Do Eucalyptus plantations host an insect community similar to remnant Eucalyptus forest
15
Austral Ecology (2005) 30, 103–117 Do Eucalyptus plantations host an insect community similar to remnant Eucalyptus forest? SAUL A. CUNNINGHAM,* ROBERT B. FLOYD AND TOM A. WEIR CSIRO Entomology, Box 1700, Canberra, ACT 2601, Australia (Email: [email protected]) Abstract We examined the potential of forest plantations to support communities of forest-using insects when planted into an area with greatly reduced native forest cover. We surveyed the insect fauna of Eucalyptus globulus (Myrtaceae) plantations and native Eucalyptus marginata dominated remnant woodland in south-western Australia, comparing edge to interior habitats, and plantations surrounded by a pastoral matrix to plantations adjacent to native remnants. We also surveyed insects in open pasture. Analyses focused on three major insect orders: Coleoptera, Lepidoptera and Hymenoptera. Plantations were found to support many forest-using insect species, but the fauna had an overall composition that was distinct from the remnant forest. The pasture fauna had more in common with plantations than forest remnants. Insect communities of plantations were different from native forest both because fewer insect species were present, and because they had a few more abundant insect species. Some of the dominant species in plantations were known forestry pests. One pest species (Gonipterus scutellatus) was also very abundant in remnant forest, although it was only recently first recorded in Western Australia. It may be that plantation forestry provided an ecological bridge that facilitated invasion of the native forest by this nonendemic pest species. Plantation communities had more leaf-feeding moths and beetles than remnant forests. Plantations also had fewer ants, bees, evanioid wasps and predatory canopy beetles than remnants, but predatory beetles were more common in the understory of plantations than remnants. Use of broad spectrum insecticides in plantations might limit the ability of these natural enemies to regulate herbivore populations. There were only weak indications of differences in composition of the fauna at habitat edges and no consistent differences between the fauna of plantations adjacent to remnant vegetation and those surrounded by agriculture, suggesting that there is little scope for managing biodiversity outcomes by choosing different edge to interior ratios or by locating plantations near or far from remnants. Key words: community composition, Eucalyptus, forestry, insects, ordination, plantation, species richness. INTRODUCTION Plantation forests are expected to support less diverse insect communities than natural forests. Production- orientated forests usually have low plant species diversity, which is expected to favour a lower diversity insect community (Murdoch et al. 1972; Knops et al. 1999). This effect is in part because of a direct linkage between plant species richness and insect species richness driven by host specificity, but also because of the linkage between plant species richness and struc- tural diversity of the vegetation (Koricheva et al. 2000; Haddad et al. 2001). Indeed tree plantations are distinguished by even-aged tree cohorts, and little understory or dead wood. The impact of plantation forestry on regional insect diversity depends not only on the levels of insect species richness per se, but on how similar or different these communities are from those in native forests, and on whether or not there are positive or negative inter- actions between these two kinds of habitat. Further, it is important to understand whether or not these bio- diversity impacts are influenced by the placement of these plantations in the landscape. It is predicted that the insect community which develops in a plantation will be effected by the amount of edge relative to interior and by the isolation of the habitat island (e.g. a plantation) from a source of colonists such as a forest remnant (Tscharntke et al. 2002). There are, however, only limited empirical data on insect responses to these landscape variables. For example, one study found that isolated patches have fewer species of insect predators (Zabel & Tscharntke 1998) and lower rates of parasitism (Kruess & Tscharntke 2000) and another found more insect species in isolated patches (Fahrig & Jonsen 1998). It has been suggested that even when there are effects of isolation, they might be small relative to the other determinants of insect community composition, such habitat quality (Thomas et al. 2001). The physical environment of forest edges are known to be different from the forest interior, with possible consequences for animal communities (Laurance & *Corresponding author. Accepted for publication April 2004.
Transcript of Do Eucalyptus plantations host an insect community similar to remnant Eucalyptus forest

Austral Ecology
(2005)
30
, 103–117
Do
Eucalyptus
plantations host an insect community similar to remnant
Eucalyptus
forest?
SAUL A. CUNNINGHAM,* ROBERT B. FLOYD AND TOM A. WEIR
CSIRO Entomology, Box 1700, Canberra, ACT 2601, Australia (Email: [email protected])
Abstract
We examined the potential of forest plantations to support communities of forest-using insects whenplanted into an area with greatly reduced native forest cover. We surveyed the insect fauna of
Eucalyptus globulus
(Myrtaceae) plantations and native
Eucalyptus marginata
dominated remnant woodland in south-western Australia,comparing edge to interior habitats, and plantations surrounded by a pastoral matrix to plantations adjacent to nativeremnants. We also surveyed insects in open pasture. Analyses focused on three major insect orders: Coleoptera,Lepidoptera and Hymenoptera. Plantations were found to support many forest-using insect species, but the faunahad an overall composition that was distinct from the remnant forest. The pasture fauna had more in common withplantations than forest remnants. Insect communities of plantations were different from native forest both becausefewer insect species were present, and because they had a few more abundant insect species. Some of the dominantspecies in plantations were known forestry pests. One pest species (
Gonipterus scutellatus
) was also very abundant inremnant forest, although it was only recently first recorded in Western Australia. It may be that plantation forestryprovided an ecological bridge that facilitated invasion of the native forest by this nonendemic pest species. Plantationcommunities had more leaf-feeding moths and beetles than remnant forests. Plantations also had fewer ants, bees,evanioid wasps and predatory canopy beetles than remnants, but predatory beetles were more common in theunderstory of plantations than remnants. Use of broad spectrum insecticides in plantations might limit the ability ofthese natural enemies to regulate herbivore populations. There were only weak indications of differences incomposition of the fauna at habitat edges and no consistent differences between the fauna of plantations adjacent toremnant vegetation and those surrounded by agriculture, suggesting that there is little scope for managingbiodiversity outcomes by choosing different edge to interior ratios or by locating plantations near or far fromremnants.
Key words:
community composition,
Eucalyptus
, forestry, insects, ordination, plantation, species richness.
INTRODUCTION
Plantation forests are expected to support less diverseinsect communities than natural forests. Production-orientated forests usually have low plant speciesdiversity, which is expected to favour a lower diversityinsect community (Murdoch
et al
. 1972; Knops
et al
.1999). This effect is in part because of a direct linkagebetween plant species richness and insect speciesrichness driven by host specificity, but also because ofthe linkage between plant species richness and struc-tural diversity of the vegetation (Koricheva
et al
. 2000;Haddad
et al
. 2001). Indeed tree plantations aredistinguished by even-aged tree cohorts, and littleunderstory or dead wood.
The impact of plantation forestry on regional insectdiversity depends not only on the levels of insectspecies richness per se, but on how similar or differentthese communities are from those in native forests, andon whether or not there are positive or negative inter-
actions between these two kinds of habitat. Further, itis important to understand whether or not these bio-diversity impacts are influenced by the placement ofthese plantations in the landscape. It is predicted thatthe insect community which develops in a plantationwill be effected by the amount of edge relative tointerior and by the isolation of the habitat island (e.g. aplantation) from a source of colonists such as a forestremnant (Tscharntke
et al
. 2002).There are, however, only limited empirical data on
insect responses to these landscape variables. Forexample, one study found that isolated patches havefewer species of insect predators (Zabel & Tscharntke1998) and lower rates of parasitism (Kruess &Tscharntke 2000) and another found more insectspecies in isolated patches (Fahrig & Jonsen 1998). Ithas been suggested that even when there are effects ofisolation, they might be small relative to the otherdeterminants of insect community composition, suchhabitat quality (Thomas
et al
. 2001).The physical environment of forest edges are known
to be different from the forest interior, with possibleconsequences for animal communities (Laurance &
*Corresponding author.
Accepted for publication April 2004.

104 S. A. CUNNINGHAM, R. B. FLOYD AND T. A. WEIR
Yensen 1991; Murcia 1995). For example, light avail-ability is sometimes greater at the edge, and someinsects are more active in sunny or warm environmentsor are known to favour the more vigorous plants foundgrowing in high light (Cromartie 1975; Moore
et al
.1988). In a study of an experimentally fragmented oldfield, ant and rove beetle diversity were more affectedby the edge-to-interior ratio of patches than the otherfragmentation effects of size and isolation (Golden &Crist 2000). In another study, the margin betweenforest and farm was found to be richer in spider andcarabid beetle species than the habitat on either side(Bedford & Usher 1994). The beetle fauna of nativeeucalypt forest has been found to respond to edgeeffects, with benefits to some species and not others(Davies & Margules 1998; Davies
et al
. 2001).We can predict from these studies that isolation and
edge effects might be important in determining thestructure of insect communities in forest plantations,but caution is necessary. Studies to date have tended tofocus on small component communities, have some-times been on a scale of metres rather than kilometres,and have usually been in the framework of fragment-ation rather than the creation of new patches in thelandscape.
In southern Australia there has been a rapid increasein the planting of forests on to what was clearedagricultural land (Wood
et al
. 2001). Most plantationsare of
Eucalytpus globulus
Labill. (Myrtaceae), a speciesendemic to parts of south-eastern Australia. Becausethe genus
Eucalyptus
dominates the canopy in mostAustralian forests, these trees are usually congenericwith the dominant native trees in the regions wherethey are being planted. One might expect therefore thatan insect fauna is present in remnant forests that will beable to use this resource. Revegetation using plantationforests can lead to many benefits, including a lowerwater table in areas of dryland salinity and reduced soilerosion (Greenwood
et al
. 1985; Montagnini 2001;McPherson & Timmer 2002). It is less clear, however,
what potential this land use has to conserve populationsof animals that are dependent on natural forests (Lamb1998).
In this study we examined the insect fauna of
Eucalyptus globulus
plantations and compared it withthe fauna of remnant
Eucalyptus
woodland andagricultural pastures in the same area. Species richness,evenness of populations, and similarity in speciescomposition and abundance were compared amonghabitats. We asked whether there were consistentdifferences between the fauna of plantations abuttingremnant forest and plantations surrounded by agri-culture, and whether there were consistent differencesbetween edges and interiors of both plantation andremnant forest. The beetle fauna of tree canopies hasbeen the focus of considerable attention because of theimportance of canopy beetles in estimates of globalspecies diversity (e.g. Novotny
et al
. 2002). Thereforewe also examined the number of canopy beetle speciesper remnant tree to allow comparison with other
Eucalyptus
canopy collections. Finally we consideredthe profile of functional groups comparing remnantsto plantations and considered the implications forpopulation dynamics.
METHODS
Survey design
The study was conducted in the south of WesternAustralia, where
Eucalyptus globulus
plantations arebeing planted at an increasing rate on to land that wasformerly used for grazing cattle and sheep (Wood
et al
.2001). Plantations are expected to have a 10 yearrotation. Canopy closure is usually reached around yearfour. We established four study areas (Table 1) eachconsisting of remnant forest, an adjacent plantation, theagricultural matrix and an isolated plantation in the
Table 1.
Location and characteristics of the four areas studied. Latitude, longitude, and vegetational information relate to theremnant forest sites. The plantations were relatively uniform in structure and species composition – dominated by a monoculturalcanopy of
Eucalyptus globulus
. The location of the isolated plantation is relative to the plantation adjacent to the remnant
Area RemnantLatitude longitude
Tree spp. (% cover) Shrub spp.
Location of isolated
plantation
1. East of Mt Barker Privately owned remnant adjacent to Porongurup Nature Reserve
34
�
40.74
�
117
�
47.78
�
2 (34) 31 3 km W
2. West of Mt Barker Privately owned remnant (25 ha) within pasture
34
�
42.65
�
117
�
34.12
�
6 (34) 34 not sampled
3. West of Millbrook Millbrook Nature Reserve 34
�
51.42
�
117
�
48.62
�
5 (19) 45 3 km NW
4. South of Millbrook Millbrook Nature Reserve 34
�
52.36
�
117
�
50.08
�
6 (17) 45 6 km SW

INSECT FAUNA: PLANTATIONS VS REMNANTS 105
agricultural matrix (Fig. 1, Table 2). Seven samplingsites were established in each study area, except forarea 2 which did not include an isolated plantation(Table 1), giving a total of 27 (= [4
�
7]
-
1) samplingsites. The aim of the design was to allow contrastsbetween plantations and remnants, edges and theinterior, and the effect of adjacency of plantations toremnants. Interior sites were located at least 100 mfrom the edge of the plantation or remnant forest inquestion. A related study considered vertebrate faunain the same sites (Hobbs
et al
. 2003).The seven plantations surveyed were established in
the period 1993–1995 as part of commercial farmforestry operations managed by a number of differentcompanies. Plantation sites were sprayed with insecti-cide according to normal management practice, whichis determined by response to outbreaks of herbivores.The agricultural land at area 3 and the agricultural landbeside the plantation adjacent to the remnant at area 4were prepared for planting trees in April 2000, and had30 cm trees by November 2000.
Vegetation was surveyed in four 20 m
�
20 m quad-rats in each site. The remnant native vegetation in thestudy areas was diverse, with a mixed tree canopyconsisting of
Corymbia calophylla
Lindl. (Myrtaceae),
Eucalyptus marginata
Donn ex Smith,
Eucalyptus patens
Benth.,
Banksia attenuata
R Br. (Proteaceae),
Banksiagrandis
Willd. and a few other less abundant species(Hobbs
et al
. 2003). A diverse array of shrub species
was present at the study sites. Pastures were composedalmost entirely of introduced annual species. Nativeannuals were sparse in both remnant vegetation andplantations, and introduced annuals were virtuallyabsent in native vegetation, but more abundant in theplantations. Plantations were pure
Eucalyptus globulus
with scattered patches of native vegetation (not sur-veyed) and understory largely absent in the plantedareas.
Insect collecting methods
We used three different techniques for samplinginsects. Insecticidal knockdown was used to collectinsects from the canopy, light traps were used to collectlight-attracted night-flying insects, and malaise trapswere used to collect flying insects passively. We sampledinsects on four survey trips: October 1999, April 2000,November 2000 and May 2001. Not all collectionmethods were used in all habitats, and some plannedsampling events in some sites were missed due to badweather (Table 2). For species-level identification weused experienced systematists.
Light traps
We operated light traps with vertical 30 cm 8 Wattultra-violet tubes, between dusk and dawn in the inte-rior sampling sites of the remnant and the adjacentplantation in all four areas (8 sampling locations), withone light trap on the ground at each site. We did threenights of trapping in each of four survey trips (i.e. 12collecting events), with an extra night in one area onone survey trip. Thus the total number of samples was98 ([8
�
12] + 2).Light traps attracted moths and beetles. To reduce
the samples to a manageable size we discarded allmoths with a forewing span of <15 mm, then pinnedand identified the rest. We refer to the moths we kept as‘macrolepidoptera’. Moths and beetles were sorted tospecies level.
Fig. 1.
A diagram of the arrangement in space of habitatssampled in each area (see Table 1).
Table 2.
Habitats sampled using different techniques and the symbols used to represent them in Figures 6, 7, 8 and 10
Code HabitatCanopy
(trees sampled)
Malaise samples (each event approx.
1 week)Light trap (nights) Symbol
R Remnant 14 16 49
�
Rpe Remnant edge to plantation 12 12 –
�
Pre Plantation edge to remnant 14 16 –
�
Pri Interior of plantation adjacent to remnant 15 16 49
�
Pagi Interior of plantation not adjacent to remnant 10 12 –
�
Prag Edge to agriculture of adjacent plantation 14 16 –
�
Ag Agricultural land – 16 –
�
–, not present.

106 S. A. CUNNINGHAM, R. B. FLOYD AND T. A. WEIR
Malaise traps
We used malaise traps in which the intercept area(the central baffle) was approximately 910 mm tall by165 mm wide. These were erected in all habitats in allsites on all survey trips. Cattle were attracted to themalaise traps and frequently knocked them over inthe pasture (Ag) areas 3 and 4. To avoid this problemwe moved the malaise traps at these sites such thaton the 2nd, 3rd and 4th surveys they were placedwithin the boundary fence of the ‘Pagi’ site, but placedin the firebreak such that they were more than 30 mfrom plantation trees, in an area of annuals and grassesand only 2 m from the grazed pasture.
We left traps erected for seven or eight fine days oneach trip, not counting days that were unusually cold orwet, because flying insect activity is much reduced inthese conditions. On the first survey trip there wereonly four fine days for the ‘Ag’, at area 3 and five finedays for ‘Ag’ at area 4.
From the malaise trap samples we sorted outHymenoptera, and counted abundance in these categ-ories: families Ichneumonidae, Braconidae, Bethylidaeand Formicidae and superfamilies Evanioidea andApoidea. We also examined all beetles caught in malaisetraps. These specimens were sorted to species level.
Canopy sampling
To sample the beetle fauna of the canopy we usedinsecticidal knockdown with a synthetic pyrethroid(Dominex 100, Elliot Chemicals, Pukekohe, NewZealand; active agent = alpha-cypermethrin) at aconcentration of 100 mg per litre. This was sprayedinto the canopy using a backpack mistblower (StihlSR400, Knoxfield, Australia), spraying until the foliagewas visibly wet. We sprayed as high in the canopy as waspossible when standing on the roof of a 4-wheel drivevehicle. We arranged 13 m
2
of white tarpaulins underthe sprayed tree and collected all insects that fell on thetarpaulins. Collection continued for at least 90 min,after which time the rain of insects from the canopy wasgreatly diminished.
We did not attempt to sample the canopy in this wayif it was raining or windy. Given the limited surveytime, it was not possible to sample all trees at the sametime of day. Canopy spraying was done between 0600and 1600 h.
In plantations we sampled
Eucalyptus globulus
. In theremnant vegetation we chose to sample
Eucalyptusmarginata
(‘Jarrah’) because this species was presentand abundant in all remnant sites. When sprayingremnant trees we were usually able to wet all the foliage.In the plantation sites, however, trees were sometimestoo tall, and the lower canopy too dense, for theinsecticide to wet the highest leaves effectively. Further,
because the canopy of plantation trees was denser thanfor the remnant trees the area of leaves wetted wasprobably greater (in this way we expect the plantationtrees to be under-sampled relative to the remnanttrees). Considering these limitations, the samplescannot be regarded as exhaustive collections of thesampled tree canopies, nor can they be treated assamples of the same canopy volume or leaf density.
We aimed to sample one tree in every habitat (exceptAg, which was treeless), in each of the four areas, oneach survey trip (for sample size see Table 2). We neversampled the same tree more than once. In total wecollected from 26 remnant trees and 53 plantationtrees. The mean height of remnant trees was 8.7 m(
�
0.46, 1 SE), and the mean height of plantation treeswas 15.4 m (
�
0.403, 1 SE). At edge sites (Re, Pre,Prag) we chose trees approximately 10 m from theedge to avoid the effect of wind on sample collection.From canopy knockdown samples we sorted, identifiedand counted all Coleoptera to the level of known orputative species.
Analyses
Species diversity has two components, species richness(the number of species) and evenness (the relativeabundance of each species). Insect fauna is generally sospecies rich that it is very difficult to discover the truenumber of species in a given place. Most studies findthat an increase in sampling effort leads to an increasein the number of species detected (Abbott
et al
. 1992;Gotelli & Colwell 2001). Therefore comparisons ofdifferent samples must either ensure that collectingeffort is similar for each sample (which can be difficultto know or define), or must estimate the true richnessand compare estimates (Gotelli & Colwell 2001). Inthis study we use both approaches.
Ecologists have developed tools to estimate the truespecies richness on the basis of the abundance anddiversity of species in the samples collected. Theseapproaches are based on extrapolation from thecollection curve, which describes the relationshipbetween sampling effort and the number of speciesfound. To estimate true species richness from oursamples we used the Chao 2 estimator because it hasbeen found to be robust in different kinds of datasets (Colwell & Coddington 1994). Similar samplingproblems affect our understanding of the overlap inspecies composition when comparing two samples.Chao
et al
. (2000) have developed an estimator for thetrue overlap in species composition for two samplesthat we also used here. To calculate species richness andshared species estimates we used ‘EstimateS’ software(Colwell 2000).
To generate our estimates of species richness weconsidered all samples from a given habitat to represent

INSECT FAUNA: PLANTATIONS VS REMNANTS 107
samples from the same community, thus we pooleddata collected in different study areas and at differenttimes. So, for example, the estimated species richnessfor light-trapped moths in habitat ‘R’ was the richnessof this habitat considering data from four sites in fourdifferent survey trips. Some of the richness, therefore,came from differences in species composition amongsites, and some came from difference through time.The standard deviation around the richness estimatewas calculated from the variation in 50 randomizedspecies accumulation curves from these data. It was notthe standard deviation of the mean from four sites. Weasked if the estimated richness of one habitat wassignificantly different from that from another habitat byexamining overlap in confidence intervals. Because95% of the observations of the richness statistic fallwithin 1.96
�
1SD we treated this as a confidenceinterval for the purpose of comparing richnessestimates (J. Coddington pers. comm., 2003). Thismethod may reveal wide confidence intervals aroundthe estimates indicating limited precision, but becausethese estimates consider variation among samples inspecies composition they convey a more completepicture of community diversity than species countsalone.
Using samples in which we had similar collectingeffort, we examined the species richness and evennessof the fauna (Fig. 2). We calculated the evennessstatistic (E) using Pielou's method (Magurran 1988).This varies from zero to one, where E = 1 if all speciesare equally abundant.
To compare similarity in composition and speciesabundance among our samples we calculated BrayCurtis similarities and used non-metric multidimen-sional scaling (NMDS) to translate the multidimen-sional complex of similarities into two-dimensionalspace. The NMDS procedure was executed in ‘PCOrd’ (McCune & Mefford 1999). To reduce thestatistical influence of very abundant species we usedthe square root of true abundance (Clarke 1993). Totest the significance of clusters in NMDS space weused the multi response permutation procedure(MRPP) in ‘PC Ord’ (McCune & Mefford 1999).Because these analyses consider both composition andspecies abundance, samples that share many species(i.e. have high species overlap) can neverthelessseparate into different areas of similarity space.
We were interested in examining whether there weredifferences between remnant and plantation faunas inthe prevalence of different feeding behaviours amongthe insects collected. However, given the number ofspecies collected it would be extremely difficult todetermine the feeding behaviours of them all. Thisproblem arises not only because of the number ofspecies, but because there is insufficient knowledgeof the ecology of many of them – especially the lesscommon species. Therefore we chose only to examinethe feeding biology of the 10 most abundant species incanopy beetle, malaise beetle, and light-trapped mothsamples. Because of the numerical dominance of these
Fig. 2.
The number of species and evenness of speciesabundance comparing plantation samples to remnant forestsamples for four faunal elements. Arrows link plantation (P)and remnant (R) samples of the same faunal element.Sampling effort was approximately balanced to calculatethese statistics. Moth and light beetle samples compare R toPri sites. Malaise and canopy beetle samples compare R andRpe (combined) to Pri and Pre (combined). Evenness wascalculated according to the method of Pielou (in Magurran1988).
Fig. 3.
Species richness estimated using the Chao 2method (Colwell & Coddington 1994) comparing ( )remnant forest to (
�
) plantation forest for moths and beetlescollected in light traps. Confidence intervals are calculated as1 SD
�
1.96.

108 S. A. CUNNINGHAM, R. B. FLOYD AND T. A. WEIR
faunas by the more abundant species, this approachstill allowed us to examine the biology of the majorityof individuals collected. In some cases we inferredlikely feeding behaviour on the basis of the knownbehaviour of near relatives. Even using this approach,there were a number of species for which we wereunable confidently to infer feeding behaviour.
The data regarding abundance of Hymenoptera inmalaise traps were not normally distributed because ofthe abundance of small values and zeroes. Becausethese data could not be transformed to normality weanalysed them using non-parametric statistics.
RESULTS
Were insect species richness and evenness similar in plantation and remnant forests?
Species richness was greater in remnants thanplantations for each of the four faunal elements(Fig. 2). For light-trapped beetles, canopy beetles andmoths the remnant samples were also more even, butfor malaise beetles the plantation fauna was more eventhan the remnant fauna (Fig. 2). The malaise beetlesamples were also notable for having the lowest abun-dance of individuals collected (Plantation = 669
vs.
Remnant = 814, compared with light beetles:
P
= 3518
vs
R = 1499, canopy beetles:
P
= 1955
vs
R = 2271;moths
P
= 1408
vs
R = 1464).Estimates of true species richness were substantially
greater than the number of species collected, but thepatterns of difference comparing remnant and plant-ation habitats were broadly similar for species countsand richness estimates. The light trapped beetles werethe group for which the habitat contrast was weakest,although the remnant fauna was richer than the plant-ation, the difference was very small for species counts(Fig. 2) and estimated richness (Fig. 3). Estimatedmoth species richness of the remnant habitat wassignificantly greater than for the plantation habitat(Fig. 3). Estimated species richness for canopy beetleswas higher in the remnant habitats (R, Rpe) than forthe plantation habitats (Pre, Pri, Pagi, Prag: Fig. 4a).These differences were significant for some but not allremnant to plantation contrasts (not significant forRpe
vs
Prag, R
vs
Pre, or R
vs
Prag: Fig. 4a). Wideconfidence intervals around the estimates indicated thatmore data were needed to refine the richness estimates.We omitted data from one tree for richness estimation(Prag, Area 3, November 2000) because its inclusiongreatly inflated the estimated richness and the associ-ated variance. Because of its effect on variance inparticular this sample must have had a compositionthat made it relatively distinct from the other 13samples.
Estimated richness of malaise beetles was higher forthe remnant habitat (R, Rpe) and sites in or adjacent topasture (Ag, Prag: Fig. 4b). Again, wide confidenceintervals around the estimates indicated that more datawere needed to refine the richness estimates. Only‘Pagi’ had confidence intervals narrow enough todistinguish significantly its estimated richness fromother habitats (it was significantly smaller than R, Rpe,Prag and Ag). Because the pasture was more simple instructure than forest it might be expected to harbourless species diversity. Indeed the complete absence of acanopy fauna inevitably makes this habitat simpler.However, the pasture was similar in estimated speciesrichness to remnant forest habitats (Fig. 4b). In fact,considering the number of beetle species collected(rather than estimated richness), and controlling forsimilar number of trapping days, we found morespecies in the pasture than in the remnant interior(Fig. 5). One might expect that malaise traps wouldhave different effectiveness in habitats with differentvegetational structure. However, the abundance ofbeetles per trap was similar in remnant, plantation
Fig. 4. Species richness estimated using the Chao 2method (Colwell & Coddington 1994) comparing differenthabitats for (a) beetles collected by canopy knockdown and(b) beetles collected by malaise trap. Confidence intervalsare calculated as 1 SD � 1.96.
INSECT FAUNA: PLANTATIONS VS REMNANTS 109
and pasture habitat. Differences in trap effectivenessmight mean sampling effort was different in eachhabitat in an unquantifiable way, but the apparentspecies richness of pasture could not be explained by adifference in the abundance of beetles sampled.
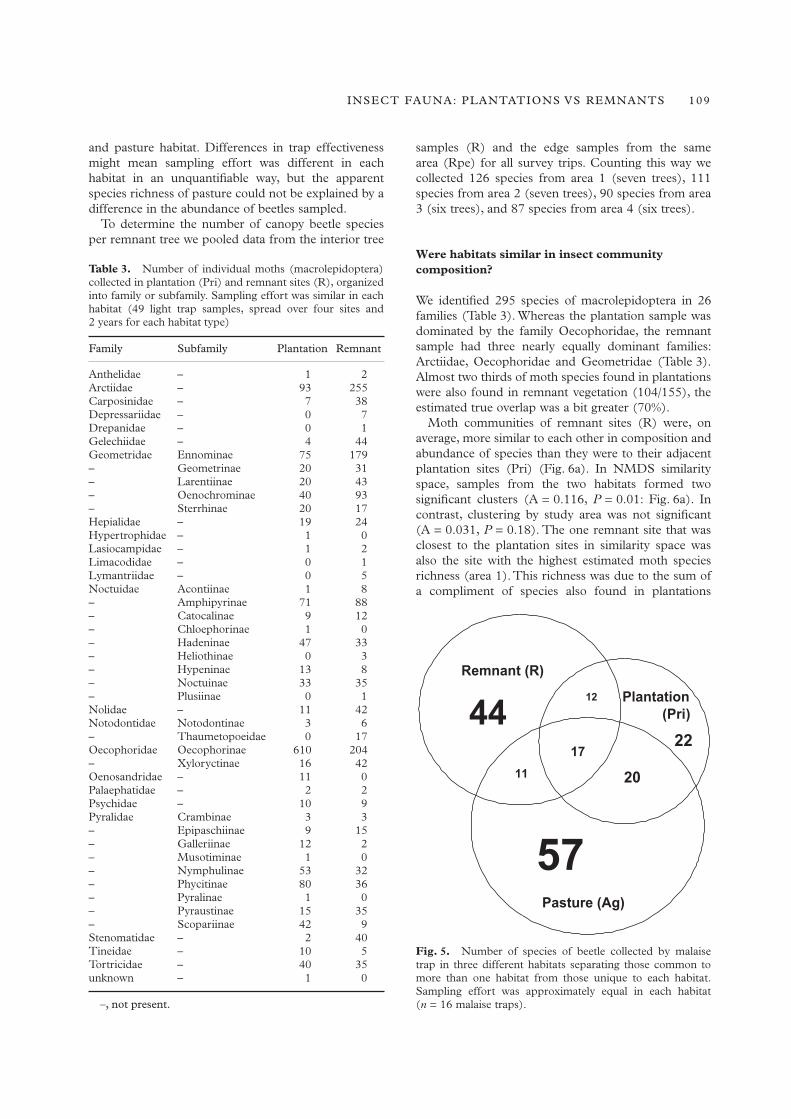
To determine the number of canopy beetle speciesper remnant tree we pooled data from the interior tree
samples (R) and the edge samples from the samearea (Rpe) for all survey trips. Counting this way wecollected 126 species from area 1 (seven trees), 111species from area 2 (seven trees), 90 species from area3 (six trees), and 87 species from area 4 (six trees).
Were habitats similar in insect community composition?
We identified 295 species of macrolepidoptera in 26families (Table 3). Whereas the plantation sample wasdominated by the family Oecophoridae, the remnantsample had three nearly equally dominant families:Arctiidae, Oecophoridae and Geometridae (Table 3).Almost two thirds of moth species found in plantationswere also found in remnant vegetation (104/155), theestimated true overlap was a bit greater (70%).
Moth communities of remnant sites (R) were, onaverage, more similar to each other in composition andabundance of species than they were to their adjacentplantation sites (Pri) (Fig. 6a). In NMDS similarityspace, samples from the two habitats formed twosignificant clusters (A = 0.116, P = 0.01: Fig. 6a). Incontrast, clustering by study area was not significant(A = 0.031, P = 0.18). The one remnant site that wasclosest to the plantation sites in similarity space wasalso the site with the highest estimated moth speciesrichness (area 1). This richness was due to the sum ofa compliment of species also found in plantations
Table 3. Number of individual moths (macrolepidoptera)collected in plantation (Pri) and remnant sites (R), organizedinto family or subfamily. Sampling effort was similar in eachhabitat (49 light trap samples, spread over four sites and2 years for each habitat type)
Family Subfamily Plantation Remnant
Anthelidae – 1 2Arctiidae – 93 255Carposinidae – 7 38Depressariidae – 0 7Drepanidae – 0 1Gelechiidae – 4 44Geometridae Ennominae 75 179– Geometrinae 20 31– Larentiinae 20 43– Oenochrominae 40 93– Sterrhinae 20 17Hepialidae – 19 24Hypertrophidae – 1 0Lasiocampidae – 1 2Limacodidae – 0 1Lymantriidae – 0 5Noctuidae Acontiinae 1 8– Amphipyrinae 71 88– Catocalinae 9 12– Chloephorinae 1 0– Hadeninae 47 33– Heliothinae 0 3– Hypeninae 13 8– Noctuinae 33 35– Plusiinae 0 1Nolidae – 11 42Notodontidae Notodontinae 3 6– Thaumetopoeidae 0 17Oecophoridae Oecophorinae 610 204– Xyloryctinae 16 42Oenosandridae – 11 0Palaephatidae – 2 2Psychidae – 10 9Pyralidae Crambinae 3 3– Epipaschiinae 9 15– Galleriinae 12 2– Musotiminae 1 0– Nymphulinae 53 32– Phycitinae 80 36– Pyralinae 1 0– Pyraustinae 15 35– Scopariinae 42 9Stenomatidae – 2 40Tineidae – 10 5Tortricidae – 40 35unknown – 1 0
–, not present.
Fig. 5. Number of species of beetle collected by malaisetrap in three different habitats separating those common tomore than one habitat from those unique to each habitat.Sampling effort was approximately equal in each habitat(n = 16 malaise traps).

110 S. A. CUNNINGHAM, R. B. FLOYD AND T. A. WEIR
(which made it similar to plantation fauna) plus acompliment of the distinctive remnant fauna.
We identified 103 species of beetles from light traps,the majority of which were found in remnant vegetation(73/103). More than half of the species found inplantations were also found in remnant vegetation(31/61 = 51%), but the estimated true overlap waseven greater (85%). Ordination of light trappedbeetles revealed that clustering by habitat was notsignificant (A = 0.039, P = 0.128) whereas clusteringby study area was significant (i.e. the sites nearMount Barker group separately from the sites nearMillbrook, A = 0.125, P = 0.005: Fig. 6b). The lackof significant separation between plantation andremnant samples in similarity space was consistent
with the very high level of estimated overlap in speciescomposition.
The mean number of canopy beetle individualscollected per tree was similar in remnant (87 � 16,1SE, n = 26) and plantation trees (75 � 10, 1SE,n = 53). Controlling for sampling effort (i.e. using dataas presented in Fig. 2) more than 60% of the speciesfound in plantations were also found in remnantvegetation (69/113 = 61%). Using all the samples (i.e.unequal collecting effort) the estimated true overlapwas similar (62%).
Ordination of canopy beetle samples revealed thatremnant tree fauna samples (R, Rpe) were clusteredseparately from plantation samples (A = 0.100,P < 0.001, Fig. 7). Within the plantation samplesthere was also significant clustering by study area(A = 0.096, P < 0.001, four groups). There alsoappeared to be some clustering by study area in theremnant samples, but with only two samples per studyarea it was not possible to test this statistically withMRPP.
More than half of the malaise trapped beetle speciesfound in plantations were also found in remnantvegetation (62/106 = 58%). Considering all thesamples, and therefore unequal collecting effort, theestimated true overlap was even greater (65%). Wealso examined the three-way overlap between malaisebeetles of remnants (R only), plantations (Pri only)and pastures (Ag), considering equal collecting effort
Fig. 6. Ordination of insect communities in two dimen-sional similarity space based on light trap collection of (a)moths and (b) beetles. We used non-metric multidimensionalscaling (NMDS) analysis of Bray Curtis similarity matricesbased on the square-root transformed abundances of allspecies represented by more than one specimen (184 speciesof Lepidoptera, stress = 0.052, 69 species of Coleoptera,stress = 0.065). Remnant sites (R) are represented by solidsquares, plantation sites (Pri) are represented by solidtriangles. Numbers identify the area, as per Table 1. Dottedlines delineate groups that are clustered (MRPP, P < 0.01).
Fig. 7. Ordination in two dimensional similarity space ofcanopy knockdown collected beetle communities. We usednon-metric multidimensional scaling (NMDS) analysis ofBray Curtis similarity matrices based on the square-roottransformed abundances of all species represented by morethan one specimen (195 species, stress = 0.14). Ssymblsfollow the legend in Table 2. Numbers identify the area.Dotted lines delineate groups that are clustered (MRPP,P < 0.001).

INSECT FAUNA: PLANTATIONS VS REMNANTS 111
(Fig. 5: the shared species estimator cannot estimatethree-way overlap). Remnant vegetation had a similaroverlap in species composition with plantation andpasture. The plantation samples shared more specieswith pasture (37/71) than with remnant vegetation(29/71: Fig. 5).
For the malaise-collected beetle samples the pasture,plantation and remnant samples grouped separately insimilarity space (A = 0.055, P < 0.001: Fig. 8). Therewas also significant clustering by study area within theplantation samples (four groups, A = 0.084, P < 0.001:Fig. 8). However, the pasture samples were compo-sitionally more similar to plantations than remnants.This was true considering the species overlap data(Fig. 5) and analysis of similarity (Fig. 8).
We collected 8162 Hymenoptera that were identifiedinto six major taxonomic groups. The most abundantwere the Formicidae (ants: 3486), Ichneumonid wasps(2146) and Braconid wasps (1304). The less abundantgroups were Bethylid wasps (709), Evanioid wasps(277) and Apoidea (bees: 240). We examined abun-dance differences among habitats in a set of unplannedposthoc comparisons and therefore adjusted ourcritical � to 0.008 (Bonferoni correction for sixpossible comparisons: edge vs interior for two habitats,isolated vs adjacent for plantation, and pairwisecontrasts among remnant, plantation and pasture).Ants were more abundant in the remnant and agri-cultural habitat than in plantations (Mann–Whitney
U-test: R and Re vs Pre and Pri, n = 27 samples(balanced), U = 111, P < 0.001: Fig. 9). Bees weremore abundant in remnant habitat than in plantation(Mann–Whitney U-test: R and Re vs Pre and Pri,n = 27 samples (balanced), U = 141.5, P < 0.001:Fig. 9). The pattern for Evanioid wasps was similar(Mann–Whitney U-test: R and Re vs Pre and Pri,n = 27 samples (balanced), U = 206, P = 0.005:
Fig. 8. Ordination in two dimensional similarity space ofmalaise trap collected beetle communities. We used non-metric multidimensional scaling (NMDS) analysis of BrayCurtis similarity matrices based on the square-root trans-formed abundances of all species represented by more thanone specimen (159 species, stress = 0.24). Ssymbls follow thelegend in Table 2. Numbers identify the area. Dotted linesdelineate groups that are clustered (MRPP, P < 0.001).Plantation sites can also be clustered by study area (MRPP,P < 0.001).
Fig. 9. Mean abundance of insects in six differentHymenopteran groups collected by malaise samples (�1SE):(a) ants, (b) bees, (c) evanioid wasps, (d) bethylid wasps, (e)braconid wasps (f) icheneumonid wasps. Sampling effort wasapproximately equal across habitat types (Table 2).

112 S. A. CUNNINGHAM, R. B. FLOYD AND T. A. WEIR
Fig. 9). Bethylid wasps were more abundant inplantation habitat than in remnant or agriculturalhabitat (Fig. 9), but there was considerable variationamong samples and consequently no statisticallysignificant contrasts. Braconid wasps were leastabundant in interior plantation sites (Mann–WhitneyU-test: Pre and Prag vs Pri and Pagi, n = 28 samples(balanced), U = 213.5, P = 0.003: Fig. 9). Ichneumo-nid wasps were similarly abundant in all habitats(Fig. 9).
The data available for multivariate analysis ofsimilarity in community composition were limited forHymenoptera, because only six taxonomic groups werecounted. Nevertheless, the remnant samples (R, Rpe)grouped separately from the plantation samples (Pri,Pre, Prag and Pagi) (A = 0.175, P < 0.001: Fig. 10).The pasture samples (Ag) overlapped these twoclusters, which was consistent with the observationfrom mean abundances (Fig. 9) that pasture sitesshared some groups with plantations, and some withremnants. Clustering by study area within the plant-ation samples was not statistically significant (fourgroups, A = 0.099, P = 0.06).
In summary, samples from remnants, plantationsand pastures grouped in distinct clusters in similarityspace considering moths, canopy beetles, malaisebeetles (Figs 6a, 7 and 8). For the Hymenoptera we
could not compare species composition, but in terms ofabundance of major taxa the habitats were distinct(Fig. 10). Only for the light-trapped beetles were thehabitat groupings not significant (Fig. 6b).
Were insect communities of edge sites different from interior sites?
Among the canopy- and malaise-collected beetlesamples there was only weak evidence for differentspecies richness in plantation edge habitats. Speciesrichness was greater in the plantation edge sitescompared to plantation interior sites (Pre, Prag > Pri,Pagi: Fig. 4). This difference was greatest whencomparing the edge between agriculture (Prag) andinterior sites (Pri, Pagi). The contrast between the edgeto remnant forest (Pre) and interior sites (Pri, Pagi)was less. However, only one of these comparisons wassignificantly different judging by non-overlap ofconfidence intervals (Prag vs Pagi, malaise beetles).
Edge sites were not identical in community compo-sition to their associated interior sites, but neither werethey generally similar to other edge sites. Edge andinterior sites were not separately clumped, but associ-ated in a larger cluster defined by habitat (remnant orpasture). This pattern was similar for canopy- andmalaise-collected beetles and Hymenoptera (Figs 7, 8and 10).
Were insect communities effected by isolation of the plantation from the remnant?
We addressed this question by comparing the fauna ofthe adjacent plantation interior habitat (Pri) to thefauna of isolated plantation interior habitat (Pagi). Wefound no evidence of a consistent effect of adjacency toremnant forest. The canopy beetle fauna was similar inspecies richness in the adjacent plantation (Pri) andisolated plantation (Pagi) habitat (Fig. 4a). For themalaise-trapped beetles there was marginally greaterspecies richness in the adjacent plantation (Pri) than inthe isolated plantation habitat (Pagi), but this differ-ence was not significant (Fig. 4b). The abundance ofthe different Hymenopteran groups was similar in theadjacent (Pri) and isolated plantation (Pagi) habitats(Fig. 9). The isolated plantation samples did not groupseparately in similarity space in any ordination (Figs 7,8 and 10).
Was the profile of functional groups similar in remnants and plantations?
Moths whose larvae are known to feed on Eucalyptusleaves, and which were found among the 10 most
Fig. 10. Ordination in two dimensional similarity space ofmalaise trap collected Hymenopteran communities, con-sidering abundance in six major groups: (a) ants, (b) bees, (c)evanioid wasps, (d) bethylid wasps, (e) braconid wasps (f)icheneumonid wasps (see Fig. 9). We used non-metricmultidimensional scaling (NMDS) analysis of Bray Curtissimilarity matrices based on the square-root transformedabundances (stress = 0.12). Ssymbls follow the legend inTable 2. Numbers identify the area. Dotted lines delineategroups that are clustered (MRPP, P < 0.001).
INSECT FAUNA: PLANTATIONS VS REMNANTS 113
abundant species, were more abundant in the plant-ation forest sample (13.1%: 185/1408) than theremnant forest sample (8.3%: 122/1464) (�2 = 17.36,d.f. = 1, P < 0.001: Table 4). However, ecologicalinformation is unavailable for many of even these more
common species, so the feeding behaviour of a signifi-cant fraction of this fauna was unknown (Table 4).
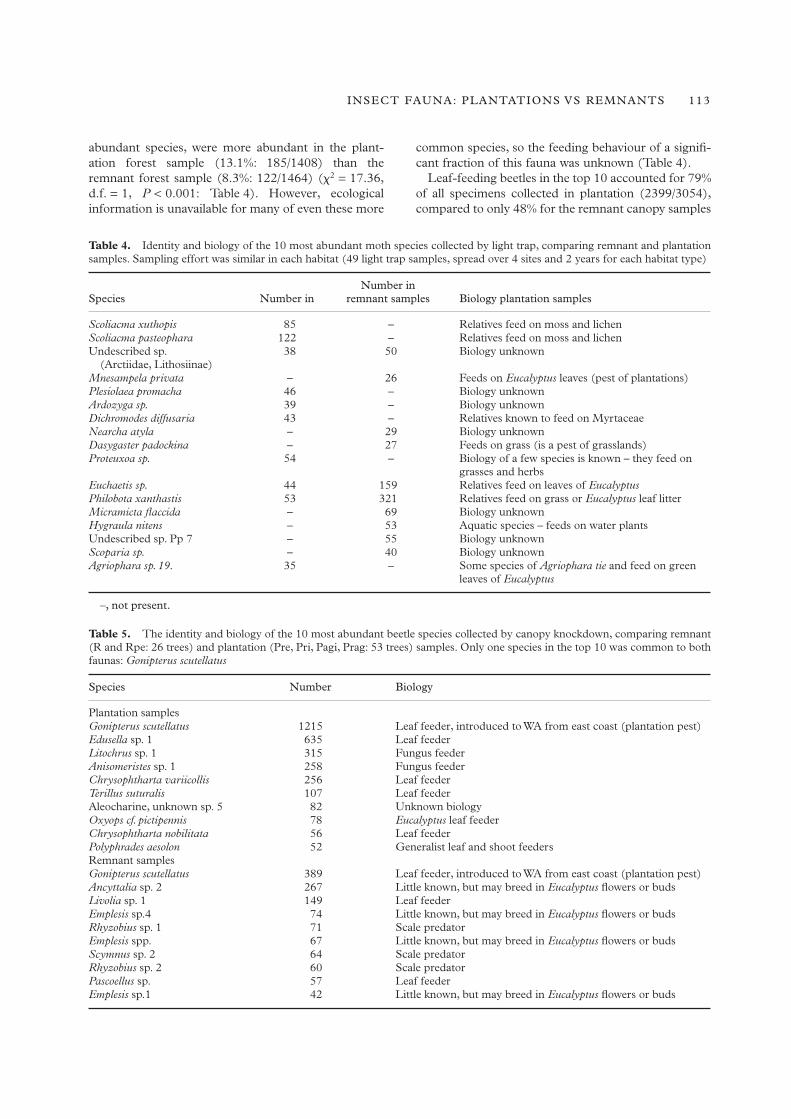
Leaf-feeding beetles in the top 10 accounted for 79%of all specimens collected in plantation (2399/3054),compared to only 48% for the remnant canopy samples
Table 4. Identity and biology of the 10 most abundant moth species collected by light trap, comparing remnant and plantationsamples. Sampling effort was similar in each habitat (49 light trap samples, spread over 4 sites and 2 years for each habitat type)
Species Number in Number in
remnant samples Biology plantation samples
Scoliacma xuthopis 85 – Relatives feed on moss and lichenScoliacma pasteophara 122 – Relatives feed on moss and lichenUndescribed sp.
(Arctiidae, Lithosiinae)38 50 Biology unknown
Mnesampela privata – 26 Feeds on Eucalyptus leaves (pest of plantations)Plesiolaea promacha 46 – Biology unknownArdozyga sp. 39 – Biology unknownDichromodes diffusaria 43 – Relatives known to feed on MyrtaceaeNearcha atyla – 29 Biology unknownDasygaster padockina – 27 Feeds on grass (is a pest of grasslands)Proteuxoa sp. 54 – Biology of a few species is known – they feed on
grasses and herbsEuchaetis sp. 44 159 Relatives feed on leaves of EucalyptusPhilobota xanthastis 53 321 Relatives feed on grass or Eucalyptus leaf litterMicramicta flaccida – 69 Biology unknownHygraula nitens – 53 Aquatic species – feeds on water plantsUndescribed sp. Pp 7 – 55 Biology unknownScoparia sp. – 40 Biology unknownAgriophara sp. 19. 35 – Some species of Agriophara tie and feed on green
leaves of Eucalyptus
–, not present.
Table 5. The identity and biology of the 10 most abundant beetle species collected by canopy knockdown, comparing remnant(R and Rpe: 26 trees) and plantation (Pre, Pri, Pagi, Prag: 53 trees) samples. Only one species in the top 10 was common to bothfaunas: Gonipterus scutellatus
Species Number Biology
Plantation samplesGonipterus scutellatus 1215 Leaf feeder, introduced to WA from east coast (plantation pest)Edusella sp. 1 635 Leaf feederLitochrus sp. 1 315 Fungus feederAnisomeristes sp. 1 258 Fungus feederChrysophtharta variicollis 256 Leaf feederTerillus suturalis 107 Leaf feederAleocharine, unknown sp. 5 82 Unknown biologyOxyops cf. pictipennis 78 Eucalyptus leaf feederChrysophtharta nobilitata 56 Leaf feederPolyphrades aesolon 52 Generalist leaf and shoot feedersRemnant samplesGonipterus scutellatus 389 Leaf feeder, introduced to WA from east coast (plantation pest)Ancyttalia sp. 2 267 Little known, but may breed in Eucalyptus flowers or budsLivolia sp. 1 149 Leaf feederEmplesis sp.4 74 Little known, but may breed in Eucalyptus flowers or budsRhyzobius sp. 1 71 Scale predatorEmplesis spp. 67 Little known, but may breed in Eucalyptus flowers or budsScymnus sp. 2 64 Scale predatorRhyzobius sp. 2 60 Scale predatorPascoellus sp. 57 Leaf feederEmplesis sp.1 42 Little known, but may breed in Eucalyptus flowers or buds

114 S. A. CUNNINGHAM, R. B. FLOYD AND T. A. WEIR
(595/1240, �2 = 390.4, d.f. = 1, P < 0.001: Table 5).The single most abundant beetle in canopy fauna ofremnants and plantations was the leaf feeding weevil,Gonipterus scutellatus Gyllenhal (Curculionidae). Leaffeeding beetles were less abundant in the malaisesamples than in the canopy knockdown samples (cfTables 5,6). Considering composition by feedinggroup of the abundant malaise-trapped beetles, theplantation samples had a greater percentage of leaffeeding beetles (23.5%, 195/831) than the remnant(17.4%, 85/489; �2 = 6.82, d.f. = 1, P = 0.009:Table 6) or pasture samples (15.2%, 25/164; (�2 = 5.3,d.f. = 1, P = 0.021: Table 6). Unfortunately, nothing isknown about the diet of the single most abundantspecies from plantation malaise samples, which wastherefore excluded from the calculated proportions. Ifthis species proved to be a leaf feeder, the percentagewould have increased to 40%.
Among malaise-trapped beetles, predators in the top10 species were more abundant in plantation (197/831,23.7%) than in remnant samples (15/489, 3.1%:�2 = 97.3, d.f. = 1, P < 0.001: Table 6). In contrast,predatory beetles were more abundant among the top10 canopy species in remnants (124/1240, 10%) com-
pared with plantations (0/3054, �2 = 314.5, d.f. = 1,P < 0.001: Table 5).
DISCUSSION
Comparing remnant forest, plantations and pasture
The fauna of remnant forest was richer in species thanthe fauna of the plantation forests. This was moststriking in the results from the two richest collectingtechniques, moths from light traps and beetles fromcanopy samples. Not only did the remnant forest havea richer fauna, but many of the species found inplantation forests were shared with remnant forests,such that the plantation forest fauna could be describedlargely as a subset sample of the richer remnant fauna.This pattern was consistent with the prediction that thespecies richness of the insect community is correlatedwith the species richness of the plant community(Murdoch et al. 1972), but the decline in insect speciesrichness was small considering the magnitude of the
Table 6. The identity and biology of the 10 most abundant beetle species collected by malaise trap, comparing remnant (R andRpe), plantation (Pre, Pri, Pagi, Prag) and pasture (Ag) samples (i.e. sampling effort was different in each habitat; for sample sizessee Table 2)
Species
Number in remnant samples
Number in plantation samples
Number in pasture samples Biology
Ancyttalia sp. 2 31 – – Little known, but may breed in Eucalyptus flowers or buds
Anisomeristes sp. 1 – – 11 Fungus feederAplopsis sp. nov. nr punctulata – 51 – Flower/pollen feederCarphurus sp. 1 – – 24 Flower associateColymbomorpha lineata – 136 21 UnknownConoderus sp. 4 – – 12 UnknownCortinicara sp. 2 – 58 – Fungus feederCortinicara sp. 3 – 55 24 Fungus feederCortinicara sp. 4 – – 10 Fungus feederCryptophagine, unknown sp. 1 124 – – Fungus feederDasytes sp. 1 48 – – Flower associateEdusella sp. 1 – 147 14 Leaf feederHelcogaster parallelus 42 – – Flower associateHeteromastix sp. 2 58 54 – Flower associateHeteronyx costulatus – – 11 Leaf feederHeteronyx sp. 4 – 48 – Leaf feederLeptacinus sp. 1 – 116 – PredatorLivolia sp. 1 64 – – Leaf feederLivolia sp. 2 21 – – Leaf feederMordella sp. 1 62 – – Flower associateNargomorphus sp. 1 – 85 – Fungus feederSarothrocrepis benefica 15 81 16 PredatorSarothrocrepis sp. 1 – – 21 PredatorTrogoderma sp. 1 24 – – Little known, but not a leaf feeder
–, not present.

INSECT FAUNA: PLANTATIONS VS REMNANTS 115
contrast in plant species richness. Differences inhabitat complexity probably also drive differences incommunity structure, but these two forces weredifficult to disentangle. In this study the speciesrichness and structural complexity effects wereconfounded in the habitat contrast.
Although remnants were generally richer, there was,nevertheless, a group of species collected only fromplantations. These species may represent species thatare plantation specialists, which were truly absent fromthe remnant forest, or they may be species that occurin both kinds of forest but were more abundant inplantations and hence more readily collected.
The malaise beetle fauna of pastures was moresimilar to the closed-canopy tree plantation than therelatively open remnant woodland. These habitats mayboth be richer in opportunistic or early successionalspecies that are less abundant in late successional nativewoodland (Hobbs et al. 2003). This hypothesis is,however, difficult to test with a poorly understoodinsect fauna.
Compared to the remnant forest fauna, the plant-ation fauna was also relatively more dominated by a fewabundant species; that is species abundances were lesseven (Fig. 2). This pattern was consistent with theprediction that habitat complexity favours greaterpopulation stability (Floater 2001). Some of thedominant species in plantations are regarded aseconomic pests, known to form outbreak populationsin plantations (e.g. Gonipterus scutellatus and Mnesam-pela privata Guenee; Loch & Floyd 2001). Althoughthe canopy fauna was more even in remnant forests,Gonipterus scutellatus was still the single most abundantcanopy beetle. This weevil is native to eastern Australiaand was not known in western Australia until recently(Loch & Floyd 2001). It may be that plantation forestryhas provided an ecological bridge that facilitatedinvasion of the native forest by this nonendemicplantation pest. The risk of such an event has beendiscussed before (Strauss 2001) but we are not awareof any other studies that suggest it might already haveoccurred.
Did plantations and remnants have a similar profile of functional groups?
Among the canopy-collected beetles, leaf feedersconstituted a greater proportion of the total beetlepopulation in plantations than in remnant forests(Table 5). The same was true for light-trapped moths(Table 4) and malaise-collected beetles (Table 6),although the differences were smaller. Increasingdensity of herbivores in monoculture is a familiarphenomenon (for a plantation forestry example, seeJactel et al. 2002), which may be due to an increasein favourable resources or a decrease in population
control by natural enemies (Root 1973). The resourceconcentration hypothesis (Kareiva 1983), predictsgreater populations of herbivores in monocultures(such as the plantation) where there is great availabilityof one appropriate host (i.e. Eucalyptus globulus)compared to polycultures (such as the remnantvegetation) where any given host (e.g. E. marginata) isless dense. It is important to note, however, that theseplantations were managed by aerial insecticidespraying. We cannot know how abundant leaf feedinginsects would become in plantations in the absence ofthis control.
Predators and parasitoids (natural enemies) maycontribute to the control of populations of abundantinsects, such as the leaf feeders (Cornell et al. 1998) butit is difficult to predict whether plantations would bemore or less conducive to developing large populationsof natural enemies. In some other studies naturalenemy numbers were found to be limited in simplifiedenvironments (such as a monocultural plantation)because of the reduced availability of alternative dietitems (e.g. nectar) (Risch et al. 1983; Andow & Risch1985; Andow 1991; Tonhasca & Byrne 1994). Theymight also be reduced in number by the application ofbroad-spectrum insecticides (Altieri et al. 1993). If,however, the plantation was host to large populations ofpotential prey, such as we know to be the case in thisinstance, these host populations might allow the naturalenemy populations to build up. Among our malaise-collected beetles, predators were more abundant in thetop 10 species in plantation than in remnant samples(Table 6), whereas among canopy-collected beetles,predators were more abundant in the top 10 species inremnants than in plantation samples (Table 5). Amongthe parasitoid wasps, the Braconids and Ichnuemonidswere similarly abundant in remnant and plantationsites (Fig. 9). These wasp families include species thatare parasitoids on a very wide range of insect hosts.Bethylid wasps were marginally more abundant inplantation sites. This family includes parasitoids ofbeetles and Lepidoptera (Naumann 1991), and maybenefit from the abundance of leaf-feeding mothsand beetles. Evanioid wasps were significantly morecommon in remnant vegetation than in the plantations;this family includes parasitoids of cockroaches, wasps,bees and wood-boring beetles (Naumann 1991) andmight therefore benefit from the greater habitatcomplexity in remnant forest. In summary, theresponse of predators and parasitoids were particular toeach taxonomic group. No doubt many more suchidiosyncratic responses would be apparent if we had aspecies level taxonomy for the Hymenoptera, becausemany parasitic wasps are host-specific.
Based on the information we do have on naturalenemies, it appeared there has not been a generalincrease in natural enemies in plantations comparedto remnants such as would be necessary to control
116 S. A. CUNNINGHAM, R. B. FLOYD AND T. A. WEIR
populations of abundant leaf feeders. The naturalenemy populations might be limited by other food orhabitat resources in the simplified plantation environ-ment, or might be depressed by the application ofinsecticides.
How rich is the remnant canopy beetle fauna?
The richness of the beetle fauna in the Eucalyptusmarginata canopy samples was in the same range asthat detected in the most comparable study (Majeret al. 2000). We collected 126 species from seven treesat the richest site and 87 species from six trees in thepoorest site. A study using a similar canopy knockdowntechnique from the same tree species in Karragullen,Western Australia, collected 99 beetle morphospecies,but sampled 40 trees (Recher et al. 1996; Majer et al.2000). This implies either that the communities weresimilar, and that the collector's curve asymptotesaround six or seven trees, or that the fauna in our studywas actually substantially richer. This difference couldbe due to an interannual component of richnessdetected in our 2 year study, or a small scale spatialcomponent of diversity contributed by our sampling ofedge trees (Rpe). There could also be site character-istics that made Karragullen relatively species poor.Some differences in species richness could be due todifferences in method – for example some beetlemorphospecies recorded in (Majer et al. 2000) couldhave included multiple species that were counted asseparate species in our study.
Edge and adjacency effects
Edge sites were not consistently distinct in communitycomposition from interior sites, and isolated plant-ations were not consistently distinct from adjacentplantations. There was no effect of isolation on speciesrichness of the beetle fauna. Estimated beetle speciesrichness was lower in the two interior plantation sitesthan the two edge sites in samples from both collectingtechniques, but differences were too small to besignificant. The lack of strong edge and isolationeffects on the insect fauna indicates that landscapeposition and patch shape are less influential than othervariables in this system. Hobbs et al. (2003) similarlyconcluded that adjacency to remnants made littledifference to vertebrate species use of these plantations.Our analyses have, however, focused on measures ofthe whole insect community. A species-by-speciesanalyses could find that, for certain species, edge andisolation are important determinants of distribution. Wecan be sure, however, that there are too few suchexamples to suggest these factors have a major effect oncommunity structure.
ACKNOWLEDGEMENTS
This research was funded in part by the RuralIndustries Research and Development Coorporationthrough the Joint Venture Agroforestry Program.Plantation companies (ITC, Sotico/Bunnings, South-coast Sharefarms Great Southern Sharefarms) andlandholders kindly provided access to plantations andfarmland. Richard Hobbs helped develop the projectand Lyn Atkins collected vegetation survey data.Design and collection methods benefited from advicefrom Jonathan Majer, Mamoru Matsuki and John Ive.Michelle Michie, Joanna Hamilton, Rex Sutherland,John Dowse, Tara Simmul, Karl Brennan, John Ingram,Allan Reid and Andrew Loch helped collect and sortthe insects. Advice from Rob Colwell and JonCoddington improved the analyses, and commentsfrom Don Driscoll improved the manuscript. Thisproject required a great effort in the identification ofspecies and the further sorting this involves, andknowledge of the biology of some of the speciescollected. For this we are very grateful to Ted Edwardsand Rolf Oberprieler.
REFERENCES
Abbott I., Burbidge T., Williams M., Van Heurck P. (1992)Arthropod fauna of Jarrah (Eucalyptus marginata) foliage inMediterranean forest of Western Australia: Spatial andtemporal variation in abundance, biomass, guild structureand species composition. Aust. J. Ecol. 17, 263–74.
Altieri M. A., Cure J. R., Garcia M. A. (1993) The role andenhancement of parasitic hymenoptera biodiversity inagroecosystems. In: Hymenoptera and Biodiversity (edsJ. LaSalle & I. D. Gauld) pp. 257–75. CAB International,Wallingford.
Andow D. A. (1991) Vegetational diversity and arthropodpopulation response. Annu. Rev. Entomol. 36, 561–86.
Andow D. A. & Risch S. J. (1985) Predation in diversifiedagroecosystems: Relations between a coccinellid predatorColeomegilla maculata and its food. J. Appl. Ecol. 22, 357–72.
Bedford S. E. & Usher M. B. (1994) Distribution of arthropodspecies across the margins of farm woodlands. Agric. Ecosyst.Environ. 48, 295–305.
Chao A., Hwang W. H., Chen Y. C., Kuo C. Y. (2000)Estimating the number of shared species in twocommunities. Stat. Sinica 10, 227–46.
Clarke K. R. (1993) Non-parametric multivariate analyses ofchanges in community structure. Aust. J. Ecol. 18, 117–43.
Colwell R. K. (2000) Estimates, Version 6. http://viceroy.eeb.uconn.edu/EstimateS.
Colwell R. K. & Coddington J. A. (1994) Estimating terrestrialbiodiversity through extrapolation. Phil. Trans. R. Soc. Lond.B 345, 101–18.
Cornell H. C., Hawkins B. A., Hochberg M. E. (1998) Towardsan empirically-based theory of herbivore demography. Ecol.Entomol. 23, 340–9.
Cromartie W. J. (1975) Influence of habitat on colonization ofcollard plants by Pieris rapae. Environ. Entomol. 4, 783–4.

INSECT FAUNA: PLANTATIONS VS REMNANTS 117
Davies K. F. & Margules C. R. (1998) Effects of habitatfragmentation on carabid beetles: Experimental evidence.J. Anim. Ecol. 67, 460–71.
Davies K. F., Melbourne B. A., Margules C. R. (2001) Effects ofwithin- and between-patch processes on communitydynamics in a fragmentation experiment. Ecology 82,1830–46.
Fahrig L. & Jonsen I. (1998) Effect of habitat patch character-istics on abundance and diversity of insects in an agriculturallandscape. Ecosystems 1, 197–205.
Floater G. J. (2001) Habitat complexity, spatial interference, and‘minimum risk distribution’: A framework for populationstability. Ecol. Monogr. 71, 447–68.
Golden D. M. & Crist T. O. (2000) Experimental effects ofhabitat fragmentation on rove beetles and ants: Patch area oredge? Oikos 90, 525–38.
Gotelli N. J. & Colwell R. K. (2001) Quantifying biodiversity:Procedures and pitfalls in the measurement and comparisonof species richness. Ecol. Lett. 4, 379–91.
Greenwood E. A. N., Klein L., Beresford J. D., Watson G. D.(1985) Differences in annual evaporation between grazedpasture and Eucalyptus species in plantations on a saline farmcatchment. J. Hydrol. 78, 261–78.
Haddad N. M., Tilman D., Haartad J., Ritchie M., KnopsJ. M. H. (2001) Contrasting effects of plant richness andcomposition on insect communities: A field experiment. Am.Nat. 158, 17–35.
Hobbs R., Catling P. C., Wombey J. C., Clayton M., Atkins L.,Reid A. (2003) Faunal use of bluegum (Eucalyptus globulus)plantations in southwestern Australia. Agroforest. Syst. 58,195–212.
Jactel H., Goulard M., Menassieu P., Goujon G. (2002) Habitatdiversity in forest plantations reduces infestations of the pinestem borer Dioryctria sylvestrella. J. Appl. Ecol. 39, 618–28.
Kareiva P. (1983) Influence of vegetation texture on herbivorepopulations: Resource concentration and herbivore move-ment. In: Variable Plants and Herbivores in Natural andManaged Systems (eds R. F. Denno & M. S. McClure)pp. 259–89. Academic Press, New York.
Knops J. M. H., Tilman D., Haddad N. M. et al. (1999) Effectsof plant species richness on invasion dynamics, diseaseoutbreaks, insect abundances and diversity. Ecol. Lett. 2,286–93.
Koricheva J., Mulder C. P. H., Schmid B., Joshi J., Huss-DanellK. (2000) Numerical responses of different trophic groupsof invertebrates to manipulations of plant diversity in grass-lands. Oecologia 125, 271–82.
Kruess A. & Tscharntke T. (2000) Species richness andparasitism in a fragmented landscape: Experiments andfield studies with insects on Vicia sepium. Oecologia 122,129–37.
Lamb D. (1998) Large-scale ecological restoration of degradedtropical forest lands: The potential role of timber plantations.Restoration Ecol. 6, 271–9.
Laurance W. F. & Yensen E. (1991) Predicting the impacts ofedge effects in fragmented habitats. Biol. Conserv. 55, 77–92.
Loch A. D. & Floyd R. B. (2001) Insect pests of Tasmanian bluegum, Eucalyptus globulus globulus, in south-western Australia:
History, current perspectives and future prospects. AustralEcol. 26, 458–66.
Magurran A. E. (1988) Ecological Diversity and Its Measurement.Croom-Helm, London.
McCune B. & Mefford M. J. (1999) PC-Ord: MultivariateAnalysis of Ecological Data, Version 4.2.0. MjM Software,Gleneden Beach.
McPherson T. S. & Timmer V. R. (2002) Amelioration ofdegraded soils under red pine plantations on the Oak RidgesMoraine, Ontario. Can. J. Soil Sci. 82, 375–88.
Majer J. D., Recher H. F., Ganesh S. (2000) Diversity patternsof eucalypt canopy arthropods in eastern and westernAustralia. Ecol. Entomol. 25, 295–306.
Montagnini F. (2001) Strategies for the recovery of degradedecosystems: Experiences from Latin America. Interciencia26, 498–503.
Moore L. V., Myers J. H., Eng R. (1988) Western tent caterpillarsprefer the sunny side of the tree, but why? Oikos 51, 321–6.
Murcia C. (1995) Edge effects in fragmented forests:Implications for conservation. Trend. Ecol. Evol. 10, 58–62.
Murdoch W. J., Evans F., Peterson C. (1972) Diversity andpattern in plants and insects. Ecology 53, 819–29.
Naumann I. D. (1991) Hymenoptera. In: The Insects of Australia,edition 2nd edn (ed. CSIRO) pp. 916–1000. MelbourneUniversity Press, Melbourne.
Novotny V., Basset Y., Miller S. E., Welblen G. D., Bremer B.,Cizek L., Drozd P. (2002) Low host specificity ofherbivorous insects in tropical forest. Nature 416, 841–4.
Recher H. F., Majer J. D., Ganesh S. (1996) Eucalypts,arthropods and birds: On the relation between foliarnutrients and species richness. Forest Ecol. Manage. 85,177–95.
Risch S. J., Andow D., Altieri M. A. (1983) Agroecosystemdiversity and pest control: Data, tentative conclusions, andnew research directions. Environ. Entomol. 12, 625–9.
Root R. B. (1973) Organization of a plant–arthropod associationin simple and diverse habitats: The fauna of collards(Brassica oleraceae). Ecol. Monogr. 43, 95–124.
Strauss S. Y. (2001) Benefits and risks of biotic exchangebetween Eucalyptus plantations and native Australian forests.Austral Ecol. 26, 447–57.
Thomas J. A., Bourn N. A. D., Clarke R. T. et al. (2001) Thequality and isolation of habitat patches both determine wherebutterflies persist in fragmented landscapes. Proc. R. Soc.Lond. B 268, 1791–6.
Tonhasca A. & Byrne D. N. (1994) The effects of crop diversifi-cation on herbivorous insects: A meta-analysis approach.Ecol. Entomol. 19, 239–44.
Tscharntke T., Steffan-Dewenter I., Kreuss A., Thies C. (2002)Characteristics of insect populations on habitat fragments: Amini review. Ecol. Res. 17, 229–39.
Wood M. S., Stephens N. C., Allison B. K., Howell C. I. (2001)Plantations of Australia – A Report from the National PlantationInventory and National Farm Forest Inventory. National ForestInventory, Bureau of Rural Sciences, Canberra.
Zabel J. & Tscharntke T. (1998) Does fragmentation ofUrtica habitats affect phytophagous and predatory insectsdifferentially? Oecologia 116, 419–25.