Probability Distributions in High-Density Dendroenergy Plantations
10
Probability Distributions in High-Density Dendroenergy Plantations Simo ´n Sandoval, Jorge Cancino, Rafael Rubilar, Edwin Esquivel, Eduardo Acun ˜a, Fernando Mun ˜ oz, and Miguel Espinosa Abstract: Six probability density functions were used to model diametric distributions of Acacia melanoxylon, Eucalyptus camaldulensis, and Eucalyptus nitens being investigated for dendroenergy purposes at three plan- tation densities (5,000, 7,500, and 10,000 trees ha 1 ). The Weibull was the function with the best fit, followed in decreasing order by the beta, Johnson S B , gamma, lognormal, and Johnson S U functions. Planting density affected the shape and amplitude of the diametric distribution of all species. Increasing stocking made distributions more leptokurtic and narrower. Analyses over time during the first 28 months suggested a stronger effect on diameter distribution form, which was less evident during the early ages of the crop. FOR.SCI. 58(6): 663– 672. Keywords: probability density functions, short rotation crops, bioenergy, stocking, Weibull D ECISIONMAKING IN FORESTRY is often based largely on a plantation’s growth and yield (Parresol 2003), and the prediction of these variables has provided a constant focus for studies. At present, mathe- matical modeling is used to predict the growth and yield of a given plantation, considering stand variables such as stocking, basal area, dominant height, and diametric fre- quency distribution per unit area (Gove and Patil 1998). Knowing the diametric distribution of a plantation, as well as the distribution of other variables at the tree level (e.g., volume and biomass), constitutes a fundamental tool for decisionmaking in forest management (Zhang et al. 2003, Cao 2004) and is one of the main characteristics used to determine stand state variables such as basal area, volume, or biomass per unit area (Mehta ¨talo 2004). Different theoretical probability density functions (PDFs) have been used to describe the diametric distribution of plantations, including the beta (Clutter and Bennett 1965, Lenhart and Clutter 1971, Zohrer 1972, Li et al. 2002), gamma (Nelson 1964), lognormal (Bliss and Reinker 1964), Weibull (Bailey and Dell 1973, Rennolls et al. 1985), and Johnson (Hafley and Schreuder 1977, Zhou and McTague 1996, Kamziah et al. 1999). Clutter and Bennett (1965) were pioneers introducing the diametric distribution meth- odology in growth and yield models. These authors used the four-parameter beta PDF to describe the distribution of the number of trees per unit area for classes of diameter at breast height (dbh). Since then, PDFs have been widely used to model plantation growth and yield (Lindsay et al. 1996). Bailey and Dell (1973) were the first to use the Weibull PDF as a dbh frequency distribution model, noting that this function had certain advantages over the beta function; because the Weibull PDF has a closed form, it can be expressed as a cumulative density function that can be evaluated without numerical integration and only requires the estimation of three parameters. Hafley and Schreuder (1977) introduced the Johnson S B distribution (system bounded) (Johnson 1949) to the methodology of diametric distributions. Alzaid and Sultan (2009) analyzed the gamma and lognormal PDFs and recommended the use of the gamma distribution, because of its higher flexibility. The analysis and selection of the right PDF for a data set has been widely discussed in different research areas. Sev- eral authors (Cox 1961, 1962, Chambers and Cox 1967, Atkinson 1969, 1970, Dyer 1973, Chen 1980) highlighted the importance of selecting the optimum PDF because of the better utility of these functions. Moreover, several studies have focused on describing differences among PDFs (Jack- son 1969, Dumonceaux and Antle 1973, Bain and Engel- hard 1980, Fearn and Nebenzahl 1991, Wiens 1999, Gupta and Kundu 2003a, 2003b, 2004, Alzaid and Sultan 2009). Although numerous research cases in forestry address this topic, they focus nearly exclusively on using PDFs to de- scribe the diametric distributions of traditional plantations (i.e., stands for sawtimber or pulp) and on modeling the diametric distribution at a specific site without comparing PDFs in terms of fit quality and precision (Hafley and Schreuder 1977, Reynolds 1984, Newberry and Burk 1985, Reynolds et al. 1988, Lindsay et al. 1996, Zhang et al. 2003, Cao 2004, Lei 2008). Studies published on this area have not considered plantations for biomass production for den- droenergy grown at high stockings for short rotation har- vesting periods. In Chile, crops for biomass production for dendroenergy Manuscript received March 7, 2011; accepted March 21, 2012; published online April 26, 2012; http://dx.doi.org/10.5849/forsci.11-028. Simo ´n Sandoval, Universidad de Concepcio ´n, Victoria 631, Barrio Universitario, Concepcio ´n, Concepcio ´n, Chile—Phone: 2204979; [email protected]. Jorge Cancino, Universidad de Concepcio ´ n—[email protected]. Rafael Rubilar, Universidad de Concepcio ´ n—[email protected]. Edwin Esquivel, Universidad de Concepcio ´n— [email protected]. Eduardo Acun ˜a, Universidad de Concepcio ´n— [email protected]. Fernando Mun ˜oz, Universidad de Concepcio ´n—[email protected]. Miguel Espinosa, Universidad de Concepcio ´n—[email protected]. Acknowledgments: This work was supported by the project INNOVA Bio-Bio N o 06 PC S1-33. This article uses metric units; the applicable conversion factors are: millimeters (mm): 1 mm 0.039 in.; centimeters (cm): 1 cm 0.39 in.; meters (m): 1m 3.3 ft.; hectares (ha): 1 ha 2.47 ac.; kilograms (kg): 1 kg 2.2 lb. Copyright © 2012 by the Society of American Foresters. Forest Science 58(6) 2012 663
-
Upload
independent -
Category
Documents
-
view
0 -
download
0
Transcript of Probability Distributions in High-Density Dendroenergy Plantations
Probability Distributions in High-Density Dendroenergy Plantations
Simon Sandoval, Jorge Cancino, Rafael Rubilar, Edwin Esquivel, Eduardo Acuna,Fernando Munoz, and Miguel Espinosa
Abstract: Six probability density functions were used to model diametric distributions of Acacia melanoxylon,Eucalyptus camaldulensis, and Eucalyptus nitens being investigated for dendroenergy purposes at three plan-tation densities (5,000, 7,500, and 10,000 trees ha�1). The Weibull was the function with the best fit, followedin decreasing order by the beta, Johnson SB, gamma, lognormal, and Johnson SU functions. Planting densityaffected the shape and amplitude of the diametric distribution of all species. Increasing stocking madedistributions more leptokurtic and narrower. Analyses over time during the first 28 months suggested a strongereffect on diameter distribution form, which was less evident during the early ages of the crop. FOR. SCI. 58(6):663–672.
Keywords: probability density functions, short rotation crops, bioenergy, stocking, Weibull
DECISIONMAKING IN FORESTRY is often basedlargely on a plantation’s growth and yield (Parresol2003), and the prediction of these variables has
provided a constant focus for studies. At present, mathe-matical modeling is used to predict the growth and yield ofa given plantation, considering stand variables such asstocking, basal area, dominant height, and diametric fre-quency distribution per unit area (Gove and Patil 1998).Knowing the diametric distribution of a plantation, as wellas the distribution of other variables at the tree level (e.g.,volume and biomass), constitutes a fundamental tool fordecisionmaking in forest management (Zhang et al. 2003,Cao 2004) and is one of the main characteristics used todetermine stand state variables such as basal area, volume,or biomass per unit area (Mehtatalo 2004).
Different theoretical probability density functions(PDFs) have been used to describe the diametric distributionof plantations, including the beta (Clutter and Bennett 1965,Lenhart and Clutter 1971, Zohrer 1972, Li et al. 2002),gamma (Nelson 1964), lognormal (Bliss and Reinker 1964),Weibull (Bailey and Dell 1973, Rennolls et al. 1985), andJohnson (Hafley and Schreuder 1977, Zhou and McTague1996, Kamziah et al. 1999). Clutter and Bennett (1965)were pioneers introducing the diametric distribution meth-odology in growth and yield models. These authors used thefour-parameter beta PDF to describe the distribution of thenumber of trees per unit area for classes of diameter atbreast height (dbh). Since then, PDFs have been widelyused to model plantation growth and yield (Lindsay et al.1996). Bailey and Dell (1973) were the first to use theWeibull PDF as a dbh frequency distribution model, notingthat this function had certain advantages over the beta
function; because the Weibull PDF has a closed form, it canbe expressed as a cumulative density function that can beevaluated without numerical integration and only requiresthe estimation of three parameters. Hafley and Schreuder(1977) introduced the Johnson SB distribution (systembounded) (Johnson 1949) to the methodology of diametricdistributions. Alzaid and Sultan (2009) analyzed the gammaand lognormal PDFs and recommended the use of thegamma distribution, because of its higher flexibility.
The analysis and selection of the right PDF for a data sethas been widely discussed in different research areas. Sev-eral authors (Cox 1961, 1962, Chambers and Cox 1967,Atkinson 1969, 1970, Dyer 1973, Chen 1980) highlightedthe importance of selecting the optimum PDF because of thebetter utility of these functions. Moreover, several studieshave focused on describing differences among PDFs (Jack-son 1969, Dumonceaux and Antle 1973, Bain and Engel-hard 1980, Fearn and Nebenzahl 1991, Wiens 1999, Guptaand Kundu 2003a, 2003b, 2004, Alzaid and Sultan 2009).Although numerous research cases in forestry address thistopic, they focus nearly exclusively on using PDFs to de-scribe the diametric distributions of traditional plantations(i.e., stands for sawtimber or pulp) and on modeling thediametric distribution at a specific site without comparingPDFs in terms of fit quality and precision (Hafley andSchreuder 1977, Reynolds 1984, Newberry and Burk 1985,Reynolds et al. 1988, Lindsay et al. 1996, Zhang et al. 2003,Cao 2004, Lei 2008). Studies published on this area havenot considered plantations for biomass production for den-droenergy grown at high stockings for short rotation har-vesting periods.
In Chile, crops for biomass production for dendroenergy
Manuscript received March 7, 2011; accepted March 21, 2012; published online April 26, 2012; http://dx.doi.org/10.5849/forsci.11-028.
Simon Sandoval, Universidad de Concepcion, Victoria 631, Barrio Universitario, Concepcion, Concepcion, Chile—Phone: 2204979; [email protected] Cancino, Universidad de Concepcion—[email protected]. Rafael Rubilar, Universidad de Concepcion—[email protected]. Edwin Esquivel,Universidad de Concepcion—[email protected]. Eduardo Acuna, Universidad de Concepcion—[email protected]. Fernando Munoz, Universidad deConcepcion—[email protected]. Miguel Espinosa, Universidad de Concepcion—[email protected].
Acknowledgments: This work was supported by the project INNOVA Bio-Bio No 06 PC S1-33.
This article uses metric units; the applicable conversion factors are: millimeters (mm): 1 mm � 0.039 in.; centimeters (cm): 1 cm � 0.39 in.; meters (m):1 m � 3.3 ft.; hectares (ha): 1 ha � 2.47 ac.; kilograms (kg): 1 kg � 2.2 lb.
Copyright © 2012 by the Society of American Foresters.
Forest Science 58(6) 2012 663
have only been recently established in experimental areas,and the potential for establishing these crops on an opera-tional scale is still unknown. However, future potentialexpansion suggests that development of growth and yieldprojection methods for these plantations will be important.The objective of our study was to model the changes indiametric distribution of a dendroenergy crop over time bytesting six PDFs for three species (Acacia melanoxylon R.Br., Eucalyptus camaldulensis Dehnh., and Eucalyptus ni-tens Deane & Maiden) at three stockings (5,000, 7,500, and10,000 trees ha�1). These first functions are to be consid-ered for the development of growth and yield models fordendroenergetic crops.
Materials and MethodsAssay Characteristics and Study Area
The assay was established in August 2007 on the Llohuesite, located in the interior dryland of the Bio-Bio Region,Ninhue Township, Chile. The site presents nutritional andwater limitations and is predominately characterized bylow-yield forest plantations dedicated to pulp or sawtimberproduction. Soils are granitic and classified as the Cau-quenes soil series, which show high susceptibility to erosionand have severe compaction potential. Surface soil horizonsare low in organic matter and have a high gravel content thatnegatively affects initial establishment and plantationgrowth. The site has up to 5 months of drought per year(Carrasco et al. 1993, Direccion General de AeronauticaCivil 2010), with an average annual rainfall of 700 mm andtemperatures that fluctuate between 0 and 32°C. The terrainhas a rolling to abrupt topography but the slope in the studyarea does not exceed 5%.
Before the beginning of the trial, the site was prepared byextracting the stumps of the previous crop (Pinus radiata D.Don) and subsoiled in a grid layout to 80-cm depth using aCaterpillar D8K tractor with 60-cm distance between rows.Weeds were controlled at pre- and postplanting using achemical mixture containing 4 kg of glyphosate (RoundupMax), 1.5 kg of simazine, and 2.5 kg of atrazine. Postplant-
ing fertilization included 15 g of boronatrocalcite, 75 g ofdiammonium phosphate, and 25 g of Sul-Po-Mag applied ina circle at 25 cm from the collar of each plant. A perimeterfence made of galvanized mesh 5014 was erected to protectthe study area from animals; the fence was buried about0.3 m and stood approximately 1.2 m above ground level.
The trial was established as a complete randomizedblock design with three replicates. Blocks were squares of75 m at each side (5,625 m2) consisting of nine experimen-tal units of 25 m per side (625 m2) with 49 measurementtrees and a buffer zone to reduce edge effects. Three species(A. melanoxylon, E. camaldulensis, and E. nitens) wereestablished in each block at three planting densities (5,000,7,500, and 10,000 trees).
Tree Measurements
Individual tree measurements at each experimental unitwere made in October and December 2007, July and De-cember 2008, and July and December 2009. At each mea-surement time collar diameter (D) at 0.1 m above theground, dbh once the trees were taller than 1.3 m, crowndiameter, and total height of all the trees were measured foreach experimental unit. In this study we used only D for allanalyses. Data from October 2007 measurements was ex-cluded from the analysis because of the lack of diameterclasses at this stage of stand development.
Data Analysis
Diameter data, time of measurement, and planting den-sity were tabulated into classes of amplitude, two for eachspecies. The relative frequency was used to fit the gamma,beta, Weibull, lognormal, Johnson SB, and Johnson SU
PDFs for each one of these factors (Table 1).For all models presented in Table 1, x is the diametric
class, a is the parameter of location, b is the parameter ofscale, and c and d are parameters of shape. As suggested byFrazier (1981), the parameter of location was restricted inall the functions to predict the minimum value of D on the
Table 1. Structures of the PDFs.
Function PDFs
Gamma 1
��c�b �x � a
b �c�1
exp���x � a
b ��; x � a
Beta�x � a�c�1�a � b � x�d�1
b�c�d�1� ���c � d�
��c���d�; a � x � �a � b�
Weibull �c
b��x � a
b �c�1
exp���x � a
b �c�; x � a
Lognormal � 1
c�x � a��2��exp��
�log�x � a� � b�2
2c2 �; x � a
Johnson SB
c
b�2���x � a
b ��1 �x � a
b ���1
exp��1
2 �d � c log� x � a
a � b � x��2�; a � x � �a � b�
Johnson SU
c
b�2�� 1
�1 � ��x � a�/b�2� exp��1
2 �d � c log��x � a
b � � ��x � a
b � � 1��2�; x � a
In all the models, x � 0 and the parameters are subject to a � 0, b � 0, c � 0, �� d �, except in the beta function, where d � 0. The expression�(�) is the gamma function of a constant calculated as (� � 1)!
664 Forest Science 58(6) 2012
plantation according to the expression a � 0.5xmin. In all thefunctions, the other parameters were estimated by the max-imum likelihood method using SAS software (SAS Insti-tute, Inc. 2002).
Evaluation of Functions
The quality of the adjusted functions was evaluatedbased on the root mean square error (RMSE), the Akaikeindex (AIC), and the error index (EI) proposed by Reynoldset al. (1988). The RMSE is an indicator of the precision ofeach PDF. Similar to the RMSE, the EI is an indicatorobtained from the sum of weighted absolute differencesbetween observed and estimated distributions. The EI con-siders the magnitude of the differences and the size class inwhich they are produced, evaluating the importance of thesize class for variables derived from the PDF (e.g., basalarea). The AIC, however, was useful for comparison be-tween functions with different numbers of parameters. TheRMSE, EI, and AIC were calculated, respectively, using
RMSE � ��i�1
n
�F� xi� � F� xi��2/n,
EI � �i�1
n
w�xi��F�xi� � F�xi��,
AIC � n ln�SSE/n� � 2p.
In these criteria, F(xi) and F(xi) are the observed andestimated relative frequencies, respectively, n is the numberof diametric classes, p is the number of parameters in thePDF, and w(xi) is a weighting function that depends onsome variable of interest. Following the methodology ofMehtatalo (2004), we also used the basal area of eachdiametric class type (gi) as a weighting factor. However,unlike the Mehtatalo (2004) we expressed this as w(xi) �gi /i�1
n gi in the EI to be an indicator of precision that canbe used to compare distributions with different numbers ofdiametric classes.
Results and Discussion
The maximum likelihood method used for the fitachieved good estimates in all the PDFs analyzed. Zarnochand Dell (1985) reported similar results from a study basedon adult plantations under traditional silviculture. Thoseauthors highlight the capacity of the method to obtain goodestimators. The estimation of the parameter of location (a)of the PDFs revealed good results, coinciding with severalinvestigations that have used this methodology (Frazier1981, Cao 2004, Lei 2008, Jiang and Brooks 2009).
In general, the indicators RMSE, EI, and AIC revealedthat the best results in terms of precision and parsimonywere obtained with the beta PDF, followed in decreasingorder by the Weibull, Johnson SB, Johnson SU, gamma, andlognormal functions. Although the gamma, lognormal, andJohnson SU functions exhibited good precision values(RMSE), they were less precise than the beta, Weibull, andJohnson SB PDFs (Table 2). Therefore, the remaining anal-yses were limited to the latter three functions.
Precision varied between planting densities and betweenspecies. Twenty-eight months after the beginning of thetrial, precision was consistently highest at the lowest plant-ing density (5,000 trees) for the three species and the threebest PDFs (Table 2). For A. melanoxylon and E. camaldu-lensis, the three PDFs showed the best results in terms ofprecision, in declining order, at 5,000, 10,000, and 7,500trees. For E. nitens, however, the same result was onlyobserved with the Weibull PDF, whereas the beta andJohnson SB functions showed greater precision, in decliningorder, at 5,000, 7,500, and 10,000 trees. For A. melanoxylon,the highest precision evaluated by RMSE was achieved withthe Weibull PDF at the three planting densities. For E.camaldulensis, the best results were obtained with the betaPDF for 5,000 and 10,000 trees, whereas at 7,500 trees, thebest precision was obtained with the Weibull PDF. For E.nitens, the beta PDF showed the best results for 5,000 and7,500 trees, and the Weibull PDF showed the highest pre-cision for 10,000 trees.
The effects of planting density and species on the preci-sion of the PDFs are difficult to analyze based on the EI. Noclear tendency was observed in terms of the effect of thesefactors (Table 2). For A. melanoxylon, the best results were
Table 2. Values of RMSE, EI, and AIC obtained with the three best PDFs according to species and planting density 28 monthsafter field establishment.
SpeciesDensity
(trees ha�1)
Beta Weibull Johnson SB
RMSE AIC EI RMSE AIC EI RMSE AIC EI
A. melanoxylon 5,000 0.0184 �228.0 0.0126 0.0183 �230.4 0.0146 0.0189 �226.5 0.01277,500 0.0323 �154.3 0.0134 0.0305 �158.9 0.0143 0.0352 �150.3 0.0135
10,000 0.0307 �156.6 0.0196 0.0288 �161.6 0.0206 0.0323 �154.3 0.0197E. camaldulensis 5,000 0.0138 �270.4 0.0097 0.0142 �270.6 0.0089 0.0146 �266.8 0.0103
7,500 0.0216 �226.4 0.0149 0.0210 �230.1 0.0153 0.0220 �225.3 0.015310,000 0.0140 �243.5 0.0094 0.0146 �243.9 0.0109 0.0147 �241.1 0.0098
E. nitens 5,000 0.0187 �203.3 0.0147 0.0228 �195.0 0.0188 0.0188 �203.0 0.01487,500 0.0270 �162.5 0.0174 0.0351 �152.5 0.0274 0.0272 �162.2 0.0172
10,000 0.0302 �171.4 0.0171 0.0280 �177.1 0.0178 0.0312 �169.7 0.0177
RMSE, root mean squared error; AIC, Akaike’s index; EI, values from Reynolds et al. (1988).
Forest Science 58(6) 2012 665
obtained for 5,000 trees with the beta and Johnson SB PDFs,whereas with the Weibull PDF the best result was obtainedfor 7,500 trees. For E. camaldulensis, the EI was lower for10,000 trees for the beta and Johnson SB PDFs, and the bestresult was obtained with the Weibull PDF for 5,000 trees.For E. nitens, there was also no clear effect of stocking onthe EI. Here the beta and Johnson SB PDFs showed the bestresults for 5,000 trees and the Weibull PDF for 10,000 trees.
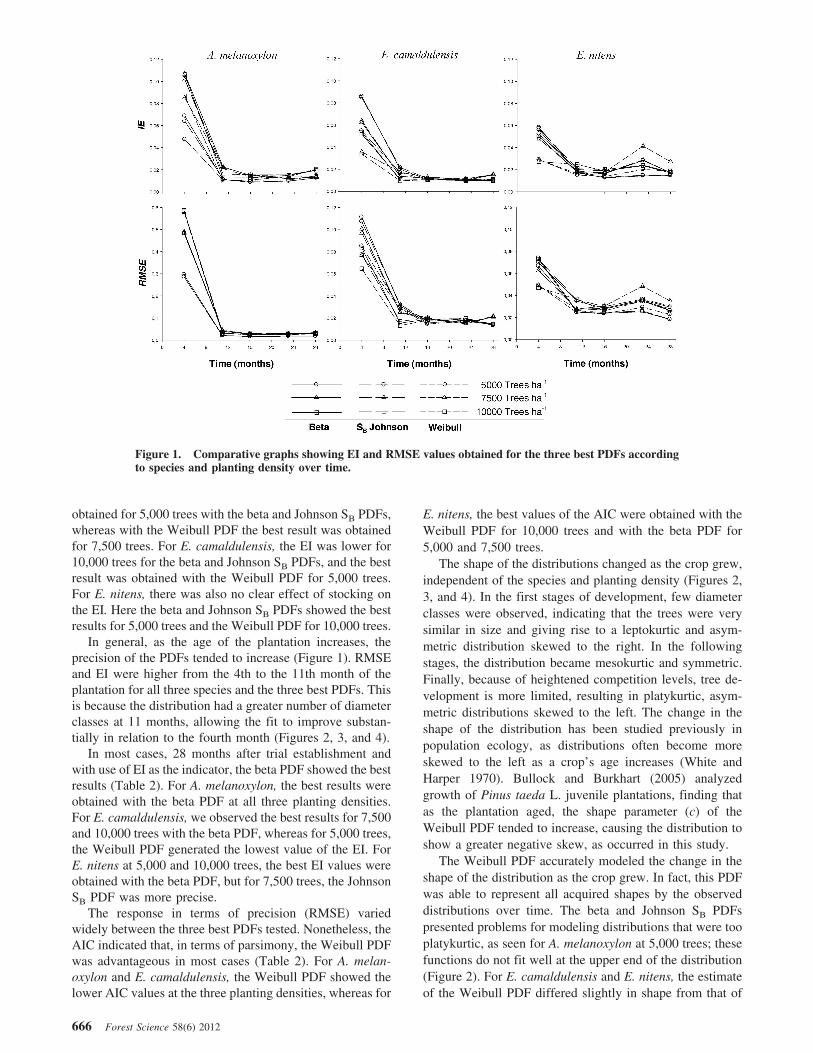
In general, as the age of the plantation increases, theprecision of the PDFs tended to increase (Figure 1). RMSEand EI were higher from the 4th to the 11th month of theplantation for all three species and the three best PDFs. Thisis because the distribution had a greater number of diameterclasses at 11 months, allowing the fit to improve substan-tially in relation to the fourth month (Figures 2, 3, and 4).
In most cases, 28 months after trial establishment andwith use of EI as the indicator, the beta PDF showed the bestresults (Table 2). For A. melanoxylon, the best results wereobtained with the beta PDF at all three planting densities.For E. camaldulensis, we observed the best results for 7,500and 10,000 trees with the beta PDF, whereas for 5,000 trees,the Weibull PDF generated the lowest value of the EI. ForE. nitens at 5,000 and 10,000 trees, the best EI values wereobtained with the beta PDF, but for 7,500 trees, the JohnsonSB PDF was more precise.
The response in terms of precision (RMSE) variedwidely between the three best PDFs tested. Nonetheless, theAIC indicated that, in terms of parsimony, the Weibull PDFwas advantageous in most cases (Table 2). For A. melan-oxylon and E. camaldulensis, the Weibull PDF showed thelower AIC values at the three planting densities, whereas for
E. nitens, the best values of the AIC were obtained with theWeibull PDF for 10,000 trees and with the beta PDF for5,000 and 7,500 trees.
The shape of the distributions changed as the crop grew,independent of the species and planting density (Figures 2,3, and 4). In the first stages of development, few diameterclasses were observed, indicating that the trees were verysimilar in size and giving rise to a leptokurtic and asym-metric distribution skewed to the right. In the followingstages, the distribution became mesokurtic and symmetric.Finally, because of heightened competition levels, tree de-velopment is more limited, resulting in platykurtic, asym-metric distributions skewed to the left. The change in theshape of the distribution has been studied previously inpopulation ecology, as distributions often become moreskewed to the left as a crop’s age increases (White andHarper 1970). Bullock and Burkhart (2005) analyzedgrowth of Pinus taeda L. juvenile plantations, finding thatas the plantation aged, the shape parameter (c) of theWeibull PDF tended to increase, causing the distribution toshow a greater negative skew, as occurred in this study.
The Weibull PDF accurately modeled the change in theshape of the distribution as the crop grew. In fact, this PDFwas able to represent all acquired shapes by the observeddistributions over time. The beta and Johnson SB PDFspresented problems for modeling distributions that were tooplatykurtic, as seen for A. melanoxylon at 5,000 trees; thesefunctions do not fit well at the upper end of the distribution(Figure 2). For E. camaldulensis and E. nitens, the estimateof the Weibull PDF differed slightly in shape from that of
Figure 1. Comparative graphs showing EI and RMSE values obtained for the three best PDFs accordingto species and planting density over time.
666 Forest Science 58(6) 2012

the beta and Johnson SB PDFs. The Weibull PDF repre-sented the middle section of the distribution better than thebeta and Johnson SB PDFs. This observation exemplifiesthe flexibility of the Weibull PDF, which requires the esti-mation of only three parameters, compared with the fourparameters that must be estimated for the beta and JohnsonSB PDFs, based on the parsimony evidenced by the AIC.This characteristic has been underscored by several authors,who also mentioned the capacity of the Weibull distribu-
tion to describe a wide range of unimodal distributions(e.g., j-inverted, exponential, and normal) and highlightedthe capacity of this PDF to be expressed in its closed shapeas an cumulative distribution function (Bailey and Dell 1973,Schreuder and Swank 1974, Schreuder et al. 1979, Little 1983,Rennolls et al. 1985, Mabvurira et al. 2002, Lei 2008).
Stocking also affected the shape and amplitude of thediametric distribution. A. melanoxylon, for example, showedimportant changes in the distribution shape as stocking
Figure 2. Distributions of observed and estimated probability for A. melanoxylon over time. The observeddistribution represent the average of the plots measured.
Forest Science 58(6) 2012 667

increased (Figure 2). The distribution for 5,000 trees wasmore platykurtic than the distribution observed for 10,000trees. Furthermore, for 5,000 trees, the number of diameterclasses was greater because these experimental units hadlower levels of competition, as manifested by the presenceof larger trees. The three species studied here exhibited thiseffect, which was observed in the first stages of growth,although to a lesser degree. This finding agrees with thefindings of White and Harper (1970), who reported distri-
butions further skewed to the right in forest populationswith high levels of competition. Bullock and Burkhart(2005) reported the same tendency in their analysis ofjuvenile plantations of Pinus taeda at several planting den-sities (747–6,727 trees), finding that as stocking increases,the value of the parameter that defined the shape of theWeibull PDF diminished (i.e., parameter c), thereby causinga positive skew of the distribution, which increases with theage of the crop. Although no studies have been published
Figure 3. Distributions of observed and estimated probability for E. camaldulensis over time. Theobserved distribution represent the average of the plots measured.
668 Forest Science 58(6) 2012

for diameter distributions of dendroenergetic crops, severalauthors results agree with the results obtained, suggestingthat diameter size decreases with greater planting densities(Bernardo et al. 1998, Pinkard and Neilsen 2003, Harmandet al. 2004, Barton and Montagu 2006, Wilkinson et al.2007) and offering clear evidence of the effect on diameterdistribution caused by high levels of competition at earlystages of development.
Some stand variables were closely related to the param-
eters estimated for the Weibull PDF for the three speciesanalyzed (Figure 5). The parameters of location (a) andscale (b) maintained a clear direct relationship with meanheight and quadratic mean diameter but showed little rela-tionship to stocking and showed a tendency to decreaseas stocking increased. The parameter of shape (c) showedlittle relationship with these stand variables. The parametersincreased slightly along with mean height and quadraticmean diameter, whereas the real number of trees did not
Figure 4. Distributions of observed and estimated probability for E. nitens over time. The observeddistribution represent the average of the plots measured.
Forest Science 58(6) 2012 669
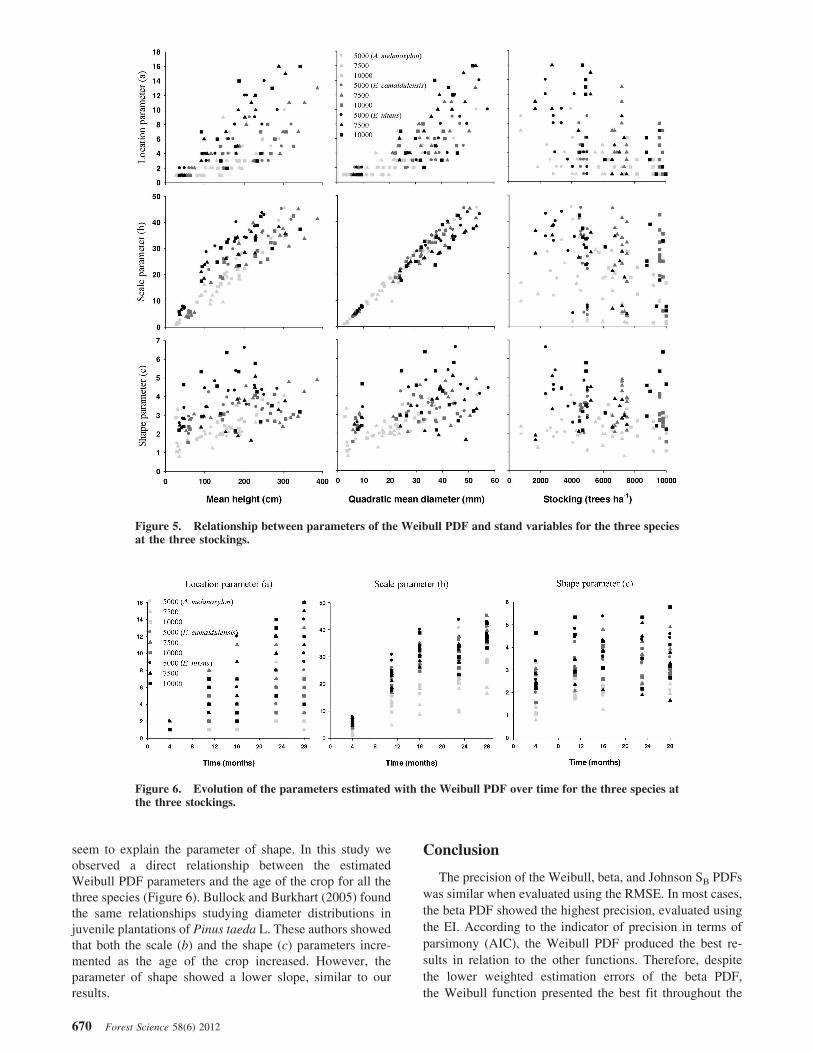
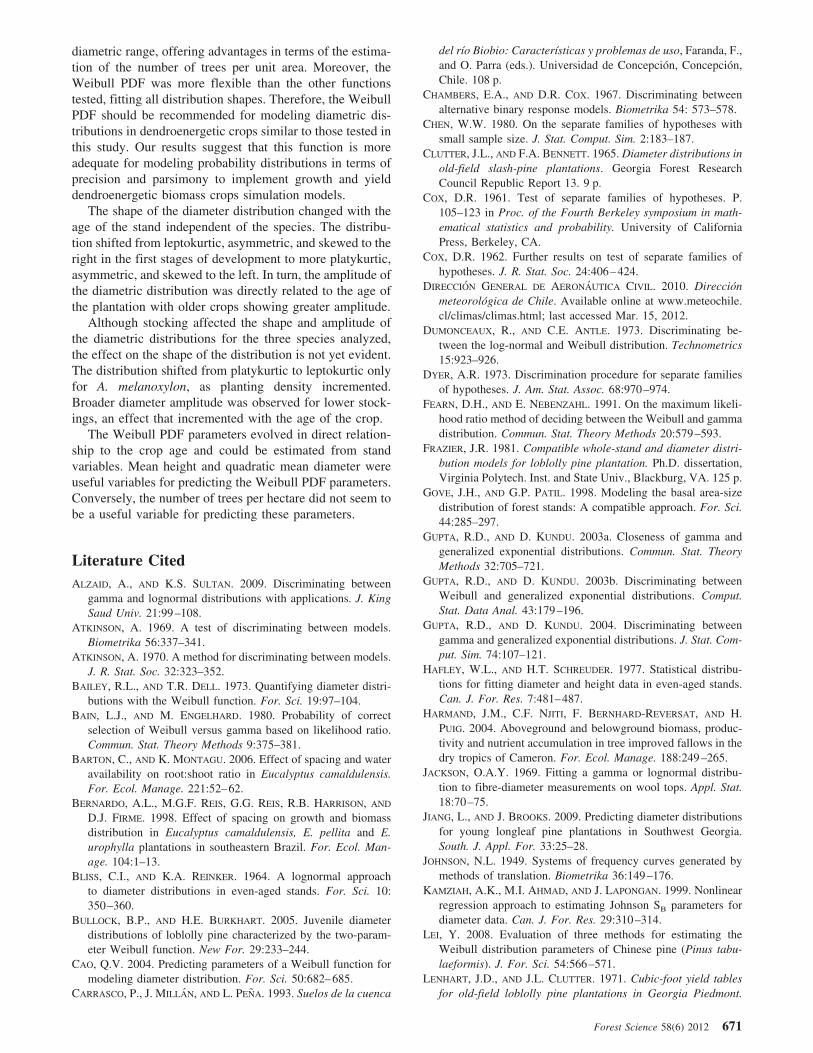
seem to explain the parameter of shape. In this study weobserved a direct relationship between the estimatedWeibull PDF parameters and the age of the crop for all thethree species (Figure 6). Bullock and Burkhart (2005) foundthe same relationships studying diameter distributions injuvenile plantations of Pinus taeda L. These authors showedthat both the scale (b) and the shape (c) parameters incre-mented as the age of the crop increased. However, theparameter of shape showed a lower slope, similar to ourresults.
Conclusion
The precision of the Weibull, beta, and Johnson SB PDFswas similar when evaluated using the RMSE. In most cases,the beta PDF showed the highest precision, evaluated usingthe EI. According to the indicator of precision in terms ofparsimony (AIC), the Weibull PDF produced the best re-sults in relation to the other functions. Therefore, despitethe lower weighted estimation errors of the beta PDF,the Weibull function presented the best fit throughout the
Figure 5. Relationship between parameters of the Weibull PDF and stand variables for the three speciesat the three stockings.
Figure 6. Evolution of the parameters estimated with the Weibull PDF over time for the three species atthe three stockings.
670 Forest Science 58(6) 2012
diametric range, offering advantages in terms of the estima-tion of the number of trees per unit area. Moreover, theWeibull PDF was more flexible than the other functionstested, fitting all distribution shapes. Therefore, the WeibullPDF should be recommended for modeling diametric dis-tributions in dendroenergetic crops similar to those tested inthis study. Our results suggest that this function is moreadequate for modeling probability distributions in terms ofprecision and parsimony to implement growth and yielddendroenergetic biomass crops simulation models.
The shape of the diameter distribution changed with theage of the stand independent of the species. The distribu-tion shifted from leptokurtic, asymmetric, and skewed to theright in the first stages of development to more platykurtic,asymmetric, and skewed to the left. In turn, the amplitude ofthe diametric distribution was directly related to the age ofthe plantation with older crops showing greater amplitude.
Although stocking affected the shape and amplitude ofthe diametric distributions for the three species analyzed,the effect on the shape of the distribution is not yet evident.The distribution shifted from platykurtic to leptokurtic onlyfor A. melanoxylon, as planting density incremented.Broader diameter amplitude was observed for lower stock-ings, an effect that incremented with the age of the crop.
The Weibull PDF parameters evolved in direct relation-ship to the crop age and could be estimated from standvariables. Mean height and quadratic mean diameter wereuseful variables for predicting the Weibull PDF parameters.Conversely, the number of trees per hectare did not seem tobe a useful variable for predicting these parameters.
Literature CitedALZAID, A., AND K.S. SULTAN. 2009. Discriminating between
gamma and lognormal distributions with applications. J. KingSaud Univ. 21:99–108.
ATKINSON, A. 1969. A test of discriminating between models.Biometrika 56:337–341.
ATKINSON, A. 1970. A method for discriminating between models.J. R. Stat. Soc. 32:323–352.
BAILEY, R.L., AND T.R. DELL. 1973. Quantifying diameter distri-butions with the Weibull function. For. Sci. 19:97–104.
BAIN, L.J., AND M. ENGELHARD. 1980. Probability of correctselection of Weibull versus gamma based on likelihood ratio.Commun. Stat. Theory Methods 9:375–381.
BARTON, C., AND K. MONTAGU. 2006. Effect of spacing and wateravailability on root:shoot ratio in Eucalyptus camaldulensis.For. Ecol. Manage. 221:52–62.
BERNARDO, A.L., M.G.F. REIS, G.G. REIS, R.B. HARRISON, AND
D.J. FIRME. 1998. Effect of spacing on growth and biomassdistribution in Eucalyptus camaldulensis, E. pellita and E.urophylla plantations in southeastern Brazil. For. Ecol. Man-age. 104:1–13.
BLISS, C.I., AND K.A. REINKER. 1964. A lognormal approachto diameter distributions in even-aged stands. For. Sci. 10:350–360.
BULLOCK, B.P., AND H.E. BURKHART. 2005. Juvenile diameterdistributions of loblolly pine characterized by the two-param-eter Weibull function. New For. 29:233–244.
CAO, Q.V. 2004. Predicting parameters of a Weibull function formodeling diameter distribution. For. Sci. 50:682–685.
CARRASCO, P., J. MILLAN, AND L. PENA. 1993. Suelos de la cuenca
del río Biobio: Características y problemas de uso, Faranda, F.,and O. Parra (eds.). Universidad de Concepcion, Concepcion,Chile. 108 p.
CHAMBERS, E.A., AND D.R. COX. 1967. Discriminating betweenalternative binary response models. Biometrika 54: 573–578.
CHEN, W.W. 1980. On the separate families of hypotheses withsmall sample size. J. Stat. Comput. Sim. 2:183–187.
CLUTTER, J.L., AND F.A. BENNETT. 1965. Diameter distributions inold-field slash-pine plantations. Georgia Forest ResearchCouncil Republic Report 13. 9 p.
COX, D.R. 1961. Test of separate families of hypotheses. P.105–123 in Proc. of the Fourth Berkeley symposium in math-ematical statistics and probability. University of CaliforniaPress, Berkeley, CA.
COX, D.R. 1962. Further results on test of separate families ofhypotheses. J. R. Stat. Soc. 24:406–424.
DIRECCION GENERAL DE AERONAUTICA CIVIL. 2010. Direccionmeteorologica de Chile. Available online at www.meteochile.cl/climas/climas.html; last accessed Mar. 15, 2012.
DUMONCEAUX, R., AND C.E. ANTLE. 1973. Discriminating be-tween the log-normal and Weibull distribution. Technometrics15:923–926.
DYER, A.R. 1973. Discrimination procedure for separate familiesof hypotheses. J. Am. Stat. Assoc. 68:970–974.
FEARN, D.H., AND E. NEBENZAHL. 1991. On the maximum likeli-hood ratio method of deciding between the Weibull and gammadistribution. Commun. Stat. Theory Methods 20:579–593.
FRAZIER, J.R. 1981. Compatible whole-stand and diameter distri-bution models for loblolly pine plantation. Ph.D. dissertation,Virginia Polytech. Inst. and State Univ., Blackburg, VA. 125 p.
GOVE, J.H., AND G.P. PATIL. 1998. Modeling the basal area-sizedistribution of forest stands: A compatible approach. For. Sci.44:285–297.
GUPTA, R.D., AND D. KUNDU. 2003a. Closeness of gamma andgeneralized exponential distributions. Commun. Stat. TheoryMethods 32:705–721.
GUPTA, R.D., AND D. KUNDU. 2003b. Discriminating betweenWeibull and generalized exponential distributions. Comput.Stat. Data Anal. 43:179–196.
GUPTA, R.D., AND D. KUNDU. 2004. Discriminating betweengamma and generalized exponential distributions. J. Stat. Com-put. Sim. 74:107–121.
HAFLEY, W.L., AND H.T. SCHREUDER. 1977. Statistical distribu-tions for fitting diameter and height data in even-aged stands.Can. J. For. Res. 7:481–487.
HARMAND, J.M., C.F. NJITI, F. BERNHARD-REVERSAT, AND H.PUIG. 2004. Aboveground and belowground biomass, produc-tivity and nutrient accumulation in tree improved fallows in thedry tropics of Cameron. For. Ecol. Manage. 188:249–265.
JACKSON, O.A.Y. 1969. Fitting a gamma or lognormal distribu-tion to fibre-diameter measurements on wool tops. Appl. Stat.18:70–75.
JIANG, L., AND J. BROOKS. 2009. Predicting diameter distributionsfor young longleaf pine plantations in Southwest Georgia.South. J. Appl. For. 33:25–28.
JOHNSON, N.L. 1949. Systems of frequency curves generated bymethods of translation. Biometrika 36:149–176.
KAMZIAH, A.K., M.I. AHMAD, AND J. LAPONGAN. 1999. Nonlinearregression approach to estimating Johnson SB parameters fordiameter data. Can. J. For. Res. 29:310–314.
LEI, Y. 2008. Evaluation of three methods for estimating theWeibull distribution parameters of Chinese pine (Pinus tabu-laeformis). J. For. Sci. 54:566–571.
LENHART, J.D., AND J.L. CLUTTER. 1971. Cubic-foot yield tablesfor old-field loblolly pine plantations in Georgia Piedmont.
Forest Science 58(6) 2012 671
Georgia Forest Research Council Republic Report 22, Series 2.12 p.
LI, F., L. ZHANG, AND C.J. DAVIS. 2002. Modeling the jointdistribution of tree diameters and heights by bivariate general-ized beta distribution. For. Sci. 48:47–58.
LINDSAY, S.R., G.R. WOOD, AND R.C. WOOLLONS. 1996. Standtable modelling through the Weibull distribution and usage ofskewness information. For. Ecol Manage. 81:19–23.
LITTLE, S.N. 1983. Weibull diameter distribution for mixed standsof western conifers. Can. J. For. Res. 13:85–88.
MABVURIRA, D., M. MALTAMO, AND A. KANGAS. 2002. Predictingand calibrating diameter distributions of Eucalyptus grandis(Hill) Maiden plantations in Zimbabwe. New For. 23:207–223.
MEHTATALO, L. 2004. An algorithm for ensuring compatibilitybetween estimated percentiles of diameter distribution andmeasured stand variables. For. Sci. 50:20–32.
NEWBERRY, J., AND T. BURK. 1985. SB distribution-based modelsfor individual tree merchantable volume-total volume ratios.For. Sci. 31:389–398.
NELSON, T.C. 1964. Diameter distribution and growth of loblollypine. For. Sci. 10:105–115.
PARRESOL, B. 2003. Recovering of Johnson’s SB distribution. Res.Pap. SRS-31. USDA Forest Service, Southern Research Sta-tion, Asheville, NC. 9 p.
PINKARD, E.A., AND B. NEILSEN. 2003. Crown and stand charac-teristics of Eucalyptus nitens in response to initial spacing:Implications for thinning. For. Ecol. Manage. 172:215–227.
RENNOLLS, K., D.N. GEARY, AND T.J.D. ROLLINSON. 1985. Char-acterizing diameter distributions by the use of the Weibulldistribution. Forestry. 58:57–66.
REYNOLDS, M.R. 1984. Estimating error in model predictions. For.Sci. 30:454–469.
REYNOLDS, M.R., T.E. BURK, AND W.-C. HUANG. 1988. Good-
ness-of-fit test and model selection procedures for diameterdistribution models. For. Sci. 34:373–399.
SAS INSTITUTE, INC. 2002. Help and documentation, version 9.0.SAS Institute, Inc., Cary, NC.
SCHREUDER, H.T., W.L. HAFLEY, AND F.A. BENNETT. 1979. Yieldprediction for unthinned natural slash pine stands. For. Sci.25:25–30.
SCHREUDER, H.T., AND W.T. SWANK. 1974. Coniferous standscharacterized with the Weibull distribution. Can. J. For. Res.4:518–523.
WHITE, J., AND J.L. HARPER. 1970. Correlated changes in plantsize and number in plant populations. J. Ecol. 58:467–485.
WIENS, B. 1999. When log-normal and gamma models give dif-ferent results: A case study. Am. Stat. 53:89–93.
WILKINSON, J.M., E.J. EVANS, P.E. BILSBORROW, C. WRIGHT,W.O. HEWISON, AND D.J. PILBEAM. 2007. Yield of willow culti-vars at different planting densities in a commercial short rotationcoppice in the north of England. Biomass Bioenergy 31:469–474.
ZARNOCH, S.J., AND T.R. DELL. 1985. An evaluation of percentileand maximum likelihood estimators of Weibull parameters.For. Sci. 31:260–268.
ZHANG, L., K. PACKARD, AND C. LIU. 2003. A comparison ofestimation methods for fitting Weibull and Johnson’s SB dis-tributions to mixed spruce-fir stands in northeastern NorthAmerica. Can. J. For. Res. 33:1340–1347.
ZHOU, B., AND J.P. MCTAGUE. 1996. Comparison and evaluationof five methods of estimation of the Johnson system parame-ters. Can. J. For. Res. 26:928–935.
ZOHRER, F. 1972. The beta-distribution for best fit of stem-diam-eter-distribution. P. 91–106 in the 3rd Conference AdvisoryGroup Forest Statistics. Proc., Publ. 72-3. IUFRO, InstitutNational Recherche Agronomique, Paris, France.
672 Forest Science 58(6) 2012