Qualidade da madeira de Eucalyptus benthamii para ... - IPEF
Upload
khangminh22Category
view
1download
0
i
2019 Research Summaries
North Carolina State University | Department of Forestry and Environmental Resources
Virginia Tech | Department of Forest Resources and Environmental Conservation
Universidad de Concepción | Departamento de Silvicultura Facultad de Ciencias Forestales
Universidade Federal de Lavras | Departamento de Ciencias Florestais
Volume 2 Eucalyptus

i

ii
2019 Research Summaries
Dear FPC Members,
The Forest Productivity Cooperative (FPC) is an international research and technology transfer program
working with the major pine and eucalypt plantation species in the southeastern United States and Latin
America. The FPC is a partnership between forest industry and university scientists who are working
together to develop innovative solutions that enhance the productivity and value of planted forests
through sustainable management of site resources. The FPC is jointly administered by faculty at North
Carolina State University, Virginia Polytechnic Institute and State University, the University of Concepción in
Chile, and the Federal University of Lavras in Brazil.
The mission of the FPC is to create innovative solutions to enhance forest productivity and value through
sustainable management of site resources. Our goal is to develop site-specific silvicultural regimes that
increase the productivity, profitability, and sustainability of plantation management. The success of the
FPC is based on our mixture of basic and applied research that creates new knowledge and then
develops practical applications that helps members optimize forest management practices.
The FPC has established a large network of field research trials that includes active experiments in the US
and Latin America. This is one of the largest networks of forestry research installations in the world. We are
also able to leverage the investment made in these studies with outside grants from a variety of
agencies. We also partner with organizations such as FONDEF, USDA Forest Service, and other research
cooperatives through programs such as EUCAHYDRO, CAFS and PINEMAP.
The 2018 FPC Research Summaries provide a summary of the results of the ongoing work in both pine and
eucalyptus conducted by the FPC. We also list the research papers published by the FPC in the last five
years. Summaries and reports on all FPC research and copies of all of our published papers are available
on the FPC website: www.forestproductivitycoop.net.
Thanks to all of our members for their continued support of the FPC.
The Forest Productivity Cooperative Team
Rachel L . Cook, NCSU David Carter, VT
Rafael A. Rubilar, UdeC Otávio Campoe, UFSC

iii
Members
Full Members
American Forest Management
BTG Pactual
Campbell Global
Campo Forestal S.A.
Deforsa
Forest Investment Associates
Forestal Mininco & Bosques del Plata
Greenwood Resources
Hancock Forest Management
Jordan Lumber
Klabin
Masisa Chile & Argentina
Milliken Forestry
Molpus Woodlands Management
Rayonier
Resource Management Service
Smurfit Kappa Colombia
Smurfit Kappa Venezuela
Superior Pine Products
Timberland Investment Resources
Volterra S.A.
Westervelt Company
Weyerhaeuser
Corresponding Members
ArborGen
BASF
Bayer
Chem-Air
CHS, Inc
FITSNR, LLC
Forestry & Land Resource Consultants
FuturaGene
International Forest Company
Lesco Aviation
Nutrien Ag Solutions
Red River Specialties
Sustaining Members
North Carolina Forest Service
OMYA
USDA Forest Service
Virginia Department of Forestry

iv
Forest Productivity Cooperative
2019 Research Summaries

1
Table of Contents
Regionwide Trials—Eucalyptus 6
*LA Regionwide 2: Site Optimum Stocking and Plantation Design to Optimize Value and
Productivity of Eucalyptus grandis Genotypes in Argentina
7
Regionwide 7: Long Term Effects of Soil Preparation, Weed Control and Fertilization on Euca-
lyptus Growth - MASISA Argentina
9
*Regionwide 7: Growth Response of Eucalyptus benthamii to Early Cultural Treatments in the
Southeastern United States
11
Regionwide 7: Long-Term Effects of Soil Preparation, Weed Control, and Fertilization on Carib-
bean Pine and Acacia mangium Growth in Venezuela.
13
Regionwide 13: Effects of Nitrogen and Phosphorus Fertilization Post-Establishment on Growth
of Eucalyptus nitens in South-Central Chile
15
Regionwide 18: Rate and Optimal Frequency of Fertilization at Midrotation Eucalyptus grandis
Stands in Colombia
17
Regionwide 18: Eucalyptus grandis Fertilizer Response Depends on Site and Rate 19
Regionwide 20: Site Optimum Stocking and Plantation Design to Optimize value and produc-
tivity of Eucalyptus grandis genotypes in Argentina
21
Regionwide 21: Eucalyptus Twin-Plot Network: the Deforsa Venezuela Trial 23
Regionwide 22: Evaluation of Potential Productivity of Eucalyptus grandis in Colombian Andes
using a Twin Plot Approach.
25
Regionwide 23: Duration and Intensity of Weed Control of
Eucalyptus grandis in the Colombian Andes
27
Regionwide 24: Cold Tolerant Eucalytpus Species Screening Study in Raleigh, NC 29
Regionwide 25: Effects of Macro and Micro Nutrient Omissions on a Eucalyptus Plantation in a
Dry Area of Brazil
31
Regionwide 25: Nutrient Omission Study on Young Eucalyptus nitens Plantations in South-
Central Chile
33
Regionwide 25: Nutrient Omission at Establishment in Eucalyptus urophylla in Colombia 35
Regionwide 25: Nutrient Omission at the Establishment and Early Development of Eucalyptus
grandis in Colombia
37
* indicates new or updated 2019 report

2
Regionwide 25: Eucalyptus Nutrient Omission Study in
Southeast United States
39
Regionwide 25: Eucalyptus Nutrient Omission Study in Northern Brazil 41
Regionwide 25: Omission of Nutritional Elements Effects on the Growth of Young Plantations of
Eucalyptus nitens in the South-central Chile
43
Regionwide 26: Doses and Efficiency of Phosphorus Fertilizer Trials in Eucalyptus urophylla and
Eucalyptus pellita in Colombia
45
*Regionwide 26: Dose and Efficiency of Phosphorus Fertilizers in Eucalyptus urograndis in Co-
lombia
47
Regionwide 27: Deep Positioning of Fertilizers on Fast Growing Plantations Under Intensive Ma-
nagement
49
Special Projects—Eucalyptus 52
Economic Assessment of Eucalyptus globulus Short Rotation Energy Crops Under Contrasting
Silvicultural Intensities on Marginal Agricultural Land
53
Nitrogen Dynamics in Forest Plantations: Comparing Newly Established and Coppiced Eucalyp-
tus in Brazil
55
Gas-Exchange Parameters Responses of Eucalyptus globulus Plants Under Drought Conditions
as Predictors of Initial Growth in the Field
57
The Effect of Contrasting Water Availability Conditions on Water Use Efficiency During Early De-
velopment of Eucalyptus globulus, E. nitens genotypes and E. camaldulensis Hybrids in
Central Chile
59
Biomass and Nutrient Content of Acacia dealbata and Eucalyptus globulus Bioenergy Planta-
tions
61
Eucalyptus Plantation Effects on Soil Carbon After 20 Years and Three Rotations in Brazil 63
Eucahydro: Quantifying Differences in Thermal Dissipation Probe Calibrations for Eucalyptus
globulus species and E.nitens x globulus hybrid
65
Eucahydro: Water Use and Water Use Efficiency of Eucalyptus Genotypes under High and Low
Water Resource Availability in Chile
67
Eucahydro: Early Growth and Leaf-Level Physiology of Eucalyptus Plantations in Chile 69
*Evaluation of Early Growth in Productive Genotypes of E. globulus and E. nitens x globulus in
Two Contrasting Conditions of Soil Water Availability
71
* indicates new or updated 2019 report
3
Fondecyt Project 1140482: Water and Nutrient Use Efficiency in Dendroenergy Plantation 73
The Radiation-Temperature Effect on Cold Tolerant Eucalyptus Species 75
Individual Stem Volume, Green Weight and Biomass Equations of Cold Tolerant Eucalypts 77
Growth and Yield Models for Eucalyptus benthamii in the SEUS 79
Eucalyptus Special Project - Cold Tolerant Eucalyptus Plus Tree Selection and Archival 81
Special Study: Nelder Spacing Trial to Evaluate Acacia mangium Development in the Nort-
heast Llanos of Venezuela
83
Special study: Nelder Spacing Trial to Evaluate the Effect of Spacing on Growth of Eucalyptus
brassiana in Venezuela
85
NPK Fertilizers Dosage Trial in Eucalyptus urophylla in Venezuela 87
Hybrid Growth and Yield Models for Eucalyptus Clones Subject to Different Environmental Con-
ditions in Brazil
89
Potential Productivity of Eucalyptus maidenii and E. globulus in Uruguay 91
Genotypic Variation and Genotype by Environment (GxE) Interactions of 52 Populus Geno-
types on two Sites in the Southeast US
93
Effects of Eucalyptus camaldulensis, E. globulus, E. nitens and Acacia melanoxylon Short-
Rotation Forest Crops (SRFC) for Energy Production in Contrasting Soils of the Bío-Bío Re-
gion, Chile
95
Effects of Intensive Silviculture on the Productivity of Eucalyptus in Venezuelan Llanos and a
Probabilistic Analysis of its Profitability
97
Using Forest Inventory as a Tool for Monitoring Silvicultural Quality in Eucalyptus Clonal Planta-
tions
99
Growth, Water Use and Water Use Efficiency of Eucalyptus Clones under Different Spacings:
From the Tree to the Watershed Scales
101
Development of Hybrid Models to Express the Growth and Yield of Eucalyptus Clones in Differ-
ent Environments in Brazil
103
Effects of Intensive Silviculture in the Restoration Process of Northeastern Atlantic Rainforest in
Brazil
105
Fertilizer Response to Eucalyptus Plantations and its Correlation with the Soil, Climate and Silvi-
culture Characteristics in Different Regions of São Paulo State
107
* indicates new or updated 2019 report
4
Zoning the Productivity of Eucalyptus Forest Plantation in the Northeastern of São Paulo State
in Brazil
109
Crown Architecture, Leaf Angle Distribution, Light Extinction Coefficient and Light Interception
in Eucalyptus Clones
11
Patterns of Seasonal Stem Growth of 18 Different Eucalyptus Clones 113
Leaf Anatomical Characterization of 16 Highly Productive Eucalyptus Genotypes from Brazil 115
Physiology of Tropical Eucalyptus Clones Under Water Stress 117
Changes in Leaf Anatomy of Tropical Eucalyptus Clones Under Water Stress Conditions 119
Biomass Evaluation of the Eucalyptus spp. Plantations Established in Bocaiúva, State of Minas
Gerais, Brazil
121
Effect of Soil Water Availability on PAR Capture by Eucalyptus globulus, Eucalyptus nitens and
Eucalyptus camaldulesis Hybrids
123
Effect of Water Availability and Temperature on Leaf Deployment in Genotypes of Eucalyptus
globulus, Eucalyptus nitens and Eucalyptus camaldulensis Hybrids
125
The Effect of Contrasting Water Availability Conditions on Water Use Efficiency During Early De-
velopment of Eucalyptus globulus, Eucalyptus nitens Genotypes and Eucalyptus camal-
dulensis Hybrids in Central Chile
127
Drought Effects in Gas Exchange Parameters on Eucalyptus spp. 129
Carbon Fluxes on Eucalyptus Plantations: Genetic and Climatic Effects 131
Populus Special Study—Identifying Cottonwood and Hybrid Poplar Clones with the Highest
Productivity on Two sites in the SEUS
133
Leaf Area, Light Interception, and Light-use Efficiency of Nine Poplar Genotypes 135
Biomass and Light Use Efficiency Comparison of Hybrid Poplar Genotypes 137
Tolerance of Eucalyptus Clones to Hydric, Thermal and Biotic Stresses - TECHS 139
TECHS Climate—Eucalyptus Tolerance to the Hydric and Thermal Stresses 141
Publications 2015-2019 144
* indicates new or updated 2019 report

5
6
Regionwide Trials — Eucalyptus

7
*LA Regionwide 2: Site Optimum Stocking and Plantation Design to
Optimize Value and Productivity of Eucalyptus grandis Genotypes in
Argentina
Introduction
Deciding the initial planting density and spacing
is one of the most important considerations in
the establishment of forest stands. This decision
effects the stand’s productivity and influences
the wood quality and profitability. From the
economic perspective, this decision will have
associated operating costs, such as the number
of plants to establish, the amount and method
of soil preparation, initial fertilization, and the
intensity and frequency of weed control. The
establishment of selected genotypes increases
the probability of specific interactions with
silvicultural management. This is an important
consideration, especially in relation to local
resource availability and climate change
impacts.
Study Objectives
The objective was to examine tree and stand
growth under contrasting site resource
availability and to assess the growth and wood
quality responses of specific tree genotypes
under different planting densities.
Treatments and Experimental Design
The study was established in October 2015 in
Entre Rios Province, Argentina (Figure 1), stand
“El Duraznal”. Soils have characteristics of Oxic
Udifluvents, Fluventic and Haplumbreptes. There
are sandy terraces with high rolling hills of
reduced fertility and low soil water retention
capacity.
The climate is subtropical. The average summer
temperature of the city is between 22 and 26°C,
while the winter is 12 to 15°C. The average
humidity is 73% with an average rainfall of 1300
mm recorded annually.
A second study was established in August 2016,
in Corrientes, Argentina, stand “La Yunta”.
On both sites, the experimental design is a split-
plot, 4 block design with two factors: spacing
and genotypes. The spacing treatment is
different within-row tree spacing (1.5; 2.25; 3; 4;
6; and 9 m) with 4 m spacing between rows,
providing densities of 1667, 1111, 833, 625, 417
and 277 trees ha-1 .
At the site El Duraznal, the genotypes were EG36
(Eucalyptus grandis) and GC27 (Eucalyptus
grandisxcamaldulensis hybrid). While at the site
La Yunta, the genotypes were EG36 and EG385
(Eucalyptus grandis).
Results
At El Duraznal site, three years after
establishment, we found a significant interaction
between genotype and density on diameter at
breast height (DBH; Figure 2) and total height
(Figure 3). The clone EG36 had a greater DBH
than Hybrid EGC27 at all densities. The largest
response in DBH was in clone EG36 in the 277
trees ha-1 (13.6 cm). GC27 planted at 1666 trees
ha-1 had the lowest DBH (Figure 2). The hybrid
GC27 had a greater mean total height than
EG36 among all planting densities. GC27 in the
625 trees ha-1 planting density had the greatest
total height among all density and genotype
Figure 1. Location of El Duraznal trial in Argentina.

8
combinations (12.5 m). Meanwhile, EG36 in the
227 trees ha-1 planting density had the lowest
total height among all density and genotype
combinations (10.7 m, Figure 3).
At La Yunta site, two years after establishment,
we found a significant interaction between
genotype and density on DBH (Figure 4) and
total height (Figure 5). The clone EG385 had a
greater DBH than clone EG36 at all densities. The
largest response in DBH was in clon eEG385 in
the 277 and 416 trees ha-1 (8.8 cm). While clone
EG36 planted at 833 and 1111 trees ha-1 had the
lowest DBH (8.1 cm, Figure 4). The clone EG385
had a greater mean total height than EG36
among all planting densities. EG385 in the 625
trees ha-1 planting density had the greatest total
height among all density and genotype
combinations (8 m). Meanwhile, EG36 in the 833
trees ha-1 planting density had the lowest total
height among all density and genotype
combinations (6.1 m, Figure 5).
Conclusions and Future Direction
The greater DBH responses were observed at
lower planting density (277 árb ha-1). We will
continue to measure DBH, height, and mortality
annually. Soil and foliar chemical properties will
be sampled for nutritional analyses. Future
m e asu re me nt s w i l l in c l ude c ro w n
characterization and leaf area.
Figure 2. DBH at the El Duraznal site, three years after
establishment. Error bars represent standard error.
Figure 3. Total height at the El Duraznal site, three years
after establishment. Error bars represent standard error.
Figure 4. DBH at the La Yunta site, two years after
establishment. Error bars represent standard error.
Figure 5. Total height at the La Yunta site, two years
after establishment. Error bars represent standard error.

9
Regionwide 7: Long Term Effects of Soil Preparation, Weed Control and
Fertilization on Eucalyptus Growth - MASISA Argentina
Trial Series Objectives To quantify the long term effects of soil
cultivation, weed control and fertilization on
eucalyptus growth on representative soils of the
company.
Treatments and Experimental Design The study was stablished in the Entre Rios
province Argentina (Figure 1), stand “El Talar”.
Trials were established in 2013 using a split-plot
design experiment with 3 blocks. Cultivation
was set up as the main plots (none, mounding,
subsoil+mounding). Figure 1 shown some views
of the site preparation. Additionally, a factorial
combination of weed control (none vs two year
banded) and fertilization at planting (none vs
fertilized) was imposed as the split-plot.
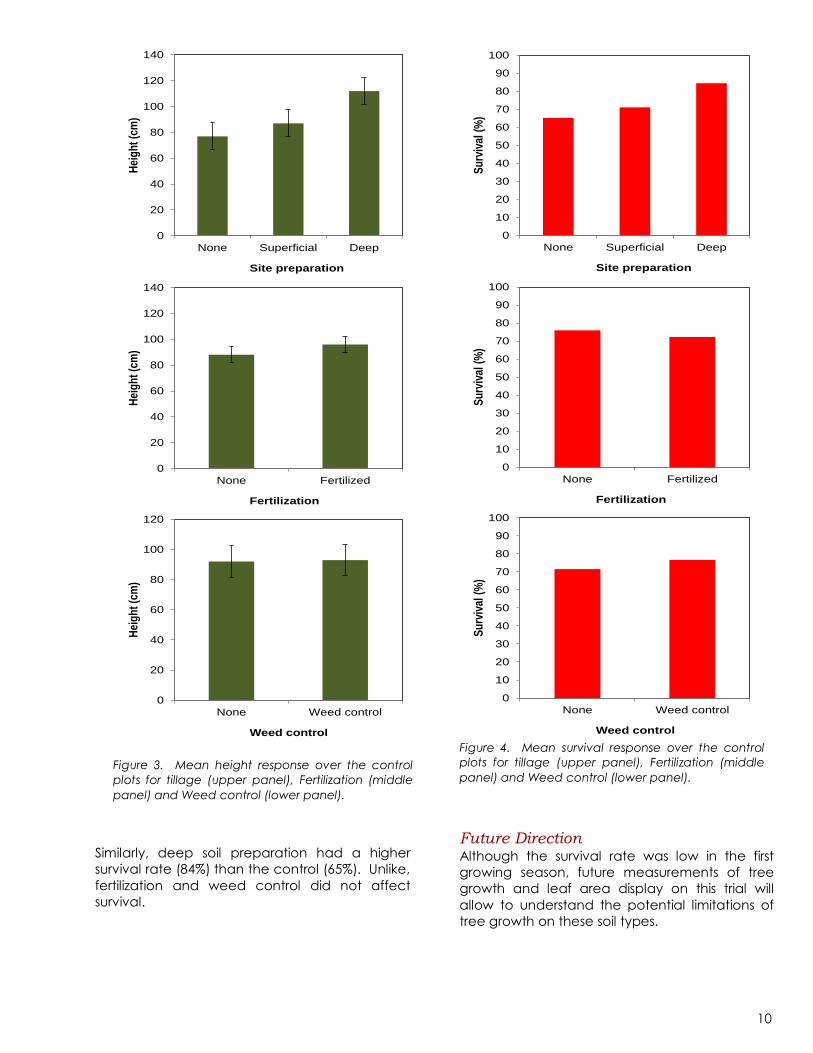
Preliminary Results During the first growing season, the site
experienced a severe drought at the beginning
of summer, and many of the trees were
replanted. Overall, the trial had a survival rate of
74%, approximately. Preliminary results on tree
height showed differences among the
treatments on tree height, but there was no
effect of the interactions among the treatment
factors. The best treatment (deep soil
preparation, fertilization and weed control) had
68% higher tree growth than the control, with a
mean height of 119 and 71 cm, respectively.
Fertilization had a significantly positive effect on
height (9% over the control) during the first
growing season (p=0.0103) (Figure 3). The tillage
effect was not significant (p=0.15), although
there was a trend of increasing tree height as
long as the soil preparation intensity increased
(subsoiling had 45% higher tree height than the
control).
Figure 1. Map showing the geographic location of
Forestal Masisa S.A. in Argentina.
1.2 m
0.57 m
1.3 m
0.15 m
Figure 2. Details of the site preparation. Subsoiling +
mounding (upper panel) and only mounding (lower panel).
10
Similarly, deep soil preparation had a higher
survival rate (84%) than the control (65%). Unlike,
fertilization and weed control did not affect
survival.
Future Direction Although the survival rate was low in the first
growing season, future measurements of tree
growth and leaf area display on this trial will
allow to understand the potential limitations of
tree growth on these soil types.
Figure 3. Mean height response over the control
plots for tillage (upper panel), Fertilization (middle
panel) and Weed control (lower panel).
0
20
40
60
80
100
120
140
None Superficial Deep
Hei
gh
t (c
m)
Site preparation
0
20
40
60
80
100
120
140
None Fertilized
Hei
gh
t (c
m)
Fertilization
0
20
40
60
80
100
120
None Weed control
Hei
gh
t (c
m)
Weed control
0
10
20
30
40
50
60
70
80
90
100
None Superficial Deep
Su
rviv
al (
%)
Site preparation
0
10
20
30
40
50
60
70
80
90
100
None FertilizedS
urv
ival
(%
)
Fertilization
0
10
20
30
40
50
60
70
80
90
100
None Weed control
Su
rviv
al (
%)
Weed control
Figure 4. Mean survival response over the control
plots for tillage (upper panel), Fertilization (middle
panel) and Weed control (lower panel).

11
*Regionwide 7: Growth Response of Eucalyptus benthamii to Early
Cultural Treatments in the Southeastern United States
Background
The search for cold-tolerant Eucalyptus species
adapted to the climate found in the
southeastern Untied States has been ongoing
for decades. Extreme low temperatures
associated with arctic cold fronts that
periodically reach the southeastern US limit the
ability of most Eucalyptus species to survive in
this region. However, work by the FPC and other
organizations has demonstrated that several
Eucalyptus species have sufficient cold
tolerance to be viable plantation species in
portions of the southeastern US. The FPC RW24
study screened 330 entries (species,
provenances, families) for cold tolerance that
included 150 species of Eucalyptus and
Corymbia. Based on these results, selected
genotypes of Eucalyptus benthamii appear to
be adapted to survive and grow well in USDA
Plant Hardiness Zones 8b and 9a that extends
from coastal South Carolina to Texas.
Study Objectives
1. To quantify the effects of intensive
management including site preparation,
weed control, and fertilization on early
growth of Eucalyptus
2. To provide stand-level data on growth and
yield of Eucalyptus on a range of soil types
3. To evaluate how intensive management
affects cold tolerance of Eucalyptus.
Treatments and Experimental Design
The study was designed as a random complete
block with four replicates of two treatments. The
first treatment represents current operational
silvicultural practices for Eucalyptus considering
cost, timing, and logistical constraints. The
second treatment represents optimal or
intensive silvicultural treatments that are
designed to ameliorate all growth limiting
factors at the appropriate time. Individual
treatment plots have 144 trees planted at a 12 x
6 ft. spacing (3.7 m x 1.8 m) which corresponds
to 605 trees/acre (1494 trees/ha). This created
treatment plots that are 0.24 acre (0.1 ha) in
size. Internal measurement plots include 96 trees
in the interior 6 rows by 16 planting spaces.
Measurement plots are approximately 0.16 ac
(0.06 ha). The measurement plots are large
enough to model diameter distributions and
develop useful per acre estimates of stand
growth and development that can be used to
parameterize growth and yield models. The
buffer between treatment plots is 66 ft. (20 m).
The plots and buffers were hand planted with a
containerized open-pollinated seed orchard
mix of E. benthamii.
71301 Merryville, Louisiana
The first study was installed in December 2015
near Merryville, LA. The site is a 4.5 ac (1.8 ha)
clearcut that was previously managed for slash
pine for sawtimber. The soil is an Ultisol, classified
as poorly-drained Beauregard silt loam. The site
was double bedded prior to planting.
Treatments differed by fertilization (Table 1) and
weed control regimes.
71302 Quincy, Florida
The second study was installed in April 2017 near
Quincy, FL. The site was a previously
unmanaged hardwood forest. The soil is an
Ultisol, classified as a well-drained fine loamy
sand. Before planting the operational plots were
ripped, and the intensive plots were disked and
ripped. Treatments also differed by fertilization
(Table 1) and weed control regimes.
Results
At 71301 LA, the intensive treatment was
significantly more productive than the
operational treatment in both DBH and height
(Table 1). The stand surrounding the treatment
plots was not managed and grew much slower
than the treatment trees. High winds in 2019
resulted in windthrow that disproportionally
affected the intensive treatment plots.

12
At 71302 FL, there were no differences between
treatments for DBH or height (Table 1). In
summer 2018, high rainfall and humidity resulted
in a fungal disease that affected the site at
100% incidence. Both treatments suffered
extensive defoliation (Figure 1). The trees did not
fully recover foliage by the end of 2018 growing
season. In October 2018, Hurricane Michael hit
the site resulting in extensive wind damage to all
plots.
The survival at both sites was >80% for all
treatments. The trees showed good cold-
tolerance, however, they did not thrive in it.
Many trees at 71301 LA had frost damage on
the apical meristem which resulted in poor stem
form. The trees at 71302 FL suffered little frost
damage.
Conclusions
Due to the damage from natural events, these
studies will no longer be evaluated and are
considered complete. These trials have
supported several key findings reported in
Kellison et al. 2013 regarding Eucalyptus
production in the southeastern US, namely the
importance of site selection. The well-drained
site was much better suited for Eucalyptus than
the poorly-drained site. The two year old trees in
FL were more productive than the 3 year old
operational treatment in LA.
This study illuminated the challenges surrounding
the potential productivity of cold-tolerant
Eucalyptus in the southeastern US.
Acknowledgements
Thanks to Ed O’Brien at Forestry & Land
Resource Consultants and Drs. Anna Osiecka
and Pat Minogue at the University of Florida
North Florida Research and Education Center
for their support of the project.
References
Kellison et al. 2013. Introduction of Eucalyptus
into the US with Special Emphasis on the
Southern US. Int. J. For. Res.
Table 1. Treatment means at year 3 (LA) and year 2 (FL) for DBH, height, and survival with statistical differences
shown by letters (P<0.05). Total amount of elemental nitrogen and phosphorous applied at each location since es-
tablishment.
Studies DBH Height Survival % Elemental N Elemental P
71301 Merryville, LA
Operational 1.8 in
(4.5 cm)
14.8 ft
(4.5 m)
85 a
123 lbs/ac
(138 kg/ha)
79 lbs/ac
(88 kg/ha) b b
Intensive 3.2 in
(8.2 cm)
24.9 ft
(7.6 m) 85 a
463 lbs/ac
(518 kg/ha)
168 lbs/ac
(188 kg/ha) a a
71302 Quincy, FL
Operational 2.6 in
(6.5 cm)
24.0 ft
(7.3 m) 85 a
10 lbs/ac
(11 kg/ha)
35 lbs/ac
(39 kg/ha) a a
Intensive 2.5 in
(6.3 cm)
21.3 ft
(6.5 m) 81 a
52 lbs/ac
(58 kg/ha)
55 lbs/ac
(62 kg/ha) a a
Figure 1. Fungal disease 2018 summer at 71302 in
Quincy, FL. Left: close up of fungal damage on leaves.
Right: example of defoliation on whole tree.

13
Regionwide 7: Long-Term Effects of Soil Preparation, Weed Control, and Fertilization on Caribbean Pine and Acacia mangium Growth in Venezuela
Introduction Despite the large plantation area of Pinus
caribaea var. hondurensis in the Orinoco river
basin in Venezuela (~500,000 ha), little
information exists on the response of these
plantations to intensive silviculture. Plantations in
the area have been established over the last 50
years with little silvicultural inputs and managed
extensively on these highly weathered soils.
Despite adequate well distributed rainfall in most
areas, plantation productivity ranges from 2 to 5
m3 ha-1 yr-1. Adding resources or improving
resource acquisition may improve productivity of
plantations in the area.
Trial Series Objectives 1-To quantify the long term effects of soil
cultivation, weed control and fertilization on
Pinus caribaea and Acacia mangium growth for
a range of soil-site conditions in Venezuela.
2-To provide parametrization data for growth
and yield models for the range of soils and site
conditions where the species is grown in
Venezuela.
3-To characterize and quantify patterns of leaf
area production and longevity for each soil-site
condition.
Treatments and Experimental Design Trials were established in 2013 in Chaguaramas
North in Venezuela (Table 1). The experiment
was a split-plot design with cultivation as the
main plots and a factorial combination of weed
control and fertilization as subplots replicated 4
times. Treatments were cultivation (none vs.
subsoil), weed control (none vs. two year
banded) and fertilizer at planting (2 kg B ha-1 vs.
34 kg N ha-1 +86 kg P ha-1 +2 kg B ha-1 ). Spacing
for all plots was 4 X 2 m . Each plot contained 45
trees.
A ninth treatment of subsoil, weed control and
repeated fertilization was added in all blocks.
The repeated fertilization will be 160 N, 21 P, 23 S,
54 K, 2 Ca, 12 Mg, and 12 B kg ha--1 every 3 years.
Results Total height was measured 19 and 20 months
after establishment on Acacia mangium and
Pinus caribbean, respectively. None of the sites
responded to tillage (Table 2). We found a
significant main effect for both fertilization and
weed control in A. mangium. Fertilization
decreased tree height, whereas weed control
increased growth for A. mangium(Figure 2) .
Figure 1. Location of RW7 trials in Venezuela on MASISA
land.
Table 1. Characteristics of the sites.
Pinus caribaea A.mangium Pinus caribaea
Site 537 Site 498 Site 845
Blocks 3 4 3
Age at the time of
establishment
(days)
191 127 194
Previous use Forest Forest Forest
Weed control Glyphosate Glyphosate Glyphosate
Texture sand sand loam
Drainage Permeable Permeable Permeable
Rainfall (mm) 2038 2040 2038
Temperature (°C) 27 29 29
Slope(%) 3 3 3
Soil taxonomy Ultisol Ultisol Ultisol
Specie

14
This pattern has been observed at other sites
with a high infestation of weeds. In this case,
weeds compete better for the nutrients applied
than the crop tree. Consequently, the responses
to weed control are highs.
One site (845) with P. caribbean had a
significant positive response to weed control, as
can be seen in Figure 3.
Future Direction Identifying the appropriate response types (A, B,
C) will allow for more accurate projection of
early gains due to silvicultural treatments.
Analyses will be completed to identify
silvicultural treatments that are redundant (e.g.
both weed control and fertilization may increase
nutrient availability to crop plants) or
unnecessary (e.g. soil cultivation in soils without
root growth restrictions) to improve profitability of
the overall system.
Figure 3. Mean height by fertilization (FERT0: non-
fertilized, FERT11:fertilized) and weed control treatment
(WC0: non-weed control, WC1: weed control) on P.
caribbean, site 845.
Table 2. Analysis of variance for height for each site 20
months after establishment.
Figure 2. Mean height by fertilization (FERT0: non-fertilized,
FERT1:fertilized) and weed control treatment (WC0: non-
weed control, WC1: weed control) for A. mangium, at site
498.
Figure 4. View of site 845 on P. caribbean, fertilized (top)
non fertilized (above).

15
Regionwide 13: Effects of Nitrogen and Phosphorus Fertilization Post-
Establishment on Growth of Eucalyptus nitens in South-Central Chile
Study Objectives To determine the effect mid-rotation nitrogen
(N) and phosphorus (P) fertilization of
Eucalyptus nitens.
To evaluate leaf area, growth efficiency and
foliar nutrient level responses to N+P
fertilization.
To determine the operational dose to
optimize tree growth response at each site.
Methods Study Area Three sites were established in the Eucalyptus
nitens region wide 13 (RW13) trials located in the
VIII region of Chile. Typical temperatures for the
region averaged between 13 and 17 degrees
Celsius, average rainfall was between 1000-1400
mm per year and soils were derived from three
geological formations, recent volcanic ash,
ancient volcanic ash (red clay) and sediment
marines (Table 1).
Treatments and Experimental Design The experimental design is characterized as
randomized complete blocks with three
replicates. Treatments considered the effect of a
factorial combination of N and P fertilization on
E. nitens early growth considering nine
treatments where a base application of 50 Kg
ha-1 of Potassium (K), 30 Kgha-1 of Magnesium
(Mg), 3 Kgha-1 of Zinc (Zn), 2 Kgha-1 of Copper
(Cu), 4 Kgha-1 of Boron (B), and 400Kgha-1 of
Calcium (Ca) was applied to the control and
other treatments (Table 2). We present the results
from 2016.
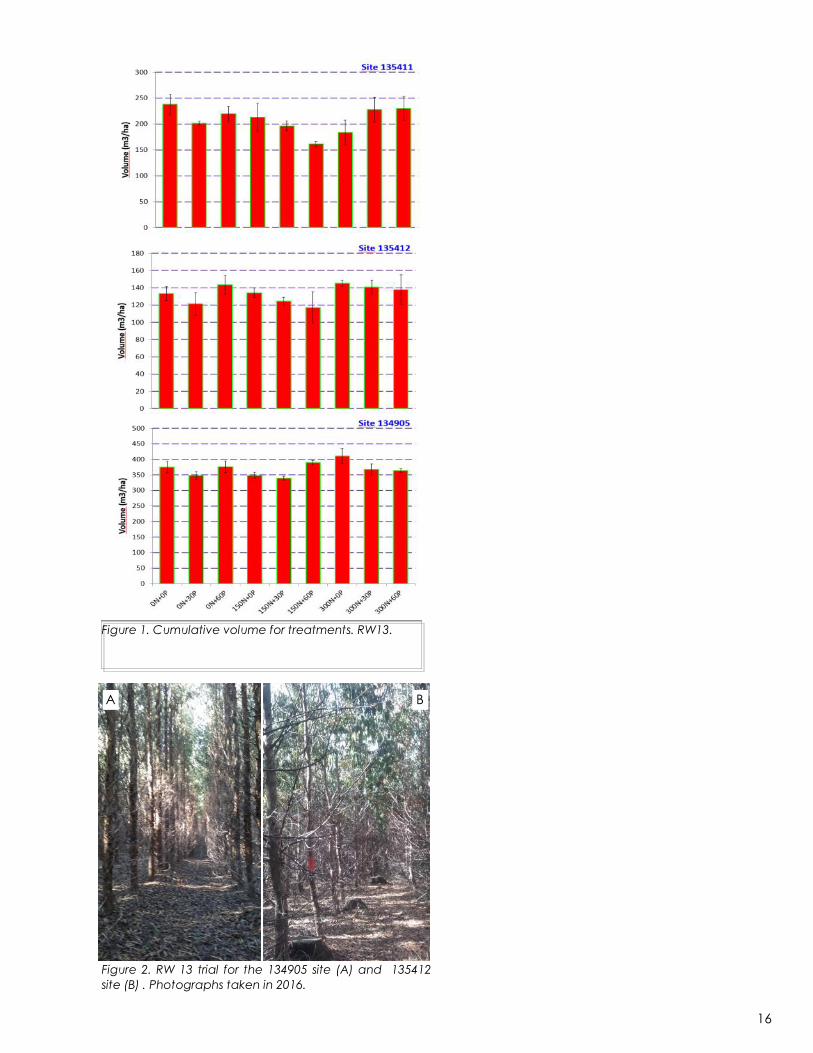
Results There are not significant differences in volume
(m3/ha) for the treatments (see Figure 1). The
134905 site shown the higher volume, with values
between 339 and 411 m3/ha. The lower volume
was obtained for the 135411 site, with values
form 234 to 161.
Future Direction The results presented here is from an ongoing
project, thus future work is required in order to
complete all objectives.
Trials will be evaluated with annual or biannual
measurements for at least for six years based on
long-term responses to fertilization observed
previously for RW13 trials. Soil and environmental
variables will be analyzed to explain leaf area
index responses across sites due to local
variation in vegetation structures. For example
Figure 2 illustrates the different structural
characteristics of two plots.
Table 1. Characteristics of the sites.
Site Las
Millongue Las
Bandurrias Maicas
Code 135411 135412 134905
City San Carlos Lebu Mulchen
Latitude 36ª26’22.88” 37ª33’14.08” 37o49’69.02”
Longitude 71ª41’07.38” 73ª37’08.95” 72º17’96.03”
MAT (ªC) 14 13 17
Rainfall
(mm.year-1) 1034 1302 1380
Soil Recent
volcanic ash
Sedimentary
marine terrace Red clays
T001
0*N + 0P
T011
0N + 30P
T021
0N + 60P
T101
150N + 0P
T111
150N + 30P
T121
150N + 60P
T201
300N + 0P
T211
300N + 30P
T221
300N + 60P
Table 2. Evaluated Region Wide 13 treatments
considering elements combinations in Kg ha-1
16
Figure 1. Cumulative volume for treatments. RW13.
Figure 2. RW 13 trial for the 134905 site (A) and 135412
site (B) . Photographs taken in 2016.
A B
17
Regionwide 18: Rate and Optimal Frequency of Fertilization at Midrotation
Eucalyptus grandis Stands in Colombia
Trial Series Objectives The RW 18 was designed to investigate the
effects of rate and frequency of N fertilization
application in E. grandis until rotation age. The
major questions under investigation were: 1) Is
there any response to mid-rotation nutrient
additions on these high fertility sites? , 2) What
level of cumulative nutrient additions may be
required to obtain a response?, 3)Does
frequency and rate matters to maximize tree
growth response?, and 4) Is there any
cumulative effect of nutrient additions on
nutrient use efficiency? Considering these
questions the main objectives of these trial series
were to: 1) determine the growth response to
increasing amounts of N availability in mid-
rotation stands, and 2) To determine how
maximum growth response may be obtained by
rate and frequency of application.
A total of 7 studies were initially installed, but a
wildfire destroyed one of the studies during its
second year of development and preliminary
results are not considered in this report. Of the 6
studies successfully established 3 of them are
located in the area of Cauca, 1 in the area of
Valle del Cauca and 1 in the area of Pereira
Quindio considering a range in soil-site
conditions (Table 1).
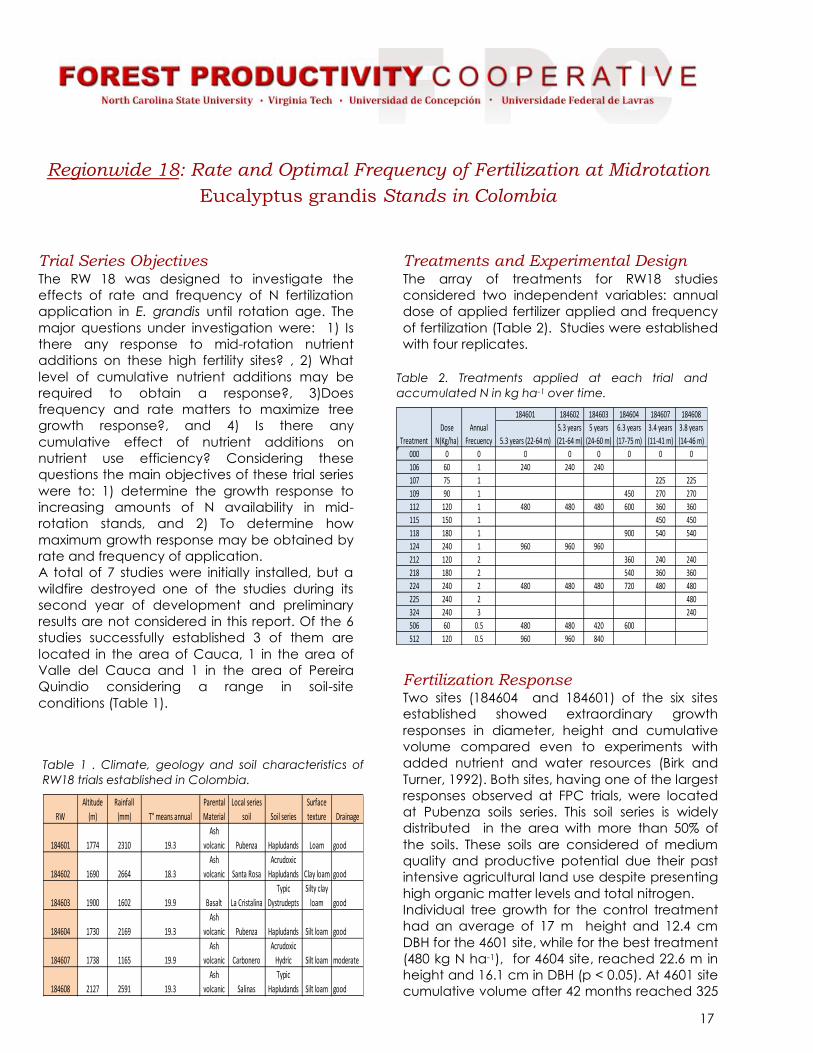
Treatments and Experimental Design The array of treatments for RW18 studies
considered two independent variables: annual
dose of applied fertilizer applied and frequency
of fertilization (Table 2). Studies were established
with four replicates.
Fertilization Response Two sites (184604 and 184601) of the six sites
established showed extraordinary growth
responses in diameter, height and cumulative
volume compared even to experiments with
added nutrient and water resources (Birk and
Turner, 1992). Both sites, having one of the largest
responses observed at FPC trials, were located
at Pubenza soils series. This soil series is widely
distributed in the area with more than 50% of
the soils. These soils are considered of medium
quality and productive potential due their past
intensive agricultural land use despite presenting
high organic matter levels and total nitrogen.
Individual tree growth for the control treatment
had an average of 17 m height and 12.4 cm
DBH for the 4601 site, while for the best treatment
(480 kg N ha-1), for 4604 site, reached 22.6 m in
height and 16.1 cm in DBH (p < 0.05). At 4601 site
cumulative volume after 42 months reached 325
184601 184602 184603 184604 184607 184608
5.3 years (22-64 m)
5.3 years
(21-64 m)
5 years
(24-60 m)
6.3 years
(17-75 m)
3.4 years
(11-41 m)
3.8 years
(14-46 m)
000 0 0 0 0 0 0 0 0
106 60 1 240 240 240
107 75 1 225 225
109 90 1 450 270 270
112 120 1 480 480 480 600 360 360
115 150 1 450 450
118 180 1 900 540 540
124 240 1 960 960 960
212 120 2 360 240 240
218 180 2 540 360 360
224 240 2 480 480 480 720 480 480
225 240 2 480
324 240 3 240
506 60 0.5 480 480 420 600
512 120 0.5 960 960 840
Dose
N(Kg/ha)Treatment
Annual
Frecuency
Table 2. Treatments applied at each trial and
accumulated N in kg ha-1 over time.
Table 1 . Climate, geology and soil characteristics of
RW18 trials established in Colombia.
RW
Altitude
(m)
Rainfall
(mm) T° means annual
Parental
Material
Local series
soil Soil series
Surface
texture Drainage
184601 1774 2310 19.3
Ash
volcanic Pubenza Hapludands Loam good
184602 1690 2664 18.3
Ash
volcanic Santa Rosa
Acrudoxic
Hapludands Clay loam good
184603 1900 1602 19.9 Basalt La Cristalina
Typic
Dystrudepts
Silty clay
loam good
184604 1730 2169 19.3
Ash
volcanic Pubenza Hapludands Silt loam good
184607 1738 1165 19.9
Ash
volcanic Carbonero
Acrudoxic
Hydric Silt loam moderate
184608 2127 2591 19.3
Ash
volcanic Salinas
Typic
Hapludands Silt loam good

18
m3 ha-1 for the best treatment (960 kg N ha-1)
compared to 172 m3 ha-1 for the control
treatment (p < 0.05). For the 4604 site cumulative
volume for the best treatment (900 kg N ha-1)
was 604 m3 ha-1 after 78 months (Figure 1).
Optimum response ranged 180-240 Kg N ha-1
every two years (Fig 3). Cumulative doses
maximized response at 800-1000 Kg N ha-1 (Fig
4).
Responses to mid-rotation nutrient additions may
double productivity of E. grandis plantations. The
observed growth rate after fertilization at both
sites is exceptionally high compared to sites in
Brazil and other previous references elsewhere.
Cumulative volume growth response observed
at sites with response to fertilization, showed a
type A response post treatment application.
High C/N ratios and low N and P foliar levels
seem to be related to site specific responses.
Nutrient availability mechanisms and plant
uptake in these ecosystems are not well
understood.
Future Direction
Nutrient accumulation on aboveground and
belowground biomass analyses will be studied
before harvesting of 184601 site to understand
second rotation carryover of improved nutrition
and nutrient removals of these fast growing E.
grandis stands.
0
100
200
300
400
500
600
700
0 6 12 18 24 30 36 42 48 54 60 72 78
Cu
mu
lati
ve
gro
wth
vo
lum
e (
m3
ha
-1)
Months
184604 /Control
184604/Fert
184601/Control
184601/Fert
Figure 1. Cumulative volume growth for RW18 trials that
showed response to fertilization.
Figure 2. Leaf area response at 184601.
Figure 3. Duration of response for dose and frequency of
application at responsive RW18 trials.
Figure 4. Cumulative N dose and cumulative volume
response at RW18 trials.
Figure 5. Stand growth response at 184601.

19
Regionwide 18: Eucalyptus grandis Fertilizer Response Depends on Site
and Rate
Objectives Determine if site effects are significant for
Eucalyptus grandis fertilizer response;
Quantify juvenile Eucalyptus response to
nitrogen and phosphorus applications;
Determine if application frequency or
cumulative applied dose drive response.;
Examine utility of foliar nutrient concentration
for determining nutrient limitation.
Treatment and Experimental Design A combination of application frequency and
nitrogen (N), phosphorus (P) and boron dose
were applied in 3 or 4 replications as a
randomized complete block design at each site.
Application frequency was 6 12, 24 or 36 months.
Nitrogen was applied at 0, 60, 75, 90, 120, 150,
180, 240 or 250 kg ha-1. Boron and P were added
at 0.005 and 0.1 times the N rate, respectively.
Treatment codes were 0 for control and a 3 digit
code for treatments where the first digit was
frequency (5=6 months; 1, 2, and 3 were years)
and the last 2 digits were N dose divided by ten.
Six sites where Eucalyptus grandis were planted
in the Colombian Andes were identified (Table
1). After three years of treatment, we tested for
site effects on response, rate response function
linear and quadratic effects (quadratic effects
indicate no additional response was achieved
with more nitrogen), dose and frequency
response effects (was response different when
the same cumulative dose was achieved with
different doses and frequencies) and
examined the utility of foliar nutrient
concentrations for determining
nutrient limitations.
Results Three years after treatment, there was
a site effect on response. Sites 1 and 4
exhibited significant treatment effects
for diameter, height, basal area and
volume growth (Figure 1). Volume
response to the 124 treatment (240 kg
N ha-1 applied annually) at Site 1 was
142 m3 ha-1,(91 %) and at Site 4
response to the 118 treatment was
116 m3 ha-1 (100%).
Linear and quadratic effects in the
rate response function were observed
at Sites 1 and 4 (Figure 1). Response
increased until doses of 480 and 360
kg N ha-1 were added at Sites 1 and
4, respectively.
Table 1. Site location, soil and geologic characteristics, and tree and
stand variables prior to treatment initiation for the six sites in Colombia
where Eucalyptus grandis was fertilized at different doses and
frequencies.
Variable 1 2 3 4 5 6
County Cauca-Cajibio Valle-Darien Valle-Darien Cauca-Meseta Valle-Cumbre Cauca-Salinas
Nearest town Popayan Pereira Darien Popayan Cumbre Salinas
Latitude (decimal degrees) 2.6 4.7 4.05 2.5 3.67 2.43
Longitude (decimal degrees) -76.62 -75.67 -76.43 -73.62 -76.52 -76.55
Installation Year 2000 2000 2000 2003 2004 2004
Age (months) 22 21 24 17 11 14
Previous land use Pasture E. grandis E. grandis P. oocarpa P. maximinoi E. grandis
Elevation (masl) 1774 1690 1900 1730 1738 2127
Precipitation (mm yr-1
) 2310 2664 1602 2169 1165 2591
Mean annual temperature (°C) 19.3 18.3 19.9 19.3 19.9 19.3
Soil Series Pubenza Santa Rosa La Cristalina Pubenza Carbonero Salinas
Parent material Volcanic ash Volcanic ash Volcanic ash Volcanic ash Volcanic ash Volcanic ash
Soil taxonomy Hapludands Acrudoxic
hapludands
Andic
Dystrudepts
Acrudoxic
Hydric
Melanudands
Acrodoxic hydric
hapludands
Acrudoxic
Melanudands
Surface texture Loam Clay loam Silty clay loam Silty loam Silty loam Silty loam
Drainage Well Well Well Well Moderately well Well
A horizon depth (cm) 24 15 13 40 25 35
Bulk density (g cm-3
) 0.49 0.69 0.56 0.51 0.51 0.71
pH 5.4 4.8 5.3 4.7 4.8 5.3
Organic matter (%) 0.58 9.2 18.2 25.6 18 0.46
Nitrogen (%) 15.9 0.4 0.63 0.8 0.63 11.8
Phosphorus (mg kg-1
) 3 3 2 0.5 1 5
Potassium (mg kg-1
) 0.07 0.16 0.17 0.09 0.12 0.34
Calcium (mg kg-1
) 0 0.3 0.1 0.1 2.4 2.3
Magnesium (mg kg-1
) 0.1 0.1 0.2 0.1 0.6 0.5
Aluminum (mg kg-1
) 0.3 0.7 1.6 1.7 0.9 0.4
Number of blocks 3 3 3 4 4 4
Diameter (cm) 6.9 5.2 9.5 5.7 3.3 5.1
Height (m) 7.0 5.6 10.9 6.5 3.4 5.0
Basal area (m2 ha
-1) 5.3 2.9 8.4 2.9 0.8 2.2
Volume (m3 ha
-1) 43.9 27.6 66.6 27.4 12.5 22.3
Stocking (trees ha-1
) 1280 1147 1129 1119 959 1027
Site
Figure 1. Three year volume growth response versus
cumulative applied nitrogen dose at Eucalyptus grandis
sites in Colombia where nitrogen, phosphorus, and boron
were applied at different rates and frequencies. Error
bars are one standard error.
Cumulative applied nitrogen dose (kg ha-1
)
0 100 200 300 400 500 600 700 800T
hre
e y
ear
volu
me r
esponse (
m3 h
a-1
yr-1
)-10
0
10
20
30
40
50
Site 1
Site 2Site 3Site 4Site 5Site 6

20
Of the 11 tests comparing different application
rates and frequencies to achieve the same
cumulative dose only one indicated a different
response (Figure 2). The one test with a different
response was at Site 4 where a cumulative dose
of 540 kg N ha-1 achieved in 3 application of 180
increased growth 38 m3 ha-1 whereas the same
dose achieved with 6 applications of 90
increased volume growth by 24 m3 ha-1.
Initial foliar N concentrations ranged from
1.73-2.34% (Table 2). Treatment and
treatment by time effects were significant at
Site 4 for N (Figure 3) and P where the control
was lower than all other treatments.
However, all sites had at least one nutrient
concentration below optimum but only 2
sites were responsive to nutrient additions.
(Table 2) indicating that other factors were
limiting (water at Site 5) or that the stands
were already close to their productive
potential. Concentrations could be well
below that considered optimal and still
support high growth rates (e.g. potassium at
Site 4) and control concentration fluctuated
significantly over time at all sites. (Site 4 N
(Figure 3). These factors indicate that caution
should be used in interpreting and then using
foliar nutrient concentrations as the sole
metric for informing fertilizer application
decisions. Other studies have shown that leaf
area index ins a good metric for predicting
growth and potential response to nutrients in
Eucalyptus where low leaf area stands are
most likely to respond to added nutrients.
Conclusions Juvenile E. grandis can respond to fertilizer.
Cumulative dose drives response, not the rate or
frequency of application. Caution is needed
when using foliar nutrient concentrations to
determine nutrient limitations.
Additional Resources Albaugh et al. 2015. For. Ecol. Manage. 350:30-
39.
Table 2. Foliar nutrient concentrations for the control treatment
prior to study initiation (Month=0) and every six months thereafter.
No post treatment samples were collected at Sites 5 and 6.
Site Month N P K Ca Mg S B Zn Mn Cu
(%) (%) (%) (%) (%) (%) (ppm) (ppm) (ppm) (ppm)
1 0 2.02 0.11 1.01 1.11 0.15 0.19 10 20 437 8
6 1.75 0.10 0.90 0.88 0.14 0.15 7 17 360 7
12 1.55 0.11 0.92 1.12 0.15 0.17 13 18 488 7
18 1.60 0.11 0.84 0.94 0.16 0.16 14 19 503 6
24 1.47 0.11 0.88 1.03 0.17 0.12 17 14 422 7
30 1.91 0.11 0.84 0.77 0.22 0.16 68 14 316 7
36 1.83 0.11 0.91 0.80 0.23 0.15 53 14 319 8
2 0 2.26 0.13 1.13 1.03 0.17 0.19 21 27 842 10
6 1.83 0.08 0.84 1.33 0.14 0.16 20 22 872 6
12 1.67 0.10 0.84 1.31 0.17 0.18 27 17 1138 7
18 1.71 0.09 0.90 1.40 0.19 0.16 31 17 1100 6
24 1.66 0.10 0.83 1.04 0.21 0.15 31 14 941 6
30 1.80 0.12 0.92 0.93 0.24 0.17 33 18 830 7
36 1.90 0.14 0.78 0.88 0.31 0.19 26 19 688 8
3 0 2.15 0.10 0.74 1.33 0.16 0.19 13 20 1527 7
6 2.12 0.10 0.74 1.14 0.13 0.19 17 17 1365 5
12 2.13 0.11 0.80 1.21 0.16 0.18 21 21 1504 6
18 2.45 0.13 0.79 0.96 0.16 NA NA NA NA NA
24 2.19 0.11 0.77 0.84 0.13 0.16 19 17 1330 7
30 2.35 0.11 0.75 0.99 0.15 0.21 29 15 1667 6
36 2.18 0.13 0.82 0.85 0.20 0.21 19 20 1353 7
4 0 1.73 0.09 0.49 0.72 0.23 0.15 35 12 688 7
6 1.77 0.08 0.47 0.71 0.22 0.14 51 12 696 7
12 1.50 0.08 0.57 0.70 0.25 0.13 44 11 525 5
18 1.19 0.07 0.54 0.60 0.23 0.13 29 10 444 5
24 1.58 0.10 0.56 0.62 0.29 0.15 23 12 516 5
30 1.35 0.09 0.59 0.51 0.22 0.13 35 14 471 6
36 1.77 0.11 0.66 0.60 0.29 0.18 32 15 498 6
5 0 2.34 0.11 0.98 1.37 0.17 0.20 23 21 415 8
6 0 1.95 0.08 0.78 1.59 0.14 0.17 31 15 914 8
Figure 2. Three year volume response at six Eucalyptus
grandis sites in Colombia where a given nitrogen dose
was applied at different rates and frequencies. X axis
labels represent site-cumulative dose where site is
nominal (1-6) and dose is in kg elemental N ha-1 applied
in 1, 2, 3 or 6 applications. Error bars are one standard
error.
Site - Cumulative nitrogen dose (kg ha-1
)
6-2
40
5-3
60
6-3
60
1-3
60
2-3
60
3-3
60
4-3
60
4-5
40
1-7
20
2-7
20
3-7
20
Th
ree
ye
ar
vo
lum
e r
esp
on
se
(m
3 h
a-1
yr-1
)
-20
-10
0
10
20
30
40
50
60
1 application2 applications3 applications6 applications
Figure 3. Foliar nitrogen concentrations from site 4.
Asterisks indicate dates when the control was significantly
less than at least one treatment. Numerical codes are
explained in the text.
Years since treatment initiation
0.0 0.5 1.0 1.5 2.0 2.5 3.0 3.5
Fo
liar
nit
rog
en
co
ncen
trati
on
(%
)
1.0
1.2
1.4
1.6
1.8
2.0
2.2
2.4
2.6
2.8Control
109
112
118
212
218
224
506
509
* **

21
Regionwide 20: Site Optimum Stocking and Plantation Design to Optimize
value and productivity of Eucalyptus grandis genotypes in Argentina
Background The choice of the initial density of planting and
the spacing is one of the most important
decisions that must be considered in the
establishment moment, because not only affect
the productivity stand but also takes the wood
quality and profitability of forest. From the
economic point of view, the density planting
and the spacing such as the number of plants
to establish, the number of lines of tilled soil or
soil preparation machinery, initial fertilization
and the intensity and frequency of weed
control, in addition to the regime of thinning
and pruning. In this context. it was established
a LAPRW2 in Argentina.
Study Objectives
The LAPRW2 was designed to assess the growth
and quality wood responses of selecting
genotypes and density planting .
The study was stablished in Entre Rios province
Argentina (Figure 1), stand “Yuqueri”. Soils have
characteristics of oxic udifluvents fluventic and
haplumbreptes. There are sandy terraces with
high rolling hills of reduced fertility and low water
retention capacity.
The climate is subtropical. The average summer
temperature of the city is between 22 and 26 °
C, while the winter is 12 to 15 ° C, with minimum
below 0 ° C values. The average humidity is 73%
and reach an average rainfall of 1300 mm
annually.
Treatments and Experimental Design The study was established in august 2015. The
growing measures was doing in October 2015,
The design correspond a split plot with 4 block ,
the structure of the treatments. Spacing
treatment correspond to a tree row spacing for
1,5; 2.25; 3; 4; 6; 9 m and 4 m spacing between
rows with consequent density of 1667, 1111, 833,
625, 417 and 278 tree/ha. The genotypes were
EG36 and CG27 correspond to Eucalyptus
grandis and Eucaliptus grandis x Eucaliptus
camaldulensis hybrid, respectively.
Results After one year, the analysis of ANOVA, shown a
significant interaction between the density and
genotypes (p<0.005). The height grow shown
differences between EG36 and GC 27 genotypes for 417 and 1667 tree/ha. In both
treatment, the GC27 obtained the higher
height, with 167 and 161cm, respectively, which
is on average a 15% higher than the CG36
(Figure 2).
Figure 1. Location of the LAPRW2 trial in Argentina.
Figure 2. Effect of interaction between genotypes by
density on H growth at age one for the LAPRW2 trial.
Bars show the standard error.

22
The survival presented high percentage to all the
treatments by density and clone, over 90%
(Figure 3).
With regard to the damage, the mainly factor of
damage is by ants and pesticides. Apparently,
the EG36 clone is more resistant. It also draws
attention the similar percentage of damage,
around 20%, for both clones at same density, 625
and 833 tree/ha. (Figure 5).
Future Direction
Annual measurements consider total height, DBH
and mortality. Soil and foliar chemical
properties will be sampled annually future
measurements included the crown growth, as
diameter and height; photosynthesis , internodes
length, branch diameter , quality
wood and stem.
Acknowledgements
This project is supported by
MASISA S.A, INTA ,FPC and
cooperators.
Figure 4. The EG36 clone in the LAPRW2 established by MASISA ARGENTINA,
2015.
Figure 5. Damage percentage for the LAPRW2 trial in
Argentina, 12 months after establishment. A:healthy,
Y:bend, inclined Z:damage by ants and/or pesticides Figure 3. Survival percentage for the LAPRW2 trial in
Argentina, 12 months after establishment.

23
Regionwide 21: Eucalyptus Twin-Plot Network: the Deforsa Venezuela Trial
Introduction The Twin Plot approach is a paired design used
to capture resource limitations at the landscape
level (Stape et al. 2004). Twin plots have the
advantage of producing knowledge on spatial
distribution of resource limitations (Ferreira and
Stape 2009) and may provide a basis for
parameterization of process based model
(Landsberg, 2011).
Understanding what limits productivity across a
landscape can help develop site-specific
silvicultural prescriptions. Resource limitations
can be directly verified by the change in forest
current annual increment (CAI) when
confronting CAI of inventory and the twin-plot.
Change in Leaf area index (LAI) (Figure 1) can
be used as a quick surrogate for site resource
limitation due to its direct effect on light
capturing and use, which precedes the final
stemwood increment results.
The RW21 Eucalyptus Twin-Plot trial are currently
being used or installed in Deforsa (Venezuela)
and Smurfit Cartón de Colombia. This report
presents the initial results at the Deforsa site in
San Carlos, Venezuela (Figure 1).
Objectives To determine the Eucalyptus potential
productivity in San Carlos, Venezuela.
To understand the main factors that constrains
Eucalyptus forest growth across this landscape.
To develop tools to identify management-
responsive Eucalyptus sites.
Methodology A total of 76 pairs of twin-plots were established
on Deforsa land (Venezuela) in 2009 (Figures 1,
2). The company has established clonal forest
plantations mainly with E. urophylla and E.
grandis x urophylla. Deforsa’s inventory network
consists of 1 permanent plot per 5 ha of
plantation, being installed when the forests
reaches 2 years-old. Permanent inventory plots
have approximately 60 trees (4 rows X 15 trees/
row). From the existing plots, 8% were selected to
represent Deforsa landscape.
Figure 1. Pair of Inventory-Twin Plots at Deforsa.
Figure 2. Twin Plot: fertilized, no weeds.

24
For every selected inventory plot, a twin-plot
location was carefully chosen in the vicinity,
based on the visual assessment of mortality,
diameter, height, competing vegetation, soil
and topography situation. Twin plots were
established in a way to assure that no run-off
would move from the twin-plot to the inventory-
plot carrying applied fertilizers.
In some sites (25% of total) where weeds were
abundant, a third plot was established (called,
the triplet-plot) which received only weed
control in order to isolate the effect of weed
competition in the management response. A
total of twenty triplet plots where established.
Results Overall, there was a quick and significant
(paired t test p<0.0001) increase in productivity
of Deforsa’s forests in the Twin-Plots due to the
combined weed control and fertilization effects
(Fig 3).
Significant statistical differences were found for
DBH, total height, and biomass increment . At
some specific sites the Management Response
(Twin-Plot growth minus Contorl growth)
reached up to 10 Mg ha-1 yr-1, which represents
an important increase over the productivity
(Figure 3).
Currently the same management practice is
applied to all the stands, however it is clear that
in some stands responses are almost zero, and in
others are very high, which shows the possibility
to site-specific optimization. For that purpose, a
tool which allows classifying the sites as
responsive or non-responsive to intensive
treatment need to be established.
For the selected group of plots with high
competing vegetation problems, no statistical
difference was found between Weed Control
and Fertilization + Weed Control treatments.
However both were more productive than the
control plot (Figure 4). These results highlight the
important of weed control in this tropical
environment, which can lead to an increase in
productivity of more than 20% in a very short
time.
Preliminary Conclusions The Twin-Plot design, with combined effect of
weed control and fertilization, has proven to be
a simple and efficient design to capture
operational constraints to Eucalyptus
productivity in tropical conditions.
The triplet-design, isolating weed control and
fertilization effects, also shown to be effective to
point the relative importance of each
management.
The study, which is also evaluating Leaf Area
Index and Light Use Efficiency, intends to identify
the adequate tool to identify between
responsive and non-responsive sites for a
operational point of view.
Acknowledgements Support for this work was provided by Deforsa
Company, the Forest Productivity Cooperative
and the Zobel Grant. We also thanks Deforsa’s
personnel and the Universidad de Los Andes
(Mérida, Venezuela).

25
Regionwide 22: Evaluation of Potential Productivity of Eucalyptus grandis in Colombian Andes using a Twin Plot Approach.
Study Objectives 1. To determine the potential productivity of E.
grandis on the Colombian Andes.
2. To understand the major constraints on E.
grandis forest growth and evaluate
silvicultural strategies to maximize forest
productivity.
3. To model plantation productivity response on
empirical models and validate process
based models.
Sites Characteristics A total of 200 Twin Plot trials (RW22 Study) were
established by Smurfit Kappa Carton de
Colombia in the Colombian Andes. Studies were
established considering a gradient of age (0.5-
5.5 years), elevation (900 to 2100 m.a.s.l.), rainfall
(900-2500 mm), soils and geology (sediments,
basaltic/andesitic, metamorphic and recent
volcanic ash) representing the whole range of
company sites across their range of operation
on a north, center and south region. Plantations
selected also considered a range of genetic
materials of second generation improved
material.
Treatments and Experimental Design Plots were established considering initial
homogeneous conditions (Twin Plots) in order to
compare a control (current silviculture) vs. weed
control maintenance until crown closure or if
competing vegetation was present and a
complete maximum fertilization treatment in
order to remove any site potential
manipulatable limitation. Weed control
treatments considered mechanical and
chemical (Glifosate 3,0L/ha) and for one or two
years in most cases, and fertilization treatments
included a range of doses for nitrogen,
phosphorus, potassium, calcium, magnesium
and micros according to the age of the stand.
Twin Plots Response Initial analysis of Control vs. Potential twin plots
at establishment showed no differences in mean
DBH between plots established at different ages
Figure 1. Location of farms where twin plot studies were
established in Colombia.
Figure 2. Twin plots established in 2011. Right, control.
Left, Potential productivity plot with weed control and
fertilization showing strong regrowth of competing
vegetation after 3 months.

26
for a range of genetic materials and soil-site
nditions (Figure 3).
Annual assessment of twin plots reponses across
all established pairs, showed significant increases
in mean DBH for all genotypes across sites after 2
years of monitoring. Increase in DBH across plots
ranged from 0 to 4 cm in mean diameter after 4
years since establishment (Figure 4).
Evaluation of responses for plot volume between
CONTROL and POTENTIAL showed also
significant and sustained responses after 4 years
(Figure 5). Plots showing large effects of
mortality or differences in stocking larger than 5%
were removed.
Range of volume responses after 4 years ranged
from –20 to 123 m3ha-1 across sites and
genotypes. However, mean response reached
30 m3/ha and showed a larger trend or response
to fertilization after 2.5 years and a single
genotype showed negative responses at some
sites. In addition, a few stands may be still
developing a full response.
Evaluation of responses across parent materials
suggested that Anfibolitic and Dense clayey soils
(high in OM) showed negative responses across
sites. However, several parent materials showed
strong and consistent responses across the
landscape (Figure 6).
Future Direction Twin plots information of foliar and soil fertility analyses
will be evaluated in order to understand and develop
a model of site-specific response.
A process model approach is expected to be carried
on in order to adjust responses across sites and
genotypes over time.
Figure 4. One to one comparison of twin plots for
CONTROL vs POTENTIAL response for mean DBH after 4
years since establishment.
Figure 3. One to one comparison of mean DBH
between Control and Potential twin plots at initial
establishment. The figure consider all pairs established.
Figure 6. Percent and absolute response of twin plots by
parent material across sites.
Figure 5. One to one comparison of twin plots for
CONTROL vs POTENTIAL response for mean Volume after
4 years since establishment.

27
Regionwide 23: Duration and Intensity of Weed Control of
Eucalyptus grandis in the Colombian Andes
Study Objectives 1. To determine the optimal duration and
intensity of weed control to maximize survival
and tree growth of E. grandis.
2. To assess biomass and nutrient uptake of
competing vegetation over time and its effect
on resource availability for the target crop.
3.- To model the biological and economical
response of E. grandis to duration and intensity
of weed control.
Sites Characteristics Three RW23 studies were established in
Colombia by Smurfit Kappa Carton de
Colombia (RW234601, RW234602 and
RW234603). Figure 1 summarizes location and
characteristic of each site. Studies were
established on well drained clay loams and a
moderately well drained loamy soil. Clay loam
sites had nearly twice the precipitation
(2.600mm) than the loamy site (1.250mm). All
soils derived from volcanic p. materials (Figure
1). A summary of the dominant competing
vegetation at each site is presented in Figure 2.
Treatments and Experimental Design The experimental design considered a complete
randomized block design with 6 to 7 replicates
depending on site and vegetation variability.
Treatments applied considered a factorial
combination of four levels of weed control
intensities (no weed control, 33% , 66% and 100%
of weed control in bands centered in the
planting line) and eight levels of weed control
duration (30, 60, 90, 120, 180, 360, 540 and 720
days free of competing vegetation) (Figure 3).
All sites had a broadcast preplanting chemical
weed control with Glifosate (3,0L/ha) and
Flufenacet (0,45 L/ha) before the application of
weed control duration and intensity treatments.
Weed Control Intensity and Duration The effect of weeds on the nutrient availability
may be very detrimental for tree growth. Two
years after establishment N uptake acumulated
in weed biomass ranged from 70 to 330 kg/ha
(Figure 4).
Figure 1. Left: Map of established trials. Right: Table
summarizing site characteristics of each trial.
Figure 3. Experimental layout in order to define weed
control intensity and duration combination treatments.
Figure 2. Dominant weed species at each site.

28
After 5 years weed control intensity and duration
treatments effects are still clearly observed on
tree growth and after year 3 showed similar
responses for 66% and 100% weed control
intensities at RW234601 and RW234603. These
results suggested that complete weed control
may not be required to obtain maximum
benefits at these sites. In terms of weed control
intensity and duration, in average the best
response was observed for a 100% intensity and
a period larger than 90 days of duration.
Maximum responses allowed to obtain a 72-140
m3ha-1 gain after 5 years of stand development
(Figure 5) but different from year 3 analyses at
234601 an increased response was obtained for
a duration of 540 days of weed control.
Therefore, the first 90 days of weed control are
critical to obtain the largest gain to weed
control but changes in competing vegetation
interference may affect long-term analyses. .
Long-term weed control analyses are not
common and responses suggest that resource
availability and type of competing vegetation
has modulated these responses. Key results for
operations suggest that initial 90 days of free
weed control in the line of planting are critical
to obtain good stand development.
Advantages of 100% weed control may be
obtained in terms of free stand mobility but may
challenge biodiversity or soil-site sustainability. Intensities of weed control may be adjusted over
time according to timely development of plantations.
However, responses to intensity of weed control for
grasses (width band 33% vs 66% vs 100%) are greater
for low rainfall sites or years with low water availability.
Our results suggest that sites of low resource
availability (lower rainfall) and competing vegetation
that do not compete for light resources may have a
shorter window of weed control needs compared to
hardwoods competing vegetation.
Future Direction Trials will be carried until rotation age and modeling of
responses has been planned as a silvicultural decision
model for Smurfit Kappa Carton de Colombia. Soils
and nutritional evaluations carried on this project will
also be incorporated to understand site specific
responses and underlying process.
Figure 5. Mean cumulative volume response to weed
control duration under a 100% intensity (full weed
control) at 234601 (upper panel), 234602 (middle panel)
and 234603 (lower panel) after 5 years.
Figure 4. Weed biomass and nutrient capture by weeds
at the control treatment over time.

29
Regionwide 24: Cold Tolerant Eucalytpus Species Screening Study in
Raleigh, NC
Background
In the RW24 study, 150 Eucalyptus species from
333 entries were planted in 37 trials on 18 sites
across the southeastern US (SEUS) in a biomass or
screening design. In the screening trials, trees
were evaluated for cold tolerance identifying
approximately 10 species that were adaptive to
survive the cold temperatures during winter
months. Based on those results, E. benthamii
appeared to be the predominant species well
adapted with exceptional growth for Plant
Hardiness Zones 8b and 9a that extends from
coastal South Carolina to eastern Texas. E.
grandis, E. grandis hybrids, and other tropical
species have been successfully grown in south
Florida for many years in Plant Hardiness Zone
10a. However, E. gunnii and E. pauciflora within
the RW24 were identified as adaptive to
northern and/or more interior areas in Plant
Hardiness Zones 7b and 8a in the SEUS. While
these species displayed significant cold
tolerance, a limitation in seedling availability
restricted the ability to evaluate the yield
potential of these species in adapted areas of
the SEUS.
Following the initial installation of the RW24 trials,
a small research trial was installed at the NCSU
Horticulture Field Lab in Raleigh, NC (35.79°N,
78.70°W) to examine the adaptation and
growth of species identified adaptive to
northern and interior regions of the SEUS. This
study is identified in the FPC as 241321. The
Raleigh, NC site has a clayey Alfisol soil and lies
in USDA Plant Hardiness Zone 7b with mean
minimum temperatures ranging from 5 to 10 F (-
15 to –12.2 C). The FCBA (Forêt Cellulose Bois-
Construction Ameublement) contributed seed
lots that consisted of the most cold-tolerant
material in the RW24 collection including E.
gunnii, E. dalrympleana, and E. gunnii x E.
dalrympleana hybrid (Table 1).
Study Objectives
1. Identify cold-hardy Eucalyptus species that
can survive and grow well in the SEUS.
2. Quantify the productivity of these species
under different silvicultural treatments.
3. Investigate the environmental factors related
with Eucalyptus cold-risk and yield zoning.
4. Provide information for tree breeding
strategies and hybridization.
Experimental Design
The screening study design used a linear plot
layout (1 row x 3 trees) with the purpose to test a
large number of entries for cold tolerance. The
trial was planted in August 2014 with a 1 x 1 m
spacing, 324 trees total. Complete competing
vegetation control was accomplished with
mechanical and chemical applications
throughout the first two growing seasons.
Canopy health was measured categorically
(Figure 1): 1 was completely healthy; 2 was
damage at the top and tips but more than 75%
of the canopy was healthy; 3 was interior foliage
of the canopy damaged but some parts of the
canopy were healthy; and 4 was a completely
dead canopy.
Species Lot # Seed Lot Source Country
E. gunnii 1380 61049 FCBA France
E. gunnii 1381 61050 FCBA France
E. gunnii 1382 61051 FCBA France
E. gunnii 1383 61058 FCBA France
E. gunnii x E. dalrympleana
1384 81075 FCBA France
E. dalrympleana 1386 91076 FCBA France
E. gunnii x E. dalrympleana
1387 91111 FCBA France
Table 1. Seed source information. FCBA(Forêt Cellulose
Bois-Construction Ameublement).

30
Results
E. gunnii showed the best canopy health after
three winters with all four seed lots having an
average canopy health rating less than 2 (Table
2). The E. dalrympleana and E. gunnii x E.
dalrympleana hybrids (Gundal) showed some
canopy damage with average canopy health
greater than 2 (Table 2). Height after two
growing seasons ranged from 4.7 to 5.7 m, with
E. dalrympleana as the tallest (Figure 2).
Diameter ranged from 3.5 to 4.5 cm, with E.
gunnii-1383 as the largest. Considering both
growth and canopy health E. gunni—1380
appeared to do the best overall.
Conclusions
E. gunnii seed lots showed the least canopy cold
damage, however, they tended to be smaller
than the E. dalrympleana and hybrids.
Additional winter seasons are necessary to
further evaluate cold tolerance in these species.
Figure 2. . Height by species for 1 and 2 growing season
after planting.
Table 2. Canopy health rating by species in June 2017.
Species Lot # Canopy Health
Gunnii 1382 1.1
Gunnii 1380 1.2
Gunnii 1383 1.4
Gunnii 1381 1.5
Dalrympleana 1386 2.3
Gundal 1384 2.7
Gundal 1387 3.0
Figure 1. Canopy rating scale for cold tolerance.

31
Regionwide 25: Effects of Macro and Micro Nutrient Omissions on a
Eucalyptus Plantation in a Dry Area of Brazil
Introduction
Several Brazilian companies expanded their
Eucalyptus plantations to the Central, North and
Northeast part of the country in recent years.
These new regions have different
edaphoclimatic conditions, compared to the
traditional plantation areas (i.e. southeast and
south), imposing challenges and demanding
innovation to silvicultural practices already
established in traditional regions. In 2011, the
Macronutrient Omission trial was established in
the north part of Brazil to address questions
concerning forest nutrition. Due to the results of
this study, a Micronutrient Omission trial was
planted in the same region in 2014.
The Nutrient Omission design has a simple
rationale, consisting of: (i) a control treatment to
assess the soil natural nutrient availability; (ii) the
complete treatment with the application of all
nutrients for adequate tree growth; and (iii)
treatments where each nutrient is omitted from
the complete fertilization to characterize their
effect on productivity.
Study Objectives
The Nutrient Omission design has three main
objectives: (i) evaluate the nutrient limitation for
quick canopy closure; (ii) Identify the ranking of
importance for nutrient limitation; and (iii) use soil
and tissue nutritional analysis for fertilization
recommendation.
Treatments and Experimental Design
The Macronutrient Omission trial (Table 1) was
installed in January 2011, and the Micronutrient
Omission trial (Table 2) in January 2014. Sites
were installed on a yellow Oxisol in Brejinho de
Nazaré, Tocantins State (Brazil), on Valor Florestal
Company area, with hybrid clones of Eucalyptus
grandis x urophylla. Precipitation was poorly
distributed over only 6 months (~1700 mm), with
a dry period of 6 months and cumulated soil
water deficit of ~600 mm. Growth was measured
annually or semiannually. At 3-years after
planting, in the Macronutrient trial, a destructive
aboveground biomass assessment was
performed in the control and complete
treatments.
Results
A significant effect of macronutrient omission
started 2 years after planting (Figure 1). As
expected, the control treatment showed the
lowest productivity, with a Mean Annual
Increment (MAI) of 9.3 m3 ha-1 year-1. The
complete treatment, with all balanced nutrients
application, showed the highest productivity,
with a MAI of 34.4 m3 ha-1 year-1. The nutrient
omission showed a similar ranking of importance
over time. Omission of N, Ca/Mg and P showed
a similar response, with a MAI of ~28 m3 ha-1 year
Table 2. Description of treatments for the Micronutrient
Omission trial.
Table 1. Description of treatments for the Macronutrient
Omission trial.

32
-1, approximately 81% of the complete
treatment.
Omission of K showed a strong impact on
productivity, with MAI of 17.6 m3 ha-1 year-1 (51%
of the complete). Omission of micronutrients
severely affected productivity, with MAI of 12.2
m3 ha-1 year-1, revealing it to be as limiting as the
control treatment (Figure 2). Mortality rates were
significantly affected 3 years after planting. At
5.6 years, micronutrient omission showed the
highest mortality (26%), followed by K omission
(16%) and control (12%). All the other
macronutrient omission treatments showed
mortality rates ranging from 5% to 8%.
The effect of micronutrient omission, 2.5 years
after planting, was not significant, except for the
control (Figure 3). The average MAI among
treatments was 30.2 m3 ha-1 year-1,
The ranking of importance and the identification
of the most limiting macro- and micro-nutrients
are essential information to develop a strategy
of fertilization regime to guarantee fast canopy
closure and high productivity.
Future Direction
Studies on both trials are still under development,
with growth and leaf area index measurements
being made periodically. A series of foliage and
soil nutritional analysis is ongoing and is currently
under processing and evaluation.
Acknowledgements
This study is supported by Valor Florestal.
Figure 2. Macronutrient omission trial photos at 4 years,
from Micronutrient omission (A) and Complete treat-
ment (B).
Figure 1. Stem volume over the years for the Macronu-
trient omission trial (A). Mean annual increment at 5.6
years, and percentages compared to complete treat-
ment (B). Letters above bars represent Tukey analysis
(p=0.05)
A
B
Figure 3. Stem volume for the Micronutrient omission
trial (A). Mean annual increment at 2.6 years, and per-
centages compared to complete treatment (B). Letters
above bars represent Tukey analysis (p=0.05)
A
B

33
Regionwide 25: Nutrient Omission Study on Young Eucalyptus nitens
Plantations in South-Central Chile
Objectives
1. To maintain high leaf area levels and
maximum growth rates in Eucalyptus
plantations at mid-rotation stages.
2. To evaluate the importance of macro and
micronutrients on the potential response to N
and P additions across major contrasting soils
and climatic conditions and under high
nutrient loading rates.
3. To evaluate leaf area, growth efficiency and
foliage nutrient levels at high rates of N and P
additions under a gradient of nutrient
omission treatments at different soil-site
conditions.
Treatments and Experimental Design
Study Area
Three sites with 1-4 year old Eucalyptus nitens
plantations were established in the Bío-Bío region
in Chile. Site mean annual temperature
averaged 13-17°C, rainfall ranged 1000-1400
mm per year and soils considered recent
volcanic ash, marine sediments and red clay old
volcanic ash soil derived parent materials (Table
1).
Trial Design
The experimental design consisted of a
completed randomized block design with three
replicates. Treatments considered an omission
trial design with low (once a year) and high
(twice a year, autumn & spring) nutrient loading
frequencies focused on extreme additions that
may avoid any potential nutrient limitation at
each site. The whole study considered a total of
18 treatments (Table 2).
Trials 255401 and 255402 were established in 2011
in 1-year-old plantations. 254901 trial was
installed in 2012 in a plantation of four years. We
show the result from 2016 data .
Results
After 5 years, the sites 255401 and 255402 did not
show an effect of treatment on height. However,
cumulative average height did show an effect
of treatment at site 254901. In this site, we
observed higher values for height in treatment
221, which had all nutrients applied (no
omission). This result showed a positive effect of
the fertilization on the growth for this site (Figure
1).
Heights ranged from 16 to 20 m for 255401, and
between 13 and 15 for 255402. The greatest
heights were found at 254901, with values from
19 to 23 m (Figure 1 and 2).
Table 1. Main characteristics of the study sites.
Site Las
Millongue Las
Bandurrias Maicas
Code 255401 255402 254901
City San Carlos Lebu Mulchen
Latitude 36ª26’22.88” 37ª33’14.08” 37o49’69.02”
Longitude 71ª41’07.38” 73ª37’08.95” 72º17’96.03”
MAT (ªC) 14 13 17
Rainfall
(mm.year-1) 1034 1302 1380
Soil Recent
volcanic ash
Marine
sediments Red clay
Table 2. Treatments for the RW25: dose, frequencies
and omission.

34
Future Direction
Site specific environmental and nutritional varia-
bles are being collected and will be analyzed to
evaluate growth and leaf area index response
at different sites. High rates of fertilization applied
are expected to sustain increased LAI levels and
eventual responses.
Figure 1. Cumulative average height 244901(EE bars) for
the 255401, 255402 and 254901 sites.
255401 255402
Figure 2. Eucalyptus nitens for the 254901 site (left) and
for the 255401 site. 2016.

35
Regionwide 25: Nutrient Omission at Establishment in Eucalyptus
urophylla in Colombia
Introduction
Eucalyptus urophyllla has potential for improved
management in some areas of Colombia.
Intensive silvicultural management, excluding
genetic improvement, may permit E. urophylla
productivity up to 40 m3 ha-1 year-1. Recent
work on E. urophylla research has been
completed in the Orinoquia region in Colombia.
This area typically has Ultisols and Oxisols, soils
with low nutrient availability, low pH (4.5-5.5)
and, consequently, low cation exchange
capacity, with high aluminum saturation (>83%).
Positive responses to phosphorus fertilization
have been found, however additional
information is required about other nutrients like
calcium and micronutrients to better refine
fertility management for E. urophylla in the area.
In order to investigate these factors, we
established a RW25 nutrient omission study.
Trial Objectives
1. To determine nutrients limiting E. urophylla
growth at establishment.
2. To model the biological and economical
response of E. urophylla to fertilization at
establishment to better define operational
fertilization strategies.
Treatments and Experimental Design
The study was planted in August 2014 with
seedlings. Spacing was 3.5 x 2.6 m (1098 trees
ha-1). Treatments were a series of nutrient
applications where no nutrients were added,
all nutrients (nitrogen, phosphorus, potassium,
calcium, magnesium zinc and copper) were
added and then one or two nutrients were
omitted from the mix in the remaining
treatments (Table 1). A proprietary
operational fertilizer treatment was also
included in the study. The experimental
design is a randomized complete block, with
35 trees per plot and 3 blocks.
Fertilizers were applied in four holes around
each plant. This report presents analyses of 4
years after planting (April-May 2018).
Results
Survival and Damage
Survival ranged from 59% to 82% (Figure 1). The
greatest survival rate was found in magnesium
omission treatment with 82% survival. The lowest
survival was found in Ca omission treatment
(59%). Other studies in the region, such as RW26,
also show low survival, which is why the high
mortality is attributed to other causes and not to
the treatments evaluated.
Percentage of damage was higher in
operational conditions (77%) and Ca (58%)
Figure 1. Survival for the RW25 trial in Colombia, 4 years
after establishment.
Table 1. Treatment description for the RW25 trial.

36
omission treatment. Overall, typical damage
types were unusable for wood and supressed
trees.
Growth
After 4 years, the treatments which included
phosphorus significantly increased diameter at
breast height (DBH), total height and volume
growth at the site (Figure 3). Mean DBH, total
height and volume ranged from 6.1 to 10.2 cm,
7 to 11.6 m and 10803 to 45680 cm3 tree-1,
respectively (Figure 3). Clearly, phosphorus is the
limiting element at these sites and its application
is necessary at establishment in these soils.
Additions of K and B will promote higher growth
rates with nitrogen fertilization.
Future Directions
This trial was designed to be evaluated for 3
years, so it is already finishing its study.
Acknowledgements
This project is supported by CAMPO FORESTAL
S.A., Cambium and FPC.
Figure 3. Mean diameter at breast height (DBH) (top
panel), total height (middle panel) and volume (bottom
panel) by treatments, 4 years after establishment. Bars
show the standard error.
Figure 2. Damage for the RW25 trial in Colombia, 4 years
after establishment. Damage codes are A: no
damage, B: suppressed trees, UN: unusable for wood
and Y: unspecified damage.

37
Regionwide 25: Nutrient Omission at the Establishment and Early
Development of Eucalyptus grandis in Colombia
Study Objectives 1. To determine the limiting nutrients for
establishment of E. grandis plantations.
2. To evaluate the clonal response of omission
of one or more nutrients at establishment of
each site.
3. To model the biological and economical
response of E. grandis clones to the omission
of site specific nutrients and to determine
operational strategies
4. To update site-specific cooperators models
use to prescribe fertilization of new planted
clonal materials.
Treatments and Experimental Design Three studies were established by SmurfitKappa
Carton de Colombia. Trials were located at
three representative and contrasting soil
conditions of the south, central and north areas
of the Cauca Valley in Colombia, which are
extensively planted with E. grandis. Trials were
established in 2012 considering a spacing of 3x3
m . The north site has 3.900 mm, the central site
1.550 mm and the southern site 2558 mm of
rainfall (Figure 1).
The experimental design consisted of a pseudo
latin square considering genotypes and omission
fertilization treatments with true replicates as
sites. Therefore fertilization omission treatments
were randomly assigned to each genotype
being evaluated. Nutrition omission treatments
considered no fertilization (Control), no P (-P),
no K (-K), no N (-N), no micronutrients (No
Micros), no Ca & Mg (-Ca&Mg), and all
nutrients applied (Full Fert. Five genotypes
(clones and seed) were selected to be
evaluated across sites. All plantations had
excellent pre-planting and post-planting full
weed control applied during the first 6 months
since establishment.
Annual measurements consider total height,
DBH and mortality and soil and foliage nutrient
analyses. Soil chemical properties will be
sampled annually to adjust soil indicators that
may be used as predictors of potential response
to applied nutrients. Environmental
measurements will include temperature, rainfall,
relative humidity, vapour pressure deficit and
photosynthetically active radiation from local
weather stations and periodical sensor
measurements as available.
Preliminary Results Analysis of after 24 months since establishment
showed a significant effect of P omission across
sites (Figure 3)but also a strong site by fertilization
treatment effect interaction (p<0.05).
Phosphorus was the most limiting nutrient in all
the sites (Figure 3), and its effect on growth was
Figure 1. Location of RW25 trials in Colombia
Figure 2. Response at 24 months for no fertilized with P
(left) and P fertilized plots (right) at RW254601.

38
evident from 6 months until canopy closure at 18
months (Figure 2).
Evaluated sites did not show any other
deficiency of any other macro– or micro
nutrients except for P. However some nutrient
omissions affected maximum potential growth
at each site (Figure 4). At the site 254603, N was
the second largest nutrient limitation. Because
of the greater productivity of this site, it may
present any other nutrient limitation later in the
rotation, which must be assessed. Omission of K
and micro elements had minor effects on
maximum productivity, however a negative or
null effect of Calcium addition on the fertilizer at
establishment was observed across sites (Figure
4). The negative effect of Ca added on fertilizers
mix at establishment of these highly productive
sites suggest that a negative effect on K or
microelements availability may be produced by
large additions of limestone applied
operationally.
All treatments considering omission of Ca and
Mg obtained the largest responses across sites.
There were significant differences in basal area
among genotypes (p<0.05, Figure 5). The three
best genotypes doubled the basal area of the
genotypes having the lower productivity (data
not shown). There were no interaction among
the genotypes neither with the sites conditions
nor with the fertilization treatments, which
suggest a strong effect of P omission and the
major need and focus of P operational
additions at establishment of plantations at
these sites.
Future Direction Stands will be monitored until rotation age
given the short rotation period (7 years) at
these sites in order to understand the value of
fertilization . New trials are underway to assess
the most efficient P rate for operational
purposes.
Figure 3. Mean height by omission treatment across sites
and genotypes. Means comparisons are indicate by
the same letter .
Figure 4. Mean height by site and omission treatments.
Means comparisons are indicate by the same letter .
Figure 5. Clonal response to nutrient omission
treatment at RW254601. Upper graph: Volume
response of best genotype (GA) vs worst genotype
(GB) showing intereaction effects.

39
Regionwide 25: Eucalyptus Nutrient Omission Study in Southeast United
States
Justification Fast-growing Eucalyptus plantations require
large quantities of nutrients to maintain high leaf
area to achieve their growth potential. The
amount of N and P taken up by Eucalyptus is
proportional to their growth rate. For example, in
Brazil, Eucalyptus grandis stands growing at 9 t/
ha/yr accumulated around 40 kg/ha/yr of N and
3 kg/ha/yr of P while stands growing at 30 t/ha/
yr accumulated around 60 kg/ha/yr of N and 4
kg/ha/yr P (Santana et al. 2000). Over a typical
7-year rotation the slower growing stands would
need around 210 kg/ha of N and 14 kg/ha P
while the faster growing stands would require
420 kg/ha N and 35 kg/ha P. Stape and
coworkers (2004) found similar trends in
Eucalyptus grandsis x urophylla hybrids in Brazil
where N uptake ranged from around 25 kg/ha/
yr in stands growing at 10 t/ha/yr to around 100
kg/ha/yr in stands growing at 40 t/ha/yr/.
Soil fertility and the need for fertilization varies
depending on soil physical and chemical
properties, parent material and geology, and
past land use history. Inherently infertile soils will
required fertilization at an earlier age and at
high rates than more fertile sites. Site specific
fertilization regimes are therefore needed to
effectively provide the nutrients needed by
Eucalyptus stands to achieve desirable growth
rates.
Nutrient Omission Design The RW25 Nutrient Omission Study was designed
to determine which nutrients limit productivity of
Eucalyptus stands so that site specific fertilization
regimes can be developed. The treatments
applied (Table 1) include a control plot without
fertilization to determine the native fertility of
each site and a complete treatment where all
essential nutrients are added to determine the
potential growth rate when no nutrients are
limiting. In other plots, one or more nutrients
were removed from the complete treatment to
determine the impact of that nutrient on growth.
Nutrients in the complete treatment were added
according to the following schedule:
Installations This report summarizes the results from two
installations of the RW25 study in Louisiana
(Merryville, LA: and Lake Charles, LA;) planted
with Eucalyptus benthamii (Figure 1). The plots
were measured at 2.3 years.
Table 1. Fertilizer treatments Used in the RW25 Nutrient
Omission Study.
Stand Age Fertilizer Rate
Pre-plant Lime 1784 lb/ac
Plant TSP 178 lb/ac
3 Month CNI Micronutrient 89 lb/ac
3 Month Ammonium Sulfate 134 lb/ac
3 Month Potassium Chloride 67 lb/ac
10-12 Month TSP 45 lb/ac
10-12 Month Ammonium Sulfate 223 lb/ac
10-12 Month Potassium Chloride 89 lb/ac
22-24 Month TSP 45 lb/ac
22-24 Month Ammonium Sulfate 223 lb/ac
22-24 Month Potassium Chloride 89 lb/ac

40
Results At both sites in Louisiana, the fertilization effect
was very clear (Figure 1), pointing to the need of
appropriate fertilization regimes for Eucalyptus
fully express its growth potential in soils with very
low fertility.
Figure 2 shows the impact of omitting specific
nutrients on the growth of E. benthamii. At both
sites, the omission of N had the greatest impact
on growth, highlighting the low inherent N
availability in these soils. The site in Merryville also
appears to be P limited while there was no
impact of P omission at the site in Lake Charles.
The site in Lake Charles was established on an
old rice field and likely received significant P
fertilizer applications in the past. The site in
Merryville is a cutover forest site that likely was
never fertilized in the past. It is also located on
the Lessie Terrace, which is known to be P
deficient. The impact of Ca omission was
relatively small at both locations. The omission of
other nutrients including K, and micronutrients
had no impact on growth. These results
indicate that the primary nutrient limitations on
these sites are N and P. It was also interesting to
note the relative productivity of the two sites. The
growth in the complete treatment at Lake
Charles was approximately twice the growth in
that treatment at Merryville. This is probably a
combination of the more favorable climate and
past fertilization history at Lake Charles. It also
suggests that higher rates of fertilizer may be
needed at the Merryville site to supply the
nutrients needed by Eucalyptus benthamii to
reach its growth potential.
Literature Cited Santana, R.C., N.F. Barros, and N.B. Comerford. 2000.
Above-ground biomass, nutrient content, and
nutrient use efficiency of Eucalyptus plantations
growing on different sites in Brazil. N.Z. J. For. Sci.
30(1/2):225-236.
Stape, J.L., D. Binkley, and M.G. Ryan. 2004.
Eucalyptus production and the supply, use ad
efficiency of use of water, light and nitrogen
across a geographic gradient in Brazil For. Ecol.
Manage. 193:17-31.
Figure 2. Impact of fertilization on growth of E. benthamii.
Control (L) vs Complete fertilization (R).
MW
V –
RW
25
-M
erry
ville
TX
Figure 3. Impact of fertilization on stem biomass after 2.3
years of E. benthamii in Lake Charles, LA (top) and
Merryville, LA (bottom).
Figure 1. Study layout for RW25 at Merryville, LA.

41
Regionwide 25: Eucalyptus Nutrient Omission Study in Northern Brazil
J. Stape, C. Alvares, R. Carneiro, T. Fox, R. Rubilar
Justification Fast-growing Eucalyptus plantations demands
adequate levels of soluble nutrients in the soil
solution to be uptake in order to build a large
and healthy canopy.
The faster the canopy is built, the earlier the
canopy closure is reached, which facilitates the
competing vegetation control and increases the
likelihood of a higher Mean Annual Increment at
the end of a short-rotation.
Traditional regions of Eucalyptus plantations in
Brazil, like São Paulo and Minas Gerais states,
already have a calibrated fertilization
recommendation protocols based on soil
analysis and Eucalyptus species expected
productivity. However, when new Eucalyptus
clones are planted in new sites, with specific soil
physical and chemical attributes, these
protocols need to be verified.
Many companies are expanding their
Eucalyptus plantations with new species/clones
in new sites which requires a better
understanding regarding soil nutrient availability
versus plant nutrient demand in regions like
Tocantins State in Northern Brazil.
The Nutrient Omission design was therefore
proposed by FPC as an easy and quick way to
capture four main information at the species-site
level: i) Is there a nutrient limitation for quick
canopy closure?; ii) If so, which nutrients are
limiting the full species development ?; iii)
Among these nutrients, what is the ranking in
importance when considering their supply via
fertilization?; and iv) Can soil or tissue analysis be
used for fertilizer recommendation?
Nutrient Omission Design The Nutrient Omission design has a very simple
rational. It has a Control treatment to infer about
the soil natural nutrient availability, a Complete
treatment with the application of all nutrients for
adequate tree growth, and treatments where
each nutrient is removed from the complete
balance to characterize its importance in
growth (Table 1).
Installations The Nutrient Omission Design was installed
(January 2011) in a Yellow Oxisol in Brejinho de
Nazaré, Tocantins State (Brazil), on site of Valor
Florestal Company. The genotypes being studies
are four hybrid clones of Eucalyptus grandis x
urophylla.
Measurements Growth is evaluated every six months via DBH
and height measurements, and LAI estimation.
At 3-years old an aboveground biomass
assessment was performed in the control and
complete treatments.
Table 1. Nutrient Omission trial treatments.
Figure 1. E. urograndis in Tocantins-Brazil, at 2.5 year-old.
Left complete treatment (A) and right control treatment
(C).

42
Results Figure 2 presents stem biomass at 4 years-old. For
the sandy and poor soil of this trial (Yellow Oxisol,
subsoiling site prep), the trial, at just 1 year-old,
already shows the crucial need of fertilizers to
promote forest and growth.
The most limiting nutrients are the micronutrients,
followed to K (Figures 2), clearly showing the
need to incorporate them on the initial
fertilization of the forest to guarantee fast
canopy closure and high growth rates.
In addition, the trial was kept free of weed
competition, pointing that in an operational
scale the fertilization will facilitate the weed
control due to the lower light environment below
the Eucalyptus canopy.
Eucalyptus plantations on soils of low fertility of
the Tocantins State depend on fertilization to
reach their potential growth. The micronutrients
omission revealed to be as limiting as the control
treatment (no fertilization).
The content of boron foliar seems to be the most
important indicator, because it showed a
positive correlation with the stem volume across
all treatments (Figure 3).
With the results shown on Figure 2 and 3, a new
experiment was installed with the omission of
micronutrients, in order to figure out which
elements are most limiting to forest growth in
that region. In this experiment was installed with
the two better clones of the first experiment plus
three other urophylla x grandis clones. In the
table 2 shows the clones were planted and the
treatments were applied together with the
results in volume with 1 year old.
Figure 4 shows the difference between the
control treatment and complete at 6 months
and 1 year in the RW25 micronutrient omission
trial.
Boro (mg Kg-1)
0 20 40 60
VO
L (
m3 h
a-1
)
0
20
40
60
80
100
120
140
160
180
y = 2,39998x - 13,352
R2 = 0,4989
C A N P K Ca M
Bio
ma
ss (
Mg
ha
-1)
0
20
40
60
80
100A217
AEC1528
2361
A211
Figure 2. Stem biomass for each block/clones of
E.urophylla x E. grandis at 4 yr-old at Brejinho de Nazaré,
Northen Brazil, according to the omission treatment
(Table 1).
Vol (m3 ha-1)
AEC1528 26.6
A217 32.5
1407 26.3
AEC144 26.9
VE10 30.8
Control 22.1
All nutrients 31.3
Boron omission 31.0
Copper omission 29.5
Zinc omission 29.9
Sulfur omission 26.6
Micro omission 29.9
Clo
nes
Trea
tmen
ts
Figure 3. Relationship between boron foliar and stem
volume for all 28 plots in 2014.
Table 2. Clones, treatment and volume (1 year) of the RW25
micronutrients installed at Tocantins State Brazil.
Figure 4. Control (left) and complete (right) treatment
with 6 months (above) and Control (left) and complete
(right) treatment with 1 year old (below).

43
Regionwide 25: Omission of Nutritional Elements Effects on the Growth of
Young Plantations of Eucalyptus nitens in the South-central Chile
M. Yaya M., R. Rubilar P. and M. Monsalvez J.
Objectives 1. To determine the feasibility of maintaining high
leaf area levels and maximum growth rates in
young Eucalyptus plantations into half or full
rotation stages.
2. To evaluated the importance of macro and
micronutrients on the potential response to N
and P additions across major contrasting soils
and climatic conditions at high nutrient loading
rates.
3. To evaluated leaf area, growth efficiency and
foliar nutrient levels for high rates of N and P
fertilization under a gradient of nutrient
omission at different soil-site conditions.
Methods Study area: Three sites were established for
Eualyptus nitens (RW25) trials in the VIII region of
Chile. Sites mean annual temperature average 13
-17 °C, rain fall range 1000-1400 mm per year and
soils are considered recent volcanic ashes, marine
sediments and red clay old volcanic ashes( Table
1.)
Trial design: The experimental design consisted of
a completed randomized block design with three
replicates. Treatments considered omission of
some nutrients, with low (once a year) and high
(twice a year, autumn & spring) nutrient loading
frequencies focused on extreme additions that
may avoid any potential nutrient limitation at each
site. The whole study considered a total of 18
treatment (Table 2).
Currently there have been 4 applications of
fertilizer treatments in trials 255401 and 255402
which were established in 2011 in 1-year-old
plantations. The trial 254901 was installed in 2012 in
a 4-years-old plantation and treatments have
been applied 3 times.
.Table 1. Main characteristics of the study sites.
Site Las
Millogue Las
Bandurrias Maicas
Code 255401 255402 254901
City San Carlos Lebu Mulchen
Latitude 36ª26’22.88” 37ª33’14.08” 37o49’69.02”
Longitude 71ª41’07.38” 73ª37’08.95” 72º17’96.03”
m.a.t. (ªC) 14 13 17
m.a.p.
(mm.year-1) 1034 1302 1380
Soil Recent ash
volcanic
Sediment
marines
ancient volca-
nic ash
Results After the first 3 years of trials installation, the
cumulative volume in recent volcanic ash was
higher than the other sites. After the first
fertilization treatment in 2011, the sites 255401 and
255402 showed no differences in the cumulated
volume until month 33, afterwards the differences
between the two sites increased (62 m3ha-1 at the
end of the measurement period in January 2014).
Table 2. RW25 treatments

44
Figure 1. Cumulative volume reached between 12 to 47
months of 255401 and 255402 and stands between 55 to
73 months in 254901. Red line: 255401, Blue Line: 255402
& Green Line 254901.
Figure 2. Leaf area index for control and full fertilization
between February 2012 and January 2014. Red line:
255401, Blue Line: 255402 & Green Line 254901.
Figure 3. Relationship between leaf area index (LAI m2m
-2) and increased cumulative volume for the control
and full fertilization treatments between 2012 and 2014.
Red line: 255401, Blue Line: 255402 & Green Line
254901.
Figure 4. Growth efficiency (m3ha-1 / m2m-2) for
treatments control and full fertilization. Red line: 255401,
Blue Line: 255402 & Green Line 254901.
This indicates a better response to fertilization in
the volcanic ash site. In ancient volcanic ash, at
the end of the measurement period (month 73),
the stand reached 144 m3ha-1 (Figure 1).
In the trial 255401, the peak of leaf area index was
reached at the age of 39 months, with 8.3 units. In
the trial 255402 the highest LAI was 6.2 at month
36. The trial 254901 peak LAI at age 60 months,
and reached 7.4 units (Figure 2.)
In the trial 255401 the growth rate achieved by
the contrast treatments was over 10 m3ha-1 per
unit of LAI. At the trial 255402, the fertilized
treatment produced 1.3 m3ha-1 more than the
control treatment. The growth rates at the trial
254901 was 6.22 m3ha-1 in the fertilized and 5.68
m3ha-1 in the control (Figure 3).
The maximum growth efficiency was achieved
on month 33 at the trial 255401 (13 m3ha-1), on
Future Direction Identify environmental and nutritional variables
that explain the growth and leaf area index
response by different nutrient loads to establish
levels of efficiency in the use of resources.
month 43 at the trial 255402 (4 m3ha-1) and on
month 66 at the trial 254901 (6.7 m3ha-1) (Figure
4).
These results indicate that fertilization produces an
increase in leaf area index, and extend the period
the tree keep te foliage, which is reflected in the
volume reached by the plantation.
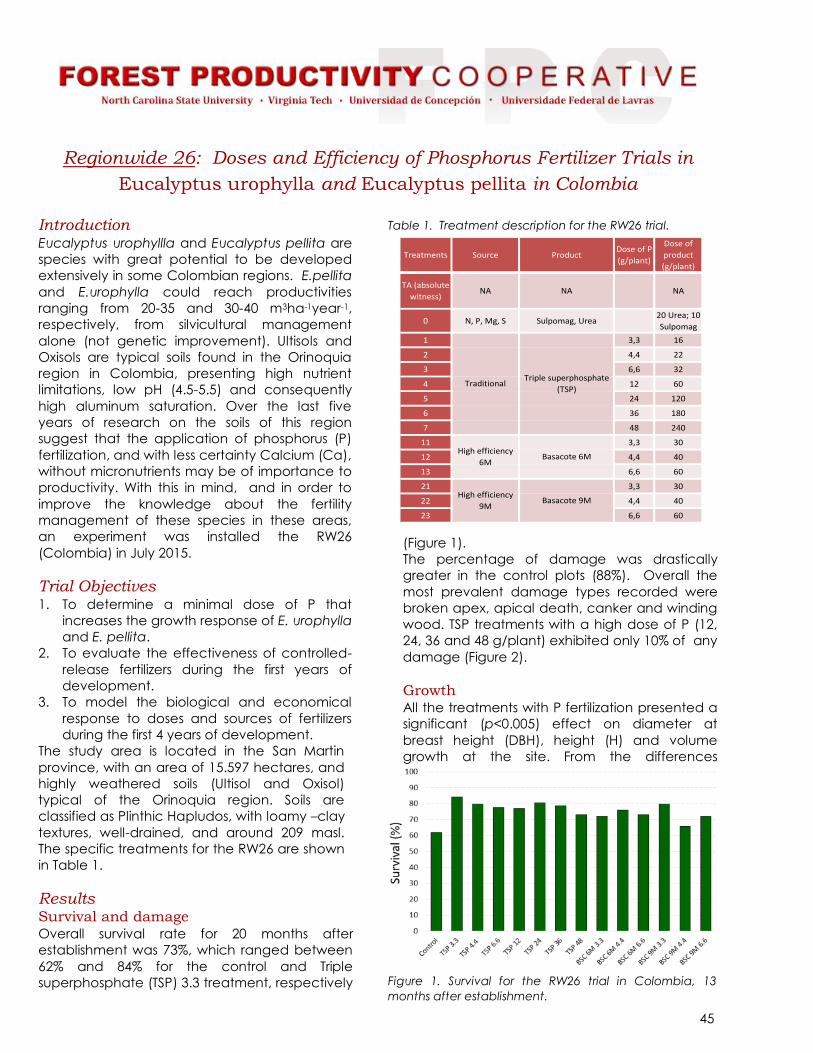
45
Regionwide 26: Doses and Efficiency of Phosphorus Fertilizer Trials in
Eucalyptus urophylla and Eucalyptus pellita in Colombia
Introduction
Eucalyptus urophyllla and Eucalyptus pellita are
species with great potential to be developed
extensively in some Colombian regions. E.pellita
and E.urophylla could reach productivities
ranging from 20-35 and 30-40 m3ha-1year-1,
respectively, from silvicultural management
alone (not genetic improvement). Ultisols and
Oxisols are typical soils found in the Orinoquia
region in Colombia, presenting high nutrient
limitations, low pH (4.5-5.5) and consequently
high aluminum saturation. Over the last five
years of research on the soils of this region
suggest that the application of phosphorus (P)
fertilization, and with less certainty Calcium (Ca),
without micronutrients may be of importance to
productivity. With this in mind, and in order to
improve the knowledge about the fertility
management of these species in these areas,
an experiment was installed the RW26
(Colombia) in July 2015.
Trial Objectives
1. To determine a minimal dose of P that
increases the growth response of E. urophylla
and E. pellita.
2. To evaluate the effectiveness of controlled-
release fertilizers during the first years of
development.
3. To model the biological and economical
response to doses and sources of fertilizers
during the first 4 years of development.
The study area is located in the San Martin
province, with an area of 15.597 hectares, and
highly weathered soils (Ultisol and Oxisol)
typical of the Orinoquia region. Soils are
classified as Plinthic Hapludos, with loamy –clay
textures, well-drained, and around 209 masl.
The specific treatments for the RW26 are shown
in Table 1.
Results Survival and damage Overall survival rate for 20 months after
establishment was 73%, which ranged between
62% and 84% for the control and Triple
superphosphate (TSP) 3.3 treatment, respectively
(Figure 1).
The percentage of damage was drastically
greater in the control plots (88%). Overall the
most prevalent damage types recorded were
broken apex, apical death, canker and winding
wood. TSP treatments with a high dose of P (12,
24, 36 and 48 g/plant) exhibited only 10% of any
damage (Figure 2).
Growth All the treatments with P fertilization presented a
significant (p<0.005) effect on diameter at
breast height (DBH), height (H) and volume
growth at the site. From the differences
Table 1. Treatment description for the RW26 trial.
Treatments Source ProductDose of P
(g/plant)
Dose of
product
(g/plant)
TA (absolute
witness)NA NA NA
0 N, P, Mg, S Sulpomag, Urea20 Urea; 10
Sulpomag
1 3,3 16
2 4,4 22
3 6,6 32
4 12 60
5 24 120
6 36 180
7 48 240
11 3,3 30
12 4,4 40
13 6,6 60
21 3,3 30
22 4,4 40
23 6,6 60
TraditionalTriple superphosphate
(TSP)
High efficiency
6MBasacote 6M
High efficiency
9MBasacote 9M
Figure 1. Survival for the RW26 trial in Colombia, 13
months after establishment.

46
observed, with respect to control treatment, we
can infer that that P is a necessary element in
this area. The higher DBH was found for TSP with
a high dose (48, 36 and 24 g/plant) in an
average of 6.4 cm. There were no significant
differences in respect to Basacote (BSC) 6M
and BSC 9M with 6.6 g/plant (Figure 3).
The higher total stem volume was found for TSP
with a high dose (36, 48 and 24 g/plant)(see
Figure 4). For example where the TSP 24
reached 7728 cm3/tree. This is an increase of
3216% in comparison to control treatment, and
is illustrated in Figure 5.
The TSP 24 treatment method outlined here
represents the high survival rate, lowest
damage and the best performance in growth,
which would seem to offer a better
economical option. These results suggests that
operational P fertilization must be a norm in
these soils, with a base dose of ~120 g/plant TSP
to obtain the desired responses.
Future Direction Growth measurements will be carried out
annually for monitoring purposes. Nutrient
content and soil chemical properties will be
sampled annually to adjust soil indicators that
may be used as predictors of potential response
to applied nutrients analysis and modeling the
biological and economical response to
fertilization.
Acknowledgements This project is supported by CAMPO FORESTAL
S.A. and the company COMPO and FPC.
Figure 2. Damage for the RW26 trial in Colombia, at 20
months after establishment. Damage codes are A: no
damage, U: winding wood, Y: unspecified damage and
OPT: broken apex, apical death, canker.
Figure 3 Mean diameter at breast height (DBH) by
treatment, at 20 months after establishment. The bars
show the standard deviation.
Figure 4. Mean volume by treatment, at 20 months
after establishment. The bars show the standard
deviation.
Figure 5. Control (A) and (B) TSP 24 growth, at 20
months after establishment
A B

47
*Regionwide 26: Doses and Efficiency of Phosphorus Fertilizer Trials in
Eucalyptus urograndis in Colombia
Introduction
Eucalyptus urograndis have potential for
improved management in some areas of
Colombia. Recent research on E. urograndis has
been completed in the Orinoquia region in
Colombia. This area typically has Ultisol and
Oxisol soils with low nutrient availability, low pH
(4.5-5.5) and, consequently, high aluminum
saturation. However, positive responses to
phosphorus fertilization have been found.
Additional information is required about other
nutrients like calcium and micronutrients to
better refine fertility management for these
species in the area. To gain this information, we
established the Region Wide 26 (RW26)
phosphorus dose and efficiency of uptake study.
Study Objectives
The current project will evaluate the viability of
establishing E. urograndisin in low quality soil sites
in the Orinoquia region of Colombia. The
application of fertilizer will be evaluated as a
means of offsetting this limitation. The specific
objectives were:
To determine a minimal dose of Phosphorus (P)
that causes a positive growth response;
To evaluate the effectiveness of controlled-
release fertilizers during a sites initial
development;
To model the biological and economical
response to fertilizer doses and sources
during the first four years of development.
Treatments and Experimental Design
The RW26 site was installed during July 2015,
located in the San Martin province, Orinoquia,
Colombia. The site is 15.6 hectares in size, and
has highly weathered soils (Ultisol and Oxisol).
Soils are classified as Plinthic Hapludos, with
loamy clay textures, well-drained, and around
209 mean altitude above sea level. The soil types
Ultisols and Oxisols are in high abundance at this
location, which have significant nutrient
limitations, low pH (4.5-5.5) and a high aluminum
saturation.
The experimental design is a randomized
complete block, with 100 trees per plot, with 14
treatments and 3 blocks (42 plots). Spacing was
3.5 x 2.6 m (1098 trees ha-1).
Fertilizes and various combinations were applied
overt the course of four years. The effects were
quantified in terms of annual field measurements
(were measured all stems per plot) and
analyzed using linear regression. The specific
treatments for the RW26 site are shown in Table
1.
Field measurements consisted of individual tree
height (H), diameter at breast height (DBH),
visual damage assessment and mortality. Tree
volume was estimated from H and DBH using the
equation for the volume of a cone.
Results
The survival rate for after 46 months is shown in
Figure 1, and on average was 66%. The
individual treatment values ranged between
51.2% for the control and 74.1% for SFT-3,3 and
SFT-36 treatments.
Statistical analysis of the growth, in terms of DBH,
H, and volume for all treatments to apply P were
Table 1. Treatment description for the RW26 trial.

48
all significant (p<0.05), and exhibited larger
growth when compared to the control (Figures 2
-4).
The largest response in DBH was observed at SFT-
48 and SFT-24(dose: 48 and 24 gr plant-1), with 7.4
and 7.3 cm respectively (Figure 2). Similarly, the
largest response in total height was found for the
treatments which applied SFT-24 and SFT-48
(dose: 24 and 48 g plant-1) with 7.6 and 7.7 m
respectively (Figure 3). And again the largest
volume per tree was observed in treatments of
SFT-24 and SFT-48 (13006.3 and 12669.4 cm3 tree-1
respectively). The best response corresponds to
increase of 1290% in comparison to control
treatment.
Conclusions and Future Direction
From the results presented here, SFT-24 and SFT-
48 treatments applied shows the highest survival
rate and the best performance in growth. This
suggests that the application of phosphorus (P)
fertilization without micronutrients may be of
importance to productivity. This treatment type
may also provide a better economical option,
and is worthy of future research.
Figure 1. Survival for the RW26 trial in Colombia, 46
months after establishment. The bars show the stand-
ard error. Same letter, the difference is not statistically
significant.
Figure 2. Mean diameter at breast height (DBH) by
treatment, at 46 months after establishment. The bars
show the standard error. Same letter, the difference is
not statistically significant.
Figure 3. Mean height (H) by treatment, at 46 months
after establishment. The bars show the standard error.
Same letter, the difference is not statistically significant.
Figure 4. Mean volume per tree by treatment, at 46
months after establishment. The bars show the standard
error. Same letter, the difference is not statistically signif-
icant.

49
Regionwide 27 : Deep Positioning of Fertilizers on Fast Growing
Plantations Under Intensive Management
Introduction
Fertilizer responses have been reported
extensively within the forest research literature.
These responses vary enormously among
species and sites. Moreover, there is little
understanding about how to optimize the
nutrient capture efficiency of the trees. With this
in mind, the use of controlled-release fertilizers
is becoming more common in plantation
forestry. These have the advantages of
increasing the nutrient capture and reducing
losses. An alternative approach to increase the
nutrient uptake may be to optimize the
positioning of the fertilizer in soil depth.
Study Objectives
This study aims to assess growth responses in fast
-growing plantations to the specific positioning
of the fertilizer materials relative to the root
system. The specific objectives are:
1) To assess the responses in survival, growth,
and stand uniformity to the addition of
controlled-release fertilizers in contact with
the root system versus fast-release fertilizers;
2) To assess the positioning of fertilizers at
different depths and their interaction with
the water availability;
3) To assess the interaction of controlled-
release fertilizers used in contact with the
root system with traditional fertilization
methods/materials.
Treatments and Experimental Design
The experimental design is a randomized
complete block design, with 3 replicates. The
treatment plots have 49 trees each and the
measurement plots each contain 25 trees. The
treatments consider the testing alone or in a
combination of:
A)a controlled-release fertilizer which was
applied in contact with the root system or at
a specific depth;
B)A blended fast-release fertilizer was applied
superficially and between 50-60 cm in
depth.
The experiment was established in August 2014
at two sites: Nacimiento (planted with
Eucalyptus nitens) with granitic soil and Mulchen
(planted with Eucalyptus nitensxglobulus) with
red clay soils. Both are located in the South-
central valley of Chile. The stands were planted
with a 3×2 m spacing. A total of 10 fertilization
treatments were tested at each site (Table 1).
LC1 (superficial) and LC2 (in depth) are two
controlled-release fertilizers, whereas LR1
(superficial) and LR2 (in depth) are two fast-
release fertilizers. Depending on the type of
fertilizer, these were applied in contact with the
root, superficially or at 50-60 cm in depth.
Where:
•LC1: 30g plant-1 (Basacote 12M)
•LC2: 80 g plant-1 (Basacote 12M)
•LR1 and LR2: 300 gr DAP + 50 gr SKMg
Table 1. Description of the fertilization treatments.
Treatment
codeFertilizer
Positioning of the
fertilizer
000 Control *
001 LC1 Root contact
002 LC2 50-60 cm depth
003 LC1+LC2LC1 root contact
+LC2 50-60 cm depth
010 LR1 Superficial
020 LR2 50-60 cm depth
030 LR1+LR2LR1 Superficial
+LR2 50-60 cm depth
011 LC1+LR1LC1 root contact
+LC1 Superficial
021 LC1+LR2LC1 root contact
+LR1 superficial
013 LC1+LR1+LC2
LC1 root contact
+LR1 superficial
+LC2 50-60 cm depth

50
Preliminary Results
Overall, the growth was higher for all variables
on granitic soil. At 48 months, there were
differences for the diameter at breast height
(DBH), tree height (HT), and volume growth
among treatments in granitic soil (p<0.05), with
the best response in cumulative volume mean
of 87.5 m3 ha-1 for LC1+LR2 treatment,
representing an increase of 28% compared to
the control treatment (68.4 m3 ha-1)
While on red clay soil were differences for
Diameter at breast height (DBH), tree height
(HT) and volume growth among treatments in
granitic soil (p<0.05), with the best response in
cumulative volume mean of 64.9 m3 ha-1 for
LC1+LC2 treatment, representing an increase
of 99% compared to the control treatment (32.6
m3 ha-1).
The contrast shows that the application of
some fertilizer compared to none had a
greater effect to all variables in both sites. Fast-
release fertilizers had a greater effect to all
variables compared with the slow-release
fertilizers in granitic soil. However, on red clay
soil, there were only small (if any) differences
(Table 2).
The positioning (superficial or in depth) does not
appear to effect growth at this age in granitic
soil. This is in contrast to all variables in red clay
soil, however.
Future Direction
Analysis of the root systems distribution will be
accomplished in the future through use of pit
excavations and extraction of soil cores.
Monitoring the soil moisture at different depth
to evaluate the fertilizer by water availability as
well as the interaction among the types of
fertilizers will be implemented. Growth
responses will be measured annually.
Acknowledgements
This project is supported in part by Forestal
Mininco.
Table 2. Contrast analysis for different treatments
combination on granitic and red clay soil. Slow-release
fertilizers (trt: 001, 002, 003), and fast-release fertilizers
(trt: 010, 020, 030).
Figure 1. Cumulative volume mean per treatment on
granitic soil at 48 months of establishment.
Figure 2. Cumulative volume mean per treatment on
red clay soil at 48 months of establishment.

51

52
Special Projects — Eucalyptus

53
Economic Assessment of Eucalyptus globulus Short Rotation Energy Crops
Under Contrasting Silvicultural Intensities on Marginal Agricultural Land
E. Acuña, R.A. Rubilar, J. Cancino, T.J. Albaugh, C.A. Maier
Background and Study Objectives
Chile depends on imported fossil fuels for
energy production. This dependence
combined with increasing demand driven by
economic development resulted in a change in
energy policy in 2010. The law requires
electrical companies with a capacity of more
than 200MW to increase their use of non-
conventional renewable energy sources to 10%
by 2024. Consequently, biomass and bioenergy
crops will likely play a role in meeting this
requirement. Short-rotation woody crops are
typically grown on poor quality soils because
better sites are used for food production.
Additionally, short-rotation woody crops may be
used to sequester carbon and reduce emissions.
The combination of these factors may lead to
the use of government incentives including
subsidies to increase the amount of short–
rotation woody crop plantations. For these
systems to be a viable economic option, a
better understanding of their profitability is
needed. This study analyzes the key variables
that affect economic sustainability of
Eucalyptus globulus as a short–rotation woody
crop for energy production purposes across a
range of silviculture and site
productivity.
Treatments and Experimental
Design
Four sites with a range in native
productivity (high, medium and
low) in south-central Chile where E.
globulus plantations were
established at four densities (5000,
7500, 10000 and 15000 tree ha-1)
and treated with irrigation or with
ambient rainfall. Parcelas Collipulli
(high fertility, non-irrigated, HN)
(38.1238°S, 72.1053°W), Santa
Leonor (medium fertility, non-
irrigated, MN) (36°42′14″ S; 72°16′35″
W), Santa Rosa (low fertility, non-
irrigated, LN) (37°03′33″S; 72°11′12″
W) and Carlos Douglas (low fertility,
irrigated, LI)(37.1335°S, 72.4685°W). Fertilizer and
chemical weed control were applied after
planting. Deterministic and stochastic
economic assessments were completed with
and without subsidies using discounted cash
flow analysis. These models covered the entire
Figure 2. Discounted costs and revenues by subsidy for the high fertility,
ambient rainfall, 5000 trees ha-1 site. This site had the highest net present
value in the deterministic analysis and was used in the stochastic analysis.
Discounted costs and revenues (USD ha-1
)
-1500 -1000 -500 0 500 1000 1500
Administration
Site preparation residues
Subsoiling
Chemical weed control
Fertilization
Manual planting
Seedlings acquisition
Density 5,000
Establishment subsidy
Fence subsidy
Subsoiling subsidy
Figure 1. Aboveground biomass for 6 years after plant-
ing for high (H), medium (M) and low (L) fertility sites
with irrigation (I) or ambient rainfall (N) at 5000 (5K),
7500 (7.5K), 10000 (10K), and 15000 (15K) trees ha-1.
Year
1 2 3 4 5 6
Ab
ov
eg
rou
nd
bio
ma
ss
(M
g h
a-1
)
0
20
40
60
80
100
120
LI5K
LI10KHN5KHN15K
LN5KMN15K
LN7.5KLN15K

54
rotation from establishment to sale with 18 and
20 year lifespans and 2 to 6 year harvesting
cycles. The transition from one harvesting cycle
to the next was through coppicing. A total of
$1385 ha-1 was provided for seedling acquisition,
soil preparation and fence
preparation for all treatments. The
deterministic assessment identified
the treatment with the highest net
present value and this treatment
was examined in a Monte Carlo
simulation where productivity,
prices, production costs, harvesting
costs, the discount rate and the
conversion factor were
incorporated to estimate dry mass
from green weight were varied in
1500 iterations.
Results and Discussion
Biomass production was generally
improved with better site fertility
(high>medium>low), a greater
number of stems (15000>5000), and
irrigation (Figure 1). All treatments
without subsidies showed a
negative net present value. The
treatment with the highest net present value
without a subsidy was the high fertility non-
irrigated site with 5000 trees ha-1 (Figure 2).
However, with a subsidy, the high fertility, non-
irrigated 5000 trees ha-1 treatment achieved a
positive cumulative discounted cash flow at
year 5 with the first harvest (Figure 3). In the
stochastic analysis, the mean net present value
without a subsidy was $117 ha-1 and with a
subsidy $1412 ha-1 (Figure 4). The factors with
the greatest influence on the net present value
in the Monte Carlo simulations were, in order,
biomass market price, the discount rate (cost of
capital), productivity, and the conversion factor
used to scale green weight in the field to
biomass. Biomass prices delivered at the “farm
gate” greater than $28.13 Mg−1 dry biomass or
green biomass greater than 351m3 ha−1
(implying a mean annual increment of 11.8 Mg
dry biomass ha−1 year−1) would permit viable
short-rotation woody crop regimes without
subsidies. Under current conditions, short
rotation woody crops are not profitable on the
low fertility sites where they are likely to be
planted. Better prices or continued subsidies
would make these plantations a viable
alternative.
Additional Resources
Acuña et al., 2018 Land Use Policy 76: 329-337.
Figure 3. Annual discounted cash flow (DCF) for the
non-irrigated high fertility site with 5000 trees ha-1 and a
5 year harvest cycle without (A) and with (B) a subsidy.
B - With subsidy
Year0 5 10 15 20
-1500
-1000
-500
0
500
1000
A - Without subsidy
Dis
co
un
ted
ca
sh
flo
w o
r a
nn
uit
y
(US
do
lla
rs h
a-1
)
-1500
-1000
-500
0
500
1000
1500
Annual DCF
Annuity
Cumulative DCF
Figure 4. Net present value probability distribution for the non-irrigated,
high fertility 5000 trees ha-1 treatment with (blue bars) and without (red
bars) a subsidy. Productivity, prices, production costs, harvesting costs, the
discount rate and the conversion factor from green weight to biomass
were varied to generate the distribution.

55
Nitrogen Dynamics in Forest Plantations: Comparing Newly Established and Coppiced Eucalyptus in Brazil
Introduction
Low levels of available soil nutrients, principally
nitrogen (N), limit growth in most forest
plantations and can be ameliorated through
appropriate fertilization techniques. However,
only a small proportion of applied N fertilizer in
forest plantations is taken up by crop trees, with
the remainder incorporated in various
ecosystem components or
lost. A better understanding
of the fate of applied N
fertilizer in forests is needed
to improve economic returns
f r o m i n v e s t m e n t i n
fertilization, and reduce
negative environmental
impacts to improve the
sustainabil ity of forest
plantations.
However, it is not possible to
distinguish the amount of N
uptake in crop trees
originating from fertilizer
additions from the natural
background levels in the soil.
Therefore, we will use 15N
stable isotope enriched
fertilizer (urea) to accurately
and precisely measure N
uptake and fate of applied
fert i l izer N in forest
ecosystems, on both newly
planted and coppice Eucalyptus forests in Brazil.
Both are widely used methods for Eucalyptus
management in Brazil (Figure 1).
Study Objectives
The operational and scientific questions,
objectives, and hypotheses developed for the
study are presented as follows (Table 1).
Figure 1. Phases of
a common Euca-
lyptus coppice
management in
Brazil, from stump
sprouting (left) to
the 5-year-old
forest (right).
Table 1. Questions, objectives and hypothesis for the nitrogen cycling study,
comparing the nutrient dynamics under newly planted and coppice manage-
ments.

56
- We address Question 1 with high frequency
sampling, especially at the beginning, during
the first (newly planted) and second (coppice)
rotations.
- We address Question 2 by studying two
consecutive rotations, and comparing newly
planted and coppice during the second
rotation.
- We address Question 3 by studying, over two
consecutive rotations, a treatment that will not
be fertilized for newly planted and coppiced
trees.
Treatments and Experimental Design
Urea labelled with the isotope of the element
nitrogen (15N) will be used to infer about
nitrogen cycling in a clonal Eucalyptus
plantation, managed following operational
methods of commercial plantations for Brazilian
companies.
The experimental design presented on Figure 2
will allow us to address the questions of the
Table 1.
The nitrogen cycling study will be replicated in
two different locations in Brazil (Figure 3), with
different patterns of rainfall (total amount and
distribution) and temperature (variation over the
year and range).
Future Direction
Currently, the FPC team is working on the
shipping process of the labeled urea from USA
to Brazil. The installations are planned to occur
during 2019. Figure 2. Proposed experimental design to study the
nitrogen cycling on newly planted and coppiced Eu-
calyptus plantations in Brazil.
Figure 3. Two potential experimental sites in Brazil for the installation of the nitrogen cycling study. These two sites
show significantly different mean annual temperature and rainfall patterns. Red represents the northern site and
black represents the southern site.
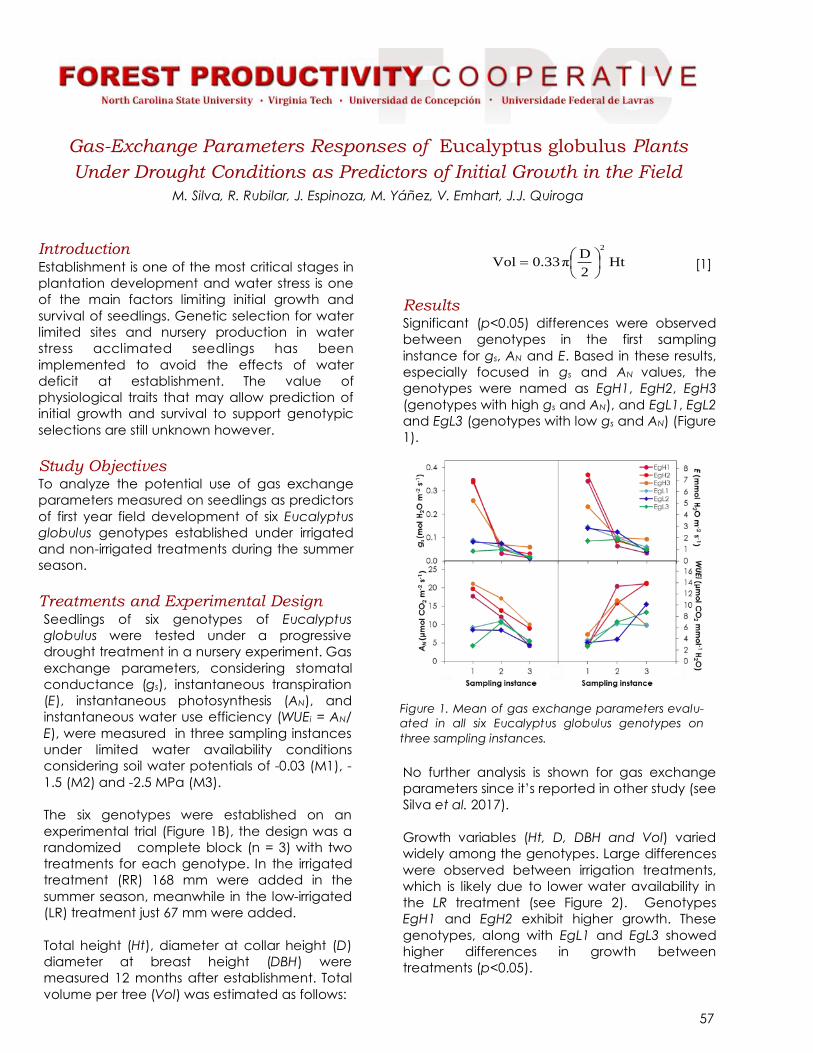
57
Gas-Exchange Parameters Responses of Eucalyptus globulus Plants
Under Drought Conditions as Predictors of Initial Growth in the Field
M. Silva, R. Rubilar, J. Espinoza, M. Yáñez, V. Emhart, J.J. Quiroga
Introduction Establishment is one of the most critical stages in
plantation development and water stress is one
of the main factors limiting initial growth and
survival of seedlings. Genetic selection for water
limited sites and nursery production in water
stress acclimated seedlings has been
implemented to avoid the effects of water
deficit at establishment. The value of
physiological traits that may allow prediction of
initial growth and survival to support genotypic
selections are still unknown however.
Study Objectives To analyze the potential use of gas exchange
parameters measured on seedlings as predictors
of first year field development of six Eucalyptus
globulus genotypes established under irrigated
and non-irrigated treatments during the summer
season.
Treatments and Experimental Design Seedlings of six genotypes of Eucalyptus
globulus were tested under a progressive
drought treatment in a nursery experiment. Gas
exchange parameters, considering stomatal
conductance (gs), instantaneous transpiration
(E), instantaneous photosynthesis (AN), and
instantaneous water use efficiency (WUEi = AN/
E), were measured in three sampling instances
under limited water availability conditions
considering soil water potentials of -0.03 (M1), -
1.5 (M2) and -2.5 MPa (M3).
The six genotypes were established on an
experimental trial (Figure 1B), the design was a
randomized complete block (n = 3) with two
treatments for each genotype. In the irrigated
treatment (RR) 168 mm were added in the
summer season, meanwhile in the low-irrigated
(LR) treatment just 67 mm were added.
Total height (Ht), diameter at collar height (D)
diameter at breast height (DBH) were
measured 12 months after establishment. Total
volume per tree (Vol) was estimated as follows:
Results Significant (p<0.05) differences were observed
between genotypes in the first sampling
instance for gs, AN and E. Based in these results,
especially focused in gs and AN values, the
genotypes were named as EgH1, EgH2, EgH3
(genotypes with high gs and AN), and EgL1, EgL2
and EgL3 (genotypes with low gs and AN) (Figure
1).
No further analysis is shown for gas exchange
parameters since it’s reported in other study (see
Silva et al. 2017).
Growth variables (Ht, D, DBH and Vol) varied
widely among the genotypes. Large differences
were observed between irrigation treatments,
which is likely due to lower water availability in
the LR treatment (see Figure 2). Genotypes
EgH1 and EgH2 exhibit higher growth. These
genotypes, along with EgL1 and EgL3 showed
higher differences in growth between
treatments (p<0.05).
Figure 1. Mean of gas exchange parameters evalu-
ated in all six Eucalyptus globulus genotypes on
three sampling instances.
Ht2
Dπ0.33Vol
2
[1]

58
All growth measurements showed a significant
correlation (p < 0.05) with the gas exchange
parameters registered in the M1 and M2
sampling instances. All the growth
measurements, excluding Ht, showed a positive
correlation (p<0.05) with WUEi measured in the
M3 sampling instance. The strongest correlations
(R2 > 0.70) were found between growth and gs
and E in the plants evaluated at field capacity (-
0.03 MPa).
Analysis of stepwise regression results indicated
that E when measured in seedlings (measured in
M1) produced the highest correlations with
cumulative growth after 12 months of
establishment for both irrigated and non-
irrigated treatments. The models with the highest
correlation coefficients when assessing growth in
the field use E as the only predictor (Table 1).
DBH recorded in the irrigated treatment (DBHRR)
was the only variable with a multiple linear
regression, which included E measured in M1
(EM1) and WUEi measured in M3 (WUEiM3). Model
statistics are R2 = 0.68 and RMSE = 0.57. The
model can be expressed as:
Conclusions Our results suggest that physiological parameters
may allow the selection of genotypes with
higher growth rates, both in sites with abundant
irrigation and sites with limiting water availability
after planting. These results could be relevant for
future studies that include strategies of
genotypes responses to water deficit, including
both growth and survival rates at the
establishment phase.
References Silva M, R Rubilar, J Espinoza, M Yáñez, V Emhart,
JJ Quiroga. 2017. Respuesta en parámetros de
intercambio gaseoso y supervivencia en plantas
jóvenes de genotipos comerciales de
Eucalyptus spp sometidas a déficit hídrico.
Bosque 38(1):79-87.
Acknowledgements This research was made possible by the support
of FONDEF project D11i1161 Eucahydro, Forestal
Mininco S.A., Forestal Arauco S.A., Bioforest S.A.,
Genómica S.A., and the Forest Nutrition
Productivity lab of Universidad of Concepción.
Table 1. Adjustment parameters for the simple linear
regressions models that predicts field growth through
instantaneous transpiration (E) measured in seedlings
under field capacity (M1). Ht: total height; D: diameter
at collar height; DBH: diameter at breast height; Vol:
total volume per tree; Trt: irrigation treatment; a0 and
a1: parameters of the model; R2: coefficient of determi-
nation; RMSE: root mean square error.
Growth
variable Trt a0 a1 R2 RMSE
Ht (m) RR 2.71 0.17 0.45 0.43
LR 2.61 0.19 0.44 0.38
D (cm) RR 4.35 0.39 0.63 0.68
LR 3.78 0.39 0.61 0.69
DBH (cm) LR 1.79 0.28 0.63 0.48
Vol (m3 x
1000)
RR 1.01 0.60 0.63 1.04
LR 0.82 0.47 0.57 0.91
Figure 2. Mean of accumulated growth of the six
genotypes of Eucalyptus globulus after one year of
development in the field.
[2] 3M1MRR WUEi0.02E0.321.64DBH

59
The Effect of Contrasting Water Availability Conditions on Water
Use Efficiency During Early Development of Eucalyptus globulus,
E. nitens genotypes and E. camaldulensis Hybrids in Central
Chile M. Acevedo, R. Rubilar, M. Pincehira, V. Emahrt, and O. Mardones
Introduction
Even though the amount of water used by
Eucalyptus plantations is an important
ecological and social subject around the world,
the WUE of these forest is also very important,
because wood production is a result from both
efficiency and water consumption (Stape et al.
2004; Binkley et al. 2004). Under the current
scenario of climate change, where an increase
in temperatures and a decrease in precipitation
is expected in many areas of the world (Howe et
al. 2005), it is very important that the
identification of genotypes or clones that are
capable of maintain higher growth rates
associated to lower water consumption values is
recognized (Dye, 2013; Albaugh et al. 2013).
Study Objective
Assess the effect of contrasting water availability
induced via spring-summer irrigation on E.
globulus, E. nitens and E. camaldulensis hybrids
water use efficiency during early development.
Methods
In the south central valley of the Province of Bio
Bio, Chile, a clonal trial was established under
two contrasting water availability conditions
(with and without irrigation spring-summer
irrigation). The experiment was established as a
split plot block design with three replicates under
each irrigation treatment. The experimental unit
considered a line of four ramets for 10 selected
Eucalyptus genotypes (Table 1) .
Sap flow density was monitored using the
method of constant heat proposed by Granier
(1985, 1987). Thermal dissipation probes were
installed in 60 trees (10 genotypes x 3 ramets x 2
watering conditions). The evaluation period was
between October 2010 and July 2011 (304
days). Monthly height and diameter growth at
10 cm from the ground was measured and
used to calculate estimate individual volume
index. Water use efficiency (WUE) was
determined as the slope of the lineal relationship
between monthly volumetric index vs. water
consumption during the measurement period.
Results
At this early stage of development, E. nitens
showed the highest WUE from all evaluted
species at this site, and in E. globulus showed a
higher WUE than E. camaldulensis.
A highly significant linear relationship (P < 0.001)
between monthly water consumption and
volumetric increment at individual tree level was
observed under both irrigation conditions for E.
globulus (egh1, egm1, egm2 y egl1), E. nitens
(en y enxeg) and E. camaldulensis (enxec y
egxec). For E. globulus (Fig. 1a) WUE for no
irrigated conditions (rainfeed) was 0.0225
(R2=0.84) and for irrigated 0.0299 m3m-3
(R2=0.90). Irrigation significantly increased (P <
0.01) WUE in 0.0074 m3m-3 which represents a
33% increment. For E. nitens (Fig. 1 b) WUE
reached 0.0348 for no irrigated (R2=0.93) and
0.0444 m3m-3 for irrigated conditions (R2=0.97)
for rainfed and irrigated conditions. Irrigation for
Table 1. Description of the genetic material evaluated.

60
E. nitens also increased significantly WUE (P <
0.01) in 0.0096 m3m-3 which represents a 28%
improvement. Contrastingly, WUE for E.
camaldulensis genotypes (Fig. 1 c) reached a
value of 0.0185 (R2=0.94) for no irrigated
(rainfeed) trees and a value of 0.0128 (R2=0.87)
m3m-3 for irrigated conditions. In this case,
irrigation significantly decreased WUE of E.
camaldulensis (P < 0.01) in 0.0057 m3m-3, which
corresponds to a 31% decrease. This result is very
interesting considering that all species showed
larger growth at irrigated conditions, and based
on how usually these species are selected for
dry environments a general understanding
indicates that from higher to lower resistance to
drought these species should rank E.
camaldulensis > E.globulus > E.nitens.
Conclusions
WUE assessed through individual volume
depends on the species, indicating the E. nitens
is more efficient than E. globulus, and these in
turn are more efficient than E. camaldulensis.
Evaluation of WUE under irrigated and non-
irrigated conditions showed that E. globulus and
E. nitens was positively affected by irrigation.
Contrastingly, E. camaldulensis showed a
decrease in WUE at irrigated conditions.
Acknowledgements
The authors of this research would like to
acknowledge the support of CONICYT graduate
scholarship, FONDECYT Project Nº 1085093,
Forestal Mininco Company SA., the Forest
Productivity Cooperative, the Soil, Nutrition and
Forest Productivity Laboratory at the Faculty of
Forest Sciences at Universidad de Concepción,
Chile.
Water use (m3 tree
-1 month
-1)
0.0 0.1 0.2 0.3 0.4 0.5 0.6 0.7 0.8 0.9
Vo
lum
en In
cre
men
t (m
3 tre
e-1
mo
nth
-1)
0.000
0.005
0.010
0.015
0.020
0.025
0.030
0.035
0.040E. nitens irrigated
Linear (irrigated)
E. nitens rainfed
Linear (rainfed)
ynitens=0.0444 (***) x
R2= 0.97; RMSE=0.0019
ynitens=0.0348 (***) x
R2= 0.93; RMSE=0.0027
Diff= 0.0096 (**)
yirrigated=0.0299 (***) x
R2= 0.90; RMSE=0.0026
Diff=0.0074 (**)
Water use (m3 tree
-1 month
-1)
0.0 0.1 0.2 0.3 0.4 0.5 0.6 0.7 0.8 0.9
Vo
lum
en
In
cre
me
nt
(m3 t
ree
-1 m
on
th-1
)
0.000
0.005
0.010
0.015
0.020
0.025
0.030E. globulus irrigated
Linear (irrigated)
E. globulus rainfed
Linear (rainfed)
yrainfed=0.0225 (***) x
R2= 0.84; RMSE=0.0019
Water use (m3 tree
-1 month
-1)
0.0 0.1 0.2 0.3 0.4 0.5 0.6 0.7 0.8 0.9
Volu
men Incre
ment (m
3 tre
e-1
month
-1)
0.000
0.002
0.004
0.006
0.008
0.010
0.012
0.014
0.016
0.018E. camaldulensis irrigated
Linear (irrigated)
E. camaldulensis rainfed
Linear (rainfed)
ycamaldulensis=0.0128 (***) x
R2= 0.87; RMSE=0.0013
Diff= - 0.0057 (**)
ycamaldulensis=0.0185 (***) x
R2= 0.94; RMSE=0.0012
(a)
(b)
(c)
Figure 1. Linear relationship between water consumption
(m3 tree-1 month-1) and volumetric increment (m3 of
wood tree-1 month-1) at individual level of E. globulus (a);
E. nitens (b) and E. camaldulensis genotypes by irrigation
treatments. RMSE, root means square error; R2,
determination coefficient. **; Significant for P<0.01; ***
P<0.001.
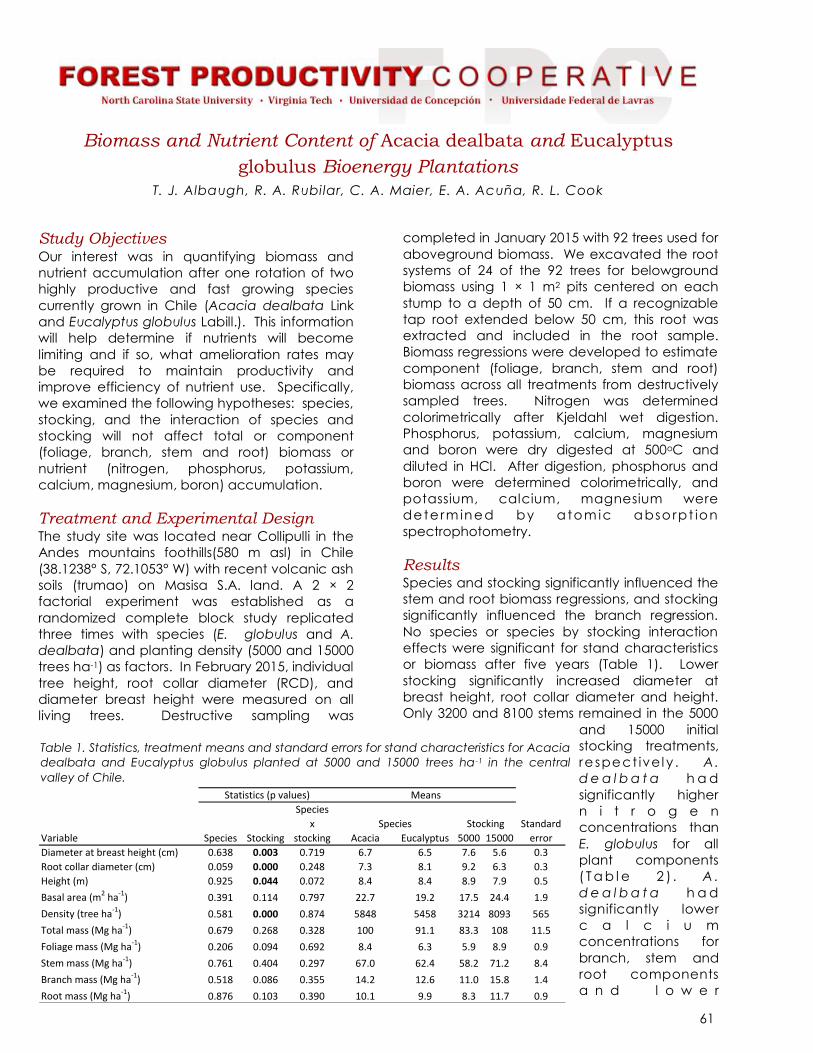
61
Biomass and Nutrient Content of Acacia dealbata and Eucalyptus
globulus Bioenergy Plantations
T. J. Albaugh, R. A. Rubilar, C. A. Maier, E. A. Acuña, R. L. Cook
Study Objectives Our interest was in quantifying biomass and
nutrient accumulation after one rotation of two
highly productive and fast growing species
currently grown in Chile (Acacia dealbata Link
and Eucalyptus globulus Labill.). This information
will help determine if nutrients will become
limiting and if so, what amelioration rates may
be required to maintain productivity and
improve efficiency of nutrient use. Specifically,
we examined the following hypotheses: species,
stocking, and the interaction of species and
stocking will not affect total or component
(foliage, branch, stem and root) biomass or
nutrient (nitrogen, phosphorus, potassium,
calcium, magnesium, boron) accumulation.
Treatment and Experimental Design The study site was located near Collipulli in the
Andes mountains foothills(580 m asl) in Chile
(38.1238° S, 72.1053° W) with recent volcanic ash
soils (trumao) on Masisa S.A. land. A 2 × 2
factorial experiment was established as a
randomized complete block study replicated
three times with species (E. globulus and A.
dealbata) and planting density (5000 and 15000
trees ha-1) as factors. In February 2015, individual
tree height, root collar diameter (RCD), and
diameter breast height were measured on all
living trees. Destructive sampling was
completed in January 2015 with 92 trees used for
aboveground biomass. We excavated the root
systems of 24 of the 92 trees for belowground
biomass using 1 × 1 m2 pits centered on each
stump to a depth of 50 cm. If a recognizable
tap root extended below 50 cm, this root was
extracted and included in the root sample.
Biomass regressions were developed to estimate
component (foliage, branch, stem and root)
biomass across all treatments from destructively
sampled trees. Nitrogen was determined
colorimetrically after Kjeldahl wet digestion.
Phosphorus, potassium, calcium, magnesium
and boron were dry digested at 500oC and
diluted in HCl. After digestion, phosphorus and
boron were determined colorimetrically, and
potassium, calcium, magnesium were
determ ined by a tom ic abso rpt ion
spectrophotometry.
Results Species and stocking significantly influenced the
stem and root biomass regressions, and stocking
significantly influenced the branch regression.
No species or species by stocking interaction
effects were significant for stand characteristics
or biomass after five years (Table 1). Lower
stocking significantly increased diameter at
breast height, root collar diameter and height.
Only 3200 and 8100 stems remained in the 5000
and 15000 initial
stocking treatments,
re spect ivel y . A.
d e a l b a t a h a d
significantly higher
n i t r o g e n
concentrations than
E. globulus for all
plant components
( T a b l e 2 ) . A .
d e a l b a t a h a d
significantly lower
c a l c i u m
concentrations for
branch, stem and
root components
a n d l o w e r
Table 1. Statistics, treatment means and standard errors for stand characteristics for Acacia
dealbata and Eucalyptus globulus planted at 5000 and 15000 trees ha-1 in the central
valley of Chile.
Species
x Standard
Variable Species Stocking stocking Acacia Eucalyptus 5000 15000 error
Diameter at breast height (cm) 0.638 0.003 0.719 6.7 6.5 7.6 5.6 0.3
Root collar diameter (cm) 0.059 0.000 0.248 7.3 8.1 9.2 6.3 0.3
Height (m) 0.925 0.044 0.072 8.4 8.4 8.9 7.9 0.5
Basal area (m2 ha-1) 0.391 0.114 0.797 22.7 19.2 17.5 24.4 1.9
Density (tree ha-1) 0.581 0.000 0.874 5848 5458 3214 8093 565
Total mass (Mg ha-1) 0.679 0.268 0.328 100 91.1 83.3 108 11.5
Foliage mass (Mg ha-1) 0.206 0.094 0.692 8.4 6.3 5.9 8.9 0.9
Stem mass (Mg ha-1) 0.761 0.404 0.297 67.0 62.4 58.2 71.2 8.4
Branch mass (Mg ha-1) 0.518 0.086 0.355 14.2 12.6 11.0 15.8 1.4
Root mass (Mg ha-1) 0.876 0.103 0.390 10.1 9.9 8.3 11.7 0.9
Species Stocking
Statistics (p values) Means
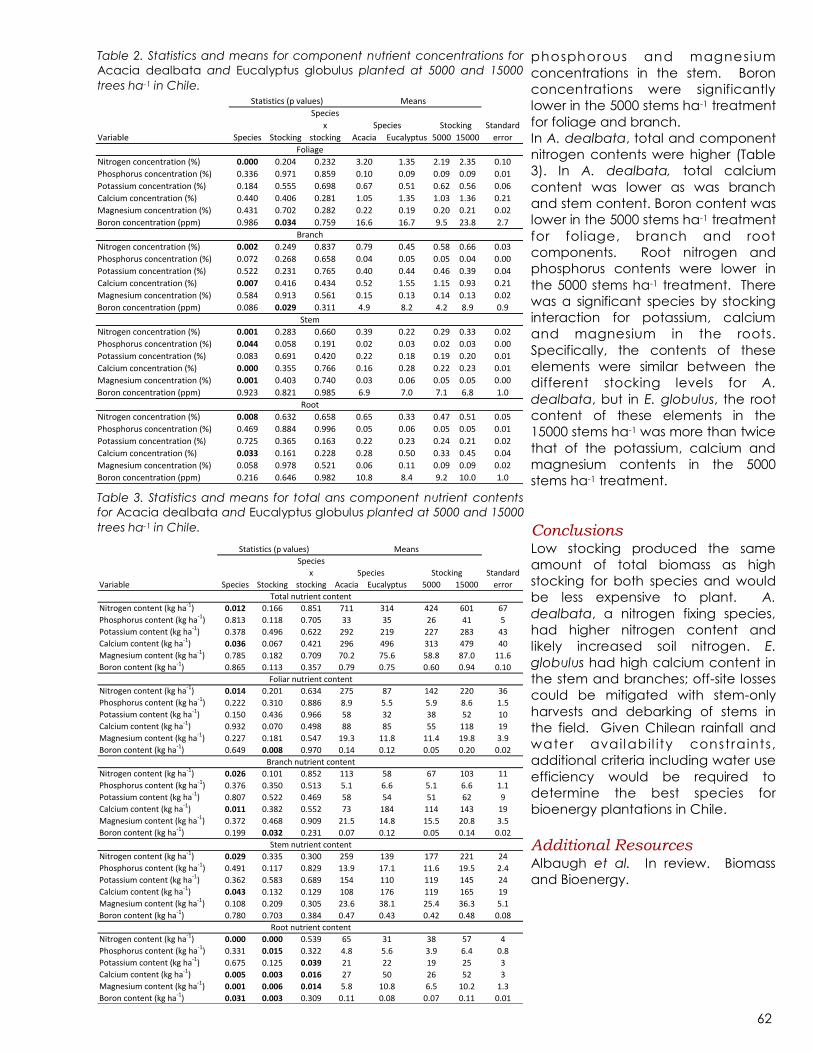
62
phosphorous and magnesium
concentrations in the stem. Boron
concentrations were significantly
lower in the 5000 stems ha-1 treatment
for foliage and branch.
In A. dealbata, total and component
nitrogen contents were higher (Table
3). In A. dealbata, total calcium
content was lower as was branch
and stem content. Boron content was
lower in the 5000 stems ha-1 treatment
for foliage, branch and root
components. Root nitrogen and
phosphorus contents were lower in
the 5000 stems ha-1 treatment. There
was a significant species by stocking
interaction for potassium, calcium
and magnesium in the roots.
Specifically, the contents of these
elements were similar between the
different stocking levels for A.
dealbata, but in E. globulus, the root
content of these elements in the
15000 stems ha-1 was more than twice
that of the potassium, calcium and
magnesium contents in the 5000
stems ha-1 treatment.
Conclusions Low stocking produced the same
amount of total biomass as high
stocking for both species and would
be less expensive to plant. A.
dealbata, a nitrogen fixing species,
had higher nitrogen content and
likely increased soil nitrogen. E.
globulus had high calcium content in
the stem and branches; off-site losses
could be mitigated with stem-only
harvests and debarking of stems in
the field. Given Chilean rainfall and
water availabil ity constraints,
additional criteria including water use
efficiency would be required to
determine the best species for
bioenergy plantations in Chile.
Additional Resources Albaugh et al. In review. Biomass
and Bioenergy.
Table 2. Statistics and means for component nutrient concentrations for
Acacia dealbata and Eucalyptus globulus planted at 5000 and 15000
trees ha-1 in Chile.
Species
x Standard
Variable Species Stocking stocking Acacia Eucalyptus 5000 15000 error
Nitrogen concentration (%) 0.000 0.204 0.232 3.20 1.35 2.19 2.35 0.10
Phosphorus concentration (%) 0.336 0.971 0.859 0.10 0.09 0.09 0.09 0.01
Potassium concentration (%) 0.184 0.555 0.698 0.67 0.51 0.62 0.56 0.06
Calcium concentration (%) 0.440 0.406 0.281 1.05 1.35 1.03 1.36 0.21
Magnesium concentration (%) 0.431 0.702 0.282 0.22 0.19 0.20 0.21 0.02
Boron concentration (ppm) 0.986 0.034 0.759 16.6 16.7 9.5 23.8 2.7
Nitrogen concentration (%) 0.002 0.249 0.837 0.79 0.45 0.58 0.66 0.03
Phosphorus concentration (%) 0.072 0.268 0.658 0.04 0.05 0.05 0.04 0.00
Potassium concentration (%) 0.522 0.231 0.765 0.40 0.44 0.46 0.39 0.04
Calcium concentration (%) 0.007 0.416 0.434 0.52 1.55 1.15 0.93 0.21
Magnesium concentration (%) 0.584 0.913 0.561 0.15 0.13 0.14 0.13 0.02
Boron concentration (ppm) 0.086 0.029 0.311 4.9 8.2 4.2 8.9 0.9
Nitrogen concentration (%) 0.001 0.283 0.660 0.39 0.22 0.29 0.33 0.02
Phosphorus concentration (%) 0.044 0.058 0.191 0.02 0.03 0.02 0.03 0.00
Potassium concentration (%) 0.083 0.691 0.420 0.22 0.18 0.19 0.20 0.01
Calcium concentration (%) 0.000 0.355 0.766 0.16 0.28 0.22 0.23 0.01
Magnesium concentration (%) 0.001 0.403 0.740 0.03 0.06 0.05 0.05 0.00
Boron concentration (ppm) 0.923 0.821 0.985 6.9 7.0 7.1 6.8 1.0
Nitrogen concentration (%) 0.008 0.632 0.658 0.65 0.33 0.47 0.51 0.05
Phosphorus concentration (%) 0.469 0.884 0.996 0.05 0.06 0.05 0.05 0.01
Potassium concentration (%) 0.725 0.365 0.163 0.22 0.23 0.24 0.21 0.02
Calcium concentration (%) 0.033 0.161 0.228 0.28 0.50 0.33 0.45 0.04
Magnesium concentration (%) 0.058 0.978 0.521 0.06 0.11 0.09 0.09 0.02
Boron concentration (ppm) 0.216 0.646 0.982 10.8 8.4 9.2 10.0 1.0
Statistics (p values) Means
Root
Species Stocking
Foliage
Branch
Stem
Table 3. Statistics and means for total ans component nutrient contents
for Acacia dealbata and Eucalyptus globulus planted at 5000 and 15000
trees ha-1 in Chile.
Species
x Standard
Variable Species Stocking stocking Acacia Eucalyptus 5000 15000 error
Nitrogen content (kg ha-1) 0.012 0.166 0.851 711 314 424 601 67
Phosphorus content (kg ha-1) 0.813 0.118 0.705 33 35 26 41 5
Potassium content (kg ha-1) 0.378 0.496 0.622 292 219 227 283 43
Calcium content (kg ha-1) 0.036 0.067 0.421 296 496 313 479 40
Magnesium content (kg ha-1) 0.785 0.182 0.709 70.2 75.6 58.8 87.0 11.6
Boron content (kg ha-1) 0.865 0.113 0.357 0.79 0.75 0.60 0.94 0.10
Nitrogen content (kg ha-1) 0.014 0.201 0.634 275 87 142 220 36
Phosphorus content (kg ha-1) 0.222 0.310 0.886 8.9 5.5 5.9 8.6 1.5
Potassium content (kg ha-1) 0.150 0.436 0.966 58 32 38 52 10
Calcium content (kg ha-1) 0.932 0.070 0.498 88 85 55 118 19
Magnesium content (kg ha-1) 0.227 0.181 0.547 19.3 11.8 11.4 19.8 3.9
Boron content (kg ha-1) 0.649 0.008 0.970 0.14 0.12 0.05 0.20 0.02
Nitrogen content (kg ha-1) 0.026 0.101 0.852 113 58 67 103 11
Phosphorus content (kg ha-1) 0.376 0.350 0.513 5.1 6.6 5.1 6.6 1.1
Potassium content (kg ha-1) 0.807 0.522 0.469 58 54 51 62 9
Calcium content (kg ha-1) 0.011 0.382 0.552 73 184 114 143 19
Magnesium content (kg ha-1) 0.372 0.468 0.909 21.5 14.8 15.5 20.8 3.5
Boron content (kg ha-1) 0.199 0.032 0.231 0.07 0.12 0.05 0.14 0.02
Nitrogen content (kg ha-1) 0.029 0.335 0.300 259 139 177 221 24
Phosphorus content (kg ha-1) 0.491 0.117 0.829 13.9 17.1 11.6 19.5 2.4
Potassium content (kg ha-1) 0.362 0.583 0.689 154 110 119 145 24
Calcium content (kg ha-1) 0.043 0.132 0.129 108 176 119 165 19
Magnesium content (kg ha-1) 0.108 0.209 0.305 23.6 38.1 25.4 36.3 5.1
Boron content (kg ha-1) 0.780 0.703 0.384 0.47 0.43 0.42 0.48 0.08
Nitrogen content (kg ha-1) 0.000 0.000 0.539 65 31 38 57 4
Phosphorus content (kg ha-1) 0.331 0.015 0.322 4.8 5.6 3.9 6.4 0.8
Potassium content (kg ha-1) 0.675 0.125 0.039 21 22 19 25 3
Calcium content (kg ha-1) 0.005 0.003 0.016 27 50 26 52 3
Magnesium content (kg ha-1) 0.001 0.006 0.014 5.8 10.8 6.5 10.2 1.3
Boron content (kg ha-1) 0.031 0.003 0.309 0.11 0.08 0.07 0.11 0.01
Statistics (p values) Means
Stem nutrient content
Root nutrient content
Species Stocking
Total nutrient content
Foliar nutrient content
Branch nutrient content

63
Eucalyptus Plantation Effects on Soil Carbon After 20 Years and Three
Rotations in Brazil
R. L. Cook, D. Binkley, and J. L. Stape
Introduction Sequestering atmospheric carbon in plant
biomass and soil organic matter can improve soil
quality and potentially mitigate climate change.
However, the effects of tropical plantation
forestry on soil carbon, and therefore on soil
quality and long-term sustainability, requires
further examination to determine what factors
drive changes. Because impacts of intensive
forestry practices on soil carbon are highly
variable, we require a better understanding of
trends to determine the effects of these
operations. The objectives of this research were
to 1) quantify mineral soil carbon stocks and
change over time and 2) examine relationships
of soil C and change in soil C with clay content,
mean annual temperature, wet and dry
seasonal precipitation, soil order, and region.
Methods In 2010, we collected soils from 306 Eucalyptus
plantations that had been previously sampled in
2001 and the 1980s and 1990s across three
regions of Brazil in order to measure the change
in soil carbon over time and across various soils
and climates (Figure 1). Eucalyptus plots were
sampled from 0-15 cm and 15-30 cm for soil
carbon concentration and bulk density to
determine soil carbon stocks and evaluate the
long-term effects of continuous Eucalyptus
management. Technical field support was
provided by the forestry companies Copener,
Fíbria, and Suzano.
Results Across all sites, soil C (0-30 cm depth) in 2010
averaged 29 Mg ha-1 (± 0.70 Mg ha-1), tending to
Figure 1. Annual precipitation (left) and mean temperature (right) across the geographic gradient where soils were
sampled.
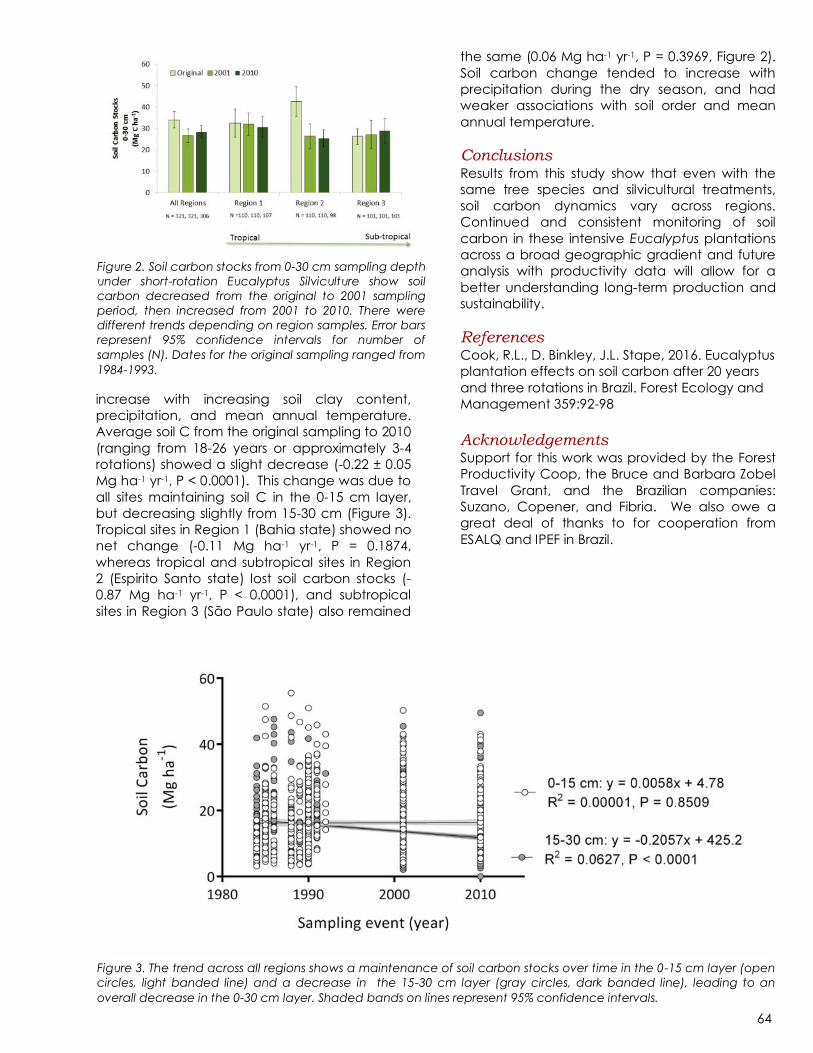
64
increase with increasing soil clay content,
precipitation, and mean annual temperature.
Average soil C from the original sampling to 2010
(ranging from 18-26 years or approximately 3-4
rotations) showed a slight decrease (-0.22 ± 0.05
Mg ha-1 yr-1, P < 0.0001). This change was due to
all sites maintaining soil C in the 0-15 cm layer,
but decreasing slightly from 15-30 cm (Figure 3).
Tropical sites in Region 1 (Bahia state) showed no
net change (-0.11 Mg ha-1 yr-1, P = 0.1874,
whereas tropical and subtropical sites in Region
2 (Espirito Santo state) lost soil carbon stocks (-
0.87 Mg ha-1 yr-1, P < 0.0001), and subtropical
sites in Region 3 (São Paulo state) also remained
the same (0.06 Mg ha-1 yr-1, P = 0.3969, Figure 2).
Soil carbon change tended to increase with
precipitation during the dry season, and had
weaker associations with soil order and mean
annual temperature.
Conclusions Results from this study show that even with the
same tree species and silvicultural treatments,
soil carbon dynamics vary across regions.
Continued and consistent monitoring of soil
carbon in these intensive Eucalyptus plantations
across a broad geographic gradient and future
analysis with productivity data will allow for a
better understanding long-term production and
sustainability.
References Cook, R.L., D. Binkley, J.L. Stape, 2016. Eucalyptus
plantation effects on soil carbon after 20 years
and three rotations in Brazil. Forest Ecology and
Management 359:92-98
Acknowledgements Support for this work was provided by the Forest
Productivity Coop, the Bruce and Barbara Zobel
Travel Grant, and the Brazilian companies:
Suzano, Copener, and Fibria. We also owe a
great deal of thanks to for cooperation from
ESALQ and IPEF in Brazil.
Figure 2. Soil carbon stocks from 0-30 cm sampling depth
under short-rotation Eucalyptus Silviculture show soil
carbon decreased from the original to 2001 sampling
period, then increased from 2001 to 2010. There were
different trends depending on region samples. Error bars
represent 95% confidence intervals for number of
samples (N). Dates for the original sampling ranged from
1984-1993.
Figure 3. The trend across all regions shows a maintenance of soil carbon stocks over time in the 0-15 cm layer (open
circles, light banded line) and a decrease in the 15-30 cm layer (gray circles, dark banded line), leading to an
overall decrease in the 0-30 cm layer. Shaded bands on lines represent 95% confidence intervals.

65
Eucahydro: Quantifying Differences in Thermal Dissipation Probe
Calibrations for Eucalyptus globulus species and E.nitens x globulus
Hybrid
Study Objective To assess equations for sapflux estimation in
Eucalyptus plantations in Chile.
Treatment and Experimental Design The Eucahydro Project involves two contrasting
climatic site conditions located in the Maule
(Quivolgo trial) and Bio-Bio regions (C.Douglas
trial). Selected sites differed mainly on relative
humidity and vapor pressure deficit conditions in
Chile (Figure 1). The Quivolgo trial has a loamy
soil texture, whereas C.Douglas trial has a Sandy
texture. A total of 30 Eucalyptus genotypes of
high, medium and low productivity for E.globulus
and Eucalyptus nitens, and hybrids of Eucalyptus
camaldulensis highly selected genotypes were
considered. Two conditions are being evaluated
as study treatments, one is irrigated to keep soil
moisture close to field capacity and the other
named water stress with soil moisture close to the
permanent wilting point. Water regime is
controlled by a drip irrigation system.
Studies at each site were established with three
blocks (replicates), each block consisting of two
main plots with both contrasting irrigation
system, where each main plot will contain 30
subplots each of 5 x 5 tres (25 trees per plot) of
each selected genotype asigned randomly to
experimental units.
Sapflow Calibration of Equations For this specific study a subsample of 3
genotypes (1 genotype of E.globulus, 1
genotype of E.nitens and 1 genotype of E.nitens
x E.globulus) were selected for sap flux density
evaluation. The genotypes were selected
based in the the 2-years growth rank for the site,
and represent the medium productivity of each
taxa in the site. In the Morning on April 13th 2015,
3 trees per genotype (1 tree per plot per
genotype) were selected to installing sap flux
probes. Trees were selected to include the
groundline diameter classes of the genotype
within the site, and specifically for the full-
irrigated treatment. We used a 2-cm
homemade heat dissipation probes, similar to
the ones used by Granier (1987), which were
installed 80 cm above-ground, approximately.
After the sunset, trees were cut and immediately
moved to a common area within the site, where
they were put in a20 L-bucket containing 7 L of
water. Probes were controlled to a set of
datalogger connected to a multiplexer (CR1000
and AM16/32B, Campbell Scientific Inc. Logan,
UT).
Water consumption was monitored every one
hour from 8:30 am to 19:30 pm on April 14th and
8:30 am to 13:30 pm on April 15th. The buckets
were graded, and the refilling of the bucket to
a target hourly was assumed to represent the
Figure 1. Geographical location of Project Eucahydro in
Chile.
Figure 2. Sapflow sensor type Granier style to measure
sapflux density.

66
hourly transpiration. We calculated the
dimensionless coefficient K to estimate the flow
density by both the Granier equation and the
fitted power function to the experimental data
(Granier, 1987). Sapflux measurements were
corrected by the sapwood area, which was
determined visually through the inspection of
transversal cuts made on the stem at the
height were the sensor was located (Figure 3)
Results A common sapflux equation was modelled for
E.globulus and for E.nitens x E.globulus hibrid.
We found significant differences in functions
adjusted through dummy variables (Figure 4).
Results suggested that Granier equations
underestimated by more than a 215% sapflow
estimates. Also this suggest that water use using
traditional coefficients are higher for
Eucalytpus species that show larger vessels
compared to other species tested by Granier
on its original equations. Potential differences
on calibrating equations may arise given the
lack of root system resistance on slope of
estimates. However, observed differences are
consistant when scaling estimates over time.
Future Direction Calibration equations will be evaluated on
lysimters at different seasons to validate
equations calibrated using potometers.
Equations will be evaluated for genotypes to
obtain accurate estimates of water
consumption.
Figure 3. Visual inspection and assessment of the
sapwood area (upper panel); trees put in the buckets
for transpiration evaluation (lower panel).
Figure 4. Calibration equation and Granier equation
comparison.
Figure 5. Autumn (May) and winter (August) transpiration
using Granier vs Calibrated equations.

67
Eucahydro: Water Use and Water Use Efficiency of Eucalyptus Genotypes
under High and Low Water Resource Availability in Chile
General Objective In Chile there is an urgent need to establish
water use sustainability, water footprint and
parameters for effective assessment for forestry
water use certification considering forest
plantations effect on water use availability for
social, economic and alternative productive or
ecological processes. This project considers the
opportunity to develop a model (EUCAHYDRO),
or toolset, based on ecophysiological and
genomic assessments for selection of Eucalytpus
globulus, E. nitens and hybrids genotypes for
water use efficiency, water consumption and
drought resistance. This toolset or model will
allow to improve and/or secure productivity of
forest Eucalyptus plantations under extreme
drought events and an effective selection of
lower water use impact genotypes for sites with
water use conflicts or with low water availability
resources.
Specific Objective To establish the water use sustainability
(environmental, social, economic) of Eucalytpus
intensively managed forest plantations. In this
report, the objective is to present the results of
water use, water use efficiency and efficient use
of water of evaluated Eucalyptus genotypes at
the southern site evaluated in this project.
Treatment and Experimental Design The Eucahydro Project involves two contrasting
climatic site conditions located in the Maule
(Quivolgo trial) and Bio-Bio regions (C.Douglas
trial). Selected sites differed mainly on relative
humidity and vapor pressure deficit conditions in
Chile (Figure 1). The Quivolgo trial has a loamy
soil texture, whereas C.Douglas trial has a Sandy
texture. A total of 30 Eucalyptus genotypes of
high, medium and low productivity for E.
globulus and E. nitens, and hybrids of E.
camaldulensis highly selected genotypes were
considered. Two conditions are being evaluated
as study treatments, one is ‘irrigated’ to keep soil
moisture close to field capacity and the other
named ‘water stress’ with soil moisture close to
the permanent wilting point. Water regime is
controlled by a drip irrigation system. The
experiments were established with 3 blocks.
Block-plots contain 25 trees, but the
measurement plot contains 9 trees. The planting
density is 1666 trees/ha.
Sapflow Assessments Sapflux assessment every 15 minutes for 15
months were obtained using thermal
dissipation probes installed on 6 trees at 10 to
25 cm above the ground and underneath all
living foliage on 16 selected genotypes
representing the gradient of species and
productivity at each site.
Figure 1. Geographical location of research sites of
Eucahydro project in Chile.
Figure 2. Sapflow assessment system and sapwood are
determination and allometric fit.
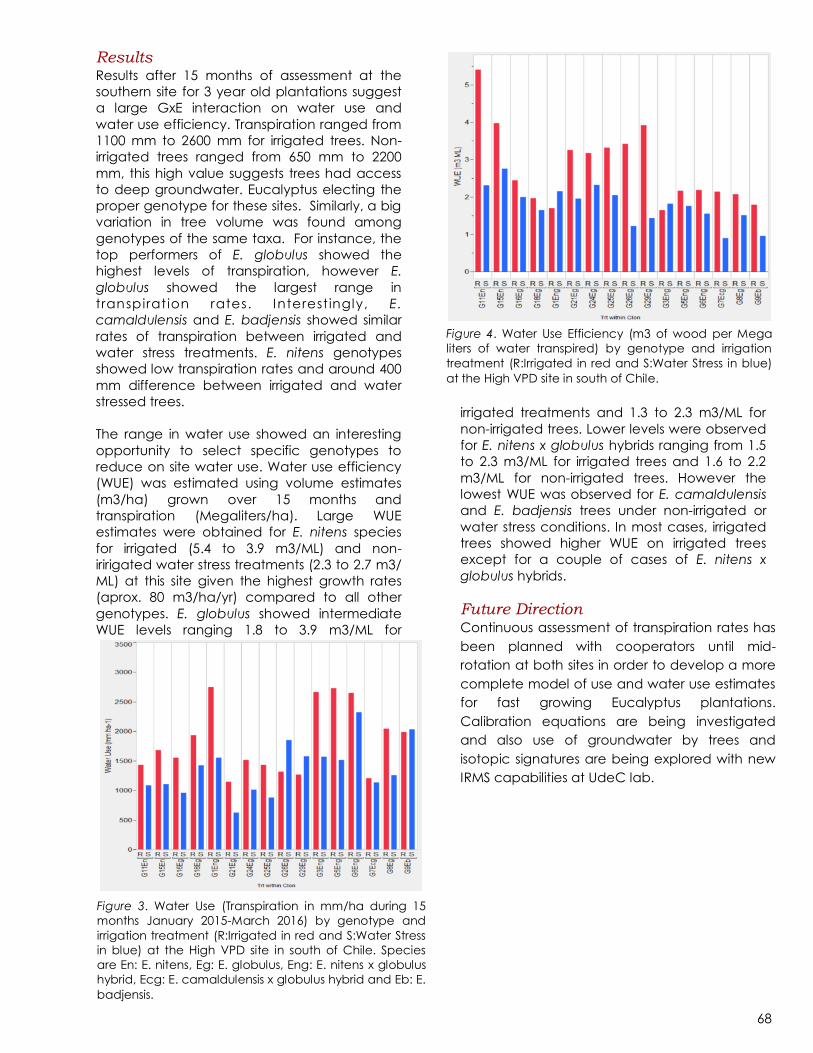
68
Results Results after 15 months of assessment at the
southern site for 3 year old plantations suggest
a large GxE interaction on water use and
water use efficiency. Transpiration ranged from
1100 mm to 2600 mm for irrigated trees. Non-
irrigated trees ranged from 650 mm to 2200
mm, this high value suggests trees had access
to deep groundwater. Eucalyptus electing the
proper genotype for these sites. Similarly, a big
variation in tree volume was found among
genotypes of the same taxa. For instance, the
top performers of E. globulus showed the
highest levels of transpiration, however E.
globulus showed the largest range in
transpirat ion rates. Interest ingly, E.
camaldulensis and E. badjensis showed similar
rates of transpiration between irrigated and
water stress treatments. E. nitens genotypes
showed low transpiration rates and around 400
mm difference between irrigated and water
stressed trees.
The range in water use showed an interesting
opportunity to select specific genotypes to
reduce on site water use. Water use efficiency
(WUE) was estimated using volume estimates
(m3/ha) grown over 15 months and
transpiration (Megaliters/ha). Large WUE
estimates were obtained for E. nitens species
for irrigated (5.4 to 3.9 m3/ML) and non-
iririgated water stress treatments (2.3 to 2.7 m3/
ML) at this site given the highest growth rates
(aprox. 80 m3/ha/yr) compared to all other
genotypes. E. globulus showed intermediate
WUE levels ranging 1.8 to 3.9 m3/ML for
irrigated treatments and 1.3 to 2.3 m3/ML for
non-irrigated trees. Lower levels were observed
for E. nitens x globulus hybrids ranging from 1.5
to 2.3 m3/ML for irrigated trees and 1.6 to 2.2
m3/ML for non-irrigated trees. However the
lowest WUE was observed for E. camaldulensis
and E. badjensis trees under non-irrigated or
water stress conditions. In most cases, irrigated
trees showed higher WUE on irrigated trees
except for a couple of cases of E. nitens x
globulus hybrids.
Future Direction Continuous assessment of transpiration rates has
been planned with cooperators until mid-
rotation at both sites in order to develop a more
complete model of use and water use estimates
for fast growing Eucalyptus plantations.
Calibration equations are being investigated
and also use of groundwater by trees and
isotopic signatures are being explored with new
IRMS capabilities at UdeC lab.
Figure 3. Water Use (Transpiration in mm/ha during 15
months January 2015-March 2016) by genotype and
irrigation treatment (R:Irrigated in red and S:Water Stress
in blue) at the High VPD site in south of Chile. Species
are En: E. nitens, Eg: E. globulus, Eng: E. nitens x globulus
hybrid, Ecg: E. camaldulensis x globulus hybrid and Eb: E.
badjensis.
Figure 4. Water Use Efficiency (m3 of wood per Mega
liters of water transpired) by genotype and irrigation
treatment (R:Irrigated in red and S:Water Stress in blue)
at the High VPD site in south of Chile.
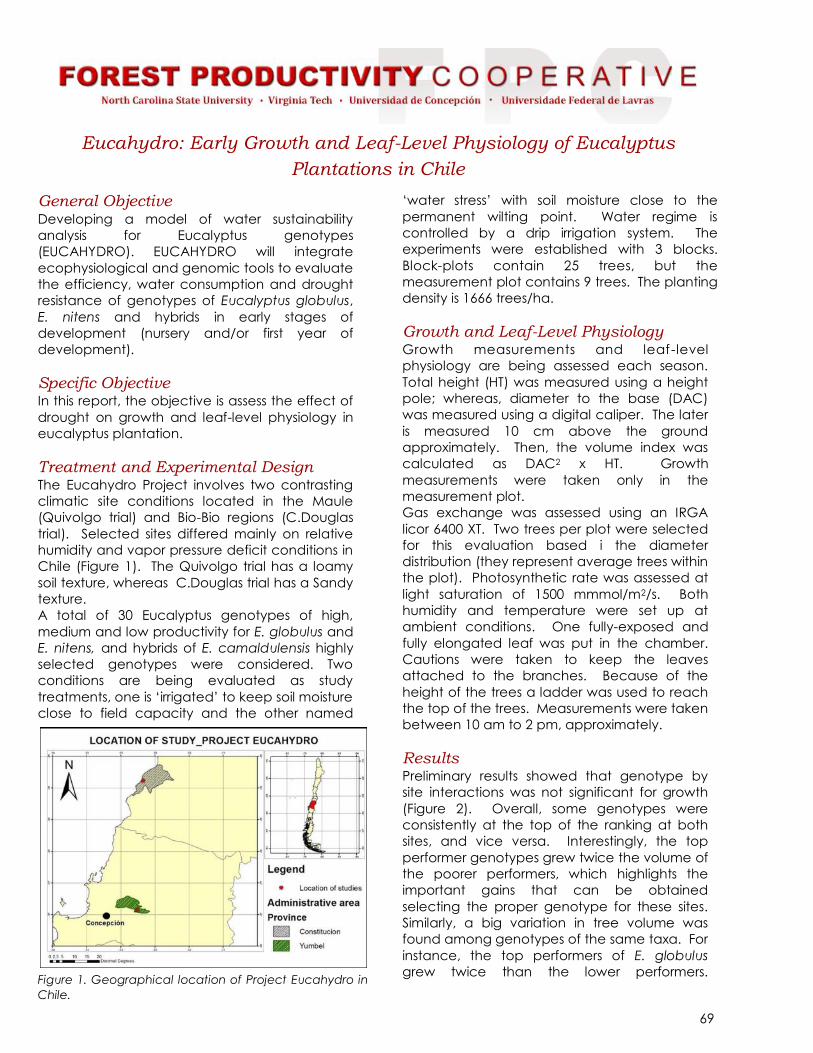
69
Eucahydro: Early Growth and Leaf-Level Physiology of Eucalyptus
Plantations in Chile
General Objective Developing a model of water sustainability
analysis for Eucalyptus genotypes
(EUCAHYDRO). EUCAHYDRO will integrate
ecophysiological and genomic tools to evaluate
the efficiency, water consumption and drought
resistance of genotypes of Eucalyptus globulus,
E. nitens and hybrids in early stages of
development (nursery and/or first year of
development).
Specific Objective In this report, the objective is assess the effect of
drought on growth and leaf-level physiology in
eucalyptus plantation.
Treatment and Experimental Design The Eucahydro Project involves two contrasting
climatic site conditions located in the Maule
(Quivolgo trial) and Bio-Bio regions (C.Douglas
trial). Selected sites differed mainly on relative
humidity and vapor pressure deficit conditions in
Chile (Figure 1). The Quivolgo trial has a loamy
soil texture, whereas C.Douglas trial has a Sandy
texture.
A total of 30 Eucalyptus genotypes of high,
medium and low productivity for E. globulus and
E. nitens, and hybrids of E. camaldulensis highly
selected genotypes were considered. Two
conditions are being evaluated as study
treatments, one is ‘irrigated’ to keep soil moisture
close to field capacity and the other named
‘water stress’ with soil moisture close to the
permanent wilting point. Water regime is
controlled by a drip irrigation system. The
experiments were established with 3 blocks.
Block-plots contain 25 trees, but the
measurement plot contains 9 trees. The planting
density is 1666 trees/ha.
Growth and Leaf-Level Physiology Growth measurements and leaf-level
physiology are being assessed each season.
Total height (HT) was measured using a height
pole; whereas, diameter to the base (DAC)
was measured using a digital caliper. The later
is measured 10 cm above the ground
approximately. Then, the volume index was
calculated as DAC2 x HT. Growth
measurements were taken only in the
measurement plot.
Gas exchange was assessed using an IRGA
licor 6400 XT. Two trees per plot were selected
for this evaluation based i the diameter
distribution (they represent average trees within
the plot). Photosynthetic rate was assessed at
light saturation of 1500 mmmol/m2/s. Both
humidity and temperature were set up at
ambient conditions. One fully-exposed and
fully elongated leaf was put in the chamber.
Cautions were taken to keep the leaves
attached to the branches. Because of the
height of the trees a ladder was used to reach
the top of the trees. Measurements were taken
between 10 am to 2 pm, approximately.
Results Preliminary results showed that genotype by
site interactions was not significant for growth
(Figure 2). Overall, some genotypes were
consistently at the top of the ranking at both
sites, and vice versa. Interestingly, the top
performer genotypes grew twice the volume of
the poorer performers, which highlights the
important gains that can be obtained
selecting the proper genotype for these sites.
Similarly, a big variation in tree volume was
found among genotypes of the same taxa. For
instance, the top performers of E. globulus
grew twice than the lower performers. Figure 1. Geographical location of Project Eucahydro in
Chile.

70
However, growth was decreased by water
stress (Figure 2).
There was a weak, but significant, relationship
between volume increment in some months of
the last growing season with the
photosynthetic rate at both sites (Figure 3).
The data suggests that the decrease in volume
due to water stress may be explain by the
decrease in the photosynthetic rate. At both
sites, photosynthesis averaged 18 mmol/m2 /s
at the irrigated treatment, and dropped to 4
mmol/m2/s at C.Douglas and 8 mmol/m2/s at
Quivolgo at the water stress treatment.
Future Direction Additional assessments on growth and leaf-level
physiology are been done through the seasons.
Moreover, ongoing work is been carried on
water use through sapflow measurement.
Figure 2. Relation between cumulated volume (February
2015) at the C.Douglas versus the Quivolgo site per
genotype (upper panel), and per irrigation treatment
(lower panel).
Figure 3. Relation between the volume increments
(spring 2014—summer 2015) and photosynthetic trate
per irrigation treatment at the C.Douglas (upper panel)
and Quivolgo (lower panel) site.
Photosynthesis (mmol/m2/s)
0 5 10 15 20 25
Vo
lum
e i
ncre
men
t (c
m3)
0
10000
20000
30000
40000
50000
Irrigated
Water stressPlot 1 Regr
Photosynthesis (mmol/m2/s)
0 5 10 15 20 25
Vo
lum
e i
ncre
men
t (c
m3)
0
10000
20000
30000
40000
50000
Irrigated
Water stressPlot 1 Regr
r=0.67 *
r=0.60 *
C.Douglas
Quivolgo
Tree volume (cm3) - C.Douglas
0 10000 20000 30000 40000 50000 60000
Tre
e v
olu
me (
cm
3)
- Q
uiv
olg
o
0
10000
20000
30000
40000
50000
60000
G10Es
G11En
G12Eg
G13Eg
G14Eg
G15En
G16Eg
G17Eg
G18Eg
G19Eg
G1Eng
G20EgG21EgG22Eg
G23Eg
G24Eg
G25Eg
G26Eg
G27EgG28Eg
G29Eg
G2Eng
G30Eg
G3Eng
G4Eng
G5Eng G6Eng
G7Ecg
G8EgG9Eb
Tree volume (cm3) - C.Douglas
0 20000 40000 60000
Tre
e v
olu
me (
cm
3)
- Q
uiv
olg
o
0
10000
20000
30000
40000
50000
60000
70000
Riego
Secano

71
*Evaluation of Early Growth in Productive Genotypes of E. globulus and E.
nitens x globulus in Two Contrasting Conditions of Soil Water Availability
Introduction
Water availability can vary greatly by site and
can be a growth limiting factor, especially in our
changing climate. The selection of species and
even genotypes for each site is critical, as shown
by the large differences in the growth responses
between sectors with contrasting water
availability.
Study Objectives
This study aims to evaluate the
early productivity and growth
efficiency of eight taxa
genotypes of E. globulus and E.
nitens x globulus at two sites
w i t h co n t ra s t in g w at e r
availability.
Treatments and
Experimental Design
Studies were established at two
sites in September 2015 with a
spacing of 4 x 1.5 m, in a
completely randomized block
design with three replications
and 8 treatments (different
genotypes).
The low VPD site had a trumao
soil with a sandy loam texture,
an average annual temperature
(2018-2019) of 12.7 ° C, with a
minimum of 6.5 ° C in July and a
maximum of 19.6 ° C in February,
and an accumulated rainfall of
1640 mm.
The high VPD site had a granitic
soil with a loamy clay texture, an
average annual temperature
(2018-2019) of 13.5 ° C, with a
minimum average of 7.2 ° C in
June and a maximum average
of 20 ° C in February, and an
accumulated rainfall of 657 mm.
Seasonally, starting in summer 2018, the DBH and
total height were measured. Then the volume
per hectare and current annual increment (CAI)
were calculated. In addition, the leaf area index
(LAI) was estimated with a ceptometer.
Results
At the low VPD site, volume and CAI was
significantly higher for E. globulus (73.9 m3ha-1
Figure 1. Cumulative volume and current annual increment (CAI) by taxa and
site.
Figure 2. Low VPD site cumulative volume and current annual increment
(CAI) by genotype.
Figure 3. High VPD site cumulative volume and current annual increment
(CAI) by genotype.

72
and 46.9 m3ha-1year-1) compared to E. nitens x
globulus (55.1 m3ha-1 and 35.4 m3ha-1year-1)
(Figure 1).
The high VPD site had no significant difference in
cumulative volume or CAI between taxa, with
an accumulated volume of 58.8 and 56.9 m3ha-1
and CAI of 32.4 and 32.5 m3ha-1year-1 for E.
globulus and E. nitens x globulus respectively
(Figure 1).
At the genotype level, the low VPD site G17 (E.
globulus) had the highest accumulated volume
and CAI, which was significantly higher than
other genotypes of the same taxa as well as with
all genotypes of E. nitens x globulus (Figure 2).
The high VPD site G21 (E. globulus) had
significantly higher accumulated volume
compared to other genotypes of the same taxa
(G16 and G34) and with G33 (E. nitens x
globulus; Figure 3). Similarly, G21 showed the
best response in CAI, with differences regarding
genotypes of the same taxa (G16, G20 and
G34) as with genotypes of the E. nitens x
globulus taxa (G32 and G33, Figure 3).
There were no significant differences between
sites when comparing the responses at
genotype level for both cumulative volume and
CAI (Figure 4)
The growth efficiency was calculated as the
ratio of CAI to LAI. At the low VPD site, E.
globulus had a significantly higher growth
efficiency than E. nitens x globulus indicating
that an increase of 1 unit of leaf area would
increase the CAI by 16.6 m3ha-1 year-1 whereas,
E. nitens x globulus, would only increase 9.45
m3ha-1year-1. At the high VPD site, the two taxa
evaluated were not significantly different (Figure
5).
Conclusions and Future Direction
E. globulus showed a better early response at
the low VPD site, both in accumulated volume
and CAI compared to E. nitens x globulus.
At both the low and high VPD sites, there are
differences in early growth responses between
genotypes of the same and different taxa.
Despite the same genetic materials being used
at both sites, growth responses were site specific,
indicating that water availability affects each
genotype differently. Therefore, when making
species and genotype selection, managers
should consider environmental and water
variables and the genetic interaction with the
environment (G x E).
Figure 4. Relationship at genotype level between sites (blue line) compared to a 1:1 line (black) for a) cumulative
volume b) CAI.
Figure 5. Relationship between CAI and LAI (leaf area index) according to site a) low VPD and b) high VPD.
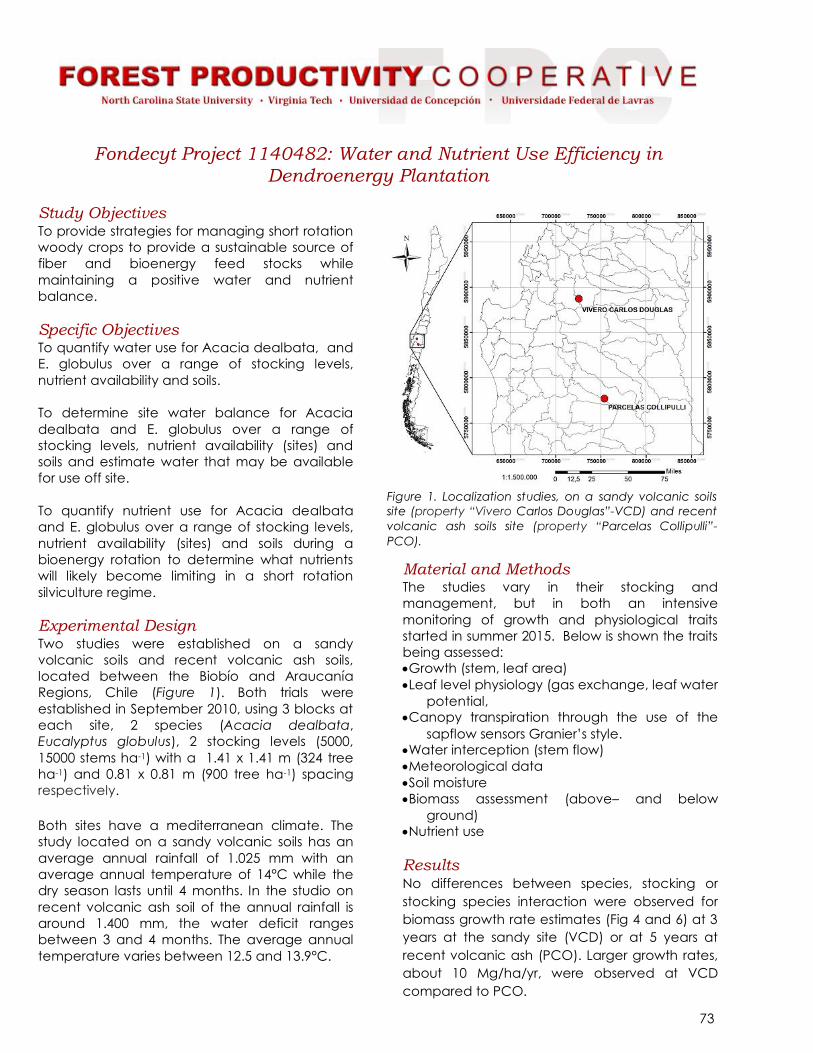
73
Fondecyt Project 1140482: Water and Nutrient Use Efficiency in Dendroenergy Plantation
Study Objectives To provide strategies for managing short rotation
woody crops to provide a sustainable source of
fiber and bioenergy feed stocks while
maintaining a positive water and nutrient
balance.
Specific Objectives To quantify water use for Acacia dealbata, and
E. globulus over a range of stocking levels,
nutrient availability and soils.
To determine site water balance for Acacia
dealbata and E. globulus over a range of
stocking levels, nutrient availability (sites) and
soils and estimate water that may be available
for use off site.
To quantify nutrient use for Acacia dealbata
and E. globulus over a range of stocking levels,
nutrient availability (sites) and soils during a
bioenergy rotation to determine what nutrients
will likely become limiting in a short rotation
silviculture regime.
Experimental Design Two studies were established on a sandy
volcanic soils and recent volcanic ash soils,
located between the Biobío and Araucanía
Regions, Chile (Figure 1). Both trials were
established in September 2010, using 3 blocks at
each site, 2 species (Acacia dealbata,
Eucalyptus globulus), 2 stocking levels (5000,
15000 stems ha-1) with a 1.41 x 1.41 m (324 tree
ha-1) and 0.81 x 0.81 m (900 tree ha-1) spacing
respectively.
Both sites have a mediterranean climate. The
study located on a sandy volcanic soils has an
average annual rainfall of 1.025 mm with an
average annual temperature of 14°C while the
dry season lasts until 4 months. In the studio on
recent volcanic ash soil of the annual rainfall is
around 1.400 mm, the water deficit ranges
between 3 and 4 months. The average annual
temperature varies between 12.5 and 13.9°C.
Material and Methods
The studies vary in their stocking and
management, but in both an intensive
monitoring of growth and physiological traits
started in summer 2015. Below is shown the traits
being assessed:
Growth (stem, leaf area)
Leaf level physiology (gas exchange, leaf water
potential,
Canopy transpiration through the use of the
sapflow sensors Granier’s style.
Water interception (stem flow)
Meteorological data
Soil moisture
Biomass assessment (above– and below
ground)
Nutrient use
Results No differences between species, stocking or
stocking species interaction were observed for
biomass growth rate estimates (Fig 4 and 6) at 3
years at the sandy site (VCD) or at 5 years at
recent volcanic ash (PCO). Larger growth rates,
about 10 Mg/ha/yr, were observed at VCD
compared to PCO.
Figure 1. Localization studies, on a sandy volcanic soils
site (property “Vivero Carlos Douglas”-VCD) and recent
volcanic ash soils site (property “Parcelas Collipulli”-
PCO).

74
Transpiration rates, compared during the
summer season at both sites, showed that at
VCD E. globulus transpired almost 20% more
water than poplars. However, high stocking
(10000 tpha) showed almost double transpiration
rates than 5000 tpha. At PCO no differences
were seen beteen species in daily transpiration
rate. However, similarly to VCD, higher stocking
showed 70% higher rates for Eucalyptus and 20%
higher rates for Acacia. A comparison for E.
globulus showed similar estimates of daily
transpiration for 5000 tpha stocking.
Next Steps Annual estimates of nutrient use estimates will be
obtained using biomass nutrient analyses from
2016 sampling campaigns. Annual estimates of
transpiration will be compared among sites,
species and stockings to evaluate hydric
sustainability of short rotation crops for
bioenergy.
Figure 2. View of the trials at VCD (sandy volcanic soils,
showing the Eucalyptus and Poplar growth at high
planting density
Figure 3. Above and belowground biomass sampling.
Figure 4. Biomass growth comparison for species and
stocking at sandy site.
Figure 5. Average daily transpiration comparison for
species and stocking at sandy site
Figure 6. Biomass growth comparison for species and
stocking at recent volcanic ash.
Figure 7. Average daily transpiration comparison for
species and stocking at recent volcanic ash.

75
The Radiation-Temperature Effect on Cold Tolerant Eucalyptus Species
Introduction A frost tolerance Eucalyptus screening trial was
installed in Raleigh, NC in 2010 consisting of 150
different species on a clayey alfisol soil (fertile).
The first winter was a mild winter and half of the
species were unable to withstand the minimum
temperatures. The 2012 winter proved to be a
harsher winter and another 50 species
experienced severe canopy damage.
Unlike pines that store fixed carbon as
carbohydrates during the winter months,
Eucalyptus species immediately use a big
portion of the fixed carbon for growth when
climate factors allow. Biomass accumulation for
Eucalyptus can be measured weekly because
of their shorter lag time following the fixation of
carbon from photosynthesis.
To fully investigate the existence of potential
new species and how their growth rates are
affected by the radiation-temperature, a
detailed measurement experiment was
implemented in a typical Piedmont area of
North Carolina.
Objectives 1. Determine potential significant difference in
weekly growth among cold tolerant
Eucalyptus species.
2. Create a model to determine weekly growth
as a function of climate variables.
3. Examine the potential lag-time response in
growth and weekly minimum temperature.
Materials & Methods Of the remaining species, seven were shown to
be frost tolerant and also had high growth rates
(Table 1).
Beginning in October 2012, diameter at breast
height (DBH) was measured and recorded
weekly, using a diameter tape to the 1/100th of
an inch to closely examine changes in DBH each
week. Total height was measured monthly using
a telescopic height pole. Between height
measurements, a linear relationship was used to
estimate change in height on a weekly basis.
Results A generalized linear model (table 2) was used to
Table 1. Average weekly biomass growth by species.
Figure 1. 2.5 years-old E. benthamii (center) and E.
viminalis (right) during snow event, 2013 in Raleigh, NC.
Figure. 2. Weekly mean stem biomass growth for each
species during the 59 week study period.

76
test for significant differences among Eucalyptus
species. The species effect was tested against
the random variable plant within species to
determine that there was no significant
differences (alpha-level = 0.05) in weekly growth
among cold tolerant Eucalyptus species.
Endogenous effects of growth were removed by
using the relative weekly growth to isolate the
effects of climate on growth. Due to no
significant differences among cold tolerant
Eucalyptus species, the grand relative mean of
weekly growth was compared to each climate
variable (fig. 3).
Multiple linear regression was used with develop
a model (table 3) to estimate relative weekly
growth of cold tolerant Eucalyptus based on
climate variables and dummy variables related
to seasons. Reciprocal and inverse
transformations were used for growth and time,
respectively.
Sinusoidal functions (fig. 4) were used for weekly
mean minimum temperature and relative
weekly growth to examine the coarse and fine
lag-time responses. Examining seasonal
variation showed an approximately 1.4 week lag
in growth. The residuals show a high correlation
in weekly growth during the winter and spring
weeks and low correlation during the summer
and fall weeks.
Acknowledgements This project is supported by the IBSS project and the
FPC and its cooperators.
Figure 3. Relationship between relative weekly stem
growth of cold tolerant Eucalyptus species and weekly
max, mean, and min mean temperatures, precipitation,
mean vapor pressure deficit, and mean
photosysnthetically active radiation (PAR).
Figure 4. (A) Observed weekly mean minimum
temperature and relative weekly growth, (B) estimated
tmin and relative growth from sinusoidal models, and (C)
residuals from model.
Table 2. Analysis of variance for repeated measures of
weekly growth of cold tolerant Eucalyptus species.
Source df SS MS F val-
ue
Pr > F
Model
Species 6 19.14 3.19 2.42 0.0812
P l a n t
(species)
14 18.45 1.32
Week 56 135.8
8
2.43 34.19 < 0.0001
S p e -
cies*Week
336 43.31 0.13 1.82 < 0.0001
Error 784 55.64 0.07
Total 1196 277.3
6
Table 3. Analysis of variance and parameter estimates
for the MLR analysis of weekly mean temperature and
relative weekly stem growth of Eucalyptus species.
Source df SS MS F value Pr > F
Model 2 36.5747 18.2874 86.0181 < 0.0001
Error 55 11.6930 0.2126
Total 57 48.2677
Parameter Estimate St. error t stat P-value
Β0 -3.0067 0.1210 -24.8471 < 0.0001
Β1 -10.8494 0.9009 -12.0432 < 0.0001
Β2 5.1830 1.5931 3.2533 0.001952

77
Individual Stem Volume, Green Weight and Biomass Equations of Cold
Tolerant Eucalypts
Background A strong research initiative has been focused on
establishing cold tolerant Eucalyptus plantations
across the SEUS in order to expand the region of
potential sites. Freezing winter temperatures
have proven to be the primary climatic variable
that limits the range eucalypts in North America.
As a result, an emphasis has been placed on
frost tolerant Eucalyptus species. The FPC cold
tolerant eucalypt screening trial was established
with 150 species. After three years, six species of
the section Maidenaria have shown sufficient
cold tolerance and fast growth characteristics.
It is necessary to be able to predict individual
stem volume and biomass for the principal
species of interest to accurately assess growth
and yield. Detailed individual stem volume and
biomass equations are necessary when
estimating total yield at the plot or stand level.
With the support of the IBSS grant and the FPC,
forty trees were sampled to determine the stem
volume, green weight and dry weight. The
objectives of this research are to 1) develop
widely applicable total and merchantable
individual stem volume, green weight and
biomass outside– and inside-bark allometric
equations for frost tolerant eucalypts and 2)
quantify the biomass partitioning of E.benthamii
for both above– and belowground
compartments.
Materials & Methods Study trees ranged from two to nine years old to
capture size classes through the anticipated
rotation age (six years). Forty trees were
sampled among six species including E.
badjensis, E. benthamii, E. dorrigoensis, E.
macarthurii, E. nitens and E. viminalis. Sample
trees were selected based on the diameter
distribution of a temporary plot at each site to
adequately represent the size classes.
Following felling, dbh, total height and canopy
height were measured. Branches were removed
from the stem, and the stem was separated into
one-meter bolts to a 2.5-cm top. Each bolt was
weighed, and a disc was collected from the
base of each bolt. The diameter outside– and
inside-bark was recorded for each disc as was
the green weight. Discs and bark were dried to
a constant weight to determine moisture
content and overall dry weight of each bolt.
Smalian’s formula was used to estimate the
volume for each bolt and the volume equation
of a cylinder and a cone were used to estimate
the stump and top-section, respectively. The
summation of each bolt yields to total stem
volume, green weight and dry weight for each
stem (Table 1).
Six nine-year old E. benthamii trees were
selected to determine the allocation of biomass.
Figure 1. E.benthamii 1-m sections in S.Carolina.
Table 1. Summary statistics for total stem volume, green
weight and dry weight of frost tolerant Eucalyptus.
*double bark thickness at breast height
Variables
Mean St. error
Min.
Max.
Per tree basis
dbh (cm) 13.9 0.98 4.0 32.3
Height (m) 11.8 0.84 6.6 25.5
Bark thickness* 2.3 0.23 0.4 7.6
Volume (m3)
Outside-bark 0.1190 0.0248 0.0051 0.821
Inside-bark 0.0992 0.0202 0.0045 0.666
Green weight (kg)
Outside-bark 113.8 26.2 3.0 852.0
Inside-bark 98.9 22.1 2.6 701.3
Biomass (kg)
Outside-bark 53.2 11.3 2.1 349.9
Inside-bark 46.3 10.0 1.8 310.9
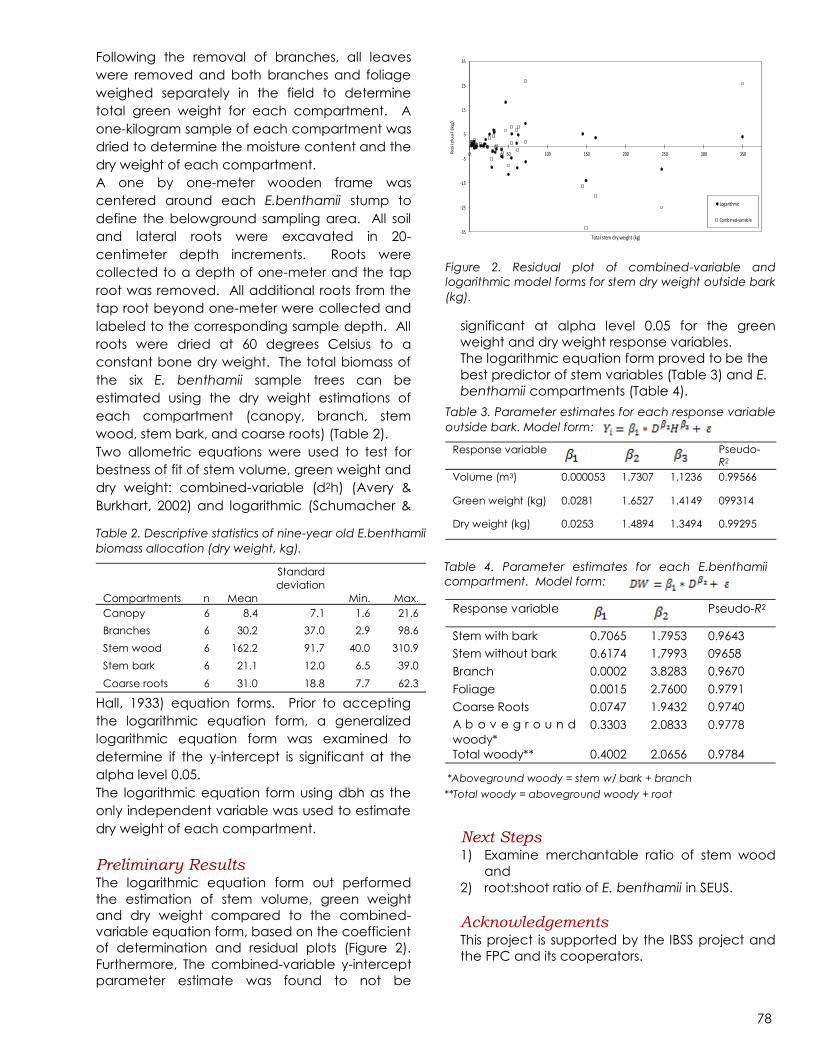
78
Following the removal of branches, all leaves
were removed and both branches and foliage
weighed separately in the field to determine
total green weight for each compartment. A
one-kilogram sample of each compartment was
dried to determine the moisture content and the
dry weight of each compartment.
A one by one-meter wooden frame was
centered around each E.benthamii stump to
define the belowground sampling area. All soil
and lateral roots were excavated in 20-
centimeter depth increments. Roots were
collected to a depth of one-meter and the tap
root was removed. All additional roots from the
tap root beyond one-meter were collected and
labeled to the corresponding sample depth. All
roots were dried at 60 degrees Celsius to a
constant bone dry weight. The total biomass of
the six E. benthamii sample trees can be
estimated using the dry weight estimations of
each compartment (canopy, branch, stem
wood, stem bark, and coarse roots) (Table 2).
Two allometric equations were used to test for
bestness of fit of stem volume, green weight and
dry weight: combined-variable (d2h) (Avery &
Burkhart, 2002) and logarithmic (Schumacher &
Hall, 1933) equation forms. Prior to accepting
the logarithmic equation form, a generalized
logarithmic equation form was examined to
determine if the y-intercept is significant at the
alpha level 0.05.
The logarithmic equation form using dbh as the
only independent variable was used to estimate
dry weight of each compartment.
Preliminary Results The logarithmic equation form out performed
the estimation of stem volume, green weight
and dry weight compared to the combined-
variable equation form, based on the coefficient
of determination and residual plots (Figure 2).
Furthermore, The combined-variable y-intercept
parameter estimate was found to not be
significant at alpha level 0.05 for the green
weight and dry weight response variables.
The logarithmic equation form proved to be the
best predictor of stem variables (Table 3) and E.
benthamii compartments (Table 4).
Next Steps 1) Examine merchantable ratio of stem wood
and
2) root:shoot ratio of E. benthamii in SEUS.
Acknowledgements This project is supported by the IBSS project and
the FPC and its cooperators.
Table 2. Descriptive statistics of nine-year old E.benthamii
biomass allocation (dry weight, kg).
Compartments
n
Mean
Standard
deviation
Min.
Max.
Canopy 6 8.4 7.1 1.6 21.6
Branches 6 30.2 37.0 2.9 98.6
Stem wood 6 162.2 91.7 40.0 310.9
Stem bark 6 21.1 12.0 6.5 39.0
Coarse roots 6 31.0 18.8 7.7 62.3
Figure 2. Residual plot of combined-variable and
logarithmic model forms for stem dry weight outside bark
(kg).
-35
-25
-15
-5
5
15
25
35
0 50 100 150 200 250 300 350Re
sid
ua
l (k
g)
Total stem dry weight (kg)
Logarithmic
Combined-variable
Table 3. Parameter estimates for each response variable
outside bark. Model form:
Response variable
Pseudo-R2
Stem with bark 0.7065 1.7953 0.9643
Stem without bark 0.6174 1.7993 09658
Branch 0.0002 3.8283 0.9670
Foliage 0.0015 2.7600 0.9791
Coarse Roots 0.0747 1.9432 0.9740
A b o v e g r o u n d
woody*
0.3303 2.0833 0.9778
Total woody** 0.4002 2.0656 0.9784
Table 4. Parameter estimates for each E.benthamii
compartment. Model form:
*Aboveground woody = stem w/ bark + branch
**Total woody = aboveground woody + root
Response variable
Pseudo-
R2
Volume (m3) 0.000053 1.7307 1.1236 0.99566
Green weight (kg) 0.0281 1.6527 1.4149 099314
Dry weight (kg) 0.0253 1.4894 1.3494 0.99295
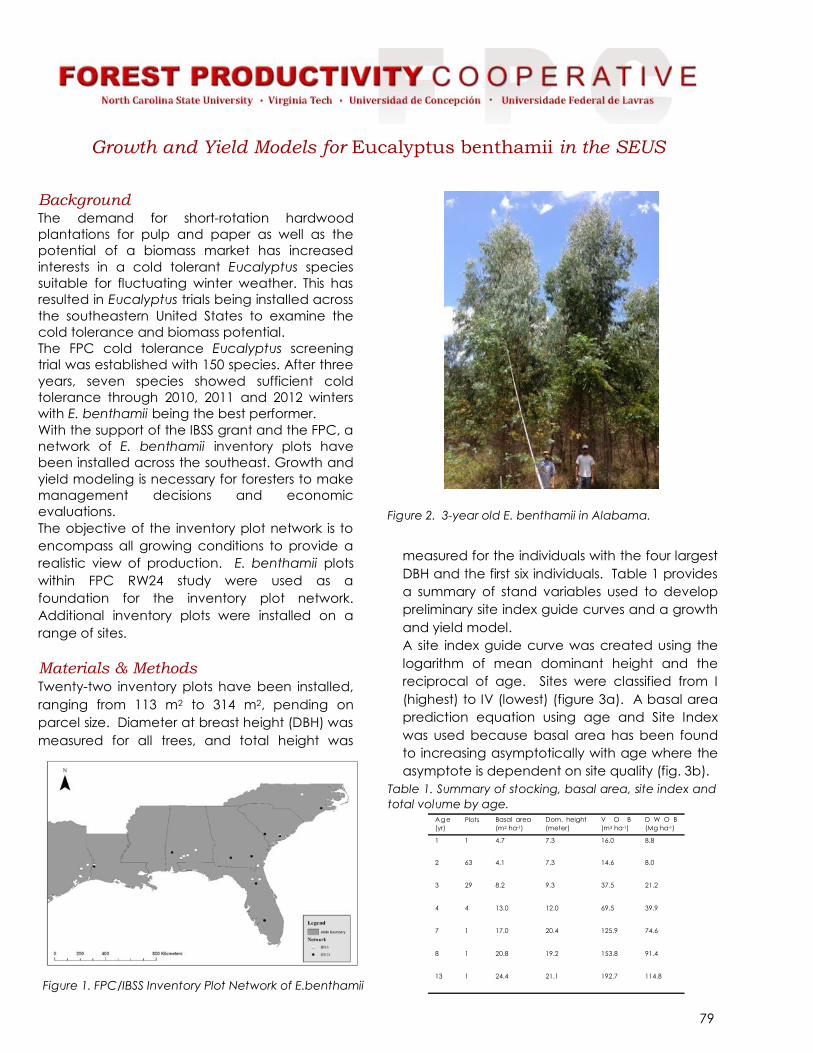
79
Growth and Yield Models for Eucalyptus benthamii in the SEUS
Background The demand for short-rotation hardwood
plantations for pulp and paper as well as the
potential of a biomass market has increased
interests in a cold tolerant Eucalyptus species
suitable for fluctuating winter weather. This has
resulted in Eucalyptus trials being installed across
the southeastern United States to examine the
cold tolerance and biomass potential.
The FPC cold tolerance Eucalyptus screening
trial was established with 150 species. After three
years, seven species showed sufficient cold
tolerance through 2010, 2011 and 2012 winters
with E. benthamii being the best performer.
With the support of the IBSS grant and the FPC, a
network of E. benthamii inventory plots have
been installed across the southeast. Growth and
yield modeling is necessary for foresters to make
management decisions and economic
evaluations.
The objective of the inventory plot network is to
encompass all growing conditions to provide a
realistic view of production. E. benthamii plots
within FPC RW24 study were used as a
foundation for the inventory plot network.
Additional inventory plots were installed on a
range of sites.
Materials & Methods Twenty-two inventory plots have been installed,
ranging from 113 m2 to 314 m2, pending on
parcel size. Diameter at breast height (DBH) was
measured for all trees, and total height was
measured for the individuals with the four largest
DBH and the first six individuals. Table 1 provides
a summary of stand variables used to develop
preliminary site index guide curves and a growth
and yield model.
A site index guide curve was created using the
logarithm of mean dominant height and the
reciprocal of age. Sites were classified from I
(highest) to IV (lowest) (figure 3a). A basal area
prediction equation using age and Site Index
was used because basal area has been found
to increasing asymptotically with age where the
asymptote is dependent on site quality (fig. 3b).
Figure 2. 3-year old E. benthamii in Alabama.
Table 1. Summary of stocking, basal area, site index and
total volume by age. A ge
(yr)
Plots Basal area
(m2 ha-1)
Dom. height
(meter)
V O B
(m3 ha-1)
D W O B
(Mg ha-1)
1 1 4.7 7.3 16.0 8.8
2 63 4.1 7.3 14.6 8.0
3 29 8.2 9.3 37.5 21.2
4 4 13.0 12.0 69.5 39.9
7 1 17.0 20.4 125.9 74.6
8 1 20.8 19.2 153.8 91.4
13 1 24.4 21.1 192.7 114.8
Figure 1. FPC/IBSS Inventory Plot Network of E.benthamii

80
Yield is a function of a measure of site quality
and stocking. Dominant height is the equivalent
of site quality based on the Site Index-Age
relationship. A Schumacher model form was
used with mean dominant height and basal
area to predict volume and biomass yields.
Using current the stand attributes and the
associated age, mean dominant height and
basal area were predicted for each age class.
Grouping sites by site index class, the mean
yields were observed (fig. 4).
Results Using a base age of six years, Site Index ranged
from 8 (SI-IV) to 20 (SI-I) meters with a mean of
13.6-m.
Current (CAI) and mean (MAI) annual
increments were estimated for each site index
class yield curve and observed MAI was plotted
in figure 5. MAI for E. benthamii in the SEUS
ranged from 28 m3 ha-1 yr-1 or 18 Mg ha-1 yr-1 (SI-I)
to 14 m3 ha-1 yr-1 or 8 Mg ha-1 yr-1 (SI-III). The
inflection point (CAI=MAI) of the yield curves
ranges in age from year 6 (SI-I) to year 9 (SI-III & SI
-IV).
Acknowledgements This project is supported by the IBSS project and
the FPC and its cooperators. The IBSS project is
supported by the Agriculture and Food
Research Initiative Competitive Grant no. 2011-
68005-30410 from the USDA National Institute of
Food and Agriculture.
Figure 3. (A) Anamorphic site index guide curves and
mean dominant height (m) of inventory plots of
E.benthamii in the SEUS. (B) Projected mean basal area
by site index for all plots.
I
III
IV
II
Figure 4. Yield curve by site index class for volume (A)
and biomass (B) per hectare.
Figure 5. Current (CAI) and mean (MAI) annual
increments for volume (left column) and biomass (right
column) with observed MAI values from inventory plots of
E.benthamii in SEUS.
A
A
B
B
SI-I SI-I
SI-II SI-II
SI-III SI-III

81
Eucalyptus Special Project - Cold Tolerant Eucalyptus Plus Tree Selection
and Archival
Background A research initiative has been focused on
establishing cold tolerant Eucalyptus plantations
across the SEUS in order to expand the region of
potential sites. An emphasis has been placed
on frost tolerant Eucalyptus species. The FPC
cold tolerant Eucalyptus screening trials (RW24s)
were established with 150 species. After four
winters of screening, all sites were visited twice to
identify trees with the superior growth and cold
tolerance.
Objectives 1. Identify and rank Eucalyptus trees with
superior growth and cold tolerance across
the FPC network of sites;
2. Archive identified trees through the
collection of scion material for grafting and
basal sprouts for rooted cuttings;
3. Establish cold tolerant Eucalyptus seed
orchard;
4. Propagate material for cold tolerant
Eucalyptus clonal testing and silvicultural
trials.
Materials & Methods A total of 331 Plus Trees were identified across
eight sites in the SEUS (Table 1). Of the 201 Plus
Trees, an emphasis was placed on the
preservation of E. benthamii material (Table 2).
The archiving of Plus Trees consisted of two types
of material collected: scions (fig. 1) and basal
sprouts (fig. 2). Scions were collected in 2015
from the healthy, actively growing branches in
the upper third of the canopy. Grafting was
completed by WestRock in 2015.
Beginning in the Fall of 2015, Plus Trees were
hinged to induce basal sprouts. Adjacent trees
and any brush are removed near the Plus Tree to
allow full sun to reach the stump. Plus Trees
were felled leaving approximately 10% of the
cambium attached. Beginning in Spring 2016,
Figure 1. Scions (left) and success graft union ( right).
Table 1. All FPC Plus Trees by priority code and location.
Location
Plus
Trees
Blackshear, GA 72
Ravenel, SC 53
Citra, FL 20
Moultrie, GA 19
Merryville, LA 18
Leroy, AL 14
Raleigh, NC 3
Allendale, SC 2
Total 201
Table 2. All FPC Plus Trees by priority code and species.
Species Total
E.benthamii 155
E.dorrigoensis 17
E.badjensis 4
E.viminalis 4
E.cinerea 3
E.dalrympleana 3
E.amplifolia 2
E.camphora 2
E.gunnii 2
E.macarthurii 2
E.neglecta 2
E.crenulata 1
E.kartzoffiana 1
E.nicholii 1
E.nobilis 1
E.pauciflora 1
Total 201

82
sprouts were collected monthly from hinged
trees and any remaining coppice was trimmed
to produce new juvenile material for later
collections.
Preliminary Results 201 Plus Trees were selected across 8 sites
consisting of 16 Species. In 2015, scions were
collected for 55 trees resulting in 24 successful
grafts (Table 3).
All trees were hinged in Spring 2016 with the
exception of younger E. benthamii in Blackshear,
GA. Approximately 70% of the hinged trees
produced healthy sprouting and sprouts were
collected and transported to NCSU for rooting.
Of the 87 Plus Trees collected, 29 have
confirmed rooting as of September 2016.
The rooting efforts are ongoing, with
approximately 3,000 cuttings from more than 70
Plus Trees currently in the greenhouse, but have
not yet been confirmed as successfully rooted.
A total of 46 Plus Trees have been successfully
archived through either grafting or rooting. 25
Plus Trees were successfully grafted in 2015, and
35 have been successfully rooted. 14 Plus Trees
have been captured through both grafting and
rooting. In 2015, 60 trees representing 33
genotypes were planted in the FPC seed
orchard/clonal archive on IFCO’s property at
Moultrie, GA.
Next Steps 1. Sprouts will continue to be collected and
rooted.
2. Testing will begin to optimize rooting based
on cutting type and hedge fertilization.
3. A pilot-scale clonal test with a small number
of archived clones is planned for 2017.
4. Newly archived clones will be placed in an
orchard for preservation and use.
Table 3. Number of Plus Trees selected for archiving, hinged, scions collected and grafted in 2015, and rooting work
completed as of September 2016.
Species Plus Trees Hinged Scions
Collected
Successful
Grafts
Sprouts
Collected
Successful
Rooting
E. benthamii 155 88 40 21 68 34
E. dorrigoensis 17 17 13 4 13 1
E. badjensis 4 4
E. viminalis 4 4 1 3
E. cinerea 3 3
E. dalrympleana 3 3 1
E. amplifolia 2 2 1
E. camphora 2 2
E. gunnii 2 1
E. macarthurii 2 2 1
E. neglecta 2 2
E. crenulata 1 1
E. kartzoffiana 1 1
E. nicholii 1 1
E. nobilis 1 1
E. pauciflora 1
Total 201 131 55 25 87 35
Figure 2. (A) Coppice from hinged Plus tree, (B) sprout
collection, and (C) successfully rooted cutting.

83
Special Study: Nelder Spacing Trial to Evaluate Acacia mangium
Development in the Northeast Llanos of Venezuela
Study Objective
Our objective was to assess the effect of
planting density on survival and growth of
Acacia mangium in the Llanos of northeast
Venezuela, an area with low fertility and low
water availability.
Treatment and Experimental Design
The Nelder design study was established on a
cutover Pinus caribaea plantation that was
burned before manual planting with a spade.
Weed control was applied mechanically to all
plots after planting and weed-free conditions
were sustained throughout the experiment.
Trees from the SSO-Lanercost PNG-N-QLD
provenance were planted July 2011. At
planting, tree height ranged from 20 to 25 cm
and root collar diameter was on average
slightly greater than 3 mm. Between each set
of ‘spokes’ of the Nelder, stocking ranged
from 2267 trees ha-1 in the middle of the Nelder
to 200 trees ha-1 at the outer edge (Figure 1
and Table 1). The Nelder was divided into
sections with and without pruning.
Results
Fifty-five months after establishment, average
diameter at breast height across all stocking
levels was 15 cm and 12.5 cm for with and
without pruning treatments, respectively
(Figure 3). The average height (13.2 m) did
not vary among the pruning treatments.
Figure 1. Nelder trial layout in Venezuela.
Table1. Stocking treatments in the Nelder design for
Acacia mangium in Venezuela.
Figure 2. Five-year growth for Spacing 6 (333 trees ha-1)
treatment in the Nelder with Acacia mangiun.
Spacing
Distance
from the
center
Distance between a
radio and otherstree /ha
Spacing1 11.4 2267
Spacing2 13.8 2.4 1545
Spacing3 16.7 2.9 1052
Spacing4 20.2 3.5 717
Spacing5 24.5 4.2 489
Spacing6 29.7 5.1 333
Spacing7 36 6.2 227
Spacing8 43.6 7.6 200

84
Pruning significantly increased diameter at
breast height for all planting densities (p˂0,05,
Figure 4). The increase in diameter due to
pruning was greater at low planting densities.
Diameter decreased in both pruning
treatments from low to high stocking levels.
Height was not influenced by stocking or
pruning (p˃0,05). Survival was greater than
88% across all stocking levels and both pruning
treatments (Figure 5). The high survival is likely
due to the intensive vegetation control (weed
free) applied in the study.
Future Direction
Annual measurements will be completed to
provide information on productivity.
Acknowledgements
This project is supported by MASISA Venezuela,
and the Forest Productivity Cooperative and
its cooperators.
Figure 4. Diameter at breast height (DBH) and height
(H) by pruning treatment and planting density 55
months after establishment. The bars show Figure 3. Diameter at breast height (DBH) and height
(H) over time. The bars show the standard error.
Figure 5. Survival for the stocking and pruning
treatments in the Nelder with Acacia mangium in
Venezuela, 55 months after establishment.

85
Special study: Nelder Spacing Trial to Evaluate the Effect of Spacing on
Growth of Eucalyptus brassiana in Venezuela
Introduction Initial planting density and spacing is one of the
most important decisions made at stand
establishment. It affects not only the productivity
of the stand but also wood quality and
profitability. Economically, density and spacing
drive the associated operating costs, due to the
number of plants, the number of lines of tilled soil
or soil preparation machinery, initial fertilization,
intensity and frequency of weed control.
Trial Objective To assess the effect of planting density on
survival and growth of Eucalyptus brassiana on
sites with low fertility and low water availability in
the Llanos region of northeast Venezuela.
Treatment and Experimental Design The study site was established in June 2014 in
the Llanos Orientales region of Venezuela. The
location’s altitude is 97 meters above mean
sea level, mean annual temperature is 27°C
and annual precipitation is 1100mm. The soil
conditions at the site predominantly consists of
a sandy loam, and is well drained. The site
index before establishment was 18 m at age
18. Each site was initially treated by slash
burning. Five month-old cuttings of E. brassiana
were planted in a Nelder design, where
planting density ranged from 173 to 5277 trees
ha-1, summarized in Table 1. Fertilizer was
applied one month after planting as 200 g
plant-1 of a 12-24-12 (N-P-K) mixture. Weed
control was mechanical. A typical three year
old site is illustrated in figure 1.
Field measurements were conducted in April
2015, April 2016 and June 2017. Stem height
was recorded via clinometer per stem. A
general linear model analysis (in SAS) was used
to evaluate the effects planting density on
growth over three years.
Results
With reference to figure 2, the range of trees
per spacing with no damage was 64-94%.
Suppressed trees were more prevalent in the
Table 1. Planting densities in the Nelder plot with E.
brassiana.
Figure 2. Survival and damage for the Nelder trial with
E. brassiana in Venezuela, three years after
establishment.
Figure 1. View of the Nelder trial on Eucalyptus brassi-
ana in Venezuela.

86
lowest and highest planting densities, however
the locations with 173 or 225 trees ha-1 showed
the highest proportions. Overall, mortality was
low across all densities. The largest mortality
observed was 5% at a density of 225 trees ha-1.
A significant relationship (p<0.05) was observed
between the initial planting density and tree
height three years after establishment (Figure
3). Total height at year three typically
exceeded 12m, and ranged from 10.3 to 13m.
The lowest height was for 173 trees ha-1.
A significant (p<0.05) correlation between DBH
and planting density was also observed (see
figure 4). The largest increases in DBH between
years two and three was observed when
stocking was of a lower density (173 to 1042
trees ha-1). A smaller increase in DBH was
evident at higher densities, e.g. 5227 trees ha -
1).
Finally, a correlation between density and
volume per tree (p<0.05) was observed,
specifically for the measurements made three
years after establishment (see figure 5). The
minimum volume was approximately 30,000
cm3 per tree, and 55,000 cm3 per tree for the
maximum. Smaller volumes were typically
associated with the extremities of the densities
tested (173 and 5277 tree ha-1). Larger volumes
were found in the low to mid-range of stem
densities.
Future Direction
Annual measurements will be completed to
assess the effect of planting density on tree
growth and to provide data for modeling
purposes.
Acknowledgements
This project is supported by MASISA Venezuela,
the Forest Productivity Cooperative and its
cooperators.
Figure 4. Diameter at breast height (DBH) for the
Nelder trial with E. brassiana in Venezuela, two and
three years after establishment. The bars show
standard error. Same letter represent treatments that
are not significantly different one each other.
Figure 3. Total height (H) for the Nelder trial with E.
brassiana in Venezuela, one, two and three years
after establishment. The bars show standard error.
Same letter represent treatments that are not
significantly different one each other.
Figure 5. Volume per tree for the Nelder trial with E.
brassiana in Venezuela, two and three years after
establishment. The bars show standard error. Same letter
represent treatments that are not significantly different
one each other.

87
NPK Fertilizers Dosage Trial in Eucalyptus urophylla in Venezuela
Background
Eucapyptus urophyllla is a interesting specie with
great potential to be developed in some
Venezuelan regions. E. urophylla is one of the
most important fast growing species considered
in the forest genetic improvement program and
it’s a good specie for poor sites. It could reach
productivities from 20-35 m3/ha in sandy soils
and under the 15 m3/ha in less sandy soils. Soils
are classified as Ustoxic Quartzipsamments/
Arenic Kandiustults, with coarse sands, low
retention humidity , presenting high nutrient
limitations, low pH (4.5-5.5) associated to low
organic matter, nitrogen, phosphorous,
potassium and calcium.
In this context, and in order to improve the
knowledge about the NPK fertility management
of this specie in these areas, it was installed this
study with MASISA S.A company.
Trial objectives
1. To determine a minimal dose of NPK that
increases the growth response of E. urophylla.
2. To model the biological and economical
response to doses and sources of fertilizers
during the first 4 years of development.
Treatments and Experimental Design
The study area is located in the Guayana city, it
was established two managements units: the
Imataca and Guayamure site. This heritage
presents the highest precipitations in Imataca
with 1200 mm annual precipitations and
Guayamure with 1100 mm, both sites have
deep sandy soils (above 100 cm), typical of the
Guayana region (Figure 1).
The study design is a random complete block
design with three replicates. The treatments 01,
Figure 1. Doses of NPK fertilizers study in Eucalyptus urophylla established in Venezuela.

88
02 03 and 04 were applied at superficial level.
The 05 treatment combine superficial and deep
fertilization, with 120 and 240 g plant –1
respectively (Table 1, Figure 2). Individual
treatment plots have 7x7 trees planted at a 4x3
m spacing which corresponds to 833 trees/ha.
Internal measurement plots include 25 trees in
the interior 5 rows by 5 planting spaces.
This study will allow to generate basis
information in order to guide the future decision
–making about fertilization program.
Future Direction
Annual measurements consider total height,
DBH and mortality and soil and foliage nutrient
analyses. Soil chemical properties will be
sampled annually to adjust soil indicators that
may be used as predictors of potential response
to applied nutrients.
Acknowledgements This project is supported by MASISA Venezuela,
and the Forest Productive Cooperative and its
cooperators.
Table 1. Treatment description for the dose of NPK
fertilizers trial in Eucalyptus urophylla established in
Venezuela. August 2016.
N P K
(g plant-1
) (g plant-1
) (g plant-1
)
00 - 0 0 0
01 120 4.2 10.5 19.9
02 180 6.3 15.7 29.9
03 240 8.4 21.0 39.8
04 360 12.6 31.4 59.8
05120 sup +
240 depth12.6 31.4 59.8
Description
10 20 20
Dose
(g plant-1
)Code Product
Figure 2. Site view of the study area (top picture), superficial
fertilization (bottom right) and superficial +depth application.

89
Hybrid Growth and Yield Models for Eucalyptus Clones Subject to Different
Environmental Conditions in Brazil
H. F. Scolforo, J. Stape, J. Roise, J. P. McTague, H. Burkhart, J. McCarter
Introduction The culture of Eucalyptus is expanding in many
regions of Brazil, however, much of the area
under cultivation has limitations to plant
productivity, notably with different levels of
water stress. Eucalyptus plantations are primarily
clonal, and these clones are adapted for each
of these regions, due to the strong genotype x
environment (GxE) interaction. This results in
more complex decisions when selecting suitable
genotypes for different environmental
conditions. It is necessary to identify the most
promising materials for each situation (Stape et
al., 2010).
The success of forest plantations, including the
matching of genotypes to different climate and
soil conditions, has a large effect on the
economics of the enterprise and on the
generation of social value to the local
communities (Stape et al., 2010).
In the tropical regions of Brazil, the year-to-year
variation in temperature and rainfall causes
significant variability of the mean annual
increment of Eucalyptus clonal plantations,
which have an accelerated growth rate and
high demand for water.
Therefore, projections made from different
regions and years can lead to completely
different responses, creating insecurity for those
who must do the forest planning. Thus, the
evolution of descriptive models including
environmental variables and hybrid models are
necessary to improve the biometric functions
and enable more accurate projections.
Objective The goal of this project is to model the growth
and yield of the 11 most important clones in
Brazil at 30 different sites with the insertion of
biophysical variables that most influence the
GxE interaction. We intend to reduce the
estimated errors and to provide a mathematical
expression of physiological sensitivity to the
models, which will increase the generalizability
power of the same. The following specific
objectives will be undertaken:
Evaluate if it is feasible to group the 11 clones in
2 or more ideotypes;
Develop descriptive models for Eucalyptus in 30
sites in Brazil;
Develop descriptive models for the same
clones with the addition of biophysical
variables;
Develop hybrid models for these same clones
and sites;
Evaluate the accuracy of the descriptive
models with and without the GxE interaction;
Evaluate the accuracy of hybrid models;
Propose the most appropriate way to model
the GxE interaction for Eucalyptus, with the
goal of developing models that are capable
of being general, realistic and accurate.
Material and Methods Forest inventory data
The "Clonal Eucalyptus Tolerance to the Hydrous
and Thermal Stresses" – TECHS, which is a project
that investigates with greater accuracy the main
environmental stresses to Eucalyptus (water and
heat), is providing the data.
The data set consists of permanent inventory
plots across 30 different sites of Brazil (Figure 1)
evaluating 11 Eucalyptus clones for each site.
Plots were installed in 2012 and the forest
inventory completed its first measurement in
2013. By 2018 there will be approximately 6 years
of semiannual data representing a complete
rotation for each of the 11 clones.
The measured growth variables include:
diameter at breast height (DBH), height (H),
canopy height (Hc) and survival (N).
The inventory also contains variables such as
Leaf Area Index (LAI), nutrient analysis of foliage
and soil, soil structure, hydraulic analysis,
measurement of evapotranspiration, plus a
complete daily record of climatic data.

90
Modeling
Studies have been undertaken to improve the
understanding of the growth of these clones,
including the interaction of GxE. Tests checking
clones that are performing similarly have been
conducted. Different levels of descriptive
models, including their combination, have been
tested, such as the Sullivan and Clutter model
(Sullivan and Clutter, 1972), Weibull distribution
and McTague’s approach (McTague et al.,
2008).
In addition, descriptive models with the addition
of biophysical variables (Scolforo et al., 2016,
Sabatia and Burkhart, 2013) have been tested.
Finally, hybrid models such as in Almeida et al.
(2003), where the authors combined 3-PG and a
descriptive growth model will be tested.
Results Prior to applying the concept of idiotypes, we
checked the bias reduction when including
biophysical variables in the descriptive
modeling. As shown in Figure 1, Brazil has high
climatic variation among its regions, which
substantially affects eucalyptus growth.
Therefore, on average, the descriptive model
performs well for site index modeling; however,
for extreme values (north of Minas Gerais State—
the driest site—and South of Sao Paulo State—
one of the wettest sites) this approach tends to
under- or over-estimate the predictions (Figure
2). Thus, by combining the mixed effect
modeling approach, plus the climatic modifier,
this bias is basically removed (Figure 2).
Next Steps The study began in August 2014 and is
scheduled for completion in May 2018.
References
Almeida AC et al. 2003. Linking process based
and empirical forest models to use as a practical
tool for decision-making in fast growing
eucalyptus plantation in Brazil. In Modelling
Forest Systems (Eds: A. Amaro, D. Reed, P.
Soares), p. 63-74. CABI Publishing, Oxford.
McTague JP et al. 2008. The SOHARC Model
System for Growth and Yield of Southern
Hardwoods. South. J. Appl. For. 32: 173-183.
Sabatia CO and Burkhart H. 2014. Predicting site
index of plantation loblolly pine from biophysical
variables. For. Ecol. Manag. 326:142-156.
Scolforo HF et al. 2016. Modeling dominant
height growth of eucalyptus plantations with
parameters conditioned to climatic variations.
For. Ecol. Manage.
Stape JL et al. 2010. The Brazil Eucalyptus
Potential Productivity Project: Influence of water,
nutrients and stand uniformity on wood
production. For. Ecol. Manage. 259, 1684-1694.
Sullivan AD and Clutter JL. 1972. A simultaneous
growth and yield model for loblolly pine. For. Sci.
18, 76-86.
Figure 1. Climatic zoning of Brazil and 30 sites of TECHS.
Figure 2. Site index modeling without (a), and with cli-
matic variables (b).

91
Potential Productivity of Eucalyptus maidenii and E. globulus in Uruguay
Introduction
Seven studies were established in Uruguay by
Farm & Forestry Management Services Cattivelli
(Eg) (2007), Esquenet (Em) (2008), Lemosur(Eg)
(2009), Parma (Em)(2008), Singer (Eg)(2009), Villa
Roble (Eg)(2011) and Yatay (Eg)(2007). The trials
were established in 2012 and were located in
the Provinces of Florida, Lavalleja, Maldonado
and Treinta y Tres for E. grandis and E. maidenii
(Figure 1). Studies were established on a well
(sandy loam) and moderately well (clay loam)
drained soils, considered taxonomically
Brunosoles. The previous use of the region was
mostly grazing. The average annual
temperature in the region is 16.5 º C, with an
annual rainfall of 1200 mm.
Objectives To determine the potential response of
Eucalyptus globulus (Eg) and E. maidenii (Em)
plantations established without weed
competition and high levels of nutrient
availability.
To determine the response that validates the
need to incorporate intensive management
Eucalyptus sp. plantation company.
To identify opportunities to increase the
profitability of plantations established in
southeastern Uruguay.
Treatments and Experimental Design To determine the potential responses of
Eucalyptus globulus and Eucalyptus maidenii,
the experiment was set up in a number of stand
having different ages (Table 2). The treatments
consisted of two homogeneous plots, one was
considered a control plot. In the case of new
plantations, the control plot was managed using
standard practices by the company. The
fertilized plots (potential productivity) were kept
free of competing vegetation for 2 years and will
be fertilized annually or seasonally for two years
(Table 1).
Height (m) and DBH (cm) measurements have
been taken annually for each trial. In this report
we synthesize the data 3 years after
establishment.
Results The increments in DBH, Height and live crown
were significantly different among the sites.
Overall, fertilization only increased marginally,
but significantly DBH with no effects on HT
variables (4.73 vs 4.24 cm for DBH of the fertilized
and none fertilized plots, respectively).
The younger stands at the treatment
establishment (YTA=3) had the higher increment
in growth (5.8 cm increment in DBH and 7.7 m
increment in HT) (Figure 2). So far there had not
been a consistent growth response associated
to the fertilization treatment in the Eucalyptus
Figure 1. Geographical location of the study sites
Table 1. Fertilization treatments for age and elemental
dose (kg ha-1).
Age TreatmentsAplications
by yearInstances
0 50 N + 25 P + 25 K + 200 Ca + 15 Mg + 1 Zn + 1 Cu + 2 B2
Establishment
Fall Next Year
2 100 N + 50 P + 50 K + 400 Ca + 30 Mg +3 Zn + 2 Cu + 3 B 2 Spring
Fall
4 150 N + 50 P + 50 K + 400 Ca + 30 Mg +3 Zn + 2 Cu + 3 B 2 Spring
Fall
6 150 N + 50 P + 50 K + 400 Ca + 30 Mg +3 Zn + 2 Cu + 3 B 2 Spring
Fall
8 150 N + 50 P + 50 K + 400 Ca + 30 Mg +3 Zn + 2 Cu + 3 B 2 Spring
Fall
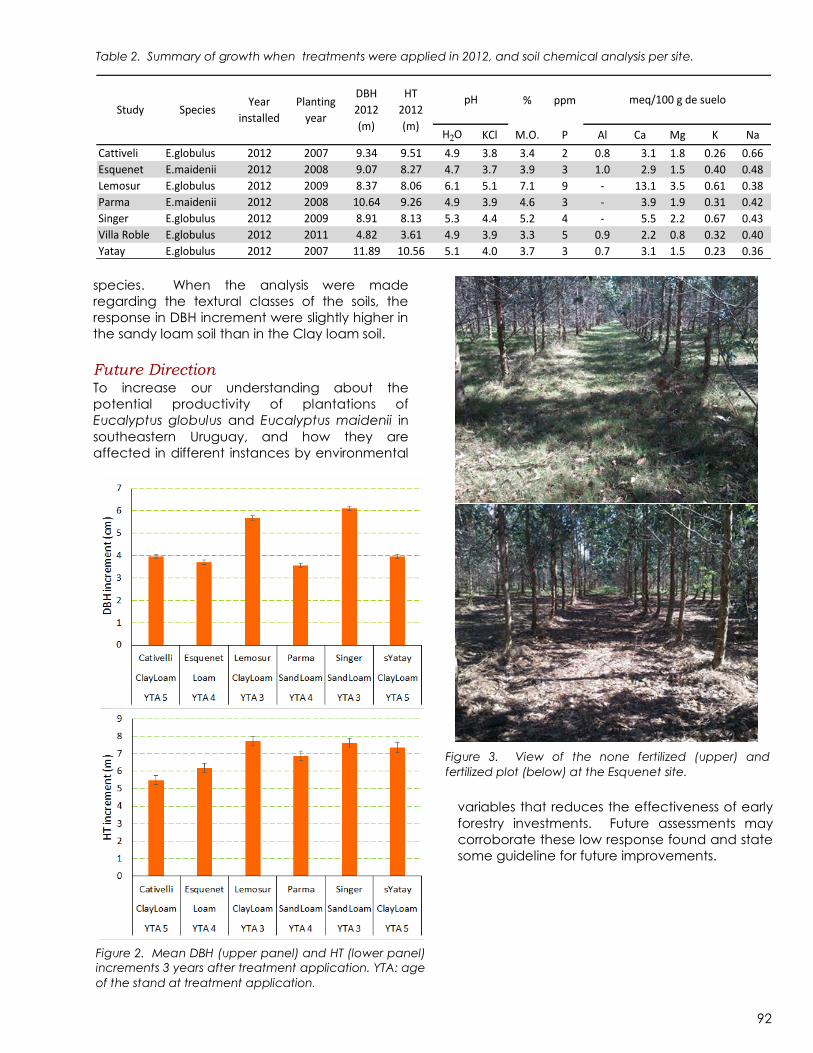
92
species. When the analysis were made
regarding the textural classes of the soils, the
response in DBH increment were slightly higher in
the sandy loam soil than in the Clay loam soil.
Future Direction To increase our understanding about the
potential productivity of plantations of
Eucalyptus globulus and Eucalyptus maidenii in
southeastern Uruguay, and how they are
affected in different instances by environmental
variables that reduces the effectiveness of early
forestry investments. Future assessments may
corroborate these low response found and state
some guideline for future improvements.
Figure 3. View of the none fertilized (upper) and
fertilized plot (below) at the Esquenet site.
% ppm
H2O KCl M.O. P Al Ca Mg K Na
Cattiveli E.globulus 2012 2007 9.34 9.51 4.9 3.8 3.4 2 0.8 3.1 1.8 0.26 0.66
Esquenet E.maidenii 2012 2008 9.07 8.27 4.7 3.7 3.9 3 1.0 2.9 1.5 0.40 0.48
Lemosur E.globulus 2012 2009 8.37 8.06 6.1 5.1 7.1 9 - 13.1 3.5 0.61 0.38
Parma E.maidenii 2012 2008 10.64 9.26 4.9 3.9 4.6 3 - 3.9 1.9 0.31 0.42
Singer E.globulus 2012 2009 8.91 8.13 5.3 4.4 5.2 4 - 5.5 2.2 0.67 0.43
Villa Roble E.globulus 2012 2011 4.82 3.61 4.9 3.9 3.3 5 0.9 2.2 0.8 0.32 0.40
Yatay E.globulus 2012 2007 11.89 10.56 5.1 4.0 3.7 3 0.7 3.1 1.5 0.23 0.36
HT
2012
(m)
pH meq/100 g de sueloStudy Species
Year
installed
Planting
year
DBH
2012
(m)
Table 2. Summary of growth when treatments were applied in 2012, and soil chemical analysis per site.
Figure 2. Mean DBH (upper panel) and HT (lower panel)
increments 3 years after treatment application. YTA: age
of the stand at treatment application.

93
Genotypic Variation and Genotype by Environment (GxE) Interactions of 52
Populus Genotypes on two Sites in the Southeast US
N. Thomas, B. Goldfarb, E. Nichols, C. Maier, D. Hazel
Introduction Populus is known as the fastest growing domestic
tree species in temperate climates. In the United
States, poplar plantations are distributed
primarily in three areas: the Pacific Northwest,
the Mississippi Alluvial Valley, and the Lake
States. Recently, the evolving bioenergy market
and its potential in the Southeast have created
interest in poplar as a SRWC. The challenges of
creating a renewable biomass industry warrant
the deployment of clonal trials throughout the
region. This study is focused on 52 clones of
eastern cottonwood and hybrid poplar planted
on two sites in the Southeast US.
Objectives 1. Investigate the genotypic variation and
heritability of growth traits.
2. Examine GxE interactions and adaptability.
3. Assess productivity and susceptibility of P.
deltoides vs. hybrid clones.
Study Design The two sites are located in Raleigh, NC, and
Columbus, MS. Both sites are in a humid,
subtropical climate characterized by hot
summers and chilly, mild winters.
The trials were installed in March, 2014 as a
randomized, complete-block design, with 8
blocks in Raleigh and 10 blocks in Columbus
and one ramet of each clone in each block. Both trials had 52 Populus clones, of which 43
were derived from crosses of P. deltoides x P.
deltoides, six from P. trichocarpa x P. deltoides,
and three from P. deltoides x P. maximowiczii.
Stem height and diameter were measured after
the first and second growing seasons, and used
to estimate main stem volume. At the end of
the second growing season all trees were rated
for Septoria musiva incidence.
Results After two growing seasons the mean heights
were 5.5 ± 0.46 meters in Raleigh and 5.66 ± 1.24
meters in Columbus. However, because low
weed-control induced mortality at Columbus
(46% survival) likely influenced the clonal
variation in growth traits, we looked at the
Raleigh trial (98% survival) as a more reliable
estimate of growth and its variation among
clones.
Significant clonal variation was exhibited for all
growth traits (<.0001). Figure 2 shows this
variation in clone height. These growth traits
were under moderate to high genetic control
with broad-sense heritability values of 0.81, 0.61,
and 0.66 for height, DBH, and volume,
respectively.
The hybrid clones had high site adaptability as
they were top performers at both sites. Three of
the top five clones at each site were hybrids,
two of them being P. deltoides x P. maximowiczii.
Consequently, hybrids had higher productivity
rates than P. deltoides clones. At both sites the
hybrid clones were 10% taller than pure P.
deltoides (Fig. 3).
After two growing seasons, minor S. musiva
damage was present at both sites. In Columbus,
hybrids were significantly more susceptible than
Figure 1. Height and DBH measurements in Raleigh, NC
during the second growing season.

94
P. deltoides clones (Fig. 4). However, in Raleigh
there was no significant difference between
hybrid and P. deltoides clones.
Summary These results demonstrate the large genetic
variation in short rotation poplar with the
potential for considerable genetic gains through
breeding and selection. With proper vegetation
control, the observed yields in Raleigh met
estimated production levels for potential short-
rotation crops. High adaptability across sites was
observed particularly in hybrids, resulting in
superior growth. However, hybrids were also
more susceptible to S. musiva. Therefore, after
two growing seasons, hybrid clones
demonstrated superior growth, but future
measurements are needed to compare the
growth performance of hybrid and P. deltoides
clones as stand age increases and across more
sites.
Acknowledgments This project has been supported by the Forest
Productivity Cooperative and its members. The
IBSS project is supported by the Agriculture and
Food Research Initiative Competitive Grant from
the USDA National Institute of Food and
Agriculture.
Figure 2. Genotype-mean height and confidence
intervals of 52 two-year-old poplar genotypes in Raleigh,
NC ranked from smallest to largest.
Figure 3. Mean height comparison of two-year-old
hybrid and P. deltoides clones at the Columbus and
Raleigh trials.
Figure 4. Mean disease incidence of two-year-old hybrid
and P. deltoides clones at the Columbus and Raleigh
trials.

95
Effects of Eucalyptus camaldulensis, E. globulus, E. nitens and Acacia
melanoxylon Short-Rotation Forest Crops (SRFC) for Energy Production in
Contrasting Soils of the Bío-Bío Region, Chile
Edwin Esquivel, Rafael Rubilar, Simón Sandoval, Eduardo Acuña, Jorge Cancino,
Miguel Espinosa y Fernando Muñoz
Abstract With the aim of reducing greenhouse gases
emissions, demand for sustainable raw material
in power generation using tree biomass has
increased. However, sustainability of these SRFC
in marginal soils has been questioned due to the
reduction of time between harvests. This project
evaluated Eucalyptus camaldulensis, E. nitens
and Acacia melanoxylon SRFC at three
stockings effect on nitrogen, phosphorus,
potassium and boron use related to biomass
production after four years (harvesting age) at
two contrasting soil conditions. Biomass
production and nutrient use showed major
differences among species and between sites
but little effect from stocking. These responses
contributed to the project´s objective of
obtaining a sustainable protocol for bioenergy
production.
Introduction Forest biomass is emerging as an alternative for
low emission and renewable energy source
(Richardson and Verwijst, 2007). However,
sustainability of biomass production depends on
its silviculture (Richardson, 2006) and major
limitations for biomass production depend on soil
sustainability (Mead, 2005), particularly
considering that SRFC are expected to be
grown on forest or abandoned agricultural land
in order to not compete with food or other
productive land alternatives.
On the other hand, use of SRFC on forest land
can increase nutrient removals when compared
with long-term rotations of traditional timber
production (Stupak et al., 2007). Therefore, the
sustainability of wood energy production may
requires a sustainable nutrient supply (Kauter et
al., 2003). This will also allow for greater above
and below ground carbon sequestration as an
additional objective of SRFC .
Objectives Evaluate the effect of short rotation species at
contrasting planting densities, in nutrient use per
unit of biomass produced.
Methodology Experimental Design: Randomized complete
block (n=3). Sampling: Soils 2, 4, 11, 16, 23, 28, 36,
40 and 48 months at 0-20 and 20-40 cm depth.
Biomass at 11, 23, 36 and 48 months.
Nutritional and lab analyses:
Soils: Available N (N-NO3, N-NH4), P, K and B,
Total Carbon and pH.
Biomass tissues : Stem, branch and foliage
biomass and N, P, K y B concentrations.
Results The analyses showed an increase in N availability
for N fixing species at sandy soils (Acacia) at 48
months and interactions with other nutrients.
Effects differed between sites where at granitic
soils ammonium and potassium showed
increased levels at 0-20 cm depth; at sandy soil
nitrate and phosphorus presented higher levels
in concentration at both depths (0-20 20-40 cm).
Boron did not showed any effects at this age
(Table 2 ).
Table 1. Species and stocking treatments
Site Granitic
Soils Xeralfs
Sandy
Soils Psamments
Species A. melanoxylon,
E. nitens and E.
camaldulensis
A. melanoxylon,
E. nitens and
E. globulus
Stockings
trees ha-1 5.000, 7.500 y 10000

96
Most nutrients showed decreased levels after 24
months for all species and stockings suggesting
fast nutrient depletion. However fertilization with
NPKB at 30 months of age allowed soil nutritional
levels to return to their initial status.
Figure 1 and 2 show the relationship between
biomass and aboveground N use. Independent
from site, species showed different nitrogen use
efficiencies and differences in aboveground
biomass production. These results suggest that
A. melanoxylon shows a higher nutrient use
efficiency for N but presented a poor biomass
production at sandy soil sites compared to
granitics. Independent of site E. nitens has
shown interesting results, that suggests a high
potential for this species as a biomass
production alternative.
Conclusions Differences in nitrogen use among species may
affect sustainability of biomass production
particularly for species with larger biomass
accumulation but less efficiency on nitrogen use
per unit of biomass.
Fertilization is required to maintain soil nutritional
levels and therefore sustained productivity at
these marginal sites.
Acknowledgements This research was funded by Chilean
government INNOVA BIO BIO Project No. 06-PC
S1-33 and Energía Verde and MASISA S.A
companies support.
Table 2. P values of analysis of effect of species
(Sp), densities (Den) and interaction (Sp*Den)
evaluated in each site (granitic and sandy) for the
age 48 months.
Figure 1. Relationship between total nitrogen (kg
ha-1) and total biomass (Mg ha-1). Granitic site.
Figure 2. Relationship between total nitrogen (kg
ha-1) and total biomass (Mg ha-1). Sandy site
Site Granitic Sandy
Depth 0-20 20-40 0-20 20-40
Ammonium
Sp 0.076 0.367 0.694 0.375
Den 0.005 0.691 0.069 0.407
Sp*Den 0.903 0.701 0.815 0.283
Nitrate
Sp 0.290 0.566 0.702 0.039
Den 0.796 0.405 0.205 0.029
Sp*Den 0.491 0.697 0.823 0.405
Phosphorus
Sp 0.773 0.732 0.562 0.609
Den 0.170 0.207 0.007 0.547
Sp*Den 0.561 0.416 0.790 0.367
Potassium
Sp 0.524 0.730 0.586 0.321
Den <0.001 0.123 0.239 0.891
Sp*Den 0.803 0.472 0.792 0.748
Boron
Sp 0.344 0.178 0.531 0.706
Den 0.170 0.578 0.732 0.109
Sp*Den 0.869 0.601 0.843 0.794

97
Effects of Intensive Silviculture on the Productivity of Eucalyptus in
Venezuelan Llanos and a Probabilistic Analysis of its Profitability
Omar Carrero, Jose Stape, Fred Cubbage, Lee Allen, Joe Roise - NCSU
Background Increasing forest site productivity is a need in
many areas. High land prices combined with
landowners’ desire for increased profitability
have motivated forest managers to apply more
intensive silvicultural treatments in order to
increase forest site productivity. Even if
Eucalyptus plantations’ growth patterns were
known in a particular area, the gap between
attainable and current productivity is unknown.
This information is important to estimate the
expected responses to intensive silviculture and
will help to decide where it is more convenient
to apply silvicultural treatments to maximize
investment. Understanding how intensive
silviculture practices like weed control and
fertilization + weed control affects productivity
will permit managers to select the best
treatments to increase productivity.
Objectives Our objectives were: a) using Twin Plots 1) to
estimate the gap between current and
attainable productivity in Eucalyptus plantations
under extra fertilization + weed control, 2) To
estimate the treatment effect on light use and
light use efficiency, and b) using Triplet Plots: 3)
to estimate the gap between current and
attainable productivity in Eucalyptus plantations
under extra fertilization + weed control and extra
weed control.
Materials and Methods To estimate the gap between current and
attainable productivity, we established 53 pairs
of plots measured for two years (Fig.1). Each pair
consisted of a control plot
(Control) which received the
m a n a g e m e n t r e g i m e
regularly applied to the
stands and a treated plot
(Twin) which received an
intensive silviculture treatment
(fertilization + weed control)
in addition to the operational
management applied to the
control plots.
In those sites where 75% of
the surface was covered by
weeds a third plot (Triplet)
was established. Those plots
received only an intensive
Figure 1. LAI, nutrient content and biomass determination in the
Twin-Plot Pairs across the Company landscape.
Figure 2. Initial and Stem Biomass increment after 2 years in twin-plot pairs

98
weed control besides the
operational management.
Results After two years, stem biomass
growth in control and twin plots
was 12.4 and 14.8 Mg ha-1 yr-1
re spe ct ive l y (F ig .2 ) . Th is
difference represents a gain of
2.4 Mg ha-1yr-1 over 2 years. We
found significant statistical
differences for APAR by twin and
control plots, whose averages
where 1406 MJ m-2 yr-1 and 1344
MJ m - 2 yr - 1 respectively,
representing 5% increase (Fig.3).
The increase in LUE was higher, reaching 21 % or
1.1 g/MJ (Fig.3). The Nutrient Area Index (LAI x N
concentration) was the best predictor of the
measured yield gain (Fig. 4). We found that the
stem biomass increment averaged 13.4, 15.1,
and 17.2 Mg ha-1 yr-1 for the control, weed
control, and fertilization + weed control (Fig.5).
Although weed control (triplet plots) could
increase nutrient availability (beside plant water
availability), it seems the amount of nutrients
released was not enough to cover trees’
demand. No statistical differences in APAR were
found, but they were found in LUE between the
twin plots and the others (control and triplets),
which seem to be a consequence of a higher
foliar nutrient concentration.
The results clearly shows that the Twin-Plot design
was very effective to provide a realistic view of
the forest potential growth at the landscape
level, allowing the financial analysis
incorporating risk.
Acknowledgements To Universidad de Los Andes, NCSU, Paveca-
Deforsa, FPC, SOFAC, Zobel Grant and SCC.
Figure 4. LAI, N concentration in the canopy and Nitrogen Area Index for the Twin-Plot pairs.
Figure 3. APAR and LUE of the Twin-Plot pairs showing that the increase in growth (Fig. 2)
was mainly due to the increase in LUE and not APAR.
+ 20%
Figure 5. Stem biomass increment for the control, weed
control only and fertilization plus weed control.

99
Using Forest Inventory as a Tool for Monitoring Silvicultural Quality in
Eucalyptus Clonal Plantations
Rodrigo Eiji Hakamada, José Luiz Stape, Cristiane Camargo Zani de Lemos
Introduction Forest productivity is defined by the environment
the population is inserted, the implementation of
genetically superior material and the correct
silvicultural management applied to this
material. The correct prescription of technical
recommendations and the execution of those
operations according to acceptable quality
standard are intended to eliminate or minimized
the growth constraints. Despite the silvicultural
improvements that have occurred in recent
decades, it is still possible to obtain gains in
productivity through monitoring, early detection
and correction of deviations in the silviculture.
The objective of this study was to investigate an
index for monitoring the silvicultural quality using
forest inventory networks.
Material and Methods There were three stages of work: i) Definition of
uniformity indexes of dendrometric variables; ii)
Standardization of so-called optimal range of
uniformity (ORU) and validation of the
methodology through its application in a
network of forest inventory for a single
commercial clone.
In the first stage we used three tests of the
network BEPP (Brazil Eucalyptus Potential
Productivity) with different levels of productivity
to establish the appropriate indexes to
characterize the silvicultural uniformity (Figure 1).
The second stage used five clonal test of
Eucalyptus in Sao Paulo state to validate the
concept of Optimum Range of Uniformity.
The last step, the indexes and the concept of
ORU were applied on a commercial scale in a
network of forest inventory plots installed in
12.000 hectares of Eucalyptus clonal plantations
in northeastern of São Paulo state, with about 2
years old, and planted within 1995 to 2009.
Results In the definition phase, the index that represents
the percentage of the total volume of 50% of
smaller trees planted (which includes the
planting holes) (PV50) was shown as the best
adapted to the purpose of this study because it
has finite limits (50% to 0%), includes the holes of
planting and indirectly represents the distribution
Figure 1: (left) Uniform treatment at left and heterogeneous
treatment at right and (b) aerial view of BEPP at IP site at 2,5
years (Stape et al., 2010).
Figure 2: Uniformity at the end of rotation (6 years) (PV50 – 6
years) related with initial uniformity at 5, 9, 12 e 24 months.
Figure 3: – Productivity at the end of rotation (6 years) (MAI – 6
years) related with initial uniformity at 5, 9, 12 e 24 months.

100
of classes of growth. The uniformity at 5, 9, 12
and 24 months were strongly correlated to
uniformity to 6 years (R² > 0.74) showing the
possibility of early monitoring for detection of
quality deviations in forestry (Fig. 2). Furthermore,
the initial rate PV50 was highly correlated with
the final yield (p <0.001) (Fig. 3).
At the stage of standardization, there was no
statistical difference (Tukey, 5%) of PV50 among
clonal tests despite their different yields, showing
that the uniformity index can be generalized,
irrespective of the productivity of the site. The
ORU of PV50 was from 37 to 50%, i.e., sample
plots which have the PV50 within this range can
be considered satisfactory "uniform" (Fig. 4).
In the validation phase, when the concept was
applied on a commercial scale there was a
strong temporal evolution of PV50. In the
plantations made in 1995 the average of PV50
was 29% and increased to 42% in 2009 (Figure 5).
The percentage of plots within the optimal
range of uniformity clearly tended to rise over
this period and could be related to major
improvements in forestry operations and their
monitoring through quality control.
Conclusion Uniformity was confirmed as a fundamental
variable to monitor operational quality in
Eucalyptus clonal plantation
Uniformity Index (PV50) and the Optimum
Range of Uniformity (ORU) permitted to
capture the evolution of silvicultural quality in
a large scale, being possible to indicate it to
monitor silvicultural quality.
References Stape et al. 2010. The Brazil Eucalyptus potential
productivity project: influence of water,
nutrients and stand uniformity on wood
product ion . Forest Ecology and
Management, Amsterdam, 259: 1686–1694.
Figure 4 – Productivity (MAI) (up) and uniformity (PV50)
at 2 years at the five clonal tests.
Figure 5: Relative increment (%) on productivity (MAI)
and uniformity (PV50) based on the year 1.
Table 1. Evolution of MAI and PV50 from 1995 to 2009. Results are shown in average, standard deviation,
maximum, minimum, amplitude and confidence interval.

101
Introduction
The definition of planting spacing is a strategic
decision for the establishment of any forest. It
directly affects its productivity, competition for
resources among individuals and the final
wood products. Many studies in planted forests
have been done to define the spacing with
the main focus on biomass. However, there are
few studies on the impact of plant density in
relation to water use, water use efficiency and
the interaction among genetics and spacings
(WHITE et al., 2004). Thus, the overall goal of the
study is to determine the effect of spacing on
biomass production, water use and water use
efficiency in Eucalyptus clonal plantation in
two scales: tree and watershed. With this study,
we would like to answer the questions: i) does
the interaction between spacing and genetics
have a relationship with water use and water
use efficiency? Why? ii) Can the effects of
water use affect water yield at watershed
scale?
Material and Methods
The project encompasses two stages. The first
assay is using a systematic planting density trial
of the TECHS network (Eucalyptus Tolerance of
Thermal and Hydric Stresses) located in Sao
Paulo state at southeast region in Brazil,
planted in February 2012. The objective of this
step is to determine water use and water use
efficiency at tree scale (Figure 1). Measured
trees are covering stockings used for the main
wood products and range from 600 to 3,000
trees per hectare.
To estimate water use, homemade sap flow
probes were installed in August 2013 at eight
trees per group of spacing in four clones with
different canopy structure and growth (Figure
2) and will be measured for two years.
Precipitation, stemflow and canopy
interception has been measured since
September 2013.
To explain differences in terms of water use
(WU) and water use efficiency (WUE)
measurements of dendrometers (monthly),
Leaf Area Index (LAI), leaf water potential, soil
humidity and fine roots depth are planned to
be done.
Figure 2. Measured clones of Eucalyptus grandis x E.
urophylla (Cenibra, IP22 and GG100) and one clone
of E. grandis x E. camaldulensis (Cop1277)
Results of water balance at tree scale will be
modeled at watershed scale using a
watershed 20 kilometers far from the TECHS site
which water yield has been monitored for 10
years. The SWAT hydrological model will be
used (Soil and Water Assessment Tool -
swat.tamu.edu) to spatialize results.
Figure 1. Layout of systematic spacing design with the eight
spacings (four groups) with water balance measurements and
the main use of wood
Growth, Water Use, and Water Use Efficiency of Eucalyptus Clones
under Different Spacings: From the Tree to the Watershed Scales
Rodrigo Hakamada, Silvio Ferraz, Robert Hubbard, Jose Stape, Cristiane Lemos, Adriano Almeida
3.000 trees ha-1 Charcoal, Fiber board
1.500 trees ha-1 Pulp, Fiber board
1.000 trees ha-1 Pulp, stakes, gateposts
600 trees ha-1 Solid products

102
Current Status
International Paper in Brazil has supported this
research through a partnership among the
company and University of São Paulo, USDA
Forest Service and North Carolina State
University. Processed data of twelve months
old are already available and also is the
sapflow of one month measurement (but not
validated). Measurements of wood growth
have been done every 6 months and
dendrometer measurements will be monthly.
Initial Results
At twelve months all clones presented the
tendency of having more wood from wider to
tighter spacing (Figure 3), but with a high
variation between clones of more than 60%. The
data of canopy depth showed the opposite,
with more trees per hectare showing a shallow
canopy (Figure 4).
Figure 3. Wood growth at twelve months at the eight
spacings. Dotted line represents the average of four
clones
Figure 4. Average canopy depth of four clones
These results evidence the beginning of
competition at tightest spacing. Loss of leaves
might be occurring because of light
attenuation or because of water deficit,
activating petiole abscission (RIOV, GOREN,
1979).
Water use followed the same behavior of
wood growth, with more transpiration with
more trees per hectare. Despite being an
initial analysis, the same water consumption in
clones CNB10 and COP1277 can represents a
significant difference in terms of WUE, once
Cenibra clone growth 66% more than
COP1277 at 3,000 trees per hectare. It might
be an alternative of management to reduce
water use at watershed scale. Measuring
wood growth, LAI and WU will permit us to
have more detailed WUE in a large range of
spacing and clones.
Figure 5. Relative transpiration to 1.500 trees per
hectare (%) of three clones and four groups of
stockings.
Future Plans
We plan to continue measurements of wood
growth every six months and dendrometers
monthly. Leaf water potential and relative
water content will be measured in October
2013, April and October 2014 and April 2015. Soil
water content and fine roots density will be
collected in October 2014 and April 2015.
Maybe a measurement of non-structural
carbohydrate analysis could be done
depending on the initial results of transpiration.
Measurements of air humidity and wind speed
to calculate boundary layer conductance at
different spacings can also be done depending
on the amount of resources available.
References
WHITE, D.A.; CROMBIE, D.S.; KINAL, J.; BATTAGLIA, M.;
MCGRATH, J.F.; MENDHAM, D.S.; WALKER, S.N.
Forest Ecology and Management, Amsterdam, v.
259, p. 33–44, 2009.
LIMA, W.P.; LAPROVITERA, R.; FERRAZ, S.F.B.;
RODRIGUES, C.B.; SILVA, M.M. International
Journal of Forest Research. v.2012, 8p.
RIOV and GOREN, Plant Cell and Environ, v. 2, p. 83–
89, 1979.
0
10
20
30
40
50
60
70
80
0 500 1000 1500 2000 2500 3000 3500
Vo
lum
e 1
2 m
on
ths
(m³
ha
-1)
Trees ha-1
Cenibra
Cop1277
GG100
IPB22
y = -0,0009x + 9,5904
R² = 0,9705
0
1
2
3
4
5
6
7
8
9
10
0 500 1000 1500 2000 2500 3000 3500
Ca
no
py
de
pth
(m
)
Trees ha-1
0
20
40
60
80
100
0 500 1000 1500 2000 2500 3000 3500
Re
lativ
e t
ran
spir
atio
n
to 1
.50
0 t
ree
s h
a-1
(%)
Trees ha-1
Cenibra
Cop1277
GG100

103
Development of Hybrid Models to Express the Growth and Yield of
Eucalyptus Clones in Different Environments in Brazil
Henrique Scolforo, Jose Stape, Joseph Roise, John Paul McTague, Harold Burkhart
Introduction The culture of Eucalyptus is expanding in many
regions of Brazil, however, much of the area
under cultivation has limitations to plant
productivity, notably with different levels of
water stress. Eucalyptus plantations are primarily
clonal, and these clones are adapted for each
of these regions, due to the strong genotype x
environment (GxE) interaction. This results in
more complex decisions when selecting suitable
genotypes for different environmental
conditions. It is necessary to identify the most
promising materials for each situation (Stape et
al., 2004), i.e., those that are best adapted to
abiotic and biotic stresses of each locality.
The success of forest plantations, including the
matching of genotypes to different climate and
soil conditions, has a large effect on the
economics of the enterprise and on the
generation of social value to the local
communities (Stape et al., 2010).
In the tropical regions of Brazil, the year-to-year
variation in temperature and rainfall causes
significant variability in the mean annual
increment of Eucalyptus clonal plantations,
which have an accelerated rate of growth and
high demand for water.
Therefore, projections made from different
regions and years can lead to completely
different responses, creating insecurity for those
who must do the forest planning. Thus, the
evolution of hybrid models to include
environmental variables is necessary to improve
the biometric functions and enable more
accurate projections.
Objective The goal of this project is to model the growth
and yield of the 11 most important clones in
Brazil at 30 different sites with the insertion of soil
and climate variables that most influence the
GxE interaction. We intend to reduce the
estimated errors and to provide a mathematical
expression of physiological sensitivity to the
models, which will increase the generalizability
power of the same. The following specific
objectives will be undertaken:
Evaluate if it is feasible to identity model clusters
of two or more clones into ideotypes;
Develop descriptive models for Eucalyptus in 30
sites in Brazil;
Develop descriptive models for Eucalyptus in 30
sites in Brazil with the addition of a climatic
modifier;
Develop hybrid models for these same clones
and sites with the incorporation of soil and
climatic variables;
Evaluate the accuracy of the descriptive
models with and without the GxE interaction;
Evaluate the accuracy of hybrid models;
Propose the most appropriate way to model
the GxE interaction for Eucalyptus, with the
goal of developing models that are capable
of being general, realistic and accurate.
Material and Methods Forest inventory data
T h e d a t a s e t f r o m t h e
"Clonal Eucalyptus Tolerance to the Hydrous and
Thermal Stresses" – TECHS, which is a project that
investigates with greater accuracy the main
environmental stresses to Eucalyptus (water and
heat), will be provided.
The data set will consist of permanent inventory
plots across 30 different sites of Brazil (Figure 1)
evaluating 11 Eucalyptus clones for each site.
Plots were installed in 2012 and the forest
inventory completed its first measurement in
2013.
By 2018 there will be approximately 6 years of
semiannual data representing a complete
rotation for each of the 11 clones.
The growth variables to be measured include:
diameter at breast height (DBH), height (H),
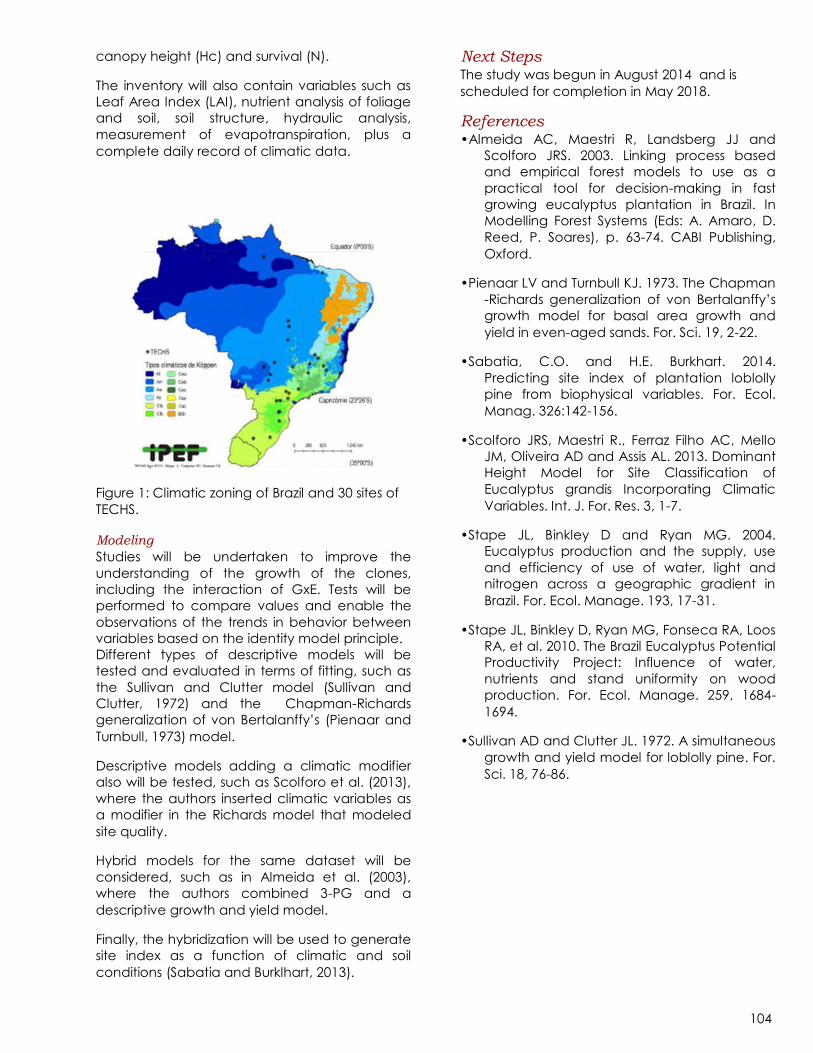
104
canopy height (Hc) and survival (N).
The inventory will also contain variables such as
Leaf Area Index (LAI), nutrient analysis of foliage
and soil, soil structure, hydraulic analysis,
measurement of evapotranspiration, plus a
complete daily record of climatic data.
Figure 1: Climatic zoning of Brazil and 30 sites of
TECHS. Modeling
Studies will be undertaken to improve the
understanding of the growth of the clones,
including the interaction of GxE. Tests will be
performed to compare values and enable the
observations of the trends in behavior between
variables based on the identity model principle.
Different types of descriptive models will be
tested and evaluated in terms of fitting, such as
the Sullivan and Clutter model (Sullivan and
Clutter, 1972) and the Chapman-Richards
generalization of von Bertalanffy’s (Pienaar and
Turnbull, 1973) model.
Descriptive models adding a climatic modifier
also will be tested, such as Scolforo et al. (2013),
where the authors inserted climatic variables as
a modifier in the Richards model that modeled
site quality.
Hybrid models for the same dataset will be
considered, such as in Almeida et al. (2003),
where the authors combined 3-PG and a
descriptive growth and yield model.
Finally, the hybridization will be used to generate
site index as a function of climatic and soil
conditions (Sabatia and Burklhart, 2013).
Next Steps The study was begun in August 2014 and is
scheduled for completion in May 2018.
References •Almeida AC, Maestri R, Landsberg JJ and
Scolforo JRS. 2003. Linking process based
and empirical forest models to use as a
practical tool for decision-making in fast
growing eucalyptus plantation in Brazil. In
Modelling Forest Systems (Eds: A. Amaro, D.
Reed, P. Soares), p. 63-74. CABI Publishing,
Oxford.
•Pienaar LV and Turnbull KJ. 1973. The Chapman
-Richards generalization of von Bertalanffy’s
growth model for basal area growth and
yield in even-aged sands. For. Sci. 19, 2-22.
•Sabatia, C.O. and H.E. Burkhart. 2014.
Predicting site index of plantation loblolly
pine from biophysical variables. For. Ecol.
Manag. 326:142-156.
•Scolforo JRS, Maestri R., Ferraz Filho AC, Mello
JM, Oliveira AD and Assis AL. 2013. Dominant
Height Model for Site Classification of
Eucalyptus grandis Incorporating Climatic
Variables. Int. J. For. Res. 3, 1-7.
•Stape JL, Binkley D and Ryan MG. 2004.
Eucalyptus production and the supply, use
and efficiency of use of water, light and
nitrogen across a geographic gradient in
Brazil. For. Ecol. Manage. 193, 17-31.
•Stape JL, Binkley D, Ryan MG, Fonseca RA, Loos
RA, et al. 2010. The Brazil Eucalyptus Potential
Productivity Project: Influence of water,
nutrients and stand uniformity on wood
production. For. Ecol. Manage. 259, 1684-
1694.
•Sullivan AD and Clutter JL. 1972. A simultaneous
growth and yield model for loblolly pine. For.
Sci. 18, 76-86.

105
Effects of Intensive Silviculture in the Restoration Process of Northeastern
Atlantic Rainforest in Brazil
Aliisa Harjuniemi UH, Jose Stape NCSU, Jacyr Alves Copener
Study Objective The overall goal of this study is to compare the
effects of intensive management versus
traditional management methods on total
above ground carbon stocks and on stem wood
biomass development for 20 different native
tree species in Atlantic forest restoration in
Northeastern Brazil. I will also determine the
effects of two different spacing and two
different tree species composition for carbon
allocation and long term sustainability. Finally I
will compare the results of this study to the
parallel study site in the Sao Paulo state in
Southeastern Brazil with similar design looking for
site specific and general patterns.
Study Design The trial was installed in Bahia state, 200 km north
from Salvador. The climate is a typical tropical
climate; annual mean temperature is 24 °C and
annual rainfall 1400 mm. The project has 23
factorial design, where intensive and traditional
treatments (factor 1) were applied to 20 native
species, for two initial stockings (factor 2, 3333
trees ha-1 and 1667 trees ha-1) and two species
composition proportion (factor 3, 50/50 and
67/33 ratio of pioneer : later successional
species). The treatments were applied in a
randomized block design (Figure 1). The trial has
40 plots; 4 plots for each treatment (4*8), 4 plots
for control without forest restoration and 4 plot
for destructive sampling. Each plot is 30 m * 39 m
(1170 m2) with an interior plot of 24 m * 32 m (768
m2) on where measurements were made. All
trees were planted on August 2004. Pictures
illustrating the differences between intensive
and traditional managements presented in
Figure 2.
Current Status The height and diameter at 30 cm were
measured for all trees in July 2012. In addition to
this, forest floor and understory were sampled
and their dry weights were determined. Wood
specific gravity was determined for all 20 tree
species four times. The density for bark was
determined four times as well.
Figure 2. The picture above is from a plot where intensive
management was applied (A2X) and below a picture
from a plot after traditional management (A1U).
Figure 1. Randomized block design. A means 50:50 ratio of
pioneers and later successional species, B 67:33 ratio, 1
means stocking 3333 tree/ha, 2 means 1667 trees/ha, X is
intensive management methods and U traditional methods.

106
Basal areas and stem wood biomass estimates
for each tree and plot were calculated to
compare the effects of different treatments.
Stem wood biomass (dry) was calculated based
on tree cross sectional area, wood specific
gravity and using a taper factor 0,5. Biomass
estimates for bark was calculated separately
because of the lower density of bark and added
to the final stem wood biomass. By summing the
biomass of all stems (including bark and wood),
stem wood biomass estimates per plot were
obtained. The results were presented in Mg/ha.
Statistical analysis to find out the individual
effects of treatments and the possible
interactions was made using ANOVA GLM
procedure with Minitab 15 software.
Next I will calculate the total aboveground
biomass for each plot to get estimates for the
carbon stocks. For this, I will add the canopy dry
mass estimates to obtain the total aboveground
biomass of trees. To get more accurate
estimates of the total amount of carbon in the
system, I will also include understory and forest
floor dry masses. The total amount of carbon per
plot will be calculated by multiplying biomass
estimates with 0,5.
Ceptometer measurements are ongoing and will
be ready approximately in mid October. I’m still
waiting for results from leaf nutrient content
analysis, forest floor furnace and weights from
specific leaf area samples. The results from these
measurements I will use to calculate the amount
of carbon in forest floor, leaf area index and
canopy nutrimental status.
Results Effects on different tree species
Intensive treatment had positive effect on the
stem wood biomass development for all tree
species (Figure 3).
Stem wood stocks per treatment
The spacing and the management method had
both statistically significant influence (p < 0,000).
Larger proportion of pioneer species had no
effect on stem wood stocks 8 years after
planting. No significant interactions was
observed at significance level 0,05. Plots with
intensive management method and denser
stockings had bigger stem wood stocks
(respectively 270 % and 70 % bigger).
Comparison to the South site
The responses to the treatments seem to be
following similar patterns so far, at least
regarding the effects of the intensive
management.
Summary The Intensive management method has a
significant positive effect on stem wood stocks
also in the Northeastern Brazil. However, not all
calculations and analysis are finished yet. Long-
term sustainably of larger pioneers species
proportion may be too early to determine.
Acknowledgements Travel to Brazil and the data analysis were
funded by the Zobel grant and the FPC. Thanks
especially to Copener for supporteding my stay
and research in Brazil and for providing valuable
help in the field and in the laboratory. My studies
at NCSU were funded by the Atlantis program.
Figure 3. Effects of intensive management to stem wood
development on different tree species. Figure 4. Effects of different treatments on stem wood stocks.
0
10
20
30
40
50
60
70
80
T B2U A2U A1U B1U B2X A2X A1X B1X
Ste
m w
oo
d d
ry m
ass
Mg
/h
a
Treatment
0
20
40
60
80
100
120
140
IN EB
PA
PO AS
AP JP
EM P
I
IA CA PB
MA
AN JE JB
AM JT IR B
I
kg d
ry m
ass/
tre
e
Species Code
Traditional
Intensive

107
Fertilizer Response to Eucalyptus Plantations and its Correlation with the
Soil, Climate and Silviculture Characteristics in Different Regions of São
Paulo State
Renato Meulman Leite da Silva, José Luiz Stape, Antonio Natal Gonçalves
Introduction The nutrients are essentials resources to wood
production, therefore a nutritional management
is needful to maintain a sustainable productivity
on forests plantations. These plantations cover
extensive landscapes, over different sites,
climate and soil conditions and the productivity
can be limited by low soils fertility or a
inappropriate fertilization management. This
study aimed to identify nutritional limitation,
evaluate the effect of the soil, climate and
silviculture characteristics on fertilization
response and determine the attainable
productivity in Eucalyptus plantations
widespread around 52,700 ha in different regions
of São Paulo state, Brazil.
Methods The Twin Plot design was used in 161 plots which
receive additional fertilizations. These plots
account stands of 2 to 4 years old, seedling or
clonal plantations and establishment or coppice
forests. The plots were paired and the initial
volume was estimated (fig. 2), and compared
for 2.5 years with traditional inventory plots which
receive the usual fertilization management and
through growth estimates to determine the
fertilization response (FR) to each pair of plots.
Experimental blocks were distributed in three
different regions (fig. 1), from north to the south,
increase the clay content, organic matter and
rainfall and decrease the temperature and
drought. To each block has determined the
climate and soil characteristics.
In additional, leaf area index (LAI) was estimated
by hemispherical photos.
Figure 1. Studied Eucalyptus plantations. Distributed
along the state of São Paulo, Brazil.
Figure 2. Twin (PG-G) and inventory plots (PG-T) volume
at study establishment, 2003.
Figure 3. Current annual increment (CAI), 2.5 years of
evaluation.
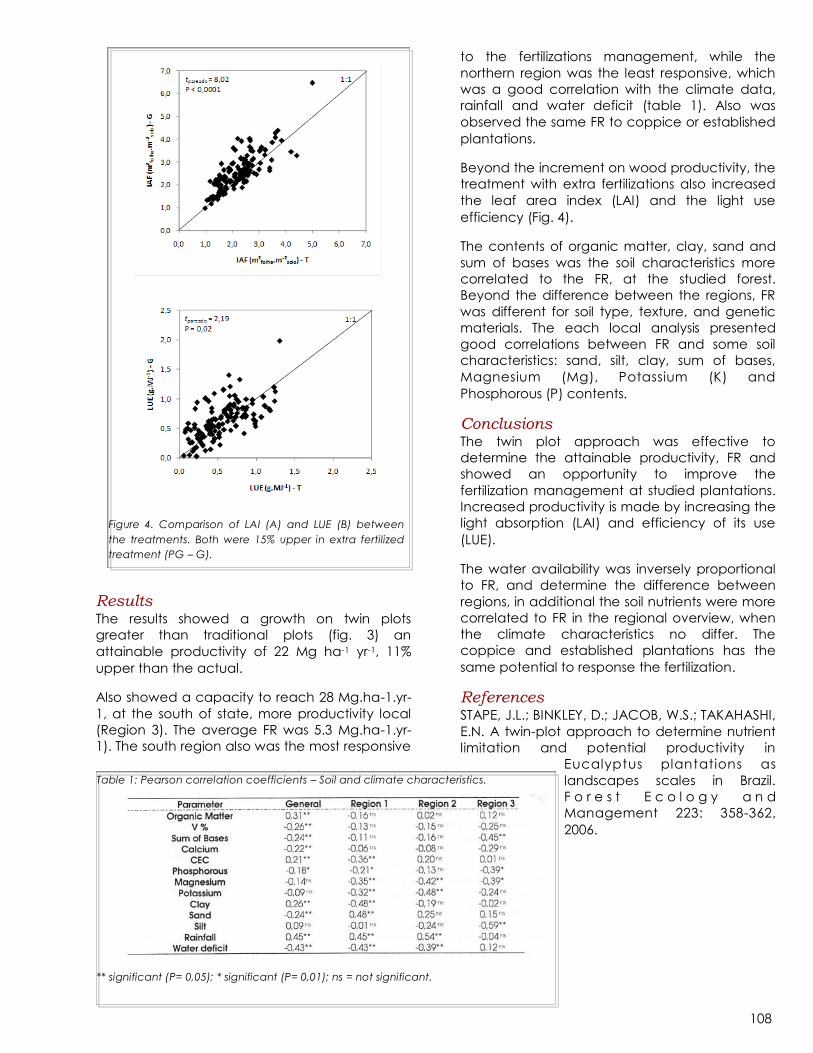
108
Results The results showed a growth on twin plots
greater than traditional plots (fig. 3) an
attainable productivity of 22 Mg ha-1 yr-1, 11%
upper than the actual.
Also showed a capacity to reach 28 Mg.ha-1.yr-
1, at the south of state, more productivity local
(Region 3). The average FR was 5.3 Mg.ha-1.yr-
1). The south region also was the most responsive
to the fertilizations management, while the
northern region was the least responsive, which
was a good correlation with the climate data,
rainfall and water deficit (table 1). Also was
observed the same FR to coppice or established
plantations.
Beyond the increment on wood productivity, the
treatment with extra fertilizations also increased
the leaf area index (LAI) and the light use
efficiency (Fig. 4).
The contents of organic matter, clay, sand and
sum of bases was the soil characteristics more
correlated to the FR, at the studied forest.
Beyond the difference between the regions, FR
was different for soil type, texture, and genetic
materials. The each local analysis presented
good correlations between FR and some soil
characteristics: sand, silt, clay, sum of bases,
Magnesium (Mg), Potassium (K) and
Phosphorous (P) contents.
Conclusions The twin plot approach was effective to
determine the attainable productivity, FR and
showed an opportunity to improve the
fertilization management at studied plantations.
Increased productivity is made by increasing the
light absorption (LAI) and efficiency of its use
(LUE).
The water availability was inversely proportional
to FR, and determine the difference between
regions, in additional the soil nutrients were more
correlated to FR in the regional overview, when
the climate characteristics no differ. The
coppice and established plantations has the
same potential to response the fertilization.
References STAPE, J.L.; BINKLEY, D.; JACOB, W.S.; TAKAHASHI,
E.N. A twin-plot approach to determine nutrient
limitation and potential productivity in
Eucalyptus plantations as
landscapes scales in Brazil.
F o r e s t E c o l o g y a n d
Management 223: 358-362,
2006.
Figure 4. Comparison of LAI (A) and LUE (B) between
the treatments. Both were 15% upper in extra fertilized
treatment (PG – G).
Table 1: Pearson correlation coefficients – Soil and climate characteristics.
** significant (P= 0,05); * significant (P= 0,01); ns = not significant.

109
Zoning the Productivity of Eucalyptus Forest Plantation in the Northeastern
of São Paulo State in Brazil
Cristiane C.Z. de Lemos, Jose L. Stape
Study Objective In a competitive wood market for land with
other cultures, zoning the productivity can help
the forest managers to make their decision
about land use, based on technical information
of forest productivity. In addition, the correct
forest location on climate condition, possibility to
ensure the wood production and to decrease
the need for land, resulting in a reduce of
pressure on native forest deforestation. The
objective of this study was to zone the actual
productivity of Eucalyptus forest plantation in the
northeastern of São Paulo state and to
determine constraints for forest growth.
Methods—Site Description The study was developed in the northeastern of
São Paulo State in Brazil (figure 1), localizated
between 23º 3’S to 18º 58’S and 48º 38’W a 46º
21’W coordinates, totalizing around 5 million of
hectares. The weather condition is Aw, Cwa and
Cwb (Köppen). The predominate soils are
Quartzpsament, red yellow sandy Oxisol, and
red clayey Oxisol.
Estimation of Eucalyptus Plantation Productivity
The estimative of productivity was obtained
using 3-PG model modified by soil water content
associated with ArcGIS tools to spatialize the
analyses. For this purpose, we used maps of
precipitation (Alvares et al., 2012a) and
maximum and minimum temperature estimation
(Alvares et al., 2012b) and a pedological map
(Oliveira et al., 1999). The solar radiation and
numbers of frost day were calculated using
empirical equations (Pereira, Angelloci and
Sentelhas, 2002; Alvares, 2011).
The 3-PG input parameters were calibrated and
validated per type of soil, using 113 pairs of twin-
plots spread over the study area.
Validation of the Estimated Productivity To validate the model, were compared the
mean annual increment at 7 years (MAI 7)
estimated by 3-PG with the projeted production
from 1.884 commercial inventory plot by Clustter
equations (forest with 5 to 8 years, figure 2),
corresponding around 58,000 ha.
Because our map resolution was 400 ha we
compared the forest productivity by stand using
the average weight.
Estimation of Eucalyptus Plantation Productivity
The 3-PG modifiers: temperature (ft), frost (ffrost),
soil water content (fѲ),vapor pressure deficit (fvpd)
e soil fertilization (FR) were used to determine
the growth constraints. We randomly selected
10% of our study area to evalute those modifiers
along the Eucalyptus rotation (7 years).
Figure 2. Eucalyptus plantation in Brazil .
Figure 1. Study area (brown) in the northeastern of São Paulo
State in Brazil.

110
Results Figure 3 shows us the Eucalyptus productivity
and leaf area índex along the northeastern of
São Paulo. The average of all validated area
was similar between the 3-PG estimation and
the inventory projection, 42 m3 ha-1 year-1.
However, the comparison of the IMA7 between
measured and predicted, stratified by soil type
and farm (figure 4), we found high data
dispersion, probably because of the average
climatic data used as model input, the soil type
detailing reflecting the soil water content, the
genetic material adaptation and silviculture
management, or the interaction of those factors.
The results suggested that increasing the
analytical scale reduces the precision of the
estimatives. It was possible to make the zoning of
the real productivity of Eucalyptus in the
northeastern state of São Paulo. The most
productive areas are located at south. The main
growth constraints were vapor pressure deficit
and soil water content.
Conclusion
The spacial 3-PG model was able to estimate
the forest productivity on northeast of São Paulo
state, and different production based on the
type of soil.
Acknowledgments This research was supported by the São Paulo
Research Foundation (FAPESP, 07/57896-5), the
University of São Paulo and International Paper
company. Clayton Alvares helped us on maps
issues. We thank them for their support.
Figure 3. Maps of northeastern of São Paulo State in Brazil - A) Eucalyptus productivity: mean annual increment at 7 years (m3 ha-1
year-1). B) Leaf area index at 7 years (m2 leaf m-2 of soil).
Figure 4. Relationship between mean anual increment (MAI, 7 years) projected using inventory data and mean anual increment at
7 years estimated using 3-PG model per type of soil (Quartzpzament, Red yellow sandy soil and red clayey oxisol), average per
farm.
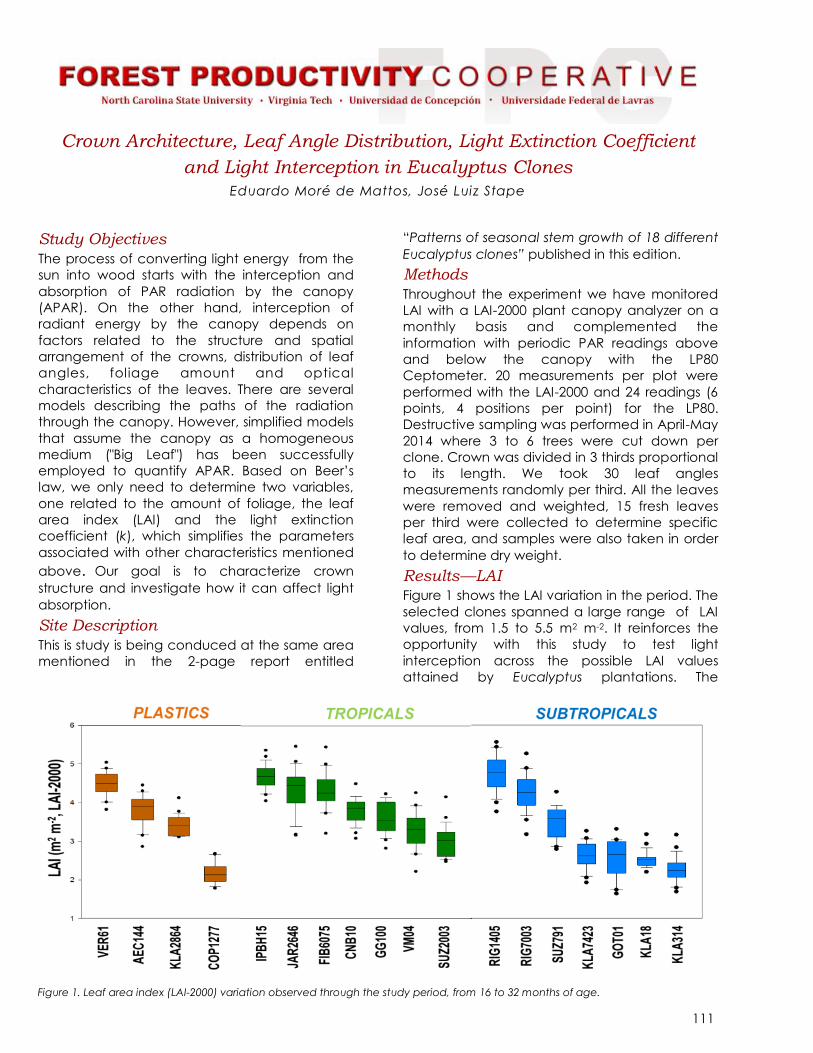
111
Study Objectives
The process of converting light energy from the
sun into wood starts with the interception and
absorption of PAR radiation by the canopy
(APAR). On the other hand, interception of
radiant energy by the canopy depends on
factors related to the structure and spatial
arrangement of the crowns, distribution of leaf
angles, foliage amount and optical
characteristics of the leaves. There are several
models describing the paths of the radiation
through the canopy. However, simplified models
that assume the canopy as a homogeneous
medium ("Big Leaf") has been successfully
employed to quantify APAR. Based on Beer’s
law, we only need to determine two variables,
one related to the amount of foliage, the leaf
area index (LAI) and the light extinction
coefficient (k), which simplifies the parameters
associated with other characteristics mentioned
above. Our goal is to characterize crown
structure and investigate how it can affect light
absorption.
Site Description
This is study is being conduced at the same area
mentioned in the 2-page report entitled
“Patterns of seasonal stem growth of 18 different
Eucalyptus clones” published in this edition.
Methods
Throughout the experiment we have monitored
LAI with a LAI-2000 plant canopy analyzer on a
monthly basis and complemented the
information with periodic PAR readings above
and below the canopy with the LP80
Ceptometer. 20 measurements per plot were
performed with the LAI-2000 and 24 readings (6
points, 4 positions per point) for the LP80.
Destructive sampling was performed in April-May
2014 where 3 to 6 trees were cut down per
clone. Crown was divided in 3 thirds proportional
to its length. We took 30 leaf angles
measurements randomly per third. All the leaves
were removed and weighted, 15 fresh leaves
per third were collected to determine specific
leaf area, and samples were also taken in order
to determine dry weight.
Results—LAI
Figure 1 shows the LAI variation in the period. The
selected clones spanned a large range of LAI
values, from 1.5 to 5.5 m2 m-2. It reinforces the
opportunity with this study to test light
interception across the possible LAI values
attained by Eucalyptus plantations. The
Crown Architecture, Leaf Angle Distribution, Light Extinction Coefficient
and Light Interception in Eucalyptus Clones
Eduardo Moré de Mattos, José Luiz Stape
Figure 1. Leaf area index (LAI-2000) variation observed through the study period, from 16 to 32 months of age.

112
estimates obtained by the LP80 were fairly
correlated to the estimates by the LAI-2000(fig 2)
However, LAI estimates via destructive sampling
were considerably greater than LAI from
equipment (fig. 3).
More investigation is needed, but our
understanding rely on the fact that clones
stacked more leaves into their crowns, which
does not necessarily contributed to light
interception. It reinforces the attention necessary
to what methods to be used when setting up
trials and tests and what is the information
required, sometimes PAR values itself are the
most valuable information.
Results—Light Extinction Coefficient (k)
Inverting beer’s law equation in conjunction with
the destructive LAI estimates and LP80 above
and below readings, assuming constant k
through the canopy, we could calculate the so
called light extinction coefficient, which ranged
from 0.25 to 0.6 (fig. 4).
We observed a trend in reducing k with
increasing leaf angle inclination. Figure 5 shows
the variation of leaf angle distributions within the
crown. Leaf angle tends to increase with
increasing crown height, this endorses the fact
that k changes within the crown and this may be
taken into account when modeling light
interception.
Acknowledgments
We thank the TECHS project and all its
associated companies in special Duratex that
hosts the experiment. We also thank CAPES for
the scholarship and the Forestry Science and
Research Institute for field support.
Figure 4. Relationship between mean inclination angle and k.
Line is a smooth trend and r is the Pearson’s correlation
coefficient (significant at 5%).
Figure 5. Leaf angle distributions for the clones under study and
differences observed at the upper (blue), mid (green) and
lower crown (red).
Figure 2. Agreement of the LAI estimates by the LP80
Ceptometer and the LAI-2000 plant canopy analyzer. Bars
represent the mean standard error.
Figure 3. Examples of two clones with different LAI estimates by
the 3 methods used. Destructive sampling led to higher values.

113
Introduction The advances of the silviculture practices and
genetic materials (basically cloning) has led the
plantations in Brazil to a significant increase in
productivity. However, can we keep this
increase? Or can we sustain this productivity
rates? In order to answer some of these
questions we have to understand how and why
patterns of growth may differ from one region to
another but also how clones interact with in-site
weather variability as climate changes and
extreme events are becoming more frequent.
Study Objectives To better understand the factors regulating
productivity and how growth is subject to soil
and weather conditions we have recorded dbh
every 15 days. Our goals are to:
1.Characterize the patterns of growth of 18
different genotypes (clones) of Eucalyptus,
representative of the variability range found
in genetic materials current in use for
commercial plantation in Brazil.
2.Identify how clones respond to weather
conditions after canopy closure (maximum
growth rates).
3.Develop clone specific models capable to
predict how meteorological variables
weights on growth response.
Site Description This study is supported by TECHS project
(Tolerance of Eucalyptus clones to hydric and
thermal stresses, www.ipef.br/techs), a research
association led by the Forest Science and
Research Institute (IPEF, www.ipef.br). The
experiment was planted in 2011, December 31st
and now has 33 months old. It is located in Buri
(23°47’57”S and 48°35’15”W ), south region of
the São Paulo state, Brazil (fig 2), on a land held
by Duratex company. The climate is classified as
Cfa, according to Koppen classification with
1200 mm of average annual rainfall and 20.5 °C
of mean annual temperature, the soil is a red
clayey Oxisol (50% clay).
Experimental Design—Methods The experimental plots consists of 120 trees on a
3x3 m spacing, where 40 trees are reserved for
destructive sampling, giving a 720 m² plot(8 rows
by 10 trees) (fig. 1). The 18 clones were classified
into plastic ones (4), tropicals (7) and
subtropicals (7) according to the region where it
is being planted and prior knowledge about
field behavior. Every fifteen days 8
representative trees are selected per plot and
their DBH is recorded. Climate information is
provide by public weather stations from the
Brazilian national institute of meteorology which
records hourly, radiation, rainfall, air
temperature, wind speed, and air relative
humidity data. Destructive sample was
conduced trough April-May 2014 at peak Leaf
area Index. A total of 93 trees were cut down
and measured in order to build allometric
Patterns of Seasonal Stem Growth of 18 Different Eucalyptus Clones
Eduardo Moré de Mattos, José Luiz Stape
Figure 1. Experimental design and site location. Only one plot of
each clone at the 3 X 3 spacing is being accessed for the
purposes of this study.
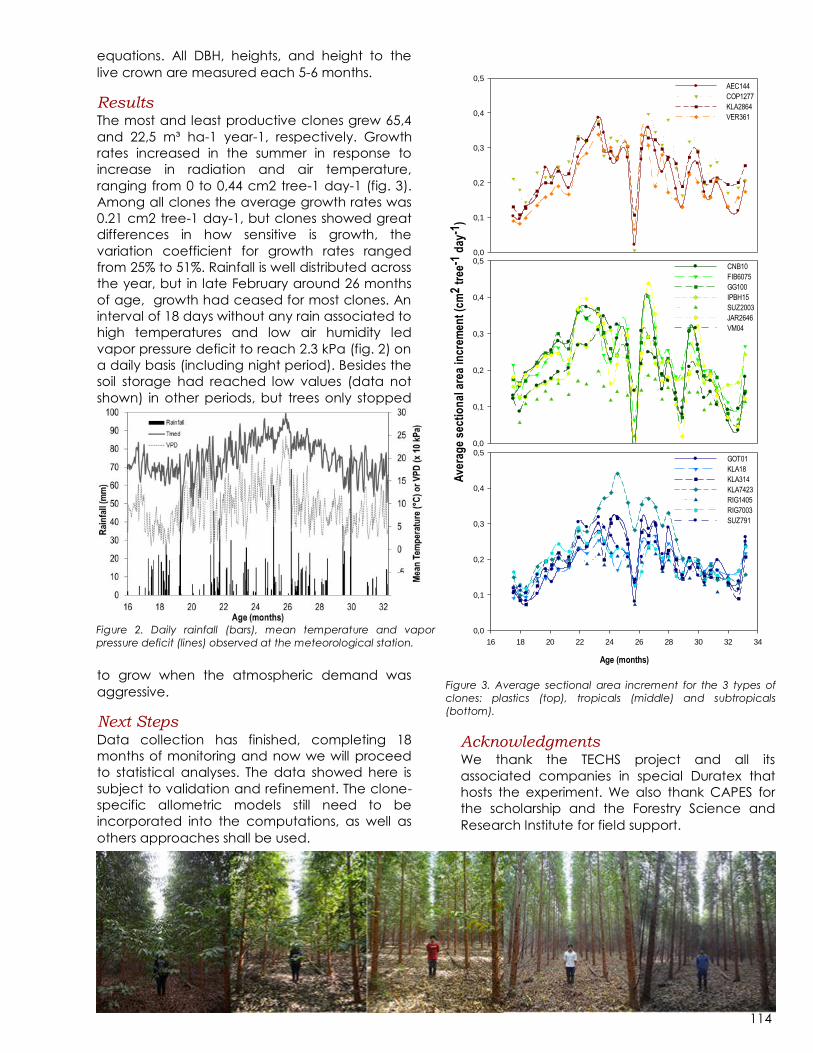
114
equations. All DBH, heights, and height to the
live crown are measured each 5-6 months.
Results The most and least productive clones grew 65,4
and 22,5 m³ ha-1 year-1, respectively. Growth
rates increased in the summer in response to
increase in radiation and air temperature,
ranging from 0 to 0,44 cm2 tree-1 day-1 (fig. 3).
Among all clones the average growth rates was
0.21 cm2 tree-1 day-1, but clones showed great
differences in how sensitive is growth, the
variation coefficient for growth rates ranged
from 25% to 51%. Rainfall is well distributed across
the year, but in late February around 26 months
of age, growth had ceased for most clones. An
interval of 18 days without any rain associated to
high temperatures and low air humidity led
vapor pressure deficit to reach 2.3 kPa (fig. 2) on
a daily basis (including night period). Besides the
soil storage had reached low values (data not
shown) in other periods, but trees only stopped
to grow when the atmospheric demand was
aggressive.
Next Steps Data collection has finished, completing 18
months of monitoring and now we will proceed
to statistical analyses. The data showed here is
subject to validation and refinement. The clone-
specific allometric models still need to be
incorporated into the computations, as well as
others approaches shall be used.
Acknowledgments We thank the TECHS project and all its
associated companies in special Duratex that
hosts the experiment. We also thank CAPES for
the scholarship and the Forestry Science and
Research Institute for field support.
Figure 2: Experimental layout and location.
Figure 3. Average sectional area increment for the 3 types of
clones: plastics (top), tropicals (middle) and subtropicals
(bottom).
0,0
0,1
0,2
0,3
0,4
0,5AEC144
COP1277
KLA2864
VER361
Ave
rag
e se
ctio
nal
are
a in
crem
ent
(cm
2 tr
ee-1
day
-1)
0,0
0,1
0,2
0,3
0,4
0,5CNB10
FIB6075
GG100
IPBH15
SUZ2003
JAR2646
VM04
Age (months)
16 18 20 22 24 26 28 30 32 34
0,0
0,1
0,2
0,3
0,4
0,5GOT01
KLA18
KLA314
KLA7423
RIG1405
RIG7003
SUZ791
Figure 2. Daily rainfall (bars), mean temperature and vapor
pressure deficit (lines) observed at the meteorological station.
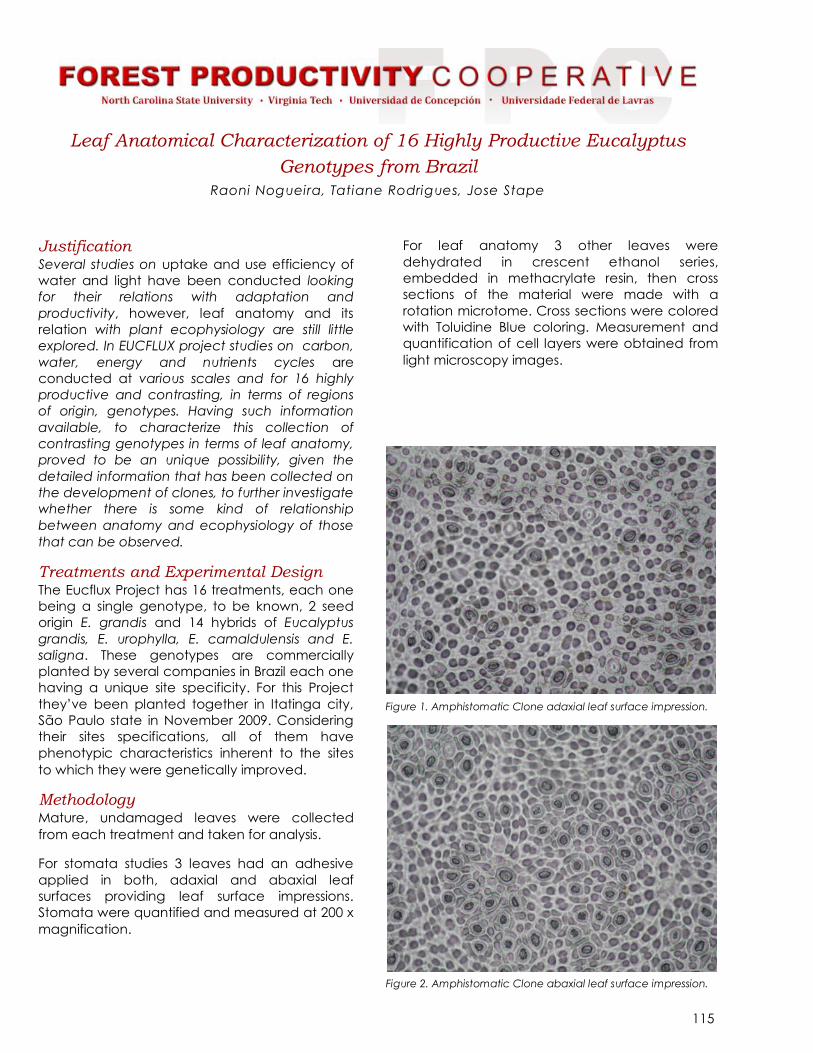
115
Leaf Anatomical Characterization of 16 Highly Productive Eucalyptus
Genotypes from Brazil
Raoni Nogueira, Tatiane Rodrigues, Jose Stape
Justification Several studies on uptake and use efficiency of
water and light have been conducted looking
for their relations with adaptation and
productivity, however, leaf anatomy and its
relation with plant ecophysiology are still little
explored. In EUCFLUX project studies on carbon,
water, energy and nutrients cycles are
conducted at various scales and for 16 highly
productive and contrasting, in terms of regions
of origin, genotypes. Having such information
available, to characterize this collection of
contrasting genotypes in terms of leaf anatomy,
proved to be an unique possibility, given the
detailed information that has been collected on
the development of clones, to further investigate
whether there is some kind of relationship
between anatomy and ecophysiology of those
that can be observed.
Treatments and Experimental Design The Eucflux Project has 16 treatments, each one
being a single genotype, to be known, 2 seed
origin E. grandis and 14 hybrids of Eucalyptus
grandis, E. urophylla, E. camaldulensis and E.
saligna. These genotypes are commercially
planted by several companies in Brazil each one
having a unique site specificity. For this Project
they’ve been planted together in Itatinga city,
São Paulo state in November 2009. Considering
their sites specifications, all of them have
phenotypic characteristics inherent to the sites
to which they were genetically improved.
Methodology
Mature, undamaged leaves were collected
from each treatment and taken for analysis.
For stomata studies 3 leaves had an adhesive
applied in both, adaxial and abaxial leaf
surfaces providing leaf surface impressions.
Stomata were quantified and measured at 200 x
magnification.
For leaf anatomy 3 other leaves were
dehydrated in crescent ethanol series,
embedded in methacrylate resin, then cross
sections of the material were made with a
rotation microtome. Cross sections were colored
with Toluidine Blue coloring. Measurement and
quantification of cell layers were obtained from
light microscopy images.
Figure 1. Amphistomatic Clone adaxial leaf surface impression.
Figure 2. Amphistomatic Clone abaxial leaf surface impression.
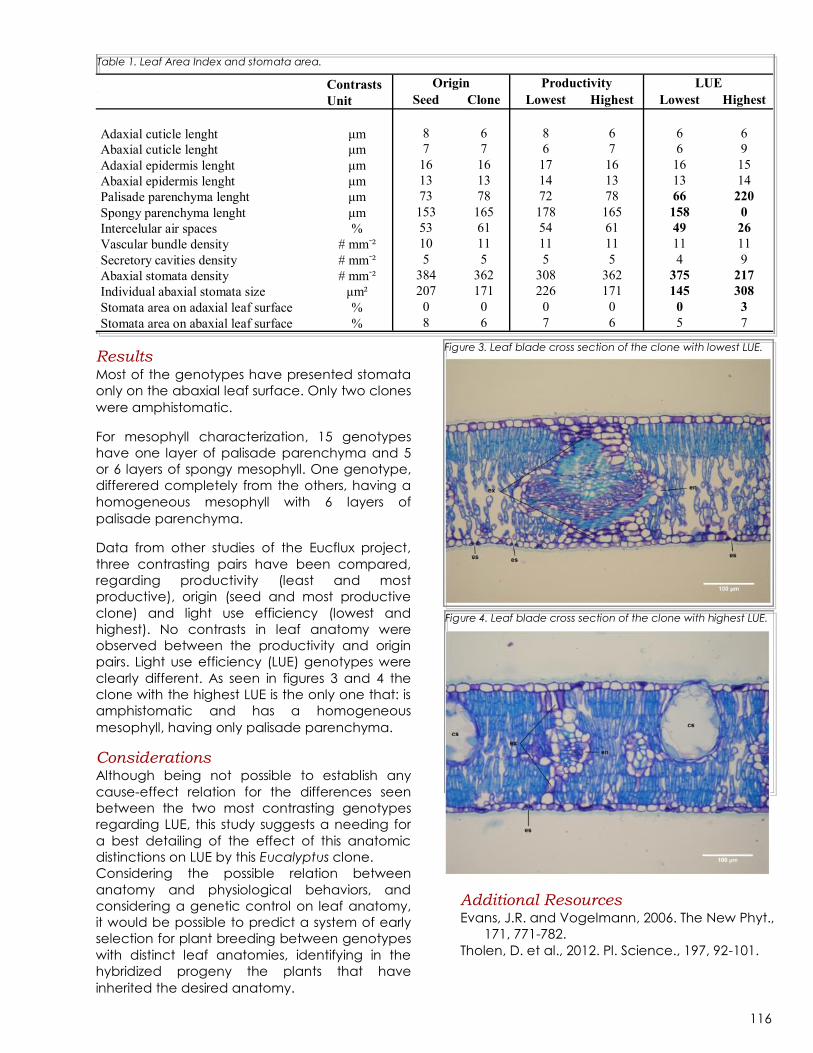
116
Results Most of the genotypes have presented stomata
only on the abaxial leaf surface. Only two clones
were amphistomatic.
For mesophyll characterization, 15 genotypes
have one layer of palisade parenchyma and 5
or 6 layers of spongy mesophyll. One genotype,
differered completely from the others, having a
homogeneous mesophyll with 6 layers of
palisade parenchyma.
Data from other studies of the Eucflux project,
three contrasting pairs have been compared,
regarding productivity (least and most
productive), origin (seed and most productive
clone) and light use efficiency (lowest and
highest). No contrasts in leaf anatomy were
observed between the productivity and origin
pairs. Light use efficiency (LUE) genotypes were
clearly different. As seen in figures 3 and 4 the
clone with the highest LUE is the only one that: is
amphistomatic and has a homogeneous
mesophyll, having only palisade parenchyma.
Considerations Although being not possible to establish any
cause-effect relation for the differences seen
between the two most contrasting genotypes
regarding LUE, this study suggests a needing for
a best detailing of the effect of this anatomic
distinctions on LUE by this Eucalyptus clone.
Considering the possible relation between
anatomy and physiological behaviors, and
considering a genetic control on leaf anatomy,
it would be possible to predict a system of early
selection for plant breeding between genotypes
with distinct leaf anatomies, identifying in the
hybridized progeny the plants that have
inherited the desired anatomy.
Additional Resources Evans, J.R. and Vogelmann, 2006. The New Phyt.,
171, 771-782.
Tholen, D. et al., 2012. Pl. Science., 197, 92-101.
Table 1. Leaf Area Index and stomata area.
Figure 4. Leaf blade cross section of the clone with highest LUE.
Figure 3. Leaf blade cross section of the clone with lowest LUE.
Contrasts Origin Productivity LUE
Unit Seed Clone Lowest Highest Lowest Highest
Adaxial cuticle lenght μm 8 6 8 6 6 6
Abaxial cuticle lenght μm 7 7 6 7 6 9
Adaxial epidermis lenght μm 16 16 17 16 16 15
Abaxial epidermis lenght μm 13 13 14 13 13 14
Palisade parenchyma lenght μm 73 78 72 78 66 220
Spongy parenchyma lenght μm 153 165 178 165 158 0
Intercelular air spaces % 53 61 54 61 49 26
Vascular bundle density # mm-² 10 11 11 11 11 11
Secretory cavities density # mm-² 5 5 5 5 4 9
Abaxial stomata density # mm-² 384 362 308 362 375 217
Individual abaxial stomata size μm² 207 171 226 171 145 308
Stomata area on adaxial leaf surface % 0 0 0 0 0 3
Stomata area on abaxial leaf surface % 8 6 7 6 5 7

117
Physiology of Tropical Eucalyptus Clones Under Water Stress
Marina S. G. Otto, Ricardo F. de Oliveira, Beatriz T. Gonsalez; José L. Stape
Study Objective
The goal of this study is to evaluate physiological
parameters and accumulation of γ-
aminobutyric acid (GABA) in Eucalyptus under
water stress. GABA is a four-carbon non-protein
amino acid that has been linked to stress,
signaling and storage in plants.
With the advancement of the global area
planted with Eucalyptus to regions under water
stress, it becomes necessary to increase our
understanding about physiological processes
triggered by the plants and to identify
metabolite signaling of stress.
Treatments and Experimental Design
Eight Eucalyptus clones from different origins
were evaluated (Table 1).
Table 1: Clones and origins.
Seedlings were planted in 320 liters pots located
in Piracicaba, state of São Paulo, Brazil in
February 2013.
The experimental design is completely
randomized in a factorial 2 x 8: 2 treatments and
8 clones, with 6 repetitions, totaling 96
experimental units.
We studied two treatments: with and without
water stress. Water stress began on November
12th when seedlings were around 3 to 4 meters
tall. Water stress was imposed by non-irrigation of
the plants and pots coverage to avoid rainfall.
These water stress treatments were maintained
for 2 cycles: 3 days (cycle 1) and 5 days (cycle
2), when water-stressed plants were rewatered
during 15 days to recovering (Figure 1).
We measured leaf water potential, gas
exchange and leaf GABA concentration during
water stress days and after rewatered plants.
Results
Gas exchange measurements
The control of stomatal conductance (gs) in
relation to the vapor pressure deficit (VPD) were
different among clones (Figure 2).
Clone Hibrid Local
COP1277 E. grandis x
camaldulensis Bahia
GG100 E.urophylla Minas Gerais
SUZ2003 E. urophylla x
tereticornis Maranhão
VM04 E. urophylla Minas Gerais
VER361 E. urophylla Bahia
CNB10 E. urophylla x grandis Minas Gerais
FIB6075 E. urophylla x grandis São Paulo
JAR2646 E. urophylla x grandis Pará
Figure1: Eucalyptus planted in Piracicaba, SP with
pot coverage to avoid rainfall.

118
Figure 2 Relation between stomatal conductance
and vapor pressure deficit for Eucalyptus clones in
water stress conditions.
Clones from drought areas had more stomatal
sensitivity (COP, VM and SUZ) than clones from
wet areas (JAR and CNB).
Table 1: Stomatal sensitivity of Eucalyptus clones
during water stressed days.
ClonesStomatal
Sensitivity
COP -0,087
VM -0,078
SUZ -0,061
GG -0,127
FIB -0,098
VER -0,102
JAR -0,213CNB -0,132
GABA Concentration
GABA aminoacid had a high correlation with
water potential, showing that this aminoacid is
largely produced in response to water stress con-
ditions (Figure 3).
Besides during the first day of water stress, GABA
concentration was higher for the clones from
drought areas (COP, VM and SUZ), the same
clones that had more stomatal sensitivity (Figure
4). This occurrence indicates that these clones
rapidly produce GABA and probably signalize
water stress conditions before clones from wet
areas.
This signalization can results in physiology reac-
tions, like stomatal control, for example.
Figure 3: Relation between water potential and
GABA concentration in Eucalyptus clones.
Figure 4: GABA concentration during the
first water stressed day in Eucalyptus
Future Plans
We plan develop a new study with the same
clones and on the same area inducing excess
of water, which is planned for the next semester
(January until July 2015). We will quantify how
these clones respond a different stress, not with-
out water but with excess of water.
We will measure water potential, GABA concen-
tration, leaf anatomic characteristics and gas
exchange variables, with the supervision of Mike
Ryan (Colorado State University).

119
Changes in Leaf Anatomy of Tropical Eucalyptus Clones Under
Water Stress Conditions
Marina S. G. Otto, Marcílio de Almeida, Lara Calvo; José L. Stape
Figure1. Eucalyptus planted in Piracicaba, SP with
pot coverage to avoid rainfall.
Figure 2. Days that we collected leafs for
anatomy measurements.
We had measure: stomatal density using epider-
mal impressions and histological characteristics
from transverse sections of leaves.
Study Objective
With the increase of planted areas with Eucalyptus
in regions under water stress, it becomes necessary
to increase our understanding about physiological
and anatomical processes triggered by the plants
under water stress conditions.
We had two goals in this study: (i) to compare leaf
anatomy for different Eucalyptus clones without
water stress; (ii) to evaluate changes of leaf
anatomy after water stress treatment.
Treatments and Experimental Design
Eight Eucalyptus clones from different origins were
evaluated.
Seedlings were planted in 320-liter pots located in
Piracicaba, state of São Paulo, Brazil in February
2013.
The experimental design is completely randomized
in a factorial 2 x 8: 2 treatments and 8 clones, with
6 repetitions, totaling 96 experimental units.
Water stress began on November 12th when
seedlings were around 10-15meters tall. Water
stress was imposed by non-irrigation of the plants
and pots coverage to avoid rainfall (Figure 1).
These water stress treatments were maintained for
2 cycles: 3 days (cycle 1) and 5 days (cycle 2)
when water-stressed plants were rewatered
during 15 days to recovering. 3 leafs per
treatment were collected before and after water
stress like showed on the Figure 2.

120
Figure 3. Homogeneous mesophyll for the SUZ
and COP clones (above) and heterogene-
ous mesophyll for CNB, FIB, JAR, GG100, VM
and VER clones (below).
Table 1. Stomatal density for the control and wa-
ter stress treatments in Eucalyptus clones.
Figure 2. Stomatal density for CNB, FIB, JAR, GG100, VM and VER clones (a, b) and for SUZ and COP
clones (e, f) in abaxial and adaxial sides.
Abaxial Adaxial Abaxial Adaxial
Results SUZ and COP clones from drought area have
homogeneous mesophyll with less intercellular
spaces compared with the others clones A typical
characteristic for species that lives in drought
areas, to avoid excess of evaporation and high
transpiration (Figure 1).
Related with stomatal density, the same clones
that presented homogeneous mesophyll,
presented stomatal density in both side of leafs
(abaxial and adaxial) (Figure 2).
After the water stress, all the clones increased
stomatal density, around 100 stomata per mm2 of
leaf (Table 1). This is a strategy called “get-it-while-
you-can”, when plants, after a drought period,
increase the stomatal density to be more efficient
during the periods when they have good water
conditions.
Future Plans
We will relate these results with physiological
measurements to understand the behavior for
these clones in water stress conditions.
Besides, we will do the same anatomy
measurements with more 10 different clones
that are being studying on the TECHS project.

121
Biomass Evaluation of the Eucalyptus spp. Plantations Established in
Bocaiúva, State of Minas Gerais, Brazil
Maria C. Arrevillaga L.; J.L. Stape
Justification The Brazil Eucalyptus Potential Productivity (BEPP)
Project was designed to evaluate the interaction
between wood production and the use of
natural resources, identifying the influence of
water and nutrients on Eucalyptus spp.
plantations established across a geographic
range of sites and clones in Brazil (Stape et al.
2010).
The BEPP project was developed as a
consortium of eight companies, the USDA Forest
Service, the Forest Science and Research
Institute (IPEF) in Brazil, the University of Sao Paulo
and Colorado State University.
Each company installed the experiment testing
irrigation levels and repeated fertilization at rates
according to its own site index. Although the
BEPP project started in 2001, the establishment of
the experiment in Bocaiúva, State of Minas
Gerais (MG), was initiated in 2005, continuing
the assessments such as forest inventory and
biomass evaluations until July 2014.
Figure 1. Localization of Bocaiuva, Minas Gerais
State, Brazil.
BEPP Bocaiúva The Eucalyptus plantations established in
Bocaiúva, MG, are highly influenced by the
water availability. The precipitation rates in the
area are approximately of 850 mm per year,
concentrated in the summer season (Table 1).
Table 1. Climate characteristics in Bocaiva, MG.
Therefore there was an interest in evaluate the
development of the plantation in conditions
where the water income was even lower than
the average precipitation rate, including an
additional treatment beside the other ones
established in the BEPP project: water
reduction.
Treatments and Experimental Design
The BEPP experiment in Bocaiúva was
established following a factorial design (3x2)
evaluating two factors simultaneously, water
availability: control, irrigated and reduced; and
fertilization rates: control and potential
fertilization. A total of 4 replicates were made
according with the 4 commercial clones of the
company (VM1, VM3, VM4 and MN463).
In order to evaluate the biomass of every
treatment, destructive sampling was made
selecting 6 trees per plot. The selection of the
trees was based on a forest inventory made
previously. DBH of every treatment was rated in
ascending order and selected trees
representatives of the average. The block
corresponding to the VM3 clone was not
included in this evaluation because it presented
wilt symptoms of Ceratocystis sp.
Average annual
temperature
23.5 ºC
PAR 3500 MJ.m.year
Average precipitation 850 mm.year
Potential evaporation 1220 mm.year

122
Measurements Measurements of height, DBH and tree crown
was made for each tree assessed. Trees were
felled in order to take samples of branches and
wood discs at different heights (0 m, 25%, 50%,
75% and 100% of commercial height).
Canopy was divided into three equal parts,
collecting 30 leafs per part for specific leaf area
index analysis. It was also evaluated the angle of
insertion of the leafs.
Results The irrigation increased 30% in the MAI for the
plot that receive only water from the rain and
50% for the plots with reduction rain.
Through the installation of dendrometers can
monitor the effect of treatments monthly,
especially during the dry season April to
October.
Next Steps Relate growth variables with the leaf area index
and light use efficiency in order to determinate
the influence of the fertilization and water
availability in the development of the
eucalyptus plantations established in Bocaiúva,
MG.
Based on the results obtained by Stape et al.
(2004) where the production increased by about
2.3 Mg ha–1 yr–1 for each 100 mm increase in
precipitation, it is expected to obtain a higher
biomass in the irrigated treatment since the area
has a low water availability; is also expected to
observe an influence of the fertilizer treatment
on the growth and carbon allocation of the
forest.
References
STAPE, J.; et al 2004. Bosque, Valdivia, v.2, p. 5-41.
STAPE, J. et al 2010 . Forest Ecology and Management,
v. 259, p. 1684–1694, 2010.
Figure 2: MAI for reduced, rainfall and irrigated
plots with 7 years old.
Irrigated
Rainfall
Reduced
Figure 2: MAI for reduced, rainfall and irrigated
plots with 7 years old.
Figure 3: Pictures of rainfall plot (above) and
redudec plot (below).
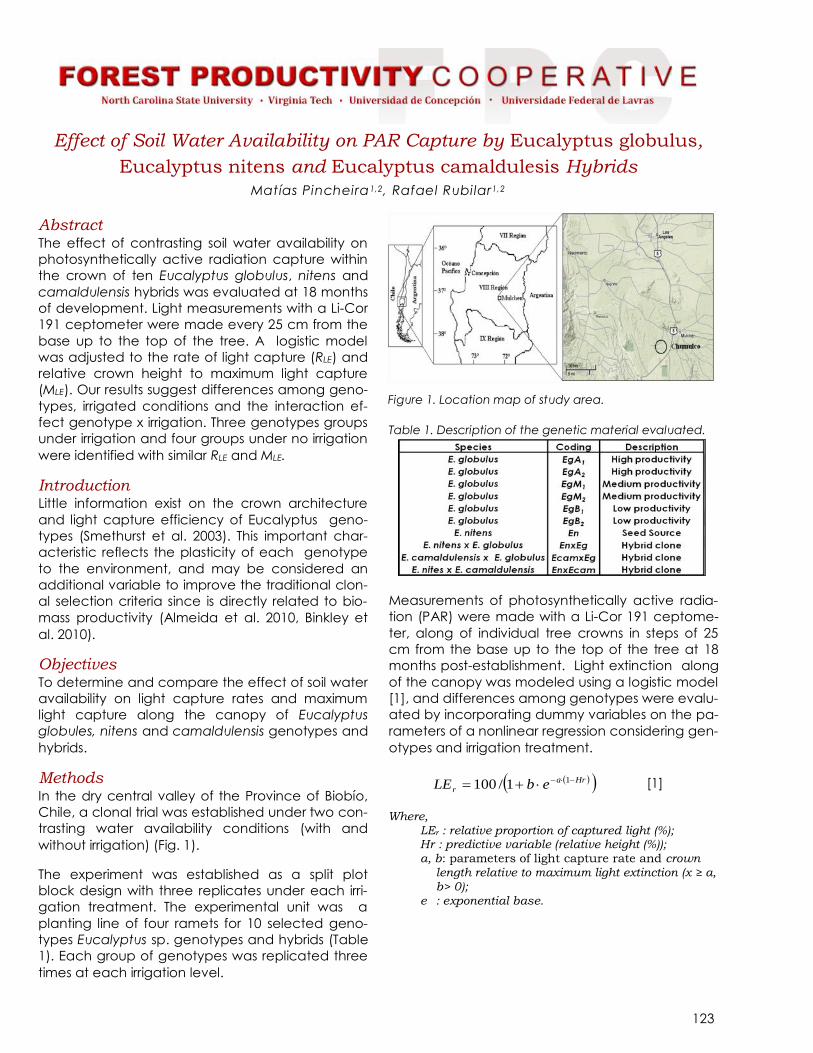
123
Effect of Soil Water Availability on PAR Capture by Eucalyptus globulus,
Eucalyptus nitens and Eucalyptus camaldulesis Hybrids
Matías Pincheira1,2, Rafael Rubilar1,2
Abstract The effect of contrasting soil water availability on
photosynthetically active radiation capture within
the crown of ten Eucalyptus globulus, nitens and
camaldulensis hybrids was evaluated at 18 months
of development. Light measurements with a Li-Cor
191 ceptometer were made every 25 cm from the
base up to the top of the tree. A logistic model
was adjusted to the rate of light capture (RLE) and
relative crown height to maximum light capture
(MLE). Our results suggest differences among geno-
types, irrigated conditions and the interaction ef-
fect genotype x irrigation. Three genotypes groups
under irrigation and four groups under no irrigation
were identified with similar RLE and MLE.
Introduction Little information exist on the crown architecture
and light capture efficiency of Eucalyptus geno-
types (Smethurst et al. 2003). This important char-
acteristic reflects the plasticity of each genotype
to the environment, and may be considered an
additional variable to improve the traditional clon-
al selection criteria since is directly related to bio-
mass productivity (Almeida et al. 2010, Binkley et
al. 2010).
Objectives To determine and compare the effect of soil water
availability on light capture rates and maximum
light capture along the canopy of Eucalyptus
globules, nitens and camaldulensis genotypes and
hybrids.
Methods In the dry central valley of the Province of Biobío,
Chile, a clonal trial was established under two con-
trasting water availability conditions (with and
without irrigation) (Fig. 1).
The experiment was established as a split plot
block design with three replicates under each irri-
gation treatment. The experimental unit was a
planting line of four ramets for 10 selected geno-
types Eucalyptus sp. genotypes and hybrids (Table
1). Each group of genotypes was replicated three
times at each irrigation level.
Table 1. Description of the genetic material evaluated.
Measurements of photosynthetically active radia-
tion (PAR) were made with a Li-Cor 191 ceptome-
ter, along of individual tree crowns in steps of 25
cm from the base up to the top of the tree at 18
months post-establishment. Light extinction along
of the canopy was modeled using a logistic model
[1], and differences among genotypes were evalu-
ated by incorporating dummy variables on the pa-
rameters of a nonlinear regression considering gen-
otypes and irrigation treatment.
Figure 1. Location map of study area.
[1] Hra
r ebLE 11/100
Where, LEr : relative proportion of captured light (%); Hr : predictive variable (relative height (%)); a, b: parameters of light capture rate and crown length relative to maximum light extinction (x ≥ a, b> 0); e : exponential base.

124
Results Differences in the rate of light relative capture (RLE)
along of the canopy was significative between
irrigated conditions for all geneotypes, exept in
EcxEg. Relative crown length to maximum light
capture (MLE) differed except in EgA2, EgB2 and
EnxEc (Figs. 2 y 3).
Figure 2. Relative light capture along the canopy of Eu-
calyptus genotypes. Closed dots (irrigated) Inversed tri-
angles (without irrigation).
Under irrigation, genotypes EgA1, EgA2, EgM2, Eg-
B1, EgB2, En, and EcxEg (group A) presented simi-
lar RLE and MLE, followed by EnxEc (group B), and
EgM1 and EnxEg (group C). EgA1, EgA2, EnxEc
and EcxEg (group A) presented the highest MLE,
followed by EgM2, EgB1, EgB2 and En (group B),
and EgM1 and EnxEg (group C).
Without irrigation, genotype EcxEg presented the
highest RLE (group A), followed by EgA1, EgA2,
EgM1, EgM2, EgB1, En and EnxEg (group B), and
EgB2 and EnxEc (groups C and D, respectively).
The genotypes EgA1, EgA2, EgM1, EgM2, EnxEg
and EcxEg presented the maximum MLE (group A),
followed by EgB1, EgB2, En and EnxEc (group B).
Figure 3. Effect of soil water availability on light extinction
model parameters (Model 1). (a) parameter of light
capture rate, (b) parameter of relative crown length to
maximum light capture.
Conclusions Irrigated conditions increased Eucalyptus geno-
types relative light capture along the crown. Re-
sponses were genotype specific and independent
of the main species tested.
Acknowledgments To the Chilean National Fund for Scientific and
Technological Development, FONDECYT 1085093.
To the valuable and continuous support of Forestal
Mininco S.A. to develop this research.
Bibliography Almeida, A. Siggins, A. Batista, T. Beadle, C. 2010.
Mapping the effect of spatial and temporal var-
iation in climate and soils on Eucalyptus planta-
tion production with 3-PG, a process-based
growth model. Forest Ecology and Manage-
ment 259: 1730-1740.
Binkley, D. Stape, J. Bauerle, W. Ryan, M. 2010. Ex-
plaining growth of individual trees: Light inter-
ception and efficiency of light use by Eucalyp-
tus at four sites in Brazil. Forest Ecology and Man-
agement 259: 1704-1713.
Smethurst, P. Baillie, C. Cherry, M. Holz, G. 2003. Fer-
tilizer effects on LAI and growth of four Eucalyp-
tus nitens plantations. Forest Ecology and Man-
agement 176: 531–542.
0,0 0,3 0,5 0,8 1,0
0
25
50
75
100
Lig
ht
rela
tive e
xtin
tio
n e
stim
ate
d (
%)
0
25
50
75
100
With irrigation
Without irrigation
EgA1 EgA2
0
25
50
75
100EgM1 EgM2
0
25
50
75
100EgB1 EgB2
0
25
50
75
100En
0,0 0,3 0,5 0,8 1,0
EnxEc
EnxEg
EcxEg
1- relative height
Para
met
er a
0
1
2
3
4
5
6
7
EgA1
EgA2
EgM
1
EgM
2
EgB1
EgB2 En
EnxE
g
EnxE
c
EcxE
g
Para
met
er b
0
2
4
6
8
10
wiht irrigation
without irrigation
b
bb
b
b
bb
a
aa
aa a a
a
aa
a aa
nsns
ns
aa
a aa
a
a
a
aa
bb b b
b
bb
b
ans
Re
lativ
e li
gh
t c
ap
ture
(%
)

125
Effect of Water Availability and Temperature on Leaf Deployment
in Genotypes of Eucalyptus globulus, Eucalyptus nitens and
Eucalyptus camaldulensis Hybrids
Matías Pincheira, Rafael Rubilar, Jorge Cancino, Manuel Acevedo
Abstract The effect of contrasting water availability
conditions was evaluated in ten genotypes of
Eucalyptus sp. on leaf area growth fortnightly.
Non-destructive leaf measurements were made
every two weeks during the first growing season,
and the effect of soil moisture and temperature
on foliar increment were identified as boundary
conditions of maximum leaf area growth rates.
Under irrigation two optimal growing conditions
were identified where without irrigation only one
condition was observed. The amplitude of
maximum range of foliar growth for genotypes
of E. globulus was directly related its cumulative
volume growth. E. nitens hybrids showed a
greater amplitude of growth conditions.
Introduction In species of the genus Eucalyptus analysis of the
dynamics and evolution of leaf growth is a topic
not completely well understood (Smethurst et al.
2003). Plasticity of genotypes to the environment
may determine common strategies to capture
light but more importantly understanding these
mechanisms may improve traditional clonal
selection criteria (Almeida et al. 2010, Binkley et
al. 2010).
Objectives To determine the effect of soil water availability
and temperature on leaf area growth in
Eucalyptus genotypes.
Methods In the dry central valley of the Province of Bio
Bio, Chile, a clonal trial was established under
two contrasting water availability conditions
(with and without irrigation) (Fig. 1).
The experiment was established as a split plot
block design with three replicates under each
irrigation treatment. The experimental unit
considered a line of four ramets for 10 selected
genotypes of Eucalyptus genotypes (Table 1)
replicated three times for each irrigation level.
Table 1. Description of the genetic material evaluated.
Two branches (a row and inter-row branch)
were selected from one plant from each
experimental unit. on these non-destructive
measurements of leaf area accumulated
increases (AF) were made every during the first
growing season.
The absolute increases fortnightly branch leaf
area were categorized into deciles and defined
the conditions of soil moisture (%, from 0 to 30 cm
of depth) and average temperature (° C,
fortnightly) limits expression of max growth rates.
We considered two levels of analysis, i. by
condition, and ii. per genotype and condition.
Results
Significant differences in the magnitude of
máximum leaf área growth rates were observed
between irrigated and no irrigated conditions
(Fig. 2).
Figure 1. Location map of study area.

126
Figure 2. Effect of soil moisture content and fortnightly
average temperature on the average increase leaf area
branch during the fisrt growing season generally for all
genotypes. Colors showing foliar increases deciles (cm2/
fortnightly).
Under irrigation, despite the narrower range of
moisture, two optimal boundaries of soil moisture
and temperature were observed for maximum
expression of leaf area growth rates. The first, at
a rate of 30% soil moisture and 21.5 °C, and the
second at a rate of 26% humidity and 25.5 °C
(Figure 2). Under no irrigation only one optimum
area was observed for peak growth rates.
However, this was a broader response surface
(12-24% moisture and 18.5-25 °C) showing that
the magnitude of the highest growth rate decile
under no irrigation was significantly lower than
the first decile under irrigation (fig. 2).
Similar patterns of soil moisture conditions and
high temperatures effects on leaf growth rates
were observed for E. globulus genotypes but
also for E. nitens x E. camaldulensis and
E.camaldulensis x E. globulus genotypes.
The greater range of humidity and temperature
of growth was observed on E.nitens x E. globulus,
E. nitens and E.nitens x E. camaldulensis
genotypes. However, these genotypes also
showed less amplitude for optimal growth (top
decile) under irrigation (fig. 3).
Conclusions Leaf area growth rates of Eucalytpus genotypes
respond positively to favorable conditions of
water availability at this Mediterranean climate
site.
Figure 3. Range of soil moisture and average temperature of
expression the maximum foliar growth rates fortnightly (top
decile) by genotype and hydric availability condition. Colors
indicate representative genotypes.
However, genotype peak growth rates differ
between irrigated and no irrigated conditions
suggesting as expected larger soil water control
at no-irrigated conditions, but more atmospheric
demand influence at irrigated conditions.
Acknowledgments Funding for this study was granted by the
National Fund for Scientific and Technological
Development, Project FONDECYT 1085093. Also
we would like to acknowledge the valuable
support of Forestal Mininco S.A., and Conicyt
Scholarship for Master's Studies in Chile of
Pincheira, M.
Bibliography Almeida, A. Siggins, A. Batista, T. Beadle, C. 2010. Mapping
the effect of spatial and temporal variation in climate
and soils on Eucalyptus plantation production with 3-PG,
a process-based growth model. Forest Ecology and
Management 259: 1730-1740.
Binkley, D. Stape, J. Bauerle, W. Ryan, M. 2010. Explaining
growth of individual trees: Light interception and
efficiency of light use by Eucalyptus at four sites in Brazil.
Forest Ecology and Management 259: 1704-1713.
Smethurst, P. Baillie, C. Cherry, M. Holz, G. 2003. Fertilizer
effects on LAI and growth of four Eucalyptus nitens
plantations. Forest Ecology and Management 176: 531–
542.
With irrigation
Without irrigation
Fort
nigh
tlyav
erag
ete
mpe
ratu
re(°
C)
Soil moisture content (%)
cm2
cm2
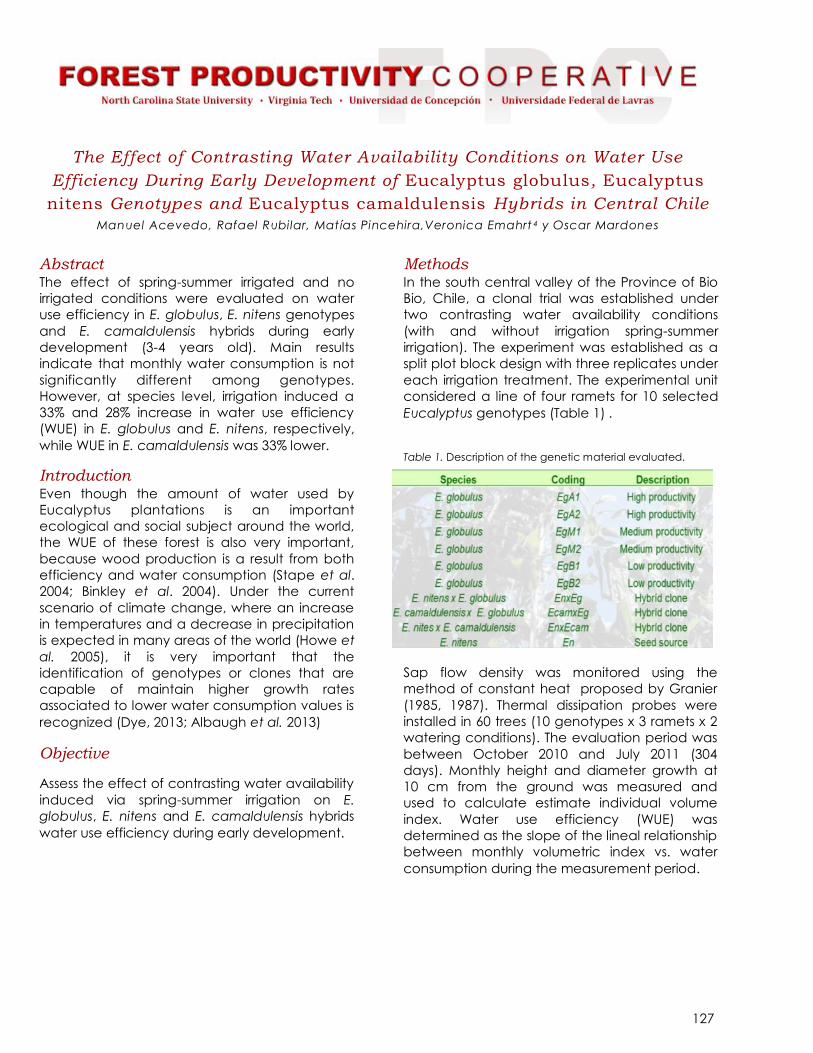
127
The Effect of Contrasting Water Availability Conditions on Water Use
Efficiency During Early Development of Eucalyptus globulus, Eucalyptus
nitens Genotypes and Eucalyptus camaldulensis Hybrids in Central Chile
Manuel Acevedo, Rafael Rubilar, Matías Pincehira,Veronica Emahrt 4 y Oscar Mardones
Abstract The effect of spring-summer irrigated and no
irrigated conditions were evaluated on water
use efficiency in E. globulus, E. nitens genotypes
and E. camaldulensis hybrids during early
development (3-4 years old). Main results
indicate that monthly water consumption is not
significantly different among genotypes.
However, at species level, irrigation induced a
33% and 28% increase in water use efficiency
(WUE) in E. globulus and E. nitens, respectively,
while WUE in E. camaldulensis was 33% lower.
Introduction Even though the amount of water used by
Eucalyptus plantations is an important
ecological and social subject around the world,
the WUE of these forest is also very important,
because wood production is a result from both
efficiency and water consumption (Stape et al.
2004; Binkley et al. 2004). Under the current
scenario of climate change, where an increase
in temperatures and a decrease in precipitation
is expected in many areas of the world (Howe et
al. 2005), it is very important that the
identification of genotypes or clones that are
capable of maintain higher growth rates
associated to lower water consumption values is
recognized (Dye, 2013; Albaugh et al. 2013)
Objective
Assess the effect of contrasting water availability
induced via spring-summer irrigation on E.
globulus, E. nitens and E. camaldulensis hybrids
water use efficiency during early development.
Methods In the south central valley of the Province of Bio
Bio, Chile, a clonal trial was established under
two contrasting water availability conditions
(with and without irrigation spring-summer
irrigation). The experiment was established as a
split plot block design with three replicates under
each irrigation treatment. The experimental unit
considered a line of four ramets for 10 selected
Eucalyptus genotypes (Table 1) .
Table 1. Description of the genetic material evaluated.
Sap flow density was monitored using the
method of constant heat proposed by Granier
(1985, 1987). Thermal dissipation probes were
installed in 60 trees (10 genotypes x 3 ramets x 2
watering conditions). The evaluation period was
between October 2010 and July 2011 (304
days). Monthly height and diameter growth at
10 cm from the ground was measured and
used to calculate estimate individual volume
index. Water use efficiency (WUE) was
determined as the slope of the lineal relationship
between monthly volumetric index vs. water
consumption during the measurement period.

128
Figure 1. Linear relationship between water
consumption (m3 tree-1 month-1) and volumetric
increment (m3 of wood tree-1 month-1) at individual
level of E. globulus (a); E. nitens (b) and E.
camaldulensis genotypes by irrigation treatments.
RMSE, root means square error; R2, determination
coefficient. **; Significant for P<0.01; *** P<0.001.
Results At this early stage of development, E. nitens
showed the highest WUE from all evaluted
species at this site, and in E. globulus showed a
higher WUE than E. camaldulensis.
A highly significant linear relationship (P < 0.001)
between monthly water consumption and
volumetric increment at individual tree level was
observed under both irrigation conditions for E.
globulus (egh1, egm1, egm2 y egl1), E. nitens
(en y enxeg) and E. camaldulensis (enxec y
egxec). For E. globulus (Fig. 1a) WUE for no
irrigated conditions (rainfeed) was 0.0225
(R2=0.84) and for irrigated 0.0299 m3m-3
(R2=0.90). Irrigation significantly increased (P <
0.01) WUE in 0.0074 m3m-3 which represents a
33% increment. For E. nitens (Fig. 1 b) WUE
reached 0.0348 for no irrigated (R2=0.93) and
0.0444 m3m-3 for irrigated conditions (R2=0.97)
for rainfed and irrigated conditions. Irrigation for
E. nitens also increased significantly WUE (P <
0.01) in 0.0096 m3m-3 which represents a 28%
improvement. Contrastingly, WUE for E.
camaldulensis genotypes (Fig. 1 c) reached a
value of 0.0185 (R2=0.94) for no irrigated
(rainfeed) trees and a value of 0.0128 (R2=0.87)
m3m-3 for irrigated conditions. In this case,
irrigation significantly decreased WUE of E.
camaldulensis (P < 0.01) in 0.0057 m3m-3, which
corresponds to a 31% decrease. This result is very
interesting considering that all species showed
larger growth at irrigated conditions, and based
on how usually these species are selected for
dry environments a general understanding
indicates that from higher to lower resistance to
drought these species should rank E.
camaldulensis > E.globulus > E.nitens.
Conclusions WUE assessed through individual volume
depends on the species, indicating the E. nitens
is more efficient than E. globulus, and these in
turn are more efficient than E. camaldulensis.
Evaluation of WUE under irrigated and non-
irrigated conditions showed that E. globulus and
E. nitens was positively affected by irrigation.
Contrastingly, E. camaldulensis showed a
decrease in WUE at irrigated conditions.
Acknowledgements The authors of this research would like to
acknowledge the support of CONICYT graduate
scholarship, FONDECYT Project Nº 1085093,
Forestal Mininco Company SA., the Forest
Productivity Cooperative, the Soil, Nutrition and
Forest Productivity Laboratory at the Faculty of
Forest Sciences at Universidad de Concepción,
Chile.
Water use (m3 tree
-1 month
-1)
0.0 0.1 0.2 0.3 0.4 0.5 0.6 0.7 0.8 0.9
Vo
lum
en In
cre
men
t (m
3 tre
e-1
mo
nth
-1)
0.000
0.005
0.010
0.015
0.020
0.025
0.030
0.035
0.040E. nitens irrigated
Linear (irrigated)
E. nitens rainfed
Linear (rainfed)
ynitens=0.0444 (***) x
R2= 0.97; RMSE=0.0019
ynitens=0.0348 (***) x
R2= 0.93; RMSE=0.0027
Diff= 0.0096 (**)
yirrigated=0.0299 (***) x
R2= 0.90; RMSE=0.0026
Diff=0.0074 (**)
Water use (m3 tree
-1 month
-1)
0.0 0.1 0.2 0.3 0.4 0.5 0.6 0.7 0.8 0.9
Vo
lum
en
In
cre
me
nt
(m3 t
ree
-1 m
on
th-1
)
0.000
0.005
0.010
0.015
0.020
0.025
0.030E. globulus irrigated
Linear (irrigated)
E. globulus rainfed
Linear (rainfed)
yrainfed=0.0225 (***) x
R2= 0.84; RMSE=0.0019
Water use (m3 tree
-1 month
-1)
0.0 0.1 0.2 0.3 0.4 0.5 0.6 0.7 0.8 0.9
Volu
men Incre
ment (m
3 tre
e-1
month
-1)
0.000
0.002
0.004
0.006
0.008
0.010
0.012
0.014
0.016
0.018E. camaldulensis irrigated
Linear (irrigated)
E. camaldulensis rainfed
Linear (rainfed)
ycamaldulensis=0.0128 (***) x
R2= 0.87; RMSE=0.0013
Diff= - 0.0057 (**)
ycamaldulensis=0.0185 (***) x
R2= 0.94; RMSE=0.0012
(a)
(b)
(c)

129
Drought Effects in Gas Exchange Parameters on Eucalyptus spp.
María Silva, Rafael Rubilar
Objective To evaluate the response in gas exchange
parameters on young seedlings of 35
Eucalyptus genotypes under drought stress
conditions.
Methods Thirty five genotypes of Eucalyptus globulus, E.
nitens, E. badjensis, E. smithii and hybrids E.
globulus x E. nitens and E. camaldulensis x E.
globulus were tested under two irrigation
treatments: 1) irrigated (control) and 2)
progressive drought (Figure 1).
Predawn water potential (ψpredawn) and leaf-gas
exchange parameters (net photosynthesis (A),
stomatal conductance (gs) and transpiration
(E)) were evaluated at three sampling instances
(M0, M1.5 and M2.5 corresponding to soil water
potentials of -0.03 MPa, -1.5 MPa and -2.5 MPa,
respectivelly, and compared to a Control
treatments at -0.03 MPa,. Gas exchange
measurements were obtained using a Licor
6400 XTR equipment and Instantaneous water
use efficiency (WUEi) was estimated as the ratio
between A and E.
Results Water potential (ψpredawn) of the Control
treatment remained steady between
measurements, with values over -0.59 MPa for
all the genotypes (Figure 2). Drought treatment
decreased ψpredawn from -0.19 ± 0-01 MPa in M0
to -0.59 ± 0.02 MPa and -2.10 ± 0.06 MPa in M1.5
and M2.5, respectively (Figure 2).
Significant differences in the leaf-gas exchange
parameters were found between sampling
instances (p < 0.05). Both gs and E decreased
decreased as long as Ψpredawn decreased
(Figure 3).
Figure 1. (A) Control treatment (B) Drought
treatment with rain protection.
Figure 2. Predawn water potential measured in
the 35 Eucalyptus genotypes in control (A) and
drought (B) treatments.

130
____________________________________________________________________________________________________
More information about the this research can be found on the Forest Nutrition Cooperative website
www.forestnutrition.org
Overall, photosynthesis showed a high
decrease between M1.5 and M2.5 (Figure 4),
with differences observed at genotype level.
WUEi exhibited an increase from 2.98 ± 0.10
µmol CO2 mmol-1 H2O at M0 to 13.62 ± 0.71
µmol CO2 mmol-1 H2O at M2.5. Significant
differences were found among genotypes at
M1.5 and M2.5 (Figure 5).
Conclusions The responses to drought varied among
genotypes, suggesting that different
mechanism are involved. In some cases there
weren’t significant changes in the
photosynthetic responses, but those were
observed for gs and E. Interestingly, clear
groups of genotypes were observed showing
increased or decreased levels of WUEi under
progressive stress.
Acknowledgements This research was made possible by the support
of FONDEF project D11i1161 Eucahydro, the
Forest Nutrition Cooperative lab and the
University of Concepción.
Figure 5. Instantaneous water use efficiency
(μmol CO2 mol H2O s-1) measured on the 35
Eucalyptus genotypes in the three sampling
instances.
Figure 4. Net photosynthesis (μmol CO2 m-2 s-1)
measured in the 35 Eucalyptus genotypes in
drought treatment.
Figure 3. Relationship between stomatal
conductance and predawn water potential for

131
Carbon Fluxes on Eucalyptus Plantations: Genetic and Climatic Effects
Otávio Campoe, Jose Stape, Dan Binkley, Mike Ryan
Introduction Wood production is the ultimate goal for forestry
companies and represents a significant but also
variable fraction of gross primary production
(GPP) in Eucalyptus plantations. The carbon (C)
absorbed by photosynthesis is partitioned to
different fluxes above- and belowground (Figure
1).
Despite the current understanding about carbon
fluxes and partitioning, knowledge about the
effects of climatic seasonality, genetic variation
and their interaction is still limited. Better
knowledge of fluxes and partitioning to woody
and non-woody tissues in response climatic and
genetic variations, focusing on mechanisms
driving the C budget of these plantations, could
provide opportunities to increase forest
productivity.
The TECHS project (www.ipef.br/techs), a
combination of genotype variation and water
manipulation across a wide climatic range
(Figure 2), provides a research platform to assess
genotype-environment interactions over carbon
fluxes and partitioning.
Our study aim investigating how C fluxes and
partitioning are affected by genotype variation,
climatic seasonality and their interaction in
different regions of Brazil.
Sites and Clones Selection Four of the 36 experimental sites of the TECHS
project were selected comprising a wide range
of climatic conditions, with cumulated annual
rainfall ranging from 1000 to 1800 mm,
cumulated annual water deficit from 0 to 700
mm and mean annual temperature from 18 to
28 oC (Figure 2).
Five contrasting clones regarding productivity
and root and canopy development from
different genotypes (pure and hybrids of E.
camaldulensis, E. grandis, E. saligna, E.
tereticornis and E. urophylla) were selected for
complete carbon budget assessment.
The study started at 2 years and will be
performed up to 4 years after planting,
capturing carbon fluxes and partitioning at
maximum current annual increment period of
the rotation.
Figure 1. Location of the four carbon budget sites (large white
circles) among the 36 TECHS´ experimental sites (small black
circles) across Brazil and Uruguay. The color scale represents
the ratio of historic annual potential evapotranspiration (ETPo)
and annual precipitation (PPT).
Figure 1. Diagram of carbon partitioning to above and below
ground components. Adapted from Litton et al. 2007.

132
Methodology
Assessments of annual aboveground net primary
production (ANPP: stem, leaf, and branch
production), total belowground C flux (TBCF:
sum of root production and respiration and
mycorrhizal production and respiration, eq. 2)
and GPP (computed as the sum of ANPP, TBCF
and estimated aboveground respiration) started
2 years after planting (October 2013) at four
sites. The measurements will be performed for
the next 2 years (until October 2015). The
methodology applied was based on Giardina
and Ryan (2002) and Ryan et al. (2010).
Partial Results
Carbon fluxes were more affected by climatic
differences among sites than genetic
differences among clones (Figure 3). The
cumulated soil CO2 efflux for clones over the
period ranged from 1405 (AEC 144) to 1493 g C
m-2 year-1 (CNB 10), and cumulated litterfall
ranged from 232 (CNB 10) 329 g C m-2 year-1
(SUZ MA2003). However, differences among sites
were higher.
The cumulated soil CO2 efflux for sites over the
period ranged from 1159 (20-IPB) to 1901 g C m-2
year-1 (22-KLT), and cumulated litterfall ranged
from 208 (20-IPB) 378 g C m-2 year-1(30-VMT).
Wood production (WNPP, Figure 4) showed a
gradient among clones (from 460 to 1090 g C m-
2 year-1) and sites (from 540 to 1112 g C m-2 year-
1).
Conclusions Studies of C budget in forest plantations are
required to improve our understanding of the
processes driving wood production and carbon
fixation, and develop our capability to
understand forest responses to climatic and
genetic interactions.
Acknowledgements To the 26 companies of the IPEF-TECHS project
for financial and technical support. For more
information: www.ipef.br/techs
References Giardina, C.P., Ryan, M.G., 2002. Ecosystems 5, 487–499.
Ryan, M.G. et al. 2010. Forest Ecol. Manag. 259, 1695–1703.
Litton, C.M. et al. 2007. Global Change Biol. 13 , 2089-2109.
Figure 5. One of the
TECHS clones showing
different behaviors on
each C budget site. Pic-
tures show a gradient of
water availability, from
no water deficit on the
left to intense water defi-
cit on the right.
Figure 3. Monthly soil CO2 efflux (right) and Litterfall (left) for clones (top, average
among sites) and for sites (bottom, average among clones).
Figure 4. WNPP for clones (gray, average
among sites) and for sites (green, average
among clones).

133
Populus Special Study—Identifying Cottonwood and Hybrid Poplar Clones
with the Highest Productivity on Two sites in the SEUS
Nathan Thomas, Jose Stape, Steve Kelley
Background The genus Populus contains one of the fastest
growing tree species in temperate climates.
Eight species of Populus are native to the United
States with many regions of natural hybridization.
Currently, in the United States, poplar plantations
are located in the Pacific Northwest, Mississippi
Alluvial Valley, and the Northeast. However,
now there is an increased interest in Populus
across the SE US, because of the effect that
renewable energy goals have created by
increasing the demand for woody biomass.
New Populus clones are being investigated on
sites across the SE US for their productivity and
disease resistance. This study will examine 52
clones of cottonwood and hybrid poplar
planted on two sites, North Carolina and
Mississippi.
Study Objectives 1. To identify poplar clones with the highest
growth, and quantify their productivity.
2. To estimate Light Use Efficiency, Water Use
Efficiency and Nutrient Use Efficiency for the
most productive clones.
3. To evaluate any G x E interaction.
Experimental Design The Raleigh site design is composed of 8 reps,
with 52 clones per rep, and each rep
randomized.
The Columbus site design has 10 reps, with 52
clones per rep, and each rep randomized.
Materials and Sampling The site in Columbus, MS, and Raleigh, NC, were
both planted in March, 2014 with genetically
identical unrooted cuttings.
The 52 clones are comprised of 47 Populus
deltoides, 4 Populus trichocarpa x deltoides, and
1 Populus deltoides x maximowiczii.
Measurements will be taken for two growing
seasons, in Fall 2014 and Fall 2015.
The objective of these measurements is to
calculate the volume of hybrid poplar and its
disease resistance. Volume will be calculated
Figure 2. Fertilizer application.
Figure 1. Location of Field sites in Raleigh, NC, and
Columbus, MS.

134
by measuring the diameter at breast height
(DBH) and total height of each individual tree.
Also, the diameter at root collar (DRC) will be
measured, since not all trees have developed a
DBH by the first measurement period. Disease
will be determined by assessing the canopy
health. The trees will be given a numerical value
of 1 through 4 depending on the severity of
damage.
Preliminary Results Average height for the top 15 clones in Raleigh,
NC, can be seen in Figure 3. The average height
is 3 meters with the best clone averaging 3.7
meters. The tallest clone (7388) at each site is
shown in figure 4. Table 1, shows that In Raleigh
the survival is 100% for the top 10 clones. In
Columbus the average survival per clone is 90%.
The difference in growth between clones is very
obvious in the field, and can be seen in Table 1,
Even in just the top 10 clones the difference in
height and volume is significant.
In Table 1, 5 of the clones are in the top 10 on
both sites, showing their adaptability across sites.
Whereas some of the clones that were
productive on one site, had very poor growth on
the other site.
Next Steps Measurements will be taken again following the
2015 growing season in order to calculate the
growth and assess the resistance to disease.
Acknowledgements This project has been realized by the support of
the Forest Productivity Cooperative and its
cooperators. The IBSS project is supported by
the Agriculture and Food Research Initiative
Competitive Grant from the USDA National
Institute of Food and Agriculture.
Figure 4. Clone 7388 in Raleigh and Columbus. Both
trees are over 4.6 meters.
Table 1. Summary measurements comparing the
top 10 clones in Raleigh and Columbus.
Figure 3. The 15 tallest clones at the Raleigh, NC
site
0.0
0.5
1.0
1.5
2.0
2.5
3.0
3.5
4.0
Ave
rage
Hei
ght
(m)
Clone
Top 15 (NC)Deltoides
Hybrid
Clon
e
Avg. Values (Raleigh) Clon
e
Avg. Values
Vol Ht (m) Surv. % Vol Ht (m) Surv. %
7388 2.51 3.76 100 185 1.93 2.64 100
8019 2.46 3.64 90 229 1.68 2.64 100
230 2.32 3.55 100 230 1.61 2.68 100
140 2.23 3.06 100 348 1.52 2.18 100
339 2.20 3.07 100 187 1.50 2.34 90
185 2.19 3.18 100 7388 1.46 2.75 90
116 2.14 2.82 100 188 1.45 1.99 90
400 2.13 2.90 100 8019 1.40 2.22 100
7595 2.13 2.92 100 200 1.35 2.11 80
188 2.12 3.03 100 176 1.34 2.37 80
Raleigh Columbus
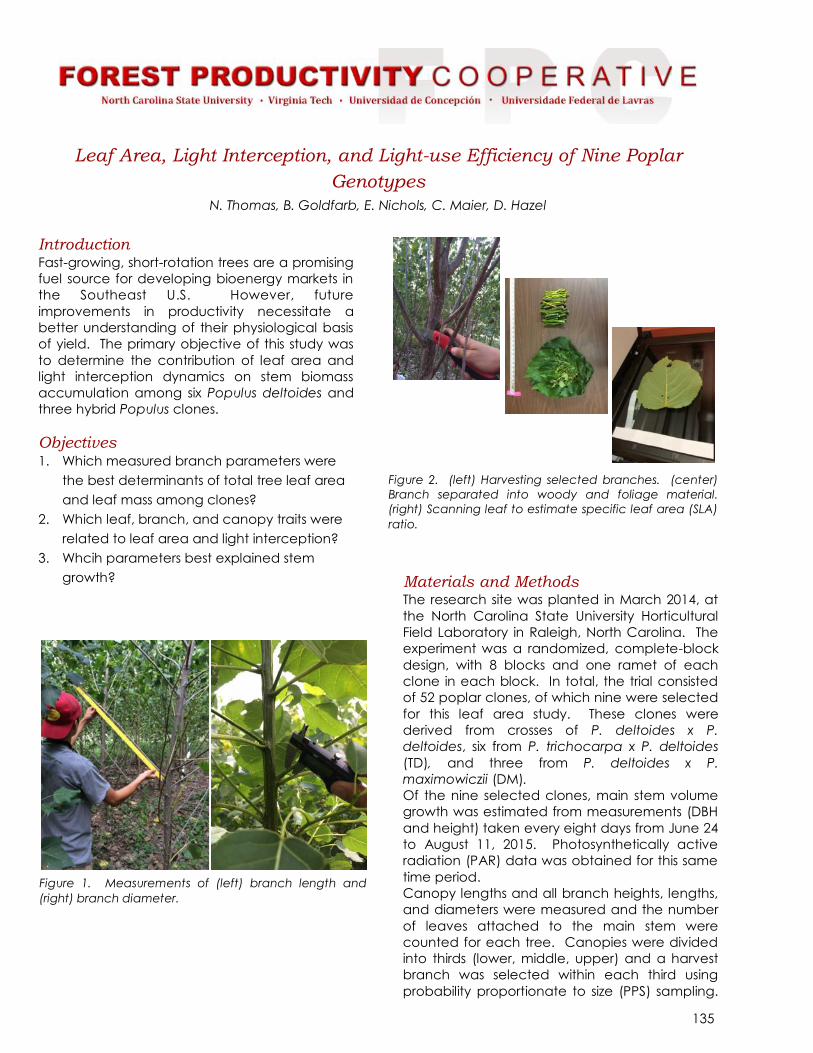
135
Leaf Area, Light Interception, and Light-use Efficiency of Nine Poplar
Genotypes
N. Thomas, B. Goldfarb, E. Nichols, C. Maier, D. Hazel
Introduction Fast-growing, short-rotation trees are a promising
fuel source for developing bioenergy markets in
the Southeast U.S. However, future
improvements in productivity necessitate a
better understanding of their physiological basis
of yield. The primary objective of this study was
to determine the contribution of leaf area and
light interception dynamics on stem biomass
accumulation among six Populus deltoides and
three hybrid Populus clones.
Objectives 1. Which measured branch parameters were
the best determinants of total tree leaf area
and leaf mass among clones?
2. Which leaf, branch, and canopy traits were
related to leaf area and light interception?
3. Whcih parameters best explained stem
growth?
Materials and Methods The research site was planted in March 2014, at
the North Carolina State University Horticultural
Field Laboratory in Raleigh, North Carolina. The
experiment was a randomized, complete-block
design, with 8 blocks and one ramet of each
clone in each block. In total, the trial consisted
of 52 poplar clones, of which nine were selected
for this leaf area study. These clones were
derived from crosses of P. deltoides x P.
deltoides, six from P. trichocarpa x P. deltoides
(TD), and three from P. deltoides x P.
maximowiczii (DM).
Of the nine selected clones, main stem volume
growth was estimated from measurements (DBH
and height) taken every eight days from June 24
to August 11, 2015. Photosynthetically active
radiation (PAR) data was obtained for this same
time period. Canopy lengths and all branch heights, lengths,
and diameters were measured and the number
of leaves attached to the main stem were
counted for each tree. Canopies were divided
into thirds (lower, middle, upper) and a harvest
branch was selected within each third using
probability proportionate to size (PPS) sampling.
Figure 1. Measurements of (left) branch length and
(right) branch diameter.
Figure 2. (left) Harvesting selected branches. (center)
Branch separated into woody and foliage material.
(right) Scanning leaf to estimate specific leaf area (SLA)
ratio.
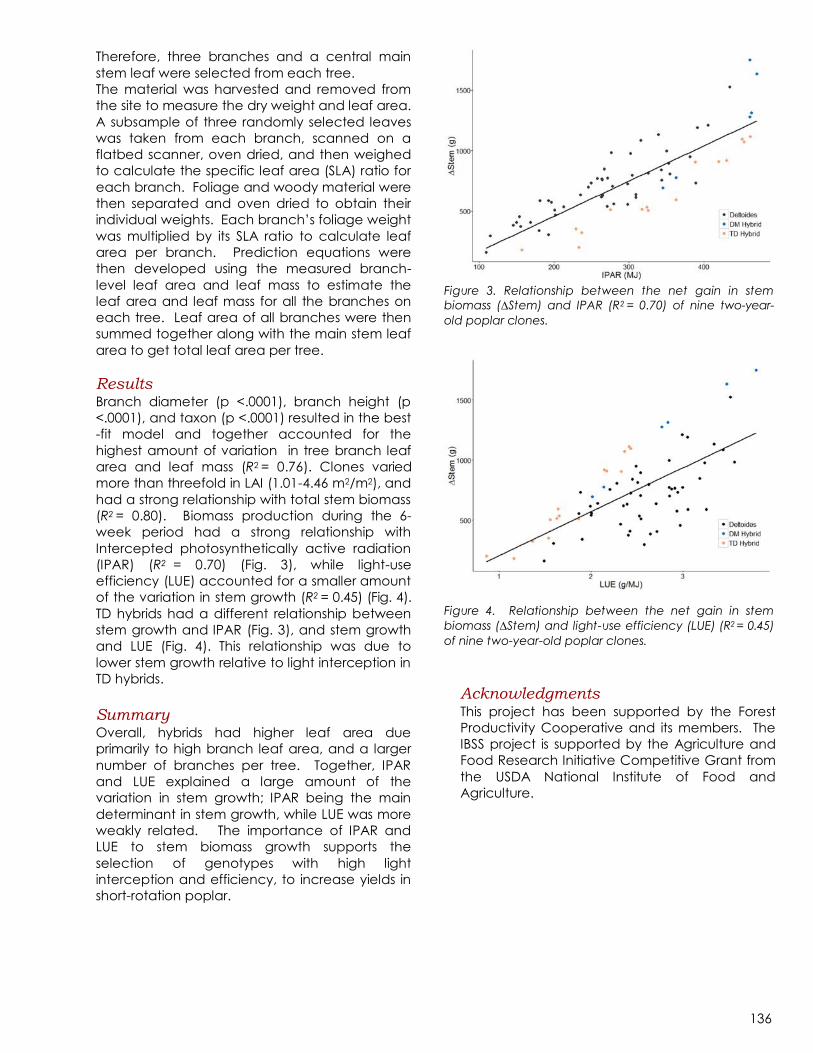
136
Therefore, three branches and a central main
stem leaf were selected from each tree.
The material was harvested and removed from
the site to measure the dry weight and leaf area.
A subsample of three randomly selected leaves
was taken from each branch, scanned on a
flatbed scanner, oven dried, and then weighed
to calculate the specific leaf area (SLA) ratio for
each branch. Foliage and woody material were
then separated and oven dried to obtain their
individual weights. Each branch’s foliage weight
was multiplied by its SLA ratio to calculate leaf
area per branch. Prediction equations were
then developed using the measured branch-
level leaf area and leaf mass to estimate the
leaf area and leaf mass for all the branches on
each tree. Leaf area of all branches were then
summed together along with the main stem leaf
area to get total leaf area per tree.
Results Branch diameter (p <.0001), branch height (p
<.0001), and taxon (p <.0001) resulted in the best
-fit model and together accounted for the
highest amount of variation in tree branch leaf
area and leaf mass (R2 = 0.76). Clones varied
more than threefold in LAI (1.01-4.46 m2/m2), and
had a strong relationship with total stem biomass
(R2 = 0.80). Biomass production during the 6-
week period had a strong relationship with
Intercepted photosynthetically active radiation
(IPAR) (R2 = 0.70) (Fig. 3), while light-use
efficiency (LUE) accounted for a smaller amount
of the variation in stem growth (R2 = 0.45) (Fig. 4).
TD hybrids had a different relationship between
stem growth and IPAR (Fig. 3), and stem growth
and LUE (Fig. 4). This relationship was due to
lower stem growth relative to light interception in
TD hybrids.
Summary Overall, hybrids had higher leaf area due
primarily to high branch leaf area, and a larger
number of branches per tree. Together, IPAR
and LUE explained a large amount of the
variation in stem growth; IPAR being the main
determinant in stem growth, while LUE was more
weakly related. The importance of IPAR and
LUE to stem biomass growth supports the
selection of genotypes with high light
interception and efficiency, to increase yields in
short-rotation poplar.
Acknowledgments This project has been supported by the Forest
Productivity Cooperative and its members. The
IBSS project is supported by the Agriculture and
Food Research Initiative Competitive Grant from
the USDA National Institute of Food and
Agriculture.
Figure 3. Relationship between the net gain in stem
biomass (∆Stem) and IPAR (R2 = 0.70) of nine two-year-
old poplar clones.
Figure 4. Relationship between the net gain in stem
biomass (∆Stem) and light-use efficiency (LUE) (R2 = 0.45)
of nine two-year-old poplar clones.

137
Biomass and Light Use Efficiency Comparison of Hybrid Poplar Genotypes
Nathan Thomas, Jose Stape, Barry Goldfarb
Introduction
Populus has the fastest growing domestic tree
species in temperate climates. Eight species of
Populus are native to the United States with
many regions of natural hybridization. In the
United States, poplar plantations are established
in the Pacific Northwest, Mississippi Alluvial Valley
and the Lake States. Lately, there has been an
increased interest in Populus across the
Southeast, due to the rising demand for
bioenergy and biofuels. This study is focused on
52 clones of eastern cottonwood and hybrid
poplar planted in Raleigh, NC. Research on new
genetics of Populus clones are needed to
calculate biomass yields and plant efficiency.
Objectives
1. Quantify the biomass growth and
development of all 52 clones.
2. Compare LAI and Light Use Efficiency (LUE)
of 9 selected clones during their 2nd growing
season.
Study Location and Design
The study is located in Raleigh, NC and has 8
replications of 52 poplar genotypes for a total of
416 trees. The experiment is a randomized,
single tree plot design with a single border row.
Materials and Methods
The site was planted in March, 2014 with 47
Populus deltoides, 4 Populus trichocarpa, and 1
Populus maximowiczii clone. The length of each
clone’s growing season is calculated by
recording the periods of bud breakage and
senescence. Cottonwood Leaf Beetle (CLB) is
recorded using a damage assessment protocol.
Heights and diameters were measured at the
beginning of the second growing season (March
2015) and the clones were ranked by volume.
A subset of the 7 most productive clones were
selected to measure biweekly DBH and height to
track the seasonal development of growth.
Nine clones were selected from the high,
average, and low productivity categories to
understand the effect of LUE. The heights and
diameters of these clones were measured on a
weekly basis. Leaf area is calculated using a
Figure 1. Difference in bud breakage between 2
clones in March 2015.
Figure 2. Branch diameter measurements (left)
and branch harvesting (right).
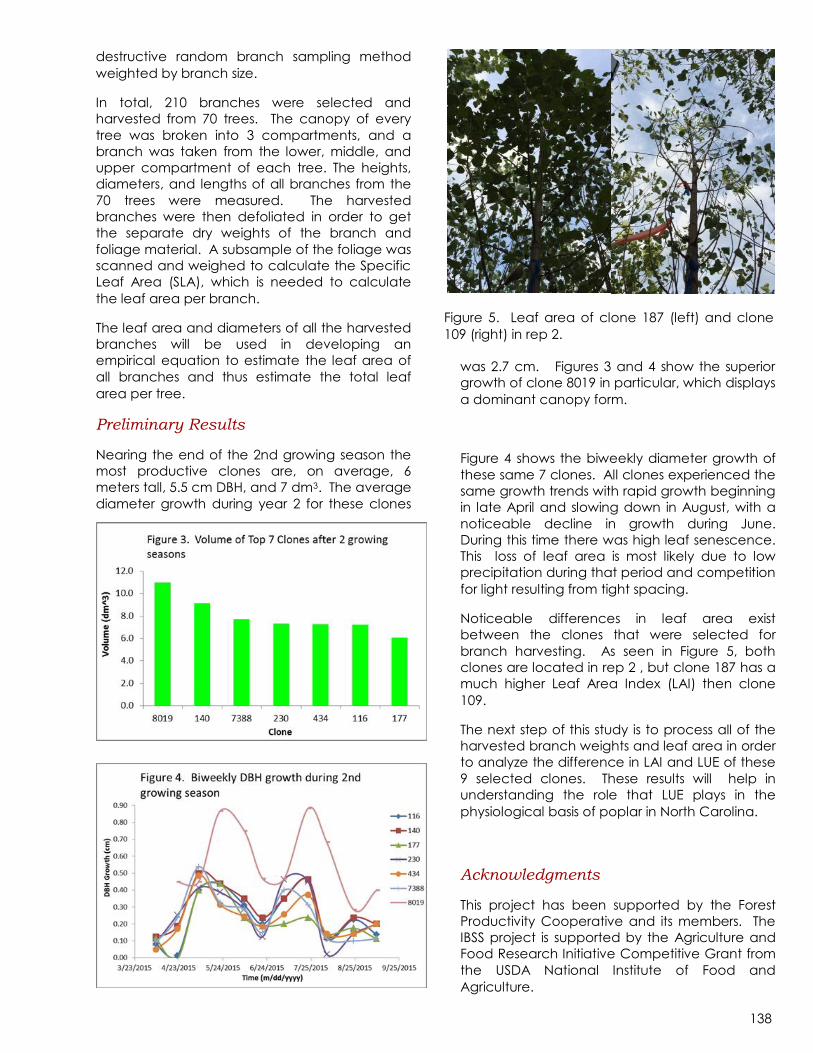
138
destructive random branch sampling method
weighted by branch size.
In total, 210 branches were selected and
harvested from 70 trees. The canopy of every
tree was broken into 3 compartments, and a
branch was taken from the lower, middle, and
upper compartment of each tree. The heights,
diameters, and lengths of all branches from the
70 trees were measured. The harvested
branches were then defoliated in order to get
the separate dry weights of the branch and
foliage material. A subsample of the foliage was
scanned and weighed to calculate the Specific
Leaf Area (SLA), which is needed to calculate
the leaf area per branch.
The leaf area and diameters of all the harvested
branches will be used in developing an
empirical equation to estimate the leaf area of
all branches and thus estimate the total leaf
area per tree.
Preliminary Results
Nearing the end of the 2nd growing season the
most productive clones are, on average, 6
meters tall, 5.5 cm DBH, and 7 dm3. The average
diameter growth during year 2 for these clones
was 2.7 cm. Figures 3 and 4 show the superior
growth of clone 8019 in particular, which displays
a dominant canopy form.
Figure 4 shows the biweekly diameter growth of
these same 7 clones. All clones experienced the
same growth trends with rapid growth beginning
in late April and slowing down in August, with a
noticeable decline in growth during June.
During this time there was high leaf senescence.
This loss of leaf area is most likely due to low
precipitation during that period and competition
for light resulting from tight spacing.
Noticeable differences in leaf area exist
between the clones that were selected for
branch harvesting. As seen in Figure 5, both
clones are located in rep 2 , but clone 187 has a
much higher Leaf Area Index (LAI) then clone
109.
The next step of this study is to process all of the
harvested branch weights and leaf area in order
to analyze the difference in LAI and LUE of these
9 selected clones. These results will help in
understanding the role that LUE plays in the
physiological basis of poplar in North Carolina.
Acknowledgments
This project has been supported by the Forest
Productivity Cooperative and its members. The
IBSS project is supported by the Agriculture and
Food Research Initiative Competitive Grant from
the USDA National Institute of Food and
Agriculture.
Figure 5. Leaf area of clone 187 (left) and clone
109 (right) in rep 2.

139
Tolerance of Eucalyptus Clones to Hydric, Thermal and Biotic Stresses -
TECHS Jose Stape, Dan Binkley, Otávio Campoe, Clayton Alvares, Rafaela Carneiro
Justification Despite the forest management experience
from previous rotations on of the current
operational production areas, potential
negative effects of climate change related to
more frequent and prolonged droughts and
extreme temperatures (cold and heat) are
eminent. Additionally, the expansion of
plantations to new frontiers without past
experience poses higher risks of production due
to environmental stresses different from those
where the clones were developed.
The two major environmental stressors to
Eucalyptus associated with both current
plantations and new forest frontiers are: i) water
stress (especially in regions of the midwest, north,
northeast and the southeast of Brazil), and ii) the
thermal stresses related to high temperatures
(above 36oC) in tropical Brazil and low
temperatures (below 5oC) in southern Brazil and
Uruguay.
Understanding ecophysiological processes
driving different responses and levels of
tolerance of Eucalyptus clones to drought and
extreme temperatures provide tools to quantify
the genotype-environment interactions, its
effects on wood production and improved
zoning of different clones across climatic regions.
Experimental Design The experimental design is a combination of
genotype variation, water manipulation and
planting spacing (not shown on this abstract)
across a wide climatic range (Figure 1),
providing a research platform to asses genotype
-environment interactions.
Experimental sites: The 36 TECHS sites were
planted during 2012 across Brazil and Uruguay,
and are divided in Tropical (above Capricorn
line) and Subtropical (below Capricorn line).
Genotypes: 18 different Eucalyptus clones,
currently planted by companies, were selected
from tropical and humid regions (n=3); tropical
and dry regions (n=4); subtropical from cold
regions (n=7), and intermediary and plastic
(n=4). The clones are pure and hybrids of E.
benthamii, E. camaldulensis, E. dunnii, E. globulus
E. grandis, E. saligna, E. tereticornis, E. urophylla.
Water manipulation: At least 4 genotypes at
each site have one plot with regular rainfall, and
paired plot with throughfall exclusion to reduce
water reaching the soil to 70% of actual rainfall,
by covering 30% of the soil surface (Figure 2).
Figure 1. Distribution of the 36 experimental sites across Brazil
and Uruguay. The color scale represents the ratio of historic
annual potential evapotranspiration (ETPo) and annual
precipitation (PPT).
Figure 2. Throughfall exclusion system covering 30% of the plot
soil surface, installed across 2013.

140
Thus, selected genotypes, at each site will be
subject to two levels water availability.
Scientific Questions The main scientific questions of the TECHS
project concerns about the effect of
environmental stresses (drought and thermal) on
productivity of Eucalyptus plantations:
i) How the productivity of different clones are
affected by climatic seasonality ?
ii) How different clones at different planting
spacing will interact among clones and sites?
iii) Which ecophysiological mechanisms allow
some clones to be better tolerant to drought
and thermal stress?
iv) What is the strength of the genotype x
environment interaction ?
v) How the clones in different environments and
under different stress levels, behave in terms of
their susceptibility to pests and diseases (biotic
stress)?
Initial Results Wood volume at three years after planting
showed a wide range of clones productivity for
tropical and subtropical sites and also among
clones within each site (Figure 3).
Ranking clones among sites show patterns of
behavior denoting G x E interactions. Some
clones show growth stability across sites, and
some clones are highly responsive to the climatic
gradient (Figure 4).
Measurements of crown depth and LAI every six
months, at the beginning and at the end of the
dry period provide detailed information about
productivity and its relation with canopy
development (Figure 5).
Acknowledgements To the 26 companies of the IPEF-TECHS project for
financial and technical support. For more information:
www.ipef.br/techs
Figure 5. Two contrasting clones side by side showing different
canopy structure and development behavior.
Figure 3. Distribution of volume for all sites (upper) and for all
clones (lower) at 3 years after planting . Dotted line represents
the average.
Figure 4. Ranking of volume for tropical sites and clones.
Clones with similar colors among sites are more stable, and
clones with different colors among sites are climatic responsive.
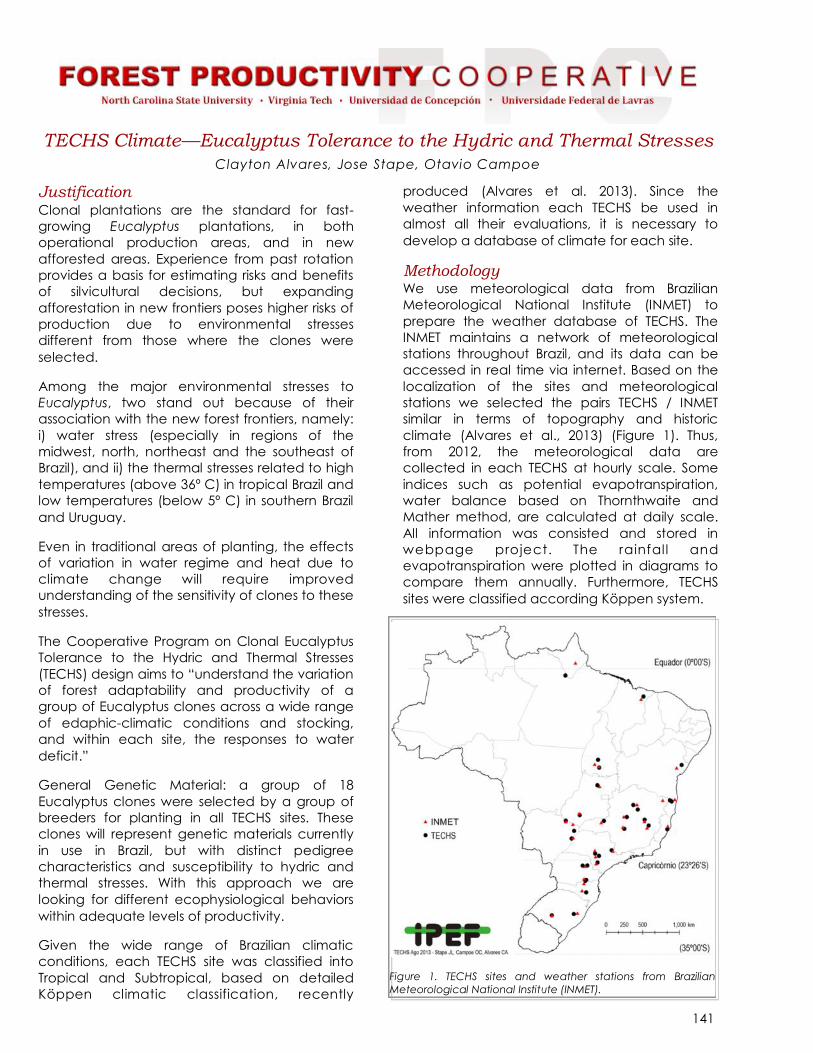
141
TECHS Climate—Eucalyptus Tolerance to the Hydric and Thermal Stresses
Clayton Alvares, Jose Stape, Otavio Campoe
Justification Clonal plantations are the standard for fast-
growing Eucalyptus plantations, in both
operational production areas, and in new
afforested areas. Experience from past rotation
provides a basis for estimating risks and benefits
of silvicultural decisions, but expanding
afforestation in new frontiers poses higher risks of
production due to environmental stresses
different from those where the clones were
selected.
Among the major environmental stresses to
Eucalyptus, two stand out because of their
association with the new forest frontiers, namely:
i) water stress (especially in regions of the
midwest, north, northeast and the southeast of
Brazil), and ii) the thermal stresses related to high
temperatures (above 36º C) in tropical Brazil and
low temperatures (below 5º C) in southern Brazil
and Uruguay.
Even in traditional areas of planting, the effects
of variation in water regime and heat due to
climate change will require improved
understanding of the sensitivity of clones to these
stresses.
The Cooperative Program on Clonal Eucalyptus
Tolerance to the Hydric and Thermal Stresses
(TECHS) design aims to “understand the variation
of forest adaptability and productivity of a
group of Eucalyptus clones across a wide range
of edaphic-climatic conditions and stocking,
and within each site, the responses to water
deficit.”
General Genetic Material: a group of 18
Eucalyptus clones were selected by a group of
breeders for planting in all TECHS sites. These
clones will represent genetic materials currently
in use in Brazil, but with distinct pedigree
characteristics and susceptibility to hydric and
thermal stresses. With this approach we are
looking for different ecophysiological behaviors
within adequate levels of productivity.
Given the wide range of Brazilian climatic
conditions, each TECHS site was classified into
Tropical and Subtropical, based on detailed
Köppen climatic classification, recently
produced (Alvares et al. 2013). Since the
weather information each TECHS be used in
almost all their evaluations, it is necessary to
develop a database of climate for each site.
Methodology We use meteorological data from Brazilian
Meteorological National Institute (INMET) to
prepare the weather database of TECHS. The
INMET maintains a network of meteorological
stations throughout Brazil, and its data can be
accessed in real time via internet. Based on the
localization of the sites and meteorological
stations we selected the pairs TECHS / INMET
similar in terms of topography and historic
climate (Alvares et al., 2013) (Figure 1). Thus,
from 2012, the meteorological data are
collected in each TECHS at hourly scale. Some
indices such as potential evapotranspiration,
water balance based on Thornthwaite and
Mather method, are calculated at daily scale.
All information was consisted and stored in
webpage project. The rainfall and
evapotranspiration were plotted in diagrams to
compare them annually. Furthermore, TECHS
sites were classified according Köppen system.
Figure 1. TECHS sites and weather stations from Brazilian
Meteorological National Institute (INMET).

142
Results The TECHS sites cover a wide range of climates in
South America, from semi-arid to super humid.
The semi-arid sites present annual rainfall 500 to
700 mm, while the super-humid sites between
1800 and 2000 mm. The year 2013 was more
humid in most of the TECHS, as shown in Figure 2.
Figure 4 shows the sequential water balance for
special sites, where it can be noticed the
increasing water deficit in the heading north to
south of Brazil. The first two years of TECHS, 2012
and 2013, showed wide climate variability, as
shown in Figure 6. A few sites keeps the same
climate type in the first two years in relation to
historical climate (Figure 5), while most of them
the change has been observed.
Reference Alvares, et al. 2013. Köppen's climate
classification map for Brazil. Met. Z., 22:711-728.
Acknowledgements To IPEF-TECHS and INMET.
Figure 4. Sequential water balance for Special TECHS sites.
Figure 3. Köppen climate classification and TECHS sites.
Figure 2. TECHS’ climate diagram of 2012 and 2013.
Figure 5. Annual climatic variability (2012, 2013) of the TECHS
regarding historic climate.

143

144
The articles and book chapters published in the last 5 years are listed below. For the
complete list of publications visit our website at: www.forestproductivitycoop.net.
2019
Albaugh, T.J., C.A. Maier, O.C. Campoe, M.A. Yáñez, E.D. Carbaugh, D.R. Carter, R.L. Cook, R.A. Rubilar,
T.R. Fox. 2019. Crown architecture, crown leaf area distribution, and individual tree growth effi-
ciency vary across site, genetic entry, and planting density. Trees, available online. DOI: https://
doi.org/10.1007/s00468-019-01898-3
Albaugh, T.J., T.R. Fox, R.L. Cook, J.E. Raymond, R.A. Rubilar, O.C. Campoe. 2019. Forest fertilizer applica-
tions in the southeastern United States from 1969 to 2016. Forest Science 65-3:355-362. DOI:
https://doi.org/10.1093/forsci/fxy058
Attia, A., Nouvellon, Y., Cuadra, S., Cabral, O., Laclau, J.P., Guillemot, J., Campoe, O., Stape, J.L., Gal-
dos, M., Lamparelli, R., Le Maire, G. 2019. Modelling carbon and water balance of Eucalyptus
plantations at regional scale: Effect of climate, soil and genotypes. For. Ecol. Manage. 449. DOI:
https://doi.org/10.1016/j.foreco.2019.117460
Batista, A.P.B., H.F. Scolforo, J.M. de Mello, M.C. Guedes, M.C.N.S. Terra, J.D. Scalon, L.R. Gomide, P.G.V.
Scolforo, R.L. Cook. 2019. Spatial association of fruit yield of Bertholletia excelsa Bonpl. trees in
eastern Amazon. For. Ecol. Manage. 441:99-105. DOI: https://doi.org/10.1016/j.foreco.2019.03.043
Blinn, C.E., M.N. House, R.H. Wynne, V.A. Thomas, T.R. Fox, M. Sumnall. 2019. Landsat 8 based leaf area
index estimation in loblolly pine plantations. Forests, 10, 222. DOI: https://doi.org/10.3390/
f10030222
Brancalion, P.H.S., Campoe, O., Mendes, J.C.T., Noel, C., Moreira, G.G., van Melis, J., Stape, J.L., Guil-
lemot, J. 2019. Intensive silviculture enhances biomass accumulation and tree diversity recovery
in tropical forest restoration. Ecological Applications 29(2): e01847. 10.1002/eap.1847
Carter, D.R., R.A. Slesak, T.B. Harrington, A.W. D’Amato. 2019. Comparative effects of soil resource avail-
ability on physiology and growth of Scotch broom (Cytisus scoparius) and Douglas-fir
(Pseudotsuga menziesii) seedlings. For. Ecol. Manage. 453:117580. DOI: https://doi.org/10.1016/
j.foreco.2019.117580
Carter, D.R., R.A. Slesak, T.B. Harrington, A.W. D’Amato. 2019. Effects of irrigation and phosphorus fertiliza-
tion on physiology, growth, and nitrogen-accumulation of Scotch broom (Cytisus scoparius).
Plant Physiol. Rep. Published online. DOI: https://doi.org/10.1007/s40502-019-00459-7
Gopalakrishnan, R., J.S. Kauffman, M.E. Fagan, J.W. Coulston, V.A. Thomas, R.H. Wynne, T.R. Fox, V. F.
Quirino. 2019. Creating landscape-scale site index maps for the southeastern US is possible with
airborne LiDAR and Landsat imagery. Forests, 10, 234. DOI: https://doi.org/10.3390/f10030234
Hall, K.B., J.L. Stape, B.P. Bullock, D. Frederick, J. Wright, H.F. Scolforo, R.L. Cook. 2019. A growth and yield
model for Eucalyptus benthamii in the southeastern United States. Forest Science. Published
online. DOI: doi: 10.1093/forsci/fxz061
Le Maire, G., Guillemot, J., Campoe, O.C., Stape, J.L., Laclau, J.P., Nouvellon, Y. 2019. Light absorption,
light use efficiency and productivity of 16 contrasted genotypes of several Eucalyptus species
along a 6-year rotation in Brazil. For. Ecol. Manage. 449. DOI: https://doi.org/10.1016/
j.foreco.2019.06.040Montero-Solis, F.M., J. Álvarez-Muñóz, M.A. López-López. 2019. Productive po-
tential of Cedrela odorata L.: estimation through the 3-PG model. Madera y Bosques 25(2):1-15 DOI:
doi: 10.21829/myb.2019.2521641
Recent Publications
145
Montero-Solis, F.M., J. Álvarez-Muñóz, M.A. López-López. 2019. Productive potential of Cedrela odorata L.:
estimation through the 3-PG model. Madera y Bosques 25(2):1-15 DOI: doi: 10.21829/
myb.2019.2521641
Schulte, M.L., D.L. McLaughlin, F.C. Wurster, J.M. Varner, R.D. Stewart, W.M. Aust, C.N. Jones, B.Gile. 2019.
Short- and long-term hydrologic controls on smoldering fire in wetland soils. Intl. J. Wildland Fire
28:177-186. DOI: https://doi.org/10.1071/WF18086
Scolforo, H.F. McTague, J.P. Burkhart, H., Roise, J. Campoe, O. Stape, J.L. 2019. Eucalyptus growth and
yield system: linking individual-tree and stand-level growth models in clonal Eucalypt plantations
in Brazil. Forest Ecology and Management 432:1-16. DOI: https://doi.org/10.1016/
j.foreco.2018.08.045
Scolforo, H.F. McTague, J.P. Burkhart, H., Roise, J. Campoe, O. Stape, J.L. 2019. Yield pattern of eucalypt
clones across tropical Brazil: an approach to clonal grouping. Forest Ecology and Management
432: 30-39. DOI: https://doi.org/10.1016/j.foreco.2018.08.051
2018
Acuña, E., R.A. Rubilar, J. Cancino, T. J. Albaugh, C.A. Maier. 2018. Economic assessment of Eucalyptus
globulus short rotation energy crops under contrasting silvicultural intensities on marginal agricul-
tural land. Land Use Policy 76:329-337. DOI: https://doi.org/10.1016/j.landusepol.2018.05.028
Albaugh, T.J., T.R. Fox, C.A. Maier, O.C. Campoe, R.A. Rubilar, R.L. Cook, J.E. Raymond, C.A. Alvares, J.L.
Stape. 2018. A common garden experiment examining light use efficiency and heat sum to ex-
plain growth differences in native and exotic Pinus taeda. Forest Ecology and Management
425:35-44. DOI: https://doi.org/10.1016/j.foreco.2018.05.033
Bracho, R., J.G. Vogel, R.E. Will, A. Noormets, L.J. Samuelson, E.J. Jokela, C.A. Gonzalez-Benecke, S.A.
Green, D. Markewitz, J.R. Seiler, B.D. Strahm, R.O. Teskey, T.R. Fox, M.B. Kane, M.A. Laviner, K.M.
McElligot, J. Yang, W. Lin, C.R. Meek, J. Cucinella, M.K. Akers, T.A. Martin. 2018. Carbon accumu-
lation in loblolly pine plantations is increased by fertilization across a soil moisture availability gra-
dient. For. Ecol. Manage. 424:39-52. DOI: https://doi.org/10.1016/j.foreco.2018.04.029
Carrero, O., J.L. Stape, H.L. Allen, M.C. Arrevillaga, M. Ladeira. 2018. Productivity gains from weed con-
trol and fertilization of short-rotation Eucalyptus plantations in the Venezuelan Western Llanos.
Forest Ecology and Management. 430:566-575. DOI: https://doi.org/10.1016/j.foreco.2018.07.050
Carter, D.R., R.A. Slasek, T.B. Harrington, D.H. Peter, A.W. D’Amato. 2018. Scotch broom (Cytisus scopari-
us) modifies microenvironment to promote nonnative plant communities. Biol. Invasions. Pub-
lished online. DOI:https://doi.org/10.1007/s10530-018-1885-y
Ojeda, H., R.A. Rubilar, C. Montes, J. Cancino, M. Espinosa. 2018. Leaf area and growth of Chilean radi-
ata pine plantations after thinning across a water stress gradient. N.Z.J. For. Sci. 48:10. DOI:
https://doi.org/10.1186/s40490-018-0116-8
Rios Saucedo, J.C., R.A. Rubilar Pons, J. Cancino Cancino, E. Acuna armona, J.J. Corral Rivas, R. Rosales
Serna. 2018. Densidad basica de la madera y poder calorifico en vastagos de tres cultivos den-
droenergeticos. Revista Mexicana de Ciencias Forestales 9(47) 253-272. DOI: https://
doi.org/10.29298/rmcf.v9i47.157
Rubilar, R.A., H.L. Allen, T.R. Fox, R.L. Cook, T. J. Albaugh, O.C. Campoe. 2018. Advances in silviculture of
intensively managed plantations. Current Forestry Reports 4:23-34. DOI: https://doi.org/10.1007/
s40725-018-0072-9
Rubilar, R.A., H.L. Allen, T.R. Fox, J.L. Stape. 2018. Productividad sustenable de sitios forestales manejados
intensivamente. In: Silvicultura de bosques plantados con fines productivos. Ed: Espinosa, M., E.

146
Acuna, J. Garcia, R. Rodriguez, R. A. Rubilar. Universidad de Concepcion, Concepcion, Chile.
pp. 37-87.
Vargas, F., C.A. Gonzalez-Benecke, R.A. Rubilar, M. Sanchez-Olate. 2018. Modelling the effect of weed
competition on long-term volume yield of Eucalyptus globulus Labill. plantations across an envi-
ronmental gradient. Forests 9:480. DOI: https://doi.org/10.1007/s11056-017-9625-1
Vargas, F., R.A. Rubilar, C.A. Gonzalez-Benecke, M. Sanchez-Olate, P. Aracena. 2018. Long-term re-
sponse to area of competition control in Eucalyptus globulus plantations. New Forests 49:383-398.
DOI: 10.3390/f9080480
2017
Acuña, E., J. Cancino, R. Rubilar, C. Parra. 2017. Bioethanol potential from high density short rotation
woody crops on marginal lands in central Chile. Cerne 23(1): 133-145. DOI:
10.1590/01047760201723012278
Albaugh, T.J., T.R. Fox, R.A. Rubilar, R.L. Cook, R.L. Amateis, H.E. Burkhart. 2017. Post-thinning density and
fertilization affect Pinus taeda stand and individual tree growth. For. Ecol. Manage. 396: 207-216.
DOI: http://dx.doi.org/10.1016/j.foreco.2017.04.030
Albaugh, T.J., R.A. Rubilar, C.A. Maier, E.A. Acuña, R.L. Cook. 2017. Biomass and nutrient mass of Acacia
dealbata and Eucalyptus globulus bionergy plantations. Biomass and Bioenergy 97: 162-171. DOI:
http://dx.doi.org/10.1016/j.biombioe.2016.12.025
Binkley, D., Campoe, O.C., Alvares, A., Carneiro, R.L., Cegatta, Í., Stape, J.L., 2017. The interactions of
climate, spacing and genetics on clonal Eucalyptus plantations across Brazil and Uruguay. Forest
Ecology and Management 405: 271-283. DOI: ht tp ://dx.doi.org/10.1016/j.foreco.2017.09.050
Espinoza, S.E., C.R. Magni, R.A. Rubilar, M.A. Yañez, R.E. Santelices, A.M. Cabrera, M. Ivković. 2017. Field
performance of various Pinus radiata breeding families established on a drought-prone site in
central Chile. New Zealand Journal of Forestry Science 47:12. DOI: 10.1186/s40490-017-0093-3
Esquivel, E.A., R. Rubliar, S. Sandoval, E. Acuña, J. Cancino, M. Espinosa, F. Muñoz. 2017. Potasio y Boro
en plantaciones dendroenergéticas, en dos suelos marginales de la Región de Biobío, Chile. Re-
vista Forestal Measoamericana Kurú. 14(34): 27-36. DOI: 10.18845/rfmk.v14134.2998
Esquivel, E.A., R. Rubliar, S. Sandoval, E. Acuña, J. Cancino, M. Espinosa, F. Muñoz. 2017. Uso de 3PG co-
mo herramienta para modelar plantaciones dendroenergéticas de Eucalyptus camaldulensis en
la Región de Biobío, Chile. Revista Forestal Measoamericana Kurú. 14(35): 33-34. DOI: 10.18845/
rfmk.v14134.3151
Lambais, G.R., C. Jourdan, M.C. Piccolo, A. Germon, R.C. Pinheiro, Y. Nouvellon, J.L. Stape, O.C. Cam-
poe, A. Robin, J.P. Bouillet, G. le Maire. J.P. Laclau. 2017. Contrasting phenology of Eucalyptus
grandis fine roots in upper and very deep soil layers in Brazil. Plant Soil. https://doi.org/10.1007/
s11104-017-3460-1
Maier, C.A., T.J. Albaugh, R.L. Cook, K. Hall, D. McInnis, K.H. Johnsen, J. Johnson, R.A. Rubilar, J.M. Vose.
2017. Comparative water use in short-rotationEucalyptus benthamii and Pinus taeda trees in the
southern United States. For. Ecol. Manage. 397: 126-138. DOI: http://dx.doi.org/10.1016/
j.foreco.2017.04.038
Oliveiro, J.C., J.B. Feret, F.J. Ponzoni, Y. Nouvellon, J.P. Gastellu-Etchegorry, O.C. Campoe, J.L. Stape,
L.C.E. Rodriguez, G. le Maire. 2017. Simulating the canopy reflectance of different Eucalypt gen-
otypes with the DART 3-D model. IEEE Journal.

147
Rios-Saucedo, J.C., E.A. Acuña-Carmona, J. Cancino-Cancino, R.A. Rubilar-Pons, J.J. Corral-Rivas, R.
Rosales-Serna. 2017. Dynamics of sprouting and basic density of wood in shoots of three wood
species with dendroenergetic potential. Agrociencia 51(2): 215-227.
Rubilar, R.A., R.M. Hubbard, M.A. Yañez, A.M. Medina, H.E. Valenzuela. 2017. Quantifying differences in
thermal dissipation probe calibrations for Eucalyptus globulus species and E. nitens x globu-
lus hybrid. Trees, published online. DOI: 10.1007/s00468-017-1545-3
Silva, M., R.A. Rubilar, J. Espinoza, M. Yañez, V. Emhart, J.J. Quiroga. 2017. Gas-exchange response and
survival of young Eucalyptus spp commercial genotypes under water stress. Bosque 38(1): 79-87.
DOI: 10.4067/S0717-92002017000100009
Sumnall, M.J., T.R. Fox, R.H. Wynne, and V.A. Thomas. 2017. Mapping the height and spatial cover of fea-
tures beneath the forest canopy at small-scales using airborne scanning discrete return Lidar. IS-
PRS Journal of Photogrammetry and Remote Sensing. 133:186-200.
Thomas, R.Q., E.B. Brooks, A.L. Jerslid, E.J. Ward, R.H. Wynne, T.J. Albaugh, H. Dinon-Aldridge, H.E.
Burkhart, J.C. Domec, T.R. Fox, C.A. Gonzalez-Benecke, T.A. Martin, A. Noormets, D.A. Sampson,
R.O. Teskey. 2017. Leveraging 35 years of Pinus taeda research in the southeastern US to con-
strain forest carbon cycle predictions: regional data assimilation using ecosystem experiments.
Biogeosciences, 14: 3525-3547. DOI: https://doi.org/10.5194/bg-14-3525-2017
2016
Albaugh, T.J., J.M. Albaugh, T.R. Fox, H.L. Allen, R.A. Rubilar, P. Trichet, D. Loustau, S. Linder. 2016. Tamm
Review: Light use efficiency and carbon storage in nutrient and water experiments on major for-
est plantation species. For. Ecol. Manage. 376: 333-342. DOI: 10.1016/j.foreco.2016.05.031
Albaugh, T.J., T.R. Fox, M.A. Yanez, R.A. Rubilar, B. Goldfarb. 2016. Will crown ideotype help determine
optimum varietal silviculture? p 302-307. In: Schweitzer, C.J., W.K. Clatterbuck, C.M. Oswalt eds.
Proceedings of the 18th biennial southern silvicultural research conference. e-Gen. Tech. Rep.
SRS-212. Asheville, NC: U.S. Department of Agriculture Forest Service, Southern Research Station.
614 p.
Albaugh, T.J., T.R. Fox, R.A. Rubilar, R.L. Cook. 2016. Growth of young pine stands with fertilization alone
versus fertilization plus vegetation control. p 99-104. In: Kirschman, J.E. comp. Proceedings of the
19th Biennial Southern Silvicultural Research Conference. e-Gen. Tech. Rep. SRS-234. Asheville,
NC: U.S. Department of Agriculture Forest Service, Southern Research Station. 444 p.
Campoe, O.C., J.S.B. Munhoz, C.A. Alvares, R.L. Carneiro, E.M. de Mattos, A.P.C. Ferez, J.L. Stape. 2016.
Meteorological seasonality affecting individual tree growth in forest plantations in Brazil. Forest
Ecology and Management. 380(2013): 149-160.
Cartes, E., R.A. Rubilar, E. Acuna, J. Cancino, J. Rodrigues, Y. Burgos. 2016. Potential of Pinus radi-
ata plantations for use of harvest residues in characteristic soils of south-central Chile. Revista
Chapingo Serie Ciencias Forstales y del Ambiente 22(2) 221-233. DOI: 10.5154/
r.rchscfa.2015.07.032
Christina, M., Y. Nouvellon, J.P. Laclau, J.L. Stape, O.C. Campoe, G. le Maire. 2016. Sensitivity and uncer-
tainty analysis of the carbon and water fluxes at the tree scale in Eucalyptus plantations using a
metamodeling approach. Can. J. For. Res. 46: 297-309.
Cook, R.L., D. Binkley, J.L. Stape. 2016. Eucalyptus plantation effects on soil carbon after 20 years and
three rotations in Brazil. For. Ecol. Manage. 359: 92-98. DOI: 10.1016/j.foreco.2015.09.035
Esquivel, E.A., R. Rubliar, S. Sandoval, E. Acuña, J. Cancino, M. Espinosa, F. Muñoz. 2016. Sustainabilidad
en el use de nutrientes de plantaciones dendroenergéticas en dos suelos marginales de la
148
Región de Biobío, Chile. Revista Forestal Measoamericana Kurú. 13(33): 11-19. DOI: 10.18845/
rfmk.v13133.2573
Minnick, K.J., C.B. Pandey, and T.R. Fox. 2016. Dissimilatory nitrate reduction to ammonia and denitrifica-
tion: Effect of soil moisture and N fertilization regimes in loblolly pine forests. Biology and Fertility of
Soils. In Press.
Pinheiro, R.C., J.C. de Deus Jr., Y. Nouvellon, O.C. Campoe, J.L. Stape, L.L Alo, I.A. Guerrini, C. Jourdan,
J.P. Laclau. 2016. A fast exploration of very deep soil layers by Eucalyptus seedlings and clones in
Brazil. Forest Ecology and Management. 366(2013): 143-152.
Ramirez, M.V., R.A. Rubilar, C. Montes, J.L. Stape, T.R. Fox, and H. L. Allen. 2016. Nitrogen availability and
mineralization in Pinus radiata stands fertilized midrotation at three contrasting sites. Journal of
Soil Science and Plant Nutrit ion. doi: 10.4067/S0718-95162016005000009.
locations in the south-eastern USA. Remote Sensing of Environment. 176:308-319.
Ramirez, M.V., R.A. Rubilar, C. Montes, J.L. Stape, T.R. Fox, and H.L. Allen. 2016. Nitrogen availability and
mineralization in Pinus radiata stands fertilized mid-rotation at three contrasting sites. J. Soil. Sci
and Plant Nutrition 16(1):118-136. DOI: 10.4067/S0718-95162016005000009
Raymond, J.E. 2016. Use of stable isotopes to trace the fate of applied nitrogen in forest plantations to
evaluate fertilizer efficiency and ecosystem impacts. Ph.D. Thesis. Department of Forest Re-
sources and Environmental Conservation, Virginia Tech, Blacksburg, VA. 218 pp.
Raymond, J.E., T.R. Fox, B.D. Strahm. 2016. Understanding the fate of applied fertilizer nitrogen in pine
plantations of the southeastern USA using stable isotopes. Forests. 7:270. DOI: 10.3390/f7110270
Raymond, J.E., T.R. Fox, B.D. Strahm, J. Zerpa. 2016. Ammonia volatilization following nitrogen fertilization
with enhanced efficiency fertilizers and urea in loblolly pine (Pinus taeda L.) plantations of the
southern United States. For. Ecol. Manage. 376:247-255. DOI: 10.1016/j.foreco.2016.06.015
Raymond, J.E., T.R. Fox, B.D. Strahm, J. Zerpa. 2016. Differences in the recovery of four different nitrogen
containing fertilizers after two application seasons in pine plantations across the southeastern
United States. For. Ecol. Manage. 380:161-171. DOI: 10.1016/j.foreco.2016.08.044
Rios, J.C., E. Acuna, J. Cancino, R.A. Rubilar, J.D.J. Navar, R, Rosales. 2016. Allometric equations com-
monly used for estimating shoot biomass in short rotation wood energy species: a review. Revista
Chapingo Serie Ciencias Forstales y del Ambiente 22(2) 193-202. DOI: 10.5154/
r.rchscfa.2015.05.022
Rodriguez, A., R.A. Rubilar, F. Munoz, E. Cartes, E. Acuna, J. Cancino. 2016. Taper model by type of soil
for Pinus radiata in the regions of Biobio and the Araucania, Chile. Revista Chapingo Serie Cien-
cias Forstales y del Ambiente 22(2) 203-220. DOI: 10.5154/r.rchscfa.2015.05.021
Salguero, D., F. Muñoz, J. Cancino, V. Flórez, R. Rubilar, E. Acuña, R. Olave. 2016. Gas exchange of two
clones of Paulownia elongata x fortunei at the first year of vegetatice growht at three sites of
south-central Chile. Gayana Bot. 73(2): 438-452. ISSN: 0016-5301
Silva, P.H.M., O.C. Campoe, R.C. de Paula, D.J. Lee. 2016. Seedling growth and physiological responses
of sixteen Eucalypt taxa under controlled water regime. Forests. 7(110):13pp. DOI:10.3390/
f7060110
Subedi, S. and T.R. Fox. 2016. Predicting loblolly pine site index from soil properties using partial least-
squares regression. Forest Science. 62(4):449-456. DOI: 10.5849/forsci.15-127
Subedi, S. and T.R. Fox. 2016. Soil fertility assessment in the 3-PG model using site index in the southeast-
ern United States. p 187-188. In: Schweitzer, C.J., W.K. Clatterbuck, C.M. Oswalt eds. Proceedings
of the 18th biennial southern silvicultural research conference. e-Gen. Tech. Rep. SRS-212. Ashe-
ville, NC: U.S. Department of Agriculture Forest Service, Southern Research Station. 614 p.

149
Sumnall, M.J., T.R. Fox, R.H. Wynne, C. Blinn, and V.A. Thomas. 2016. Estimating leaf area index at multiple
heights within the understory component of Loblolly pine forests from airborne discrete-return li-
dar. Int. J. Remote Sensing. 37(1): 78-99. DOI: 10.1080/01431161.2015.1117683
Sumnall, M.J., A. Peduzzi, T.R. Fox, R.H. Wynne, and V.A. Thomas. 2016. Analysis of a lidar voxel-derived
vertical profile at the plot and individual tree scales for the estimation of forest canopy layer
characteristics. Int. J. Remote Sensing. 37(11): 2653-2681. DOI: 10.1080/01431161.2016.1183833
Sumnall, M.J., T.R. Fox, R.H. Wynne, C. Blinn, V.A. Thomas, and B. Cook. 2016. Assessing the transferability
of statistical predictive models for leaf area index between two airborne discrete return LiDAR
sensor designs within multiple intensely managed loblolly pine forest locations in the southeastern
USA. Remote Sensing of Environment. 176:308-319.
Zhao, D., M. Kane, R. Teskey, T.R. Fox, T.J. Albaugh, H.L. Allen, R.A. Rubilar. 2016. Maximum response of
loblolly pine plantations to silvicultural management in the southern United States. For. Ecol. Man-
age. 375: 105.111. DOI: 10.1016/j.foreco.2016.05.035
2015
Albaugh, T.J., J. Alvarez, R.A. Rubilar, T.R. Fox, H.L. Allen, J.L. Stape. 2015. Long-term Pinus radiata produc-
tivity gains from tillage, vegetation control, and fertilization. For. Sci. 61(4):800-808. DOI: 10.5849/
forsci.14-207.
Albaugh, T.J., T.R. Fox, H.L. Allen, R.A. Rubilar. 2015. Juvenile southern pine response to fertilization is influ-
enced by soil drainage and texture. Forests 6:2799-2819. DOI: 10.3393/f6082799.
Albaugh, T.J., R.A. Rubilar, T.R. Fox, H.L. Allen, J.B. Urrego, M. Zapata, J.L. Stape. 2015. Response of Euca-
lyptus grandis in Colombia to mid-rotation fertilization is dependent on site and rate but not fre-
quency of application. For. Ecol. Manage. 350:30-39. DOI: http://dx.doi.org/10.1016/
j.foreco.2015.04.030.
Cook, R.L., D. Binkley, and J.L. Stape. 2015. Eucalyptus plantation effects on soil carbon after 20 years
and three rotations in Brazil. Forest Ecology and Management.
Fox, T.R. and J. Creighton. 2015. Silvics of Oak. In A Practical Guide to Managing Oak Forests in the East-
ern United States. CRC Press.
Gerson,R. F. Munoz, M. Uribe, J. Cancino, E. Acuna, R. Rubilar. 2015. Macropropagatcion de Paulownia
elongate x fortune a partir de esquejes de raiz en la Region del Biobio. Chile. Gayana Botanica.
72(1) 70-75.
Gorgens, E.B., P. Packalen, A.G.P. da Siilva, C.A. Alvares, O.C. Campoe, J.L. Stape and L.C.E. Rodriguez.
2015. Stand volume models based on stable metrics as from multiple ALS acquisitions in Eucalyp-
tus plantations Ann. For Sci. 72:489-498. DOI: http://dx.doi.org/10.1007/s13595-015-0457-x.
Jara, M.C., M. Henry, M. Rejou-Mechain, C. Wayson, M. Zapata-Cuartas, D. Piotto, F.A. Guier, H. C. Lom-
bis, E.C. Lopez, R.C. Lara, K.C. Rojas, J.D. A. Pasquel, A.D. Montoya, J.F. Vega, A.J. Galo, O.R.
Lopez, L.G. Marklund, J.M. M. Fuentes, F. Milla, J.de Jesus Navar Cgaudezm E.O. Malavassi, J. Pe-
rez, C.R. Zea, L. R. Garcia, R.. Rubilar, L. Saint-Andre, C. Sanquetta, C. Scot, and J. Westfall. 2015.
Guidelines for documenting and reporting tree allometric equations. Annals of Forest Science. 72
(6):6769-777.
Minick, K.J., B.D. Strahm, T.R. Fox, E.B. Sucre, Z.H. Leggett. 2015. Microbial nitrogen cycling response to
forest -based bioenergy production. Ecological Applications. In press – preprint. DOI: http://
dx.doi.org/10.1890/14-1745.1.

150
Minnick, K.J., C.B. Pandey, and T.R. Fox. 2015. Dissimilatory nitrate reduction to ammonia and denitrifica-
tion: Effect of soil moisture and N fertilization regimes in loblolly pine forests. Soil Biology and Bio-
chemistry. In Press.
Pulito, A.P., J.L.M. Goncalves, P.J. Smethurst, J.C.A. Junior, C.A. Alvares, J.H.T. Rocha, A. Hubner, L.F. de
Moraes, A.C. Miranda, M.Y. Kamogawa, J.L. Gava, R. Chaves, C.R. Silva. 2015. Available nitro-
gen and responses to nitrogen fertilizer in Brazilian eucalypt plantations on soils of contrasting tex-
ture. Forests 6:973-991. DOI: http://dx.doi.org/10.3390/f6040973.
Mora, F., R. Rubilar, R. Schmidt, V. Emhart. 2015. Longitudinal analysis in the selection of Eucalyptus glob-
ulus clones under contrasting water availability conditions. Scientia Forestalis. 43:105. March 2015.
(no print).
Moralesa, M., G. Aroca, R. Rubilar, E. Acuna, B. Mola-Yudego, S. Gonzalez-Garcia. 2015. Cradle-to-gate
life cycle analysis of Eucalyptus globulus short rotation plantations in Chile. Journal of Cleaner
Production.99:239-249.
Rubilar, R., Albaugh, T.J., Fox, T.R., Allen, H.L., Stape, J. L., and Mardones, O. 2015. Long term Pinus radi-
ata productivity gains from tillage, vegetation control and fertilization. Forest Science. In Press.
Rubilar, R.A., H.L. Allen, T.R. Fox, J.L. Stape, and T.J. Albaugh. 2015. Disponibilidad de nutrients y ferti-
lizacion en plantaciones forestales. In: Fertilidad de suelos y fertilizacion de cultivos. Editors: Eche-
verria, H.E. and Garcia, F.O. INTA Ediciones and IPNI Cono Sur. Buenos Aires, Argentina. Pages
753-769.
Smethurst, P.J., J.L.M. Goncalves, A.P. Pulito, S. Gomes, K. Paul, C.A. Alvares and J.C.A. Junior. 2015. Ap-
praisal of the SNAP model for predicting nitrogen mineralization in tropical soils under eucalyptus.
R. Bras . Ci. Solo. 39:523-532. Ecological Appl icat ions. DOI : http://
dx.doi.org/10.1590/01000683rbcs20140379.
Subedi,S., T.R. Fox, and R.H. Wynne. 2015. Determination of Fertility Rating (FR) in the 3-PG Model for Lob-
lolly Pine Plantations in the Southeastern United States Based on Site Index. Forests. In Press.
Venegas-Gonzalez, A., M.P. Chagas, C.R.A. Junior, C.A. Alvares, F.A. Roig and M.T.Filho. 2015. Sensitivity
of tree ring growth to local and large-scale climate variability in a region of Southeastern Brazil.
Theor. Appl. Climatol. In press. Online version available DOI: http://dx.doi.org/10.1007/s00704-014-
1351-4.
Ward, E.J., J.C. Domec, M.A. Laviner, T.R. Fox, G. Sun, S. McNulty, J. King, and A. Noormets. 2015. Fertiliza-
tion intensifies drought stress: Water use and stomatal conductance of Pinus taeda in a midrota-
tion fertilization and throughfall reduction experiment. For. Ecol. Manage. In press. DOI: http://
dx.doi.org/10.1016/j.foreco.2015.04.009.
Will, R., T.R. Fox, M. Akers, J.C. Domec, C. Gonzalez-Benecke, E. J. Jokela, M. Kane,M.A. Laviner, G. Loku-
ta, D. Markewitz, M.A. McGuire, C.Meek, A. Noormets, L. Samuelson, J. Seiler, B. Strahm, R. Tesky,
J. Vogel, E. Ward, J. West, D. Wilson, T. A. Martin. 2015. A Range-wide Experiment to Investigate
Nutrient and Soil Moisture Interactions in Loblolly Pine Plantations. Forests. In Press.
Yanez, M.A., T.R. Fox, and J.R. Seiler. 2015. Early growth response of loblolly pine varieties and families to
silvicultural intensity. Forest Ecology and Management. In Press.

151
Copyright © 2022 FDOKUMEN