Rheological properties and surface tension of Acacia tortuosa gum exudate aqueous dispersions
Upload
independentCategory
view
3download
0
Research Article
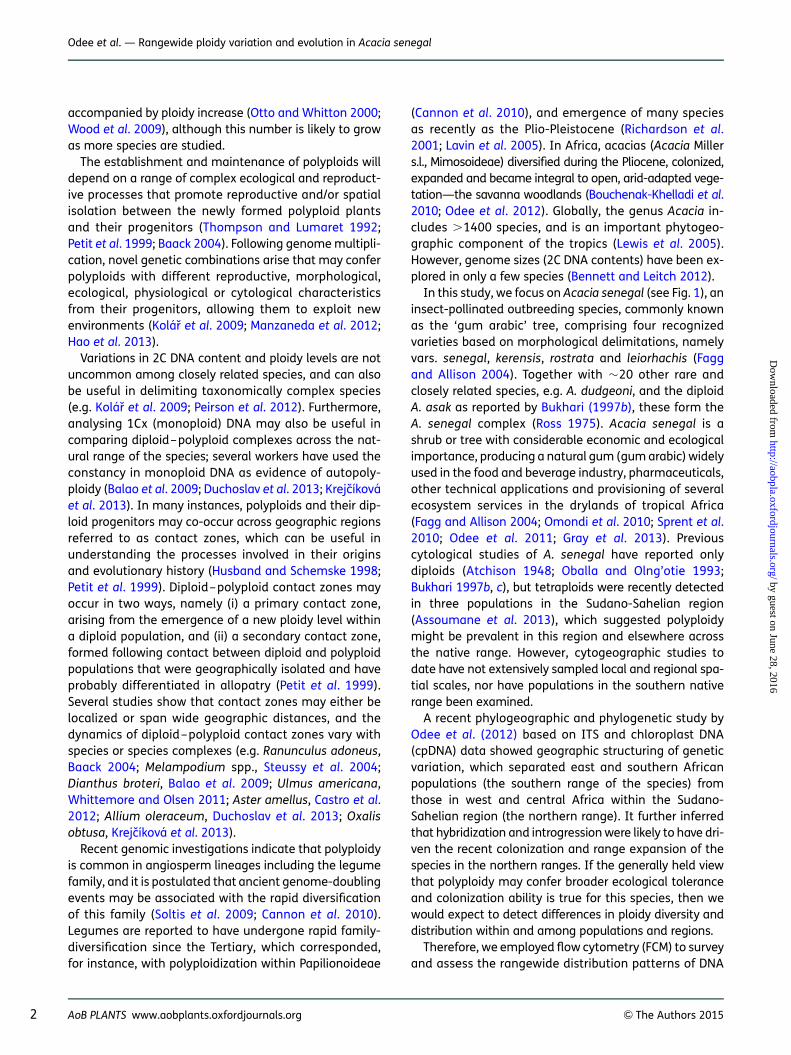
Rangewide ploidy variation and evolution in Acacia senegal:a north–south divide?David W. Odee1,2*, Julia Wilson2, Stephen Omondi1, Annika Perry2 and Stephen Cavers2
1 Kenya Forestry Research Institute, PO Box 20412-00200, Nairobi, Kenya2 Centre for Ecology and Hydrology, Bush Estate, Penicuik, Midlothian EH26 0QB, UK
Received: 7 September 2014; Accepted: 21 January 2015; Published: 13 February 2015
Associate Editor: F. Xavier Pico
Citation: Odee DW, Wilson J, Omondi S, Perry A, Cavers S. 2015. Rangewide ploidy variation and evolution in Acacia senegal: a north–south divide? AoB PLANTS 7: plv011; doi:10.1093/aobpla/plv011
Abstract. Knowledge of rangewide variation in DNA content and ploidy level may be valuable in understanding theevolutionary history of a species. Recent studies of Acacia senegal report diploids and occasional tetraploids in theSudano-Sahelian region of sub-Saharan Africa, but nothing is known about the overall extent of DNA ploidy variationwithin the species. In this study, we determine the DNA content and ploidy level of A. senegal across its native range,and explore whether the variation is related to its evolutionary and colonization history. We used propidium iodide flowcytometry (FCM) to estimate DNA content (2C value) and infer ploidy in 157 individuals from 54 populations on varioustissues, using seeds, fresh leaves, dried leaves and twigs and herbarium specimens. The mean 2C DNA (pg+ s.d.) con-tents detected were 1.47+0.09, 2.12+0.02, 2.89+0.12, and a single individual with 4.51 pg, corresponding to apolyploid series of diploid, triploid, tetraploid and hexaploid individuals. Diploids were confirmed by chromosomecounts (2n ¼ 2x ¼ 26). Most populations (90.7 %) were of single ploidy level, while mixed ploidy populations (9.3 %)comprising mostly diploids (2x + 3x, 2x + 4x and 2x + 6x) were restricted to the Sudano-Sahelian and Indian subcon-tinent regions, its northern range. The species is predominantly diploid, and no mixed ploidy populations were de-tected in east and southern Africa, its southern range. The geographic pattern of ploidy variation in conjunctionwith existing phylogeographic and phylogenetic data of the species suggests that polyploids have occurredmultiple times in its evolutionary and recent colonization history, including contemporary ecological timescales.The successful use of external tissues of dried twigs in FCM is new, and presents the opportunity to study numerousother dryland woody species.
Keywords: Acacia senegal; African acacias; diploids; DNA ploidy level; dried leaves and twigs; flow cytometry;hexaploids; polyploidy; tetraploids; triploids.
IntroductionPolyploidy, also known as whole-genome duplication, iswidely recognized as a major driver of evolution, diversifi-cation and speciation in angiosperms (Soltis et al. 2009;Wood et al. 2009; Robertson et al. 2010). Cytological, fossiland genomic studies suggest that polyploidy is ancient
and widespread, with most angiosperms estimated tohave undergone one or more polyploidization eventsduring their evolutionary history (Cui et al. 2006; Soltiset al. 2009; Wood et al. 2009; Jiao et al. 2011). Furtheranalyses of cytogenetic and phylogenetic databases indi-cate that up to 15 % of angiosperm speciation events are
* Corresponding author’s e-mail address: [email protected]
Published by Oxford University Press on behalf of the Annals of Botany Company.This is an Open Access article distributed under the terms of the Creative Commons Attribution License (http://creativecommons.org/licenses/by/4.0/), which permits unrestricted reuse, distribution, and reproduction in any medium, provided the original work is properly cited.
AoB PLANTS www.aobplants.oxfordjournals.org & The Authors 2015 1
by guest on June 28, 2016http://aobpla.oxfordjournals.org/
Dow
nloaded from
accompanied by ploidy increase (Otto and Whitton 2000;Wood et al. 2009), although this number is likely to growas more species are studied.
The establishment and maintenance of polyploids willdepend on a range of complex ecological and reproduct-ive processes that promote reproductive and/or spatialisolation between the newly formed polyploid plantsand their progenitors (Thompson and Lumaret 1992;Petit et al. 1999; Baack 2004). Following genome multipli-cation, novel genetic combinations arise that may conferpolyploids with different reproductive, morphological,ecological, physiological or cytological characteristicsfrom their progenitors, allowing them to exploit newenvironments (Kolar et al. 2009; Manzaneda et al. 2012;Hao et al. 2013).
Variations in 2C DNA content and ploidy levels are notuncommon among closely related species, and can alsobe useful in delimiting taxonomically complex species(e.g. Kolar et al. 2009; Peirson et al. 2012). Furthermore,analysing 1Cx (monoploid) DNA may also be useful incomparing diploid–polyploid complexes across the nat-ural range of the species; several workers have used theconstancy in monoploid DNA as evidence of autopoly-ploidy (Balao et al. 2009; Duchoslav et al. 2013; Krejcıkovaet al. 2013). In many instances, polyploids and their dip-loid progenitors may co-occur across geographic regionsreferred to as contact zones, which can be useful inunderstanding the processes involved in their originsand evolutionary history (Husband and Schemske 1998;Petit et al. 1999). Diploid–polyploid contact zones mayoccur in two ways, namely (i) a primary contact zone,arising from the emergence of a new ploidy level withina diploid population, and (ii) a secondary contact zone,formed following contact between diploid and polyploidpopulations that were geographically isolated and haveprobably differentiated in allopatry (Petit et al. 1999).Several studies show that contact zones may either belocalized or span wide geographic distances, and thedynamics of diploid–polyploid contact zones vary withspecies or species complexes (e.g. Ranunculus adoneus,Baack 2004; Melampodium spp., Steussy et al. 2004;Dianthus broteri, Balao et al. 2009; Ulmus americana,Whittemore and Olsen 2011; Aster amellus, Castro et al.2012; Allium oleraceum, Duchoslav et al. 2013; Oxalisobtusa, Krejcıkova et al. 2013).
Recent genomic investigations indicate that polyploidyis common in angiosperm lineages including the legumefamily, and it is postulated that ancient genome-doublingevents may be associated with the rapid diversificationof this family (Soltis et al. 2009; Cannon et al. 2010).Legumes are reported to have undergone rapid family-diversification since the Tertiary, which corresponded,for instance, with polyploidization within Papilionoideae
(Cannon et al. 2010), and emergence of many speciesas recently as the Plio-Pleistocene (Richardson et al.2001; Lavin et al. 2005). In Africa, acacias (Acacia Millers.l., Mimosoideae) diversified during the Pliocene, colonized,expanded and became integral to open, arid-adapted vege-tation—the savanna woodlands (Bouchenak-Khelladi et al.2010; Odee et al. 2012). Globally, the genus Acacia in-cludes .1400 species, and is an important phytogeo-graphic component of the tropics (Lewis et al. 2005).However, genome sizes (2C DNA contents) have been ex-plored in only a few species (Bennett and Leitch 2012).
In this study, we focus on Acacia senegal (see Fig. 1), aninsect-pollinated outbreeding species, commonly knownas the ‘gum arabic’ tree, comprising four recognizedvarieties based on morphological delimitations, namelyvars. senegal, kerensis, rostrata and leiorhachis (Faggand Allison 2004). Together with �20 other rare andclosely related species, e.g. A. dudgeoni, and the diploidA. asak as reported by Bukhari (1997b), these form theA. senegal complex (Ross 1975). Acacia senegal is ashrub or tree with considerable economic and ecologicalimportance, producing a natural gum (gum arabic) widelyused in the food and beverage industry, pharmaceuticals,other technical applications and provisioning of severalecosystem services in the drylands of tropical Africa(Fagg and Allison 2004; Omondi et al. 2010; Sprent et al.2010; Odee et al. 2011; Gray et al. 2013). Previouscytological studies of A. senegal have reported onlydiploids (Atchison 1948; Oballa and Olng’otie 1993;Bukhari 1997b, c), but tetraploids were recently detectedin three populations in the Sudano-Sahelian region(Assoumane et al. 2013), which suggested polyploidymight be prevalent in this region and elsewhere acrossthe native range. However, cytogeographic studies todate have not extensively sampled local and regional spa-tial scales, nor have populations in the southern nativerange been examined.
A recent phylogeographic and phylogenetic study byOdee et al. (2012) based on ITS and chloroplast DNA(cpDNA) data showed geographic structuring of geneticvariation, which separated east and southern Africanpopulations (the southern range of the species) fromthose in west and central Africa within the Sudano-Sahelian region (the northern range). It further inferredthat hybridization and introgression were likely to have dri-ven the recent colonization and range expansion of thespecies in the northern ranges. If the generally held viewthat polyploidy may confer broader ecological toleranceand colonization ability is true for this species, then wewould expect to detect differences in ploidy diversity anddistribution within and among populations and regions.
Therefore, we employed flow cytometry (FCM) to surveyand assess the rangewide distribution patterns of DNA
2 AoB PLANTS www.aobplants.oxfordjournals.org & The Authors 2015
Odee et al. — Rangewide ploidy variation and evolution in Acacia senegal
by guest on June 28, 2016http://aobpla.oxfordjournals.org/
Dow
nloaded from
contents and ploidy levels of A. senegal, and specificallyaddressed the following questions: (i) What is thevariation in overall (2C DNA content) and monoploid(1Cx DNA content) genome size? (ii) What is the ploidyvariation and distribution pattern across its nativerange? (iii) Are the ploidy levels phylogeographicallyand phylogenetically structured? The ploidy data are
discussed in the context of origins, evolutionary andrecent colonization history of the species. Furthermore,due to difficulties associated with collecting fresh leafsamples in rangewide studies conducted remote from ap-propriate facilities, we tested a range of tissues, namelyseed, fresh leaf and twig, dried leaf and twig and herbar-ium specimens to evaluate their utility in FCM analysis.
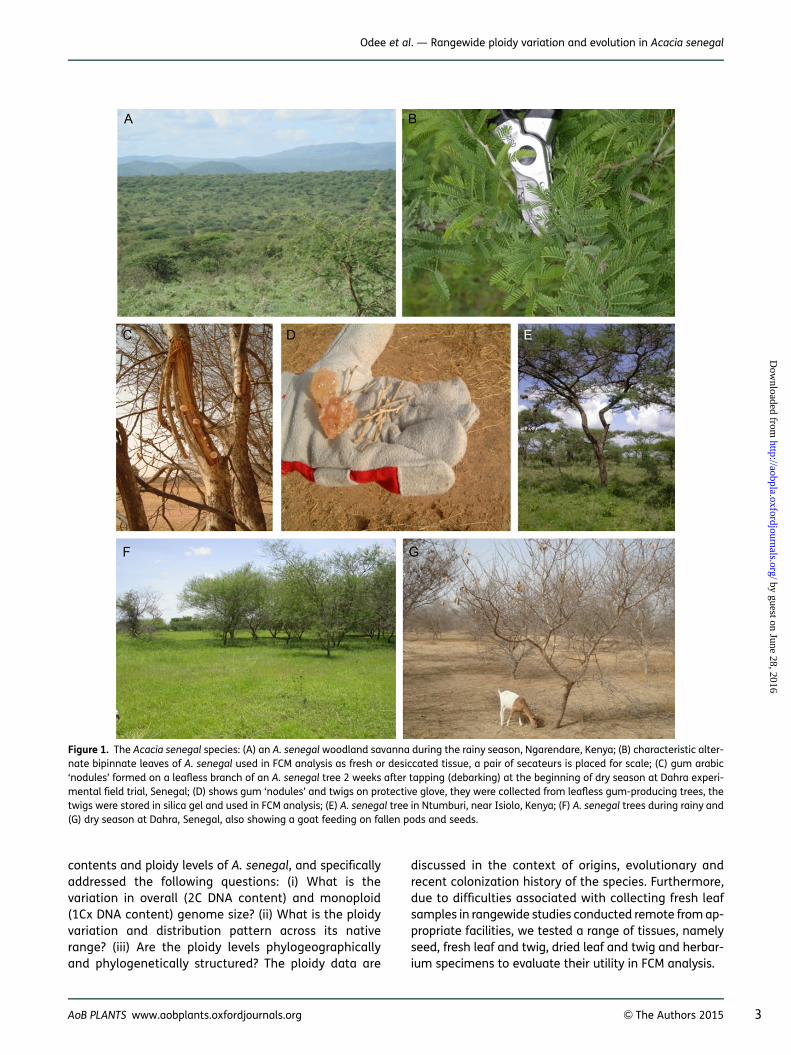
Figure 1. The Acacia senegal species: (A) an A. senegal woodland savanna during the rainy season, Ngarendare, Kenya; (B) characteristic alter-nate bipinnate leaves of A. senegal used in FCM analysis as fresh or desiccated tissue, a pair of secateurs is placed for scale; (C) gum arabic‘nodules’ formed on a leafless branch of an A. senegal tree 2 weeks after tapping (debarking) at the beginning of dry season at Dahra experi-mental field trial, Senegal; (D) shows gum ‘nodules’ and twigs on protective glove, they were collected from leafless gum-producing trees, thetwigs were stored in silica gel and used in FCM analysis; (E) A. senegal tree in Ntumburi, near Isiolo, Kenya; (F) A. senegal trees during rainy and(G) dry season at Dahra, Senegal, also showing a goat feeding on fallen pods and seeds.
AoB PLANTS www.aobplants.oxfordjournals.org & The Authors 2015 3
Odee et al. — Rangewide ploidy variation and evolution in Acacia senegal
by guest on June 28, 2016http://aobpla.oxfordjournals.org/
Dow
nloaded from
Methods
Plant material
Samples were collected between May 2006 and June2011 from a total of 157 A. senegal individuals in wildpopulations, experimental trials and herbarium speci-mens representing 54 localities across its natural rangein sub-Saharan Africa, Pakistan and India (Table 1).Samples were also obtained from Kadiogo, Burkina Fasofor A. dudgeoni, a member of the A. senegal complex. Sam-ples of different tissues (seed, leaf or twigs) and ages includ-ing herbarium specimens that had been stored for .53months since collection were used for 2C and 1Cx DNAcontent analysis [see Supporting Information—Table S1].During field collections, fresh terminal twig (�2–4 mmdiameter) or leaf (where available) tissue samples were col-lected (see Fig. 1D), dried on silica gel in sealable bags,transported back to the lab and stored at 4 8C until used.
Chromosome counts
Chromosome numbers were determined from mitoticallyactive root tip meristems of seedlings germinatedfrom seeds from two populations (Kibwezi and Fallatu,Table 1) using standard methods described for acacias(Bukhari 1997a). Chromosome counts for other popula-tions, namely Kidira, Somo and Tourba; and Sodera, repre-senting both diploids and tetraploids have previouslybeen determined (Assoumane et al. 2013). Chromosomecounts in other populations from previous studies arepresented [see Supporting Information—Table S2].
Flow cytometry, determination of DNA contentand ploidy levels
All 157 individuals were subjected to DNA content andploidy-level estimation using FCM. Sample preparationfollowed the one-step protocol of Dolezel et al. (2007),using an internal plant standard and propidium iodide(PI) dye, which is a DNA selective fluorochrome with nobase specificity, and Tris . MgCl2 buffer (Dolezel et al.2007). For each sample, 1 mL of chilled buffer was placedin a small (5 cm diameter) Petri dish, on ice. Twigs werewiped with damp tissue to remove surface debris, andgently scraped with a razor blade, removing tangentialslivers of the outer layers of the tissues, up to and in-cluding the green cambial layer, and the scrapings(4 mg) were collected into the buffer. For leaf samples,4 mg of fresh or dried tissue of the test plant were used.Fresh leaf tissue (25 mg) of a DNA primary referencestandard of glasshouse-grown tomato (Solanum lycoper-sicum ‘Stupicke polnı rane’, 2C ¼ 1.96 pg DNA), soya bean(Glycine max Merr. ‘Polanka’, 2C ¼ 2.50 pg DNA) or maize(Zea mays ‘CE-777, 2C ¼ 5.43 pg DNA) plants (Dolezelet al. 2007) were chopped together with the test samples
with a new feather-edge razor blade, cutting piecesmeasuring 0.5–2 mm across (taking �60–90 s). Forseeds, radicle tissue was used as described by Sliwinskaet al. (2005) to avoid endoreduplicated cells in endo-sperms. The resultant suspension was collected into a1 mL pipette and filtered through squares of 42-mmnylon mesh (Sefar AG, Switzerland) into standard 5-mLflow cytometer collection tubes, on ice. RNase wasadded to prevent staining of double-stranded RNA, fol-lowed by PI to attain final concentrations of 80 mg mL21
for both. Samples were then briefly and gently vortexedto mix, and incubated on ice in the dark until they weremeasured (usually within 10–50 min).
The use of different tissues was tested in a range ofstudies, including comparisons of data collected fromfresh leaves and twigs from the same plant, and driedleaves and stems from the same plant. Analyses wererepeated on several samples to determine the reliabilityof the data obtained.
Samples were analysed with a Becton Dickinson FACSCa-libur flow cytometer (San Jose, CA, USA), equipped with anargon-ion 488-nm wavelength laser, calibrated daily andrun on the low flow rate. Counts were collected using theFL2 (orange) detector with a band-pass filter of 585/42 nm. The default threshold setting on FL2 was used(channel 52). Instrument settings (voltage and gain) wereadjusted to allow for fluorescence intensity of expectedploidy levels, together with the peak of the referenceplant, to be located between channels 250–750 on thex-axis (using a 1024 scale) of plots of counts of nuclei vsFL2A. Forward scatter (FSC) and side scatter (SSC) wereset to logarithmic scales, and FL2 was set to linear.
Data were acquired with CellQuest software (v4.0.2;Becton Dickinson) and subsequently analysed usingCyflogicTM software (version 1.2.1; Cyflo Ltd, Finland),determining the DNA content of the test sample againstthat of the internal reference standard. Gating of the po-pulations of interest was done first on the FSC/SSC dotplot, and then on the FL2A (area) vs FL2W (width) dotplot to remove debris and doublets, and histograms of anumber of nuclei vs channel number (relative fluores-cence) were then plotted. The peak mean channel num-ber and full peak coefficients of variation (CV) of eachpeak were determined. DNA contents of the sampleswere calculated from the ratios of the peak mean channelnumbers of the test and reference plant material. Thesamples were assigned to ploidy levels based on theavailable chromosome counts and their DNA contents.
Statistical analysis
The 2C DNA content was calculated for each sample asthe average of the replicates, and monoploid genomesize (1Cx) estimated as the amount of nuclear DNA
4 AoB PLANTS www.aobplants.oxfordjournals.org & The Authors 2015
Odee et al. — Rangewide ploidy variation and evolution in Acacia senegal
by guest on June 28, 2016http://aobpla.oxfordjournals.org/
Dow
nloaded from
. . . . . . . . . . . . . . . . . . . . . . . . . . . . . . . . . . . . . . . . . . . . . . . . . . . . . . . . . . . . . . . . . . . . . . . . . . . . . . . . . . . . . . . . . . . . . . . . . . . . . . . . . . . . . . . . . . . . . . . . . . . . . . . . . . . . . . . . . . . . . . . . . . . . . . . . . . . . . . . . . . . . . . . . . . . . . . . . . . . . . . . . . . . . . . . . . . . . . . . . . . . . . . . . . . . . . . . . . . . . . . . . .
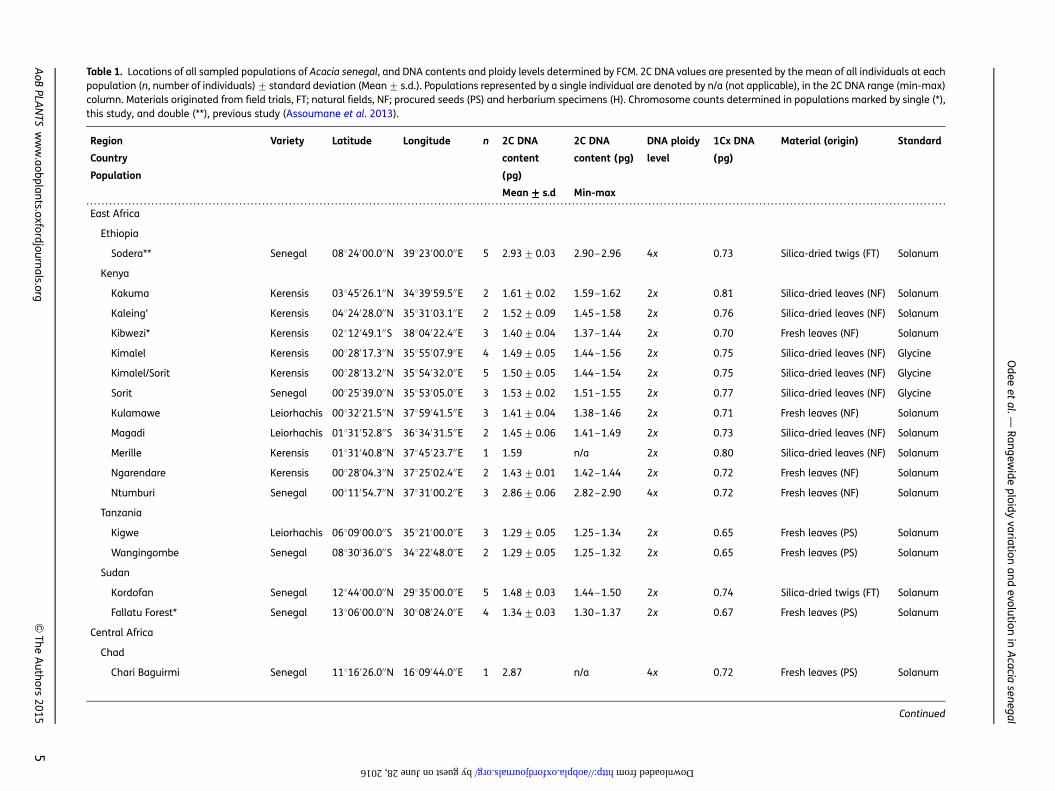
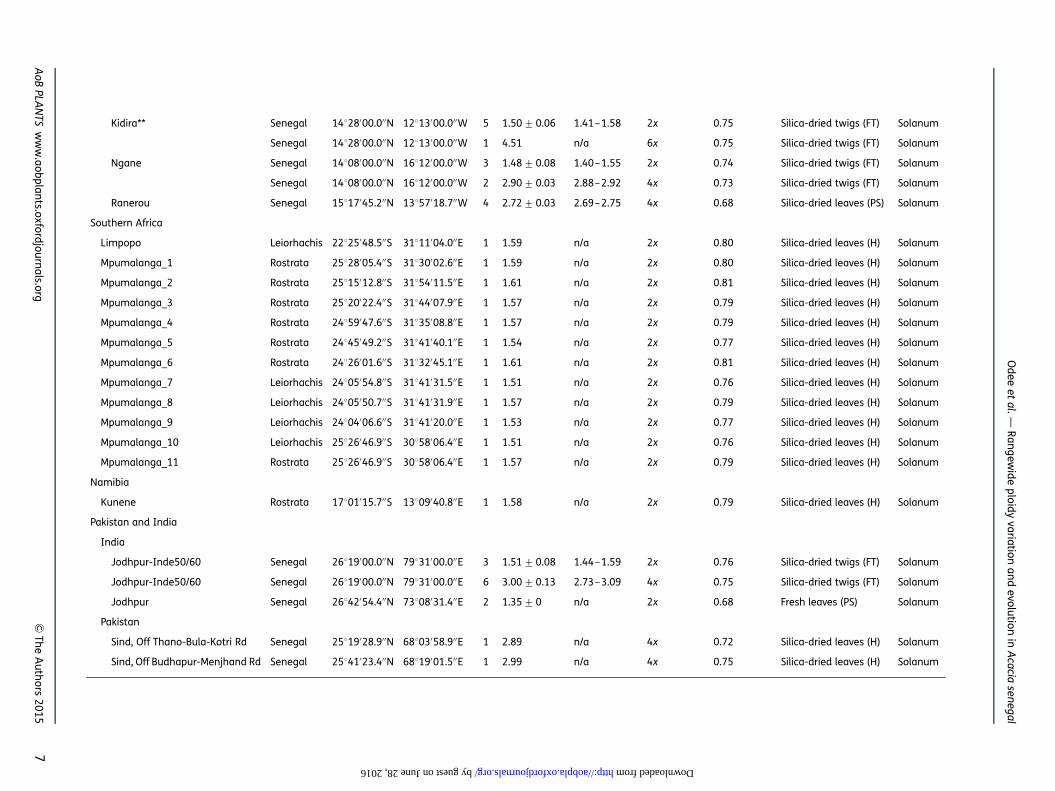
Table 1. Locations of all sampled populations of Acacia senegal, and DNA contents and ploidy levels determined by FCM. 2C DNA values are presented by the mean of all individuals at eachpopulation (n, number of individuals)+ standard deviation (Mean+ s.d.). Populations represented by a single individual are denoted by n/a (not applicable), in the 2C DNA range (min-max)column. Materials originated from field trials, FT; natural fields, NF; procured seeds (PS) and herbarium specimens (H). Chromosome counts determined in populations marked by single (*),this study, and double (**), previous study (Assoumane et al. 2013).
Region
Country
Population
Variety Latitude Longitude n 2C DNA
content
(pg)
2C DNA
content (pg)
DNA ploidy
level
1Cx DNA
(pg)
Material (origin) Standard
Mean+++++ s.d Min-max
East Africa
Ethiopia
Sodera** Senegal 08824′00.0′′N 39823′00.0′′E 5 2.93+0.03 2.90–2.96 4x 0.73 Silica-dried twigs (FT) Solanum
Kenya
Kakuma Kerensis 03845′26.1′′N 34839′59.5′′E 2 1.61+0.02 1.59–1.62 2x 0.81 Silica-dried leaves (NF) Solanum
Kaleing’ Kerensis 04824′28.0′′N 35831′03.1′′E 2 1.52+0.09 1.45–1.58 2x 0.76 Silica-dried leaves (NF) Solanum
Kibwezi* Kerensis 02812′49.1′′S 38804′22.4′′E 3 1.40+0.04 1.37–1.44 2x 0.70 Fresh leaves (NF) Solanum
Kimalel Kerensis 00828′17.3′′N 35855′07.9′′E 4 1.49+0.05 1.44–1.56 2x 0.75 Silica-dried leaves (NF) Glycine
Kimalel/Sorit Kerensis 00828′13.2′′N 35854′32.0′′E 5 1.50+0.05 1.44–1.54 2x 0.75 Silica-dried leaves (NF) Glycine
Sorit Senegal 00825′39.0′′N 35853′05.0′′E 3 1.53+0.02 1.51–1.55 2x 0.77 Silica-dried leaves (NF) Glycine
Kulamawe Leiorhachis 00832′21.5′′N 37859′41.5′′E 3 1.41+0.04 1.38–1.46 2x 0.71 Fresh leaves (NF) Solanum
Magadi Leiorhachis 01831′52.8′′S 36834′31.5′′E 2 1.45+0.06 1.41–1.49 2x 0.73 Silica-dried leaves (NF) Solanum
Merille Kerensis 01831′40.8′′N 37845′23.7′′E 1 1.59 n/a 2x 0.80 Silica-dried leaves (NF) Solanum
Ngarendare Kerensis 00828′04.3′′N 37825′02.4′′E 2 1.43+0.01 1.42–1.44 2x 0.72 Fresh leaves (NF) Solanum
Ntumburi Senegal 00811′54.7′′N 37831′00.2′′E 3 2.86+0.06 2.82–2.90 4x 0.72 Fresh leaves (NF) Solanum
Tanzania
Kigwe Leiorhachis 06809′00.0′′S 35821′00.0′′E 3 1.29+0.05 1.25–1.34 2x 0.65 Fresh leaves (PS) Solanum
Wangingombe Senegal 08830′36.0′′S 34822′48.0′′E 2 1.29+0.05 1.25–1.32 2x 0.65 Fresh leaves (PS) Solanum
Sudan
Kordofan Senegal 12844′00.0′′N 29835′00.0′′E 5 1.48+0.03 1.44–1.50 2x 0.74 Silica-dried twigs (FT) Solanum
Fallatu Forest* Senegal 13806′00.0′′N 30808′24.0′′E 4 1.34+0.03 1.30–1.37 2x 0.67 Fresh leaves (PS) Solanum
Central Africa
Chad
Chari Baguirmi Senegal 11816′26.0′′N 16809′44.0′′E 1 2.87 n/a 4x 0.72 Fresh leaves (PS) Solanum
Continued
AoB
PLAN
TSw
ww
.aobplants.oxford
journ
als.org&
The
Au
thors
20155
Od
eeet
al.—R
ang
ewid
eploid
yvariation
and
evolution
inA
caciasen
egal
by guest on June 28, 2016 http://aobpla.oxfordjournals.org/ Downloaded from
. . . . . . . . . . . . . . . . . . . . . . . . . . . . . . . . . . . . . . . . . . . . . . . . . . . . . . . . . . . . . . . . . . . . . . . . . . . . . . . . . . . . . . . . . . . . . . . . . . . . . . . . . . . . . . . . . . . . . . . . . . . . . . . . . . . . . . . . . . . . . . . . . . . . . . . . . . . . . . . . . . . . . . . . . . . . . . . . . . . . . . . . . . . . . . . . . . . . . . . . . . . . . . . . . . . . . . . . . . . . . . . . .
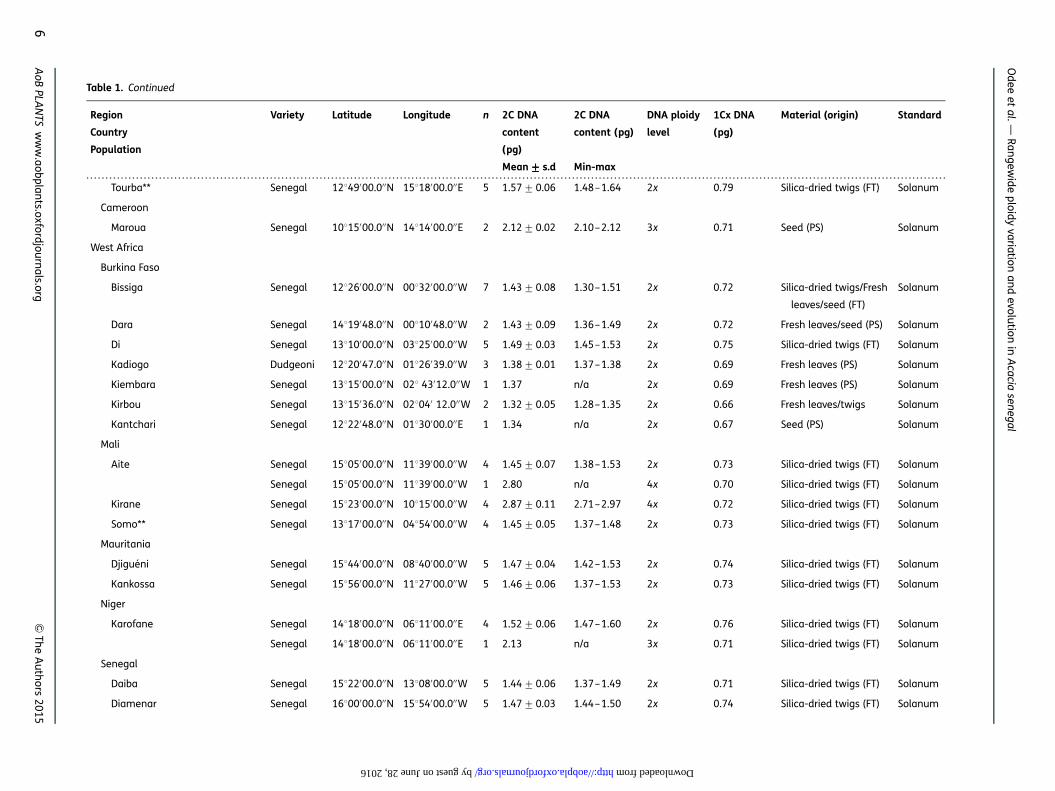
Table 1. Continued
Region
Country
Population
Variety Latitude Longitude n 2C DNA
content
(pg)
2C DNA
content (pg)
DNA ploidy
level
1Cx DNA
(pg)
Material (origin) Standard
Mean+++++ s.d Min-max
Tourba** Senegal 12849′00.0′′N 15818′00.0′′E 5 1.57+0.06 1.48–1.64 2x 0.79 Silica-dried twigs (FT) Solanum
Cameroon
Maroua Senegal 10815′00.0′′N 14814′00.0′′E 2 2.12+0.02 2.10–2.12 3x 0.71 Seed (PS) Solanum
West Africa
Burkina Faso
Bissiga Senegal 12826′00.0′′N 00832′00.0′′W 7 1.43+0.08 1.30–1.51 2x 0.72 Silica-dried twigs/Fresh
leaves/seed (FT)
Solanum
Dara Senegal 14819′48.0′′N 00810′48.0′′W 2 1.43+0.09 1.36–1.49 2x 0.72 Fresh leaves/seed (PS) Solanum
Di Senegal 13810′00.0′′N 03825′00.0′′W 5 1.49+0.03 1.45–1.53 2x 0.75 Silica-dried twigs (FT) Solanum
Kadiogo Dudgeoni 12820′47.0′′N 01826′39.0′′W 3 1.38+0.01 1.37–1.38 2x 0.69 Fresh leaves (PS) Solanum
Kiembara Senegal 13815′00.0′′N 028 43′12.0′′W 1 1.37 n/a 2x 0.69 Fresh leaves (PS) Solanum
Kirbou Senegal 13815′36.0′′N 02804′ 12.0′′W 2 1.32+0.05 1.28–1.35 2x 0.66 Fresh leaves/twigs Solanum
Kantchari Senegal 12822′48.0′′N 01830′00.0′′E 1 1.34 n/a 2x 0.67 Seed (PS) Solanum
Mali
Aite Senegal 15805′00.0′′N 11839′00.0′′W 4 1.45+0.07 1.38–1.53 2x 0.73 Silica-dried twigs (FT) Solanum
Senegal 15805′00.0′′N 11839′00.0′′W 1 2.80 n/a 4x 0.70 Silica-dried twigs (FT) Solanum
Kirane Senegal 15823′00.0′′N 10815′00.0′′W 4 2.87+0.11 2.71–2.97 4x 0.72 Silica-dried twigs (FT) Solanum
Somo** Senegal 13817′00.0′′N 04854′00.0′′W 4 1.45+0.05 1.37–1.48 2x 0.73 Silica-dried twigs (FT) Solanum
Mauritania
Djigueni Senegal 15844′00.0′′N 08840′00.0′′W 5 1.47+0.04 1.42–1.53 2x 0.74 Silica-dried twigs (FT) Solanum
Kankossa Senegal 15856′00.0′′N 11827′00.0′′W 5 1.46+0.06 1.37–1.53 2x 0.73 Silica-dried twigs (FT) Solanum
Niger
Karofane Senegal 14818′00.0′′N 06811′00.0′′E 4 1.52+0.06 1.47–1.60 2x 0.76 Silica-dried twigs (FT) Solanum
Senegal 14818′00.0′′N 06811′00.0′′E 1 2.13 n/a 3x 0.71 Silica-dried twigs (FT) Solanum
Senegal
Daiba Senegal 15822′00.0′′N 13808′00.0′′W 5 1.44+0.06 1.37–1.49 2x 0.71 Silica-dried twigs (FT) Solanum
Diamenar Senegal 16800′00.0′′N 15854′00.0′′W 5 1.47+0.03 1.44–1.50 2x 0.74 Silica-dried twigs (FT) Solanum
6A
oBPLA
NTS
ww
w.aobplan
ts.oxfordjou
rnals.org
&Th
eA
uth
ors2015
Od
eeet
al.—R
angew
ide
ploidy
variationan
devolu
tionin
Acacia
senegal
by guest on June 28, 2016 http://aobpla.oxfordjournals.org/ Downloaded from
Kidira** Senegal 14828′00.0′′N 12813′00.0′′W 5 1.50+0.06 1.41–1.58 2x 0.75 Silica-dried twigs (FT) Solanum
Senegal 14828′00.0′′N 12813′00.0′′W 1 4.51 n/a 6x 0.75 Silica-dried twigs (FT) Solanum
Ngane Senegal 14808′00.0′′N 16812′00.0′′W 3 1.48+0.08 1.40–1.55 2x 0.74 Silica-dried twigs (FT) Solanum
Senegal 14808′00.0′′N 16812′00.0′′W 2 2.90+0.03 2.88–2.92 4x 0.73 Silica-dried twigs (FT) Solanum
Ranerou Senegal 15817′45.2′′N 13857′18.7′′W 4 2.72+0.03 2.69–2.75 4x 0.68 Silica-dried leaves (PS) Solanum
Southern Africa
Limpopo Leiorhachis 22825′48.5′′S 31811′04.0′′E 1 1.59 n/a 2x 0.80 Silica-dried leaves (H) Solanum
Mpumalanga_1 Rostrata 25828′05.4′′S 31830′02.6′′E 1 1.59 n/a 2x 0.80 Silica-dried leaves (H) Solanum
Mpumalanga_2 Rostrata 25815′12.8′′S 31854′11.5′′E 1 1.61 n/a 2x 0.81 Silica-dried leaves (H) Solanum
Mpumalanga_3 Rostrata 25820′22.4′′S 31844′07.9′′E 1 1.57 n/a 2x 0.79 Silica-dried leaves (H) Solanum
Mpumalanga_4 Rostrata 24859′47.6′′S 31835′08.8′′E 1 1.57 n/a 2x 0.79 Silica-dried leaves (H) Solanum
Mpumalanga_5 Rostrata 24845′49.2′′S 31841′40.1′′E 1 1.54 n/a 2x 0.77 Silica-dried leaves (H) Solanum
Mpumalanga_6 Rostrata 24826′01.6′′S 31832′45.1′′E 1 1.61 n/a 2x 0.81 Silica-dried leaves (H) Solanum
Mpumalanga_7 Leiorhachis 24805′54.8′′S 31841′31.5′′E 1 1.51 n/a 2x 0.76 Silica-dried leaves (H) Solanum
Mpumalanga_8 Leiorhachis 24805′50.7′′S 31841′31.9′′E 1 1.57 n/a 2x 0.79 Silica-dried leaves (H) Solanum
Mpumalanga_9 Leiorhachis 24804′06.6′′S 31841′20.0′′E 1 1.53 n/a 2x 0.77 Silica-dried leaves (H) Solanum
Mpumalanga_10 Leiorhachis 25826′46.9′′S 30858′06.4′′E 1 1.51 n/a 2x 0.76 Silica-dried leaves (H) Solanum
Mpumalanga_11 Rostrata 25826′46.9′′S 30858′06.4′′E 1 1.57 n/a 2x 0.79 Silica-dried leaves (H) Solanum
Namibia
Kunene Rostrata 17801′15.7′′S 13809′40.8′′E 1 1.58 n/a 2x 0.79 Silica-dried leaves (H) Solanum
Pakistan and India
India
Jodhpur-Inde50/60 Senegal 26819′00.0′′N 79831′00.0′′E 3 1.51+0.08 1.44–1.59 2x 0.76 Silica-dried twigs (FT) Solanum
Jodhpur-Inde50/60 Senegal 26819′00.0′′N 79831′00.0′′E 6 3.00+0.13 2.73–3.09 4x 0.75 Silica-dried twigs (FT) Solanum
Jodhpur Senegal 26842′54.4′′N 73808′31.4′′E 2 1.35+0 n/a 2x 0.68 Fresh leaves (PS) Solanum
Pakistan
Sind, Off Thano-Bula-Kotri Rd Senegal 25819′28.9′′N 68803′58.9′′E 1 2.89 n/a 4x 0.72 Silica-dried leaves (H) Solanum
Sind, Off Budhapur-Menjhand Rd Senegal 25841′23.4′′N 68819′01.5′′E 1 2.99 n/a 4x 0.75 Silica-dried leaves (H) Solanum
AoB
PLAN
TSw
ww
.aobplants.oxford
journ
als.org&
The
Au
thors
20157
Od
eeet
al.—R
ang
ewid
eploid
yvariation
and
evolution
inA
caciasen
egal
by guest on June 28, 2016 http://aobpla.oxfordjournals.org/ Downloaded from
divided by ploidy level (Table 1). Either one-way ANOVAfollowed by Tukey’s multiple comparison tests or two-tailed unpaired t-test were performed with 2C DNA and1Cx DNA contents as the dependent variables. Analysescomprised the variation in 2C DNA and 1Cx DNA contentswith ploidy (Fig. 3A and B); the effects of tissue type (seed,leaf and dried leaf and twigs) on diploid 2C DNA content(Fig. 3C); and the effects of storage duration (arbitrarilycategorized as 0, between 2 and 41 and .53 months)on 2C DNA content (Fig. 3D). Regional comparisonswere carried out among populations from east Africa,west and central Africa and the Indian subcontinent(India and Pakistan) using only diploid individuals for 2CDNA (Fig. 3E) and all ploidy levels and individuals for1Cx DNA contents (Fig. 3F). Southern Africa was excludedfrom these regional analyses because possible regionalvariation could not be separated from variations due totissue storage duration. All analyses and graphs were per-formed with GraphPad Prism version 5.04 for Windows,GraphPad Software, La Jolla, CA, USA, www.graphpad.com. The DNA ploidy distribution was mapped using theESRI software ArcMap 10.1 (ESRI, Redlands, CA, USA)(Fig. 2). Eleven herbarium specimens collected fromMpamalanga province (Republic of South Africa) were
grouped and mapped into two geographically proximatequasi populations of four and seven individuals, taxonom-ically affiliated to vars. leiorhachis and rostrata, respect-ively (Table 1) [see Supporting Information—Table S1].
The DNA ploidy data of analysed individuals were alsolocated on the phylogenetic tree (maximum parsimonystrict consensus tree) of A. senegal based on ITS sequencedata (Fig. 4) (Odee et al. 2012). Examples of FCM histo-grams collected from different tissue types are providedin Supporting Information—Fig. S1.
Results
Chromosome counts
Chromosome numbers for Kibwezi (A. senegal var.kerensis) and Fallatu (A. senegal var. senegal) populationswere 2n ¼ 26, corresponding to diploid.
Flow cytometry measurements and effects of tissuetypes and storage
Flow cytometry analyses generally produced clearpeaks [see Supporting Information—Fig. S1] and outputfrom fresh or dry twigs [see Supporting Information—Fig. S1A and C] was of similar quality to that of
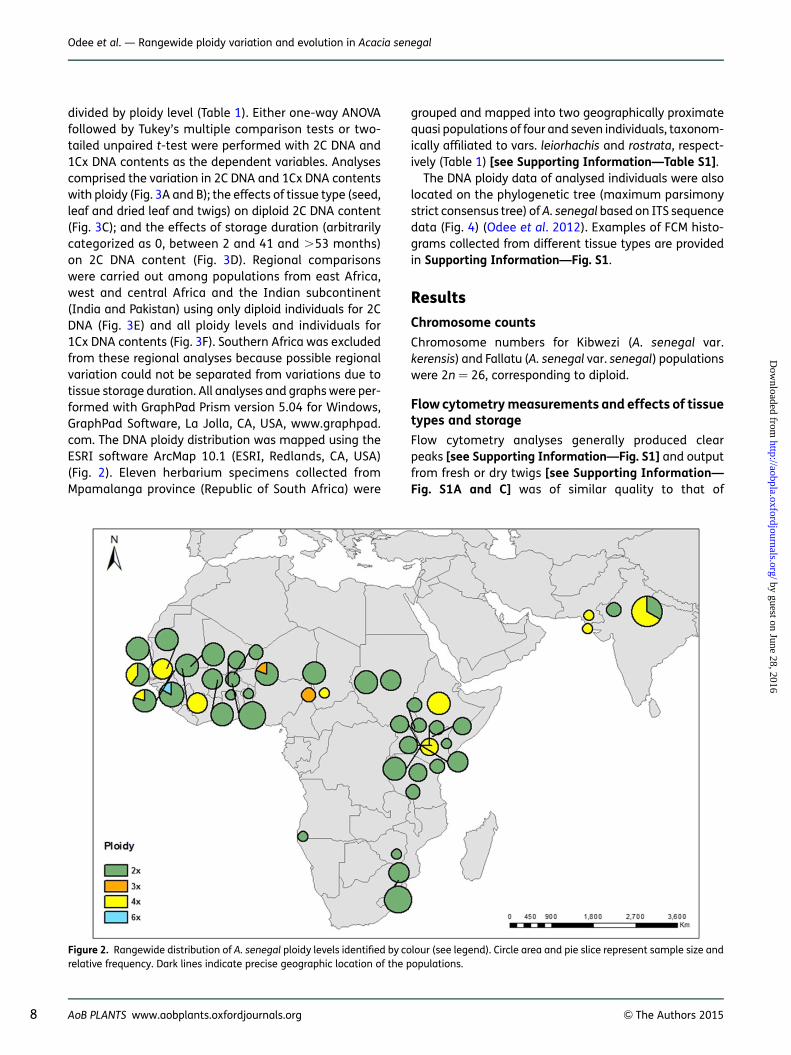
Figure 2. Rangewide distribution of A. senegal ploidy levels identified by colour (see legend). Circle area and pie slice represent sample size andrelative frequency. Dark lines indicate precise geographic location of the populations.
8 AoB PLANTS www.aobplants.oxfordjournals.org & The Authors 2015
Odee et al. — Rangewide ploidy variation and evolution in Acacia senegal
by guest on June 28, 2016http://aobpla.oxfordjournals.org/
Dow
nloaded from

Figure 3. Box-plot representations of A. senegal (A) 2C DNA, (B) monoploid (1Cx) values comparing ploidy levels; (C) 2C DNA comparing tissuetypes of diploid individuals, (D) 2C DNA values comparing storage duration; (E) 2C DNA of diploid individuals and (F) monoploid (1Cx) values of allploidy levels comparing biogeographical regions. Means not significantly different at P , 0.05 are indicated by the same letter (Tukey’s post test,or two-tailed unpaired t-test). Horizontal lines represent the median, and boxes and whiskers, respectively, the interquartile range and the non-outlier ranges. Circles denote outliers. An asterisk (*) indicates the single hexaploid DNA content value (4.51 pg) is not included in the ANOVAanalysis.
AoB PLANTS www.aobplants.oxfordjournals.org & The Authors 2015 9
Odee et al. — Rangewide ploidy variation and evolution in Acacia senegal
by guest on June 28, 2016http://aobpla.oxfordjournals.org/
Dow
nloaded from
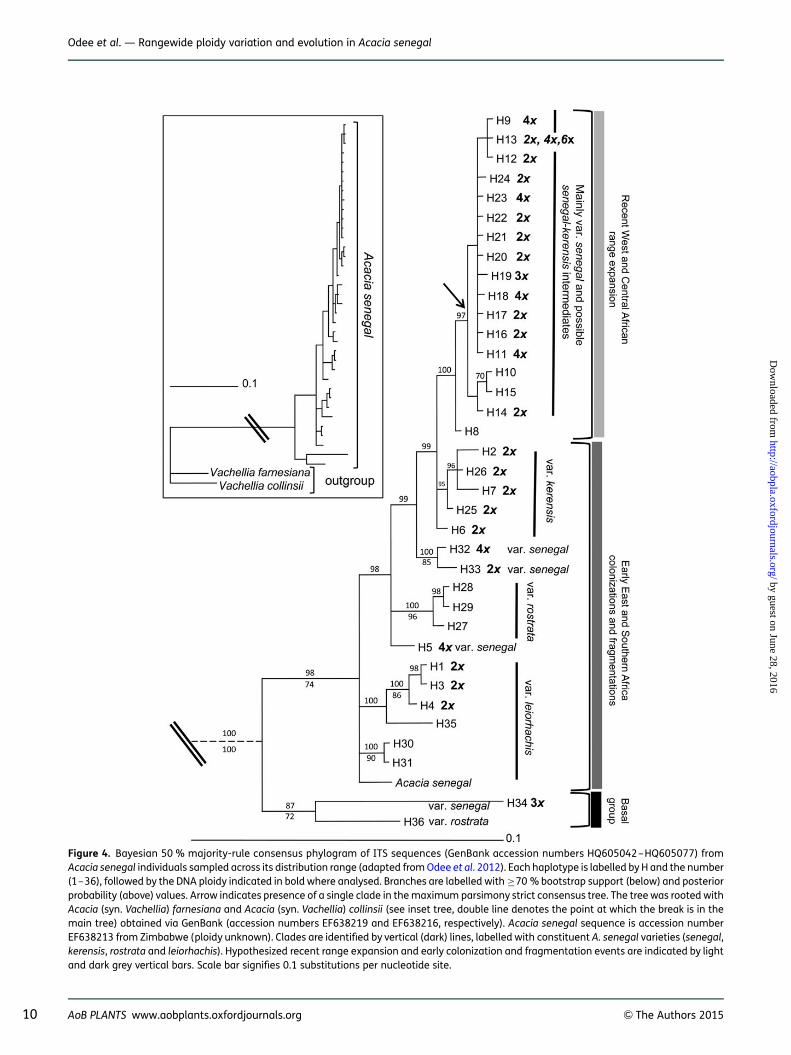
Figure 4. Bayesian 50 % majority-rule consensus phylogram of ITS sequences (GenBank accession numbers HQ605042–HQ605077) fromAcacia senegal individuals sampled across its distribution range (adapted from Odee et al. 2012). Each haplotype is labelled by H and the number(1–36), followed by the DNA ploidy indicated in bold where analysed. Branches are labelled with ≥70 % bootstrap support (below) and posteriorprobability (above) values. Arrow indicates presence of a single clade in the maximum parsimony strict consensus tree. The tree was rooted withAcacia (syn. Vachellia) farnesiana and Acacia (syn. Vachellia) collinsii (see inset tree, double line denotes the point at which the break is in themain tree) obtained via GenBank (accession numbers EF638219 and EF638216, respectively). Acacia senegal sequence is accession numberEF638213 from Zimbabwe (ploidy unknown). Clades are identified by vertical (dark) lines, labelled with constituent A. senegal varieties (senegal,kerensis, rostrata and leiorhachis). Hypothesized recent range expansion and early colonization and fragmentation events are indicated by lightand dark grey vertical bars. Scale bar signifies 0.1 substitutions per nucleotide site.
10 AoB PLANTS www.aobplants.oxfordjournals.org & The Authors 2015
Odee et al. — Rangewide ploidy variation and evolution in Acacia senegal
by guest on June 28, 2016http://aobpla.oxfordjournals.org/
Dow
nloaded from
comparable leaf samples [see Supporting Information—Fig. S1B and D]. When fresh leaf and twig were combinedin the same extract [see Supporting Information—Fig.S1E], the peak positions were identical. The dried leafshowed a slightly higher peak position than the driedstem [see Supporting Information—Fig. S1D vs C], as isalso indicated in Fig. 3C. Overall, the mean full peak CVs ofstandards ranged from 1.78 to 2.89 %, while those ofsamples (including dried leaf and twigs stored 2–41months) ranged from 1.76 to 5.09 % [see SupportingInformation—Table S3]. The CVs of samples fromsouthern Africa, which had been stored for .53 monthsranged from 4.38 to 7.57 %. Fresh material (leaves andseed) generally yielded lower CVs than dried samples.The mean 2C DNA contents of diploids, triploids andtetraploids were significantly different (Fig. 3A). TheDNA content of the hexaploid was not included in thestatistical analysis but was 3.06-fold higher than the cor-responding diploid DNA content. The monoploid DNAcontent across all the ploidy series ranged from 0.63 to0.81 pg (Table 1), but the mean monoploid DNA contentsamong the diploids, triploids and tetraploids were not sig-nificantly different (Fig. 3B). Analysis of variance resultsshowed that the 2C DNA value of diploid individualswas dependent on tissue type (seed, fresh leaves, driedleaves and twigs) (F3,121 ¼ 40.8, P , 0.0001); seed andfresh leaves were not significantly different according toTukey’s post test (Fig. 3C), and were lower than driedleaves and twigs. There was also a significant effect(F3,56 ¼ 46.7, P , 0.0001) of storage (period betweensample collection and FCM analysis) (Fig. 3D). No signifi-cant differences between regions were detected in thecomparisons of 2C DNA of diploids (Fig. 3E) and 1CxDNA (Fig. 3F).
DNA content variation and ploidy levels
The 2C DNA contents of all 157 individuals ranged from1.25 to 4.51 pg (Table 1) [see Supporting Information,Table S1]. Taking both fresh and dried A. senegal tissuesamples into consideration, we found mean 2C DNA(pg+ s.d.) contents of 1.47+0.09 (n ¼ 126), 2.12+0.02 (n ¼ 3), 2.89+0.12 (n ¼ 28), and a single individualwith 4.51 pg, corresponding to a polyploid series ofdiploid, triploid, tetraploid and hexaploid (Table 1) [seeSupporting Information, Table S1]. The mean 2C DNAcontents of fresh samples from Kibwezi and Fallatu,1.40+0.04 pg (n ¼ 3) and 1.34+0.03 pg (n ¼ 4), re-spectively, were confirmed as diploids by chromosomecounts (2n ¼ 2x ¼ 26). The Sodera population had amean 2C DNA value of 2.93+0.03 pg (n ¼ 5; Table 1)and was recently confirmed as tetraploid with chromo-some counts (2n ¼ 4x ¼ 52) and microsatellite markers(Assoumane et al. 2013). In essence, 2C DNA values for
the predominant diploids varied from 1.25 to 1.64 pg(1.31-fold variation, n ¼ 126), while tetraploids rangedfrom 2.69 to 3.09 pg (1.15-fold, n ¼ 28), and the raretriploids, 2.13 to 2.17 pg (1.02-fold, n ¼ 3). Most popula-tions (90.7 %) were of single ploidy level (i.e. uniformploidy; 2x, 3x or 4x), while five populations (9.3 %)presented mixed ploidy levels as follows: diploid andtetraploid (Aite, Ngane and Jodhpur), diploid and triploid(Karofane) and diploid and hexaploid (Kidira), all of whichwere in the Sudano-Sahelian and Indian subcontinentregions (Table 1, Fig. 2) [see Supporting Information,Table S1]. Triploid and hexaploid individuals were rare.The triploid individuals occurred in Maroua, Cameroonand Karofane, Niger (Fig. 2, Table 1). Both triploids andthe hexaploid detected by FCM are reported for the firsttime, but have not been confirmed by chromosomecounts due to their rarity.
Cytogeography
The overall distribution pattern of ploidy levels is shown inFig. 2 (Table 1) [see Supporting Information—Table S2with additional data from previous studies (Bukhari1997b, c; Assoumane et al. 2013)]. Diploids were themost common and widespread, occurring in the entirenatural geographic range of the species. Acacia dudgeoni(analysed in this study) and A. asak (previously reportedby Bukhari (1997b)) are also diploids [see SupportingInformation—Table S2]. Tetraploids, the rare triploidsand hexaploid individuals occur in the Sudano-Sahelianregion. Only two tetraploid populations occur in theeast African Highlands (Sodera, Ethiopia, and Ntumburi,Kenya), while populations south of the Equator were alldiploids. Both diploids and tetraploids were also detectedin populations from Pakistan and India in spite of limitedsampling of these regions. Interestingly, all detectedpolyploids belonged to A. senegal var. senegal, althoughdiploids were still the majority in this taxon, and nonewere detected in the vars. kerensis, leorhachis, rostrataor A. dudgeoni.
Phylogeny and phylogeography of A. senegaldiploids and polyploidsThe ITS and cpDNA haplotypes were variably sharedwithin and among diploids and polyploids [see Support-ing Information—Table S1]. The diploid–polyploid com-plexes occurred mostly in the terminal clade, whichcomprised mainly Sudano-Sahelian samples affiliated tovar. senegal (Fig. 4). Diploids dominated the basal clades,which largely comprised east and southern Africa popu-lations (southern range), and consisted of individualsaffiliated to either var. leiorhachis or vars. senegal,kerensis and rostrata.
AoB PLANTS www.aobplants.oxfordjournals.org & The Authors 2015 11
Odee et al. — Rangewide ploidy variation and evolution in Acacia senegal
by guest on June 28, 2016http://aobpla.oxfordjournals.org/
Dow
nloaded from
Discussion
Flow cytometry: methodological limitationsand innovations
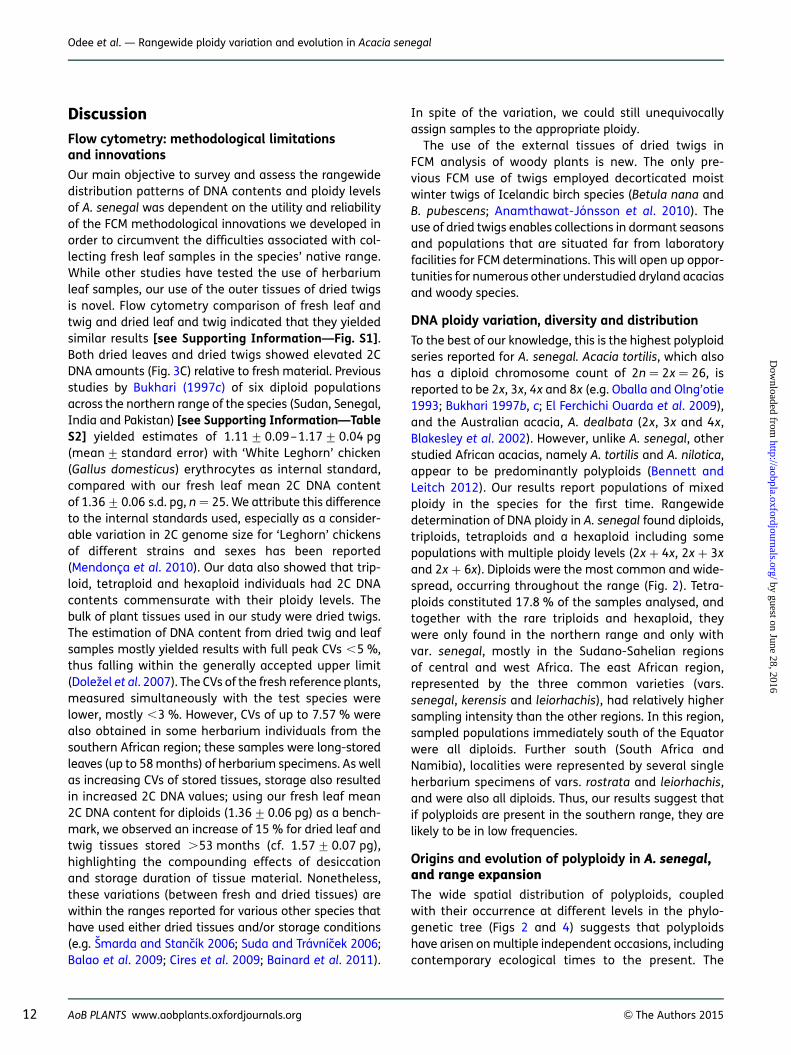
Our main objective to survey and assess the rangewidedistribution patterns of DNA contents and ploidy levelsof A. senegal was dependent on the utility and reliabilityof the FCM methodological innovations we developed inorder to circumvent the difficulties associated with col-lecting fresh leaf samples in the species’ native range.While other studies have tested the use of herbariumleaf samples, our use of the outer tissues of dried twigsis novel. Flow cytometry comparison of fresh leaf andtwig and dried leaf and twig indicated that they yieldedsimilar results [see Supporting Information—Fig. S1].Both dried leaves and dried twigs showed elevated 2CDNA amounts (Fig. 3C) relative to fresh material. Previousstudies by Bukhari (1997c) of six diploid populationsacross the northern range of the species (Sudan, Senegal,India and Pakistan) [see Supporting Information—TableS2] yielded estimates of 1.11+0.09–1.17+0.04 pg(mean+ standard error) with ‘White Leghorn’ chicken(Gallus domesticus) erythrocytes as internal standard,compared with our fresh leaf mean 2C DNA contentof 1.36+0.06 s.d. pg, n ¼ 25. We attribute this differenceto the internal standards used, especially as a consider-able variation in 2C genome size for ‘Leghorn’ chickensof different strains and sexes has been reported(Mendonca et al. 2010). Our data also showed that trip-loid, tetraploid and hexaploid individuals had 2C DNAcontents commensurate with their ploidy levels. Thebulk of plant tissues used in our study were dried twigs.The estimation of DNA content from dried twig and leafsamples mostly yielded results with full peak CVs ,5 %,thus falling within the generally accepted upper limit(Dolezel et al. 2007). The CVs of the fresh reference plants,measured simultaneously with the test species werelower, mostly ,3 %. However, CVs of up to 7.57 % werealso obtained in some herbarium individuals from thesouthern African region; these samples were long-storedleaves (up to 58 months) of herbarium specimens. As wellas increasing CVs of stored tissues, storage also resultedin increased 2C DNA values; using our fresh leaf mean2C DNA content for diploids (1.36+0.06 pg) as a bench-mark, we observed an increase of 15 % for dried leaf andtwig tissues stored .53 months (cf. 1.57+0.07 pg),highlighting the compounding effects of desiccationand storage duration of tissue material. Nonetheless,these variations (between fresh and dried tissues) arewithin the ranges reported for various other species thathave used either dried tissues and/or storage conditions(e.g. Smarda and Stancık 2006; Suda and Travnıcek 2006;Balao et al. 2009; Cires et al. 2009; Bainard et al. 2011).
In spite of the variation, we could still unequivocallyassign samples to the appropriate ploidy.
The use of the external tissues of dried twigs inFCM analysis of woody plants is new. The only pre-vious FCM use of twigs employed decorticated moistwinter twigs of Icelandic birch species (Betula nana andB. pubescens; Anamthawat-Jonsson et al. 2010). Theuse of dried twigs enables collections in dormant seasonsand populations that are situated far from laboratoryfacilities for FCM determinations. This will open up oppor-tunities for numerous other understudied dryland acaciasand woody species.
DNA ploidy variation, diversity and distribution
To the best of our knowledge, this is the highest polyploidseries reported for A. senegal. Acacia tortilis, which alsohas a diploid chromosome count of 2n ¼ 2x ¼ 26, isreported to be 2x, 3x, 4x and 8x (e.g. Oballa and Olng’otie1993; Bukhari 1997b, c; El Ferchichi Ouarda et al. 2009),and the Australian acacia, A. dealbata (2x, 3x and 4x,Blakesley et al. 2002). However, unlike A. senegal, otherstudied African acacias, namely A. tortilis and A. nilotica,appear to be predominantly polyploids (Bennett andLeitch 2012). Our results report populations of mixedploidy in the species for the first time. Rangewidedetermination of DNA ploidy in A. senegal found diploids,triploids, tetraploids and a hexaploid including somepopulations with multiple ploidy levels (2x + 4x, 2x + 3xand 2x + 6x). Diploids were the most common and wide-spread, occurring throughout the range (Fig. 2). Tetra-ploids constituted 17.8 % of the samples analysed, andtogether with the rare triploids and hexaploid, theywere only found in the northern range and only withvar. senegal, mostly in the Sudano-Sahelian regionsof central and west Africa. The east African region,represented by the three common varieties (vars.senegal, kerensis and leiorhachis), had relatively highersampling intensity than the other regions. In this region,sampled populations immediately south of the Equatorwere all diploids. Further south (South Africa andNamibia), localities were represented by several singleherbarium specimens of vars. rostrata and leiorhachis,and were also all diploids. Thus, our results suggest thatif polyploids are present in the southern range, they arelikely to be in low frequencies.
Origins and evolution of polyploidy in A. senegal,and range expansionThe wide spatial distribution of polyploids, coupledwith their occurrence at different levels in the phylo-genetic tree (Figs 2 and 4) suggests that polyploidshave arisen on multiple independent occasions, includingcontemporary ecological times to the present. The
12 AoB PLANTS www.aobplants.oxfordjournals.org & The Authors 2015
Odee et al. — Rangewide ploidy variation and evolution in Acacia senegal
by guest on June 28, 2016http://aobpla.oxfordjournals.org/
Dow
nloaded from
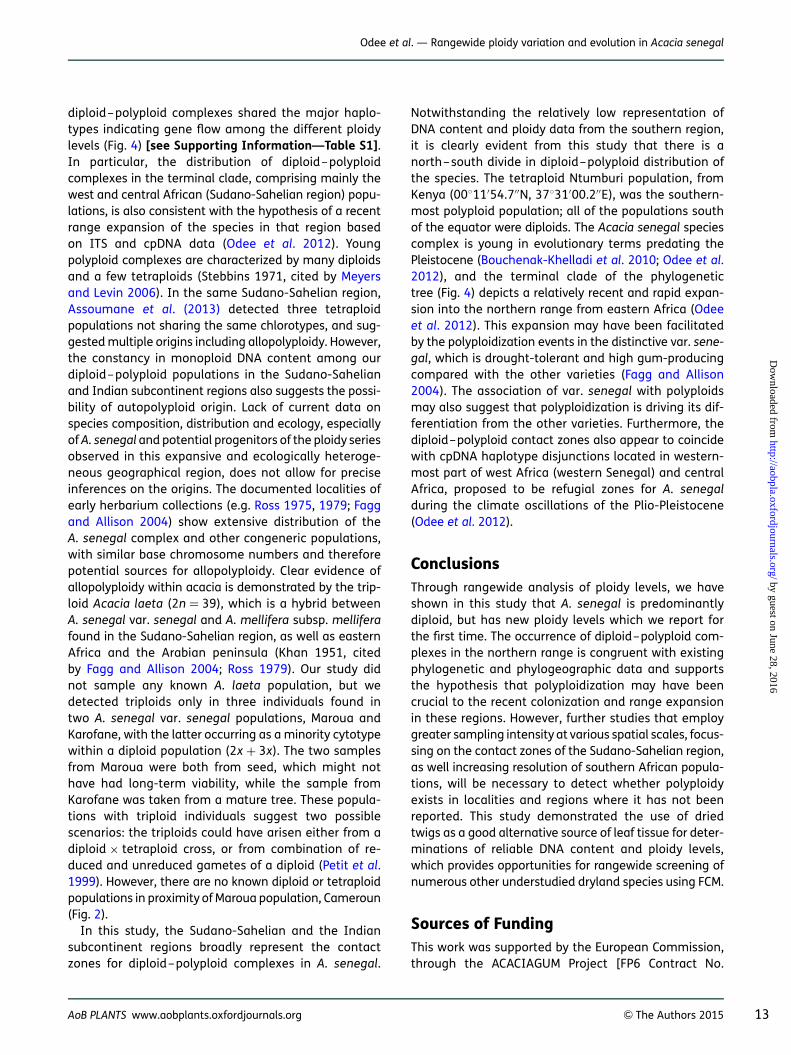
diploid–polyploid complexes shared the major haplo-types indicating gene flow among the different ploidylevels (Fig. 4) [see Supporting Information—Table S1].In particular, the distribution of diploid–polyploidcomplexes in the terminal clade, comprising mainly thewest and central African (Sudano-Sahelian region) popu-lations, is also consistent with the hypothesis of a recentrange expansion of the species in that region basedon ITS and cpDNA data (Odee et al. 2012). Youngpolyploid complexes are characterized by many diploidsand a few tetraploids (Stebbins 1971, cited by Meyersand Levin 2006). In the same Sudano-Sahelian region,Assoumane et al. (2013) detected three tetraploidpopulations not sharing the same chlorotypes, and sug-gested multiple origins including allopolyploidy. However,the constancy in monoploid DNA content among ourdiploid–polyploid populations in the Sudano-Sahelianand Indian subcontinent regions also suggests the possi-bility of autopolyploid origin. Lack of current data onspecies composition, distribution and ecology, especiallyof A. senegal and potential progenitors of the ploidy seriesobserved in this expansive and ecologically heteroge-neous geographical region, does not allow for preciseinferences on the origins. The documented localities ofearly herbarium collections (e.g. Ross 1975, 1979; Faggand Allison 2004) show extensive distribution of theA. senegal complex and other congeneric populations,with similar base chromosome numbers and thereforepotential sources for allopolyploidy. Clear evidence ofallopolyploidy within acacia is demonstrated by the trip-loid Acacia laeta (2n ¼ 39), which is a hybrid betweenA. senegal var. senegal and A. mellifera subsp. melliferafound in the Sudano-Sahelian region, as well as easternAfrica and the Arabian peninsula (Khan 1951, citedby Fagg and Allison 2004; Ross 1979). Our study didnot sample any known A. laeta population, but wedetected triploids only in three individuals found intwo A. senegal var. senegal populations, Maroua andKarofane, with the latter occurring as a minority cytotypewithin a diploid population (2x + 3x). The two samplesfrom Maroua were both from seed, which might nothave had long-term viability, while the sample fromKarofane was taken from a mature tree. These popula-tions with triploid individuals suggest two possiblescenarios: the triploids could have arisen either from adiploid × tetraploid cross, or from combination of re-duced and unreduced gametes of a diploid (Petit et al.1999). However, there are no known diploid or tetraploidpopulations in proximity of Maroua population, Cameroun(Fig. 2).
In this study, the Sudano-Sahelian and the Indiansubcontinent regions broadly represent the contactzones for diploid–polyploid complexes in A. senegal.
Notwithstanding the relatively low representation ofDNA content and ploidy data from the southern region,it is clearly evident from this study that there is anorth–south divide in diploid–polyploid distribution ofthe species. The tetraploid Ntumburi population, fromKenya (00811′54.7′′N, 37831′00.2′′E), was the southern-most polyploid population; all of the populations southof the equator were diploids. The Acacia senegal speciescomplex is young in evolutionary terms predating thePleistocene (Bouchenak-Khelladi et al. 2010; Odee et al.2012), and the terminal clade of the phylogenetictree (Fig. 4) depicts a relatively recent and rapid expan-sion into the northern range from eastern Africa (Odeeet al. 2012). This expansion may have been facilitatedby the polyploidization events in the distinctive var. sene-gal, which is drought-tolerant and high gum-producingcompared with the other varieties (Fagg and Allison2004). The association of var. senegal with polyploidsmay also suggest that polyploidization is driving its dif-ferentiation from the other varieties. Furthermore, thediploid–polyploid contact zones also appear to coincidewith cpDNA haplotype disjunctions located in western-most part of west Africa (western Senegal) and centralAfrica, proposed to be refugial zones for A. senegalduring the climate oscillations of the Plio-Pleistocene(Odee et al. 2012).
ConclusionsThrough rangewide analysis of ploidy levels, we haveshown in this study that A. senegal is predominantlydiploid, but has new ploidy levels which we report forthe first time. The occurrence of diploid–polyploid com-plexes in the northern range is congruent with existingphylogenetic and phylogeographic data and supportsthe hypothesis that polyploidization may have beencrucial to the recent colonization and range expansionin these regions. However, further studies that employgreater sampling intensity at various spatial scales, focus-sing on the contact zones of the Sudano-Sahelian region,as well increasing resolution of southern African popula-tions, will be necessary to detect whether polyploidyexists in localities and regions where it has not beenreported. This study demonstrated the use of driedtwigs as a good alternative source of leaf tissue for deter-minations of reliable DNA content and ploidy levels,which provides opportunities for rangewide screening ofnumerous other understudied dryland species using FCM.
Sources of FundingThis work was supported by the European Commission,through the ACACIAGUM Project [FP6 Contract No.
AoB PLANTS www.aobplants.oxfordjournals.org & The Authors 2015 13
Odee et al. — Rangewide ploidy variation and evolution in Acacia senegal
by guest on June 28, 2016http://aobpla.oxfordjournals.org/
Dow
nloaded from
032233]. D.W.O. was also supported by a Marie CurieFellowship [Contract MIIF-CT-2006-39216].
Contributions by the AuthorsD.W.O. and J.W. designed the experiment and performedFCM analysis; all authors participated in sample collec-tion, data analysis and writing of the manuscript. Theyall have seen and agreed to the submitted manuscript.
Conflicts of Interest StatementNone declared.
AcknowledgementsWe thank the Institut Senegalais de Recherches Agricoles(ISRA) for access to Bambey and Dahra field sites,Senegal; Aliou Faye, Mayecor Diouf and Mame Sokhna(ISRA), and John Gicheru, Milton Esitubi and CharlesOduor (KEFRI) for field assistance during sample collec-tion. We also thank Prof. Michelle van der Bank of Uni-versity of Johannesburg, Republic of South Africa, forproviding herbarium material from southern Africa, andour anonymous reviewers for their constructive com-ments. Seeds of FCM reference plant material were kindlyprovided by Prof. Dr Jaroslav Dolezel, Institute of Experi-mental Botany, Olomouc, Czech Republic. Plant materialwas imported to Scotland under licence from the ScottishAgricultural Science Agency, number PH/34/2009, andIMP/SOIL/27/2010, in accordance with the Plant Health(Scotland) Order 2005.
Supporting InformationThe following additional information is available in theonline version of this article –
Table S1. Locations of sampled Acacia senegal popula-tions, DNA content and ploidy levels analysed by FCM, andcorresponding nuclear ITS and chloroplast PCR-RFLPtrnH-psbA haplotype data derived from a previous study(Odee et al. 2012).
Table S2. Species, locations, 2C DNA content and ploidylevels (chromosome counts) of Acacia senegal fromprevious studies.
Table S3. 2C DNA content and ploidy of Acacia senegaldetermined from dried twigs, dried leaves and freshleaves, with Solanum lycopersicum ‘Stupicke polnı rane’as the internal standard and Tris.MgCl2 buffer. Driedtwigs had been stored for 41 months and dried leavesfor 2 months. Samples measured were each taken fromindividual plants, not repeat measurements on thesame plant or same extract.
Figure S1. Number of nuclei vs relative fluorescence in-tensity (FL2-A 1024 linear channel scale) obtained aftersimultaneous extraction and analysis of nuclei isolatedfrom (A) fresh twigs and (B) fresh leaves of DNA diploidAcacia senegal (Kirbou) (G1 peak) and fresh internal refer-ence standard, Solanum lycopersicum ‘Stupicke polnırane’ (2C ¼ 1.96 pg DNA), showing G0/G1 and G2/Mpeaks of the solanum cell cycle), (C) dried twigs and (D)dried leaves of DNA diploid A. senegal (Bissiga) andfresh internal solanum reference standard and (E) a com-bined extract of fresh twig and leaf of DNA diploidA. senegal (Fallatu Forest) and fresh internal solanum ref-erence standard. Horizontal bars represent the full peakwidths used for determination of full peak coefficientsof variation. Solanum and acacia samples A, B and Ewere from fresh glasshouse grown material, acacia sam-ples C and D had been stored in silica gel for 41 monthsbefore extraction and analysis.
Literature CitedAnamthawat-Jonsson K, Thorsson ÆTh, Temsch EM, Greilhuber J.
2010. Icelandic birch polyploids—the case of a perfect fit ingenome size. Journal of Botany Article ID 347254, 9 pages;doi:10.1155/2010/347254.
Assoumane A, Zoubeirou AM, Rodier-Goud M, Favreau B, Bezancon G,Verhaegen D. 2013. Highlighting the occurrence of tetraploidy inAcacia senegal (L.) Willd. and genetic variation patterns in its nat-ural range revealed by DNA microsatellite markers. Tree Genetics& Genomes 9:93–106.
Atchison E. 1948. Studies in the Leguminosae. II. Cytogeography ofAcacia (Tourn.) L. American Journal of Botany 35:651–655.
Baack EJ. 2004. Cytotype segregation on regional and microgeo-graphic scales in snow buttercups (Ranunculus adoneus: Ranun-culaceae). American Journal of Botany 91:1783–1788.
Bainard JD, Husband BC, Baldwin SJ, Fazekas AJ, Gregory TR,Newmaster SG, Kron P. 2011. The effects of rapid desiccationon estimates of plant genome size. Chromosome Research 19:825–842.
Balao F, Casimiro-Soriguer R, Talavera M, Herrera J, Talavera S. 2009.Distribution and diversity of cytotypes in Dianthus broteri asevidenced by genome size variations. Annals of Botany 104:965–973.
Bennett MD, Leitch IJ. 2012. Angiosperm DNA C-values database(release 8.0, Dec. 2012) http://www.kew.org/cvalues/ (29 January2015).
Blakesley D, Allen A, Pellny TK, Roberts AV. 2002. Natural and inducedpolyploidy in Acacia dealbata Link. and Acacia mangium Willd.Annals of Botany 90:391–398.
Bouchenak-Khelladi Y, Maurin O, Hurter J, Van der Bank M. 2010.The evolutionary history and biogeography of Mimosoideae (Le-guminosae): an emphasis on African acacias. Molecular Phylo-genetics and Evolution 57:495–508.
Bukhari YM. 1997a. A simple method of chromosome preparation forAcacia and Prosopis (Mimosaceae). Hereditas 126:195–197.
Bukhari YM. 1997b. Cytoevolution of taxa in Acacia and Prosopis(Mimosaceae). Australian Journal of Botany 45:879–891.
14 AoB PLANTS www.aobplants.oxfordjournals.org & The Authors 2015
Odee et al. — Rangewide ploidy variation and evolution in Acacia senegal
by guest on June 28, 2016http://aobpla.oxfordjournals.org/
Dow
nloaded from
Bukhari YM. 1997c. Nuclear DNA amounts in Acacia and Prosopis(Mimosaceae) and their evolutionary implications. Hereditas126:45–51.
Cannon SB, Ilut D, Farmer AD, Maki SL, May GD, Singer SR, Doyle JJ.2010. Polyploidy did not predate the evolution of nodulation in alllegumes. PLoS ONE 5:e11630.
Castro S, Loureiro J, Prochazka T, Munzbergova Z. 2012. Cytotype dis-tribution at a diploid-hexaploid contact zone in Aster amellus(Asteraceae). Annals of Botany 110:1047–1055.
Cires E, Cuesta C, Peredo EL, Revilla MA, Prieto JAF. 2009. Genome sizevariation and morphological differentiation within Ranunculusparnassifolius group (Ranunculaceae) from calcareous screes inthe northwest of Spain. Plant Systematics and Evolution 281:193–208.
Cui L, Wall PK, Leebens-Mack JH, Lindsay BG, Soltis DE, Doyle JJ,Soltis PS, Carlson JE, Arumuganathan K, Barakat A, Albert VA,Ma H, dePamphilis CW. 2006. Widespread genome duplicationsthroughout the history of flowering plants. Genome Research16:738–749.
Dolezel J, Greilhuber J, Suda J. 2007. Estimation of nuclear DNAcontent in plants using flow cytometry. Nature Protocols 2:2233–2244.
Duchoslav M, Safarova L, Jandova M. 2013. Role of adaptive and non-adaptive mechanisms forming complex patterns of genome sizevariation in six cytotypes of polyploid Allium oleraceum (Amaryl-lidaceae) on a continental scale. Annals of Botany 111:419–431.
El Ferchichi Ouarda H, Walker DJ, Khouja ML, Correal E. 2009. Diversityanalysis of Acacia tortilis (Forsk.) Hayne ssp. raddiana (Savi)Brenan (Mimosaceae) using phenotypic traits, chromosomecounting and DNA content approaches. Genetic Resources andCrop Evolution 56:1001–1010.
Fagg CW, Allison GE. 2004. Acacia senegal and the gum arabic trade.Oxford: Oxford Forestry Institute, Department of Plant Sciences,University of Oxford.
Gray A, Odee D, Cavers S, Wilson J, Telford A, Grant F, Diouf M,Ochieng J, Grant H, Stott A. 2013. Does geographic origin dictateecological strategies in Acacia senegal (L.) Willd.? Evidence fromcarbon and nitrogen stable isotopes. Plant and Soil 369:479–496.
Hao G-Y, Lucero ME, Sanderson SC, Zacharias EH, Holbrook NM. 2013.Polyploidy enhances the occupation of heterogeneous environ-ments through hydraulic related trade-offs in Atriplex canescens(Chenopodiaceae). New Phytologist 197:970–978.
Husband BC, Schemske DW. 1998. Cytotype distribution at a diploid-tetraploid contact zone in Chamerion (Epilobium) angustifolium(Onagraceae). American Journal of Botany 85:1688–1694.
Jiao Y, Wickett NJ, Ayyampalayam S, Chanderbali AS, Landherr L,Ralph PE, Tomsho LP, Hu Y, Liang H, Soltis PS, Soltis DE,Clifton SW, Schlarbaum SE, Schuster SC, Ma H, Leebens-Mack J,dePamphilis CW. 2011. Ancestral polyploidy in seed plants andangiosperms. Nature 473:97–100.
Kolar F, Stech M, Travnıcek P, Rauchova J, Urfus T, Vıt P, Kubesova M,Suda J. 2009. Towards resolving the Knautia arvensis agg.(Dipsacaceae) puzzle: primary and secondary contact zonesand ploidy segregation at landscape and microgeographicscales. Annals of Botany 103:963–974.
Krejcıkova J, Sudova R, Lucanova M, Travnıcek P, Urfus T, Vıt P,Weiss-Schneeweiss H, Kolano B, Oberlander K, Dreyer LL,Suda J. 2013. High ploidy diversity and distinct patterns ofcytotype distribution in a widespread species of Oxalis in theGreater Cape Floristic Region. Annals of Botany 111:641–649.
Lavin M, Herendeen PS, Wojciechowski MF. 2005. Evolutionary ratesanalysis of Leguminosae implicates a rapid diversification oflineages during the tertiary. Systematic Biology 54:575–594.
Lewis G, Schrire B, Mackinder B, Lock M, eds. 2005. Legumes of theworld. London: Royal Botanic Gardens Kew.
Manzaneda AJ, Rey PJ, Bastida JM, Weiss-Lehman C, Raskin E,Mitchell-Olds T. 2012. Environmental aridity is associated withcytotype segregation and polyploidy occurrence in Brachypo-dium distachyon (Poaceae). New Phytologist 193:797–805.
Mendonca MAC, Carvalho CR, Clarindo WR. 2010. DNA content differ-ences between male and female chicken (Gallus gallus domesticus)nuclei and Z and W chromosomes resolved by image cytometry.Journal of Histochemistry and Cytochemistry 58:229–235.
Meyers LA, Levin DA. 2006. On the abundance of polyploids in flower-ing plants. Evolution 60:1198–1206.
Oballa PO, Olng’otie PAS. 1993. Chromosome numbers in two AfricanAcacia species. Kew Bulletin 49:107–113.
Odee DW, Wilson J, Cavers S. 2011. Prospects for genetic improve-ment of Acacia senegal: can molecular approaches deliver bettergum yield and quality? In: Kennedy JF, Philips GO, Williams PA,eds. Gum Arabic. Cambridge: Royal Society of Chemistry, 99–109.
Odee DW, Telford A, Wilson J, Gaye A, Cavers S. 2012. Plio-Pleistocene history and phylogeography of Acacia senegal indry woodlands and savannahs of sub-Saharan tropical Africa:evidence of early colonisation and recent range expansion.Heredity 109:372–382.
Omondi SF, Kireger E, Dangasuk OG, Chikamai B, Odee DW, Cavers S,Khasa DP. 2010. Genetic diversity and population structure ofAcacia senegal (L) Willd. in Kenya. Tropical Plant Biology 3:59–70.
Otto SP, Whitton J. 2000. Polyploid incidence and evolution. AnnualReview of Genetics 34:401–437.
Peirson JA, Reznicek AA, Semple JC. 2012. Polyploidy, infraspecificcytotype variation, and speciation in Goldenrods: The cytogeo-graphy of Solidago subsect. Humiles (Asteraceae) in NorthAmerica. Taxon 61:197–210.
Petit C, Bretagnolle F, Felber F. 1999. Evolutionary consequences ofdiploid-polyploid hybrid zones in wild species. Trends in Ecologyand Evolution 14:306–311.
Richardson JE, Pennington RT, Pennington TD, Hollingsworth PM.2001. Rapid diversification of a species-rich genus of neotropicalrain forest trees. Science 293:2242–2245.
Robertson A, Rich TCG, Allen AM, Houston L, Roberts C, Bridle JR,Harris SA, Hiscock SJ. 2010. Hybridization and polyploidy as dri-vers of continuing evolution and speciation in Sorbus. MolecularEcology 19:1675–1690.
Ross JH. 1975. The Acacia senegal complex. Bothalia 11:453–462.
Ross JH. 1979. A conspectus of the African Acacia species. Memoirsof the Botanical Survey of South Africa 44:1–155.
Sliwinska E, Zielinska E, Jedrzejczik I. 2005. Are seeds suitable forflow cytometric estimation of plant genome size? CytometryPart A 64A:72–79.
Smarda P, Stancık D. 2006. Ploidy level variability in South Americanfescues (Festuca L., Poaceae): use of flow cytometry in up to51
2-year-old caryopses and herbarium specimens. Plant Biology8:73–80.
Soltis DE, Albert VA, Leebens-Mack J, Bell CD, Paterson AH, Zheng C,Sankoff D, de Pamphilis CW, Wall PK, Soltis PS. 2009. Polyploidyand angiosperm diversification. American Journal of Botany 96:336–348.
AoB PLANTS www.aobplants.oxfordjournals.org & The Authors 2015 15
Odee et al. — Rangewide ploidy variation and evolution in Acacia senegal
by guest on June 28, 2016http://aobpla.oxfordjournals.org/
Dow
nloaded from
Sprent JI, Odee DW, Dakora FD. 2010. African legumes: a vital but under-utilized resource. Journal of Experimental Botany 61:1257–1265.
Steussy TF, Weiss-Schneeweiss H, Keil DJ. 2004. Diploid and polyploidcytotype distribution in Melampodium cinereum and M. leucanthum(Asteraceae, Heliantheae). American Journal of Botany 91:889–898.
Suda J, Travnıcek P. 2006. Reliable DNA ploidy determination in dehy-drated tissues of vascular plants by DAPI flow cytometry—newprospects for plant research. Cytometry Part A 69A:273–280.
Thompson JD, Lumaret R. 1992. The evolutionary dynamics ofpolyploid plants: origins, establishment and persistence. Trendsin Ecology and Evolution 7:302–307.
Whittemore AT, Olsen RT. 2011. Ulmus americana (Ulmaceae) is apolyploid complex. American Journal of Botany 98:754–760.
Wood TE, Takebayashi N, Barker MS, Mayrose I, Greenspoon PB,Rieseberg LH. 2009. The frequency of polyploid speciation invascular plants. Proceedings of the National Academy of Sciencesof the USA 106:13875–13879.
16 AoB PLANTS www.aobplants.oxfordjournals.org & The Authors 2015
Odee et al. — Rangewide ploidy variation and evolution in Acacia senegal
by guest on June 28, 2016http://aobpla.oxfordjournals.org/
Dow
nloaded from
Copyright © 2022 FDOKUMEN