COVID-19 Pandemic: Health & Safety Strategy A Plantation ...
Upload
independentCategory
view
0download
0
Influence of soil and organic residue management onbiomass and biodiversity of understory vegetation
in a Eucalyptus globulus Labill. plantation
A. Fabiao*, M.C. Martins, C. Cerveira, C. Santos,M. Lousa, M. Madeira, A. Correia
Instituto Superior de Agronomia, Tapada da Ajuda, P-1349-017 Lisboa, Portugal
Abstract
The objective of this study was to assess the effect of different options of soil preparation and management of harvesting debris on
biodiversity and biomass of understory vegetation in plantations of Eucalyptus globulus of Central Portugal. The experiment
consisted of six treatments in a replanted area and four treatments in a coppice area with five replicates, following a randomised
block design. Surveys of vegetation were performed for 6 years. The proportion of soil cover by plant species was estimated and the
Shannon–Wiener diversity and equitability indexes determined for each treatment and year. After the 2nd year, the understory
vegetation was randomly sampled for above-ground biomass determination. Within the planted area, the removal of slash without
soil preparation induced the highest number of species during the experimental period. A similar trend was observed in the coppice
area, but less regularly. Significant differences in the proportion of soil cover only occurred within the planted area in the first year,
when slash removal without soil preparation induced the highest understory cover. Species diversity was not clearly affected by
treatments: significant differences only occurred occasionally and were apparently related to differences in the number of species.
Therefore, differences in the equitability index between treatments never were significant. Removal of slash without soil
disturbance and broadcast of slash over the soil usually shared the highest biodiversity. Differences between treatments in the
amount of understory biomass were never statistically significant during the experimental period. Tendency for a negative influence
of soil mobilisation on the amount of understory biomass was observed within the planted area, as well as a similar effect of the
treatments consisting of broadcast of slash over the soil surface in the coppice area. In parallel to tree development and canopy
closure biomass of that vegetation along the study period was reduced, especially in the planted area.
# 2002 Elsevier Science B.V. All rights reserved.
Keywords: Biodiversity; Biomass; Equitability; Eucalyptus plantations; Site preparation; Understory
1. Introduction
The plantation of fast growing forest tree species
has usually been established in Portugal following
intensive site preparation, which causes deep soil dis-
turbance (with variable depths according to site char-
acteristics) and the destruction of the existing natural
vegetation (Alves, 1988). These techniques may sig-
nificantly reduce the amount of soil organic matter
(Madeira et al., 1989), and may affect the soil water
holding capacity. Planting of a fast growing tree spe-
cies may have a negative effect on the reestablishment
Forest Ecology and Management 171 (2002) 87–100
* Corresponding author. Tel.: þ351-21-365-3488;
fax: þ351-21-364-5000.
E-mail address: [email protected] (A. Fabiao).
0378-1127/02/$ – see front matter # 2002 Elsevier Science B.V. All rights reserved.
PII: S 0 3 7 8 - 1 1 2 7 ( 0 2 ) 0 0 4 6 3 - 2

of natural vegetation in the understory (Alves et al.,
1990). Frequently, understory species are good com-
petitors for the fast growing tree seedlings (Alves et al.,
1990; Smith et al., 1997).
Coppicing of forest tree plantations is almost
always performed with the use of heavy machinery
for the extraction of timber from the stand, driven by
the need to increase efficiency by reducing operation
costs. The use of heavy machinery may significantly
increase soil compaction, mainly through alterations
of the soil porosity (Lenhard, 1986). The displacement
of boles and the heavy accumulation of slash on soil
surface may also have an important negative effect on
the reestablishment and survival of the understory
vegetation (Smith et al., 1997). The consequences
resulting from reduction in understory on ecosystem
functions have been poorly studied.
After harvesting, slash may be removed from the
site to prevent fire hazard and to ease the execution of
operations during the growing stages of a stand (Smith
et al., 1997). Due to the exportation and displacement
of nutrients contained in plant biomass a negative
effect on site fertility may occur (Nyland et al.,
1979; Abbott and Crossley, 1982; Burger and Prichett,
1984; Smith et al., 1997). This may also be unfavour-
able to the reestablishment of understory vegetation
and in some situations even to the development of the
tree stratum (Smethurst and Nambiar, 1989; Emmett
et al., 1991).
Therefore, fast growing forest tree plantations—
and, in particular, those of Eucalyptus globulus Labill.
in the Iberian Peninsula—are usually considered as
having less understory vegetation than other types of
forest stands or other kinds of vegetation cover (Rosa
et al., 1986; Bernaldez et al., 1989; Alves et al., 1990).
The judgement of value on this fact is not, however,
consensual. The presence of natural vegetation is not
always desirable during the early growth stages of
planted forest seedlings due to competition for water
and nutrients, especially where prolonged seasonal
water stress is expected (Nyland, 1996; Smith et al.,
1997). On the other hand, the maintenance of the
understory plant cover guarantees protection against
soil erosion when the stand canopy is not yet closed,
and the understory contributes to the nutrient cycles
and to the stability of soil aggregation (Tisdall and
Oades, 1982). In addition, the natural plant cover
protects young seedlings against wind and frost (Smith
et al., 1997) and increases the landscape and environ-
mental value of forested areas (Crowe, 1966, 1978;
Forestry Commission, 1994). Moreover, the biodiver-
sity of understory vegetation in intensively managed
forest plantations may be an indicator for the preser-
vation of overall biodiversity and of ecological sus-
tainability (Bengtsson et al., 2000).
Within the above-mentioned context, it is of utmost
importance to identify the effects on the understory
vegetation of different methods of slash management
and soil preparation at outplanting. In addition, the
effects of slash disposal after coppice on subsequent
understory vegetation development are poorly under-
stood, recommending further research on the impact
of alternative options of organic matter management.
The aim of this study was therefore to evaluate the
effect of slash management alternatives (both in newly
established and coppice plantations) and soil prepara-
tion techniques (in new plantations) on biomass and
species diversity of understory vegetation in planta-
tions of E. globulus intensively established and man-
aged in Central Portugal. Preliminary results on
biodiversity during the early growth stage (1–3 years)
have already been published elsewhere (Cerveira et al.,
1999), and suggest a positive effect of slash disposal,
and absence or low intensity of soil disturbance, on
understory species richness.
2. Methods and materials
2.1. Site characteristics
The experiment was installed at the end of March
1993 in an E. globulus plantation at Quinta do Fur-
adouro (398200N, 98130W, 30 m.a.s.l.), in West Central
Portugal, ca. 10 km from the Atlantic Ocean. After
coppice of a previous first rotation eucalyptus planta-
tion, the stumps were killed with a systemic herbicide
in part of the area (planted area) to install a new stand
with eucalyptus seedlings from a single clone prove-
nance. In the remaining area, the stumps were allowed
to sprout and regenerate to form a new stand (coppice
area). In both areas, the tree density was kept at
approximately 1111 ha�1 (3 m � 3 m spacing). In
the planted area, each seedling was supplied at out-
planting with ca. 100 g of a fertiliser containing 14%
N, 16% P and 17% K (Jones et al., 1999).
88 A. Fabiao et al. / Forest Ecology and Management 171 (2002) 87–100

The climate of the site is of the Mediterranean
type, tempered by an oceanic influence. At the
weather survey station at Caldas da Raınha, ca.
12 km away from the site and 70 m.a.s.l., the mean
annual temperature averages 15.2 8C, ranging from a
monthly mean of 10.4 8C in January to 19.8 8C in
August. The occurrence of minimum temperatures
below 0 8C is occasional. Mean annual rainfall is
607 mm, but less than 10% occurs between May
and September. An atmospheric humidity rate usually
higher than 80% in the morning, during summer, as
well as frequent summer fogs, contributes to reduce
the impacts of summer drought (Reis and Goncalves,
1981).
The geology of the experimental area is dominated
by Jurassic Sandstone, with fossil remains of plants
and dinosaurs (Zbyszewski and Almeida, 1960). The
soil is an Eutric Cambisol (FAO/UNESCO, 1988),
with a base saturation level higher than 50% in the
50 cm top soil layer and a pH in water ranging from
5.2 to 5.8 in 0–80 cm soil (Table 1).
2.2. Experimental design
The experimental design consisted of six treatments
in the planted area: (A) removal of slash without soil
preparation; (B) broadcast of slash without soil pre-
paration; (C) as in B, but depositing the woody debris
between the plantation rows; (D) incorporation of
slash into the soil by harrowing (�20 cm depth);
(E) removal of slash followed by harrowing; and
(F) as D followed by deep soil preparation with a
ripper (�50 cm depth).
In the coppice area, the experimental design con-
sisted only of treatments A–D, since treatments E and
F were considered as related to the establishment of
new stands and therefore not pertinent within the
context of coppice management. Within this area,
the sprouts were thinned ca. 3 years after clear-cut
and left on the site in all the treatments. This is the
usual practice in the management of eucalyptus cop-
pices in Portugal.
This experimental design was replicated in five
different blocks in both areas. Each replicate was a
plot of 30 m � 30 m, with a core of 36 trees
(18 m � 18 m) surrounded by two buffer tree rows
on each of the four sides.
2.3. Floristic surveys
The floristic surveys were performed by the quadrat
method (Kent and Coker, 1992) every spring, when the
majority of plant species were flowering, from 1994 to
1999, i.e. until the stand was 6 years old. A wooden
frame measuring 1 m � 1 m and divided by a string in
100 0:1 m � 0:1 m squares was randomly applied four
times in each treatment plot. All the plants inside the
frame were identified to the species level (occasion-
ally, some taxa were identified only to the genus, and
some to the subspecies level). The proportion of sur-
face cover of each species was carefully estimated and
recorded.
Eucalyptus seedlings from natural regeneration by
seed from the previous stand were observed and
recorded as understory vegetation whenever present
within the frame. A similar criterion was used for
other tree species seedlings, such as Pinus radiata
(natural regeneration from a neighbour stand), Lusi-
tanian oak (Quercus faginea ssp. broteroi, with natural
occurrence in the study area) and chestnut (Castanea
sativa, with some isolated trees present in the neigh-
bourhood).
Table 1
Soil characteristics of the experimental site at Quinta do Furadouroa
Depth
(cm)
Horizon Bulk density
(g cm�3)
Silt
(g kg�1)
Clay
(g kg�1)
Organic
C (g kg�1)
pH
(H2O)
Sbase
(cmolc kg�1)
Al
(cmolc kg�1)
ECEC
(cmolc kg�1)
P
(mg g�1)
K
(mg g�1)
0–20 Ah 1.47 23 161 8.8 5.24 1.84 1.90 3.74 8.6 120
20–40 Bw 1.52 25 198 7.3 5.19 2.06 1.73 3.79 11.4 69
40–60 C1 1.54 18 172 2.3 5.62 2.56 0.72 4.28 0.7 71
60–80 C2 1.63 11 130 1.7 5.81 1.83 0.53 2.36 0.7 61
a The values represent the average of six soil profiles excavated prior to the establishment of the experiment (from Jones et al., 1999)
(Sbase—sum of base cations; ECEC—effective cation exchange capacity).
A. Fabiao et al. / Forest Ecology and Management 171 (2002) 87–100 89

2.4. Assessment of understory biomass
A wooden frame measuring 0:5 m � 0:5 m was
randomly applied four times in each treatment plot,
every spring from 1995 to 1999 (i.e. 2nd to 6th year),
for above-ground biomass sampling. All the unders-
tory plants inside the frame were collected close to the
ground and packed separately in identified plastic
bags. They were immediately oven dried in the labora-
tory at 80–85 8C and weighed.
2.5. Data handling and statistical analysis
The data from floristic surveys were compiled and
organised in an Excel data-sheet (#Microsoft) and a
list of species by year and treatment plot was obtained.
The soil cover proportion of each species (including
the proportion of uncovered soil) in each treatment
plot was averaged. The Shannon–Wiener diversity
index H and equitability index J (Begon et al.,
1996) were calculated for each treatment plot using
the proportion of soil cover by each species in relation
to total plant cover and e-base logarithms. The oven-
dry weight of understory vegetation was organised in a
similar way, expressed in an area basis and integrated
for each treatment plot.
The average number of species per treatment plot,
the proportion of plant cover to total sampling area,
the Shannon–Wiener diversity and equitability
indexes and the total understory biomass were statis-
tically compared between treatments. The SAS-Sys-
tem for Windows, version 6, software SAS/STAT
(SAS Institute, 1989) was utilised for those compar-
isons. The normality of variance was verified by the
Kolmogorov–Smirnov test and the homogeneity was
verified through graphics of residuals (studentised
residuals � predicted values) to analyse the homose-
dasticity of residuals and their normality. The demon-
strative graphics are not shown here. Whenever the
normality and homogeneity were confirmed, the com-
parisons were performed through the procedure GLM
(generalised linear model) and the Tukey test. Blocks
and treatments were considered as the independent
variables and the average number of species, propor-
tion of soil cover, diversity and equitability indexes,
and biomass, the dependent variables. When variance
was not normal and/or the homogeneity of residuals
was not confirmed, the NPAR1WAY procedure of the
same software was used and the averages were com-
pared through the Kruskal–Wallis test. The signifi-
cance level of 0.05 was utilised in all the statistical
analysis of data. Homologous treatments of planted
Table 2
Average number of understory species in various treatment plots in the planted and coppice areasa
Years Treatments
A B C D E F
Planted area
1994 13.4a 9.0a,b 10.0a,b 10.4a,b 10.4a,b 7.6b
1995 9.4 6.8 7.4 7.4 7.6 6.6
1996 9.0 7.6 8.2 7.0 7.6 8.8
1997 14.4 10.6 10.8 10.4 12.0 11.6
1998 16.2 12.4 11.6 10.8 16.2 12.0
1999 9.0 7.4 9.0 6.2 7.8 6.2
Coppice area
1994 12.6a 6.4b 6.6b 9.6a,b – –
1995 8.0a 4.6b 5.6a,b 5.4b – –
1996 7.6a,b 3.8c 4.8b,c 8.2a,b – –
1997 13.8 12.4 10.0 9.2 – –
1998 14.6 11.2 12.4 11.6 – –
1999 11.4a 9.8a,b 8.6b 10.4a,b – –
a The values followed by different characters in the same line were statistically different (P < 0:05, GLM procedure and Tukey test).
Treatments are: (A) removal of slash and plantation without soil disturbance; (B) broadcast disposal of slash and plantation without soil
disturbance; (C): as in B, but with woody slash concentrated between the plantation rows; (D) incorporation of slash into the soil by harrowing;
E: removal of slash followed by harrowing; F: as D followed by deep soil ripping.
90 A. Fabiao et al. / Forest Ecology and Management 171 (2002) 87–100

and coppice areas were compared using similar sta-
tistical methods.
3. Results and discussion
3.1. Number of species
The mean total number of species per treatment plot
was usually highest in the treatment A (slash removal
without generalised soil disturbance), both in planted
and coppice areas (Table 2). Within the planted area,
however, significant differences only occurred in the
first year, when treatment F (incorporation of slash
into the soil by deep ripping) had an average number
of species significantly lower than treatment A, with
the remaining treatments ranking between those two.
Within the coppice area the treatment A had a
significantly higher number of species than B and C
(broadcast of slash over the soil surface, respectively
Fig. 1. Proportion of soil covered by the three more abundant understory species during different years and in different treatments. Left:
planted area (A–F); right: coppice area (A–D). Treatments A–F are given in Table 2. HL: H. lanatus; OP: Ornithopus pinnatus; RU: R.
ulmifolius; LR: Lepidophorum repandum; CB: Conyza bonariensis; PA: P. aquilinum; AC: Agrostis curtisii; LP: Lonicera periclymenum; EG:
E. globulus; BS: Brachypodium sylvaticum; LYP: Lythrum portula; GT: Genista triacanthos; ULE: Ulex europaeus; GF: Gaudinia fragilis;
FH: F. hygrometrica; DV: Dittrichia viscosa; UM: U. minor; HH: Hedera helix; QC: Q. coccifera.
A. Fabiao et al. / Forest Ecology and Management 171 (2002) 87–100 91

without and with woody slash concentrated between
plantation rows) in the first year, and higher than
treatments B and D (incorporation of slash into the
soil by harrowing) in the second. A low value also
occurred in the 3rd year in treatment B, but the highest
number of species was observed in treatment D,
although its value was not significantly different from
that in treatment A (cf. Table 2). The treatment A kept
the highest score from the 4th to the 6th year, but
significant differences only occurred in the latter year,
when the treatment C had the lowest number of
species.
In an experiment of slash management after harvest
performed in coniferous forests of north-western Uni-
ted Sates (site characteristics and treatments described
by Zabowski et al., 2000), Scherer et al. (2000) found
little variation in the number of species among treat-
ment plots, but marked differences in species compo-
sition. The treatment consisting of slash disposal over
the soil surface had the lowest number of species 3
years after harvest and the dominant understory spe-
cies were substantially different from those in other
treatments or in non-harvested adjacent forest.
Although our experiment is hardly comparable with
that described above, due to differences in site char-
acteristics, main forest species and silvicultural tech-
niques, we found indications of a negative influence of
the presence of slash on the number of species within
the coppice area. Differences in species composition
among treatments, however, were not apparent during
the first 4 years, neither in the planted nor in the
coppice area. The proportion of understory soil cover,
not accounting for bare soil, was usually dominated
(�60 to more than 90%) in all treatments by the three
species that ranked first in the rank-abundance dia-
grams (not shown in this article), along the study
period (Fig. 1). The grass coloniser Holcus lanatus
was dominant in almost all the treatments of both
planted and coppice areas along the first 4 years,
except for treatments A, C and D of the coppice in
the 3rd year. From the 4th year onwards a moss,
Funaria hygrometrica, became one the most abundant
species in almost all the treatments of both areas,
being strongly dominant in treatments B, D and F
(planted area) and A, B and C (coppice area) in the 5th
year. In the 6th year, F. hygrometrica ranked first in
treatments B, C, D and F (planted area) and B and C
(coppice area) suggesting a relationship with the pre-
sence of slash, either distributed over the soil, or
incorporated into the topsoil by harrowing or deep
soil ripping. Its presence in treatments consisting of
slash removal (A and E) was, however, still important
and that relationship was not clear. The change in
species composition might also be a consequence of
environmental changes at the understory level due to
canopy closure after the 4th year, as discussed below.
In some treatments of both areas, woody perennials
strongly increased their relative importance during the
6th year. Genista triacanthus (treatment D of the
planted area), Ulex minor (treatments E and F of
the same area), U. europaeus (A, coppice area), Quer-
cus coccifera (A and C, coppice area) and Rubus
ulmifolius (C and D, both areas) are good examples
of such a tendency.
Bracken (Pteridium aquilinum) was the second
most abundant species in treatment D of the coppice
area in the first 2 years, and in treatment A in the 2nd
year. It dominated in the understory plant cover of A
and D during the 3rd year (when it ranked second in
treatment C), to decrease again in the 4th (Fig. 2).
Until the end of the experiment it never was within the
three most abundant species in treatment B (broadcast
of slash over the soil surface) of the coppice area,
neither an important species in the planted area (cf.
Fig. 1). Dolling (1999) studied bracken in hemiboreal
forests of southern Sweden and concluded that this
species was suppressed under closed canopy, but the
rhizomes could survive for several years. The presence
of intact rhizomes may be the key factor for its
spreading after clear-cutting or in forest clearings,
as it apparently happened in our experiment after
coppice. The proportion of soil cover by bracken in
treatment D, where this species was abundant since the
beginning, increased with time, suggesting that the
incorporation of slash into the soil by harrowing might
have positively affected its survival and subsequent
spreading. The removal of organic soil layers and the
absence of soil disturbances in treatment A also had a
positive effect on the spreading of bracken until the
3rd year, but its importance decreased after that, in
apparent agreement with the above-mentioned sup-
pression due to canopy closure.
The coppice area usually had a lower number of
understory species than the planted area, but an inverse
situation occasionally occurred in all treatments
from the 3rd year onwards. Significant differences
92 A. Fabiao et al. / Forest Ecology and Management 171 (2002) 87–100

between these areas only occurred in treatment C in
the first year and in treatment D in the 2nd and 6th
years, in the latter year with the highest number of
species in the coppice area.
The average number of species followed the same
general trend over the experimental period, irrespec-
tive of treatment or area, planted or coppice (Table 2).
This is in agreement with Moore and Allen (1999),
who stated that the richness of understory species in
forest plantations did not usually decrease as a con-
sequence of management practices, at least prior to
crown closure. Our results also suggest that the num-
ber of species present in the understory vegetation
reflected, at least partially, the scarcity or abundance
of winter and spring rainfall in different years, with the
highest scores in the rainy years and the lowest in the
dry ones. The experimental area in 1993–1994, 1995–
1996 and 1997–1998 received an amount of winter
and spring rainfall higher than the 50-year average
1941–1990, whereas 1994–1995 and 1998–1999
hardly totalled more than half that average (Francisco
Abreu, pers. commun.). Spring rainfall (March–May)
in 1995 was less than half the 50-year average. We
may speculate that the 1994–1995 drought may have
contributed to a decrease in the number of species in
the 2nd and 3rd years of the experiment, although the
latter had a high amount of rainfall. The recovery of
species richness in 1997 and 1998 was paralleled with
normal and high rainfall in 1996–1997 and 1997–
1998. The decrease in the number of species observed
in 1999, a dry year, may also be dependent on changes
due to stand development.
The results also suggest that species richness was
affected by the intensity of the initial perturbations
resulting from tree harvest, slash disposal, and/or soil
preparation (the latter mainly within the planted area).
In the planted area, the lowest number of species was
always observed in treatments consisting of incorpora-
tion of slash into the soil, both by surface harrowing
(treatment D, during the 3rd to 6th year period) and
deep ripping (treatment F, in the 1st, 2nd and 6th
years).
In the coppice area the treatment D had the highest
number of species in the 3rd year. The lowest score
only occurred in this treatment in the 4th year, when
species richness was exceptionally high in all the
treatments of both areas (probably as a consequence
of abundant rainfall in spring). On the other hand,
the treatments consisting of distribution of slash over
the soil surface usually had the lowest number of
species, and frequently differences were statistically
significant in relation to treatment A and/or D.
Fig. 2. Proportion of soil covered by bracken (P. aquilinum) in treatments of the coppice area along the experimental period. Treatments A–D
are given in Table 2.
A. Fabiao et al. / Forest Ecology and Management 171 (2002) 87–100 93
This different pattern between coppice and planted
areas may have resulted from differences in tree cover
and management techniques. Early tree growth was
faster in the coppice than in the planted area (Jones
et al., 1999), and in the former the sprouts were
thinned and abandoned over the soil in all the treat-
ments between the 3rd and 4th years.
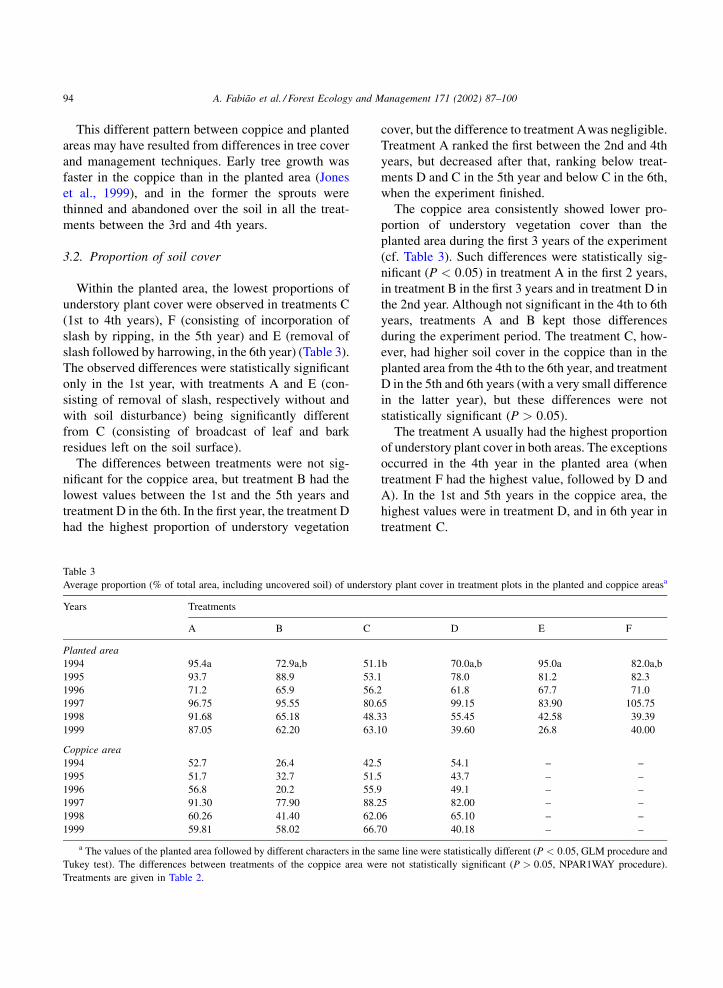
3.2. Proportion of soil cover
Within the planted area, the lowest proportions of
understory plant cover were observed in treatments C
(1st to 4th years), F (consisting of incorporation of
slash by ripping, in the 5th year) and E (removal of
slash followed by harrowing, in the 6th year) (Table 3).
The observed differences were statistically significant
only in the 1st year, with treatments A and E (con-
sisting of removal of slash, respectively without and
with soil disturbance) being significantly different
from C (consisting of broadcast of leaf and bark
residues left on the soil surface).
The differences between treatments were not sig-
nificant for the coppice area, but treatment B had the
lowest values between the 1st and the 5th years and
treatment D in the 6th. In the first year, the treatment D
had the highest proportion of understory vegetation
cover, but the difference to treatment Awas negligible.
Treatment A ranked the first between the 2nd and 4th
years, but decreased after that, ranking below treat-
ments D and C in the 5th year and below C in the 6th,
when the experiment finished.
The coppice area consistently showed lower pro-
portion of understory vegetation cover than the
planted area during the first 3 years of the experiment
(cf. Table 3). Such differences were statistically sig-
nificant (P < 0:05) in treatment A in the first 2 years,
in treatment B in the first 3 years and in treatment D in
the 2nd year. Although not significant in the 4th to 6th
years, treatments A and B kept those differences
during the experiment period. The treatment C, how-
ever, had higher soil cover in the coppice than in the
planted area from the 4th to the 6th year, and treatment
D in the 5th and 6th years (with a very small difference
in the latter year), but these differences were not
statistically significant (P > 0:05).
The treatment A usually had the highest proportion
of understory plant cover in both areas. The exceptions
occurred in the 4th year in the planted area (when
treatment F had the highest value, followed by D and
A). In the 1st and 5th years in the coppice area, the
highest values were in treatment D, and in 6th year in
treatment C.
Table 3
Average proportion (% of total area, including uncovered soil) of understory plant cover in treatment plots in the planted and coppice areasa
Years Treatments
A B C D E F
Planted area
1994 95.4a 72.9a,b 51.1b 70.0a,b 95.0a 82.0a,b
1995 93.7 88.9 53.1 78.0 81.2 82.3
1996 71.2 65.9 56.2 61.8 67.7 71.0
1997 96.75 95.55 80.65 99.15 83.90 105.75
1998 91.68 65.18 48.33 55.45 42.58 39.39
1999 87.05 62.20 63.10 39.60 26.8 40.00
Coppice area
1994 52.7 26.4 42.5 54.1 – –
1995 51.7 32.7 51.5 43.7 – –
1996 56.8 20.2 55.9 49.1 – –
1997 91.30 77.90 88.25 82.00 – –
1998 60.26 41.40 62.06 65.10 – –
1999 59.81 58.02 66.70 40.18 – –
a The values of the planted area followed by different characters in the same line were statistically different (P < 0:05, GLM procedure and
Tukey test). The differences between treatments of the coppice area were not statistically significant (P > 0:05, NPAR1WAY procedure).
Treatments are given in Table 2.
94 A. Fabiao et al. / Forest Ecology and Management 171 (2002) 87–100

Usually a decrease in understory plant cover should
be expected after canopy closure, eventually occurring
together with a change in species composition
(Nyland, 1996; Spies, 1997; Barnes et al., 1998;
Brokaw and Lent, 1999). Yorks and Dabydeen
(1999) observed a decline in understory cover follow-
ing clear-cut in hardwood mixed forests of Maryland,
USA. The canopy closure in E. globulus plantations
may result in a sudden decrease in crown depth
(increasing the extension of bare stem), and a stabi-
lisation in the leaf area index (LAI) (Pereira et al.,
1997). In our experiment, this occurred approximately
in the 4th year, as expected in E. globulus plantations
in moderate to good quality sites in Portugal (Pereira
et al., 1997). The thinning of sprouts in the coppice
area did not delay the canopy closure, since the
remaining stems had a very fast growth response
following thinning.
Despite the qualitative changes that occurred in
understory species composition between the 4th and
5th years, a clear decrease in vegetative cover with
stand development was not observed in this experi-
ment. On the contrary, almost all the treatments had
the highest cover in the 4th year, i.e. about the canopy
closure stage (Table 3). The exception was treatment
E of the planted area, which had the highest propor-
tion of plant cover in the 1st year. The plant cover
increase in the 4th year may result from either spring
rainfall above the local average, or the high contribu-
tion of F. hygrometrica and bracken to understory
cover. The small vertical growth of F. hygrometrica
contrasts with its wide horizontal spreading, leading
to the development of a very low continuous moss
stratum over the soil. Bracken, on the other hand,
formed a higher stratum that frequently allowed the
development of other herbaceous plants under its
cover.
3.3. Shannon–Wiener diversity and equitability
indexes
Within the planted area, the relationship between
treatments on Shannon–Wiener diversity index was
not clear (Table 4). Significant differences between
treatments only occurred in the 1st and 4th years. In
the 1st year, treatments D and E had higher diversity
than treatment B, with A, C and F scoring inter-
mediate values. In the 4th year, treatment A had a
significantly higher Shannon–Wiener diversity index
than treatment E, and all the other treatments ranked
between those two. In the other years, the highest
value was in treatments A (2nd year), C (3rd and 5th
years) and E (6th year), defying any attempt of
interpretation.
In the coppice area, a difference similar to that
observed in the planted area occurred in the 4th year,
but between treatments A and D. The latter ranked as
the second lowest in the planted area in the same year,
but the difference to treatment A was not statistically
significant. The differences between treatments of the
coppice area were not significant in other years.
Treatment A usually ranked the highest index values
in all years except the 3rd and 6th year, when treatment
D scored the highest Shannon–Wiener diversity
indexes. The lowest value for diversity was in treat-
ment D in the 1st, 2nd and 4th years, in treatment B in
the 3rd year, and in treatment C in the 5th and 6th year.
With the exception of treatment C and sometimes of
treatment D, there was a tendency for higher values of
the diversity index in the coppice than in the planted
area, but the difference was significant only for treat-
ment A in the 2nd year (P < 0:05). In contrast, treat-
ment C had a Shannon–Wiener diversity index
significantly higher in the planted than in the coppice
area in the 5th year (P < 0:01). Treatment C had a
higher diversity index in the planted than in the
coppice area in the 1st, 3rd and 6th years, and the
treatment D in the 1st year, but the differences were
not significant.
Most of the differences in the diversity index may
probably be related to differences in the average
number of species in each treatment and in each year.
The differences between treatments in the equitability
index (Table 5) were never significant, either in the
planted or in the coppice areas. The highest values in
the planted area were observed in treatments E (1st
and 6th years), C (2nd, 3rd and 5th years) and A (4th
year). In the coppice area, treatment A ranked the
highest value in the 1st, 2nd and 4th years, but in other
years the maximum was shared between treatments C
(3rd year), D (5th year) and B (6th year).
With the exception of treatment D in the 1st year
(not significantly different) and C in the 5th year
(P < 0:05) and 6th years (not significantly), the cop-
pice area always had higher Shannon–Wiener equit-
ability indexes than the planted area. However, the
A. Fabiao et al. / Forest Ecology and Management 171 (2002) 87–100 95

differences only were significant for treatment A in the
2nd year (P < 0:05), similar to that observed in the
diversity index.
Moore and Allen (1999) stated that, in intensively
managed forest plantations, complete removal of
canopy through harvesting produces a more diverse
flora than that occurring under a closed canopy. Site
preparation activities tend to reduce diversity in the
short term, but the duration of that impact depends on
the intensity of those practices. In our experiment, we
expected some kind of temporal trend in diversity of
understory vegetation, even if differences among
treatments were not clear or merely speculative. Both
diversity and equitability decreased from the first to
Table 4
Shannon–Wiener diversity index in treatment plots in the planted and coppice areasa
Year Treatments
B C D E F
Planted area
1994 1.082a,b 0.695b 1.210a,b 1.259a 1.254a 0.941a,b
1995 0.784 0.514 0.751 0.475 0.295 0.307
1996 0.949 0.580 1.027 0.785 0.828 0.848
1997 1.106a 0.751a,b 0.716a,b 0.679a,b 0.608b 0.766a,b
1998 1.293 1.047 1.559 1.120 1.407 0.959
1999 0.926 0.747 1.205 0.777 1.213 0.663
Coppice area
1994 1.549 1.092 1.119 1.082 – –
1995 1.171 0.745 0.900 0.740 – –
1996 1.054 0.627 0.804 1.287 – –
1997 1.138a 1.039a,b 0.787a,b 0.740b – –
1998 1.531 1.355 1.241 1.361 – –
1999 1.321 1.350 0.933 1.352 – –
a The values followed by different characters in the same line were statistically different (P < 0:05, GLM procedure and Tukey test).
Treatments are given in Table 2.
Table 5
Shannon–Wiener equitability index in treatment plots in the planted and coppice areasa
Year Treatments
A B C D E F
Planted area
1994 0.424 0.331 0.526 0.537 0.546 0.461
1995 0.359 0.275 0.384 0.231 0.156 0.159
1996 0.470 0.294 0.495 0.457 0.420 0.403
1997 0.422 0.314 0.306 0.298 0.248 0.315
1998 0.471 0.456 0.651 0.460 0.502 0.391
1999 0.438 0.345 0.550 0.416 0.599 0.377
Coppice area
1994 0.617 0.588 0.611 0.490 – –
1995 0.578 0.486 0.560 0.433 – –
1996 0.533 0.471 0.542 0.622 – –
1997 0.438 0.416 0.361 0.335 – –
1998 0.570 0.569 0.497 0.597 – –
1999 0.546 0.588 0.438 0.578 – –
a The differences between treatments were not statistically significant (P > 0:05, GLM procedure). Treatments are given in Table 2.
96 A. Fabiao et al. / Forest Ecology and Management 171 (2002) 87–100
the 2nd year and in some treatments the 3rd or the 4th
year, either in planted or in coppice area, but there was
a clear increase in the 5th year in all treatments and
areas (Tables 4 and 5). This temporal pattern does not
match with any defined temporal trend in flora com-
position. Yorks and Dabydeen (1999), who studied
understory diversity in second-growth hardwood for-
ests of Maryland, USA, also found an overall absence
of any significant trend in diversity with stand age.
Apparently, differences in environmental characteris-
tics such as aspect and the dominance of single
understory species in particular sites had greater
influence in diversity than the stand age. Dominance
of the understory cover by a small number of species
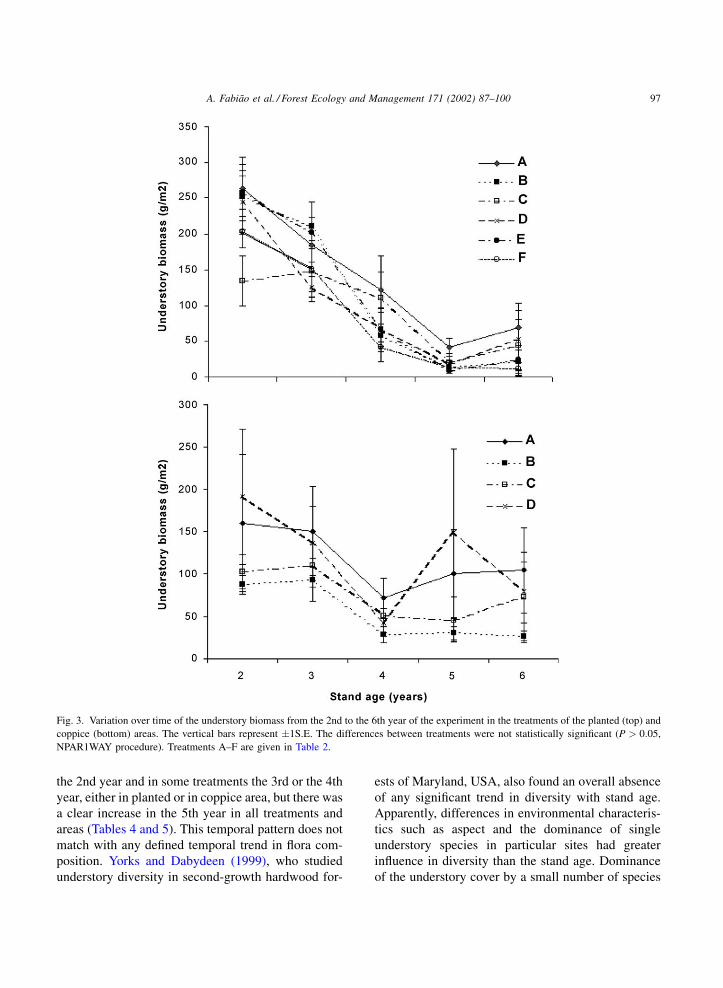
Fig. 3. Variation over time of the understory biomass from the 2nd to the 6th year of the experiment in the treatments of the planted (top) and
coppice (bottom) areas. The vertical bars represent �1S.E. The differences between treatments were not statistically significant (P > 0:05,
NPAR1WAY procedure). Treatments A–F are given in Table 2.
A. Fabiao et al. / Forest Ecology and Management 171 (2002) 87–100 97
was also observed in our study in all treatments and
both experimental areas.
Removal of slash followed by deep soil distur-
bance is probably the most common technique of site
preparation to establish eucalypt plantations in Por-
tugal. It has been demonstrated that intensive soil
preparation is not always needed for plantation suc-
cess or for wood production optimisation (Madeira
et al., 1989). The current experiment showed that tree
growth was not significantly affected by treatments
on this site (Jones et al., 1999). It may be therefore
possible to decrease the intensity of site preparation
in favourable environmental situations, for adequate
development of understory biodiversity and for wood
production.
3.4. Biomass
The understory biomass generally decreased during
the experimental period in all treatments, both in the
planted and coppice areas, but the decrease was less
regular in the latter. In most treatments, however, there
was a small increase between the 5th and the 6th year,
especially within the planted area (Fig. 3). Therefore,
the variation of understory biomass with stand age
matched the expected pattern of decline over time,
following stand development from establishment to
canopy closure. The particular development pattern of
F. hygrometrica on the proportion of understory plant
cover was not found in the biomass, due to the
negligible contribution of F. hygrometrica to the total
understory biomass.
Differences in biomass between treatments were
not significant, neither in the planted nor in the
coppice areas. Within the planted area, the lowest
biomass occurred in one of the treatments consisting
of some type of soil disturbance (D and E, by harrow-
ing, respectively with and without incorporation of
slash, and F, by ripping). The only exception was
treatment C, which scored the lowest value in the
2nd year. The highest understory biomass was always
found in treatment A (2nd and 4th to 6th years) and,
exceptionally, in treatment B (3rd year, when treat-
ment A ranked the third).
Within the coppice area the highest understory
biomass was found in treatments A (3rd, 4th and 6th
years) or D (2nd and 5th years) and the lowest
consistently in treatment B. This pattern differed
from that shown by the treatments of the planted
area, where treatment B also ranked the lowest of
treatments A–D (i.e., excluding treatments E and F),
but only during the last 3 years of the experimental
period.
The biomass data suggest that broadcast disposal
of slash over the soil surface might have inhibited the
development of understory vegetation in the coppice
area, especially when woody biomass components
(branches and twigs) were also included. A possible
reason for that inhibition might have been soil
shading by woody slash disposal. It may be specu-
lated, however, whether competition for nitrogen
between understory vegetation and decomposing
woody debris could also have an effect on the
development of understory biomass (M.C. Magal-
haes, pers. commun.). Within the planted area, as
referred above, it was soil disturbance that appar-
ently had the highest contribution to a decrease of
understory biomass, but in the last 3 years of the
experimental period treatment B also ranked the last
of treatments A–D.
4. Conclusions
The mean total number of species per treatment plot
was high when slash was removed without soil dis-
turbance, both in planted and coppice areas. This trend
was clearer for the coppice than the planted area. In the
planted area, incorporation of slash into the soil, with
or without subsoil disturbance, induced the lowest
number of species. This trend, however, was not
observed in the coppice area.
Decrease in species richness during the early stage
of stand growth followed drought conditions, both
during the year and in spring. The highest proportion
of understory plant cover was promoted when slash
was removed without soil disturbance, both in planted
and coppice areas.
The Shannon–Wiener diversity and equitability
indexes did not show a clear relationship with treat-
ments. The diversity and, especially, equitability index
were higher in the coppice than in the planted area.
Understory biomass decreased with time in the
planted area during the first 5 years of the experiment.
This decrease was not observed in the coppice area.
Broadcast distribution of slash on the soil surface
98 A. Fabiao et al. / Forest Ecology and Management 171 (2002) 87–100
negatively affected understory biomass in coppice
area. Data at the end of the experimental period
suggest that the development of shrubs may be respon-
sible for changes in the understory biomass.
Acknowledgements
The experiment was funded by EU (Project CEC
AIR-CT-92-0492), JNICT/FCT, Portugal (Projects
PDGT/FER/366/94 and PRAXIS XXI 3/3.2/FLOR/
2123/95), and PAMAF Program (Ministry of Agricul-
ture), Portugal (Project 4029/95). Maria do Ceu Mar-
tins, Claudia Cerveira and Conceicao Santos were
granted, as graduation students and/or junior scien-
tists, by JNICT/FCT. The pulp company Celulose
Beira Industrial (CELBI), S.A., landowner of Quinta
do Furadouro, supervised the management of the
experimental area. The contribution of two anon-
ymous referees to the improvement of the manuscript
is gratefully acknowledged.
References
Abbott, D.T., Crossley Jr., D.A., 1982. Woody litter decomposition
following clear-cutting. Ecology 63, 35–42.
Alves, A.A.M., 1988. Tecnicas de Producao Florestal. Fundamen-
tos, Tipificacao e Metodos, 2a edicao. Instituto Nacional de
Investigacao Cientıfica, Lisboa.
Alves, A.A.M., Pereira, J.M.S., Borges, J.G.C., Borges, G.C.,
Carvalho, P.O., David, J.S., Goncalves, J.H.C., Madeira, M.,
Onofre, N., Valente, F., 1990. Impactes Ambientais e Socio-
Economicos do Eucaliptal em Portugal. Departamento de
Engenharia Florestal, Universidade Tecnica de Lisboa, Instituto
Superior de Agronomia, Lisboa.
Barnes, B.V., Zak, D.R., Denton, S.R., Spurr, S.H., 1998. Forest
Ecology, 4th ed. Wiley, New York.
Begon, M., Harper, J.L., Townsend, C.R., 1996. Ecology, 3rd ed.
Blackwell Science, Oxford.
Bengtsson, J., Nilsson, S.G., Franc, A., Menozzi, P., 2000.
Biodiversity, disturbances, ecosystem function and manage-
ment of European forests. For. Ecol. Manage. 132, 39–50.
Bernaldez, F.G., Perez, R.P., Levassor, C., 1989. Effets des
Plantations d’Eucalyptus dans le Nord d’Espagne. Commission
des Communautes Europeennes, Brussels.
Brokaw, N.V., Lent, R.A., 1999. Vertical structure. In: Hunter Jr.,
M.L. (Ed.), Maintaining Biodiversity in Forest Ecosystems.
Cambridge University Press, Cambridge, pp. 373–399.
Burger, J.A., Prichett, W.L., 1984. Effects of clearfelling and site
preparation on nitrogen mineralization in a southern pine stand.
Soil Sci. Soc. Am. J. 48, 1432–1437.
Cerveira, C., Lousa, M., Fabiao, A., Madeira, M., Tome, M., 1999.
Influencia de tecnicas de instalacao e conducao do eucaliptal na
diversidade da vegetacao sob coberto. Revista de Ciencias
Agrarias XXII (2), 49–63.
Crowe, S., 1966. Forestry in the Landscape. Forestry Commission
Booklet No. 18. Her Majesty’s Stationery Office, London.
Crowe, S., 1978. The Landscape of Forests and Woods. Forestry
Commission Booklet No. 44. Her Majesty’s Stationery Office,
London.
Dolling, A., 1999. The vegetative spread of Pteridium aquilinum in
a hemiboreal forest—invasion or revegetation. For. Ecol.
Manage. 124, 177–184.
Emmett, B.A., Anderson, J.M., Hornung, M., 1991. Nitrogen sinus
following two intensities of harvesting in a Sitka spruce forest
(N. Wales) and the effect on the establishment of the next
cropping. For. Ecol. Manage. 41, 81–93.
FAO/UNESCO, 1988. Soil Map of the World (revised legend).
FAO, Rome.
Forestry Commission, 1994. Forest Landscape Design Guidelines.
Her Majesty’s Stationery Office, London.
Jones, H.E., Madeira, M., Herraez, L., Dighton, J., Fabiao, A.,
Gonzalez-Rio, F., Fernandez-Marcos, M., Gomez, C., Tome,
M., Feith, H., Magalhaes, M.C., Howson, G., 1999. The effect
of organic matter management on the productivity of
Eucalyptus globulus stands in Spain and Portugal: tree growth
and harvest residue decomposition in relation to site and
treatment. For. Ecol. Manage. 122, 73–86.
Kent, M., Coker, P., 1992. Vegetation Description and Analysis: A
Practical Approach. Belhaven Press, London.
Lenhard, R.J., 1986. Change in void distribution and volume during
compaction of a forest soil. Soil Sci. Soc. Am. J. 50, 462–
464.
Madeira, M., Melo, G., Alexandre, C., Steen, E., 1989. Effects of
deep ploughing and superficial disc harrowing on physical and
chemical soil properties and biomass in a new plantation of
Eucalyptus globulus. Soil Till. Res. 14, 163–175.
Moore, S.E., Allen, H.L., 1999. Plantation forestry. In: Hunter Jr.,
M.L. (Ed.), Maintaining Biodiversity in Forest Ecosystems.
Cambridge University Press, Cambridge, pp. 400–433.
Nyland, R.D., 1996. Silviculture: Concepts and Applications.
Forestry Series. McGraw-Hill, New York.
Nyland, R.D., Leaf, A.L., Bickelhaut, D.H., 1979. Litter removal
impairs growth of direct seeded Norway spruce. For. Sci. 25,
244–246.
Pereira, J.M.C., Tome, M., Carreiras, J.M.B., Tome, J.A., Pereira,
J.S., David, J.S., Fabiao, A.M.D., 1997. Leaf area estimation
from tree allometrics in Eucalyptus globulus plantations. Can.
J. For. Res. 27, 166–173.
Reis, R.M., Goncalves M.Z., 1981. Caracterizacao Climatica da
Regiao Agrıcola do Ribatejo e Oeste. O Clima de Portugal.
Fasc. XXXII. Instituto Nacional de Meteorologia e Geofısica,
Lisboa.
Rosa, M.L., Gomes, M.F., Espırito-Santo, M.D., 1986. Influencia
de factores ecologicos e fitotecnicos na Flora espontanea de
sistemas florestais da regiao de Castelo Branco. In: 1 Congresso
Florestal Nacional. Fundacao Calouste Gulbenkian, Lisboa,
pp. 255–260.
A. Fabiao et al. / Forest Ecology and Management 171 (2002) 87–100 99
SAS Institute, 1989. SAS/STAT User Guide, vol. II, Version 6, 4th
ed. SAS Institute, Cary, NC.
Scherer, G., Zabowski, D., Java, B., Everett, R., 2000. Timber
harvesting residue treatment. Part II. Understory vegetation
response. For. Ecol. Manage. 126, 35–50.
Smethurst, P.J., Nambiar, E.S.K., 1989. Role of weeds in the
management of nitrogen in a young Pinus radiata plantation.
New For. 3, 203–224.
Smith, D.M., Larson, B.C., Kelty, M.J., Ashton P.M.S., 1997. The
Practice of Silviculture: Applied Forest Ecology, 9th ed. Wiley,
New York.
Spies, T., 1997. Forest stand structure, composition and
function. In: Kohm, K.A., Franklin, J.F. (Eds.), Creating a
Forestry for the 21st Century: The Science of Ecosy-
stem Management. Island Press, Washington, DC, pp. 11–
30.
Tisdall, J.M., Oades, J.M., 1982. Organic matter and water stable
aggregates in soils. J. Soil Sci. 33, 141–163.
Yorks, T.E., Dabydeen, S., 1999. Seasonal and successional
understory vascular plant diversity in second-growth hardwood
clearcuts of western Maryland, USA. For. Ecol. Manage. 119,
217–230.
Zabowski, D., Java, B., Scherer, G., Everett, R.L., Ottmar, R., 2000.
Timber harvesting residue treatment. Part I. Responses of conifer
seedlings, soils and microclimate. For. Ecol. Manage. 126, 25–34.
Zbyszewski, G., Almeida F.M., 1960. Carta Geologica de Portugal
(Esc. 1:50 000). Notıcia Explicativa da Folha 26-D. Servicos
Geologicos de Portugal, Lisboa.
100 A. Fabiao et al. / Forest Ecology and Management 171 (2002) 87–100
Copyright © 2022 FDOKUMEN