Growth at moult and intermoult period in the Norway lobsterNephrops norvegicusfrom Galician waters
17
ICES Journal of Marine Science, 55: 924–940. 1998 Article No. jm980365 Growth at moult and intermoult period in the Norway lobster Nephrops norvegicus from Galician waters E. Gonza ´lez-Gurriara ´n, J. Freire, A. C. Farin ˜a, and A. Ferna ´ndez Gonza ´lez-Gurriara ´n, E., Freire, J., Farin ˜a, A. C., and Ferna ´ndez, A. 1998. Growth at moult and intermoult period in the Norway lobster Nephrops norvegicus from Galician waters. – ICES Journal of Marine Science, 55: 924–940. Size increase at moult, duration of the intermoult period, and moulting seasonality of the Norway lobster Nephrops norvegicus off Galicia (NW Spain) were studied in the laboratory. At a mean pre-ecdysis carapace length, CL, of 35 mm the absolute moult size increment (MI) was 2.1 &1.1 mm (mean &s.d.) in males and 1.7 &0.7 mm in females. This corresponded to percentage moult increments (PMI) of 6.2 and 5.5% in males and females, respectively. There was a significant positive linear relation between MI and CL in males but not in females. Percentage moult increments in males were constant throughout the CL range examined (21–54 mm), but in females a significant negative linear relationship was detected between lnPMI and CL. In both sexes the growth at moult decreased with increasing holding time under laboratory conditions, especially in the case of ecdyses taking place after more than 1 year in captivity. In males, MI was lower in smaller holding tanks. Duration of the intermoult period was similar in both sexes (180 &80 days in males and 174 &65 days in females), and increased significantly with increasing CL. Moulting seasonality was not marked, but two moulting seasons in autumn–winter and spring–summer were recorded. The information obtained in the present study was compared with available data for the Norway lobster in other geographical areas in the NE Atlantic and Mediterranean. ? 1998 International Council for the Exploration of the Sea Key words: Galicia, growth, intermoult period, moulting, Nephrops norvegicus. Received 6 July 1997; accepted 11 April 1998. E. Gonza ´lez-Gurriara ´n and J. Freire: Departamento de Bioloxı ´a Animal, Bioloxı ´a Vexetal e Ecoloxı ´a, Universidade de Corun ˜a, Campus da Zapateira s/n, E-15071 A Corun ˜ a, Spain. A. C. Farin ˜ a: Instituto Espan ˜ ol de Oceanografı ´a, Apartado 130, E-15080 A Corun ˜a, Spain. A. Ferna ´ndez: Instituto Espan ˜ol de Oceanografı ´a, Av. de Brasil 31, E-28080 Madrid, Spain. Correspondence to J. Freire: tel: +34 981 167000; fax: +34 981 167065; email: [email protected] Introduction In common with other crustaceans, the growth of the Norway lobster, Nephrops norvegicus, is a discontinuous process consisting of a succession of moults or ecdyses. This growth pattern has two parts (Hartnoll, 1982; Botsford, 1985): the moult size increment (MI) and the intermoult period (IP) or time interval between consecu- tive ecdyses. The growth of the Norway lobster is indeterminate and continues after the onset of sexual maturity without the occurrence of a terminal moult (Farmer, 1973). The Norway lobster supports important fisheries in the North-east Atlantic and Mediterranean and is the subject of fisheries assessments. In order to make use of analytical population models it is necessary to obtain growth models and a size-age key (ICES, 1994, 1995). Unlike many fish species which can be aged and are assessed using age-based models the fact that crusta- ceans lose all of their hard structures during the moult makes it impossible to determine their age by examining permanent calcified structures. Growth data may be collected in field or laboratory experiments, as has been done by several authors with the Norway lobster using different methods: larval culture in laboratory (Anger and Pu ¨ schel, 1986; Thompson and Ayers, 1989); holding juveniles and adults in captivity (Thomas, 1965; Farmer, 1973; Charuau and Conan, 1977; Figueiredo, 1979; Sarda ´, 1985); holding individuals ready to moult in submarine cages at sea (Charuau, 1977); mark- recapture experiments (Andersen, 1962; Chapman, 1982; Eirı ´kson, 1982; Chapman et al., 1989; Figueiredo, 1054–3139/98/050924+17 $30.00/0 ? 1998 International Council for the Exploration of the Sea
Transcript of Growth at moult and intermoult period in the Norway lobsterNephrops norvegicusfrom Galician waters
ICES Journal of Marine Science, 55: 924–940. 1998Article No. jm980365
Growth at moult and intermoult period in the Norway lobsterNephrops norvegicus from Galician waters
E. Gonzalez-Gurriaran, J. Freire, A. C. Farina, andA. Fernandez
Gonzalez-Gurriaran, E., Freire, J., Farina, A. C., and Fernandez, A. 1998. Growth atmoult and intermoult period in the Norway lobster Nephrops norvegicus from Galicianwaters. – ICES Journal of Marine Science, 55: 924–940.
Size increase at moult, duration of the intermoult period, and moulting seasonality ofthe Norway lobster Nephrops norvegicus off Galicia (NW Spain) were studied in thelaboratory. At a mean pre-ecdysis carapace length, CL, of 35 mm the absolute moultsize increment (MI) was 2.1&1.1 mm (mean&s.d.) in males and 1.7&0.7 mm infemales. This corresponded to percentage moult increments (PMI) of 6.2 and 5.5% inmales and females, respectively. There was a significant positive linear relation betweenMI and CL in males but not in females. Percentage moult increments in males wereconstant throughout the CL range examined (21–54 mm), but in females a significantnegative linear relationship was detected between lnPMI and CL. In both sexes thegrowth at moult decreased with increasing holding time under laboratory conditions,especially in the case of ecdyses taking place after more than 1 year in captivity. Inmales, MI was lower in smaller holding tanks. Duration of the intermoult period wassimilar in both sexes (180&80 days in males and 174&65 days in females), andincreased significantly with increasing CL. Moulting seasonality was not marked, buttwo moulting seasons in autumn–winter and spring–summer were recorded. Theinformation obtained in the present study was compared with available data for theNorway lobster in other geographical areas in the NE Atlantic and Mediterranean.
? 1998 International Council for the Exploration of the Sea
Key words: Galicia, growth, intermoult period, moulting, Nephrops norvegicus.
Received 6 July 1997; accepted 11 April 1998.
E. Gonzalez-Gurriaran and J. Freire: Departamento de Bioloxıa Animal, BioloxıaVexetal e Ecoloxıa, Universidade de Coruna, Campus da Zapateira s/n, E-15071 ACoruna, Spain. A. C. Farina: Instituto Espanol de Oceanografıa, Apartado 130, E-15080A Coruna, Spain. A. Fernandez: Instituto Espanol de Oceanografıa, Av. de Brasil 31,E-28080 Madrid, Spain. Correspondence to J. Freire: tel: +34 981 167000; fax:+34 981 167065; email: [email protected]
Introduction
In common with other crustaceans, the growth of theNorway lobster, Nephrops norvegicus, is a discontinuousprocess consisting of a succession of moults or ecdyses.This growth pattern has two parts (Hartnoll, 1982;Botsford, 1985): the moult size increment (MI) and theintermoult period (IP) or time interval between consecu-tive ecdyses. The growth of the Norway lobster isindeterminate and continues after the onset of sexualmaturity without the occurrence of a terminal moult(Farmer, 1973).
The Norway lobster supports important fisheries inthe North-east Atlantic and Mediterranean and is thesubject of fisheries assessments. In order to make use ofanalytical population models it is necessary to obtain
growth models and a size-age key (ICES, 1994, 1995).Unlike many fish species which can be aged and areassessed using age-based models the fact that crusta-ceans lose all of their hard structures during the moultmakes it impossible to determine their age by examiningpermanent calcified structures. Growth data may becollected in field or laboratory experiments, as has beendone by several authors with the Norway lobster usingdifferent methods: larval culture in laboratory (Angerand Puschel, 1986; Thompson and Ayers, 1989); holdingjuveniles and adults in captivity (Thomas, 1965; Farmer,1973; Charuau and Conan, 1977; Figueiredo, 1979;Sarda, 1985); holding individuals ready to moultin submarine cages at sea (Charuau, 1977); mark-recapture experiments (Andersen, 1962; Chapman, 1982;Eirıkson, 1982; Chapman et al., 1989; Figueiredo,
1054–3139/98/050924+17 $30.00/0 ? 1998 International Council for the Exploration of the Sea
1989) or combinations of these methods (Charuau andConan, 1977; Hillis, 1979; Bailey and Chapman,1983). The analysis of size frequency distributions ofthe natural populations is another alternative (Conan,1975a,b, 1978; Bailey and Chapman, 1983; Tulley et al.,1989; Castro, 1992; Mytilineou and Sarda, 1995; Tucket al., 1997), although in the Norway lobster this isquite complicated due to its low growth rate and theoverlapping of components corresponding to age ormoulting groups.
The results of the studies of growth at moult, inaddition to the information provided by more recentlyapplied methodologies, such as dating carapaces byradioisotopes (Latrouite et al., 1991; Talidec and Reyss,1993) or estimating age by the accumulation of ageingpigments or lipofuscin (Sheehy, 1990a,b; Tully, 1993;Belchier et al., 1994) may be used to corroborate othermethods and models based on the analyses of sizefrequency distributions (Castro, 1995).
The moult size increment in crustaceans is oftendescribed using the Hiatt diagram, which shows therelationship between body size at post-moult and pre-moult (Gray and Newcombe, 1938; Hiatt, 1948;Kurata, 1962; Mauchline, 1976; Somerton, 1980). Thismodel has been criticized for assuming a constantgrowth rate for successive moults (Easton and Misra,1988) and for not giving an adequate description of thevariability related to body size in growth at moult(Wainwright and Armstrong, 1993; Castro, 1995). Therelationship between absolute moult size incrementand pre-ecdysis size, in addition to the frequencyor duration of the intermoult period, gives animproved description of growth and its variability(Botsford, 1985). It can also be applied to the analysisof size frequency distributions (Caddy, 1987; Castro,1992). With the exception of Farmer (1973) andCharuau and Conan (1977), who used the Hiatt dia-gram and Charuau (1975) who relied on the relationbetween the post-ecdysis size and the number of post-larval stages, the different authors modelled growth atmoult in the Norway lobster using the relationshipbetween MI or the percentage moult increment(PMI) and pre-ecdysis size (Castro, 1992 and the refer-ences quoted earlier). The duration of the intermoultperiod is a parameter, about which there is less infor-mation since it requires laboratory experiments where aminimum of two consecutive ecdyses must be monitoredfor each individual [see Castro (1992), for a review].
This study examines the laboratory growth of theNorway lobster off Galicia (NW Spain) and analyseshow the growth components (size increase at moult andduration of the intermoult period) relate to pre-ecdysissize. Differences between males and females, the effect ofexperimental conditions, and the moulting seasonalityare also examined. This information is compared withavailable data for this species in other geographical
areas using different methodologies. The causes of thevariability in the growth estimates obtained for thisspecies are discussed.
Materials and methods
Samples and experimental conditions
A total of 325 Nephrops norvegicus (194 males and 131females), caught on the Galician continental shelf duringbottom trawl surveys in September 1982 and 1983 andMay 1984, were used in the growth studies. Threeexperiments, identified by catch year (1982, 1983, and1984) and ending on 31 July 1984, were carried out.Only individuals whose appendages showed no signs ofbreakage or damage were used.
Following capture, the lobsters were placed in oystertrays and containers with openings for water circulationheld on board in a 1 m3, open-flow tank. In 1982, theNorway lobsters were held on board ship several daysafter being caught. This was used as an acclimationperiod after which there was a selection of individualsseen to be in the best condition. The lobsters weretransported to the laboratory of the Instituto Espanol deOceanografıa in A Coruna, where they were placedindividually in two types of tanks: (1) 20 l plastic boxesarranged in terraces. The boxes were divided in themiddle with plastic mesh in order to hold two individ-uals per box (individual holding space of approximately10 l). Each section had a segment of cylindrical PVCtubing which the animal could use as a den; (2) stackableplastic net oyster trays (40 cm diameter#10 cm high)hung in a 3000 l water tank. Each tray consisted of foursections each holding only one lobster (individual hold-ing space of approximately 3 l). Table 1 gives detailedinformation on the number of individuals of each sexand the type of tank used in each experiment.
The boxes and the tank were run on open watercircuits (0.5 and 5 l min"1 respectively). The boxes werecovered with black plastic in order to reduce the daylightintensity, while the location of the tank and the layout ofthe trays already provided the appropriate conditions ofvery low light intensity. Temperature and salinity wererecorded two or three times a week. Water temperatureranged between 13.3 and 16.4)C (mean: 14.6)C) andsalinity was between 33.28 and 35.82 (mean: 34.55),following the seasonal variations in the coastal area nearthe laboratory from where the water was pumped. Freshor frozen mussels and fish (smelt or horse mackerel)were used for food. When moulting took place, theexuvia was left in the tank to be ingested as anadditional source of calcium.
Following sex determination the carapace length (CL)of each lobster was measured to the nearest 0.1 mmwhen they were brought to the laboratory. The individ-uals were checked at least three times a week for ecdyses
925Growth and intermoult period in the Norway lobster
and to add food. CL of the individuals that moultedwas measured a few days after ecdysis when thecarapace started to harden. (It was not possible tomeasure the post-ecdysis CL on 10 occasions due todeath and the fragmentation of the carapace after themoult.)
During the experimental period 74 lobsters died (52males and 22 females) due directly to accidental causes(handling, cleaning of tanks, and technical breakdownof the equipment), while 130 (86 males and 44 females)died of apparently natural causes before the experimentswere completed. Only the individuals that did not diefrom accidental causes were taken into account whendetermining laboratory survival.
Data analysis
Growth at moult was estimated for each sex based onthe moult size increment (MI=post-ecdysis CL"pre-ecdysis CL) and the percentage moult increment(PMI=MI#100/pre-ecdysis CL). Linear regressionmodels were fitted for each sex by the least squaresmethod in order to relate growth at moult (MI andlnPMI) and the duration of the intermoult period (IPand lnIP) to the pre-ecdysis CL (Mauchline, 1977;Somerton, 1980; Botsford, 1985; Wainwright andArmstrong, 1993):
Y=a+b · pre-ecdysis CL
where Y is MI, lnPMI, IP or lnIP, and a is the interceptand b is the slope of the equation.
The MI residuals (absolute difference between the MIobserved and the one predicted by regression) wererelated for males and females to the period of time atlaboratory before ecdysis took place (Tlab, days). Theanalysis of residuals indicates that this variable shouldbe included in the model and the following regressionequation was fitted accordingly (Thomas, 1965):
MI=a+b · pre-ecdysis CL+c · Tlab
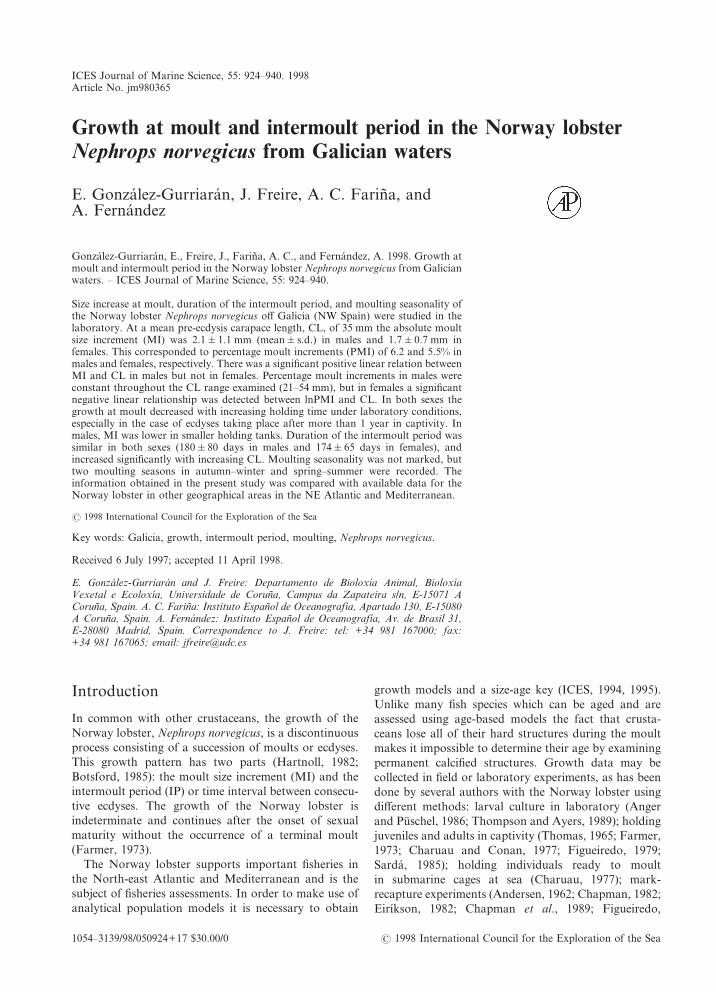
The possibility of changes in growth with maturitywas not analysed due to the limited number of juveniles(approx. CL<25 mm) held in captivity (size range ofindividuals in captivity: 21–54 mm, Fig. 1).
For a comparison of the fitting of the different modelsrelating growth at moult (in terms of MI or lnPMI) orthe duration of the intermoult period (IP or lnIP) withpre-ecdysis CL, the coefficient of variation of residuals(c.v.) was estimated for each regression (Somerton, 1980;Wainwright and Armstrong, 1993). Analyses of covari-ance (ANCOVA) were carried out using the pre-ecdysisCL as a covariable to compare growth at moult and theduration of the intermoult period between males andfemales and types of tanks (trays and boxes).
Results
General observations: size frequencydistributions, number of moults in thelaboratory, and survival
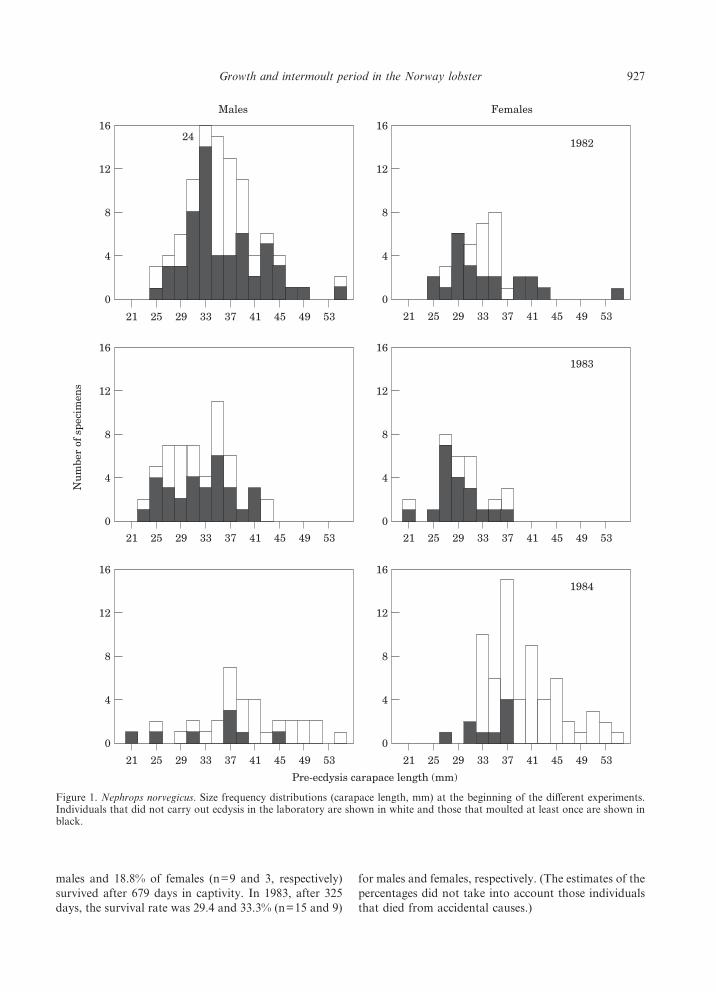
Figure 1 shows the initial size frequency distribution ofthe Norway lobsters held in the laboratory and of thosethat moulted at least once. Males and females over theentire size range underwent ecdyses in the 1982 and 1983experiments, which lasted a total of 679 and 325 days,respectively. Owing to the short duration of the 1984experiment (77 days), only a very small number of malesand females carried out the first ecdysis in the labora-tory. A total of 151 ecdyses (93 in males and 48 infemales) took place in the laboratory (Tables 1 and 2).Of these, 101 (70 males and 31 females) corresponded tothe first ecdysis after being placed in captivity, 40 (23and 17) are second ecdyses, and 9 individuals (7 and 2)underwent a third. A male caught in 1982 measuring33 mm CL achieved four ecdyses in captivity.
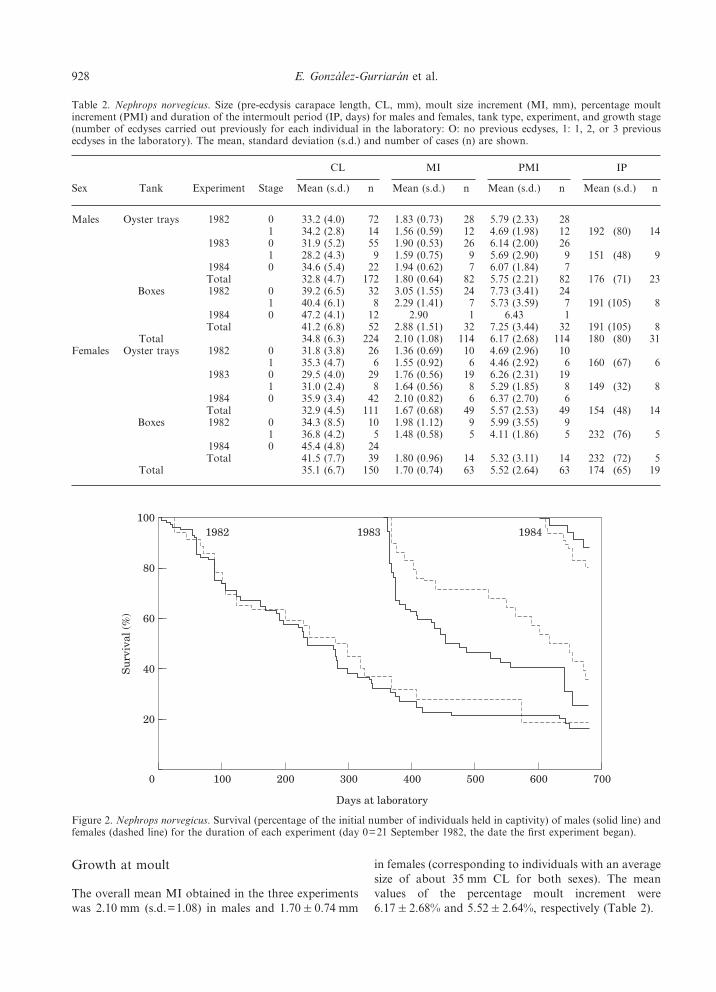
Laboratory survival in the 1982 and 1983 experimentswas slightly higher in females than in males. Despite theshort duration of the 1984 experiment, the survival washigher in males (Fig. 2). In the 1982 experiment 15.8% of
Table 1. Nephrops norvegicus. Number of individuals (males and females) used in each experiment(1982, 1983, and 1984) and tank type (oyster trays and boxes). The number of animals that carried outecdyses in the laboratory is shown in parentheses.
Experience Start/end Tank Males Females Total
1982 21/09/82 Oyster trays 72 (30) 26 (11) 98 (41)31/07/84 Boxes 33 (25) 10 (9) 43 (34)
Total 105 (55) 36 (20) 141 (75)1983 10/09/83 Oyster trays 55 (30) 29 (19) 84 (49)
31/07/841984 15/05/84 Oyster trays 22 (7) 42 (8) 64 (15)
31/07/84 Boxes 12 (1) 24 (1) 36 (2)Total 34 (8) 66 (9) 100 (17)
Total 194 (93) 131 (48) 325 (141)
926 E. Gonzalez-Gurriaran et al.
males and 18.8% of females (n=9 and 3, respectively)survived after 679 days in captivity. In 1983, after 325days, the survival rate was 29.4 and 33.3% (n=15 and 9)
for males and females, respectively. (The estimates of thepercentages did not take into account those individualsthat died from accidental causes.)
16
0
21
Pre-ecdysis carapace length (mm)
4933 41
12
8
4
2925 37 45 53
16
0
21 4933 41
12
8
4
2925 37 45 53
16
0
21
Nu
mbe
r of
spe
cim
ens
4933 41
12
8
4
2925 37 45 53
16
0
21 4933 41
12
8
4
2925 37 45 53
16
0
21 4933 41
12
8
4
2925 37 45 53
16
0
21 4933 41
12
8
4
2925 37 45 53
1984
1983
241982
FemalesMales
Figure 1. Nephrops norvegicus. Size frequency distributions (carapace length, mm) at the beginning of the different experiments.Individuals that did not carry out ecdysis in the laboratory are shown in white and those that moulted at least once are shown inblack.
927Growth and intermoult period in the Norway lobster
Growth at moult
The overall mean MI obtained in the three experimentswas 2.10 mm (s.d.=1.08) in males and 1.70&0.74 mm
in females (corresponding to individuals with an averagesize of about 35 mm CL for both sexes). The meanvalues of the percentage moult increment were6.17&2.68% and 5.52&2.64%, respectively (Table 2).
Table 2. Nephrops norvegicus. Size (pre-ecdysis carapace length, CL, mm), moult size increment (MI, mm), percentage moultincrement (PMI) and duration of the intermoult period (IP, days) for males and females, tank type, experiment, and growth stage(number of ecdyses carried out previously for each individual in the laboratory: O: no previous ecdyses, 1: 1, 2, or 3 previousecdyses in the laboratory). The mean, standard deviation (s.d.) and number of cases (n) are shown.
Sex Tank Experiment Stage
CL MI PMI IP
Mean (s.d.) n Mean (s.d.) n Mean (s.d.) n Mean (s.d.) n
Males Oyster trays 1982 0 33.2 (4.0) 72 1.83 (0.73) 28 5.79 (2.33) 281 34.2 (2.8) 14 1.56 (0.59) 12 4.69 (1.98) 12 192 (80) 14
1983 0 31.9 (5.2) 55 1.90 (0.53) 26 6.14 (2.00) 261 28.2 (4.3) 9 1.59 (0.75) 9 5.69 (2.90) 9 151 (48) 9
1984 0 34.6 (5.4) 22 1.94 (0.62) 7 6.07 (1.84) 7Total 32.8 (4.7) 172 1.80 (0.64) 82 5.75 (2.21) 82 176 (71) 23
Boxes 1982 0 39.2 (6.5) 32 3.05 (1.55) 24 7.73 (3.41) 241 40.4 (6.1) 8 2.29 (1.41) 7 5.73 (3.59) 7 191 (105) 8
1984 0 47.2 (4.1) 12 2.90 1 6.43 1Total 41.2 (6.8) 52 2.88 (1.51) 32 7.25 (3.44) 32 191 (105) 8
Total 34.8 (6.3) 224 2.10 (1.08) 114 6.17 (2.68) 114 180 (80) 31Females Oyster trays 1982 0 31.8 (3.8) 26 1.36 (0.69) 10 4.69 (2.96) 10
1 35.3 (4.7) 6 1.55 (0.92) 6 4.46 (2.92) 6 160 (67) 61983 0 29.5 (4.0) 29 1.76 (0.56) 19 6.26 (2.31) 19
1 31.0 (2.4) 8 1.64 (0.56) 8 5.29 (1.85) 8 149 (32) 81984 0 35.9 (3.4) 42 2.10 (0.82) 6 6.37 (2.70) 6Total 32.9 (4.5) 111 1.67 (0.68) 49 5.57 (2.53) 49 154 (48) 14
Boxes 1982 0 34.3 (8.5) 10 1.98 (1.12) 9 5.99 (3.55) 91 36.8 (4.2) 5 1.48 (0.58) 5 4.11 (1.86) 5 232 (76) 5
1984 0 45.4 (4.8) 24Total 41.5 (7.7) 39 1.80 (0.96) 14 5.32 (3.11) 14 232 (72) 5
Total 35.1 (6.7) 150 1.70 (0.74) 63 5.52 (2.64) 63 174 (65) 19
100
0
Days at laboratory
300 500
80
40
20
200100 400 600 700
Su
rviv
al (
%) 60
1982 1983 1984
Figure 2. Nephrops norvegicus. Survival (percentage of the initial number of individuals held in captivity) of males (solid line) andfemales (dashed line) for the duration of each experiment (day 0=21 September 1982, the date the first experiment began).
928 E. Gonzalez-Gurriaran et al.
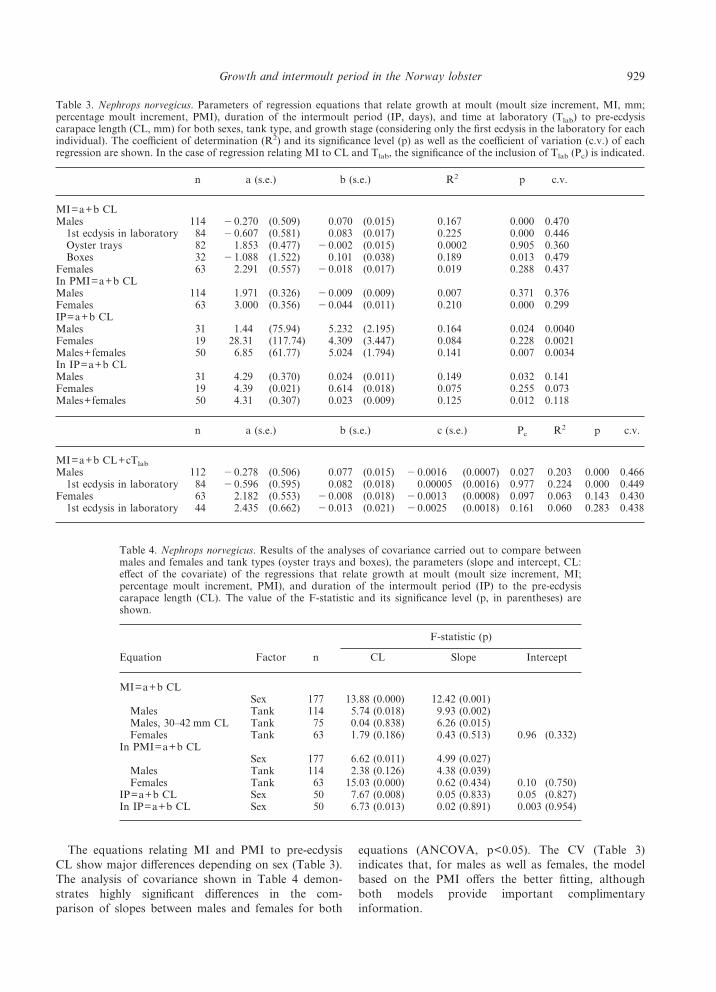
The equations relating MI and PMI to pre-ecdysisCL show major differences depending on sex (Table 3).The analysis of covariance shown in Table 4 demon-strates highly significant differences in the com-parison of slopes between males and females for both
equations (ANCOVA, p<0.05). The CV (Table 3)indicates that, for males as well as females, the modelbased on the PMI offers the better fitting, althoughboth models provide important complimentaryinformation.
Table 3. Nephrops norvegicus. Parameters of regression equations that relate growth at moult (moult size increment, MI, mm;percentage moult increment, PMI), duration of the intermoult period (IP, days), and time at laboratory (Tlab) to pre-ecdysiscarapace length (CL, mm) for both sexes, tank type, and growth stage (considering only the first ecdysis in the laboratory for eachindividual). The coefficient of determination (R2) and its significance level (p) as well as the coefficient of variation (c.v.) of eachregression are shown. In the case of regression relating MI to CL and Tlab, the significance of the inclusion of Tlab (Pc) is indicated.
n a (s.e.) b (s.e.) R2 p c.v.
MI=a+b CLMales 114 "0.270 (0.509) 0.070 (0.015) 0.167 0.000 0.470
1st ecdysis in laboratory 84 "0.607 (0.581) 0.083 (0.017) 0.225 0.000 0.446Oyster trays 82 1.853 (0.477) "0.002 (0.015) 0.0002 0.905 0.360Boxes 32 "1.088 (1.522) 0.101 (0.038) 0.189 0.013 0.479
Females 63 2.291 (0.557) "0.018 (0.017) 0.019 0.288 0.437In PMI=a+b CLMales 114 1.971 (0.326) "0.009 (0.009) 0.007 0.371 0.376Females 63 3.000 (0.356) "0.044 (0.011) 0.210 0.000 0.299IP=a+b CLMales 31 1.44 (75.94) 5.232 (2.195) 0.164 0.024 0.0040Females 19 28.31 (117.74) 4.309 (3.447) 0.084 0.228 0.0021Males+females 50 6.85 (61.77) 5.024 (1.794) 0.141 0.007 0.0034In IP=a+b CLMales 31 4.29 (0.370) 0.024 (0.011) 0.149 0.032 0.141Females 19 4.39 (0.021) 0.614 (0.018) 0.075 0.255 0.073Males+females 50 4.31 (0.307) 0.023 (0.009) 0.125 0.012 0.118
n a (s.e.) b (s.e.) c (s.e.) Pc R2 p c.v.
MI=a+b CL+cTlab
Males 112 "0.278 (0.506) 0.077 (0.015) "0.0016 (0.0007) 0.027 0.203 0.000 0.4661st ecdysis in laboratory 84 "0.596 (0.595) 0.082 (0.018) 0.00005 (0.0016) 0.977 0.224 0.000 0.449
Females 63 2.182 (0.553) "0.008 (0.018) "0.0013 (0.0008) 0.097 0.063 0.143 0.4301st ecdysis in laboratory 44 2.435 (0.662) "0.013 (0.021) "0.0025 (0.0018) 0.161 0.060 0.283 0.438
Table 4. Nephrops norvegicus. Results of the analyses of covariance carried out to compare betweenmales and females and tank types (oyster trays and boxes), the parameters (slope and intercept, CL:effect of the covariate) of the regressions that relate growth at moult (moult size increment, MI;percentage moult increment, PMI), and duration of the intermoult period (IP) to the pre-ecdysiscarapace length (CL). The value of the F-statistic and its significance level (p, in parentheses) areshown.
Equation Factor n
F-statistic (p)
CL Slope Intercept
MI=a+b CLSex 177 13.88 (0.000) 12.42 (0.001)
Males Tank 114 5.74 (0.018) 9.93 (0.002)Males, 30–42 mm CL Tank 75 0.04 (0.838) 6.26 (0.015)Females Tank 63 1.79 (0.186) 0.43 (0.513) 0.96 (0.332)
In PMI=a+b CLSex 177 6.62 (0.011) 4.99 (0.027)
Males Tank 114 2.38 (0.126) 4.38 (0.039)Females Tank 63 15.03 (0.000) 0.62 (0.434) 0.10 (0.750)
IP=a+b CL Sex 50 7.67 (0.008) 0.05 (0.833) 0.05 (0.827)In IP=a+b CL Sex 50 6.73 (0.013) 0.02 (0.891) 0.003 (0.954)
929Growth and intermoult period in the Norway lobster
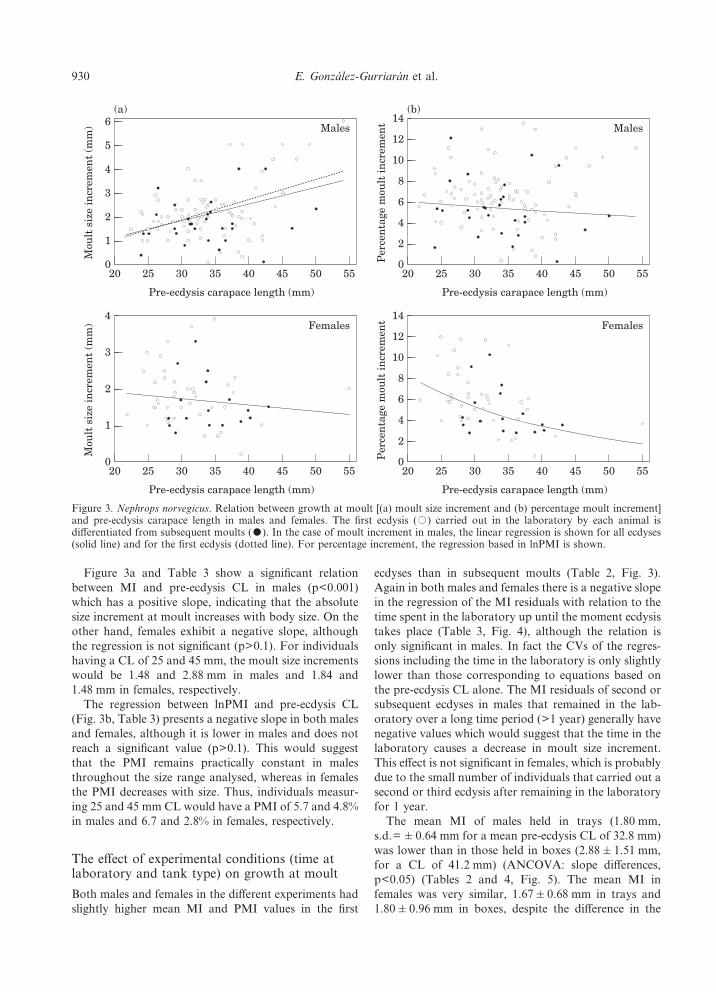
Figure 3a and Table 3 show a significant relationbetween MI and pre-ecdysis CL in males (p<0.001)which has a positive slope, indicating that the absolutesize increment at moult increases with body size. On theother hand, females exhibit a negative slope, althoughthe regression is not significant (p>0.1). For individualshaving a CL of 25 and 45 mm, the moult size incrementswould be 1.48 and 2.88 mm in males and 1.84 and1.48 mm in females, respectively.
The regression between lnPMI and pre-ecdysis CL(Fig. 3b, Table 3) presents a negative slope in both malesand females, although it is lower in males and does notreach a significant value (p>0.1). This would suggestthat the PMI remains practically constant in malesthroughout the size range analysed, whereas in femalesthe PMI decreases with size. Thus, individuals measur-ing 25 and 45 mm CL would have a PMI of 5.7 and 4.8%in males and 6.7 and 2.8% in females, respectively.
The effect of experimental conditions (time atlaboratory and tank type) on growth at moult
Both males and females in the different experiments hadslightly higher mean MI and PMI values in the first
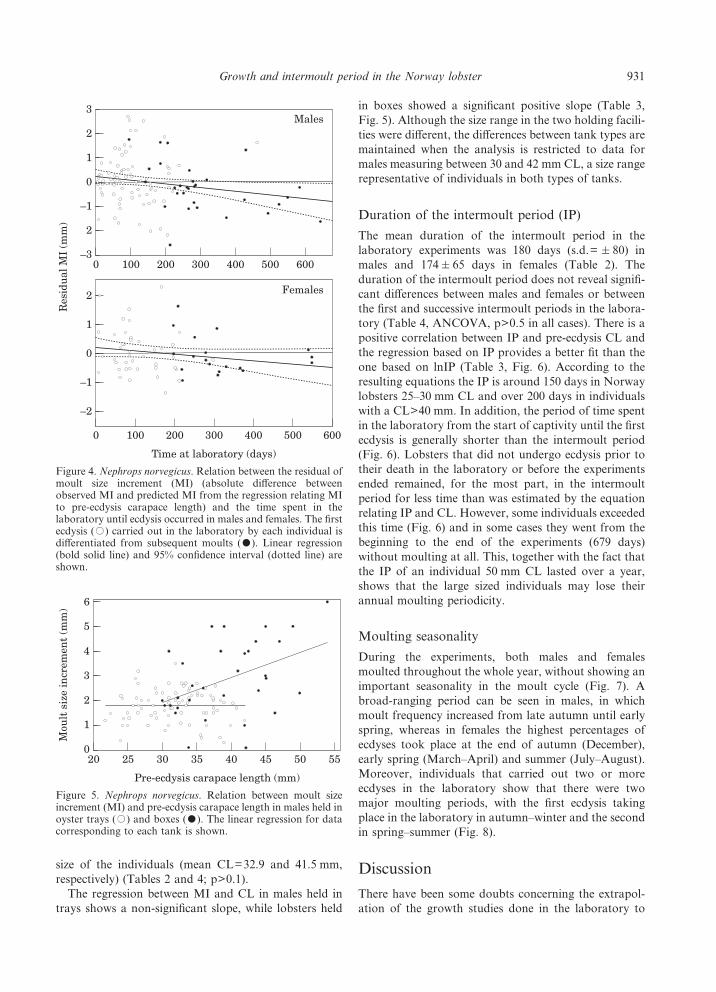
ecdyses than in subsequent moults (Table 2, Fig. 3).Again in both males and females there is a negative slopein the regression of the MI residuals with relation to thetime spent in the laboratory up until the moment ecdysistakes place (Table 3, Fig. 4), although the relation isonly significant in males. In fact the CVs of the regres-sions including the time in the laboratory is only slightlylower than those corresponding to equations based onthe pre-ecdysis CL alone. The MI residuals of second orsubsequent ecdyses in males that remained in the lab-oratory over a long time period (>1 year) generally havenegative values which would suggest that the time in thelaboratory causes a decrease in moult size increment.This effect is not significant in females, which is probablydue to the small number of individuals that carried out asecond or third ecdysis after remaining in the laboratoryfor 1 year.
The mean MI of males held in trays (1.80 mm,s.d.= &0.64 mm for a mean pre-ecdysis CL of 32.8 mm)was lower than in those held in boxes (2.88&1.51 mm,for a CL of 41.2 mm) (ANCOVA: slope differences,p<0.05) (Tables 2 and 4, Fig. 5). The mean MI infemales was very similar, 1.67&0.68 mm in trays and1.80&0.96 mm in boxes, despite the difference in the
55
4
020
Mou
lt s
ize
incr
emen
t (m
m)
40
1
3
2
25 30 35 45
Pre-ecdysis carapace length (mm)
50
Females
55
6
020
Mou
lt s
ize
incr
emen
t (m
m)
40
1
3
2
25 30 35 45
Pre-ecdysis carapace length (mm)
50
Males
5
4
(a)
55
14
020
Per
cen
tage
mou
lt in
crem
ent
40
8
2
25 30 35 45
Pre-ecdysis carapace length (mm)
50
Females
55
14
020
Per
cen
tage
mou
lt in
crem
ent
40
2
8
4
25 30 35 45
Pre-ecdysis carapace length (mm)
50
Males12
10
(b)
12
10
6
4
6
Figure 3. Nephrops norvegicus. Relation between growth at moult [(a) moult size increment and (b) percentage moult increment]and pre-ecdysis carapace length in males and females. The first ecdysis (,) carried out in the laboratory by each animal isdifferentiated from subsequent moults (-). In the case of moult increment in males, the linear regression is shown for all ecdyses(solid line) and for the first ecdysis (dotted line). For percentage increment, the regression based in lnPMI is shown.
930 E. Gonzalez-Gurriaran et al.
size of the individuals (mean CL=32.9 and 41.5 mm,respectively) (Tables 2 and 4; p>0.1).
The regression between MI and CL in males held intrays shows a non-significant slope, while lobsters held
in boxes showed a significant positive slope (Table 3,Fig. 5). Although the size range in the two holding facili-ties were different, the differences between tank types aremaintained when the analysis is restricted to data formales measuring between 30 and 42 mm CL, a size rangerepresentative of individuals in both types of tanks.
Duration of the intermoult period (IP)
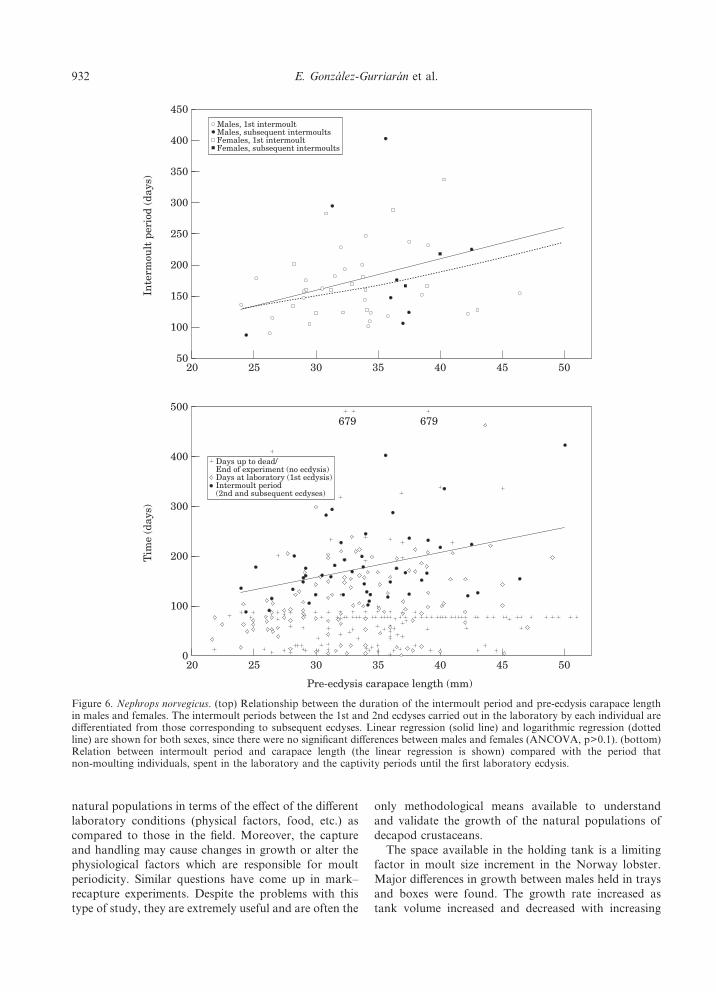
The mean duration of the intermoult period in thelaboratory experiments was 180 days (s.d.= &80) inmales and 174&65 days in females (Table 2). Theduration of the intermoult period does not reveal signifi-cant differences between males and females or betweenthe first and successive intermoult periods in the labora-tory (Table 4, ANCOVA, p>0.5 in all cases). There is apositive correlation between IP and pre-ecdysis CL andthe regression based on IP provides a better fit than theone based on lnIP (Table 3, Fig. 6). According to theresulting equations the IP is around 150 days in Norwaylobsters 25–30 mm CL and over 200 days in individualswith a CL>40 mm. In addition, the period of time spentin the laboratory from the start of captivity until the firstecdysis is generally shorter than the intermoult period(Fig. 6). Lobsters that did not undergo ecdysis prior totheir death in the laboratory or before the experimentsended remained, for the most part, in the intermoultperiod for less time than was estimated by the equationrelating IP and CL. However, some individuals exceededthis time (Fig. 6) and in some cases they went from thebeginning to the end of the experiments (679 days)without moulting at all. This, together with the fact thatthe IP of an individual 50 mm CL lasted over a year,shows that the large sized individuals may lose theirannual moulting periodicity.
Moulting seasonality
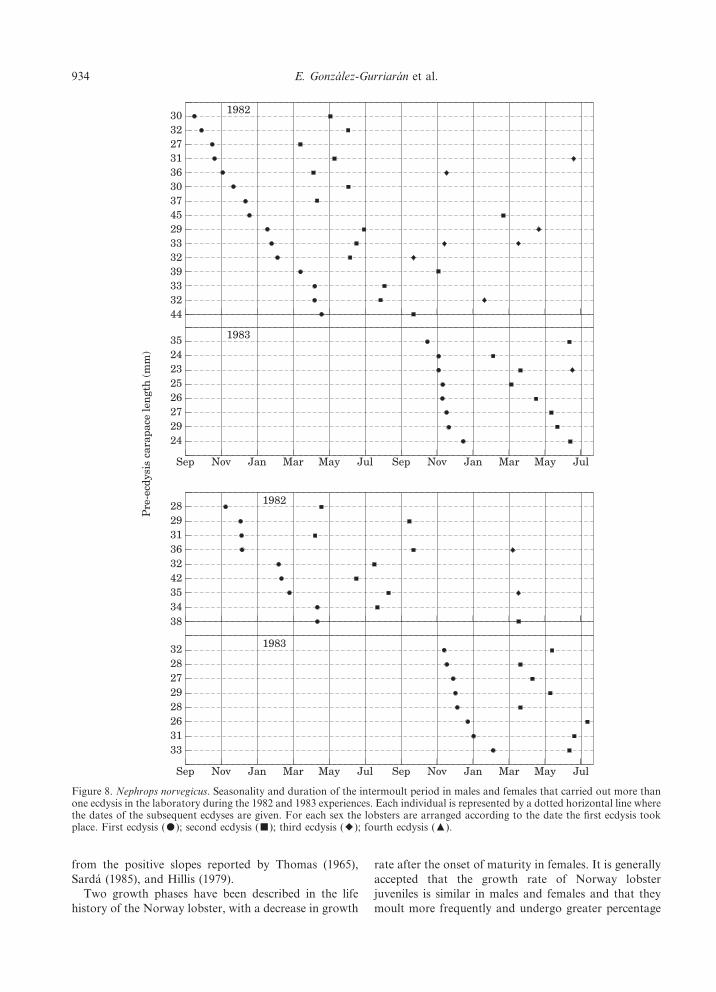
During the experiments, both males and femalesmoulted throughout the whole year, without showing animportant seasonality in the moult cycle (Fig. 7). Abroad-ranging period can be seen in males, in whichmoult frequency increased from late autumn until earlyspring, whereas in females the highest percentages ofecdyses took place at the end of autumn (December),early spring (March–April) and summer (July–August).Moreover, individuals that carried out two or moreecdyses in the laboratory show that there were twomajor moulting periods, with the first ecdysis takingplace in the laboratory in autumn–winter and the secondin spring–summer (Fig. 8).
Discussion
There have been some doubts concerning the extrapol-ation of the growth studies done in the laboratory to
600
2
0
Res
idu
al M
I (m
m)
400
–2
1
0
100 200 300 500
Time at laboratory (days)
Females
–1
600
3
0 400–3
1
0
100 200 300 500
Males
–1
2
2
Figure 4. Nephrops norvegicus. Relation between the residual ofmoult size increment (MI) (absolute difference betweenobserved MI and predicted MI from the regression relating MIto pre-ecdysis carapace length) and the time spent in thelaboratory until ecdysis occurred in males and females. The firstecdysis (,) carried out in the laboratory by each individual isdifferentiated from subsequent moults (-). Linear regression(bold solid line) and 95% confidence interval (dotted line) areshown.
55
6
20
Mou
lt s
ize
incr
emen
t (m
m)
450
5
4
25 30 35 50
Pre-ecdysis carapace length (mm)
2
3
1
40
Figure 5. Nephrops norvegicus. Relation between moult sizeincrement (MI) and pre-ecdysis carapace length in males held inoyster trays (,) and boxes (-). The linear regression for datacorresponding to each tank is shown.
931Growth and intermoult period in the Norway lobster
natural populations in terms of the effect of the differentlaboratory conditions (physical factors, food, etc.) ascompared to those in the field. Moreover, the captureand handling may cause changes in growth or alter thephysiological factors which are responsible for moultperiodicity. Similar questions have come up in mark–recapture experiments. Despite the problems with thistype of study, they are extremely useful and are often the
only methodological means available to understandand validate the growth of the natural populations ofdecapod crustaceans.
The space available in the holding tank is a limitingfactor in moult size increment in the Norway lobster.Major differences in growth between males held in traysand boxes were found. The growth rate increased astank volume increased and decreased with increasing
50
500
020
Tim
e (d
ays)
40
200
400
300
100
25 30 35 45
Pre-ecdysis carapace length (mm)
679 679
50
450
5020
Inte
rmou
lt p
erio
d (d
ays)
40
300
400
350
200
25 30 35 45
100
150
250
Days up to dead/End of experiment (no ecdysis)Days at laboratory (1st ecdysis)Intermoult period(2nd and subsequent ecdyses)
Males, 1st intermoultMales, subsequent intermoultsFemales, 1st intermoultFemales, subsequent intermoults
Figure 6. Nephrops norvegicus. (top) Relationship between the duration of the intermoult period and pre-ecdysis carapace lengthin males and females. The intermoult periods between the 1st and 2nd ecdyses carried out in the laboratory by each individual aredifferentiated from those corresponding to subsequent ecdyses. Linear regression (solid line) and logarithmic regression (dottedline) are shown for both sexes, since there were no significant differences between males and females (ANCOVA, p>0.1). (bottom)Relation between intermoult period and carapace length (the linear regression is shown) compared with the period thatnon-moulting individuals, spent in the laboratory and the captivity periods until the first laboratory ecdysis.
932 E. Gonzalez-Gurriaran et al.

time at laboratory, as has been reported for otherdecapods (Gonzalez-Gurriaran, 1981, 1985; Wilber andWilber, 1989). In the field, growth rate decreases in areashaving a high density of burrows and adult populationof Norway lobster although probably due to increasedcompetition for food or agonistic behaviour (Bailey andChapman, 1983; Chapman and Howard, 1988).
The main cause of mortality in the Norway lobstersduring the days following capture, in both individualsheld in the laboratory (Evans et al., 1994) as well asthose placed in submarine cages (Symonds and Simpson,1971; Gueguen and Charuau, 1975; Morizur et al., 1982)is most probably the damage caused by capture, whichincludes the negative physiological effects of exposure toair (Spicer et al., 1990). In this sense, the high mortalityrate seen in males in the 1983 experiment, in the daysimmediately after they were placed in captivity, could bethe result of imperceptible and undetected damage thatoccurred during capture and subsequent holding in thelaboratory, which in this case took place the day aftercapture.
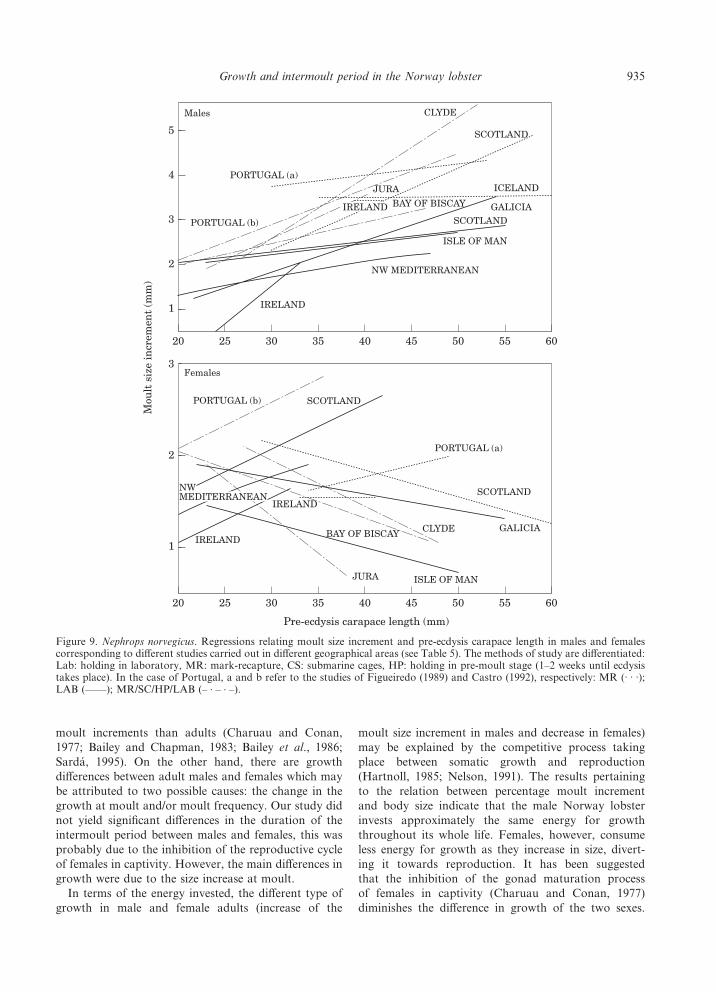
In general there is high variability in the equationsrelating size increase at moult to the pre-ecdysis size inthe Norway lobster, as reported by different authorsin different geographical areas (Fig. 9). Males have apositive slope, although in many cases the relation is notsignificant (Table 5). In studies carried out in the field(mark-recapture and submarine cages) growth in maleswas greater in the Clyde (Western Scotland) than in theSound of Jura (Western Scotland), which could be
attributed to the high availability of food in the formerarea (Bailey and Chapman, 1983). The results fromIceland and Portugal point to a relatively high moultsize increment, which was similar in the size rangesanalysed (Eirıksson, 1982; Figueiredo, 1989). Growthwas lower in the experiments done in captivity thanthose carried out in the field. These differences stay thesame even when different methodologies are applied inthe same area, as indicated by the laboratory results ofThomas (1965) and the mark-recapture data reported byChapman (1982) in the waters of Scotland. If we com-pare only the captivity studies, they have similar growthrates with the exception of Hillis (1979) in Ireland, whichis probably due to the fact that this author used a limitednumber of small sized individuals. The results reportedfor Galicia showed a greater slope than the one Thomas(1965) estimated in Scotland and Farmer (1973) in theIsle of Man, and a higher growth rate throughout theentire size range compared to Mediterranean Nephrops(Sarda, 1985).
The results for females vary widely among the differ-ent areas, particularly in the slope of the equation (Table5, Fig. 9), but in all cases they exhibit a lower growthrate than males. There is no clear variability patternbetween the studies made in the laboratory and the field,although the growth at moult decreases with body sizemore often in the studies carried out in the field. If wecompare our results with other studies made in captivity,they coincide with Farmer (1973) as far as the negativeslope in the growth model is concerned, while they differ
Sep 1982
Nov
Jan 1983
MarMay Jul
Nov
Jan 1984
MarMay
JulSep
0
Sep 1982
Per
cen
tage
ecd
ysis
Nov
Jan 1983
MarMay
JulNov
Jan 1984
MarMay
Jul
100
10
0
10
20
Sep
1984
1983
1982
0
10
0
100
10
20
1984
1983
198230
20
FemalesMales
Figure 7. Nephrops norvegicus. Moulting seasonality of males and females in each experiment carried out in laboratory. Thepercentage of ecdyses in respect to the total number of live individuals is shown.
933Growth and intermoult period in the Norway lobster
from the positive slopes reported by Thomas (1965),Sarda (1985), and Hillis (1979).
Two growth phases have been described in the lifehistory of the Norway lobster, with a decrease in growth
rate after the onset of maturity in females. It is generallyaccepted that the growth rate of Norway lobsterjuveniles is similar in males and females and that theymoult more frequently and undergo greater percentage
May
32
33
Sep
Pre
-ecd
ysis
car
apac
e le
ngt
h (
mm
)
Jul
26
28272928
31
Nov Jan Mar May Sep Nov Jan Mar Jul
1983
28
34
42
29313632
35
1982
38
May
35
24
Sep Jul
27
24232526
29
Nov Jan Mar May Sep Nov Jan Mar Jul
1983
37
32
39
45293332
33
1982
44
303631273230
Figure 8. Nephrops norvegicus. Seasonality and duration of the intermoult period in males and females that carried out more thanone ecdysis in the laboratory during the 1982 and 1983 experiences. Each individual is represented by a dotted horizontal line wherethe dates of the subsequent ecdyses are given. For each sex the lobsters are arranged according to the date the first ecdysis tookplace. First ecdysis (-); second ecdysis (/); third ecdysis (;); fourth ecdysis (4).
934 E. Gonzalez-Gurriaran et al.
moult increments than adults (Charuau and Conan,1977; Bailey and Chapman, 1983; Bailey et al., 1986;Sarda, 1995). On the other hand, there are growthdifferences between adult males and females which maybe attributed to two possible causes: the change in thegrowth at moult and/or moult frequency. Our study didnot yield significant differences in the duration of theintermoult period between males and females, this wasprobably due to the inhibition of the reproductive cycleof females in captivity. However, the main differences ingrowth were due to the size increase at moult.
In terms of the energy invested, the different type ofgrowth in male and female adults (increase of the
moult size increment in males and decrease in females)may be explained by the competitive process takingplace between somatic growth and reproduction(Hartnoll, 1985; Nelson, 1991). The results pertainingto the relation between percentage moult incrementand body size indicate that the male Norway lobsterinvests approximately the same energy for growththroughout its whole life. Females, however, consumeless energy for growth as they increase in size, divert-ing it towards reproduction. It has been suggestedthat the inhibition of the gonad maturation processof females in captivity (Charuau and Conan, 1977)diminishes the difference in growth of the two sexes.
60
3
20
Mou
lt s
ize
incr
emen
t (m
m)
45
1
25 30 35 50
Pre-ecdysis carapace length (mm)
2
40 55
PORTUGAL (b) SCOTLAND
IRELAND
BAY OF BISCAY CLYDE
ISLE OF MANJURA
IRELAND
PORTUGAL (a)
SCOTLAND
GALICIA
NWMEDITERRANEAN
60
5
20 45
1
25 30 35 50
2
40 55
PORTUGAL (b)
SCOTLAND
IRELAND BAY OF BISCAY
CLYDE
ISLE OF MAN
JURA
IRELAND
PORTUGAL (a)
SCOTLANDGALICIA
NW MEDITERRANEAN
4
3
ICELAND
Males
Females
Figure 9. Nephrops norvegicus. Regressions relating moult size increment and pre-ecdysis carapace length in males and femalescorresponding to different studies carried out in different geographical areas (see Table 5). The methods of study are differentiated:Lab: holding in laboratory, MR: mark-recapture, CS: submarine cages, HP: holding in pre-moult stage (1–2 weeks until ecdysistakes place). In the case of Portugal, a and b refer to the studies of Figueiredo (1989) and Castro (1992), respectively: MR (· · ·);LAB (——); MR/SC/HP/LAB (– · – · –).
935Growth and intermoult period in the Norway lobster
This may be the reason why some authors observefew differences in growth between males and females(Thomas, 1965; Conan, 1978; Sarda, 1985). In our
experiments, these effects are not noticeable and femalegrowth diminishes with the pre-ecdysis size. Similarresults were reported by Farmer (1973), Charuau
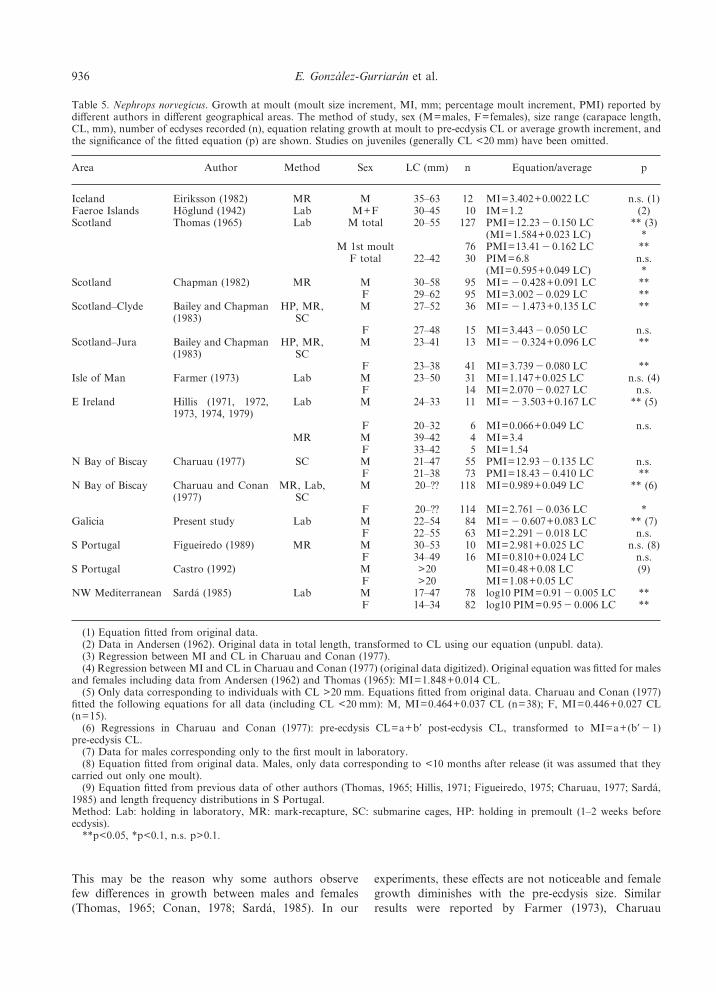
Table 5. Nephrops norvegicus. Growth at moult (moult size increment, MI, mm; percentage moult increment, PMI) reported bydifferent authors in different geographical areas. The method of study, sex (M=males, F=females), size range (carapace length,CL, mm), number of ecdyses recorded (n), equation relating growth at moult to pre-ecdysis CL or average growth increment, andthe significance of the fitted equation (p) are shown. Studies on juveniles (generally CL <20 mm) have been omitted.
Area Author Method Sex LC (mm) n Equation/average p
Iceland Eiriksson (1982) MR M 35–63 12 MI=3.402+0.0022 LC n.s. (1)Faeroe Islands Hoglund (1942) Lab M+F 30–45 10 IM=1.2 (2)Scotland Thomas (1965) Lab M total 20–55 127 PMI=12.23"0.150 LC ** (3)
(MI=1.584+0.023 LC) *M 1st moult 76 PMI=13.41"0.162 LC **
F total 22–42 30 PIM=6.8 n.s.(MI=0.595+0.049 LC) *
Scotland Chapman (1982) MR M 30–58 95 MI= "0.428+0.091 LC **F 29–62 95 MI=3.002"0.029 LC **
Scotland–Clyde Bailey and Chapman(1983)
HP, MR,SC
M 27–52 36 MI= "1.473+0.135 LC **
F 27–48 15 MI=3.443"0.050 LC n.s.Scotland–Jura Bailey and Chapman
(1983)HP, MR,
SCM 23–41 13 MI= "0.324+0.096 LC **
F 23–38 41 MI=3.739"0.080 LC **Isle of Man Farmer (1973) Lab M 23–50 31 MI=1.147+0.025 LC n.s. (4)
F 14 MI=2.070"0.027 LC n.s.E Ireland Hillis (1971, 1972,
1973, 1974, 1979)Lab M 24–33 11 MI= "3.503+0.167 LC ** (5)
F 20–32 6 MI=0.066+0.049 LC n.s.MR M 39–42 4 MI=3.4
F 33–42 5 MI=1.54N Bay of Biscay Charuau (1977) SC M 21–47 55 PMI=12.93"0.135 LC n.s.
F 21–38 73 PMI=18.43"0.410 LC **N Bay of Biscay Charuau and Conan
(1977)MR, Lab,
SCM 20–?? 118 MI=0.989+0.049 LC ** (6)
F 20–?? 114 MI=2.761"0.036 LC *Galicia Present study Lab M 22–54 84 MI= "0.607+0.083 LC ** (7)
F 22–55 63 MI=2.291"0.018 LC n.s.S Portugal Figueiredo (1989) MR M 30–53 10 MI=2.981+0.025 LC n.s. (8)
F 34–49 16 MI=0.810+0.024 LC n.s.S Portugal Castro (1992) M >20 MI=0.48+0.08 LC (9)
F >20 MI=1.08+0.05 LCNW Mediterranean Sarda (1985) Lab M 17–47 78 log10 PIM=0.91"0.005 LC **
F 14–34 82 log10 PIM=0.95"0.006 LC **
(1) Equation fitted from original data.(2) Data in Andersen (1962). Original data in total length, transformed to CL using our equation (unpubl. data).(3) Regression between MI and CL in Charuau and Conan (1977).(4) Regression between MI and CL in Charuau and Conan (1977) (original data digitized). Original equation was fitted for males
and females including data from Andersen (1962) and Thomas (1965): MI=1.848+0.014 CL.(5) Only data corresponding to individuals with CL >20 mm. Equations fitted from original data. Charuau and Conan (1977)
fitted the following equations for all data (including CL <20 mm): M, MI=0.464+0.037 CL (n=38); F, MI=0.446+0.027 CL(n=15).
(6) Regressions in Charuau and Conan (1977): pre-ecdysis CL=a+b* post-ecdysis CL, transformed to MI=a+(b*"1)pre-ecdysis CL.
(7) Data for males corresponding only to the first moult in laboratory.(8) Equation fitted from original data. Males, only data corresponding to <10 months after release (it was assumed that they
carried out only one moult).(9) Equation fitted from previous data of other authors (Thomas, 1965; Hillis, 1971; Figueiredo, 1975; Charuau, 1977; Sarda,
1985) and length frequency distributions in S Portugal.Method: Lab: holding in laboratory, MR: mark-recapture, SC: submarine cages, HP: holding in premoult (1–2 weeks beforeecdysis).
**p<0.05, *p<0.1, n.s. p>0.1.
936 E. Gonzalez-Gurriaran et al.
(1977), Chapman (1982), and Bailey and Chapman(1983) using different methodologies.
In Norway lobster females, moult frequency and theduration of the intermoult period is directly related tothe duration of the incubation period, which varies,depending on the latitude, e.g. from 6–7 months in areasaround the South of Portugal and Galicia (Figueiredoand Ferreira Barraca, 1963; Farina, unpubl. data) up to12–13 months in Iceland and the Faeroe Islands(Andersen, 1962; Nicolajsen and Eirıksson, 1990;Eirıksson, 1993). In this study, the mean duration ofthe intermoult period in adult females, which haveno possibility of reproducing in the laboratory, was6–7 months, which was very similar to previous resultsfound by Thomas (1965) and Sarda (1985). However,based on other methods (monitoring moult cycle andmodes in length frequency distributions from time seriesof trawl samples) the mean duration reported by otherauthors is around 12 months (Charuau, 1975; Bailey andChapman, 1983; Talidec and Reyss, 1993) (Table 6). Onthe other hand, Norway lobster males moult throughoutthe whole year with moult peaks that vary spatially andseasonally (Thomas, 1965; Farmer, 1973; Charuau,1974). In some areas adult males are reported as having
two annual moulting periods (Conan, 1975b; Sarda,1985). In our case a moult cycle with a certain degree ofseasonality was observed, especially in females, showingecdysis peaks in autumn and spring. These periodscoincide with the stages before and after copulation andthis in turn corresponds with the fact that in order tocopulate females must have just moulted and males mustbe in hard-shelled condition. However, females that donot spawn may carry out the ecdysis at a later time. Inthe field, these peaks could happen earlier, and it hasbeen demonstrated that in experimental conditions thereis a shift in the moulting peak (Conan, 1978, 1985;Sarda, 1985).
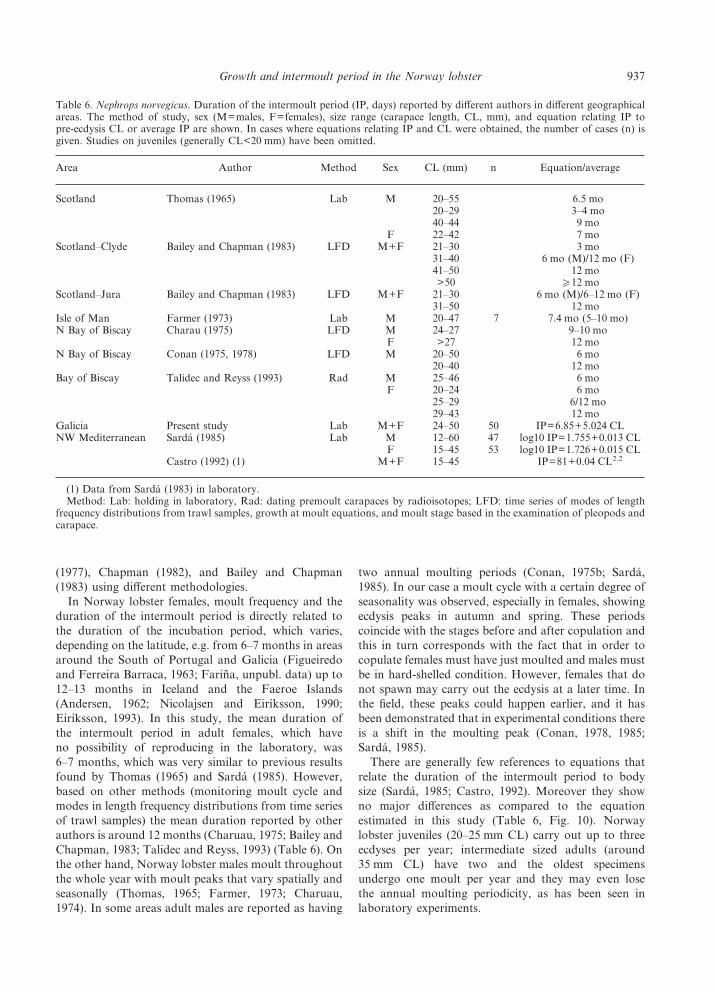
There are generally few references to equations thatrelate the duration of the intermoult period to bodysize (Sarda, 1985; Castro, 1992). Moreover they showno major differences as compared to the equationestimated in this study (Table 6, Fig. 10). Norwaylobster juveniles (20–25 mm CL) carry out up to threeecdyses per year; intermediate sized adults (around35 mm CL) have two and the oldest specimensundergo one moult per year and they may even losethe annual moulting periodicity, as has been seen inlaboratory experiments.
Table 6. Nephrops norvegicus. Duration of the intermoult period (IP, days) reported by different authors in different geographicalareas. The method of study, sex (M=males, F=females), size range (carapace length, CL, mm), and equation relating IP topre-ecdysis CL or average IP are shown. In cases where equations relating IP and CL were obtained, the number of cases (n) isgiven. Studies on juveniles (generally CL<20 mm) have been omitted.
Area Author Method Sex CL (mm) n Equation/average
Scotland Thomas (1965) Lab M 20–55 6.5 mo20–29 3–4 mo40–44 9 mo
F 22–42 7 moScotland–Clyde Bailey and Chapman (1983) LFD M+F 21–30 3 mo
31–40 6 mo (M)/12 mo (F)41–50 12 mo>50 ¢12 mo
Scotland–Jura Bailey and Chapman (1983) LFD M+F 21–30 6 mo (M)/6–12 mo (F)31–50 12 mo
Isle of Man Farmer (1973) Lab M 20–47 7 7.4 mo (5–10 mo)N Bay of Biscay Charau (1975) LFD M 24–27 9–10 mo
F >27 12 moN Bay of Biscay Conan (1975, 1978) LFD M 20–50 6 mo
20–40 12 moBay of Biscay Talidec and Reyss (1993) Rad M 25–46 6 mo
F 20–24 6 mo25–29 6/12 mo29–43 12 mo
Galicia Present study Lab M+F 24–50 50 IP=6.85+5.024 CLNW Mediterranean Sarda (1985) Lab M 12–60 47 log10 IP=1.755+0.013 CL
F 15–45 53 log10 IP=1.726+0.015 CLCastro (1992) (1) M+F 15–45 IP=81+0.04 CL2.2
(1) Data from Sarda (1983) in laboratory.Method: Lab: holding in laboratory, Rad: dating premoult carapaces by radioisotopes; LFD: time series of modes of length
frequency distributions from trawl samples, growth at moult equations, and moult stage based in the examination of pleopods andcarapace.
937Growth and intermoult period in the Norway lobster
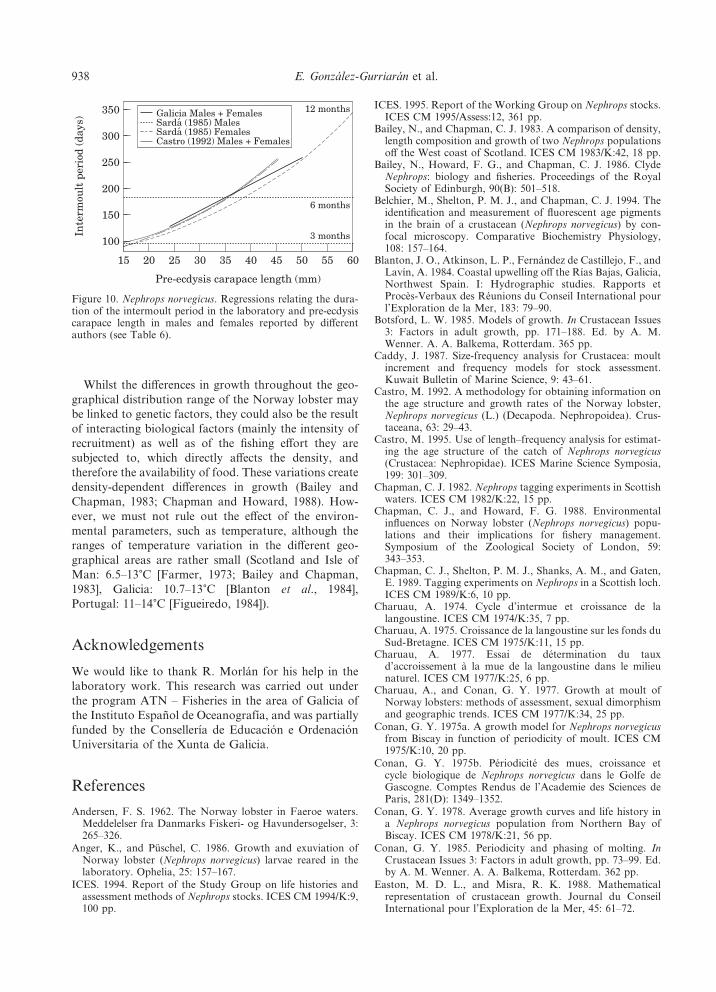
Whilst the differences in growth throughout the geo-graphical distribution range of the Norway lobster maybe linked to genetic factors, they could also be the resultof interacting biological factors (mainly the intensity ofrecruitment) as well as of the fishing effort they aresubjected to, which directly affects the density, andtherefore the availability of food. These variations createdensity-dependent differences in growth (Bailey andChapman, 1983; Chapman and Howard, 1988). How-ever, we must not rule out the effect of the environ-mental parameters, such as temperature, although theranges of temperature variation in the different geo-graphical areas are rather small (Scotland and Isle ofMan: 6.5–13)C [Farmer, 1973; Bailey and Chapman,1983], Galicia: 10.7–13)C [Blanton et al., 1984],Portugal: 11–14)C [Figueiredo, 1984]).
Acknowledgements
We would like to thank R. Morlan for his help in thelaboratory work. This research was carried out underthe program ATN – Fisheries in the area of Galicia ofthe Instituto Espanol de Oceanografıa, and was partiallyfunded by the Consellerıa de Educacion e OrdenacionUniversitaria of the Xunta de Galicia.
References
Andersen, F. S. 1962. The Norway lobster in Faeroe waters.Meddelelser fra Danmarks Fiskeri- og Havundersogelser, 3:265–326.
Anger, K., and Puschel, C. 1986. Growth and exuviation ofNorway lobster (Nephrops norvegicus) larvae reared in thelaboratory. Ophelia, 25: 157–167.
ICES. 1994. Report of the Study Group on life histories andassessment methods of Nephrops stocks. ICES CM 1994/K:9,100 pp.
ICES. 1995. Report of the Working Group on Nephrops stocks.ICES CM 1995/Assess:12, 361 pp.
Bailey, N., and Chapman, C. J. 1983. A comparison of density,length composition and growth of two Nephrops populationsoff the West coast of Scotland. ICES CM 1983/K:42, 18 pp.
Bailey, N., Howard, F. G., and Chapman, C. J. 1986. ClydeNephrops: biology and fisheries. Proceedings of the RoyalSociety of Edinburgh, 90(B): 501–518.
Belchier, M., Shelton, P. M. J., and Chapman, C. J. 1994. Theidentification and measurement of fluorescent age pigmentsin the brain of a crustacean (Nephrops norvegicus) by con-focal microscopy. Comparative Biochemistry Physiology,108: 157–164.
Blanton, J. O., Atkinson, L. P., Fernandez de Castillejo, F., andLavın, A. 1984. Coastal upwelling off the Rıas Bajas, Galicia,Northwest Spain. I: Hydrographic studies. Rapports etProces-Verbaux des Reunions du Conseil International pourl’Exploration de la Mer, 183: 79–90.
Botsford, L. W. 1985. Models of growth. In Crustacean Issues3: Factors in adult growth, pp. 171–188. Ed. by A. M.Wenner. A. A. Balkema, Rotterdam. 365 pp.
Caddy, J. 1987. Size-frequency analysis for Crustacea: moultincrement and frequency models for stock assessment.Kuwait Bulletin of Marine Science, 9: 43–61.
Castro, M. 1992. A methodology for obtaining information onthe age structure and growth rates of the Norway lobster,Nephrops norvegicus (L.) (Decapoda. Nephropoidea). Crus-taceana, 63: 29–43.
Castro, M. 1995. Use of length–frequency analysis for estimat-ing the age structure of the catch of Nephrops norvegicus(Crustacea: Nephropidae). ICES Marine Science Symposia,199: 301–309.
Chapman, C. J. 1982. Nephrops tagging experiments in Scottishwaters. ICES CM 1982/K:22, 15 pp.
Chapman, C. J., and Howard, F. G. 1988. Environmentalinfluences on Norway lobster (Nephrops norvegicus) popu-lations and their implications for fishery management.Symposium of the Zoological Society of London, 59:343–353.
Chapman, C. J., Shelton, P. M. J., Shanks, A. M., and Gaten,E. 1989. Tagging experiments on Nephrops in a Scottish loch.ICES CM 1989/K:6, 10 pp.
Charuau, A. 1974. Cycle d’intermue et croissance de lalangoustine. ICES CM 1974/K:35, 7 pp.
Charuau, A. 1975. Croissance de la langoustine sur les fonds duSud-Bretagne. ICES CM 1975/K:11, 15 pp.
Charuau, A. 1977. Essai de determination du tauxd’accroissement a la mue de la langoustine dans le milieunaturel. ICES CM 1977/K:25, 6 pp.
Charuau, A., and Conan, G. Y. 1977. Growth at moult ofNorway lobsters: methods of assessment, sexual dimorphismand geographic trends. ICES CM 1977/K:34, 25 pp.
Conan, G. Y. 1975a. A growth model for Nephrops norvegicusfrom Biscay in function of periodicity of moult. ICES CM1975/K:10, 20 pp.
Conan, G. Y. 1975b. Periodicite des mues, croissance etcycle biologique de Nephrops norvegicus dans le Golfe deGascogne. Comptes Rendus de l’Academie des Sciences deParis, 281(D): 1349–1352.
Conan, G. Y. 1978. Average growth curves and life history ina Nephrops norvegicus population from Northern Bay ofBiscay. ICES CM 1978/K:21, 56 pp.
Conan, G. Y. 1985. Periodicity and phasing of molting. InCrustacean Issues 3: Factors in adult growth, pp. 73–99. Ed.by A. M. Wenner. A. A. Balkema, Rotterdam. 362 pp.
Easton, M. D. L., and Misra, R. K. 1988. Mathematicalrepresentation of crustacean growth. Journal du ConseilInternational pour l’Exploration de la Mer, 45: 61–72.
60
350
100
15
Inte
rmou
lt p
erio
d (d
ays)
40
200
300
250
150
20 25 30 35 45 50 55
3 months
6 months
12 months
Pre-ecdysis carapace length (mm)
Galicia Males + FemalesSarda (1985) MalesSarda (1985) FemalesCastro (1992) Males + Females
``
Figure 10. Nephrops norvegicus. Regressions relating the dura-tion of the intermoult period in the laboratory and pre-ecdysiscarapace length in males and females reported by differentauthors (see Table 6).
938 E. Gonzalez-Gurriaran et al.
Eirıksson, H. 1982. Estimating the growth of Nephrops atIceland. ICES CM 1982/K:16, 9 pp.
Eirıksson, H. 1993. On the biennial breeding cycle of Nephropsat Iceland and how it relates to the fishery. ICES CM1993/K:5, 18 pp.
Evans, S. M., Hunter, Elizal, J. E., and Wahju, R. I. 1994.Composition and fate of the catch and bycatch in the FarneDeep (North Sea) Nephrops fishery. ICES Journal of MarineScience, 51: 155–168.
Farmer, A. S. 1973. Age and growth in Nephrops norvegicus(Decapoda: Nephropidae). Marine Biology, 23: 315–325.
Figueiredo, M. J. 1979. Artificial culture of Nephrops norvegicus(L.). II – Some studies on the growth of early post-larvaeof Nephrops norvegicus (L.) reared from the egg. BoletimInstituto Nacional de Investigacao das Pescas, Lisboa, 1:13–23.
Figueiredo, M. J. 1984. Attempts to estimate growth andnatural mortality of Nephrops norvegicus off the Portuguesecoast. ICES CM 1984/K:28, 19 pp.
Figueiredo, M. J. 1989. Preliminary results of the taggingexperiments on Nephrops norvegicus in Portuguese waters.ICES CM 1989/K:25, 15 pp.
Figueiredo, M. J., and Ferreira Barraca, Y. 1963. Contribucaopara o conhecimento da pesca e da biologıa do lagostim(Nephrops norvegicus L.) na costa portuguesa. Notas eEstudos. Instituto de Biologia Marıtima, Lisboa, 28:1–45.
Gonzalez-Gurriaran, E. 1981. Primeros datos sobre el crec-imiento en la ecdisis y pruebas de sistemas de marcado de lanecora, Macropipus puber (L.) (Decapoda-Brachyura), en ellaboratorio. Boletın del Instituto Espanol de Oceanografıa,6: 115–136.
Gonzalez-Gurriaran, E. 1985. Crecimiento de la necora Mac-ropipus puber (L.) (Decapoda-Brachyura), en la Rıa deArousa (Galicia, NW Espana) y primeros datos sobre ladinamica de la poblacion. Boletın del Instituto Espanol deOceanografıa, 2: 33–51.
Gray, E. H., and Newcombe, C. I. 1938. Studies of molting inCallinectes sapidus Rathburn. Growth, 2: 285–296.
Gueguen, J., and Charuau, A. 1975. Essai de determination dutaux de survie des langoustines hors taille rejetees lors desoperations de peche commerciale. ICES CM 1975/K:12, 6 pp.
Hartnoll, R. G. 1982. Growth. In The biology of Crustacea, 2:Embriology, Morphology, and Genetics, pp. 111–196. Ed. byL. G. Abele. Academic Press, New York. 440 pp.
Hartnoll, R. G. 1985. Growth, sexual maturity and repro-ductive output. In Crustacean Issues, 3: Factors in adultgrowth, pp. 101–128. Ed. by A. M. Wenner. A. A. Balkema,Rotterdam. 362 pp.
Hiatt, R. W. 1948. The biology of the lined shore crab,Pachygrapsus crassipes Randall. Pacific Science, 2: 135–213.
Hillis, J. P. 1971. Growth studies in Nephrops. ICES CM1971/K:2, 6 pp.
Hillis, J. P. 1972. Further growth-studies on Nephropsnorvegicus: growth in captivity. ICES CM 1972/K:27, 3 pp.
Hillis, J. P. 1973. Continued growth studies on captiveNephrops norvegicus. ICES CM 1973/K:27, 5 pp.
Hillis, J. P. 1974. Observations on the growth of Nephropsnorvegicus 1973–74. ICES CM 1974/K:8, 3 pp.
Hillis, J. P. 1979. Growth studies on the prawn, Nephropsnorvegicus. Rapports et Proces-Verbaux des Reunions duConseil International pour l’Exploration de la Mer, 175:170–175.
Kurata, H. 1962. Studies on the age and growth of Crustacea.Bulletin Hokkaido Regional Fisheries Research Labora-tories, 24: 1–115.
Latrouite, D., Talidec, C., Reyss, J. L., and Noel, P. 1991. Newdata on the growth of the Norway lobster from the Bay of
Biscay (Nephrops norvegicus) by measurement of the 228Th/228Ra carapace ratio. ICES CM 1991/K:39, 8 pp.
Mauchline, J. 1976. The Hiatt growth diagram for Crustacea.Marine Biology, 35: 79–84.
Mauchline, J. 1977. Growth of shrimps, crabs and lobsters –an assessment. Journal du Conseil International pourl’Exploration de la Mer, 37: 162–169.
Morizur, Y., Charuau, A., and Rivoalen, J.-J. 1982. Survie deslangoustines (Nephrops norvegicus) s’echappant d’un cul dechalut. ICES CM 1982/B:14, 5 pp.
Mytilineou, Ch., and Sarda, F. 1995. Age and growth ofNephrops norvegicus in the Catalan Sea, using length–frequency analysis. Fisheries Research, 23: 283–299.
Nelson, K. 1991. Scheduling of reproduction in relation tomolting and growth in malacostracean crustaceans. InCrustacean issues, 7: Crustacean egg production, pp. 77–113.Ed. by A. Wenner, and A. Kuris. A. A. Balkema, Rotterdam.401 pp.
Nicolajsen, A., and Eirıksson, H. 1990. A preliminary report onthe reproductive cycle of Nephrops norvegicus at the Faroes.ICES CM 1990/K:3, 10 pp.
Sarda, F. 1985. Estudio de la edad, crecimiento y frecuencia demuda, en cautividad, de Nephrops norvegicus L. del marCatalan. Investigacion Pesquera, 49: 139–154.
Sarda, F. 1995. A review (1967–1990) of some aspects of thelife history of Nephrops norvegicus. ICES Marine ScienceSymposia, 199: 78–88.
Sheehy, M. R. J. 1990a. Widespread occurrence of fluorescentmorphological lipofuscin in the crustacean brain. Journal ofCrustacean Biology, 10: 613–622.
Sheehy, M. R. J. 1990b. Potential of morphological lipofuscinage-pigment as an index of crustacean age. Marine Biology,107: 439–442.
Somerton, D. A. 1980. Fitting straight lines to Hiatt growthdiagrams: a re-evaluation. Journal du Conseil Internationalpour l’Exploration de la Mer, 39: 15–19.
Spicer, J. I., Hill, A. D., Taylor, A. C., and Strang, R. H. C.1990. Effect of aerial exposure on concentrations of selectedmetabolites in blood of the Norwegian lobster Nephropsnorvegicus (Crustacea: Nephropidae). Marine Biology, 105:129–135.
Symonds, D. J., and Simpson, A. C. 1971. The survival of smallNephrops returned to the sea during commercial fishing.Journal du Conseil International pour l’Exploration de laMer, 34: 89–98.
Talidec, C., and Reyss, J. L. 1993. Determination of theinter-individual growth variability of the Norway lobsterfrom the Bay of Biscay (Nephrops norvegicus) by measure-ment of the 228Th/228Ra carapace ratio. ICES CM 1993/K:28,11 pp.
Thomas, H. J. 1965. The growth of Norway lobsters inaquaria. Rapports et Proces-Verbaux des Reunions duConseil International pour l’Exploration de la Mer, 156:209–216.
Thompson, B. M., and Ayers, R. A. 1989. Laboratory studieson the development of Nephrops norvegicus larvae. Journal ofthe Marine Biological Association of the United Kingdom,69: 795–801.
Tuck, I. D., Chapman, C. J., and Atkinson, R. J. A. 1997.Population biology of the Norway lobster, Nephrops norvegi-cus (L.) in the Firth of Clyde, Scotland – I: Growth anddensity. ICES Journal of Marine Science, 54: 125–135.
Tully, O. 1993. Morphological lipofuscin (age pigment) asan indicator of age in Nephrops norvegicus and Homarusgammarus. ICES CM 1993/K:18.
Tully, O., Hillis, J. P., and McMullan, D. 1989. Fitting normalcurves to polymodal length frequencies to assess growth inNephrops. ICES CM 1989/K:32, 18 pp.
939Growth and intermoult period in the Norway lobster

Wainwright, T. C., and Armstrong, D. A. 1993. Growthpatterns in the Dungeness crab (Cancer magister Dana):synthesis of data and comparison of models. Journal ofCrustacean Biology, 13: 36–50.
Wilber, D. H., and Wilber, T. P., Jr. 1989. The effects ofholding space and diet on the growth of the West Indianspider crab Mithrax spinosissimus (Lamarck). Journal ofExperimental Marine Biology and Ecology, 131: 215–222.
940 E. Gonzalez-Gurriaran et al.