Consumer Attitudes to Genetically Modified Food in Norway
31
Consumer Attitudes toward Genetically Modified Food in Norway by Kristine M. Grimsrud, Jill J. McCluskey, Maria L. Loureiro, and Thomas I. Wahl* American Agricultural Economics Association 2002 Annual Meeting, July 28-31, 2002, Long Beach, California Selected Paper Keywords: biotechnology, genetically modified foods, Norway, contingent valuation Submitted: May 8, 2002 *Grimsrud: Assistant Professor, University of Guelph, Canada; McCluskey (corresponding author): Assistant Professor, Department of Agricultural Economics, Washington State University; Loureiro: Assistant Professor, Department of Agricultural Economics, Colorado State University; Wahl: Director, International Marketing Program for Agricultural Commodities and Trade (IMPACT) Center. The authors wish to thank without implicating Phil Wandschneider helpful discussion and advice. The authors gratefully acknowledge financial support from the IMPACT Center at Washington State University.
Transcript of Consumer Attitudes to Genetically Modified Food in Norway
Consumer Attitudes toward Genetically Modified Food in Norway by Kristine M. Grimsrud, Jill J. McCluskey, Maria L. Loureiro, and Thomas I. Wahl*
American Agricultural Economics Association 2002 Annual Meeting, July 28-31, 2002, Long Beach, California
Selected Paper Keywords: biotechnology, genetically modified foods, Norway, contingent valuation
Submitted: May 8, 2002
*Grimsrud: Assistant Professor, University of Guelph, Canada; McCluskey (corresponding author): Assistant Professor, Department of Agricultural Economics, Washington State University; Loureiro: Assistant Professor, Department of Agricultural Economics, Colorado State University; Wahl: Director, International Marketing Program for Agricultural Commodities and Trade (IMPACT) Center. The authors wish to thank without implicating Phil Wandschneider helpful discussion and advice. The authors gratefully acknowledge financial support from the IMPACT Center at Washington State University.

2
Consumer Attitudes toward Genetically Modified Food in Norway
Abstract There is a lack of public acceptance of genetically modified (GM) food products in Europe.
Using a dichotomous choice contingent valuation methodology, we find that willingness to
accept (WTA) for GM food in Norway is positively affected (i.e. a greater discount is required)
by higher levels of self-reported risk perceptions toward GM-food and preferences for
domestically produced food. The estimation results show that self-reported knowledge about
biotechnology increases WTA while higher levels of formal education decrease the WTA for
GM-foods. Also, respondents who have a high level of concern about food safety have a higher
WTA for GM food. Further, we estimate mean willingness to accept for GM food products. Our
results indicate that our sample on average wants a 47.7% discount on GM bread compared to
conventional bread. For GM-salmon a 56.0% discount compared to non-GM salmon is
necessary.

3
1. Introduction
The introduction of genetically modified crops to world markets has created a new division
between the crop trading countries. The U.S. and Canada have great economic interests in
exporting their transgenic crops, however, lack of public acceptance of genetically modified
(GM) food products in the European Union (EU) and Japan have already resulted in reduced or
curbed demand for GM food products. A suggested remedy has been consumer education about
the GM foods safeness. However, the results of the 1996 Eurobarometer survey suggested that
more knowledgeable people do not necessarily have a more positive opinion; they just have a
more definite opinion about biotechnology (Biotechnology and the European Public Concerted
Action Group 1997). A later survey, the 2001 Eurobarometer survey showed that 70.9 percent of
Europeans simply do not want GMOs.
Consumer attitudes may be just as important as consumer knowledge. The
Eurobarometer survey showed that moral doubts were more important than health risks in
shaping public acceptance of gene technology (Biotechnology and the European Public
Concerted Action Group 1997). Environmental concerns are also important—in the 2000
Eurobarometer survey, 59.4 percent of EU citizens interviewed said that they thought GMOs
could have negative impact on the environment. The European consumer attitudes and behavior
toward genetically modified food products are complex, and a better understanding is essential
for designing market strategies. This study investigates factors that affect consumer acceptance
of GM food in Norway and the discount necessary for consumers to be willing to purchase GM
food.
The Norwegian regulations regarding GM foods are somewhat stricter, but overall in
accordance with the EU regulations. Differences with the EU are possible because Norway is

4
not an EU-member. The marketing of derived GM-foods is regulated by the ‘Act relating to the
supervision and control of food and similar products’1. The Norwegian Food Control Authority2
is responsible for approval to use and market GM food material3. GM foods may be approved if
their use does not pose health risks to humans. Currently, the Food Control Authority has
received several applications for approval of GM-foods, but the applications have been returned
requesting more research concerning health risks. A second Law, The Gene Technology Act,
regulates the import of living GM-organisms. The Norwegian Gene Technology Act requires
that the production and use must be useful for society, ethically defendable, and contribute to
sustainable development (Myrmæl and Tveito 2000). The Norwegian Directorate for Nature
Management4 evaluates potential environmental consequences of such import.
The precautionary principle that dominates the Norwegian and the EU environmental and
food safety policy, calls for preventive measures to be taken when an activity raises threats or
scares even if direct cause-effect relationship has not been scientifically proven. In its strongest
and most distinctive forms, the principle imposes a burden of proof on those who create potential
risks, and it requires regulation of activities even if it cannot be shown that those activities are
likely to produce significant harms (Sunstein 2002). The Precautionary Principle was applied
regarding the use of antibiotic marker genes in transgenic crop varieties (Myrmæl and Tveito
2000) because there was a concern that such marker genes could lead to antibiotic resistance in
humans. In 1997, all such varieties were banned in Norway, and consequently, Norway did not
approve EU-approved genetically modified corn, sweet raps and chicory–three GM food
products that all have antibiotic resistant marker genes. Of six additional products later approved
1 Næringsmiddelloven 2 Statens Næringsmiddel Tilsyn 3GM-material includes food products that do not contain GMO’s, but where GMO’s are used in the production process.

5
by the EU, two will not be approved by Norway because of the presence of antibiotic marker
genes and for the four others the documentation is considered incomplete. So far, only one
transgenic tobacco plant and 11 transgenic carnation varieties are approved for importation
(Myrmæl and Tveito 2000).
Although the Precautionary Principle has been applied in the past by the Norwegian
Government, the Walløe commission presented a report fall 2000 (NOU 2000) in which they
conclude that there are insufficient reasons to apply the Precautionary Principle to imported GM-
food products. Their conclusions were partly based on the experiences from the US and Canada
where no health consequences have been discovered from use of GM food.
If a GM food product is approved for the Norwegian market, it must be labeled. Since
1997, the requirements are that approved GM food products must be labeled as such if the food
products/ingredients contains more than 2% genetically modified materials. The 2% threshold
will likely be adjusted to 1% in order to make the Norwegian policy consistent with the EU-
policy. The Food Control Authority recognizes that there inevitably are traces of GM material in
batches of conventional crops, and they do not require approval in such instances. However,
they are continuously evaluating what can be considered “unavoidable trace amounts” of GM
material in conventional batches of imported crops.
The goals of this study are to analyze factors that induce consumers to choose GM-food
and to estimate Norwegian consumers’ relative willingness to purchase GM-food with discounts
compared to non-GM food. The paper is organized as follows: We first discuss previous
literature on consumer preferences and attitudes towards GM foods and Norwegian attitudes
towards food safety. Next, we introduce the survey data that is utilized in this study. We then
4 Direktoratet for Naturforvaltning

6
present an empirical analyses of the data; first, factors that affect consumers’ willingness to
purchase discounted GM food products are analyzed, and second, the mean willingness to accept
(or required discount) for GM foods in Norway is estimated. Finally, concluding remarks are
offered.
2. Previous Studies
An analogous survey to the Eurobarometer survey was held in Norway5 in 1993, 1996 and 1999,
[NSD Report no 118]. The results show that the skepticism in the Norwegian population toward
gene technology is considerable. The percentage of people who thought that gene technology
would make society better minus the percentage of people who thought it would make things
worse was a negative 32 percent for Norway as opposed to a positive 9 for EU in general.
Further, the results of the survey indicate that there are no significant differences between
Norway and the EU in general regarding cognitive knowledge about biotechnology. Possibly
because of the potential for medical use, the percentage of Norwegian people who support
biotechnology is higher than the percentage of people who are against it by 18 percent.
Gruner et al. (2000) investigated how perceptions of GM foods are related to basic
motivators or life values in the Nordic countries of Denmark, Finland, Sweden and Norway. In
particular, they studied consumer beliefs about GM food products and the motivation for GM
food choice decisions. The GM food products considered were cheese, hard candy and salmon.
For each of the three products, five product variants were considered: the conventional product,
the product where GM is used in the production process but is not present in the final product,
the product where GM is present but is not active in the final product, and finally, the product
where GM is present and active. Respondents were asked to rank the product varieties and were
7
also interviewed about their beliefs about each of the products. Gruner et al. (2000) found
striking similarities in consumer preferences in Denmark, Finland, Norway and Sweden. For
cheese and candy, the consumers acknowledged the benefits of genetic modification such as
improved taste, functional benefits, and environmental benefits. However, the benefits of the
application of GM in food production could generally not compensate for the negative
associations to GM. The conventional product was associated with safety and good health while
the GM products gave negative associations including uncertainty, unnatural, diseases/
deformities, loss of species and ecological imbalance.
A further finding of Gruner et al. (2000) was that the degree of genetic modification is
important. For all countries, the consumers ranked the conventional product highest despite that
only the product description for this product did not explicitly mention any benefits. The product
variants where the GM material was present in the final product but not active was ranked
medium and the product variant in which the GM material is both present and active was ranked
last.
Consumers may be more positive about the use of biotechnology for health purposes.
Gruner et al. (2000) found that GM candy with a low calorie content and that could be consumed
by diabetics was valued by consumers. Further, they found that consumers might be more
negative to genetic modifications related to animals compared with plants. Consumers did not
acknowledge the benefits of genetic modification for salmon. The food industry acknowledges
the consumer skepticism and does not have any plans at present for developing GMO products
for the Norwegian market (Abildgaard 2000).
Only a few studies analyze consumer willingness to pay (WTP) for food products that
contain GM ingredients. Burton et al. (2001) studied attitudes toward GM food in the UK. They
5 Since Norway is not an EU member, Norway was not included in the Eurobarometer surveys.
8
found that there exist significant differences between organic and non-organic consumers on GM
acceptance. Regarding genetic manipulations, they found a considerable difference in consumer
acceptance between plant and animal products. Using a choice modeling approach, they elicited
WTP for GM-free foods. They concluded that infrequent male organic shoppers would be
willing to increase their food bill to avoid animal and plant GM technology by 26%, while
female shoppers would be willing to pay an extra of 49.31%. For committed organic shoppers
these values increased up to 352.12% for males and 471.95% for females.
Lusk et al. (2001) estimated willingness to pay for corn chips made without genetically
modified ingredients. In their experimental study, junior and senior-level agricultural economics
students at Kansas State University indicated their maximum WTP by exchanging a bag of GM
corn chips for a bag of GM-free corn chips. They found that an individual who is very
concerned about GM foods would be 50% more likely to be willing to pay a premium to
exchange GM chips for non-GM chips than an individual with little concern for GM foods.
However, their results indicated that 70% of all participants state that they are not willing to pay
a premium for non-GM chips. The average bid to exchange GM chips for non-GM chips is
$0.07/oz. Still, 20% of participants were willing to pay at least $0.25/oz. for the exchange, and
2% offered bids of $0.50/oz., suggesting that there may be a potential niche market in the United
States for GM-free food products.
Baker and Burnham (2001) investigate U.S. consumers’ acceptance of GM corn flakes
and found that that 30% of consumers based their purchasing decision on GM content. Their
analysis shows that cognitive variables (opinions, beliefs, knowledge) have a great influence on
consumer preferences. The level of risk aversion, knowledge about genetic modification and
opinion about genetic modification were highly significant in explaining the purchasing decision.
9
Previous studies that investigate the relationship between consumer characteristics and food
safety concerns generally find that sociodemographic variables (like education and income)
perform poorly as explanatory variables for purchasing decisions regarding GM food products.
The exception is that women in general are more concerned with food safety.
3. Choice Modelling and Willingness to Accept
The contingent valuation method (CVM) is a standard approach to elicit people’s willingness to
accept (WTA) through dichotomous choice, market-type questioning format with a direct survey
such as via telephone, mail, and in-person questionnaire (Kanninen 1993). In the dichotomous
choice CVM, each respondent is asked whether or not he/she would be willing to accept a
particular discount for a particular good in a hypothetical market, letting him/her answer with
“yes” or “no” along with the discounts “bid” amounts offered to each individual.
The most commonly used bidding methods used in the CVM are the single-bounded and
double-bounded dichotomous choice with the double-bounded model gaining popularity
(Kanninen 1993). The single-bounded model approach recovers the bid amount as a threshold
by asking only one dichotomous choice question (Hanemann , Loomis, and Kanninen 1991).
The statistical efficiency of this approach can be improved by use of the double-bounded model,
which engages in two bids.
Our survey included contingent valuation questions regarding willingness to accept a
discount to purchase bread made from genetically modified wheat and salmon fed feed
containing genetically modified soybeans. The hypothetical market for the good in question
must be as close as possible to a real market in order to reveal people’s true preferences if an
actual market existed (Pearce and Kerry 1990). The food products (bread and salmon) used in

10
this study are appropriate to be examined since they are frequently consumed food products by
the most Norwegians. Bread is an everyday food in Norway, and 46% of the respondents have
salmon at least once a week while 35% have salmon at least once a month.
First, consumers were asked if they were willing to purchase the GM-food product if
offered at the same price as the corresponding, non-GM product. If the respondent’s answer to
this question was “no,” a follow-up question was asked if the respondent was willing to purchase
the GM-food product if offered a percentage discount compared with the corresponding, non-
GM product. The discount was set at one of the following levels: 5%, 10%, 25%, 40%, and
50%. Each level of discount was used for one fifth of the surveys. That is, eighty of the 400
surveys had a 5% discount for GM salmon, another 80 surveys had a 10% discount for GM
salmon, and so on. The assignment of survey version (and thus, discount) was random to the
respondent. The maximum discount was set 50%, assuming that people who would not prefer
the GM food product at such at large discount would not choose the product at any discount. No
follow-up question was asked if the customer’s answer was “yes” to the initial question, and
he/she was willing to purchase the GM food product at no discount. The rationale for no follow
up to a “yes” response is that the type of genetic modification associated with these GM food
products is a process attribute, which reduces production costs—as opposed to a product-
enhancing attribute. An example of a GM product with a product-enhancing attribute is the
Flavr Savr Tomato. Proponents claim that the GM products with process attributes are identical
to non-GM products. Opponents view genetic modification as a negative attribute. Therefore, it
would not make economic sense after an initial “yes” respond with a follow-up question that
involves paying a premium for these GM products that only have cost-reducing attributes.
11
Surprisingly, of the 400 respondents, more than one fourth of the sample would buy
bread with genetically modified wheat flower when offered no discount compared to
conventional bread, and one-fifth of customers in the sample are willing to purchase salmon fed
feed containing genetically modified ingredients at no discount. Further, 39% (for bread) and
31% (for salmon) of consumers in the sample replied that they would be willing to purchase the
GM products if they were cheaper than the conventional products. The rest of the respondents,
that is 61% for bread and 67% for salmon, claimed that even with the discount offered, they were
unwilling to purchase the GM product. For more specific statistics on the distribution of
responses over the various discounts, see Table 1.
3.1 Econometric Model
There are three possible outcomes in our methodology instead of the four possible outcomes in
the standard double-bounded model: (1) the respondent is willing to purchase the GM product at
the same price as the non-GM product implying a “yes”; (2) the respondent is not willing to
purchase the GM product neither at the same price but is willing to buy the GM food product at
the random discount offered, i.e. a “no” followed by a “yes”; (3) the respondent is not willing to
purchase the GM product neither at the same price nor at a discount relative to the non-GM
product, i.e. “no” to both bids.
The model that is applicable to examine the outcomes of our survey can be considered a
special case of the double-bounded logit model (Hanemann, Loomis, and Kanninen 1991). In
this model, the initial bid (B0) equals zero and implies no price difference between GM and the
corresponding, non-GM food products. The second bid (BD), is the GM-food product offered at
a random percentage discount relative to the corresponding, non-GM food product. This bid is

12
only given to those individuals who answer that they would not buy GM food products at equal
prices. We refer to this model as a ‘semi-double-bounded’ model. Modeling of this type has
been around in the literature since at least Cameron and Huppert (1989) and is envisioned in the
multiple bounded discrete choice modeling in Welsh and Poe (1998).
The sequence of questions isolates the range in which the respondents the true WTA
discounts for GM products relative to non-GM food products lie. The discount for the GM
product relative to the non-GM product can be zero, B0, or it can be located in one of the
intervals (B0, BD], (BD, +�� ZKHUH BD is the discount bid offered. The second bid, BD, in
conjunction with the response to the initial preference decision, allows bounds to be placed on
the respondent’s unobservable true WTA for GM food. The lower bound on the WTA discounts
for GM food was determined a priori as no discount on GM-food in comparison to non-GM food
because it is assumed that the genetic modification did not add any value to the product for the
customer. Note that a discount greater than 100% can be interpreted as that the respondent
would need to be paid to choose the GM product.
Let WTAg denote an individual’s WTA (or bid function) for the particular GM-food
product g, { }salmon-GM bread,-GM∈g , relative to the non-GM product and BD�06 denotes
the discount bid on the GM food product relative to the non-GM food product. The following
discrete outcomes of the bidding process are observable for each product g:
(1)
gD
Dg
g
g
WTAB
BWTAB
BWTA
D
<≤<
≤
= 0
0
3
2
1
13
Respondents who indicate the lowest WTA for GM foods (i.e. the smallest required discount to
choose GM foods) fall into the first group, because they are willing to purchase the GM-food
product at zero discount compared to the non-GM food product. Those who fall into the second
group indicate an intermediate WTA for GM foods. In order to choose the GM product, the
price of the GM products must be discounted relative to the corresponding non-GM food product
by an amount less than or equal to the discount bid. Finally, those who indicate the highest
WTA (i.e. the largest required discount to choose GM food) fall into the third group. Customers
in this group are not willing to purchase the GM-product at the discount offered.
The WTA function for each food product g, individual i is
(2) niBWTA giiggigggi ,...,1' =++−= ερα z�
where Bgi is the ultimate discount bid individual i faces for food product g, zi is a column vector
of observable characteristics of the individual, 0gi is a random variable accounting for random
noise and possibly unobservable characteristics. Unknown parameters to be estimated are αg, ρg,
and λg. Linearity in z and ε is assumed, for both food products and all individuals. Furthermore,
the distribution of the error term is assumed to follow ),,0(~ 2σε G where G(0,σ2) denotes a
6 The randomly assigned discount bids were BD= }5.0,4.0,25.0,1.0,05.0{ , or expressed as percentages, 5%, 10%, 25%, 40%, and 50% of discount compared to the price of the conventional product.

14
cumulative distribution function with mean zero and variance 2σ . Under these assumptions, the
choice probabilities for product g individual i can be characterized as7:
(3)
=
+−−+−−+−
+−==
3
2
1
for
)~~~(1
)~~~()
~~~(
)~~~(
)(Prob 0
0
j
BG
BGBG
BG
jD
igiDgg
igiggigiDgg
igigg
gi
z'�
z'�z'�
z'�
ραραρα
ρα
Thus, the log-likelihood function becomes:
(4) [ ][ ]
∑
+−−+
−−−+−+
+−
=
=
=
=
i
igDgiggD
iggiggigDiggD
igiggD
g
BGI
BGBGI
BGI
L
i
i
i
)~~~(1ln
)~~~()
~~~(ln
)~~~(ln
3
02
01
z'�
z'�z'�
z'�
ρα
ραρα
ρα
where KI is an indicator function for the event K, and Di = j denotes that the jth alternative
occurred. In the empirical implementation of the model, we define )(⋅G to be the standard
logistic distribution function with mean zero and standard deviation 3/πσ = .
4. The Application
In January 2002, we conducted a survey at a Norwegian grocery store, RIMI Liertoppen, in the
Oslo-region of Norway. This region is the most populated part of Norway and one of the
7The condition of linearity on z is a simplifying assumption widely used in RUM (random utility models). This assumption implies that consumer’s willingness to accept c dollars is generally represented as:
),,1(),,0( 10 cmxUmxU +≤ , }Pr{}Pr{}Pr{ 10011100 VVVVcWTA −≤−=+≤+=≤ εεεε where
cVV βα +=− 10 .
15
Norwegian centers of economic activity. The survey data was collected with in-person
interviews. By collecting data from consumers at the same time and place where actual purchase
decisions are made, we hoped to better elicit consumers' true preferences about the products.
Respondents were selected randomly with the criterion that the interviewer was to solicit every
third customer who came in the survey area, and the turndown rate was about 5%. After the
survey was completed, every respondent was given a gift certificate (worth approximately $5 in
Norwegian Kroner).
In total, 400 consumers were surveyed. The majority of respondents are the primary food
shoppers of the household (82%) and female (69%). Eighty-four percent of the shoppers in the
survey shop for groceries daily or between two and five times a week. The respondents' average
age is 41.6 years, which is close to the average age of 44 years for the general population of
Norway in 1998. Fifty-seven percent of all respondents have children under the age of 18 years
living in their household. The most frequent range of household income as a whole family is
between 450,000 Norwegian Kroner (U.S. $50,300) and 600,000 Norwegian Kroner
(U.S.$67,100)8 for the 2001 fiscal year. This range is slightly higher than the average Norwegian
income; in 1999, the average income for all households was Norwegian Kroner 381,500 which
when inflated to 2001 represents an income of Norwegian Kroner 405,367. The most frequent
level of education includes two to three years of college. This level of education may be
somewhat higher than the national average; in 1998, the most frequent level of education
completed was secondary school. The dataset contains 381 usable observations. Summary
statistics and variable descriptions are presented in Table 2.
8In order to obtain a high response rate, respondents were asked to place themselves in income intervals, rather than state their exact income amount. Survey respondents are typically reluctant to divulge incomes information. The exchange rate used is $1= 8.941 kroner.
16
The survey asked for information about respondents’ attitudes about the environment and
food safety, their self-reported knowledge and perceptions about the biotechnology (see Table 3).
Information about environmental and food safety attitudes was obtained by presenting trade-off
situations between environmental quality and economic growth, and between food safety and
low prices, respectively (see the appendix for English translation of the tradeoff questions). We
find that 58% of the customers assign more importance to economic growth than preserving the
environment, and 68% placed more importance on food safety issues than price. Eliciting these
attitudes with trade-off scenarios is an effective way of ensuring that the survey information is
informative as well as useful in an empirical modeling context. For example, without the
tradeoff, most respondents will say that they value the environment highly. The resulting lack of
variation in response can lead to a lack of statistical significance.
As in all surveys, sample representativeness is of concern. One possible sample bias is
the population choice bias, in which the population sampled does not adequately correspond to
the population that would purchase genetically modified food products. The RIMI chain of
grocery stores has chosen a low-price/limited-selection niche in the market and has in this way
gained significant power in the Norwegian marketplace. Although the store-selection is wide
enough to include all the most frequently consumed foods in Norwegian households, the chain
does not focus on specialty products, such as organic and ecologically produced foods. This
potential bias may be mitigated by the location of the grocery store at a mall where many
different people drop by to pick up a few grocery store items. Another potential concern with
respect to population bias is that the geographical location of the chosen grocery store. The store
is located in one of the major agricultural production areas in Norway. However, the specific
store chosen is also located in a major shopping mall for the region including the city Drammen

17
and the capital Oslo. Given the preceding concerns, we acknowledge that the extent to which the
findings can be fully generalized to broader populations is uncertain.
5. Empirical Analysis
The empirical analysis associated with this research is divided into two sub-sections. The first
analyses factors that affects consumers’ willingness to accept discounts to purchase GM-foods,
and the second estimates of Norwegian consumers willingness to accept discounts for GM-foods.
5.1 Analysis of Factors that Affect WTA for GM-food
The bid information and other demographic information were used to estimate the magnitude of
factors that affect Norwegian consumers’ WTA for GM-food products and how much of a
relative discount Norwegian consumers will require to purchase GM food products. We present
an analysis of factors that affect WTA for GM-bread only since we have more usable
observations for bread than for salmon, and the responses are similar.
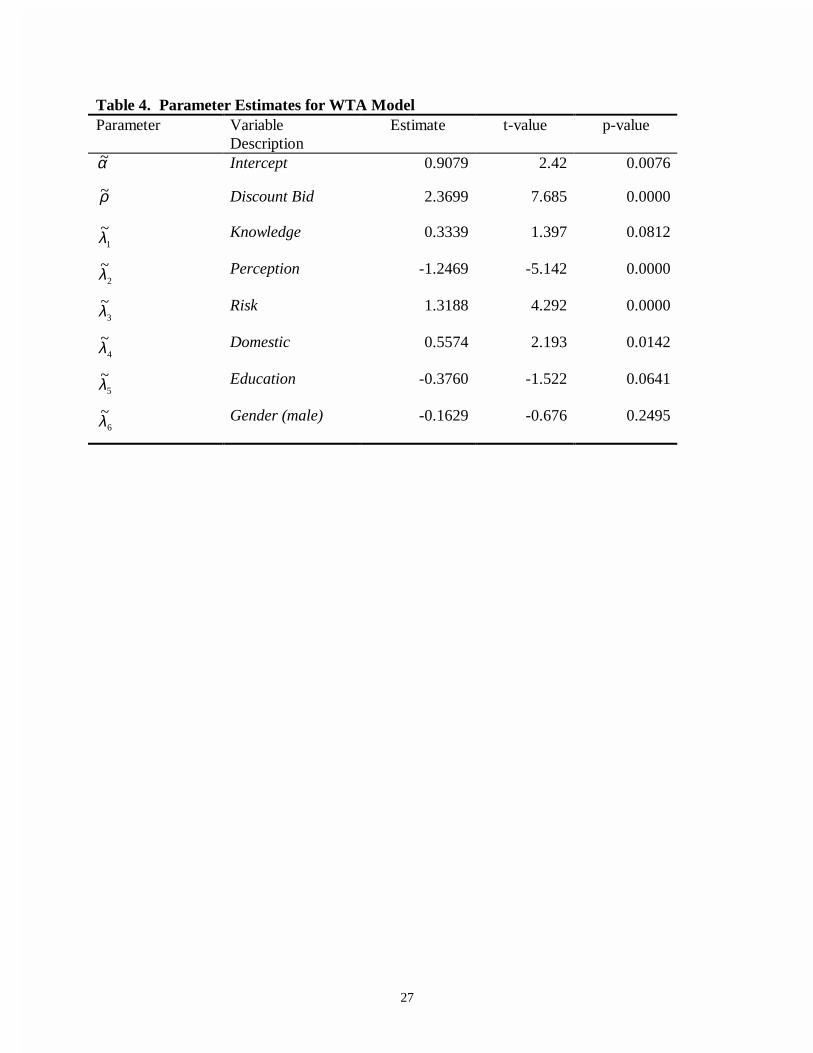
The variables included in the model were self-reported knowledge about GMO, opinion
regarding use of biotechnology in food production, self-reported risk perceptions about
biotechnology, preferences for domestic versus imported food, education level, and gender. The
model (2) was estimated where
{ }iiiiiii GenderEducationDomesticRiskOpinionKnowledge=z . Variable
definitions and descriptions are given in Tables 2 and 3. Parameters to be estimated are
{ }654321' λλλλλλ=� in addition to ., !. Additional variables are difficult to include
because of convergence problems. The parameter estimates are reported in Table 4.
18
Increasing self-reported risk perceptions toward GM-foods and preference for
domestically produced food both significantly increase the WTA for GM-foods (i.e. a greater
discount is required). These results are consistent with the general skepticism to GM-foods
found by Gruner et al. (2000). Interestingly, the estimation results show that self-reported
knowledge about biotechnology increases WTA while higher education levels decrease the WTA
for GM-foods. This may indicate that the self-reported knowledge has been obtained from
sources that negative to biotechnology and/or genetic modification. The discrepancy in
willingness to purchase genetically modified food between people with high self-reported
knowledge and people with higher education may indicate that consumer education may increase
consumers’ willingness to purchase GM-foods. The coefficient for Gender (indicating female) is
positive although not significant at conventional levels.
5.2 Estimates for Mean WTA for GM-food
The mean willingness to accept for both GM food products, WTAg, where g= {bread, salmon},
was estimated by restricting λg = 0 (Hanemann, Loomis and Kanninen 1991). The empirical
mean WTAg can then calculated as gg ρα ~~ . Our results indicate that on average the consumers
in our sample want a 47.7% discount on GM bread compared to conventional bread. For GM-
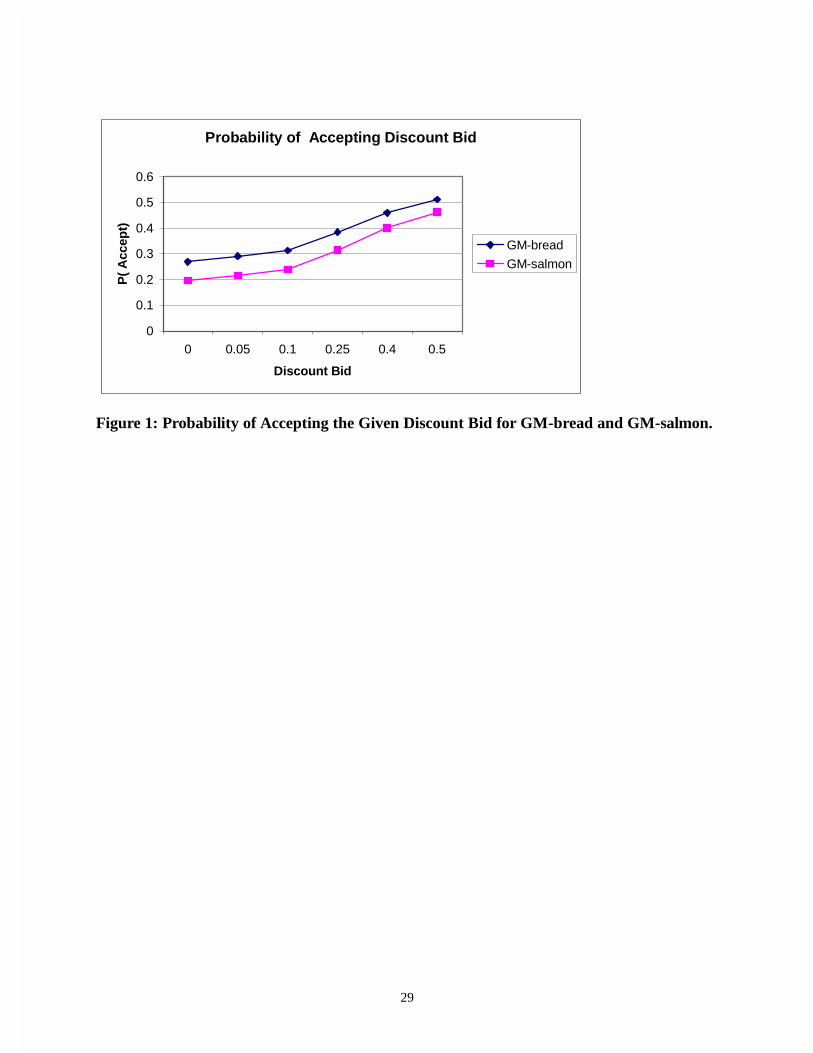
salmon a 56.0% discount compared to non-GM salmon is necessary (see Table 5). The increase
in probability of accepting the discount bid offered over the range of bids given is displayed in
Figure 1. The figure shows that the discount required for salmon is generally higher than the
discount needed for GM bread and the reason may be that many people are more skeptic to
genetic modification associated with animals than with plants (Gruner et al. 2000, Burton et al.
2001). Further, there seemed to be a general distrust in the fish farming industry; most people

19
(84%) said that they believed that salmon had been fed food containing genetically modified
ingredients despite that such feed is illegal in Norway.
The high discounts are reasonable given how relatively few people indicated their
willingness to purchase GM foods either at the equal prices or discounted prices (see Table 3).
Ideally, the mean WTA would be contained within the discounts offered. However, the
partitions cover all the ranges of the WTA distribution. The “no, no” group likely includes
people who would not choose GM foods if they were given away for free. This group is included
in the lower-bound partition of willingness to accept.
Although the skepticism towards GM food in the Norwegian population currently seems
strong, this may be a fading trend. An indication of this is an age-relationship in the data (see
Table 5). To be willing to purchase GM bread, respondents below the average age of 41.6 years
on average only need a discount of 31.8% while for customers older than the average age the
average discount needed is 88.0%. We see the similar effects for salmon. The average discount
needed for GM-salmon is 44.3% for customers below the average age of the data set and 83.6%
for customers above the average age.
The confidence intervals for the WTA estimates are given in Table 5, and were calculated
using 1000 bootstrap samples. The standard deviation of the average WTA for the 1000
bootstrap samples was used to calculate 95% confidence intervals9 (assuming asymptotic
normality of these averages WTA estimates).
9 CI= ±ρα ~/~ 1.96*SEBootstrap
20
6. Conclusions
A better understanding of Norwegian consumers' attitudes and behavior toward genetically
modified food products and how these attitudes affect the purchasing choices for such food
products is essential for marketing GM food products in Norway. This study analyzes factors
that affects Norwegian consumers’ WTA for GM food products and estimates their WTA (the
discount required to choose the GM products).
The Norwegian policy restricting GM food products and the results of surveys show that
there is a considerable skepticism in the Norwegian population toward GM foods. The results of
this study suggests that our sample of Norwegian consumers are, on average, willing to purchase
GM bread with a 47.7% discount and GM salmon with a 56.0% discount compared to the
corresponding non-GM product. Consumers’ perceptions and attitudes toward GM-food and
respondents’ age increase WTA (that is, a greater discount would be required) for GM-food.
The strong skepticism in the Norwegian population may be fading, leaving a potential
future market for GM foods. People younger than the average age of the sample were willing to
purchase the GM food products with an average discount that is half (or less) of what the
customers above the average age of the sample needed. The gap in between generations for
WTA, indicate that younger people may be more open to GM foods and that it may a question of
time before the Norwegian market may be more open to GM food products.

21
References
Abildgaard, C. (2000). Forskningsrådets prioriteringer i forhold til forskning på genmodifisert
mat og innvirkninger på helse og miljø. Genialt (4)20-22.
Baker, G.A. and Burnham, T.A. (2001). Consumer response to genetically modified foods:
market segment analysis and implications for producers and policy makers. Journal of
Agricultural and Resource Economics 26: 387-403.
Biotechnology and the European Public Concerted Action Group (1997). Europe ambivalent on
biotechnology. Nature (387): 845-847.
Burton, M., Rigby, D., Young, T. and James, S. (2001). Consumer attitudes to genetically
Modified organisms in food in the UK. European Review of Agricultural Economics 28: 479-
498.
Cameron, T.A. and Huppert, D.D. (1989) OLS versus ML estimation of non-market resource
values with payment card interval data.” Journal of Environmental Economics and
Management. 17:230-46.
Caswell, J.A.(2000). An evaluation of risk analysis as applied to agricultural biotechnology (with
a case study of GMO labeling). Agribusiness 16(1):115-123.
Gruner, K. G., Lähteenmäki, L., Nielsen, N.A., Poulsen, J.B, Ueland, O. and Åström, A. (2000).
Consumer perception of food products involving genetic modification: results from a
qualitative study in four Nordic countries. Working Paper no 72. MAPP – Centre for Market
Surveillance, Research and Strategy for the Food Sector, Århus, Denmark.
22
Hanemann, W.M., Loomis, J. and Kanninen, B.J. (1991). Statistical efficiency of double-
bounded dichotomous choice contingent valuation. American Journal of Agricultural
Economics 73:1255-1263.
Hviid Nielsen, T. (2000). Vitende Skepsis. Genialt (4):35-37.
Kanninen, B.J. (1993). Optimal experimental design for double-bounded dichotomous choice
contingent valuation. Land Economics 69(2): 138-146.
Lund, M., Hviid Nielsen, T. and Kalgraff Skjåk, K. (2000). Norwegian attitudes to
biotechnology. Norsk Samfunnsvitenskapelig Datatjeneste (NSD). Report no. 118.
Lusk, J.L., Daniel, M.S., Mark, D.R. and Lusk, C.L. (2001). Alternative calibration and auction
institutions for predicting consumer willingness to pay for nongenetically modified corn
chips. Journal of Agriculture and Resource Economics 26(1): 40-57.
McCluskey J.J. (2000). Read the warning: this product may contain GMOs. CHOICES Second
Quarter: 39-42.
Myrmæl, A. and Tveito, G. (2000). Hvilken betydining har internasjonale avtaler for den
politikken Norge kan føre når det gjelder genmat? Genialt (4):24-26.
Nelson, G.C., De Pinto, A., Bullock, D., Nitsi, E.I., Rosegrant, M., Josling, T., Babinard, J.,
Cunningham, C., Unnevehr, L. and Hill, L. (1999). The Economics and Politics of
Genetically Modified Organisms in Agriculture: Implications for WTO 2000, Bulletin 809,
University of Illinois.
NOU [Norsk Offentlig Utredning] (2000). No. 29. GMO-mat. Helsemessige konsekvenser ved
bruk av genmodifiserte næringsmiddler og næringsmiddelingredienser. Ministry of Health,
Oslo, Norway.
23
Pearce, D.W. and Turner, R.K. (1990). Economics of natural resources and the environment.
Harvester Wheatsheaf.
Slovic, P. (1987). Perception of Risk. Science 236: 280-285.
Sunstein, C.R. (2002). Beyond the Precautionary Principle. University of Chicago Law &
Economics, Olin Working Paper No. 149.
Welsh M.P and Poe, G.L. (1998). Elicitation effects in contingent valuation: comparisons to a
multiple bounded discrete choice approach. Journal of Environmental Economics and
Management. 36:170-185

24
Table 1. Range and Distribution of response rates to the randomly assigned discount offer Percentage of Yes-responses for Each Discount
Question
Discount Bread Salmon
Initial Question 0% 26.8%
17.8%
5% 10.8%
4.8%
10% 11.9%
14.3%
25% 19.7%
16.4%
40% 17.9%
23.8%
Second Question
50% 26.9%
20.6%
25
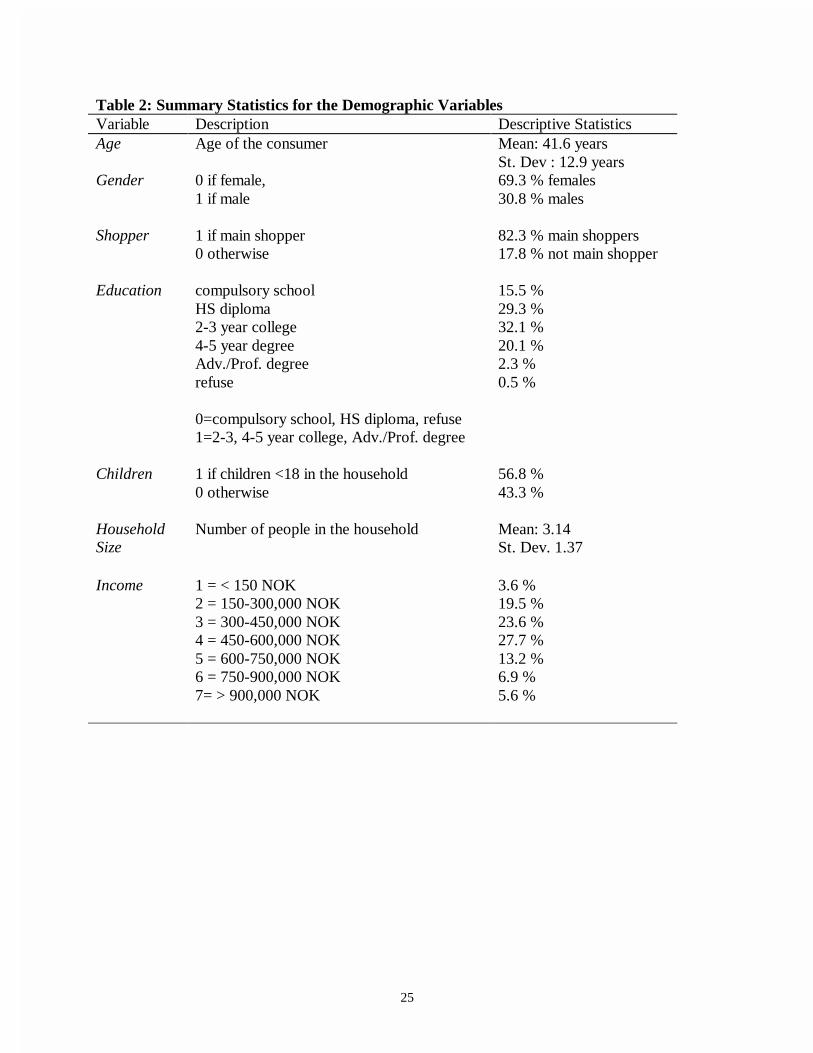
Table 2: Summary Statistics for the Demographic Variables Variable Description Descriptive Statistics Age Age of the consumer Mean: 41.6 years
St. Dev : 12.9 years Gender 0 if female,
1 if male
69.3 % females 30.8 % males
Shopper 1 if main shopper 0 otherwise
82.3 % main shoppers 17.8 % not main shopper
Education compulsory school HS diploma 2-3 year college 4-5 year degree Adv./Prof. degree refuse 0=compulsory school, HS diploma, refuse 1=2-3, 4-5 year college, Adv./Prof. degree
15.5 % 29.3 % 32.1 % 20.1 % 2.3 % 0.5 %
Children 1 if children <18 in the household 0 otherwise
56.8 % 43.3 %
Household Size
Number of people in the household Mean: 3.14 St. Dev. 1.37
Income 1 = < 150 NOK 2 = 150-300,000 NOK 3 = 300-450,000 NOK 4 = 450-600,000 NOK 5 = 600-750,000 NOK 6 = 750-900,000 NOK 7= > 900,000 NOK
3.6 % 19.5 % 23.6 % 27.7 % 13.2 % 6.9 % 5.6 %
26
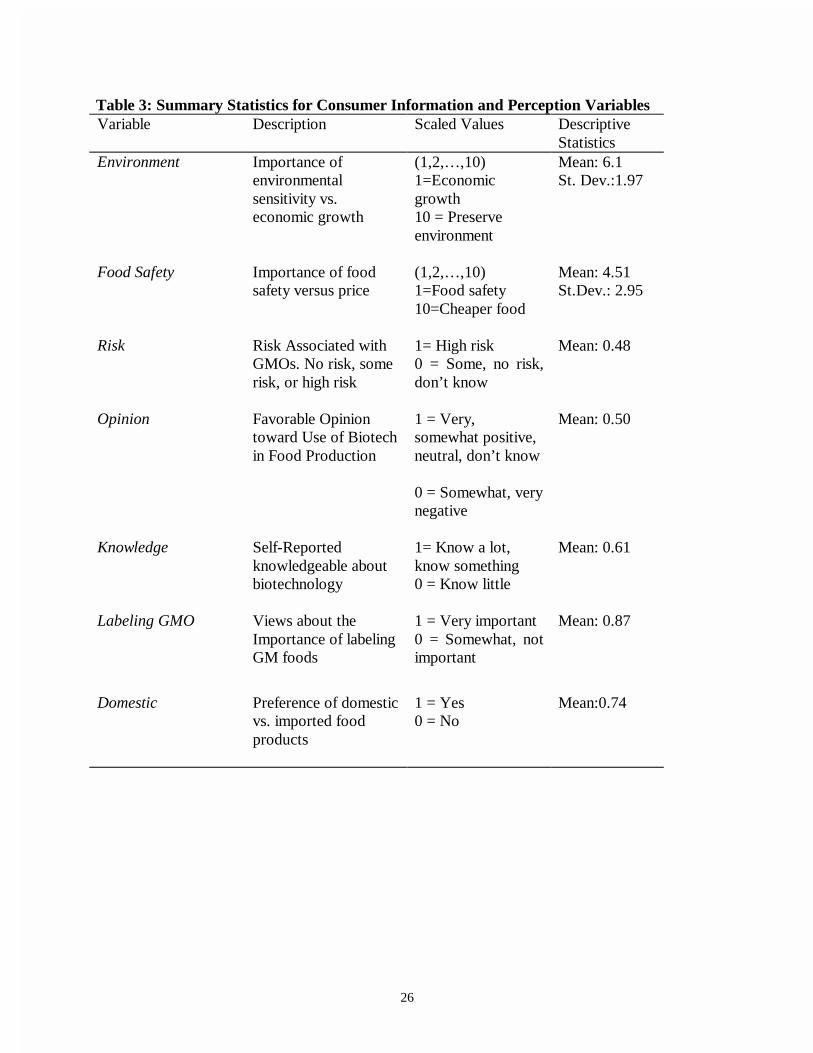
Table 3: Summary Statistics for Consumer Information and Perception Variables Variable Description Scaled Values Descriptive
Statistics Environment Importance of
environmental sensitivity vs. economic growth
(1,2,…,10) 1=Economic growth 10 = Preserve environment
Mean: 6.1 St. Dev.:1.97
Food Safety Importance of food safety versus price
(1,2,…,10) 1=Food safety 10=Cheaper food
Mean: 4.51 St.Dev.: 2.95
Risk Risk Associated with GMOs. No risk, some risk, or high risk
1= High risk 0 = Some, no risk, don’t know
Mean: 0.48
Opinion Favorable Opinion toward Use of Biotech in Food Production
1 = Very, somewhat positive, neutral, don’t know 0 = Somewhat, very negative
Mean: 0.50
Knowledge Self-Reported knowledgeable about biotechnology
1= Know a lot, know something 0 = Know little
Mean: 0.61
Labeling GMO Views about the Importance of labeling GM foods
1 = Very important 0 = Somewhat, not important
Mean: 0.87
Domestic Preference of domestic vs. imported food products
1 = Yes 0 = No
Mean:0.74
27
Table 4. Parameter Estimates for WTA Model Parameter
Variable Description
Estimate t-value p-value
α~ Intercept
0.9079 2.42 0.0076
ρ~ Discount Bid
2.3699 7.685 0.0000
1
~λ Knowledge
0.3339 1.397 0.0812
2
~λ Perception
-1.2469 -5.142 0.0000
3
~λ Risk
1.3188 4.292 0.0000
4
~λ Domestic
0.5574 2.193 0.0142
5
~λ Education
-0.3760 -1.522 0.0641
6
~λ Gender (male)
-0.1629 -0.676 0.2495

28
Table 5: WTA Premium for GM Bread and Salmon (%) with Confidence Intervals Estimated from Semi-Double Bounded Model
α~
ρ~
Average Discount needed =( ρα ~/~ )
Bootstrap SE for average discount
95% Confidence Interval
GM bread 0.9960
2.0894
0.4767 0.0633 (0.3526,0.6008)
GM bread, below average age of the sample
0.8654 2.7226 0.3179 0.0580
(0.2042,0.4316)
GM bread, above average age of the sample
1.1297 1.2837 0.8800 0.1501 (0.5858, 1.1742)10
GM salmon 1.4103 2.5192 0.5598
0.1025 (0.3589,0.7607)
GM salmon, below average age of the sample
1.2127 2.7342 0.4435 0.0675
(0.3112,0.5758)
GM salmon, above average age of the sample
1.5740 1.8834 0.8357 0.1195
(0.6015,1.070)
10 A discount above 100% means that the person is not willing to accept the product regardless of how much discount is offered.
29
Probability of Accepting Discount Bid
0
0.1
0.2
0.3
0.4
0.5
0.6
0 0.05 0.1 0.25 0.4 0.5
Discount Bid
P( A
ccep
t)
GM-bread
GM-salmon
Figure 1: Probability of Accepting the Given Discount Bid for GM-bread and GM-salmon.

30
APPENDIX A QUESTIONS USED TO ELICIT FOOD SAFETY AND ENVIROMENTAL ATTITUDES Where would you place yourself on a scale from 1 to 10, if economic growth at all costs is a 1 and saving the environment at all costs is a 10. (CIRCLE JUST ONE) 1 2 3 4 5 6 7 8 9 10 When you are purchasing food, how important are lower food safety risks versus lower cost food on a scale of 1 to 10, where 1 means lower food safety risk is all important and 10 means lower food prices are all important? (CIRCLE JUST ONE) 1 2 3 4 5 6 7 8 9 10 QUESTIONS ABOUT GMO KNOWLEDGE AND ATTITUDES How knowledgeable are you about biotechnology and genetically modified (GM) foods?
1. Very knowledgeable 2. Somewhat knowledgeable 3. Not informed
Overall, how do you feel about the use of biotechnology in foods?
1. Very positive 2. Somewhat positive 3. Neutral 4. Somewhat negative 5. Very negative 6. Don’t know
How much risk, if any, do you associate with genetically modified foods?
1. High level risk 2. Low level risk 3. No risk 4. Don’t know
How important is it to you for foods with genetically modified ingredients to be labeled?
1. Very important 2. Somewhat important 3. Not very important
Do you prefer domestic to imported food products?
31
1. Yes 2. No
QUESTIONS RELATED TO WILLINGNESS TO ACCEPT A U.S. university is developing genetically engineered wheat. Would be willing to purchase bread made with this wheat if it is offered at the same price as bread without genetically engineered wheat?
1. Yes (skip to salmon questions) 2. No
Would you be willing to purchase this bread if it was offered at a price that is [INSERT RANDOM DISCOUNT] less than bread without genetically engineered wheat?
1. Yes 2. No
Would you be willing to purchase salmon that has been given feed containing genetically modified ingredients (genetically modified soy) if it is offered at the same price as salmon that had not been given feed containing genetically modified ingredients?
1. Yes (skip to demographic questions) 2. No
Would you be willing to purchase salmon that has been given feed containing genetically modified ingredients if it is offered at a price that is [INSERT RANDOM DISCOUNT] less than salmon that has not been given feed containing genetically modified ingredients?
1. Yes 2. No