Grid Photovoltaic System using Machine Learning Algorithms
21
Research Article A Practical Approach for Predicting Power in a Small-Scale Off- Grid Photovoltaic System using Machine Learning Algorithms Aadyasha Patel , 1 O. V. Gnana Swathika , 1 Umashankar Subramaniam, 2,3 T. Sudhakar Babu , 4 Alok Tripathi , 1 Samriddha Nag , 1 Alagar Karthick , 5 and M. Muhibbullah 6 1 School of Electrical Engineering, VIT Chennai, Chennai 600127, India 2 Department of Communications and Networks, Renewable Energy Laboratory, College of Engineering, Prince Sultan University, Riyadh 11586, Saudi Arabia 3 Department of Energy and Environmental Engineering, Saveetha School of Engineering, Saveetha Institute of Medical and Technical Sciences, Saveetha University, Saveetha Nagar, Thandalam, Chennai, 602105 Tamilnadu, India 4 Department of Electrical and Electronics Engineering, Chaitanya Bharathi Institute of Technology (CBIT), Hyderabad 500075, India 5 Renewable Energy lab, Department of Electrical and Electronics Engineering, KPR Institute of Engineering and Technology, 641407, Coimbatore, Tamilnadu, India 6 Department of Electrical and Electronic Engineering, Bangladesh University, Dhaka 1207, Bangladesh Correspondence should be addressed to M. Muhibbullah; [email protected] Received 28 October 2021; Accepted 18 January 2022; Published 12 February 2022 Academic Editor: Laurentiu Fara Copyright © 2022 Aadyasha Patel et al. This is an open access article distributed under the Creative Commons Attribution License, which permits unrestricted use, distribution, and reproduction in any medium, provided the original work is properly cited. Climate change and the energy crisis substantially motivated the use and development of renewable energy resources. Solar power generation is being identified as the most promising and abundant source for bulk power generation. However, solar photovoltaic panel is heavily dependent on meteorological data of the installation site and weather fluctuations. To overcome these issues, collecting performance data at the remotely installed photovoltaic panel and predicting future power generation is important. The key objective of this paper is to develop a scaled-down prototype of an IoT-enabled datalogger for photovoltaic system that is installed in a remote location where human intervention is not possible due to harsh weather conditions or other circumstances. An Internet of Things platform is used to store and visualize the captured data from a standalone photovoltaic system. The collected data from the datalogger is used as a training set for machine learning algorithms. The estimation of power generation is done by a linear regression algorithm. The results are been compared with results obtained by another machine learning algorithm such as polynomial regression and case-based reasoning. Further, a website is developed wherein the user can key in the date and time. The output of that transaction is predicted temperature, humidity, and forecasted power generation of the specific standalone photovoltaic system. The presented results and obtained characteristics confirm the superiority of the proposed techniques in predicting power generation. 1. Introduction Renewable or nonconventional sources of energy are some- thing that replenishes itself at the speed of its consumption. Some examples of renewable energy are solar, wind, tidal, waves, and geothermal. Renewable energy ventures are being undertaken in developed as well as developing countries. The majority of the nonconventional energy is harnessed to get electricity, which is more efficient, clean, does not pol- lute the environment, and is costeffective in the long run. Among all the nonconventional forms of available resources, solar energy is most abundantly found and the amount of Hindawi International Journal of Photoenergy Volume 2022, Article ID 9194537, 21 pages https://doi.org/10.1155/2022/9194537
-
Upload
khangminh22 -
Category
Documents
-
view
0 -
download
0
Transcript of Grid Photovoltaic System using Machine Learning Algorithms

Research ArticleA Practical Approach for Predicting Power in a Small-Scale Off-Grid Photovoltaic System using Machine Learning Algorithms
Aadyasha Patel ,1 O. V. Gnana Swathika ,1 Umashankar Subramaniam,2,3
T. Sudhakar Babu ,4 Alok Tripathi ,1 Samriddha Nag ,1 Alagar Karthick ,5
and M. Muhibbullah 6
1School of Electrical Engineering, VIT Chennai, Chennai 600127, India2Department of Communications and Networks, Renewable Energy Laboratory, College of Engineering, Prince Sultan University,Riyadh 11586, Saudi Arabia3Department of Energy and Environmental Engineering, Saveetha School of Engineering, Saveetha Institute of Medical andTechnical Sciences, Saveetha University, Saveetha Nagar, Thandalam, Chennai, 602105 Tamilnadu, India4Department of Electrical and Electronics Engineering, Chaitanya Bharathi Institute of Technology (CBIT),Hyderabad 500075, India5Renewable Energy lab, Department of Electrical and Electronics Engineering, KPR Institute of Engineering and Technology, 641407,Coimbatore, Tamilnadu, India6Department of Electrical and Electronic Engineering, Bangladesh University, Dhaka 1207, Bangladesh
Correspondence should be addressed to M. Muhibbullah; [email protected]
Received 28 October 2021; Accepted 18 January 2022; Published 12 February 2022
Academic Editor: Laurentiu Fara
Copyright © 2022 Aadyasha Patel et al. This is an open access article distributed under the Creative Commons AttributionLicense, which permits unrestricted use, distribution, and reproduction in any medium, provided the original work isproperly cited.
Climate change and the energy crisis substantially motivated the use and development of renewable energy resources. Solar powergeneration is being identified as the most promising and abundant source for bulk power generation. However, solar photovoltaicpanel is heavily dependent on meteorological data of the installation site and weather fluctuations. To overcome these issues,collecting performance data at the remotely installed photovoltaic panel and predicting future power generation is important.The key objective of this paper is to develop a scaled-down prototype of an IoT-enabled datalogger for photovoltaic systemthat is installed in a remote location where human intervention is not possible due to harsh weather conditions or othercircumstances. An Internet of Things platform is used to store and visualize the captured data from a standalone photovoltaicsystem. The collected data from the datalogger is used as a training set for machine learning algorithms. The estimation ofpower generation is done by a linear regression algorithm. The results are been compared with results obtained by anothermachine learning algorithm such as polynomial regression and case-based reasoning. Further, a website is developed whereinthe user can key in the date and time. The output of that transaction is predicted temperature, humidity, and forecasted powergeneration of the specific standalone photovoltaic system. The presented results and obtained characteristics confirm thesuperiority of the proposed techniques in predicting power generation.
1. Introduction
Renewable or nonconventional sources of energy are some-thing that replenishes itself at the speed of its consumption.Some examples of renewable energy are solar, wind, tidal,waves, and geothermal. Renewable energy ventures are being
undertaken in developed as well as developing countries.The majority of the nonconventional energy is harnessedto get electricity, which is more efficient, clean, does not pol-lute the environment, and is costeffective in the long run.Among all the nonconventional forms of available resources,solar energy is most abundantly found and the amount of
HindawiInternational Journal of PhotoenergyVolume 2022, Article ID 9194537, 21 pageshttps://doi.org/10.1155/2022/9194537

solar energy that hits the surface of the earth in an hour isenough to fulfill global needs for an entire year. This powerfrom the Sun is used in a variety of ways, such as solar heat-ing, solar thermal energy, photovoltaic, and photosynthesis.For large scale utility solar installations, solar thermal isemployed.
SAPV system or off-grid system is one that is not con-nected to any electricity distribution system. They are classi-fied into two types: direct-coupled system and stand-alonesystem. A direct-coupled system does not have a battery tostore energy and can be used only when there is enough sun-light available. Stand-alone systems, on the other hand,employ battery backups to be used at any time of the day.They may also be equipped with a sensor and dataloggerto sense and record the different parameters that need tobe observed, respectively, such as pyranometer, anemome-ter, temperature sensor, humidity sensor, and system currentand voltages. For further analysis of the obtained data, MLtools could be used.
Data collection to digitize the industry and society hasbecome a priority nowadays. A summary of the up-to-dateML with its practical applicability is discussed in [1, 2].The demand for new research concerned with AutoML(automated machine learning) is discussed in [3] so thatdependency on domain experts and time-consuming datamanipulation is reduced. To estimate the power productionof an established PV plant, a comparative analysis of threedifferent methods is performed in [4] between a SandiaNational Laboratories model, a multilayer perceptron neuralnetwork, and a regression approach. Statistical MLapproaches demonstrated more accurate power predictions.Authors in [5] propose a new feature selection-based distrib-uted ML approach to sense the active signatures of diversepower system events. The methodology presented in [5] isdemonstrated in an interrelated two-area-based microgridwith numerous kinds of energy generation arrangements.Residential energy management system is proposed in [6]such that possible loads are effectively switched on to localenergy storage based on its charge-discharge cycles and gridavailability. The automation of switchover is achieved usingartificial neural networks and support vector machine,machine learning algorithms. The work presented in [7]gives a summary of predicting means of solar irradiationusing ML styles. In [8], the application of deep learning arti-ficial intelligence procedures is reported to predict theenergy ingestion and power generation combined with theweather forecasting mathematical simulation. Ensemble-based models are proposed in [9] to fulfil a long-term fore-casting for territorial PV generation. Various predictivemodels based on ML style are trained and confirmed in[10] to estimate the real PV output power in orientationwith a satisfactory time period accurately. In [11], an in-depth analysis of the current methods used in the predictionof solar irradiance is presented to enable the selection of asuitable forecast method for the proposed system.
Authors in [12, 13] elaborated the design of an economicdatalogger capable of measuring electrical and meteorologi-cal data, which also meets the IEC requirements for SAPVsystems to operate in remote areas. The data from the logger
is collected via a SD card since telecommunications is a con-cern. All the required parameters are monitored with highaccuracy and low power consumption. The datalogger con-sists of Arduino Mega 2560 board with ATmega2560 chipand DS1307 real-time clock chip for date stamping in theSD card every time data is logged. The results and findingsare recorded and compared with the data that was takenby one commercial datalogger DataTaker DT80 during thetesting stage in [14]. In [15], a datalogger, to monitor iso-lated PV systems in developing nations, was developed usingArduino. The system met all the relevant requirements ofthe IEC standard. It is tested in harsh weather conditionsand exhibited comparable performance to commercial sys-tems, hence is found to be reliable. The microcontroller-based data acquisition systems are designed and developedfor feasible operation in [16–20]. In [21], the author devel-oped a wireless data acquisition system for weather stationmonitoring consisting of sensors to measure various atmo-spheric parameters, whose data that is collected and condi-tioned using precision electronic circuits and interfaced toa PC using RS232 linking via a wireless unit. The processingand display of the collected data are done using the Lab-VIEW program. Also, the data is available over the internetto any user. The key task of observing temperature andhumidity along with the transmission of this data in theshort message service form to users’ cellular phone is doneby the system which also offers a data-logging facility. Forfurther analysis by [22], the logged data can be transferredto a PC having a graphical user interface program.
[23] discuss a software program that could be used toacquire any Unidalog (universal datalogger) remotely asremote terminal unit by using the GSM network as an inter-mediate for data communication. Processing software pro-gram design models using transformative developmentmodels to get the system iteratively to make segments arepart of the telemetry monitoring. Further, in [24, 25], a loss-less algorithm is presented based on the statistical informa-tion with a compression ratio of up to 14: 1 to significantlyreduce the storage and telecommunication costs of large vol-umes of measured data. The development of an economicalfield datalogger model using Raspberry Pi and industrialsensors is described, and an online rain flow count algorithmis implemented in [26]. The software and hardware style forconstructing a wireless datalogger for a thermal authentica-tion system to measure and operate in a stated temperaturerange and also agreeing with International and Europeanprotocols for validation of pharmaceutical, biotechnology,and the medical device is described in [27], where the tem-perature ranges from -60°C to 150°C with total system mea-surement accuracy of 0.1°C. CBR algorithm is employed todiscover the past cases which are the most identical to thepresent case in [28]. The exactness of the model is confirmedusing past 10 years data.
Few features of photovoltaics, such as loss of load prob-ability and peak solar hour, were demonstrated and simu-lated by authors in [29, 30]. Better battery managementsystems are proposed in [31–34] to extend the life cycle ofthe batteries and smooth transition between charging anddischarging cycles. Several methodologies are studied in
2 International Journal of Photoenergy

[35–38] to minimize the cost and size of the SAPV systemwith DC-DC converters. The parallel connection of theMPPT system decreases the undesirable effect of power con-verter losses in the total efficiency since only a portion of thegenerated power is processed by the MPPT system as stud-ied in [39]. For this MPPT to operate with functions of thestep-up converter and battery charger, a simple bidirectionalDC-DC power converter is proposed. The operational char-acteristics of the proposed circuit are being investigated withthe implementation of a model in a real-time application. In[40], authors discussed the scheme that comprises three DC-DC converters and that operate in accordance with the mainbus load demand and the PV panel power. Execution of con-trol elements through the usage of One-Cycle Control per-mits great accurateness of convergence, fast response totransient conditions, and low-cost analogue application.Simulations of transition conditions are achieved throughactual states such as the absence of sunshine, cloud-edgeeffects, sluggishly passing clouds. The design and the factorsthat affect the performance of the SAPV consist of PV sizing,the consequence of shadowing, temperature, and dust, lead-ing to reduced SAPV output power and progressive degrada-tion of the PV generator and cells permanently. Specialattention is drawn by authors in [41] to the need for remotemonitoring and examination and standardized upkeep mea-sures, and a cautious design segment is encouraged forSAPV systems to remain a favored power substitute for tele-communication applications. An appropriate and rationaltechnique for selecting the optimum constraints of the parti-cle swarm optimization algorithm takes into account thetopology, constraints of the DC-DC converter, and the con-figuration of solar panels. The ideal value of the samplingperiod for the digital MPP controllers delivering their peakperformance is determined in [42] based on an innovativemethod.
Compared to the direct duty cycle method, the voltagereference control method has the attraction of fast conver-gence and minor oscillations in steady state, also analyticalcalculations of controller gains are possible in [43]. In [44],the design and cost estimation of SAPV along with MPPT,inverter, charge controller, and lead-acid batteries are stud-ied. The sizing of SAPV is achieved by taking into accountthe radiation and electrical data for a typical household inremote areas or villages using MATLAB/Simulink. The LifeCycle Cost analysis is used to evaluate the economic feasibil-ity of the system. The results are encouraging, in the sensethat, Yemeni remote areas could be electrified. The errorsmade during designing, costing, sizing, installing, and main-tenance of solar PV system are discussed in [45]. The designwas done in 2 dissimilar ways. The total price came out to bebetween US$422.5 and US$ 107.5. An alternative method toMPPT was discussed in [46] grounded on the transforma-tion of the energy parameters into new charge-relatedparameters specified by the Joint Research Center and theIEC Standard 61724. In [47], authors proposed a schemewhich when compared with traditional schemes needs areduced number of switching elements in the battery path,hence significantly reducing the cost and size of inductorsinvolved with battery charging circuits by employing simple
power management topology. The efficiency of the powerconversion stage varies with levels of irradiance. Hence, tomaximize the system efficiency over a broader array ofreal-time working environments, a novel adaptive controlscheme was proposed in [48].
For the fitted electrical devices in an independent house,the battery storage necessities are to address on the kind,size, and functioning sequence. The relation between theaccessible stored energy and the size/operational order ofthe house’s electrical equipment are highlighted in [49].The rules for the selection of a suitable site/location togetherwith the technique for the assessment of solar energy supplyat the preferred site are provided in [50]. Sizing of varioussolar system components such as panels, batteries, inverter,charge controllers, and other accessories with daily loadenergy demand considerations was studied in [50] to designand install a solar PV system. The energy management of aSAPV structure is designed taking into consideration thedrastic changes in weather conditions and rapid changes inthe energy necessities of the client. A storage unit such as asuper-capacitor is used to bring under control the mismatchof energy among the load and the SAPV system. The effec-tiveness and performance of the system in [51] is evaluatedusing MATLAB/Simulink software. The case studies of sev-eral SAPV systems in various parts of the world from[52–55] present information on guidelines, componentsrequired, the energy demand and consumed portfolio, andthe process of calculation.
IoT-based solutions are proposed by researchers in[56–58] to make available appropriate and suitable sourcemanagement, load shedding, data acquisition, and controlof the SAPV systems and monitor and evaluate the electrifi-cation projects. [59] show that IoT provides the capability tobring into use the MATLAB, ThingSpeak, and other tools/functions by granting the authority to one person to operatethe forecasting system. Overall, the entire effort lessens.MAPE does not depend on the scale, there is possibility ofintuitive interpretation and it is also easy to compute is pre-sented in [60]. The authors in [61–63] discussed that thesimulation and design of a hybrid system in an islandedlocation is actually feasible ecologically and economically.There is a drop in emission of CO2, lesser energy, and netcost. The work done in [64–68] evaluates the numerousstrategies of load dispatch of islanded microgrid systems.The outcome attained gives a proper parameter to compareand approximate sizes of modules and its related costs.
This paper was aimed at developing a novel scaled-downprototype of an IoT-enabled datalogger for PV panels thatare installed in a remote location where human interventionis not possible due to harsh weather conditions or other cir-cumstances. An IoT platform is used to store and visualizethe captured data. The collected data from the dataloggeris used as a training set for ML algorithms. The estimationof power generation is done by a LR algorithm. Further, awebsite is developed wherein the user can input the dateand time. The output of that transaction is predicted tem-perature, humidity, and forecasted power generation of thespecific standalone PV system. Hence, the proposed IoT-enabled datalogger extensively contributes in realizing a
3International Journal of Photoenergy

self-sufficient small-scale off-grid photovoltaic system sinceit does not require involvement of any individual in provid-ing and predicting power. The proposed small-scale off-gridphotovoltaic system has applications in electrification ofsecluded, rural, isolated, and remote areas/homes. It can alsobe utilized by regions facing frequent power cuts. This sys-tem is also capable of supplying electricity under naturaldisaster circumstances.
The organization of the article is as follows: Section 2explains the methodology to be followed for realizing theIoT-enabled datalogger for SAPV networks. It also discusseshow ML algorithms are employed to forecast power genera-tion. The purpose of creating the website is also discussed inthis section. Section 3 discusses the system designing indetail for the hardware prototype of the proposed datalog-ger. It also explains how the logged data serves as the train-ing data to the ML algorithms. The output of the algorithmis the forecasted power generation. Section 4 elaborates how
the datalogger is implemented on the 40W PV panel andalso how the data is logged. LR algorithm is effectively usedon the training data to predict the power generation in thewebsite as well. Section 5 concludes working model of thedatalogger for SAPV networks.
2. Methodology
2.1. Datalogger for SAPV Network. The main objective of thiswork is to develop a low-cost IoT-enabled datalogger for aremotely deployed standalone solar PV system. The datalog-ger contains calibrated digital sensors and a microcontroller.The sensors monitor and logs performance parameters ofthe PV system and the microcontroller which has a connec-tion to an IoT server through a Wi-Fi connection send themeasured data to the server. While collecting data, the sen-sors may tend to log erroneous values or miss logging afew values. To avoid the above-mentioned scenarios, two
Dat
aco
llect
ion
Dat
apr
epar
atio
n
Choo
sing
a mod
el
Eval
uatin
gth
e mod
el
Trai
ning
the m
odel
Mak
ing
pred
ictio
ns
Para
met
erTu
ning
Dco
lle
a tion
Cho
a m Eval
the m
ng odel
Ma
pred
eter
ng
Figure 2: Block diagram of the basic machine learning stages.
PV array
Vol
tage
Curr
ent
Am
bien
tte
mpe
ratu
re
Relativehumidity
Micro
controller
IoT server
Sensor
%
IOT
Figure 1: Data from PV panel to an IoT server.
4 International Journal of Photoenergy

data predicting algorithms are employed. The performanceof the two algorithms is compared, and based on the appli-cation, one of the algorithms is deployed. On the server-side,users can view live generation performance and can exportdata to an excel sheet for further data analysis.
A datalogger is designed for the PV system as demon-strated in Figure 1. The datalogger consists of a sensor tomeasure photovoltaic parameters such as voltage and cur-rent and a microcontroller that is connected to an IoTserver. The sensors collect information and transmit it tothe computer via direct serial connection or directly beingsent to an IoT server, where it is further viewed and ana-lyzed. Appropriate software and weather data providingplatforms are used to store, display, and process the collecteddata. The collected data then proceeds to the ML algorithmfor estimating power generation for the next 30 days.
2.2. Machine Learning-based Prediction Algorithms. Themachine learning stages are shown in Figure 2. The dataloggerinitially collects performance parameters of PV panel, voltage,and current and sends it to the ThingSpeak server. This serverprovides storing and graphical representation facility. The col-lected data from the datalogger is used as a training set for theML program where the algorithm analyzes the collected dataand attempts to relate measured data with weather parameterssuch as temperature and relative humidity.
The algorithms employed here are the following:
2.2.1. Linear Regression. LR is a mathematical approach toderive a linear relationship between two variables. It doesso by finding a linear line that best fits the data points. The
equation of a line is used to predict output values that arenot present in the data set. LR is fast and used extensivelyin analysing and predicting data sets. Upon executing thecalculation of LR, it creates a LR line equation. The equationhas two variables: temperature and relative humidity, andthe substitution of these two values will predict the powergeneration. This process also minimizes errors.
2.2.2. Polynomial Regression. PR has an independent variablex and a dependent variable y. The relationship between thevariables is a polynomial of nth degree. Hence, the plotforms a curve. This algorithm can adjust to multiple varietyof curves but requires additional effort to realize the appro-priate fit and interprets the role of its independent variables.
2.3. GUI for Viewing Forecasted Power. A webpage, which iscreated, acts as the GUI to view the generated parameters.The user needs to feed the date and time so that the web-page fetches its corresponding temperature and relativehumidity from weather forecasting servers to display gen-erated wattage. The constant record of performance andfailure data is enabled by IoT so that it can used for ana-lytics of predicting and forecasting the impending powergeneration potentials, revenue generation, etc. Photovoltaicsystems fitted at isolated or faraway places from the con-trol center can be accessed using IoT which also helps inimproving the efficiency of the system, reducing humaninvolvement and supervision time, and facilitating networkmanagement.
Mea
sure
men
t uni
t
Data logger
ACS 712 currentsensor
LV25 voltagesensor
Measurement ofgenerated current
Measurement ofgenerated voltage
Measurement ofgenerated power
Uploading live datato the IoT server
Analysis ofcollecteddata
Arduino uno+ESP8266
Thingspeak IoTServer
Publishing datato the website
Working withIoT
Power generationestimation
Linearregression
TemperatureRelative
humidity
Obtaining weatherinformation from
visual-crossing
Training set
Machine learning alogrithmfor estimation of power
generation
Dat
a pro
cess
Figure 3: The methodology of proposed machine learning-based power forecasting in SAPV networks.
5International Journal of Photoenergy

3. System Designing
Figure 3 gives a detailed overview of the methodology incor-porated in this article. The design is categorized into twoparts: hardware and software. The hardware platform involvesrealizing a low-cost data monitoring system that gathers dataand stores them in the IoT server. To predict power genera-tion, the machine learning algorithm requires at least 4months of performance data of PV panel for best results.Due to time constraints, the collection of so much data wasimplausible. Hence, appropriate approximate values were usedfor training sets. The software part consists of MATLAB forML algorithm, an IDE for Arduino, and a webpage for viewingthe real-time performance of solar PV panel and estimation ofgeneration. ThingSpeak platform is programmed to show thevoltage and current of a standalone PV panel.
3.1. IoT Based Datalogger
3.1.1. Selection of Microprocessor. The selection of suitablehardware was based on the use of open-source softwareand hardware that will allow us to attain the economicalobjective of the final system. Among the plentiful micropro-cessors based upon open-source hardware available in themarket, Arduino Uno is chosen for its low-cost, flexibility,and widespread popular developer community. The Ardu-ino DIY board is based on the ATmega328 microcontrollerand has 14 digital I/O pins, 6 analogue inputs, a power jack,USB connection, and a reset button. The board comprises ofeverything essential to support the microcontroller and itcan work using an external supply or any standard USB portusing USB type A to USB type B connector cable.
It offers advantages over other development kits such asthe following:
(i) Easy programming tool: Arduino programming isdone by its free IDE software being beginner-friendly yet flexible enough for advanced users.Arduino IDE is a very small, lightweight programthat requires very basic system requirements:
(a) Microsoft Windows XP with SP2, Windows 7,Windows 8/8.1, and Windows 10 operatingsystem
(b) Microsoft .NET Framework 3.5 or higher
(c) Intel Pentium/AMD Athlon processor or equiv-alent running at 1GHz or more
(d) 512MB RAM (1GB RAM recommended)
(e) 10MB free hard drive space or more (only forPROGRAMINO IDE for Arduino)
(f) It can run on any modern low-end PC, andunlike Raspberry Pi, it does not require anyexternal development environment or second-ary operating system to work with
(g) It uses a modified version of basic C/C++ pro-gramming language and has a built-in compilerwith an error notifier
(ii) Low-cost: Arduino board especially Nano and Unovariants are relatively cheaper than their counter-parts by a high margin. The least expensive ArduinoUno board costs around ₹250, and it can even beassembled by hand which will reduce its costs evenfurther. Compatible sensors are also cheap and eas-ily available in the market
(iii) Cross-platform: Arduino IDE is available on mostof the commonly used operating systems. Whereasits rivals like Raspberry Pi require their own OSand are difficult to set up especially in Macbooks.Most of the DIY development board does not sup-port Linux and ChromeOS but Arduino does
(iv) Expandable software: The Arduino IDE supports C/C++ language, and it receives OTA update overtime. It also has a board manager to download andinstalls an external development board. It also hasa library manager which lists available externallibrary from its GitHub page. Many extensions arealso available for the Arduino IDE
(v) Expandable Hardware: Arduino supports UART,I2C, and SPI protocol through which it can connectto a plethora of modems. Arduino is an open-sourceproject, so an experienced circuit designer can addmore features to it and publish it for others to use.There are many modified versions of Arduino boardavailable to choose from as per one’s need andrequirement
3.1.2. Selection of Sensors and Internet Module. The sensorsused to collect the data required to carry out this work aredescribed in the following subsections.
(1) Voltage sensor. The voltage is measured and recorded bythe new low-cost voltage sensor LV25, which works on theprinciple of resistive voltage divider design. The voltagedetection sensor is very cheap and easily available in themarket. Its interfacing with Arduino Uno board is also verysimple. It uses a potential divider to decrease any input volt-age by a factor of 5 permitting the user to use the analog pinof a microcontroller to monitor voltage greater than itscapacity. The specifications of the voltage-sensing deviceare given in Table 1. Some of the features of LV25 are asfollows:
(i) Small in size and compact
(ii) High personnel safety
(iii) High-degree of accuracy
Table 1: Specifications of voltage sensing device.
ComponentModelno.
Detectionrange
AccuracyAnalog
resolution
Voltagesensor
LV250.02445V to
25V±0.01V 0.00489V
6 International Journal of Photoenergy

(iv) Nonsaturable
(v) Wide dynamic range
(vi) No external components required
(vii) Easy to use with microcontrollers
(2) Current sensor. The PV current is measured by ACS712hall-effect sensor. It is a low-cost sensor and is compatiblewith Arduino Uno. The device consists of a precise, low-off-set, and linear hall sensor circuit with a copper conductionpath located near the surface of the die. The hall-effect sen-sor detects current by magnetic field generation. Upondetection, a proportional voltage is generated whichbecomes the raw data measurement for the microcontroller.Arduino Uno uses this raw data to calculate proportionalcurrent for the corresponding voltage. The specifications of
the current sensing device are given in Table 2. Some ofthe features of ACS712 are as follows:
(i) Better accuracy
(ii) Minimum power loss
(iii) Low-noise analogue signal path
(iv) Device bandwidth is set via the new filter pin
(v) Stable output offset voltage
(vi) Near zero magnetic hysteresis
(3) Wi-Fi module. The Arduino Uno board cannot connectto the internet on its own. Hence, a small and cost-efficientWi-Fi module ESP8266 is being employed here. It providesinternet access using a built-in micro-Wi-Fi modem and
Table 2: Specifications of current sensing device.
Component Model no. Range Internal conductor resistance Output error Bandwidth Output sensitivity
Current sensor ACS712 0 – 5 A 1.2 mΩ1.5% at
TA = 25°C 80 kHz 66 to 185mV/A
Table 3: Specifications of Wi-Fi module.
Component Manufacturer Model no.Operating values Recommended values
Voltage Current Voltage Current
Wi-Fi module Espressif systems ESP8266 3.3V 400mA 3.3 V 300 – 800mA
Read the measureddata points from
the sensors
Set the weightsof the measured
data set
Compute the errorrate of measured
data set
Calculate predictionvalue for the
erroneous/missingdata
Are all themeasured
data points read? Start
Stop
Yes
No
Figure 4: Prediction process of erroneous/missing data.
7International Journal of Photoenergy

supports Wi-Fi 802.11 b/g/n protocol offering a completeand self-contained Wi-Fi networking solution. It allows toeither host the application or offload all Wi-Fi networkingfunctions from another application processor.
ESP8266 can boot up directly from an external flashdrive. It has its memory and integrated cache storage. Itremembers data like previously connected Wi-Fi SSID (ser-vice set Iidentifier) and password and automatically getsconnected to the remembered Wi-Fi network if it is avail-able. It can provide internet accessibility basically to any
device which supports a UART connection. The specifica-tions of the Wi-Fi module are given in Table 3. Some fea-tures of ESP8266 are as follows:
(i) Low-cost: ESP8266 is very cheap and can be foundin the market for less than ₹400. It is fast and easyto use and compatible with most of the develop-ment boards
(ii) Plug and play: It requires very basic wiring with theArduino. It has two inbuilt LED (light-emittingdiode) for showing transmission and receivingoperation
(iii) Integrated Circuit: ESP8266 does not require anyexternal resistor or capacitor, it has an integratedTR switch, balun, low-noise amplifier, power ampli-fier and matching network; integrated PLL (phase-locked loop), regulators, power management units,
End
Develop aGUI todisplay the results
Are there anymatched cases?
No
Yes
Compare the cases in thedatabase with previously
stored cases
Decided the types ofstatistical method
to be used
Store data inthe database
Store the obtainedresults in the database
for future reference
Fetch datafrom sensorsStart
Dat
asto
ring
Dat
aco
llect
ion
CBR
algo
rithm
Vie
win
g re
sults
Figure 5: CBR algorithm.
Table 4: Specifications of Arduino Uno.
ParameterVoltage
Operating current MicrocontrollerOperating Recommended
Rating 5V 5 – 12V 0.04A Built-in ATmega328
Table 5: Rating of the PV panel.
ParameterMaximumvoltage
Maximumcurrent
Maximum powergeneration
Rating 16.4 Vmp 2.44 Amp 40W
8 International Journal of Photoenergy

and +19.5 dBm output power in 802.11b mode;integrated temperature sensor; and integratedMIMO antenna
(iv) Fast boot and recovery: ESP8266’s latest firmwareallows it to boot up quickly and recover cache mem-ory in no time. It wakes up and transmits packets inless than 2ms and has very low power consumption
3.2. Forecasting Based on Linear and Polynomial RegressionAlgorithm. The collected data from the datalogger is usedas a training set for the machine learning program, whereasthe machine learning algorithm analyzes the collected dataand attempts to relate measured data with weather parame-ters such as temperature and relative humidity. Linear andPRs are a mathematical approach to derive a linear relation-ship between two variables. It does so by finding a linear linethat best fits the data points. The equation of a line is used topredict output values that are not present in the data set. LRis fast and is used extensively in analysing and predictingdata sets. The prediction process of erroneous/missing datais shown in Figure 4.
The estimation of power generation is executed by linearand PR algorithms between generated wattage and tempera-ture, humidity for estimating power generation. Irradiance,wind direction, wind speed, and dew point are also the keyelements that affect PV panels. Irradiance measurementinstrument (pyranometer) is an expensive tool, and in mon-
itoring wind direction, wind speed is also an arduous thingto do. But if the cost is not a concern, then one can furtherenhance the prediction by adding these factors too.
3.3. Challenges. During the development of the prototype,there were many issues for which alternative solutions werebrainstormed and implemented. The first constraint facedwas the implementation of ESP8266 in the circuit since pro-gramming it as per need was a challenge. The initial planwas to use a GSM module, but it was expensive and can onlysend a text message to a GSM number, and the proposedwork required something which could store data in thecloud.
Secondly, IoT is often thought to be the future of theinternet. Ever since the world has got fast personal internet,people are working towards an interconnected world where
Figure 6: Circuit diagram of datalogger.
Figure 7: Testing datalogger with solar PV emulator.
Figure 8: Solar PV emulator.
9International Journal of Photoenergy

Figure 9: Monitoring power generation of Solar PV emulator.
Figure 10: Setting up datalogger with roof-top panel to monitor performance data.
Figure 11: Power generation of 40W PV panel.
10 International Journal of Photoenergy

every machine, be it small or huge, communicates with eachother and makes life easier than it already is. The internetcovers almost the entire world, and the world has both goodand bad sides. On the bright side, we have IoT as an emerg-ing technology that aims to play a crucial role in savingmoney, conserving energy, better monitoring, and powermanagement, and now we are on the verge of the upcomingsuperfast fifth generation of internet, the 5G. On the otherhand, it also raises questions regarding privacy, data breach,
social, and technical challenges. Some researchers havefound that making life this much easier may make human-kind lazy and inactive.
3.4. Forecasting Based on CBR. The CBR is an artificial intel-ligence technique that solves new problems by comparing it tothe old cases or by fetching solution to the new problems fromits past experiences. This algorithm is predominantly appliedwhen the available data is incomplete, erroneous, missing,
2030
31
32
33
34
35
36
37
38
39
22 24 26 28 30 32 34
Gen
erat
ed p
ower
in w
ait
Temperature in°C
Figure 12: PR between power and temperature.
31
32
33
34
35
36
37
38
38
22 24 26 28 30 32 34
Gen
erat
ed p
ower
in w
ait
Temperature in°C
Figure 13: LR between power and temperature.
Table 6: Essential cloud services.
Cloud service Visual-crossing ThingSpeak
Description Weather data acquisition platform IoT cloud server to save measured data
11International Journal of Photoenergy

Table 7: Methods of analysing meteorological data.
Ref. Paper titleType of
meteorologicaldata
Method Inference
[28]Transformer failure diagnosis using fuzzyassociation rule mining combined with case
based reasoning— Hybrid
CBR algorithm is employed to discover the past caseswhich are the most identical to the present case. Theexactness of the model is confirmed using past 10
years data.
[69]A hybrid algorithm for short-term solar power
prediction - sunshine state case studyHourly Hybrid
Results obtained from the hybrid algorithm are moreaccurate with fast convergence compared to the
classic algorithm.
[70]A hybrid ensemble model for interval
prediction of solar power output in shiponboard power systems
Hourly HybridThe hybrid algorithm gives outcomes with high
efficiency considering the meteorological data alongwith the ship’s swinging as the input parameters.
[71]A lightweight short-term photovoltaic power
prediction for edge computing
Data sampledevery 30minutes
HybridCompared to other standard ML algorithms, thetechnique employed here is remarkable and is
capable of making short-term power predictions.
[72]A local training strategy-based artificial neuralnetwork for predicting the power production
of solar photovoltaic systemsHourly Intuitive
Various tests were conducted that showed thesuperiority of the proposed ANN over the
benchmark ANN training strategies.
[73]A practicable copula-based approach for
power forecasting of small-scale photovoltaicsystems
Daily NumericalFrom the results, it is clear that the mathematicalmodel used here gives satisfactory prediction for
cloudy days.
[74]A solar time based analog ensemble method
for regional solar power forecastingHourly Hybrid
The proposed model adapts easily to the changingweather conditions irrespective of the location with
high forecasting accuracy, few parameterrequirements, data management, etc.,
[75]Ensemble approach of optimized artificial
neural networks for solar photovoltaic powerprediction
Daily Intuitive
Accurate day-ahead power prediction is obtainedand is verified against a real case study. The numberof hidden neurons in the hidden layer of ANN isoptimized using trial and error method of the
proposed model.
[76]Photovoltaic power forecasting with a hybrid
deep learning approachDaily Hybrid
The proposed hybrid method is compared with threeother benchmark methods and is shown to have very
small prediction errors.
[77]Power generation forecast of hybrid PV-wind
system4 hours daily Numerical
The duration for which data samples are incompleteor missing can be predicted by using the proposed
method.
[78]Prediction of photovoltaic power generation
based on general regression and Backpropagation neural network
Daily Numerical
Temperature and irradiance were found to be the keyparameters. Back propagation neural network
predicted accurate results, but general regressiontechnique was more appropriate for big data sets.
[79]Probabilistic forecasting of photovoltaic
generation: An efficient statistical approachDaily Probabilistic
The technique employed here exhibits very highcomputational efficiency and proves to be
remarkably effective.
[80]Real-time anomaly detection for very short-
term load forecastingDaily Numerical
A way to detect and replace anomalies/corrupteddata is proposed here whose performance surpasses
state-of-the-art methods.
[81]Day-ahead hierarchical probabilistic load
forecasting with linear quantile regression andempirical copulas
Daily HybridA simple linear regression is adopted here for of
accurate prediction improvement.
[82]Direct quantile regression for nonparametric
probabilistic forecasting of wind powergeneration
Hourly ProbabilisticThe proposed linear programming gives a simplesolution with high computational efficiency and
flexible framework.
[83]Solar power probabilistic forecasting by using
multiple linear regression analysisHourly Numerical
The forecasting result was satisfactory using linearregression
12 International Journal of Photoenergy

Table 7: Continued.
Ref. Paper titleType of
meteorologicaldata
Method Inference
[84]IOT based online load forecasting using
machine learningHourly Numerical
Compared to all the ML algorithms, LR MLalgorithm is found to be better as per the parametersis considered in this paper. Forecasting consumptionof power for the next-hour is done using the online
IoT platform.
Probabilistic Intuitive
Numerical
Hybrid
No. of research work based on analysis type
Method of analysis
No.
of p
ublic
atio
ns
0
1
2
3
4
5
6
7
8
Figure 14: Number of research work based on method of analysis.
Figure 15: Comparison of measured and predicted results.
Figure 16: Testing predicted wattage with measured wattage.
13International Journal of Photoenergy

WattagePredicted wattage with only temperature (proposed LR method)Predicted wattage with only temperature (CBR) [28]
1 2 3 4 5 6 7 8 9 10 11 12 1332
33
34
35
36
37
38
39
40
Pow
er
Comparison chart showing actual power and predicted power withonly temperature
Figure 17: Comparison chart showing actual power and predicted power with only temperature.
WattagePredicted wattage with only temperature (proposed LR method)Predicted wattage with only temperature (CBR) [28]
1 2 3 4 5 6 7 8 9 10 11 12 1332
33
34
35
36
37
38
39
40
Pow
er
Comparison chart showing actual power and predicted power withhumidity correction
Figure 18: Comparison chart showing actual power and predicted power with humidity correction.
Predicted wattage with humidity correctionPredicted wattage with only temperature
Predicted wattage
% Accuracy using proposed LRmethod
% Accuracy using CBR (28)
Comparison chart showing % accuracy using CBR and LR
95.00 96.00 97.00 98.00 99.00 100.00 101.00
Figure 19: Comparison chart showing % accuracy obtained using CBR and LR.
14 International Journal of Photoenergy

and corrupted, and the rule-based reasoning does not give sat-isfactory solution. The implementation of CBR algorithm isdepicted in Figure 5.
3.5. Other Component Specifications. The specifications ofvarious components and the essential cloud services usedto develop the proposed work are tabulated. Table 4 showsthe specifications of Arduino Uno. The ratings of the PVpanel used are given in Table 5, and Table 6 lists the essentialcloud services used.
4. Experimental Results and Discussion
The proposed model of forecasting of generated power is builtand verified under different scenarios to assess its superiorityand performance. The assessment and obtained results of theproposed model is discussed in the following subsections.
4.1. Datalogger Realization. The voltage and current sensorare connected to the pins of Arduino Uno which is pro-grammed using an Arduino IDE. ESP8266 Wi-Fi modem
is paired with the Arduino Uno to enable wireless capabilityon the Arduino Uno development board. ESP8266 is flashedwith custom firmware to be able to receive and transmit dataover the internet. The sensor is manually calibrated andtested with a high precision multimeter. The sensors collectdata in real-time and transfer it to the Arduino Uno devel-opment board using its analog pins. Upon receiving raw datafrom the sensors, Arduino Uno is programmed to calculatethe performance parameters. This data is sent to be storedin the cloud via the Wi-Fi module.
The voltage and current sensors are connected to digitalI/O pins of Arduino, whereas ESP8266 Wi-Fi modem is con-nected to digital pin 2 and 3 which are acting as TX and RXas shown in Figure 6. The reason behind not using thedefault TX and RX pin is that Arduino board resets itselfeach time it starts an operation, and while resetting, thereshould not be any connection on the default TX and RXpin otherwise it will come up with an error code and willnot initialize. The Wi-Fi modem has an inbuilt antennaand it works as either a Wi-Fi hotspot or Wi-Fi receiver with
Predicted wattage with only temperaturePredicted wattage with humidity correction
Comparison chart showing % MAPE of LR and CBR
0.000
2.000
1.000
3.000
4.000
0.500
2.500
1.500
3.500
4.500
Proposed LR method CBR (28)
Algorithms used
% M
APE
Figure 20: Comparison chart showing % MAPE.
Figure 21: Homepage of developed website.
15International Journal of Photoenergy
inbuilt microprocessor and memory. It does not come withany firmware installed in its memory. The users have to flashthe latest firmware by themselves which is provided by themanufacturer. In this project, the latest Non-Os AT firm-ware version, 1.6.2 is being used. The ESP8266 modemserves as a communicator between the datalogger and IoTserver.
IoT capability is incorporated by the ThingSpeak IoTserver. It is a free and open-source platform to store andretrieve data. It is one-of-a-kind, easy, and simple authenti-cation system that makes it the most popular IoT serverfor research and project purposes. ThingSpeak providesreading and writing capabilities to its channels by giving aunique API key for each channel.
An IoT-based datalogger for a standalone PV panel isdeveloped with generation estimation capability. A hardwareprototype is realized for a scaled-down version of the data-logger circuit. IoT is incorporated by Arduino Uno andESP8266 Wi-Fi module to collect the performance parame-ter of solar PV panels such as current and voltage and tostore and visualize these on the ThingSpeak server. The tem-perature and relative humidity are obtained by Visual-Crossing weather API. Visual-Crossing is a free weatherforecasting service. It provides hourly or daily based weatherdata for any given date and location. First up, a dataloggercircuit was assembled to monitor the data of the solar panel.The developed datalogger circuit was tested with a solar PVemulator as shown in Figure 7.
The solar PV emulator emulates power generationthrough the photovoltaic panels in a closed box. A brightelectric bulb emulates solar irradiance, and two small setsof PV arrays work as a PV panel. These PV panels are con-nected to an inbuilt measurement instrument that displays
voltage and current reading in an LCD mounted in frontof the emulator system as displayed in Figure 8. The solarPV emulator has two knobs through which temperature orvoltage and current generation can be adjusted. It has aswitch that switches between external or internal measure-ment instruments. It has a power outlet pin to attach exter-nal measurement monitoring instruments. The dataloggersystem is attached and tested, and sensors were calibrated.
4.2. Data Collection. The output of the datalogger is moni-tored in the serial monitor window of Arduino IDE. Ascreenshot of the same is attached in Figure 9. The PV panelperformance data for the next ten days is collected from a40W PV panel. Interfacing the datalogger to the PV panelis demonstrated in Figure 10. The power generated is mea-sured and is shown in Figure 11 along with its respectivedate and time stamp. The monitored data is analyzed andstored on a local computer.
4.3. Forecasting Based on Linear and Polynomial RegressionAlgorithms. In this section, linear and polynomial regressionalgorithms are employed to forecast the missing/erroneousvalues of voltage and current obtained from the datalogger.
4.3.1. Polynomial Regression Algorithm. The data is used as atraining set to train the ML algorithm namely PR. The out-put is a curve. It is considered to be better than LR if the var-iables in the data set have little to no linear relations betweenthem. The degree of the polynomial equation can also beadjusted for best fitting. Figure 12 shows the PR betweenpower and temperature. The red dots are the measuredpoints and the blue curve is its linearity.
Relative humidity
Gen
erat
ed p
ower
in w
att
45
32333435363738
50 55 60 65 70
Figure 23: LR between generated power and relative humidity.
Figure 22: Website displaying estimated power.
16 International Journal of Photoenergy

4.3.2. Linear Regression Algorithm. The captured data as inFigure 11 is also used to train another ML algorithm suchas LR, and its output is a straight line. Figure 13 shows theLR between power and temperature. The blue dots are themeasured points, and the red line is its linearity. Table 7summarizes the methods of analysing meteorological datafor power prediction. From the research papers studied, wefind that regression method is simpler to implement. Thereare better algorithms available for power forecasting, butdue to limited data availability and usage of few parametricvariables, the regression technique is more suitable. Hence,the proposed algorithm for power forecasting in SAPV sys-tems for the hourly data accessible is LR. Figure 14 showsthe number of research articles deliberate based on methodof analysis.
4.4. Comparison Summary of Linear and PolynomialRegression Algorithms. The results of both the algorithmsare compared. PR does the same thing as LR but by fittinga polynomial equation to the given data sets. Hence, theresult is a curve instead of a straight line. While doing inter-nal testing, the results of PR, Figure 12, were not satisfactorywhen compared to LR as displayed in Figure 13. It is evidentthat LR fits more accurately than PR. Also, the predictionerror and error percentage are noticeably high with the lat-ter. And going higher than 6 degrees of PR resulted in evenmore inferior curve fitting. Also, going lower than 6 degreeswas not satisfactory for the considered system. Hence, LR ischosen as the ML algorithm for the analysis of data from thedatalogger of the SAPV network.
4.5. Data Analysis. The ML algorithm namely LR fetched theweather data (temperature and relative humidity) from anAPI namely Visual-Crossing. Using the fetched data, theML algorithm is able to estimate the power generation ofthe PV panel for the next 30 days. Figures 15 and 16 showthe comparison between measured and estimated powergeneration. As seen in Figure 15, column E contains themeasured power of the PV panel and column F and G arethe estimated values. Column F lists estimated power gener-ation when only the temperature is being considered in thealgorithm whereas column G lists estimated power genera-tion when both temperature and relative humidity are beingused for estimation. From Figure 15, it is evident that theobtained wattage with only temperature has an accuracy of94%, and similarly, the obtained wattage with both temper-ature and humidity correction is 98.955%. The estimatedpower is found to be more accurate while taking both theparameters, temperature, and relative humidity into accountas in Figure 16.
The data recorded in Figure 16 is assessed, and the cor-responding results are depicted. Figure 17 compares thewattage with the predicted wattage obtained using both LRand CBR algorithms when only temperature is considered.Figure 18 compares the wattage with the predicted wattageobtained using both LR and CBR algorithms when humiditycorrection is considered. MAPE is the measure of the fore-casting system accuracy. The lower the error, the better willbe the prediction. Figures 19 and 20 illustrate the % accuracy
and % MAPE attained using CBR and LR algorithms, henceproving that LR is a better power prediction option thanCBR. Figure 19 shows that there is a 3.51% increase in thepercentage accuracy of predicting wattage with only temper-ature using the proposed LR method than the CBR method.Also, there is a 1.24% increase in the prediction of wattagewith humidity correction between the two methods.Figure 20 depicts the comparison of percentage MAPEbetween LR and CBR methods. The % MAPE is 2.958 and3.978 for LR and CBR methods, respectively, for predictedwattage with only temperature. For the prediction of wattagewith humidity correction, the % MAPE is 1.321 and 2.374for LR and CBR methods, respectively. On comparing boththe set of values, it is obvious that LR method has lower %MAPE than CBR method.
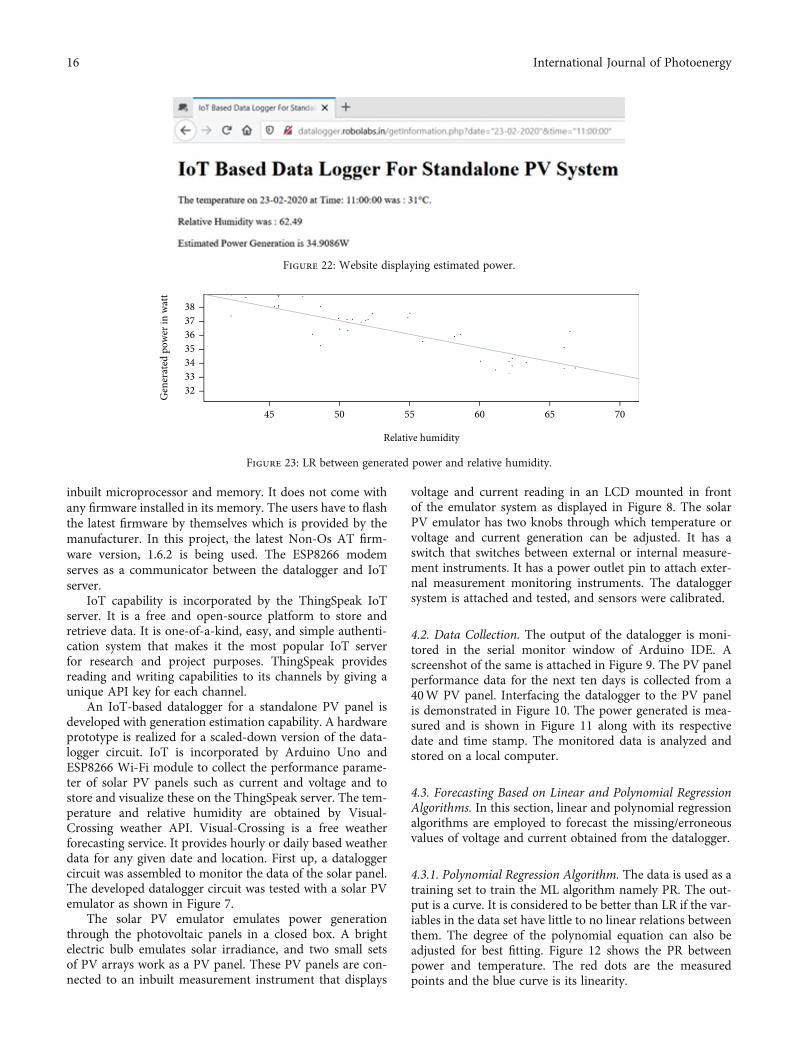
The measured performance data of the PV panel is sentto the ThingSpeak IoT server by the microcontroller. Thing-Speak provides an easy and hassle-free setup to import datafrom various IoT-enabled sensors. The developed webpage isshown in Figure 21 containing a graphical representation ofcurrent and voltage in real-time. It also has a drop-downmenu bar to select date and time, and clicking on Get Infor-mation navigates the page to the next page where it showsthe estimated power generated for the entered date and timeas seen in Figure 22. ThingSpeak then plots a graphical visu-alization of received data concerning time for each set ofparameters individually. These graphs are updated in real-time and can be used to attach anywhere on the web throughan embedded link. The website also has a back-end connec-tion to the MATLAB server for the estimation of power gen-eration. MATLAB server is programmed in such a way thatupon entering date and time, it obtains weather informationsuch as relative humidity and temperature from Visual-Crossing API for the entered date and time and substitutesthese two in the LR algorithm. The algorithm calculates esti-mated power generation and displays it on the website as canbe seen in Figure 22. Figure 23 shows the linear relationbetween generated power and relative humidity. The bluedots are the measured points and the red line demonstratestheir linearity.
5. Conclusion
In this paper, a new low-cost portable datalogger to monitorPV systems is designed, tested, and analyzed. The systemdesign attributed easy-to-obtain hardware and free software,making it available to any investigator or user for the prog-ress of schemes of their design and usage. This adjustabilityand adaptability makes the system more appropriate forintended applications like monitoring of PV plants and thecollection of data from PV panels at isolated sites in develop-ing nations.
LR machine learning algorithm is successfully used. Thedata from the datalogger serves as the training data set forthe algorithm. The forecasted power generation is the outputof the machine learning algorithm, which is tested with real-time data and found out to be accurate with less than 10%error. To store the measured data of voltage and current,sensor two channels of Thing Speak are used. Once date
17International Journal of Photoenergy

and time are keyed in, forecasted power generation for theentered date and time is computed. The website also has aback-end connection to the MATLAB server for the estima-tion of power generation.
The price of the proposed system is significantly lessthan commercially available devices, with little loss of accu-racy and precision. Essential data for energy managementsystems are provided by the power generation estimationsystem. For use by researchers and in developing nations,this datalogger permits additional study. The subsequentphases include achieving lower power consumption, developa small SAPV system realized with Arduino, using wirelesstechnologies for communication aspects, scrutinizing thepricing meticulously. The proposed work has a very widescope and can be conveniently used for standalone PVplants which are usually installed in a remote location wherehuman intervention is not possible due to harsh weather orother circumstances.
Abbreviations
A: AmpereAC: Alternating currentAmp: Current at maximum powerAPI: Application programming interfaceAT: AttentionCBR: Case based reasoningdBm: Decibel-milliwattsDC: Direct currentDIY: Do it yourselfGB: Giga byteGHz: Giga hertzGSM: Global system for mobileI/O: Input and outputI2C: Inter-integrated circuitIC: Integrated circuitIDE: Integrated development environmentIEC: International electrotechnical commissionIoT: Internet of thingskHz: Kilo hertzLCD: Liquid crystal displayLR: Linear regressionmΩ: Milli ohmmA: Milli ampereMAPE: Mean absolute percentage errorMB: Mega byteMIMO: Multiple-in multiple-outML: Machine learningMPP: Maximum power pointMPPT: Maximum power point trackingms: Milli secondmV/A: Milli volt per ampereOS: Operating systemOTA: Over the airPC: Personal computerPR: Polynomial regressionPV: PhotovoltaicPWM: Pulse width modulationRAM: Random access memory
RX: ReceiveSAPV: Stand-alone photovoltaicSD: Secure digitalSPI: Serial peripheral interfaceSTBC: Space-time block codingTA: Ambient temperatureTHD: Total harmonic distortionTR: Transmit/receiveTX: TransmitUART: Universal asynchronous receiver-transmitterUSB: Universal serial busV: VoltageVmp: Voltage at maximum powerW: WattWi-Fi: Wireless fidelity.
Data Availability
The data used to support the findings of this study areincluded in the article.
Conflicts of Interest
The authors declare that there is no conflict of interestregarding the publication of this article.
References
[1] L. Tuggener, M. Amirian, K. Rombach et al., “Automatedmachine learning in practice: state of the art and recentresults,” in 2019 6th Swiss Conference on Data Science (SDS),pp. 31–36, Bern, Switzerland, 2019.
[2] Y. Roh, G. Heo, and S. E. Whang, “A survey on data collectionfor machine learning: a big data - AI integration perspective,”IEEE Transactions on Knowledge and Data Engineering,vol. 33, p. 1, 2021.
[3] K. Chauhan, S. Jani, D. Thakkar et al., “Automated machinelearning: the new wave of machine learning,” in 2020 2ndInternational Conference on Innovative Mechanisms for Indus-try Applications (ICIMIA), pp. 205–212, Bangalore, India,2020.
[4] G. Graditi, S. Ferlito, and G. Adinolfi, “Comparison of photo-voltaic plant power production prediction methods using alarge measured dataset,” Renewable Energy, vol. 90, pp. 513–519, 2016.
[5] M. Al Karim, J. Currie, and T. Lie, “Dynamic event detectionusing a distributed feature selection based machine learningapproach in a self-healing microgrid,” IEEE Transactions onPower Systems, vol. 33, no. 5, pp. 4706–4718, 2018.
[6] N. Krishna Prakash and D. Prasanna Vadana, “Machine learn-ing based residential energy management system,” in 2017 IEEEInternational Conference on Computational Intelligence andComputing Research (ICCIC), pp. 1–4, Coimbatore, India, 2017.
[7] C. Voyant, G. Notton, S. Kalogirou et al., “Machine learningmethods for solar radiation forecasting: a review,” RenewableEnergy, vol. 105, pp. 569–582, 2017.
[8] T. Sogabe, H. Ichikawa, K. Sakamoto et al., “Optimization ofdecentralized renewable energy system by weather forecastingand deep machine learning techniques,” in 2016 IEEE Innova-tive Smart Grid Technologies - Asia (ISGT-Asia), pp. 1014–1018, Melbourne, VIC, Australia, 2016.
18 International Journal of Photoenergy

[9] H. Eom, Y. Son, and S. Choi, “Feature-Selective ensemblelearning-based long-term regional PV generation forecasting,”IEEE Access, vol. 8, pp. 54620–54630, 2020.
[10] K. Benhmed, F. Touati, M. Al-Hitmi et al., “PV power predic-tion in Qatar based on machine learning approach,” in 20186th International Renewable and Sustainable Energy Confer-ence (IRSEC), pp. 1–4, Rabat, Morocco, 2018.
[11] M. Diagne, M. David, P. Lauret, J. Boland, and N. Schmutz,“Review of solar irradiance forecasting methods and a propo-sition for small- scale insular grids,” Renewable and Sustain-able Energy Reviews, vol. 27, pp. 65–76, 2013.
[12] A. López-Vargas, M. Fuentes, M. V. García, and F. J. Muñoz-Rodríguez, “Low-Cost datalogger intended for remote moni-toring of solar photovoltaic standalone systems based onArduino™,” IEEE Sensors Journal, vol. 19, no. 11, pp. 4308–4320, 2019.
[13] A. López-Vargas, M. Fuentes, and M. Vivar, “Evaluation oflong-term performance of a solar home system (SHS) moni-toring system on harsh environments,” Sensors, vol. 19,no. 24, p. 5462, 2019.
[14] N. Mahzan, A. Omar, L. Rimon, S. M. Noor, and M. Z. Rosse-lan, “Design and Development of an Arduino based data log-ger for photovoltaic monitoring system,” InternationalJournal of Simulation: Systems, Science and Technology,vol. 17, pp. 15.1–15.5, 2017.
[15] M. Fuentes, M. Vivar, J. M. Burgos, J. Aguilera, and J. A. Vacas,“Design of an accurate, low-cost autonomous data logger forPV system monitoring using Arduino™ that complies withIEC standards,” Solar Energy Materials and Solar Cells,vol. 130, pp. 529–543, 2014.
[16] A. Mahjoubi, R. Mechlouch, and A. Brahim, “A low cost wire-less data acquisition system for a remote photovoltaic (PV)water pumping system,” Energies, vol. 4, no. 1, pp. 68–89,2011.
[17] T. A. Jesha and M. T. Iqbal, “Data logging and energy con-sumption analysis of two houses in St. John’s, Newfoundland,”in 8th International Conference on Electrical and ComputerEngineering, pp. 816–819, Dhaka, Bangladesh, 2014.
[18] B. Nkom and H. Musa, “Development of a novelmicrocontroller-based data logger,” in 2009 2nd InternationalConference on Adaptive Science & Technology (ICAST),pp. 314–324, Accra, Ghana, 2009.
[19] A. Suzdalenko, “Guidelines for autonomous data loggerdesign,” in 2011 IEEE International Symposium on IndustrialElectronics, pp. 1426–1429, Gdansk, Poland, 2011.
[20] M. Engin, “Open source embedded data logger design for PVsystem monitoring,” in 2017 6th Mediterranean Conferenceon Embedded Computing (MECO), pp. 1–5, Bar, Montenegro,2017.
[21] M. Benghanem, “Measurement of meteorological data basedon wireless data acquisition system monitoring,” AppliedEnergy, vol. 86, no. 12, pp. 2651–2660, 2009.
[22] G. Nhivekar and R. Mudholkar, “Data logger and remotemonitoring system for multiple parameter measurementapplications,” Journal of Electrical and Electronics Engineering,vol. 4, 2011.
[23] D. Munandar and D. Syamsi, “Data logger management soft-ware design for maintenance and utility in remote,” in 2014The 1st International Conference on Information Technology,Computer, and Electrical Engineering, pp. 74–78, Semarang,Indonesia, 2014.
[24] S. Badhiye, B. Chatur, and B. V. Wakode, “Data Logger Sys-tem: A Survey,” International Journal of Computer Technologyand Electronics Engineering (IJCTEE), pp. 24–26, 2011.
[25] M. Kovac, “Efficient data compression algorithm for data log-gers, measurement equipment and remote data analysis appli-cations,” in Proceedings IEEE Southeastcon '98 'Engineering fora New Era', pp. 47-48, Orlando, FL, USA, 1998.
[26] S. Chaudhary, P. Ghimire, P. B. Thogersen, and P. de PlaceRimmen, “Field data logger prototype for power converters,”in 2014 IEEE International Conference on Power Electronics,Drives and Energy Systems (PEDES), pp. 1–4, Mumbai, India,2014.
[27] C. M. Vancea and L. Viman, “Wireless data logger for thermalvalidation systems,” 2011 IEEE 17th International Symposiumfor Design and Technology in Electronic Packaging (SIITME),2011, pp. 295–298, Timisoara, Romania, 2011.
[28] C. Guo, B. Wang, Z. Wu et al., “Transformer failure diagnosisusing fuzzy association rule mining combined with case-basedreasoning,” IET Generation, Transmission and Distribution,vol. 14, no. 11, pp. 2202–2208, 2020.
[29] R. Uthirasamy, V. K. Chinnaiyan, S. Vishnukumar et al.,“Design of boosted multilevel DC-DC converter for solar pho-tovoltaic system,” International Journal of Photoenergy,vol. 2022, Article ID 1648474, 23 pages, 2022.
[30] S. Kaliappan, R. Saravanakumar, A. Karthick et al., “Hourlyand day ahead power prediction of building integrated semi-transparent photovoltaic system,” International Journal ofPhotoenergy, vol. 2021, Article ID 7894849, 8 pages, 2021.
[31] A. K. Podder, A. K. Das, E. Hossain et al., “Integrated modelingand feasibility analysis of a rooftop photovoltaic systems for anacademic building in Bangladesh,” International Journal ofLow Carbon Technologies, vol. 16, no. 4, pp. 1317–1327, 2021.
[32] U. Subramaniam, M.M. Subashini, D. Almakhles, A. Karthick,and S. Manoharan, “An expert system for COVID-19 infectiontracking in lungs using image processing and deep learningtechniques,” BioMed Research International, vol. 2021, ArticleID 1896762, 17 pages, 2021.
[33] S. S. Ganesh, G. Kannayeram, A. Karthick, andM. Muhibbullah, “A novel context aware joint segmentationand classification framework for glaucoma detection,” Compu-tational and Mathematical Methods in Medicine, vol. 2021,Article ID 2921737, 19 pages, 2021.
[34] A. Hmidet, U. Subramaniam, R. M. Elavarasan et al., “Designof efficient off-grid solar photovoltaic water pumping systembased on improved fractional open circuit voltage MPPT tech-nique,” International Journal of Photoenergy, vol. 2021, ArticleID 4925433, 18 pages, 2021.
[35] P. M. Kumar, R. Saravanakumar, A. Karthick, andV. Mohanavel, “Artificial neural network-based output powerprediction of grid-connected semitransparent photovoltaicsystem,” Environmental Science and Pollution Research,vol. 29, pp. 10173–10182, 2022.
[36] D. Singh, R. Chaudhary, and A. Karthick, “Review on theprogress of building-applied/integrated photovoltaic system,”Environmental Science and Pollution Research, vol. 28,no. 35, pp. 47689–47724, 2021.
[37] N. M. Kumar, M. Samykano, and A. Karthick, “Energy lossanalysis of a large scale BIPV system for university buildingsin tropical weather conditions: a partial and cumulative per-formance ratio approach,” Case Studies in Thermal Engineer-ing, vol. 25, p. 100916, 2021.
19International Journal of Photoenergy

[38] A. R. Prasad, R. Shankar, C. K. Patil, A. Karthick, A. Kumar,and R. Rahim, “Performance enhancement of solar photovol-taic system for roof top garden,” Environmental Science andPollution Research, vol. 28, no. 36, pp. 50017–50027, 2021.
[39] V. Chandran, M. G. Sumithra, A. Karthick et al., “Diagnosis ofcervical cancer based on ensemble deep learning networkusing colposcopy images,” BioMed Research International,vol. 2021, Article ID 5584004, 15 pages, 2021.
[40] R. Kabilan, V. Chandran, J. Yogapriya et al., “Short-termpower prediction of building integrated photovoltaic (BIPV)system based on machine learning algorithms,” InternationalJournal of Photoenergy, vol. 2021, Article ID 5582418, 11pages, 2021.
[41] N. Y. Jayalakshmi, R. Shankar, U. Subramaniam et al., “Novelmulti-time scale deep learning algorithm for solar irradianceforecasting,” Energies, vol. 14, no. 9, p. 2404, 2021.
[42] S. Obukhov, A. Ibrahim, A. A. Z. Diab, A. S. Al-Sumaiti, andR. Aboelsaud, “Optimal performance of dynamic particleswarm optimization based maximum power trackers forstand-alone PV system under partial shading conditions,”IEEE Access, vol. 8, pp. 20770–20785, 2020.
[43] M. Killi and S. Samanta, “Voltage-sensor-based MPPT forstand-alone PV systems through voltage reference control,”IEEE Journal of Emerging and Selected Topics in Power Elec-tronics, vol. 7, no. 2, pp. 1399–1407, 2019.
[44] A. Al-Shetwi, M. Sujod, A. Tarabsheh, and I. Altawail, “Designand economic evaluation of electrification of small villages inrural area in Yemen using stand-alone PV system,” Interna-tional Journal of Renewable Energy Research (IJRER), vol. 6,pp. 289–298, 2016.
[45] T. Kulworawanichpong and J. Mwambeleko, “Design andcosting of a stand-alone solar photovoltaic system for a Tanza-nian rural household,” Sustainable Energy Technologies andAssessments, vol. 12, pp. 53–59, 2015.
[46] F. J. Muñoz, G. Almonacid, G. Nofuentes, and F. Almonacid,“A new method based on charge parameters to analyse theperformance of stand- alone photovoltaic systems,” SolarEnergy Materials and Solar Cells, vol. 90, no. 12, pp. 1750–1763, 2006.
[47] S. Parsekar and K. Chatterjee, “A novel strategy for batteryplacement in standalone solar photovoltaic converter system,”in 2014 IEEE 40th Photovoltaic Specialist Conference (PVSC),pp. 2751–2756, Denver, CO, USA, 2014.
[48] S. Babaa, M. Armstrong, and V. Pickert, “High efficiency stan-dalone photovoltaic system using adaptive switching of aninterleaved boost converter,” in 6th IET International Confer-ence on Power Electronics, Machines and Drives (PEMD2012), pp. 1–7, Bristol, UK, 2012.
[49] M. Nassereddine, J. Rizk, M. Nagrial, and A. Hellany, “Batterysustainable PV solar house: storage consideration for off grid,”in 2018 Third International Conference on Electrical and Bio-medical Engineering, Clean Energy and Green Computing(EBECEGC), pp. 34–38, Beirut, Lebanon, 2018.
[50] W. Ali, H. Farooq, A. U. Rehman, Q. Awais, M. Jamil, andA. Noman, “Design considerations of stand-alone solar photo-voltaic systems,” in 2018 International Conference on Comput-ing, Electronic and Electrical Engineering (ICE Cube), pp. 1–6,Quetta, Pakistan, 2018.
[51] K. Sehil and M. Darwish, “Effective power management in astand-alone PV system,” in 2018 53rd International Universi-ties Power Engineering Conference (UPEC), pp. 1–5, Glasgow,UK, 2018.
[52] C. Egbon, A. Oyekola, and T. Lie, “Design of stand alone pho-tovoltaic system in developing countries: a case study of Kano,Nigeria,” in 2018 Australasian Universities Power EngineeringConference (AUPEC, pp. 1–6, Auckland, New Zealand, 2018.
[53] S. R. Spea and H. A. Khattab, “Design sizing and performanceanalysis of stand-alone PV system using PVSyst software for alocation in Egypt,” in 2019 21st International Middle EastPower Systems Conference (MEPCON), pp. 927–932, Cairo,Egypt, 2019.
[54] G. Yang and M. Chen, “Methodology for precisely estimatingthe generation of standalone photovoltaic system,” in 2009International Conference on Environmental Science and Infor-mation Application Technology, vol. 1, pp. 48–51, Wuhan,China, 2009.
[55] L. Fara and D. Craciunescu, “Output analysis of stand-alonePV systems: modeling, simulation and control,” Energy Proce-dia, vol. 112, pp. 595–605, 2017.
[56] O. V. G. Swathika and K. T. M. U. Hemapala, “IOT basedenergy management system for standalone PV systems,” Jour-nal of Electrical Engineering and Technology, vol. 14, no. 5,pp. 1811–1821, 2019.
[57] M. S. Shaik, D. Shah, R. Chetty, and R. R. Marathe, “A LoRa-WAN based open source IOT solution for monitoring ruralelectrification policy,” in 2020 International Conference onCOMmunication Systems & NETworkS (COMSNETS),pp. 888–890, Bengaluru, India, 2020.
[58] A. López-Vargas, M. Fuentes, and M. Vivar, “IoT applicationfor real-time monitoring of solar home systems based onArduino™ with 3G connectivity,” IEEE Sensors Journal,vol. 19, no. 2, pp. 679–691, 2019.
[59] J. R. K. K. Dabbakuti, A. Jacob, V. R. Veeravalli, and R. K. Kal-lakunta, “Implementation of IoT analytics ionospheric fore-casting system based on machine learning and ThingSpeak,”IET Radar, Sonar and Navigation, vol. 14, no. 2, pp. 341–347, 2020.
[60] S. Kim andH. Kim, “A newmetric of absolute percentage errorfor intermittent demand forecasts,” International Journal ofForecasting, vol. 32, no. 3, pp. 669–679, 2016.
[61] S. S. Arefin, “Optimization techniques of islanded hybridmicrogrid system,” in Renewable Energy - Resources, Chal-lenges and Applications, p. Ch. 23, IntechOpen, 2020.
[62] S. K. S. Arefin, “Optimization of islanded microgrid consider-ing system stability and reliability according to the dispatchstrategies,” 2021, https://researchrepository.rmit.edu.au/d i s c o v e r y / d e l i v e r y / 6 1 RM I T _ I N S T : RM I T U /12272691400001341.
[63] S. K. A. Shezan and C. Y. Lai, “Optimization of hybridwind-diesel-battery energy system for remote areas ofMalaysia,” in 2017 Australasian Universities Power Engineer-ing Conference (AUPEC), pp. 1–6, Melbourne, VIC, Austra-lia, 2017.
[64] M. F. Ishraque, S. A. Shezan, M. M. Rashid et al., “Techno-eco-nomic and power system optimization of a renewable richislanded microgrid considering different dispatch strategies,”IEEE Access, vol. 9, pp. 77325–77340, 2021.
[65] M. Fatin Ishraque, S. A. Shezan, M. M. Ali, and M. M. Rashid,“Optimization of load dispatch strategies for an islandedmicrogrid connected with renewable energy sources,” AppliedEnergy, vol. 292, p. 116879, 2021.
[66] S. K. A. Shezan, “Feasibility analysis of an islanded hybridwind-diesel-battery microgrid with voltage and power
20 International Journal of Photoenergy

response for offshore Islands,” Journal of Cleaner Production,vol. 288, p. 125568, 2021.
[67] S. A. Shezan, K. N. Hasan, A. Rahman, M. Datta, and U. Datta,“Selection of appropriate dispatch strategies for effective plan-ning and operation of a microgrid,” Energies, vol. 14, no. 21,p. 7217, 2021.
[68] S. A. Shezan, A. S. S. Rawdah, and Z. Rahman, “Design andimplementation of an islanded hybrid microgrid system for alarge resort center forPenang Islandwith the proper applica-tion of excess energy,” Environmental Progress & SustainableEnergy, vol. 40, no. 4, pp. 1–15, 2021.
[69] A. Asrari, T. X. Wu, and B. Ramos, “A hybrid algorithm forshort-term solar power prediction—sunshine state case study,”IEEE Transactions on Sustainable Energy, vol. 8, no. 2,pp. 582–591, 2017.
[70] S. Wen, C. Zhang, H. Lan, Y. Xu, Y. Tang, and Y. Huang, “Ahybrid ensemble model for interval prediction of solar poweroutput in ship onboard power systems,” IEEE Transactionson Sustainable Energy, vol. 12, no. 1, pp. 14–24, 2021.
[71] X. Chang, W. Li, and A. Y. Zomaya, “A lightweight short-termphotovoltaic power prediction for edge computing,” IEEETransactions on Green Communications and Networking,vol. 4, no. 4, pp. 946–955, 2020.
[72] S. Al-Dahidi, M. Louzazni, and N. Omran, “A local trainingstrategy-based artificial neural network for predicting thepower production of solar photovoltaic systems,” IEEE Access,vol. 8, pp. 150262–150281, 2020.
[73] S. Rajabalizadeh and S. M. M. Tafreshi, “A practicable copula-based approach for power forecasting of small-scale photovol-taic systems,” IEEE Systems Journal, vol. 14, no. 4, pp. 4911–4918, 2020.
[74] X. Zhang, Y. Li, S. Lu, H. F. Hamann, B. Hodge, andB. Lehman, “A solar time based analog ensemble method forregional solar power forecasting,” IEEE Transactions on Sus-tainable Energy, vol. 10, no. 1, pp. 268–279, 2019.
[75] S. Al-Dahidi, O. Ayadi, M. Alrbai, and J. Adeeb, “Ensembleapproach of optimized artificial neural networks for solar pho-tovoltaic power prediction,” IEEE Access, vol. 7, pp. 81741–81758, 2019.
[76] G. Li, S. Xie, B. Wang, J. Xin, Y. Li, and S. Du, “Photovoltaicpower forecasting with a hybrid deep learning approach,”IEEE Access, vol. 8, pp. 175871–175880, 2020.
[77] M. J. Sanjari, H. B. Gooi, and N. C. Nair, “Power generationforecast of hybrid PV–wind system,” IEEE Transactions onSustainable Energy, vol. 11, no. 2, pp. 703–712, 2020.
[78] J. Zhong, L. Liu, Q. Sun, and X. Wang, “Prediction of photo-voltaic power generation based on general regression and backpropagation neural network,” Energy Procedia, vol. 152,pp. 1224–1229, 2018.
[79] C. Wan, J. Lin, Y. Song, Z. Xu, and G. Yang, “Probabilisticforecasting of photovoltaic generation: an efficient statisticalapproach,” IEEE Transactions on Power Systems, vol. 32,no. 3, pp. 2471-2472, 2017.
[80] J. Luo, T. Hong, and M. Yue, “Real-time anomaly detectionfor very short-term load forecasting,” Journal of ModernPower Systems and Clean Energy, vol. 6, no. 2, pp. 235–243, 2018.
[81] T. Zhao, J. Wang, and Y. Zhang, “Day-ahead hierarchicalprobabilistic load forecasting with linear quantile regressionand empirical copulas,” IEEE Access, vol. 7, pp. 80969–80979,2019.
[82] C. Wan, J. Lin, J. Wang, Y. Song, and Z. Y. Dong, “Directquantile regression for nonparametric probabilistic forecastingof wind power generation,” IEEE Transactions on Power Sys-tems, vol. 32, no. 4, pp. 2767–2778, 2017.
[83] M. Abuella and B. Chowdhury, “Solar power probabilisticforecasting by using multiple linear regression analysis,” inSoutheastCon 2015, pp. 1–5, Lauderdale, FL, USA, 2015.
[84] M. P. Raju and A. J. Laxmi, “IOT based online load forecastingusing machine learning algorithms,” Procedia Computer Sci-ence, vol. 171, pp. 551–560, 2020.
21International Journal of Photoenergy