VOLTAGE CONTROL BY FUZZY LOGIC OF THE PHOTOVOLTAIC PRODUCTIONS INTEGRATED IN THE HTA GRID
12
International Journal of Electrical Engineering and Technology (IJEET), ISSN 0976 – 6545(Print), ISSN 0976 – 6553(Online) Volume 5, Issue 4, April (2014), pp. 27-38 © IAEME 27 VOLTAGE CONTROL BY FUZZY LOGIC OF THE PHOTOVOLTAIC PRODUCTIONS INTEGRATED IN THE HTA GRID Mohamed DHARIF 1 , Abdellah AIT OUHMAN 2 Labo.of Optimization of Communication Systems Advanced, Systems and Security University CADI AYYAD, (ENSA) Marrakech, Morocco ABSTRACT The intense integrating of the decentralized production PV (DP) into the HTA grid causes a fluctuation in the voltage during the day, this paper discusses a method for regulating the voltage at DP based on fuzzy logic controller, through the injection or the absorption of the reactive energy, taking account of local stresses of the measured voltage. Keywords: PV Production, Fuzzy Logic, Reactive Energy, Fluctuation, Voltage Control. 1. INTRODUCTION The massive integration of renewable energy production in the grid, including photovoltaic plants, dramatically, changes the energy structure of the HTA distribution grid. The impact of decentralized productions (DP) is significant especially on the voltage at the output variation and load. In fact, a simulation of an intelligent voltage control (based on fuzzy logic) is needed to learn about the contribution of such control on the stability of the voltage plane of the HTA grid. This paper deals with an auto-adaptive control [1], designed to be embedded on production devices unobservable to allow an autonomous control of voltage at the connection point. This control is based on the regulation of transit reactive power (injection or absorption) to maintain the voltage level within permissible limits. The simulation results are displayed as a graph and a critical analysis was conducted to describe the contribution of such control. INTERNATIONAL JOURNAL OF ELECTRICAL ENGINEERING & TECHNOLOGY (IJEET) ISSN 0976 – 6545(Print) ISSN 0976 – 6553(Online) Volume 5, Issue 4, April (2014), pp. 27-38 © IAEME: www.iaeme.com/ijeet.asp Journal Impact Factor (2014): 6.8310 (Calculated by GISI) www.jifactor.com IJEET © I A E M E
Transcript of VOLTAGE CONTROL BY FUZZY LOGIC OF THE PHOTOVOLTAIC PRODUCTIONS INTEGRATED IN THE HTA GRID

International Journal of Electrical Engineering and Technology (IJEET), ISSN 0976 – 6545(Print),
ISSN 0976 – 6553(Online) Volume 5, Issue 4, April (2014), pp. 27-38 © IAEME
27
VOLTAGE CONTROL BY FUZZY LOGIC OF THE PHOTOVOLTAIC
PRODUCTIONS INTEGRATED IN THE HTA GRID
Mohamed DHARIF1, Abdellah AIT OUHMAN
2
Labo.of Optimization of Communication Systems Advanced, Systems and Security
University CADI AYYAD, (ENSA) Marrakech, Morocco
ABSTRACT
The intense integrating of the decentralized production PV (DP) into the HTA grid causes a
fluctuation in the voltage during the day, this paper discusses a method for regulating the voltage at
DP based on fuzzy logic controller, through the injection or the absorption of the reactive energy,
taking account of local stresses of the measured voltage.
Keywords: PV Production, Fuzzy Logic, Reactive Energy, Fluctuation, Voltage Control.
1. INTRODUCTION
The massive integration of renewable energy production in the grid, including photovoltaic
plants, dramatically, changes the energy structure of the HTA distribution grid. The impact of
decentralized productions (DP) is significant especially on the voltage at the output variation and
load.
In fact, a simulation of an intelligent voltage control (based on fuzzy logic) is needed to learn
about the contribution of such control on the stability of the voltage plane of the HTA grid.
This paper deals with an auto-adaptive control [1], designed to be embedded on production
devices unobservable to allow an autonomous control of voltage at the connection point. This control
is based on the regulation of transit reactive power (injection or absorption) to maintain the voltage
level within permissible limits.
The simulation results are displayed as a graph and a critical analysis was conducted to
describe the contribution of such control.
INTERNATIONAL JOURNAL OF ELECTRICAL ENGINEERING &
TECHNOLOGY (IJEET)
ISSN 0976 – 6545(Print) ISSN 0976 – 6553(Online) Volume 5, Issue 4, April (2014), pp. 27-38
© IAEME: www.iaeme.com/ijeet.asp Journal Impact Factor (2014): 6.8310 (Calculated by GISI) www.jifactor.com
IJEET
© I A E M E

International Journal of Electrical Engineering and Technology (IJEET), ISSN 0976 – 6545(Print),
ISSN 0976 – 6553(Online) Volume 5, Issue 4, April (2014), pp. 27-38 © IAEME
28
2. HIGHLIGHTING PROBLEMS OF FLUCTUATION VOLTAGE INDUCED BY DP
In the conventional distribution grid of radial structure, the voltage is generally higher at the
substation and decreases towards the end of the line. Power flows in one direction from the
substation towards the consumers. But with the presence of DP on the grid, the system becomes
active and the power flows are changed.
Fig.1: Determination of the voltage drop
The voltage drop (∆V pu) between the substation and the connection point of DP (Figure 1) is
determined as follows [1], [2]:
∆ . . cos . . . sin 1
∆ . . . 2
∆ . . 3
Where:
• R, L is the total resistance and inductance of the line
• VN voltage at node N and It the current flowing in the line
• P, Q the active and reactive power at node N
• PGQG are the active and reactive power supplied by DP
• PL, QL are the active and reactive power consumption
• Qc is the reactive power compensation device
Equation (3) illustrates one of the main problems with connecting the DP to grid. Indeed,
injection of active and reactive power will induce an increase in the voltage at connection node.
Impacts on voltage of such productions will be different depending on the type of grid to which they
are connected. According to the grid structure, the characteristics of the substation, the connection
point and the power injected by the DP, the voltage can be raised to the point of connection, and can
even exceed the permissible limit.
In the HTA grid of distribution, the reactance is greater than the resistance, and if X >> R, the
formula (3) can be simplified as follows:
∆ .!"#" 4
International Journal of Electrical Engineering and Technology (IJEET), ISSN 0976 – 6545(Print),
ISSN 0976 – 6553(Online) Volume 5, Issue 4, April (2014), pp. 27-38 © IAEME
29
The injection of reactive power will have more impact on the voltage level of the injection of
active power.
The voltage level of distribution grid depends strongly on the level of consumption and
power factor of the load. A change in load causes a change in voltage on the grid. The extreme case
for a rise in voltage corresponds to a zero load consumption associated with a maximum production.
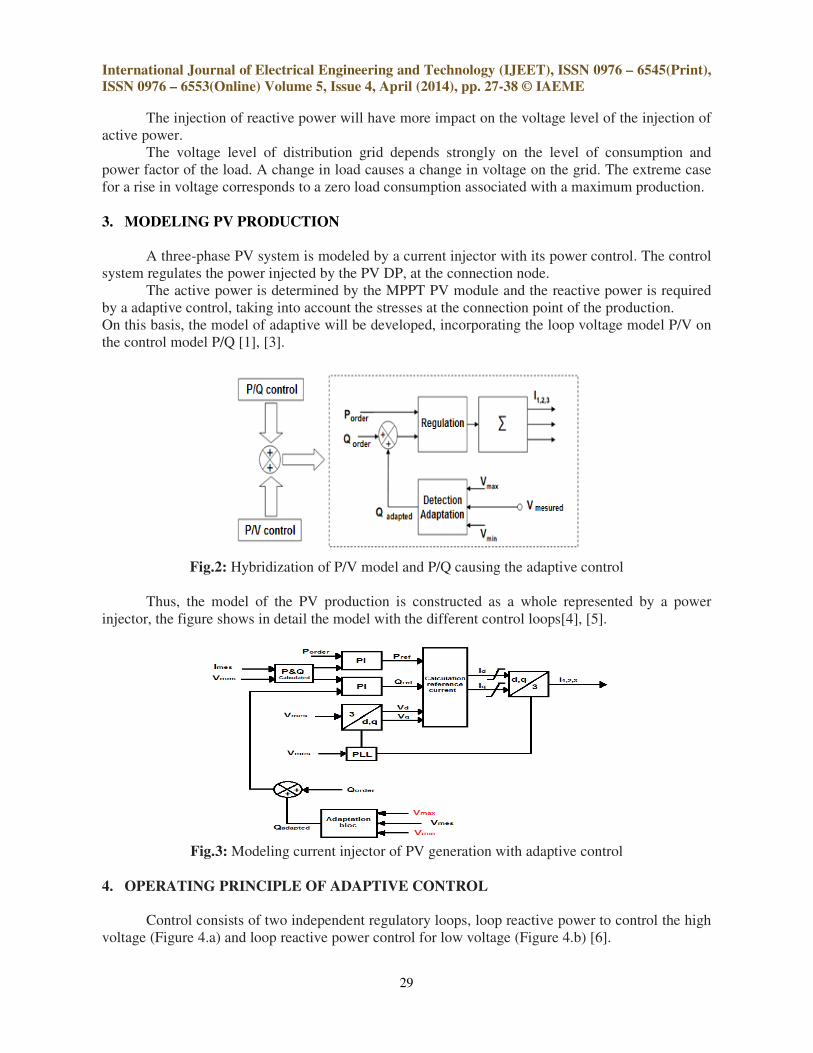
3. MODELING PV PRODUCTION
A three-phase PV system is modeled by a current injector with its power control. The control
system regulates the power injected by the PV DP, at the connection node.
The active power is determined by the MPPT PV module and the reactive power is required
by a adaptive control, taking into account the stresses at the connection point of the production.
On this basis, the model of adaptive will be developed, incorporating the loop voltage model P/V on
the control model P/Q [1], [3].
Fig.2: Hybridization of P/V model and P/Q causing the adaptive control
Thus, the model of the PV production is constructed as a whole represented by a power
injector, the figure shows in detail the model with the different control loops[4], [5].
Fig.3: Modeling current injector of PV generation with adaptive control
4. OPERATING PRINCIPLE OF ADAPTIVE CONTROL
Control consists of two independent regulatory loops, loop reactive power to control the high
voltage (Figure 4.a) and loop reactive power control for low voltage (Figure 4.b) [6].
International Journal of Electrical Engineering and Technology (IJEET), ISSN 0976 – 6545(Print),
ISSN 0976 – 6553(Online) Volume 5, Issue 4, April (2014), pp. 27-38 © IAEME
30
a) Control loop of the high voltage b) Control Loop low voltage
Fig.4: Adaptive control loops based on the measured voltage
5. DYNAMIC SYSTEM AND LIMITATIONS
Dynamics chosen for the control loop of the active power is that of the MPPT (Maximum
Power Point Tracking) that is a few seconds, while the dynamic control of reactive power is selected
that of the inverter, with tenth of a second.
The current can be directly limited on the amplitude values Id and Iq into the domain of Park,
located at the output of the control loop, and corresponding to the current components to be injected
onto the grid. These components are shown in Figure 3. The limitation for the Id component is
selected based on the limitation of the DC power source. And the limitation for Iq component is
chosen accordingly , so as not to exceed the limitation reactive power chosen based on a tangent phi
generally limited to 0.4 [1], [7].
In order not to make the system unstable, the dynamic of adaptive block is chosen twice as
fast as the control loop reactive power.
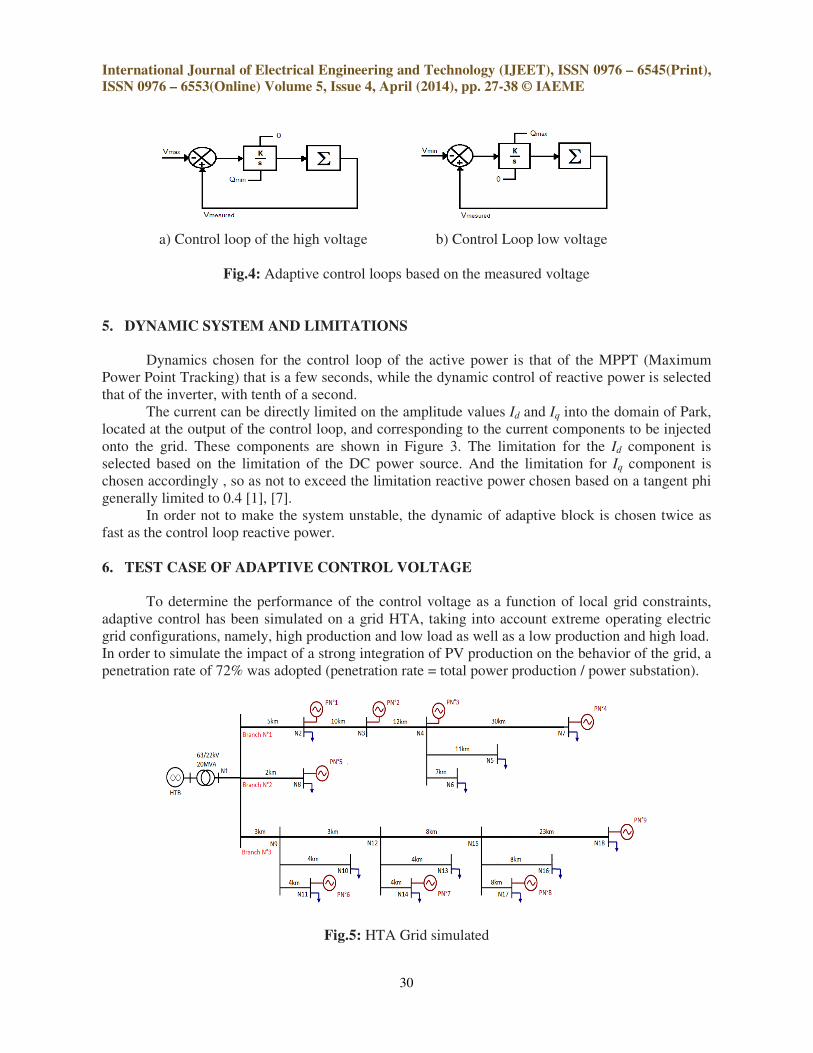
6. TEST CASE OF ADAPTIVE CONTROL VOLTAGE
To determine the performance of the control voltage as a function of local grid constraints,
adaptive control has been simulated on a grid HTA, taking into account extreme operating electric
grid configurations, namely, high production and low load as well as a low production and high load.
In order to simulate the impact of a strong integration of PV production on the behavior of the grid, a
penetration rate of 72% was adopted (penetration rate = total power production / power substation).
Fig.5: HTA Grid simulated

International Journal of Electrical Engineering and Technology (IJEET), ISSN 0976 – 6545(Print),
ISSN 0976 – 6553(Online) Volume 5, Issue 4, April (2014), pp. 27-38 © IAEME
31
This grid was implemented on MATLAB/SIMULINK by using the SimPowerSystems
library, the simulation scenario is as follows:
• Change of load
o At t =2s, ∆Sload=-20%
o At t =5s, ∆Sload=20%
o At t =19s, ∆Sload=10%
o At t =22s, ∆Sload=-20%
• Set point change of the production
for all PV, t =4s to t=16s.
Production increase of 4.5MW to
14.4MW.
Fig.6: Transit in the substation for the defined scenario
The characteristics of the simulated grid are summarized in the following table:
Component Parameter Value retained
HTB Source
Psc 277MVA
Nominal voltage 63kV
Nominal
frequency
50Hz
R/X 0,05
Transformer data
Power 20MVA
Primary voltage 63kV
Secondary
voltage
22kV
Usc 16%
Wiring YNyn
Neutral resistance 42,5Ωm
Line data Rd 0,2236 Ωm/km
Ro 0,368 Ωm/km
Xd 0,35 Ωm/km
Xo 1,588 Ωm/km
Cd 11,13nF/km
Co 5nF/km
0 2 4 6 8 10 12 14 16 18 20 22 240
0.1
0.2
0.3
0.4
0.5
0.6
0.7
0.8
0.9
1
Time [s]
Active p
ow
er
[pu]
Transit of active power in substation

International Journal of Electrical Engineering and Technology (IJEET), ISSN 0976 – 6545(Print),
ISSN 0976 – 6553(Online) Volume 5, Issue 4, April (2014), pp. 27-38 © IAEME
32
7. SIMULATION OF GRID BEHAVIOR WITHOUT CONTROL VOLTAGE
During this simulation no control voltage will be executed, the following graphs illustrate the
fluctuation of the voltage at connection points of PV plants with a tolerance of ±10% of voltage.
a) Branch n°1 b) Branch n°2
c) Branch n°3
Fig.7: Evolution of the voltage at the connection point of the PV production
This scenario leads to see the sub voltages at times t=2s to t=5s, in the connection points of
the PV production N3 , N4 , N7 , N11 , N14 , N17 and N18 , and a high level of the voltage at the
output of the DP connected in the nodes N2 , N8 and N11 . The voltages seen by other production
units are not critical and remain within acceptable values.
Therefore, this scenario highlights the exceeded of the voltage limits due to the production of
active power into the distribution grid, HTA in this case. Thus, it will be possible to intervene with
groups of productions, by absorbing or supplying reactive power according to the stresses measured
at the connection point of each DP. The adaptive control created will be tested on the same case.
8. SIMULATION OF ADAPTIVE VOLTAGE CONTROL
To enable the PV productions to participate in voltage regulation , adaptive control was
activated at PV production , the permitted voltage range that is tolerated at the HTA grid is ±10% of
the contract voltage, Vmax = 1.1pu and Vmin = 0.9pu , the simulation results are as follows:
0 5 10 15 20 240.8
0.85
0.9
0.95
1
1.05
1.1
1.15
Time [s]
Volt
age
[p
u]
N1 N2 N3 N4 N7 Vmax Vmin
0 5 10 15 20 240.8
0.85
0.9
0.95
1
1.05
1.1
1.15
Time [s]
Volt
age
[p
u]
N8 Vmax Vmin
0 5 10 15 20 240.8
0.85
0.9
0.95
1
1.05
1.1
1.15
Time [s]
Vo
lta
ge
[p
u]
N1 N11 N14 N17 N18 Vmax Vmin

International Journal of Electrical Engineering and Technology (IJEET), ISSN 0976 – 6545(Print),
ISSN 0976 – 6553(Online) Volume 5, Issue 4, April (2014), pp. 27-38 © IAEME
33
a) Branch n°1 b) Branch n°2
c) Branch n°3
Fig.8: Evolution of the voltage at the connection point of the PV production
The results show that this type of regulation is effective for DP N2, N3, N11 and N14.
Indeed, the critical voltages in the preceding simulations are avoided by acting on their production of
reactive power. However this is not sufficient in the case of DP N4, N7, N8, N17 and N18. Figure 9
show that the DP in end of grid cannot effectively control the voltage in the connecting node.
By analyzing the evolution of reactive power at each output, we see that only the productions under
constraints involved in control the voltage at the connection point, therefore a limitation to support
the voltage plan of the HTA grid.
Fig.9: Evolution of reactive power at PV productions
0 5 10 15 20 240.8
0.85
0.9
0.95
1
1.05
1.1
1.15
Time [s]
Voltage [
pu]
N1 N2 N3 N4 N7 Vmax Vmin
0 5 10 15 20 240.8
0.85
0.9
0.95
1
1.05
1.1
1.15
Time [s]
Voltage [
pu]
N8 Vmax Vmin
0 5 10 15 20 240.8
0.85
0.9
0.95
1
1.05
1.1
1.15
Time [s]
Voltage [
pu]
N1 N11 N14 N17 N18 Vmax Vmin
0 5 10 15 20 24-0.5
-0.4
-0.3
-0.2
-0.1
0
0.1
0.2
0.3
0.4
Time [s]
Reactive p
ow
er
[pu]
PN°1
PN°2
PN°3
PN°4
PN°5
0 5 10 15 20 24-0.1
0
0.1
0.2
0.3
0.4
Time [s]
Reactive p
ow
er
[pu]
PN°6
PN°7
PN°8
PN°9

International Journal of Electrical Engineering and Technology (IJEET), ISSN 0976 – 6545(Print),
ISSN 0976 – 6553(Online) Volume 5, Issue 4, April (2014), pp. 27-38 © IAEME
34
So, it is necessary to take the help of other DP, Indeed, if the downstream groups
participating in the control, the effort provided by them would be less important. It is in this
perspective that will be added a desired voltage window narrower than the window of eligibility.
It is with this objective, that the adaptive controller will evolve. The principle is simple, in
order to involve all DP in the control, a "desired" voltage window will be added to the principle of
control (Figure 10). Beyond this window of voltage, narrower than the previous window of
permissible voltage, output voltage regulation activates. It will therefore be possible to react before
reaching the critical voltages.
Fig.10: Plan of operation of the adaptive control
To ensure maximum participation [1] of the different productions, it is necessary to provide a
window of different desired voltage for each DP depending on its position and thus the constraints it
faces.
We started with the adaptive controller which it will be added a "smart" supervision [8], [9]
able to calculate voltage set points desired autonomously through local measurements of voltage and
reactive power. This intelligent supervision is achieved through fuzzy logic.
Fig.11: Basic principle of the fuzzy supervisor
Figure 11 illustrates the operating principle of fuzzy supervisor, it takes place up stream of
the adaptive control which has been previously illustrated, and be, depending on local measurements
of voltage and reactive power, capable of providing voltages orders in the manner consistently as
possible.
International Journal of Electrical Engineering and Technology (IJEET), ISSN 0976 – 6545(Print),
ISSN 0976 – 6553(Online) Volume 5, Issue 4, April (2014), pp. 27-38 © IAEME
35
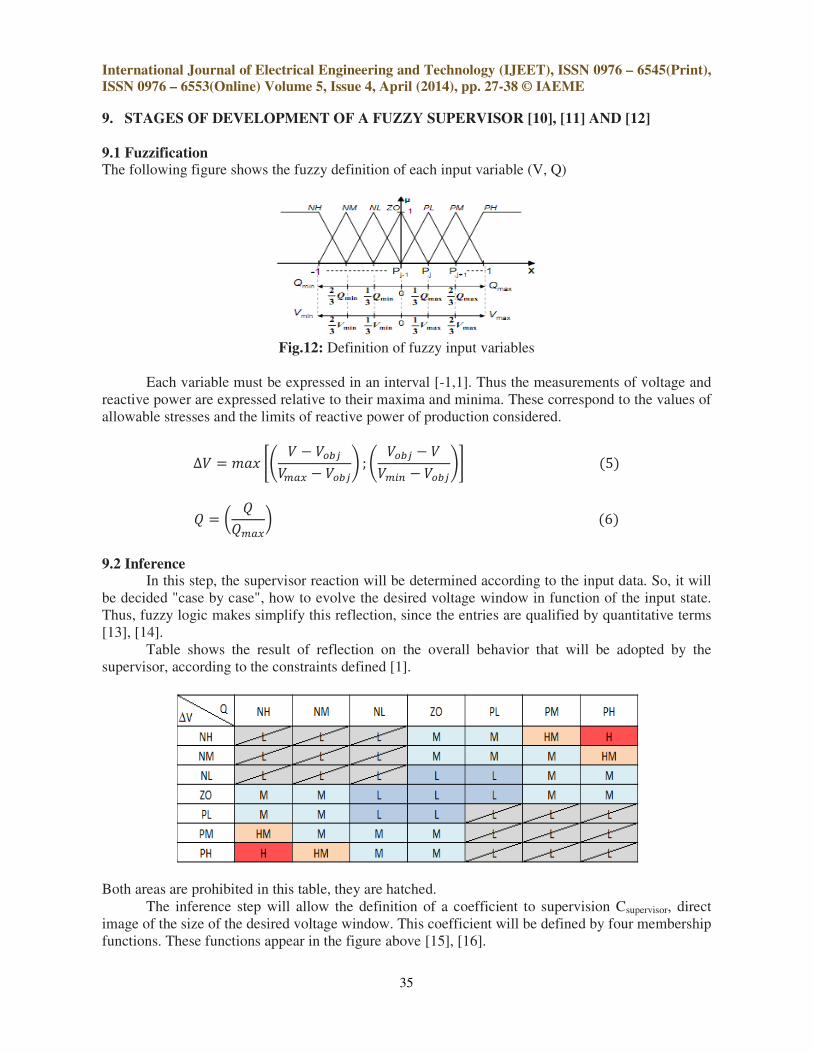
9. STAGES OF DEVELOPMENT OF A FUZZY SUPERVISOR [10], [11] AND [12]
9.1 Fuzzification The following figure shows the fuzzy definition of each input variable (V, Q)
Fig.12: Definition of fuzzy input variables
Each variable must be expressed in an interval [-1,1]. Thus the measurements of voltage and
reactive power are expressed relative to their maxima and minima. These correspond to the values of
allowable stresses and the limits of reactive power of production considered.
∆ %&' () *+,-./ *+,0 ; ) *+, -23 *+,04 5
6 -./7 6
9.2 Inference In this step, the supervisor reaction will be determined according to the input data. So, it will
be decided "case by case", how to evolve the desired voltage window in function of the input state.
Thus, fuzzy logic makes simplify this reflection, since the entries are qualified by quantitative terms
[13], [14].
Table shows the result of reflection on the overall behavior that will be adopted by the
supervisor, according to the constraints defined [1].
Both areas are prohibited in this table, they are hatched.
The inference step will allow the definition of a coefficient to supervision Csupervisor, direct
image of the size of the desired voltage window. This coefficient will be defined by four membership
functions. These functions appear in the figure above [15], [16].

International Journal of Electrical Engineering and Technology (IJEET), ISSN 0976 – 6545(Print),
ISSN 0976 – 6553(Online) Volume 5, Issue 4, April (2014), pp. 27-38 © IAEME
36
Fig.13: Fuzzy set defining the outlet supervisor
The SOM-PROD inference method was used, it enables development of more linear
response, in addition, this method can reduce simulation time in MATLAB.
9.3 Defuzzification
In order to calculate the size of the window of the desired voltage, fuzzy value Csupervisor must
be translated into numerical value. The method of the center of gravity is used. Figure 14 thus shows
the value of dimensional change of the coefficient of variation based on input measurements.
Fig.14: Three-dimensional representation of the evolution of the adjustment coefficient
Vdesired voltage values are defined by this factor as well as voltages Veligible.
9:;< _>?@2A?> B-./ 1'C@DE?AF2@*AG 1:HI _>?@2A?> B-23 1'C@DE?AF2@*AG 1 7K
The desired voltage window is an image of the coefficient Csupervisor provided. This voltage
window is based on measurements of the stress of voltage and reactive power injected.
10. SIMULATION OF THE CONTROL AUTO-ADAPTIVE
The auto-adaptive control will now be compared to the controls already tested at the
beginning, namely, the P/Q control and adaptive control. To do this, we'll use the same scenario
shown in Figure 6, with replacing the adaptive control by the auto-adaptive control system. That
integrates the function of selection of desired voltage, depending on measurements made at the point
of connection.
-1
-0.5
0
0.5
1
-1
-0.5
0
0.5
10.2
0.4
0.6
0.8
1
Reactive powerVoltage
Csuperv
isor

International Journal of Electrical Engineering and Technology (IJEET), ISSN 0976 – 6545(Print),
ISSN 0976 – 6553(Online) Volume 5, Issue 4, April (2014), pp. 27-38 © IAEME
37
The results obtained are as follows:
a) Branch n°1 b) Branch n°2
c) Branch n°3
Fig.15: Evolution of the voltage at the connection point of the PV productions
The results presented in Figure 15 show that with this type of control, the voltages at the
connection points of the productions identified as critical in previous simulations, are maintained
near in the eligibility window.
The performance of auto-adaptive control is seed through changes of reactive power supplied
or absorbed by DP in Figure 16. The fact adapt intelligently the instructions forces all productions to
participate in control. And the constraints are better spread over the decentralized PV productions.
Fig.16: Evolution of reactive power at PV productions
0 5 10 15 20 240.8
0.85
0.9
0.95
1
1.05
1.1
1.15
Time [s]
Voltage [
pu]
N1 N2 N3 N4 N7 Vmax Vmin
0 5 10 15 20 240.8
0.85
0.9
0.95
1
1.05
1.1
1.15
Time [s]
Vo
ltage
[pu]
N8 Vmax Vmin
0 5 10 15 20 240.8
0.85
0.9
0.95
1
1.05
1.1
1.15
Time [s]
Vo
ltage
[pu]
N1 N11 N14 N17 N18 Vmax Vmin
0 5 10 15 20 24-0.5
-0.4
-0.3
-0.2
-0.1
0
0.1
0.2
0.3
0.4
Time [s]
Re
ac
tive
pow
er
[pu]
PN°1
PN°2
PN°3
PN°4
PN°5
0 5 10 15 20 24-0.4
-0.3
-0.2
-0.1
0
0.1
0.2
0.3
0.4
Time [s]
Rea
ctive
pow
er
[pu]
PN°6
PN°7
PN°8
PN°9

International Journal of Electrical Engineering and Technology (IJEET), ISSN 0976 – 6545(Print),
ISSN 0976 – 6553(Online) Volume 5, Issue 4, April (2014), pp. 27-38 © IAEME
38
11. CONCLUSION
This paper shows the performance of the auto-adaptive voltage regulator and the interest of
its use in the case of high penetration of PV productions. On this scenario, the surge constraints are
erased and the regulator forces the participation of all of DP at an intelligently manner.
The integration of intelligence in control using fuzzy logic can achieve the conservation
objectives of the levels of voltage wave form without having communication system as well as
calculation of the independent instructions.
12. REFERENCE
[1] G.RAMI, "Auto-adaptive voltage control for decentralized energy productions connecting to
the electrical distribution grid", PhD thesis of ENSIEG, November 2006.
[2] [2] ABDELHAY.A.SALLAM, O.P.MALIK « Electric Distribution Systems », IEEE Press
Editorial Board, 2011.
[3] A.E.Kiprakis, A.R.Wallace, “Hybrid control of distributed generation of distributed
generators connected to weak rural grids to mitigate voltage variation”, CIRED, May 2003,
Barcelone.
[4] I.E.OTADUI "On the system of power electronics dedicated to the distribution electric
Application to Power Quality", PhD thesis of ENSIEG, November 2003.
[5] Tran-Quoc Tuan (IDEA), Bacha Seddik (G2elab), "Interactions PV inverter / Investigations
on the grid services provided by PV inverters" ADEME, in December 2011.
[6] T.Luong. LE "Dynamic Analysis of the distribution grid in the presence of decentralized
production" Doctoral Thesis Polytechnic Institute in Hanoi, January 2008.
[7] P.N.Vovos, A.E.Kiprakis, G.P.Harrison, J.R.Barrie, “Enhancement of grid capacity by
widespread intelligent generator control”, CIRED, Juin 2005, Turin.
[8] P.Y.Ekel, L.D.B.Terra, M.F.D.Junges, F.J.A.Oliviera, R.Kowaltschuk, T.Y.Taguti, “Fuzzy
logic in voltage and reactive power control in power systems”, in Proc. 1999 IEEE
International Conference on Control Applications, pp. 622-6627.
[9] P.Y.Ekel, L.D.B.Terra, M.F.D.Junges, F.J.A.Oliviera, A.Melek, T.Y.Taguti, “Fuzzy logic in
voltage and reactive power control in regulated and deregulated environments”,
2001IEEE/PES Transmission and Distribution Conference and Exposition.
[10] F.Chevrie, F.Guély, "Fuzzy logic" Cahier Technique Schneider Electric °191.
[11] H.Bühler, "Setting by fuzzy logic", polytechnic and university presses
romandes, 1994.
[12] A.V.Patel, “Simplest Fuzzy Controllers under Various Defuzzification Methods”,
International journal of computational cognition, vol. 3, No. 1, 21-32.
[13] G.Rami, "Modelling of decentralized production systems", Technical Paper GIEIDEA,
December 2004.
[14] G.Rami; T.Tran-Quoc, N.Hadjsaid, 2005, "Fuzzy logic supervision and control of distributed
generators", CIRED 2005, Turin.
[15] G.Rami, "Prospective study for the development of auto-adaptive controller," Technical
NoteGIEIDEA, February 2005.
[16] G.Rami, G.Verneau, L.Bernard, T.Tran-Quoc, N.Hadj said, "Regulations of dispersed energy
generation connected to the distribution grid," RIGE2006.
[17] Shubhangi Arbale and Rajesh M Holmukhe, “Monitoring and Analysis of Reliaibility of
Electrical Distribution System using Matlab – A Case Study”, International Journal of
Electrical Engineering & Technology (IJEET), Volume 4, Issue 2, 2013, pp. 330 - 337,
ISSN Print : 0976-6545, ISSN Online: 0976-6553.