Gravity modelling of the litho-asthenosphere system in the Central Mediterranean
22
Tectonophysics 287 (I 998) I 17- 138 Gravity modelling of the litho-asthenosphere system in the Central Mediterranean F. Cella *, M. Fedi, G. Florio, A. Rapolla Dipartitnento di Geqjisica e Vulcanologia Universitri degli Studi ‘Federico II’ di Napoli, 80138 Napoli, Ital? Received 15 January 1997; accepted 24 September 1997 Abstract The results of the 2.5-D gravity modelling of the litho-asthenosphere system in the Central Mediterranean, along two regional geotransects, are presented and their possible implications for the geodynamical evolution of this area are discussed. Particularly, gravity data on the Tyrrhenian and ProvenGal-Balearic basins were interpreted introducing significant constraints by means of several main petro-physical parameters tied to the litho-asthenospheric evolution during the extensive tectonics. By this approach, based on the model of McKenzie and Bickle (in: J. Petrol., 29, pp. 625-679, 1988) and White and McKenzie (in: J. Geophys. Res., 94, B6, pp. 7685-7729, 1988), the estimation of the vertical density distribution in the lithosphere-asthenosphere system has been possible. Significant differences in the gravity anomaly field occur when different density models of asthenospheric upwelling are considered. This depends on factors like the thermal regime, the stretching of the lithosphere and its thickness before it. The obtained results contributed to the validation of models interpreting the origin of the Tyrrhenian and Ligurian-ProvenGal basins as related to a passive extensional process rather than to the presence of an active upwelling asthenosphere beneath the Central Mediterranean basins. 0 1998 Elsevier Science B.V. All rights reserved. Kqwords: Thyrrhenian basin; lithosphere; asthenosphere; gravity anomalies; density; geodynamics 1. Previous works 1.1. The Tyrrhenian Sea The Tyrrhenian basin (Fig. 1) is a small and deep basin of an asymmetric shape, partially floored with basaltic crust. In the western part of the basin the continental crust has been stretched and thinned by rotational normal faulting prior to the formation of the basaltic crust (Moussat et al., 1985), revealing the presence of asymmetrical, tilted basement blocks *Corresponding author. Fax: +39 (81) 552-7631: E-mail: [email protected] (Kastens et al., 1988). The northern sector of the Tyrrhenian basin is composed of continental crust that underwent an intense anatectic magmatism of Late Miocene age (Barbieri et al., 1986), followed by cyclic extensional phases (Bernini et al., 1990). The south- western part of the Tyrrhenian basin (Sardinia Chan- nel) is characterized by thinned continental crust, un- derplated by partial melt in the central region (Peirce and Barton, 1992). The central part of the basin is the youngest and the deepest and mainly composed of large extensions of tholeiitic basal& including several alkali-basaltic volcanic centres (Magnaghi, Vavilov, Marsili), located within a strongly stretched ancient continental crust (Kastens et al., 1988). 0040. I95 I /98/$19.00 0 1998 Elsevier Science B.V. All rights reserved. PII SOO40- I95 1(97)00244-8
Transcript of Gravity modelling of the litho-asthenosphere system in the Central Mediterranean
Tectonophysics 287 (I 998) I 17- 138
Gravity modelling of the litho-asthenosphere system in the Central Mediterranean
F. Cella *, M. Fedi, G. Florio, A. Rapolla
Dipartitnento di Geqjisica e Vulcanologia Universitri degli Studi ‘Federico II’ di Napoli, 80138 Napoli, Ital?
Received 15 January 1997; accepted 24 September 1997
Abstract
The results of the 2.5-D gravity modelling of the litho-asthenosphere system in the Central Mediterranean, along two regional geotransects, are presented and their possible implications for the geodynamical evolution of this area are discussed. Particularly, gravity data on the Tyrrhenian and ProvenGal-Balearic basins were interpreted introducing significant constraints by means of several main petro-physical parameters tied to the litho-asthenospheric evolution during the extensive tectonics. By this approach, based on the model of McKenzie and Bickle (in: J. Petrol., 29, pp. 625-679, 1988) and White and McKenzie (in: J. Geophys. Res., 94, B6, pp. 7685-7729, 1988), the estimation of the vertical density distribution in the lithosphere-asthenosphere system has been possible. Significant differences in the gravity anomaly field occur when different density models of asthenospheric upwelling are considered. This depends on factors like the thermal regime, the stretching of the lithosphere and its thickness before it. The obtained results contributed to the validation of models interpreting the origin of the Tyrrhenian and Ligurian-ProvenGal basins as related to a passive extensional process rather than to the presence of an active upwelling asthenosphere beneath the Central Mediterranean basins. 0 1998 Elsevier Science B.V. All rights reserved.
Kqwords: Thyrrhenian basin; lithosphere; asthenosphere; gravity anomalies; density; geodynamics
1. Previous works
1.1. The Tyrrhenian Sea
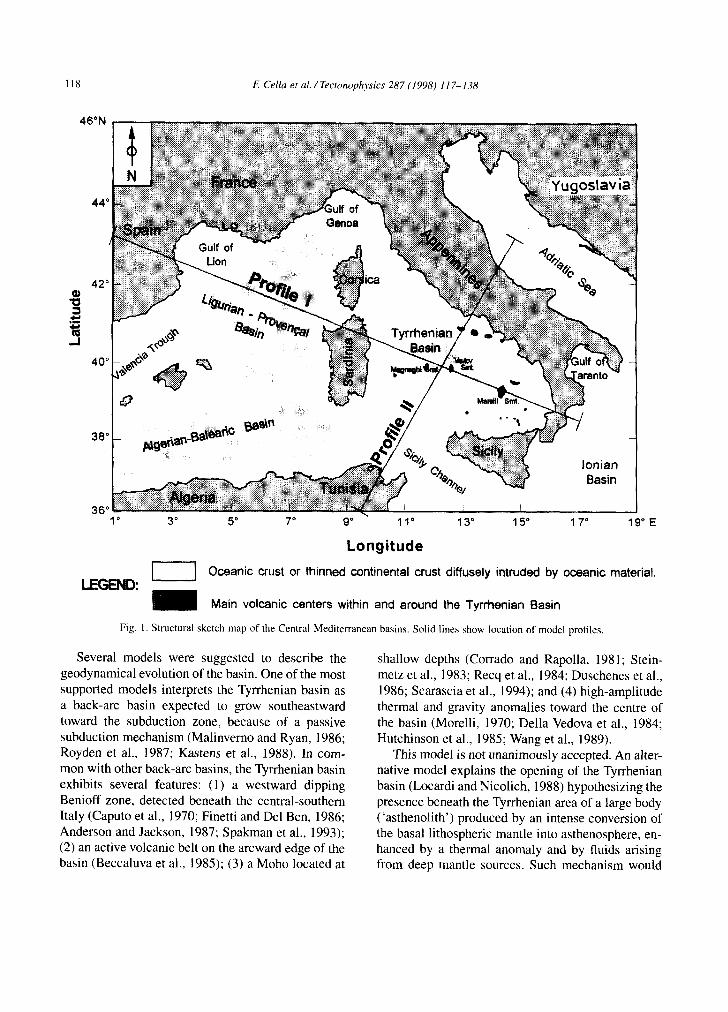
The Tyrrhenian basin (Fig. 1) is a small and deep basin of an asymmetric shape, partially floored with basaltic crust. In the western part of the basin the continental crust has been stretched and thinned by rotational normal faulting prior to the formation of the basaltic crust (Moussat et al., 1985), revealing the presence of asymmetrical, tilted basement blocks
*Corresponding author. Fax: +39 (81) 552-7631: E-mail:
(Kastens et al., 1988). The northern sector of the Tyrrhenian basin is composed of continental crust that underwent an intense anatectic magmatism of Late Miocene age (Barbieri et al., 1986), followed by cyclic extensional phases (Bernini et al., 1990). The south- western part of the Tyrrhenian basin (Sardinia Chan-
nel) is characterized by thinned continental crust, un- derplated by partial melt in the central region (Peirce and Barton, 1992). The central part of the basin is
the youngest and the deepest and mainly composed of large extensions of tholeiitic basal& including several alkali-basaltic volcanic centres (Magnaghi, Vavilov, Marsili), located within a strongly stretched ancient continental crust (Kastens et al., 1988).
0040. I95 I /98/$19.00 0 1998 Elsevier Science B.V. All rights reserved.
PII SOO40- I95 1(97)00244-8
118
46"N
42"
3 .f:
F: Cella et (11. /Tectonophyics 287 (1998) 117-138
1" 3" 5" 7" 9" 11" 13" 15" 17" -
19"E
Longitude
Oceanic crust or thinned continental crust diffusely intruded by oceanic material.
Main volcanic centers within and around the Tymhenian Basin
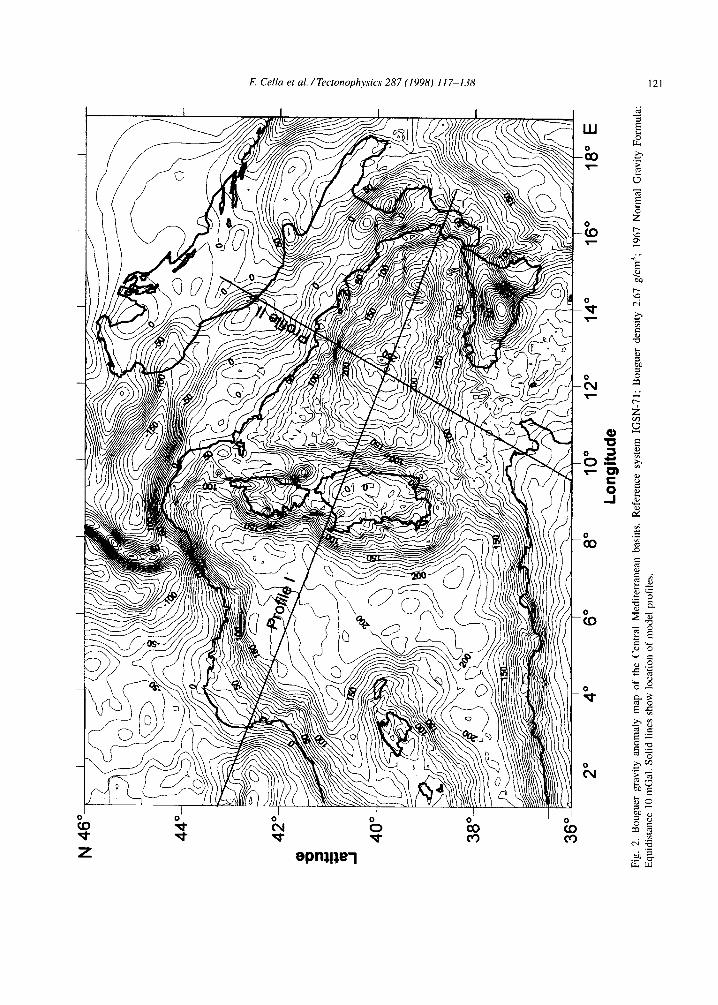
Fig. I. Structural sketch map of the Central Mediterranean basins. Solid lines show location of model profiles.
Several models were suggested to describe the geodynamical evolution of the basin. One of the most supported models interprets the Tyrrhenian basin as a back-arc basin expected to grow southeastward toward the subduction zone, because of a passive subduction mechanism (Malinvemo and Ryan, 1986; Royden et al., 1987; Kastens et al., 1988). In com- mon with other back-arc basins, the Tyrrhenian basin exhibits several features: (1) a westward dipping Benioff zone, detected beneath the central-southern Italy (Caputo et al., 1970; Finetti and Del Ben, 1986; Anderson and Jackson, 1987; Spakman et al., 1993); (2) an active volcanic belt on the arcward edge of the basin (Beccaluva et al., 1985); (3) a Moho located at
shallow depths (Corrado and Rapolla, 1981; Stein-
metz et al., 1983; Recq et al., 1984; Duschenes et al., 1986; Scarascia et al., 1994); and (4) high-amplitude
thermal and gravity anomalies toward the centre of the basin (Morelli, 1970; Della Vedova et al., 1984; Hutchinson et al., 1985; Wang et al., 1989).
This model is not unanimously accepted. An alter- native model explains the opening of the Tyrrhenian basin (Locardi and Nicolich, 1988) hypothesizing the presence beneath the Tyrrhenian area of a large body (‘asthenolith’) produced by an intense conversion of the basal lithospheric mantle into asthenosphere, en- hanced by a thermal anomaly and by fluids arising from deep mantle sources. Such mechanism would
F: Cella et al. / Tectonophyics 2X7 (1998) I I7- 138 119
be coherent with evidences from available geophysi-
cal and geological data. It does not coincide with an asthenospheric intrusion caused by external driving forces (passive rifting) but substantially it represents an active mechanism associated with the presence of a deep thermal anomaly in the lower mantle. There- fore, the magmatic setting in the peri-Tyrrhenian regions would be interpreted not as the consequence of a westward dipping subduction below the Central and Southern Apennines but with the presence of a fluidized asthenospheric mass flowed from the top of the Tyrrhenian asthenolith toward the Apenninic belt. Thus, andesitic, K-andesitic and shoshonitic magmas
would be delivered in quick succession in the tran- sition area between the allochthonous fluidized mass and the asthenolith.
Even the location of deep-seated earthquakes along an inclined seismic belt is explained as the contact zone between the convecting hot mantle, ris- ing beneath the Tyrrhenian basin and the ‘cool’ and rigid mantle beneath the Adria plate rather than by the occurrence of a Benioff zone.
Moreover, recent studies based on a careful rein- terpretation of large geochemical data sets, (Cundari
and Ferguson, 1991; Cundari, 1994), demonstrate that the hypothesis of a relationship between the pet- rogenesis of potassic magmatism and the subduction process, where this is hypothetical, is inconsistent with several recent geological and petrological data worldwide and therefore is not geochemically sub- stantiated.
A third, more recent, global view of the geo- dynamical evolution of the Central Mediterranean and of the Tyrrhenian basin introduces several major complexities in order to explain the unusual asym- metry of the tectonic domains and to find agreement among a large amount of apparently inconsistent data (Doglioni, 1991). This model explains the evolution of the Tyrrhenian basin in the frame of a global westward motion of the lithosphere relative to the
asthenosphere. Consequently, an eastward oriented flow of the asthenosphere increased the Adriatic slab slope and caused an eastward migration of the
central-northern Apennines during the Neogene and Pleistocene, associated with the rollback of the sub- duction hinge. In particular, the progressive south- eastward migration of the spreading centre of the Tyrrhenian and the stronger southeastern deviation
of the Ionian arc should be related to the differ- ent hinge ‘rollback’ rate of the subducting Adriatic lithosphere. In fact, thicker and less dense conti- nental lithosphere of the Apulian swell arrived at the subduction hinge along the Central Apennines, thus slowing down the process, whereas southward,
along the Calabrian arc, old oceanic lithosphere still constitutes the slab at depth.
Finally, some authors (Mantovani et al., 1992) considered the above-mentioned models unable to account for a number of basic features observed
in the Central Mediterranean. They suggested that the complex space-time post-Tortonian events in the
Central Mediterranean can be explained by a rela- tively simple model if we assume a driving mecha- nism consisting in an approach between Africa and
Eurasia roughly along a SSW-NNE direction, and in extrusion tectonics as the main deformation pattern.
1.2. The Ligurian-Provengal basin
The Ligurian-Provegal basin (Fig. 1) is located
in the northwestern Mediterranean and includes the Gulf of Lion and the Ligurian Sea. The models to explain the geodynamical nature of this basin are
substantially the same as those proposed for the Tyrrhenian basin. The hypothesis of the Ligurian- Provencal basin as a back-arc structure was pro- posed by Biju-Duval et al. ( 1977) and Durand-Delga and Fonbote (1980). As suggested by this model, its opening would have preceded the formation of the Tyrrhenian basin, contemporaneously with the emplacement of oceanic crust and after a rifting
episode from the Late Oligocene to earliest Miocene. This would have resulted from a hypothetical coun- terclockwise rotation of the Sardinian-Corsican mi- croplate southeastward.
The decrease of Moho depth (up to 11 km) along the deeper portion of the Ligurian-Provencal basin was early recognised (Hirn et al., 1977), whereas a lithospheric thinning (60 km) was only suspected (Him et al., 1977). Afterwards, the oceanic nature of the central region of the Ligurian-Provencal basin
was confirmed by the results of seismic soundings and gravity and magnetic data (Le Douran et al., 1984).
In addition, a distinction between two different basins was proposed: (a) the Gulf of Lions, with
120 E Cella et al. / Tectonophysics 287 ( 1998) I 17-138
wider and thinner margins and with a thick oceanic basement (5-7 km); (b) the Ligurian Sea, delineated by deeper margins, with thin oceanic basement (3 km) and a narrower oceanic area, probably not ex- tending toward the Gulf of Genoa. The deeper part of the latter was interpreted as thinned continental crust with a minimum thickness of 16 km (Ginzburg et al., 1986). Beneath the continental slope of the ProvenGal margin, a strong decrease of the Moho depth from 20 km to 10 km was inferred from seismic data together with the presence of a 5-6 km thin oceanic crust up to the Sardinian margin (Pascal et al., 1993).
Burrus (1984) proposed a two-stage kinematic model to describe the opening of the Ligurian- Provencal basin. At first, Corsica and Sardinia drifted asymmetrically as a singled block; subsequently, the accretion became symmetrical and Sardinia drifted with an additional 15” rotation.
On the other hand, the northeastern part of the basin, toward the Ligurian Sea, would seem to be the result of a compressive stress-field (Rehault and Bethoux, 1984). A set of magnetic lines was also identified (Galdeano and Rossignol, 1977; Burrus, 1984), and were reasonably correlated with a ge- omagnetic time scale. Nevertheless, this result dis- agrees with tectonic evidence (De Voogt et al., 1991; Pasquale et al., 1995) showing the lack of a clear and extended spreading centre.
More recent seismic data in the Gulf of Lion may be interpreted with an early rifting stage when the Valencia Trough formed, and with a second stage with the drifting of the Corsican-Sardinian plate (Pascal et al., 1993);
Finally, extensional tectonics appear to have mi- grated from the Ligurian-Provencal basin beyond the eastern side of the Sardinian-Corsican plate. Consequently, the Tyrrhenian basin started to open (La Vecchia, 1988). This was explained by Nur et al. (1986) who stated that the amount of fault rotation permissible under a stable stress field can not be larger than 20”-45”. Block rotations larger than this limit require the formation of a new set of faults so that, where the lithospheric deformations along the Ligurian-Provencal basin exceeded the above value, the spreading centre jumped to the east of the Sardinian-Corsican plate (La Vecchia, 1988), causing the opening of the more recent Tyrrhenian basin.
2. Main purposes of this work
As shown in Fig. 2, in the Mediterranean re- gion a clear correlation exists between marine basins and very strong positive Bouguer regional anoma- lies (Ligurian-ProvenCal basin: +210 mGa1; Tyrrhe- nian basin: +250 mGa1; Jonian basin: +310 mGa1). Moreover, continental margins or small continen- tal fragments (Italian Peninsula; Sardinian-Corsican microplate) are correlated with long-wavelength neg- ative Bouguer anomalies. The aim of this study is to give a contribution to the reconstruction of the structure of the lithosphere-asthenosphere system beneath the Central Mediterranean basins and of its geodynamical evolution by utilizing gravity data.
In particular, we addressed the mechanism (pas- sive or active) of the upwelling asthenosphere and of the opening of the Ligurian-ProvenCal and Tyrrhe- nian basins. These two opposite kinds of rifting pro- cesses are strictly related to rather different styles of upwelling asthenosphere, depending on several fac- tors like the mantle thermal regime and the presence of external forces driving the lithospheric thinning process. Different uprising models will be charac- terized by different vertical density distributions and, consequently, will generate different gravity anomaly fields. Therefore, if these models are available, ob- served gravity data can be used to constrain them to choose the most reasonable one. This was carried out here by means of an approach based on McKenzie and Bickle (1988) and White and McKenzie (1988).
3. Density distribution in the upwelling asthenosphere
The estimation of the density distribution within uprising asthenospheric mantle needs a careful eval- uation of the following parameters: - the vertical distribution of temperature in the up-
welling asthenosphere; - the amount of melt fraction during partial melting
of mantle rock and its change with depth; - the composition of the melt and its change with
depth; - the composition of the uprising asthenospheric
residual rocks after the magma segregation; - the dependence of the thermal expansion on the
composition of both the liquid fraction generated
E Cella et al. /TectonophyGcs 287 (1998) 117-138
122 E Cella et al. / Tectonophysics 287 (1998) I 17-138
by partial melting and the uprising asthenospheric residual rocks resulting from the extraction of the latter. There are a few models that allow to describe the
evolution of the uprising asthenosphere from both the physical and petrological point of view. Among them, the model suggested by McKenzie and Bickle (1988) and White and McKenzie (1988) allows to describe the asthenospheric upwelling process on the base of several parameters:
(1) Potential temperature (T,), i.e. the temperature that a fluid mass would have if it were compressed or expanded at a constant reference pressure. Generally, a low Tp value (1280 - 1320°C) indicates the ab- sence of a thermal perturbation in the lower mantle. This implies an uprising asthenosphere due only to plate separation caused by external driving forces. This case, common in most parts of ocean ridges, could be considered as typical of ‘passive rifting’. On the contrary, high Tp values (1460 - 1480°C) indicate the probable presence of a ‘hot rising jet’ (Oxburgh, 1980), or ‘hot plume’ having a deep ther- mal origin (Courtney and White, 1986);
(2) The stretching factor (/?) (McKenzie, 1984), that is the “ratio of the final to initial surface area in- volved in the rifting process” (McKenzie and Bickle, 1988). The latter can be inferred from geological and geophysical data and could have a different
1600
o^ 1500 e
1100
value if related to the whole lithosphere or to the shallower brittle crustal layer. In the present case, the stretching amount of the whole lithosphere was taken into account, because the vertical temperature distribution in the mantle is strongly constrained by the global thinning of the lithosphere. As far as the Ligurian-Provencal and Tyrrhenian basins are concerned, some authors suggested a quantitative es- timation of /I in these basins deduced from thermal evidences. Hutchinson et al. (1985) interpreted heat flux data and bathymetry to estimate a stretching value /I > 6 in the Tyrrhenian basin. Afterwards, results of ODP Leg 107 (Kastens et al., 1988) re- duced the uncertainties about the ages of extension of the basin, allowing Wang et al. (1989) to sug- gest a little bit smaller values (/I = 4 to 5). These informations were precious because they allowed to constrain one of the parameters needed to calcu- late density profiles and, indirectly, to constrain the gravity modelling.
(3) Lithospheric thickness before stretching. In the present case the thickness of the continental lithosphere in the Mediterranean region and southern Europe with ‘undisturbed’ features should be taken into account (e.g. the Corsica-Sardinia block, the eastern part of the Italian Peninsula, the central and southern Adriatic Sea, southern France). In these regions the continental lithosphere was estimated to
1 Solidus curve 1 Tp = 1480 OC
Depth (km) MBL thickness = 90 Km
- _-a=2 ----13=3 _____ ___ .._.. fJ=5 a=, (-j -r3=50
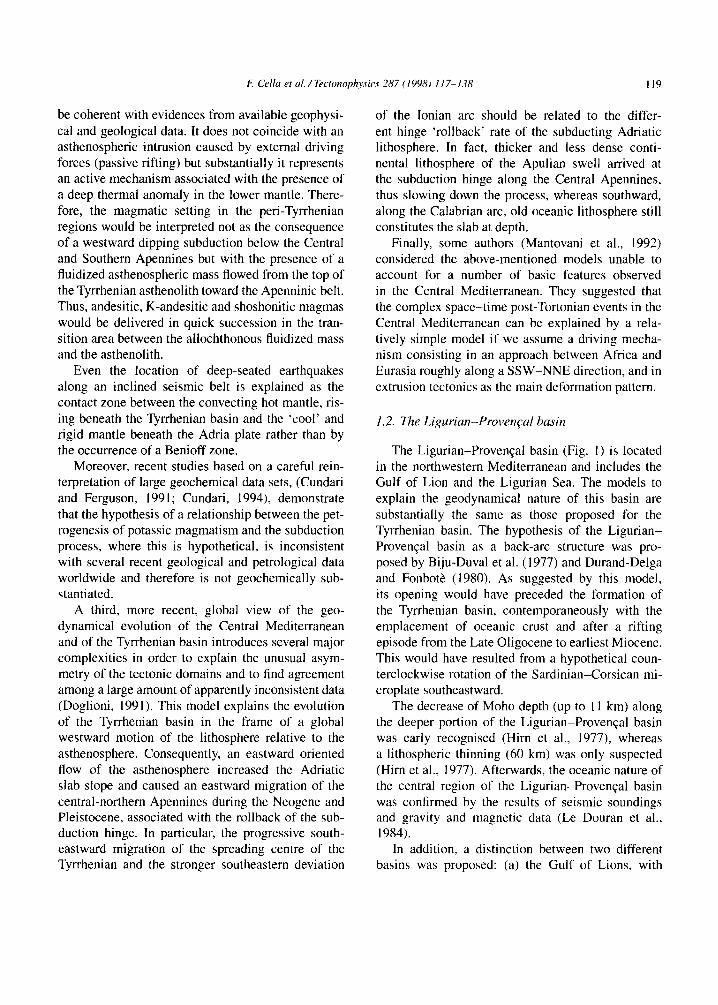
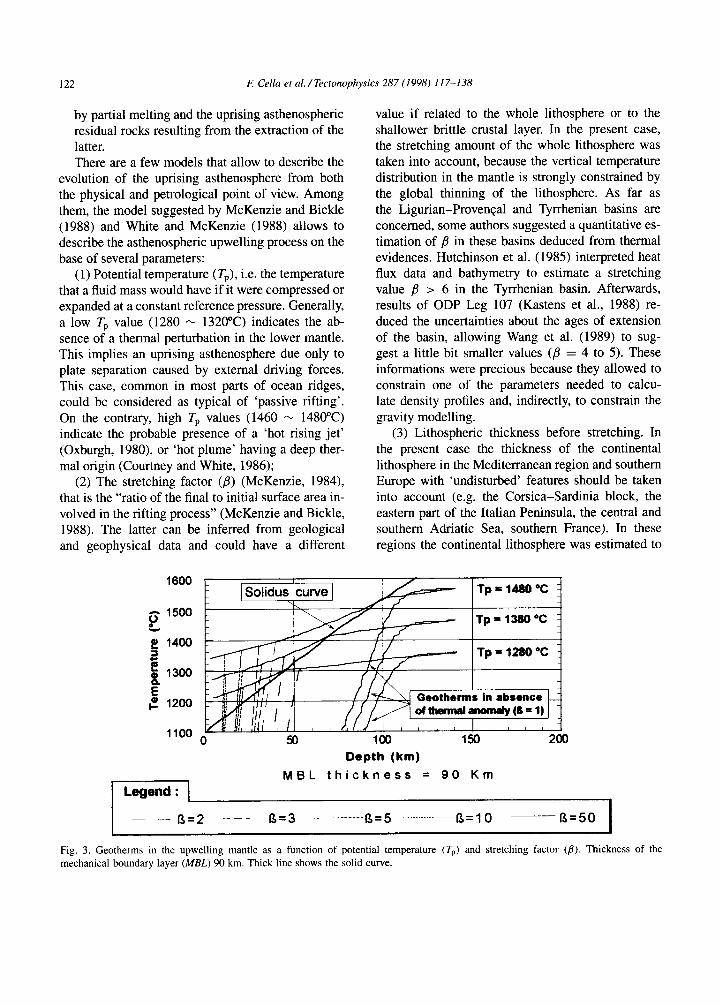
Fig. 3. Geotherms in the upwelling mantle as a function of potential temperature (TP) and stretching factor (B). Thickness of the mechanical boundary layer (MBL) 90 km. Thick line shows the solid curve.
E Cella et al. / Tectonophysics 287 (1998) I 17-138 123
40 35
g 30
5 25
2 20 g s '5 g 10
5 0
0 20 40 60 80 100 120
Depth (km)
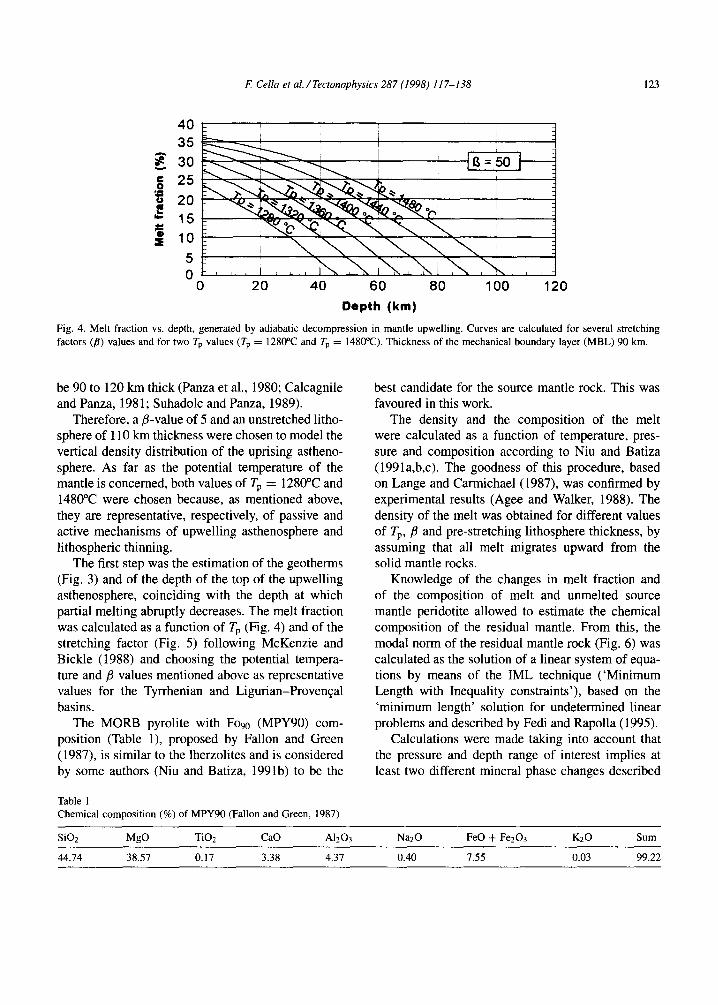
Fig. 4. Melt fraction vs. depth, generated by adiabatic decompression in mantle upwelling. Curves are calculated for several stretching
factors (B) values and for two TP values (TP = 1280°C and TP = 1480°C). Thickness of the mechanical boundary layer (MBL) 90 km.
be 90 to 120 km thick (Panza et al., 1980; Calcagnile and Panza, 1981; Suhadolc and Panza, 1989).
Therefore, a B-value of 5 and an unstretched litho- sphere of 110 km thickness were chosen to model the vertical density distribution of the uprising astheno- sphere. As far as the potential temperature of the mantle is concerned, both values of Tp = 1280°C and 1480°C were chosen because, as mentioned above, they are representative, respectively, of passive and active mechanisms of upwelling asthenosphere and lithospheric thinning.
The first step was the estimation of the geotherms (Fig. 3) and of the depth of the top of the upwelling asthenosphere, coinciding with the depth at which partial melting abruptly decreases. The melt fraction was calculated as a function of Tp (Fig. 4) and of the stretching factor (Fig. 5) following McKenzie and Bickle (1988) and choosing the potential tempera- ture and fi values mentioned above as representative values for the Tyrrhenian and Ligurian-Provencal basins.
The MORB pyrolite with Foss (MPY90) com- position (Table l), proposed by Fallon and Green (1987), is similar to the lherzolites and is considered by some authors (Niu and Batiza, 1991b) to be the
Table 1 Chemical composition (%) of MPY90 (Fallon and Green, 1987)
best candidate for the source mantle rock. This was favoured in this work.
The density and the composition of the melt were calculated as a function of temperature, pres- sure and composition according to Niu and Batiza (1991a,b,c). The goodness of this procedure, based on Lange and Carmichael (1987), was confirmed by experimental results (Agee and Walker, 1988). The density of the melt was obtained for different values of Tp, /I and pre-stretching lithosphere thickness, by assuming that all melt migrates upward from the solid mantle rocks.
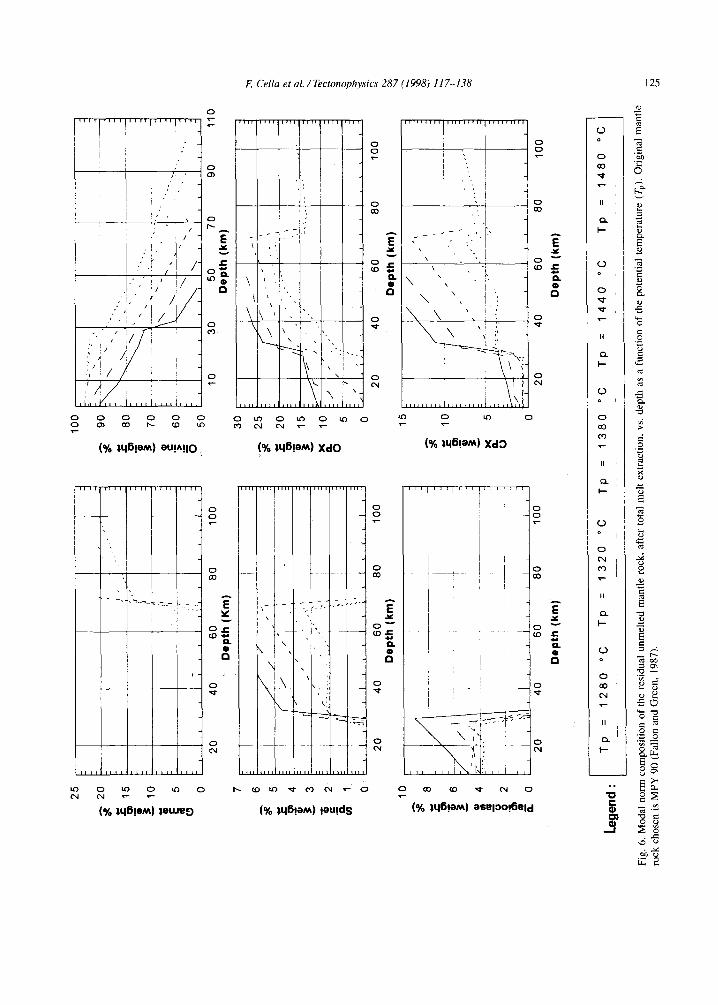
Knowledge of the changes in melt fraction and of the composition of melt and unmelted source mantle peridotite allowed to estimate the chemical composition of the residual mantle. From this, the modal norm of the residual mantle rock (Fig. 6) was calculated as the solution of a linear system of equa- tions by means of the IML technique (‘Minimum Length with Inequality constraints’), based on the ‘minimum length’ solution for undetermined linear problems and described by Fedi and Rapolla (1995).
Calculations were made taking into account that the pressure and depth range of interest implies at least two different mineral phase changes described
SiOz
44.74
MgO
38.57
TiOz
0.17
CaO
3.38
A1203
4.37
Na20
0.40
Fe0 + Fe203
7.55
K20 Sum
0.03 99.22
124 E Cella et al. / Tectonophysics 287 (I 998) I 17-138
0 20 40 60 80 100
Depth (km)
Thickness of Mechanical Boundary Layer (MBL) = 90 Km.
I Legend: I3 = 2 I3 = 3 r3=5 l3= 10 n = 50 - _ --_ I
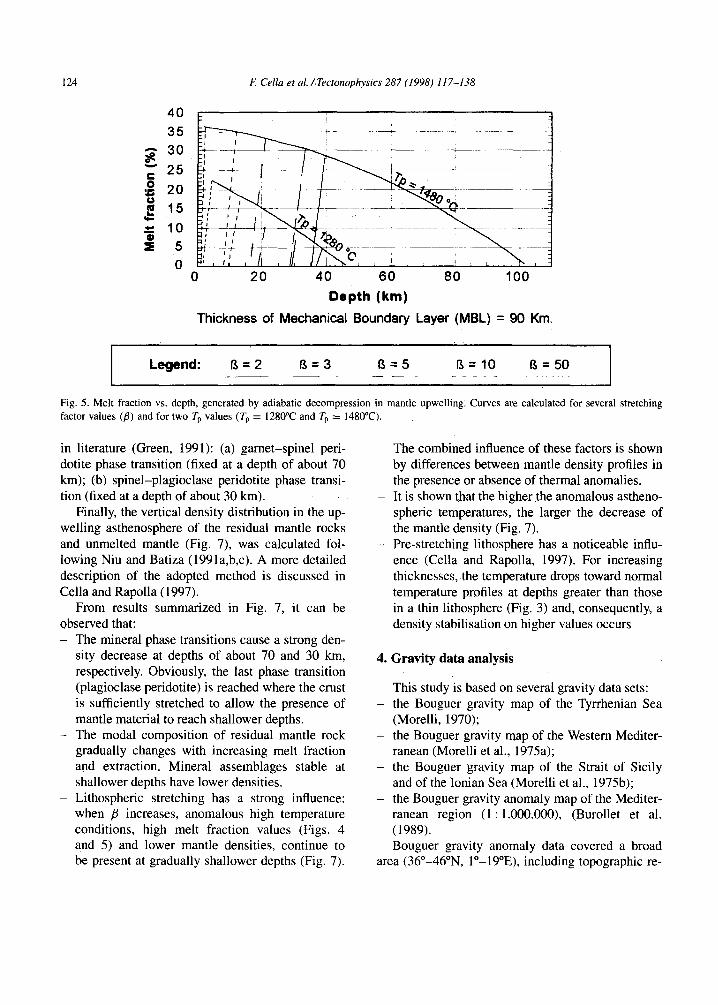
Fig. 5. Melt fraction vs. depth, generated by adiabatic decompression in mantle upwelling. Curves are calculated for several stretching
factor values (,!I) and for two T, values (TP = 1280°C and TP = 1480°C).
in literature (Green, 1991): (a) garnet-spine1 peri- dotite phase transition (fixed at a depth of about 70 km); (b) spinel-plagioclase peridotite phase transi- tion (fixed at a depth of about 30 km).
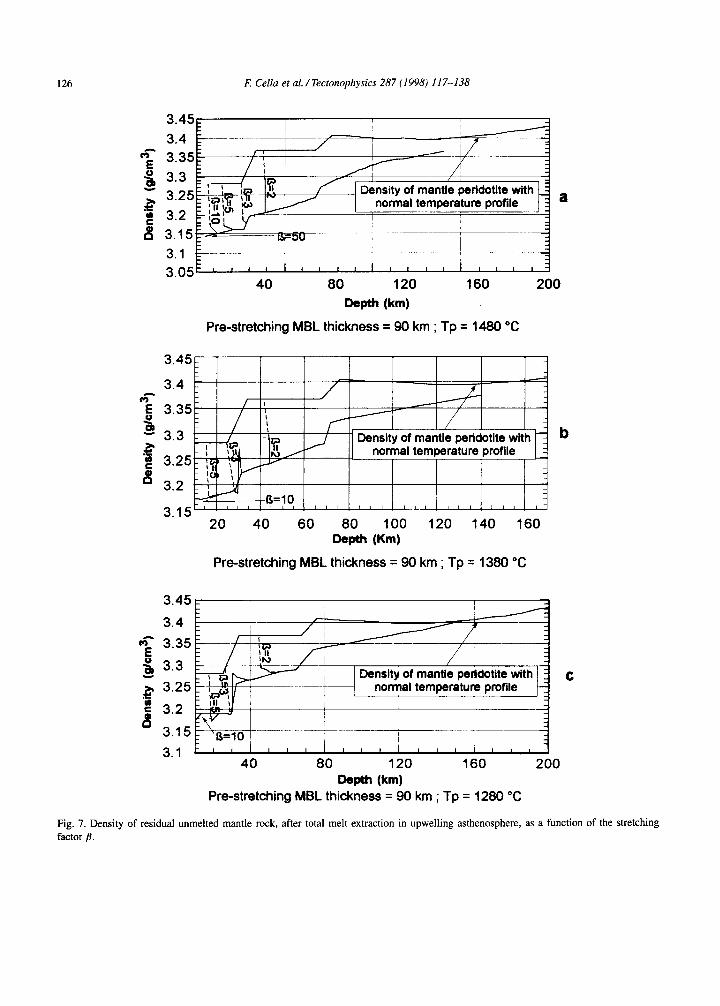
Finally, the vertical density distribution in the up- welling asthenosphere of the residual mantle rocks and unmelted mantle (Fig. 7), was calculated fol- lowing Niu and Batiza (1991a,b,c). A more detailed description of the adopted method is discussed in Cella and Rapolla (1997).
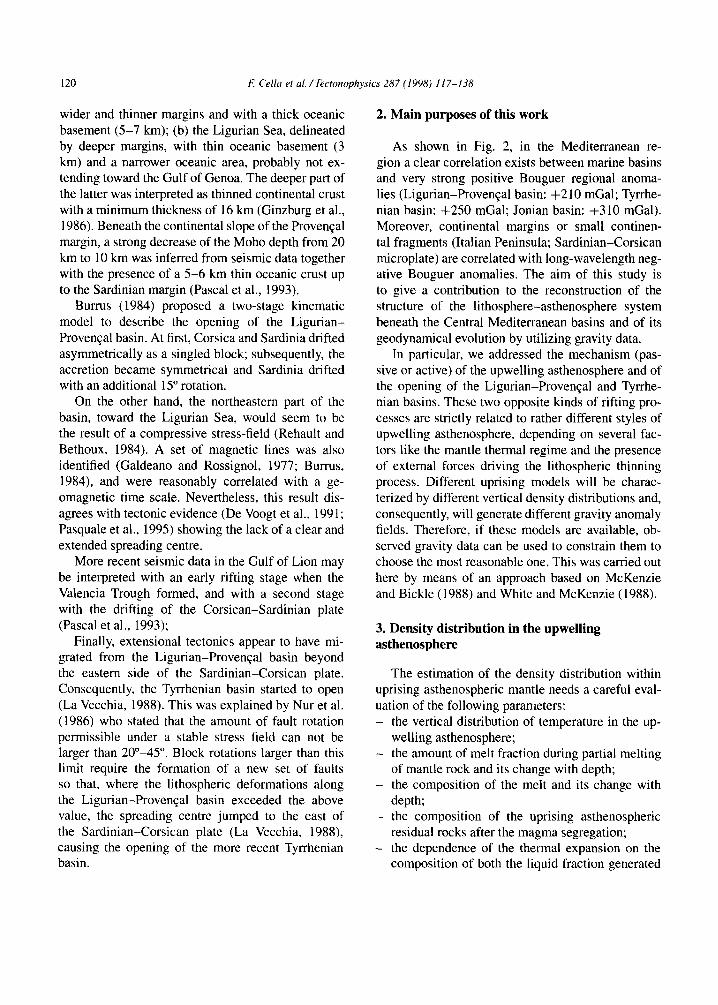
From results summarized in Fig. 7, it can be observed that: - The mineral phase transitions cause a strong den-
sity decrease at depths of about 70 and 30 km, respectively. Obviously, the last phase transition (plagioclase peridotite) is reached where the crust is sufficiently stretched to allow the presence of mantle material to reach shallower depths.
- The modal composition of residual mantle rock gradually changes with increasing melt fraction and extraction. Mineral assemblages stable at shallower depths have lower densities.
- Lithospheric stretching has a strong influence: when /l increases, anomalous high temperature conditions, high melt fraction values (Figs. 4 and 5) and lower mantle densities, continue to be present at gradually shallower depths (Fig. 7).
The combined influence of these factors is shown by differences between mantle density profiles in the presence or absence of thermal anomalies.
- It is shown that the higher the anomalous astheno- spheric temperatures, the larger the decrease of the mantle density (Fig. 7).
- Pre-stretching lithosphere has a noticeable influ- ence (Cella and Rapolla, 1997). For increasing thicknesses, the temperature drops toward normal temperature profiles at depths greater than those in a thin lithosphere (Fig. 3) and, consequently, a density stabilisation on higher values occurs
4. Gravity data analysis
This study is based on several gravity data sets: the Bouguer gravity map of the Tyrrhenian Sea (Morelli, 1970); the Bouguer gravity map of the Western Mediter- ranean (Morelli et al., 1975a); the Bouguer gravity map of the Strait of Sicily and of the Ionian Sea (Morelli et al., 1975b); the Bouguer gravity anomaly map of the Mediter- ranean region (1 : l.OOO.OOO), (Burollet et al. (1989). Bouguer gravity anomaly data covered a broad
area (36”-46”N, lo-19”E), including topographic re-
E Celia et al./Tectonophysics 287 (1998) 117-138 1 2 5
I ~ I I I I
i "
; ' , ; \
, ! ' ' r/ : / -
I% ),q6!e~) eu!A.llO
I I I
( % l q 6 ! O M ) leu~e~)
0
o
o
o
' ' " ' ' ' ' 1 I r l l , r , , , i , , , i
\ \ ,
\ , ,
0 ~ 0 ~ 0 ~ 0
I , I
i .
\ ! ' "'" J .., ' ,, i ' "'i. ~ \ \ ~, - :
~S
0 0
0
0 O0
A
E 0 v © : .
0 a
0
0
!% :l, q6!e~) XdO (% ],q6!eM) XdO
I l ! o
j i
o o
' - ;"~~: g / ! , ! o g r'., " ; a II~
\ ' ,:
/ i I l o
(% ; Iql~!eM) l e u ! d s ( % ~,q§!eM) eSe l~ ,O!6e ld
E
.,,.
©
%
©
"5
>
0
E
0 ~ o'~
u;
II , - o
• . E ~
C =
126 E Cella et al. /Tectonophysics 287 (1998) 117-138
a
3.05F ’ ’ ’ ’ ’ ’ ’ ’ ’ ’ ’ ’ ’ ’ ’ 40 80 120 160 200
Depth (km)
Pre-stretching MBL thickness = 90 km ; Tp = 1480 “C
3.45
3.4
% 3.35
B 3.3 b
g ’ 312 325
3.15 20 40 60 80 100 120 140 160
Depth (Km)
Pre-stretching MBL thickness = 90 km ; Tp = 1380 “C
3.45
3.4
m; 3.35
5 3.3 C
‘ID g 3.25
c 91
3.2
3.15
3.1 40 80 120 160 200
Depth (km) Pre-stretching MBL thickness = 90 km ; Tp = 1280 “C
Fig. 7. Density of residual unmelted mantle rock, after total melt extraction in upwelling asthenosphere, as a function of the stretching
factor ~9.
E Cella et al. / Tectonophysics 287 (I 998) 117-138 127
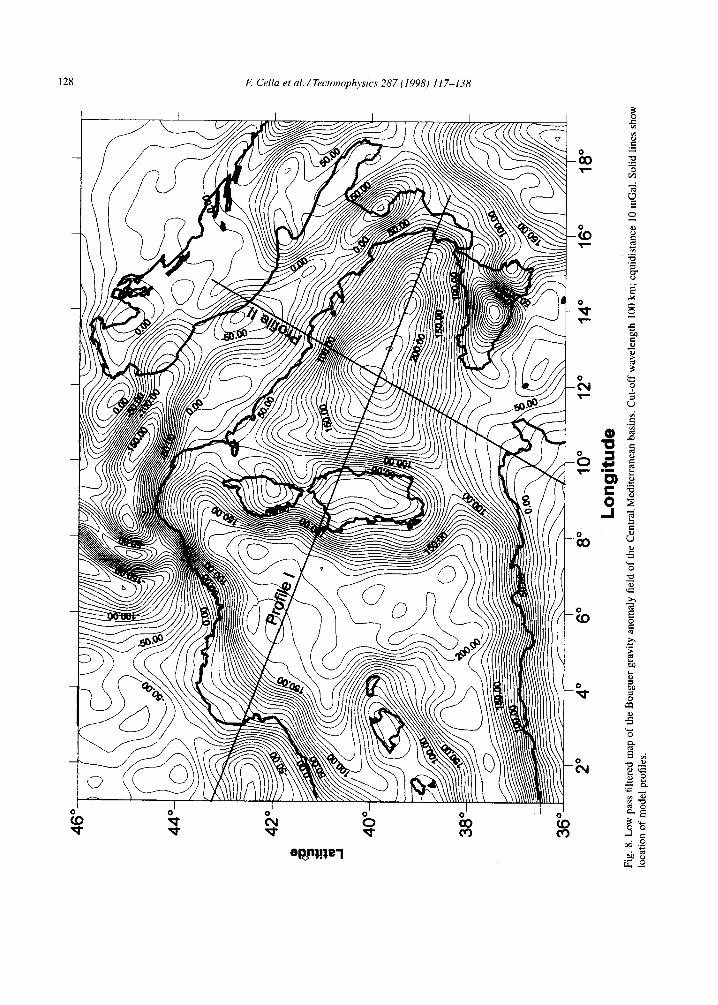
duction, to provide a step grid (5’) coherent with the regional aim of this study (Fig. 2).
In order to recognise the geometrical pattern of sub-crustal sources (Moho and lithosphere-astheno- sphere boundary (LAB)), the removal of high-fre- quency signals due to shallow crustal sources was preferred. A frequency domain filter provided with a Hamming-Tukey window was adopted and, in order to reduce distortions from boundary effects, the data were previously bordered extrapolating data with a maximum entropy predictor algorithm.
Previous works (Pinna and Rapolla, 1979; Cella et al., 1995) suggested for the Moho boundary Bouguer anomalies of a few hundreds of kilometres wave- length.
In the present case the broad range of frequen- cies characterizing the spectral contribution of the Moho and LAB gravity signals suggested the choice of a not very long cut-off wavelength (100 km) (Fig. 8). Consequently, only small differences re- sult between observed and filtered gravity profiles, consisting of a slight smoothing effect of the high- frequency field due to the density contrasts within sedimentary basins. On the other hand, this field can not be resolved because of the large step grid (5’).
The components related to the morphology of Moho and LAB are rather difficult to separate by numerical filtering, because these sources have both similar lateral extensions and depth ranges. Con- sequently, they generate anomalies whose spectral components are partially overlapping. Thus, we have made no attempt to separate the contribution of the Moho and the LAB.
5. Gravity data interpretation along profiles 1 and 2
The regional gravity anomaly field, obtained by means of a low pass filter with a 100 km cut- off wavelength, was interpreted along two profiles (Fig. 1) by adopting a 2.5-D inversion method (Ras- mussen and Pedersen, 1979; Fedi, 1989). The half- strike values chosen in the gravity modelling are shown in Table 2. Gravity models were calculated by introducing several constraints. First of all, bound- aries between continental and oceanic crust were chosen based on the extent of the crust with oceanic features estimated by Duschenes et al. (1986) in
the Tyrrhenian basin (x300 km) and by Pasquale et al. (1995) in the Ligurian-Provencal basin (~250 km), even if some authors (Thisseau et al., 1986) identified only thinned continental crust diffusely in- truded by oceanic material in the Tyrrhenian Sea. The Moho depth was constrained with results in- ferred from many geophysical investigations along the whole profiles (Hirn et al., 1977; Steinmetz et al., 1983; Recq et al., 1984; Le Douran et al., 1984; Duschenes et al., 1986; Nicolich, 1989; Pascal et al., 1993; Scarascia et al., 1994). In addition heat flow evidence (Della Vedova et al., 1984) indicates a stretched crust beneath the southern Tyrrhenian Sea 8- 10 km thick.
The lithospheric thickness in the Central Mediter- ranean region was checked by the models based on Rayleigh-wave dispersion data (Knopoff and Panza, 1978; Panza et al., 1980; Calcagnile and Panza, 1981; Suhadolc and Panza, 1989) which indicate strong lat- eral thickness variations from 130 to about 30 km.
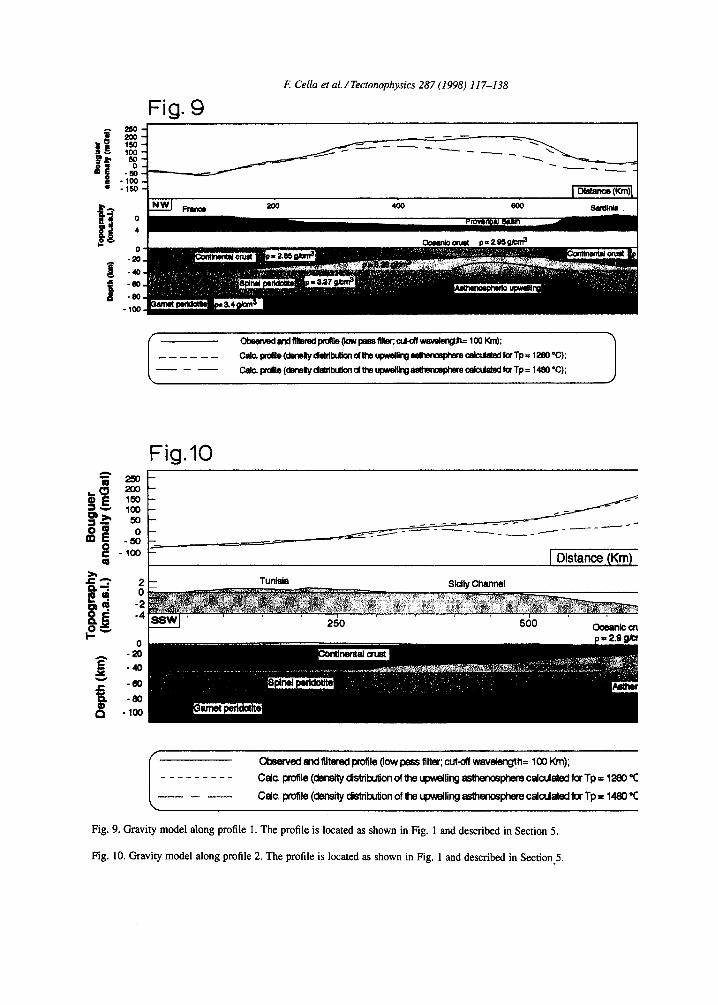
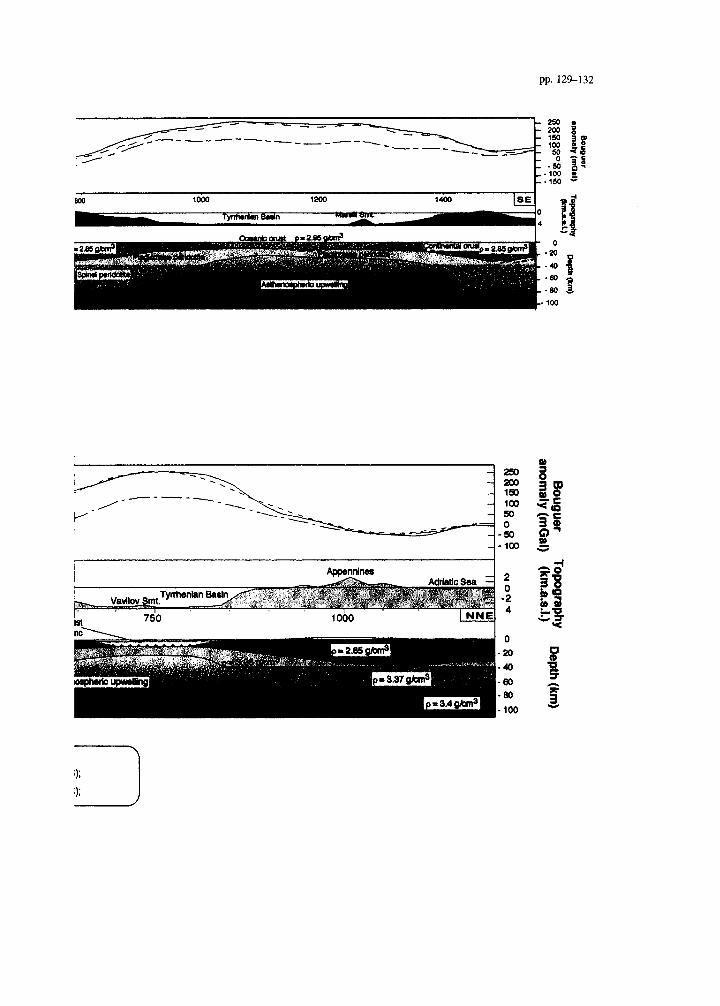
The gravity effect from the models along profiles 1 and 2 was calculated by assigning densities of the different mineral assemblages representing the undisturbed lithosphere and two vertical density dis- tributions (Fig. 7) estimated for Tp = 1280°C and Tp = 1480°C respectively. The densities assigned to the continental and oceanic crust, respectively, were chosen taking into account density values suggested by several authors as described in Cella et al. (1995).
Profile 1 (1725 km long) starts from the Euro- pean continental margin (43”24’N, 1”E) and crosses, southeastward, the Ligurian-Provencal basin, the Sardinia-Corsica block, the Tyrrhenian basin and the Calabrian arc, and ends in the Ionian basin (37’48’N, 19”E).
An examination of the results (Fig. 9) shows a substantial agreement between the LAB depth deduced in this study and the lithospheric thick- nesses reported by Calcagnile and Panza (198 1) and Suhadolc and Panza (1989). Slight differences ex- isting in lithospheric thickness beneath Sardinia are largely below the resolution of the method (Knopoff and Panza, 1978).
In our model the LAB rises from a depth of lOO- 110 km beneath the Calabrian arc up to 20-25 km in the western Tyrrhenian basin. On the western side of the profile the LAB rises up to a minimum depth of 25 km beneath the Ligurian-Provencal basin.
128 E Celia et al./Tectonophysics 287 (1998) 117-138
(D
0
r ~
8
?
r,.)
0 - I
E 0
o
E
'-'E
0 0

E Cella et al. /Tectonophysics 287 (I 998) 117-138
Fig. 9
Fig.10 250 200 150 100
50
-4 - 100 1 Distance (Km)
; -2 -4
250 500 Omanlc cn
/ obeenred mdMwed pmflle (low pass filter; cut-S wavekngth= 100 Km); ---______ Calc. pmf~le (density dsbibution of the upweiling tsthemsphere cdalatd fa Tp = 1280 “C
--- \
WC. pmfde (density dsbibulion oi the upwdling sthemsphera cdculatd for Tp = 1480 “c
Fig. 9. Gravity model along profile 1. The profile is located as shown in Fig. 1 and described in Section 5.
Fig. 10. Gravity model along profile 2. The profile is located as shown in Fig. 1 and described in Section_%
pp. 129-132
- 250 .

F: Cellu et al. /Tecronophysics 287 (199X) 117-138 133
Table 2
Half-strike values chosen for the 2.5 inversion along profiles 1 and 2
Continental crust Oceanic crust
Half strike Half strike
Lithospheric mantle
Half strike
Upwelling asthenosphere
Upward variable half strike
Profile I 150 km 150 km 350 km from 350 to 80 km
Profile 2 350 km 150 km 350 km from 350 to 120 km
The dashed line beneath the Apennine chain shows the Moho depth as suggested by Scarascia et al. (1994), who hypothesized the presence of a low-velocity zone corresponding to an abrupt crustal thickening beneath the eastern side of the Calabrian Arc. Nevertheless this model does not seem to be in agreement whit evidence inferred from gravity modelling in previous works (Corrado et al., 1974; Pinna and Rapolla, 1979) and in this study. In fact, a Moho structure as suggested by Scarascia et al. (1994) generates a gravity signal incompatible (more than 80 mGa1) with that observed in correspondence of the Calabrian chain.
A mass deficiency was detected by Marson et al. (1995) by interpreting gravity data of the eastern side of the Tyrrhenian basin, along a profile (profile 3) almost coinciding with profile 1 in this paper. They balanced it admitting the presence of a very large high-density body in the upper mantle overlain by thinned lithosphere claiming an agreement with the presence of a sinking seismogenetic lithospheric slab recognized by several authors. However, most of them (Anderson and Jackson, 1987; Patacca et al., 1990; Spakman et al., 1993) locate a slab whose slope seems to be quite higher, and therefore less horizontally extended, than that assumed by Marson et al. (1995). As suggested in our paper, by taking into account the variable density within the mantle upwelling due to the previously described factors, the assumption of such a large high-density body is not required.
Profile 2 (1200 km long) starts from the Tunisian margin of the African plate (36”N, 9”30’E) and crosses, northeastward, the Sicily Channel, the Tyrrhenian basin and the Central Apennines, end- ing in the Adriatic Sea (46”N, 17”E). Along profile 2 the lithosphere starts thinning beneath the coastal margin of Tunisia; the LAB is located at a depth ranging northeastward from 75 to 65 km beneath the Sicily Channel and continues to rise toward the
Tyrrhenian basin where it remains at a depth of 25 km for 100 km. Northeastward, the lithosphere grad- ually re-thickens up to 65 km beneath the Tyrrhenian coast of Italy. From here the LAB sinks more gently and reaches a depth of 100 km beneath the Apen- ninic Chain.
6. Discussion and conclusions
Regional gravity modelling along two profiles was conducted to contribute to the reconstruction of the lithosphere-asthenosphere system in Central Mediterranean. Results provided by several authors, based on geophysical (above all seismic) evidences, were taken into account as constraints in the gravity models. They concern the Moho depth, the varia- tions in lithospheric thickness, the density values of continental and oceanic crust, and the location of boundaries between continental and oceanic crust.
In addition to the above constraints, the petro- physical models described in Section 3 and in Cella and Rapolla (1997) allowed to estimate:
(1) The depth of the top of the upwelling astheno- sphere and the vertical density distribution within it. These parameters were inferred by adopting the model suggested by McKenzie and Bickle (1988) and White and McKenzie (1988) and that of Niu and Batiza (1991a,b,c). The first one allowed estimation of the vertical change of temperature and melt frac- tion and of the composition of the residual unmelted mantle rocks, depending on the potential temper- ature, the stretching factor and the pre-stretching lithospheric thickness. The model of Batiza and Niu allowed the vertical density distribution of the resid- ual unmelted mantle rocks to be inferred, depending on their modal composition and on temperature and pressure;
(2) The density of the ‘undisturbed’ lithosphere was carefully calculated by adopting quantitative models taking into account: (a) the density depen-
134 E Cella et al. /Tectonophysics 287 (1998) II 7-138
dence of the upper mantle rocks on their modal com- position and on temperature and pressure; (b) the changes in modal composition of the mantle rocks due to phase transitions (garnet-spinel-plagioclase peridotite) inferred by petrologists.
The results obtained (Figs. 9 and 10) clearly in- dicate a significant difference in amplitude among the long-wavelength gravity anomalies generated by the asthenospheric domes beneath the Ligurian- Provencal and Tyrrhenian basins, depending on the chosen thermal regime.
process beneath the Ligurian-Provencal and Tyrrhe- nian basins. On the contrary, the absence in the inves- tigated region of an anomalous deep thermal regime in the lower mantle would be inferred. Therefore, the hypothesis of a passive thinning process, driven by an external regime of tensile stresses, seems to be favoured. This is in agreement with recent results from tectonic and petrological studies (La Vecchia and Stoppa, 1996).
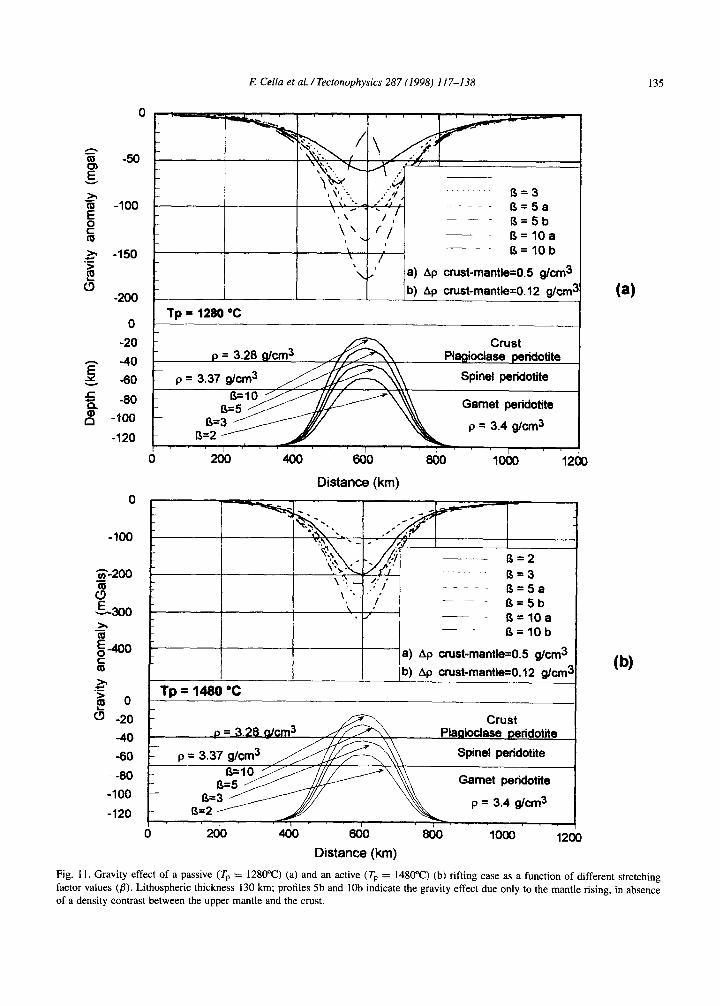
It is very important to observe that the anomaly generated by calculating the density distribution with Tp = 1280°C (Fig. 9) fits fairly well the observed anomaly, whereas the amplitude of the anomaly pro- duced by adopting a higher potential temperature (Tp = 1480°C) is much smaller. The amplitude dif- ference for the same anomaly calculated with mantle density distributions obtained from different Tp val- ues (1280°C and 148O”C), is about 120 mGa1 along the Tyrrhenian basin (see profiles 1 and 2) and reaches about 100 mGa1 along the eastern part of the Ligurian-Proveqal basin (profile 1). Intermediate results were obtained assuming a density distribution with Tp = 1380°C. These results are confirmed by simulations (Fig. 11) in which the differences in the vertical density distribution, depending on the poten- tial temperature, stretching factor and pre-extension lithospheric thickness, are shown to have a strong influence (even more than 100 mGa1) on the gravity anomaly field (Cella and Rapolla, 1997).
Although the information concerning the litho- spheric thickness in the Central Mediterranean re- gion is small (Suhadolc and Panza, 1989), it is nevertheless considered an approximate datum point to evaluate which is the more suitable gravity model. The hypothesis of an asthenospheric up- welling driven by external forces rather than by a thermal anomaly in the lower mantle, is also sup- ported by a resemblance between the LAB morphol- ogy, as proposed by Suhadolc and Panza (1989), and that inferred by assuming a low Tp value (1280°C) in our method.
These amplitude differences are so large that a better agreement between observed and calculated anomalies, based on a high Tp value (148O”C), could be obtained only by assigning depth values to the Moho in wide disagreement with many lines of geo- physical evidence, or by assuming unrealistic density contrasts between continental and oceanic crust, or between the continental crust and the upper litho- spheric mantle. This confirms that the significance of the strong differences in the observed gravity ef- fects due to different mechanisms of asthenospheric upwelling is real and not caused by possible small misfits in the density contrast assignments.
Moreover, these conclusions are in good agree- ment with the results obtained by Keen (1985), whose model, based on rheological and thermo- dynamic features of the advective asthenospheric upwelling, gives a clue to distinguish rifts related to active and passive upwelling mantle also on the basis of the LAB morphology. It predicts that a mantle plume related to a strong thermal anomaly, typical of active mechanisms, will show a much larger lat- eral extension (more than about 1000 km) than that related to passive rifting. In the present case the mantle rise extends over an area of about 500 km in the Tyrrhenian basin, and even less in the Ligurian- Provencal basin.
The results of this study suggest a possible con- tribution to delineate some features of the rifting processes starting from gravity models obtained by estimating density distributions in the uprising man- tle through a careful evaluation of thermal and petro- logical aspects of the mantle upwelling mechanisms.
Acknowledgements
Our interpretation results do not seem to agree We are grateful to Prof. A. Cundari for his critical with the hypothesis of an active mechanism of up- review of the paper and for productive discussions. rising asthenosphere (Van Bemmelen, 1977; Locardi Our thanks are also due to Dr. I. Buonanno for and Nicolich, 1988) causing a lithospheric thinning her help with graphic processing of the data, and
I? Cella et al. / Tectonophysics 287 (I 998) I1 7-138 135
0
-” F?iJ -50
.5. 3 2 -100
e to a+ .= -150
5 b
-200
0
-20
5 8
-80
0 -100
-120
0
-100
___ t3=lOa
Tp = 1280 “C
a) Ap crust-mantle=0.5 g/cm3
b) Ap crust-mantle=O. 12 g/cm
Garnet peridotite
400 600 800 1000 Ii
Distance (km)
--__. l3=5a - - t3=5b - l3=10a - - _ fL=lOb
a) Ap crust-mantk0.5 @cm3
b) Ap crust-mantle=0.12 g/cm:
6 -20 Crust
-40
-60
-80
-100
-120
0 200 400 600 800 1000 12 Distance (km)
(a)
(4
Fig. 11. Gravity effect of a passive (TP = 1280°C) (a) and an active (TP = 1480°C) (b) rifting case as a function of different stretching
factor values (fi). Lithospheric thickness 130 km: profiles 5b and lob indicate the gravity effect due only to the mantle rising, in absence
of a density contrast between the upper mantle and the crust.
136 F: Cella et al. / Tectonophyics 287 (1998) I 17-138
to the reviewers for their significant suggestions. This research was financially supported by MURST (Ministry of the University and of the Scientific and Technological Research, 40%, 10.3.702-1995) and by CNR (National Research Committee - CROP Project: 1994-1996) grants to one of us (A.R.).
References
Agee, G.B., Walker, D., 1988. Static compression and olivine
flotation in ultrasonic silicate liquid. J. Geophys. Res. 93 (4).
3437-3449.
Anderson, H., Jackson, J., 1987. The deep seismicity of the
Tyrrhenian Sea. Geophys. J. R. Astron. Sot. 91, 613-637.
Barbieri, M., Gasparotto, G., Lucchini, F., Savelli, C., Vigliotti,
L., 1986. Contributo allo studio de1 magmatismo nel Mar
Tirreno: L’intrusione granitica tardo-miocenica de1 monte sub-
marino Vercelli. Mem. Sot. Geol. It. 36, 41-54.
Beccaluva, L., Gabbianelli, G., Lucchini, F., Rossi, F!L., Savelli,
C., 1985. Petrology and IVAr ages of volcanics dredged from
Eolian seamounts: implications for geodynamic evolution of
the Southern Tyrrhenian basin. Earth Planet. Sci. Lett. 74,
187-208.
Bemini, M., Boccaletti, M., Moratti, G., Papani, G., Sani,’ F.,
Torelli, L., 1990. Episodi compressivi neogenico-quatemari
nell’area estensionale tirrenica Nord-Orientale. Dati in mare e
a terra. Mem. Sot. Geol. Ital. 45, 577-589.
Biju-Duval, B., Dercourt, J., Le Pichon, X., 1977. From the
Tethys Ocean to the Mediterranean Seas: a plate tectonic
model of the western Alpine system. In: Bij-Duval, B., Mon-
tadert, L. (Eds.), Structural History of the Mediterranean
Basins. Technip, Paris, pp. 143-I 64.
Burollet, P., Faleev, V., Fabricius, F., Gennesseaux, M., Hall,
J.K., Kuprin, P., Makris, J., Morelli, C., Val’Chuk, S., Win-
nok, E., 1989. The Bouguer Gravity Anomaly Map of the
Mediterranean Region, (I : 1 ,OOO.OOO). The Intergovernmental
Oceanographic Commission (IOC-UNESCO). Overprint of:
International Bathymetric Chart of the Mediterranaen (IBCM).
Burrus, J., 1984. Contribution to a geodynamic synthesis of the
ProvenGal basin (North-Western Mediterranean). Mar. Geol.
55,247-279.
Calcagnile, G., Panza, G.F., 198 I. The main characteristics of the
Lithosphere Asthenosphere System in Italy and surrounding
regions. Pageoph 119, 865-879:
Caputo, M.. Panza, G.F., Postpischel, D., 1970. Deep structure in
the Mediterranean basins. J.. Geophys. Res. 75, 4919-4923.
Cella, E, Rapolla, A., 1997. Density changes in upwelling man-
tle. Phys. Earth Planet. Inter. (in press).
Cella, F., Dorre, AS., Rapolla, A., 1995. Moho and lithosphere-
asthenosphere boundary in East Africa from regional gravity
data. Boll. Geofis. Teor. Appl. 37 (148), 277-301.
Corrado, G., Rapolla, A., 1981. The gravity field of Italy: anal-
ysis of its spectral composition and delineation of a tridimen-
sional crustal model for central-southern Italy. Boll. Geofis.
Teor. Appl. 23, 17-29.
Corrado, G., Iacobucci, F., Pinna, E., Rapolla, A., 1974. Anoma-
lie gravimetriche e magnetiche e strutture crostali nell’Italia
Centro-Meridionale. Boll. Geofis. Tear. Appt. 16 (64), 271-
291.
Courtney, R.C., White, R.S., 1986. Anomalous heat flow and
geoid across the Cape Verde rise: evidence of dynamic support
from a thermal plume in the mantle. Geophys. J.R. Astron.
Sot. 87, 815-868.
Cundari A., 1994. Role of subduction in the genesis of potassic
basaltic rocks: A discussion paper on the unfashionable side
of the role. Miner. Petrogr. Acta XXXVII, 8 I-90.
Cundari, A., Ferguson, A.K., 1991. Petrogenetic relationship
between melilite and lamproite in the Roman Comagmatic Re-
gion: the lavas of S. Venanzo and Cupaello. Contrib. Mineral.
Petrol. 107, 343-357.
Della Vedova, B., Pellis, G., Foucher, J.P., Rehault, J.-I?, 1984.
Geothermal structure of the Tyrrhenian Sea. Mar. Geol. 55,
271-289.
De Voogt, B., Nicolich, R., Olivet, J.L., Fanucci, E, Burrus, J.,
Mauffret, A., Pascal, q., Argnani, A., Auzende, J.M., Bern-
’ abini, M., Bois, C., Carmignani, L., Fabbri, A., Finetti, I.,
Galdeano, A., Gorini, C.Y., Labaume, F!, Layat, D., Patriat, I?,
Pinet, J., Ravat, F., Ricci Lucchi, F., Vemassa, S., 1991. First
deep seismic reflection transect from the Gulf of Lions to Sar-
dinia (ECORS-ECROP profiles in Western Mediterranean).
In: Continental Lithosphere: Deep Seismic Reflection. Am.
Geophys. Union, Geodyn. Ser. 22, 265-274.
Doglioni, C., 1991. A proposal of kinematic modelling for
W-dipping subductions - possible applications to the
Tyrrhenian-Apennines system. Terra Nova 3, 423-434.
Durand-Delga, M., Fonbot?, J.M., 1980. Le cadre structural de
la MkditerranCe Occidentale. In: Colloque C5, Geology in the
Alpine Chains of the Tethys. MCm. BRGM I 15.
Duschenes, J., Louden, K.E., Sinha, M.C., 1986. A seismic
refraction experiment in the Tyrrhenian Sea. Geophys. J.R.
Astron. Sot. 85, 139-160.
Fallon, T.J., .Green, D.H., 1987. Anhydrous partial melting of
MORB pyrolite and other peridotite compositions at IO kbar:
implications for the origin of MORB glasses. Mineral. Petrol.
37, 181-219.
Fedi, M., 1989. Spectral expansion inversion of gravity data for
2.5 D structures. Boll. Geofis. Teor. Appl. 3 1 (12 I), 25-39.
Fedi, M., Rapolla, A., 1995. Vertical gravity and magnetic sound-
ings: forward problem formulation and data inversion. Boll.
Geofis. Teor. Appl. 37 (147), 191-205.
Finetti, I., Del Ben, A., 1986. Geophysical study, of the Tyrrhe-
nian opening. Bollettino di Geofisica Teorica e Applicata 28
(1 IO), 75-155.
Galdeano, A., Rossignol, J.C., 1977. Assemblage 2 altitude
constante des cartes d’anomalies magnttiques couvrante
l’ensemble du bassin occidental de la MBediterrante. Bull.
Sot. Geol. Fr. 19, 3.
Ginzburg, A., Makris, J., Nicolich, R., 1986. European Geotra-
verse: a seismic refraction profile across the Ligurian Sea.
Tectonophysics 126, 85-97.
Green, D.H., 1991. The Earth’s lithosphere and asthenosphere
E Cella et al. / Tectonophysics 287 (I 998) I 17-138 137
- concepts and constraints derived from petrology and, high
pressure experiments. Geol. Sot. Aust. Spec. Publ. 17, l-22.
Him, A., Steinmetz, L., Sapin, M., 1977. Along range seismic
protile in the Western Mediterranean basin: structure of the
Upper Mantle. Ann. Geophys. 33 (3). 373-384.
Hutchinson, I., Von Herzen, R.P., Louden, K.E., Sclater, J.G.,
Jemsek, J., 1985. Heat flow in the Balearic and Tyrrhenian
basins, Western Mediterranean. J. Geophys. Res. 90, 685-702.
Kastens, K., Mascle, J., Auroux, C., Bonatti, E., Broglia, C.,
Channell, J., Curzi, P., Emeis, K.C., Glacon, Cl., Asegawa,
S., Hieke, W., Mascle, G., McCoy, F., McKenzie, J., Mendel-
son, J., Muller, C., RChault, J.P., Robertson, A., Sartori, R.,
Sprovieri, R., Torii, M., 1988. ODP Leg 107 in the Tyrrhenian
Sea: Insights into passive margin and back-arc basin evolution.
Geol. Sot. Am. Bull. 100, 1140-l 156.
Keen, C.E., 1985. The Dynamics of rifting deformation of the
lithosphere by active and passive driving forces. Geophys. J.R.
Astron. Sot. 80, 95- 120.
Knopoff, L., Panza, G.F., 1978. Resolution of upper mantle struc-
ture using higher modes of Rayleigh waves. Ann. Geophys.
30,491-505.
Lange, R.A., Carmichael, I.S.E., 1987. Densities of NazO, KlO.
CaO, MgO, FeO, FezOx. Al20s, TiO?, SiOz liquids: new
measurements and derived partial molar properties. Geochim.
Cosmochim. Acta 51 (I I), 2931-2946.
La Vecchia, G., 1988. The Tyrrhenian-Apennines system: struc-
tural setting and seismotectogenesis. Tectonophysics 147,
263-296.
La Vecchia, G., Stoppa. F., 1996. The tectonic significance of
Italian magmatism: an alternative view to the popular interpre-
tation. Terra Nova 8, 435-446.
Le Douran, S., Burrus, J., Avedik, F., 1984. Deep structure of
the North-Western Mediterranean basin: results of two-ship
seismic survey. Mar. Geol. 55, 325-345.
Locardi, E., Nicolich, R., 1988. Geodinamica del Tirreno
e dell’ilppennino Centro-Meridionale: la nuova carta della
Moho. Mem. Sot. Geol. Ital. 41, 121-140.
Malinvemo, A., Ryan, W.B.F., 1986. Extension in Tyrrhenian Sea
and shortening in the Apennines as a result of arc migration
driven by sinking of the lithosphere. Tectonics 5 (2). 227-245.
Mantovani, E., Albarello, D., Babbucci, D., Tamburelli, C.. 1992.
Recent geodynamic evolution of the Central Mediterranean
Region. Tipografa Senese, Siena, Italy
Marson. I., Panza, G.F., Suhadolc, P., 1995. Crust and upper
mantle models along the active Tyrrhenian rim. Terra Nova 7,
348-357.
McKenzie, D., 1984. The generation and compaction of partially
molten rock. J. Petrol. 25, 713-765.
McKenzie, D., Bickle, M.J., 1988. The volume and composition
of melt generated by extension of the lithosphere. J. Petrol. 29
(3) 625-679.
Morelli, C., 1970. Physiography, gravity and magnetism of the
Tyrrhenian Sea. Boll. Geotis. Teor. Appl. I2 (48), 275-31 I.
Morelli, C., Pisani, M., Gantar. C., 1975a. Geophysical anoma-
lies and tectonics in the Western Mediterranean. Boll. Geofs.
Teor. Appl. 17, 65.
Morelli, C., Pisani. M., Gantar, C.. 1975b. Geophysical anoma-
lies and tectonics in the Strait of Sicily and of the Ionian Sea.
Boll. Geofis. Teor. Appl. I7 (67), 21 l-249.
Moussat, E., Rehault, J.P., Fabbri, A., Mascle, G., 1985. Evolu-
tion geologique de la Mer Tyrrhenienne. C. R. Acad. Sci. 7
(301), 491-496.
Nicolich, R., 1989. Crustal structures from seismic studies in
the frame of the European Geotraverse (southern segment)
and CROP projects. Proceedings of ‘The Lithosphere in Italy’.
Accad. Naz. Lincei 80.41-61.
Niu. Y., Batiza, R., 199la. DENSCAL: a program for calculating
densities of silicate melts and mantle minerals as a function
of pressure, temperature, and composition in melting range.
Comput. Geosci. I7 (5), 679-687.
Niu, Y., Batiza, R., 199lb. In-situ densities of silicate melts and
mantle minerals as a function of temperature, pressure and
compositions. J. Geol. 99, 767-775.
Niu, Y., Batiza, R., 1991~. An empirical method for calculating
melt compositions produced beneath mid-ocean ridges: appli-
cations for axis and off axis (seamounts) melting. J. Geophys.
Res. 96 (Bl3). 21753-21777.
Nur, A., Ron, H., Scotti, O., 1986. Fault mechanisms and the
kinematics of block rotations. Geology 14, 746-749.
Oxburgh, E.R., 1980. Heat flow and magma genesis. In: Har-
graves, R.B. (Ed.), Physics of Magmatic Processes. Princeton
University Press, Princeton, N.J., pp. 161-199.
Panza, G.F., Mueller, S., Calcagnile, G., 1980. The gross fea-
tures of the lithosphere-asthenosphere system in Europe from
seismic surface waves and body waves. Pageoph I 18, l209-
1213.
Pascal, G.P., Mauffret, A., Patriat, P., 1993. The ocean-continent
boundary in the Gulf of Lions from analysis of expanding
spread profiles and gravity modelling. Geophys. 3. Int. I 13,
701-726.
Pasquale, V.. Verdoya, M., Chiozzi, I?. 1995. Rifting and thermal
evolution of the Northwestern Mediterranean. Ann. Geotis. 38,
43-53.
Patacca. E.. Sartori, R.. Scandone, P., 1990. Tyrrhenian basin
and Appenninic Arcs: kinematic relations since Late Tortonian
times. Mem. Sot. Geol. Ital. 45, 453-462.
Peirce, C., Barton, P.J., 1992. Southern segment of the European
Geotraverse - a wide-angle seismic refraction experiment in
the Sardinia Channel. Mar. Geophys. Res. 14, 227-248.
Pinna. E., Rapolla, A., 1979. Strutture crostali nell’Italia Merid-
ionale da dati gravimetrici. Pubbl., 235, Progetto Finalizzato
Geodinamica, CNR.
Rasmussen, R., Pedersen, L.B., 1979. End corrections in poten-
tial tield modelling. Geophys. Prospect. 27, 74-760.
Recq, M., Rehault, J.P., Steinmetz, L., Fabbri, A., 1984. Am-
incissement de la crofite et accretion au centre du Bassin
Tyrrhtnien d’apres la refraction sismique. Mar. Geol. 55, 41 l-
428.
Rehault, J.P.. Bethoux, N., 1984. Earthquake relocation in the
Ligurian Sea (Western Mediterranean): geological interpreta-
tion Mar. Geol. 55, 429-445.
Royden, L., Patacca, E., Scandone, I?, 1987. Segmentation and
contiguration of subducted lithosphere in Italy: an important
138 E Cella et al. / Tectonophysics 287 (1998) I 17-138
control on thrust-belt and foredip basin evolution. Geology 15, 114-117.
Scarascia, S., Lozej, A., Cassinis, R., 1994. Crustal structures of the Ligurian, Tyrrhenian and Ionian Seas and adjacent onshore areas interpreted from wide-angle seismic profiles. Boll. Geofis. Teor. Appl. 36 (141-144) 5-19.
Spakman, W., Van der Lee, S., Van der Hilst, R., 1993. Travel-time tomography of the European-Mediterranean man- tle down to 1400 km. Phys. Earth Planet. Inter. 79, 3-74.
Steinmetz, L., Ferrucci, F., Him, A., Morelli, C., Nicolich, R., 1983. A 550 km long Moho traverse in the Tyrrhenian Dea from O.B.S. recorded Pn waves. Geophys. Res. Lett. 10,428- 431.
Suhadolc, I?, Panza, GE, 1989. Physical properties of the
lithosphere-asthenosphere system in Europe from geophysi- cal data. Proceedings of ‘The lithosphere in Italy’. Accad. Naz. Lincei 80, 15-40.
Thisseau, C., Rehault, J.P., Foucher, J.P., 1986. Modeles ther- miques et hypotheses sur la nature de la croflte au centre de la Mer Tyrrhenienne. Mem. Sot. Geol. Ital. 36, 109-122.
Van Bemmelen, R.W., 1977. Plate tectonics and the undation model: a comparison. Tectonophysics 32, 145-182.
Wang, C.Y., Awang, W.T., Yaolin, S., 1989. Thermal evolution of a rift basin: the Tyrrhenian Sea. J. Geophys. Res. 94 (B4), 399 l-4006.
White, R., McKenzie, D., 1988. Magmatism at rift zones: the generation of volcanic continental margins and flood basalts. J. Geophys. Res. 94 (B6), 7685-7729.