Granger causality relationships between local field potentials in an animal model of temporal lobe...
9
Please cite this article in press as: Cadotte AJ, et al. Granger causality relationships between local field potentials in an animal model of temporal lobe epilepsy. J Neurosci Methods (2010), doi:10.1016/j.jneumeth.2010.03.007 ARTICLE IN PRESS G Model NSM-5569; No. of Pages 9 Journal of Neuroscience Methods xxx (2010) xxx–xxx Contents lists available at ScienceDirect Journal of Neuroscience Methods journal homepage: www.elsevier.com/locate/jneumeth Granger causality relationships between local field potentials in an animal model of temporal lobe epilepsy Alex J. Cadotte a,b,c,d,∗ , Thomas B. DeMarse b,∗ , Thomas H. Mareci b,c,d,f , Mansi B. Parekh g , Sachin S. Talathi b,c,d , Dong-Uk Hwang b,c,d , William L. Ditto e , Mingzhou Ding b , Paul R. Carney a,b,c,d,g a Department of Pediatrics, Division of Neurology, University of Florida, United States b J. Crayton Pruitt Family Department of Biomedical Engineering, University of Florida, United States c Wilder Center of Excellence for Epilepsy Research, University of Florida, United States d McKnight Brain Institute, University of Florida, United States e School of Biological and Health Systems Engineering, Arizona State University, United States f Department of Biochemistry and Molecular Biology, University of Florida, United States g Department of Neuroscience, University of Florida, United States article info Article history: Received 20 May 2009 Received in revised form 8 March 2010 Accepted 11 March 2010 Keywords: Granger causality Temporal lobe epilepsy Seizure Animal model of epilepsy Functional connectivity Effective connectivity Magnetic Resonance Imaging (MRI) Histology Microelectrode array abstract An understanding of the in vivo spatial emergence of abnormal brain activity during spontaneous seizure onset is critical to future early seizure detection and closed-loop seizure prevention therapies. In this study, we use Granger causality (GC) to determine the strength and direction of relationships between local field potentials (LFPs) recorded from bilateral microelectrode arrays in an intermittent sponta- neous seizure model of chronic temporal lobe epilepsy before, during, and after Racine grade partial onset generalized seizures. Our results indicate distinct patterns of directional GC relationships within the hippocampus, specifically from the CA1 subfield to the dentate gyrus, prior to and during seizure onset. Our results suggest sequential and hierarchical temporal relationships between the CA1 and den- tate gyrus within and across hippocampal hemispheres during seizure. Additionally, our analysis suggests a reversal in the direction of GC relationships during seizure, from an abnormal pattern to more anatom- ically expected pattern. This reversal correlates well with the observed behavioral transition from tonic to clonic seizure in time-locked video. These findings highlight the utility of GC to reveal dynamic direc- tional temporal relationships between multichannel LFP recordings from multiple brain regions during unprovoked spontaneous seizures. © 2010 Elsevier B.V. All rights reserved. 1. Introduction A better understanding of the spatial–temporal dynamics of brain electrical activity during ictogenesis is an important step toward the development of seizure prevention strategies (Mormann et al., 2007). There are two prevailing theories by which seizures are thought to spatially initiate and propagate; the first being from a discrete seizure focus and the second being from a diffuse hyper-excitable network (Bertram et al., 1998). Further- more, there are theories on how seizures terminate ranging from increased GABAergic inhibition to “anticonvulsant effects” of spe- cific subcortical brain regions (Lado and Moshe, 2008). However, ∗ Corresponding authors at: PO Box 116131, University of Florida, Gainesville, FL 32611-6131, United States. Tel.: +1 352 327 8668. E-mail addresses: [email protected]fl.edu (A.J. Cadotte), [email protected]fl.edu (T.B. DeMarse). the mechanisms and subsequent dynamics underlying sponta- neous seizures remain largely unknown (Bertram, 2009). A better understanding of the dynamics of how seizures spatially initiate, propagate, and terminate may provide an important step towards the development of successful seizure intervention therapies. Much of what is known about the circuitry of the hippocam- pus during ictogenesis is based on in vitro experiments (Ang et al., 2006; Avoli et al., 2002; Barbarosie and Avoli, 1997). However, it is difficult to apply in vitro electrophysiological recording methods to a freely behaving in vivo animal model. Therefore, new methods, models, and tools are necessary to examine spontaneous seizures in vivo. To better examine the spatiotemporal dynamics of spontaneous temporal lobe seizure onset and spread, we use an animal model of chronic temporal lobe epilepsy (TLE) in parallel with continuous multichannel electrophysiological recording. This was accom- plished using 32-channel microwire arrays chronically implanted bilaterally into the hippocampus dentate gyrus (DG) and CA1 sub- 0165-0270/$ – see front matter © 2010 Elsevier B.V. All rights reserved. doi:10.1016/j.jneumeth.2010.03.007
-
Upload
independent -
Category
Documents
-
view
2 -
download
0
Transcript of Granger causality relationships between local field potentials in an animal model of temporal lobe...
G
N
Go
ASPa
b
c
d
e
f
g
a
ARRA
KGTSAFEMHM
1
os(sbdmic
3
(
0d
ARTICLE IN PRESSModel
SM-5569; No. of Pages 9
Journal of Neuroscience Methods xxx (2010) xxx–xxx
Contents lists available at ScienceDirect
Journal of Neuroscience Methods
journa l homepage: www.e lsev ier .com/ locate / jneumeth
ranger causality relationships between local field potentials in an animal modelf temporal lobe epilepsy
lex J. Cadottea,b,c,d,∗, Thomas B. DeMarseb,∗, Thomas H. Marecib,c,d,f, Mansi B. Parekhg,achin S. Talathib,c,d, Dong-Uk Hwangb,c,d, William L. Dittoe, Mingzhou Dingb,aul R. Carneya,b,c,d,g
Department of Pediatrics, Division of Neurology, University of Florida, United StatesJ. Crayton Pruitt Family Department of Biomedical Engineering, University of Florida, United StatesWilder Center of Excellence for Epilepsy Research, University of Florida, United StatesMcKnight Brain Institute, University of Florida, United StatesSchool of Biological and Health Systems Engineering, Arizona State University, United StatesDepartment of Biochemistry and Molecular Biology, University of Florida, United StatesDepartment of Neuroscience, University of Florida, United States
r t i c l e i n f o
rticle history:eceived 20 May 2009eceived in revised form 8 March 2010ccepted 11 March 2010
eywords:ranger causalityemporal lobe epilepsy
a b s t r a c t
An understanding of the in vivo spatial emergence of abnormal brain activity during spontaneous seizureonset is critical to future early seizure detection and closed-loop seizure prevention therapies. In thisstudy, we use Granger causality (GC) to determine the strength and direction of relationships betweenlocal field potentials (LFPs) recorded from bilateral microelectrode arrays in an intermittent sponta-neous seizure model of chronic temporal lobe epilepsy before, during, and after Racine grade partialonset generalized seizures. Our results indicate distinct patterns of directional GC relationships withinthe hippocampus, specifically from the CA1 subfield to the dentate gyrus, prior to and during seizure
eizurenimal model of epilepsyunctional connectivityffective connectivityagnetic Resonance Imaging (MRI)istology
onset. Our results suggest sequential and hierarchical temporal relationships between the CA1 and den-tate gyrus within and across hippocampal hemispheres during seizure. Additionally, our analysis suggestsa reversal in the direction of GC relationships during seizure, from an abnormal pattern to more anatom-ically expected pattern. This reversal correlates well with the observed behavioral transition from tonicto clonic seizure in time-locked video. These findings highlight the utility of GC to reveal dynamic direc-tional temporal relationships between multichannel LFP recordings from multiple brain regions during
seizu
icroelectrode array unprovoked spontaneous. Introduction
A better understanding of the spatial–temporal dynamicsf brain electrical activity during ictogenesis is an importanttep toward the development of seizure prevention strategiesMormann et al., 2007). There are two prevailing theories by whicheizures are thought to spatially initiate and propagate; the firsteing from a discrete seizure focus and the second being from a
Please cite this article in press as: Cadotte AJ, et al. Granger causality relatiolobe epilepsy. J Neurosci Methods (2010), doi:10.1016/j.jneumeth.2010.03
iffuse hyper-excitable network (Bertram et al., 1998). Further-ore, there are theories on how seizures terminate ranging from
ncreased GABAergic inhibition to “anticonvulsant effects” of spe-ific subcortical brain regions (Lado and Moshe, 2008). However,
∗ Corresponding authors at: PO Box 116131, University of Florida, Gainesville, FL2611-6131, United States. Tel.: +1 352 327 8668.
E-mail addresses: [email protected] (A.J. Cadotte), [email protected]. DeMarse).
165-0270/$ – see front matter © 2010 Elsevier B.V. All rights reserved.oi:10.1016/j.jneumeth.2010.03.007
res.© 2010 Elsevier B.V. All rights reserved.
the mechanisms and subsequent dynamics underlying sponta-neous seizures remain largely unknown (Bertram, 2009). A betterunderstanding of the dynamics of how seizures spatially initiate,propagate, and terminate may provide an important step towardsthe development of successful seizure intervention therapies.
Much of what is known about the circuitry of the hippocam-pus during ictogenesis is based on in vitro experiments (Ang et al.,2006; Avoli et al., 2002; Barbarosie and Avoli, 1997). However, itis difficult to apply in vitro electrophysiological recording methodsto a freely behaving in vivo animal model. Therefore, new methods,models, and tools are necessary to examine spontaneous seizuresin vivo.
To better examine the spatiotemporal dynamics of spontaneous
nships between local field potentials in an animal model of temporal.007
temporal lobe seizure onset and spread, we use an animal model ofchronic temporal lobe epilepsy (TLE) in parallel with continuousmultichannel electrophysiological recording. This was accom-plished using 32-channel microwire arrays chronically implantedbilaterally into the hippocampus dentate gyrus (DG) and CA1 sub-
ING
N
2 roscie
fiawscsTb(attchd(mB1topmd
btGTnsbattfitbWLns
2
2
2
ribLvei(ts1hob1r
ARTICLEModel
SM-5569; No. of Pages 9
A.J. Cadotte et al. / Journal of Neu
elds. We then use Granger causality (GC) to reveal the magnitudend direction of temporal relationships during 1 s overlappingindows during each seizure. Granger proposed that, “for two
imultaneously measured time series, one series can be calledausal to the other one if we can better predict the second timeeries by incorporating past knowledge of the first” (Granger, 1969).he mathematical and statistical framework that underlies GC cane traced back to Wiener (1956) and also has roots in autoregressiveAR) modeling (Chatfield, 1996). Granger has discussed in recentnd prior communication (Granger, 2001, 1980; Seth, 2007) howhe concept of causality is a controversial philosophical questionhat is continually debated. Indeed, GC is not a measure of trueausality “it is only Granger’s causality” (Seth, 2007). However, GCas proven a practical, well-defined statistical tool for quantifyingirectional temporal relationships between financial time seriesGranger, 1969), that has found broad use in the neuroscience com-
unity (Bollimunta et al., 2008; Ding et al., 2007; Franaszczuk andergey, 1998; Franaszczuk et al., 1998, 1994; Osorio et al., 2008,998; Schiff et al., 2005; Sitnikova et al., 2008) to reveal direc-ional relationships between specific brain regions in the contextf the underlying anatomy as well as behavior. We will use thisractical formulation to reveal directional relationships betweenultichannel local field potentials (LFP) recorded from the brain
uring seizure.This study seeks to measure the directional GC relationships
etween LFP recorded from the bilateral CA1 and DG subfields ofhe hippocampus. We test the hypothesis that specific directionalC relationships between hippocampal subfields occur duringLE seizure onset (as opposed to global non-directional synchro-ization) and are detectable using GC. This is based on previousuccess in elucidating directional relationships in the epilepticrain (Cadotte et al., 2009; Franaszczuk et al., 1994; Sitnikova etl., 2008). We will demonstrate how GC can be used to quantifyhe magnitude and the direction of these relationships over theime course of the seizure epoch. To our knowledge, this is therst in vivo demonstration of the dynamic relationships betweenime series recorded from multiple bilateral hippocampal subfieldsefore, during, and after seizure onset in an animal model of TLE.e postulate that a better understanding of the dynamics of how
FP propagate in vivo during spontaneous seizure onset and termi-ation may provide an important step towards the development ofuccessful seizure intervention therapies.
. Materials and methods
.1. Animal model of TLE and data acquisition
.1.1. Animal modelSeveral animal models of epilepsy have been developed in
ecent years in order to study chronic TLE. Progress in develop-ng a functional connectivity theory to explain human epilepsy haseen impeded by the difficulties of obtaining sufficient samples ofFP recordings of patients and the many uncontrollable interveningariables that occur in the clinical setting. A valid animal model thatxhibits the essential dynamical features of the human conditions clearly necessary. The self-sustaining electrical status epilepticusSSESE) rat model (Lothman et al., 1990) was developed to studyhe pathophysiological and molecular effects of a defined injury (i.e.tatus epilepticus) on the susceptibility to develop TLE (Bertram,997). This animal model has many of the features associated with
Please cite this article in press as: Cadotte AJ, et al. Granger causality relatiolobe epilepsy. J Neurosci Methods (2010), doi:10.1016/j.jneumeth.2010.03
uman TLE including similar electrophysiological correlates, etiol-gy, pathological changes in the limbic system, and seizure inducedehavioral manifestations (Bertram and Cornett, 1994; Quigg et al.,997, 1998; Sanchez et al., 2006). The seizures in this model areecurrent, spontaneous, and chronic in nature. This model is char-
PRESSnce Methods xxx (2010) xxx–xxx
acterized by a progressive strengthening of recurrent spontaneoustemporal lobe seizures beginning 4–6 weeks after induced statusepilepticus.
2.1.2. Electrode implantation surgeryFifty-day-old male Sprague–Dawley rats weighing 210–265 g
were used using protocols and procedures approved by the Univer-sity of Florida Institutional Animal Care and Use Committee (IACUCprotocol D710). The methods used to create this animal model weresimilar to those reported by our laboratory elsewhere (Cadotte etal., 2009; Sanchez et al., 2006; Talathi et al., 2009, 2008). Xylazine(10 mg/kg, SQ) and isoflurane (1–3%) in oxygen was used for anes-thesia. Inhalation anesthesia was continued via a nose mask duringsurgery where the animals were secured in a Kopf stereotacticframe. The top of the rat’s head is shaved and chemically steril-ized with iodine and alcohol. The bregma and lambdoidal sutureis exposed by a midsagittal incision that begins between the eyesand extends caudally to the ears. Extraneous soft tissue is removedfrom the skull using a peroxide wash. Four stainless steel screws(0.8 mm, Small Parts, Miami Lakes, FL) are placed in the skull toanchor an acrylic headset. Two screws were anterior to bregma by2 mm and bilaterally 2 mm and one of which served as a referenceelectrode. The remaining two screws were posterior by 2 mm tolambda and bilateral 2 mm and one of which served as a groundelectrode. A roughly 3 mm by 1.5 mm craniotomy is created usinga rotary tool and the dura was removed for microelectrode arrayplacement such that the long axis extended from 1.7 mm lateral(left and right) to 3.5 mm lateral from bregma. Two independent16-channel microelectrode arrays (2 by 8 electrode arrays of 50 �mpolyimide insulated tungsten microwire, 5 mm long, with 250 �min row spacing with 500 �m separation between the two rows,Tucker Davis Technologies, Alachua, FL) were positioned to recordLFP from the bilateral CA1 and DG subfields. The center of each2 × 8 array was placed 4.4 mm back from bregma, 3.2 mm right orleft from the midline, and at a depth of 3.1 mm using a stereotaxicinstrument based on coordinates from a rat brain atlas (Paxinos,1997). An independent custom fabricated bipolar twist electrode(Teflon-sheathed stainless steel 330 �m diameter wire) is placedin the right posterior ventral hippocampus (−5.3 mm posterior,4.9 mm lateral (right) of bregma, 5 mm ventral) for the sole pur-pose of electrical stimulation into status epilepticus (Lothman et al.,1990). All electrodes are then chronically secured with Cranioplast(Plastics One, Inc., Roanoke, VA) and anchored to the previouslymentioned 4 ground and anchor screws. The animals were allowedto recover for 1-week post-surgery, and then induced into statusepilepticus using the bipolar twist electrode.
2.1.3. Induction of seizuresInduction into status epilepticus to create the animal model of
TLE was achieved by electrical stimulation of the bipolar twist elec-trode (Lothman et al., 1990). Stimulation consisted of waveformtrains composed of biphasic square wave pulses at a frequency of50 Hz with a pulse duration of 1 ms, intensity of 300–400 �A andwas delivered for 50–70 min with a duty cycle of 10 s on and 2 s off.During the stimulus the animal increased exploratory activity anddisplays ‘wet dog shakes’. After approximately 20–30 min of stim-ulation, convulsive seizures of up to 1 min in duration are observedon average about every 10 min. Post-stimulation, intracranial LFPare assessed for evidence of slow wave activity in all recordedelectrodes. In the absence of slow wave activity, the stimulus isre-applied for 10-min intervals (up to 3 times) until continuous
nships between local field potentials in an animal model of temporal.007
slow waves appeared following termination of the stimulus.Rats were observed for behavioral seizure activity and adequate
food and water intake for 12–24 h after stimulation. Post-electricalstimulation, the LFP recordings were characterized by activitybelow 5 Hz for 12–24 h and occasional spontaneous 30–60 s elec-
ING
N
roscie
tlp1idaEdwtmatso
2
aNwipelc6oirdt
r(aaatpscecqiolEb1rs1
c(adtntfa
ARTICLEModel
SM-5569; No. of Pages 9
A.J. Cadotte et al. / Journal of Neu
rographic seizures for 2–4 h. Rats inducted into this model showedoss of cells in the hippocampus formation and the parahippocam-al gyrus, mossy fiber sprouting, atrophy, and gliosis (Bertram,997; Hoang-Minh et al., 2006; Parekh et al., 2006). Following the
nduction of status epilepticus, the rats are moved to a speciallyesigned enclosure that allows full mobility of animals, good visu-lization for video monitoring and a stable recording environment.ach rat enclosure is constructed from a 30.48 cm high and 25.4 cmiameter cast acrylic tube with a plastic mesh floor. Each enclosureas housed in a temperature (21.1 ◦C) and humidity (60%) con-
rolled room on a fixed 12 h light dark cycle. Rats were continuouslyonitored 24 h/day with time-locked video-EEG for behavioral
nd/or electrographic seizures. Following behavioral stabilization,he animals are observed for the next 6 weeks, during which time,pontaneous seizures that are characteristic of this animal modelf TLE develop.
.2. Data acquisition, seizure detection, and seizure selection
The experimental data used for this analysis was initiallycquired as part of a Collaborative Research in Computationaleuroscience National Institutes of Health research project thatas designed to study the dynamical changes in the brain dur-
ng the latency period of epileptogenesis. Epileptogenesis is therocess by which the otherwise healthy brain transitions intopilepsy. To study this process, seven rats were electrophysio-ogically recorded from via 32 channels of bilaterally implantedhronic microwire arrays continuously (24 h, 7 days a week, for–8 weeks) at 12 kHz, resulting in approximately 1–2 terabytesf data per rat. During these recordings the animal was engagedn either sleep or in quiet exploration. LFP and unit activity wereecorded (Tucker Davis Technologies, Alachua, Florida) at 12 kHz,igitized with 16 bits of resolution, and band pass filtered from 0.5o 6 kHz.
Continuous electroencephalography (EEG) from channel 2 (cor-esponding to the microelectrode in the left hippocampal CA1)Talathi et al., 2009) were analyzed for screening seizures usingn in-house automated seizure detection algorithm (Talathi etl., 2008). The EEG was first pre-processed to remove line noisend passed through a median filter to eliminate isolated interic-al spike events. The continuous wavelet transform (CWT) of there-processed signal was obtained using a “Derivative of Gaus-ian” mother wavelet of order 2. The scales for the CWT werehosen such that the EEG signal was decomposed into signals withnergy in frequency band of 1–50 Hz. The wavelet scale functionorresponding to maximum signal energy within 1–50 Hz fre-uency band in a given time epoch was identified. Seizures were
dentified when the wavelet scale function crossed a thresholdf 8.5. The screened seizures were then confirmed through time-ocked video-EEG validation by two independent scorers (PRC, SST).ach identified seizure was given a Racine grade based on theehavioral characteristics of the animal during seizure (Racine,972). Electrographic seizure durations for this animal modelanged between 10 and 60 s. Seizures were also identified andcored using the qualitative criteria described previously (Bertram,997).
The datasets extracted from the seizure detection algorithmonsist of 10 min LFP epochs. Each epoch contained a single seizurei.e. the animal displayed a severe generalized clonic convulsionccompanied by falling down in the time-locked video) in the mid-le of the file. Of the data collected from the original seven animals,
Please cite this article in press as: Cadotte AJ, et al. Granger causality relatiolobe epilepsy. J Neurosci Methods (2010), doi:10.1016/j.jneumeth.2010.03
hree of the animals never seized while a fourth animal seized butever at Racine grade 5. Only Racine grade 5 seizures were used inhis analysis. All EEG segments were deemed sufficiently artifact-ree. Additionally, EEG seizure epochs were only included in thisnalysis if both hemispheres were successfully recorded during
PRESSnce Methods xxx (2010) xxx–xxx 3
seizure to allow for study of bilateral dynamics of seizure. Fifteenseizures from three animals meet these criteria and were includedin our analysis.
2.3. Electrode target verification with magnetic resonanceimaging and histology
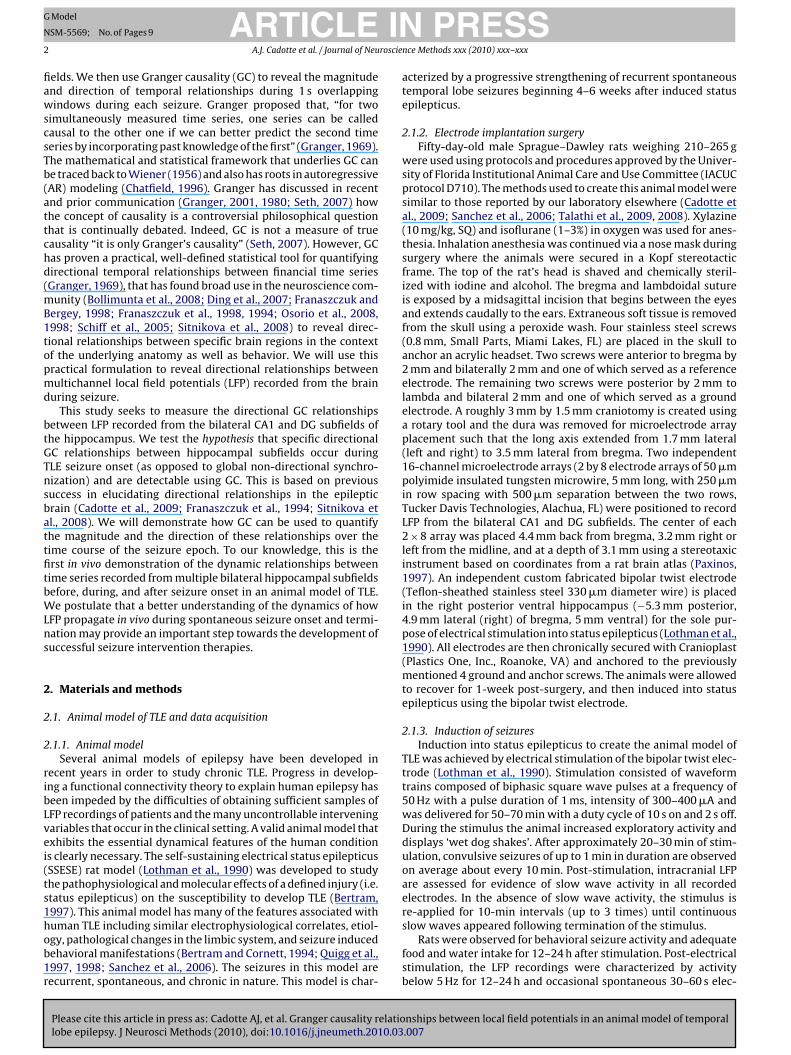
The location of pathology and the track of the stimulating andrecording electrodes were visualized in the excised, fixed, intactrat brains using high-field, high-resolution magnetic resonance(MR) imaging. We have used this method for previous studiesto validate electrode placement alongside the Paxinos brain atlasand histology (Sanchez et al., 2006). After the animals completedthe in vivo epilepsy study, they were perfused with 10% forma-lin through intra-cardial exsanguination. The fixed intact brainwas extracted, the electrodes were removed and the brain wasthen stored in 10% formalin. Prior to MR imaging, the brain wassoaked in phosphate buffer saline (PBS) solution for at least 24 hto wash out residual fixative. The excised brain was then placedin a 20 mm tube containing fluorinated oil (Fluorinert; 3 M Corp.).MR images were measured in a 17.6 T, 89 mm bore Bruker Avanceinstrument (Bruker NMR Instruments, Billerica, MA) with a 3Dgradient echo pulse sequence using a repetition time of 150 ms,gradient echo time of 15 ms with two signal averages in a totaldata acquisition time from 2 h 40 min. The image field-of-view was30 mm × 15 mm × 12 mm, in a matrix of 400 × 200 × 160, result-ing in isotropic resolution of 75 �m. A three-dimensional Fouriertransformation was applied to the acquired data to produce thethree-dimensional image, which was then interpolated by a fac-tor of two in each dimension to produce an image with a display“resolution” of 37.5 �m.
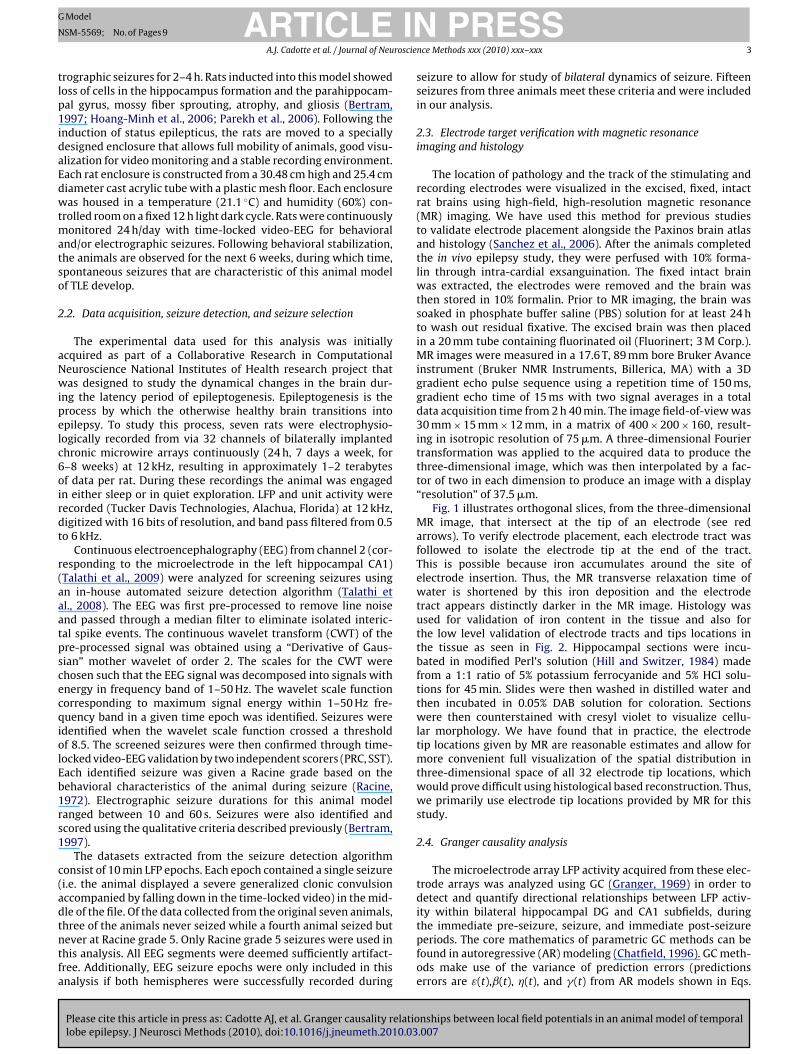
Fig. 1 illustrates orthogonal slices, from the three-dimensionalMR image, that intersect at the tip of an electrode (see redarrows). To verify electrode placement, each electrode tract wasfollowed to isolate the electrode tip at the end of the tract.This is possible because iron accumulates around the site ofelectrode insertion. Thus, the MR transverse relaxation time ofwater is shortened by this iron deposition and the electrodetract appears distinctly darker in the MR image. Histology wasused for validation of iron content in the tissue and also forthe low level validation of electrode tracts and tips locations inthe tissue as seen in Fig. 2. Hippocampal sections were incu-bated in modified Perl’s solution (Hill and Switzer, 1984) madefrom a 1:1 ratio of 5% potassium ferrocyanide and 5% HCl solu-tions for 45 min. Slides were then washed in distilled water andthen incubated in 0.05% DAB solution for coloration. Sectionswere then counterstained with cresyl violet to visualize cellu-lar morphology. We have found that in practice, the electrodetip locations given by MR are reasonable estimates and allow formore convenient full visualization of the spatial distribution inthree-dimensional space of all 32 electrode tip locations, whichwould prove difficult using histological based reconstruction. Thus,we primarily use electrode tip locations provided by MR for thisstudy.
2.4. Granger causality analysis
The microelectrode array LFP activity acquired from these elec-trode arrays was analyzed using GC (Granger, 1969) in order todetect and quantify directional relationships between LFP activ-ity within bilateral hippocampal DG and CA1 subfields, during
nships between local field potentials in an animal model of temporal.007
the immediate pre-seizure, seizure, and immediate post-seizureperiods. The core mathematics of parametric GC methods can befound in autoregressive (AR) modeling (Chatfield, 1996). GC meth-ods make use of the variance of prediction errors (predictionserrors are ε(t),ˇ(t), �(t), and �(t) from AR models shown in Eqs.
ARTICLE IN PRESSG Model
NSM-5569; No. of Pages 9
4 A.J. Cadotte et al. / Journal of Neuroscience Methods xxx (2010) xxx–xxx
Fig. 1. The electrode placement visualized in the excised fixed brain with high-fieldMRI. The three panels show orthogonal slices from a three-dimensional, gradientecho MR image, acquired at 17.6 T (750 MHz): a coronal slice in panel (a), horizontalslice in panel (b), and sagittal slice in panel (c). The three image slices intersect at thetip of an individual electrode located in the right CA1 (see arrows) ipsilateral to thesb
(cutvc
dYuvms
Fig. 2. An example of electrode tip placement validation using coronally sectionedhistology. Perl staining shows the tips of five electrodes in the CA1 subfield ofthe hippocampus. The electrode to the left terminates in the stratum lacunosum-moleculare, the middle three electrodes terminate in the stratum radiatum and the
a steady state BIC value was reached. The point at which the steady
ite of injury. The panels also illustrate several additional electrode tracts (shown aslack vertical lines in the coronal and sagittal slices).
1) and (2)) to extrapolate directional relationships. For example,onsider X(t) and Y(t), univariate AR models, where previous val-es of each time series are used to predict current value of thatime series, say X from p (p is an optimized AR model order) pastalues of X. The coefficients bXX and bYY are the AR model coeffi-ients.
X(t) =p∑
j=1
bXX (j)X(t − j) + ε(t), ˙1 = var(ε(t))
Y(t) =p∑
j=1
bYY (j)Y(t − j) + �(t), �1 = var(ˇ(t))
(1)
The variance of the error series ε(t), ˙1, is a gauge of the pre-iction accuracy of the linear model of X(t). � 1 is the analog for(t) time series. The next step in the calculation of GC involves the
Please cite this article in press as: Cadotte AJ, et al. Granger causality relatiolobe epilepsy. J Neurosci Methods (2010), doi:10.1016/j.jneumeth.2010.03
se of a bivariate autoregressive model, W(t), where the currentalue of each time series X(t) and Y(t) is predicted (with the sameodel order p) using the p past values of both the X and Y time
eries, shown in Eq. (2). Here, aXX, aYY, aXY, and aYX are the AR model
electrode to the right terminates in the CA1 pyramidal cell layer. This histologicalstaining validated the iron content (The Perl stain highlights iron in black) and elec-trode track and tip locations visualized in Fig. 1. Sections were then counterstainedwith cresyl violet to visualize cellular morphology.
coefficients
W (t) =
⎛⎜⎜⎜⎜⎝
X(t) =m∑
j=1
aXX (j)X(t − j) +m∑
j=1
aXY (j)Y(t − j) + �(t)
Y(t) =m∑
j=1
aYX (j)X(t − j) +m∑
j=1
aYY (j)Y(t − j) + �(t)
⎞⎟⎟⎟⎟⎠ (2)
The variance of the new error series is a gauge of the predictionaccuracy of the new expanded predictor
˙W =(
˙2 �2�2 �2
)=
(var(�(t)) cov(�(t), �(t))
cov(�(t), �(t)) var(�(t))
)(3)
GC for Y to X is then calculated from the variance of the linearprediction error of X alone, ˙1, and then compared to the varianceof linear prediction error of X incorporating Y, ˙2, shown in Eq. (4)
FY→X = ln˙1
˙2(4)
Essentially, FY→X is the ratio of the prediction error of X aloneover the prediction error of X including Y. When ˙1 = ˙2 (i.e. thelinear prediction error is not improved by including Y), Eq. (4) willyield a GC value of zero. However, when Y improves the predictionof X the log ratio is non-zero and positive a directional relationshipcan be inferred. The relationship in the opposite direction (X to Y)is addressed by simply reversing the roles of the two time series.
Multielectrode array LFP data from each animal was first pre-processed by down sampling to 1 kHz. The AR model order for theGC analysis was chosen to be p = 25 using methodology based onAkaike’s Information Criterion (AIC) and the Bayesian InformationCriterion (BIC) (Akaike, 1974; Chatfield, 1996). The AIC and the BICwere both calculated, however, the BIC was used primarily due toits correction for large numbers of parameters essentially providingtougher criteria (i.e. higher model order) than the AIC. The BIC wascalculated for each model order for a given data set and plotted,yielding a plot that decreased in a pseudo exponential fashion until
nships between local field potentials in an animal model of temporal.007
state is reached is the model order where increases in the modelorder do not further improve the prediction power of the model.This was repeated for several data chunks across multiple chan-nels and seizures suggesting model orders in the range of 15–20.
ARTICLE IN PRESSG Model
NSM-5569; No. of Pages 9
A.J. Cadotte et al. / Journal of Neuroscience Methods xxx (2010) xxx–xxx 5
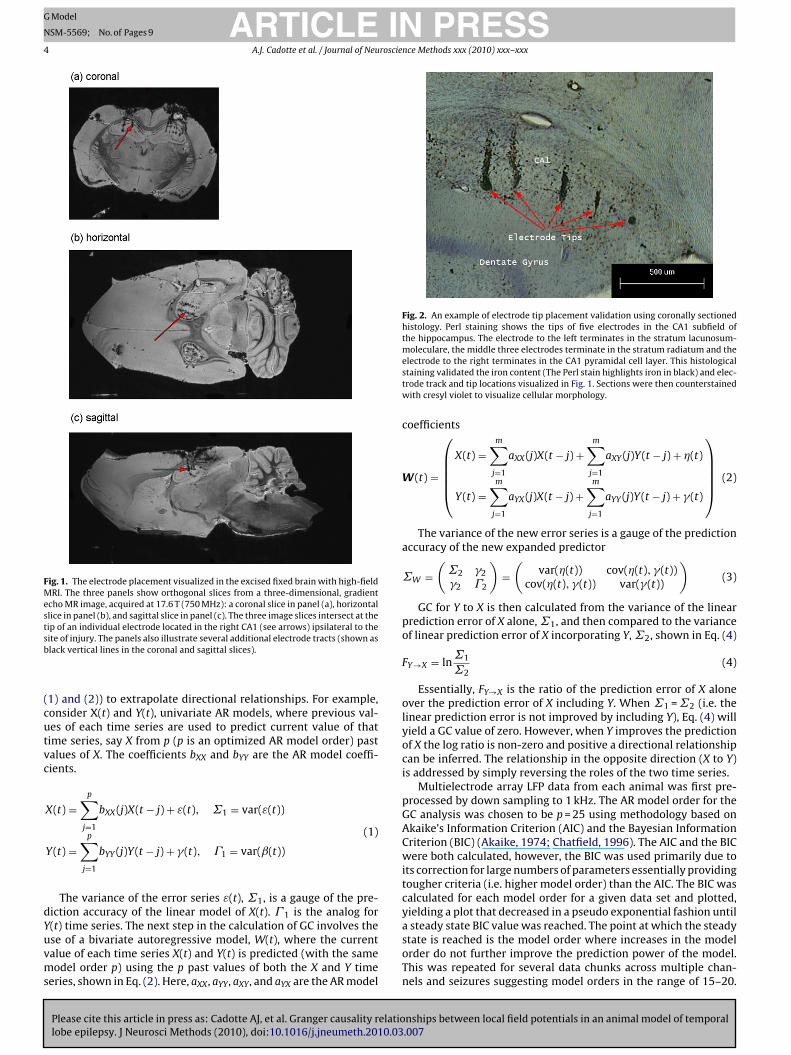
Fig. 3. Example of GC analysis for a single (N = 1) spontaneous temporal lobe seizure. The 1st row contains cartoon plots of the results from the GC indices calculated acrossall seizures (N = 15) and are overlaid on MRI images of the animals hippocampus to visualize GC index directional relationships (note that the location and shape of the arrowsare not meant to imply specific physiological pathways or mechanisms). GC raw results for selected time windows in the example seizure (N = 1) are presented in the 2nd row.The 2nd row plots depict the strength of directional relationships among each electrode pair for all 32 electrodes by color. The electrode pairings are arranged by anatomicalarea. The bottom row provides the electrographic activity from the example seizure (N = 1) from 4 of the 32 electrodes, one from each of the four major subfields coveredby the microelectrode arrays, R-CA1, R-DG, L-CA1, and L-DG. The highlighted time segments correspond to the GC analysis excerpts shown in rows 1 and 2. These tracesinclude one electrode among the four major hippocampal areas observed. Colors indicate the magnitude of GC results, ranging from weak (blue) to strong (red). Directionalinformation is presented by portraying the source location on the vertical axis and response location on the horizontal axis. Starting from the lower left and moving counterclockwise, the four quadrants of each plot represent within-left hemisphere, left-to-right cross-hemisphere, within-right hemisphere, and right-to-left cross-hemispheredirectional relationships. The first column depicts the results from prior to the behavioral onset of seizure (PS) followed by six panels representing transitions (stages S1,S lysis wy h GC rG he Nefi
Itcatladlndenscw
2
wtdesacp
2a and S2b, S3, S4, S5) in the patterns during seizure. A time-shifted surrogate anaields a GC threshold value of 3.66 for p < 0.01 (dark blue in the figure), below whicC analysis of the example seizure (N = 1) presented in this figure is available on tgure legend, the reader is referred to the web version of the article.)
t was then decided to round up the model order to 25 for all datao allow direct comparisons between GC results over time, provideonfidence that the model order was high enough to provide reli-ble AR models for calculation of GC, and low enough model ordero allow for reasonable computational tractability. GC was calcu-ated using p = 25 within a 1 s moving window with 50% overlapmong all possible electrode pairings. Within a 1 s moving win-ow the data was approximately stationary (Hesse et al., 2003) and
ong enough to provide stable AR models. This windowing tech-ique is consistent with previous GC analysis of absence-seizureata (Sitnikova et al., 2008). This analysis produces a GC value forach directional electrode pairing and for each time window orga-ized by source electrode, destination electrode, and time for eacheizure. Thus, 32 × 32 − 32 = 992 GC directional relationships werealculated per time window (within-channel or self-relationshipsere not investigated).
.5. Surrogate analysis and post hoc contrasts of GC indexes
The statistical significance of our results is estimated in twoays. First, we use a time-shifted surrogate analysis where data is
ime shifted randomly to destroy temporal relationships within theata. This method is applied to provide a significance threshold for
Please cite this article in press as: Cadotte AJ, et al. Granger causality relatiolobe epilepsy. J Neurosci Methods (2010), doi:10.1016/j.jneumeth.2010.03
ach individual GC value at any time point. Analysis of the time-hifted surrogate produced a threshold value of 3.66 for p < 0.01bove which the temporal relationships suggested by GC analysisan be said to be significantly different than chance for the exam-le seizure. Practically speaking, this means electrode pairs with
as carried out by applying GC to the time-shifted data set. This surrogate analysisesults are not significant. Note: A supplementary high-resolution animation of theuroscience Methods website. (For interpretation of the references to color in this
dark blue pixels in Fig. 3 (and the supplemental movie) cannot bedifferentiated from random fluctuations and thus should be inter-preted as having no directional relationship. The red dashed lines inthe panels for Fig. 4 represent averaged value for the time-shiftedsurrogate.
Second, post hoc contrasts were used to better justify thequalitative partitioning of the seizure stages and the observedhierarchical evolution of temporal GC relationships during seizureonset and seizure. Pre-seizure and seizure GC temporal patternswere shown to be significantly different in a previous work (Cadotteet al., 2009), thus we examine the transition from pre-seizureinto generalized seizure independently from post-generalizationseizure. Due to the highly multivariate nature of the analysis, indi-vidual GC results often required averaging into GC indexes (GCI)selected by the source and destination recording locations relevantto the pattern being discussed. GCIs are averaged 1-s time windowswithin the corresponding stage for each individual seizure. Thisapproach greatly simplifies the conceptual basis of the statisticalanalysis across the 15 seizures. Additionally, because the seizuresare spontaneous and complex, the lengths of the stages vary. Theaverage time length for each stage (N = 15 seizures) is 8.4 ± 4.4,11.9 ± 4.6, 11.7 ± 5.8, 6.9 ± 4.5, and 15.7 ± 5.8 for seizures stages 1through 5, respectively. Post hoc contrasts of GCI between seizure
nships between local field potentials in an animal model of temporal.007
stages were performed using a nonparametric Friedman two-wayanalysis of variance with multiple comparison correction (MAT-LAB, friedman and multcompare functions) between GCI relative toobserved qualitative patterns during seizure onset and within theseizures post-generalization. For each contrast, we report the GCI

ARTICLE IN PRESSG Model
NSM-5569; No. of Pages 9
6 A.J. Cadotte et al. / Journal of Neuroscience Methods xxx (2010) xxx–xxx
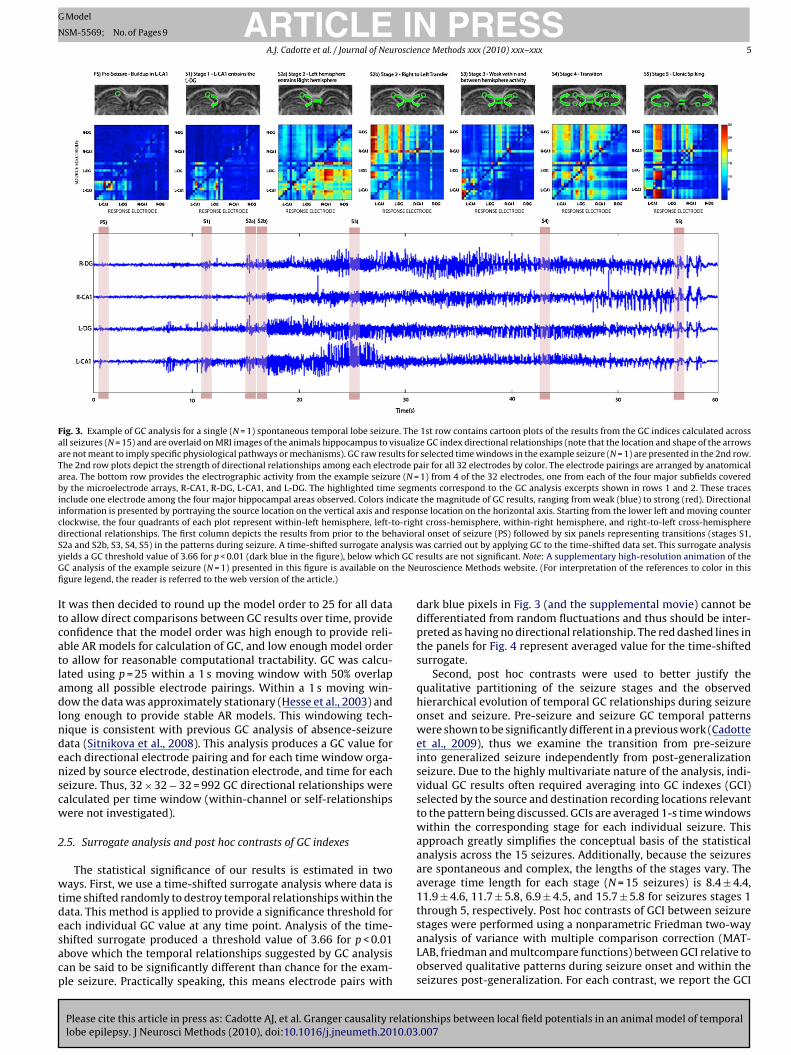
Fig. 4. Continuous plots for the primary GC Indices for the same example seizure presented in Fig. 2. Each window represents the GC Index (dark blue trace) for all of theelectrode pairings from and to the areas specified on the label for each panel. For example, the top left plot (column 1, row 1) represents the GC Index or the sum of all GCresults from the right DG to the L-CA1. The arrangement of the “from” and “to” areas in the subplots corresponds to the same relative arrangement in each of the GC plotsshown in the 2nd row of Fig. 2. For each panel, seizure data from one of the corresponding “from” electrodes used in calculation of the GC index is plotted in light grey togive a temporal context to the GC index. Additionally, significance thresholds from GC analysis of a time-shifted surrogate time series is shown with a red dashed line. Thes he GCd inder een 6c color
usfc
3
isaaiAdoamttfptrisLps
eizure occurs mainly in the middle 60 s, the same as in the supplemental video. Tecreased for 1 index. Interestingly the sole decreased index is from L-CA1 to L-DGelationship observed from the L-CA1 to the L-DG prior to seizure. The spikes betwross-hemisphere directional relationships. (For interpretation of the references to
sed, stages compared, corresponding GCI/stage means, The Chi-quared value for the Friedman ANOVA (with column degrees ofreedom and total degrees of freedom), and p-value for the specificontrast (post-multiple comparison correction).
. Results: analysis of spatiotemporal dynamics
A qualitative assessment of the dynamics of GC patterns dur-ng the 15 Racine grade 5 seizure epochs suggests a consistentpatial and temporal progression of directional relationships forll analyzed seizures. To better describe this temporal progression,nimations of the resultant patterns were used to define stages dur-ng each seizure based on qualitative changes in observed patterns.
supplemental video depicting the results from the GC analysisuring one seizure is provided on the Journal of Neuroscience Meth-ds website and is recommended as a companion to our results. Thisnimation also includes selected electrographic signals and a sum-ary of the patterns across 15 seizures overlaid on an MR image of
he hippocampus. The temporal progression of the pattern suggestshat seizure onset can be characterized by a directional relationshiprom the DG subfield to the CA1 subfield in the left hippocam-al formation (contra-lateral to the bipolar twist electrode usedo create the animal model). This appearance of this directionalelationship reasonably correlates with the emergence of behav-
Please cite this article in press as: Cadotte AJ, et al. Granger causality relatiolobe epilepsy. J Neurosci Methods (2010), doi:10.1016/j.jneumeth.2010.03
oral changes associated with seizure such as blinking and chewingeen in time-locked behavioral video as well as high-magnitudeFP waveforms associated with seizure. For consistency, the timerior to this entrainment will be referred to as pre-ictal (PI) in thistudy. The subsequent time epochs are qualitatively divided into
Index is increased after seizure for 11 of the indexes, the same for 4 indexes, andx (column 2, row 4). This is the same index implicated for having an abnormal GC0 and 70 s (most prevalent in the top left and bottom right) correspond to Stage 2in this figure legend, the reader is referred to the web version of the article.)
five different successive stages. The number of stages was basedsolely on the evolution of the patterns of GC relationships dur-ing these seizures (the patterns used for defining stages will bediscussed later in this section) in order to better characterize andlater quantify the dynamics of seizure initiation, propagation, andtermination.
One of the 15 seizures was selected and displayed in par-allel with its GC analysis during each stage and is depicted inFigs. 3 and 4. Fig. 3 depicts a colorized representation of directionalrelationships (middle row) organized by anatomical area (L-CA1, L-DG, R-CA1, and R-DG) during the example seizure. Electrographictime series from 4 of the 32 channels for the example seizure areplotted in the lower panel for visual reference. Cartoon representa-tions of the dominant patterns from analysis of all seizures (N = 15)are shown in the 1st row. Raw GC matrices for selected analysiswindows are presented in the 2nd row. Fig. 4 displays the GC indexfor the example seizure (N = 1) where the magnitudes of GC indicesfor that seizure (calculated by summing specific directional rela-tionships between and within observed hippocampal subfields) aredisplayed over time. Each of the 16 indexes presented is displayedin parallel with seizure data from one of the source electrodes usedin calculation of that GC index (shown in light gray within the pan-els in Fig. 4) to serve as a temporal reference for the GC index resultsfor the example seizure. The following is a brief qualitative descrip-
nships between local field potentials in an animal model of temporal.007
tion of the five seizure stages suggested by the temporal patternssuggested by the GC analysis. This description will be immediatelyfollowed by a more detailed quantitative analysis where statisticalsignificance is addressed. Neural and behavioral correlates to thestages are described where appropriate.
ING
N
roscie
wsofTspSfrprtTitibSadtscrSi
rpJwlststCrblclasct
tp(pshSEwssamaoct
ARTICLEModel
SM-5569; No. of Pages 9
A.J. Cadotte et al. / Journal of Neu
During the PI state there are GC relationships seen exclusivelyithin the left CA1, as shown in Fig. 3 in the PS panel. These relation-
hips are persistent up to 2 min prior to seizure onset. Seizure onsetr stage 1 is characterized by the strengthening of the relationshiprom the left CA1 to the left DG, illustrated in Fig. 3 in the S1 panel.he spatially extent of these relationships expands in stage 2 wheretrong directional relationship can be seen from the left hippocam-us to the right hippocampus, shown in Fig. 3 in the S2a panel.tage 2 may also include a reverberation of directional relationshipsrom left to right and right to left, as shown by strong directionalelationships from the right hippocampus to the left hippocam-us in the S2b panel of Fig. 3. Note that these highly directionaleverberations in S2 would likely be indistinguishable from con-inuous global synchronization using a non-directional measure.hese reverberations lessen in stage 3, contributing to the declinen total GC relationships seen in Fig. 3. Furthermore, stage 3 rela-ionships appear to be more local and less global organized. Stage 4s a brief epoch characterized by a global increase in relationshipsetween nearly all observed areas, as illustrated in Fig. 3 in panel4. Stage 5 patterns, where strong balanced bilateral relationshipsre seen from the DG to the CA1, are diametrically opposite to theirectionality of the GC patterns seen in stages 1–3. This suggestshat stage 4 may be a transition between stage 3 and 5. This tran-ition is behaviorally correlated with the progression from tonic tolonic seizure behavior in the time-locked video. Also of note is thatelationships are primarily seen in the left hippocampus in the PI,1, and S2 stages, but become more balanced between hemispheresn stages 3–5.
The following more detailed quantitative analysis of theseesults is used to validate our qualitative findings. During the PIeriod, relationships are confined to the CA1 of one hemisphere.
ust prior to seizure onset, the strongest relationships are seenithin the left CA1 (column 1, row 4, Fig. 4) and between the
eft CA1 and left DG (column 2, row 4, Fig. 4, 0–60 s). Duringtage 1 (S1) of the seizure, relationships within CA1 continueo increase (within-CA1, S1 vs. Pre, mean 5.37 vs. 2.41, Chi-q(2,44) = 30, p < 0.02) and a new directional relationship fromhe CA1 to the DG (CA1 to DG, S1 vs. Pre, mean 6.47 vs. 2.52,hi-sq(2,44) = 30, p < 0.02). Behavioral correlates for stage 1 rep-esents the onset of the tonic phase of the seizure, characterizedy where the animal becomes motionless. Within each animal the
ocation (hemisphere) in which seizures appear to originate wasonsistent across seizures but varied by animal (5 of 6 seizureseft hemisphere for rat 1, 4 of 5 right hemisphere for rat 2,nd 3 of 4 seizures right hemisphere for rat 3). The relation-hips within the CA1 that appear to initiate the seizure cascadean often be seen up to a minute prior to the PS to S1 transi-ion.
In stage 2, the driving influence of CA1 upon DG increased fur-her (CA1 to DG, S2 vs. S1, mean 12.55 and 6.47, Chi-sq(2,44) = 30,< 0.02) and was accompanied by further increases within CA1
within-CA1, S2 vs. S1, mean 10.11 and 5.37, Chi-sq(2,44) = 30,< 0.02). The relationships within the initiating hippocampal hemi-
phere expand to the contra-lateral (right) hippocampus (betweenemisphere i.e. upper left and lower right quadrants in Fig. 3,2 vs. S1, mean 5.58 and 3.08, Chi-sq(2,44) = 28.13, p < 0.05).lectrographically, stage 2 contained the first of high-magnitudeaveforms commonly associated with seizure. In this example
eizure, the initial directional relationship from the left hemi-phere to the right (labeled S2a in the figure) was followed bydirectional relationship from right to left (labeled S2b). These
Please cite this article in press as: Cadotte AJ, et al. Granger causality relatiolobe epilepsy. J Neurosci Methods (2010), doi:10.1016/j.jneumeth.2010.03
ono-directional cross-hemisphere relationships often reverber-te between hemispheres several times and were the most strikingf the features that occur during the early stages of seizure. Theseross-hemisphere volleys appeared as large spikes in the GC indexime series between 60 and 70 s in the cross-hemisphere GC
PRESSnce Methods xxx (2010) xxx–xxx 7
indexes in the panels in the top left and bottom right quadrantsof Fig. 4.
During stage 3, the magnitude of within-hemisphere relation-ships declined significantly (within hemisphere i.e. upper right andlower left quadrants in Fig. 3, S3 vs. S2, mean 7.40 vs. 9.77, Chi-sq(3,59) = 13.48, p < 0.11). This decrease was seen with most GCindices (shown near t = 90 s in Fig. 4). While the magnitudes ofcross-hemisphere relationships remained elevated in stage 3 (bidi-rectional left and right cross-hemisphere electrode pairings, S3 vs.S2, mean 5.28 vs. 5.58, Chi-sq(3,59) = 18.44, p = 0.98), these relation-ships were now more diffuse and became scattered among differenthippocampal areas. Although the total GC index was reduced rel-ative to stage 2 during this period (all, S3 vs. S2, mean 6.34 vs.7.68, Chi-sq(3,59) = 17, p < 0.11), electrographically it contained thelargest magnitude waveforms.
Stage 4 is correlated to the behavioral transition from tonicto clonic seizure observed in the time-locked video. Duringthis transition the animal’s limbs jerk rhythmically and rapidly.This brief transition was marked by the reemergence of strongwithin-hemisphere relationships (within hemispheres, S4 vs. S3,mean 9.11 vs. 7.40, Chi-sq(3,59) = 13.48, p < 0.15) appearing att = 95 s as broad spikes in most of the GC indexes. However,unlike stage 2 (where high-magnitude relationships are primar-ily cross-hemisphere), during this epoch all observed areas werebidirectional. Moreover, the directional pattern from CA1 to DGthat was observed during earlier stages is completely reversed.The primary directional relationships are now from the DG tothe CA1 (from DG to CA1, S4 vs. S3, mean 10.21 vs. 7.22, Chi-sq(3,59) = 11.24, p < 0.01). At this point, the animal demonstratedrearing and falling in the time-locked video consistent with Racinegrade 5 seizures.
Seizure-offset or Stage 5, was characterized by a gradual emer-gence of low-frequency large-magnitude spike-wave events inthe electrographic data. Behaviorally, the animal experiencedclonic seizure until the seizure terminated. Like stage 4, the pri-mary pattern during this stage was from DG to CA1. Althoughcross-hemisphere relationships are sometimes present during thisfinal stage, these relationships declined significantly (betweenhemispheres, S5 vs. S4, mean 3.67 vs. 5.26, Chi-sq(3,59) = 18.44,p < 0.002). Furthermore, directional GC relationships from the DG tothe CA1 that emerged during the Stage 4 transition persisted afterthe termination of behavioral seizure in the time-locked video.
4. Discussion
The main findings of this study were that the representativecohort of spontaneous limbic seizures from an animal model ofchronic TLE in our analysis follows a common spatial sequence ofinitiation, propagation, and termination. Two dominant patternsof LFP microelectrode array relationships were found within thissequence. The first, summarized and illustrated in Fig. 3 panelsPS through S2b, describe the initiation and propagation of seizure,where the seizure spreads from the CA1 to the ipsilateral DG andthen the contra-lateral hippocampus. If a diffuse hyper-excitablenetwork initiates ictogenesis during this time frame, one mightexpect to see widespread non-directional relationships rather thana hierarchical directional progression among hippocampal sub-fields. The second pattern, illustrated in Fig. 3 panels S3 throughS4, suggests a distinct transition from an abnormal pattern (CA1 tothe DG), which was observed during initiation and propagation to a
nships between local field potentials in an animal model of temporal.007
more anatomically expected pattern (DG to the CA1). Interestingly,this transition occurs during the observed behavioral transitionfrom tonic to clonic seizure. This complete reversal in the direc-tional GC patterns may lend support to the hypothesized “resetting”of the brain during seizure (Iasemidis et al., 2004).
ARTICLE ING Model
NSM-5569; No. of Pages 9
8 A.J. Cadotte et al. / Journal of Neuroscie
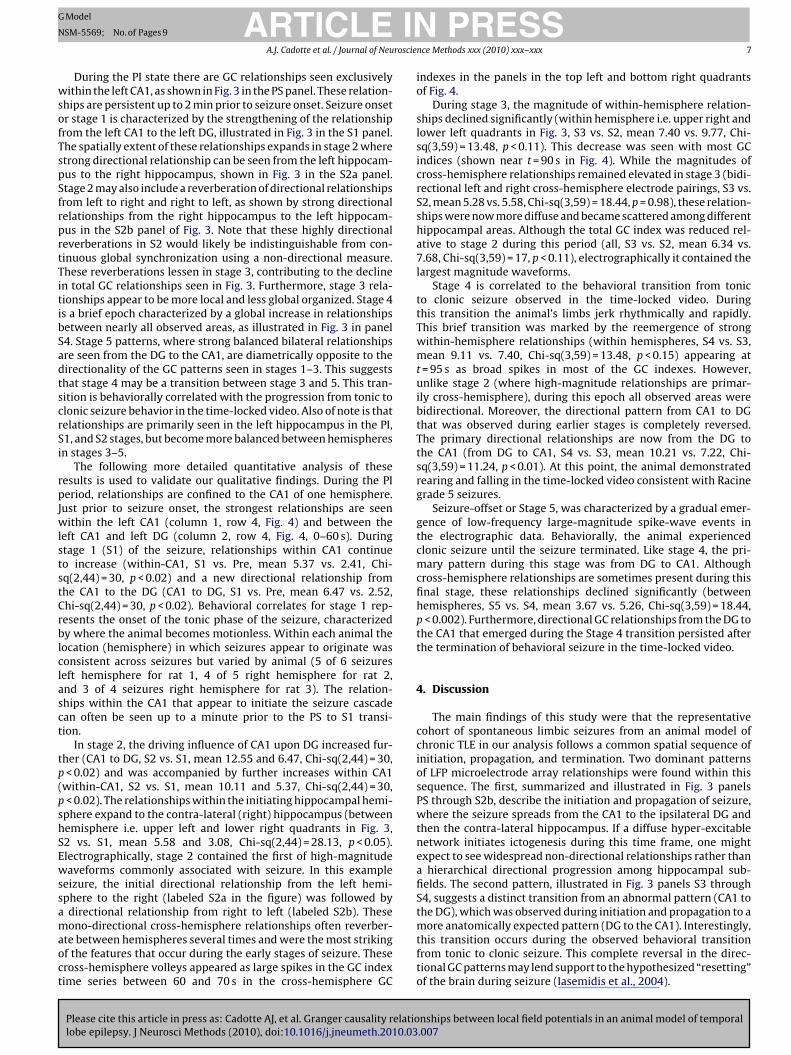
Fig. 5. Non-directional mean (N = 15 seizures) GC index of all channels pre-seizureand through each of the five seizure stages. All of the directional relationshipsbetween all 32 electrodes have been averaged to produce a representation of a totalnon-directional relationship. The strength of this non-directional GC index increasesrapidly from the pre-seizure period to Stage 1 and continues to increase until peak-ing during Stage 2. Following Stage 2 the non-directional index decreases duringStage 3 but briefly spikes once again in Stage 4 before terminating at the end ofStage 5. Note that this non-directional analysis shows no difference between stages2 and 4. Overall, these results are consistent with general effective and functionalconnectivity assessments of synchronization during seizure found in the literature.Aiss
stoa(drGtWatbnsapttrraesdemebet
tp(aUf
dditionally, these results are consistent with the general dynamics observed dur-ng each of the fifteen seizures in our analysis. The average time length for eachtage (N = 15 seizures) is 8.4 ± 4.4, 11.9 ± 4.6, 11.7 ± 5.8, 6.9 ± 4.5, and 15.7 ± 5.8 foreizures stages 1 through 5, respectively.
Overall, the detailed results of our GC and GC indices analysisuggest these methods are a reliable tool to estimate LFP direc-ional relationships between hippocampal subfields during seizurenset and propagation. Other traditionally used methods suchs power spectrum (univariate, non-directional) and coherencenon-directional) are not sufficient alone to capture the evolvingynamics of LFP seizure onset and spread. A summation of all GCelationships during each stage creates a non-directional index ofC, shown in Fig. 5, that is consistent with previously reported func-
ional connectivity analysis of seizure epochs (Schiff et al., 2005).ithout directionality, this type of analysis suggests that seizures
re accompanied by global increases in synchronization. Addi-ionally, the mono-directional reverberations of S2 and the globalidirectional relationships of S4 would be indistinguishable in aon-directional analysis. However, when the directional relation-hips are segregated in the context of the location of the electrodesnd time, our analysis suggests specific directional spatiotemporalatterns during spontaneous seizure initiation and propagation inhis animal model of TLE. Furthermore, the importance in direc-ionality in our findings is similar to specific directional findingsevealed in a GC analysis of absence seizures in the thalamo-corticalegion (Sitnikova et al., 2008). Additionally, GC analysis simplifiestime dependent analysis of seizure evolution due to its ability toxtract the strength and direction of relationships between neuralubfields from the use of only one computational method. Whenirectly compared to other connectivity measures (Winterhaldert al., 2005), GC is shown to be among the most suitable for theonitoring of temporally dependent brain dynamics. GC is a well-
stablished method used for examining the relationships betweenrain regions and is now more widely used in epilepsy (see Cadottet al., 2009 for a more comprehensive review of effective connec-ivity measures in epilepsy).
However, it is worth noting these results cannot precludehe involvement of unobserved brain areas outside of the hip-
Please cite this article in press as: Cadotte AJ, et al. Granger causality relatiolobe epilepsy. J Neurosci Methods (2010), doi:10.1016/j.jneumeth.2010.03
ocampus or the contribution from a diffuse epileptic networkBertram et al., 1998; Bertram, 2009; Kudo et al., 1997; Osorio etl., 2008; Raisinghani and Faingold, 2005a,b; Sheerin et al., 2004).nobserved time series or systems may contribute to observed
unctional or effective relationships. This weakness is not spe-
PRESSnce Methods xxx (2010) xxx–xxx
cific to GC analysis, however, and is shared by all methods thatseek to measure the functional and effective relationships betweentime series. Thus, while the results presented here are compelling,they also reinforce the need for further experiments that expandthe spatial coverage of electrodes to better utilize GC and otherconnectivity measures to characterize the mechanisms underly-ing seizure. For example, hypotheses for such experiments coulddraw upon evidence in recently published papers that suggeststhat the entorhinal cortex may play a strong role in seizure ini-tiation (Amaral and Lavenex, 2007; Ang et al., 2006; Avoli et al.,2002; Barbarosie and Avoli, 1997) while activating the CA1 andDG. In Barbarosie and Avoli (1997) when the Schaffer collateralis cut in vitro (severing the anatomical linkage from the CA3 thatprovides modulatory input to the entorhinal cortex), epileptiformactivity arises from the entorhinal cortex onto the CA1 and DG. Inmicrolesion studies where the entorhinal cortex is damaged, sim-ilar spontaneous seizures arise in vivo (Wu and Schwarcz, 1998).Further, in vitro evidence from Ang et al. (2006) describe theinitiation and spread of seizure-like activity from the entorhinalcortex into the CA1. These studies considered in the context ofour results may suggest that time delayed influences from theentorhinal cortex may be responsible for the abnormal connec-tivity patterns seen in PS through S3 stages. Additionally, thismay suggest that recordings from the entorhinal cortex in suchan experiment may have an earlier hierarchical involvement inthe analysis we present. We also hypothesize that in vivo earlyseizure detection studies in this rat model could be improved byusing GC methods in addition to recording from strategically placedrecording electrodes. Future experiments in our laboratory willinclude electrodes in the entorhinal cortex and the CA3 to providea more complete representation of the involvement of the bilat-eral hippocampal trisynaptic circuits in spontaneous temporal lobeseizures.
In conclusion, the rat model of TLE in parallel with mul-tichannel recordings provides a useful experimental platformfrom which to develop spatial and temporal analyses such asGC, a basis for further testing the hypothesis that epilepsyinvolves hierarchical networks. Our analysis suggests the impor-tance in identifying and investigating directional relationships inthe epileptic brain and eventually the underlying mechanismsthat contribute to the transitions of patterns we observed. Wepostulate that the real-time detection and identification of thetransitions in GC patterns across the hippocampal network duringseizure onset may offer new opportunities for therapeutic inter-vention.
Acknowledgments
This research was supported by the National Institutes ofBiomedical Imaging and Bioengineering (NIBIB) through Collab-orative Research in Computational Neuroscience (CRCNS) GrantNumbers R01 EB004752 and EB007082, the Wilder Center of Excel-lence for Epilepsy Research, and the Children’s Miracle Network.PRC was partially supported through the Wilder Center of Excel-lence for Epilepsy Research Endowment funds. WLD was partiallysupported through the J. Crayton Pruitt Family Endowment funds.SST was partially funded by a Fellowship Grant from the EpilepsyFoundation of America. We thank Dr. Wendy Norman and StephenMyers for data collection and animal care, and Hector Sepulvedafor MRI data collection. We thank for reviewing the behavioral
nships between local field potentials in an animal model of temporal.007
videos to identify the seizure events and we also thank YonghongChen, Anil Bollimunta, and Yan Zhang for helpful discussions. MRIdata were obtained at the Advanced Magnetic Resonance Imagingand Spectroscopy Facility in the McKnight Brain Institute of theUniversity of Florida.
ING
N
roscie
A
t
R
A
A
A
A
B
B
B
B
B
B
C
C
D
F
F
F
G
G
G
H
H
H
Winterhalder M, Schelter B, Hesse W, Schwab K, Leistritz L, Klan D, et al. Com-
ARTICLEModel
SM-5569; No. of Pages 9
A.J. Cadotte et al. / Journal of Neu
ppendix A. Supplementary data
Supplementary data associated with this article can be found, inhe online version, at doi:10.1016/j.jneumeth.2010.03.007.
eferences
kaike H. A new look at the statistical model identification. IEEE Trans Autom Control1974;19:716–23.
maral D, Lavenex P. Hippocampal neuroanatomy. In: Andersen P, Morris R, AmaralT, Bliss T, O’Keefe J, editors. The hippocampus book. Oxford: Oxford UniversityPress; 2007. p. 37–114.
ng CW, Carlson GC, Coulter DA. Massive and specific dysregulation of directcortical input to the hippocampus in temporal lobe epilepsy. J Neurosci2006;26:11850–6.
voli M, D’Antuono M, Louvel J, Köhling R, Biagini G, Pumain R, et al. Network andpharmacological mechanisms leading to epileptiform synchronization in thelimbic system in vitro. Prog Neurobiol 2002;68:167–207.
arbarosie M, Avoli M. CA3-driven hippocampal entorhinal loop controls rather thansustains in vitro limbic seizures. J Neurosci 1997;17:9308–14.
ertram E, Zhang D, Mangan P, Fountain N, Rempe D. Functional anatomy of limbicepilepsy: a proposal for central synchronization of a diffusely hyperexcitablenetwork. Epilepsy Res 1998;32(1–2):194–205.
ertram EH. Functional anatomy of spontaneous seizures in a rat model of limbicepilepsy. Epilepsia 1997;38:95–105.
ertram EH. Temporal lobe epilepsy: where do seizures really begin? Epilepsy &Behavior 2009;14:32–7.
ertram EH, Cornett J. The evolution of a rat model of chronic limbic epilepsy. BrainResearch 1994;661:157–62.
ollimunta A, Chen Y, Schroeder CE, Ding M. Neuronal mechanisms of corticalalpha oscillations in awake-behaving macaques. J Neurosci 2008;28:9976–88.
adotte A, Mareci TH, Demarse TB, Parekh M, Rajagovindan R, Ditto WL, et al. Tem-poral lobe epilepsy: anatomical and effective connectivity. IEEE Trans NeuralSyst Rehab Eng 2009;17:214–23.
hatfield C. The analysis of time series an introduction. 5th ed. Boca Raton, FL:Chapman & Hall; 1996.
ing L, Worrell G, Lagerlund T, He B. Ictal source analysis: localization and imagingof causal interactions in humans. Neuroimage 2007;34:575–86.
ranaszczuk P, Bergey G. Application of the directed transfer function method tomesial and lateral onset temporal lobe seizures. Brain Topogr 1998;11:13–21.
ranaszczuk P, Bergey G, Durka P, Eisenburg H. Time-frequency analysis usingmatching pursuit algorithm applied to seizures originating from the mesialtemporal lobe. Electroencephalogr Clin Neurophysiol 1998;106:513–21.
ranaszczuk P, Bergey G, Kaminski M. Analysis of mesial temporal seizure onset andpropogation using the directed transfer function method. ElectroencephalogrClin Neurophysiol 1994;91:413–27.
ranger CWJ. Essays in econometrics: the collected papers of Clive W.J. Granger.Cambridge: Cambridge University Press; 2001.
ranger CWJ. Investigating causal relations by econometric models andcross-spectral methods. Econometrica 1969;3:424–38.
ranger CWJ. Testing for causality. A personal view point. J Econ Dyn Control1980;2:329–52.
esse W, Moller E, Arnold M, Schack B. The use of time-variant EEG Granger causal-ity for inspecting directed interdependencies of neural assemblies. J NeurosciMethods 2003;124:27–44.
ill JM, Switzer RC. The regional distribution and cellular localisation of iron in the
Please cite this article in press as: Cadotte AJ, et al. Granger causality relatiolobe epilepsy. J Neurosci Methods (2010), doi:10.1016/j.jneumeth.2010.03
rat brain. Neuroscience 1984;11:595–603.oang-Minh L, Sepulveda H, Parekh M, Hadlock A, Norman W, Sanchez J, et al. MRI
Measurements at 17.6 Tesla in an Animal Model of Temporal Lobe Epilepsy Cor-related with Histological Analysis. Proceedings of the 60th Annual Meeting of theAmerican Epilepsy Society, San Diego, CA, 2006. Epilepsia 2006;47:(309 Suppl.4).
PRESSnce Methods xxx (2010) xxx–xxx 9
Iasemidis L, Shiau D, Sackellares J, Pardalos P, Prasad A. Dynamical resetting of thehuman brain at epileptic seizures: application of nonlinear dynamics and globaloptimization techniques. IEEE Trans Biomed Eng 2004;51:493–506.
Kudo T, Kazuichi Y, Seino M. Effect of callosal bisection on seizure development andinterhemispheric transfer effects in feline motor cortical kindling. Epilepsy Res1997;28:105–18.
Lado FA, Moshe SL. How do seizures stop? Epilepsia 2008;49:1–14.Lothman EW, Bertram EH, Kapur J, Stringer JL. Recurrent spontaneous hippocampal
seizures in the rat as a chronic sequela to limbic status epilepticus. Epilepsy Res1990;6:110–8.
Mormann F, Andrzejak RG, Elger C, Lehnertz K. Seizure Prediction: the long andwinding road. Brain 2007;130:314–33.
Osorio I, Frei M, Lai Y. Neuronal synchronization and the ‘Ictio-centric’ vs. thenetwork theory for ictiogenesis: mechanistic and therapeutic implicationsfor clinical epileptology. In: Schelter B, Timmer J, Schulze-Bonhage A, edi-tors. Seizure prediction in epilepsy. Weinheim, Germany: Wiley-VCH; 2008. p.109–15.
Osorio I, Frei M, Wilkinson S. Real-time automated detection and Quantitativeanalysis of the seizure and short-term prediction of clinical onset. Epilepsia1998;39:615–27.
Parekh M, Hoang-Minh L, Sepulveda H, Handlock A, Norman W, Sanchez J, et al.Diffusion tensor MR imaging of the rat model of mesial temporal lobe epilepsy.Proceedings of the 60th annual meeting of the American epilepsy society, SanDiego, CA. Epilepsia 2006;47(317 Suppl. 4).
Paxinos G. The rat brain in sterotaxic coordinates. Sydney, Australia: Academic Press;1997.
Quigg M, Bertram EH, Jackson T, Laws E. Volumetric magnetic resonance imagingof bilateral hippocampal atrophy in mesial temporal lobe epilepsy. Epilepsia1997;38:588–94.
Quigg M, Straume M, Menaker M, Bertram EH. Temporal distribution of partialseizures: comparison of an animal model with human partial epilepsy. AnnNeurol 1998;43:748–55.
Racine R. Modification of seizure activity by electrical stimulation. II. Motor seizure.Electroencephalogr Clin Neurophysiol 1972;32:281–94.
Raisinghani M, Faingold C. Evidence for the perirhinal cortex as a requisite compo-nent in the seizure network following seizure repetition in an inherited form ofgeneralized clonic seizures. Brain Res 2005a;1048:193–201.
Raisinghani M, Faingold C. Neurons in the amygdala play an important role in theneuronal network mediating a clonic form of audiogenic seizures both beforeand after audiogenic kindling. Brain Res 2005b;1032:131–40.
Sanchez JC, Mareci TH, Norman WM, Principe JC, Ditto WL, Carney PR. Evolvinginto epilepsy: multiscale electrophysiological analysis and imaging in an animalmodel. Exp Neurol 2006;198:31–47.
Schiff SJ, Sauer T, Kumar R, Weinstein SL. Neuronal spatiotemporal pattern discrim-ination: the dynamical evolution of seizures. NeuroImage 2005;28:1043–55.
Seth AK. Granger causality. Scholarpedia 2007;2:1667.Sheerin A, Nylen K, Zhang X, Saucier D, Corcoran M. Further evidence for a role of
the anterior claustrum in epileptogenesis. Neuroscience 2004;125:57–62.Sitnikova E, Diaknev T, Smirnov D, Bezruchko D, van Luijtelaar G. Granger causality:
cortico-thalamic interdependencies during absence seizures in WAG/Rij rats. JNeurosci Methods 2008;170:245–54.
Talathi S, Hwang DU, Ditto WL, Spano ML, Mareci T, Sepulveda H, et al. Circadian con-trol of neural excitability in an animal model of temporal lobe epilepsy. NeurosciLett 2009;15:145–9.
Talathi S, Hwang DU, Spano ML, Simonotto J, Furman M, Myers S, et al.Non-parametric early seizure detection in an animal model of temporal lobeepilepsy. J Neural Eng 2008;5:85–98.
Wiener N. The theory of prediction. In: Beckenback EF, editor. Modern mathematicsfor engineers, series 1; 1956, Chapter 8.
nships between local field potentials in an animal model of temporal.007
parison directed of linear signal processing techniques to infer interactions inmultivariate neural systems. Signal Process 2005;85:2137–60.
Wu H, Schwarcz R. Focal microinjection of gamma-acetylenic GABE into the ratentorhinal cortex: behavioral and electroencephalographic abnormalities andpreferential neuron loss in layer III. Exp Neurol 1998;153:203–13.