Grade-12-Geography-Textbook.pdf - Ethiopian Legal Brief
244
GEOGRAPHY STUDENT TEXTBOOK GRADE 12 Authors, Editors and Reviewers: Mesfin Weldeselassie (M.A.) Mulugeta Assefa (M.Sc.) Hari Shankar Sharma (Ph.D., Professor) Bekure Weldesemait (Ph.D.) Evaluators: Haftu Araya Tamrat Fitie Yitagesu Demsie FEDERAL DEMOCRATIC REPUBLIC OF ETHIOPIA MINISTRY OF EDUCATION
-
Upload
khangminh22 -
Category
Documents
-
view
1 -
download
0
Transcript of Grade-12-Geography-Textbook.pdf - Ethiopian Legal Brief
GEOGRAPHYSTUDENT TEXTBOOK
GRADE 12
Authors, Editors and Reviewers:
Mesfin Weldeselassie (M.A.)
Mulugeta Assefa (M.Sc.)
Hari Shankar Sharma (Ph.D., Professor)
Bekure Weldesemait (Ph.D.)
Evaluators:
Haftu Araya
Tamrat Fitie
Yitagesu Demsie
FEDERAL DEMOCRATIC REPUBLIC OF ETHIOPIA
MINISTRY OF EDUCATION
Published E.C. 2003 by the Federal Democratic Republic of Ethiopia, Ministry of Education, under the General Education Quality Improvement Project (GEQIP) supported by IDA Credit No. 4535-ET, the Fast Track Initiative Catalytic Fund and the Governments of Finland, Italy, Netherlands and the United Kingdom.
© 2011 by the Federal Democratic Republic of Ethiopia, Ministry of Education. All rights reserved. No part of this book may be reproduced, stored in a retrieval system or transmitted in any form or by any means including electronic, mechanical, magnetic or other, without prior written permission of the Ministry of Education or licensing in accordance with the Federal Democratic Republic of Ethiopia, Federal Negarit Gazeta, Proclamation No. 410/2004 – Copyright and Neighbouring Rights Protection.
The Ministry of Education wishes to thank the many individuals, groups and other bodies involved – directly and indirectly – in publishing this textbook and the accompanying teacher guide.
Copyrighted materials used by permission of their owners. If you are the owner of copyrighted material not cited or improperly cited, please contact with the Ministry of Education, Head Office, Arat Kilo, (PO Box 1367), Addis Ababa, Ethiopia.
PHOTO CREDIT: New Complete Geography 1, 1989; Focus on Earth Science ©1987; Paul Guinness and Garrett Nagle, IGCSE Geography, Odder Education, an Hachette UK Company London, 2009; Ralph C. Scott, Physical Geography Second Edition, 1992; Robert J. Sager, William L. Ramsey, Clifford R. Phillips and Frank M. Watenpaugh Modern Earth Science; Simon Ross, Introducing Physical Geography and Map Reading, Long Man Group, 1988; Encyclopedia; Microsoft ® Encarta ®2009; http://en.wikipedia.org/wiki.GreatRiftValley; www.uregon.edu,SWWales, UK; http://scienceray.com/earth-sciences/geology; http://geology.about.com/od/geoprocesses.
While every attempt has been made to trace and acknowledge copyright, the authors and publishers apologies for any accidental infringement where copyright has proved untraceable.
Developed and Printed by
STAR EDUCATIONAL BOOKS DISTRIBUTORS Pvt. Ltd.24/4800, Bharat Ram Road, Daryaganj,
New Delhi – 110002, INDIAand
ASTER NEGA PUBLISHING ENTERPRISEP.O. Box 21073
ADDIS ABABA, ETHIOPIA
Under GEQIP Contract No. ET-MoE/GEQIP/IDA/ICB/G02/09-A.
ISBN 978-99944-2-142-9
Second Edition 2007 (E.C.),By Tan Prints India Pvt. Ltd.
CausesForming
Hypothesis
Data collection, organization and
interpretation
Findings
Solutions
Prob
lem
s
Unit
BASIC RESEARCH METHODOLOGIES IN GEOGRAPHY ......................................... 1
1
Unit
MAP USE AND MAP WORK ............. 28
2
Contents
Pages
2.1 The Study of Topographic Maps .......................... 302.2 Globe and Map .................................................... 442.3 Map Projection ...................................................... 472.4 Drawing Sketch Map ........................................... 52
F Unit Summary .............................. 58
F Review Exercise ............................ 58
1.1 DefinitionandConcept ......................................... 31.2 TheSignificanceofResearch(qualitativeand quantitative) .......................................................... 31.3 ApproachesofResearch .................................... 51.4 TheNatureofGeographicResearch ..................... 81.5 BasicResearchMethodologyinGeography ........ 101.6 ConductingActionResearch ................................ 21
F Unit Summary .............................. 25
F Review Exercise ........................... 25
Grade 12 Geography II
Contents
Unit
POPULATION OF ETHIOPIA AND THE HORN ..................................... 149
4
Unit
PHYSICAL GEOGRAPHY OF ETHIOPIA AND THE HORN ............................. 60
3
4.1 Population Theories ................................................... 1514.2 Trends of Population Growth and Structure in Ethiopia ................................................................... 1594.3 The Spatial Distribution of Population in Ethiopia ................................................................... 1684.4 Factors Affecting Population Distribution in Ethiopia ................................................................... 1724.5 Settlement Patterns of Ethiopian Population ......... 1774.6 DeterminantsofPopulationChangein Ethiopia ........................................................................ 1814.7 ImpactsofRapidPopulationGrowth in Ethiopia ................................................................... 1914.8 Population Policy of Ethiopia .................................. 1954.9 Urbanization in Ethiopia ........................................... 203
F Unit Summary .............................. 203 F Review Exercise ............................ 204
3.1 Location of the Horn of Africa and Sizes of Member Countries .............................................................. 613.2 Location, Size and Shape of Ethiopia ................... 653.3 GeologicalStructureandReliefofthe Horn of Africa ....................................................... 723.4 ClimateofEthiopiaandtheHorn ...................... 1093.5 Natural Vegetation and Wild Animals of Ethiopia ................................................................. 1233.6 Soils of Ethiopia .................................................... 138
F Unit Summary ............................. 147
F Review Exercise ............................ 148
Grade 12 Geography III
Contents Contents
Unit
ECONOMIC GROWTH AND DEVELOPMENT TREND IN ETHIOPIA ......................................... 206
55.1 AnOverviewofGrowthandDevelopment Trend in Ethiopia ....................................................... 208
5.2 Major Features of Ethiopian Economy ................. 210
5.3 Present features of Ethiopian socio-economic development ............................................................... 215
5.4 ChallengesandProspectsofSocio-economic DevelopmentforEthiopia ........................................ 218
5.5 EconomicRelation .................................................... 222
5.6 PASDEP(PlanforAcceleratedandSustained DevelopmenttoEndPoverty)................................. 226
F Unit Summary ............................... 229
F Review Exercise ............................ 230
Glossary ....................................... 233

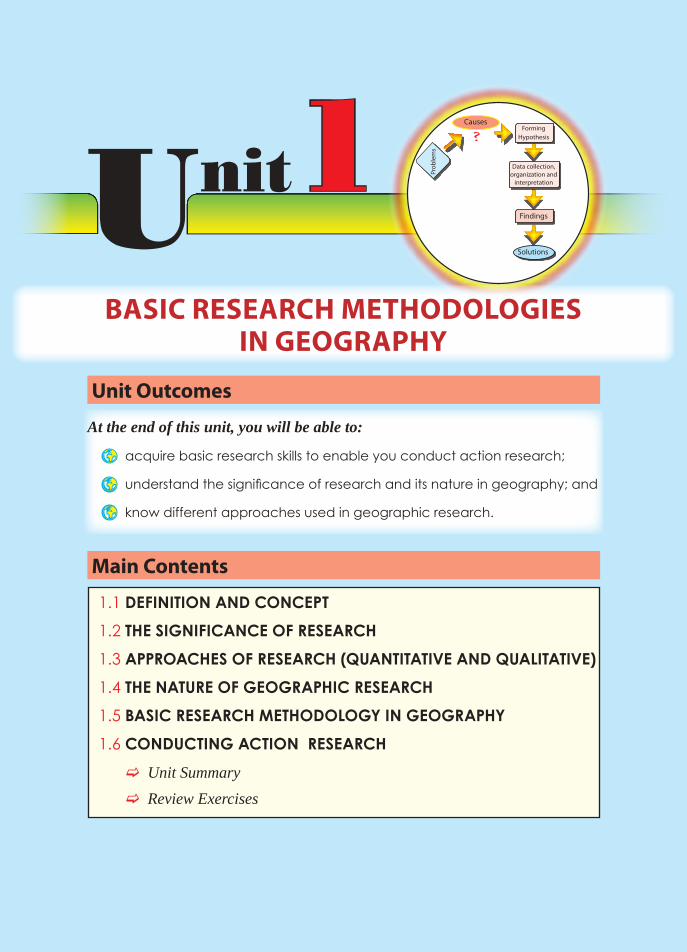
Unit Outcomes
At the end of this unit, you will be able to:
Þ acquire basic research skills to enable you conduct action research;
Þ understand the significance of research and its nature in geography; and
Þ know different approaches used in geographic research.
Main Contents
1.1 DEFINITION AND CONCEPT1.2 THE SIGNIFICANCE OF RESEARCH 1.3 APPROACHES OF RESEARCH (QUANTITATIVE AND QUALITATIVE)1.4 THE NATURE OF GEOGRAPHIC RESEARCH1.5 BASIC RESEARCH METHODOLOGY IN GEOGRAPHY1.6 CONDUCTING ACTION RESEARCH
F Unit Summary
F Review Exercises
Unit1 CausesForming
Hypothesis
Data collection, organization and
interpretation
Findings
Solutions
Prob
lem
s
BASIC RESEARCH METHODOLOGIES IN GEOGRAPHY
Grade 12 Geography 2
Introduction
Þ INTRODUCTIONDo you remember the definitions of geography you learned in previous grades?
Geography is a discipline that attempts to understand human and physical aspects of the world. Its primary concerns are location, time and the concept that everything that happens to us is affected by our surroundings, including other people and the places within which we live, work and travel. (Khaskar: 1)
Geography helps us to understand how the world is changing. By studying geography, you will conceive:
F how places and landscapes are formed
F how people and their environments interact
F what decisions we make to further our social interests
F what causes the diverse range of cultures and societies, and what results from these.
Considering such issues motivates us to:
F formulate questions
F develop intellectual skills for finding answers (solutions) F introduce investigative tools
Because of the wide range of geography’s human and physical concerns, the questions that arise in its study ultimately lead us to perform research. The goals of this research include:
F producing definite answers to the questions F improving existing answers to the questions
F performing research that leads to a consensus regarding the answers
Unlike the concerns of most social sciences, the social concerns of geography are relatively dynamic. To provide sustainable solutions for this fast-changing subject, we must use skilled action research.
In this unit you will learn the skills and attitudes that this approach to research requires. This information could lead you to become one of tomorrow's experienced researchers.
Unit 1: Basic ReseaRch MethodoloGies in GeoGRaphy 3
Introduction 1.2 The SIgnIfIcance Of ReSeaRch
1.1 DEFINITION AND CONCEPTAt the end of this section, you will be able to:
Þ explain the concept of research.
Key Terms
³ Research ³ Research method
³ Systematic inquiry ³ Discovery
Have you ever attempted a small research project at your class or section level?
The term research came into English from
F the old French root word “cerchier,” which means to search or seek; and
F the prefix ‘re-’ which means again.
Research, therefore, means to seek again with a view to becoming certain. (Desta Hamito; 2000)
By the term definition, we mean a generally agreed-on opinion about the subject under clarification. When we define research it is in this sense. We define research as a scientific method of investigating answers for the problems identified. It is also a systematic inquiry into causes or the discovery of new facts through planned and organized effort that requires time, money and skill.
In short, research is the search for knowledge through objective and systematic methods of finding solutions to problems.
1.2 THE SIGNIFICANCE OF RESEARCHAt the end of this section, you will be able to:
Þ show appreciation to the significance of research in tackling social problems.
Key Terms ³ Development ³ Problem solving ³ Problem identification
³ Rational decisions ³ Policy
Grade 12 Geography 4
1.2 The SIgnIfIcance Of ReSeaRch
Have you ever imagined or thought about the importance of research?
Development in any country depends, among other things, upon its research capability and the extent to which this capability is channeled into action. Also, to result in action, the research must be accessible to appropriate institutions, etc. Sometimes capable research work never reaches its targeted destinations.
Advances in science, technology and welfare are often considered to be the result of capable research. Governments in developed countries allocate huge sums of money for research work. Developing countries are also adopting this approach. This situation has made research work a good business for professionals.
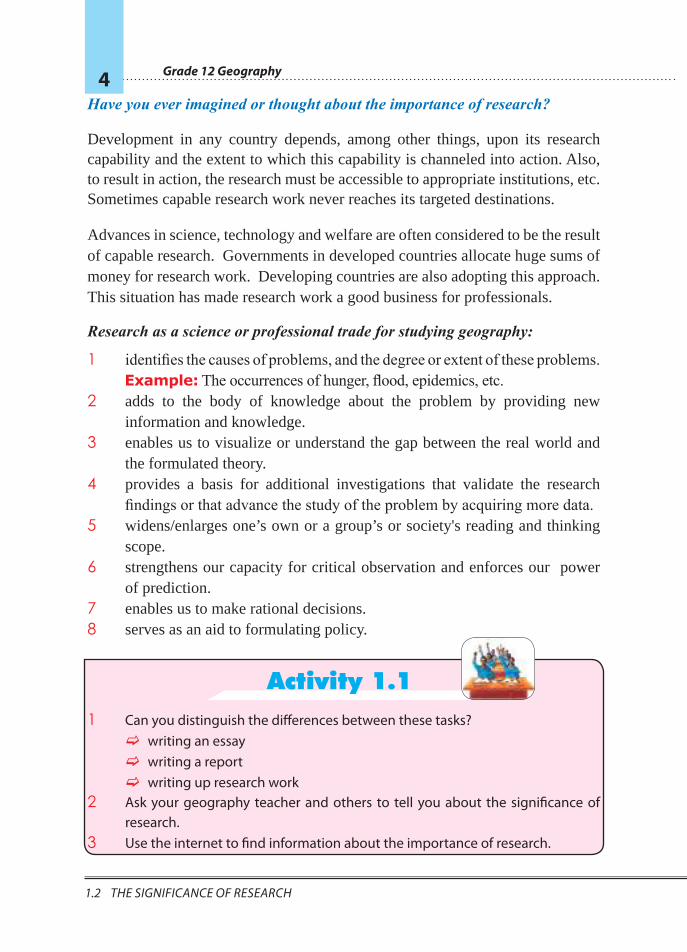
Research as a science or professional trade for studying geography:
1 identifies the causes of problems, and the degree or extent of these problems.Example: The occurrences of hunger, flood, epidemics, etc.
2 adds to the body of knowledge about the problem by providing new information and knowledge.
3 enables us to visualize or understand the gap between the real world and the formulated theory.
4 provides a basis for additional investigations that validate the research findings or that advance the study of the problem by acquiring more data.
5 widens/enlarges one’s own or a group’s or society's reading and thinking scope.
6 strengthens our capacity for critical observation and enforces our power of prediction.
7 enables us to make rational decisions.8 serves as an aid to formulating policy.
Activity 1.11 Can you distinguish the differences between these tasks?
F writing an essay F writing a report F writing up research work
2 Ask your geography teacher and others to tell you about the significance of research.
3 Use the internet to find information about the importance of research.
Unit 1: Basic ReseaRch MethodoloGies in GeoGRaphy 5
1.2 The SIgnIfIcance Of ReSeaRch 1.3 appROacheS Of ReSeaRch (qualITaTIve and quanTITaTIve)
1.3 APPROACHES OF RESEARCH (QUALITATIVE AND QUANTITATIVE)
At the end of this section, you will be able to:
Þ use different geographic research approaches in action research.
Key Terms
³ Quantitative ³ Qualitative ³ Theory ³ Independent variable
³ Dependent variable ³ Inference ³ Model ³ Approach
What do you mean by an approach to treating a problem?
There are two basic approaches to research. Their differences are mainly in the attributes to be measured and the techniques to be used for collecting and analyzing data. These approaches are called
A the quantitative approach B the qualitative approach
A Quantitative Approach We use the quantitative approach when trying to verify a given geographical theory. We translate the concepts of the theory into variables that can be measured with statistical techniques.
The advantage of this approach is that the quantitative technique employed by one researcher can be used by another researcher for different objectives or for further developing the same information. Very simple examples of this approach are given below:
F the decrease in land-lease prices as one travels from the center of a city to its suburbs;
F the decrease in population density as one travels from the center of a city to its edges;
F the decrease in temperature towards the poles from the equator.
All of the preceding examples investigate changes that occur as a function of distance from a defined point – for example, from the center of a city. In the examples, distance is the determining variable. A determining variable influences the variation of other phenomena.
Grade 12 Geography 6
1.3 appROacheS Of ReSeaRch (qualITaTIve and quanTITaTIve)
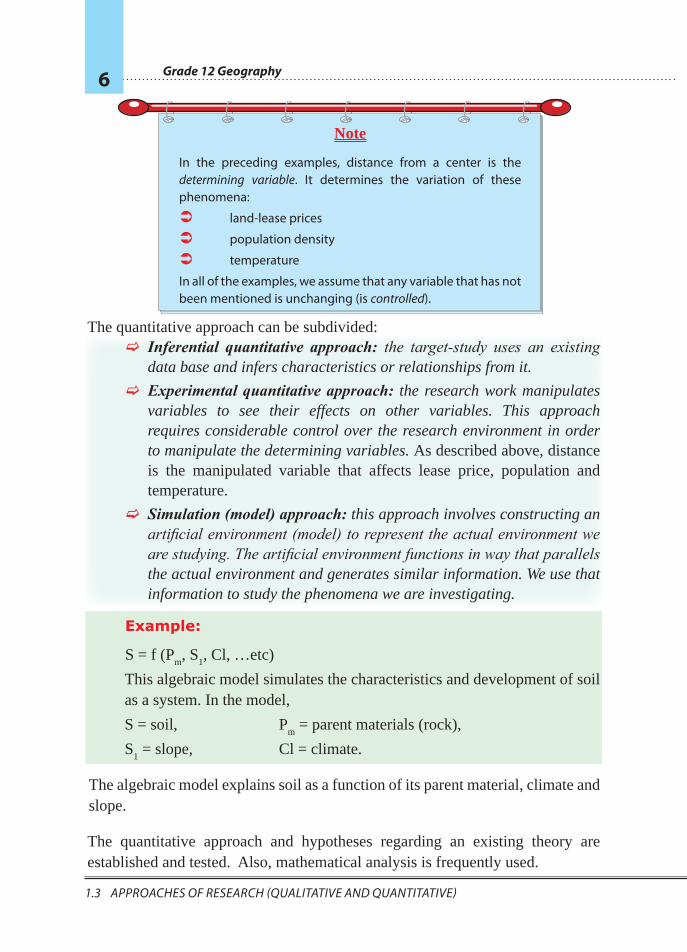
The quantitative approach can be subdivided: F Inferential quantitative approach: the target-study uses an existing data base and infers characteristics or relationships from it.
F Experimental quantitative approach: the research work manipulates variables to see their effects on other variables. This approach requires considerable control over the research environment in order to manipulate the determining variables. As described above, distance is the manipulated variable that affects lease price, population and temperature.
F Simulation (model) approach: this approach involves constructing an artificial environment (model) to represent the actual environment we are studying. The artificial environment functions in way that parallels the actual environment and generates similar information. We use that information to study the phenomena we are investigating.
Example:
S = f (Pm, S
1, Cl, …etc)
This algebraic model simulates the characteristics and development of soil as a system. In the model,
S = soil, Pm = parent materials (rock),
S1 = slope, Cl = climate.
The algebraic model explains soil as a function of its parent material, climate and slope.
The quantitative approach and hypotheses regarding an existing theory are established and tested. Also, mathematical analysis is frequently used.
Note
In the preceding examples, distance from a center is the determining variable. It determines the variation of these phenomena:
 land-lease prices
 population density
 temperature
In all of the examples, we assume that any variable that has not been mentioned is unchanging (is controlled).

Unit 1: Basic ReseaRch MethodoloGies in GeoGRaphy 7
1.3 appROacheS Of ReSeaRch (qualITaTIve and quanTITaTIve) 1.3 appROacheS Of ReSeaRch (qualITaTIve and quanTITaTIve)
B Qualitative Approach
What does qualitative method imply in the field of geography?
In the qualitative approach, data are used to explain a new theory. No previously existing theory or hypothesis is tested by way of this approach. Quantitative techniques are not employed. Therefore, the study cannot be repeated by other researchers.
Common techniques for gathering data in the qualitative approach are:
 group interviews
 questionnaires
 personal observations
Some examples of subjects that could be studied with the qualitative approach to research are:
F differences between urban and rural populations of Ethiopia.
F differences in academic achievement between boys and girls.
F effects of harsh climate on human activity.
F effects of poor leadership on students’ national examination results.
Þ Exercise 1.1I Complete the following sentences correctly.
1 The approach we take to research is a function of the subject or attributes of the study and of the techniques to be used for collecting and analyzing data. The approaches we choose from are ___________ and ___________.
2 The technique of using interviews and questionnaires in data collection comes under the ___________ approach.
3 In the quantitative approach, hypotheses are established and ___________.
4 If a given theory is not to be verified and no hypothesis about it is to be established, the approach employed will be ___________.
5 To examine the relationship between availability of books and student grades in college entrance exam, we would use the ___________ approach to research.
telephone interviews
in-person interviews (face-to-face)

Grade 12 Geography 8
1.4 The naTuRe Of geOgRaphIc ReSeaRch
II Vocabulary Skills: See if you can match the items under column A with their definitions under column B. Ignore the unrelatable ones.
A B
1.4 THE NATURE OF GEOGRAPHIC RESEARCH
At the end of this section, you will be able to:
Þ reflect the distinct nature of geographic research from other disciplines.
Key Terms
³ Spatial distribution ³ GIS ³ Spatial data
Do you always focus on the same issue or center of interest?
Geography's focus has developed in scope and approach over time through the development of technology and accumulation of information.
Traditionally, geographical research is related to the locations of places and
A A tested hypothesis.B A proposed idea or explanation that is
based on observed or known facts but has not yet been proved. A predictive statement that can be tested.
C Energetic and fast changing.D Simulation of the real world to explain
a designed feature.E To be proved.F Careful observation.G Characters.H To deal with problems.I A document or case that serves as a
source or reference.J Substances or factors whose effects are studied.K Measures or investigates.
1 To tackle problems
2 Dynamic
3 Theory
4 Critical observation
5 Attributes
6 To be verified
7 Inference
8 Model
9 Hypothesis
10 Variables
Unit 1: Basic ReseaRch MethodoloGies in GeoGRaphy 9
1.4 The naTuRe Of geOgRaphIc ReSeaRch 1.4 The naTuRe Of geOgRaphIc ReSeaRch
people. In the eighteenth century, geography’s focus shifted to the physical and human characteristics of places in our world. In the mid-twentieth century, geographical research focused mainly on:
F the spatial distributions of phenomena and things
F the resulting patterns and interactions
F the forces responsible for the formation of the patterns
Very lately, geographical research has begun to deal with environmental issues like hunger, global warming, poverty and the sustainable development of our ecosystem.
In July of 2006, in Brisbane, Australia, the International Geographical Union (IGU) commission was formed under the UN Charter that commands worldwide geographical education. The commission’s position is that the academic discipline of geography is crucial to achieving sustainable worldwide development.
Human Population
Human population is an issue of concern to geography, sociology, economics, political science, etc. Each discipline has its own concerns and approaches to this issue. However, the ideas of all these fields of study about population overlap.
Economists’ sphere of interest is largely aggregate demand and supply and responses to production. Sociologists’ research work greatly emphasizes cultural values, the effect of the population factor on the occurrence of crimes, harmony disorders, etc.
The concerns of geography and geographers are mainly to:
F assess the spatial distribution of the population
F determine the forces that governed the distribution:
K is the distribution due to physical factors? or
K is it due to economic factors?
F examine patterns of population distribution: (is it sparsely or densely populated, is there uniformity or not?)
F question whether there is a relationship between the distribution and the factor observed:
K are areas sparsely or densely populated?
Grade 12 Geography 10
1.5 BaSIc ReSeaRch MeThOdOlOgy In geOgRaphy
K is there uniformity or not?
F To investigate possible relationships between population distribution and other factors.
F look at the impact of populations on the surrounding natural resources
F foreward views on the sustainability of the area or locality for the future
Thus, we see the differences and similarities between the various disciplines’ approaches to the issue of population and we see geography’s specific concerns and approaches to population.
In the 1950s and 1960s, the adoption of quantitative techniques in geographic research revolutionized the field. Its interest in human-environment relations became deeper and wider. At the end of the millennium, the development of the Geographical Information system (GIS) produced a powerful investigative tool for geographic research.
Do you know what information sciences are? Please study the next section carefully.
Geographic Information System (GIS)
The Geographic Information System (GIS) is a computer system that records, stores and analyzes information about features of the earth’s surface. The break through that GIS provided is its ability to generate two-dimensional and three-dimensional images of an area. Also, it can receive geographical data from maps, satellites, photographs, and printed texts and books. GIS allows geographers to conduct research on environmental changes. GIS, as an information-acquisition and interpretation device, has enhanced geographers’ ability to perform accurate high-level research. (Encarta, 2007)
1.5 BASIC RESEARCH METHODOLOGY IN GEOGRAPHY
At the end of this section, you will be able to:
Þ use basic elements of research in your action research.
Unit 1: Basic ReseaRch MethodoloGies in GeoGRaphy 11
1.5 BaSIc ReSeaRch MeThOdOlOgy In geOgRaphy 1.5 BaSIc ReSeaRch MeThOdOlOgy In geOgRaphy
Key Terms
³ Research problem ³ Hypothesis ³ Interview ³ Sampling
³ Questionnaire ³ Research report ³ Bibliography ³ Data analysis
³ Primary data ³ Secondary data
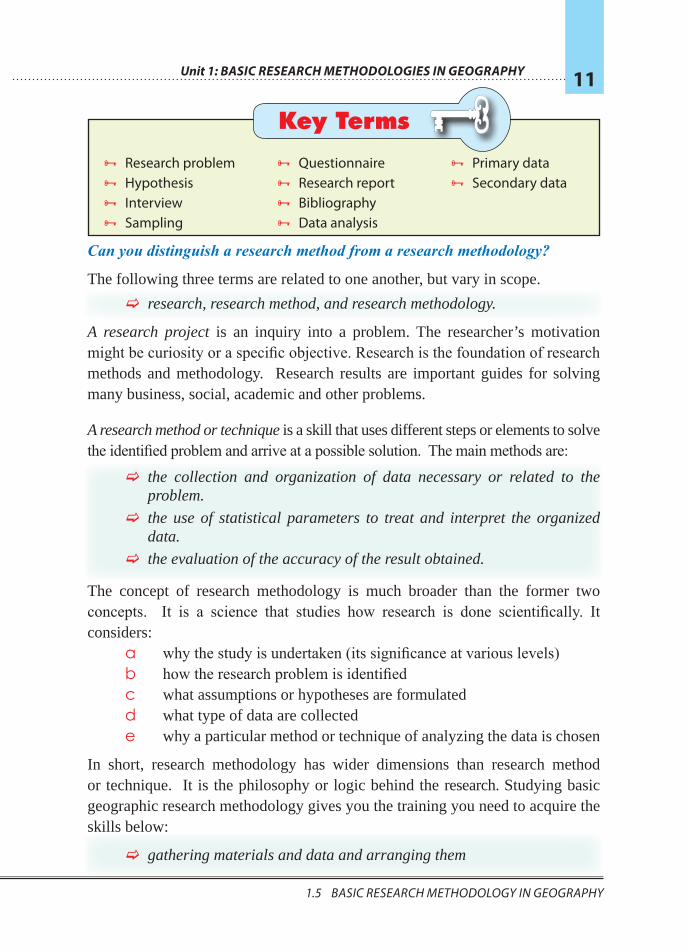
Can you distinguish a research method from a research methodology?
The following three terms are related to one another, but vary in scope.
F research, research method, and research methodology.
A research project is an inquiry into a problem. The researcher’s motivation might be curiosity or a specific objective. Research is the foundation of research methods and methodology. Research results are important guides for solving many business, social, academic and other problems.
A research method or technique is a skill that uses different steps or elements to solve the identified problem and arrive at a possible solution. The main methods are:
F the collection and organization of data necessary or related to the problem.
F the use of statistical parameters to treat and interpret the organized data.
F the evaluation of the accuracy of the result obtained.
The concept of research methodology is much broader than the former two concepts. It is a science that studies how research is done scientifically. It considers:
a why the study is undertaken (its significance at various levels)b how the research problem is identified c what assumptions or hypotheses are formulatedd what type of data are collectede why a particular method or technique of analyzing the data is chosen
In short, research methodology has wider dimensions than research method or technique. It is the philosophy or logic behind the research. Studying basic geographic research methodology gives you the training you need to acquire the skills below:
F gathering materials and data and arranging them

Grade 12 Geography 12
1.5 BaSIc ReSeaRch MeThOdOlOgy In geOgRaphy
F participating in field work F preparing questionnaires, interviews, etc.
F using statistical techniques
F interpreting and reporting results of the study that you have designed or proposed.
Activity 1.2
Form a group and study the following two options for your group work. Choose the one that best suits your school environment and perform the activity.
1 Ask your teacher to identify some one who is experienced in performing research. Invite that person to visit your class and conduct a discussion session on
a what research is
b the significance of research
c the relevance of research for geography
2 Using Encarta or Internet or other possibly accessible materials, conduct a group discussion inferring the different concepts stated between a research technique and a research methodology.
Basic Elements of Research After considering basic questions of the research methodology for their projects, geographers conduct their research by performing the following tasks:
F identifying or formulating the research problem
F defining the significance of the study for solving the problem
Note
Research is a time, money and other costs consuming activity
but empowers you to understand, be logical and be a good
observer.
Unit 1: Basic ReseaRch MethodoloGies in GeoGRaphy 13
1.5 BaSIc ReSeaRch MeThOdOlOgy In geOgRaphy 1.5 BaSIc ReSeaRch MeThOdOlOgy In geOgRaphy
F defining the study of the problem area F defining the objectives of the study F defining the scope and limitations of the study F reviewing the literature
F developing a working hypothesis
F preparing the research design
F defining the sample design F collecting and organizing the data
F analyzing the data by using statistical techniques
F generalizing and interpreting the data
F preparing the research report, based on the findings F compiling the bibliography/references
In what follows, we look at these elements:
A Identifying or Formulating the Research Problem
At the very beginning of a research project, the researcher must choose the problem to study. In other words, the researcher must define the area of interest. A good approach to defining a research problem is to discuss it with people who have significant experience performing research in the study area and to read the literature related to that area.
Investigating the causes of a problem is an important factor for identifying its solutions. In some cases, a problem has multiple causes that you must identify.
B Defining the significance of the study for Solving the problem
The significance of a research project differs from its objectives. Its significance is its importance at a local, regional, national or global level.
To be significant, a study must benefit a society or community by: F providing new discoveries
F improving existing situations
F demanding new decisions
F enriching or refuting already existing theories
Grade 12 Geography 14
1.5 BaSIc ReSeaRch MeThOdOlOgy In geOgRaphy
C Studying the Problem Area
When we study the problem area that a research project addresses, we create a detailed bird's eye-view for ourselves and others who will access the research. As we study the problem area, we identify problems and eliminate ambiguity. This step is particularly important when we research the spatial distribution of phenomena and things.
D Defining the Objectives of the Study
A study’s objectives are the goals the researcher intends to achieve through the research project. In this step, general and specific objectives are set. The general objectives provide short statements of the goal, while the specific objectives provide detailed inter-connected statements.
E Defining the Scope and Delimitation of the Study
Research requires time, financing and skilled manpower or professionals. These factors are not always available at required levels. Shortages of these resources limits the spatial dimension that the research can cover. It also limits the quality of the research work. The greater the accessibility or spatial extent, the wider is the scope and the amount and quality of information to be obtained; which, in turn, leads to greater competency.
F Reviewing the Literature
Did you have the experience of reviewing books? After reviewing, you may have the main idea. Try to remember that idea.
Reviewing the literature means identifying, reading and analyzing documentation related to the research you plan to perform. For example,
F books F academic journals F conference proceedings F government reports F published and unpublished documents related to the problem
For quantitative research, the literature review can help you identify the variables and their relationships. You need to understand them in order to establish an appropriate hypothesis.
Unit 1: Basic ReseaRch MethodoloGies in GeoGRaphy 15
1.5 BaSIc ReSeaRch MeThOdOlOgy In geOgRaphy 1.5 BaSIc ReSeaRch MeThOdOlOgy In geOgRaphy
For qualitative research, the literature review helps you to expand your knowledge of the research subject.
G Developing or Formulating a Working Hypothesis
How do we develop a working hypothesis?
A hypothesis is a preliminary assumption or tentative explanation that accounts for a set of facts, taken to be true for the purpose of investigation and testing a theory.
Establishing a working hypothesis is crucial for research in all disciplines including geography. The information you gain from your literature review will help you to formulate an appropriate hypothesis.
The hypothesis you develop will guide you as you define the types of data to collect and decide which methods of data analysis you will use.
A working hypothesis can be formulated based on the ideas you gather from: a conducting discussions with experts,
b inferring from the work of others on similar studies,
c personal investigations of conducting original field interviews with interested parties and individuals.
A hypothesis must have the following characteristics. It a should be clear and precise
b should be capable of being tested or verifiedc should state relationships between the variables determined
d must explain the facts that give rise to the explanation
H Preparing the Research Design
What is the basis for preparing a research design?
After formulating the research problem, you prepare a research design. The research design is the conceptual framework within which the research could be conducted. It helps you collect related evidence. It also helps you to limit required time, effort and expense.
Grade 12 Geography 16
1.5 BaSIc ReSeaRch MeThOdOlOgy In geOgRaphy
The preparation of an appropriate research design for a particular problem involves the following considerations.
i the means of obtaining the information
ii the competence of the researcher
iii the time available for the research
iv the money available for the research
A research design answers such questions as these about your research project and its subject: what, where, when, how much and by what means.
I Defining the Sample Design
What factors influence in determining the sample design?
We typically study samples of the total population in question, rather than studying the entire population. If a population is very large, and we try to address the entire population, our project might be too large to be practical. For example, the amount of information we would need to identify, gather, organize and analyze might be too large to manage.
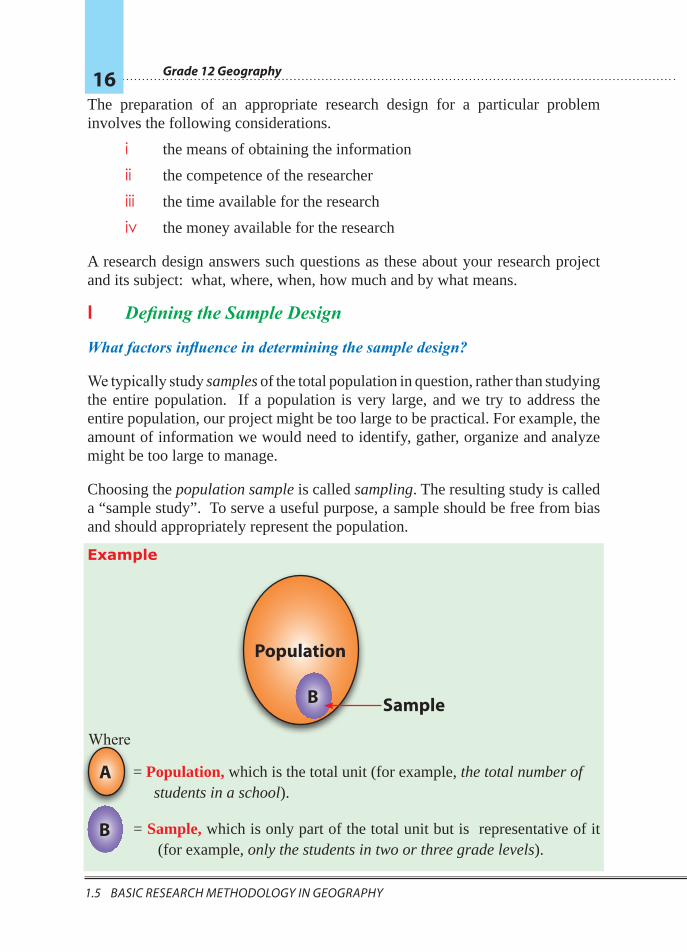
Choosing the population sample is called sampling. The resulting study is called a “sample study”. To serve a useful purpose, a sample should be free from bias and should appropriately represent the population.
Example
Population
B Sample
A = Population, which is the total unit (for example, the total number of students in a school).
B = Sample, which is only part of the total unit but is representative of it (for example, only the students in two or three grade levels).
Where
Unit 1: Basic ReseaRch MethodoloGies in GeoGRaphy 17
1.5 BaSIc ReSeaRch MeThOdOlOgy In geOgRaphy 1.5 BaSIc ReSeaRch MeThOdOlOgy In geOgRaphy
J Designing The Main Techniques for SamplingWhat are the basic techniques adopted in sampling?
There are two main sampling techniques: non-probability and probability.
i Non-Probability Sampling
F This approach is sometimes known as deliberate or purposive sampling.
F The items for the sample are selected deliberately by the researcher.
F The basis of such samplings is personal decision.
F There is always a danger of bias in such sampling.
ii Probability Sampling (also known as 'random sampling')
F This approach is often called chance or lottery sampling.
F Under this approach to sampling, every item of the population has an equal chance of being included (lottery method).
F Only chance determines whether an item is selected or not. Once an item is selected for the sample, it cannot appear again.
There are different types of probability sampling (Random sampling). You will learn about them when you reach the college level.
K Collecting and Organizing the Data
What is data? How do you collect it?
There are two types of data collection: primary and secondary.
i Primary Data Collection: This type of data collection is original in character. The research produces the data, rather than relying on existing data.
Note
The appropriate percentage or ratio of the size of a population sample to the entire population depends upon the variability of the population. If the population under study is homogeneous (similar) a small sample is sufficient. On the other hand, if the population is heterogeneous, a much larger size is necessary.
Grade 12 Geography 18
1.5 BaSIc ReSeaRch MeThOdOlOgy In geOgRaphy
There are several ways of collecting primary data. The important ones are based on
F The researcher's personal observations.
F Interviews conducted through telephone conversations and in person. F Questionnaires: A questionnaire consists of a number of questions printed or typed on a form or set of forms. The questionnaire is given to the respondents, who then fill it out by themselves. The questionnaire could be given to and collected from the respondents through the mail, by e-mail, or in person.
F discussion with groups of people.
F Primary data collection may also make use of schedules.
This approach is similar to the use of questionnaires but differs in one aspect. An assigned enumerator fills out the questionnaire. The enumerator schedules appointments with the respondents, meets with them in person, asks them the questions from the questionnaire, and records their answers.
ii Secondary Data Collection: This type of data collection investigates data that has already been collected, organized and arranged by someone else. Secondary data may be either published or unpublished:
F Published data include:
K publications by governments
K publications by NGOs K journals
K magazines and newspapers
K reports by universities, scholars, etc.
K historical records, etc.
F Unpublished data include:
K diaries
K letters
K unpublished biographies, etc.
L Analysis of the Data
Data analysis is an essential aspect of the scientific study of problems and discovering their solutions. This step involves the use of statistical techniques to measure relationships of the geographic variables defined in the hypothesis. The
Unit 1: Basic ReseaRch MethodoloGies in GeoGRaphy 19
1.5 BaSIc ReSeaRch MeThOdOlOgy In geOgRaphy 1.5 BaSIc ReSeaRch MeThOdOlOgy In geOgRaphy
important issue in this step is the selection of appropriate measuring techniques.
Different statistical techniques are employed in analyzing collected data. The statistical techniques vary, depending on the nature of the geographical research, the variables investigated, the ability of the researcher etc.
At this class level, you can use: i simple ratios and percentages
ii pie charts and compound graphs
iii measures of averages and raw-data variances
Processing research data with statistical techniques results in new discoveries or findings, followed by interpretations. Then, based on the findings, recommendations are made.
M Preparing the Research Report, Based on the FindingsThe research report is a major component of the study. Until the report is written or presented, no one can use the research results. The report must be clear and accurate.
Even if your hypothesis is brilliant, your research sampling and statistical technique accurate, and your results extremely important, they are of value only if your readers can understand and appreciate them.
To create a good report, you must prepare it carefully. A good report is the product of concentration, accuracy and the logical arrangement of your facts and ideas.
N Compiling the Bibliography /ReferencesCompiling a bibliography is the final step of your research project. A bibliography is a list of written materials relevant to the research study you have performed. It includes all books, documents, etc that you referred to as you prepared for and conducted your project.
Note
Be sure that your recommendations are realistic.
Grade 12 Geography 20
1.5 BaSIc ReSeaRch MeThOdOlOgy In geOgRaphy
Arrange the items in your bibliography alphabetically. Use these formats:
For Books and Pamphlets
1 Name of the author, last name first.2 Title, underlined or in italics 3 Place, publisher and date of publication4 Volume(s) number(s)
Example: Getas A, (2007), Introduction to Geography, 2nd edition, Mc Graw Hill, New york.
For Magazines and Newspapers
1 Name of the author, last name first2 Title of article, in quotation marks3 Name of the periodical, underlined to indicate the practice of italics
in printouts.4 Volume number 5 The date of the issue6 Page or page range
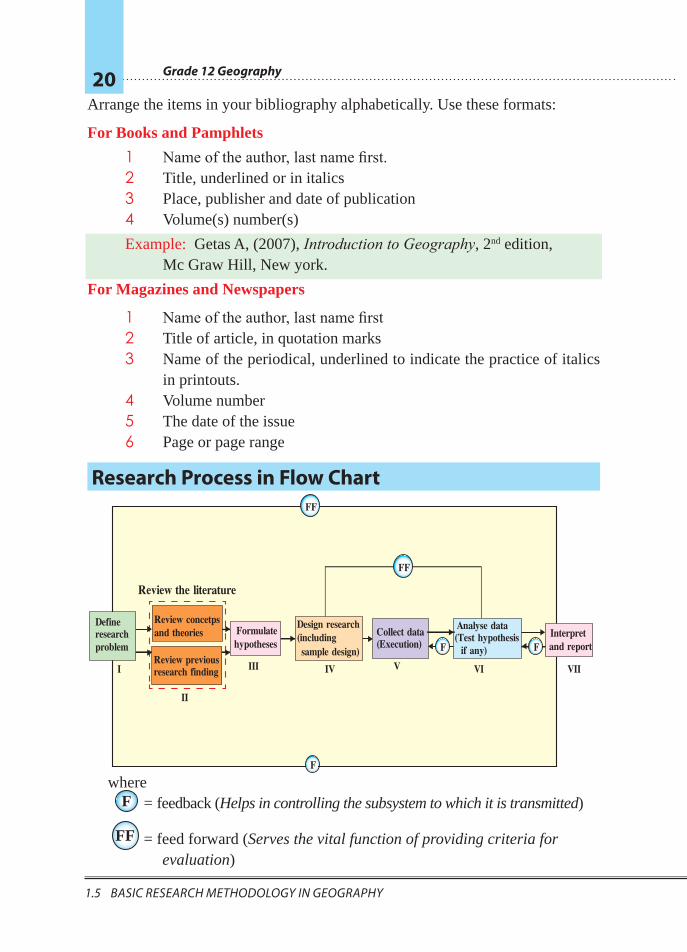
Research Process in Flow Chart
F
FF
where = feedback (Helps in controlling the subsystem to which it is transmitted)
= feed forward (Serves the vital function of providing criteria for evaluation)
Defineresearchproblem
Review concetpsand theories
Review previousresearch finding
Review the literature
I
II
III
Formulatehypotheses
IV
Design research(includingsample design)
Collect data(Execution)
V
Analyse data(Test hypothesis if any)
Interpretand report
VI VII
FF
FF
F
FF
Unit 1: Basic ReseaRch MethodoloGies in GeoGRaphy 21
1.5 BaSIc ReSeaRch MeThOdOlOgy In geOgRaphy 1.6 cOnducTIng acTIOn ReSeaRch
1.6 CONDUCTING ACTION RESEARCHAt the end of this section, you will be able to:
Þ conduct action research on selected problems.
Key Terms
³ Action research ³ Qualitative approach ³ Data collection
³ Sample size ³ Data analysis ³ Data interpreter
Please think of various problems that exist at your school. Then perform the following project.
Under subtopic 1.5, we saw the basic research methodology and elements of research work. Based on that, you will attempt to do a research project practically. It is advisable for you do this in groups.
Action research is an ongoing research process by which a particular real problem is identified, information/data are gathered, practical solutions are tested, conclusions and recommendations are reached and finally improvements are made.
The following are basic features of action research.
F It is based on reality. F It enables researchers to put ideas into action. F There is rapid feedback.
F It aims at improving situations, not at producing new knowledge. F It encourages reflections and further developments.
When we come to action research at this grade level, you are expected to exercise elementary research work activities since they are also engaged in studying other subjects. Here, the problems identified or selected should be very easy and accessible to the students' capacity, time and availability of sources. Hence, the following steps are thought to be helpful in conducting action research at this level.
Grade 12 Geography 22
1.6 cOnducTIng acTIOn ReSeaRch
Step 1: Selecting the Problem
In identifying or selecting the problem, this gives opportunities to select problems since a problem must come out from the researcher's mind like a fountain comes out from a mountain. The following points may be thoroughly considered in selecting a research problem:
F the problem selected should not be overdone
F it should not be a debatable issue
F it must be simple and clear so that it does not discourage the participants or the students involved in research-work
Example: Assume that the selected problem from the three proposed problems is “Low grade achievement of arts students in mathematics exams.”
Step 2: Objectives of the Study
The objective of the action research is to discover the reasons why art students are low achievers and finally find a solution to minimize the problem. This step or process is a very pertinent part that will lead to decide on the type and nature of data to be collected.
Step 3: Making Review of Literature
This process actually gives the students more ideas, clues and attempted solutions from previous work about how to minimize achievement of low grades in a given subject. Review literatures should be related to the selected problem that should be dealt with. The availability of a good library or previously done papers is very essential for this. Teachers should guide the students from where to get the required materials. If documents are not available in the school library, the teacher should visit affiliated offices and agencies to get information.
Step 4: Establishing Working Hypothesis
A hypothesis is often considered as the principal tool in research. Its main function is to put forward an assumption that can be verified by the research. In fact, many action research projects, establish hypotheses. However, it will be difficult for grade 12 students to conduct hypothesis formulating and testing processes. Both skills demand high competence and experience. It is because of this fact that the problem identified, "why most art students often achieve low grades in mathematics than science stream students", is forwarded for conducting action research at this level.

Unit 1: Basic ReseaRch MethodoloGies in GeoGRaphy 23
1.6 cOnducTIng acTIOn ReSeaRch 1.6 cOnducTIng acTIOn ReSeaRch
This action research makes use of the qualitative approach. The data collectable could be based on interviews and questionnaires. Sample questionnaire formats are suggested below.
Activity 1.3
Investigating and finding a solution why most art students are less competent than science students in mathematics.
Sample Questionnaire Format
Step 5: Determining the Sample Size
When research is done, taking a sample is essential. Determining your sample size can vary because all the students learning this topic at this grade level have different class size, different student combination of age, caliber, etc). Let us say that 20 % of the population under study will suffice as the sample size. If the class size is 100, twenty students are taken as the sample size. In order to avoid personal interest or making the sampling random, use a technique of lottery system.
Questionnaire format B (to be filled by mathematics teachers)
1 Name of the school ____________
2 Grade level _____ section _______ Academic year ____________
3 What percent of your
a arts-stream students are good in mathematics? _________
b science stream students are good in mathematics? _________
4 Which-stream is active when you teach? Arts or science ___________
5 Please give us your opinions about why art students are not as competent in mathematics as science students. _______________________________
Thank you,
Questionnaire format A (to be filled in by students)
1 Name of the school ________2 Grade level _____section ____
Academic year _______3 Average grade results in
grade 9 __________grade 10 __________grade 11 __________
4 Which subject do you like best? Mention only three of them.1 ___________2 ___________3 ___________
5 Are you good in mathematics (Yes or No) _______6 If your answer is no, give your
reasons __________________ ________________________
Thank you,
Grade 12 Geography 24
1.6 cOnducTIng acTIOn ReSeaRch
The selected 20 students represent the 100 students. All the information they give represents the whole class or section.
Step 6: Collecting the Required Data
Under this research work, the easiest way of collecting data from the selected sample size could be:
a either through personal interview or
b through questionnaires
The students should prepare questionnaires made up of items that attempt to get answers regarding why most arts students are relatively lower grade achievers in mathematics than most of science students.
Step 7: Analysis of the Data
In order to analyze the collected data, the teacher should help the students understand how to organize the data in a tabular or graphic form. From the table, the students can create:
a simple ratios/proportions
b bar graphs/line graphs
Step 8: Generalization and Interpretation
After applying simple ratios or graphs, the students can make comparisons and generalizations. They can prove that most science students are good in mathematics than arts students. After that, possible solutions could be gathered from the questionnaire and employ the solution to reduce the number of art students scoring low marks in mathematics.
Step 9: Preparation of the Report
It may be difficult to hear the report of every student. Students could be grouped as it was done at the very beginning. The students should bear in mind that their reports must include:
a a clear statement of the objective and the explanation of the method used to analyze the data,
b a summarized generalization of the discovery or finding obtained, and
c finally forward the possible solutions that could change the attitude of most arts students towards mathematics.
It is advisable that selected students read their report to the class, or if possible even at the flag ceremony.
Unit 1: Basic ReseaRch MethodoloGies in GeoGRaphy 25
unit Review1.6 cOnducTIng acTIOn ReSeaRch
Unit Review
Þ UNIT SUMMARY Þ Research is a scientific method of investigating answers for the problems
identified.
Þ Development in any country depends, among other things, upon its research capability.
Þ There are two basic approaches often used in geographical research works. They are quantitative and qualitative approaches. Their difference lie mainly in the attributes considered to be measured and the techniques chosen to be used.
Þ Geographical research works are different from the research work of other disciplines/sciences. They are very much concerned with spatial distributions and organizations of things and phenomena in time bound. They also consider the forces that results in determine the distributions.
Þ In the study and analysis of spatial aspects, geographical research procedures and techniques with other sciences. For example, identifying the research problem, defining the objective and significance of the research, reviewing literature related to the study, formulating a working hypothesis, etc.
Þ Finally, developing the skill of making action research to solve their problems.
Þ REVIEW EXERCISE FOR UNIT 1I Multiple Choices: Choose the best answer from the given alternatives for
the following statements and questions.
1 Which of the following geographical approaches is used for confirming a given theory?
A quantitative approach
B qualitative approach
C A and B
D descriptive approach
Grade 12 Geography 26
unit Review
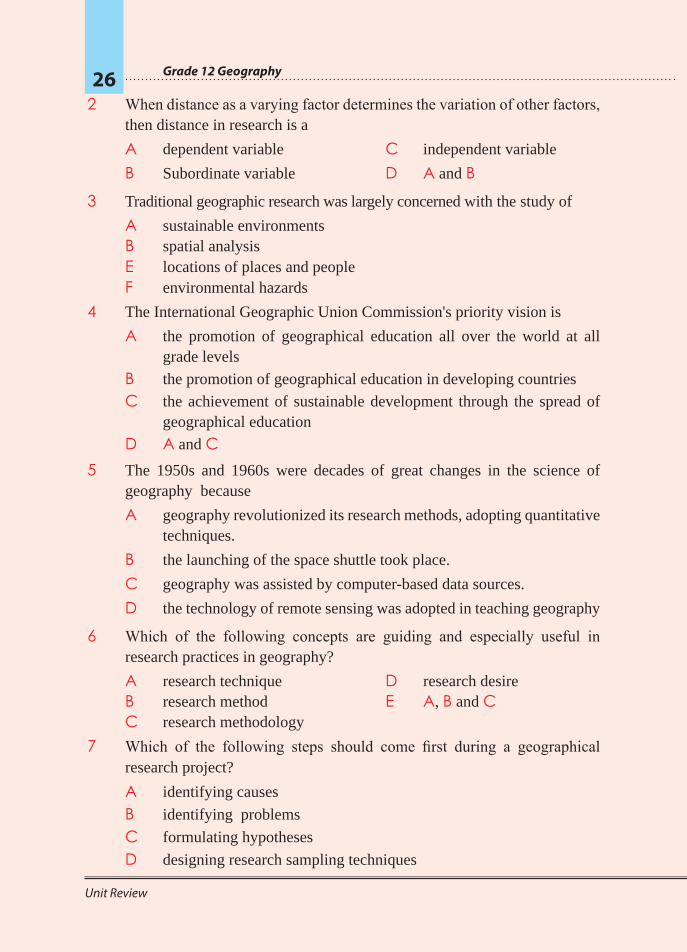
2 When distance as a varying factor determines the variation of other factors, then distance in research is a
A dependent variable
B Subordinate variable
C independent variable
D A and B
3 Traditional geographic research was largely concerned with the study of
A sustainable environmentsB spatial analysisE locations of places and peopleF environmental hazards
4 The International Geographic Union Commission's priority vision is
A the promotion of geographical education all over the world at all grade levels
B the promotion of geographical education in developing countries
C the achievement of sustainable development through the spread of geographical education
D A and C5 The 1950s and 1960s were decades of great changes in the science of
geography because
A geography revolutionized its research methods, adopting quantitative techniques.
B the launching of the space shuttle took place.
C geography was assisted by computer-based data sources.
D the technology of remote sensing was adopted in teaching geography
6 Which of the following concepts are guiding and especially useful in research practices in geography?
A research techniqueB research methodC research methodology
D research desireE A, B and C
7 Which of the following steps should come first during a geographical research project?
A identifying causes
B identifying problems
C formulating hypotheses
D designing research sampling techniques
Unit 1: Basic ReseaRch MethodoloGies in GeoGRaphy 27
unit Review
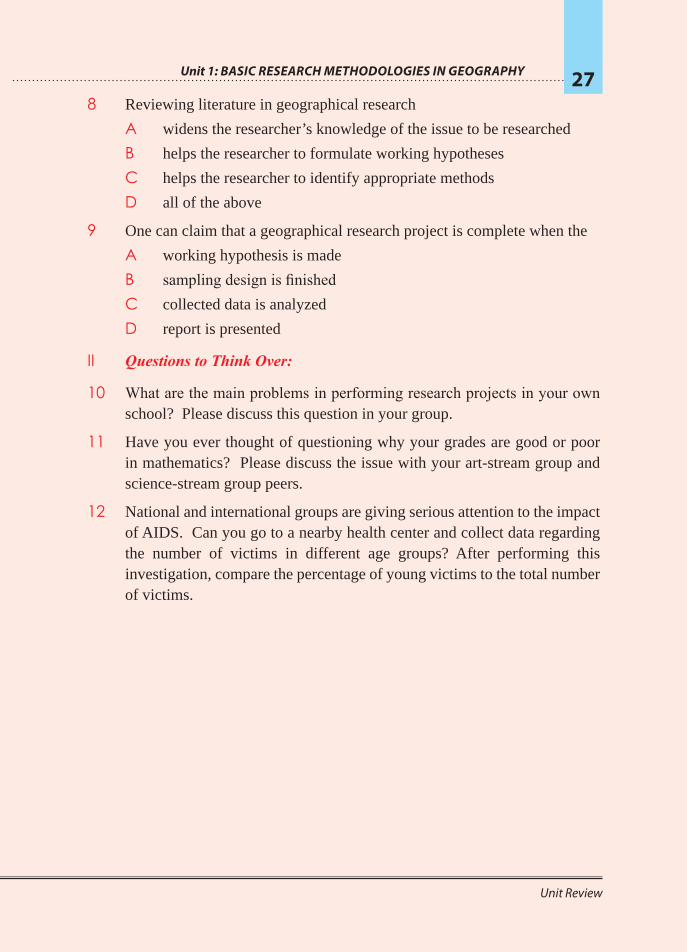
8 Reviewing literature in geographical research
A widens the researcher’s knowledge of the issue to be researched
B helps the researcher to formulate working hypotheses
C helps the researcher to identify appropriate methods
D all of the above
9 One can claim that a geographical research project is complete when the
A working hypothesis is made
B sampling design is finishedC collected data is analyzed
D report is presented
II Questions to Think Over:
10 What are the main problems in performing research projects in your own school? Please discuss this question in your group.
11 Have you ever thought of questioning why your grades are good or poor in mathematics? Please discuss the issue with your art-stream group and science-stream group peers.
12 National and international groups are giving serious attention to the impact of AIDS. Can you go to a nearby health center and collect data regarding the number of victims in different age groups? After performing this investigation, compare the percentage of young victims to the total number of victims.
Unit Outcomes
After completing this unit, you will be able to:
Þ Recognize meanings, uses, conventional signs and symbols and distribution of topographic maps;
Þ Distinguish the properties of globe and map;
Þ Analyze the meaning, significance, properties and classification of map projections;
Þ Acquire basic skills to draw sketch maps.
Main Contents
2.1 THE STUDY OF TOPOGRAPHIC MAPS2.2 GLOBE AND MAP 2.3 MAP PROJECTION2.4 DRAWING SKETCH MAP
F Unit Summary
F Review Exercise
Unit2MAP USE AND MAP WORK
Unit 2: Map Use and Map Work 29
Introduction
MAP USE AND MAP WORK
INTRODUCTIONHuman beings have kept track of locations and the directions to and from them since we first appeared on earth. As we began to move from place to place, looking for sources of water and other necessities and opportunities, we began to make simple maps. All good explorers made sketches or maps as they travelled to unknown places so that their followers could either trace them or continue to achieve the desired goal.
The roots of modern map-making lie in the 17th century. Three key developments contributed to modern map making. These developments were
F The revival of aspects of the ancient Greco-Roman civilizations during the Renaissance.
F The Age of Exploration and Discovery.
F The invention of the printing press.
The art, science and technology of map-making is called cartography. The technology of map making has its background in the times of the ancient Greeks and Romans. They recognized the spherical form of the earth and created maps in the form of globes. In this process, they developed map projection and the geographical grid system. This technology was lost to Europe during the Middle Ages.
After the Age of Exploration and Discovery (i.e., at the end of the fifteenth century) geographers and other people became more interested in locating places. This interest led to the development of maps. These map makers developed a technique based on inserting a light within a transparent globe of the earth. As you will learn later in this unit, the light casts shadows of the globe’s features on a flat surface, resulting in a map.
In this way, Europeans developed flat maps and substituted them for globes. In the 17th century, they developed the mathematical method of map making. They replaced cast shadows with mathematics as the basis of map making. With this method, they developed the concepts of parallels and meridians based on a standard set of parallel lines covering the whole globe.
In recent years, remote sensing technique has been applied for making accurate maps, monitoring the environment and conducting surveys. The need to store, process and retrieve the vast amounts of data generated by remote sensing resulted in the development of the Geographic Information System (GIS).
Grade 12 Geography 30
2.1 The STudy Of TOpOgraphIc MapS
In this unit, you will learn about: F topographic maps and other types of distribution maps.
F map projection and its various types in making maps.
You will also learn how to: F make a sketch map.
F locate and identify geographical elements on a sketch map.
Start-up Activity1 Do you know what topographic maps are?
2 What is the difference between topographic maps and other types of distribution maps?
2.1 THE STUDY OF TOPOGRAPHIC MAPSAt the end of this section, you will be able to:
Þ Define topographic maps; Þ Identify the uses of topographic maps; Þ Interpret conventional signs and symbols on topographic maps; Þ Realize the difference between qualitative and quantitative distribution
maps; Þ Translate different data into distribution maps using different diagrammatic
methods.
Key Terms
³ Topographic map
³ Signs and symbols
³ Thematic map
³ Chrochromatic map
³ Choroschematic map
³ Chroplet map
³ Isoplethic map
Although many disciplines use maps, maps have a special significance for
geographers. They are geographers’ primary tools for displaying and analyzing
spatial distributions, patterns and relations. Because these features cannot easily
be observed and interpreted in real landscapes, maps are essential to geographers.
Unit 2: Map Use and Map Work 31
2.1 The STudy Of TOpOgraphIc MapS 2.1 The STudy Of TOpOgraphIc MapS
2.1.1 Meaning and Uses of Topographic Maps
Meaning of Topographic MapsWhat is Topographic map?
Topography is a Greek word made up of “topos” and “graphy.” “Topos” means places, and “graphy” means writing or description. Therefore topography means the description or explanation of places.
Topographic maps are often known as topo sheets. Unlike other distribution maps, topographic maps, portray one or more natural and cultural features of an area. Simply, topographic maps are maps that show both human made and natural features. They can be used for various disciplines to make inferences.
Nature of Topographic Maps
A topographic map is:
F a map that portrays rivers, streams, drainage, vegetation, roads, buildings, land uses, etc.
F a detailed map that shows multiple natural and anthropogenic features;
F a large scale map drawn to show a relatively small area; therefore, called a scenery map, too;
F a map that uses definite symbols, known as conventional symbols.
Series of these maps are:
F numbered sequentially in this format: 1, 2, 3 … 9, 10 ….
F each presents an area of 1o latitude by 1o longitude
F each such sheet is thus 1/16 of the international sheet. These sheets are numbered
F These degree sheets are numbered sequentially in this format as A, B, C, etc.
F The degree sheets are again subdivided into half degree and quarter degree sheets. These sheets are also sequentially numbered in this format as /ANE, /ASE,/ANW and /ASW, …..

Grade 12 Geography 32
2.1 The STudy Of TOpOgraphIc MapS
1A 1B 1C 1D
Activity 2.1
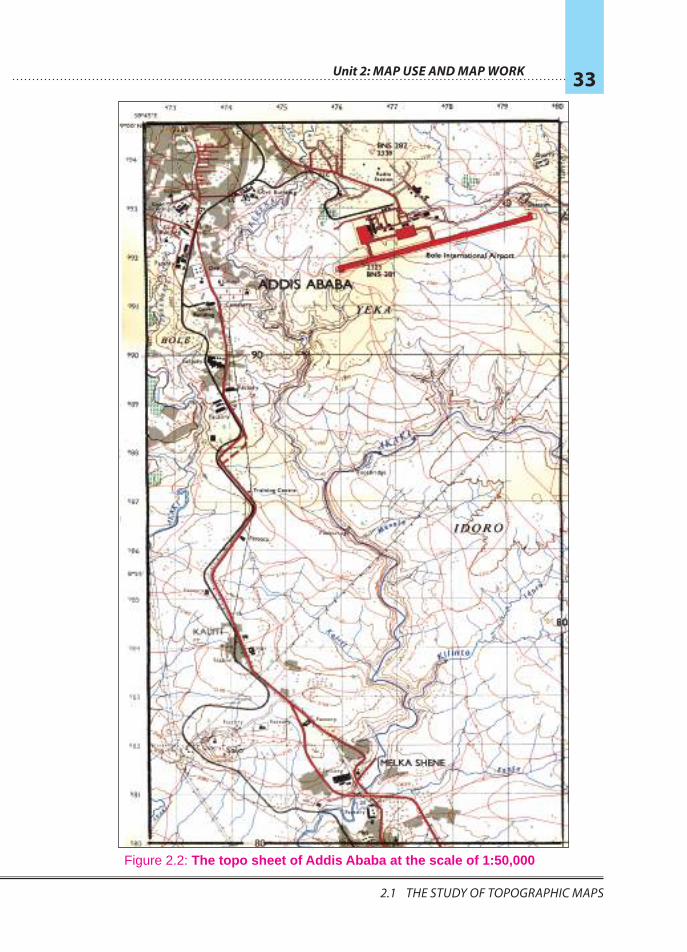
Looking at the topo sheet of Addis Ababa in the next page,
a identify the natural features shown on it.
b identify the built-up features on the map.
0 1° 2° 3° 4°
4°
3°
2°
1°
prIMe M
erIdIaN
eQuaTOr
Figure 2.1: Degree sheets
NW
SW SE
NE
Unit 2: Map Use and Map Work 33
2.1 The STudy Of TOpOgraphIc MapS 2.1 The STudy Of TOpOgraphIc MapS
Figure 2.2: The topo sheet of Addis Ababa at the scale of 1:50,000
Grade 12 Geography 34
2.1 The STudy Of TOpOgraphIc MapS
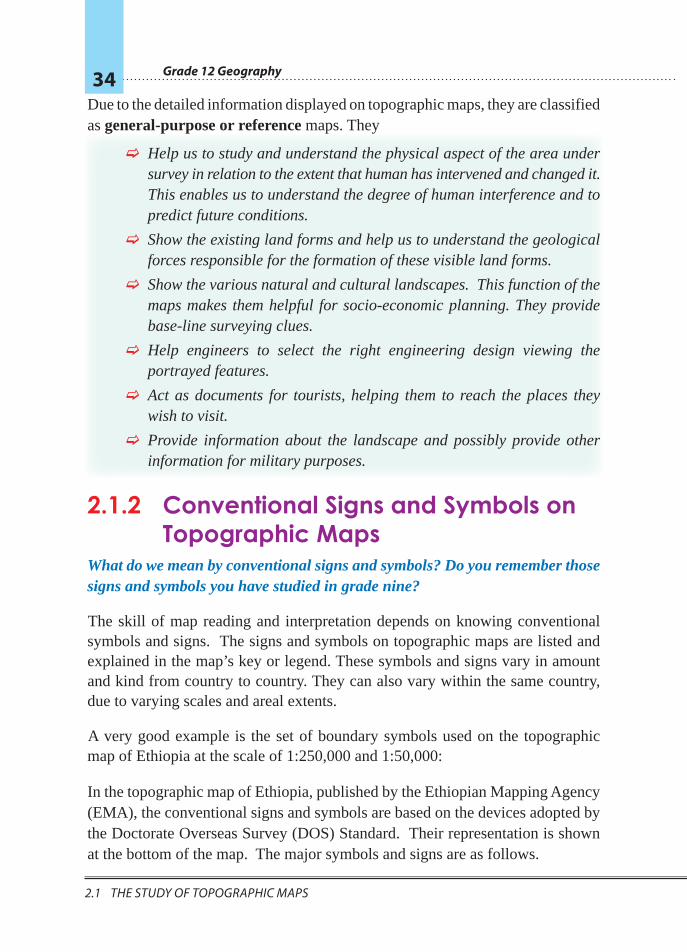
Due to the detailed information displayed on topographic maps, they are classified as general-purpose or reference maps. They
F Help us to study and understand the physical aspect of the area under survey in relation to the extent that human has intervened and changed it. This enables us to understand the degree of human interference and to predict future conditions.
F Show the existing land forms and help us to understand the geological forces responsible for the formation of these visible land forms.
F Show the various natural and cultural landscapes. This function of the maps makes them helpful for socio-economic planning. They provide base-line surveying clues.
F Help engineers to select the right engineering design viewing the portrayed features.
F Act as documents for tourists, helping them to reach the places they wish to visit.
F Provide information about the landscape and possibly provide other information for military purposes.
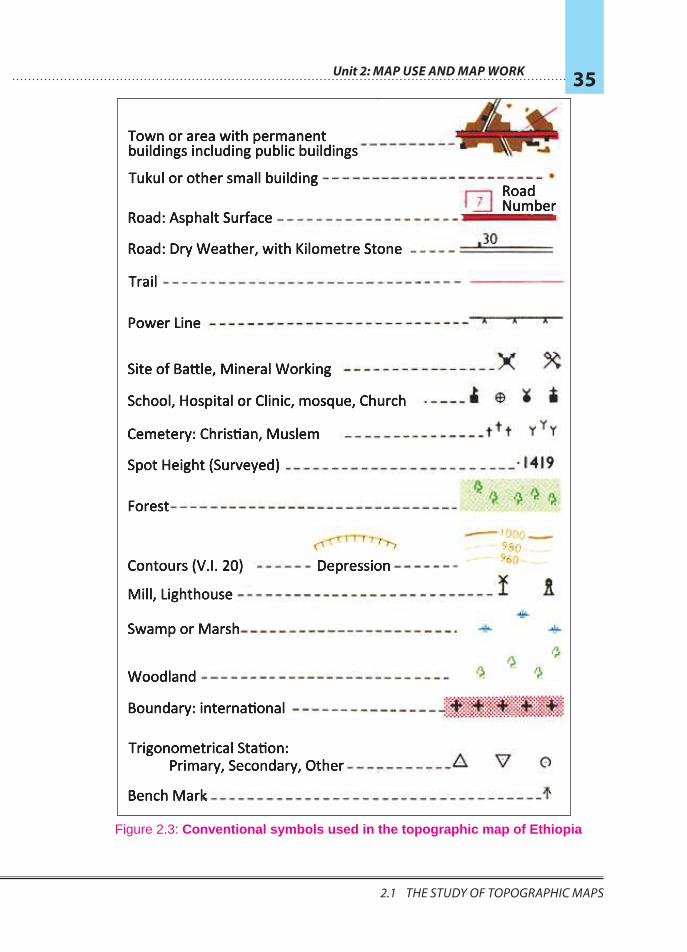
2.1.2 Conventional Signs and Symbols on Topographic Maps
What do we mean by conventional signs and symbols? Do you remember those signs and symbols you have studied in grade nine?
The skill of map reading and interpretation depends on knowing conventional symbols and signs. The signs and symbols on topographic maps are listed and explained in the map’s key or legend. These symbols and signs vary in amount and kind from country to country. They can also vary within the same country, due to varying scales and areal extents.
A very good example is the set of boundary symbols used on the topographic map of Ethiopia at the scale of 1:250,000 and 1:50,000:
In the topographic map of Ethiopia, published by the Ethiopian Mapping Agency (EMA), the conventional signs and symbols are based on the devices adopted by the Doctorate Overseas Survey (DOS) Standard. Their representation is shown at the bottom of the map. The major symbols and signs are as follows.
Unit 2: Map Use and Map Work 35
2.1 The STudy Of TOpOgraphIc MapS 2.1 The STudy Of TOpOgraphIc MapS
Cemetery: Christian, Muslem
Town or area with permanentbuildings including public buildings
Tukul or other small building
Road: Asphalt Surface
Road: Dry Weather, with Kilometre Stone
Trail
Power Line
Site of Battle, Mineral Working
School, Hospital or Clinic, mosque, Church
Spot Height (Surveyed)
Forest
Contours (V.I. 20) Depression
Mill, Lighthouse
Swamp or Marsh
Woodland
Boundary: international
Trigonometrical Station:
Bench Mark
Primary, Secondary, Other
RoadNumber
Figure 2.3: Conventional symbols used in the topographic map of Ethiopia
Grade 12 Geography 36
2.1 The STudy Of TOpOgraphIc MapS
Þ Exercise 2.11 Why do we say topographic maps are general purpose maps?
2 How did GIS promote the development of map-making?
3 Compare and contrast chorochromatic and choroschematic maps.
4 State the three historical events that promoted the development of map-making.
2.1.3 The Study of Distribution MapsWhat does distribtuion map mean? Does it differ from cadastral and navigational maps?
The Introduction to Grade 11’s geography textbook presented this concept. Try to recall what you learned about this in that text; or else refer back to the text now.
Maps are two-dimensional models of the surface of the earth. They portray the distribution of features, characters or phenomena. Many kinds of distribution maps are used world-wide. Nevertheless, we can group them into different classes based on their purposes.
In this section, you will learn about the maps in some of the categories, viz.:
 Reference or general-purpose maps
 Special-purpose or thematic maps
 Charts
Reference or General Purpose Maps
What are general purpose maps?
These maps are topographic maps that portray different features at the same time. They are made at a larger scale covering smaller areas to show details.
Thematic or Special-Purpose Maps
What are thematic maps?
These are distribution maps that emphasize the distribution of a single geographical element or character.
Unit 2: Map Use and Map Work 37
2.1 The STudy Of TOpOgraphIc MapS 2.1 The STudy Of TOpOgraphIc MapS
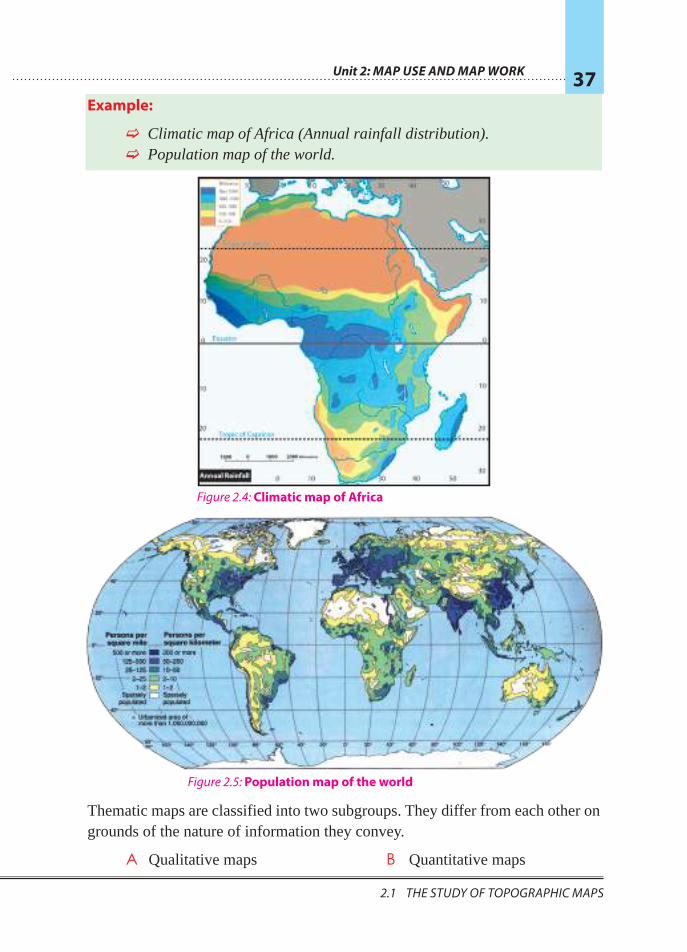
Example:
F Climatic map of Africa (Annual rainfall distribution). F Population map of the world.
Thematic maps are classified into two subgroups. They differ from each other on grounds of the nature of information they convey.
A Qualitative maps B Quantitative maps
figure 2.4: Climatic map of Africa
figure 2.5: Population map of the world
Grade 12 Geography 38
2.1 The STudy Of TOpOgraphIc MapS
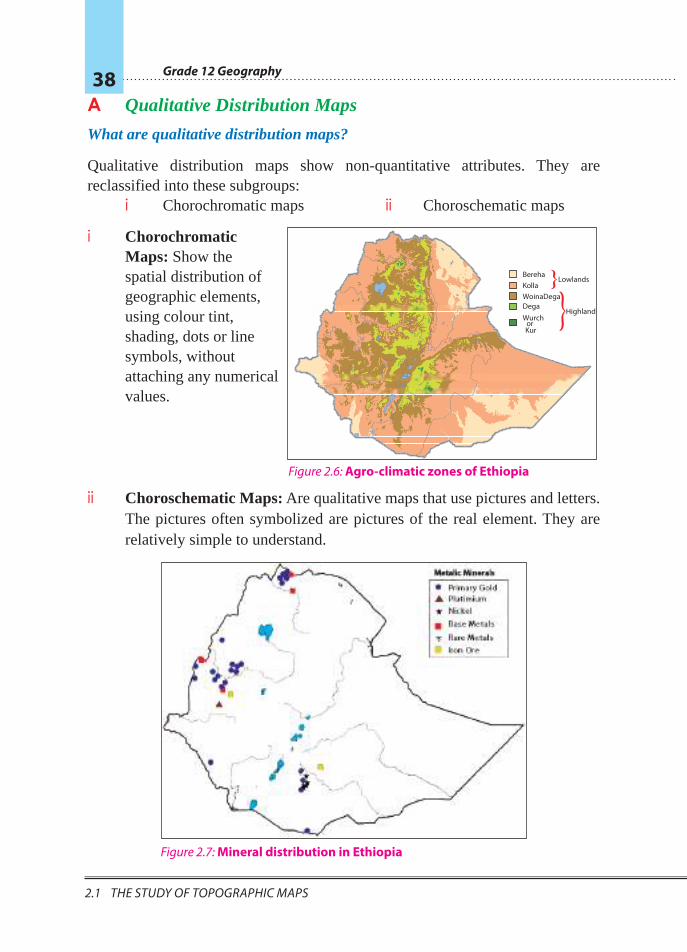
A Qualitative Distribution Maps
What are qualitative distribution maps?
Qualitative distribution maps show non-quantitative attributes. They are reclassified into these subgroups:
i Chorochromatic maps ii Choroschematic maps
i Chorochromatic Maps: Show the spatial distribution of geographic elements, using colour tint, shading, dots or line symbols, without attaching any numerical values.
ii Choroschematic Maps: Are qualitative maps that use pictures and letters. The pictures often symbolized are pictures of the real element. They are relatively simple to understand.
BerehaKolla WoinaDega
DegaWurch
orKur
Highlands
Lowlands
figure 2.6: Agro-climatic zones of Ethiopia
figure 2.7: Mineral distribution in Ethiopia

Unit 2: Map Use and Map Work 39
2.1 The STudy Of TOpOgraphIc MapS 2.1 The STudy Of TOpOgraphIc MapS
B Quantitative Distribution Maps
What are quantitative distribution maps?
As their name suggests, such maps display spatial distributions of geographical elements, representing quantitative values. The most commonly used distribution maps are:
i Dot maps
ii Choropleth maps
iii Isopleth maps
iv Graphs and diagrammatic maps
i Dot maps: In dot quantitative maps, each dot represents a given quantity or value. To create a clear and accurate dot map, you must
F place the dots accurately
F be sure there is enough space between the dots to distinguish them
F be sure all dots on the map are of the same size
Source: Woobeshet (2008).
ii Choroplethic maps: Sometimes they are called shaded maps. They display quantifiable features. Choroplethic maps are often used to show the distribution of average values such as population density, cropping intensity, etc. The type or intensity of the shading reflects variation in quantity.
● 50,000 cattle
figure 2.8: Cattle distribution in Ethiopia
Grade 12 Geography 40
2.1 The STudy Of TOpOgraphIc MapS
Source: Atlas of the Ethiopian Rural Economy
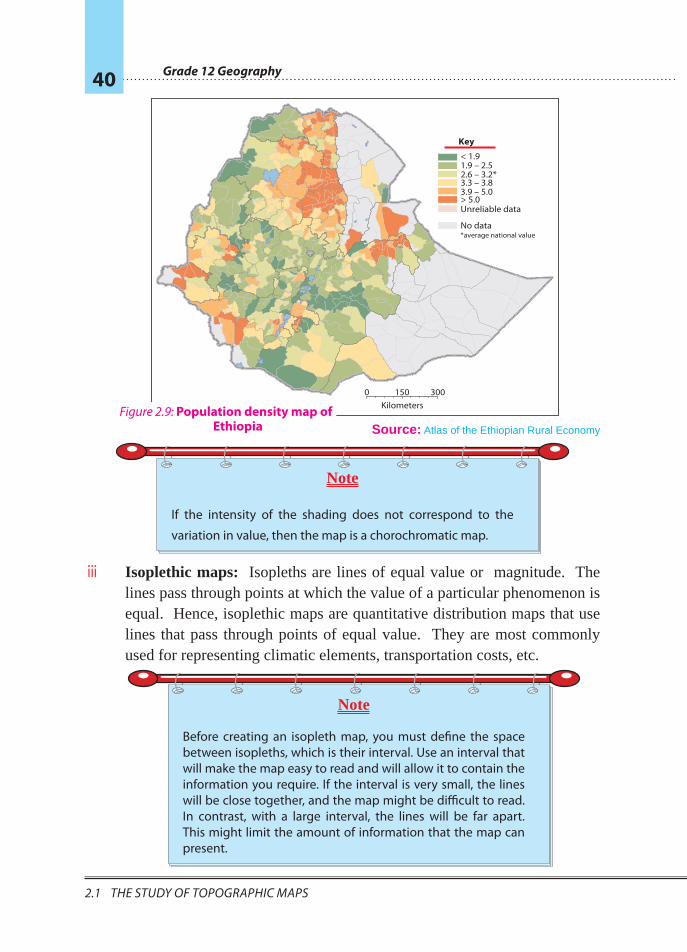
iii Isoplethic maps: Isopleths are lines of equal value or magnitude. The lines pass through points at which the value of a particular phenomenon is equal. Hence, isoplethic maps are quantitative distribution maps that use lines that pass through points of equal value. They are most commonly used for representing climatic elements, transportation costs, etc.
Kilometers 0 150 300
Key
< 1.91.9 – 2.52.6 – 3.2*3.3 – 3.83.9 – 5.0> 5.0Unreliable data
No data*average national value
figure 2.9: Population density map of Ethiopia
Note
If the intensity of the shading does not correspond to the
variation in value, then the map is a chorochromatic map.
Note
Before creating an isopleth map, you must define the space between isopleths, which is their interval. Use an interval that will make the map easy to read and will allow it to contain the information you require. If the interval is very small, the lines will be close together, and the map might be difficult to read. In contrast, with a large interval, the lines will be far apart. This might limit the amount of information that the map can present.

Unit 2: Map Use and Map Work 41
2.1 The STudy Of TOpOgraphIc MapS 2.1 The STudy Of TOpOgraphIc MapS
Example:
Isotherm maps are ones that show equal temperature points.Isobar maps are those that show equal pressure distribution.Isodapane maps are those that show equal transportation-cost distribution.Isohyet maps are those that show equal rainfall distribution.Isoneph maps are those that show equal cloud cover distribution.
Source: geography Students text grade 12 (2006)
iv Graphs and Diagrammatic Maps: These are often, used to show economic data, population data and other quantifiable distributions.
Graphs: The simplest and most widely used graphs are line graphs and bar graphs. They are used to show the relationship between two geographic variables in time and space series.
Both line graphs and bar graphs can use a single or double format. The format depends on the items to be shown.
25o C
25oC
20oC 14o C
20o C
25o C
30o C
20o C18o C
14oC
18oC
18o C
figure 2.10: Temperature distribution in Ethiopia
figure 2.11: Single-line graph figure 2.12: Double-line graph
Grade 12 Geography 42
2.1 The STudy Of TOpOgraphIc MapS
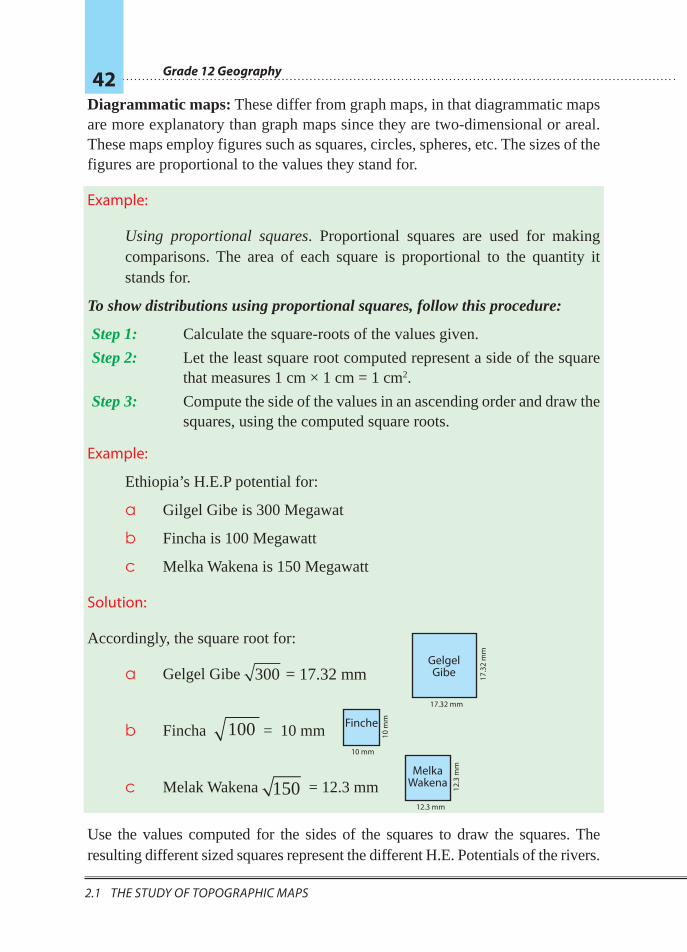
Diagrammatic maps: These differ from graph maps, in that diagrammatic maps are more explanatory than graph maps since they are two-dimensional or areal. These maps employ figures such as squares, circles, spheres, etc. The sizes of the figures are proportional to the values they stand for.
Example:
Using proportional squares. Proportional squares are used for making comparisons. The area of each square is proportional to the quantity it stands for.
To show distributions using proportional squares, follow this procedure:
Step 1: Calculate the square-roots of the values given.
Step 2: Let the least square root computed represent a side of the square that measures 1 cm × 1 cm = 1 cm2.
Step 3: Compute the side of the values in an ascending order and draw the squares, using the computed square roots.
Example:
Ethiopia’s H.E.P potential for:
a Gilgel Gibe is 300 Megawat
b Fincha is 100 Megawatt
c Melka Wakena is 150 Megawatt
Solution:
Accordingly, the square root for:
a Gelgel Gibe 300 = 17.32 mm
b Fincha 100 = 10 mm
c Melak Wakena 150 = 12.3 mm
Use the values computed for the sides of the squares to draw the squares. The resulting different sized squares represent the different H.E. Potentials of the rivers.
17.3
2 m
m
17.32 mm
Gelgel Gibe
12.3
mm
12.3 mm
Melka Wakena
10 m
m
10 mm
Finche
Unit 2: Map Use and Map Work 43
2.1 The STudy Of TOpOgraphIc MapS 2.1 The STudy Of TOpOgraphIc MapS
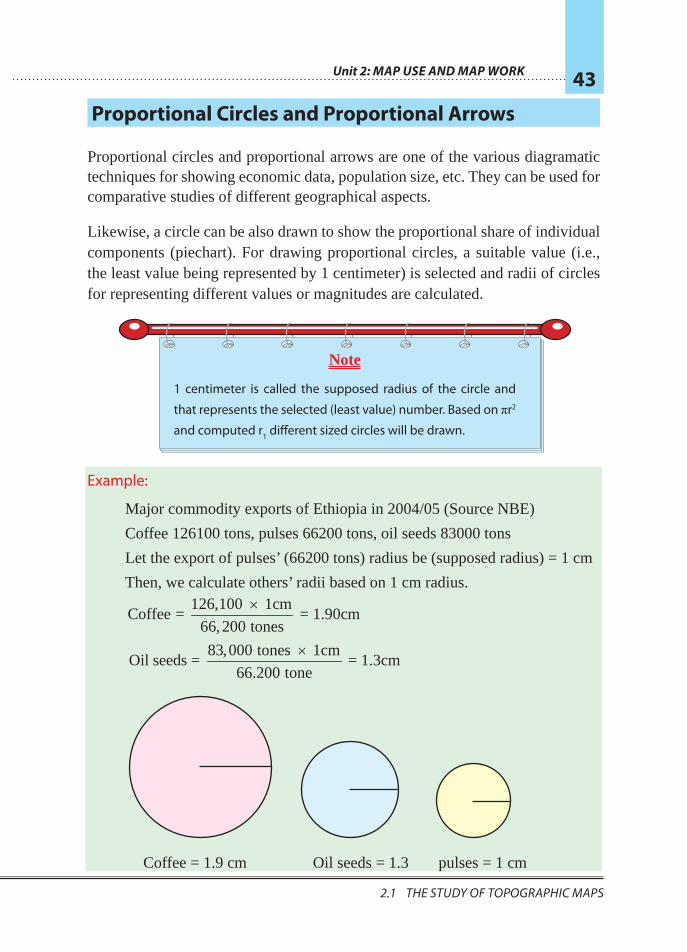
Proportional Circles and Proportional Arrows
Proportional circles and proportional arrows are one of the various diagramatic techniques for showing economic data, population size, etc. They can be used for comparative studies of different geographical aspects.
Likewise, a circle can be also drawn to show the proportional share of individual components (piechart). For drawing proportional circles, a suitable value (i.e., the least value being represented by 1 centimeter) is selected and radii of circles for representing different values or magnitudes are calculated.
Example:
Major commodity exports of Ethiopia in 2004/05 (Source NBE)
Coffee 126100 tons, pulses 66200 tons, oil seeds 83000 tons
Let the export of pulses’ (66200 tons) radius be (supposed radius) = 1 cm
Then, we calculate others’ radii based on 1 cm radius.
Coffee = 1.9 cm Oil seeds = 1.3 pulses = 1 cm
Note
1 centimeter is called the supposed radius of the circle and
that represents the selected (least value) number. Based on πr2
and computed r1 different sized circles will be drawn.
126,100 1cmCoffee = = 1.90cm
66,200 tones
×
83,000 tones 1cmOil seeds = = 1.3cm
66.200 tone
×
Grade 12 Geography 44
2.2 glObe aNd Map
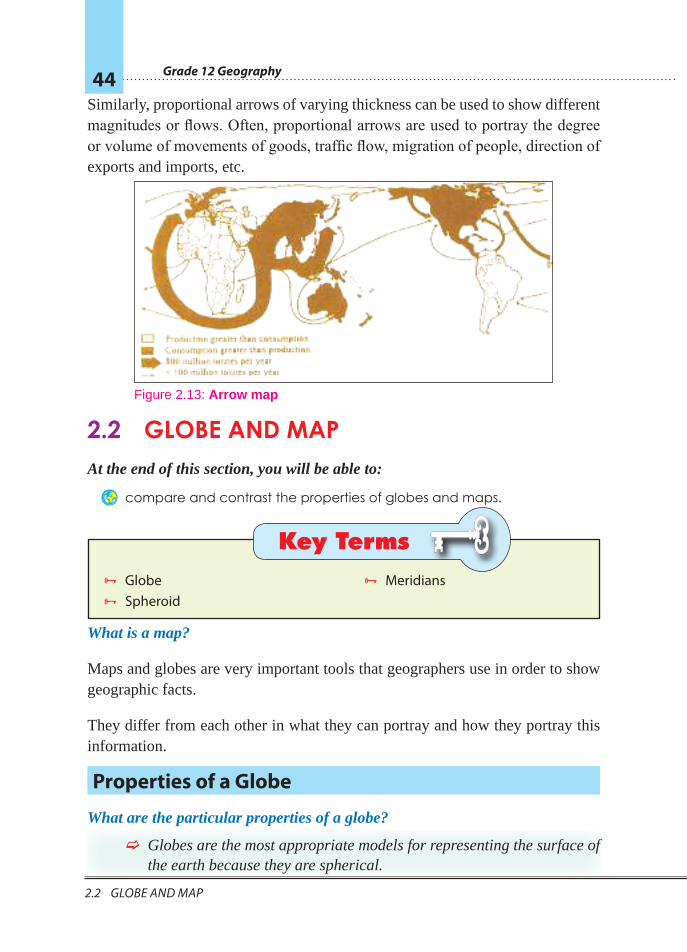
Similarly, proportional arrows of varying thickness can be used to show different magnitudes or flows. Often, proportional arrows are used to portray the degree or volume of movements of goods, traffic flow, migration of people, direction of exports and imports, etc.
2.2 GLOBE AND MAPAt the end of this section, you will be able to:
Þ compare and contrast the properties of globes and maps.
Key Terms ³ Globe ³ Spheroid
³ Meridians
What is a map?
Maps and globes are very important tools that geographers use in order to show geographic facts.
They differ from each other in what they can portray and how they portray this information.
Properties of a Globe
What are the particular properties of a globe?
F Globes are the most appropriate models for representing the surface of the earth because they are spherical.
Figure 2.13: Arrow map
Unit 2: Map Use and Map Work 45
2.2 glObe aNd Map 2.2 glObe aNd Map
F The scale on the surface of a globe is identical over all of its surface.
F All meridians and parallels on a globe intersect at right angles.
F All meridians converge at the poles.
F All parallels are parallel to the equator and to each other.
F Parallels decrease in length as they approach the poles.
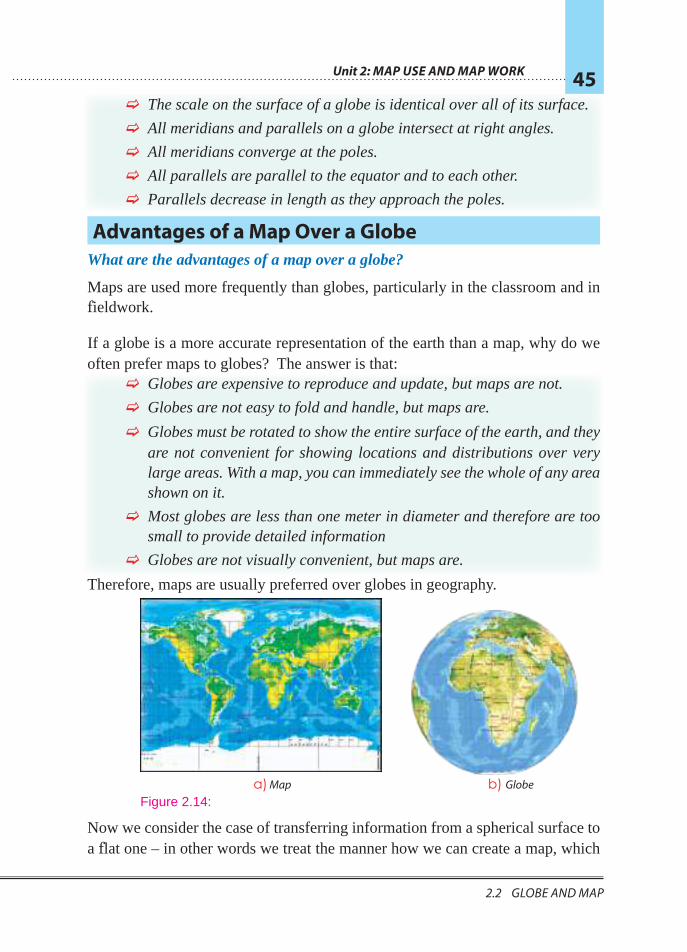
Advantages of a Map Over a GlobeWhat are the advantages of a map over a globe?
Maps are used more frequently than globes, particularly in the classroom and in fieldwork.
If a globe is a more accurate representation of the earth than a map, why do we often prefer maps to globes? The answer is that:
F Globes are expensive to reproduce and update, but maps are not.
F Globes are not easy to fold and handle, but maps are.
F Globes must be rotated to show the entire surface of the earth, and they are not convenient for showing locations and distributions over very large areas. With a map, you can immediately see the whole of any area shown on it.
F Most globes are less than one meter in diameter and therefore are too small to provide detailed information
F Globes are not visually convenient, but maps are.
Therefore, maps are usually preferred over globes in geography.
Now we consider the case of transferring information from a spherical surface to a flat one – in other words we treat the manner how we can create a map, which
a) Map b) globeFigure 2.14:

Grade 12 Geography 46
2.2 glObe aNd Map
is two-dimensional, from the surface of the earth, which is spherical. We use a remedial device, map projection.
Activity 2.2 1 Prepare a globe and a map and present it on the table for discussion
2 By looking at these tools, attempt to characterize each item. And then identify the draw-backs for each tool.
Þ Exercise 2.2 I Choose the best answer among the given alternatives
1 Which of the following types of map is appropriate for showing settlement, drainage, roads and land use distribution on a single map?
A Thematic map
B Topographic map
C Cadastral map
D Navigation map 2 Which of the following truly expresses the nature of topographic maps?
A They are small-scale maps.
B They can be drawn at varying scales.
C The symbols and signs used in all topo-maps are consistent.
D A and B.3 In a thematic distribution map
A only one geographic element is portrayed.
B settlements and graticules are shown.
C a number of features can be shown very neatly.D Both human made and natural features are shown clearly.
II Short Answers
1 Enumerate the differences between topographic and thematic maps.2 What are the advantages of maps over globes?
3 List the marginal information in the topo sheet of Addis Ababa that uses the scale of 1:50,000.
4 What precautions must the map-maker of these types of maps observe?
a Dot map
b Isoplethic map
Unit 2: Map Use and Map Work 47
2.2 glObe aNd Map 2.3 Map prOjecTION
2.3 MAP PROJECTIONAt the end of this section, you will be able to:
Þ define map projection;
Þ discuss the significance of map projection;
Þ identify the properties of map projection; and
Þ demonstrate cylindrical, conical and zenithal map projections.
Key Terms
³ Map projection ³ Homolographic ³ Orthomorphic ³ Azimuthal
³ Cylinderical ³ Equal-Area ³ Conformal ³ Equidistant
³ Zenithal ³ Conical ³ Polyconic
2.3.1 Meaning and Significance of Map Projection
What does map projection mean? What is its significance?
We are quite sure that you can define what a map is and tell what its significance is.
Meaning of map projection: Map projection is a technique that cartographers use to transfer information from a globe to a flat surface in order to create a map.
Cartographers developed map projection as they tried to solve the problems that globes presented. The end result of their efforts was to produce an alternative tool – the map.
Depicting various types of data on a map is the chief objective of a cartographer. This demands the establishment of basic information (like grid references, boundaries, etc.) on the required map. The acquiring of this basic information in turn demands map projection. In this way, map projection becomes very significant so that data and other geographic elements will be depicted in their appropriate place.
Grade 12 Geography 48
2.3 Map prOjecTION
2.3.2 Properties of Map ProjectionIs map projection a perfect technique of transferring all the information portrayed on a spherical surface onto a plane surface?
No type of map projection is free of distortion. Because cartographers must make choices when they decide to pick a projection, they begin by asking themselves questions like the ones just below:
The task of representing a spherical surface on a plane surface is complicated. There is no way to preserve accuracy. This is because there is no way to cut up the surface of a globe that would allow it to lie flat on a piece of paper. The spherical surface would tear if you tried to spread it out onto a perfectly flat surface.
Therefore, transferring the graphics on the surface of a globe to a flat surface always results in distortion in the graphics. Distortions in one or more of the following properties always occur.
F area F shape
F distance F direction (angle)
If you maintain the accuracy of one of these features, some or all of the others will be distorted. Therefore, there is no projection type that provides an absolutely perfect representation of the earth on a flat surface.
A surface, such as that of the earth, that cannot be converted into a flat surface without distortion is called an undevelopable surface.
Here are some commonly used types of projections. Each maintains accuracy in one of the features by sacrificing accuracy in others.
F homolographic projections maintain accuracy of true area.
F orthomorphic projections maintain accuracy of true area.
F azimuthal projections maintain accuracy of direction.
Considering the information that I want to present on my map,
F what property do I want to preserve?
F what properties are less important?
Then choose from among the properties listed earlier: i.e, area, shape, distance, direction (angle).
Unit 2: Map Use and Map Work 49
2.3 Map prOjecTION 2.3 Map prOjecTION
2.3.3 Geometrical Map ProjectionWhat does the term geometrical map projection mean? Does it have relationships with the geometrical figures?
As you know, map projection is a device of representing a sphere surface on a flat and plane surface. This involves a difficult task since the spherical surface the globe-cannot be cut and opened into a perfectly flat surface. However, there are some geometrical surfaces that can cover the globe partially and they can be cut open into flat surfaces. By covering a globe of glass (that illuminates from inside) with such a surface (developable surface), the shadows of parallels and meridians can be traced onto the paper and then be open into a plane surface.
When creating projections by casting shadows onto a developable surface, we capture the pattern of the shadows on the surface and then flatten the surface.
Here are some commonly used projections that are based on the shape of the developable surface. Some of them have sub-categories.
 cylindrical
 conic (cone)
 planar (plane) – also known as azimuthal
I Cylindrical Projections:
What do you mean by cylindrical Projection? Where does the cylinder tangent the globe?
Have you seen balls kept in a cylinder? The cylinder tangents the balls at both sides. A very simple example is the keeping of table tennis balls in their cylindrical package.
Cylindrical projection are obtained with the help of a cylindrical developable surface. The cylinder, which is wrapped around the globe tangent to the cylinder, is tall enough to parallel both sides of the equator.
After the data have been captured on its surface, the cylinder is removed from around the globe, and is cut open and flattened to create a rectangular plane surface.
Cylindrical projections are best suited for the projection of tropical regions since deformities increase polewards.
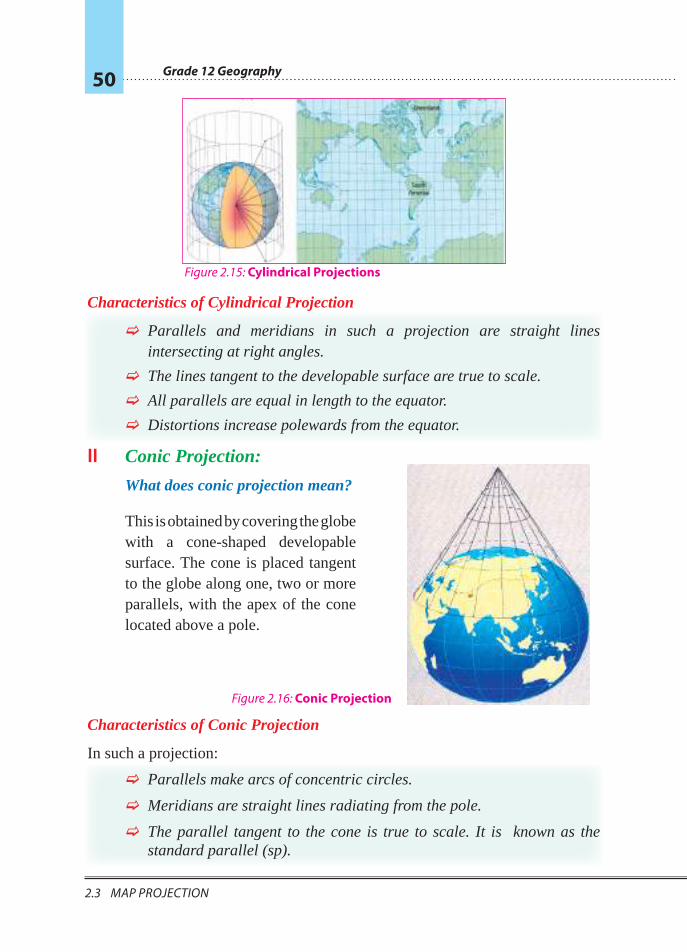
Grade 12 Geography 50
2.3 Map prOjecTION
Characteristics of Cylindrical Projection
F Parallels and meridians in such a projection are straight lines intersecting at right angles.
F The lines tangent to the developable surface are true to scale.
F All parallels are equal in length to the equator.
F Distortions increase polewards from the equator.
II Conic Projection:
What does conic projection mean?
This is obtained by covering the globe with a cone-shaped developable surface. The cone is placed tangent to the globe along one, two or more parallels, with the apex of the cone located above a pole.
Characteristics of Conic Projection
In such a projection:
F Parallels make arcs of concentric circles.
F Meridians are straight lines radiating from the pole.
F The parallel tangent to the cone is true to scale. It is known as the standard parallel (sp).
figure 2.15: Cylindrical Projections
Earth projected on conefigure 2.16: Conic Projection
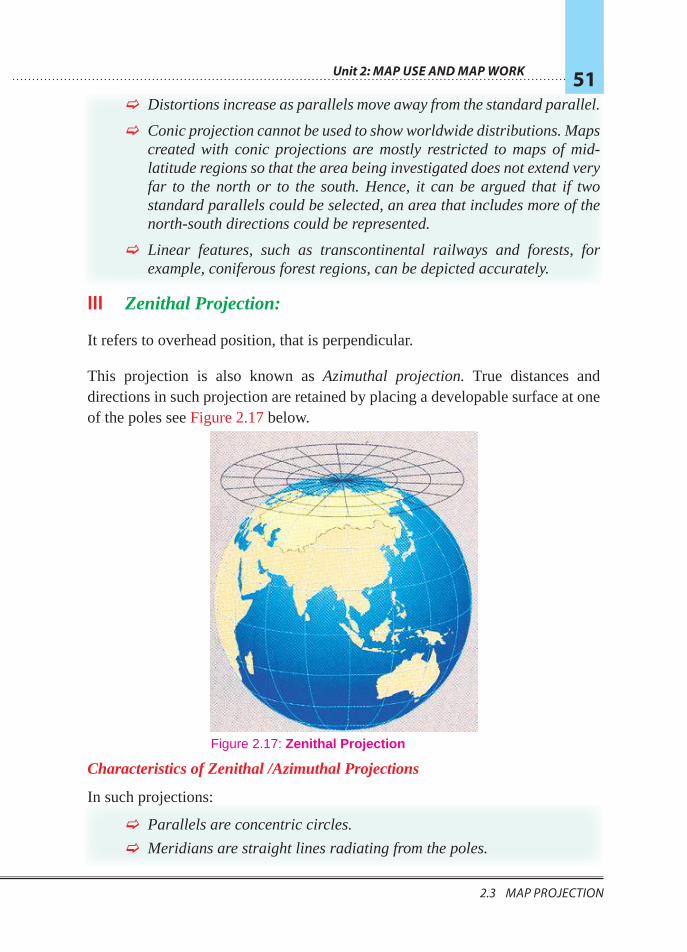
Unit 2: Map Use and Map Work 51
2.3 Map prOjecTION 2.3 Map prOjecTION
F Distortions increase as parallels move away from the standard parallel.
F Conic projection cannot be used to show worldwide distributions. Maps created with conic projections are mostly restricted to maps of mid-latitude regions so that the area being investigated does not extend very far to the north or to the south. Hence, it can be argued that if two standard parallels could be selected, an area that includes more of the north-south directions could be represented.
F Linear features, such as transcontinental railways and forests, for example, coniferous forest regions, can be depicted accurately.
III Zenithal Projection:
It refers to overhead position, that is perpendicular.
This projection is also known as Azimuthal projection. True distances and directions in such projection are retained by placing a developable surface at one of the poles see Figure 2.17 below.
thal Projectio
Characteristics of Zenithal /Azimuthal Projections
In such projections:
F Parallels are concentric circles.
F Meridians are straight lines radiating from the poles.
Earth projected on azimuth (point))Figure 2.17: Zenithal Projection

Grade 12 Geography 52
2.4 drawINg SkeTch Map
What is more:
F Planar projections produce circular maps.
F Planar projections are very much suited to maps of polar landmasses (high latitude regions).
Activity 2.3In your group, work out what the following instructions ask you to do in the form of discussion:
1 Compare and contrast globes and maps.
2 Describe geometrical projection.
2.4 DRAWING SKETCH MAP At the end of this section, you will be able to:
Þ define what a sketch map is; Þ explain the purpose of drawing sketch maps; Þ discuss the guidelines for making good sketch maps; and Þ draw a sketch map of a given area.
Key Terms
³ Sketch map
³ Landscape
³ Boundary
³ Location
³ Route
2.4.1 The Meaning and Purpose of Sketch Maps
What are the basic differences between a sketch map and a conventional map?
A sketch map is a freehand drawing that attempts to simulate real features. It is an important tool in fieldwork.

Unit 2: Map Use and Map Work 53
2.4 drawINg SkeTch Map 2.4 drawINg SkeTch Map
The main purpose of a sketch map is to retain required features in field observation with their relative locations and sizes.
We use a sketch map for its following characteristics:
F It can be drawn quickly.
F It is a guideline.
F It is easily recognizable.
F It provides skills for roughly showing or recording landscapes.
We do not use a sketch map if its following drawbacks become significantly disadvantageous to our goals:
F It does not have scale.
F It is crude.
F It can be both misleading and clumsy.
2.4.2 Basic Guidelines for Making Good Sketch Maps
What is the first step employed in the making of a good sketch map?
Sketch maps allow geographers to record information very quickly as they prepare for complex tasks. They use many types of sketch maps, including maps that show location, route and landscape.
Here are guidelines for creating good sketch maps.
F Choose an area to sketch that will be manageable for you as you create the sketch map and that will be easy for you and others to understand when the map is complete.
F Select the important frames of reference for the area.
F Create a complete mental picture of the sketch map that you will make. As you plan the map, remember the features that you want and interest you, for instance, such features as:
K appear in proportion to the map as a whole and to each other
K correct placement so that locations could be recognizable in relation to:
3 each other,
3 the map’s boundary,
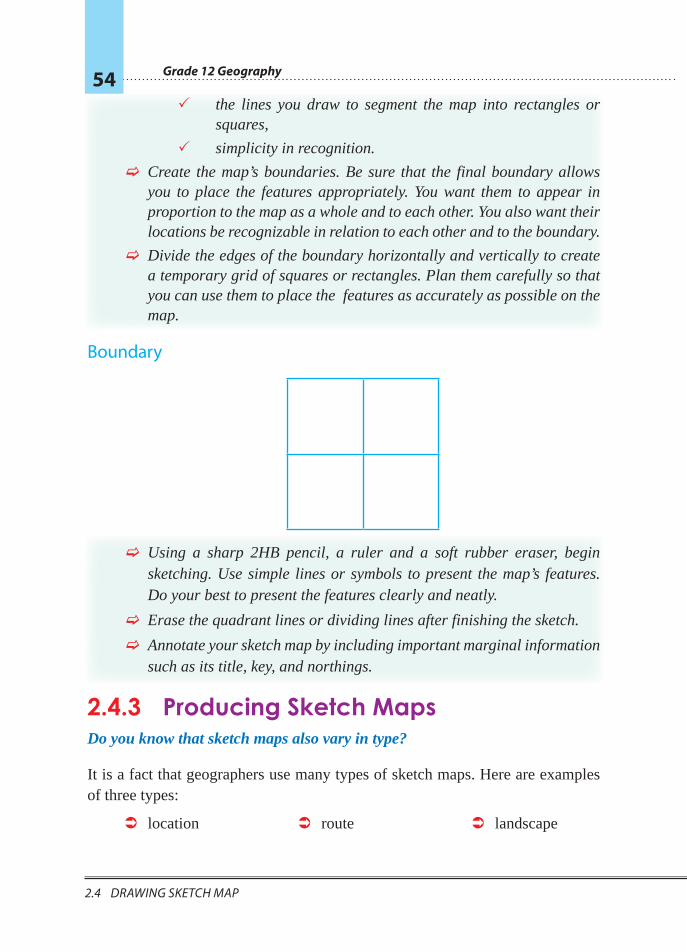
Grade 12 Geography 54
2.4 drawINg SkeTch Map
3 the lines you draw to segment the map into rectangles or squares,
3 simplicity in recognition.
F Create the map’s boundaries. Be sure that the final boundary allows you to place the features appropriately. You want them to appear in proportion to the map as a whole and to each other. You also want their locations be recognizable in relation to each other and to the boundary.
F Divide the edges of the boundary horizontally and vertically to create a temporary grid of squares or rectangles. Plan them carefully so that you can use them to place the features as accurately as possible on the map.
Boundary
F Using a sharp 2HB pencil, a ruler and a soft rubber eraser, begin sketching. Use simple lines or symbols to present the map’s features. Do your best to present the features clearly and neatly.
F Erase the quadrant lines or dividing lines after finishing the sketch.
F Annotate your sketch map by including important marginal information such as its title, key, and northings.
2.4.3 Producing Sketch Maps Do you know that sketch maps also vary in type?
It is a fact that geographers use many types of sketch maps. Here are examples of three types:
 location  route  landscape
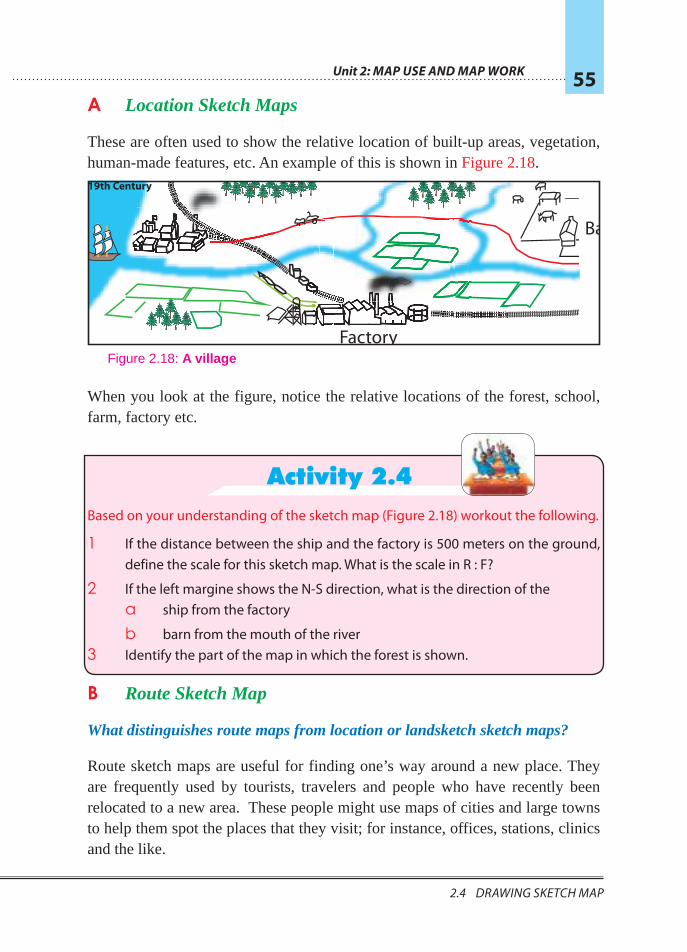
Unit 2: Map Use and Map Work 55
2.4 drawINg SkeTch Map 2.4 drawINg SkeTch Map
A Location Sketch Maps
These are often used to show the relative location of built-up areas, vegetation, human-made features, etc. An example of this is shown in Figure 2.18.
When you look at the figure, notice the relative locations of the forest, school, farm, factory etc.
Activity 2.4Based on your understanding of the sketch map (Figure 2.18) workout the following.
1 If the distance between the ship and the factory is 500 meters on the ground, define the scale for this sketch map. What is the scale in R : F?
2 If the left margine shows the N-S direction, what is the direction of the a ship from the factory
b barn from the mouth of the river3 Identify the part of the map in which the forest is shown.
B Route Sketch Map
What distinguishes route maps from location or landsketch sketch maps?
Route sketch maps are useful for finding one’s way around a new place. They are frequently used by tourists, travelers and people who have recently been relocated to a new area. These people might use maps of cities and large towns to help them spot the places that they visit; for instance, offices, stations, clinics and the like.
Figure 2.18: A village
19th Century
Factory
Barn
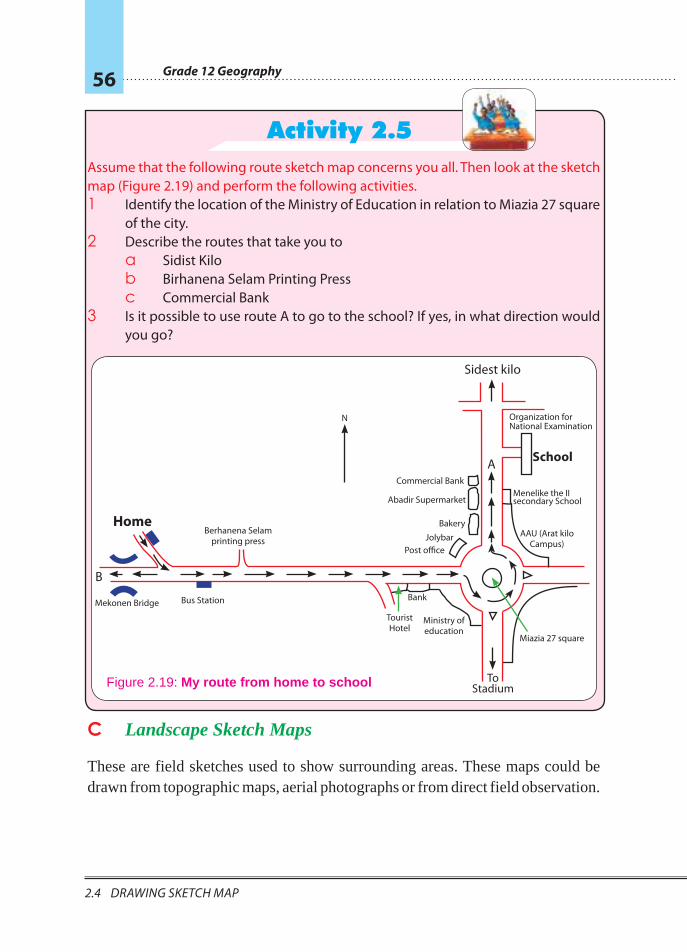
Grade 12 Geography 56
2.4 drawINg SkeTch Map
Activity 2.5Assume that the following route sketch map concerns you all. Then look at the sketch map (Figure 2.19) and perform the following activities.1 Identify the location of the Ministry of Education in relation to Miazia 27 square
of the city. 2 Describe the routes that take you to
a Sidist Kilob Birhanena Selam Printing Pressc Commercial Bank
3 Is it possible to use route A to go to the school? If yes, in what direction would you go?
C Landscape Sketch Maps
These are field sketches used to show surrounding areas. These maps could be drawn from topographic maps, aerial photographs or from direct field observation.
Sidest kilo
A
B
School
Menelike the II secondary School
AAU (Arat kilo Campus)
Ministry of education
Berhanena Selam printing press
Bus StationMekonen Bridge
Home
Tourist Hotel
Bank
Miazia 27 square
To Stadium
Organization for National Examination
Commercial Bank
Abadir Supermarket
Bakery
JolybarPost office
N
Figure 2.19: My route from home to school
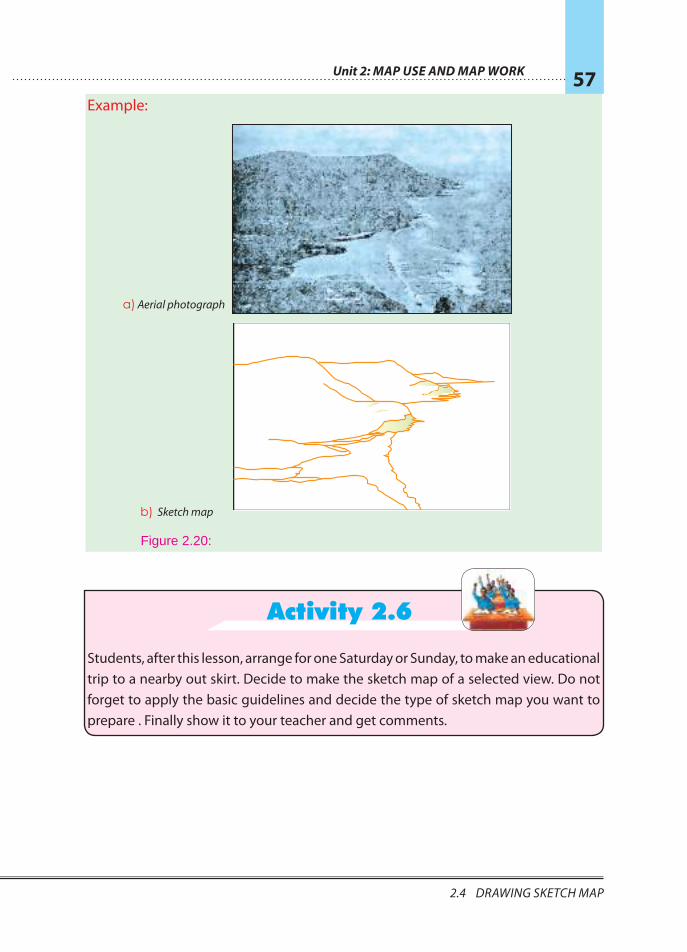
Unit 2: Map Use and Map Work 57
2.4 drawINg SkeTch Map 2.4 drawINg SkeTch Map
Example:
a) aerial photograph
b) Sketch map
Activity 2.6
Students, after this lesson, arrange for one Saturday or Sunday, to make an educational trip to a nearby out skirt. Decide to make the sketch map of a selected view. Do not forget to apply the basic guidelines and decide the type of sketch map you want to prepare . Finally show it to your teacher and get comments.
Figure 2.20:
Grade 12 Geography 58
unit review
Unit Review
Þ UNIT SUMMARY Þ Based on their purpose, maps are classified into topographic and thematic
maps Þ Topographic maps are detail maps as well as general purpose maps. They
show both natural and human-made features. Because of this, they are used as inferences.
Þ In order to understand and interoperate topographic maps, it is necessary to know the conventional signs and symbols used on topographic maps.
Þ Unlike topographic maps, thematic maps show only one geographic element at a time. Hence, they cannot be used as inferences.
Þ Thematic maps are again reclassified or subdivided into qualitative and quantitative distribution maps. Qualitative distribution maps show non-qualitative attributes, while the quantitative distribution maps show geographical elements representing quantities.
Þ Qualitative distribution maps use colors, shades, symbols and letters to show distribution.
Þ Quantitative distribution maps use colors, shades, symbols and letters to show distribution.
Þ Quantitative distribution maps use graphs, dots and proportional figures to show distributions.
Þ REVIEW EXERCISE FOR UNIT 2 I Choose the best answer among the suggested alternatives.
1 Topographic maps are described as scenery maps, because they:
A are written in block letters B show detail information
C show the whole parts of the earth
D are true to scale
Unit 2: Map Use and Map Work 59
unit review
2 Thematic maps are different from topographic maps. Their differences lie in
A purpose
B scale
C areal coverage
D all of the above
3 Which standard colour is wrongly associated?
A brown-relief
B blue-water bodies
C green-vegetation cover
D yellow-urban centres
4 Which of the following features is not included in the topographic sheet of Addis Ababa?
A roads
B settlements
C built-up areas
D weather and climate
5 Which of the following maps are used to show population density?
A Isoplethic maps
B Flow maps
C Chroplethic maps
D Chorochromatic maps
6 The most suitable map projection for the tropical areas is
A Cylindrical equal area projection
B Azimllthal projection
C Conic equal area projection
D B and C
II Short-Answer Questions: Provide brief descriptions for the following.
7 State the contrasts between thematic and general purpose maps. Give one example for each.
8 Distinguish chorochromatic maps from chroplethic maps. Give two examples for each.
9 What is the distinction between a conventional map and a sketch map?
10 What factors necessitate the use of map projection techniques?
Unit OutcomesAfter completing this unit, you will be able to:
Þ describe the location and size of countries in the Horn of Africa; Þ recognize the geological history, structure and relief of the Horn of Africa; Þ discuss the significance and characteristics of the drainage systems of
Ethiopia and the Horn; Þ appreciate water-resource conservation and management policy; Þ identify the factors influencing the spatial and temporal distribution of
elements of climate in Ethiopia; Þ realize the different types of natural vegetation and wild animals of Ethiopia; Þ describe soil types, problems and conservation in Ethiopia.
Main Contents3.1 LOCATION OF THE HORN OF AFRICA AND SIZES OF MEMBER
COUNTRIES 3.2 LOCATION, SIZE AND SHAPE OF ETHIOPIA 3.3 GEOLOGICAL STRUCTURE AND RELIEF OF THE HORN OF AFRICA 3.4 CLIMATES OF ETHIOPIA AND THE HORN3.5 NATURAL VEGETATION AND WILD ANIMALS OF ETHIOPIA 3.6 SOILS OF ETHIOPIA
F Unit Summary F Review Exercise
Unit3PHYSICAL GEOGRAPHY OF ETHIOPIA
AND THE HORN
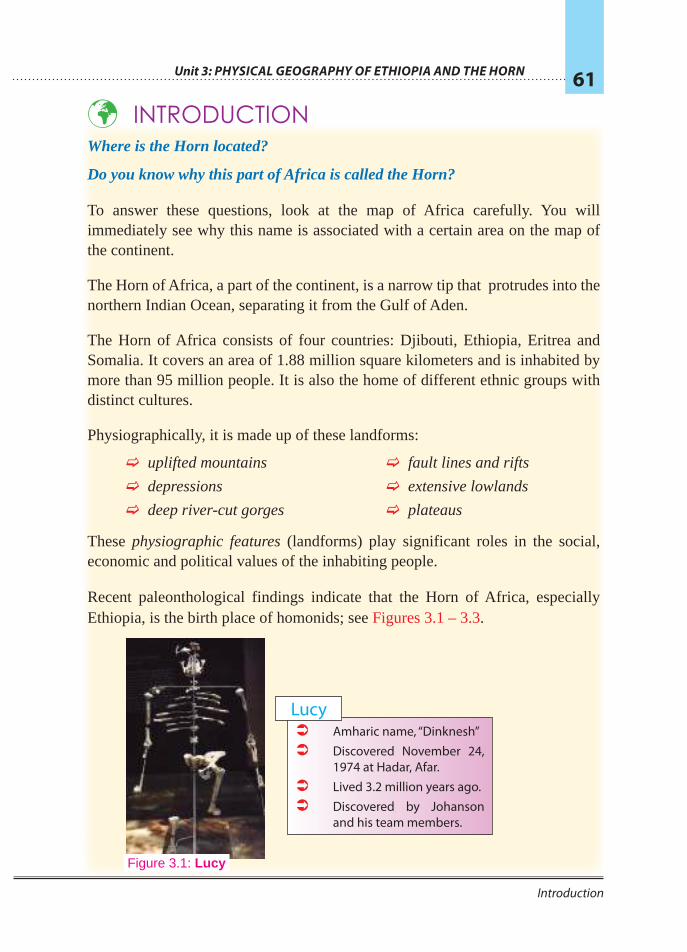
Unit 3: Physical GeoGraPhy of ethioPia and the horn 61
Introduction
PHYSICAL GEOGRAPHY OF ETHIOPIA AND THE HORN
Þ INTRODUCTIONWhere is the Horn located?
Do you know why this part of Africa is called the Horn?
To answer these questions, look at the map of Africa carefully. You will immediately see why this name is associated with a certain area on the map of the continent.
The Horn of Africa, a part of the continent, is a narrow tip that protrudes into the northern Indian Ocean, separating it from the Gulf of Aden.
The Horn of Africa consists of four countries: Djibouti, Ethiopia, Eritrea and Somalia. It covers an area of 1.88 million square kilometers and is inhabited by more than 95 million people. It is also the home of different ethnic groups with distinct cultures.
Physiographically, it is made up of these landforms:
F uplifted mountains
F depressions
F deep river-cut gorges
F fault lines and rifts
F extensive lowlands
F plateaus
These physiographic features (landforms) play significant roles in the social, economic and political values of the inhabiting people.
Recent paleonthological findings indicate that the Horn of Africa, especially Ethiopia, is the birth place of homonids; see Figures 3.1 – 3.3.
 Amharic name, “Dinknesh”  Discovered November 24,
1974 at Hadar, Afar. Â Lived 3.2 million years ago. Â Discovered by Johanson
and his team members.
Lucy
Figure 3.1: Lucy
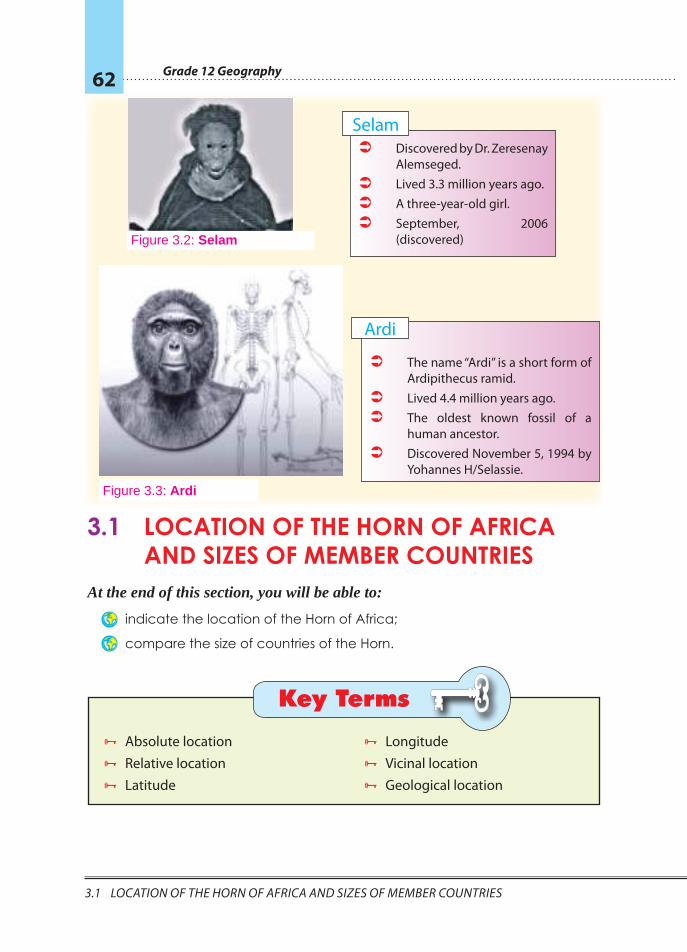
Grade 12 Geography 62
3.1 LocatIon of the horn of afrIca and SIzeS of MeMber countrIeS
3.1 LOCATION OF THE HORN OF AFRICA AND SIZES OF MEMBER COUNTRIES
At the end of this section, you will be able to:
Þ indicate the location of the Horn of Africa;
Þ compare the size of countries of the Horn.
Key Terms
³ Absolute location ³ Relative location ³ Latitude
³ Longitude ³ Vicinal location ³ Geological location
 Discovered by Dr. Zeresenay Alemseged.
 Lived 3.3 million years ago.  A three-year-old girl.  September, 2006
(discovered)
Selam
Figure 3.2: Selam
 The name “Ardi” is a short form of Ardipithecus ramid.
 Lived 4.4 million years ago.  The oldest known fossil of a
human ancestor. Â Discovered November 5, 1994 by
Yohannes H/Selassie.
Ardi
Figure 3.3: Ardi
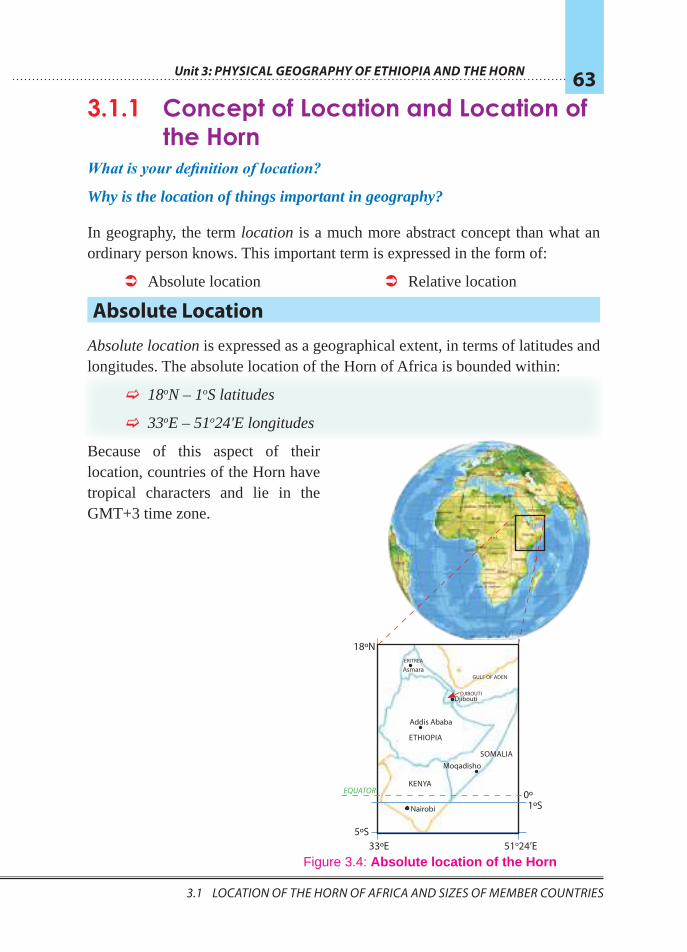
Unit 3: Physical GeoGraPhy of ethioPia and the horn 63
3.1 LocatIon of the horn of afrIca and SIzeS of MeMber countrIeS 3.1 LocatIon of the horn of afrIca and SIzeS of MeMber countrIeS
3.1.1 Concept of Location and Location of the Horn
What is your definition of location?
Why is the location of things important in geography?
In geography, the term location is a much more abstract concept than what an ordinary person knows. This important term is expressed in the form of:
 Absolute location  Relative location
Absolute Location
Absolute location is expressed as a geographical extent, in terms of latitudes and longitudes. The absolute location of the Horn of Africa is bounded within:
F 18oN – 1oS latitudes
F 33oE – 51o24'E longitudes
Because of this aspect of their location, countries of the Horn have tropical characters and lie in the GMT+3 time zone.
33ºE 51o24’E
0º1ºS
5ºS
18ºN
eQuatorKENYA
ETHIOPIA
DJIBOUTI
GULF OF ADEN
ERITREA
Addis Ababa
Moqadisho
Asmara
Djibouti
Nairobi
SOMALIA
Figure 3.4: Absolute location of the Horn
Grade 12 Geography 64
3.1 LocatIon of the horn of afrIca and SIzeS of MeMber countrIeS
Relative Location Can you identify the relative location of your school or residence?
The frame of reference for a place’s relative location differs from that of its
absolute location, in that it is the surrounding bodies of water and landmasses
that come into account instead of latitudes and longtiudes. One way in which the
relative location of the Horn can be described is as a region or subregion bounded by:
F the Indian Ocean in the southeast,
F the Red Sea and Gulf of Aden in the northeast,
F Sudan, in the north and west, and
F Kenya in the south.
Relative location can also be expressed in terms of vicinal (nearness) and
geological (strategic) terms. The geological approach considers a broad aerial
extent.
For example, when we describe the geological location of the Horn countries we
list the Middle East, Southwest Asia, the Mediterranean, adjacent countries etc.
Activity 3.1
1 Draw a map of the Horn of Africa and show the political divisions of the
countries of the Horn.
2 Locate and name their capital cities.
3 Which non-Ethiopian capital city is the nearest to Addis Ababa?
3.1.2 Sizes of Countries of the Horn Do you know the largest country in the Horn of Africa?
The countries of the Horn vary in size, i.e., in area coverage. This variation has
both advantages and disadvantages for individual countries.
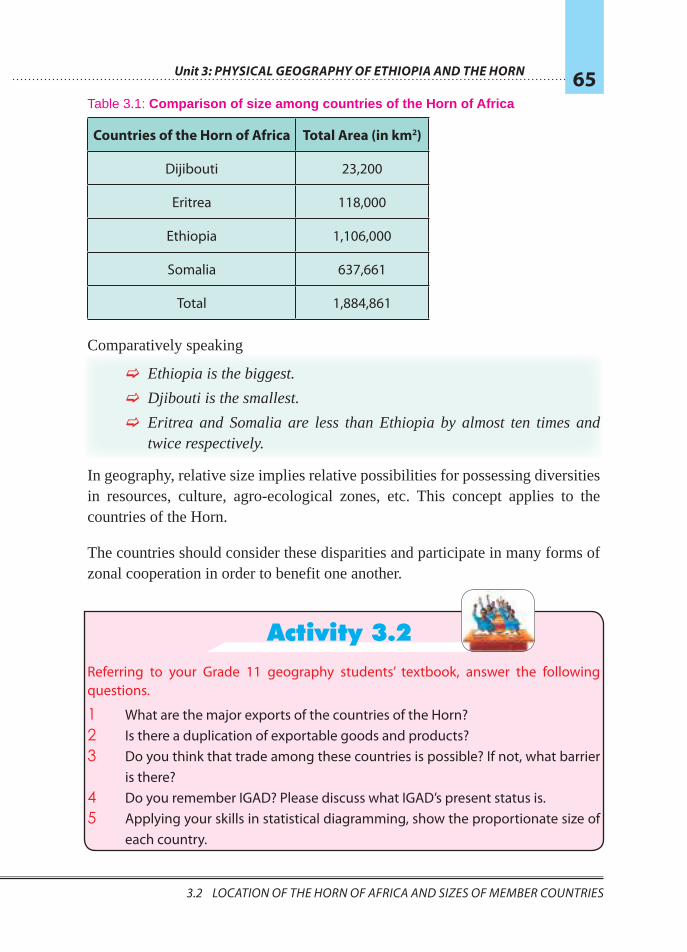
Unit 3: Physical GeoGraPhy of ethioPia and the horn 65
3.1 LocatIon of the horn of afrIca and SIzeS of MeMber countrIeS 3.2 LocatIon of the horn of afrIca and SIzeS of MeMber countrIeS
Table 3.1: Comparison of size among countries of the Horn of Africa
Countries of the Horn of Africa Total Area (in km2)
Dijibouti 23,200
Eritrea 118,000
Ethiopia 1,106,000
Somalia 637,661
Total 1,884,861
Comparatively speaking
F Ethiopia is the biggest.
F Djibouti is the smallest.
F Eritrea and Somalia are less than Ethiopia by almost ten times and twice respectively.
In geography, relative size implies relative possibilities for possessing diversities in resources, culture, agro-ecological zones, etc. This concept applies to the countries of the Horn.
The countries should consider these disparities and participate in many forms of zonal cooperation in order to benefit one another.
Activity 3.2Referring to your Grade 11 geography students’ textbook, answer the following questions.
1 What are the major exports of the countries of the Horn? 2 Is there a duplication of exportable goods and products? 3 Do you think that trade among these countries is possible? If not, what barrier
is there? 4 Do you remember IGAD? Please discuss what IGAD’s present status is. 5 Applying your skills in statistical diagramming, show the proportionate size of
each country.
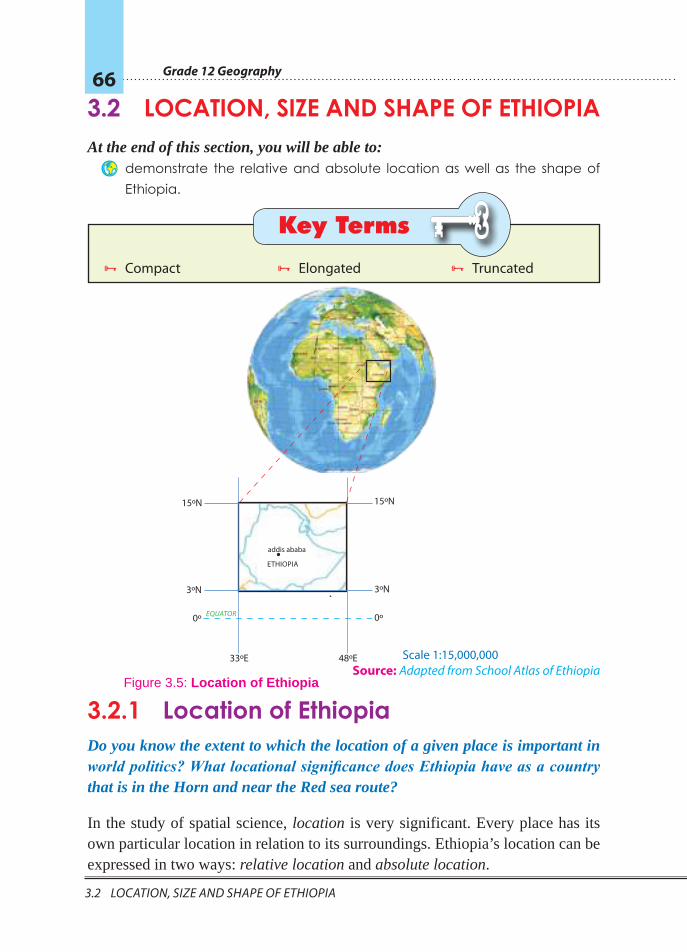
Grade 12 Geography 66
3.2 LocatIon, SIze and Shape of ethIopIa
3.2 LOCATION, SIZE AND SHAPE OF ETHIOPIAAt the end of this section, you will be able to:
Þ demonstrate the relative and absolute location as well as the shape of Ethiopia.
Key Terms
³ Compact ³ Elongated ³ Truncated
Source: adapted from School atlas of ethiopia
3.2.1 Location of Ethiopia Do you know the extent to which the location of a given place is important in world politics? What locational significance does Ethiopia have as a country that is in the Horn and near the Red sea route?
In the study of spatial science, location is very significant. Every place has its own particular location in relation to its surroundings. Ethiopia’s location can be expressed in two ways: relative location and absolute location.
33ºE 48ºE
0º0º
3ºN3ºN
15ºN
eQuator
ETHIOPIA
addis ababa
15ºN
Scale 1:15,000,000
Figure 3.5: Location of Ethiopia
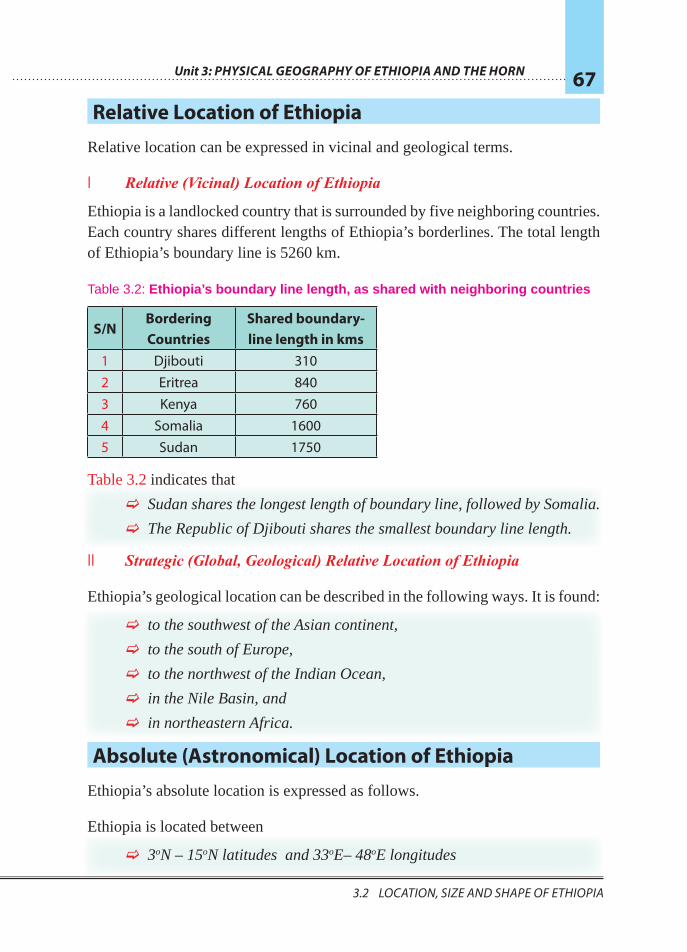
Unit 3: Physical GeoGraPhy of ethioPia and the horn 67
3.2 LocatIon, SIze and Shape of ethIopIa 3.2 LocatIon, SIze and Shape of ethIopIa
Relative Location of Ethiopia
Relative location can be expressed in vicinal and geological terms.
I Relative (Vicinal) Location of Ethiopia
Ethiopia is a landlocked country that is surrounded by five neighboring countries. Each country shares different lengths of Ethiopia’s borderlines. The total length of Ethiopia’s boundary line is 5260 km.
Table 3.2: Ethiopia’s boundary line length, as shared with neighboring countries
S/NBordering Countries
Shared boundary-line length in kms
1 Djibouti 3102 Eritrea 8403 Kenya 7604 Somalia 16005 Sudan 1750
Table 3.2 indicates that
F Sudan shares the longest length of boundary line, followed by Somalia.
F The Republic of Djibouti shares the smallest boundary line length.
II Strategic (Global, Geological) Relative Location of Ethiopia
Ethiopia’s geological location can be described in the following ways. It is found:
F to the southwest of the Asian continent,
F to the south of Europe,
F to the northwest of the Indian Ocean,
F in the Nile Basin, and
F in northeastern Africa.
Absolute (Astronomical) Location of Ethiopia
Ethiopia’s absolute location is expressed as follows.
Ethiopia is located between
F 3oN – 15oN latitudes and 33oE– 48oE longitudes
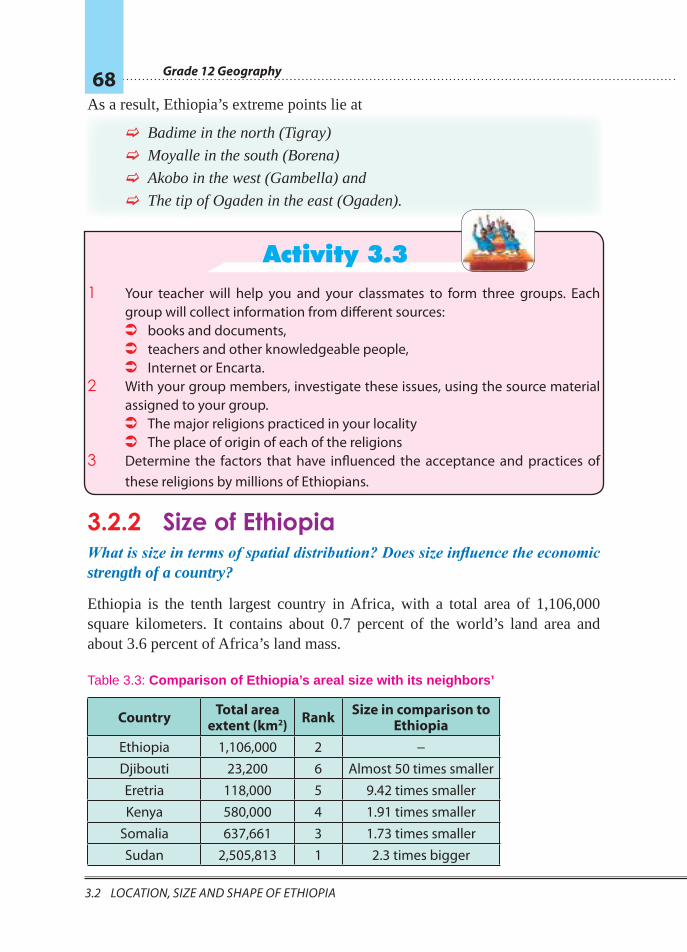
Grade 12 Geography 68
3.2 LocatIon, SIze and Shape of ethIopIa
As a result, Ethiopia’s extreme points lie at
F Badime in the north (Tigray)
F Moyalle in the south (Borena)
F Akobo in the west (Gambella) and
F The tip of Ogaden in the east (Ogaden).
Activity 3.3 1 Your teacher will help you and your classmates to form three groups. Each
group will collect information from different sources: Â books and documents, Â teachers and other knowledgeable people, Â Internet or Encarta.
2 With your group members, investigate these issues, using the source material assigned to your group.
 The major religions practiced in your locality  The place of origin of each of the religions
3 Determine the factors that have influenced the acceptance and practices of these religions by millions of Ethiopians.
3.2.2 Size of Ethiopia What is size in terms of spatial distribution? Does size influence the economic strength of a country?
Ethiopia is the tenth largest country in Africa, with a total area of 1,106,000 square kilometers. It contains about 0.7 percent of the world’s land area and about 3.6 percent of Africa’s land mass.
Table 3.3: Comparison of Ethiopia’s areal size with its neighbors’
Country Total area extent (km2) Rank Size in comparison to
EthiopiaEthiopia 1,106,000 2 −Djibouti 23,200 6 Almost 50 times smallerEretria 118,000 5 9.42 times smallerKenya 580,000 4 1.91 times smaller
Somalia 637,661 3 1.73 times smallerSudan 2,505,813 1 2.3 times bigger
Unit 3: Physical GeoGraPhy of ethioPia and the horn 69
3.2 LocatIon, SIze and Shape of ethIopIa 3.2 LocatIon, SIze and Shape of ethIopIa
What advantages and disadvantages does Ethiopia’s large size offer the country?
Advantages: Ethiopia’s large size lets it:
F possess diverse agro-ecological zones, resulting in a wide variety of fauna and flora,
F possess a large amount of arable land, F have a great variety of mineral resources, and F be the home of diverse ethnic groups.
Disadvantages: Its large size compels Ethiopia to:
F require great financial power to construct infrastructural facilities,
F have a large army to protect its sovereignty,
F preserve an efficient and popular government to administer its vast territory.
3.2.3 Shape of Ethiopia Look at the shape of Ethiopia and the neighbouring countries. Does Ethiopia have shape similarity? Can you identify the shape of each neighbouring country?
Countries vary not only in location and size but also in shape. Some have nearly circular (compact) shapes, others have elongated (linear) shapes, and still others have truncated (shortened) shapes. These shapes affect each country‘s administration, defence and economic integration, both within the country and in respect to outside areas.
Ethiopia’s shape is of the compact type. Its shape is considered to be compact, or essentially circular, because the extreme north-south and east-west spans of the country cover comparable distances. You can easily see this approximate circularity in your school atlases and wall maps.
Note
Ethiopia is the largest country in the Horn. This status in size, in combination with its status of having a large population, confers many advantages to Ethiopia in the Horn area.
Grade 12 Geography 70
3.2 LocatIon, SIze and Shape of ethIopIa
There are three theoretical indicators of the compactness of an area: F the boundary-circumference ratio (B/C)
F the area-boundary ratio (A/B)
F the actual area-area of the inscribing circle (A/A')
For example, let’s use the boundary-circumference ratio to measure Ethiopia’s degree of compactness or index of compactness. In the ratio, circumference is based on an inscribing circle that touches the north, south, east and west boundaries of Ethiopia described earlier in the “Absolute (Astronomical) Location” section.
r – is not given, we have to find it.
Then, change the obtained length (7o30') into kilometers:
1o = 110.5 km
7o30' × 110.5 km = 828.75 km
Therefore, index of compactness = 5260
1.012 3.14 828.75
=× ×
Note
Each of these theoretical assumptions is based on a value of 1 as indicating a perfectly compact shape. They consider 0.5 – 1.5 values as deviating only slightly from circular/compact and therefore indicating approximate compactness. In contrast, smaller values indicate greater divergence from compactness, especially as they approach zero (0). These small values reflect tendencies to elongation or truncation.
Index of compactness = Boundary length
Circumference of the inscribing circle
Note
The inscribing circle is the circle drawn through the extreme points on the boundary of Ethiopia. The radius is obtained by taking half the length of the distance between the astronomical extremes of west and east of Ethiopia i.e., 48oE – 33oE = 15o/2 = 7o30’ (this is radius of the inscribing circle).
Unit 3: Physical GeoGraPhy of ethioPia and the horn 71
3.2 LocatIon, SIze and Shape of ethIopIa 3.2 LocatIon, SIze and Shape of ethIopIa
The value obtained, 1.01, indicates that Ethiopia’s shape to be nearly a perfect compact shape.
The value obtained indicates that Ethiopia’s shape deviates by only 32% from being perfectly compact. Therefore, Ethiopia’s shape is closer to the compact type than to either of the other shapes.
Þ Exercise 3.1 I Multiple Choice: Choose the appropriate answer from the
given alternatives. 1 Ethiopia experiences overhead sun twice in a year. This particular feature
could be attributed to its
A geological location
B vicinal location
C astronomical location
D A and B
2 Which neighboring country shares the longest boundary line with Ethiopia?
A Somali
B Eritrea
C Sudan
D Djibouti
3 Which of the following towns is not a border town of Ethiopia?
A Bademe
B Metema/Galabat
C Moyallee
D Negelle Borena
4 Which of the following countries of the Horn of Africa does not have an outlet to the sea?
A Eritrea
B Djibouti
C Ethiopia
D Somalia
5 Which of the following geographical phenomena is not related to Ethiopia’s astronomical location?
A relatively high temperatures throughout the year
B very little annual range of temperature
C its location within the range of GMT + 3 hours time zone
D itssignificantroleinIGAD

Grade 12 Geography 72
3.3 GeoLoGIcaL Structure and reLIef of the horn of afrIca
3.3 GEOLOGICAL STRUCTURE AND RELIEF OF THE HORN OF AFRICA
At the end of this section, you will be able to:
Þ explain geological structure and major events of the Horn of Africa; Þ describe major landforms of Ethiopia and the Horn; Þ discuss the general characteristics of Ethiopian rivers and drainage
patterns; Þ classify the Ethiopian lakes as highland and rift valley; Þ show appreciation for the significance of rivers and lakes of Ethiopia; Þ show interest for the implementation of water-resource conservation and
management policy.
Key Terms
³ Era ³ Period ³ Epoch ³ Transgression
³ Regression ³ Endogenic force ³ Exogenic force ³ Drainage system
³ Relief ³ Geology ³ Orogenic ³ Epeirogenic
3.3.1 Geological History of the Horn of Africa Which geological era is significant regarding the formation of the various landforms in Ethiopia and the Horn?
The geological history of the Horn cannot be separated from the geological history of Africa. It deals with various geographic activities that have occurred for many millions of years in the past.
The geological history of the Horn shows us that four major geological eras have elapsed. Each era is divided into periods, and each period is subdived into epochs.
Each geological era is distinguished from the other’s, based on grounds of the following three characteristics:
F the relative positions of the continents
F the character of the prevailing climate
F the predominant life form
Unit 3: Physical GeoGraPhy of ethioPia and the horn 73
3.3 GeoLoGIcaL Structure and reLIef of the horn of afrIca 3.3 GeoLoGIcaL Structure and reLIef of the horn of afrIca
Summary of Major Geological Events in the Horn
Let’s begin by considering the different geological eras and then study the events that took place in those eras. Here are the geological eras, in chronological order.
F the Precambrian Era – the oldest era (from 4.5 billion years to 600 million years ago;
F the Paleozoic Era (from 600 million years to 250 million years ago) F the Mesozoic Era (from 250 million years to 70 million years ago) F the Cenozoic era (from 70 million years to the recent time)
The Precambrian Era (from 4.5 Billion to 600 Million years ago)
What do you understand by the term Precambrian?
F the Precambrian Era is the oldest and longest geological era, covering about 5/6 of the earth’s geological time. The following geological events occurred in the Horn during this era.
F frequent orogenic movements
F intensive volcanic activities
F denudation during the later periods
F formation of folded mountain ranges in a NNE – SSW direction
Today, in a few areas of Ethiopia, outcrops of old crystalline basement complex rocks are found on the surface, due to continuous denudation.
Example:
F In central and northern Tigray.
F In Mettekel, Assossa, Illubabor and the Abbay.
F In central Sidama, southern Omo, southern Bale and Borena.
F In central, western and northern Eritrea.
Note
During the Precambrian era  The first forms of life emerged, such as amoeba, and
jellyfish. Â The oldest rock formed – the old crystalline basement.
This rock underlies all other rocks.
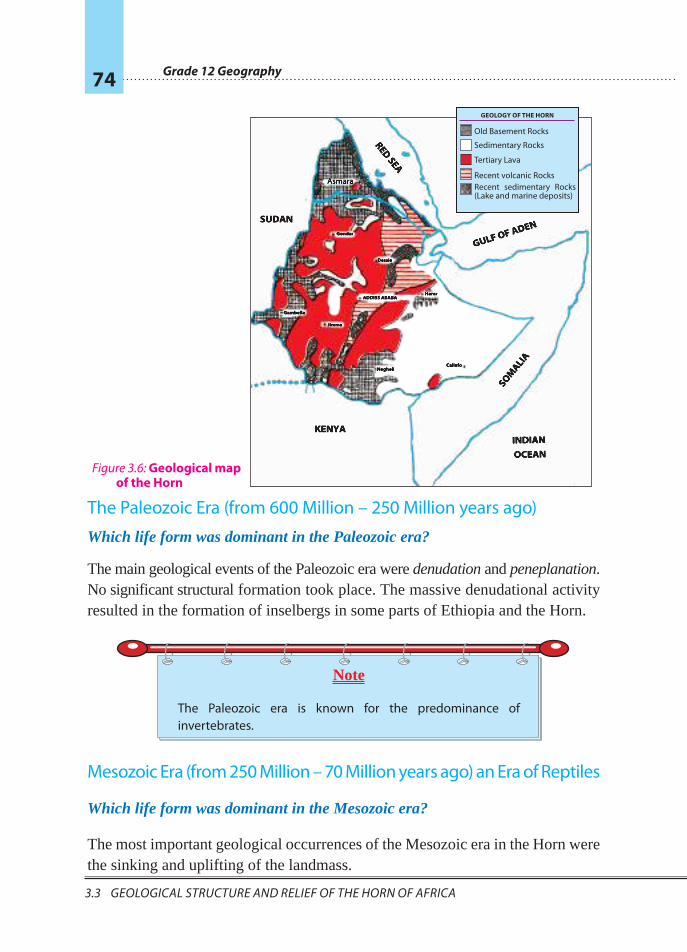
Grade 12 Geography 74
3.3 GeoLoGIcaL Structure and reLIef of the horn of afrIca
The Paleozoic Era (from 600 Million – 250 Million years ago)
Which life form was dominant in the Paleozoic era?
The main geological events of the Paleozoic era were denudation and peneplanation. No significant structural formation took place. The massive denudational activity resulted in the formation of inselbergs in some parts of Ethiopia and the Horn.
Mesozoic Era (from 250 Million – 70 Million years ago) an Era of Reptiles
Which life form was dominant in the Mesozoic era?
The most important geological occurrences of the Mesozoic era in the Horn were the sinking and uplifting of the landmass.
Asmara
SOMALIA
GULF OF ADEN
INDIAN OCEAN
RED SEA
KENYA
SUDAN
Harar
CallafoNegheli
Jimma
Gambella
ADDISS ABABA
Dessie
Gondar
GEOLOGY OF THE HORN
Old Basement Rocks
Sedimentary Rocks
Tertiary Lava
Recent volcanic RocksRecent sedimentary Rocks (Lake and marine deposits)
figure 3.6: Geological map of the Horn
Note
The Paleozoic era is known for the predominance of invertebrates.
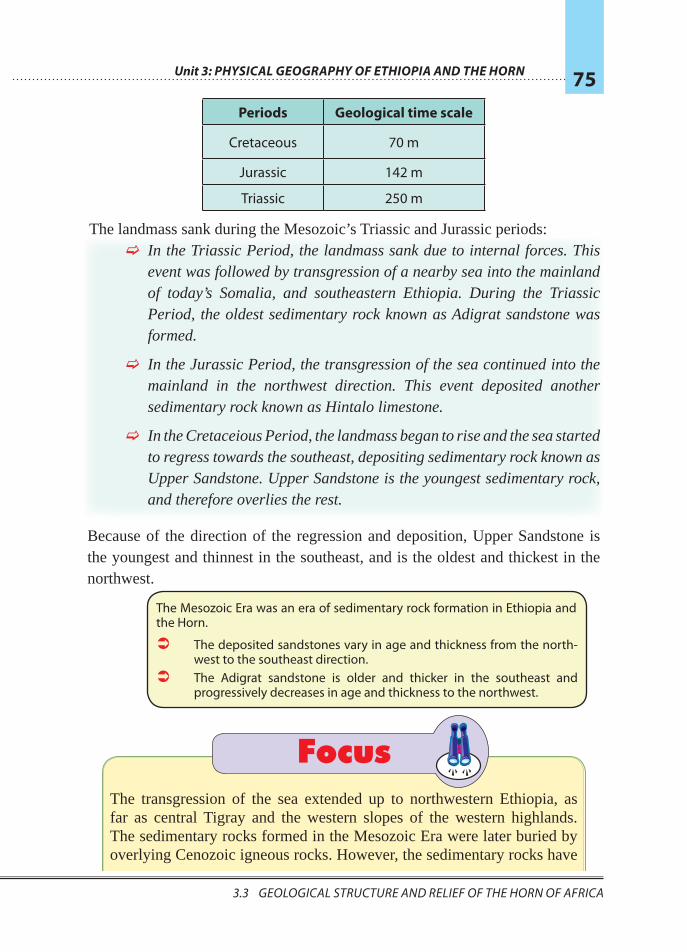
Unit 3: Physical GeoGraPhy of ethioPia and the horn 75
3.3 GeoLoGIcaL Structure and reLIef of the horn of afrIca 3.3 GeoLoGIcaL Structure and reLIef of the horn of afrIca
Periods Geological time scale
Cretaceous 70 m
Jurassic 142 m
Triassic 250 m
The landmass sank during the Mesozoic’s Triassic and Jurassic periods: F In the Triassic Period, the landmass sank due to internal forces. This event was followed by transgression of a nearby sea into the mainland of today’s Somalia, and southeastern Ethiopia. During the Triassic Period, the oldest sedimentary rock known as Adigrat sandstone was formed.
F In the Jurassic Period, the transgression of the sea continued into the mainland in the northwest direction. This event deposited another sedimentary rock known as Hintalo limestone.
F In the Cretaceious Period, the landmass began to rise and the sea started to regress towards the southeast, depositing sedimentary rock known as Upper Sandstone. Upper Sandstone is the youngest sedimentary rock, and therefore overlies the rest.
Because of the direction of the regression and deposition, Upper Sandstone is the youngest and thinnest in the southeast, and is the oldest and thickest in the northwest.
Focus The transgression of the sea extended up to northwestern Ethiopia, as far as central Tigray and the western slopes of the western highlands. The sedimentary rocks formed in the Mesozoic Era were later buried by overlying Cenozoic igneous rocks. However, the sedimentary rocks have
The Mesozoic Era was an era of sedimentary rock formation in Ethiopia and the Horn.
 The deposited sandstones vary in age and thickness from the north-west to the southeast direction.
 The Adigrat sandstone is older and thicker in the southeast and progressively decreases in age and thickness to the northwest.
Grade 12 Geography 76
3.3 GeoLoGIcaL Structure and reLIef of the horn of afrIca
been exposed at the surface in some areas of Ethiopia. They are thinnest (because they are the youngest) in the southeast and thickest (because they are the oldest) in the northwest.
One can see them exposed at the surface mostly in the south eastern lowlands of Ethiopia, central Tigray, and in the Abbay and Wabishebelle gorges. (For more information, look at the geological map of Ethiopia.)
Biological Events of the Mesozoic Era
The Mesozoic is also known for the predominance of reptiles. Huge reptiles, such as dinosaurs, were dominant. However, at the end of this era, two other significantbiologicaleventsoccurred:
F one was the disappearance of the dinosaurs, and
F the other was the emergence of mammals, birds and flowering plants.
The Cenozoic Era (from 70 Million to Recent Years)
Do you know the era in which the human form of life appeared?
The Cenozoic is the most recent geological era. Very significant structural, climatic and biological events have occurred in the Horn.
In order to make things simple and easily comprehendible, we shall discuss only the geological events of this era into events of the Tertiary and Quaternary Periods.
Geologic Events of the Tertiary Period - (70 million - 2 million years ago)
In the Tertiary Period, the uplifting that began in the Cretaceous Period of the Mesozoic Era continued and reached its maximum height.
In Ethiopia and the Horn it formed huge blocks of dome over the greater part of the region. As the uplifting continued through time, great cracks opened in the crust and resulted in the pouring out of extensive basaltic lava (known as the Trappean lava series). The lava resulted in the formation of:
F The Eritrean Highlands F The Northwestern Highlands F The Southeastern Highlands F The Somali plateaus
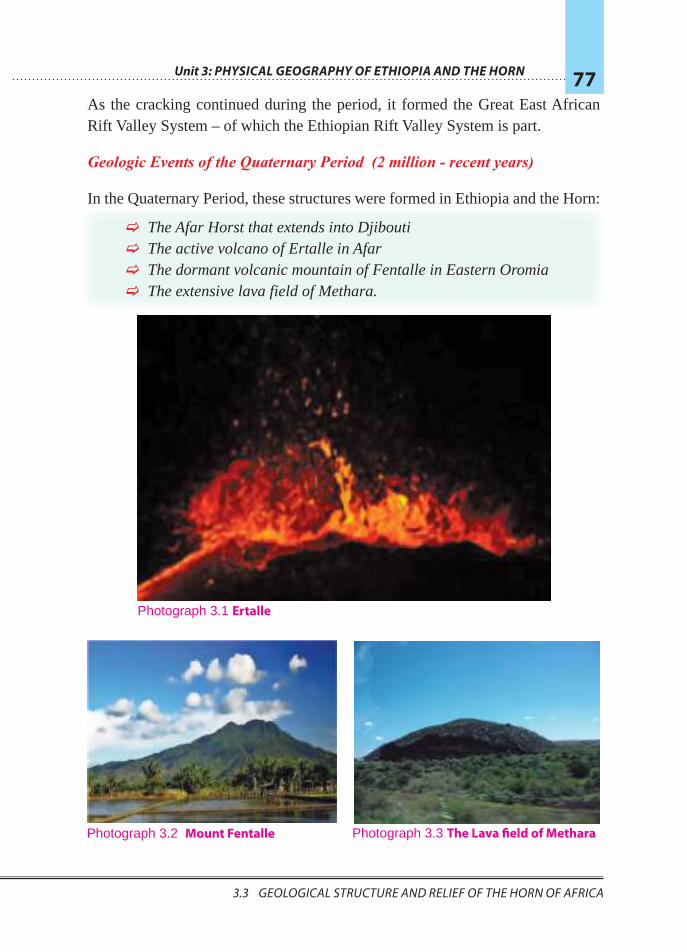
Unit 3: Physical GeoGraPhy of ethioPia and the horn 77
3.3 GeoLoGIcaL Structure and reLIef of the horn of afrIca 3.3 GeoLoGIcaL Structure and reLIef of the horn of afrIca
As the cracking continued during the period, it formed the Great East African Rift Valley System – of which the Ethiopian Rift Valley System is part.
Geologic Events of the Quaternary Period (2 million - recent years)
In the Quaternary Period, these structures were formed in Ethiopia and the Horn:
F The Afar Horst that extends into Djibouti F The active volcano of Ertalle in Afar F The dormant volcanic mountain of Fentalle in Eastern Oromia F The extensive lava field of Methara.
Photograph 3.2 Mount Fentalle Photograph 3.3 The Lava field of Methara
Photograph 3.1 Ertalle
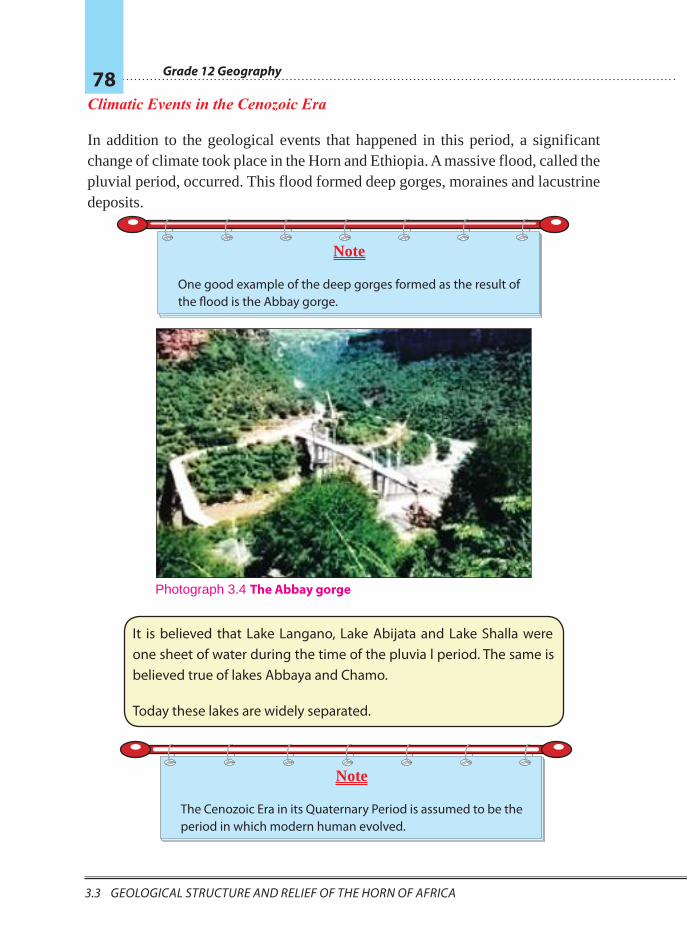
Grade 12 Geography 78
3.3 GeoLoGIcaL Structure and reLIef of the horn of afrIca
Climatic Events in the Cenozoic Era
In addition to the geological events that happened in this period, a significant change of climate took place in the Horn and Ethiopia. A massive flood, called the pluvial period, occurred. This flood formed deep gorges, moraines and lacustrine deposits.
Note
One good example of the deep gorges formed as the result of the flood is the Abbay gorge.
Photograph 3.4 The Abbay gorge
It is believed that Lake Langano, Lake Abijata and Lake Shalla were one sheet of water during the time of the pluvia l period. The same is believed true of lakes Abbaya and Chamo.
Today these lakes are widely separated.
Note
The Cenozoic Era in its Quaternary Period is assumed to be the period in which modern human evolved.
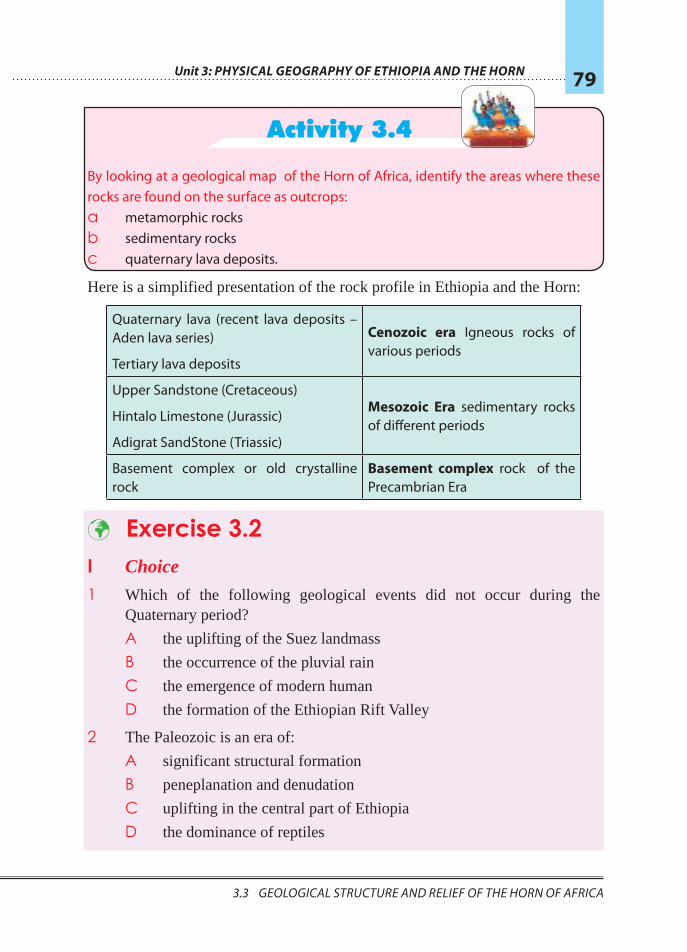
Unit 3: Physical GeoGraPhy of ethioPia and the horn 79
3.3 GeoLoGIcaL Structure and reLIef of the horn of afrIca 3.3 GeoLoGIcaL Structure and reLIef of the horn of afrIca
Activity 3.4
By looking at a geological map of the Horn of Africa, identify the areas where these rocks are found on the surface as outcrops: a metamorphic rocks b sedimentary rocks c quaternary lava deposits.
Here is a simplified presentation of the rock profile in Ethiopia and the Horn:
Quaternary lava (recent lava deposits – Aden lava series)
Tertiary lava deposits
Cenozoic era Igneous rocks of various periods
Upper Sandstone (Cretaceous)
Hintalo Limestone (Jurassic)
Adigrat SandStone (Triassic)
Mesozoic Era sedimentary rocks of different periods
Basement complex or old crystalline rock
Basement complex rock of the Precambrian Era
Þ Exercise 3.2I Choice
1 Which of the following geological events did not occur during the Quaternary period?
A the uplifting of the Suez landmass
B the occurrence of the pluvial rain
C the emergence of modern human
D the formation of the Ethiopian Rift Valley
2 The Paleozoic is an era of:
A significant structural formation
B peneplanation and denudation
C uplifting in the central part of Ethiopia
D the dominance of reptiles
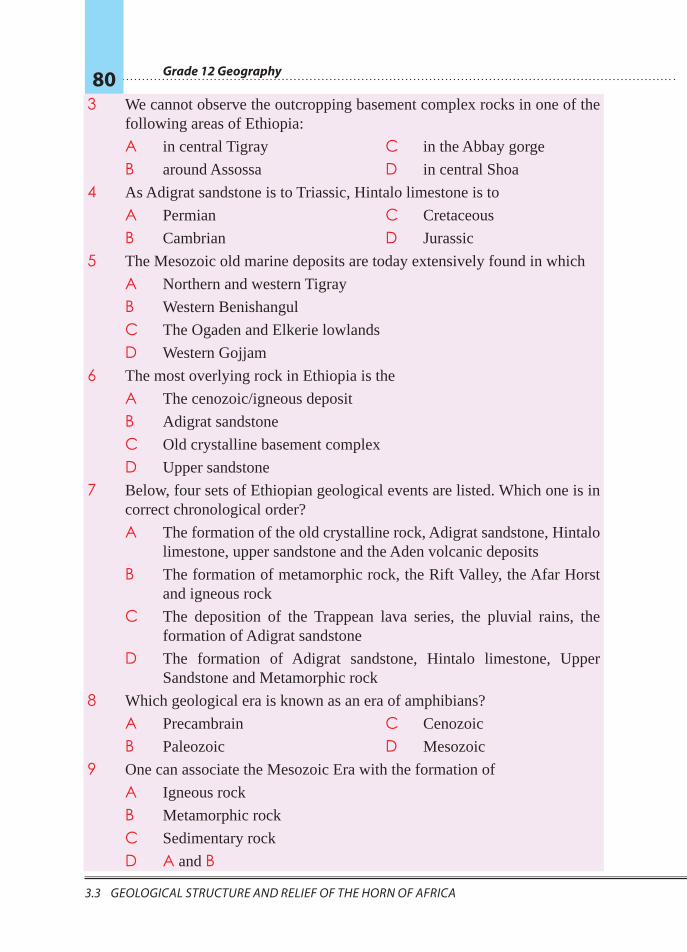
Grade 12 Geography 80
3.3 GeoLoGIcaL Structure and reLIef of the horn of afrIca
3 We cannot observe the outcropping basement complex rocks in one of the following areas of Ethiopia:
A in central Tigray
B around Assossa
C in the Abbay gorge
D in central Shoa
4 As Adigrat sandstone is to Triassic, Hintalo limestone is to
A Permian
B Cambrian
C Cretaceous
D Jurassic
5 The Mesozoic old marine deposits are today extensively found in which
A Northern and western Tigray
B Western Benishangul
C The Ogaden and Elkerie lowlands
D Western Gojjam
6 The most overlying rock in Ethiopia is the
A The cenozoic/igneous deposit
B Adigrat sandstone
C Old crystalline basement complex
D Upper sandstone
7 Below, four sets of Ethiopian geological events are listed. Which one is in correct chronological order?
A The formation of the old crystalline rock, Adigrat sandstone, Hintalo limestone, upper sandstone and the Aden volcanic deposits
B The formation of metamorphic rock, the Rift Valley, the Afar Horst and igneous rock
C The deposition of the Trappean lava series, the pluvial rains, the formation of Adigrat sandstone
D The formation of Adigrat sandstone, Hintalo limestone, Upper Sandstone and Metamorphic rock
8 Which geological era is known as an era of amphibians?
A Precambrain
B Paleozoic
C Cenozoic
D Mesozoic
9 One can associate the Mesozoic Era with the formation of
A Igneous rock
B Metamorphic rock
C Sedimentary rock
D A and B
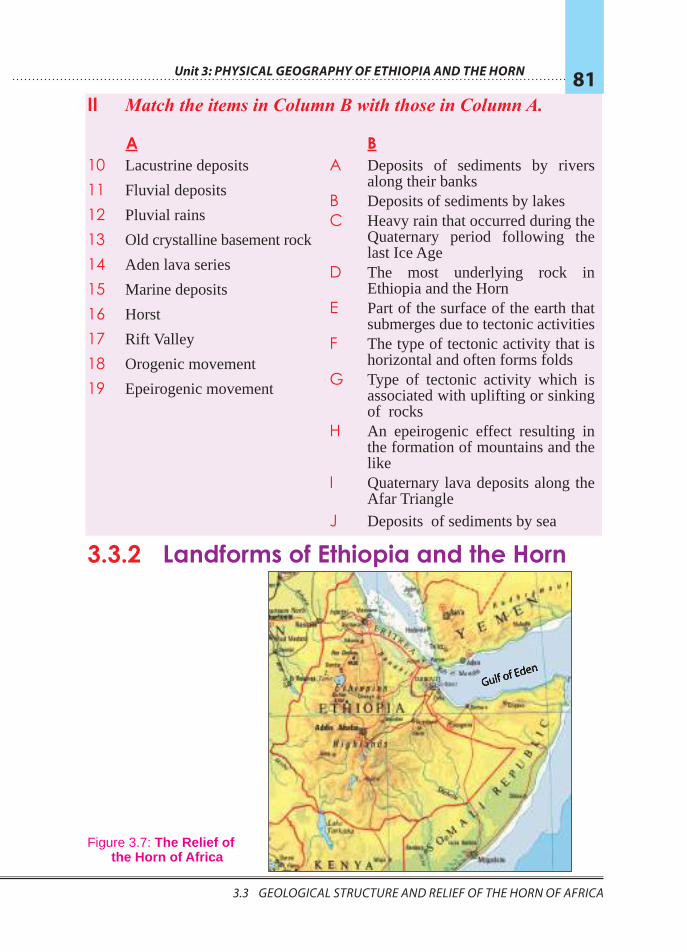
Unit 3: Physical GeoGraPhy of ethioPia and the horn 81
3.3 GeoLoGIcaL Structure and reLIef of the horn of afrIca 3.3 GeoLoGIcaL Structure and reLIef of the horn of afrIca
II Match the items in Column B with those in Column A.
A B 10 Lacustrine deposits
11 Fluvial deposits
12 Pluvial rains
13 Old crystalline basement rock
14 Aden lava series
15 Marine deposits
16 Horst
17 Rift Valley
18 Orogenic movement
19 Epeirogenic movement
A Deposits of sediments by rivers along their banks
B Deposits of sediments by lakes C Heavy rain that occurred during the
Quaternary period following the last Ice Age
D The most underlying rock in Ethiopia and the Horn
E Part of the surface of the earth that submerges due to tectonic activities
F The type of tectonic activity that is horizontal and often forms folds
G Type of tectonic activity which is associated with uplifting or sinking of rocks
H An epeirogenic effect resulting in the formation of mountains and the like
I Quaternary lava deposits along the Afar Triangle
J Deposits of sediments by sea
3.3.2 Landforms of Ethiopia and the Horn
Figure 3.7: The Relief of the Horn of Africa
Gulf of Eden
Grade 12 Geography 82
3.3 GeoLoGIcaL Structure and reLIef of the horn of afrIca
Focus Lake Tana is found in the physiographic subdivision between the plains of Foggera in the southeast and Dembia in the north.
Look at the relief map of the Horn of Africa. It shows high mountains and extensive lowlands mostly found at the coasts and the Great East African Rift Valley that diagonally bisects the region and stretches to East Africa.
These landforms are the work of two opposite forces:
F The endogenic force that originates from inside the earth. For example, volcanic activity and tectonic forces.
F The exogenic force that originates at the surface (denudation and penepalantion).
It is a combination of these two forces that created the existing landforms of the Horn of Africa.
Have you had opportunities to travel to the different regions of Ethiopia? If you did, what did you notice along your routes?
If you have not had those opportunities, make an educational tour of your surroundings with your geography teacher. Then write a short report on what you observe.
The landforms of Ethiopia and the Horn are made up of river-cut gorges, valleys, plateaus, mountains and rolling plains. These landforms are the results of exogenic and endogenic forces that have acted alternately and, at times, simultaneously or the last sixty million years
Altitude varies from about 116 meters below sea level at the Dallol depression (Kobar sink) to 4620 meters above sea level at Ras Dashen in Semein. Between these extreme points lie a number of mountains. If 1000 meters is chosen as a demarcating contour line between highlands and lowlands, 56 percent of Ethiopia’s land is highland. This fact has given Ethiopia the name “Roof of Northeastern Africa.” It is the only country in the region with such a high proportion of elevated surface. This elevated surface is bisected diagonally by the Rift Valley which extends from Syria to Mozoambique across the East African lakes.

Unit 3: Physical GeoGraPhy of ethioPia and the horn 83
3.3 GeoLoGIcaL Structure and reLIef of the horn of afrIca 3.3 GeoLoGIcaL Structure and reLIef of the horn of afrIca
In terms of the geological and structural features that resulted from the two types of forces, the relief of Ethiopia and the Horn can be divided into three main physiographic divisions:
 Highlands
 The Rift Valley
 The lowlands
The Highlands of the Horn
Highlands are lands with altitudes of over 1000 meters above sea level (masl).
The Horn’s highlands are:
1 The Northwestern Highlands
2 The Southeastern Highlands
1 The Northwestern Highlands of the Horn Have you ever had a chance to go to Bahrdar, Gondar, etc.?
The Northwestern Highlands of the Horn stretch from Ras Kassar in Eritrea to the highlands of Gamo-Goffa in southwestern Ethiopia. They are separated from the southeastern highlands by the Rift Valley, which is part of the Great East African Rift Valley. They consist of:
 The Plateau of Eritrea
 The Plateau of Tigray
 The North Central Massifs
 The Plateau of Shewa
 The Southwestern Highlands
The Plateau of Eritrea
Are the Eritrean plateaus extensions of the Ethiopian plateaus?
The plateau of Eritrea is located between the course of the Barka River and the coastal plain of Eritrea. It is bisected by the upper basin of the Mereb River. The plateau is capped by basaltic rocks.
Grade 12 Geography 84
3.3 GeoLoGIcaL Structure and reLIef of the horn of afrIca
The Plateau of Tigray
Is the plateau of Tigray contemporary to the other plateaus of Ethiopia?
The Plateau of Tigray is the most northerly plateau in Ethiopia. It is separated from the Eritrean plateau by the Mereb River. It lies to the southeast of the upper course of the Mereb/Gash River and to the northeast of Tekkeze River Gorge.
It is an area composed largely of sandstones and limestones, as the overlying basalt have been eroded. As a result, the soils are poor and thin. The plateau has been exposed to severe erosion due to long periods of human inhabitation.
There are very high mountains on this plateau with elevations of over 3000 meters above sea level. Three of these are:
F Mount Tsibet – 3988 m.a.s.l
F Mount Ambalage – 3291 m.a.s.l
F Mount Assimba – 3248 m.a.s.l
The North-Central Massifs
What makes the Northern central massifs distinct from the massifs of central Ethiopia?
These are the most rugged and dissected plateaus of Ethiopia. They are capped by basalts and surrounded by deep gorges. Within each of the plateaus are small arable lands known as ambas. The ambas are isolated from one another by gorges. The Tekezze, together with its tributaries, is the main river that drains the region.
Tekezze River has divided the North Central Massif area into western and eastern massifs, which are connected by the Yejju-Wadla-Dilanta plateau. The western massifs make up the massifs of South Gondar (Semein), while the eastern ones make up the Lasta and Wollo Massifs. South of these is found the Gojjam Massif.
The Semein Massif is dominated by Ras Dashen, while the eastern forms the watershed of the Nile drainage basin.
The Gojjam Massif is the most extended tableland and is comparatively less dissected. It is formed on the core of the Amedamit-Choke mountains. It is carved by the Abbay river that effectively separated it from the Shewa plateau in the south and the Amahara Saynt Massif in the northeast.
The North-Central Massifs are made up of numerous high mountains. They are known for the production of cereals, such as teff, pulses and oil seeds.
Unit 3: Physical GeoGraPhy of ethioPia and the horn 85
3.3 GeoLoGIcaL Structure and reLIef of the horn of afrIca 3.3 GeoLoGIcaL Structure and reLIef of the horn of afrIca
Famous mountain peaks on these massifs are
F MT. RAS DASHEN (in Semein) – 4620 masl F MT. LEGEDA (in Gondar) – 4532 masl F MT. ANALU (in Gondar) – 4480 masl F MT. TEFAW LEZER (in Gondar) – 4456 masl F MT. KOLO (in Lasta) – 4300 masl F MT. GUNA (in Gondar) – 4231 masl F MT. ABUNA YOSEPH (in Lasta) – 4190 masl F MT. HEY (in Gondar) – 4154 masl
F MT. BIRHAN (in Gojjam) – 4100 masl
The Plateau of Shewa
Have you ever had the opportunity to travel from Addis Ababa to Debre Markos or Bahir Dar? If yes, what do you recognize all the way through until you reach the Abbay Gorge?
The Shoan Plateau is a dome-shaped plateau that serves as a watershed between the Awash and Abbay River basins. It extends westwards into western Wellega through Horo Guduru and forms a crescent shape which causes the Abbay to swerve and drain northwards. The Shoan plateau is separated
F from the plateau of Gojjam by the Abbay gorge in the north
F from the southeastern highlands by the Awash River and the Rift Valley.
F from the Highlands of Keffa by the Ghibe River.
The Plateau of Shewa is drained by the tributaries of the Abbay River in the west and the Awash River in the east. Its high mountains are found on its northeastern and south eastern margins; they are:
F Mt. Abbuye Meda (on the northeastern margin) – 4000 masl
F Mt. Guraghe (on the southeastern margin) – 3721 masl
The Southwestern Highlands of the Horn
Which regional zones are found in the southwestern highlands of the Horn?
These include the highland areas of Wellega, Illubabor, Gamo Goffa and Keffa.
These Ethiopian highlands lie south of the Abbay trough which is greatly eroded
due to torrential rain that pours down on in the area for almost all of the year. It
is the wettest region of the country with a total average annual rainfall of above
1500 mm.
Grade 12 Geography 86
3.3 GeoLoGIcaL Structure and reLIef of the horn of afrIca
The region is drained:
F northwards, by the Dabus and Diddeessa tributaries of the Abbay River
F westwards, by the headstreams of the Baro-Akobo River
F southwards, by the Omo-Ghibe River, which ends in Lake Turkana
F eastwards, by the right-bank tributaries of the Omo-Ghibe (the Gojeb- Ghibe River of Jima and Yem zone)
The general elevation of these highlands is relatively low, when compared to that of the Northern and Eastern Highlands. Only a few areas are above 2500 meters. The highest points in the region are the:
F Gamo-Konso Highlands (in GamoGoffa)
F Maji-Korma Highlands (in Keffa Zone)
F Kulo-Konta Highlands (Keffa zone)
F Benishangul mountain (in Benshangul Gumuz)
F Tullu Wallel (in West Wellega)
Mt Gughe has the highest altitude: 4200 masl. It is found in the Gammo plateau.
The Southeastern Highlands of the Horn
Can you suggest what feature separates these highlands from the northwestern highlands?
Which highlands are said to be the components of southeastern highlands of the Horn?
The Southeastern Highlands of the Horn include the plateaus of
 Hararghe
 Sidama
 Arsi
 Bale
 Somali highlands
Their formation is similar to that of the North and Southwestern Highlands; and they are capped by basaltic rock. They are the main sources of the Wabishebelle and Genalle rivers.
Note
These highlands are well-known for the production of coffee, inset and maize.
Unit 3: Physical GeoGraPhy of ethioPia and the horn 87
3.3 GeoLoGIcaL Structure and reLIef of the horn of afrIca 3.3 GeoLoGIcaL Structure and reLIef of the horn of afrIca
They are bounded: F in the west, by the fault line of the Rift Valley
F in the east, by the Ogaden Lowlands
F in the south by the Elkerie and Borena Lowlands.
These highlands are subdivided into the plateaux of Hararghe, Arsi, Bale and Sidama. Each is discussed in turn as follows.
The Plateau of Hararghe The Plateau of Hararghe rises sharply from the fault line of the Rift Valley and extends gently to the east up to Jijiga. After Jigjiga, a fall in elevation takes place, giving way to the Ogaden Lowlands. The Plateau is drained by the left-bank tributaries of the Wabishebelle River. The basaltic rocks have been worn away, exposing limestones and earlier sedimentary rocks.
TheHarargePlateau area and its foothills are significant producers of coffee,chat, sorghum and millet. The highest points of this plateau are Mount Gara Muleta (3381 masl) and Mount Jebel Tita (3122 masl).
The Plateau of ArsiThis plateau area consists of the Gugu and Chillalo Massifs. It is an extendingly rolling plateau; it is a very suitable plateau for farming. These features are due to the fact that erosion on the Arsi plateau has been comparatively low. The Arsi plateau is known for its wheat.
The highest points on the Arsi plateau are Mount Chillallo (4136 masl), Mount Bada (4139 masl) and Mount Kaka (4180 masl).
The Bale MassifThe Bale Massif is next to the Arsi Plateau but is separated from it by the headstreams of the Wabishebelle River (popularly known as the Wabe). In the north,themassifconsistsofaflatformthatissimilartobasalticplateaus.Inthesouth, the massif consists of huge mountains. The Bale Massif is dominated by
F Mount Tulu Dimtu (4377 masl)
F Mount Batu (4307 masl)
The Plateau of Sidama
This plateau area is next to the Bale Massifs, but is separated from them by the Genalle River. The area constitutes the southwest extension of the southeastern highlands. The plateau slopes away gently to the south and is drained by the Dawa River and its tributaries. The Jemjem is the dominant part of the plateau.
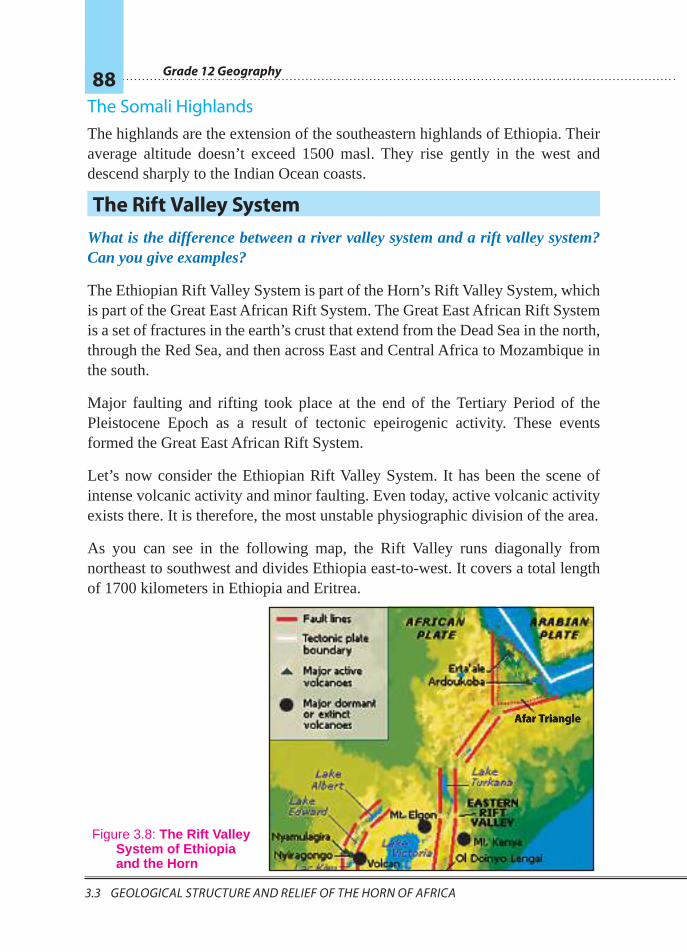
Grade 12 Geography 88
3.3 GeoLoGIcaL Structure and reLIef of the horn of afrIca
The Somali Highlands The highlands are the extension of the southeastern highlands of Ethiopia. Their average altitude doesn’t exceed 1500 masl. They rise gently in the west and descend sharply to the Indian Ocean coasts.
The Rift Valley System What is the difference between a river valley system and a rift valley system? Can you give examples?
The Ethiopian Rift Valley System is part of the Horn’s Rift Valley System, which is part of the Great East African Rift System. The Great East African Rift System is a set of fractures in the earth’s crust that extend from the Dead Sea in the north, through the Red Sea, and then across East and Central Africa to Mozambique in the south.
Major faulting and rifting took place at the end of the Tertiary Period of the Pleistocene Epoch as a result of tectonic epeirogenic activity. These events formed the Great East African Rift System.
Let’s now consider the Ethiopian Rift Valley System. It has been the scene of intense volcanic activity and minor faulting. Even today, active volcanic activity exists there. It is therefore, the most unstable physiographic division of the area.
As you can see in the following map, the Rift Valley runs diagonally from northeast to southwest and divides Ethiopia east-to-west. It covers a total length of 1700 kilometers in Ethiopia and Eritrea.
Afar Triangle
Figure 3.8: The Rift Valley System of Ethiopia and the Horn
Unit 3: Physical GeoGraPhy of ethioPia and the horn 89
3.3 GeoLoGIcaL Structure and reLIef of the horn of afrIca 3.3 GeoLoGIcaL Structure and reLIef of the horn of afrIca
Focus From an economic point of view, the Afar Triangle is becoming increasingly significant for its great potential in the extraction of salt, geothermal energy and irrigable agriculture.
Subdivisions of the Ethiopian Rift Valley System
Can you forward the main natural/physical factors that make up the subdivisions of the Ethiopian Rift Valley?
Covering a length of 1700 km, the Ethiopian Rift Valley System comprises 18 percent of the country’s total area. It is subdivided into three main parts:
 The Afar Triangle (northern)
 The Main Ethiopian Rift (central)
 The Chew-Bahir Rift (southern)
The Afar Triangle (Northern Subdivision)
The northern subdivision of the Ethiopian Rift Valley System, i.e., the Afar Triangle, is the largest and widest part of the system. Its altitude is generally low, ranging from 116 meters below sea level at the Kobar Sink to about 900 meters above sea level at Awash.
This part of the Ethiopian Rift System is characterized by
F faulted depressions (the Dallol Depression) and grabens (also called troughs)
F volcanic mountains.
Also, a large part of the area is covered by extensive salt plains and lakes (Lake Assale and Lake Afrera).
TheAfartriangleisboundedbyparallelfaultlinesontheeastandwest.Itsflooris made up of:
F grabens such as the Tendaho Graben
F volcanic ash and lava deposits
F Lacustrian and fluvial deposits, and
F Volcanic mountains such as Mount Fentalle.

Grade 12 Geography 90
3.3 GeoLoGIcaL Structure and reLIef of the horn of afrIca
What is more, the Afar Triangle has special characteristics that do not exist in other regions of Ethiopia. It consists of:
K fossil rich sediments
K rich archeological sites which have shown us that the area was the home of the ancient ancestors of primates and hominids.
The Main Ethiopian Rift (Lake Region or Central Part)
F The central subdivision of the Ethiopian Rift system, i.e., the Main Ethiopian Rift, covers the area from the lower Awash basin up to Lake Chamo. This subdivision is the most elevated part of the Ethiopian Rift Valley. It is also the wettest, most densely vegetated, and most densely populated.
F Sedentary farming is practiced here. The area also includes numerous lakes of enormous aesthetic value.
The Chew-Bahir Rift (Southern Subdivision)
The southern subdivision of the Ethiopian Rift system, the Chew-Bahir Rift, is also known as the Omo-Ghibe trough. It is the smallest section of the Ethiopian Rift System. It consists of an extensive shallow marshy area covered by tall grasses.
In the vicinity of Arba Minch, this part of the Ethiopian Rift valley system is split into the Ganjuli and the Galena Valleys by the Amaro mountain range.
Activity 3.5 1 Draw a map of the Rift Valley System in Ethiopia and demarcate its subdivisions. 2 For each subdivision, show two important towns.
The Lowlands of the Horn
These landform divisions occupy the peripheries of Ethiopia on its eastern and western sides, running from north to south. They are generally below the 1000 meter contour line and have relatively harsh and very hot climates. The lowlands constitute more than 35 percent of the total area of the country. They are inhabited mainly by pastoralists.
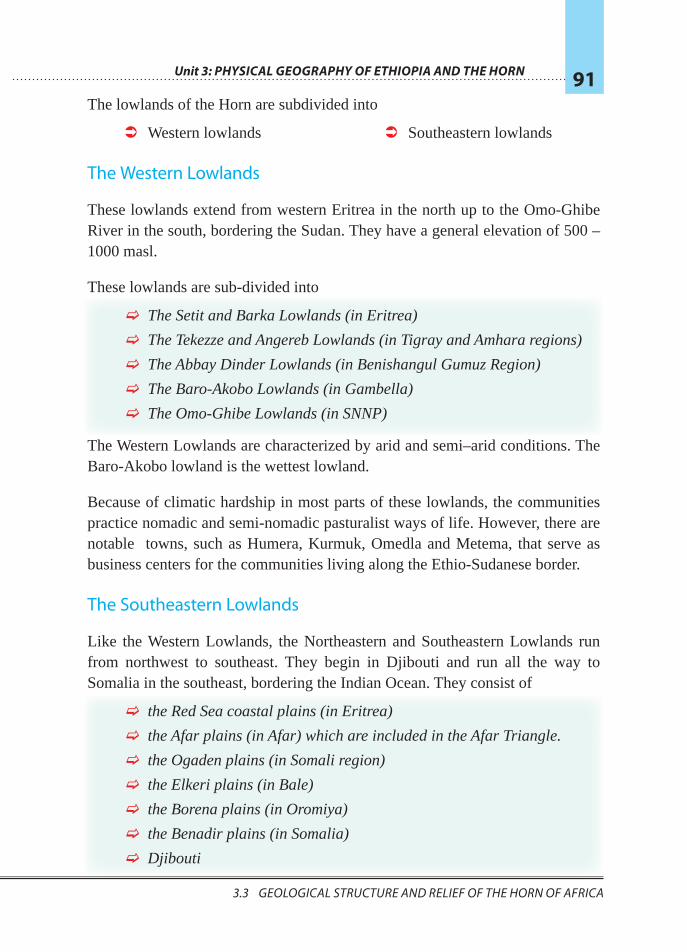
Unit 3: Physical GeoGraPhy of ethioPia and the horn 91
3.3 GeoLoGIcaL Structure and reLIef of the horn of afrIca 3.3 GeoLoGIcaL Structure and reLIef of the horn of afrIca
The lowlands of the Horn are subdivided into
 Western lowlands  Southeastern lowlands
The Western Lowlands
These lowlands extend from western Eritrea in the north up to the Omo-Ghibe River in the south, bordering the Sudan. They have a general elevation of 500 – 1000 masl.
These lowlands are sub-divided into
F The Setit and Barka Lowlands (in Eritrea)
F The Tekezze and Angereb Lowlands (in Tigray and Amhara regions)
F The Abbay Dinder Lowlands (in Benishangul Gumuz Region)
F The Baro-Akobo Lowlands (in Gambella)
F The Omo-Ghibe Lowlands (in SNNP)
The Western Lowlands are characterized by arid and semi–arid conditions. The Baro-Akobo lowland is the wettest lowland.
Because of climatic hardship in most parts of these lowlands, the communities practice nomadic and semi-nomadic pasturalist ways of life. However, there are notable towns, such as Humera, Kurmuk, Omedla and Metema, that serve as business centers for the communities living along the Ethio-Sudanese border.
The Southeastern Lowlands
Like the Western Lowlands, the Northeastern and Southeastern Lowlands run from northwest to southeast. They begin in Djibouti and run all the way to Somalia in the southeast, bordering the Indian Ocean. They consist of
F the Red Sea coastal plains (in Eritrea)
F the Afar plains (in Afar) which are included in the Afar Triangle.
F the Ogaden plains (in Somali region)
F the Elkeri plains (in Bale)
F the Borena plains (in Oromiya)
F the Benadir plains (in Somalia)
F Djibouti
Grade 12 Geography 92
3.3 GeoLoGIcaL Structure and reLIef of the horn of afrIca
These lowlands are highly extensive lowlands. They are characterized by low annual rainfall-often below 500 mm. Most of these lowlands are covered by sandstones and recent marine deposits. The people practice a pastoralist way of life because of the harsh climate.
Activity 3.61 Draw a map of Ethiopia showing the major physiographic divisions.
2 Name three very important towns for each division.
3 Briefly explain the current economic significance of each division and, if you can, predict its future prospects.
4 Explain why the Baro-Akobo Lowlands are the wettest of all lowlands.
Þ Exercise 3.3 I Tell whether the following statements are true or false.
1 All the highlands of Ethiopia are the result of tectonic activity.
2 The Plateau of Shewa is a dome-shaped plateau with a crescent shape at the center.
3 The Southwestern Highlands are lower in altitude than the other highlands of Ethiopia.
4 The plateaus of Semein, Lasta and Wollo are the most dissected and rugged subdivisions.
5 The Plateau of Shewa is one of the sources for the water that flows to the Abbay
6 Lake Tana lies between the plateaus of Gojjam and Southern Gondar and has a crater shape.
II Choose the best answer among the suggested alternatives.
7 The plateau of Tigray is separated from the plateau of Eritrea by the
A Tekezze RiverB Mereb River
C Tributaries of the Setit RiverD The Danakil Lowlands
8 The difference in altitude between the lowest and highest point in Ethiopia is A 4736 metersB 4504 meters
C 4760 metersD 4620 meters
Unit 3: Physical GeoGraPhy of ethioPia and the horn 93
3.3 GeoLoGIcaL Structure and reLIef of the horn of afrIca 3.3 GeoLoGIcaL Structure and reLIef of the horn of afrIca
9 As the highest point is in the Semein, the lowest point is in the A Western margins
B Elkere Lowlands
C Afar Lowlands
D Ogaden Lowlands
10 Imagine that you could travel in a straight line from Ras Dashen to the Dallol Depresion. You would encounter all of the following features except for one or two. Identify the exception(s). A The Rift Valley escarpments
B The Lasta Massif
C The Tekezze gorge
D Lakes Shalla and Abijata
11 Which one of the following mountains is found to the north of Lake Tana Basin? A Mount Guna
B Mount Abuna Yoseph
C Mt. Abuye Medda
D Mt. Ras Dashen
12 Mt. Kolo is found in A Semein
B Lasta
C Amahara Saint
D Gojjam
13 The most extended tableland in the northern part of Ethiopia is the plateau of A Shoa
B Gojjam
C Southern Gondar
D Tigray
14 Which one of the following appears to be different from the others?
A The Choke-Amedamit mountains
B The Gamo-Konso Highlands
C The Maji-Korma Highlands
D The Kullo-Konta Highlands
15 Which one of the following areas is not drained by the tributaries of the Tekezze?
A Southwest Wello
B Southern Tigray
C Semein
D Northern Shewa
16 All of the following are drained by the Abbay and its tributaries, except,
A The Southwestern Highlands
B The North and Western Highlands
C The Central Highlands
D The Southeastern Highlands
Grade 12 Geography 94
3.3 GeoLoGIcaL Structure and reLIef of the horn of afrIca
III Short Answers
17 Tell why sandstone and limestone are seen as surface outcrops in the Plateau of Tigray.
18 Assume that you are travelling from the Dallol Depression to Mt. Ambalage in a straight line. Create a graph of your trip using the x–y axis. The x–axis represents the travel line. The y axis represents elevation variation. Let point O be your origin, in distance. Let D stands for Dallol and point M stand for Mt. Ambalage.
3.3.3 Drainage Systems and Water Resources of Ethiopia
Are drainage systems and drainage patterns alike? What is Ethiopia’s status with regard to water resources?
In geography, drainage patterns differ from drainage systems. The term patterns refers to the fabric or surface arrangement of the main rivers and their tributaries. These features are the result of factors of the underlying rock and slope. In contrast, the term systems refers to the direction and destination of the rivers.
For example, drainage patterns are expressed as radial, dendrite, trellis, etc., while drainage systems are expressed as endoric, exotric and aeric.
The drainage patterns and systems of Ethiopia are the results of various structural events that took place in the Cenozoic era.
Major Rivers of Ethiopia and their Characteristics
Do you know the major rivers of Ethiopia?
Ethiopia is among the few countries that have many rivers. Ethiopia has enormous potential water resources. As well as being numerous, Ethiopian rivers are energetic. They flow from the highlands of the interior to the peripheral lowlands and then to seas and lakes bouncingly. These conditions have made Ethiopia known as the “water tower of Northeastern Africa” and as the watershed between the Mediterranean Sea and the Indian Ocean drainage systems.
Characteristics of Ethiopian Rivers
Are all Ethiopian rivers perennial and non-fluctuating in their volume of water?
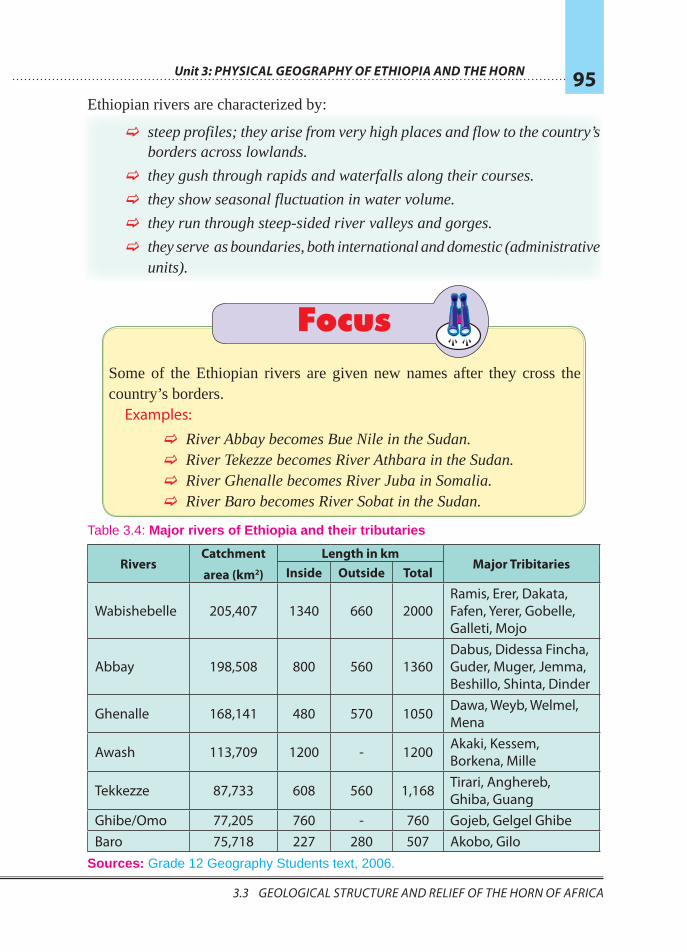
Unit 3: Physical GeoGraPhy of ethioPia and the horn 95
3.3 GeoLoGIcaL Structure and reLIef of the horn of afrIca 3.3 GeoLoGIcaL Structure and reLIef of the horn of afrIca
Ethiopian rivers are characterized by:
F steep profiles; they arise from very high places and flow to the country’s borders across lowlands.
F they gush through rapids and waterfalls along their courses.
F they show seasonal fluctuation in water volume.
F they run through steep-sided river valleys and gorges.
F they serve as boundaries, both international and domestic (administrative units).
Focus Some of the Ethiopian rivers are given new names after they cross the country’s borders.
Examples:
F River Abbay becomes Bue Nile in the Sudan. F River Tekezze becomes River Athbara in the Sudan. F River Ghenalle becomes River Juba in Somalia. F River Baro becomes River Sobat in the Sudan.
Table 3.4: Major rivers of Ethiopia and their tributaries
Rivers Catchment
area (km2)
Length in kmMajor Tribitaries
Inside Outside Total
Wabishebelle 205,407 1340 660 2000Ramis, Erer, Dakata, Fafen, Yerer, Gobelle, Galleti, Mojo
Abbay 198,508 800 560 1360Dabus, Didessa Fincha, Guder, Muger, Jemma, Beshillo, Shinta, Dinder
Ghenalle 168,141 480 570 1050 Dawa, Weyb, Welmel, Mena
Awash 113,709 1200 - 1200 Akaki, Kessem, Borkena, Mille
Tekkezze 87,733 608 560 1,168 Tirari, Anghereb, Ghiba, Guang
Ghibe/Omo 77,205 760 - 760 Gojeb, Gelgel GhibeBaro 75,718 227 280 507 Akobo, Gilo
Sources: Grade 12 Geography Students text, 2006.
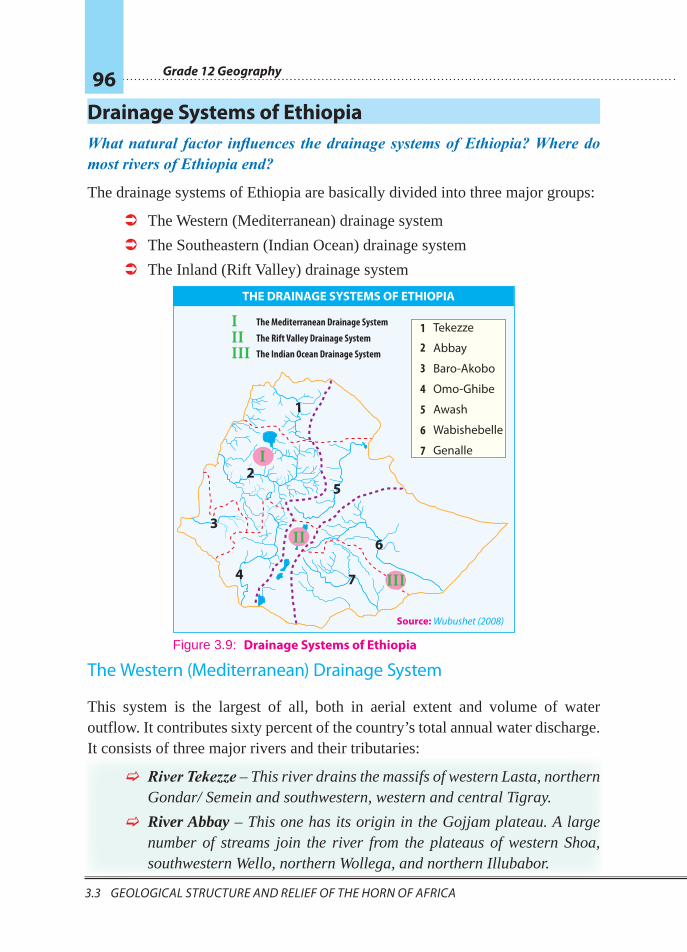
Grade 12 Geography 96
3.3 GeoLoGIcaL Structure and reLIef of the horn of afrIca
Drainage Systems of EthiopiaWhat natural factor influences the drainage systems of Ethiopia? Where do most rivers of Ethiopia end?
The drainage systems of Ethiopia are basically divided into three major groups:
 The Western (Mediterranean) drainage system
 The Southeastern (Indian Ocean) drainage system
 The Inland (Rift Valley) drainage system
The Western (Mediterranean) Drainage System
This system is the largest of all, both in aerial extent and volume of water outflow. It contributes sixty percent of the country’s total annual water discharge. It consists of three major rivers and their tributaries:
F River Tekezze – This river drains the massifs of western Lasta, northern Gondar/ Semein and southwestern, western and central Tigray.
F River Abbay – This one has its origin in the Gojjam plateau. A large number of streams join the river from the plateaus of western Shoa, southwestern Wello, northern Wollega, and northern Illubabor.
THE DRAINAGE SYSTEMS OF ETHIOPIA
Tekezze
Baro-Akobo
Omo-Ghibe
Awash
Wabishebelle
Genalle
1
2
3
4
5
6
7
Abbay
The Mediterranean Drainage System
The Rift Valley Drainage System
The Indian Ocean Drainage System
IIIIII
Source: Wubushet (2008)
I
II
III
25
7
63
4
1
Figure 3.9: Drainage Systems of Ethiopia
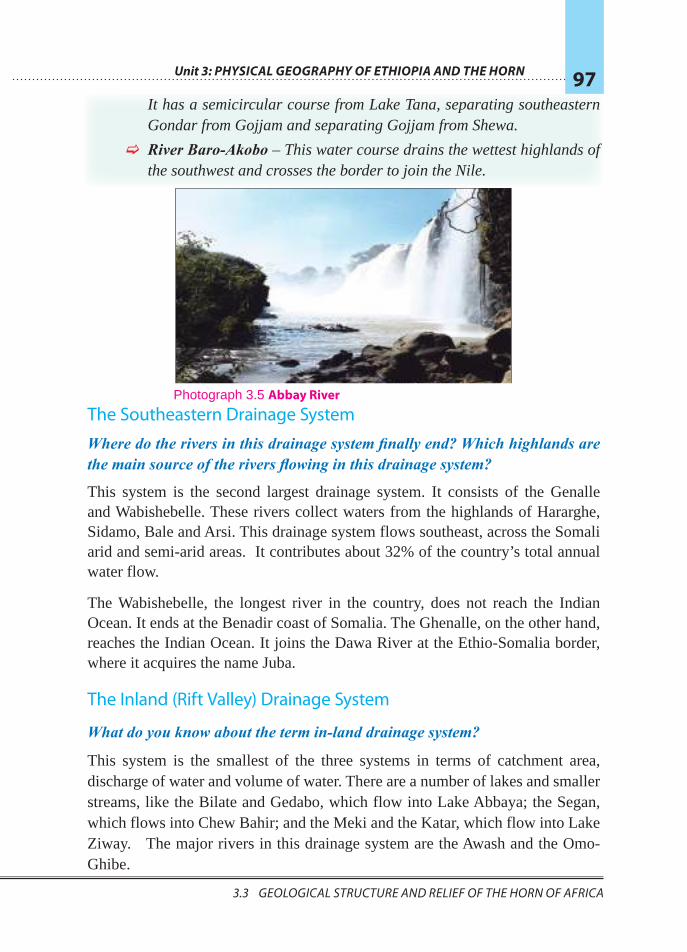
Unit 3: Physical GeoGraPhy of ethioPia and the horn 97
3.3 GeoLoGIcaL Structure and reLIef of the horn of afrIca 3.3 GeoLoGIcaL Structure and reLIef of the horn of afrIca
It has a semicircular course from Lake Tana, separating southeastern Gondar from Gojjam and separating Gojjam from Shewa.
F River Baro-Akobo – This water course drains the wettest highlands of the southwest and crosses the border to join the Nile.
The Southeastern Drainage System
Where do the rivers in this drainage system finally end? Which highlands are the main source of the rivers flowing in this drainage system?
This system is the second largest drainage system. It consists of the Genalle and Wabishebelle. These rivers collect waters from the highlands of Hararghe, Sidamo, Bale and Arsi. This drainage system flows southeast, across the Somali arid and semi-arid areas. It contributes about 32% of the country’s total annual water flow.
The Wabishebelle, the longest river in the country, does not reach the Indian Ocean. It ends at the Benadir coast of Somalia. The Ghenalle, on the other hand, reaches the Indian Ocean. It joins the Dawa River at the Ethio-Somalia border, where it acquires the name Juba.
The Inland (Rift Valley) Drainage System
What do you know about the term in-land drainage system?
This system is the smallest of the three systems in terms of catchment area, discharge of water and volume of water. There are a number of lakes and smaller streams, like the Bilate and Gedabo, which flow into Lake Abbaya; the Segan, which flows into Chew Bahir; and the Meki and the Katar, which flow into Lake Ziway. The major rivers in this drainage system are the Awash and the Omo-Ghibe.
Photograph 3.5 Abbay River
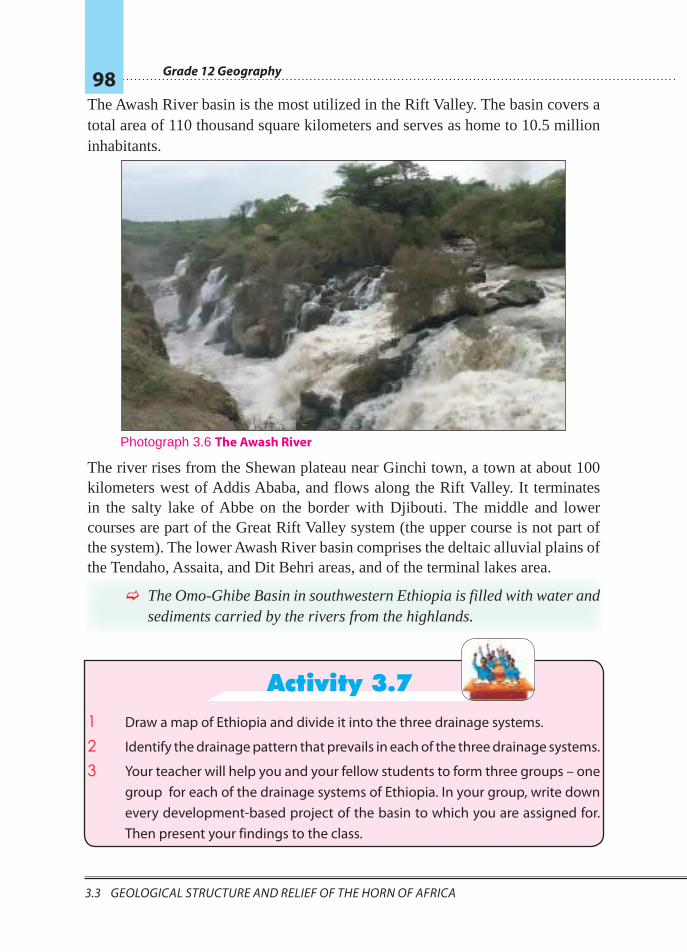
Grade 12 Geography 98
3.3 GeoLoGIcaL Structure and reLIef of the horn of afrIca
The Awash River basin is the most utilized in the Rift Valley. The basin covers a total area of 110 thousand square kilometers and serves as home to 10.5 million inhabitants.
The river rises from the Shewan plateau near Ginchi town, a town at about 100 kilometers west of Addis Ababa, and flows along the Rift Valley. It terminates in the salty lake of Abbe on the border with Djibouti. The middle and lower courses are part of the Great Rift Valley system (the upper course is not part of the system). The lower Awash River basin comprises the deltaic alluvial plains of the Tendaho, Assaita, and Dit Behri areas, and of the terminal lakes area.
F The Omo-Ghibe Basin in southwestern Ethiopia is filled with water and sediments carried by the rivers from the highlands.
Activity 3.71 Draw a map of Ethiopia and divide it into the three drainage systems.
2 Identify the drainage pattern that prevails in each of the three drainage systems.
3 Your teacher will help you and your fellow students to form three groups – one group for each of the drainage systems of Ethiopia. In your group, write down every development-based project of the basin to which you are assigned for. Then present your findings to the class.
Photograph 3.6 The Awash River
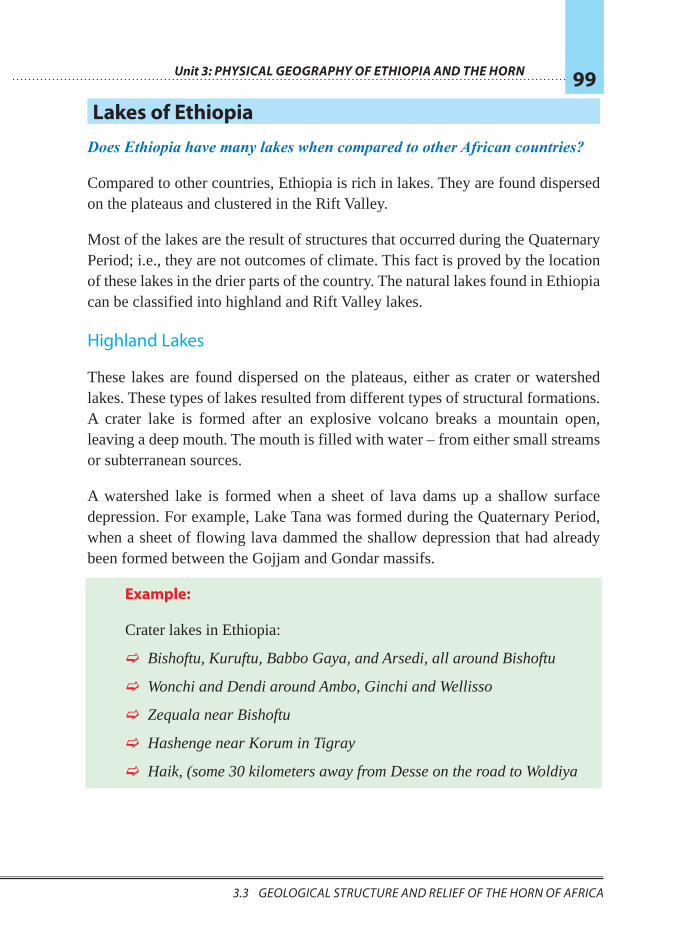
Unit 3: Physical GeoGraPhy of ethioPia and the horn 99
3.3 GeoLoGIcaL Structure and reLIef of the horn of afrIca 3.3 GeoLoGIcaL Structure and reLIef of the horn of afrIca
Lakes of Ethiopia
Does Ethiopia have many lakes when compared to other African countries?
Compared to other countries, Ethiopia is rich in lakes. They are found dispersed on the plateaus and clustered in the Rift Valley.
Most of the lakes are the result of structures that occurred during the Quaternary Period; i.e., they are not outcomes of climate. This fact is proved by the location of these lakes in the drier parts of the country. The natural lakes found in Ethiopia can be classified into highland and Rift Valley lakes.
Highland Lakes
These lakes are found dispersed on the plateaus, either as crater or watershed lakes. These types of lakes resulted from different types of structural formations. A crater lake is formed after an explosive volcano breaks a mountain open, leaving a deep mouth. The mouth is filled with water – from either small streams or subterranean sources.
A watershed lake is formed when a sheet of lava dams up a shallow surface depression. For example, Lake Tana was formed during the Quaternary Period, when a sheet of flowing lava dammed the shallow depression that had already been formed between the Gojjam and Gondar massifs.
Example:
Crater lakes in Ethiopia:
F Bishoftu, Kuruftu, Babbo Gaya, and Arsedi, all around Bishoftu
F Wonchi and Dendi around Ambo, Ginchi and Wellisso
F Zequala near Bishoftu
F Hashenge near Korum in Tigray
F Haik, (some 30 kilometers away from Desse on the road to Woldiya
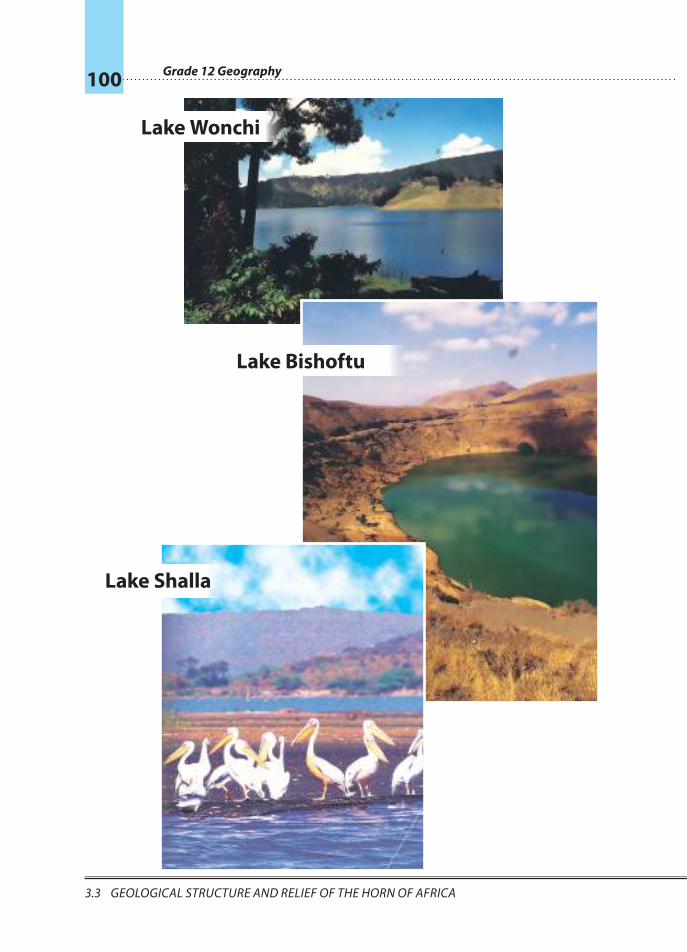
Grade 12 Geography 100
3.3 GeoLoGIcaL Structure and reLIef of the horn of afrIca
Lake Wonchi
Lake Bishoftu
Lake Shalla
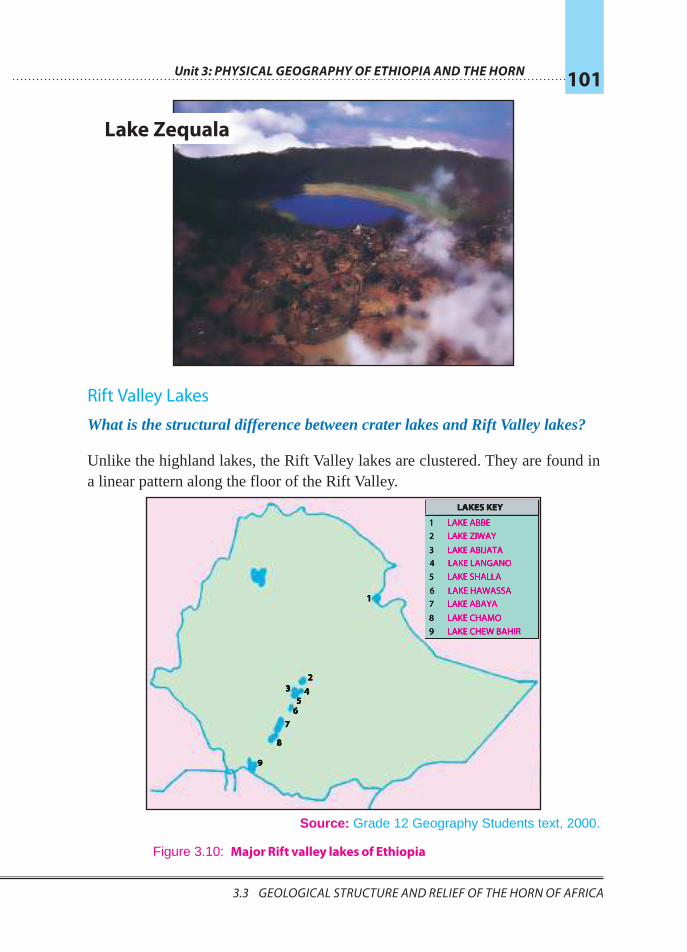
Unit 3: Physical GeoGraPhy of ethioPia and the horn 101
3.3 GeoLoGIcaL Structure and reLIef of the horn of afrIca 3.3 GeoLoGIcaL Structure and reLIef of the horn of afrIca
Rift Valley Lakes
What is the structural difference between crater lakes and Rift Valley lakes?
Unlike the highland lakes, the Rift Valley lakes are clustered. They are found in a linear pattern along the floor of the Rift Valley.
Source: Grade 12 Geography Students text, 2000.
Lake Zequala
1
23 4
56
7
9
8
LAKES KEY
1 LAKE ABBE2 LAKE ZIWAY3 LAKE ABIJATA4 LAKE LANGANO5 LAKE SHALLA6 LAKE HAWASSA7 LAKE ABAYA8 LAKE CHAMO9 LAKE CHEW BAHIR
Figure 3.10: Major Rift valley lakes of Ethiopia
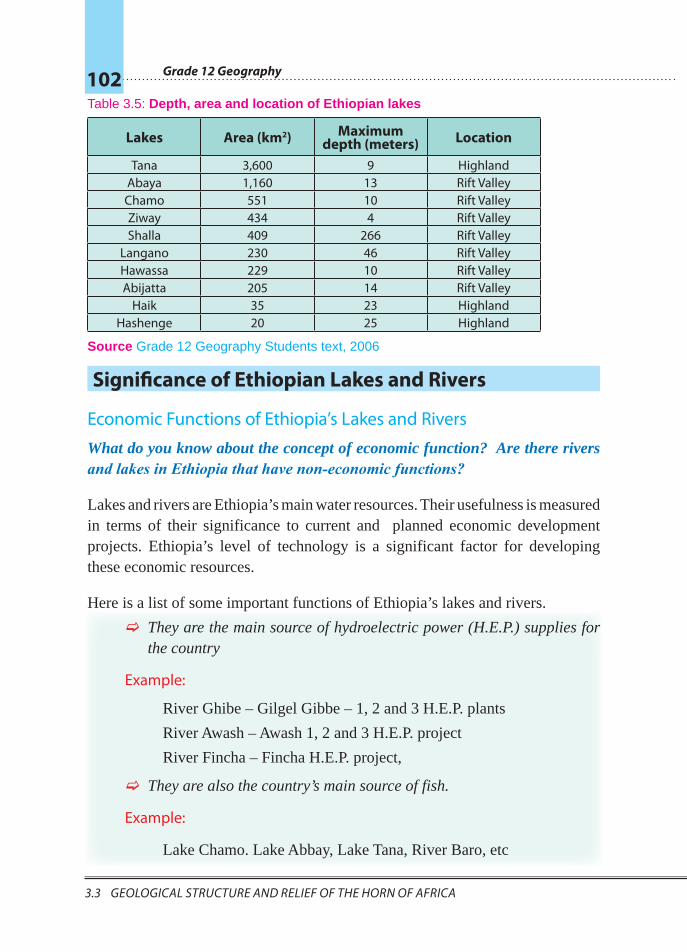
Grade 12 Geography 102
3.3 GeoLoGIcaL Structure and reLIef of the horn of afrIca
Table 3.5: Depth, area and location of Ethiopian lakes
Lakes Area (km2) Maximum depth (meters) Location
Tana 3,600 9 Highland Abaya 1,160 13 Rift Valley Chamo 551 10 Rift ValleyZiway 434 4 Rift ValleyShalla 409 266 Rift Valley
Langano 230 46 Rift ValleyHawassa 229 10 Rift ValleyAbijatta 205 14 Rift Valley
Haik 35 23 HighlandHashenge 20 25 Highland
Source Grade 12 Geography Students text, 2006
Significance of Ethiopian Lakes and Rivers
Economic Functions of Ethiopia’s Lakes and Rivers
What do you know about the concept of economic function? Are there rivers and lakes in Ethiopia that have non-economic functions?
Lakes and rivers are Ethiopia’s main water resources. Their usefulness is measured in terms of their significance to current and planned economic development projects. Ethiopia’s level of technology is a significant factor for developing these economic resources.
Here is a list of some important functions of Ethiopia’s lakes and rivers.
F They are the main source of hydroelectric power (H.E.P.) supplies for the country
Example:
River Ghibe – Gilgel Gibbe – 1, 2 and 3 H.E.P. plants
River Awash – Awash 1, 2 and 3 H.E.P. project
River Fincha – Fincha H.E.P. project,
F They are also the country’s main source of fish.
Example:
Lake Chamo. Lake Abbay, Lake Tana, River Baro, etc
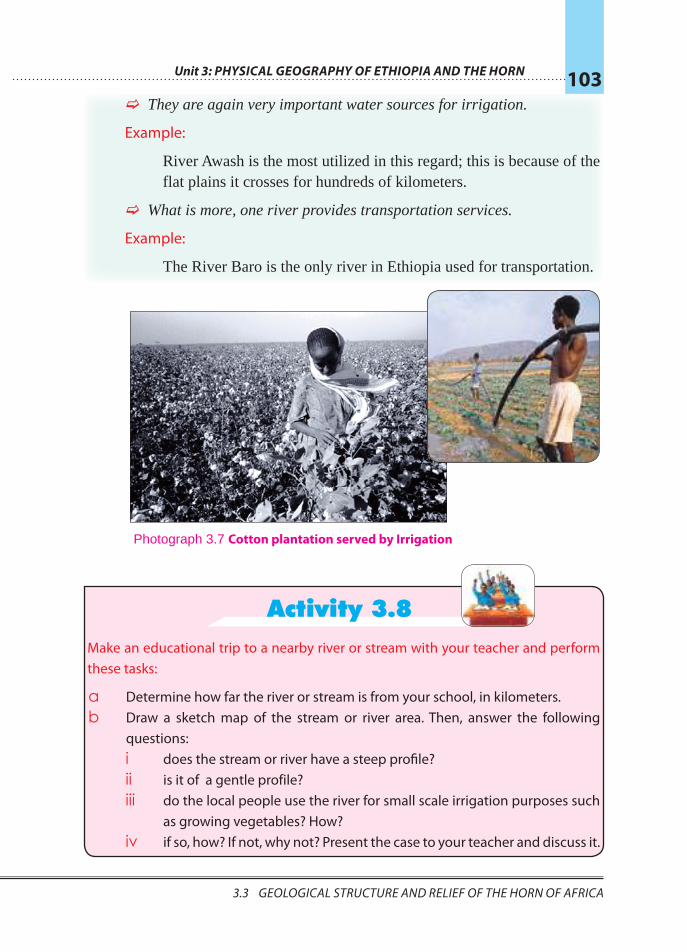
Unit 3: Physical GeoGraPhy of ethioPia and the horn 103
3.3 GeoLoGIcaL Structure and reLIef of the horn of afrIca 3.3 GeoLoGIcaL Structure and reLIef of the horn of afrIca
F They are again very important water sources for irrigation.
Example:
River Awash is the most utilized in this regard; this is because of the flat plains it crosses for hundreds of kilometers.
F What is more, one river provides transportation services.
Example:
The River Baro is the only river in Ethiopia used for transportation.
Activity 3.8Make an educational trip to a nearby river or stream with your teacher and perform these tasks:
a Determine how far the river or stream is from your school, in kilometers.b Draw a sketch map of the stream or river area. Then, answer the following
questions: i does the stream or river have a steep profile? ii is it of a gentle profile? iii do the local people use the river for small scale irrigation purposes such
as growing vegetables? How? iv if so, how? If not, why not? Present the case to your teacher and discuss it.
Photograph 3.7 Cotton plantation served by Irrigation
Grade 12 Geography 104
3.3 GeoLoGIcaL Structure and reLIef of the horn of afrIca
Ethiopia’s lakes and rivers provide recreation resorts and aesthetic value. They arealsoimportantsourcesofthenation’sfish.
Theirscenicbeautyemanates therichvarietyofbirds,fishandotherwildlife,spectacularly deep gorges, waterfalls of all description and the mists these produce. These panoramic features win the affection of the Ethiopian people and tourists and are sites of the country’s best recreational resorts. The economic potential of these scenic resources is enormous but is still not well developed.
3.3.4 Water-Resource Conservation and Management in Ethiopia
Why do we conserve water resources? Are our water resources running out? How do they support our existing needs? Are policy measures the correct solution to problems?
As you know, Ethiopia has been known as the “Water Tower of Northeastern Africa” for the last fifty to sixty years. Ethiopia is the second richest African country in terms of water-resource potential, following the Democratic Republic of Congo. However,
F drought is recurring every 3 to 5 years.
F some highland lakes are disappearing or are on the verge of disappearance.
Example:
Lake Haromaya in Hararghe zone and Lake Cheleklektu in Bishoftu.
F the volume and purity of Ethiopia’s rivers is decreasing. Pollutants are increasingly contaminating the country’s water resources.
F due to the rapid growth of human population, there is a crucial growing demand for potable water.
These and other factors have led to the need for the conservation and management of water resources in Ethiopia. In response to this need, the Federal Democratic Republic of Ethiopia has adopted a national conservation strategy for natural resources under the Ethiopian Environmental Protection Authority. The Authority has developed policy goals, objectives and guiding principles.
Unit 3: Physical GeoGraPhy of ethioPia and the horn 105
3.3 GeoLoGIcaL Structure and reLIef of the horn of afrIca 3.3 GeoLoGIcaL Structure and reLIef of the horn of afrIca
Overall Policy Goals
The overall policy goals are:
F improve and enhance the health and quality of life of all Ethiopians
F promote sustainable social and economic development through sound management and use of
K natural, human-made and cultural resources
K the environment
F perform these tasks in a manner that meets the needs of the present generation without compromising the ability of future generations to meet their own needs.
Policy Goals Related to Water Resources
In relation to water resources, the goals of the Ethiopian Environmental Protection Authority are:
F ensure that the control of environmental health hazards is a necessary condition in the design, constitution and use of dams and irrigation systems.
F recognize that natural ecosystems, particularly wetlands and upstream forests, are fundamental for regulating water quality and quantity, and integrate their rehabilitation and protection into the construction, development and management of water resources.
F ensure that any proposed introduction of exotic species into water ecosystems as subject to detailed studies and environmental-impact assessment.
F promote the protection of the interface between water-bodies and land (for example, lake shores, river banks and wetlands).
F involve water-resource users, particularly women and animal herders, in the local planning, designing, and follow up of water policies, programs and projects, in order to promote these activities without affecting the ecological balance.
F recycle waste water when it is found to be safe for health and the environment.
Grade 12 Geography 106
3.3 GeoLoGIcaL Structure and reLIef of the horn of afrIca
F promote, to the extent possible, viable measures to artificially recharge ground and surface-water resources.
F promote effective water-management techniques at the farm level for improved performance of medium-to-large-scale irrigation schemes.
F provide technical and credit support to the private sector in water-resource development activities.
Note
The Hydro Politics of Ethiopia
Ethiopia is the main source of the Nile waters. More than 86 percent of the water of the Nile originates from Ethiopia. However, it is a country that has made the least use of it.
During the past forty years Ethiopia was engaged in internal wars and did not have the time to harness the Nile waters for development.
However, Ethiopia’s interest in utilizing the Nile waters was clear. For example, in 1927, it sent Martin to the United States on a diplomatic mission to discuss the Lake Tana development project and recruit American engineers. However, the project failed to materialize due to opposition on the part of Britain and to the impending Italian invasion.
In the 1950s, Ethiopia contracted a US engineering firm to conduct a comprehensive study of the Abbay river. Sadly, at that time Egypt and the Sudan were engaged in negotiations regarding the full utilization of the Nile waters. Ethiopia was not included in the negotiations. It was in this context that the Ethiopian government protested, asserting Ethiopia’s right to utilize the water resources within its borders.
Despite these setbacks, Ethiopia’s rights to utilize its own water resources remain valid, reach on allocation has persisted the simple reasons that it is firmly committed to place and a win-win situation that can be derived from cooperation.
(Dr. Kinfe Abraham, 2000)

Unit 3: Physical GeoGraPhy of ethioPia and the horn 107
3.3 GeoLoGIcaL Structure and reLIef of the horn of afrIca 3.3 GeoLoGIcaL Structure and reLIef of the horn of afrIca
Þ Exercise 3.4 I Are these statements True or False?
1 In geography, drainage pattern and drainage system have the same meaning.
2 Most Ethiopian drainage patterns are dendritic.
3 One can confidently state that the plateau of Shoa serves as a watershed between the Abbay and Awash river basins.
4 Altitudinal factors cause the energetic flow of Ethiopian rivers.
5 The Abbay is the longest river in Ethiopia.
6 Almost all rivers in Ethiopia are navigable.
II Choose the best answer among the given alternatives
7 All the rivers below drain the Southeastern Highlands except.
A Wabeshebelle
B Ghenalle
C Omo-Ghibe
D Juba
8 Ethiopia’s largest surface water is found in the
A South and northwest
B Rift Valley System
C Western Lowlands
D A and B9 The southeastern drainage system consists of
A Genalle and Wabeshebelle rivers
B Omo and Gibbe rivers
C Baro and Akobo rivers
D Tekezze and Angereb rivers
10 The Awash River rises from the plateau of
A Hararge
B Bale
C Shewa
D South Wello
11 Which of the following rivers does not end in a lake?
A Segen
B Awash
C Omo-Ghibe
D Baro-Akobo
Grade 12 Geography 108
3.3 GeoLoGIcaL Structure and reLIef of the horn of afrIca
12 The Ethiopian lakes are said to be the results of structural activity. This is proved by their
A location in wet areas
B location in dry areas
C location at high altitudes
D having less volume of water
13 Which one of the following lakes is not a crater lake?
A Lake Ashenge
B Lake Wonchi
C Hawassa
D Lake Arsedi
14 What distinguishes the Rift Valley Lakes from the highland lakes?
A the fluctuation of their volume of water
B their significance for transportation
C their richness in chemicals that produce soda ash
D their location along transport lines
15 The deepest and shallowest lakes of Ethiopia are, respectively:
A Ziway and Shalla
B Shalla and Zeway
C Tana and Shalla
D Abbaya and Abyatta
16 No Ethiopian river is navigable except
A Abbay
B Athbara
C Baro–Akobo
D Omo
17 The Awash River is the most utilized in Ethiopia for irrigation purposes. This is mainly due to its:
A surrounding terrain,
B flow to the Afar lowlands
C unfluctuating volume of water
D great number of tributaries
18 One of the following is not a strategy adopted by the FDRE in conserving and managing water resources.
A Rehabilitating wetlands and headstream areas
B Providing technical support to the private sector in participating in the conservation strategy
C Recycling waste water when it is found to be safe
D Paying little concern to women’s role in the local involvement tasks.
Unit 3: Physical GeoGraPhy of ethioPia and the horn 109
3.3 GeoLoGIcaL Structure and reLIef of the horn of afrIca 3.4 cLIMate of ethIopIa and the horn
19 Which of the following statements is not correct about Ethiopia’s current water-resource status?
A Ethiopia is rich in rivers and lakes, but they are not utilized at all.
B Available water resources in Ethiopia are being widely used.
C Policy intervention is necessary to conserve Ethiopia’s water resources.
D A number of development projects are underway regarding the major rivers of Ethiopia.
3.4 CLIMATE OF ETHIOPIA AND THE HORNAt the end of this section, you will be able to:
Þ discuss the factors that influence the spatial distribution of the climatic elements of Ethiopia and the Horn;
Þ describe the spatial and temporal variation of temperature in Ethiopia and the Horn;
Þ explain the spatial and temporal variation of rainfall in Ethiopia and the Horn;
Þ compare the rainfall regions in Ethiopia.
Key Terms ³ Latitude ³ Altitude ³ Weather ³ Climate ³ Revolution of the earth
³ Rotation ³ Inter-Tropical Convergence zone ³ Equatorial westeries ³ North easterlies ³ South easterlies
Are you aware of the weather information that is broadcast and televised by the Ethiopian Radio and Television Service Agency every morning and night?
These reports inform the people of the projected daily maximum and minimum temperatures, cloud cover, humidity and other air conditions for the coming day. This information about air condition relates to weather. In contrast, climate information gives us long-term data about the average weather conditions of a place or a region over a long period of time; such a period is typically as long as 30 years or more.
Grade 12 Geography 110
3.4 cLIMate of ethIopIa and the horn
3.4.1 Factors Influencing the Spatial and Temporal Distribution of Climatic Elements in Ethiopia and the Horn
What do you know about the concepts of weather and climate? Do you watch weather broadcast every day? What is the significance of knowing the weather condition of a place?
Both weather and climate are composed of the following elements.
F precipitation
F temperature
F humidity
F air pressure
F wind
F sunshine, etc.
The distribution of these elements over the surface of the earth is uneven in terms of magnitude and time. For example, Ethiopia and the Horn as a whole experience different temperatures on the same day or within a month. This spatial and temporal distribution of climatic elements is governed by the climate control factors described in the sections below.
The following factors influence the control of the spatial and temporal distribution of the climatic elements in Ethiopia and the Horn:
 latitude
 altitude
 revolution of the earth and the inclination of the earth’s axis
 distance from the sea
 mountain barriers
 weather systems
 cloud cover
Latitude
Are latitudes and parallels the same?
Latitude, as a climate control, is the angular location of a place or point with reference to the direct rays of the sun. When we speak of the latitudinal impact on the climates of Ethiopia and the Horn, we are considering the intensity of temperature in the region.
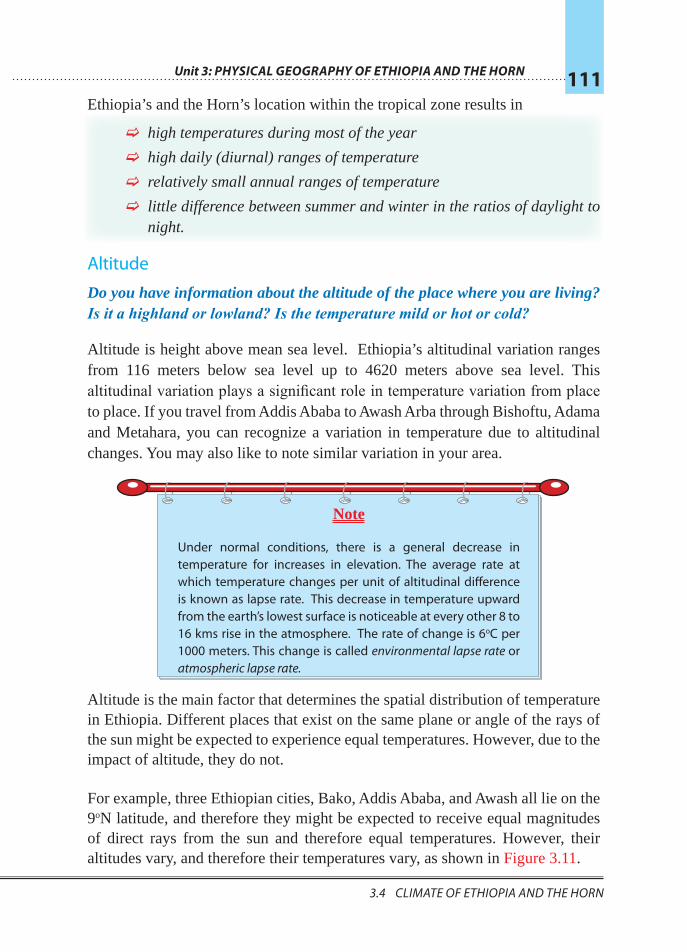
Unit 3: Physical GeoGraPhy of ethioPia and the horn 111
3.4 cLIMate of ethIopIa and the horn 3.4 cLIMate of ethIopIa and the horn
Ethiopia’s and the Horn’s location within the tropical zone results in
F high temperatures during most of the year
F high daily (diurnal) ranges of temperature
F relatively small annual ranges of temperature
F little difference between summer and winter in the ratios of daylight to night.
Altitude
Do you have information about the altitude of the place where you are living? Is it a highland or lowland? Is the temperature mild or hot or cold?
Altitude is height above mean sea level. Ethiopia’s altitudinal variation ranges from 116 meters below sea level up to 4620 meters above sea level. This altitudinalvariationplaysasignificantroleintemperaturevariationfromplaceto place. If you travel from Addis Ababa to Awash Arba through Bishoftu, Adama and Metahara, you can recognize a variation in temperature due to altitudinal changes. You may also like to note similar variation in your area.
Altitude is the main factor that determines the spatial distribution of temperature in Ethiopia. Different places that exist on the same plane or angle of the rays of the sun might be expected to experience equal temperatures. However, due to the impact of altitude, they do not.
For example, three Ethiopian cities, Bako, Addis Ababa, and Awash all lie on the 9oN latitude, and therefore they might be expected to receive equal magnitudes of direct rays from the sun and therefore equal temperatures. However, their altitudes vary, and therefore their temperatures vary, as shown in Figure 3.11.
Note
Under normal conditions, there is a general decrease in temperature for increases in elevation. The average rate at which temperature changes per unit of altitudinal difference is known as lapse rate. This decrease in temperature upward from the earth’s lowest surface is noticeable at every other 8 to 16 kms rise in the atmosphere. The rate of change is 6oC per 1000 meters. This change is called environmental lapse rate or atmospheric lapse rate.
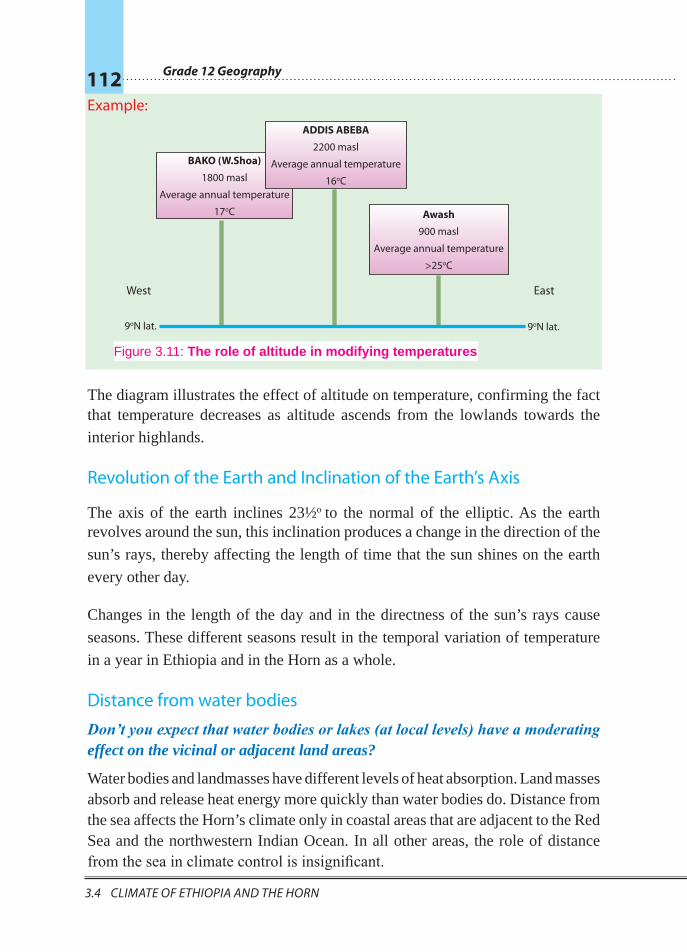
Grade 12 Geography 112
3.4 cLIMate of ethIopIa and the horn
Example:
The diagram illustrates the effect of altitude on temperature, confirming the fact that temperature decreases as altitude ascends from the lowlands towards the
interior highlands.
Revolution of the Earth and Inclination of the Earth’s Axis
The axis of the earth inclines 23½o to the normal of the elliptic. As the earth revolves around the sun, this inclination produces a change in the direction of the
sun’s rays, thereby affecting the length of time that the sun shines on the earth
every other day.
Changes in the length of the day and in the directness of the sun’s rays cause
seasons. These different seasons result in the temporal variation of temperature
in a year in Ethiopia and in the Horn as a whole.
Distance from water bodies
Don’t you expect that water bodies or lakes (at local levels) have a moderating effect on the vicinal or adjacent land areas?
Water bodies and landmasses have different levels of heat absorption. Land masses absorb and release heat energy more quickly than water bodies do. Distance from the sea affects the Horn’s climate only in coastal areas that are adjacent to the Red Sea and the northwestern Indian Ocean. In all other areas, the role of distance fromtheseainclimatecontrolisinsignificant.
9oN lat.9oN lat.
BAKO (W.Shoa)
1800 masl
Average annual temperature
17oC
ADDIS ABEBA
2200 masl
Average annual temperature
16oC
Awash
900 masl
Average annual temperature
>25oC
West East
Figure 3.11: The role of altitude in modifying temperatures
Unit 3: Physical GeoGraPhy of ethioPia and the horn 113
3.4 cLIMate of ethIopIa and the horn 3.4 cLIMate of ethIopIa and the horn
Mountain Barriers
Mountainbarrierscanaffectclimatein that theyexert influenceonthespatialdistribution of rainfall. Places located on the leeward side of mountains (also called rain shadow) receive little rain. This effect occurs in the northwestern and northeastern lowlands of Ethiopia and the Horn.
Weather Systems
Weather systems are actually the effects of spatial variation of the overhead sun, which in turn results in the variation of temperature, pressure and rainfall.
In the Horn of Africa, the apparent shift of the overhead sun between the Tropic of Cancer and Tropic of Capricorn contributes to the prevalence of different wind systems in different seasons. The major weather systems that impact over Ethiopia and the Horn are:
F The Northeast Tradewinds (prevalent in December, January and February)
F The Equatorial Westerlies (prevalent in June, July and August)
F The Equatorial easterlies (prevalent in September and October, March and April).
It is because of these weather systems that the rainfall period varies in Ethiopia and the Horn.
3.4.2 Spatial and Temporal Variation of Temperature in Ethiopia
What do we mean by spatial and temporal in the context of Geography?
A Spatial Variation of Temperature in Ethiopia
The two factors that most affect the spatial variation of temperature in Ethiopia are:
 cloud cover and
 altitude
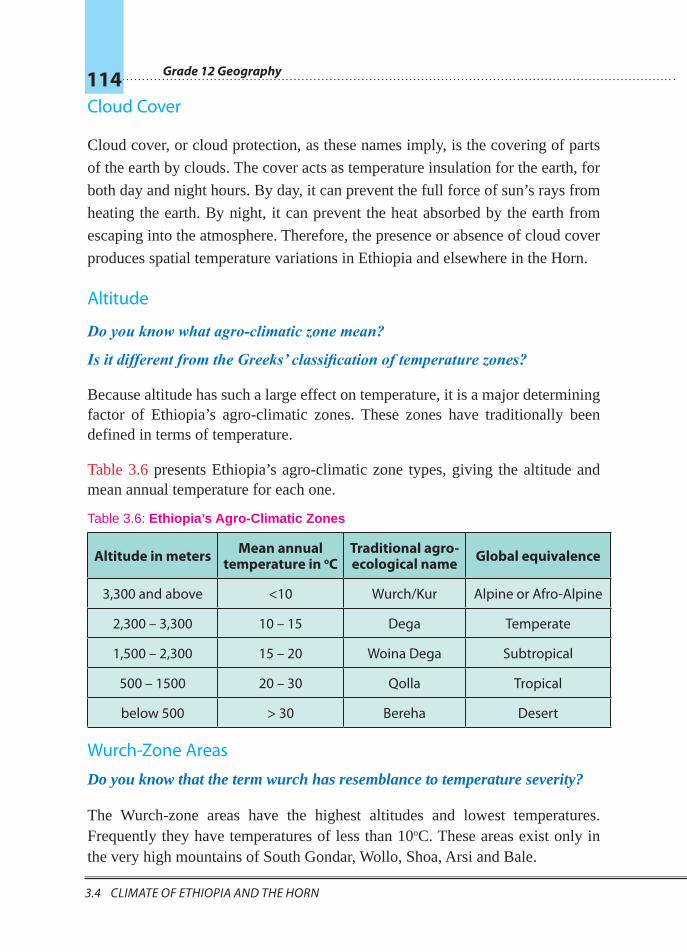
Grade 12 Geography 114
3.4 cLIMate of ethIopIa and the horn
Cloud Cover
Cloud cover, or cloud protection, as these names imply, is the covering of parts
of the earth by clouds. The cover acts as temperature insulation for the earth, for
both day and night hours. By day, it can prevent the full force of sun’s rays from
heating the earth. By night, it can prevent the heat absorbed by the earth from
escaping into the atmosphere. Therefore, the presence or absence of cloud cover
produces spatial temperature variations in Ethiopia and elsewhere in the Horn.
Altitude
Do you know what agro-climatic zone mean?
Is it different from the Greeks’ classification of temperature zones?
Because altitude has such a large effect on temperature, it is a major determining factor of Ethiopia’s agro-climatic zones. These zones have traditionally been defined in terms of temperature.
Table 3.6 presents Ethiopia’s agro-climatic zone types, giving the altitude and mean annual temperature for each one.
Table 3.6: Ethiopia’s Agro-Climatic Zones
Altitude in meters Mean annual temperature in oC
Traditional agro-ecological name Global equivalence
3,300 and above <10 Wurch/Kur Alpine or Afro-Alpine
2,300 – 3,300 10 – 15 Dega Temperate
1,500 – 2,300 15 – 20 Woina Dega Subtropical
500 – 1500 20 – 30 Qolla Tropical
below 500 > 30 Bereha Desert
Wurch-Zone Areas
Do you know that the term wurch has resemblance to temperature severity?
The Wurch-zone areas have the highest altitudes and lowest temperatures. Frequently they have temperatures of less than 10oC. These areas exist only in the very high mountains of South Gondar, Wollo, Shoa, Arsi and Bale.
Unit 3: Physical GeoGraPhy of ethioPia and the horn 115
3.4 cLIMate of ethIopIa and the horn 3.4 cLIMate of ethIopIa and the horn
Example:
Mt. Ras Dashen in Semine Gondar Mt. Guna in South GondarMt. Megezez in North ShoaMt. Batu in Bale, etc.
Dega-Zone Areas
What crops are grown in Dega areas?
The Dega-zone areas are highland areas with lower altitudes and higher temperatures than Wurch-zone areas. Historically, Dega-zone areas were the home of concentrated human settlement. They were chosen because of the features below:
i secure location (from which people could defend themselves from threats)
ii reliable rainfall
iii absence of diseases such as malaria, etc.
Due to this high concentration of human population, the Dega zone has been intensively cultivated and has a high rate of soil erosion, overgrazing and deforestation.
Some of the humid areas of this zone support two growing periods per year under rain-fed agriculture.
Example:
F Dinsho in Bale
F Chillallo in Arsi
F Hulla in Sidama
F Debresina in North Shewa
Note
Most of Ethiopia’s medieval and later settlements are concentrated in Dega-zone agro-climatic areas.
Grade 12 Geography 116
3.4 cLIMate of ethIopIa and the horn
Woina-Dega-Zone Areas
What is your understanding why the term Woina Dega comes after Dega? Does the term mean milder Dega?
The Woina-Dega-zone areas contain most of Ethiopia’s agricultural land. They are the country’s main areas producing:
F Surplus grain F Inset and its derivatives
In the Woina-Dega zone, as in the Dega zone, there can be two growing seasons when rainfall reliability is high.
Qolla Zone and Bereha-Zone Areas
What are the dominant crops grown in Qolla areas? Can we grow crops in Bereha zone areas?
TheQollaandBerehaagro-climaticzonesarelargelyconfinedtolowlandareaswith altitudes of 1500 meters and below. They are sparsely populated and their populations are primarily engaged in pastoralist activities. They occupy
F The peripheral areas of Ethiopia and Eritrea
F Most of Somalia
F Djibouti
B Temporal variation of temperature in Ethiopia
Can you identify the temperature differences in Ethiopia between the months of April/May and those of October/November? How do these differences occur?
In Ethiopia and elsewhere in the Horn, temperatures vary from season to season. For example, in most of Ethiopia, high temperatures are recorded from March to June. Conversely, low temperatures are recorded from November to February These variations are primarily due to.
F the tilting of the earth at 23½º to the normal elliptic
F the distance of the overhead sun and its apparent north-south movement across the equator as the earth revolves around the sun
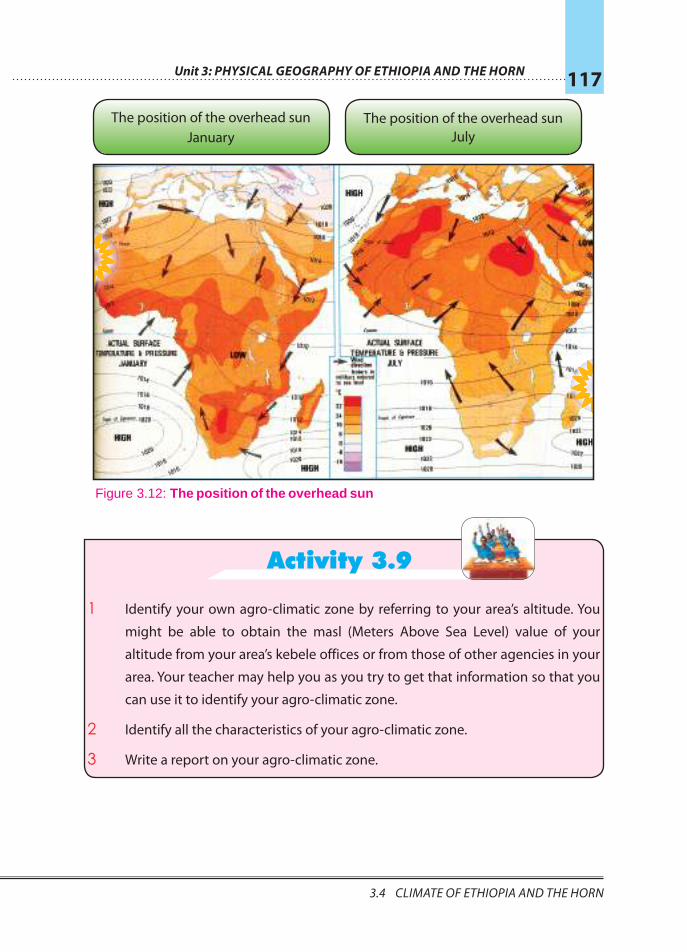
Unit 3: Physical GeoGraPhy of ethioPia and the horn 117
3.4 cLIMate of ethIopIa and the horn 3.4 cLIMate of ethIopIa and the horn
Activity 3.9
1 Identify your own agro-climatic zone by referring to your area’s altitude. You
might be able to obtain the masl (Meters Above Sea Level) value of your
altitude from your area’s kebele offices or from those of other agencies in your
area. Your teacher may help you as you try to get that information so that you
can use it to identify your agro-climatic zone.
2 Identify all the characteristics of your agro-climatic zone.
3 Write a report on your agro-climatic zone.
The position of the overhead sun January
The position of the overhead sun July
Figure 3.12: The position of the overhead sun
Grade 12 Geography 118
3.4 cLIMate of ethIopIa and the horn
3.4.3 Spatial and Temporal Variation of Rainfall in Ethiopia and the Horn
Do you distinguish the two concepts spatial and temporal? Which of the two terms is very much explanatory in the distribution of rainfall in time series?
Rainfall is one of the main climatic elements, as we indicated in the preceding discussion on the effects of weather systems and the distribution of climatic elements in Ethiopia and the Horn. Let us now consider the variation in detail.
A Spatial Variation of Rainfall in Ethiopia and the Horn
Ethiopia and the Horn experience marked spatial and temporal variations of rainfall. The spatial variation is the result of the strength and nature of prevailing weather systems.
As described earlier, Ethiopia’s and the Horn’s weather systems result from
F the apparent movement of the overhead sun F prevailing winds F the associated Inter-Tropical Convergence Zone
The first two factors were described in detail earlier. Now let’s focus on the effects of the associated Inter-Tropical Convergence zone.
Inter-Tropical Convergence Zone (ITCZ)
It is a low pressure zone formed by the convergence of Northeast Tradewinds and the Equatorial Westerlies. It shifts north and south of the equator following the position of the overhead sun.
In July, its position is at the Tropic of Cancer. During this time, Ethiopia and the Horn come under the influence of the Equatorial Westerlies and Easterlies. These winds bring moisture to the highlands but decrease their magnitude and length of rainy periods northwards.
In January, its position shifts to the Tropic of Capricorn leaving the region for the prevalence of the Northeast Tradewinds that are non-moistrue-laden. During this time only the Eritirean coastal lands and the Afar region receive rain. In most of Ethiopia, western Eriteria and Somalia, it becomes dry season.
In March and September, the position of the ITCZ is around the equator. Hence, the Equatorial Easterlies provide rain to the highlands of Somalia, and to the Central and Southeastern lowlands and highlands of Ethiopia.
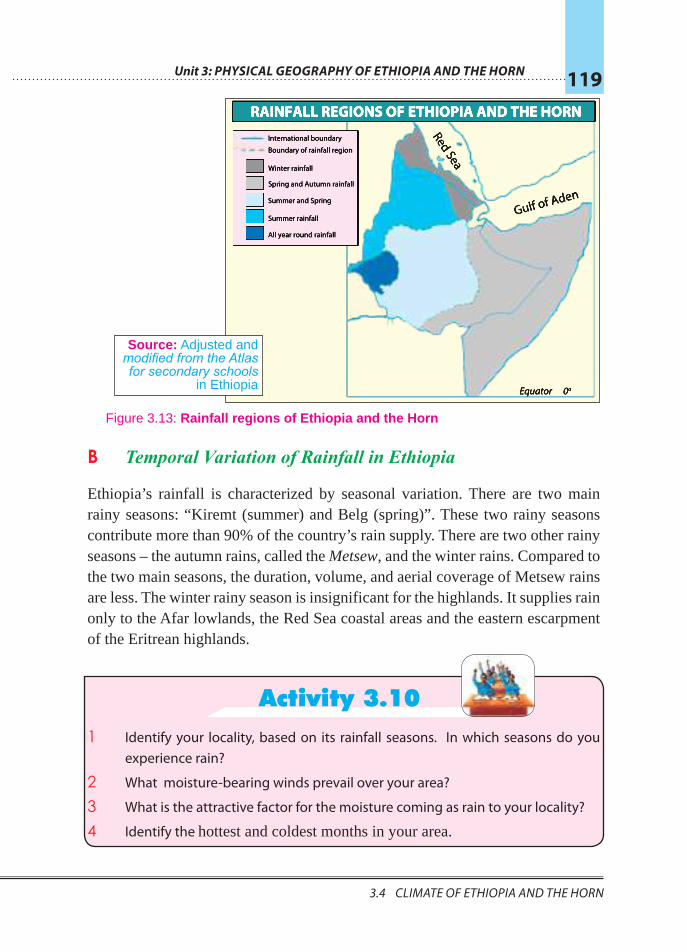
Unit 3: Physical GeoGraPhy of ethioPia and the horn 119
3.4 cLIMate of ethIopIa and the horn 3.4 cLIMate of ethIopIa and the horn
B Temporal Variation of Rainfall in Ethiopia
Ethiopia’s rainfall is characterized by seasonal variation. There are two main rainy seasons: “Kiremt (summer) and Belg (spring)”. These two rainy seasons contribute more than 90% of the country’s rain supply. There are two other rainy seasons – the autumn rains, called the Metsew, and the winter rains. Compared to the two main seasons, the duration, volume, and aerial coverage of Metsew rains are less. The winter rainy season is insignificant for the highlands. It supplies rain only to the Afar lowlands, the Red Sea coastal areas and the eastern escarpment of the Eritrean highlands.
Activity 3.101 Identify your locality, based on its rainfall seasons. In which seasons do you
experience rain?
2 What moisture-bearing winds prevail over your area?
3 What is the attractive factor for the moisture coming as rain to your locality?
4 Identify the hottest and coldest months in your area.
Red SeaGulf of Aden
Equator 0o
International boundary
Boundary of rainfall region
Summer and Spring
Winter rainfall
Spring and Autumn rainfall
Summer rainfall
All year round rainfall
RAINFALL REGIONS OF ETHIOPIA AND THE HORN
Source: Adjusted and modified from the Atlas for secondary schools
in Ethiopia
Figure 3.13: Rainfall regions of Ethiopia and the Horn

Grade 12 Geography 120
3.4 cLIMate of ethIopIa and the horn
3.4.4 Rainfall Regions in Ethiopia and the Horn
Does rainfall regions indicate variation in rainfall magnitude and duration within Ethiopia and the Horn?
Based on rainfall distribution, both in space and time, five types of rainfall regions can be identified in Ethiopia and the Horn. These are:
F year-round rainfall region (wet in most months) F summer rainfall region F autumn-and-spring rainfall region F winter rainfall region F merged spring, summer, and autumn rainfall region
Let us consider each region in turn.
Year-Round Rainfall Region
In Ethiopia, the area of year-round rainfall:
F includes the southwestern plateau comprising the highlands of Wellega, Keffa, Illubabor and Gamo Goffa.
This region can be represented by the following stations:
Gore, Mizan, Metu, Bonga, Gambella, etc.
The region has more rainy days than any other part of the country. The average rainfall varies from 1400 mm to 2200 mm.
The year-round rainfall region is represented by the letter B on Figure 3.14.
Summer Rainfall Region
The summer rainfall region is the largest in the country. This region consists of the Northwest Highlands and Western Lowlands, and can be represented by the following stations.
Debremarkos, Fitche, Gondar, Bahrdar, etc.
Its moisture-bearing winds are the Equatorial Westerlies and Easterlies. The summer rainfall region is represented by the letter A in Figure 3.14.
Unit 3: Physical GeoGraPhy of ethioPia and the horn 121
3.4 cLIMate of ethIopIa and the horn 3.4 cLIMate of ethIopIa and the horn
Autumn-and-Spring Rainfall Region
The autumn-and-spring rainfall region covers the southeastern highlands and associated lowlands up to the Somalia coasts. They can be represented by the following stations:
Gode, Moyalle, Jigjiga, Yabello, Baydhabo.
The region’s moisture-bearing winds are the Equatorial Easterlies. They pick up moisture from the Indian Ocean, and they blow over the autumn and spring rainfall region when the Northeasterlies and Equatorial Westerlies are weak. The region’s average rainfall varies from less than 500 to 1000 mm.
The autumn-and-spring rainfall region is represented by E in Figure 3.14.
Winter Rainfall Region
The winter rainfall region consists of the eastern escarpment of the western highlands, the middle Rift Valley section, the Afar subdivision and Eritrea. The winter rainfall region can be represented by the following stations.
Mitswa, Assaita and Djibouti.
The region’s moisture-bearing winds are, for the most part, the North Easterlies. The air mass is continental (dry) and has only a short sea trajectory (that is the Red Sea).
It is represented by letter D in Figure 3.14. The region’s total annual moisture is very low and of short duration.
Merged Spring, Summer and Autumn Rainfall Region
The merged spring, summer and autumn rainfall region is the smallest in the country. It consists mainly of the western foothills of the Southeastern Highlands.
Note
In Ethiopia, highland rainfall is more dependable than lowland rainfall. However, highland dependability decreases from the southwestern highlands in all directions. In short, rainfall variability (deviation from the expected amount and time) decreases from areas of heavy rains to areas of low rainfall.

Grade 12 Geography 122
3.4 cLIMate of ethIopIa and the horn
The region’s total annual rainfall varies from 1500 mm to 1000 mm. It covers a corridor that stretches from the Sidama Highlands to the Hararge Plateau.
The merged spring, summer, and autumn rainfall region is represented by the letter C in Figure 3.14: stations-Assaita, Awash, etc.
Þ Exercise 3.5 I Match the items of Column A with the items of Column B.
A B1 Experiences rain almost all year round.
2 Experiences mostly summer rains.
3 Temperature zones that are largely
confinedtoplacesover3,300masl.4 Temperature zones that are largely
confinedtothesoutheasternlowlands.5 Moisture-bearing winds to the central
and northern parts of Ethiopia.
6 Pools for the autumn and spring rains
of Ethiopia.
7 Pools for the summer rains of Ethiopia.
8 The continental winds that prevail in
winter over the greater part of the Red
Sea and central Ethiopia.
A Northeasterlies
B The highlands of South Gondar
C Bereha
D Alpine or Afro-Alpine
E The Equatorial Westerlies
F The Indian Ocean
G The Atlantic Ocean
H The plateaus of Illubabor and Western Wellega
34 36 38 40 42 44 46 48
1414
1212
1010
88
66
44
4846444240383634
0 50 100 200 300 400
Kilometers
Scale
A
BE
C
D
Figure 3.14: Rainfall Regions of Ethiopia
Unit 3: Physical GeoGraPhy of ethioPia and the horn 123
3.4 cLIMate of ethIopIa and the horn 3.5 naturaL VeGetatIon and WILd anIMaLS of ethIopIa
II Questions to Think Over.
9 What natural factors are responsible for the all year round wet conditions of the southwestern part of Ethiopia?
10 What do we mean by the Inter Tropical Convergence Zone? Why does it apparently shift north and south of the equator?
11 If the axis of the earth were perpendicular, what effect would it have on temporal variation of temperature?
12 By referring to the rainfall regions of Ethiopia and the Horn,
a Identify the rainfall region in which you live.
b Suggest the total annual rainfall that your area experiences referring to the theoretically proposed amount in the text.
c For each rainfall region, select a representative town. Then draw a bar graph that shows the rainfall of each of the towns you have chosen. For source materials, use references such as your school atlas, the National Atlas of Ethiopia, textbooks, and other sources of information.
d Which region has the least rainfall variability?
3.5 NATURAL VEGETATION AND WILD ANIMALS OF ETHIOPIA
At the end of this section, you will be able to: Þ relate types of natural vegetation to climatic regions; Þ identify the wild animals of Ethiopia; Þ discuss the effects of human intervention on forest lands; Þ show interest to participate in the conservation of natural vegetation and
wild animals.
Key Terms
³ Afro alpine ³ Forest ³ Desert ³ Gallery forest ³ Coniferous trees ³ Deforestation
³ Overgrazing ³ Endemic ³ National park ³ Game reserve ³ Overcultivation ³ Soil conservation
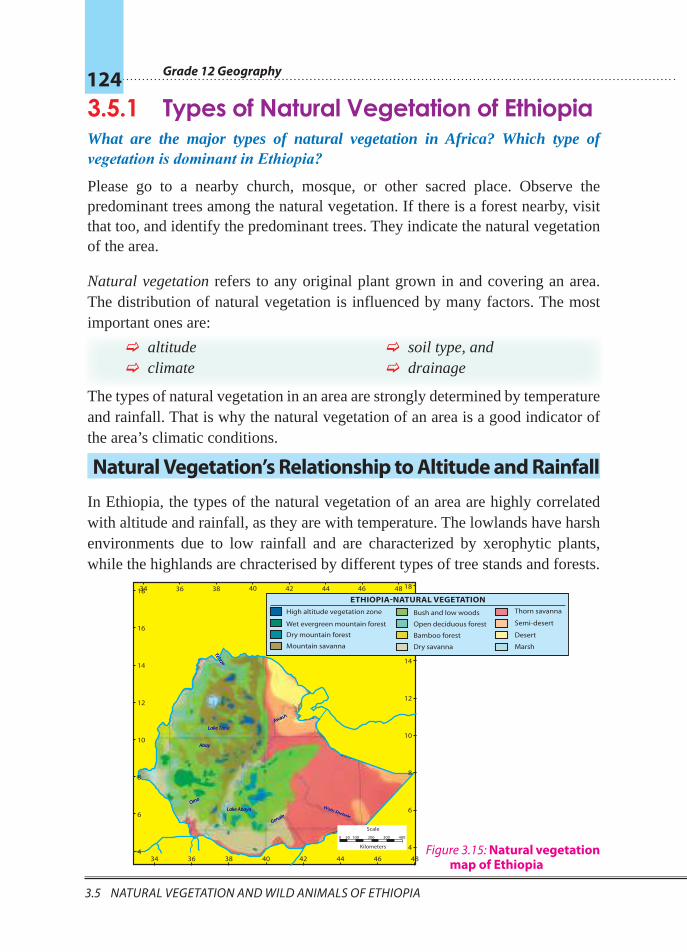
Grade 12 Geography 124
3.5 naturaL VeGetatIon and WILd anIMaLS of ethIopIa
3.5.1 Types of Natural Vegetation of EthiopiaWhat are the major types of natural vegetation in Africa? Which type of vegetation is dominant in Ethiopia?
Please go to a nearby church, mosque, or other sacred place. Observe the predominant trees among the natural vegetation. If there is a forest nearby, visit that too, and identify the predominant trees. They indicate the natural vegetation of the area.
Natural vegetation refers to any original plant grown in and covering an area. The distribution of natural vegetation is influenced by many factors. The most important ones are:
F altitude F climate
F soil type, and F drainage
The types of natural vegetation in an area are strongly determined by temperature and rainfall. That is why the natural vegetation of an area is a good indicator of the area’s climatic conditions.
Natural Vegetation’s Relationship to Altitude and Rainfall
In Ethiopia, the types of the natural vegetation of an area are highly correlated with altitude and rainfall, as they are with temperature. The lowlands have harsh environments due to low rainfall and are characterized by xerophytic plants, while the highlands are chracterised by different types of tree stands and forests.
figure 3.15: Natural vegetation map of Ethiopia
Wabi ShebeleGenale
Lake Abaya
Awash
Omo
Abay
Lake Tana
Tekeze
34 36 38 40 42 44 46 48 1818
1616
1414
1212
1010
88
66
44
4846444240383634
0 50 100 200 300 400
Kilometers
Scale
ETHIOPIA-NATURAL VEGETATIONHigh altitude vegetation zone
Wet evergreen mountain forest
Dry mountain forest
Mountain savanna
Bush and low woods
Dry savanna
Desert
Marsh
Open deciduous forest
Bamboo forest
Thorn savanna
Semi-desert
Unit 3: Physical GeoGraPhy of ethioPia and the horn 125
3.5 naturaL VeGetatIon and WILd anIMaLS of ethIopIa 3.5 naturaL VeGetatIon and WILd anIMaLS of ethIopIa
Based on altitude, we can classify the natural vegetation of Ethiopia into the following five types:
 Afro-alpine and sub-Afro alpine
 Forests
 Woodland savanna
 Steppe vegetation
 Desert and semidesert vegetation
Afro-Alpine and Sub Afro-Alpine Vegetation
What do you know about the difference between Afro - Alpine and Sub Afro Alpine?
This type of vegetation is found at very high altitudes (above 3300 meters). Afro-alpine and sub-afro-alpine vegetation is very similar to European alpine vegetation. Sub-afro-alpine vegetation is found between 3000 – 3300 m, while Afro-alpine vegetation is found at higher altitudes than these. In Ethiopia, Afro-alpine and sub-Afro-alpine vegetations are found in the:
F Highlands of Semein and
F Highlands of Bale
Afro-Alpine vegetation consists of tussock grasslands, serules, scattered mosses and lichens. SubAfro Alpines are predominantly woodland scrubs. Gibra (Lobelia rhynchopetalum) and Asta (Erica arborea) are dominant plant species in this region of natural vegetation.
Forests
What is the present status of Ethiopia’s forest resources when compared to the other countries of the Horn?
In Ethiopia, forests are characterized by broad altitudinal ranges (450 – 3300 m) and
large variations in mean annual rainfall (200 – 2200 mm). This wide variation
in altitude and rainfall results in the formation of highland and lowland forests.
These two types of forests have very different characteristics since they are the
results of altitudinal zonation.
Grade 12 Geography 126
3.5 naturaL VeGetatIon and WILd anIMaLS of ethIopIa
A Highland Forests (forests that grow between 1500 - 3300 masl altitude)
Ethiopia’s highland forests consist of
F Kerkha (Arundinarial) 2800 – 3000 masl
F Tid (Juniperous Procera) or Coniferous trees 2200 – 2800 masl
F Zigba (Podocarpus) 1800 – 2200 masl
F Woira (Oliia Africana) and Kosso (Hagenia Abbyssinia (1500 – 1800)
B Lowland Forests (forests that grow below 1500 m altitude)What are the temperature and rainfall limits for the formation of forests?
Is there a strong relationship between altitudinal variation and types of forests? Which part of Ethiopia is currently under dense forest cover?
These forests are known as gallery/riverine forests. In Ethiopia, they grow along the banks of the Awash, Wabishabelle, and Ghanalle Rivers where moisture is available in the soil. The predominant trees are Sholla and Warka. In areas where mean annual rainfall exceeds 500 mm, Baphia forest predominates.
Woodland Savanna
Can you remember the sub-divisions of the African Savana? Do you expect certain similarities between woodland Savana and proper Savana?
Like forests, Savanna woodlands are found in both highland and lowland areas. Their altitudinal range is 250 – 2300 m, and their mean annual rainfall range is between 200 – 1400 mm. (Example: acacia, grass etc.)
However, such vegetation is dominant at lower elevations and drier climates than the forests.
Savanna grasslands experience marked seasons and are characterized by scattered acacia trees.
In areas where mean annual rainfall is more than 1000 mm, these grasslands can formattractivepark-likeareaswithacacia,wildfig,sycamoreandkossotrees.Ethiopia’s savanna grasslands are found in the southern half of Ziway, Langano, Abiyatta and Hawassa.

Unit 3: Physical GeoGraPhy of ethioPia and the horn 127
3.5 naturaL VeGetatIon and WILd anIMaLS of ethIopIa 3.5 naturaL VeGetatIon and WILd anIMaLS of ethIopIa
AFROALPINE REGION
SUB AFRO ALPINE REGION
Precipitation (mm)
Altitude (m)
FOREST REGION
WO
OD
LAN
D S
AVA
NN
AH
RE
GIO
N
JUNIPERUS FOREST
500 1000
1000
2000
3000
4000
1500 2000
PODOCARPUS FOREST
BAPHIA FOREST
OLEA FOREST
ANINGERIA FOREST
ARUNDINARIA FOREST
JUNIPERUS WOODLAND
STEP
PE R
EGIO
N
SEM
I DES
ERT
REG
ION
ACACIA WOODLAND
MIXED DECIDUOUS WOODLAND
Acacia mellifera
w. Acacia
seyal w.
Acacia etbaica w.
Acacia xiphocorpa w.
Figure 3.16: Vegetation regions correlated to altitude and mean annual rainfall

Grade 12 Geography 128
3.5 naturaL VeGetatIon and WILd anIMaLS of ethIopIa
Semi-desert and Desert Vegetation
Is there a remarkable difference between semi desert and desert vegetation? How can you differentiate the two?
Sem-idesert and desert vegetation consists of short acacia, thorn bushes, succulent plants and a few rough grasses. In Ethiopia, vegetation of this kind is found in the Eastern, Northwestern and Southeastern Lowlands, i.e., in areas where annual rainfall is below 500 mm and drought persists for a long period of time.
Activity 3.111 With your teacher, schedule an educational trip to nearby natural areas. If possible,
the teacher will have a camera or video camera to use during the trip.
2 Draw a sketch map of the target area.
3 Write a short report describing the area’s
F predominant trees
F temperature
F rainfall seasons
4 With your classmates, discuss and then list the area’s natural vegetation.
Note
Concern for the preservation of Ethiopia’s forests must be a major issue on the public agenda. Communities and individuals must participate in the conservation and management of the country’s forest resources. Our pressing needs to perform these tasks is a call to every citizen.
Unit 3: Physical GeoGraPhy of ethioPia and the horn 129
3.5 naturaL VeGetatIon and WILd anIMaLS of ethIopIa 3.5 naturaL VeGetatIon and WILd anIMaLS of ethIopIa
Þ Exercise 3.6Match the items in Box A with those in Box B
Box A
1 Natural vegetation
2 Baphia forest
3 Juniperous procera
4 Arundinaria forests
5 Riverine forests
6 Afro-alpine forests
7 Practicing agro-forestry
8 Developing school curricula in forestry management
9 Promoting the role of youth in conserving local forest resources
Box B
A Forests found in humid areas of about 1000 masl or below
B An indicator of an area’s climate
C A highland forest similar to forests of coniferous trees
D Institutional development to conserve forest resources
E Community capacity building to conserve forest resources
F A highland forest that grows between 2500 – 3000 meters
G Gallery forests
H Type of forest that grows above 3000 meters
I Community practices to conserve or reduce the destruction of forests
3.5.2 Wild Animals of EthiopiaDo you think that wild animals have significance to the national economy? If so, can you mention some?
The diversity in Ethiopia’s topography, climate, and vegetation has given the country a wide variety of wild animals. Ethiopia’s wild-animal stock is generally similar to that of East Africa as a whole, due to topographic similarity and other aspects.

Grade 12 Geography 130
3.5 naturaL VeGetatIon and WILd anIMaLS of ethIopIa
Ethiopia has about 277 species of mammals and 862 species of birds. Of these, seven species of mammals and twenty five species of birds are endemic to Ethiopia.
Types of Wild Animals in Ethiopia
Can you identify or state some of the common and endemic wild animals of Ethiopia? Which type is prevalent in your wereda or zone?
The many types of wild animals found in Ethiopia can be grouped into the following broad categories.
F Common wild animals: These ones are animals commonly found in many places of the world. Many areas of Ethiopia have many common wild animals, including the hyena and the jackal.
F Game animals: These are animals that are killed for sport. Ethiopia’s game animals include herbivores and carnivores. They are found in the lowlands.
Here are some examples of Ethiopia’s game animals:
F Arboreals: These animals are animals that climb up trees. Ethiopia’s arboreal animals, such as the Colobus monkey and baboons, are mostly found in the rainforest regions of Ethiopia.
F Aquatic animals: These creatures are animals that live in lakes and rivers. Example: Fish, crocodiles and hippopotamus.
F Birds: Ethiopia has different kinds of both endemic and migratory birds; for example, Pelicans and flamingoes.
F Rare/Endemic animals: These are wild animals found only in Ethiopia. These days Ethiopia’s endemic animals exist in only very small numbers. They inhabit highland and other areas. They are at great risk of extinction. The following are some of them.
K Walia Ibex (wild goat), found in the Semein highlands.
K Mountain Nyala (Dega Agazon), found in the Bale mountains.
K Carnivores lions, leopards, cheetahs etc.
K Herbivores browsers – giraffes
grazers – wild asses, zebras, etc.
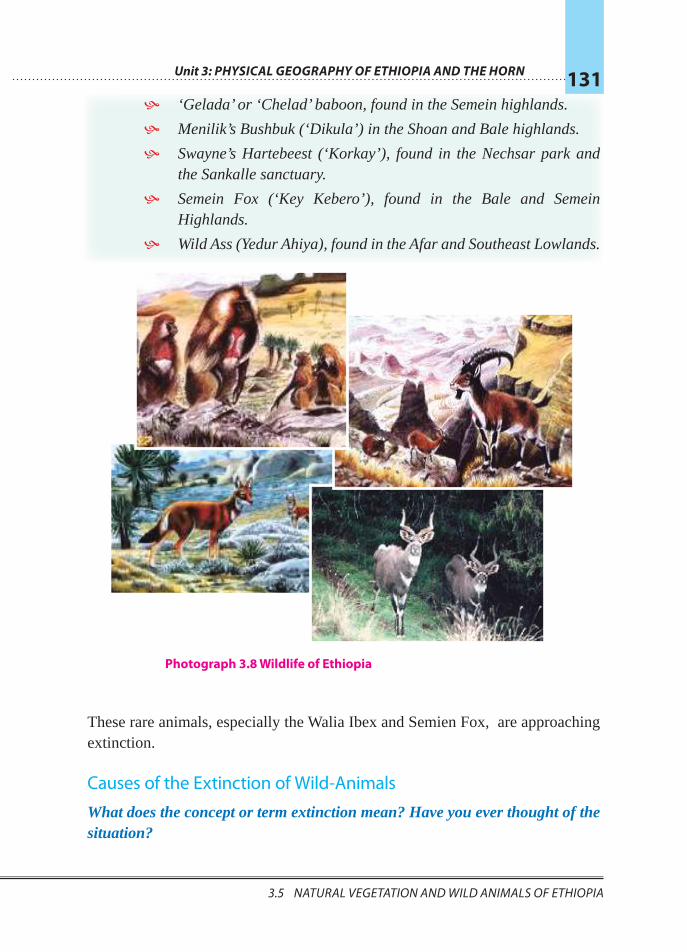
Unit 3: Physical GeoGraPhy of ethioPia and the horn 131
3.5 naturaL VeGetatIon and WILd anIMaLS of ethIopIa 3.5 naturaL VeGetatIon and WILd anIMaLS of ethIopIa
K ‘Gelada’ or ‘Chelad’ baboon, found in the Semein highlands.
K Menilik’s Bushbuk (‘Dikula’) in the Shoan and Bale highlands.
K Swayne’s Hartebeest (‘Korkay’), found in the Nechsar park and the Sankalle sanctuary.
K Semein Fox (‘Key Kebero’), found in the Bale and Semein Highlands.
K Wild Ass (Yedur Ahiya), found in the Afar and Southeast Lowlands.
These rare animals, especially the Walia Ibex and Semien Fox, are approaching extinction.
Causes of the Extinction of Wild-Animals
What does the concept or term extinction mean? Have you ever thought of the situation?
Photograph 3.8 Wildlife of Ethiopia
Grade 12 Geography 132
3.5 naturaL VeGetatIon and WILd anIMaLS of ethIopIa
The main reasons for such conditions are the shrinking and destruction of habitats, which are mainly forest land by way of:
F rapid expansion of farmland, settlements, and industrialization
F expansion of grazing land
F wide spread practices of illegal hunting by the local people in search of meat, skin, fur, horn and ivory.
F frequent wild fires
What is more,
F migration of the wild animals to neighboring countries, due to shortages of food and water in Ethiopia adds to their perpetual disappearance.
Conservation Measures
What can we do to save, sustain and protect wildlife resources?
Here are some conservation measures that have been recommended:
F establish national parks, game reserves and sanctuaries.
F Monitor and administer existing conservation areas properly.
F establish and implement strong laws that effectively prohibit illegal hunting.
F educate the public about environment protection.
F protect habitats.
F educate and encourage local communities to protect their animals’ habitats and resources.
As you can see, some of these mitigation measures involve direct protection of the animals – for example by establishing and properly administering protected areas; and by training people in how to protect these areas.
Establishing Protected Parks, Reserves, and Sanctuaries.
National Parks
Are there national parks in your region? Have you had an opportunity to participate in educating the community about the conservation of wild animals?
National parks are conservation areas for wild animals in which legal hunting is allowed, with some restrictions. The Ethiopian National Parks are.
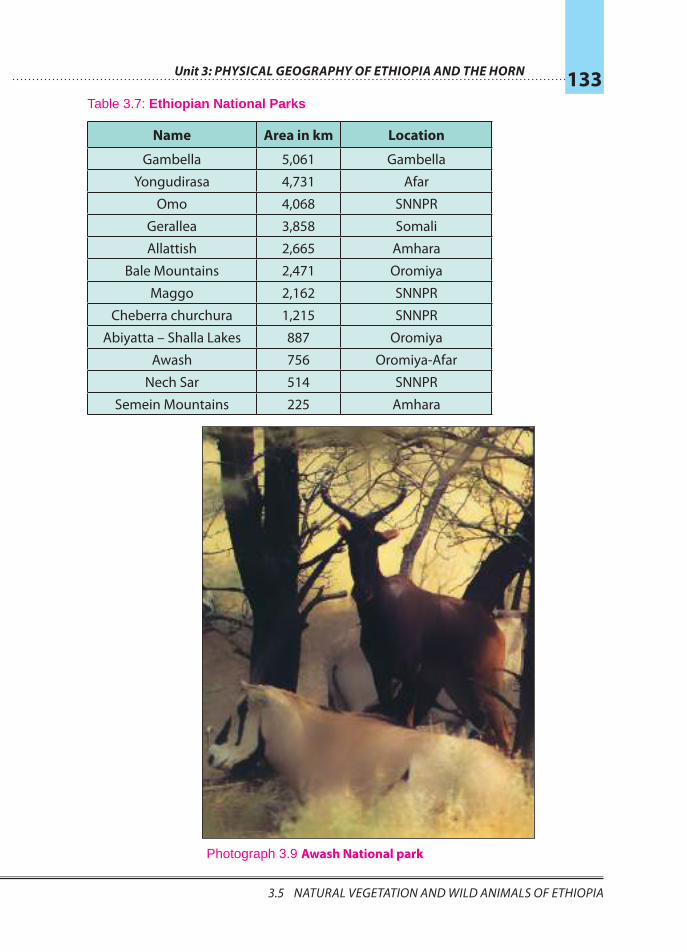
Unit 3: Physical GeoGraPhy of ethioPia and the horn 133
3.5 naturaL VeGetatIon and WILd anIMaLS of ethIopIa 3.5 naturaL VeGetatIon and WILd anIMaLS of ethIopIa
Table 3.7: Ethiopian National Parks
Name Area in km Location
Gambella 5,061 Gambella
Yongudirasa 4,731 Afar
Omo 4,068 SNNPR
Gerallea 3,858 Somali
Allattish 2,665 Amhara
Bale Mountains 2,471 Oromiya
Maggo 2,162 SNNPR
Cheberra churchura 1,215 SNNPR
Abiyatta – Shalla Lakes 887 Oromiya
Awash 756 Oromiya-Afar
Nech Sar 514 SNNPR
Semein Mountains 225 Amhara
Photograph 3.9 Awash National park
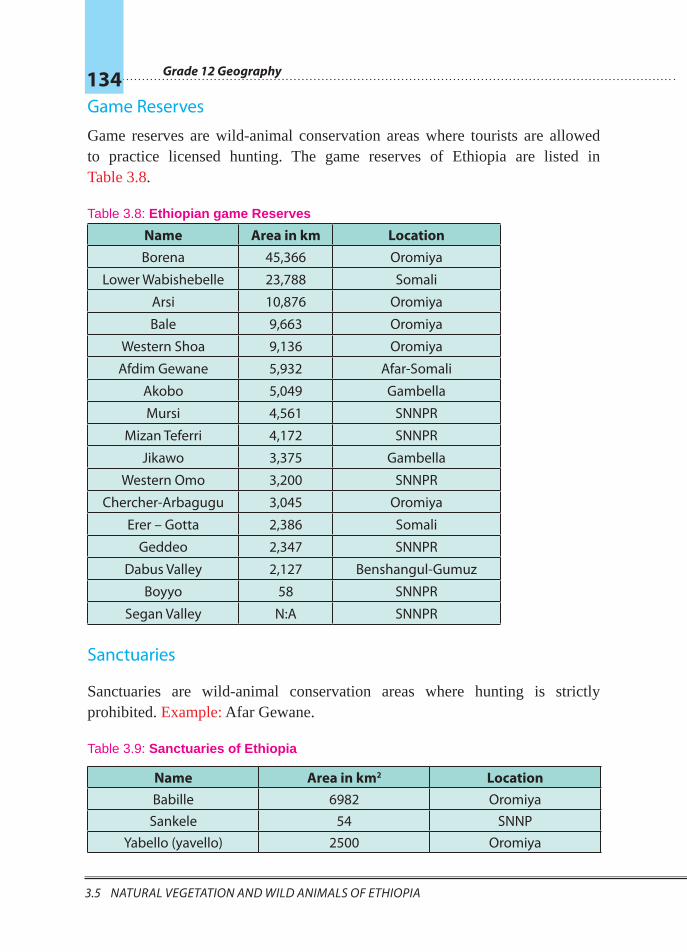
Grade 12 Geography 134
3.5 naturaL VeGetatIon and WILd anIMaLS of ethIopIa
Game Reserves
Game reserves are wild-animal conservation areas where tourists are allowed to practice licensed hunting. The game reserves of Ethiopia are listed in Table 3.8.
Table 3.8: Ethiopian game Reserves
Name Area in km LocationBorena 45,366 Oromiya
Lower Wabishebelle 23,788 Somali
Arsi 10,876 Oromiya
Bale 9,663 Oromiya
Western Shoa 9,136 Oromiya
Afdim Gewane 5,932 Afar-Somali
Akobo 5,049 Gambella
Mursi 4,561 SNNPR
Mizan Teferri 4,172 SNNPR
Jikawo 3,375 Gambella
Western Omo 3,200 SNNPR
Chercher-Arbagugu 3,045 Oromiya
Erer – Gotta 2,386 Somali
Geddeo 2,347 SNNPR
Dabus Valley 2,127 Benshangul-Gumuz
Boyyo 58 SNNPR
Segan Valley N:A SNNPR
Sanctuaries
Sanctuaries are wild-animal conservation areas where hunting is strictly prohibited. Example: Afar Gewane.
Table 3.9: Sanctuaries of Ethiopia
Name Area in km2 Location Babille 6982 Oromiya
Sankele 54 SNNPYabello (yavello) 2500 Oromiya
Unit 3: Physical GeoGraPhy of ethioPia and the horn 135
3.5 naturaL VeGetatIon and WILd anIMaLS of ethIopIa 3.5 naturaL VeGetatIon and WILd anIMaLS of ethIopIa
3.5.3 Human Intervention in Forest Lands How do human beings interfere with forest lands?
One intervention is in deforestation. At the beginning of the 20th C, the forest cover of Ethiopia was estimated at 40 percent of the entire country. Now it is less than 3 percent. This deforestation rate is alarming. We estimate that Ethiopia loses 100,000 – 200,000 hectares of forestland every year.
Causes of Deforestation
What are the major causes for this drastic rate of destruction?
The main causes are:
F unwise tree cutting for supplies and materials
F overgrazing
F slash-and-burn practices
F fuel wood
F furniture
F construction etc.
Overgrazing: This is the practice of placing too MANY livestock on a given piece of land. The activities of these animals strips the land bare.
In addition to overgrazing pasture areas, people are increasingly converting forest land to pasture land. This practice has expanded grazing land at the expense of forest land – in other words, through deforestation.
Slash and burn practices: People are involved in slash-and-burn practices to clear forestland in order to prepare it for farming. This practice essentially strips the forest bare by slashing (cutting down and digging up) all or most of the trees and other vegetation and then burning the piles away.
Slash-and-burn is also used to periodically strip an area of farmland in order to leave it lying fallow to regain its nutrients.
In Ethiopia, slashing and burning forests destroys a large area of forest annually. This approach to gaining farmland is commonly practiced in southwestern Ethiopia.
Grade 12 Geography 136
3.5 naturaL VeGetatIon and WILd anIMaLS of ethIopIa
Expansion of built up areas: Built-up areas are areas occupied by factories, residence, recreational sites etc. Ethiopia’s expanding human population increasingly requires more area for housing and other services. Some of the land that is converted to built-up areas is forestland.
Mitigation Measures
What should be done to protect, rehabilitate and achieve sustainable use of forests in Ethiopia?
The following approaches have been suggested for slowing down and/or mitigating Ethiopia’s rapid deforestation rate:
 conservation
 capacity building
 institutional development
These approaches are described below. However, despite their having great potential, these approaches alone are not enough. More ideas are needed, and sustained effort must be applied to enhance the mitigation effort.
Conservation of Natural Vegetation
Have you developed attitude of conserving resources?
What measures do you often take to conserve resources at household level?
These conservation measures have been suggested for preserving Ethiopia’s forests:
F Reforestation – planting trees after every tree harvest.
F Afforestation – planting trees on bare and unproductive lands.
F Controlling burning practices (i.e., the slash-and-burn activities).
F Practicing agro-forestry.
F Reducing the use of fuel wood by adopting alternative sources of energy for household consumption.
F Controlling overgrazing.
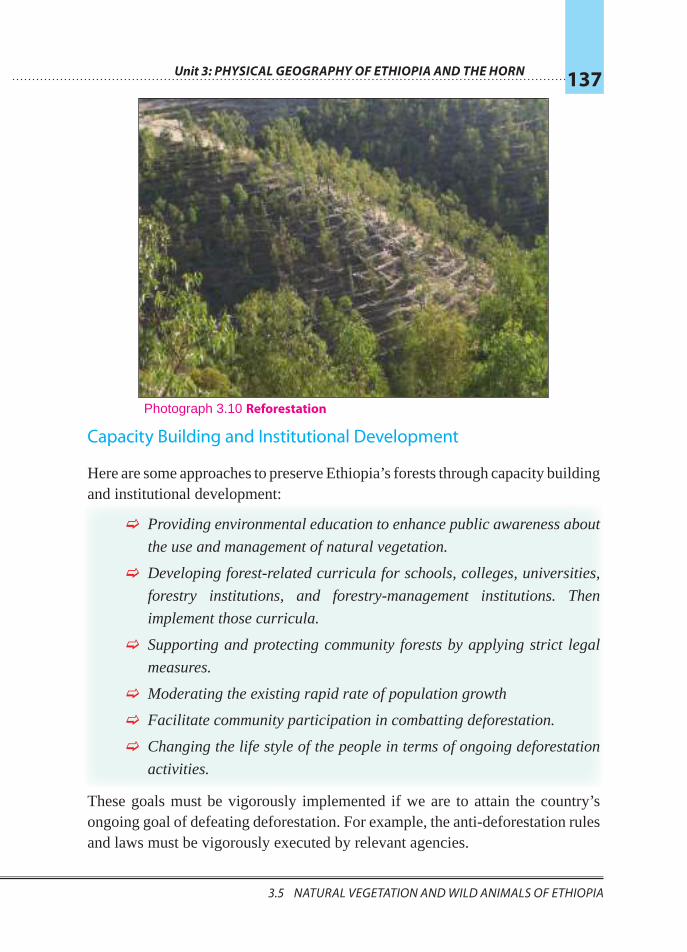
Unit 3: Physical GeoGraPhy of ethioPia and the horn 137
3.5 naturaL VeGetatIon and WILd anIMaLS of ethIopIa 3.5 naturaL VeGetatIon and WILd anIMaLS of ethIopIa
Capacity Building and Institutional Development
Here are some approaches to preserve Ethiopia’s forests through capacity building and institutional development:
F Providing environmental education to enhance public awareness about
the use and management of natural vegetation.
F Developing forest-related curricula for schools, colleges, universities,
forestry institutions, and forestry-management institutions. Then
implement those curricula.
F Supporting and protecting community forests by applying strict legal
measures.
F Moderating the existing rapid rate of population growth
F Facilitate community participation in combatting deforestation.
F Changing the life style of the people in terms of ongoing deforestation
activities.
These goals must be vigorously implemented if we are to attain the country’s ongoing goal of defeating deforestation. For example, the anti-deforestation rules and laws must be vigorously executed by relevant agencies.
Photograph 3.10 Reforestation
Grade 12 Geography 138
3.6 SoILS of ethIopIa
3.6 SOILS OF ETHIOPIA At the end of this section, you will be able to:
Þ relate formation of soils of Ethiopia with geological events of the past;
Þ distinguish major soil types in Ethiopia; and
Þ realize soils problems and its conservation in Ethiopia.
Key Terms
³ Parent material ³ Humus ³ Conservation
³ Leaching ³ Soil
3.6.1 Formation of Soils in Ethiopia Why is soil erosion a serious issue in Ethiopia?
Soils are the uppermost loose or unconsolidated material overlying the earth’s crustal rocks. Its major components are water, air, organic and inorganic minerals. It is a dynamic, natural and complex substance which can support animals and plants.
Soils of Ethiopia owe their origin to:
F parent rock material, which has been broken into small particles by way of weathering and natural decomposition
F climatic conditions, which largely determine the speed and nature of the processes that form the soil; for example, extreme heat, or cold, could stop the work of bacteria, and the amount of moisture influences on several aspects of soil formation.
F vegetation cover, which adds humus to the soils and renders support to the soil making animals and bacteria
On the plateaus that make up extensive areas in north, north western, south western, and central and south eastern Ethiopia the parent rocks are volcanic origin and experience sufficient rainfall. The soils formed in these areas are red basaltic and black basaltic soils. Unlike the red basaltic soils, the black soils have high clay content that makes the soil difficult for farming.
Unit 3: Physical GeoGraPhy of ethioPia and the horn 139
3.6 SoILS of ethIopIa 3.6 SoILS of ethIopIa
In areas where the hard crystalline rocks are the parent rock, the soils are poor and thin. They are also rocky and acidic. They range in colour from grey to brown. They are found in Hararghe plateaus and Borena lowlands.
In the Afar region where recent volcanic deposits and dried-out lake deposits had occurred, very shallow and saline-dominated soils are formed. Due to time and climatic effects, these soils are not deep and fertile.
In the southeastern lowlands where the parent rocks are sedimentary rocks, the soils lack humus but are rich in phospherous and potash. They are also low in nitrogen content.
In the lower course of the major rivers, transported soils often known as alluvial soils are dominant. These soils because of their volcanic origin and continuous nourishment of water, are fertile.
People depend on soils; conversely, the quality of the soils depends on how wisely people use the land. Not only in countries like Ethiopia, whose economy is largely agrarian, but also in highly industrialized countries like the USA, soil is one of the most important bases of life.
3.6.2 Types of Soil in Ethiopia Can you describe what soil is and how it is formed?
The soils of Ethiopia are basically derived from crystalline, volcanic and Mesozoic sedimentary rocks. According to the latest classification made by the FAO, there are eighteen classes of soil in Ethiopia.
Here are the main soil types. They cover more than 85 percent of the country.
 Nithosols (red basaltic soils): These soil types:
F cover about 12 percent of the country.
F are basically associated with high rainfall and are found in areas that were previously covered with forest.
F are predominant in the Western Highlands of Wellega, Keffa, Illubabor, the Southern Highlands of Sidama, the Central and Western Highlands of Shoa, the Highlands of Gojjam and the Eastern Highlands of Hararghe.
Grade 12 Geography 140
3.6 SoILS of ethIopIa
F are matured soils with deep profiles. They are highly leached and lack soluble minerals like Sodium, Calcium, etc., but they are rich in iron and aluminum.
F are potentially good for farming and other agricultural practices since they are friable, and have a stable structure; as a result,
F are the most widely cultivated soil type. They are the best soils for coffee, inset and cereals.
 Vertisols (black Basaltic soils): soil types of these sort:
F cover about 10 percent of the total land of Ethiopia.
F have high clay content; so, are sticky. For this reason and for poor drainage qualities, such soils are difficult to be used for farming purposes.
F have excellent nutrients that could provide support for agriculture, but their poor drainage qualities limit their use for grazing purposes.
F are largely found in Arsi, Bale and central Hararghe, where there are pronounced wet and dry seasons.
 Acrisols: These soil types:
F are found associated with Nithosols.
F cover about 4.5 percent of the country.
F are widely found in the Southwestern Highlands of Ethiopia,where there is high rainfall.
F are extremely leached; and therefore, have low productivity capacity.
 Cambisoils: Such soils:
F are soils that developed from the recent lava deposits of the Quaternary Period.
F are young and shallow.
F are found on the rugged and sloping terrain of the Plateau of Shoa (eastern escarpment) and Chercher Highlands.
 Regosols: These types: F like the cambisols, are shallow and young; but they are coarse-textured.
F have low agricultural value.
F are found in the Danakil and Ogaden plains.
 Xerosols: These soils:
F These soils are generally young and shallow, and are found in arid and semi-arid regions. They have a weakly developed profile.
Unit 3: Physical GeoGraPhy of ethioPia and the horn 141
3.6 SoILS of ethIopIa 3.6 SoILS of ethIopIa
F are found extensively in the Northeastern escarpment, Northwestern and Southeastern Lowlands.
F are characterized by high salt content and humus deficiencies.
F have little significance for agriculture except places where they could be irrigated.
 Yermosols: Soils of this sort:
F are found in desert and semi-desert areas, as are xerosols.
F are salty, acidic and have a weakly-developed profile.
F are not suitable for cultivation, even when irrigated, due to their salty and acidic nature.
 Luvisols: These soils:
F are well-developed in areas where there are clearly marked wet and dry seasons and when leaching is not very high.
F are among the best soils, since they have good chemical nutrients.
F are intensively cultivated, except in areas that are steeply sloped or water-logged.
F are found around Lake Tana, and in the eastern part of the Northern Central Highlands and in the Southern Lowlands.
 Lithosols: Such soils:
F are similar to cambisols and regosols in their poor maturity and their location on steep slopes.
F are found in areas of low precipitation.
F cover the escarpments of the Northeastern and Chercher Highlands.
 Fluvisols: This type of soils:
F are soils that rivers have transported from highlands to lowlands.
F cover about 10 percent of the country’s total area.
F are associated with river, sea and lake deposits.
F have very good agricultural potential.
F are found extensively in the lower regions of the Omo, Awash, Abbay and Baro-Akobo Rivers.
Grade 12 Geography 142
3.6 SoILS of ethIopIa
Þ Exercise 3.71 Compare and contrast
a cambisols with regosols and xerosols
b nithosols with vertisols
c luvisols with fluvisols
2 List the soils of Ethiopia in order of their suitability for agriculture from the best to the worst.
Match the items under Column A with those under Column B.
A
3 Extremely leached soils
4 Young and shallow soils found in arid and semi-arid areas
5 Young and shallow soils covering the rugged slopes of the Shoa Plateau and the Chercher Highlands.
6 Plentiful along the lower regions of the Omo, Awash, Rivers etc.
7 Black soil that is hard to plough during the rainy season
8 Red basaltic soil
BA Fluvisols
B Vertisols
C Nithosols
D Xerosols
E Cambisols
F Acrisols
3.6.3 Soil Problems and Conservation in Ethiopia
Ethiopia’s Soil Problem – Erosion
What is the basic difference between soil erosion and leaching?
For countries like Ethiopia, where the mainstay of the peoples’ livelihood is agriculture, issues related to soil are extremely important. Therefore, whatever setback happens must be carefully handled. One such setback is erosion.
Unit 3: Physical GeoGraPhy of ethioPia and the horn 143
3.6 SoILS of ethIopIa 3.6 SoILS of ethIopIa
Soil Erosion by Running Water
Every year enormous quantities of soil are carried away by Ethiopia’s rivers to neighboring countries. As a matter of fact, the main problem related to soil in Ethiopia is erosion by running water.
Examples:
F River Abbay alone carries away 3000 – 4000 million cubic metric tons of soil annually.
F The Ethiopian highlands experience a loss of about 2000 tons of soil per square kilometer per year.
Factors that Accelerate Soil Erosion in Ethiopia
It is known that natural and human-made factors accelerate soil erosion. Which of the two factors is prevalent in your locality?
Both natural and human-made factors play a role in accelerating erosion.
Natural Factors
Two main natural factors contribute to soil erosion in Ethiopia.
F Topography: Many Ethiopian rivers set in motion from high places and have steep profiles as they progress to lower altitudes. These conditions are highly conducive for erosion to take place at ease.
F The heavy summer rains: Although most of Ethiopia’s rivers have very low flows during the dry season, the heavy summer rains turn them into rushing torrents. The cracks that have appeared during the dry seasons turn rapidly into deep gullies. These conditions greatly facilitate the mechanical action of raindrops to wear away the surface soil, eroding it deeply.
Human-Made Factors
Human activities accelerate the soil erosion that is caused by the natural factors
that we have just considered. Here are some of the many ways in which people
have contributed to the erosion of the land that they depend on.
Grade 12 Geography 144
3.6 SoILS of ethIopIa
F Deforestation: Most of the highlands of Ethiopia were once covered
by forests. These forests provided cover for the land and protected the
soil from the physical action of rainfall. Deforestation is progressing
at a rapid rate and has become one of the main causes for Ethiopia’s
hastened erosion rate.
F Bad cultivation practices: Bad cultivation practices also speed up
erosion by making the soil vulnerable to the natural forces that we have
just described a few lines above. For example,
K Overcropping – This is one bad cultivation practice. It is the act of
planting an area too densely. This approach to farming uses up the
soil’s nutrients faster than natural processes can replenish them
and destroys the land’s fertility.
K Overcultivation – This one entails tilling land every year. For
example, in order to keep up with increasing food requirements,
people overcultivate their lands. Too frequent tilling can remove
nutrients from the soil faster than natural processes can replenish
them.
K Slash and burn – With such a practice, people slash (cut down and
dig up) all or most of an area’s vegetation and then burn the results.
In farming, this practice is sometimes used periodically to strip an
area before leaving it to lie fallow to regain its nutrients. However,
since the soil is now bare and therefore unprotected, the land is
vulnerable to the forces of erosion. Slash-and-burn techniques are
also used to clear forestland in order to prepare it for farming, but
unwittingly exposing the soil for erosion.
F Keeping too many livestock (overgrazing): Most areas used for
pastoral activities are overgrazed because too many animals have been
kept there relative to their grass. The livestock destroys the vegetation
faster than it can replenish itself. When the vegetation is destroyed,
the land is laid bare and is therefore vulnerable to erosion. Goats are
particularly damaging. They destroy all kinds and parts of an area’s
vegetation, including the roots.
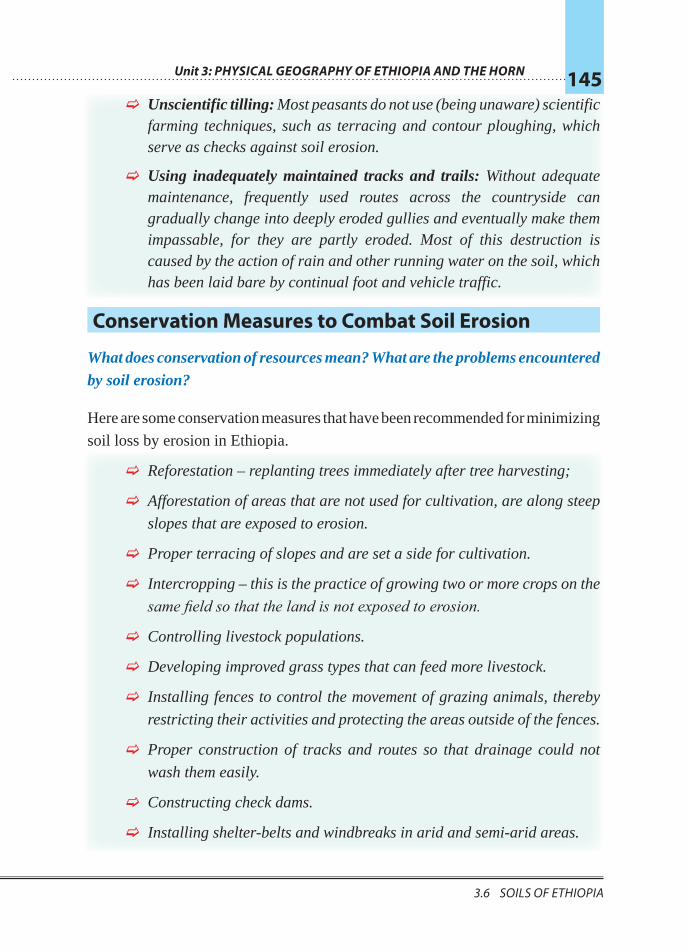
Unit 3: Physical GeoGraPhy of ethioPia and the horn 145
3.6 SoILS of ethIopIa 3.6 SoILS of ethIopIa
F Unscientific tilling: Most peasants do not use (being unaware) scientific farming techniques, such as terracing and contour ploughing, which serve as checks against soil erosion.
F Using inadequately maintained tracks and trails: Without adequate maintenance, frequently used routes across the countryside can gradually change into deeply eroded gullies and eventually make them impassable, for they are partly eroded. Most of this destruction is caused by the action of rain and other running water on the soil, which has been laid bare by continual foot and vehicle traffic.
Conservation Measures to Combat Soil Erosion
What does conservation of resources mean? What are the problems encountered by soil erosion?
Here are some conservation measures that have been recommended for minimizing
soil loss by erosion in Ethiopia.
F Reforestation – replanting trees immediately after tree harvesting;
F Afforestation of areas that are not used for cultivation, are along steep
slopes that are exposed to erosion.
F Proper terracing of slopes and are set a side for cultivation.
F Intercropping – this is the practice of growing two or more crops on the
same field so that the land is not exposed to erosion.
F Controlling livestock populations.
F Developing improved grass types that can feed more livestock.
F Installing fences to control the movement of grazing animals, thereby
restricting their activities and protecting the areas outside of the fences.
F Proper construction of tracks and routes so that drainage could not
wash them easily.
F Constructing check dams.
F Installing shelter-belts and windbreaks in arid and semi-arid areas.

Grade 12 Geography 146
3.6 SoILS of ethIopIa
F Extending irrigation schemes along the major river basins and their
tributaries so that water will be available in proper quantities at proper
times. This measure would alleviate both drought and flood conditions. Stored water would be used during dry periods, and flood waters would be controlled and therefore would no longer be destructive or wasteful.
Activity 3.12 1 Collect a sample of your locality’s predominant soil type in a small plastic
container. Then examine it so as to:
a Identify its color.
b Check whether it has high clay content. Use your saliva to perform this check, as follows: Wet it and press it with your finger. If you find that the soil is sticky then it has significant clay content.
c Is it friable? Ask your community’s farmers.
d What crops are widely grown in your area?
2 Are there gullies near your school? How wide are they? Ask older members of your community whether the gullies have changed in size over the years. What do you think will happen to them after ten or eight years?
3 Are attempts being made to check soil erosion in your locality? If not, organize a conservation club with your friends, classmates or community members with the goal of planting trees in your area. Locate trees to plant, and then create a schedule for planting them. You will be performing a noble task.
Unit 3: Physical GeoGraPhy of ethioPia and the horn 147
unit review3.6 SoILS of ethIopIa
Unit Review
Þ UNIT SUMMARY Þ Ethiopia and the Horn countries occupy a tropical location in Eastern Africa
within the 1oS – 18oN latitudes and the 33oE – 51o24’ E longitudes. Þ The countries of the Horn vary in size. Ethiopia is the biggest while Djibouti
is the smallest. This variation of size among the countries has resulted in advantages and disadvantages.
Þ Regarding shape, Ethiopia and Djibouti have more or less compact shapes, while Somalia and Eritirea have elongated shapes.
Þ Ethiopia and the other Horn countries have experienced four geological eras. The geological structure of the region is the result of the geological events that occurred during these eras.
Þ The landforms of Ethiopia and the Horn are largely the results of the geological forces that took place in the Cenozoic era’s, Tertiary and Quaternary periods. Altitudes increase from the peripheries to the centers. The highest peak is Ras Dashen (4620 meters) in Ethiopia.
Þ The altitude plays a significant role in determining the climate, natural vegetation, drainage systems as well human activities in the region.
Þ Due to the altitude effect we see spatial variation of F Temperature; F Rainfall
F Vegetation F Population density
Þ The drainage system itself is the altitudinal effects, rivers as flow out from the central highlands to the peripheral lowlands. This has made the rivers flow swiftly.
Þ The highlands are homes of different wild animals of which some are endemic. These endemic animals are at the risk of extinction.
Þ Although the forests are confined to the highlands, human intervention for both economic and other purposes is destroying it at an alarming rate. The forest resource stock that had covered 40 percent of the country has come to less than 3 percent these days.
Þ Ethiopia has different types of soils. The volcanic soil, especially nithosol, is the most widely utilized soil. The country’s cereals, coffee, inset, etc. are grown on this soil type. However, the topography, climate and traditional practices have become major accelerants of its removal. Attempts have
Grade 12 Geography 148
unit review
been underway to check erosion. Awareness is being created at all levels through school syllabi and extension services to mitigate the problem.
Þ Soils are the upper most loose or unconsolidated material overlying the earth’s crustal rocks. Soils of Ethiopia owe their origin from their parent-materials. They are basically derived from crystalline, volcanic and mesozoic sedimentary rocks. The main types of soil in Ethiopia are nithosols, vertisols, acrisols, cambisols, regosols, xerosols, yermisols, luvisols, fluvisols and lithosols.
Þ The major problems of Ethiopia’s soils is erosion by running water. Both human-made and natural factros are responsible for erosion.
Þ REVIEW EXERCISE FOR UNIT 3 I Short Answers
1 Describe the major geological events that occurred during the Cenozoic Tertiary Period in Ethiopia and the Horn.
2 Identify the dominant factors that determine the drainage systems and change patterns in Ethiopia and the Horn.
3 Name two areas in Ethiopia with
a high rainfall variability b very low rainfall variability
4 Which soil classes in Ethiopia are very unproductive? What are the reasons for this unproductivity?
5 Which regional administration is involved in the protection of wild animals and conservation of areas for them? Name at least four of Ethiopia’s protected wild animals.
II Completing Sentences: Complete the sentences below by filling in the spaces left blank.
6 The two non-anthropogenic factors that accelerate soil erosion in Ethiopia are __________ and __________.
7 One of the attainable measures for reducing soil erosion is afforestation. It is the __________.
8 The year-round rainfall region corresponds to __________.
9 The current economic potential of the Ethiopian Rift Valley is assumed to be __________.
Unit OutcomesAfter completing this unit, you will be able to:
Þ discuss population theories, trends, growth, structure, spatial distribution and factors affecting population distribution in Ethiopia; and
Þ explain settlement patterns, determinants of population changes, impacts of rapid population growth and urbanization in Ethiopia.
Main Contents4.1 POPULATION THEORIES4.2 TRENDS OF POPULATION GROWTH AND STRUCTURE IN ETHIOPIA4.3 THE SPATIAL DISTRIBUTION OF POPULATION IN ETHIOPIA4.4 FACTORS AFFECTING POPULATION DISTRIBUTION IN ETHIOPIA4.5 SETTLEMENT PATTERNS OF ETHIOPIAN POPULATION4.6 DETERMINANTS OF POPULATION CHANGE IN ETHIOPIA4.7 IMPACTS OF RAPID POPULATION GROWTH IN ETHIOPIA4.8 POPULATION POLICY OF ETHIOPIA4.9 URBANIZATION IN ETHIOPIA
F Unit Summary F Review Exercise
Unit4POPULATION OF ETHIOPIA AND
THE HORN
Grade 12 Geography 150
Introduction
INTRODUCTIONA human population is all of the people living in a specified area-such as a city, region, country, or continent-at a given time. Population is one of the most critical factors that determine the socio-economic and environmental conditions of every country in the world.
The issue of population is multi-disciplinary, so it is studied by a variety of fields, such as demography, geography, sociology, anthropology, economics, biology, statistics, and history. In geography, population geography is a branch of human geography that usually focuses on the spatial patterns and variations of the various characteristics of human populations. It particularly emphasizes the spatial dimensions of population size, structure, composition, distribution, settlement, density, migration, growth, and other demographic processes and facts. It also considers demographic facts in terms of both their present contexts and causes, characteristics and possible consequences to the geographical environments (i.e., both the physical and cultural environment).
Population studies in geography and other fields yield knowledge essential for planning, especially by governments, in fields such as health, education, housing, social security, employment, food security, and environmental preservation. Moreover, the studies provide information needed in the formulation of governments’ population policies, which seek to modify the trends of population size, composition, and distribution in order to achieve economic, social, and environmental objectives.
This unit focuses on the study of the general features of Ethiopia’s population. The unit has nine sections, which present major topics such as population theories, trends of population growth, population structure and composition, spatial distribution and settlement patterns determinants of population growth, nature of urbanization, and population policy.
Unit 4: POPULATION OF ETHIOPIA AND THE HORN 151
Introduction 4.1 PoPulatIon theorIes
4.1 POPULATION THEORIESAt the end of this section, you will be able to:
Þ analyze the population theories of Malthusian and anti-Malthusian.
Key Terms
³ Theory
³ Malthusian
³ Anti-Malthusian
³ Over-population
³ Preventive-checks
³ Positive-checks
³ Food supply
³ Resource
What do you know about theories?
How do you think a theory is developed?
The problem of population, particularly population growth, has been a major concern of humankind since ancient times. Based on political, social, economic, and military considerations, statesmen and thinkers held opinions about the need to stimulate or retard population growth. On the basis of these factors, they also formulated public policies. In ancient times, such policies were not based on theories. However, those policies and practices have been used as starting points for modern population theories.
Modern population theory is generally thought to have evolved in the late eighteenth century, in the writings of Malthus. Malthus’s work stimulated interest in population and in the economic and social issues associated with it. His work also prompted controversy, and that controversy spurred further investigation into demographic problems, which stimulated continuing observation and analysis of these issues, which, in turn, led to formulation of other population theories.
With the help of the theories, various scholars have attempted to explain the relationships that exist between population and factors such as resources, economy, politics, and other social issues.
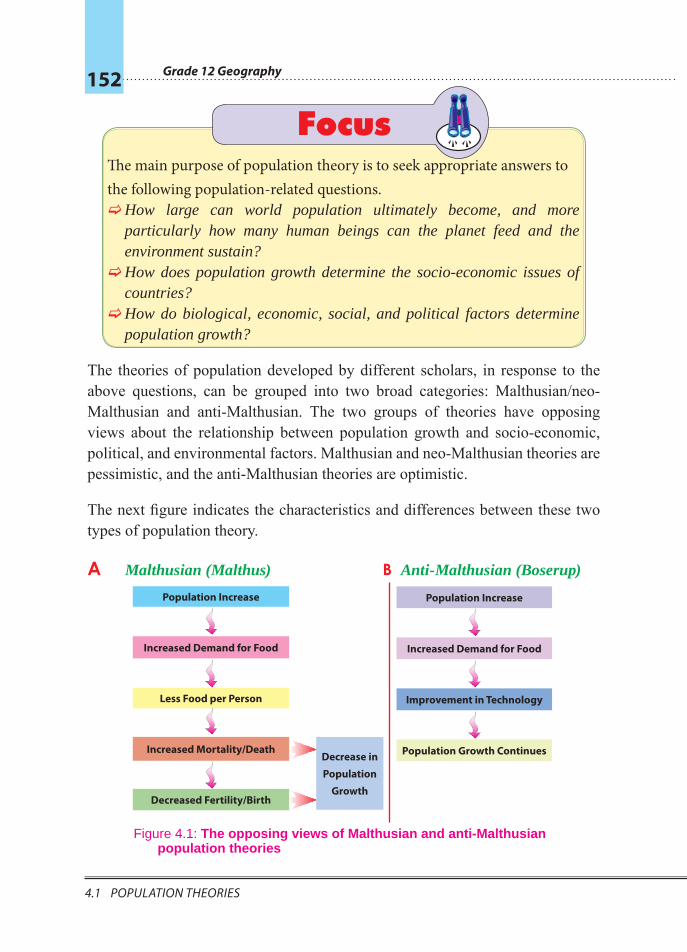
Grade 12 Geography 152
4.1 PoPulatIon theorIes
FocusThe main purpose of population theory is to seek appropriate answers to the following population-related questions.
FHow large can world population ultimately become, and more particularly how many human beings can the planet feed and the environment sustain? FHow does population growth determine the socio-economic issues of countries? FHow do biological, economic, social, and political factors determine population growth?
The theories of population developed by different scholars, in response to the above questions, can be grouped into two broad categories: Malthusian/neo-Malthusian and anti-Malthusian. The two groups of theories have opposing views about the relationship between population growth and socio-economic, political, and environmental factors. Malthusian and neo-Malthusian theories are pessimistic, and the anti-Malthusian theories are optimistic.
The next figure indicates the characteristics and differences between these two types of population theory.
A Malthusian (Malthus) B Anti-Malthusian (Boserup)
Decreased Fertility/Birth
Decrease in
Population
Growth
Increased Mortality/Death
Less Food per Person
Increased Demand for Food
Population Increase
Population Growth Continues
Increased Demand for Food
Population Increase
Improvement in Technology
Figure 4.1: The opposing views of Malthusian and anti-Malthusian population theories
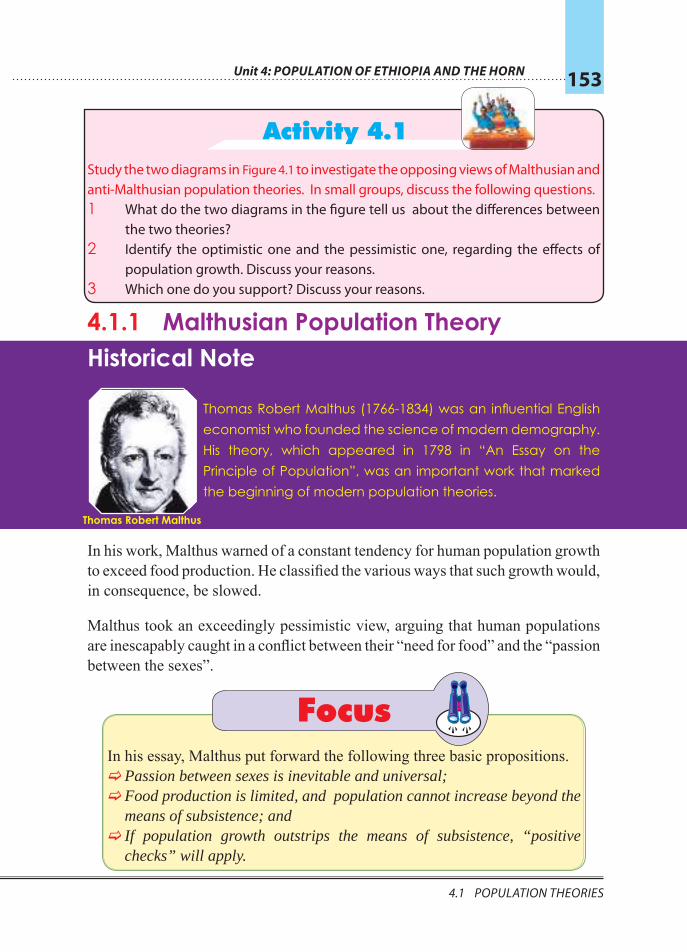
Unit 4: POPULATION OF ETHIOPIA AND THE HORN 153
4.1 PoPulatIon theorIes 4.1 PoPulatIon theorIes
Activity 4.1 Study the two diagrams in Figure 4.1 to investigate the opposing views of Malthusian and anti-Malthusian population theories. In small groups, discuss the following questions. 1 What do the two diagrams in the figure tell us about the differences between
the two theories? 2 Identify the optimistic one and the pessimistic one, regarding the effects of
population growth. Discuss your reasons.3 Which one do you support? Discuss your reasons.
4.1.1 Malthusian Population Theory
In his work, Malthus warned of a constant tendency for human population growth to exceed food production. He classified the various ways that such growth would, in consequence, be slowed.
Malthus took an exceedingly pessimistic view, arguing that human populations are inescapably caught in a conflict between their “need for food” and the “passion between the sexes”.
FocusIn his essay, Malthus put forward the following three basic propositions.
FPassion between sexes is inevitable and universal; FFood production is limited, and population cannot increase beyond the means of subsistence; and F If population growth outstrips the means of subsistence, “positive checks” will apply.
Historical Note
Thomas Robert Malthus (1766-1834) was an influential English economist who founded the science of modern demography. His theory, which appeared in 1798 in “An Essay on the Principle of Population”, was an important work that marked the beginning of modern population theories.
Thomas Robert Malthus
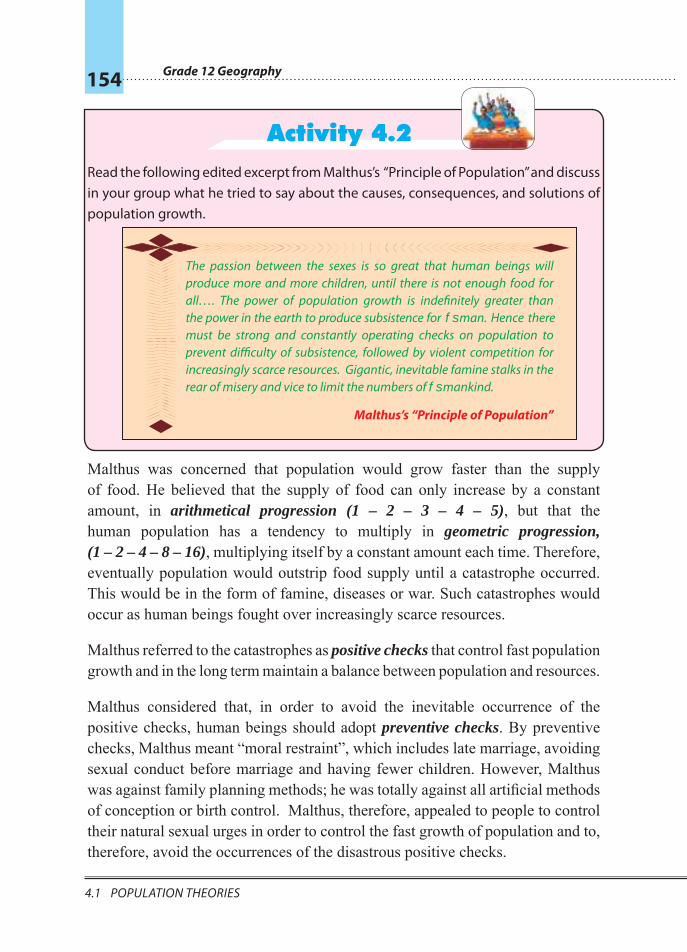
Grade 12 Geography 154
4.1 PoPulatIon theorIes
Activity 4.2Read the following edited excerpt from Malthus’s “Principle of Population” and discuss in your group what he tried to say about the causes, consequences, and solutions of population growth.
Malthus was concerned that population would grow faster than the supply of food. He believed that the supply of food can only increase by a constant amount, in arithmetical progression (1 – 2 – 3 – 4 – 5), but that the human population has a tendency to multiply in geometric progression, (1 – 2 – 4 – 8 – 16), multiplying itself by a constant amount each time. Therefore, eventually population would outstrip food supply until a catastrophe occurred. This would be in the form of famine, diseases or war. Such catastrophes would occur as human beings fought over increasingly scarce resources.
Malthus referred to the catastrophes as positive checks that control fast population growth and in the long term maintain a balance between population and resources.
Malthus considered that, in order to avoid the inevitable occurrence of the positive checks, human beings should adopt preventive checks. By preventive checks, Malthus meant “moral restraint”, which includes late marriage, avoiding sexual conduct before marriage and having fewer children. However, Malthus was against family planning methods; he was totally against all artificial methods of conception or birth control. Malthus, therefore, appealed to people to control their natural sexual urges in order to control the fast growth of population and to, therefore, avoid the occurrences of the disastrous positive checks.
the passion between the sexes is so great that human beings will produce more and more children, until there is not enough food for all…. the power of population growth is indefinitely greater than the power in the earth to produce subsistence for man. hence there must be strong and constantly operating checks on population to prevent difficulty of subsistence, followed by violent competition for increasingly scarce resources. Gigantic, inevitable famine stalks in the rear of misery and vice to limit the numbers of mankind.
Malthus’s “Principle of Population”
Unit 4: POPULATION OF ETHIOPIA AND THE HORN 155
4.1 PoPulatIon theorIes 4.1 PoPulatIon theorIes
FocusIn general, Malthus believed that the “hot passion or sexual urge” of people could lead to overpopulation, which, in turn, would result in poverty and other catastrophes (positive checks). He concluded that “the poor are to be blamed for their own poverty. Neither wages nor providence, nor society is to be blamed.”
Today, supporters of Malthus’s pessimistic view, who fear that population growth will outstrip food supply and other resources, leading to the catastrophic consequences (the positive checks) predicted by Malthus, are called Malthusi-
ans or neo-Malthusians.
Activity 4.3In small groups:
1 Discuss Malthus’s positive checks, and his idea of using preventative checks, as a way of controlling rapid population growth.
2 Discuss what Malthus meant by the statement “the poor are to be blamed for their own poverty”.
4.1.2 Anti-Malthusian Population TheoriesAnti-Malthusians are optimists who argue against Malthus. They believe that either population growth will slow down well before it is limited by scarcity of food and other resources or the ingenuity/cleverness of humankind will solve the problems, overcoming potential scarcities of food and other resources.
Let’s consider two anti-Malthusian theories – one was developed by Karl Marx, and the other by Ester Boserup.
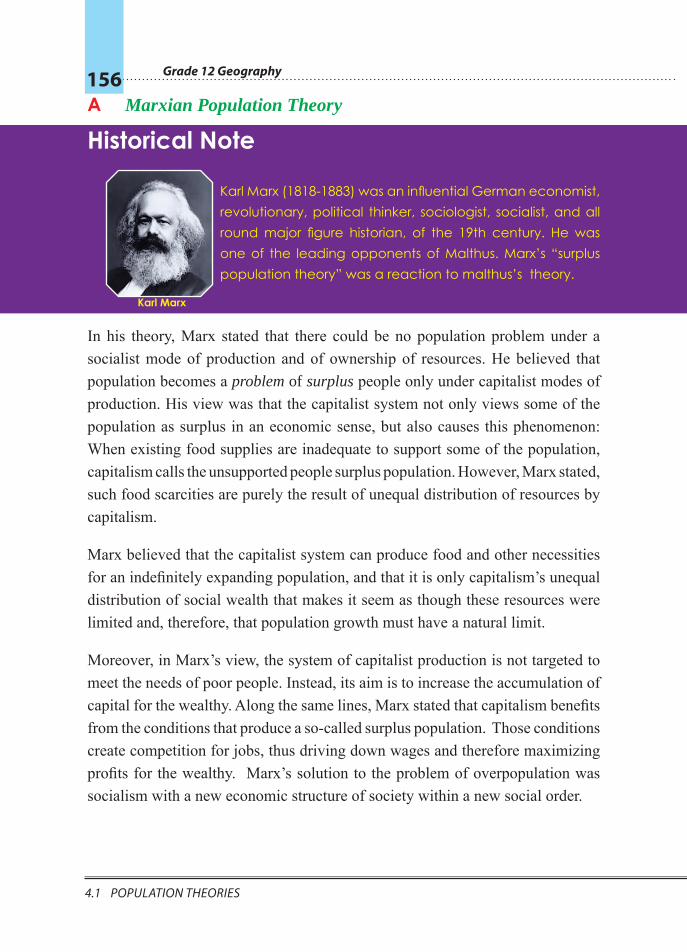
Grade 12 Geography 156
4.1 PoPulatIon theorIes
A Marxian Population Theory
In his theory, Marx stated that there could be no population problem under a socialist mode of production and of ownership of resources. He believed that population becomes a problem of surplus people only under capitalist modes of production. His view was that the capitalist system not only views some of the population as surplus in an economic sense, but also causes this phenomenon: When existing food supplies are inadequate to support some of the population, capitalism calls the unsupported people surplus population. However, Marx stated, such food scarcities are purely the result of unequal distribution of resources by capitalism.
Marx believed that the capitalist system can produce food and other necessities for an indefinitely expanding population, and that it is only capitalism’s unequal distribution of social wealth that makes it seem as though these resources were limited and, therefore, that population growth must have a natural limit.
Moreover, in Marx’s view, the system of capitalist production is not targeted to meet the needs of poor people. Instead, its aim is to increase the accumulation of capital for the wealthy. Along the same lines, Marx stated that capitalism benefits from the conditions that produce a so-called surplus population. Those conditions create competition for jobs, thus driving down wages and therefore maximizing profits for the wealthy. Marx’s solution to the problem of overpopulation was socialism with a new economic structure of society within a new social order.
Historical Note
Karl Marx (1818-1883) was an influential German economist, revolutionary, political thinker, sociologist, socialist, and all round major figure historian, of the 19th century. He was one of the leading opponents of Malthus. Marx’s “surplus population theory” was a reaction to malthus’s theory.
Karl Marx
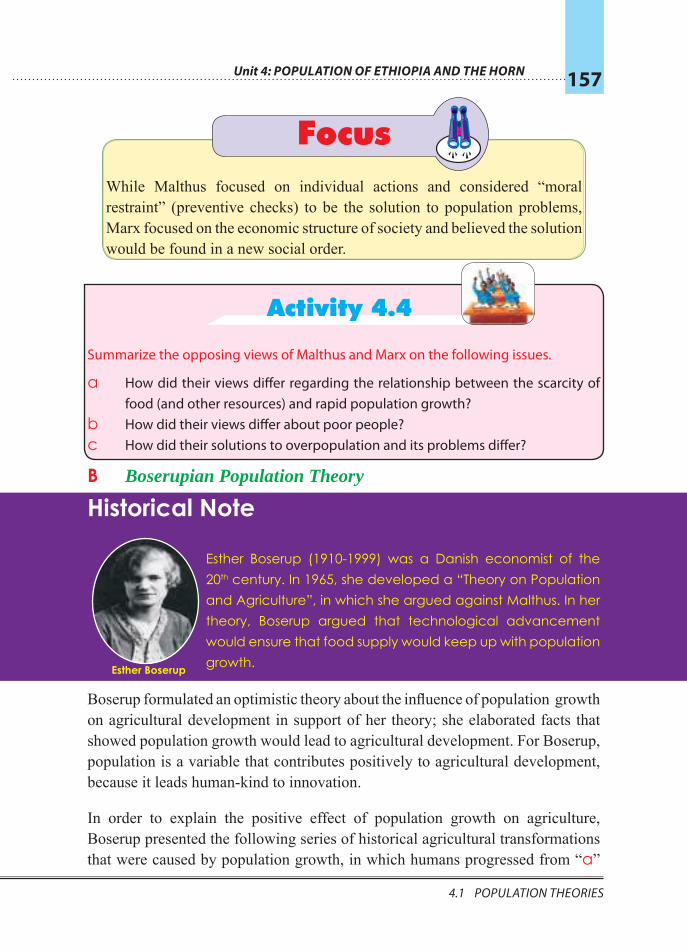
Unit 4: POPULATION OF ETHIOPIA AND THE HORN 157
4.1 PoPulatIon theorIes 4.1 PoPulatIon theorIes
FocusWhile Malthus focused on individual actions and considered “moral restraint” (preventive checks) to be the solution to population problems, Marx focused on the economic structure of society and believed the solution would be found in a new social order.
Activity 4.4
Summarize the opposing views of Malthus and Marx on the following issues.
a How did their views differ regarding the relationship between the scarcity of food (and other resources) and rapid population growth?
b How did their views differ about poor people? c How did their solutions to overpopulation and its problems differ?
B Boserupian Population Theory
Boserup formulated an optimistic theory about the influence of population growth on agricultural development in support of her theory; she elaborated facts that showed population growth would lead to agricultural development. For Boserup, population is a variable that contributes positively to agricultural development, because it leads human-kind to innovation.
In order to explain the positive effect of population growth on agriculture, Boserup presented the following series of historical agricultural transformations that were caused by population growth, in which humans progressed from “a”
Historical Note
Esther Boserup (1910-1999) was a Danish economist of the 20th century. In 1965, she developed a “Theory on Population and Agriculture”, in which she argued against Malthus. In her theory, Boserup argued that technological advancement would ensure that food supply would keep up with population growth.Esther Boserup
Grade 12 Geography 158
4.1 PoPulatIon theorIes
through “e” in their approach to agriculture between the nth and nth centuries. For each transformation, Boserup
F described the approach to agriculture of the specified time and explained how it used land
F examined the labor requirements of that approach between the nth and nth centuries
Boserup noted that, as the human population grew, the amount of land available per-capita shrank but that, in response, people developed more effective ways to use the land. With each development in land use, labor requirements grew, and the increasing population provided the labor – and, therefore, the means to implement these developments. In addition, the increased labor requirements provided occupation for the growing number of people.
a Forest-Fallow Cultivation
F Long periods of forest growth alternate with short periods of cultivation.
F Per-capita, the population owns and must cultivate large areas of land. However, because the work required - and therefore the labor requirement - of the forest-fallow approach to cultivation is low, food supplies are adequate.
b Bush-Fallow Cultivation
F Relatively long periods of bush growth alternate with short periods of cultivation. The bush-growth periods are not longer than the forest-growth periods.
F The labor requirement is larger than for the first (forest-fallow) approach.
c Short-Fallow Cultivation
F The land is cultivated with intervals of only a few years of abandonment. These intervals last only for only a few years. They allow the land to regenerate and are used to enhance its productivity.
F The labor requirement is larger than for the first two approaches.d Annual Cropping
F The land is cultivated annually.
F Fertilizers are required.
F Labor requirement is larger than for all of the earlier approaches.
Unit 4: POPULATION OF ETHIOPIA AND THE HORN 159
4.1 PoPulatIon theorIes 4.2 trends of PoPulatIon Growth and structure In ethIoPIa
e Multiple Cropping
F Different crops are grown at the same time, on the same land, throughout the year. The land is used throughout the year.
F The labor requirement is larger than for all of the earlier approaches.
Boserup concluded that population growth could not be controlled by scarcity of food and other necessities, as Malthus believed. Instead, population would continue to grow because the increased demand for food and other necessities would lead to new innovations and technological advancement which, in turn, would allow production to keep pace with the needs of the increasing population.
Activity 4.5
Summarize the opposing views of Malthus and Boserup on the relationship between the scarcity of food and population growth.
FocusBoserup thought that “As the size of population increases, it results in technological innovations and advancement.” For her, population is an independent variable/factor, and agriculture is a dependent variable/factor. She believed that population growth could not be controlled by scarcity of food supply. Rather, the increasing demand for food caused by population growth would increase agricultural productivity by stimulating innovation in agricultural systems and technologies. In this regard, she said that “Necessity is the mother of invention”.
4.2 TRENDS OF POPULATION GROWTH AND STRUCTURE IN ETHIOPIA
At the end of this section, you will be able to: Þ explain the trends of population growth and structure in Ethiopia.
Grade 12 Geography 160
4.2 trends of PoPulatIon Growth and structure In ethIoPIa
Key Terms
³ Census ³ Survey ³ Growth rate ³ Age structure
³ Sex structure ³ Population pyramid ³ Age dependency ratio ³ Sex ratio
4.2.1 Trends of Population Growth in Ethiopia
What do you know about census and surveys? What do you know about the nature of population growth in Ethiopia?
The most important source of population information (demographic data) that enables us to understand population growth rate and its trends in a country is a census. Census is defined as the periodic counting of the entire population of a country. In Ethiopia, census is a recent phenomenon introduced after the late 20th
century.
In addition to census, from the 20th century onwards, several sample surveys were conducted in Ethiopia in order to estimate the total population of Ethiopia and to generate other reliable demographic data.
Activity 4.6
In small groups, discuss the following questions.
1 What are the advantages of conducting census and surveys for any country? That is, what is the use of understanding the trends of population growth in any country by conducting census and surveys?
2 Why is the Ethiopian population growing so fast?
Ethiopia is the third most populous country in Africa, next to Nigeria and Egypt. According to the 2007 Census, the population of Ethiopia is 73.8 million. The country’s population is among the fastest growing in the world. The 2008 estimate of the annual growth rate of Ethiopian population is 2.23 percent.
It was estimated that, in 1900, Ethiopia had only 11.8 million persons. This number increased to about 13 million in 1920 and to 23.5 million in 1960, as is
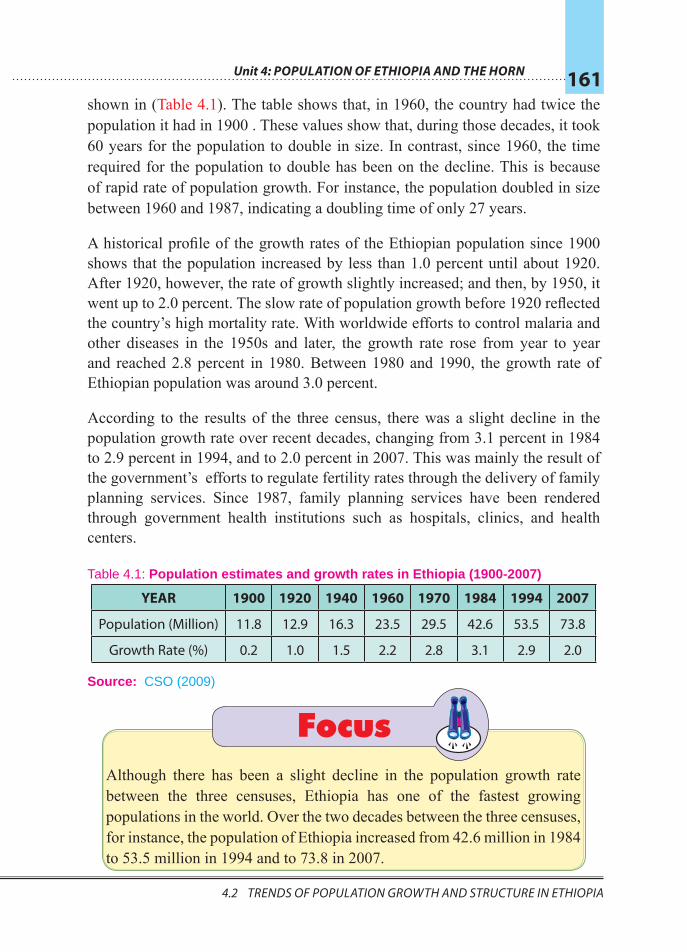
Unit 4: POPULATION OF ETHIOPIA AND THE HORN 161
4.2 trends of PoPulatIon Growth and structure In ethIoPIa 4.2 trends of PoPulatIon Growth and structure In ethIoPIa
shown in (Table 4.1). The table shows that, in 1960, the country had twice the population it had in 1900 . These values show that, during those decades, it took 60 years for the population to double in size. In contrast, since 1960, the time required for the population to double has been on the decline. This is because of rapid rate of population growth. For instance, the population doubled in size between 1960 and 1987, indicating a doubling time of only 27 years.
A historical profile of the growth rates of the Ethiopian population since 1900 shows that the population increased by less than 1.0 percent until about 1920. After 1920, however, the rate of growth slightly increased; and then, by 1950, it went up to 2.0 percent. The slow rate of population growth before 1920 reflected the country’s high mortality rate. With worldwide efforts to control malaria and other diseases in the 1950s and later, the growth rate rose from year to year and reached 2.8 percent in 1980. Between 1980 and 1990, the growth rate of Ethiopian population was around 3.0 percent.
According to the results of the three census, there was a slight decline in the population growth rate over recent decades, changing from 3.1 percent in 1984 to 2.9 percent in 1994, and to 2.0 percent in 2007. This was mainly the result of the government’s efforts to regulate fertility rates through the delivery of family planning services. Since 1987, family planning services have been rendered through government health institutions such as hospitals, clinics, and health centers.
Table 4.1: Population estimates and growth rates in Ethiopia (1900-2007)
YEAR 1900 1920 1940 1960 1970 1984 1994 2007
Population (Million) 11.8 12.9 16.3 23.5 29.5 42.6 53.5 73.8
Growth Rate (%) 0.2 1.0 1.5 2.2 2.8 3.1 2.9 2.0
Source: CSO (2009)
FocusAlthough there has been a slight decline in the population growth rate between the three censuses, Ethiopia has one of the fastest growing populations in the world. Over the two decades between the three censuses, for instance, the population of Ethiopia increased from 42.6 million in 1984 to 53.5 million in 1994 and to 73.8 in 2007.
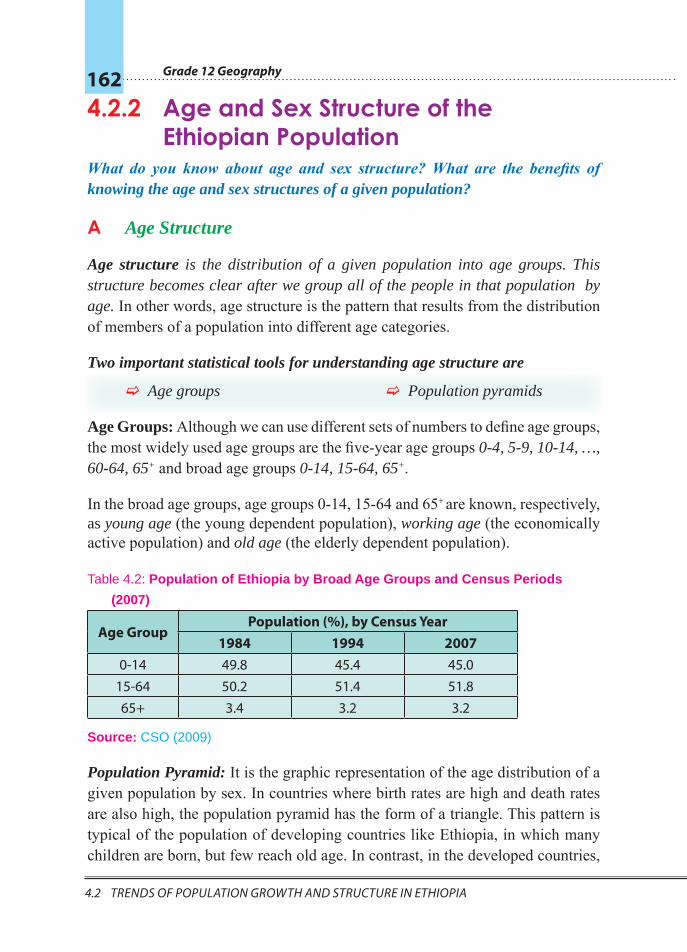
Grade 12 Geography 162
4.2 trends of PoPulatIon Growth and structure In ethIoPIa
4.2.2 Age and Sex Structure of the Ethiopian Population
What do you know about age and sex structure? What are the benefits of knowing the age and sex structures of a given population?
A Age Structure
Age structure is the distribution of a given population into age groups. This structure becomes clear after we group all of the people in that population by age. In other words, age structure is the pattern that results from the distribution of members of a population into different age categories.
Two important statistical tools for understanding age structure are
F Age groups F Population pyramids
Age Groups: Although we can use different sets of numbers to define age groups, the most widely used age groups are the five-year age groups 0-4, 5-9, 10-14, …, 60-64, 65+ and broad age groups 0-14, 15-64, 65+.
In the broad age groups, age groups 0-14, 15-64 and 65+ are known, respectively, as young age (the young dependent population), working age (the economically active population) and old age (the elderly dependent population).
Table 4.2: Population of Ethiopia by Broad Age Groups and Census Periods
(2007)
Age GroupPopulation (%), by Census Year
1984 1994 20070-14 49.8 45.4 45.0
15-64 50.2 51.4 51.865+ 3.4 3.2 3.2
Source: CSO (2009)
Population Pyramid: It is the graphic representation of the age distribution of a given population by sex. In countries where birth rates are high and death rates are also high, the population pyramid has the form of a triangle. This pattern is typical of the population of developing countries like Ethiopia, in which many children are born, but few reach old age. In contrast, in the developed countries,
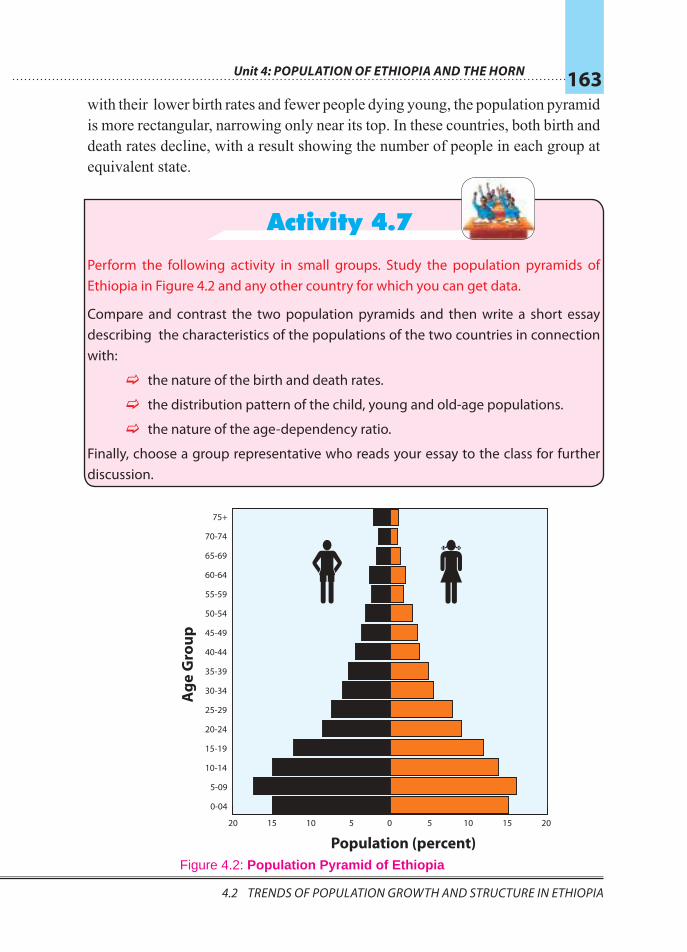
Unit 4: POPULATION OF ETHIOPIA AND THE HORN 163
4.2 trends of PoPulatIon Growth and structure In ethIoPIa 4.2 trends of PoPulatIon Growth and structure In ethIoPIa
with their lower birth rates and fewer people dying young, the population pyramid is more rectangular, narrowing only near its top. In these countries, both birth and death rates decline, with a result showing the number of people in each group at equivalent state.
Activity 4.7
Perform the following activity in small groups. Study the population pyramids of Ethiopia in Figure 4.2 and any other country for which you can get data.
Compare and contrast the two population pyramids and then write a short essay describing the characteristics of the populations of the two countries in connection with:
F the nature of the birth and death rates.
F the distribution pattern of the child, young and old-age populations.
F the nature of the age-dependency ratio.
Finally, choose a group representative who reads your essay to the class for further discussion.
20 15 10 5 0 5 10 15 20
0-04
25-29
5-09
30-34
50-54
10-14
35-39
55-59
15-19
40-44
60-64
70-74
20-24
45-49
65-69
75+
Population (percent)
Age
Gro
up
Figure 4.2: Population Pyramid of Ethiopia
Grade 12 Geography 164
4.2 trends of PoPulatIon Growth and structure In ethIoPIa
In general, population pyramids of developing countries like Ethiopia have very broad bases, showing the dominance of the young-age population. These pyramids become increasingly narrower towards the top, advancing through the age groups, showing that the percentage of the population becomes less and less in the upper age groups (65-69, 70-74, etc.).
Focus F Age structure/composition is one of the most important demographic characteristics of a population.
F Age information is often used to understand the sizes of school-age, labor-force, elderly, and other populations.
F A population pyramid is usually employed to show the age distribution of a given population by sex.
F The population pyramid of Ethiopia has a broad base that narrows towards the top as age increases. This shape is typical of a population with high fertility rate.
As shown in Table 4.2, Ethiopia’s young-age (0-14 years) dependent population declined from 49.8 percent in 1984 to 45.0 percent in 2007 but was still very large. In contrast, Ethiopia’s old-age (65+ years) dependent population was very small - only 3.2% in the 1994 and 2007 Census.
Although the proportion of the population of working-age group (15-64) has shown modest increases over the course of time of the three census, it accounts for only a little more than half of the total population.
The population pyramid for Ethiopia demonstrates that the country’s population as a whole has a high preponderance of young population, with a median age of not more than 18 years. This is a typical feature of a rapidly growing population.
The high percentage for the young-age group in Ethiopia is the result of a high birth rate, while the small percentage of the old-age group reflects a high mortality rate, which accounts for the low life expectancy of the population of the country.
Unit 4: POPULATION OF ETHIOPIA AND THE HORN 165
4.2 trends of PoPulatIon Growth and structure In ethIoPIa 4.2 trends of PoPulatIon Growth and structure In ethIoPIa
Age Dependency Ratio
What do you think age dependency is? Do you think that it is a problem in Ethiopia?
The Age Dependency Ratio (ADR) is the relationship between the working or economically active population and the non-working population. It is generally accepted that people in the young and old ages are dependent on the working-age population. The Age Dependency Ratio (ADR) is used to show the magnitude of this dependency in a given population. This means that the dependency burden, represented by the non-working population in the young and old age groups, on the working-age population can be shown by the age dependency ratio. The formula for calculating the age dependency ratio (ADR) is:
Activity 4.8Use Table 4.2 to calculate the age dependency ratio of the Ethiopian population for the three census. Explain what these ADRs mean.
The age dependency ratio for more developed countries is usually between 50 and 75. In contrast, less developed countries like Ethiopia have ratios between 85 and 105. In Ethiopia, the age dependency ratio is very high. In other words, the dependency burden of the young and old age populations on the working or economically active population is very heavy. For example, the value of 93 for the age dependency ratio of Ethiopia in 2007 shows that for every 100 persons in the working-age group, there are about 93 dependents. In other words, every person in the working-age group has nearly one dependent.
FocusThe negative implications of heavy youth dependency in Ethiopia can be summarized as follows.
FEven higher levels of fertility are likely to be reached when the youth group reaches reproductive age.
ADR = (% of population aged 0 14) + (% of population age− dd 65+)
% of population aged 15 64 × 100
−
Grade 12 Geography 166
4.2 trends of PoPulatIon Growth and structure In ethIoPIa
FThe capacity to save is highly constrained at both the household and the national level.
FLimited national resources must be diverted from investment and other developmental activities in order to use those resources to provide services and meet the young peoples’ basic needs, such as food, housing, education, health care, etc.
FThe demand for the nation’s employment opportunities will increase as the youth group reaches working age; this results in a further high levels of unemployment.
In general, knowing about the age structure of a country’s population helps its policy-makers and socio-economic planners to predict for the future what sorts of goods and services might be needed for how many people in which age group. As we have said, a large proportion of children means growing demands for schools; a large number of people entering their child-bearing years signals probable population growth; an increasing number of elderly people may strain pension plans and health services.
The age structure of a population also affects its growth rates. A population that has been growing rapidly will keep growing even when current birth rates slow down to replacement levels. This is because, when the large child population reaches its reproductive years, it will reproduce offsprings, unless that reproduction is kept at replacement level. In fact, reproduction will create an even larger new youth population. Thus, because the same thing is likely to happen again when that new generation reaches its reproductive years, the danger of a rising population spiral becomes higher and higher. For example, in Ethiopia, even if there were slight declines in the average number of children that each woman has, (Total Fertility Rate) in future years, these children will reproduce, producing more individuals than their own generation contains. Thus, the population of the country will continue to expand.
B Sex Structure
What is sex structure? What are the benefits of knowing the sex structure of a given population?
The sex structure of a population is shown by its sex ratio, which is the ratio of male population to female population. Sex ratio is usually expressed as the
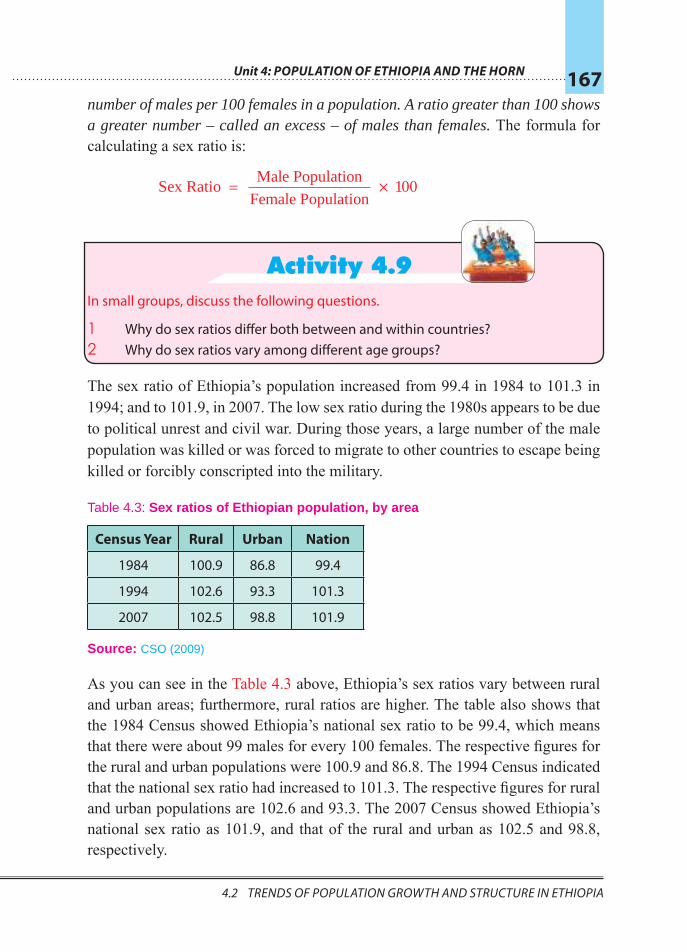
Unit 4: POPULATION OF ETHIOPIA AND THE HORN 167
4.2 trends of PoPulatIon Growth and structure In ethIoPIa 4.2 trends of PoPulatIon Growth and structure In ethIoPIa
number of males per 100 females in a population. A ratio greater than 100 shows a greater number – called an excess – of males than females. The formula for calculating a sex ratio is:
Activity 4.9In small groups, discuss the following questions.
1 Why do sex ratios differ both between and within countries?2 Why do sex ratios vary among different age groups?
The sex ratio of Ethiopia’s population increased from 99.4 in 1984 to 101.3 in 1994; and to 101.9, in 2007. The low sex ratio during the 1980s appears to be due to political unrest and civil war. During those years, a large number of the male population was killed or was forced to migrate to other countries to escape being killed or forcibly conscripted into the military.
Table 4.3: Sex ratios of Ethiopian population, by area
Census Year Rural Urban Nation
1984 100.9 86.8 99.4
1994 102.6 93.3 101.3
2007 102.5 98.8 101.9
Source: CSO (2009)
As you can see in the Table 4.3 above, Ethiopia’s sex ratios vary between rural and urban areas; furthermore, rural ratios are higher. The table also shows that the 1984 Census showed Ethiopia’s national sex ratio to be 99.4, which means that there were about 99 males for every 100 females. The respective figures for the rural and urban populations were 100.9 and 86.8. The 1994 Census indicated that the national sex ratio had increased to 101.3. The respective figures for rural and urban populations are 102.6 and 93.3. The 2007 Census showed Ethiopia’s national sex ratio as 101.9, and that of the rural and urban as 102.5 and 98.8, respectively.
Sex Ratio Male Population
Female Population 1 = × 00

Grade 12 Geography 168
4.3 the sPatIal dIstrIbutIon of PoPulatIon In ethIoPIa
Sex ratio in Ethiopia also varies with age. As you now know, males predominate among newborns and the very young. However, their numbers lessen as age increases. Hence, sex ratios are high for young age groups and low for adult and old-age groups. However, in rural areas this pattern does not hold for later age groups. In the country, the situation of more male than female newborns accounts for the normal high sex ratio in the young age groups. Then, the usual situation of higher mortality among male than female children narrows the gap, which gives the normal drop in sex ratio. By the time these children reach their twenties and thirties, the ratio is below 100. However, in their later age groups, this trend – and with it, the normal development of a population’s sex-ratio pattern – is reversed. This is because more rural females than males migrate to urban areas. In the above 50 age groups, males predominate in the countryside, and the sex ratio rises. After age 70, the rural ratio exceeds 120.
4.3 THE SPATIAL DISTRIBUTION OF POPULATION IN ETHIOPIA
At the end of this lesson, you will be able to: Þ discuss the spatial distribution of population in Ethiopia.
Key Terms
³ Population distribution
³ Population density
³ Dense population
³ Sparse population
Do you know what population distribution means? How about population density?
Note
Sex ratios in Ethiopia are generally lower for urban areas and
higher for rural areas. This is primarily due to large number of
females migrating to urban areas.
Unit 4: POPULATION OF ETHIOPIA AND THE HORN 169
4.3 the sPatIal dIstrIbutIon of PoPulatIon In ethIoPIa 4.3 the sPatIal dIstrIbutIon of PoPulatIon In ethIoPIa
Population distribution refers to the way how population spreads out over a given area, i.e., of any size from a small area to the earth as a whole. The distribution of population is indicated by population density.
Population density is the average number of people per square kilometer in a given area.
Activity 4.10
Use the table given below to answer the questions that follow it.
Ethiopia in 1994
Total population 53,477,265
Rural population 46,154,058
Total area (km2) 1,106,000
Arable land (km2) 969,680
Cultivated land (km2) 185,177
1 Calculate the crude density of Ethiopia in 1994.
2 Interpret the results you obtained for each measure.
In Ethiopia, the population is unevenly distributed for various physical and human-related reasons. In the nation, people mostly live in areas with agreeable life conditions such as moderate climate, adequate supply of water, good vegetation cover, fertile soil and absence of disease causing-insects. For such preferences, most people are found concentrated in the highlands and plateaus of the country. These places have the country’s most favorable natural conditions for settlement and crop cultivation. Therefore, they have attracted denser populations than the lowlands. The highlands, where there are no vector-born diseases, have generally been the areas of high population concentration. On the other hand, the lowlands are of low population concentration. Thus, 77 percent of the population of Ethiopia lives in the highlands at altitudes above 1800 meters, and only 11 percent lives at altitudes below 1400 meters.
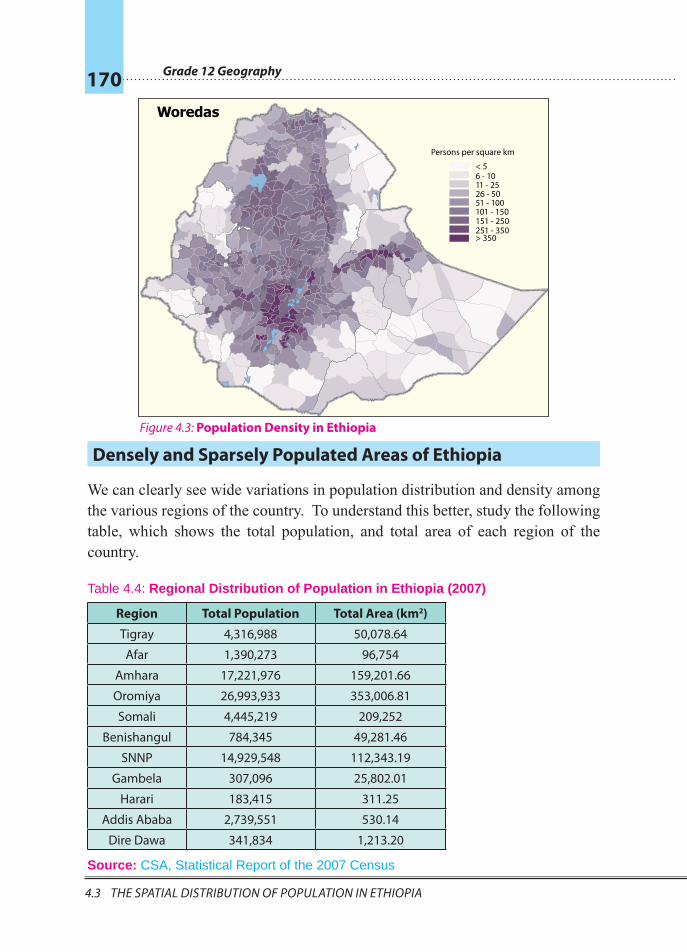
Grade 12 Geography 170
4.3 the sPatIal dIstrIbutIon of PoPulatIon In ethIoPIa
Densely and Sparsely Populated Areas of Ethiopia
We can clearly see wide variations in population distribution and density among the various regions of the country. To understand this better, study the following table, which shows the total population, and total area of each region of the country.
Table 4.4: Regional Distribution of Population in Ethiopia (2007)
Region Total Population Total Area (km2)
Tigray 4,316,988 50,078.64
Afar 1,390,273 96,754
Amhara 17,221,976 159,201.66
Oromiya 26,993,933 353,006.81
Somali 4,445,219 209,252
Benishangul 784,345 49,281.46
SNNP 14,929,548 112,343.19
Gambela 307,096 25,802.01
Harari 183,415 311.25
Addis Ababa 2,739,551 530.14
Dire Dawa 341,834 1,213.20
Source: CSA, Statistical Report of the 2007 Census
Persons per square km
< 56 - 1011 - 2526 - 5051 - 100101 - 150151 - 250251 - 350> 350
Woredas
figure 4.3: Population Density in Ethiopia
Unit 4: POPULATION OF ETHIOPIA AND THE HORN 171
4.3 the sPatIal dIstrIbutIon of PoPulatIon In ethIoPIa 4.3 the sPatIal dIstrIbutIon of PoPulatIon In ethIoPIa
Spatial distributions of population by region vary significantly. Table 4.4 shows that the percentage share of the regions ranges from the smallest proportion of 0.5 percent in the Harari region to the largest, 36.6 percent, in the Oromiya region. That is, the largest proportion of population is found in the Oromiya region (26,993,933) while the smallest proportion of persons is in the Harari region (183,415). The Amhara region (17,221,976) and the SNNP region (14,929,548) have the second and third largest population in the country, respectively.
Activity 4.11Use the data in Table 4.4 to calculate the crude density for each region.
Excluding Addis Ababa, Dire Dawa, and Harari Regions, (which are mostly urban areas with relatively small geographical sizes) identify the three most densely populated and three most sparsely populated regions of Ethiopia.
In terms of density of population, Addis Ababa, Dire Dawa, and Harari Regions have exceptionally different and much higher population densities than the rest of the nation. This is because they are urban-dominated regions with high population concentration in very small geographical areas. Excluding these regions, the most densely populated region in Ethiopia is the Southern Nations, Nationalities and Peoples Region (SNNP) (133 persons/km2), followed by the Amhara (108.2 persons/km2) and Tigray (86.2 persons/km2) regions. On the other hand, the Somali, Afar and Gambela regions are the most sparsely populated regions in the country.
When population densities are considered in terns of zones, the variation of population density in Ethiopia is generally greater than the differences among the regions. Nation wide, there are several zones with population densities of over 200 persons per square kilometer. Some of the zones with very high population
Note
According to the 2007 Census, Ethiopia had significant variation
of population distribution between the rural and urban areas.
At the national level, 83.9 % of the total population lives in
rural places, while the urban population accounts for only
16.1 %.
Grade 12 Geography 172
4.4 factors affectInG PoPulatIon dIstrIbutIon In ethIoPIa
densities are Ghedeo (424 persons/km2), Sidama (299 persons/km2), Kembata-Alaba-Tembaro (299 persons/km2) and Hadiya (264 persons/km2). In contrast, there are zones with population densities of less than 10 persons per square kilometer, two of which are Kamashi (5.7 persons/km2) and Metekel (7.7 persons/km2). Some of the zones in the Somali and Afar regions, for which densities have not been calculated, have even lower densities.
4.4 FACTORS AFFECTING POPULATION DISTRIBUTION IN ETHIOPIA
At the end of this section, you will be able to: Þ state factors affecting population distribution in Ethiopia.
Key Terms
³ Altitude ³ Soil fertility ³ River valley
³ Tropical disease ³ Crop farming ³ Nomadic herding
You can easily see from the preceding information, that the distribution of population in Ethiopia is extremely uneven. This extreme unevenness is the result of a number of factors operating in combination. These factors can be grouped into two as: physical and human.
4.4.1 Physical FactorsDo you know the reasons for the significant variation of population distribution over the highlands and lowlands of Ethiopia?
The most significant physical factors affecting the distribution of population in Ethiopia are the following.
F Climate (mainly rainfall and temperature)
F Soil fertility
F Natural water supply
F Relief (slope and altitude)
F Vegetation cover
Unit 4: POPULATION OF ETHIOPIA AND THE HORN 173
4.4 factors affectInG PoPulatIon dIstrIbutIon In ethIoPIa 4.4 factors affectInG PoPulatIon dIstrIbutIon In ethIoPIa
Activity 4.12
In small groups discuss the following questions.
1 What are the major factors that attract large populations to the highland areas of Ethiopia for settlement?
2 Why are the lowland areas of Ethiopia sparsely populated?
3 In most parts of the world, valleys of major rivers are zones of large concentrations of population. In contrast, the valleys of major rivers of Ethiopia are areas of sparse population distribution. Why is this so?
In Ethiopia, most of the physical factors are influenced by altitude. Therefore, altitude is the most crucial physical factor influencing patterns of population distribution and settlement in the country. Studies in climatology make it clear that rainfall increases while temperature decreases with an increase in altitude. Incidentally, this means that rainfall is very low and temperature is high in lowland areas, while rainfall is high and temperature moderately low in the highlands. Since soil formation and vegetation growth are closely associated with adequate rainfall and moderate temperature, highlands tend to have better soils and vegetation cover.
Lowlands in Ethiopia are characterized by scarcity of rainfall, high temperature, and poor vegetation and soil conditions. In addition to these negative factors, the prevalence of tropical diseases such as malaria and yellow fever contributes to the sparse population distribution in such areas.
For reasons of tropical diseases, most of the valleys of the major rivers of Ethiopia are also characterized by sparse population concentration. The main exception is the Awash River Valley, where irrigation agriculture is practiced. This overall pattern differs from what can be seen in other parts of the world, where valleys of major rivers are zones of large concentrations of people. However, with improvements in agricultural and medical technology, Ethiopia’s lower major river valleys might, in the future, attract more people from the densely populated highland areas.
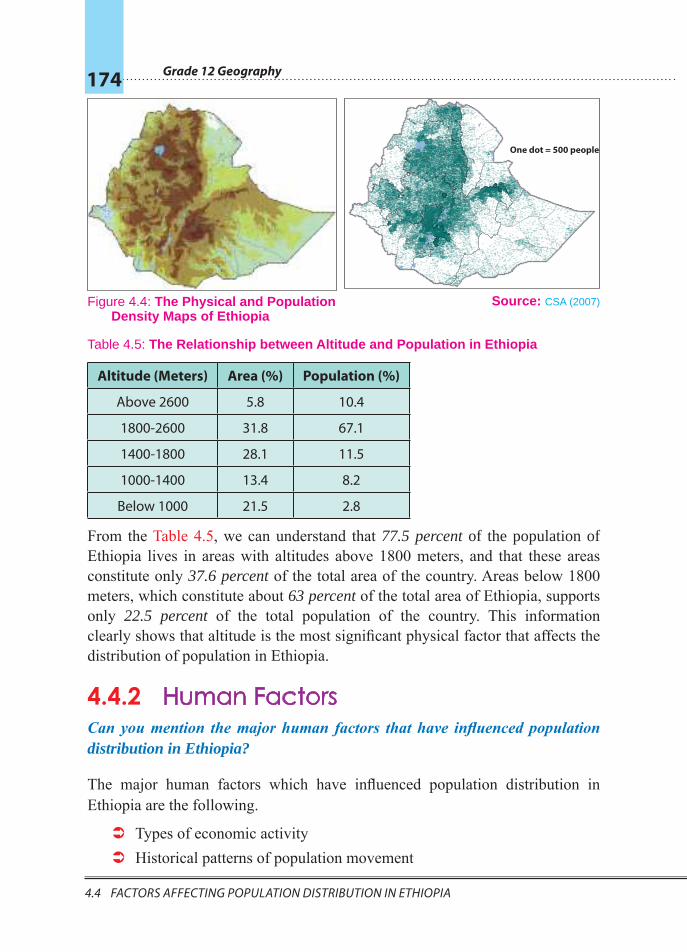
Grade 12 Geography 174
4.4 factors affectInG PoPulatIon dIstrIbutIon In ethIoPIa
Source: CSA (2007)
Table 4.5: The Relationship between Altitude and Population in Ethiopia
Altitude (Meters) Area (%) Population (%)
Above 2600 5.8 10.4
1800-2600 31.8 67.1
1400-1800 28.1 11.5
1000-1400 13.4 8.2
Below 1000 21.5 2.8
From the Table 4.5, we can understand that 77.5 percent of the population of Ethiopia lives in areas with altitudes above 1800 meters, and that these areas constitute only 37.6 percent of the total area of the country. Areas below 1800 meters, which constitute about 63 percent of the total area of Ethiopia, supports only 22.5 percent of the total population of the country. This information clearly shows that altitude is the most significant physical factor that affects the distribution of population in Ethiopia.
4.4.2 Human FactorsCan you mention the major human factors that have influenced population distribution in Ethiopia?
The major human factors which have influenced population distribution in Ethiopia are the following.
 Types of economic activity  Historical patterns of population movement
One dot = 500 people
Figure 4.4: The Physical and Population Density Maps of Ethiopia
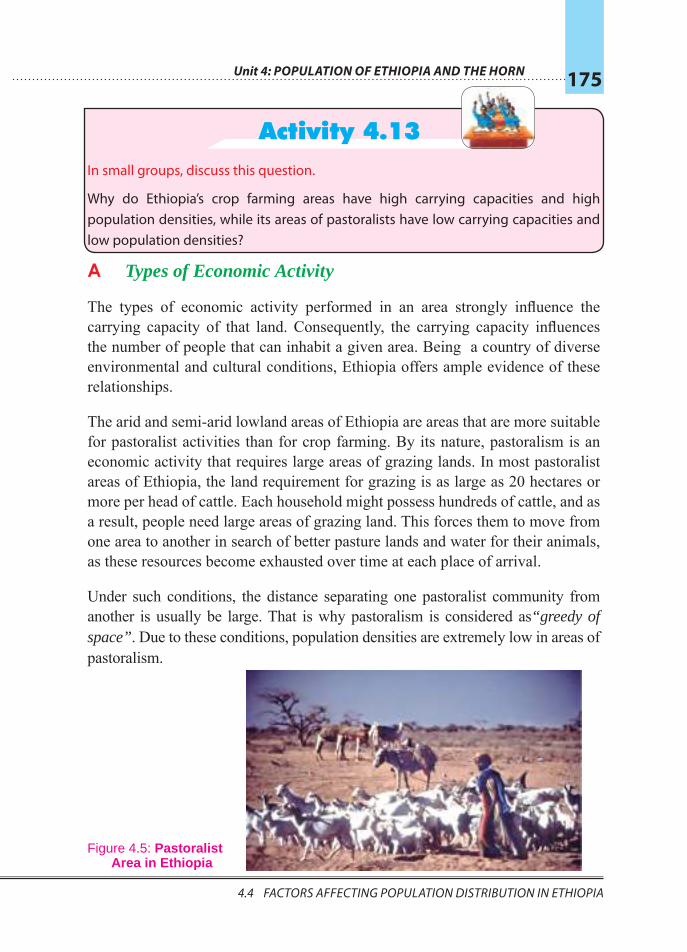
Unit 4: POPULATION OF ETHIOPIA AND THE HORN 175
4.4 factors affectInG PoPulatIon dIstrIbutIon In ethIoPIa 4.4 factors affectInG PoPulatIon dIstrIbutIon In ethIoPIa
Activity 4.13In small groups, discuss this question.
Why do Ethiopia’s crop farming areas have high carrying capacities and high population densities, while its areas of pastoralists have low carrying capacities and low population densities?
A Types of Economic Activity
The types of economic activity performed in an area strongly influence the carrying capacity of that land. Consequently, the carrying capacity influences the number of people that can inhabit a given area. Being a country of diverse environmental and cultural conditions, Ethiopia offers ample evidence of these relationships.
The arid and semi-arid lowland areas of Ethiopia are areas that are more suitable for pastoralist activities than for crop farming. By its nature, pastoralism is an economic activity that requires large areas of grazing lands. In most pastoralist areas of Ethiopia, the land requirement for grazing is as large as 20 hectares or more per head of cattle. Each household might possess hundreds of cattle, and as a result, people need large areas of grazing land. This forces them to move from one area to another in search of better pasture lands and water for their animals, as these resources become exhausted over time at each place of arrival.
Under such conditions, the distance separating one pastoralist community from another is usually be large. That is why pastoralism is considered as“greedy of space”. Due to these conditions, population densities are extremely low in areas of pastoralism.
Figure 4.5: Pastoralist Area in Ethiopia
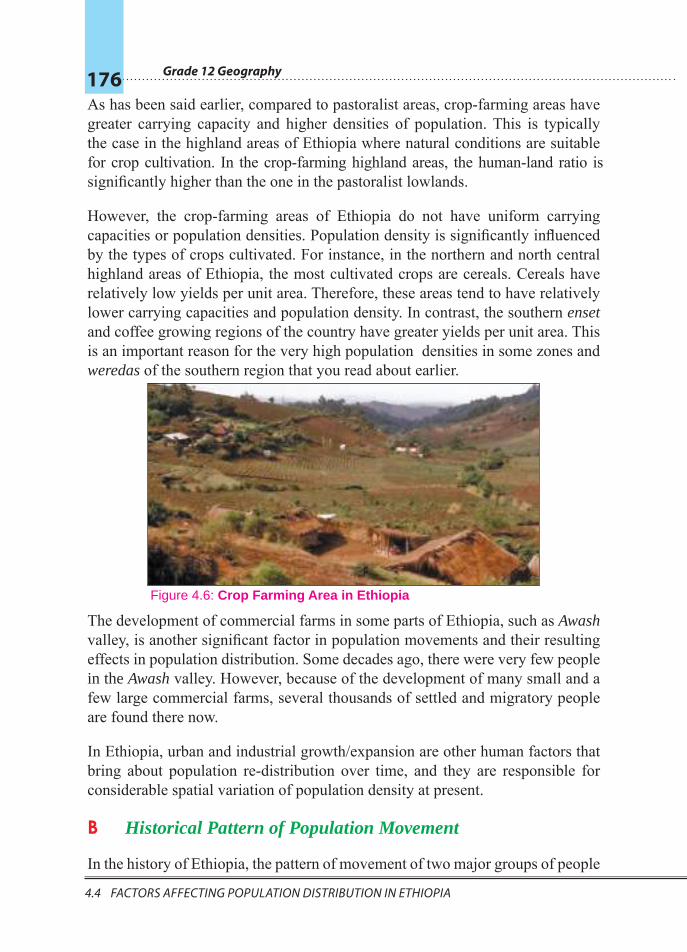
Grade 12 Geography 176
4.4 factors affectInG PoPulatIon dIstrIbutIon In ethIoPIa
As has been said earlier, compared to pastoralist areas, crop-farming areas have greater carrying capacity and higher densities of population. This is typically the case in the highland areas of Ethiopia where natural conditions are suitable for crop cultivation. In the crop-farming highland areas, the human-land ratio is significantly higher than the one in the pastoralist lowlands.
However, the crop-farming areas of Ethiopia do not have uniform carrying capacities or population densities. Population density is significantly influenced by the types of crops cultivated. For instance, in the northern and north central highland areas of Ethiopia, the most cultivated crops are cereals. Cereals have relatively low yields per unit area. Therefore, these areas tend to have relatively lower carrying capacities and population density. In contrast, the southern enset and coffee growing regions of the country have greater yields per unit area. This is an important reason for the very high population densities in some zones and weredas of the southern region that you read about earlier.
The development of commercial farms in some parts of Ethiopia, such as Awash valley, is another significant factor in population movements and their resulting effects in population distribution. Some decades ago, there were very few people in the Awash valley. However, because of the development of many small and a few large commercial farms, several thousands of settled and migratory people are found there now.
In Ethiopia, urban and industrial growth/expansion are other human factors that bring about population re-distribution over time, and they are responsible for considerable spatial variation of population density at present.
B Historical Pattern of Population Movement
In the history of Ethiopia, the pattern of movement of two major groups of people
Figure 4.6: Crop Farming Area in Ethiopia

Unit 4: POPULATION OF ETHIOPIA AND THE HORN 177
4.4 factors affectInG PoPulatIon dIstrIbutIon In ethIoPIa 4.5 settlement Patterns of ethIoPIan PoPulatIon
had direct impact on the distribution of population in the country. These two groups, which make up the largest part of Ethiopia’s population, are the Semitic and the Cushitic populations. The two waves of population movement, one from the north (the Semitic) and the other from the south, (the Cushitic) led to the high concentration of people in and around the central highlands of Ethiopia.
4.5 SETTLEMENT PATTERNS OF ETHIOPIAN POPULATION
At the end of this section, you will be able to: Þ realize settlement patterns of Ethiopian population.
Key Terms ³ Settlement ³ Urban settlement ³ Rural settlement
³ Villagization ³ Nucleated settlement ³ Dispersed settlement
Activity 4.14In small groups, discuss the following questions.
1 What do you know about the concept of settlement?
2 Do you know why settlement patterns differ from place to place in Ethiopia?
FocusIn Ethiopia, different settlement types have been developed in response to mainly the following and other physical and human factors.
F Relief (altitude and slope of the land)
F Climate (the magnitude of rainfall and temperature)
F The kind of land ownership
F The level of development (transportation and industrialization)
F The need for community defense
F The need for communal field labor
Grade 12 Geography 178
4.5 settlement Patterns of ethIoPIan PoPulatIon
Ethiopian settlements are broadly categorized as rural and urban. The primary bases for this dichotomy are the dominant economic activities and the degree of population density. Urban settlements are usually branded by non-agricultural economic activities, while the rural settlements are typically agricultural. Leaving social, cultural and physiological differences aside, rural and urban settlements in Ethiopia can very well distinguished by population densities, which are generally very high in urban settlements compared to the relatively lower densities of population in rural settlement areas.
4.5.1 Rural SettlementsWhat kinds of settlements exist in the rural areas of Ethiopia?
Settlements in the rural areas of Ethiopia can be broadly grouped into two: permanent and temporary/mobile settlements.
Permanent Settlements
What kinds of settlements are considered as permanent? In which areas of Ethiopia that these types of settlements mostly found? Highlands or lowlands?
Settlements are considered permanent if their locations do not frequently change, i.e. if they remain in place for more than ten years. In this sense, most rural settlements over the highland areas of Ethiopia are permanent. The permanent rural settlements of Ethiopia are mostly associated with the crop-farming highland areas of the country.
The permanent rural settlements of Ethiopia can also be broadly divided into two: the scattered (diffused or dispersed) settlements and the grouped (nucleated) settlements. In areas of scattered settlements, homesteads are separated by relatively long distances. On the other hand, the grouped settlements are characterized by a large number of homesteads/households concentrated in one place.
In Ethiopia, the Derg Regime’s compulsory villagization program resulted in the formation of grouped settlements (villages) in many parts of the country. In most parts of the northern regions of the country, such settlements have remained in place for years with the idea that they would enhance communal ownership of land and the provision of social services. But, because the program was conducted by forcing people into villages against their will, and because the services were
Unit 4: POPULATION OF ETHIOPIA AND THE HORN 179
4.5 settlement Patterns of ethIoPIan PoPulatIon 4.5 settlement Patterns of ethIoPIan PoPulatIon
non-existent, people began to return to their original sites, in a manner of reversal move. This movement began even before the regime was overthrown. The current government of Ethiopia has recently conducted villagization programs that are based on peoples’ will to leave their original settlement sites.
Temporary Settlements
What kinds of settlements are temporary? Do you know the areas of Ethiopia in which these types of settlements mostly found? What do you think are the reasons?
The lowlands in most parts of the Rift Valley and peripheral areas of Ethiopia are characterized by pastoralism with temporary settlements. The settlements in these areas are temporary because the pastoralists have to look for new sites for water and pasture lands for their livestock when these resources are exhausted at each new site.
The major problem posed by mobile settlements in these pastoralist areas is the difficulty in providing the people with social services like clean wellspring water, schools, hospitals, electricity, etc. Because most of these services cannot move from place to place as do the pastoralists, the only way that the pastoralists could receive and benefit from them is by settling in permanent locations. However, making such a change can happen only after major alterations have been made in the peoples’ values and attitudes. The current government is involved in progressive activities to help the pastoralists make permanent settlements in a gradual manner.
4.5.2 Urban SettlementsWhat kinds of settlements are considered urban? Can you mention some examples of urban settlements in Ethiopia? Do you know the features that make urban settlements different from the rural settlements in Ethiopia?
Urban settlements include residence in cities and towns. The process of development of urban settlements is known as urbanization. In most parts of Africa, urbanization is a recent phenomenon, and is attributed to colonialism. Urbanization in Ethiopia is not influenced by European colonialism. It is an unplanned, natural phenomenon of the late 19th and early 20th centuries.

Grade 12 Geography 180
4.5 settlement Patterns of ethIoPIan PoPulatIon
FocusNot all grouped settlements are classified as urban centers. Different countries use different criteria for assigning the status of urban center to a settlement. The major criteria used in Ethiopia are
a the settlement has a minimum of 2000 people.b two-thirds of the population in the settlement are engaged in non-
agricultural activities.c the settlement has a chartered municipality.
Historically, two major factors contributed to the development of urban centers in Ethiopia. They are:
F The interconnection of the different parts of the country by all-weather roads, which radiate from Addis Ababa.
F The five-year Italian occupation, which intensified the construction of roads, and the development of small-scale industries and service-giving institutions.
Most urban settlements of Ethiopia have developed along major transport routes, which have attracted people to settle in those areas. Consequently, the areas have turned into centers of greater transport-route network, home of larger numbers of urban populations and, generally, spot of higher population densities.
Activity 4.15
In small groups, discuss this question.
Why are Ethiopia’s urban settlements concentrated along the nation’s major transport routes and networks.
Two main areas in the country have relatively large concentrations of urban populations: the Shewan and the Harerghe plateaus. Together, these regions account for more than 50 percent of the urban population of the country. The major reasons for this situation are:
F relatively high concentration of industries
Unit 4: POPULATION OF ETHIOPIA AND THE HORN 181
4.5 settlement Patterns of ethIoPIan PoPulatIon 4.6 determInants of PoPulatIon chanGe In ethIoPIa
F greater assemblage of social services, such as schools, health institutions, water supplies, electricity, transportation, etc.
Peoples’ needs for such facilities, services, and employment opportunities captivated urban setters to come to those places.
4.6 DETERMINANTS OF POPULATION CHANGE IN ETHIOPIA
At the end of this section, you will be able to: Þ compare fertility and mortality from a given data.
Key Terms
³ Mortality ³ Fertility ³ Migration
³ Natural increase ³ Birth rate ³ Death rate
As you are aware from your previous classes in population geography, population change in any country is affected by three major factors: fertility (births), mortality (deaths), and migration (movement into or out of the nation).
FocusPopulation change in any country is the result of the following.
F The difference between fertility (births) and mortality (deaths), which is called natural increase.
F The balance between immigration (in-migration) and emigration (out-migration), which is known as net migration.
Look at Figure 4.7, below; it is an input-output model of population change.
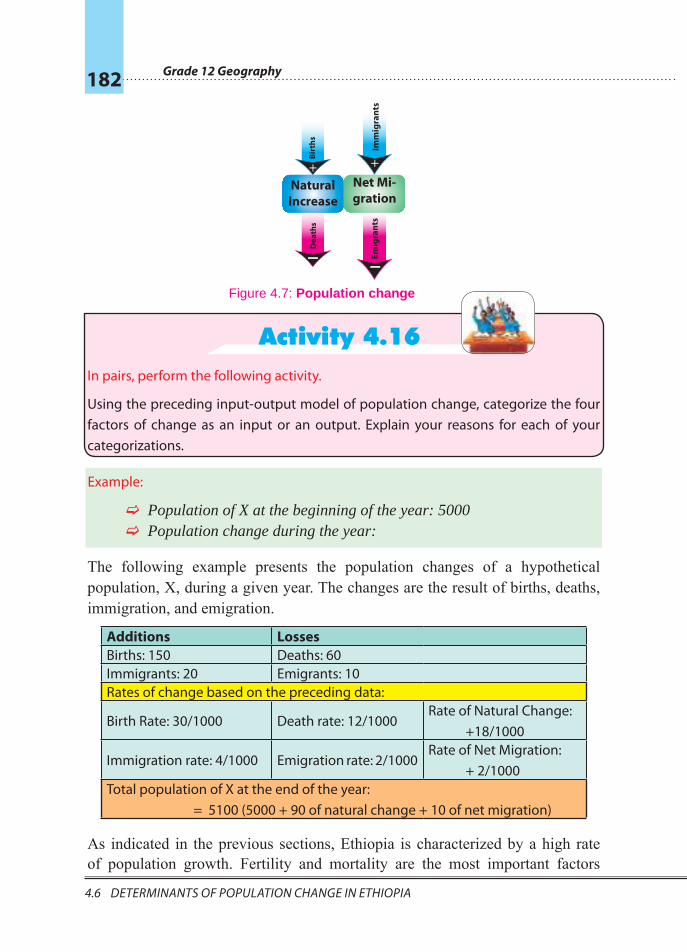
Grade 12 Geography 182
4.6 determInants of PoPulatIon chanGe In ethIoPIa
Activity 4.16In pairs, perform the following activity.
Using the preceding input-output model of population change, categorize the four factors of change as an input or an output. Explain your reasons for each of your categorizations.
Example:
F Population of X at the beginning of the year: 5000 F Population change during the year:
The following example presents the population changes of a hypothetical population, X, during a given year. The changes are the result of births, deaths, immigration, and emigration.
Additions LossesBirths: 150 Deaths: 60Immigrants: 20 Emigrants: 10Rates of change based on the preceding data:
Birth Rate: 30/1000 Death rate: 12/1000Rate of Natural Change: +18/1000
Immigration rate: 4/1000 Emigration rate: 2/1000Rate of Net Migration: + 2/1000
Total population of X at the end of the year: = 5100 (5000 + 90 of natural change + 10 of net migration)
As indicated in the previous sections, Ethiopia is characterized by a high rate of population growth. Fertility and mortality are the most important factors
Figure 4.7: Population change
Natural Increase
Birt
hs
Dea
ths
Net Mi-gration
Imm
igra
nts
Emig
rant
s
Unit 4: POPULATION OF ETHIOPIA AND THE HORN 183
4.6 determInants of PoPulatIon chanGe In ethIoPIa 4.6 determInants of PoPulatIon chanGe In ethIoPIa
contributing to high population growth nation wide. The effect of migration is insignificant.
4.6.1 Fertility in EthiopiaHow does fertility determine the size and structure of the population of a country?
Fertility is one of the three principal components of population change that determine the size and structure of the population of a country. In its general sense, fertility refers to the occurrence of birth in a given country or region.
FocusBefore studying the fertility characteristics of the population of Ethiopia, become familiar with the following measures of fertility.
F Crude Birth Rate (CBR): this is the total number of births occurring in a given year, per 1000 population.
F General Fertility Rate (GFR): this one is the number of births occurring in a given year per 1000 women in the reproductive ages (i.e., women aged 15-49).
F Age Specific Fertility Rate (ASFR): this is the number of births that occur in a given year per woman in the reproductive ages, presented in five-year age groups.
F Total Fertility Rate (TFR): this is the number of children a woman may have produced by the end of her reproductive period, given the current ASFR.
Fertility Levels and Differentials in Ethiopia
Ethiopia, like most countries in sub-Saharan Africa, has rapid population growth, characterized by a high level of fertility. The result of the most recently conducted demographic and health survey of Ethiopia (EDHS 2005) indicate that the fertility level of Ethiopia’s population, as measured by TFR (5.4), GFR (179) and CBR (35.7), is among the highest in the world.
There is also significant variation in fertility levels between the urban and rural populations of the country. As expected, fertility is considerably higher in the
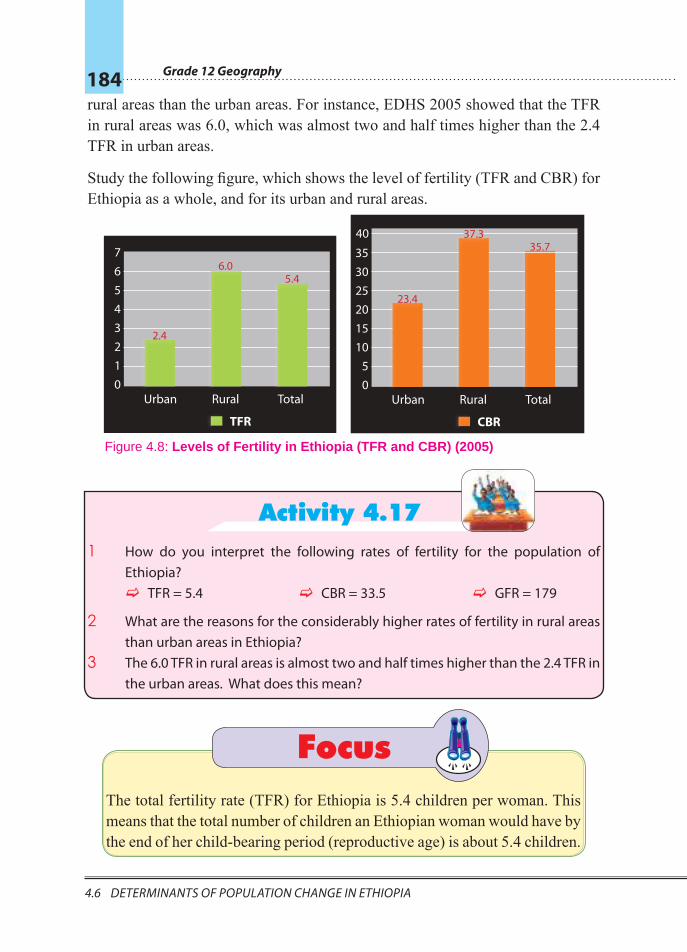
Grade 12 Geography 184
4.6 determInants of PoPulatIon chanGe In ethIoPIa
rural areas than the urban areas. For instance, EDHS 2005 showed that the TFR in rural areas was 6.0, which was almost two and half times higher than the 2.4 TFR in urban areas.
Study the following figure, which shows the level of fertility (TFR and CBR) for Ethiopia as a whole, and for its urban and rural areas.
Activity 4.171 How do you interpret the following rates of fertility for the population of
Ethiopia? F TFR = 5.4 F CBR = 33.5 F GFR = 179
2 What are the reasons for the considerably higher rates of fertility in rural areas than urban areas in Ethiopia?
3 The 6.0 TFR in rural areas is almost two and half times higher than the 2.4 TFR in the urban areas. What does this mean?
FocusThe total fertility rate (TFR) for Ethiopia is 5.4 children per woman. This means that the total number of children an Ethiopian woman would have by the end of her child-bearing period (reproductive age) is about 5.4 children.
76543210
TFR
Urban Rural Total
2.4
6.05.4
35
40
3025201510
50
CBR
Urban Rural Total
23.4
35.737.3
Figure 4.8: Levels of Fertility in Ethiopia (TFR and CBR) (2005)
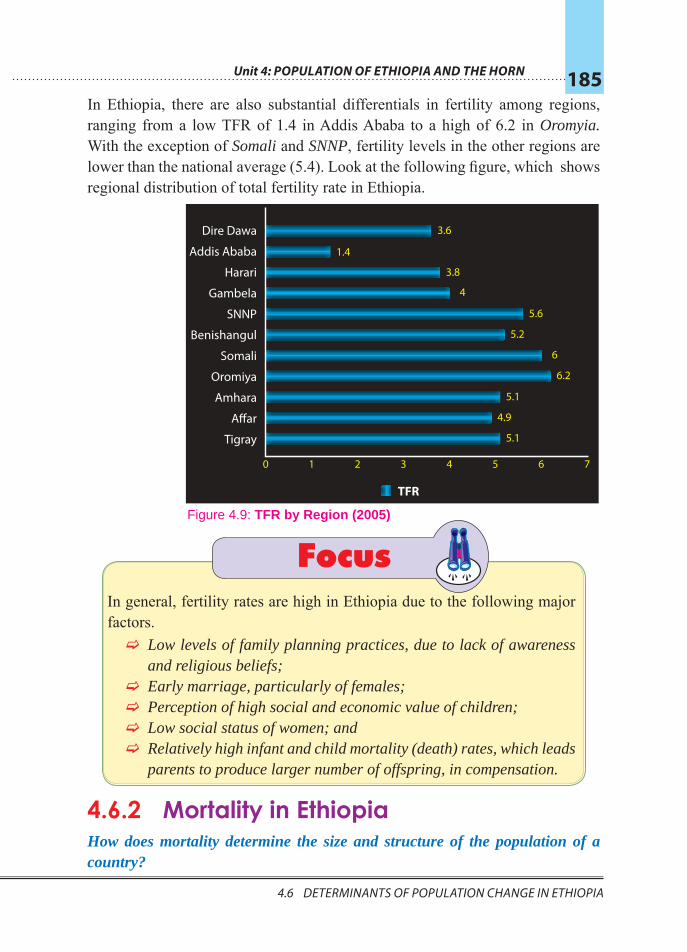
Unit 4: POPULATION OF ETHIOPIA AND THE HORN 185
4.6 determInants of PoPulatIon chanGe In ethIoPIa 4.6 determInants of PoPulatIon chanGe In ethIoPIa
In Ethiopia, there are also substantial differentials in fertility among regions, ranging from a low TFR of 1.4 in Addis Ababa to a high of 6.2 in Oromyia. With the exception of Somali and SNNP, fertility levels in the other regions are lower than the national average (5.4). Look at the following figure, which shows regional distribution of total fertility rate in Ethiopia.
FocusIn general, fertility rates are high in Ethiopia due to the following major factors.
F Low levels of family planning practices, due to lack of awareness and religious beliefs;
F Early marriage, particularly of females; F Perception of high social and economic value of children; F Low social status of women; and F Relatively high infant and child mortality (death) rates, which leads parents to produce larger number of offspring, in compensation.
4.6.2 Mortality in EthiopiaHow does mortality determine the size and structure of the population of a country?
0 1 2 3 4 5 6 7
Dire Dawa
Addis Ababa
Harari
Gambela
Benishangul
SNNP
Somali
Oromiya
Amhara
Affar
Tigray
TFR
3.6
1.4
3.8
4
5.6
5.2
6
6.2
5.1
4.9
5.1
Figure 4.9: TFR by Region (2005)

Grade 12 Geography 186
4.6 determInants of PoPulatIon chanGe In ethIoPIa
Mortality is the second principal factor in population change that determines the size and structure of the population of a country. In its general sense, mortality is the occurrence of deaths in a given population.
FocusBefore studying the mortality characteristics of Ethiopia’s population, become familiar with the following measures of mortality.
F Crude Death Rate (CDR): this is the total number of deaths occurring in a given year, per 1000 people.
F Infant Mortality Rate (IMR): this is the number of deaths in a year among infants under one year of age, per 1000 live births.
F Child Mortality Rate (CMR): this is the number of deaths in a year among children between one and five years of age, per 1000 children between the same ages.
F Under-Five Mortality Rate: this is the number of deaths in a year among infants and children between birth and five years of age, per 1000 live births.
F Maternal Mortality rate (MMR): this is the annual number of maternal deaths occurring during pregnancy, child birth, or within two months after the birth or termination of pregnancy, per 1000 women between 15 and 49 years of age (reproductive age).
F Adult Mortality Rate (AMR): this is the number of deaths in a year among adults between 15 and 49 years of age, per 1000 adults in the same age group.
F Age-Specific Death Rate (ASDR): this is the number of deaths that occur in a given year per 1000 of the population in five-year age group.
F Life Expectancy: this is the average number of years a newborn baby is expected to live if he/she is exposed throughout life to the prevailing pattern of age-specific death rates.
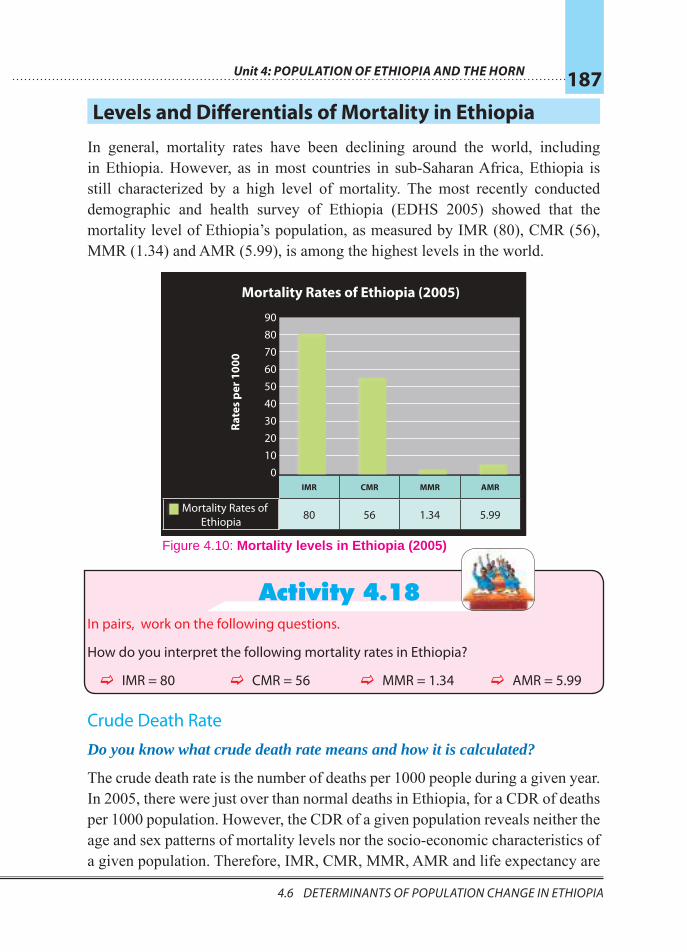
Unit 4: POPULATION OF ETHIOPIA AND THE HORN 187
4.6 determInants of PoPulatIon chanGe In ethIoPIa 4.6 determInants of PoPulatIon chanGe In ethIoPIa
Levels and Differentials of Mortality in Ethiopia
In general, mortality rates have been declining around the world, including in Ethiopia. However, as in most countries in sub-Saharan Africa, Ethiopia is still characterized by a high level of mortality. The most recently conducted demographic and health survey of Ethiopia (EDHS 2005) showed that the mortality level of Ethiopia’s population, as measured by IMR (80), CMR (56), MMR (1.34) and AMR (5.99), is among the highest levels in the world.
Activity 4.18In pairs, work on the following questions.
How do you interpret the following mortality rates in Ethiopia?
F IMR = 80 F CMR = 56 F MMR = 1.34 F AMR = 5.99
Crude Death Rate
Do you know what crude death rate means and how it is calculated?
The crude death rate is the number of deaths per 1000 people during a given year. In 2005, there were just over than normal deaths in Ethiopia, for a CDR of deaths per 1000 population. However, the CDR of a given population reveals neither the age and sex patterns of mortality levels nor the socio-economic characteristics of a given population. Therefore, IMR, CMR, MMR, AMR and life expectancy are
IMR CMR MMR AMR
Mortality Rates of Ethiopia 80 56 1.34 5.99
Mortality Rates of Ethiopia (2005)
Rate
s pe
r 100
0
908070605040302010
0
Figure 4.10: Mortality levels in Ethiopia (2005)
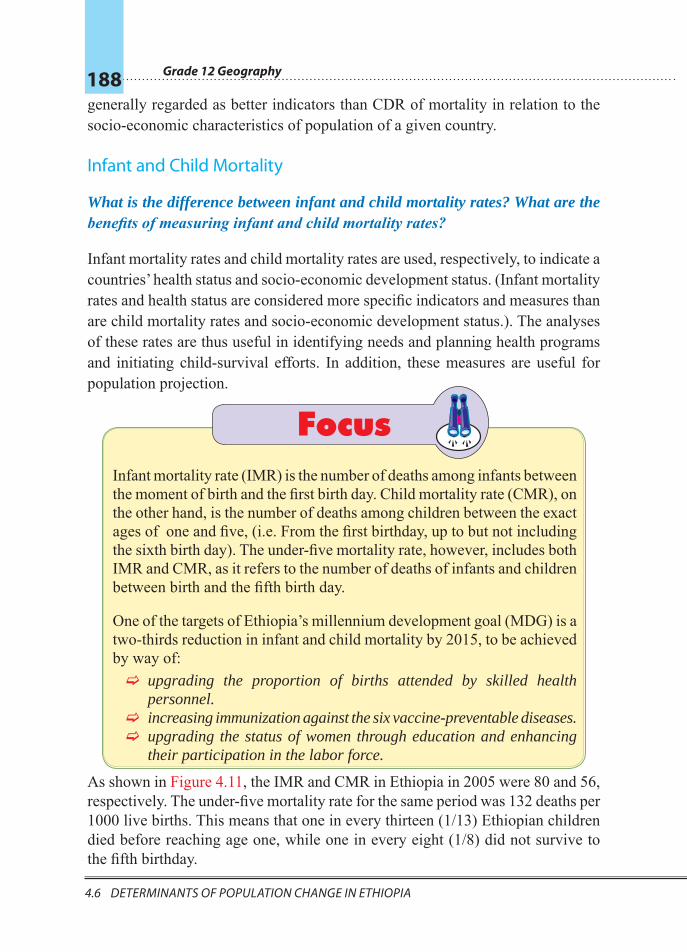
Grade 12 Geography 188
4.6 determInants of PoPulatIon chanGe In ethIoPIa
generally regarded as better indicators than CDR of mortality in relation to the socio-economic characteristics of population of a given country.
Infant and Child Mortality
What is the difference between infant and child mortality rates? What are the benefits of measuring infant and child mortality rates?
Infant mortality rates and child mortality rates are used, respectively, to indicate a countries’ health status and socio-economic development status. (Infant mortality rates and health status are considered more specific indicators and measures than are child mortality rates and socio-economic development status.). The analyses of these rates are thus useful in identifying needs and planning health programs and initiating child-survival efforts. In addition, these measures are useful for population projection.
Focus Infant mortality rate (IMR) is the number of deaths among infants between the moment of birth and the first birth day. Child mortality rate (CMR), on the other hand, is the number of deaths among children between the exact ages of one and five, (i.e. From the first birthday, up to but not including the sixth birth day). The under-five mortality rate, however, includes both IMR and CMR, as it refers to the number of deaths of infants and children between birth and the fifth birth day.
One of the targets of Ethiopia’s millennium development goal (MDG) is a two-thirds reduction in infant and child mortality by 2015, to be achieved by way of:
F upgrading the proportion of births attended by skilled health personnel.
F increasing immunization against the six vaccine-preventable diseases. F upgrading the status of women through education and enhancing their participation in the labor force.
As shown in Figure 4.11, the IMR and CMR in Ethiopia in 2005 were 80 and 56, respectively. The under-five mortality rate for the same period was 132 deaths per 1000 live births. This means that one in every thirteen (1/13) Ethiopian children died before reaching age one, while one in every eight (1/8) did not survive to the fifth birthday.
Unit 4: POPULATION OF ETHIOPIA AND THE HORN 189
4.6 determInants of PoPulatIon chanGe In ethIoPIa 4.6 determInants of PoPulatIon chanGe In ethIoPIa
The IMR of Ethiopia’s population is not only significantly higher than the global average (52/1000), but is also much higher than the average in the less developed countries (57/1000). Ethiopia’s very high IMR is even more striking when we compare it with the lowest rates among the world’s developed countries, such as Japan (4.4/1000 – the lowest in the world), Sweden (5.7/1000), Finland (5.8/1000), Taiwan (6.0/1000), Switzerland (7.3/1000) and the USA (8.8/1000).
Activity 4.19
Answer the following questions, based on Figure 4.11.
1 Which area (urban or rural) has the highest rates of mortality?
2 Discuss the reasons for the differentials in childhood mortality rates for urban and rural areas of Ethiopia.
It is clear that infant and child survival in Ethiopia is influenced by maternal socio-economic characteristics, and that those conditions differ between regions and between rural and urban areas. There is significant urban-rural and regional variation in child mortality levels. Mortality in urban areas is consistently lower than in rural areas. For example, EDHS 2005 showed that infant mortality in urban areas was 66 deaths per 1000 live births, compared to 81 deaths per 1000 live births in rural areas.
There are wide regional differentials in infant, child and under-five mortality
140
120
100
80
60
40
20
0Infant Mortality Child Mortality Under-Five
Mortality
Urban Rural
66
81
34
58
98
135
Figure 4.11: Mortality Rates in Ethiopia by Urban and Rural Residence (2005)
Grade 12 Geography 190
4.6 determInants of PoPulatIon chanGe In ethIoPIa
levels in Ethiopia. The lowest level is that of Addis Ababa (72/1000), which is the most urbanized part of the country. On the other hand, the highest levels are in Benishangul-Gumuz (157/1000), Gambela (156/1000) and Amahara (154/1000).
FocusSurvival of infants and children in Ethiopia is strongly influenced by maternal education and socio-economic status, age at birth, child birth order, birth interval, and gender. For instance, EDHS 2005 showed that:
F Under-five mortality among children born to mothers with no education is more than twice as high as that among children born to mothers with secondary or higher education.
F Childhood mortality is higher among children born to mothers under age 20 and over age 40.
F Children born within two years of a preceding birth are more than three times as likely to die within the first year of life as are children born after an interval of three or more years.
F First births and births of order seven and higher also suffer significantly higher rates of mortality than births of orders two to six.
F Male children experience higher mortality than female children.
F Children born at home with the help of traditional birth attendants experience higher mortality than those born in modern health centers with skilled medical personnel.
Maternal Mortality
What do you think maternal mortality is? What are the benefits of measuring maternal mortality rates?
Maternal mortality is any death that occurred during pregnancy, childbirth, or within two months after a birth or termination of a pregnancy. Maternal mortality rate is the annual number of maternal deaths per 1000 women aged 15-49. Such a rate is an important indicator of reproductive health status, broadly, and maternal health status, specifically, of the population of a given country.
The maternal mortality rate in Ethiopia is high, in relation to such rates in the developed countries. For instance, the average Ethiopian value for the maternal
Unit 4: POPULATION OF ETHIOPIA AND THE HORN 191
4.6 determInants of PoPulatIon chanGe In ethIoPIa 4.7 ImPacts of raPId PoPulatIon Growth In ethIoPIa
mortality rate for the period 1994-2005 was 1.34. The figure seems low, but during this period, maternal deaths in the country accounted for 21 percent of all deaths of women aged 15-49. In other words, more than one in five (1-5) Ethiopian women who died in this period died from pregnancy or pregnancy-related causes. This shows how high the maternal mortality level is in Ethiopia.
Activity 4.20
In small groups discuss, this question.
Why does Ethiopia have a high rate of maternal mortality?
4.7 IMPACTS OF RAPID POPULATION GROWTH IN ETHIOPIA
At the end of this section, you will be able to:
Þ analyze the impact of rapid population growth on Ethiopia’s socio-economic and environmental conditions.
Key Terms
³ Deforestation ³ Pollution ³ Environmental degradation ³ Food scarcity ³ Drought
³ Famine ³ Health care ³ Housing ³ Employment
Can you mention some of the challenges of rapid population growth in Ethiopia? Can you mention some of the real problems that have resulted from population growth in your locality?
As we have already discussed, the size of Ethiopia’s population has been growing very rapidly. The population growth rate is much higher and is increasing much faster than the economic growth rate and is growing beyond the carrying capacity of the country’s natural resources, such as land, water, soil, forest, etc. These negative results of rapid population growth have caused many environmental and socio-economic problems.
Grade 12 Geography 192
4.7 ImPacts of raPId PoPulatIon Growth In ethIoPIa
For example, population growth causes serious environmental degradation in the area where it occurs, including deforestation, pollution, soil erosion, depletion of resources, etc.
Activity 4.21
In small groups, discuss these questions.1 What do you know about global warming?2 How does rapid population growth lead to environmental degradation?
4.7.1 DeforestationWhat is deforestation? Can you mention some of the problems caused by deforestation? is deforestation a problem in your locality?
Forests are the lungs of the earth. They absorb carbon dioxide from the atmosphere and exhale oxygen. They also store energy from the sun, bind topsoil to land, and aid in climate control by capturing and releasing water. They also provide a habitat for innumerable species of plants and animals, serving as a global storehouse of genetic diversity.
The forest cover resource of Ethiopia has been declining significantly over time. This is caused mainly by rapid population growth and the increasing population’s needs for forest resources such as wood and land. Many people in the country use wood for cooking, heating, and lightning, as well as for houses and furniture. Similarly, the increasing demand for agricultural and settlement lands is a major cause of forest destruction in the country. In Ethiopia, there is a direct correlation between population density and deforestation – the more people there are in an area, the more trees they cut down. New trees do not spring up to replace the old ones.
Deforestation refers to the removal of forest cover of an area without adequate
replacement. In other words, it is the process of the indiscriminate destruction
of the natural vegetation cover of a forest area.
Unit 4: POPULATION OF ETHIOPIA AND THE HORN 193
4.7 ImPacts of raPId PoPulatIon Growth In ethIoPIa 4.7 ImPacts of raPId PoPulatIon Growth In ethIoPIa
FocusIn Ethiopia, rapid population growth leads to deforestation mainly because of peoples’ increasing needs for more:
F wood F agricultural land
F settlement land F grazing land
Such deforestation has various negative consequences, both directly on the natural environment, and indirectly on the socio-economic conditions of the people. Its direct consequences include the following.
F It accelerates soil erosion.
F It destroys biodiversity.
F It affects rainfall by decreasing evapotranspiration.
F It results in shortages of wood supply.
F It affects the natural beauty of the affected areas.
Activity 4.22
In pairs, discuss this question.
What are the indirect consequences of deforestation on socio-economic conditions?
4.7.2 Pollution
Can you mention some of the causes of air and water pollution? Is pollution a problem in your locality?
Water and air pollution are mainly caused by human activities in households, industries, farmlands, means of transportation, and so on. However, it can also be
Pollution refers to any undesirable change in natural conditions of water,
air, and other components of the natural environment that has negative
effects on the health and activities of human beings and other living
creatures.

Grade 12 Geography 194
4.7 ImPacts of raPId PoPulatIon Growth In ethIoPIa
caused by natural events such as volcanic eruption, wildfire, and the like.
When an area is overcrowded (i.e. inhabited by a rapidly growing number of people) the natural environment is polluted by a variety of unwanted and harmful wastes that peoples’ activities produce. In Ethiopia, pollution is a major problem in overpopulated urban centers. In large cities like Addis Ababa, most people live in unsafe environments that have extremely polluted air and water. They are surrounded by the garbage and pollutants that households, industries, automobiles, and other sources discharge.
FocusIn Ethiopia, rapid population growth leads to environmental pollution by increasing emission of the amounts of pollutants such as:
F Sewage, solid wastes, and pollutant gases generated by households. F Pollutant gases, liquids, and solid chemicals generated by expanded industries.
F Pollutant gases generated by the increasing number of automobiles. F Agricultural pollutants, such as fertilizers, pesticides, animal wastes, etc.
Activity 4.23
Group Project
1 Form a small group with the help of your teacher.
2 Your teacher will assign one of the following topics to each group.
F Impact of rapid population growth in Ethiopia on:
K Housing
K Food supply
K Farmland
K Education
K Health care
K Drought and famine
3 Write a short paper on the issue.
4 Choose a group representative to present your paper to the class for further discussion.
Unit 4: POPULATION OF ETHIOPIA AND THE HORN 195
4.7 ImPacts of raPId PoPulatIon Growth In ethIoPIa 4.8 PoPulatIon PolIcy of ethIoPIa
4.8 POPULATION POLICY OF ETHIOPIAAt the end of this section, you will be able to:
Þ adhere to the realization of population policy of Ethiopia.
Key Terms
³ Policy ³ Population policy ³ Anti-natal policy
³ Pro-natal policy ³ Reproductive health ³ Family planning
Why do governments and organizations, especially in developing countries like Ethiopia, strongly encourage population planning?
Focus F A population policy is a policy that is formulated and implemented by a government in order to plan and control population growth, based on the economic, social, cultural, political, and demographic conditions of the country. It is needed mainly to address population- related problems in a country.
F The population policies of countries can be broadly categorized into two groups as: anti-natalist and pro-natalist policies.
K Anti-natalist population policy seeks to lower fertility rates, in particular, and population growth rates, in general.
K Pro-natalist population policy seeks to increase fertility rates, in particular, and population growth rates, in general.
History of Population Policy in EthiopiaIn Ethiopia, population policies were given low priority before the early 1990s. After the Derg regime, the Transitional Government of Ethiopia (TGE) adopted a national population policy in 1993. The policy was based on the awareness that large population size and continued rapid population growth in Ethiopia can be an enemy of development and can cause economic, social and environmental problems in the country.
Grade 12 Geography 196
4.8 PoPulatIon PolIcy of ethIoPIa
Activity 4.24In pairs, discuss the following questions.
F Which of the two types of population policies is appropriate for addressing population-related problems in Ethiopia and in other similarly developing countries of the world? Explain why.
F What kinds of countries use pro-natalist population policies? Explain why.
Goals and Strategies of Ethiopia’s Population Policy
Ethiopia’s anti-natal population policy formulates several goals and strategies to regulate population for the over all good of the country.
Ethiopia’s Population-Policy Goals
Ethiopia’s population policy has the following types of goals: F Broad F General F Specific
The broad goal of Ethiopia’s population policy is to promote social welfare by harmonizing the rate of population growth and the country’s capacity for socio-economic development and the rational utilization of natural resources. The policy expresses particular concern over the age structure of Ethiopia’s population, which is greatly dominated by young people. The policy is also concerned with the large number of women in childbearing age, which is likely to result in continued rapid population growth.
General objectives of Ethiopia’s population policy include:
F Closing the gap between high population growth and low economic productivity, through planned reduction of population growth and increasing economic returns;
Note
Similar to most of the developing countries, the type of
population policy used in Ethiopia is basically anti-natalist.
Such policies promote lowered fertility rates, in particular, and
lowered population growth rates, in general.
Unit 4: POPULATION OF ETHIOPIA AND THE HORN 197
4.8 PoPulatIon PolIcy of ethIoPIa 4.8 PoPulatIon PolIcy of ethIoPIa
F Expediting socio-economic development processes through holistically integrated development programs;
F Reducing the rate of rural-to-urban migration;
F Ensuring environmental protections;
F Reducing morbidity and mortality;
F Raising the economic and social status of women; and
F Improving the social and economic status of vulnerable groups, such as adolescents, children, and the elderly.
Specific objectives of Ethiopia’s population policy include:
F Reducing the total fertility rate (TFR) of 7.7 children per woman in 1990 to 4.0 by the year 2015;
F Increasing the prevalence of contraceptive use from 4.0 percent in 1990 to 44 percent in 2015;
F Reducing maternal, infant, and child morbidity and mortality rates, as well as promoting the level of general welfare of the population;
F Significantly increasing female participation at all levels of the educational system;
F Removing all legal and customary practices that prevent women from the full enjoyment of economic and social rights, including the full enjoyment of property rights and access to gainful employment;
F Ensuring spatially balanced population distribution patterns, with a view to maintaining environmental security and extending the scope of development activities;
F Improving productivity in agricultural activities and introducing off-farm and non-agricultural activities for the purpose of employment diversification; and
F Mounting effective country-wide population information and program s that address issues pertaining to small family size and its relationship to human welfare and environmental security.
Ethiopia’s Population-Policy Strategies
The strategies by which the goals and objectives of the population policy are to be attained include the following.
F Expanding contraceptive distribution;
Grade 12 Geography 198
4.8 PoPulatIon PolIcy of ethIoPIa
F Diversifying available contraceptive methods;
F Raising the minimum age of marriage for girls from 15 years to at least 18 years;
F Promoting breast-feeding as a means of birth-spacing;
F Implementing career counseling services in schools;
F Integrating women into the modern sector of the economy;
F Amending all laws “impeding, in any way, the access of women to all social, economic, and cultural resources”;
F Amending relevant articles and sections of the civil code to remove unnecessary restrictions to “advertisement, propagation and popularization of diverse contraceptive methods”;
F Establishing teenage and youth reproductive health counseling centers;
F Increasing research in reproductive health; and
F Promoting the involvement of males in family planning.
The population policy of Ethiopia acknowledges that existing reproductive health service delivery systems are limited in scope and that choice of family planning methods is limited. To correct these problems, it calls for an expansion of reproductive health service delivery, currently available only through the limited formal health structure, to clinical and community-based outreach services. It also recommends the involvement of non-governmental organizations (NGOs) in providing reproductive health services, including the widest possible choice of contraceptives.
The policy also acknowledges a need to expand capacity for performing population research and training family planning advisors. To implement these, it calls for family planning to be integrated into the curricula of medical schools, nursing and health assistants’ schools, junior colleges, and technical-vocational schools.
The population policy also calls for the expansion of Information, Education, and Communication (IEC), and community involvement in achieving the goals and objectives of the policy.
In general, the population policy covers all major ground that needs to be covered in providing directives on the management of population growth in the interest of sustainable development.
Unit 4: POPULATION OF ETHIOPIA AND THE HORN 199
4.8 PoPulatIon PolIcy of ethIoPIa 4.9 urbanIzatIon In ethIoPIa
Activity 4.25
Write a short essay on the following question.
What are your responsibilities and roles in the realization of Ethiopia’s population policy?
4.9 URBANIZATION IN ETHIOPIAAt the end of this section, you will be able to:
Þ explain the concept of urbanization; and Þ discuss the rate of urbanization and its regional variation in Ethiopia Þ compare rate of urbanization.
4.9.1 The Concept of UrbanizationWhat do you know about the concept of urbanization, its causes, and consequences?
The degree of urbanization varies throughout the world but generally reflects the wealth of individual countries. The rich, industrialized countries tend to be the most highly urbanized, while the poor countries tend to be the least urbanized. In the Netherlands, for example, 89 percent of the population is urban, compared to only 16 percent in Ethiopia.
In most developing countries, including Ethiopia, most rural migrants to the cities have bettered themselves in comparison to their former standard of living in rural areas. However, the rapid growth of population in urban centers of such countries has been causing serious problems such as overcrowding, substandard housing, homelessness, inadequate municipal services, crime, poverty, and pollution.
Urbanization is the process of population shifts from rural areas to cities, and the resulting growth of urban areas. It is the process whereby large numbers of people leave countryside/rural places and small towns in order to settle in cities and surrounding metropolitan/urban areas. A nation is said to have become more urbanized as its cities grow in number, its urban populations increase in size, and the proportion of its population living in urban areas rises.
Grade 12 Geography 200
4.9 urbanIzatIon In ethIoPIa
Today, these characteristics mark the lives of many people in most urban centers of the developing countries. Dealing with these conditions, especially in very large cities like Addis Ababa, presents massive difficulties for governments.
4.9.2 Trends of Urbanization in EthiopiaWhat factors are responsible for the varying trends of urbanization in Ethiopia?
As been pointed out earlier, urbanization is a recent phenomenon in Ethiopia. It was introduced mainly after the late 19th and early 20th centuries. Factors Contributing to Urbanization in the nation include: firstly, peoples’ need for better living conditions this has been the major cause for the origin, growth and development of many of the urban centers; secondly, people’s desire to come close to clustered settlements, many rural Ethiopians have been motivated to move and settle in urban places where there are relatively higher concentration of social services, industries, and employment opportunities.
FocusIn the history of Ethiopia, major factors contributed to the origin and development of most urban centers
F The interconnection of the different parts of the country by all-weather roads, which radiate from Addis Ababa.
F The five-year Italian occupation, which intensified the construction of roads, and the development of small-scale industries and service-giving institutions.
Most urban centers of Ethiopia have developed along major transport routes, which have attracted people to these areas. Consequently, areas with greater transport route network have larger numbers of urban settlements, and higher population densities.
Two main areas have relatively large concentrations of urban centers and urban population: the Shewan and the Harerghe plateaus. Together, these regions account for more than 50 percent of the urban population of the country. The major reasons for this situation are:
F Concentration of industries that results in relatively higher opportunities for employment.
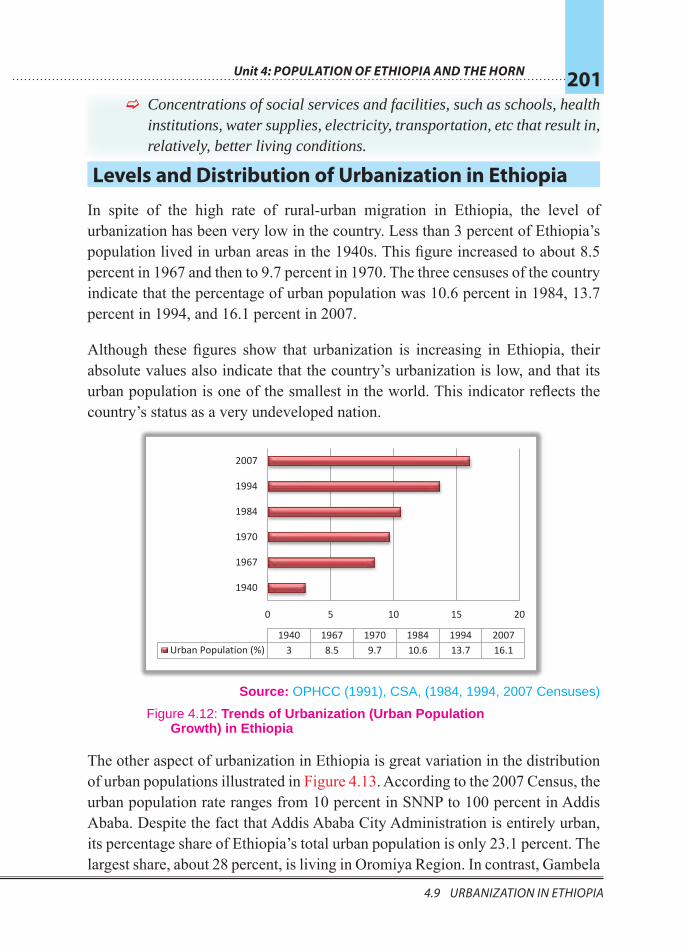
Unit 4: POPULATION OF ETHIOPIA AND THE HORN 201
4.9 urbanIzatIon In ethIoPIa 4.9 urbanIzatIon In ethIoPIa
F Concentrations of social services and facilities, such as schools, health institutions, water supplies, electricity, transportation, etc that result in, relatively, better living conditions.
Levels and Distribution of Urbanization in Ethiopia
In spite of the high rate of rural-urban migration in Ethiopia, the level of urbanization has been very low in the country. Less than 3 percent of Ethiopia’s population lived in urban areas in the 1940s. This figure increased to about 8.5 percent in 1967 and then to 9.7 percent in 1970. The three censuses of the country indicate that the percentage of urban population was 10.6 percent in 1984, 13.7 percent in 1994, and 16.1 percent in 2007.
Although these figures show that urbanization is increasing in Ethiopia, their absolute values also indicate that the country’s urbanization is low, and that its urban population is one of the smallest in the world. This indicator reflects the country’s status as a very undeveloped nation.
Source: OPHCC (1991), CSA, (1984, 1994, 2007 Censuses)
The other aspect of urbanization in Ethiopia is great variation in the distribution of urban populations illustrated in Figure 4.13. According to the 2007 Census, the urban population rate ranges from 10 percent in SNNP to 100 percent in Addis Ababa. Despite the fact that Addis Ababa City Administration is entirely urban, its percentage share of Ethiopia’s total urban population is only 23.1 percent. The largest share, about 28 percent, is living in Oromiya Region. In contrast, Gambela
0 5 10 15 20
1940
1967
1970
1984
1994
2007
1940 1967 1970 1984 1994 2007Urban Population (%) 3 8.5 9.7 10.6 13.7 16.1
Figure 4.12: Trends of Urbanization (Urban Population Growth) in Ethiopia
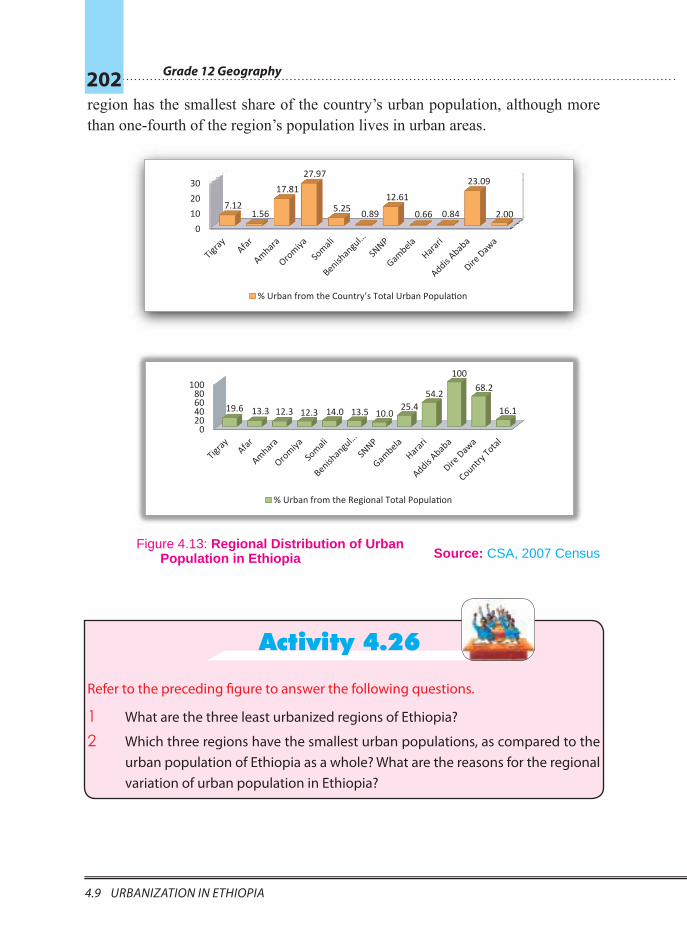
Grade 12 Geography 202
4.9 urbanIzatIon In ethIoPIa
region has the smallest share of the country’s urban population, although more than one-fourth of the region’s population lives in urban areas.
Source: CSA, 2007 Census
Activity 4.26
Refer to the preceding figure to answer the following questions.
1 What are the three least urbanized regions of Ethiopia?
2 Which three regions have the smallest urban populations, as compared to the urban population of Ethiopia as a whole? What are the reasons for the regional variation of urban population in Ethiopia?
0102030
7.12 1.56
17.81 27.97
5.25 0.89
12.61
0.66 0.84
23.09
2.00
% Urban from the Country’s Total Urban Population
020406080
100
19.6 13.3 12.3 12.3 14.0 13.5 10.025.4
54.2
100
68.2
16.1
% Urban from the Regional Total Population
Figure 4.13: Regional Distribution of Urban Population in Ethiopia
Unit 4: POPULATION OF ETHIOPIA AND THE HORN 203
unit review4.9 urbanIzatIon In ethIoPIa
Unit Review
Þ UNIT SUMMARY Þ Malthusian population theory is very pessimistic about population growth
and its effects, while the anti-Malthusian theories are optimistic. Þ Ethiopia is the third most populous country in Africa, with a population of
73.8 million. With a growth rate of 2.23, the country’s population is among the fastest growing in the world.
Þ In Ethiopia a high percentage of the national population is the young age group. This is the result of high birth rate.
Þ In Ethiopia, the population is unevenly distributed; this is due to various physical and human-related factors.
Þ Settlements in Ethiopia are broadly categorized as rural and urban. The primary bases for this distinction are the dominant economic activities and population density.
Þ Population change in any country is affected by three major factors. These factors are: fertility (births), mortality (deaths), and international migration (movement into or out of country).
Þ Ethiopia is characterized by rapid population growth, resulting from a high level of fertility. However, fertility has been declining, moderately especially since the late 1980s.
Þ Although, in general, mortality rates have been declining in Ethiopia, as in most countries in sub-Saharan Africa, the country still has a high mortality rate.
Þ In Ethiopia, the number of international emigrants is higher than the number of immigrants. Within the country, there have been substantial internal movements of people. This has been due to various reasons, including economic, social, political and natural factors.
Þ In Ethiopia, rapid population growth has brought about serious negative impacts on the country’s socio-economic development and on its environmental protection.
Þ Similar to most of the developing countries, the type of population policy used in Ethiopia is basically anti-natalist, promoting lowered fertility rates, in particular, and lower population growth rates, in general.
Þ In Ethiopia, urbanization is a recent phenomenon introduced mainly after the late 19th and early 20th centuries. The country is categorized as one of the least urbanized countries of the world. In Ethiopia, the proportion of urban population varies greatly by region.
Grade 12 Geography 204
unit review
Þ REVIEW EXERCISE FOR UNIT 4I Answer TRUE or FALSE.
1 The main reason for the broad base of Ethiopia’s population pyramid is high rate of mortality in the country.
2 Malthusian population theory believes that population growth has positive consequences.
3 Since 1990, the TFR of Ethiopia’s population has been declining.
4 The high age dependency ratio in Ethiopia is the result of large numbers of people in the old-age group.
5 In Ethiopia, altitude is the major factor that influences population distribution.
II Choose the best possible answer from the alternatives provided.
6 Which of the following areas is in the most sparsely populated areas of Ethiopia?
A KembataB SidamaC Borena
D HadiyaE B and D
7 Which one of the following indicators measures the total number of births occurring in a given year, per 1000 population?A Total Fertility RateB Crude Birth RateC General Fertility Rate
D Age Specific Fertility RateE Rate of Natural Increase
8 In Ethiopia, socio-economic conditions affect all of the following, except:A UrbanizationB MigrationC Age structure
D Population densityE None of the above
9 The high rate of maternal mortality in Ethiopia is the result of:A High educational status of women.B High frequency of births per woman.C Low access of women to reproductive health services.D Early marriageE All except “A”
Unit 4: POPULATION OF ETHIOPIA AND THE HORN 205
unit review
10 Which one of the following is a push factor for the migration of many people from rural areas to urban areas in Ethiopia?A Poor employmentB Better job prospectsC Better services and facilities
D Improved housingE Improved living conditions
III Match the items given under Column A with those under Column B.
A B
IV Fill in the blank spaces.
16 The process of the shift of population from rural areas to cities, and the resulting growth of urban areas is _____________ .
17 Any death that occurs during pregnancy, child birth, or within two months after the birth or termination of a pregnancy is defined as ___________ .
18 According to the 2007 Census, the TFR of Ethiopia’s population is about __________.
19 In the pastoralist areas of Ethiopia, population densities are __________.20 The Ethiopian region that has the highest proportion of the nation’s
population is __________.
V Answer the following questions briefly in writing.
21 What are the two reasons for the high fertility rates in Ethiopia?22 Why are the lowland areas of Ethiopia sparsely populated?23 Why is the age dependency ratio of Ethiopia’s population very high?24 What are the major goals of Ethiopia’s population policy?
11 Population growth leads to innovation
12 Population growth leads to catastrophes
13 Ethiopia’s population policy14 Infant mortality15 Smallest proportion of
internal migrants
A Death below age 1B Rural-to-urban migrationC Anti-natalistD Boserup E Death below age 5 F MalthusG Urban-to-rural migration H Pro-natalist
Unit Outcomes
After completing this unit, you will be able to: Þ realize economic growth, development trend, major features and present
socio-economic development and its indicators Þ analyze the challenges and prospects of socio-economic development
for Ethiopia Þ appreciate the economic relationships with its neighboring countries and
other continents Þ recognize plan for accelerated and sustainable development to end
poverty (PASDEP)
Main Contents5.1 AN OVERVIEW OF GROWTH AND DEVELOPMENT TREND IN ETHIOPIA5.2 MAJOR FEATURES OF ETHIOPIAN ECONOMY5.3 PRESENT FEATURES OF ETHIOPIAN SOCIO-ECONOMIC DEVELOPMENT5.4 CHALLENGES AND PROSPECTS OF SOCIO-ECONOMIC DEVELOPMENT
FOR ETHIOPIA 5.5 ECONOMIC RELATION 5.6 PASDEP (PLAN FOR ACCELERATED AND SUSTAINED DEVELOPMENT TO
END POVERTY) F Unit Summary F Review Exercise
Unit5ECONOMIC GROWTH AND
DEVELOPMENT TREND IN ETHIOPIA
Unit 5: ECONOMIC GROWTH AND DEVELOPMENT TREND IN ETHIOPIA 207
Introduction
ECONOMIC GROWTH AND DEVELOPMENT TREND IN ETHIOPIA
Þ INTRODUCTIONAs documents reveal, Ethiopia’s economy is dominantly based on agriculture: 85
percent of the population is engaged in this sector. However, the performance of
this sector had been weak until 1992. As the Ministry of Finance and Economic
Development study (2004) on sources of growth revealed, encouraging progress
had been made in recent years in improving some of the basic aspects of life
across many parts of the country.
However, the Ethiopian government states that, for the last six or seven years,
the country’s overall economy has been growing at the rate of 11% per year. This
growth rate is among the highest in the world.
While studying this unit, you will learn about the status of the Ethiopian economy
and its prospects. As part of your work, be sure to expand your knowledge by
investigating different sources of information, including books, newspapers,
radio and television.
In your Grade 10 geography lessons you studied various economic subjects,
including detailed analyses of Ethiopia’s economic sectors. The current unit
continues to consider this subject matter, while focusing on the major features of
the Ethiopian economy.
The unit begins by discussing the concepts of economic growth and economic
development. More than forty indicators are used to assess the economic
development of countries. Here, a few that are relevant to the Ethiopian situation
are outlined. The challenges to and prospects for Ethiopia’s socio-economic
development are also discussed. Ethiopia’s economic relations with neighboring
and other countries are also described. Finally, we present the objectives of
Ethiopia’s 2005-2010 Plan for Accelerated and Sustainable Development to End
Poverty (PASDEP).

Grade 12 Geography 208
5.1 An OvervIew Of GrOwth And develOpment trend In ethIOpIA
5.1 AN OVERVIEW OF GROWTH AND DEVELOPMENT TREND IN ETHIOPIA
At the end of this section, you will be able to:
Þ discuss trends of economic growth and development in Ethiopia.
Key Terms
³ Economic growth ³ Economic development ³ Linkages between sectors ³ Indicators of development ³ Accelerated development
³ Sustained development ³ Poverty trap ³ Duty-free ³ Quota-free
Start-Up ActivityAnswer the following questions.
What do you understand by the term economic growth? Does it mean the same thing as economic development? Or are they different?
Economic growth and development are not the same. They have two different meanings. Growth is the quantitative accumulation of the national capital. It is simply a change in output regardless of cultural, political, economic and other improvements.
Development is far more complex than growth. Development is a process involving economic as well as social and environmental changes. It involves higher per capita income, equitable education, and job opportunities, greater gender equality, better health and nutrition, cleaner, more sustainable natural environment, a more impartial judicial and legal system, broader civil and political freedoms, and richer cultural life.
Development is also the qualitative transformation of a whole society, a shift to new ways of thinking, and corresponding new relations and new methods of production. Moreover, transformation only qualifies as development if it benefits most people – improves their quality of life and gives them more control over their destinies. This comprehensive process of change has to involve most of the population and cannot be limited to modernization at the top or in the capital city.
Unit 5: ECONOMIC GROWTH AND DEVELOPMENT TREND IN ETHIOPIA 209
5.1 An OvervIew Of GrOwth And develOpment trend In ethIOpIA 5.1 An OvervIew Of GrOwth And develOpment trend In ethIOpIA
Development must be inclusive of future generations and the earth they will inherit. According to the UN Commission on Environment and Development (1987) “sustainable development is development that meets the needs of the present without compromising the ability of future generations to meet their own needs”. It must engage in people, for without their participation, no strategy can succeed for long.
The term trend refers to a general tendency, movement or direction. So, in the economy of a country, the trend may be upward, downward or stagnating.
Activity 5.1
Form two or more groups (depending on the class size and access to the desired
information) and share tasks. Let a certain group search information/data from the
local concerned offices and another group reconcile the achievement made in the
surroundings. Finally report to the class and make discussion.
According to official sources, the economy of Ethiopia shows a forward tendency with a growing rate of 11% per annum and is projected has been growing at a rate
of 11% and is projected to increase in the coming 5 years.
When we refer to our topic, Economic Growth and Development Trend in
Ethiopia, there has been an encouraging trend since 1996. This fact has been
released by Welfare Monitoring surveys as follows.
F In rural areas, the literacy rate increased from 18% in 1995/96 to 31%
in 2004/05.
F At country level, gross enrollment ratio at primary grades level has
increased from 37.4% in 1996 to 79.8 in 2004/05. Although still
relatively high, primary dropouts in rural areas declined from 18.5%
in 1996 to 13.6% in 2004 at secondary level from 29.3% to 16.5%. The
proportion of households that are very far away from schools. i.e., 10
km in the case of primary school) has fallen substantially.
F The proportion of rural population living more than 20 km from a health
facility has fallen from 20% of household, in 1996 to 13% in 2004.

Grade 12 Geography 210
5.2 An OvervIew Of GrOwth And develOpment trend In ethIOpIA
F A consistent decline in malnutrition over time is being shown in both
rural and urban area. The rate in urban areas fell from 58% in 1996 to
30% in 2004; and in rural areas fell from 67% to 48%.
F About 92% of rural households are less than 5 kms away from the
closest source of drinking water while it is much better in urban area.
More than 82% could get access to drinking water in less than one-
kilometer distance.
F About 42% of rural households are now less than five kilometers away from the closest all-weather road. The trend over time also indicates
that availability of all-weather roads within five kilometer radius has been increasing etc.
In general, Ethiopia has started to have an economic growth at an average 11%,
which is appreciable. PASDEP has contributed much to enhance all the achievements
made for the last five years, the new Growth and Transformation Program (2010-15) will promote and lead to increased success within the coming five years.
Activity 5.2Perform the following tasks:
1 Using an atlas, locate the continents that are considered developed and those
considered to be developing.
2 List at least five countries from each of the above two groups.
Þ Exercise 5.1Short answer questions.
1 Give examples that express economic growth.
2 Describe aspects that explain or show economic development for one
country that has experienced it, and then for another country that has not.
Unit 5: ECONOMIC GROWTH AND DEVELOPMENT TREND IN ETHIOPIA 211
5.2 An OvervIew Of GrOwth And develOpment trend In ethIOpIA 5.2 mAjOr feAtures Of ethIOpIAn ecOnOmy
5.2 MAJOR FEATURES OF ETHIOPIAN ECONOMY
At the end of this section, you will be able to:
Þ characterize the major features of the Ethiopian economy; and Þ describe links between different economic sectors of Ethiopia.
Key Terms
³ Cash crops
³ Industrial crops
³ GDP
³ GNP
³ Backward-linkage
³ Foreward-linkage
How can you characterize the main features of Ethiopian economy?
The nature, performance, and growth of each sector were discussed in detail. Here in this unit, only their basic features are given as we examine the main characteristics of Ethiopia’s economy. Try to integrate the information between the two units.
This section highlights the major sectors of the Ethiopian economy:
F agricultural
F industrial
F distributed (service)
The agricultural sector, which is the dominant sector in many aspects, has
performed unsatisfactorily for the last forty or fifty years due to multifaceted determining factors. Although various developmental strategies have been
adopted since the early 1960s, their performance has been low. Even in the fiscal years of and 2002/03, 2003/04, 2004/05, 2005/06, 2006/07, 2007/08, the GDP
share of agriculture was 44.9%, 47%, 47.4%, 47.2%, 46.3%, 44.6%, respectively.
This apparent decline was due to problems of weather changes, is the main factor
on which Ethiopian agriculture depends. However, reforms instituted after 2002
have promoted the sector significantly.
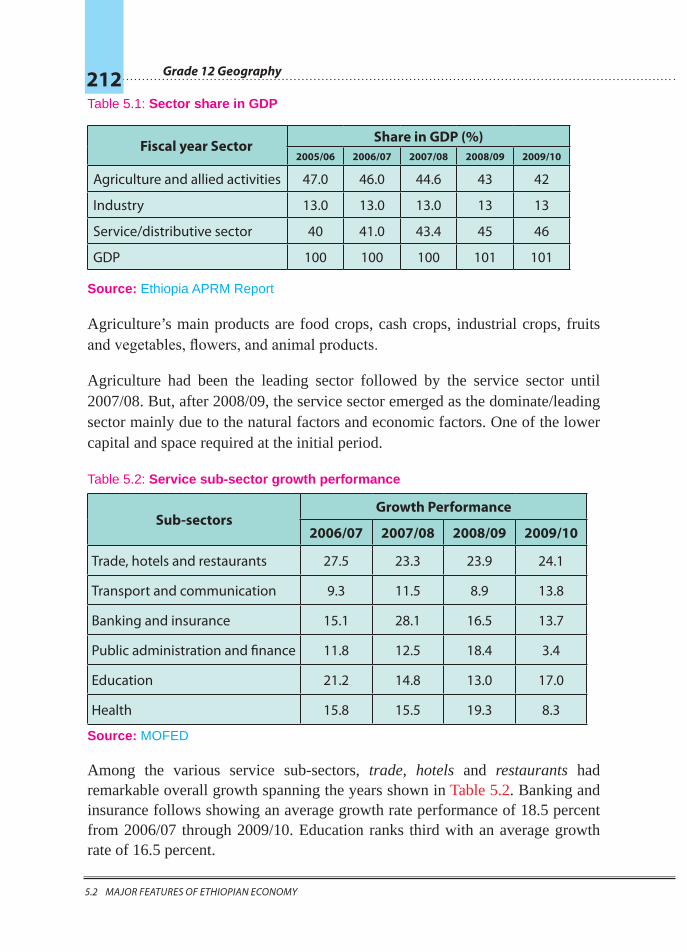
Grade 12 Geography 212
5.2 mAjOr feAtures Of ethIOpIAn ecOnOmy
Table 5.1: Sector share in GDP
Fiscal year SectorShare in GDP (%)
2005/06 2006/07 2007/08 2008/09 2009/10
Agriculture and allied activities 47.0 46.0 44.6 43 42
Industry 13.0 13.0 13.0 13 13
Service/distributive sector 40 41.0 43.4 45 46
GDP 100 100 100 101 101
Source: Ethiopia APRM Report
Agriculture’s main products are food crops, cash crops, industrial crops, fruits and vegetables, flowers, and animal products.
Agriculture had been the leading sector followed by the service sector until 2007/08. But, after 2008/09, the service sector emerged as the dominate/leading sector mainly due to the natural factors and economic factors. One of the lower capital and space required at the initial period.
Table 5.2: Service sub-sector growth performance
Sub-sectorsGrowth Performance
2006/07 2007/08 2008/09 2009/10
Trade, hotels and restaurants 27.5 23.3 23.9 24.1
Transport and communication 9.3 11.5 8.9 13.8
Banking and insurance 15.1 28.1 16.5 13.7
Public administration and finance 11.8 12.5 18.4 3.4
Education 21.2 14.8 13.0 17.0
Health 15.8 15.5 19.3 8.3
Source: MOFED
Among the various service sub-sectors, trade, hotels and restaurants had remarkable overall growth spanning the years shown in Table 5.2. Banking and insurance follows showing an average growth rate performance of 18.5 percent from 2006/07 through 2009/10. Education ranks third with an average growth rate of 16.5 percent.
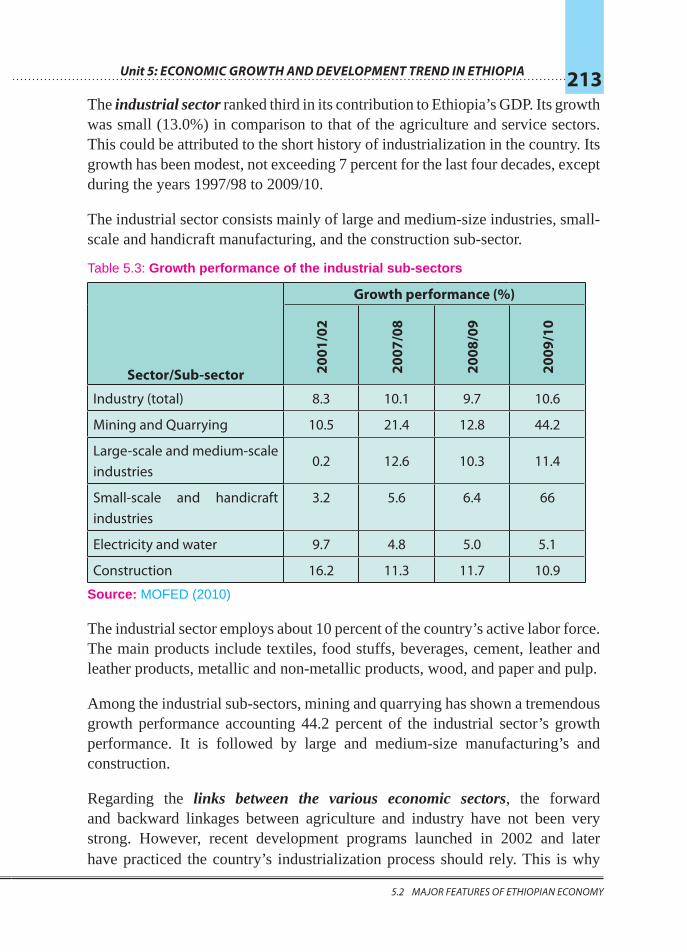
Unit 5: ECONOMIC GROWTH AND DEVELOPMENT TREND IN ETHIOPIA 213
5.2 mAjOr feAtures Of ethIOpIAn ecOnOmy 5.2 mAjOr feAtures Of ethIOpIAn ecOnOmy
The industrial sector ranked third in its contribution to Ethiopia’s GDP. Its growth was small (13.0%) in comparison to that of the agriculture and service sectors. This could be attributed to the short history of industrialization in the country. Its growth has been modest, not exceeding 7 percent for the last four decades, except during the years 1997/98 to 2009/10.
The industrial sector consists mainly of large and medium-size industries, small-scale and handicraft manufacturing, and the construction sub-sector.
Table 5.3: Growth performance of the industrial sub-sectors
Sector/Sub-sector
Growth performance (%)
2001
/02
2007
/08
2008
/09
2009
/10
Industry (total) 8.3 10.1 9.7 10.6
Mining and Quarrying 10.5 21.4 12.8 44.2
Large-scale and medium-scale industries
0.2 12.6 10.3 11.4
Small-scale and handicraft industries
3.2 5.6 6.4 66
Electricity and water 9.7 4.8 5.0 5.1
Construction 16.2 11.3 11.7 10.9
Source: MOFED (2010)
The industrial sector employs about 10 percent of the country’s active labor force. The main products include textiles, food stuffs, beverages, cement, leather and leather products, metallic and non-metallic products, wood, and paper and pulp.
Among the industrial sub-sectors, mining and quarrying has shown a tremendous growth performance accounting 44.2 percent of the industrial sector’s growth performance. It is followed by large and medium-size manufacturing’s and construction.
Regarding the links between the various economic sectors, the forward and backward linkages between agriculture and industry have not been very strong. However, recent development programs launched in 2002 and later have practiced the country’s industrialization process should rely. This is why
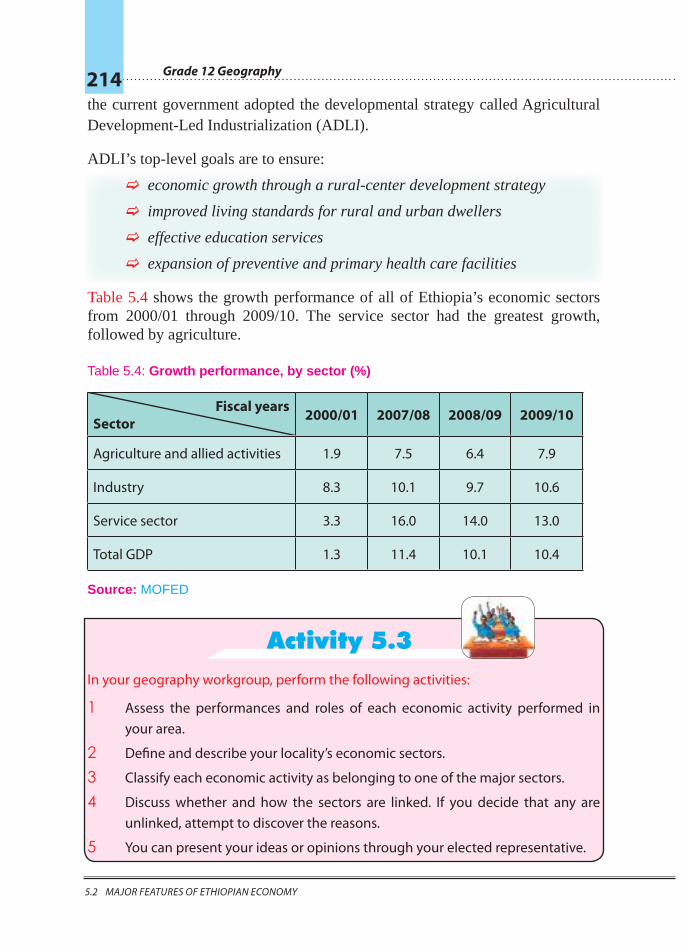
Grade 12 Geography 214
5.2 mAjOr feAtures Of ethIOpIAn ecOnOmy
the current government adopted the developmental strategy called Agricultural Development-Led Industrialization (ADLI).
ADLI’s top-level goals are to ensure:
F economic growth through a rural-center development strategy
F improved living standards for rural and urban dwellers
F effective education services
F expansion of preventive and primary health care facilities
Table 5.4 shows the growth performance of all of Ethiopia’s economic sectors from 2000/01 through 2009/10. The service sector had the greatest growth, followed by agriculture.
Table 5.4: Growth performance, by sector (%)
Fiscal years Sector 2000/01 2007/08 2008/09 2009/10
Agriculture and allied activities 1.9 7.5 6.4 7.9
Industry 8.3 10.1 9.7 10.6
Service sector 3.3 16.0 14.0 13.0
Total GDP 1.3 11.4 10.1 10.4
Source: MOFED
Activity 5.3In your geography workgroup, perform the following activities:
1 Assess the performances and roles of each economic activity performed in your area.
2 Define and describe your locality’s economic sectors.
3 Classify each economic activity as belonging to one of the major sectors.
4 Discuss whether and how the sectors are linked. If you decide that any are unlinked, attempt to discover the reasons.
5 You can present your ideas or opinions through your elected representative.
Unit 5: ECONOMIC GROWTH AND DEVELOPMENT TREND IN ETHIOPIA 215
5.2 mAjOr feAtures Of ethIOpIAn ecOnOmy 5.3 present feAtures Of ethIOpIAn sOcIO-ecOnOmIc develOpment
Þ Exercise 5.21 List the economic sectors of Ethiopia by rank depending on their
contribution to the country’s GDP.
2 List the industrial sub-section by rank, depending on their growth performance from 1999-2005.
3 Suggest why industrialization has a relatively lower status in its contribution to Ethiopias’s GDP.
4 Suggest the possible ways to promote industrialization in Ethiopia.
5.3 PRESENT FEATURES OF ETHIOPIAN SOCIO-ECONOMIC DEVELOPMENT
After completing this section, you will be able to:
Þ reflect links between different economic sectors of Ethiopia; Þ generalize the present features of Ethiopian socio-economic development;
and Þ analyze indicators of development in the Ethiopian context.
Key Terms
³ Expected life expectancy ³ Sustainable development ³ PRP
³ Range areas/lands ³ Spacing of births
What does the present socio-economic feature of Ethiopia look like?
There are various indicators of development employed to compare the level of development countries or regions. The following are widely/frequently used in the Ethiopian context.
F GDP or GNP (Gross Domestic Product/Gross National Product) per capita.
F Illiteracy rate
F Infant mortality rate
F Expected life expectancy
Grade 12 Geography 216
5.3 present feAtures Of ethIOpIAn sOcIO-ecOnOmIc develOpment
F Population growth rate
F Percentage of population who have access to clean water
F Level of infrastructural development, etc.
Based on the above indicators, Ethiopia’s present socio-economic features are treated as follows.
1 GDP per capita: It is believed that Ethiopia’s GDP per capita is one of the lowest in the world. PASDEP’s target has achieved a growth rate of Ethiopia’s GDP per capita status will join the middle in group countries with in the coming five years (2010-2015). The current status of Ethiopia’s GDP per capita is estimated to be US $344 per annum (source: wikipedia, the free encyclopedia).
2 Literacy rate: Like many of the less developed countries, the illiteracy rate in Ethiopia has been high. The literacy campaign that had under taken before 1991 contributed much to the ongoing task to eradicate illiteracy. Since 1996, the illiteracy rate has decreased by 50%. Welfare Monitoring Surveys Undertaken so far exhibits a sharp rise in gross school enrollment that considerably confirm the decline of illiteracy rate in the country. The current literacy rate of Ethiopia is said to be 42.7% in the year 2009 (Source: wikipedia, the free encyclopedia).
3 Infant Mortality Rate: Like in many developing countries, IMR in Ethiopia has been high. The UNDP 1997 census reveal that Ethiopia’s infant mortality rate was 111/000 which even above the average of sub-sharan countries (97/1000). The recent development strategies adopted to achieve growth and sustained development, has target to lower down the IMR to 47/1000 with in the coming five years.
4 Expected life expectancy: the life expectancy of any country is the reflection of varied social, economic, psychological and other factors. In most developing countries life expectancy does not exceed 55 years. Likewise, in Ethiopia, it was 43 about ten years ago due to the prevalence of HIV impacts. The recent strategies adopted both in the primary health care services and supply of HIV/AIDS medicines extensively, the expected life expectancy in Ethiopia has reached to 55.8 years in 2009/10.
5 Population growth rate: Rapid population growth with an average rate per annum has been one of the many threats to Ethiopia’s development pace. Estimates or surveys reveal that 38,000 people are added to the population each week incurring high costs of providing additional services. Addressing
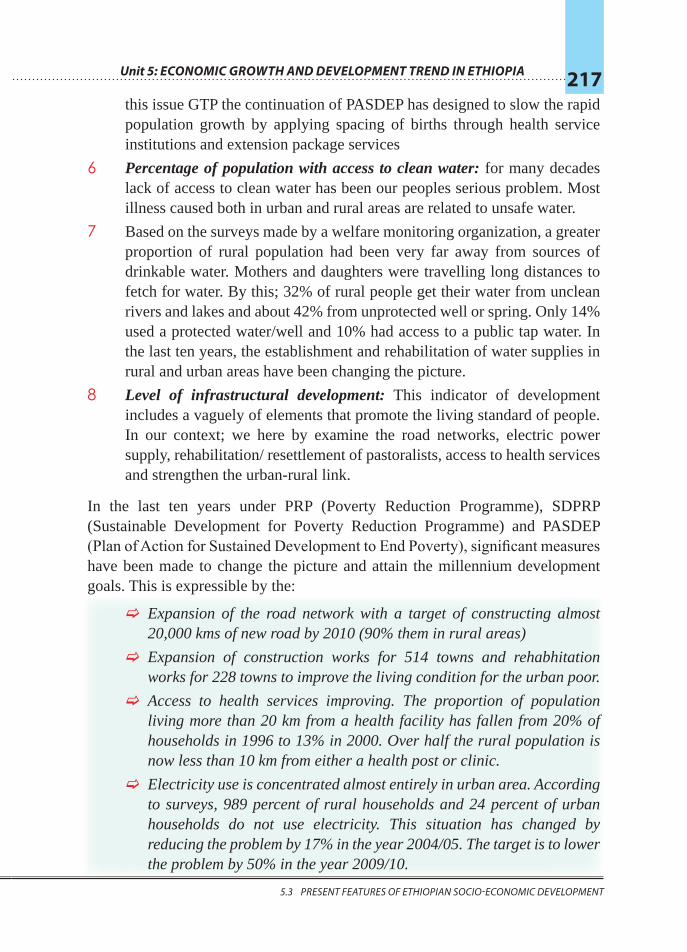
Unit 5: ECONOMIC GROWTH AND DEVELOPMENT TREND IN ETHIOPIA 217
5.3 present feAtures Of ethIOpIAn sOcIO-ecOnOmIc develOpment 5.3 present feAtures Of ethIOpIAn sOcIO-ecOnOmIc develOpment
this issue GTP the continuation of PASDEP has designed to slow the rapid population growth by applying spacing of births through health service institutions and extension package services
6 Percentage of population with access to clean water: for many decades lack of access to clean water has been our peoples serious problem. Most illness caused both in urban and rural areas are related to unsafe water.
7 Based on the surveys made by a welfare monitoring organization, a greater proportion of rural population had been very far away from sources of drinkable water. Mothers and daughters were travelling long distances to fetch for water. By this; 32% of rural people get their water from unclean rivers and lakes and about 42% from unprotected well or spring. Only 14% used a protected water/well and 10% had access to a public tap water. In the last ten years, the establishment and rehabilitation of water supplies in rural and urban areas have been changing the picture.
8 Level of infrastructural development: This indicator of development includes a vaguely of elements that promote the living standard of people. In our context; we here by examine the road networks, electric power supply, rehabilitation/ resettlement of pastoralists, access to health services and strengthen the urban-rural link.
In the last ten years under PRP (Poverty Reduction Programme), SDPRP (Sustainable Development for Poverty Reduction Programme) and PASDEP (Plan of Action for Sustained Development to End Poverty), significant measures have been made to change the picture and attain the millennium development goals. This is expressible by the:
F Expansion of the road network with a target of constructing almost 20,000 kms of new road by 2010 (90% them in rural areas)
F Expansion of construction works for 514 towns and rehabhitation works for 228 towns to improve the living condition for the urban poor.
F Access to health services improving. The proportion of population living more than 20 km from a health facility has fallen from 20% of households in 1996 to 13% in 2000. Over half the rural population is now less than 10 km from either a health post or clinic.
F Electricity use is concentrated almost entirely in urban area. According to surveys, 989 percent of rural households and 24 percent of urban households do not use electricity. This situation has changed by reducing the problem by 17% in the year 2004/05. The target is to lower the problem by 50% in the year 2009/10.
Grade 12 Geography 218
5.4 chAllenGes And prOspects Of sOcIO-ecOnOmIc develOpment fOr ethIOpIA
F A special effort is under way to change the lives of the pastoralists who depend on grazing herds of cattle, camels and goats. These people are concentrated mostly in the dry lowland areas of Afar and Somali regions. In education, a network of informal community-based schools and teaching arrangements are being made. Special programs with improved veterinary services, marketing and early warning systems are under process. Water points adjacent to range areas for dry season utilization and small scale irrigation projects are underway.
Activity 5.4 Organize a data or information collecting group. Let the group list the various infrastructural projects accomplished in your area. Attempt to describe how much these projects will help to change the living condition of the people. The group has to report to the class. The class has to discuss and comment on the report.
Þ Exercise 5.31 What is the basic difference between GDP and GNP?2 Explain the relationship between life expectancy on one hand and different
socio-economic factors on the other hand.3 Identify the current strategic measures underway to improve the pastoralists.
5.4 CHALLENGES AND PROSPECTS OF SOCIO-ECONOMIC DEVELOPMENT FOR ETHIOPIA
At the end of this section, you will be able to:
Þ state the challenges to and prospects for Ethiopia’s socio-economic development.
Key Terms
³ Poverty ³ Poverty-trap
³ Poverty-line ³ Land-fragmentation
Unit 5: ECONOMIC GROWTH AND DEVELOPMENT TREND IN ETHIOPIA 219
5.4 chAllenGes And prOspects Of sOcIO-ecOnOmIc develOpment fOr ethIOpIA 5.4 chAllenGes And prOspects Of sOcIO-ecOnOmIc develOpment fOr ethIOpIA
The preceding section defined and distinguished between economic growth and development. Can you think of some of the economic developments achieved in your area?
The ultimate goal of all economic planning and execution is growth followed by development. Achieving economic development has been a serious issue in many countries, especially in the developing countries. Different programs and strategies have been adopted and pursued, but often their goals have not been achieved or else have not been sustained. This has been the case in our country since the early 1960s.
5.4.1 Challenges to Ethiopia’s Socio-Economic Development
What are Ethiopia’s challenges to achieve development?
For about half a century, successive Ethiopian governments have launched economic development programs to reduce, if not to end, poverty. However, income poverty is widespread. Some 31 million people live below the poverty line, and between 6 and 13 million people are at risk of starvation every year. Also many people lack consumption access – which means that they are unable to purchase basic necessities, often for extended periods of time.
Despite improvements in the past few years, sustainable long-term growth remains a challenge. For example, the full potential of the most basic sector - agriculture - has not yet been realized. Our overall growth performance has not yielded the hoped-for reduction in poverty.
The different factors hindering Ethiopia’s progress (challenges) are interconnected and in combination constitute a “poverty trap” that prevents the country from breaking out of poverty. These factors are:
F Rapid population growth and the concomitant addition of 2 million persons per year is a major barrier to poverty reduction. For instance, this growth puts tremendous strains on Ethiopia’s resource base and the government’s ability to deliver services.
F Land-fragmentation: more than 50% of Ethiopia’s small land holders have less than 2 hectares, which deters the use of modern agricultural input and large-scale farming techniques.
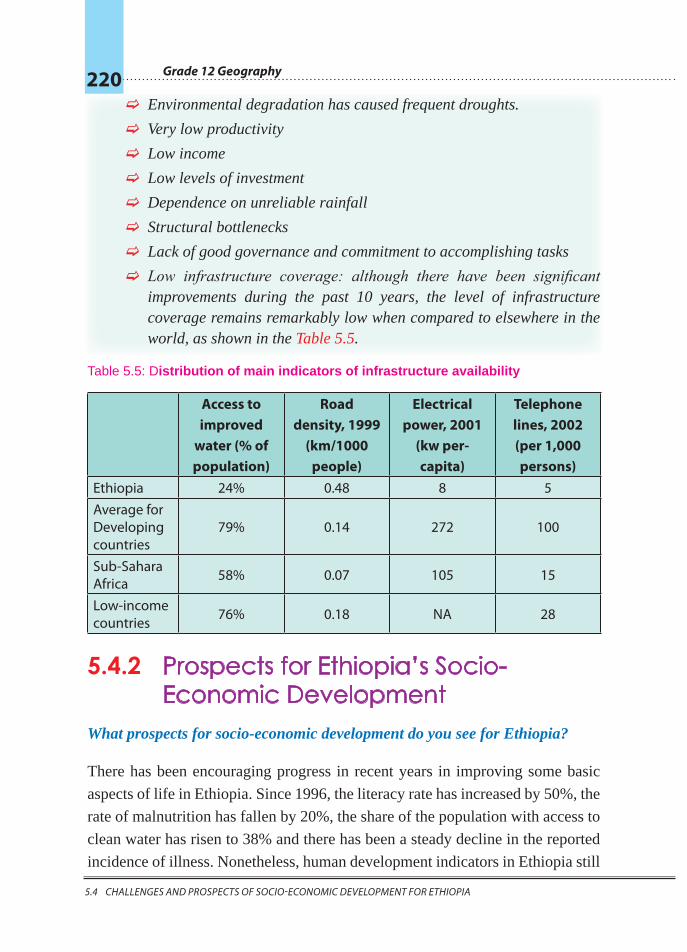
Grade 12 Geography 220
5.4 chAllenGes And prOspects Of sOcIO-ecOnOmIc develOpment fOr ethIOpIA
F Environmental degradation has caused frequent droughts.
F Very low productivity
F Low income
F Low levels of investment
F Dependence on unreliable rainfall
F Structural bottlenecks
F Lack of good governance and commitment to accomplishing tasks
F Low infrastructure coverage: although there have been significant improvements during the past 10 years, the level of infrastructure coverage remains remarkably low when compared to elsewhere in the world, as shown in the Table 5.5.
Table 5.5: Distribution of main indicators of infrastructure availability
Access to improved
water (% of population)
Road density, 1999
(km/1000 people)
Electrical power, 2001
(kw per-capita)
Telephone lines, 2002 (per 1,000 persons)
Ethiopia 24% 0.48 8 5Average for Developing countries
79% 0.14 272 100
Sub-Sahara Africa 58% 0.07 105 15
Low-income countries 76% 0.18 NA 28
5.4.2 Prospects for Ethiopia’s Socio-Economic Development
What prospects for socio-economic development do you see for Ethiopia?
There has been encouraging progress in recent years in improving some basic
aspects of life in Ethiopia. Since 1996, the literacy rate has increased by 50%, the
rate of malnutrition has fallen by 20%, the share of the population with access to
clean water has risen to 38% and there has been a steady decline in the reported
incidence of illness. Nonetheless, human development indicators in Ethiopia still
Unit 5: ECONOMIC GROWTH AND DEVELOPMENT TREND IN ETHIOPIA 221
5.4 chAllenGes And prOspects Of sOcIO-ecOnOmIc develOpment fOr ethIOpIA 5.4 chAllenGes And prOspects Of sOcIO-ecOnOmIc develOpment fOr ethIOpIA
remain at low levels compared with global indicators. For example, Ethiopia’s
maternal mortality, is 673 per 100,000, in 2005/06, which is the highest in the
world.
The way to overcome these challenges is to sustain the economic growth achieved
in the last few years. Maintaining the priority of such growth is essential to finally having a lasting impact on poverty. This growth process is also essential for
financing the necessary social investment for human development.
Estimates show that a growth rate of about 8% per annum would have to be
sustained to reach the Millennium Development Goal (MDG). This rate would
require a great deal of revenue. Existing revenues are insufficient for financing the proposed MDG growth in essential health, education, infrastructure and other
services. Therefore, the government requires a massive increase in tax revenue
(particularly from the unproductive consumption sector) to achieve the required
economic growth of about 6 to 8% per year that is required for meeting the goals
of the Growth and Transformation Programme (GTP) period (2010-2015).
Furthermore, Ethiopia’s strategy must be based on its most abundant resources:
labor and the country’s favorable climate (for instance for flowers and other crops).
In sum, progress is needed on every possible front including:
F proper utilization of agricultural potential;
F much more rapid development of the modern sector;
F exploitation of niche markets and opportunities wherever they present
themselves;
F expansion of exports: in particular, diversifying exportable items to
widen the economic base, reduce susceptibility to shocks and, in the
long term, to reduce the prevailing dependency on foreign aid;
F promotion of better links between markets and producers to enable
business to take place and to allow people easier access to essential
services;
F promotion of capacity building regarding the work force’s education
and skills.
Grade 12 Geography 222
5.5 ecOnOmIc relAtIOn
F slowing the existing rapid population growth; and
F proper utilization of the potential of Ethiopia’s women, who constitute
about 48.9 percent of the population.
Activity 5.5Make a thorough assessment of the challenges to economic growth and development in your area. What are the major challenges? For example, is it unemployment? Low productivity? Drought? What else? Then, predict the possible prospects for overcoming the challenges. If there are self-help institutions or associations in your area, discuss how they could be used. Also, invite guest speakers to conduct discussions with your class.
Þ Exercise 5.41 State the domino-effects of rapid population growth.
2 What are the advantages of diversifying exportable items?
3 Explain briefly what capacity building mean to education.
4 How much growth rate is the estimate fore-warded to reach the Millennium Development Goals?
5.5 ECONOMIC RELATIONAt the end of this section, you will be able to:
Þ appreciate Ethiopia’s economic relations with other countries.
Key Terms
³ Exports
³ Imports
³ Duty-free
³ Quota-free
Why do countries establish economic relationships? Does any country in the world independently meet all the needs and wants of its nation?
Unit 5: ECONOMIC GROWTH AND DEVELOPMENT TREND IN ETHIOPIA 223
5.5 ecOnOmIc relAtIOn 5.5 ecOnOmIc relAtIOn
Many geographical and political factors drive countries to establish economic relationships with other countries, including:
F geographic factors, such as physiographic variation, that result in product variation.
F political factors such as political affiliations due to temporary or permanent common interests.
F economic factors such as comparative advantages.
Ethiopia’s economic relationships are greatly affected by factors such as those. As a result, the nation has economic relationships with:
F neighboring countries,
F other countries.
5.5.1 Ethiopia’s Economic Relationships with Neighboring Countries
Ethiopia has these relationships with its neighbors:
F Ethiopia has a long-standing economic relationship with the Republic of Djibouti.
F The Sudan has started a good economic relationship with Ethiopia by providing petroleum. It is hoped that this relationship will strengthen in the future.
F Due to the political instability prevailing in Somalia, economic relationships are minor.
5.5.2 Ethiopia’s Economic Relationships with Countries Other than its Neighbors
The same factors that govern Ethiopia’s economic relationships with neighboring countries affect its relationships with other countries. In addition, the nature of Ethiopia’s export and import items as well as its trade policy and strategy influence the economic relationships that the nation establishes with distant countries. Another factor is Ethiopia’s advantageous geographical proximity to countries of the Middle East, the Gulf, and Europe.
Grade 12 Geography 224
5.5 ecOnOmIc relAtIOn
Exports
For decades, Ethiopia has had substantial economic relationships with Western Europe, the Far East and North America. Due to the economic reforms of 1993 and later periods, Ethiopian trade with these regions has grown, and its export destinations have widened to include other regions such as Central America . This expansion has led to greater earnings in foreign capital.
For instance, the relatively new business of exporting cut flowers has created a major export commodity and has opened new markets for Ethiopia and brought in significant foreign earnings.
Regarding Ethiopia’s export distribution in world regions, Europe was the leading export destination in the year 2006/07, taking 40.8% of the total value, and was followed by Asia, Africa and North and Central America, accounting for 33.5%, 15.5% and 5.8%, respectively.
In terms of individual trade-partner countries, the export major destinations for 2005 were:
F Germany 13.3%
F China 9.1%
F Japan 7.3%
F Saudi Arabia 6%
F Djibouti 5.9%
F Italy 5%
F USA 4.7%
Germany was the single most important destination for Ethiopian exports between 2004 and 2006.
Imports
According to the Ministry of Trade and Industry, Ethiopia’s most important sources of imports in 2004/05 were the Middle East and Asia which, in combination, accounted for 57.5%. Next was Europe, at 23.1%. The third and fourth places were taken by North America and Africa.
Unit 5: ECONOMIC GROWTH AND DEVELOPMENT TREND IN ETHIOPIA 225
5.5 ecOnOmIc relAtIOn 5.5 ecOnOmIc relAtIOn
As for the individual trading partners,
F Saudi Arabia’s share was 9.5% in 2003 and 15.7% in 2005.
F China’s share was around 9.6% in 2003 and 12.7% in 2007.
In general, Saudi Arabia and China are the two most important sources of imports for Ethiopia in recent years. The increase shown above in China’s share resulted when China became a major source of lower-cost consumer goods and other basic manufactured items.
Duty-Free and Quota-Free Market-Access Opportunities
In the context of the World Trade Organization (WTO), Ethiopia, which is one of the developing countries, is expected to benefit from duty-free and quota-free market-access opportunities. For example, the People’s Republic of China has granted almost all Ethiopian export products duty-free access to its markets.
Such opportunities will broaden Ethiopia’s economic relationships and connect our nation with additional countries. This process will be facilitated by Ethiopia’s advantageous geographical proximities to the Middle East, Gulf countries and European countries.
Activity 5.6 Considering the geographical advantages Ethiopia has over its neighboring countries, identify the most promising exportable items to the Middle East and Gulf countries.
Þ Exercise 5.51 Which neighboring country of Ethiopia is a good trade partner? (In the
sphere of recovering its exports).
2 Which European country takes the largest share of Ethiopians export?
3 States the most probable prospective trade regions or areas to Ethiopia’s agricultural exports.
Grade 12 Geography 226
5.6 pAsdep (plAn fOr AccelerAted And sustAIned develOpment tO end pOverty)
5.6 PASDEP (PLAN FOR ACCELERATED AND SUSTAINED DEVELOPMENT TO END POVERTY)
At the end of this section, you will be able to:
Þ be interested in PASDEP.
Key Terms
³ Growth and Transformation programme ³ Massive push to accelerated growth
Does Ethiopia have a long history of adopting National Development plan? What are the core objectives of National Development plans?
Since the early 1960s, various development plans have been designed in Ethiopia to alleviate poverty. However, due to factors such as wrong structural adjustments and frequent weather shocks, the country has not been able to come out of its “poverty trap”.
The National Development Plans that were developed under the Monarchy and under the Military Regime were unable to improve the lives of most Ethiopian people, particularly the peasantry.
The EPRDF government initiated a five-year development program during its first year’s rule (1992-1993). Later, it defined successive additional five-year development plans to achieve sustainable growth. These are
F Sustainable Development and Poverty Reduction Programme (SDPRP) – 2000-2004.
F Plan for Accelerated and Sustainable Developments to End Poverty – 2005-2010 (PASDEP)
F Growth and Transformation Programme – 2010-2015 (GTP).
We shall now consider PASDEP, examining it as a good example of Ethiopia’s current approach to economic and social development.
What is PASDEP?
PASDEP is a document that describes the Plan for Accelerated and Sustained Development to End Poverty. It was Ethiopia’s guiding strategic framework for
Unit 5: ECONOMIC GROWTH AND DEVELOPMENT TREND IN ETHIOPIA 227
5.6 pAsdep (plAn fOr AccelerAted And sustAIned develOpment tO end pOverty) 5.6 pAsdep (plAn fOr AccelerAted And sustAIned develOpment tO end pOverty)
the five-year period of 2005 – 2010. It represents the second phase of SDPRP, which covered 2001 – 2004, and it is the link to GTP, which was designed for 2010 – 2015.
PASDEP carries forward important SDPRP strategies related to:
F human development
F rural development
F food security
F capacity building
GTP also addresses these and other socio-economic issues.
Unfortunately, during its 5-year period, PASDEP was affected by a number of external and internal shocks including:
F less support than expected offered by donors
F poor rainfall
F the global financial crises that began in 2008/2009 and swept the whole world
The PASDEP process benefited from two round consultations with civil society, non-government actors, and partners. The strategy was also supported by a number of background papers and studies prepared by government ministries and independent Ethiopian experts. The strategy’s bases included the MDGs Needs Assessment for Ethiopia.
The PASDEP Strategy During the PASDEP period, Ethiopia continued to follow the important initiatives adopted under SDPRP (expanding education and strengthening health services, capacity building, decentralization, and the food security program). It also continued to pursue the strategy of ADLI (Agricultural Development-Led Industrialization) but made important enhancements to intensify and commercialize the small-land-holding agricultural sub-sector.
The PASDEP program was based on these nine activities:
1 A massive push to accelerate growth. This strategy had two main thrusts:
i Commercialization of agriculture, and
ii Promoting much moral rapid non-farm private sector.
2 A more differentiated approach to agriculture, focusing on Ethiopia’s very different agro-ecological area.
Grade 12 Geography 228
5.6 pAsdep (plAn fOr AccelerAted And sustAIned develOpment tO end pOverty)
3 A renewed look at several-urban linkages and the urban agenda.
4 Addressing the population challenge by implementing the existing national population strategy and making services available for spacing births.
5 Unleashing the potential of Ethiopia’s women. The goals were:
i increasing the number of girls who complete their schooling
ii improving women’s health
iii liberating girls’ and women’s time from the unproductive hours spent fetching water supplies.
iv improving several telephone services
6 Strengthening the infrastructure’s backbone – the road network, water supply, electric power supply, etc.
7 Managing risk and volatility. The goals were:
i reducing repeated households cycles in and out of poverty that result from crop failure and major illness.
ii reducing the impact of shocks on public finances and government programs
8 Intensive efforts to reach the MDGs. This goal included a major effort between the government of Ethiopia and its foreign-aid partners.
9 Creating jobs. In Ethiopia, especially in urban areas, unemployment is a serious challenge. The goals were:
i managing the dynamics of population growth
ii expanding labor-intensive production activities

Unit 5: ECONOMIC GROWTH AND DEVELOPMENT TREND IN ETHIOPIA 229
unit review5.6 pAsdep (plAn fOr AccelerAted And sustAIned develOpment tO end pOverty)
Unit Review
Þ UNIT SUMMARY Þ The two economic concepts – growth and development are not the same
in scope and essence.
Þ Economic development is more complex. In addition to the present socio-economic situations, it considers the benefit of the future generation.
Þ The major economic features of Ethiopia are characterized by the agriculture, industry and service sectors. The agricultural sector leads the other sectors in its contribution to GDP, export earnings, labour employment, etc.
Þ Although the agricultural sector has relatively better forward linkage with the industrial sector by supplying raw materials, the forward linkage is small.
Þ The present features of Ethiopia’s socio-economic development has been showing an encouraging progress since 1992. Growth in the various sectors is being achieved. The service sector is exhibiting a dynamic change when compared to the other two sectors.
Þ Although these changes are achieved, attaining sustainable growth and an end to poverty is a challenge. Various and consecutive but inter–related development policies and strategies are in process to meet the challenges. For example,
Þ Sustainable Development and Poverty Reduction program (2000 – 2004)
Þ Plan for Accelerated and Sustainable Development to End Poverty (2005 –2010)
Þ Growth and Transformation Program (2010 – 2015)
Þ Ethiopia’s economic relationships with neighboring and other countries developed over time. Because the existing political situations in most of the neighboring countries, its trade relationships with other counties is strong.
Þ The targets set by PASDEP appear to be sound. Remarkable achievements are being seen in the expansion of roads, schools, energy supply plants, export earnings, etc.
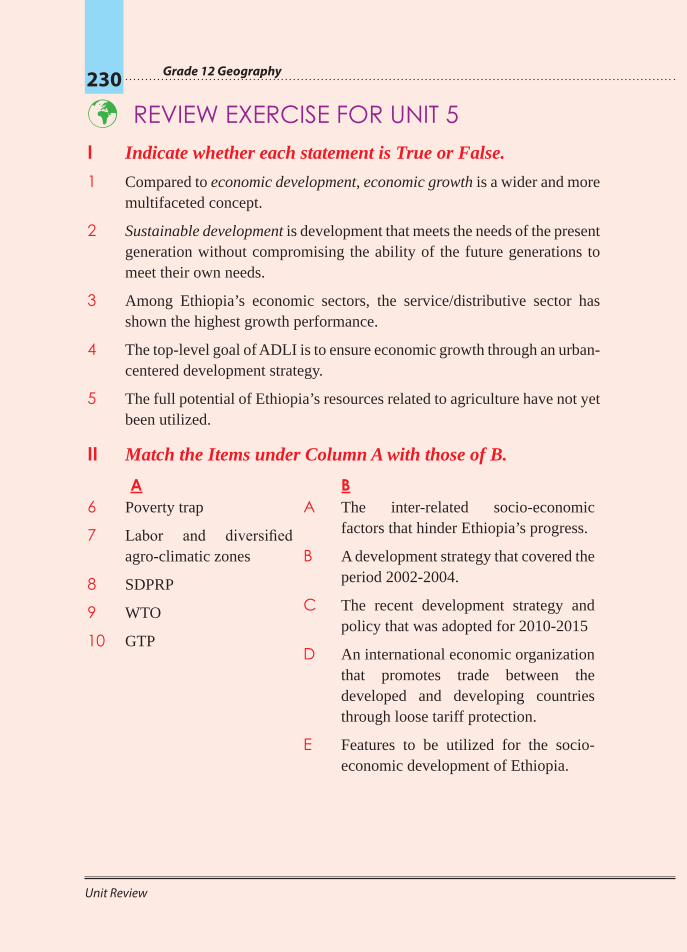
Grade 12 Geography 230
unit review
Þ REVIEW EXERCISE FOR UNIT 5 I Indicate whether each statement is True or False.
1 Compared to economic development, economic growth is a wider and more multifaceted concept.
2 Sustainable development is development that meets the needs of the present generation without compromising the ability of the future generations to meet their own needs.
3 Among Ethiopia’s economic sectors, the service/distributive sector has shown the highest growth performance.
4 The top-level goal of ADLI is to ensure economic growth through an urban-centered development strategy.
5 The full potential of Ethiopia’s resources related to agriculture have not yet been utilized.
II Match the Items under Column A with those of B.
A B 6 Poverty trap
7 Labor and diversified agro-climatic zones
8 SDPRP
9 WTO
10 GTP
A The inter-related socio-economic factors that hinder Ethiopia’s progress.
B A development strategy that covered the period 2002-2004.
C The recent development strategy and policy that was adopted for 2010-2015
D An international economic organization that promotes trade between the developed and developing countries through loose tariff protection.
E Features to be utilized for the socio-economic development of Ethiopia.
Unit 5: ECONOMIC GROWTH AND DEVELOPMENT TREND IN ETHIOPIA 231
unit review
III Choose the best answer among the suggested alternatives.
11 Which sub-sector of the service/distributive sector showed the best growth performance during the fiscal year 2005/2006?
A Hotels and restaurants
B Banking and insurance
C Education
D Transport and communication
12 The development program and strategy that was launched in 2002 to improve the economy of Ethiopia sought to overcome
A Rapid population growth
B Unexpected weather changes
C Low levels of infrastructure
D Diversified climatic zones13 All are the challenges to Ethiopia’s socio-economic development except
A Rapid population growth
B Unexpected weather changes
C Low level of infrastructure
D Diversified climatic zones 14 Which one of the following might facilitate Ethiopia’s socio-economic
development?
A expansion of exports by diversifying exportable items
B slowing down the existing rapid population growth
C utilizing the potential of Ethiopia’s women
D all of the above
15 Which country has been the single most important destination for Ethiopia’s exports?
A England
B Japan
C Germany
D USA
Grade 12 Geography 232
unit review
16 The two most important sources of Ethiopian imports in recent years have been
A England and Germany
B Saudi Arabia and China
C Djibouti and Egypt
D China and Japan
17 The external factor (s) that negatively affected PASDEP was/were
A the poor rainfall experienced in 2005/06
B the global financial crises of 2008/09C less support than expected offered by foreign donors
D B and C
IV Give short answers.
18 List the major export and imports of Ethiopia in order of importance.
19 Attempt to explain the major problems that have hindered agricultural development in Ethiopia.
20 Compare and contrast the developmental strategies adopted in Ethiopia before and after 1991.
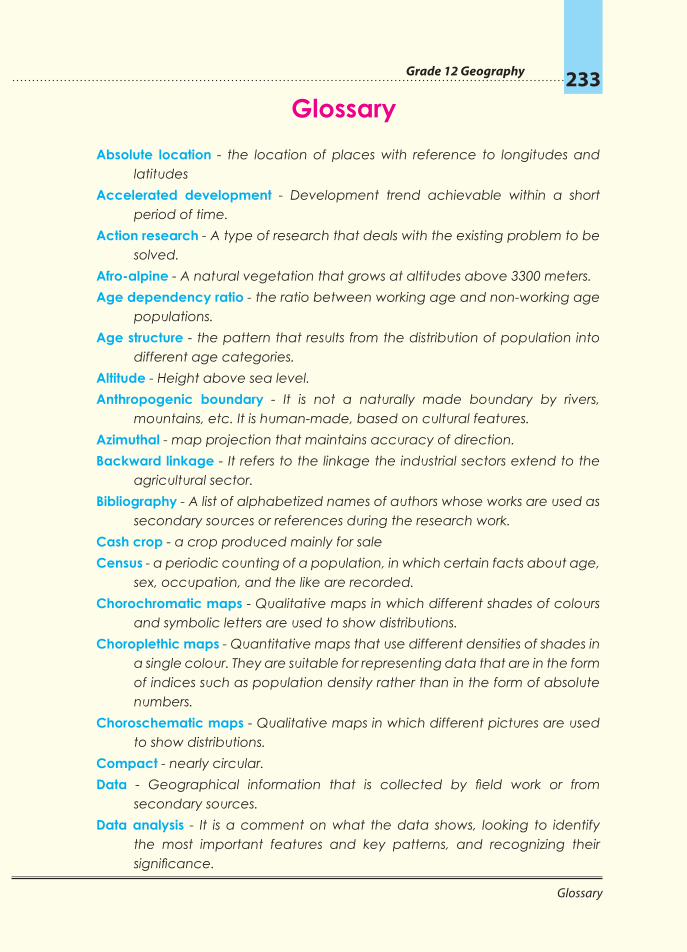
Grade 12 Geography 233
Glossary
Glossary Absolute location - the location of places with reference to longitudes and
latitudes Accelerated development - Development trend achievable within a short
period of time.Action research - A type of research that deals with the existing problem to be
solved. Afro-alpine - A natural vegetation that grows at altitudes above 3300 meters.Age dependency ratio - the ratio between working age and non-working age
populations.Age structure - the pattern that results from the distribution of population into
different age categories. Altitude - Height above sea level. Anthropogenic boundary - It is not a naturally made boundary by rivers,
mountains, etc. It is human-made, based on cultural features. Azimuthal - map projection that maintains accuracy of direction. Backward linkage - It refers to the linkage the industrial sectors extend to the
agricultural sector. Bibliography - A list of alphabetized names of authors whose works are used as
secondary sources or references during the research work. Cash crop - a crop produced mainly for sale Census - a periodic counting of a population, in which certain facts about age,
sex, occupation, and the like are recorded.Chorochromatic maps - Qualitative maps in which different shades of colours
and symbolic letters are used to show distributions. Choroplethic maps - Quantitative maps that use different densities of shades in
a single colour. They are suitable for representing data that are in the form of indices such as population density rather than in the form of absolute numbers.
Choroschematic maps - Qualitative maps in which different pictures are used to show distributions.
Compact - nearly circular. Data - Geographical information that is collected by field work or from
secondary sources. Data analysis - It is a comment on what the data shows, looking to identify
the most important features and key patterns, and recognizing their significance.
Grade 12 Geography 234
Glossary
Deforestation - the process of indiscriminate destruction of the natural vegetation cover of an area without adequate replacement.
Demography - the scientific study of how births, deaths, and migration affect the composition, size, and distribution of populations.
Dependent variable - a variable determined by the main variable.
Duty-free - Free from taxation.
Economic development - a complex process of development involving the social, cultural, economic and political aspects of citizens.
Economic growth - the quantitative accumulation of national products/wealth.
Elongated - tappering either east-west or north-south direction.
Endemic- native/not found elsewhere.
Endogenic force - Internal force (Example: volcanism and tectonic).
Epeirogenic movement - A tectonic movement that results in either the uplifting or sinking of surfaces.
Epoch - Next-smaller division of geological time after Period.
Equal area projection - A projection that maintains relative size accurately.
Era - second largest division of geological time characterized by differences in life forms (Example: Paleozoic era - an era of amphibians, Mesozoic era - an era of reptiles).
Forward linkage - the linkage extended from the source sector to the receiving sector (Example: Agriculture to industry).
Geological location - A variant of relative location that considers global or semi-global areal extents (Example: the location of Ethiopia with reference to the middle East, etc).
Geology - A branch of natural science that studies the composition and structure of rock.
GIS (Geographic Information System) - A computer - based system that records, stores and analyses information about features of the earth’s surface.
Humus - Dark-colored, decayed organic matter that supplies nutrients to soils and then to plants.
Hypothesis - A statement about what we expect to find before we make the actual investigation. It can be tested or proved to see whether it is correct or not.
Independent variable - A determining variable.
Indicators of developments - Factors/elements that show the achievement of development (Example: GNP per-capital, life expectancy, etc)
Grade 12 Geography 235
Glossary
Industrial crops - crops that serve as raw materials for manufacture (Example: cotton, tea, tobacco, etc.)
Infant mortality rate - the number of deaths among infants under one year of age per 1,000 live births in a given year.
Inter-Tropical Convergence Zone - It is a low-pressure zone created within the tropic due to the occurrence of the overhead sun and convergence of northeasterlies and Equatorial Westerlies.
Interview - Asking people questions in order to get the required information for the research work. It is usually conducted on a one-to-one basis.
Landscape - landform.
Latitude - Angular distance of places north and south of the equator.
Leaching - Removal of minerals that have been dissolved in water.
Life expectancy - the life span expected when one is born or at birth.
Mapprojection - is a technique or device that cartographers use to transfer information from a globe onto a flat surface.
Meridians - are lines drawn from north to south and from east to west of the zero degree longitude.
Model - Artificially designed simulation to represent an organization or function of the real world.
Mortality rate - the relative frequency of deaths among members of a population segment.
Orogenic movement - A tectonic movement that is horizontal and results in the formation of folding.
Orthomorphic-projections - are equal area map projections that maintain accurate relative sizes.
Over-cultivation - continuous ploughing a given farm land without fallowing or rotating crops.
Over-grazing - keeping too many cattle over a given grazing land.
Parallels - are lines drawn from east to west. They are lines of latitudes.
Parent Material - a material from which others are derived or obtained.
Period - third longest division of geological time, subdivided by epochs
Policy - A guide line document of rules and principles to achieve a defined goal.
Pollution - damage to the environment caused by waste levels that overload natural recycling systems or by synthetic materials that cannot be broken down by natural processes.
Grade 12 Geography 236
Glossary
Population density - the average number of people per square kilometer area.
Population distribution - the proportions of people in the world, countries, provinces, regions, cities, etc
Population policy - a policy designed to control and plan population growth based on the socio-economic and political conditions of a country.
Population pyramid - a graphic representation of the age and sex structure of a given population.
Positive checks - the catastrophes (such as poverty, famine, war, diseases, etc) proposed by Malthus as consequences and controls of fast population growth.
Poverty line - demarcated income level to show the degree of poverty (Example: US $ 2 per day is said to be a poverty line).
Poverty trap - A trap/circumstance that countries cannot break of out from an industrialization level. Simply, it is the inter-related social and economic factors that hinder progress.
Preventive checks - moral restraint such as late marriage, avoiding sexual conduct before marriage, etc proposed by Malthus as controls of fast population growth.
Primary data - New data obtained by undertaking field work. It involves/observation, measurement, questionnaires and interviews.
Qualitative - Related to non-measurable variables.
Quantiative - Related to a measurable variable.
Questionnaire - A sheet of questions for subjects (people) of the research work/survey to answer.
Range lands - pasture lands usually in areas of low annual rainfall.
Regression - Backward movement of sea/water bodies towards their original locations.
Relative location - The location of a place with reference to the surrounding landmasses or water bodies
Research - a scientific method of investigating answers for the problem identified.
Research method - A skill employed to collect, organize and analyze data/information.
Sample size - the proportion or percentage chosen for data collection.
Sampling - Studying a number of people or places or other things for data collection that is smaller than the total number, but which hopefully will give a good indication of the total picture.
Grade 12 Geography 237
Glossary
Sex ratio - the number of males per 100 females.
Sex structure - the pattern that results from the distribution of population according to sex.
Sketch maps - are simple free-hand drawings showing features with relative positions.
Spacing of birth - a family planning aspect having births separated by extended period of years.
Spatial distribution - Distribution over the surface of the earth.
Sustained development - A continuous/unwavering development trend that meets the needs of the present generation without compromising the ability of future generations to meet their own needs.
Thematic map - A distribution map that shows a single geographical element.
Theory - A verified hypothesis.
Topographic map - large-scale and detailed maps showing both human-made and natural features.
Total fertility rate - the average number of births a woman will have in her lifetime.
Transgression - The inland march/movement of the sea (Example: The transgression of the sea into the Horn during the Triassic and Jurassic Periods)
Truncated - shortened and divided.
Urbanization - the process whereby large number of people leave the countryside and small towns in order to settle in cities and surrounding metropolitan areas.
Vicinal location - Unlike geological location, it is a type of relative location that considers very nearby areas (i.e., neighboring countries).
Zenithal - perpendicular to the area or position under consideration.