
Gold Nanorods for Optimized Two-photon Luminescence Imaging of Cancerous Tissue
9
Gold Nanorods for Optimized Two-photon Luminescence Imaging of Cancerous Tissue Nicholas J. Durr a , Benjamin A. Holfeld b , Timothy Larson a , Danielle K. Smith c , Brian A. Korgel c , Konstantin Sokolova a,d , Adela Ben-Yakar *,a,e a Department of Biomedical Engineering; The University of Texas at Austin; Austin, TX 78712 b Department of Physics; The University of Texas at Austin; Austin, TX 78712 c Department of Chemical Engineering; Texas Materials Institute, Center for Nano- and Molecular Science and Technology; University of Texas at Austin; Austin TX 78712 d Department of Biomedical Engineering; The University of Texas M.D. Anderson Cancer Center; Houston, TX 77030 e Department of Mechanical Engineering; The University of Texas at Austin; Austin, TX 78712 ABSTRACT We demonstrate the use of gold nanorods as molecularly targeted contrast agents for two-photon luminescence (TPL) imaging of cancerous cells 150 µm deep inside a tissue phantom. We synthesized gold nanorods of 50 nm x 15 nm size with a longitudinal surface plasmon resonance of 760 nm. Gold nanorods were conjugated to antibodies against epidermal growth factor receptor (EGFR) and labeled to A431 human epithelial skin cancer cells in a collagen matrix tissue phantom. Using a 1.4 NA oil immersion objective lens, we found that excitation power needed for similar emission intensity in TPL imaging of labeled cells was up to 64 times less than that needed for two-photon autofluorescence (TPAF) imaging of unlabeled cells, which would correspond to a more than 4,000 times increase in emission intensity under equal excitation energy. However, the aberrations due to refractive index mismatch of the immersion oil and the sample limit imaging depth to 75 µm. Using a 0.95 NA water immersion objective lens, we observe robust two-photon emission signal from gold nanorods in the tissue phantoms from at depths of up to 150 µm. Furthermore, the increase in excitation energy required to maintain a constant emission signal intensity as imaging depth was increased was the same in both labeled and unlabeled phantom, suggesting that at the concentrations used, the addition of gold nanorods did not appreciably increase the bulk scattering coefficient of the sample. The remarkable TPL brightness of gold nanorods in comparison to TPAF signal makes them an attractive contrast agent for early detection of cutaneous melanoma. Keywords: Gold Nanorods, surface plasmon resonance, two-photon luminescence, two-photon microscopy, epithelial carcinoma, epidermal growth factor receptor 1. INTRODUCTION More than 85% of all cancers begin as precancerous lesions that are confined to the surface epithelium, which is typically several hundreds of microns thick. Early detection of these lesions can dramatically improve cutaneous melanoma mortality. 1 Two-photon imaging (TPI) is a powerful technique for the early diagnosis of epithelial cancers because it permits noninvasive imaging of subcellular features potentially hundreds of micrometers deep into tissue. 2-4 Because the signal to noise ratio of TPI decreases as imaging depth is increased, it is desirable for the imaging target to be as bright as possible. Unfortunately, endogenous fluorophores such as NADH typically have extremely low two- photon action cross sections, on the order of 10 -4 GM. 5 However, a recent study has demonstrated that both morphological and fluorescence quantification from TPI of endogenous fluorophores can be used to distinguish cancerous and precancerous from normal tissue down to 40 µm deep. 6 An alternative approach that can provide much brighter signal and a higher signal to noise ratio is to attach a bright fluorescent contrast agent to the molecular target of * [email protected]; phone 1 512 475-9280; fax 1 512 471-1045; www.me.utexas.edu/ben-yakar Plasmonics: Metallic Nanostructures and Their Optical Properties V, edited by Mark I. Stockman, Proc. of SPIE Vol. 6641, 66410O, (2007) · 0277-786X/07/$18 · doi: 10.1117/12.735296 Proc. of SPIE Vol. 6641 66410O-1
-
Upload
independent -
Category
Documents
-
view
1 -
download
0
Transcript of Gold Nanorods for Optimized Two-photon Luminescence Imaging of Cancerous Tissue
Gold Nanorods for Optimized Two-photon Luminescence Imaging of Cancerous Tissue
Nicholas J. Durra, Benjamin A. Holfeldb, Timothy Larsona, Danielle K. Smithc, Brian A. Korgelc,
Konstantin Sokolovaa,d, Adela Ben-Yakar*,a,e a Department of Biomedical Engineering; The University of Texas at Austin; Austin, TX 78712
b Department of Physics; The University of Texas at Austin; Austin, TX 78712 c Department of Chemical Engineering; Texas Materials Institute, Center for Nano- and Molecular
Science and Technology; University of Texas at Austin; Austin TX 78712 d Department of Biomedical Engineering; The University of Texas M.D. Anderson Cancer Center;
Houston, TX 77030 e Department of Mechanical Engineering; The University of Texas at Austin; Austin, TX 78712
ABSTRACT
We demonstrate the use of gold nanorods as molecularly targeted contrast agents for two-photon luminescence (TPL) imaging of cancerous cells 150 µm deep inside a tissue phantom. We synthesized gold nanorods of 50 nm x 15 nm size with a longitudinal surface plasmon resonance of 760 nm. Gold nanorods were conjugated to antibodies against epidermal growth factor receptor (EGFR) and labeled to A431 human epithelial skin cancer cells in a collagen matrix tissue phantom. Using a 1.4 NA oil immersion objective lens, we found that excitation power needed for similar emission intensity in TPL imaging of labeled cells was up to 64 times less than that needed for two-photon autofluorescence (TPAF) imaging of unlabeled cells, which would correspond to a more than 4,000 times increase in emission intensity under equal excitation energy. However, the aberrations due to refractive index mismatch of the immersion oil and the sample limit imaging depth to 75 µm. Using a 0.95 NA water immersion objective lens, we observe robust two-photon emission signal from gold nanorods in the tissue phantoms from at depths of up to 150 µm. Furthermore, the increase in excitation energy required to maintain a constant emission signal intensity as imaging depth was increased was the same in both labeled and unlabeled phantom, suggesting that at the concentrations used, the addition of gold nanorods did not appreciably increase the bulk scattering coefficient of the sample. The remarkable TPL brightness of gold nanorods in comparison to TPAF signal makes them an attractive contrast agent for early detection of cutaneous melanoma. Keywords: Gold Nanorods, surface plasmon resonance, two-photon luminescence, two-photon microscopy, epithelial carcinoma, epidermal growth factor receptor
1. INTRODUCTION More than 85% of all cancers begin as precancerous lesions that are confined to the surface epithelium, which is typically several hundreds of microns thick. Early detection of these lesions can dramatically improve cutaneous melanoma mortality.1 Two-photon imaging (TPI) is a powerful technique for the early diagnosis of epithelial cancers because it permits noninvasive imaging of subcellular features potentially hundreds of micrometers deep into tissue.2-4 Because the signal to noise ratio of TPI decreases as imaging depth is increased, it is desirable for the imaging target to be as bright as possible. Unfortunately, endogenous fluorophores such as NADH typically have extremely low two-photon action cross sections, on the order of 10-4 GM.5 However, a recent study has demonstrated that both morphological and fluorescence quantification from TPI of endogenous fluorophores can be used to distinguish cancerous and precancerous from normal tissue down to 40 µm deep.6 An alternative approach that can provide much brighter signal and a higher signal to noise ratio is to attach a bright fluorescent contrast agent to the molecular target of
* [email protected]; phone 1 512 475-9280; fax 1 512 471-1045; www.me.utexas.edu/ben-yakar
Plasmonics: Metallic Nanostructures and Their Optical Properties V, edited by Mark I. Stockman,Proc. of SPIE Vol. 6641, 66410O, (2007) · 0277-786X/07/$18 · doi: 10.1117/12.735296
Proc. of SPIE Vol. 6641 66410O-1
interest. This technique has the additional benefit of allowing TPI to monitor a variety of additional nonfluorescent biomolecular signatures that are more strongly indicative of cancer. The promise of this technique has prompted researchers to investigate the use of traditional and engineered organic fluorophores7 as well as new classes of luminescent contrast agents such as quantum dots8 and metallic nanoparticles.9-12 Though fluorescent semiconductor quantum dots offer much larger two-photon action cross sections than organic fluorophores (>10,000 GM compared to 1-300 GM for organic fluorophores),5 the most well-studied quantum dots have heavy metals that are cytotoxic, making them unsuitable for in vivo clinical applications. Gold nanoparticles, on the other hand, are relatively biocompatible13 and can have large two-photon action cross-sections (larger than 2,000 GM for gold nanorods).11 We have recently demonstrated that gold nanorods can be used for bright, molecularly-specific two-photon luminescence imaging of cancerous cells.14
Single-photon-induced luminescence was first reported from bulk copper and gold by Mooradian in 1969.15 Later, Boyd et al. found that roughened metal surfaces exhibited much higher single-photon-induced luminescence efficiency than smooth surfaces. They also found that two-photon-induced luminescence, which depends quadratically on excitation intensity, could be observed from roughened surfaces.16 The luminescence enhancement from roughened surfaces is likely a result of efficient resonant coupling of specific frequencies of light to surface plasmons. Two-photon luminescence (TPL) has been identified as a serial process involving sequential absorption of photons and emission from the recombination of electrons in the sp-band and holes in the d-band.17 This absorption process in TPL is different than two-photon excitation in fluorophores, which requires near-simultaneous absorption of two coherent photons.
Gold nanorods exhibit highly efficient single- and two-photon-induced luminescence,11, 18 which may be due to their ability to sustain resonating surface plasmons with minimal damping.18 Furthermore, their longitudinal plasmonic resonance can be tuned to the near-infrared wavelengths, where biological tissue exhibit relatively small extinction coefficients. The TPL emission spectra shows that much of the emission light is also in the NIR region.11 These optical properties make gold nanorods an attractive contrast agent for biomedical imaging of highly scattered tissue. With the use of near-field scanning microscopy and the ability to synthesize metallic particles in a variety of shapes, progress is being made in understanding the optical properties of gold nanorods.17, 19 We present TPL images of gold-nanorod-labeled cancer cells acquired up to 150 µm deep in a tissue phantom. By embedding cells in a collagen matrix, the performance of nanorods as contrast agents for deep-tissue imaging was explored. We found that TPL imaging of labeled cancer cells could be performed using less than 60 times the laser excitation power needed for two-photon autofluorescence (TPAF) imaging from unlabeled cancer cells, corresponding to a 3 orders-of-magnitude increase in emitted signal for equal excitation intensity.
2. METHODOLOGY 2.1 Imaging System
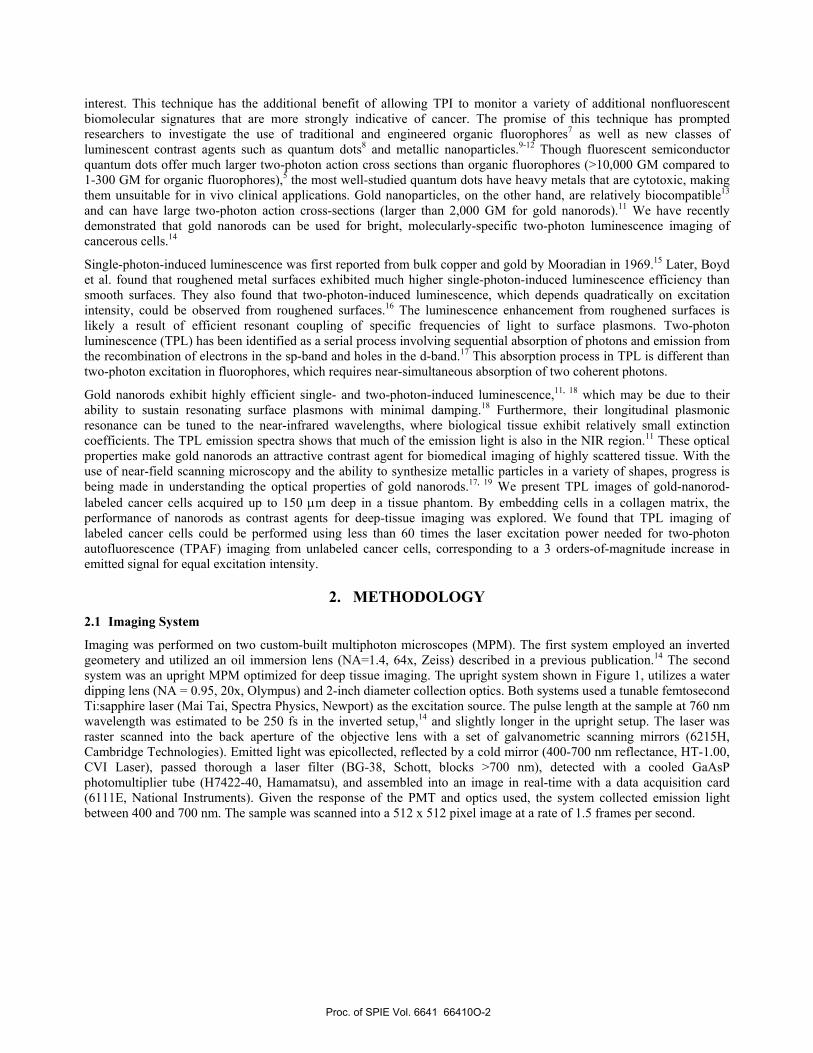
Imaging was performed on two custom-built multiphoton microscopes (MPM). The first system employed an inverted geometery and utilized an oil immersion lens (NA=1.4, 64x, Zeiss) described in a previous publication.14 The second system was an upright MPM optimized for deep tissue imaging. The upright system shown in Figure 1, utilizes a water dipping lens (NA = 0.95, 20x, Olympus) and 2-inch diameter collection optics. Both systems used a tunable femtosecond Ti:sapphire laser (Mai Tai, Spectra Physics, Newport) as the excitation source. The pulse length at the sample at 760 nm wavelength was estimated to be 250 fs in the inverted setup,14 and slightly longer in the upright setup. The laser was raster scanned into the back aperture of the objective lens with a set of galvanometric scanning mirrors (6215H, Cambridge Technologies). Emitted light was epicollected, reflected by a cold mirror (400-700 nm reflectance, HT-1.00, CVI Laser), passed thorough a laser filter (BG-38, Schott, blocks >700 nm), detected with a cooled GaAsP photomultiplier tube (H7422-40, Hamamatsu), and assembled into an image in real-time with a data acquisition card (6111E, National Instruments). Given the response of the PMT and optics used, the system collected emission light between 400 and 700 nm. The sample was scanned into a 512 x 512 pixel image at a rate of 1.5 frames per second.
Proc. of SPIE Vol. 6641 66410O-2
absorb diffuse light _________(oerouter for
Figure 1: (a) Schematic and (b) photograph of custom-built upright MPM system. Optimizations for deep imaging include use of a water dipping lens and 2-inch diameter collection optics.
2.2 Nanorod Synthesis
Gold nanorods were synthesized using a seed-mediated, surfactant-assisted growth method in a two-step procedure.20-22 Colloidal gold seeds (1.5 nm diameter) were first prepared by mixing aqueous solutions of hexadecylcetyltrimethylammonium bromide (CTAB, 0.1 M, 9.75 mL) and hydrogen tetrachloroaurate(III) hydrate (0.01 M, 250 µL). (Note: For nanorods to form, we found it necessary to use low-purity CTAB from Fluka (96% purity), as nanorods did not form when high-purity CTAB (>99% purity) was used.)14 An aqueous solution of sodium borohydride (0.01 M, 600 µL) was then added.23, 24 The colloidal gold seeds were then injected into an aqueous “growth solution” of CTAB (0.1 M, 9.5 mL), silver nitrate (0.01 M, varying amounts of silver between 20 and 120 µL depending on desired nanorod aspect ratio), hydrogen tetrachloroaurate(III) hydrate (0.01 M, 500 µL), and ascorbic acid (0.1 M, 55 µL). Nanorods were purified by several cycles of suspending them in ultrapure water, followed by centrifugation. The
a)
b)
Proc. of SPIE Vol. 6641 66410O-3
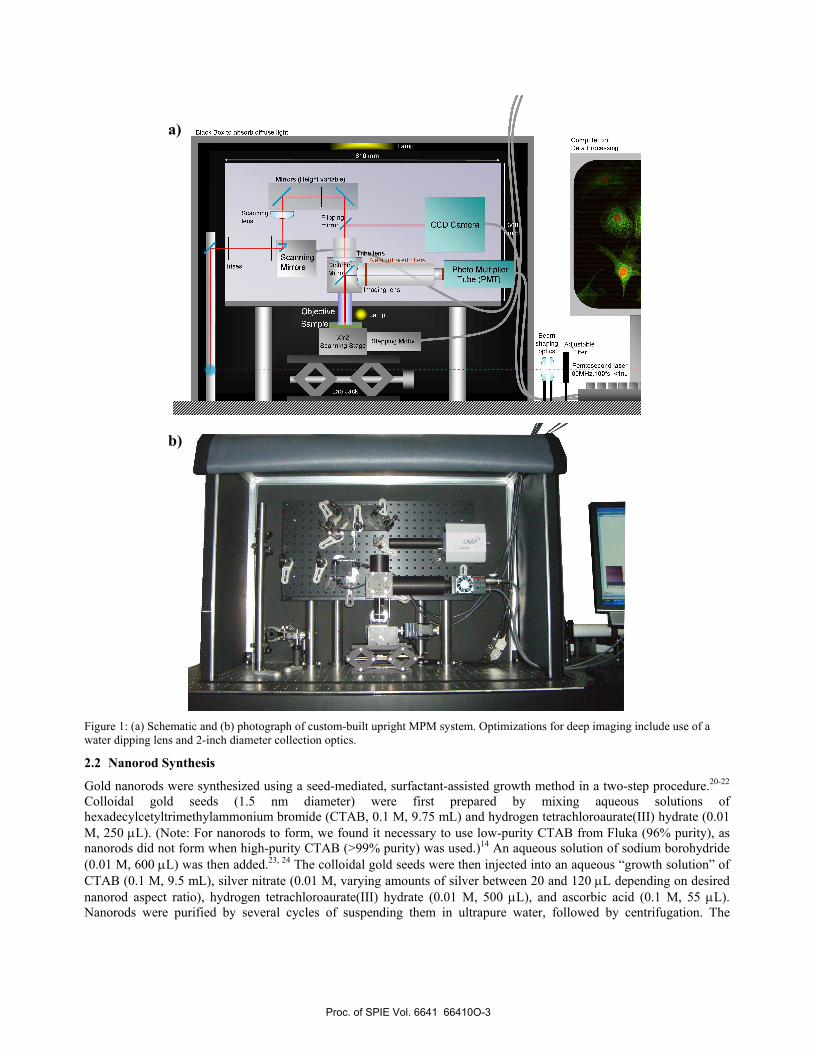
nanorods were isolated in the precipitate, and excess CTAB was removed in the supernatant. Figure 2a shows a transmission electron microscopy (TEM) image of synthesized gold nanorods that have an average aspect ratio of 3.4 +/- 0.6. Figure 2b shows that the longitudinal plasmon mode of these nanorods is centered at 754 nm.
Figure 2. Properties of the gold nanorods used as contrast agents. (a) TEM image of gold nanorods indicates an average length and width of 48.1 ( 5.5 nm and 14.3 ( 2.2 nm, respectively. (b) Gold nanorod absorbance in aqueous solution. (c) Emission intensity dependence of gold nanorods on excitation power at 760 nm.14
2.3 Labeling of Cancer Cells
To functionalize the gold nanorods, the positive surface potential was converted to a negative surface potential by coating the CTAB with polystyrene sulfonate (PSS).25 PSS (MW 14 kD, 10 mg/mL in 1 mM NaCl solution) was added to the nanorod suspension in a 1:10 volume ratio and allowed to react for 30 min. The particles were then collected via centrifugation at 2000g for 30 min, resuspended in NaCl (1 mM), and reacted with another aliquot of PSS solution. Following the second PSS incubation, the particles were washed twice in water and then resuspended in HEPES (40 mM, pH 7.4) for compatibility with the antibody solution. Anti-EGFR antibody (clone 29.1, Sigma) was purified using Centricon 100 kD MWCO filters, then resuspended in HEPES (40 mM, pH 7.4, 200 µg/mL). For the control, a nonspecific antibody was used in place of the anti-EGFR antibody (clone MOPC 21, Sigma). Antibody solution and nanorods were mixed at 1:1 volume ratio and allowed to interact for 45 min. PEG (MW 15 kD, 10 mg/mL in 1x PBS) was then added for stability, and the particles were centrifuged to remove unbound antibodies.
Three-dimensional tissue phantoms were prepared using EGFR-overexpressing A431 skin cancer cells. The cells were purchased from the American Type Culture Collection and cultured in DMEM supplemented with 5% FBS. Cells were harvested via trypsinization and resuspended in 1x PBS at a concentration of 6 x 10⁶ cells/mL as determined with a hemacytometer. The cell suspension was mixed with either EGFR-targeted or nonspecifically targeted nanorods in a 1:1 volume ratio and allowed to interact for 45 min. The cells were then spun down at 200g for 5 min to remove unbound particles, and the cells were resuspended in a buffered collagen solution at a concentration of 7.5 x 10⁷ cells/mL. The collagen/cell mix was pipetted into a 120 µm spacer (Molecular Probes) and sealed with a coverslip for imaging.
3. RESULTS 3.1 TPL imaging using inverted setup with oil immersion objective lens
Two-photon-induced luminescence from the gold nanorods was verified by measuring the dependence of the emission intensity on the excitation power in the inverted setup. Gold nanorods were sparsely deposited on a glass coverslip, and
Proc. of SPIE Vol. 6641 66410O-4
single emission spots were examined. A quadratic dependence of 2.05 +/- 0.06 on the incident power was observed for increasing excitation powers from 30 to 90 µW, indicating that the excitation is a two-photon process (Figure 2c). The TPL signal also exhibited cosine4 dependence on excitation polarization, which has been observed in other reports.11 When a droplet of PBS was placed on the nanorod-coated coverslip, emission from nanorods that maintained their attachment to the coverslip was unchanged in both magnitude and the quadratic dependence of emission intensity. The point spread function (PSF) of the upright imaging setup was obtained by recording the intensities of small spots that exhibited strong polarization sensitivity. From the full width at half-maximum of the PSF, the radial and axial resolutions were 320 and 625 nm, respectively. A similar resolution was also measured from the PSF of 100 nm diameter fluorescent beads.
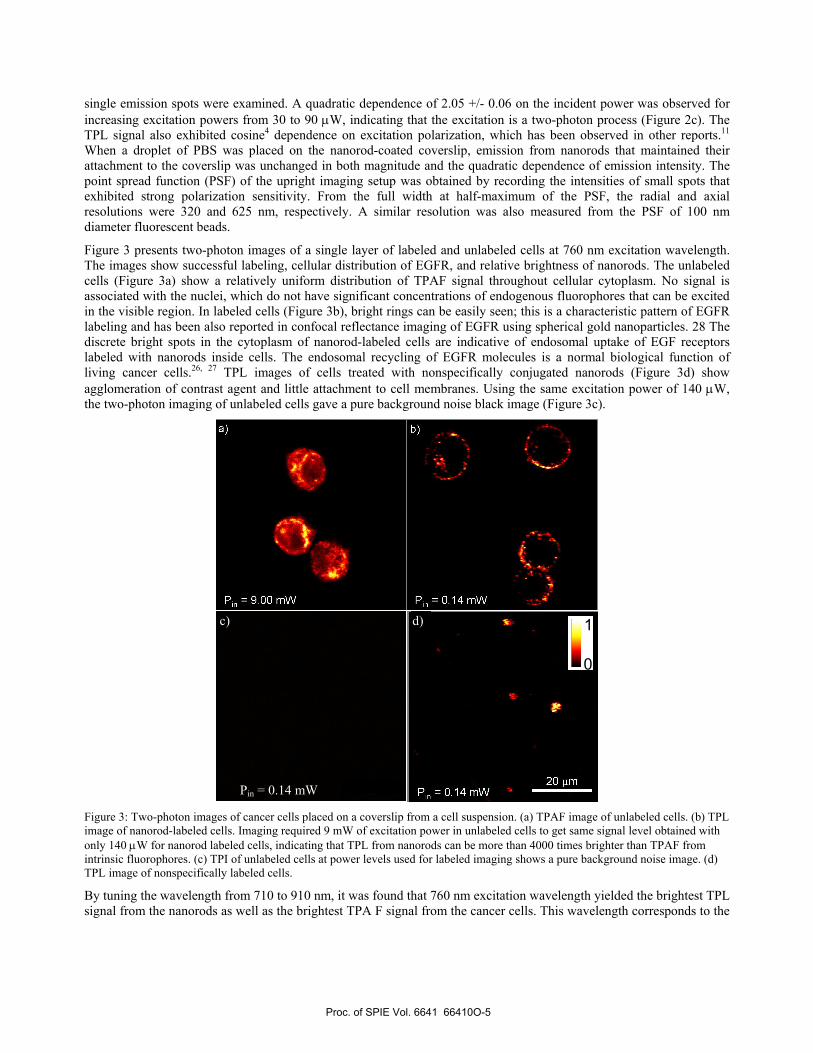
Figure 3 presents two-photon images of a single layer of labeled and unlabeled cells at 760 nm excitation wavelength. The images show successful labeling, cellular distribution of EGFR, and relative brightness of nanorods. The unlabeled cells (Figure 3a) show a relatively uniform distribution of TPAF signal throughout cellular cytoplasm. No signal is associated with the nuclei, which do not have significant concentrations of endogenous fluorophores that can be excited in the visible region. In labeled cells (Figure 3b), bright rings can be easily seen; this is a characteristic pattern of EGFR labeling and has been also reported in confocal reflectance imaging of EGFR using spherical gold nanoparticles. 28 The discrete bright spots in the cytoplasm of nanorod-labeled cells are indicative of endosomal uptake of EGF receptors labeled with nanorods inside cells. The endosomal recycling of EGFR molecules is a normal biological function of living cancer cells.26, 27 TPL images of cells treated with nonspecifically conjugated nanorods (Figure 3d) show agglomeration of contrast agent and little attachment to cell membranes. Using the same excitation power of 140 µW, the two-photon imaging of unlabeled cells gave a pure background noise black image (Figure 3c).
Figure 3: Two-photon images of cancer cells placed on a coverslip from a cell suspension. (a) TPAF image of unlabeled cells. (b) TPL image of nanorod-labeled cells. Imaging required 9 mW of excitation power in unlabeled cells to get same signal level obtained with only 140 µW for nanorod labeled cells, indicating that TPL from nanorods can be more than 4000 times brighter than TPAF from intrinsic fluorophores. (c) TPI of unlabeled cells at power levels used for labeled imaging shows a pure background noise image. (d) TPL image of nonspecifically labeled cells.
By tuning the wavelength from 710 to 910 nm, it was found that 760 nm excitation wavelength yielded the brightest TPL signal from the nanorods as well as the brightest TPA F signal from the cancer cells. This wavelength corresponds to the
c) d)
Pin = 0.14 mW
1
0
Proc. of SPIE Vol. 6641 66410O-5
longitudinal plasmon resonance frequency of the nanorods. For the cancer cells, this finding is consistent with other reports that show that the biological molecules that are primarily responsible for the signal in TPAF imaging (NADH and flavins) have two-photon cross-sections that increase with decreasing excitation wavelength from 1000 to 750 nm, and level off around 750 nm.4 The similarity of the optimal excitation wavelengths for both the gold nanorods and cellular autofluorescence allows a comparison of the two imaging modalities under identical excitation conditions. We found that TPL imaging of nanorod-labeled cells required 64 times less power than TPAF imaging of unlabeled cells in order to achieve the similar collected intensity. Given the quadratic dependence of emission intensity on the incident power, this observation implies that, for equal excitation powers, TPL imaging of nanorod-labeled cancer cells can generate more than 4000 times larger emission signal than TPAF imaging of unlabeled cells.
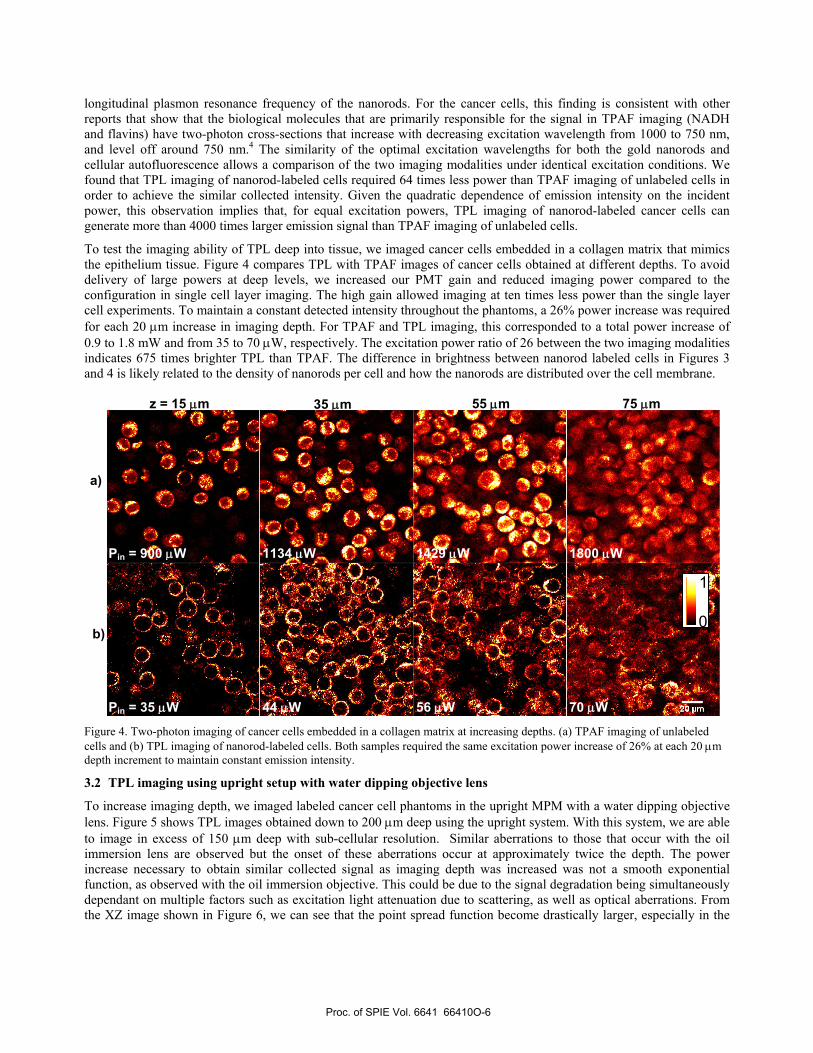
To test the imaging ability of TPL deep into tissue, we imaged cancer cells embedded in a collagen matrix that mimics the epithelium tissue. Figure 4 compares TPL with TPAF images of cancer cells obtained at different depths. To avoid delivery of large powers at deep levels, we increased our PMT gain and reduced imaging power compared to the configuration in single cell layer imaging. The high gain allowed imaging at ten times less power than the single layer cell experiments. To maintain a constant detected intensity throughout the phantoms, a 26% power increase was required for each 20 µm increase in imaging depth. For TPAF and TPL imaging, this corresponded to a total power increase of 0.9 to 1.8 mW and from 35 to 70 µW, respectively. The excitation power ratio of 26 between the two imaging modalities indicates 675 times brighter TPL than TPAF. The difference in brightness between nanorod labeled cells in Figures 3 and 4 is likely related to the density of nanorods per cell and how the nanorods are distributed over the cell membrane.
Figure 4. Two-photon imaging of cancer cells embedded in a collagen matrix at increasing depths. (a) TPAF imaging of unlabeled cells and (b) TPL imaging of nanorod-labeled cells. Both samples required the same excitation power increase of 26% at each 20 µm depth increment to maintain constant emission intensity.
3.2 TPL imaging using upright setup with water dipping objective lens
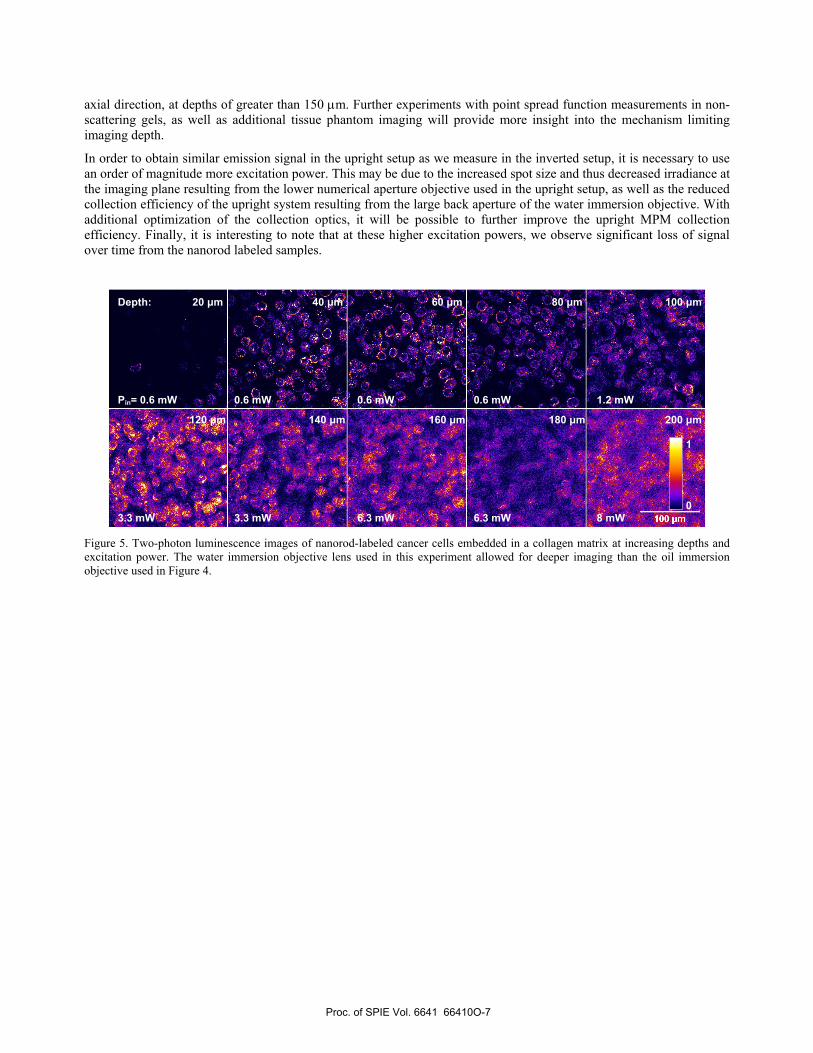
To increase imaging depth, we imaged labeled cancer cell phantoms in the upright MPM with a water dipping objective lens. Figure 5 shows TPL images obtained down to 200 µm deep using the upright system. With this system, we are able to image in excess of 150 µm deep with sub-cellular resolution. Similar aberrations to those that occur with the oil immersion lens are observed but the onset of these aberrations occur at approximately twice the depth. The power increase necessary to obtain similar collected signal as imaging depth was increased was not a smooth exponential function, as observed with the oil immersion objective. This could be due to the signal degradation being simultaneously dependant on multiple factors such as excitation light attenuation due to scattering, as well as optical aberrations. From the XZ image shown in Figure 6, we can see that the point spread function become drastically larger, especially in the
Pin = 900 µW 1134 µW 1429 µW 1800 µW
70 µW 56 µW44 µW Pin = 35 µW
z = 15 µm 35 µm 55 µm 75 µm
a)
b)
1
0
Proc. of SPIE Vol. 6641 66410O-6
axial direction, at depths of greater than 150 µm. Further experiments with point spread function measurements in non-scattering gels, as well as additional tissue phantom imaging will provide more insight into the mechanism limiting imaging depth.
In order to obtain similar emission signal in the upright setup as we measure in the inverted setup, it is necessary to use an order of magnitude more excitation power. This may be due to the increased spot size and thus decreased irradiance at the imaging plane resulting from the lower numerical aperture objective used in the upright setup, as well as the reduced collection efficiency of the upright system resulting from the large back aperture of the water immersion objective. With additional optimization of the collection optics, it will be possible to further improve the upright MPM collection efficiency. Finally, it is interesting to note that at these higher excitation powers, we observe significant loss of signal over time from the nanorod labeled samples.
Figure 5. Two-photon luminescence images of nanorod-labeled cancer cells embedded in a collagen matrix at increasing depths and excitation power. The water immersion objective lens used in this experiment allowed for deeper imaging than the oil immersion objective used in Figure 4.
Depth: 20 µm 40 µm 60 µm 80 µm 100 µm Pin= 0.6 mW 0.6 mW 0.6 mW 0.6 mW 1.2 mW 120 µm 140 µm 160 µm 180 µm 200 µm 1 0 3.3 mW 3.3 mW 6.3 mW 6.3 mW 8 mW
Proc. of SPIE Vol. 6641 66410O-7
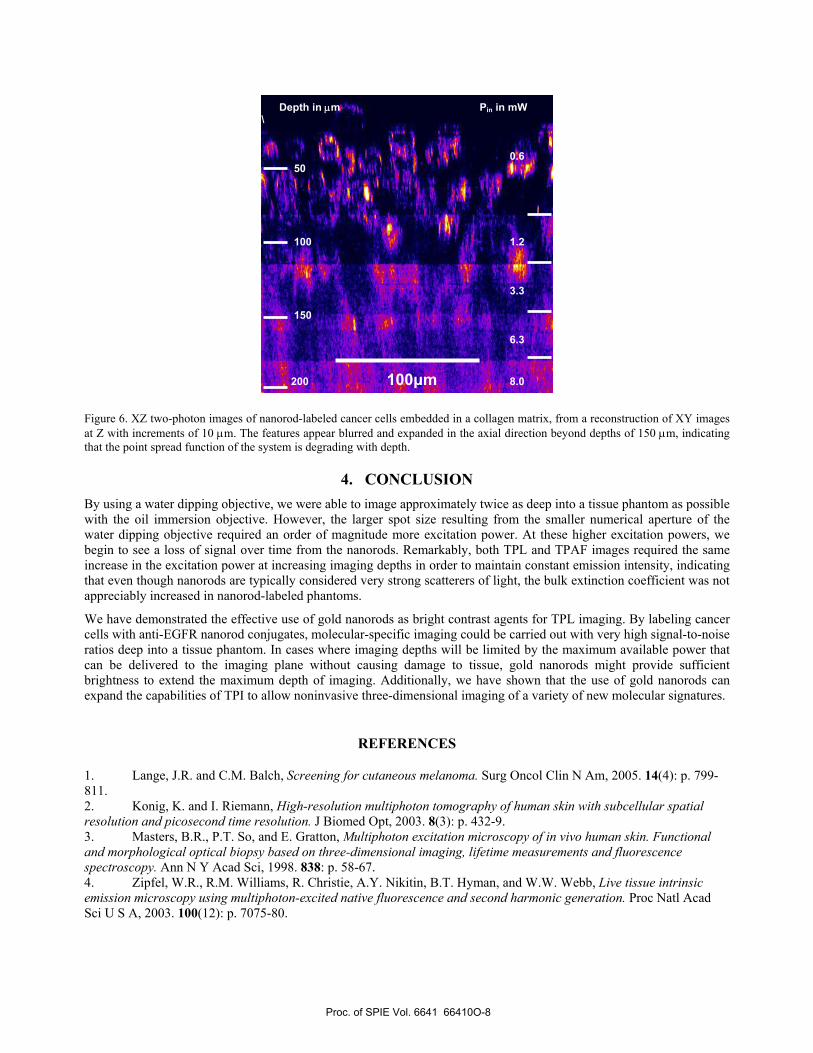
Figure 6. XZ two-photon images of nanorod-labeled cancer cells embedded in a collagen matrix, from a reconstruction of XY images at Z with increments of 10 µm. The features appear blurred and expanded in the axial direction beyond depths of 150 µm, indicating that the point spread function of the system is degrading with depth.
4. CONCLUSION By using a water dipping objective, we were able to image approximately twice as deep into a tissue phantom as possible with the oil immersion objective. However, the larger spot size resulting from the smaller numerical aperture of the water dipping objective required an order of magnitude more excitation power. At these higher excitation powers, we begin to see a loss of signal over time from the nanorods. Remarkably, both TPL and TPAF images required the same increase in the excitation power at increasing imaging depths in order to maintain constant emission intensity, indicating that even though nanorods are typically considered very strong scatterers of light, the bulk extinction coefficient was not appreciably increased in nanorod-labeled phantoms.
We have demonstrated the effective use of gold nanorods as bright contrast agents for TPL imaging. By labeling cancer cells with anti-EGFR nanorod conjugates, molecular-specific imaging could be carried out with very high signal-to-noise ratios deep into a tissue phantom. In cases where imaging depths will be limited by the maximum available power that can be delivered to the imaging plane without causing damage to tissue, gold nanorods might provide sufficient brightness to extend the maximum depth of imaging. Additionally, we have shown that the use of gold nanorods can expand the capabilities of TPI to allow noninvasive three-dimensional imaging of a variety of new molecular signatures.
REFERENCES
1. Lange, J.R. and C.M. Balch, Screening for cutaneous melanoma. Surg Oncol Clin N Am, 2005. 14(4): p. 799-811. 2. Konig, K. and I. Riemann, High-resolution multiphoton tomography of human skin with subcellular spatial resolution and picosecond time resolution. J Biomed Opt, 2003. 8(3): p. 432-9. 3. Masters, B.R., P.T. So, and E. Gratton, Multiphoton excitation microscopy of in vivo human skin. Functional and morphological optical biopsy based on three-dimensional imaging, lifetime measurements and fluorescence spectroscopy. Ann N Y Acad Sci, 1998. 838: p. 58-67. 4. Zipfel, W.R., R.M. Williams, R. Christie, A.Y. Nikitin, B.T. Hyman, and W.W. Webb, Live tissue intrinsic emission microscopy using multiphoton-excited native fluorescence and second harmonic generation. Proc Natl Acad Sci U S A, 2003. 100(12): p. 7075-80.
Depth in µm Pin in mW \ 0.6 50 100 1.2 3.3 150 6.3 200 100µm 8.0
Proc. of SPIE Vol. 6641 66410O-8
5. Zipfel, W.R., R.M. Williams, and W.W. Webb, Nonlinear magic: multiphoton microscopy in the biosciences. Nat Biotechnol, 2003. 21(11): p. 1369-77. 6. Skala, M.C., J.M. Squirrell, K.M. Vrotsos, J.C. Eickhoff, A. Gendron-Fitzpatrick, K.W. Eliceiri, and N. Ramanujam, Multiphoton microscopy of endogenous fluorescence differentiates normal, precancerous, and cancerous squamous epithelial tissues. Cancer Res, 2005. 65(4): p. 1180-6. 7. Albota, M., D. Beljonne, J.L. Bredas, J.E. Ehrlich, J.Y. Fu, A.A. Heikal, S.E. Hess, T. Kogej, M.D. Levin, S.R. Marder, D. McCord-Maughon, J.W. Perry, H. Rockel, M. Rumi, G. Subramaniam, W.W. Webb, X.L. Wu, and C. Xu, Design of organic molecules with large two-photon absorption cross sections. Science, 1998. 281(5383): p. 1653-6. 8. Larson, D.R., W.R. Zipfel, R.M. Williams, S.W. Clark, M.P. Bruchez, F.W. Wise, and W.W. Webb, Water-soluble quantum dots for multiphoton fluorescence imaging in vivo. Science, 2003. 300(5624): p. 1434-6. 9. Farrer, R.A., F.L. Butterfield, V.W. Chen, and J.T. Fourkas, Highly efficient multiphoton-absorption-induced luminescence from gold nanoparticles. Nano Lett, 2005. 5(6): p. 1139-42. 10. Sonnichsen, C. and A.P. Alivisatos, Gold nanorods as novel nonbleaching plasmon-based orientation sensors for polarized single-particle microscopy. Nano Lett, 2005. 5(2): p. 301-4. 11. Wang, H., T.B. Huff, D.A. Zweifel, W. He, P.S. Low, A. Wei, and J.X. Cheng, In vitro and in vivo two-photon luminescence imaging of single gold nanorods. Proc Natl Acad Sci U S A, 2005. 102(44): p. 15752-6. 12. Yelin, D., D. Oron, S. Thiberge, E. Moses, and Y. Silberberg, Multiphoton plasmon-resonance microscopy. Optics Express, 2003. 11(12): p. 1385-1391. 13. Abrams, M.J. and B.A. Murrer, Metal-Compounds in Therapy and Diagnosis. Science, 1993. 261(5122): p. 725-730. 14. Durr, N.J., T. Larson, D.K. Smith, B.A. Korgel, K. Sokolov, and A. Ben-Yakar, Two-photon luminescence imaging of cancer cells using molecularly targeted gold nanorods. Nano Lett, 2007. 7(4): p. 941-5. 15. Mooradian, A., Photoluminescence of Metals. Phys Rev Lett, 1969. 22: p. 185-187. 16. Boyd, G.T., Z.H. Yu, and Y.R. Shen, Photoinduced luminescence from the noble metals and its enhancement on roughened surfaces. Physical Review B. Condensed Matter, 1986. 33(12): p. 7923-7936. 17. Imura, K., T. Nagahara, and H. Okamoto, Near-field two-photon-induced photoluminescence from single gold nanorods and imaging of plasmon modes. Journal of Physical Chemistry B, 2005. 109(27): p. 13214-13220. 18. Mohamed, M.B., V. Volkov, S. Link, and M.A. El-Sayed, The 'lightning' gold nanorods: fluorescence enhancement of over a million compared to the gold metal. Chemical Physics Letters, 2000. 317(6): p. 517-523. 19. Bouhelier, A., M.R. Beversluis, and L. Novotny, Characterization of nanoplasmonic structures by locally excited photoluminescence. Applied Physics Letters, 2003. 83(24): p. 5041-5043. 20. Gou, L.F. and C.J. Murphy, Fine-tuning the shape of gold nanorods. Chemistry of Materials, 2005. 17(14): p. 3668-3672. 21. Jana, N.R., L. Gearheart, and C.J. Murphy, Wet chemical synthesis of high aspect ratio cylindrical gold nanorods. Journal of Physical Chemistry B, 2001. 105(19): p. 4065-4067. 22. Nikoobakht, B. and M.A. El-Sayed, Preparation and growth mechanism of gold nanorods (NRs) using seed-mediated growth method. Chemistry of Materials, 2003. 15(10): p. 1957-1962. 23. Liu, M.Z. and P. Guyot-Sionnest, Mechanism of silver(I)-assisted growth of gold nanorods and bipyramids. Journal of Physical Chemistry B, 2005. 109(47): p. 22192-22200. 24. Murphy, C.J., T.K. San, A.M. Gole, C.J. Orendorff, J.X. Gao, L. Gou, S.E. Hunyadi, and T. Li, Anisotropic metal nanoparticles: Synthesis, assembly, and optical applications. Journal of Physical Chemistry B, 2005. 109(29): p. 13857-13870. 25. El-Sayed, I.H., X. Huang, and M.A. El-Sayed, Surface plasmon resonance scattering and absorption of anti-EGFR antibody conjugated gold nanoparticles in cancer diagnostics: applications in oral cancer. Nano Lett, 2005. 5(5): p. 829-34. 26. Barnes, C.J.K., Rakesh, Biology of the epidermal growth factor receptor family. Vol. 119. 2004: Springer US. 27. Schlessinger, J., Cell signaling by receptor tyrosine kinases. Cell, 2000. 103(2): p. 211-225.
Proc. of SPIE Vol. 6641 66410O-9