Determination of Optical Coefficients and Fractal Dimensional Parameters of Cancerous and Normal...
7
spectroscopic techniques Determination of Optical Coefficients and Fractal Dimensional Parameters of Cancerous and Normal Prostate Tissues Yang Pu, a Wubao Wang, a Mohammad AL-Rubaiee, b Swapan Kumar Gayen, b Min Xu c, * a Institute for Ultrafast Spectroscopy and Lasers, Department of Physics, The City College of the City University of New York, 160 Convent Avenue, New York, NY 10031 USA b Department of Physics, The City College and the Graduate Center of the City University of New York, 160 Convent Avenue, New York, NY 10031 USA c Department of Physics, Fairfield University, Fairfield, CT 06824 USA Optical extinction and diffuse reflection spectra of cancerous and normal prostate tissues in the 750 to 860 nm spectral range were measured. Optical extinction measurements using thin ex vivo prostate tissue samples were used to determine the scattering coefficient (l s ), while diffuse reflection measurements using thick prostate tissue samples were used to extract the absorption coefficient (l a ) and the reduced scattering coefficient (l 0 s ). The anisotropy factor (g) was obtained using the extracted values of l s and l 0 s . The values of fractal dimension (D f ) of cancerous and normal prostate tissues were obtained by fitting to the wavelength dependence of l 0 s . The number of scattering particles contributing to l s as a function of particle size and the cutoff diameter d max as a function of g were investigated using the fractal soft tissue model and Mie theory. Results show that d max of the normal tissue is larger than that of the cancerous tissue. The cutoff diameter d max is observed to agree with the nuclear size for the normal tissues and the nucleolar size for the cancerous tissues. Transmission spectral polarization imaging measurements were performed that could distinguish the cancerous prostate tissue samples from the normal tissue samples based on the differences between their absorption and scattering parameters. Index Headings: Prostate tissue; Prostate cancer detection; Biomedical imaging; Absorption coefficient; Scattering coefficient; Reduced scatter- ing coefficient; Anisotropy factor; Near-infrared imaging; NIR spectros- copy; Diffusion; Mie theory; Fractal tissue model; Transmission imaging. INTRODUCTION Prostate cancer is the most common visceral malignancy in American men. Hence, there exists a need for development of affordable, noninvasive modalities for early detection and diagnosis of prostate tumors. Near-infrared (NIR) optical imaging and spectroscopy offer the potential for noninvasive detection and diagnosis based on differences in pathological architecture and optical characteristics between cancerous and normal prostate tissues. The disruption of the normal architecture of tissue that accompanies cancer and its progression may be modeled by fractal geometry. 1 A combination of optical spectroscopic investigations and fractal geometric analysis presents an intriguing possibility for development of a useful modality for prostate cancer detection and diagnosis. Variations in extracellular 2 and nuclear 3 structures and chromophore compositions cause differences in optical scat- tering and absorption properties of cancerous and normal prostate tissues, which in turn provide optical contrast, and may serve as native markers for prostate cancer detection. A survey of the literature suggests that the change of water content within living cells might be the primary factor in carcinogen- esis. 4–6 Tissues with high water content will usually be hypo- dense in relation to normal tissue. 5 The dominant chromophore in biological tissue, which absorbs light in the infrared range, is water. 4,5 A systematic investigation of the absorption coefficient (l a ), the scattering coefficient (l s ), the reduced scattering coefficient (l 0 s ), and the anisotropy factor (g) of tissue is necessary for accurate modeling of light transport in tissues. 7 The differences in the values of l a , l s , l 0 s , and g between normal and cancerous tissues may provide a basis for biomedical imaging and potential diagnostics using optical techniques. 7,8 Several authors have suggested fractal analysis as a useful tool in the study of cancer. 9–14 Baish and Jain elucidated the role of fractal geometry in describing the pathological architecture of tumors and its potential for providing insight into tumor growth mechanism. 9 Bizzarri et al. emphasized that the appropriate level of observation for the study of carcinogenesis is tissue and suggested that fractal measures may provide reliable information about the system complex- ity. 10 The fractal approach was used to model soft tissues and, along with the Mie scattering theory, provided the basis for numerical evaluation of the phase functions, the optical scattering coefficient, the reduced scattering coefficient, the backscattering coefficient, and the anisotropy factor. 11–14 However, there is a paucity of systematic and detailed investigations exploring the correlation between optical properties and fractal characteristics of normal and cancerous tissues involving different types of cancers and cancers in different stages of progression. Received 13 September 2011; accepted 22 March 2012. * Author to whom correspondence should be sent. E-mail: mxu@mail. fairfield.edu. DOI: 10.1366/11-06471 828 Volume 66, Number 7, 2012 APPLIED SPECTROSCOPY 0003-7028/12/6607-0828$2.00/0 Ó 2012 Society for Applied Spectroscopy
Transcript of Determination of Optical Coefficients and Fractal Dimensional Parameters of Cancerous and Normal...
spectroscopic techniques
Determination of Optical Coefficients and Fractal DimensionalParameters of Cancerous and Normal Prostate Tissues
Yang Pu,a Wubao Wang,a Mohammad AL-Rubaiee,b Swapan Kumar Gayen,b Min Xuc,*a Institute for Ultrafast Spectroscopy and Lasers, Department of Physics, The City College of the City University of New York, 160 Convent
Avenue, New York, NY 10031 USAb Department of Physics, The City College and the Graduate Center of the City University of New York, 160 Convent Avenue, New York, NY10031 USAc Department of Physics, Fairfield University, Fairfield, CT 06824 USA
Optical extinction and diffuse reflection spectra of cancerous and normal
prostate tissues in the 750 to 860 nm spectral range were measured.
Optical extinction measurements using thin ex vivo prostate tissue samples
were used to determine the scattering coefficient (ls), while diffuse
reflection measurements using thick prostate tissue samples were used to
extract the absorption coefficient (la) and the reduced scattering
coefficient (l0s). The anisotropy factor (g) was obtained using the extracted
values of ls and l0s. The values of fractal dimension (Df) of cancerous and
normal prostate tissues were obtained by fitting to the wavelength
dependence of l0s. The number of scattering particles contributing to ls as
a function of particle size and the cutoff diameter dmax as a function of g
were investigated using the fractal soft tissue model and Mie theory.
Results show that dmax of the normal tissue is larger than that of the
cancerous tissue. The cutoff diameter dmax is observed to agree with the
nuclear size for the normal tissues and the nucleolar size for the cancerous
tissues. Transmission spectral polarization imaging measurements were
performed that could distinguish the cancerous prostate tissue samples
from the normal tissue samples based on the differences between their
absorption and scattering parameters.
Index Headings: Prostate tissue; Prostate cancer detection; Biomedical
imaging; Absorption coefficient; Scattering coefficient; Reduced scatter-
ing coefficient; Anisotropy factor; Near-infrared imaging; NIR spectros-
copy; Diffusion; Mie theory; Fractal tissue model; Transmission imaging.
INTRODUCTION
Prostate cancer is the most common visceral malignancy inAmerican men. Hence, there exists a need for development ofaffordable, noninvasive modalities for early detection anddiagnosis of prostate tumors. Near-infrared (NIR) opticalimaging and spectroscopy offer the potential for noninvasivedetection and diagnosis based on differences in pathologicalarchitecture and optical characteristics between cancerous andnormal prostate tissues. The disruption of the normalarchitecture of tissue that accompanies cancer and itsprogression may be modeled by fractal geometry.1 A
combination of optical spectroscopic investigations and fractalgeometric analysis presents an intriguing possibility fordevelopment of a useful modality for prostate cancer detectionand diagnosis.
Variations in extracellular2 and nuclear3 structures andchromophore compositions cause differences in optical scat-tering and absorption properties of cancerous and normalprostate tissues, which in turn provide optical contrast, and mayserve as native markers for prostate cancer detection. A surveyof the literature suggests that the change of water contentwithin living cells might be the primary factor in carcinogen-esis.4–6 Tissues with high water content will usually be hypo-dense in relation to normal tissue.5 The dominant chromophorein biological tissue, which absorbs light in the infrared range, iswater.4,5
A systematic investigation of the absorption coefficient (la),the scattering coefficient (ls), the reduced scattering coefficient(l0
s), and the anisotropy factor (g) of tissue is necessary foraccurate modeling of light transport in tissues.7 The differencesin the values of la, ls, l0
s, and g between normal and canceroustissues may provide a basis for biomedical imaging andpotential diagnostics using optical techniques.7,8
Several authors have suggested fractal analysis as a usefultool in the study of cancer.9–14 Baish and Jain elucidated therole of fractal geometry in describing the pathologicalarchitecture of tumors and its potential for providing insightinto tumor growth mechanism.9 Bizzarri et al. emphasized thatthe appropriate level of observation for the study ofcarcinogenesis is tissue and suggested that fractal measuresmay provide reliable information about the system complex-ity.10 The fractal approach was used to model soft tissues and,along with the Mie scattering theory, provided the basis fornumerical evaluation of the phase functions, the opticalscattering coefficient, the reduced scattering coefficient, thebackscattering coefficient, and the anisotropy factor.11–14
However, there is a paucity of systematic and detailedinvestigations exploring the correlation between opticalproperties and fractal characteristics of normal and canceroustissues involving different types of cancers and cancers indifferent stages of progression.
Received 13 September 2011; accepted 22 March 2012.* Author to whom correspondence should be sent. E-mail: [email protected]: 10.1366/11-06471
828 Volume 66, Number 7, 2012 APPLIED SPECTROSCOPY0003-7028/12/6607-0828$2.00/0
� 2012 Society for Applied Spectroscopy

In this paper, we report on the initial results of a study ofoptical properties and fractal parameters of ex vivo normal andcancerous prostate tissues and how these parameters varybetween these two types of tissues. We obtained la, ls, l0
s, andg of cancerous and normal prostate tissues in the 750–860 nmspectral range using extinction measurements on thin samplesand diffuse reflection measurements on thick samples. Lightextinction by a thin specimen (thickness ,, mean scatteringlength, ls) within the spectral range investigated here isdominated by light scattering. Therefore, measurements onthin tissue may approximate ls in tissue and present a goodstarting estimation. Light transport through a thick tissue sliceis usually modeled as a diffusion process, and diffusereflectance measurements provide information for assessmentof la, and l0
s = ls(1 – g), where g is the anisotropy factor.7,8,15
EXPERIMENTAL METHODS AND SAMPLES
Prostate tissue specimens were obtained from the Co-operative Human Tissue Network (CHTN), the NationalDisease Research Interchange (NDRI), and HackensackUniversity Medical Center (HUMC) under an InstitutionalReview Board (IRB) approval at the City College of New York(CCNY). For every cancerous tissue sample, a normal tissuespecimen from the same patient was obtained for comparison.CHTN, NDRI, and HUMC provided pathology reports for the
samples. The samples were received on dry ice and wereneither chemically treated nor frozen before spectroscopic andimaging measurements. The time elapsed between tissueresection and measurements varied from sample to sampledue to different sample sources, but all were within 30 hours.
Six pairs of different prostate tissue specimens obtained fromsix patients of age between 49 and 64 years were investigated.The Gleason scores of the six cancerous tissue specimensvaried from 5 to 8 as indicated in the pathology reports. Thecancerous samples were carefully checked to determine thehard parts to locate the cancerous regions before making anymeasurements. Assessment using hardness is acknowledged tobe a simple way to locate regions of malignancy.6
For extinction spectral measurements, the cancerous andnormal prostate tissues were cut to a thickness of ;100 lm andan area of ;2 cm 3 3 cm. The tissue samples were then putinto 100 lm thick quartz cells and slightly compressed toensure same thickness for the extinction measurements. Theextinction spectra (optical density, O.D., vs. wavelength) ofnormal and cancerous prostate tissues in the 400 to 2400 nmspectral range were measured using a Perkin-Elmer Lambda-9UV/VIS/NIR Spectrophotometer.
For diffuse reflectance measurements, the cancerous andnormal prostate tissue samples were cut into ;2 cm 3 2 cm 31.1 cm pieces. The schematic diagram of the diffusivereflectance experimental setup is shown in Fig. 1a. A
FIG. 1. (a) Schematic diagram of the diffuse reflectance imaging experimental setup; (b) NIR spectral polarization imaging arrangement (CCD: charge-coupleddevice, M: mirror; L: lens, P1: polarizer, P2: analyzer, and WBF: wide-band filter).
APPLIED SPECTROSCOPY 829

Ti : sapphire laser (Spectra-Physics Tsunami) beam tunable from750 to 860 nm was used to illuminate the sample. The laser wasoperated in continuous-wave (cw) mode and had a spectral fullwidth at half-maximum bandwidth less than 1 nm. The beampassed through a 40-cm focal length converging lens andilluminated the sample at an incidence angle of a = 72.48.Backscattered light in the direction normal to the surface of thesample was recorded by a charge-coupled device (CCD) camera.Measurements made in 10 nm steps over the 750 to 860 nmspectral range resulted in 12 sets of backscattering data.
The effective area recorded for the backscattered lightintensity distribution used for analyzing is ;2 mm 3 5 mm.Light reflectance predominantly probes the volume of thesample around the point of incidence. While the lightpenetrates deep into the tissue, the major contribution tobackscattered signal at the detection angle comes mainly froma depth of approximately 1 mm. The incident beam was aimedat the cancer site. In the case of a tumor of size smaller than theprobed volume, the fitted optical parameters should beregarded as the average property of the probed volume(including the tumor and its surrounding environment). Thecancer sites examined in the diffuse reflectance measurementswere of sizes comparable to the effective area mentionedabove, and hence the probed optical properties approximatethose of the cancerous areas.
A spectral polarization imaging setup used for transmissionimaging measurements is schematically shown in Fig. 1b. Awhite light beam collimated to a diameter of ;2 cm was passedthrough wide band filters (WBF) with a typical bandwidth of60 nm centered at 700 nm and 800 nm to select the desirablespectral range for imaging. A polarizer (P1) was located in theincident beam path before the sample to obtain a linearlypolarized incident beam of light. The second polarizer (P2) waspositioned in front of the CCD camera for selecting thedetection polarization direction (parallel or perpendicular to theorientation of P1). A cooled silicon CCD camera (PhotometricCH350L), which has spectral response in the 400 to 1000 nmrange and is equipped with a 50-mm focal-length zoom lens,was used to record the images in transmission geometry.
THEORETICAL FORMALISM
Determination of la, ls, l0s, g from Optical Spectroscopic
Measurements. Since la ,, ls in the 750 to 860 nm spectralrange for prostate tissue, the extinction coefficient, lt = lsþla
’ ls, and the optical density (O.D.) spectrum of a thin prostatetissue sample is dominated by scattering. The scatteringcoefficient (ls) is given by:
ls ffi lt ¼ 2:303O:D:
Lð1Þ
where L is the light path length in the tissue.Backscattered light intensities measured in diffuse reflection
experiments for a thick prostate tissue sample with thickness of;1.1 cm were used to extract the optical absorption and thereduced scattering coefficients. The coordinates (x, y, z) aredefined in Fig. 1a. In the case of an obliquely incident pencilbeam, the origin of the system co-ordinate is set on the surface(z = 0) and the incident direction is (sin a, 0,�cos a), where ais the incidence angle (a = 72.48 in our case). The Snell’s lawpredicted direction of the diffraction beam within the tissue is(sin b, 0,�cos b), where sin a = n sin b, and n is the index of
refraction of prostate tissue (n = 1.35).16 The backscattereddiffuse intensity at position (x, y, 0) on the surface of thesample is given by:15
Iðx; yÞ ¼ ltcosb
4pq31
ð1þ leffq1Þexpð�leffq1Þ
þ ltcosbþ 2ze
4pq32
ð1þ leffq2Þexpð�leffq2Þ ð2Þ
where the incident intensity is taken to be unity,
q1 ¼ffiffiffiffiffiffiffiffiffiffiffiffiffiffiffiffiffiffiffiffiffiffiffiffiffiffiffiffiffiffiffiffiffiffiffiffiffiffiffiffiffiffiffiffiffiffiffiffiffiffiffiffiffiffiffi
ðx � ltsinbÞ2 þ y2 þ l2t cos2bq
;
q2 ¼ffiffiffiffiffiffiffiffiffiffiffiffiffiffiffiffiffiffiffiffiffiffiffiffiffiffiffiffiffiffiffiffiffiffiffiffiffiffiffiffiffiffiffiffiffiffiffiffiffiffiffiffiffiffiffiffiffiffiffiffiffiffiffiffiffiffiffiffiffi
ðx � ltsinbÞ2 þ y2 þ ð2ze þ ltcosbÞ2q
;
and leff =ffiffiffiffiffiffiffiffiffiffiffiffi
3la=ltp
; lt = ðl0sÞ�1
is the transport mean free path;ze is the extrapolation length that depends on the mismatch ofthe index of refraction at the interface.17 The extrapolationlength is computed to be ze = 1.69lt. Equation 2 is used to fitthe measured diffuse reflectance along a line in the x directionon the tissue surface to obtain la and lt. The anisotropy factor gis then obtained using g = 1 – (l0
s/ls).Fractal Soft Tissue Model for Determination of Df and
dmax.. As many biological tissues have fractal-like organizationand are statistically self-similar, various tissue light scatteringmodels based on fractal geometry have been proposed. Thedistribution of the number density of particles of diameter di isgiven by11,12
nðdiÞ ¼g0d3�Df
i
pd3i =6
¼ 6g0
pd�Df
i ð3Þ
where Df is the fractal volume dimension, g0 is a scale-dependent constant, and n(di)Dd gives the number density ofthe particles with diameters between di and diþDd. The valueof g0 can be determined from the total volume fraction of allparticles, Tm, using equations11,12
Tm ¼ g0
Z dmax
dmin
d3�Df
i ddi�g0 ¼ Tm
�
Z dmax
dmin
d3�Df
i ddi;
where dmin and dmax are diameters of the smallest and largestscattering particles, respectively.
The discrete particle model may not be appropriate todescribe tissue inhomogeneities, as on a microscopic scale theconstituents of tissue have no clear boundaries and merge intoa quasi-continuum structure. As the refractive index variationin biological tissue is weak, tissue is better modeled as acontinuous random medium where light scattering is not due tothe discontinuities in refractive index but is considered to be aconsequence of weak random fluctuations of the dielectricpermittivity.
In such a fractal soft tissue model, the correlation function R(r)of the random fluctuation of the refractive index is a weightedaverage of fluctuations over a range of correlation length l, thatdepends on the fractal dimension Df and the cutoff length or themaximum correlation length, dmax.13 Light scattering property ofthe tissue is fully determined by the power spectrum (the Fouriertransform) of R(r). This model has been shown to be in good
830 Volume 66, Number 7, 2012
agreement with NIR light scattering experimental results in
biological tissues and cell suspensions.13,14
The amplitude scattering function S(h) at the scattering angle
h is given by:13
jSðhÞj2 ¼Z kdmax
kdmin
e2g0kDf�1x6�Df
2p½1þ 2ð1� cos hÞx2�2dx ð4Þ
where e2 = 4n40dm2, k [ 2pn0/k, n0 is the index of refraction of
the surrounding medium, and dm is the amplitude of the
relative refractive index fluctuation. The anisotropy factor (g),
the mean cosine of the scattering angle, was then found as13
g ¼Z
dXð1þ cos2 hÞcos hjSðhÞj2
2k2
�
Z
dXð1þ cos2 hÞjSðhÞj2
2k2
ð5Þ
where X is the solid angle and dX = 2psinhdh for a scattering
angle h.13 The reduced scattering coefficient in the fractal soft
tissue model follows a power law:
l0s } k3�Df ð6Þ
This provides a simple procedure to estimate the fractaldimension Df from the wavelength dependence of l0
s.13
Using Eqs. 4 and 5, and the known value of dmin, thevariation of g as a function of dmax can be plotted in a g ; dmax
curve. Using the g ; dmax curve, the maximum correlationlength dmax can be obtained from the determined anisotropyfactor g.
EXPERIMENTAL RESULTS AND ANALYSIS
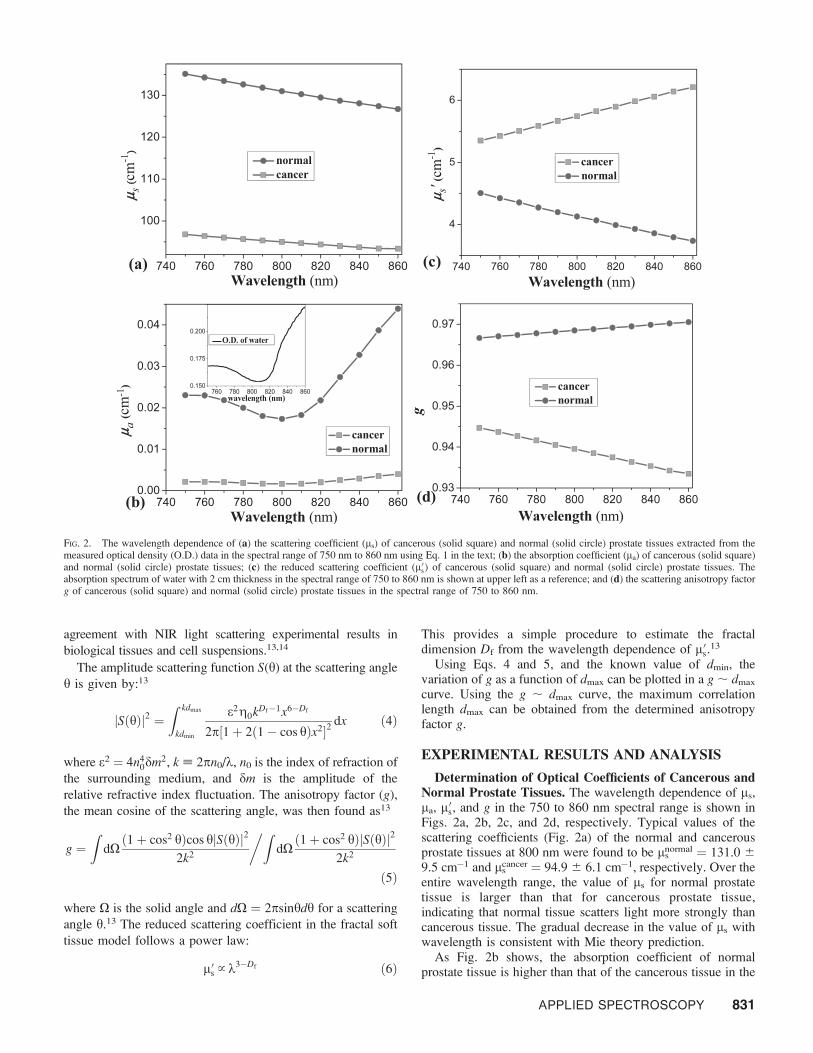
Determination of Optical Coefficients of Cancerous andNormal Prostate Tissues. The wavelength dependence of ls,la, l0
s, and g in the 750 to 860 nm spectral range is shown inFigs. 2a, 2b, 2c, and 2d, respectively. Typical values of thescattering coefficients (Fig. 2a) of the normal and cancerousprostate tissues at 800 nm were found to be ls
normal = 131.0 6
9.5 cm�1 and lscancer = 94.9 6 6.1 cm�1, respectively. Over the
entire wavelength range, the value of ls for normal prostatetissue is larger than that for cancerous prostate tissue,indicating that normal tissue scatters light more strongly thancancerous tissue. The gradual decrease in the value of ls withwavelength is consistent with Mie theory prediction.
As Fig. 2b shows, the absorption coefficient of normalprostate tissue is higher than that of the cancerous tissue in the
FIG. 2. The wavelength dependence of (a) the scattering coefficient (ls) of cancerous (solid square) and normal (solid circle) prostate tissues extracted from themeasured optical density (O.D.) data in the spectral range of 750 nm to 860 nm using Eq. 1 in the text; (b) the absorption coefficient (la) of cancerous (solid square)and normal (solid circle) prostate tissues; (c) the reduced scattering coefficient (l0
s) of cancerous (solid square) and normal (solid circle) prostate tissues. Theabsorption spectrum of water with 2 cm thickness in the spectral range of 750 to 860 nm is shown at upper left as a reference; and (d) the scattering anisotropy factorg of cancerous (solid square) and normal (solid circle) prostate tissues in the spectral range of 750 to 860 nm.
APPLIED SPECTROSCOPY 831
750 to 860 nm spectral range, with typical values of lnormala =
(1.73 6 0.14) 3 10�2 cm�1 and lcancera = (1.62 6 0.13)310�3
cm�1, respectively at 800 nm. Comparison with the absorptionspectrum of water in the inset shows that the absorption spectraof the tissues follow that of water closely, and the behavior ismore prominent for the absorption spectrum of the normaltissue. This result indicates that water is the dominantabsorptive tissue constituent in this spectral range. What iseven more important is that water content is much higher innormal prostate tissues than in prostate tumors, an observationconsistent with known relative abundance of water in normaland cancerous tissues.4,5
Reduced scattering coefficient (Fig. 2c) of normal prostatetissue decreases and that of cancerous prostate tissues increasesmonotonically in the 750 to 860 nm range, while the behavioris reversed for anisotropy factor g. The overall magnitude of l0
s
is significantly higher for cancerous prostate tissue than fornormal prostate tissue, with typical values of (l0
s)normal = 4.136 0.21 cm�1 and (l0
s)cancer = 5.74 6 0.19 cm�1 at 800 nm. Theobserved lower values of g for cancerous tissue than that fornormal tissue (Fig. 2d) follow readily from the behavior of l0
s
because of the simple algebraic relation between the twoparameters. Typical values of g at 800 nm for normal andcancerous prostate tissues are estimated to be 0.968 6 0.04 and0.939 6 0.06. It is intriguing that the g factor of normal tissueis always larger than that of cancerous tissues in this spectralrange. Since ls, l0
s, and g depend on a number of parameters,such as index of refraction and scattering particles’ size anddistribution, detailed analysis is given in the next section usingthe fractal soft tissue model to illustrate the origin of theseobservations.
Numerical Evaluation of Fractal Dimension (Df) andCutoff Diameters of Scatterers in Cancerous and NormalProstate Tissues. To study how the absorption and scatteringspectra reflect micro-structural properties of cancerous andnormal prostate tissues, we analyzed the scattering data of thesetwo types of tissues numerically using the fractal soft tissuemodel outlined in the Theory section. The followingparameters were used in our simulation: the total volumefraction of all scatterers Tm = 0.2,11,12 the diameter of thesmallest particle dmin = 50 nm,11,18 the index of refraction ofthe cytoplasm of prostate tissue (host medium) n0 = 1.35,16
and the index of refraction of prostate cellular nuclei (scatteringparticles) n1 = 1.46.12–14,16
The values of fractal dimension, Df, were obtained by fittingthe data shown in Fig. 2c using Eq. 6, and the results show thatDf = 1.9 6 0.04 and 4.4 6 0.06 for the cancerous and normalprostate tissues, respectively.
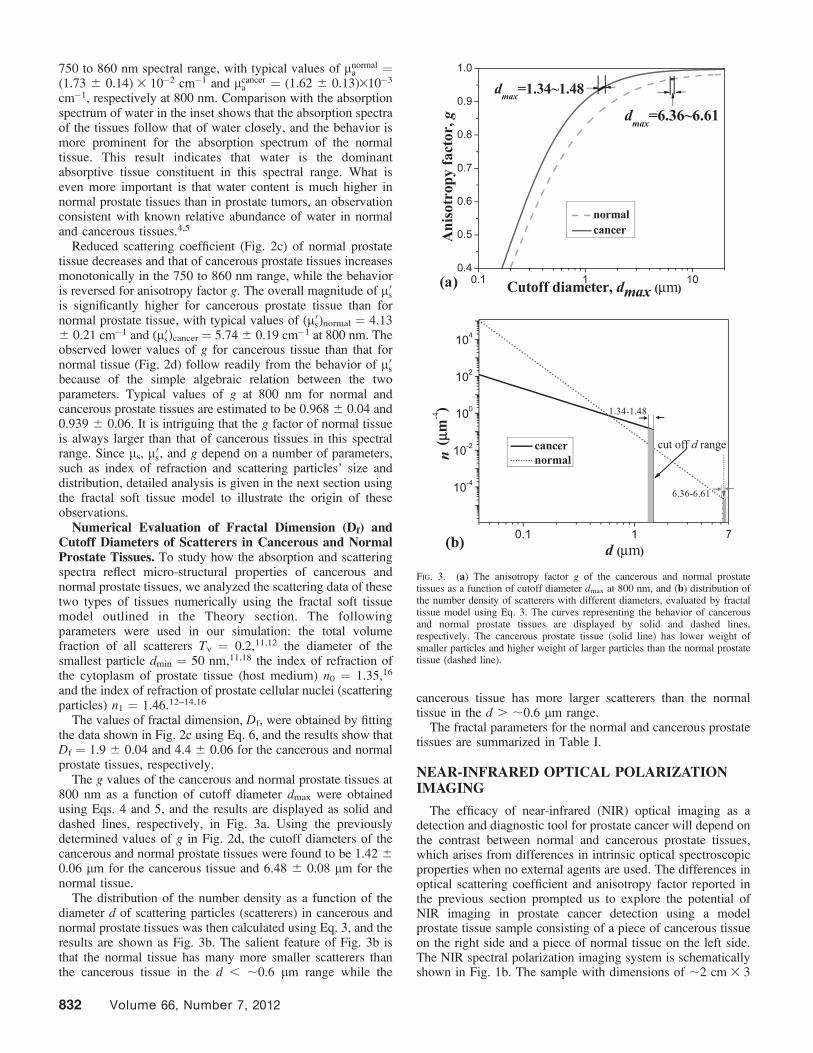
The g values of the cancerous and normal prostate tissues at800 nm as a function of cutoff diameter dmax were obtainedusing Eqs. 4 and 5, and the results are displayed as solid anddashed lines, respectively, in Fig. 3a. Using the previouslydetermined values of g in Fig. 2d, the cutoff diameters of thecancerous and normal prostate tissues were found to be 1.42 60.06 lm for the cancerous tissue and 6.48 6 0.08 lm for thenormal tissue.
The distribution of the number density as a function of thediameter d of scattering particles (scatterers) in cancerous andnormal prostate tissues was then calculated using Eq. 3, and theresults are shown as Fig. 3b. The salient feature of Fig. 3b isthat the normal tissue has many more smaller scatterers thanthe cancerous tissue in the d , ;0.6 lm range while the
cancerous tissue has more larger scatterers than the normaltissue in the d . ;0.6 lm range.
The fractal parameters for the normal and cancerous prostatetissues are summarized in Table I.
NEAR-INFRARED OPTICAL POLARIZATIONIMAGING
The efficacy of near-infrared (NIR) optical imaging as adetection and diagnostic tool for prostate cancer will depend onthe contrast between normal and cancerous prostate tissues,which arises from differences in intrinsic optical spectroscopicproperties when no external agents are used. The differences inoptical scattering coefficient and anisotropy factor reported inthe previous section prompted us to explore the potential ofNIR imaging in prostate cancer detection using a modelprostate tissue sample consisting of a piece of cancerous tissueon the right side and a piece of normal tissue on the left side.The NIR spectral polarization imaging system is schematicallyshown in Fig. 1b. The sample with dimensions of ;2 cm 3 3
FIG. 3. (a) The anisotropy factor g of the cancerous and normal prostatetissues as a function of cutoff diameter dmax at 800 nm, and (b) distribution ofthe number density of scatterers with different diameters, evaluated by fractaltissue model using Eq. 3. The curves representing the behavior of cancerousand normal prostate tissues are displayed by solid and dashed lines,respectively. The cancerous prostate tissue (solid line) has lower weight ofsmaller particles and higher weight of larger particles than the normal prostatetissue (dashed line).
832 Volume 66, Number 7, 2012

cm 3 0.035 cm was held between two glass plates under slightcompression to ensure uniform thickness. Figures 4a and 4bdisplay the polarization-gated images of the sample recordedwith transmitted light polarized parallel and perpendicular topolarization of the incident light, respectively. The centerwavelength of the imaging beam was 800 nm. It can be seenfrom Fig. 4 that the image of the right side of the sample(consisting primarily of cancerous tissue) is brighter than thatof the left side (consisting mainly of normal tissue). This can beexplained by the differences of scattering and absorptioncoefficients between cancerous and normal prostate tissues.Since both the scattering and absorption coefficients of thecancerous tissue at 800 nm are smaller than the correspondingcoefficients of the normal tissue, as shown in Figs. 2a and 2b,the light propagating in the cancerous tissue undergoes lessscattering and absorption. As a result, the light transmittedthrough the cancerous tissue area is stronger than that throughthe normal tissue.
The differences between the intensities transmitted through thecancerous and normal prostate tissue areas can be seen moreclearly from the spatial intensity distributions obtained byintegrating the image intensity over a horizontal rectangularregion as marked with the dashed boxes in Figs. 4a and 4b. Theintegrated image intensity distributions for the images shown inFigs. 4a and 4b are displayed in Figs. 4c and 4d, respectively. Theaverage image intensities of the cancerous tissue area were foundto be 1.04 and 1.71 times stronger than that of the normal tissuearea for the parallel and perpendicular images, respectively.
The image intensity distributions were also used to calculatethe degree of polarization, defined as P = (Ijj � I?)/(Ijj þ I?),where Ijj and I? are intensities of transmitted light parallel andperpendicular to the polarization of the incident light beam,respectively. The value of P for the normal and cancerousprostate tissues at 800 nm are Pcancer = 0.24 and Pnormal =0.46. Similar higher values of P for normal tissue than forcancerous tissue are observed for images with other wave-lengths in the 760 to 850 nm range. This is expected since the gfactor of normal prostate tissue is larger than that of thecancerous tissue, as shown in Fig. 2d. Linearly polarized lightpropagating in a more strongly forward-peaked scatteringmedium (characterized by a larger value of g) is lessdepolarized in one scattering event. The smaller g factor forthe cancerous tissue results in more depolarization and asmaller value of P in comparison with that in the normaltissue.19
DISCUSSION
In this paper we have presented the initial results of a studyto explore potential correlation between optical properties andfractal dimensional parameters in normal and cancerous humanprostate tissues. The extinction spectra of cancerous andnormal prostate tissues in the 750 to 860 nm spectral rangewere used to obtain the scattering coefficient (ls). Theabsorption coefficient (la) and the reduced scattering coeffi-
cient (l0s) were acquired by fitting the diffuse reflectance of an
obliquely incident beam using the diffusion model in a thicktissue sample. The values of l0
s were found to be greater than la
by 2 to 3 orders of magnitude in this spectral range, and theresults are consistent with literature values for prostate tissue.7,8
The anisotropy factor g was calculated from ls and l0s.
A fractal soft tissue model was used to extract the values offractal dimension (Df) from the wavelength dependence of l0
s
and were found to be 1.9 and 4.4 for the cancerous and normalprostate tissues, respectively. The values are markedlydifferent. Similar remarkable difference was observed in thevalues for cutoff diameter, dmax: 1.42 6 0.06 lm for thecancerous tissue and 6.48 6 0.08 lm for the normal tissue.Since the cutoff diameter may be considered to be an upperlimit on the size of scatterers in tissue specimens, this resultmay be quite significant. Further probing revealed that theobserved value of the cutoff diameter of the cancerous tissue(1.42 6 0.06 lm) falls within the range of 1.38–1.96 lm forthe nucleolar diameter of cancerous prostate cell,20 and thecutoff diameter for normal tissue (6.48 6 0.08 lm) closelymatches the nuclear diameter of normal prostate cell (6.3–6.72lm).20 These close agreements point to the intriguingimplication that in normal prostate cells the largest scatterersare the nuclei, while in cancerous prostate cells nucleoli are thelargest scatterers. However, such a hypothesis raises thequestion why it is that the nucleoli represent the upper limitto the size of scatterers in cancerous cells, while nucleidetermine the upper limit in normal cells. In this context itshould be noted that the diameter of the normal prostatenucleoli lie in the 1.10 to 1.24 lm range, and that of cancerousnuclei is in the 8.4 to 10.31 lm range.20
TABLE I. Df and dmax for cancerous and normal prostate tissues.
Tissue type Df dmax (lm)
Cancer 1.9 6 0.04 1.42 6 0.06Normal 4.4 6 0.06 6.48 6 0.08
FIG. 4. Transmission images of a normal (N) and cancerous (C) humanprostate tissue sample, obtained using 800 nm light for (a) parallel and (b)perpendicular polarization configurations. The size of tissue for imaging is ;2cm 3 3 cm 3 0.035 cm (length 3 height 3 depth). (c, d) The digitized spatialintensity distributions of images (a) and (b), respectively, obtained byintegrating the image intensity over the horizontal rectangular region asmarked with the dashed boxes in (a) and (b).
APPLIED SPECTROSCOPY 833
A quantitative answer to this question is beyond the scope ofthis paper. However some qualitative and plausible observa-tions based on the morphological changes associated withcancer and consequent changes in optical spectroscopiccharacteristics can be made in support of the hypothesis.20–25
Normal cells, in general, are characterized by uniformity in sizeand shape of nuclei (round or oval) and have an orderedmorphological structure.21 The cell nucleus is dense andcompact and may be considered as an entity with a localizedindex of refraction inhomogeneity. So, the entire nucleus actsas a scattering entity that happens to be larger than any otherscatterer within the normal cell. This neat, regular, and orderedstructure breaks down in cancerous cells. Malignant cells arecharacterized by irregular morphology, including changes inthe shape and size of the nucleus, the nuclear envelope, thenucleolus, and the chromatin.21 Richards-Kortum et al. foundthat light scattering is strongly influenced by the difference inmorphology of nucleus and nucleolus, DNA content, andclumping and coarse chromatins.22 Fischer et al. show that twoimportant cell structure changes in human prostate cancer arenucleolar enlargement and nuclear envelope irregularity.23
Varma et al. investigated the morphologic criteria for diagnosisof prostate adenocarcinoma in 250 consecutive cases andobserved that dysplastic nuclei have irregular size and shape,clumps of condensed chromatin, and multiple nucleoli.24 Theysuggest that the prominent nucleoli, marginated nucleoli(location of nucleoli is close to or at the inner nuclearmembrane) and multiple nucleoli are criteria having highestsensitivity and specificity for diagnosis of prostate cancer.24 Tosum up, because of high density of malignant prostate cells,irregularity of nuclear envelope, enlargement of nucleoli,clumping and condensation of the chromatin and marginatednucleoli,22–25 and fragmentation of nuclei and nucleardegeneration, it seems that nuclei no longer behave as thelargest compact entities in cancerous cells when it comes tolight scattering: that role is taken up by nucleoli.
Fractal model analysis of optical spectroscopic measure-ments on normal prostate tissues and prostate tumors atdifferent stages of growth and different Gleason gradescorroborated by microscopic and histological examinations ofthe samples will be needed to put the hypothesis presentedabove to stringent test. Affirmation of the hypothesis wouldimply that the fractal dimension and the cutoff diameterpredicted by the fractal soft tissue model may be used ascriteria for prostate cancer detection. The results furtherindicate that the NIR spectral polarization imaging26 has thepotential to be developed as a modality for prostate cancerdetection.
ACKNOWLEDGMENTS
This research is supported in part by U.S. Army Medical Research andMaterial Command (USAMRMC) under the grants numbered W81XWH-08-1-0717, W81XWH-10-1-0526, and W81XWH-11-1-0335. The authors acknowl-edge the help of NDRI, CHTN, and HUMC for providing cancerous andnormal prostate tissue samples for the measurements. Min Xu acknowledgesResearch Corporation and NIH (1R15EB009224) for additional support.
1. L. Goutzanis, N. Papadogeorgakis, P.M. Pavlopoulos, K. Katti, V. Petsinis,I. Plochoras, C. Pantelidaki, N. Kavantzas, E. Patsouris, C. Alexandridis.‘‘Nuclear fractal dimension as a prognostic factor in oral squamous cellcarcinoma’’. Oral Oncol. 2008. 44: 345-353.
2. C. Morrison, J. Thornhill, E. Gaffney. ‘‘The connective tissue frameworkin the normal prostate, BPH and prostate cancer: analysis by scanningelectron microscopy after cellular digestion’’. Urol. Res. 2000. 28: 304-307.
3. R. Montironi, A. Filho, A. Santinelli, R. Mazzucchelli, R. Pomante, P.Colanzi, M. Scarpelli. ‘‘Nuclear changes in the normal-looking columnarepithelium adjacent to and distant from prostatic intraepithelial neoplasiaand prostate cancer. Morphometric analysis in whole-mount sections’’.Virchow Arch. 2000. 437: 625-634.
4. M. Chaplin. ‘‘Do we underestimate the importance of water in cellbiology?’’ Nature Rev. Molecular Cell Biol. 2006. 7: 861-866.
5. P. Atluri, G.C. Karakousis, P.M. Porrett, L.R. Kaiser. ‘‘The SurgicalReview: An Integrated Basic and Clinical Science Study Guide’’.Lippincott Williams and Wilkins, ISBN 0781756413, 2005. Pp. 10-32.
6. A. Shmilovici. ‘‘Incomplete tumor volume reduction may improve cancerprognosis’’. Med. Hypotheses. 2007. 68: 1236-1239.
7. W.-f. Cheong, S.A. Prahl, A.J. Welch. ‘‘A review of the optical propertiesof biological tissues’’. IEEE J. Quant. Electron. 1990. 26: 2166-2185.
8. M. Xu, Y. Pu, W.B. Wang. ‘‘Clean image synthesis and target numericalmarching for optical imaging with backscattering light’’. Biomed. Opt.Exp. 2011. 2: 850-857.
9. J.W. Baish, R.K. Jain. ‘‘Fractals and Cancer’’. Cancer Res. 2000. 60: 3683-3688.
10. M. Bizzarri, A. Giuliani, A. Cucina, F. D’Anselmi, A.M. Soto, C.Sonnenschein. ‘‘Fractal analysis in a systems biology approach to cancer’’.Sem. Cancer Biol. 2011. 21: 175-182.
11. R.K. Wang. ‘‘Modeling optical properties of soft tissue by fractaldistribution of scatterers’’. J. Mod. Opt. 2000. 47: 103-120.
12. S.K. Sharma, S. Banerjee. ‘‘Volume concentration and size dependence ofdiffuse reflectance in a fractal soft tissue model’’. Med. Phys. 2005. 32:1767-1774.
13. M. Xu, R.R. Alfano. ‘‘Fractal mechanisms of light scattering in biologicaltissue and cells’’. Opt. Lett. 2005. 30: 3051-3053.
14. M. Xu, T. Wu, J.Y. Qu. ‘‘Unified Mie and fractal scattering by cells andexperimental study on application in optical characterization of cellular andsubcellular structures’’. J. Biomed. Opt. 2008. 13: 0240151-9.
15. M. Xu, M. Alrubaiee, S.K. Gayen, R.R. Alfano. ‘‘Determination of lightabsorption, scattering and anisotropy factor of a highly scattering mediumusing backscattered circularly polarized light’’. Proc. SPIE. 2007. Opticalinteraction with tissue and cells XVIII. 6435: J1-6.
16. S.L. Jacques, S.A. Prahl. ‘‘Introduction to tissue optics’’. 2002. http://omlc.ogi.edu/classroom/ece532/index.html.
17. J.X. Zhu, D.J. Pine, D.A. Weitz. ‘‘Internal reflection of diffusive light inrandom media’’. Phys. Rev. A. 1991. 44: 3948-3959.
18. J.M. Schmitt, G. Kumar. ‘‘Optical Scattering Properties of Soft Tissue: ADiscrete Particle Model’’. Appl. Opt. 1998. 37: 2788-2797.
19. M. Xu, R.R. Alfano. ‘‘Random walk of polarized light in turbid media’’.Phys. Rev. Lett. 2005. 95: 213905.
20. R. Montironi, R. Mazzucchelli, A. Santinelli, M. Scarpelli, A. Beltran, D.Bostwick. ‘‘Incidentally detected prostate cancer in cystoprostatectomies:pathological and morphometric comparison with clinically detected cancerin totally embedded specimens’’. Human Pathol. 2005. 36: 646-654.
21. I. Ramzy. ‘‘Clinical cytopathology and aspiration biopsy’’. The McGraw-Hill Companies, 2001.
22. R. Drezek, M. Guillaud, T. Collier, I. Boiko, A. Malpica, C. Macaulay, M.Follen, R. Richards-Kortum. ‘‘Light scattering from cervical cellsthroughout neoplastic progression: influence of nuclear morphology,DNA content, and chromatin texture’’. J. Biomed. Opt. 2003. 8: 7-16.
23. A. Fischer. S. Bardarov Jr. and Z. Jiang ‘‘Molecular aspects of diagnosticnucleolar and nuclear envelope changes in prostate cancer’’. J. Cell.Biochem. 2004. 91: 170-184.
24. M. Varma, M. Lee, P. Tamboli, R. Zarbo, R. Jimenez, P. Salles, M. Amin.‘‘Morphologic criteria for the diagnosis of prostatic adenocarcinoma inneedle biopsy specimens: A study of 250 consecutive cases in a routinesurgical pathology practice’’. Arch Pathol. Lab. Med. 2002. 126: 554-561.
25. S. Bektasx, B. Bahadir, B. Gun, G. Kertisx, Sx. Ozdamar. ‘‘The relationbetween gleason score, and nuclear size and shape factors in prostaticadenocarcinoma’’. Turk J. Med. Sci. 2009. 39: 381-38.
26. Y. Pu, W.B. Wang, G.C. Tang, F. Zeng, S. Achilefu, J.H. Vitenson, I.Sawczuk, S. Peters, J.M. Lombardo, R.R. Alfano. ‘‘Spectral polarizationimaging of human prostate cancer tissue using near-infrared receptor-targeted contrast agent’’. Technol. Cancer Res. Treat. (TCRT). 2005. 4:429-436.
834 Volume 66, Number 7, 2012