Fractal analysis 2014
10
____________________________________________________________________________________________ *Corresponding author: Email: [email protected], [email protected]; Annual Research & Review in Biology 4(4): 699-708, 2014 SCIENCEDOMAIN international www.sciencedomain.org Fractal Analysis of DNA by Nonlinear Genome Signal Processing for Exon and Intron Separation Ali Karmi 1 , Ali Najafi 1* , Peyman Gifani 1 and Sahand Khakabimamaghani 1 1 Molecular Biology Research Center, Baqiyatallah University of Medical Sciences, Tehran, Iran. Authors’ contributions Authors may use the following wordings for this section: “ ‘Payman Gifani’ designed the study, performed the statistical analysis, wrote the protocol, and wrote the first draft of the manuscript. ‘Ali Najafi’ and ‘Ali Karami’ managed the analyses of the study. ‘Sahand Khakabimamaghani’ managed the literature search. All authors read and approved the final manuscript.” Received 18 th August 2013 Accepted 1 st October 2013 Published 20 th November 2013 ABSTRACT Aims: To provide a new reasonable measure for distinguishing between coding and non- coding regions of DNA sequences based on its fractal nature and self-similarity. Study Design: After conducting background studies on the fractal structure of DNA sequences, the application of Detrended Fluctuation Analysis for identifying coding and non-coding regions in those sequences was investigated. Finally, the propositions were tested on a standard dataset of 195 genes. Place and Duration of Study: Sample: We use a common data set, “HMR 195”, which has been used in conventional tools, between December 2012 and July 2013. Methodology: The Fractal Scaling Exponent (FSE) of the numerical signal, produced by converting a DNA string to a numerical sequence via a number mapping algorithm, was calculated for exons and introns of 195 genes. This calculation was repeated twice: once for computing the optimal values of FSE, and once for non-optimal FSEs. Analysis of Variance (ANOVA) was used for investigating the significance of difference between the average FSE of exons versus that of introns in both optimal and non-optimal cases. Results: ANOVA indicated a significant gap between the optimal mean FSE of exons (0.65) and introns (0.72). The difference, although smaller, was significant for non-optimal Original Research Article
Transcript of Fractal analysis 2014

____________________________________________________________________________________________
*Corresponding author: Email: [email protected], [email protected];
Annual Research & Review in Biology4(4): 699-708, 2014
SCIENCEDOMAIN internationalwww.sciencedomain.org
Fractal Analysis of DNA by Nonlinear GenomeSignal Processing for Exon and Intron
Separation
Ali Karmi1, Ali Najafi1*, Peyman Gifani1 and Sahand Khakabimamaghani1
1Molecular Biology Research Center, Baqiyatallah University of Medical Sciences,Tehran, Iran.
Authors’ contributions
Authors may use the following wordings for this section: “ ‘Payman Gifani’ designed thestudy, performed the statistical analysis, wrote the protocol, and wrote the first draft of the
manuscript. ‘Ali Najafi’ and ‘Ali Karami’ managed the analyses of the study. ‘SahandKhakabimamaghani’ managed the literature search. All authors read and approved the final
manuscript.”
Received 18th August 2013Accepted 1st October 2013
Published 20th November 2013
ABSTRACT
Aims: To provide a new reasonable measure for distinguishing between coding and non-coding regions of DNA sequences based on its fractal nature and self-similarity.Study Design: After conducting background studies on the fractal structure of DNAsequences, the application of Detrended Fluctuation Analysis for identifying coding andnon-coding regions in those sequences was investigated. Finally, the propositions weretested on a standard dataset of 195 genes.Place and Duration of Study: Sample: We use a common data set, “HMR 195”, whichhas been used in conventional tools, between December 2012 and July 2013.Methodology: The Fractal Scaling Exponent (FSE) of the numerical signal, produced byconverting a DNA string to a numerical sequence via a number mapping algorithm, wascalculated for exons and introns of 195 genes. This calculation was repeated twice: oncefor computing the optimal values of FSE, and once for non-optimal FSEs. Analysis ofVariance (ANOVA) was used for investigating the significance of difference between theaverage FSE of exons versus that of introns in both optimal and non-optimal cases.Results: ANOVA indicated a significant gap between the optimal mean FSE of exons(0.65) and introns (0.72). The difference, although smaller, was significant for non-optimal
Original Research Article
Annual Research & Review in Biology, 4(4): 699-708, 2014
700
values as well.Conclusion: Throughout this study, the FSE is proved to be a reliable measure fordistinguishing between coding and non-coding regions of DNA gene sequences based onour experiments. Accordingly, this metric can be used for predicting exons/introns whenembedded within current tools such as TestCode. However, its contribution to thepredictive accuracy of current methods requires more investigation in the future works.
Keywords: DNA sequence; fractal scaling exponent; exon; intron.
1. INTRODUCTION
The biological information is embedded in the DNA sequence which stores, produces andcontrols processes for growth and maintenance of living systems. This information organizedin a structure of a nanowire, is encrypted in sequences of four bases, i.e. A, T, G, C. Eachsegment of every organism represents a processor to execute a particular biologicalprocess. Traditional approaches based on reductionism are hardly ever able to characterizemore than a tiny subset of the full range of behaviors. In the past years, many well-knownmolecular biologists have pointed out the vital need for theoretical and computational tools toshow the spatial and temporal organization of macromolecules interaction implicit in the wayto create a living cell as a whole [1].
Gene identification in prokaryotes is easier, because the coding regions are smallcontinuous strings of DNA. However, in higher eukaryotic organisms, genes are often splitinto a number of coding sequences (exons) separated by non-coding intervening sequences(introns). In gene identification, we can use intrinsic information derived from the querysequence itself, in addition to extrinsic information achieved by comparing the querysequence with other known sequences in public databases. Examples of intrinsic informationare promoters, splice sites, and CpG islands. This information can also be derived accordingto the fact that coding region sequences in the DNA exhibit specific statistical properties.
Locating genes on DNA which has not been analyzed for potential coding regions involvesusing statistical detection methods by using probability models to predict where in a DNAsequence a gene is located. The nucleic acid sequence probabilities can be determinedthrough analysis of known coding regions and can be categorized into measures thatdepend on coding DNA and measures that are independent of coding DNA. Modeldependent statistics capture the specific features of coding DNA whereas modelindependent statistics capture the global features of coding DNA. Since model independentmethods don’t need a sample of coding DNA they can be used in the absence of previousknowledge of the under consideration species. Therefore, there are two approaches namelyknowledge-based methods and ab-initio techniques. The knowledge-based methods sufferfrom some disadvantages. The methods such as hidden Markov models or Artificial NeuralNetwork which uses training based system are organism/dataset-specific and the accuracyof this method is affected when the information of newly sequenced genomes or availableorganisms is limited [2].
The development of high-throughput data-collection techniques for sequencing DNA such asnext generation sequencing brings vast nucleic acid sequence data rapidly. By sequencingthe entire human genome and the genomes of several other species, a need for the rapididentification of genes on long stretches of sequenced DNA has been emerged. Although the

Annual Research & Review in Biology, 4(4): 699-708, 2014
701
conventional gene detection techniques, such as cDNA hybridization, are effective inlocating transcribed genes, but these methods are based on reductionism approach, time-consuming and costly. Due to the present size and increasing rate of new raw data, we needsystemic and integrative ways of thinking about information organization of genomes tocheck quickly for similarities and differences among them and to explore the interactionsamong genotypes, phenotypes, and the environment. By the advent of Bioinformatics theneed for new computational tools to analyze and interpret the large amount of nucleotidesequences available in databases has been recently highlighted [3].
One of the whole genome structural features is the long-range correlation or scale-invariantproperty of DNA. This phenomenon implies that the occurrence of a nucleotide in a specificposition depends on the previous nucleotides and also the occurrence of a small segment ofnucleotides depends on large scale segments. Such long-range correlation is directly relatedto power-law and fractal structure of the DNA sequence. There is self-similarity amongdifferent scales of sequences which means that its fragments can be rescaled to resemblethe original sequence itself.
In this paper we investigated this global feature of DNA sequence by calculating the FractalScaling Exponent (FSE) of the numerical signal which is produced by converting a DNAstring to a numerical sequence by number mapping algorithm. By this approach, we have anumerical signal for a DNA string which could be analyzed by different signal processingalgorithms. Based on fractal structure of DNA sequence, in this paper, we implementedDetrended Fluctuation Analysis to calculate the FSE of this signal. This measure, thatcaptures another aspect of difference between coding and noncoding DNA sequences, canbe used in existing ab initio prediction methods.
2. MATERIALS AND METHODS
Providing robust computing solutions for DNA sequence analysis is a challenging issue inBioinformatics. Most of the Bioinformatics tools are currently searching for patterns orcorrelations existing in the DNA sequence based on codons, amino acids, and proteinsusing a variety of sophisticated computational techniques, including neural networkalgorithms, dynamic programming, decision trees, stochastic reasoning, and hidden Markovchain.
The application of chaos and fractal theory considering intrinsic patterns, correlations, andself-similarity measurement, is going to be highlighted in several areas of science.Correlation properties in DNA sequences have been studied in [4] through fractal landscapeor DNA walk models, in which genometric method projected the sequence of position foreach nucleotide on a two dimensional plot representation of the DNA landscape or walk,providing a landscape comparable among different genomes [5].
2.1 Scaling Exponents and Detrended Fluctuation Analysis
The scaling exponent is important in the characterization of long-range correlations in finite-length sequences. Peng and co-workers have developed an algorithm to estimate scalingexponents with local-detrending to remove the non-stationary components, known asDetrended Fluctuation Analysis (DFA) [4]. This technique can be applied to a self-similarprocess through simple integration. A DNA signal of length N, x(s), which has been

Annual Research & Review in Biology, 4(4): 699-708, 2014
702
generated from DNA sequence by numerical mapping system, can be integrated to generatea self-similar series y(k) by Equation (1).
j
ixixjy
1
)()((1)
Where the average value of x, denoted by x , is given by
N
iix
Nx
1)(1
(2)
After partitioning the entire range of y(k) into boxes of equal size n, we fit this integratedsignal by using a polynomial function, yn(k), which is representing the local trend within eachbox. After removing the trend in the root-mean-square fluctuation, F(n), is given by Equation(3):
(3)
The above computation is repeated for boxes with different sizes (scales) to provide arelationship between F(n) and the size n. A power-law relation between F(n) and the size ofthe box, indicates the presence of scaling F(n) ~ nα. F(n) is the average fluctuation andusually increases linearly with n.
This gives the scaling relation:
(4)
The scaling exponent (self-similarity parameter), α, should therefore be able to completelydescribe the significant correlation properties of DNA signal. Since the Equation (4)represents the scale transformation independent of n, then the exponent, α, provides asuccinct measure of the dynamics across a range of n. For ideal mathematical fractals, suchbehavior persists without a limit in n. However, for real systems, its range is always finite,and may in addition be interrupted by dynamical mechanisms which introduce characteristicscales into the data. In our investigation this limitation occurred and we had to select anoptimal range of box sizes. On the other hand, the scaling exponent estimation on the non-optimum region could also lead to meaningful results.
2.2 Converting Sequences to Signal
As we discussed before, to investigate the fractal property of DNA sequence by DFA, weshould first convert DNA string to a sequence of numerical values via number mappingalgorithm. A genome is simply a string of four nucleotide bases A, T, G, and C, and themapping system is also compromised a number system of the base four. The system hasfour digits 0, 1, 2, and 3 assigned to the four bases according to their molecular weights.Smaller digits are assigned to higher molecular weights; that is G = 0, A = 1, T = 2, and C =3.
N
kknyky
NnF
1)()( 21)(
nnF )(

Annual Research & Review in Biology, 4(4): 699-708, 2014
703
By the fact that double strand of DNA are complementary to each other and according that inDNA structure the observed complementary pairing is GC and AT and when we add thevalues of the GC (0+3=3) and AT (1+2=3) a constant value of three is obtained, the signalgenerated by the DNA remains the same to its reverse, complementary, and reversecomplementary sequence. Thus, in comparison to conventional gene analysis algorithmsthere is no need to take the sequence and run the algorithm and then take the reversecomplement of the sequence and run the algorithm again in our approach and we haveanalyzed the DNA sequence only once. In order to convert the DNA string to a uniquenumber string, a window of size three nucleotides is slid on the sequence to eliminate anyORF (Open Reading Frame) related bias. The codons are transformed to numbers using theformula F(Xn, Yn, Zn) = 4*4*Xn+4*Yn+Zn for window n containing bases X, Y, and Z. Forexample, for sequence CTGTCA, the first triplet CTG is converted into a numerical valueafter obtaining the numerical value (3, 1, 2) through mapping system described above andthen using the formula F(C,T,G) = 4*4*3+4*2+0 = 56; then the windows slide to the nexttriples, which are TGT, GTC, TCA and respectively.
2.3 Dataset
We use a common data set, “HMR 195” [6], which has been used in conventional tools.Below is a part of detailed description of this database exactly as stated in its website(http://blogs.ubc.ca/sanja/hmr195-dataset/):
DNA sequences were extracted from GenBank release 111.0 (April 1999). The basicrequirements in sequence selection were:
• the sequence was entered in GenBank after August, 1997• the source organism is Homo sapiens, Mus musculus or Rattus norvegicus• only genomic sequences that contain exactly one gene were considered• mRNA sequences and sequences containing pseudo genes or alternatively
spliced genes were excluded.
Sequences collected according to those principles were further filtered to meet followingrequirement:
• all annotated coding sequences started with the ATG initiation codon and endedwith one of the stop codons: TAA. TAG, TGA.
• all exons had dinucleotide AG at their acceptor site and dinucleotide GT at theirdonor site.
• sequences that did not contain any nucleotides in their 5’ or 3’ UTR werediscarded.
• the sequences whose coding region contains in-frame stop codon werediscarded.
HMR195 has the following characteristics:
• the ratio of Human: Mouse: Rat sequences is 103:82:10• the mean length of the sequences in the set is 7,096 bp• the number of single-exon genes is 43 and the number of multi-exon genes is
152.• the average number of exons per gene is 4.86.• the mean exon length is 208 bp, the mean intron length is 678 bp and the mean
coding length of a gene is 1,015 bp (~330 amino acids).

Annual Research & Review in Biology, 4(4): 699-708, 2014
704
3. RESULTS AND DISCUSSION
This section presents the results of our approach to analyzing the FSE of genome signal onmentioned dataset. As discussed before the first step is converting DNA sequence togenome signal by numerical mapping system presented in the previous section. Theanalysis was carried out after separating the intron and exon from the dataset. Any signalprocessing method can now be used to determine the variation or extract the biologicalfeature form generated signals of introns and exons.
As we discussed before based on fractal structure of DNA sequence, we implemented DFAto calculate the FSE of this signal. The details of this algorithm have been mentioned in theprevious section. The scaling exponent can be approximated as the slope of log(F(n))against log(n). The parameter α, called the scaling exponent or correlation exponent,represents the correlation properties of the signal. If α = 0.5, there is no correlation and thesignal is an uncorrelated signal (white noise); if α < 0.5, the signal is anti-correlated; if α >0.5, there are positive correlations in the signal. Therefore, finding scaling exponents in therange 0.5 to 1.0 would indicate long-range power-law correlations of the kind which areubiquitous in nature.
Although the algorithm is simple but the process of optimal feature selection on largeamounts of data, is not a straightforward problem. In this section, we discuss the optimalFSE estimation by selecting the best box sizes which lead to meaningful exon and intronsignal separation.
As illustrated in Fig. 1, when we use conventional DFA methods, in which all box sizes forslope estimation are used and a non-optimal scaling region has been defined, the diagramstarts from small box size (n), for which the data is fully matched by detrending step andtherefore the output value, F(n), is so small. On the extreme of the diagram, when nbecomes large, there is some box sizes in which detrending is saturated and no meaningfulincrease in fluctuation happens with an increase in the box size. Thus, the slope estimationmust be performed on a limited region, where most of the discrimination takes place.
Fig. 1. The result of DFA for exon and intron signals. The scaling exponent can beapproximated as the slope of log(F(n)) against log(n).
Annual Research & Review in Biology, 4(4): 699-708, 2014
705
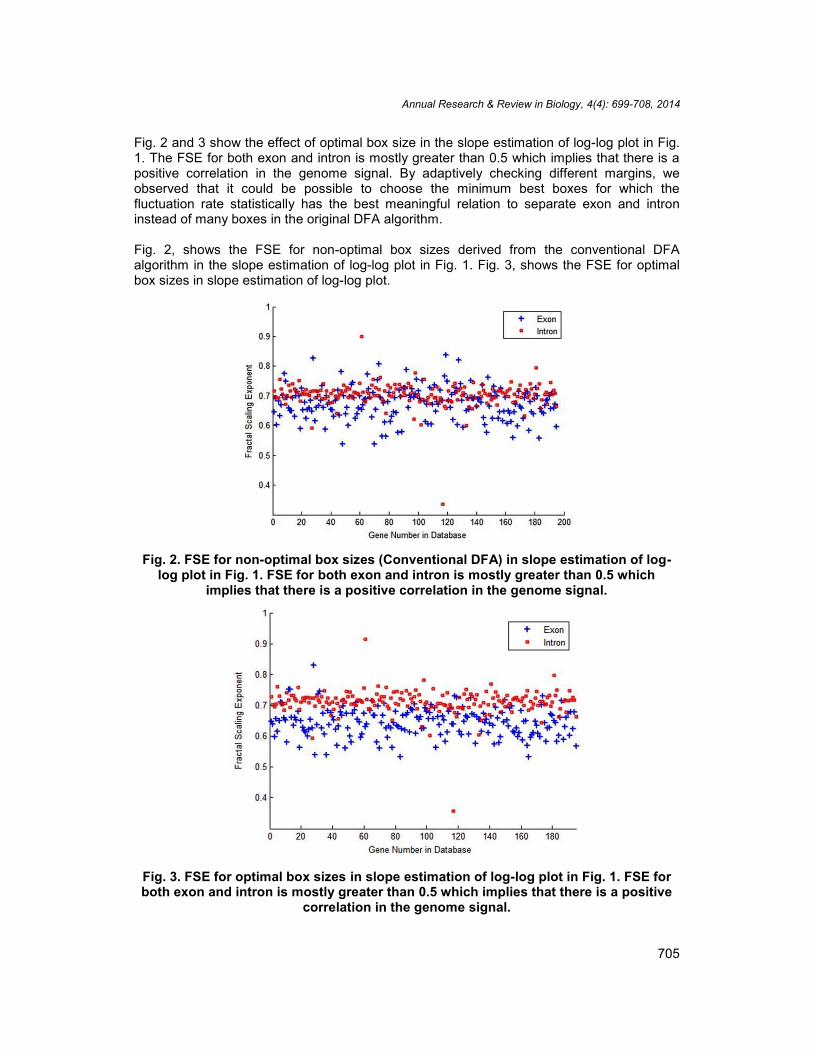
Fig. 2 and 3 show the effect of optimal box size in the slope estimation of log-log plot in Fig.1. The FSE for both exon and intron is mostly greater than 0.5 which implies that there is apositive correlation in the genome signal. By adaptively checking different margins, weobserved that it could be possible to choose the minimum best boxes for which thefluctuation rate statistically has the best meaningful relation to separate exon and introninstead of many boxes in the original DFA algorithm.
Fig. 2, shows the FSE for non-optimal box sizes derived from the conventional DFAalgorithm in the slope estimation of log-log plot in Fig. 1. Fig. 3, shows the FSE for optimalbox sizes in slope estimation of log-log plot.
Fig. 2. FSE for non-optimal box sizes (Conventional DFA) in slope estimation of log-log plot in Fig. 1. FSE for both exon and intron is mostly greater than 0.5 which
implies that there is a positive correlation in the genome signal.
Fig. 3. FSE for optimal box sizes in slope estimation of log-log plot in Fig. 1. FSE forboth exon and intron is mostly greater than 0.5 which implies that there is a positive
correlation in the genome signal.

Annual Research & Review in Biology, 4(4): 699-708, 2014
706
To determine whether differences in these two sets are statistically significant we useANOVA (analysis of variance). Since knowing the average and standard deviation is notsufficient to determine significance, the ANOVA can be used to see if a data set issignificantly different from another. The results of this test revealed that FSE significantlyseparates the exon and intron groups and it can be seen that optimal box sizes differentiatethese two groups more clearly regarding the gap between the mean FSEs of introns andexons. Table 1 summarized the result of this test for two different box size ranges.
Table 1. FSE separates the exon and intron groups and it can be seen that optimalbox sizes differentiate these two groups more significantly.
Significance (P-Value)Mean FSE (STD)Intron
Mean FSE (STD)Exon
DFA
P < 0.010.7202 (0.0391)0.6809 (0.07551)Non-optimal FSEP < 0.010.7231 (0.0938)0.6446 (0.04179)Optimal FSE
Box sizes (4-28)
Fractal analysis have been used to disclose long-range correlations in DNA sequences [7-9].It has revealed complex patterns in natural objects [10-12]. For example, the genomefragments have been classified according to their fractal properties and a prokaryoticphylogenetic tree based on fractal analysis has been proposed in [13]. One of fractalanalysis methods to study long-range correlations in genomes is the DFA [7, 14]. DFA is ascaling analysis method that provides a simple quantitative parameter (scaling exponent, α)to represent the correlation properties of sequence and the characteristic length scale ofrepetitive patterns.
The advantages of DFA over other methods are that it permits the detection of long-rangecorrelations embedded in the apparent non-stationary signal produced by mapping of asequence of the alphabet to numerical values. Conventional methods such as spectralanalysis or root mean square fluctuation can be applied only to stationary signal. Thismethod also avoids the counterfeit detection of long-range correlations that are artifacts ofnon-stationarity in sequences and differentiates local patchiness, such as excess of one typeof nucleotide in a specific region. DFA can be used for local heterogeneouse nucleotidecontent as well as for the entire sequence.
Moreover, DFA captures the fractal nature of DNA sequences which is not considered intraditional bias-based measures like Fickett’s statistic [15]. While compositional bias is animportant indicator of coding regions of DNA sequences, but it is not as specific to theseregions as self-similarity is. Accordingly, FSE could provide a more reasonable metric foridentifying informative regions in DNA sequences.
Methods such as Markov models have restrictions in dealing with dependencies at differentscales, although they are more suitable for short-range nucleotide correlation analysis. FastFourier transform (FFT) method is also affected at high-frequency analysis of short-rangecorrelations related to codon structure, whereas the signal is distorted by artifacts of themethod especially at low frequencies. A meaningful relation between the self-similarityproperty of DNA sequence and evolution has been reported in [16] which suggested a linkbetween long-range correlations and higher order structure of the DNA molecule [17]. Scale-independent correlations offer the best tradeoff between efficient information transfer androbustness to errors on all scales [16], whereas the information theory suggests that one can

Annual Research & Review in Biology, 4(4): 699-708, 2014
707
package the largest amount of information into characters of constant length when asequence is self-similar [18].
4. CONCLUSION
Based on long-range correlation or scale-invariant property of DNA as one of the wholegenome structural features, in this paper we use the self-similarity and fractal property of thenumerical signal generated from a DNA sequence. FSE as a global feature has beenextracted from the signal which belongs to exon and intron signals using DFA. The resultsimply that the FSE for both exon and intron of 195 genes in the dataset are mostly above 0.5indicating the presence of long-range correlations and fractal nature of genome signal. Moreimportantly the FSE of coding sequences (exon) was significantly lower than sequences thatwere primary noncoding (intron). The FSE of exon segments represents more variationcompare to FSE of intron segments as illustrated in Fig. 2 and 3. It means that non-codingunit of a sequence has a simpler information structure in relation to coding segments (exon)which shows more complex information entropy.
Accordingly, like Fickett’s statistic, FSE can be exploited in the existing exon/intronprediction algorithms like TestCode (http://rothlab.ucdavis.edu/genhelp/testcode.html). Thiscould be the topic of next research complementing the present one. Moreover, the presentedmethod can be used for other datasets with different target questions. Especially tracing thefractal property of the genome in evolution and among diverse species can be invaluabletopics for future researches. Another issue in separating coding and non-coding regions notaddressed in this research is the analysis of difference between 3’ and 5’ UTRs, as othernon-coding segments, with other segments of the gene. This, also, can be another potentialarea of research.
COMPETING INTERESTS
Authors have declared that no competing interests exist.
REFERENCES
1. Tyson JJ, Chen K, Novak B. Network dynamics and cell physiology. Nat Rev Mol CellBiol. 2001;2(12):908-16.
2. Singhal P, et al. Prokaryotic gene finding based on physicochemical characteristics ofcodons calculated from molecular dynamics simulations. Biophysical journal.2008;94(11):4173-4183.
3. Biran, A. and E. Meshorer, Concise review: chromatin and genome organization inreprogramming. Stem Cells. 2012;30(9):1793-9.
4. Buldyrev SV, et al. Long-range correlation properties of coding and noncoding DNAsequences: GenBank analysis. Phys Rev E Stat Phys Plasmas Fluids Relat InterdiscipTopics. 1995;51(5):5084-91.
5. Ashida H, Asai K, Hamada M. Shape-based alignment of genomic landscapes inmulti-scale resolution. Nucleic Acids Res. 2012;40(14):6435-48.
6. Rogic S. Evaluating and improving the accuracy of computational gene-finding onmammalian DNA sequences. The University of British Columbia; 2000.
7. Peng CK, et al. Statistical properties of DNA sequences. Physica A. 1995;221:180-92.

Annual Research & Review in Biology, 4(4): 699-708, 2014
708
8. Voss RF. Evolution of long-range fractal correlations and 1/f noise in DNA basesequences. Phys Rev Lett. 1992;68(25):3805-3808.
9. Havlin RNM,. Peng CK, Simons M. Scale Invariant Features of Coding and NoncodingDNA Sequences. Fractal Geometry in Biological Systems: An Analytical Approach.1996;15.
10. Berthelsen CL, Glazier JA, Skolnick MH. Global fractal dimension of human DNAsequences treated as pseudorandom walks. Physical Review A. 1992;45(12):8902.
11. Zu-Guo Y, et al. Fractals in DNA sequence analysis. Chinese Physics.2002;11(12):1313.
12. de Sousa Vieira M. Statistics of DNA sequences: A low-frequency analysis. PhysicalReview E. 1999;60(5):5932.
13. Yu ZG, et al. The genomic tree of living organisms based on a fractal model. PhysicsLetters A. 2003;317(3):293-302.
14. Peng CK, et al. Mosaic organization of DNA nucleotides. Physical Review E.1994;49(2):1685.
15. Fickett JW. Recognition of protein coding regions in DNA sequences. Nucleic AcidsRes. 1982;10(17):5303-18.
16. Voss RF. Evolution of long-range fractal correlations and 1/fα noise in DNA basesequences. Phys. Rev. Lett. 1992;68:3805-3808.
17. Nyeo SL, Yang IC, Wu CH. Spectral classification of archaeal and bacterial genomes.Journal of Biological Systems. 2002;10(03):233-241.
18. Nagai N, et al. Evolution of the periodicity and the self-similarity in DNA sequence: aFourier transform analysis. The Japanese journal of physiology. 2001;51(2):159-168.
_________________________________________________________________________© 2014 Najafi et al.; This is an Open Access article distributed under the terms of the Creative Commons AttributionLicense (http://creativecommons.org/licenses/by/3.0), which permits unrestricted use, distribution, and reproductionin any medium, provided the original work is properly cited.
Peer-review history:The peer review history for this paper can be accessed here:
http://www.sciencedomain.org/review-history.php?iid=316&id=32&aid=2546