Novel BODIPY-based Conjugated Polymers Donors for Organic Photovoltaic Applications
Upload
independentCategory
view
1download
0
Array Based Sensing of Normal, Cancerous and Metastatic Cellsusing Conjugated Fluorescent Polymers
Avinash Bajaj§, Oscar R. Miranda§, Ronnie Phillips#, Ik-Bum Kim#, D. Joseph Jerry‡, UweH. F. Bunz#, and Vincent M. Rotello§§Department of Chemistry University of Massachusetts, 710 North Pleasant Street, Amherst,Massachusetts 01003‡Department of Veterinary and Animal Science, University of Massachusetts, 710 North PleasantStreet, Amherst, Massachusetts 01003#Department of School of Chemistry and Biochemistry, Georgia Institute of Technology, 901 AtlanticDrive, Atlanta, Georgia 30332
AbstractA family of conjugated fluorescent polymers was used to create an array for cell sensing. Fluorescentconjugated polymers with pendant charged residues provided multivalent interactions with cellmembranes, allowing the detection of subtle differences between different cell types on the basis ofcell surface characteristics. Highly reproducible characteristic patterns were obtained from differentcell types as well as from isogenic cell lines, enabling the identification of cell type as welldifferentiating between normal, cancerous and metastatic isogenic cell types with high accuracy.
IntroductionThe multivalent capabilities and sensitivity of conjugated polymers to minor conformationalor environmental changes makes them ideal candidates for biosensing applications.1,2 Theoptical properties of these materials, e.g. i.e. absorption (color) and emission (glow) changesignificantly in response to even subtle changes in their surroundings. Unlike small moleculefluorophores, conjugated polymers feature a molecular wire effect and polyvalent modes ofinteractions that can enhance signal generation.1,2 Moreover, conjugated polymer chains withmultiple recognition elements can bind to one analyte molecule, thereby increasing both thebinding efficiency and recognition selectivity for specific analytes.3
The favorable properties of conjugated polymers have facilitated their applications inbiosensing and bioimaging. As an example, the heparin-like properties of a highly negativelycharged PPE were shown by staining of hamster fibroblast cells, where PPE binds selectivelyto fibronectin due to significant electrostatic interactions.4 Recent studies on cell labeling usingpolymers5,6 suggest that conjugated polymers could provide an effective platform for cellsensing, including the detection of cancer cells.
Existing methods for cancer cell detection are in general based on antibody array7,8 and DNAmicroarray9 techniques, and rely on variations in intra- and extracellular protein biomarkersand mutations in genome, respectively. While antibody-based arrays have been quite successful
[email protected]; [email protected] Information Available. Complete Ref. 10, fluorescence titration and unknown samples data. This information is availablefree of charge via the Internet at http://pubs.acs.org/.
NIH Public AccessAuthor ManuscriptJ Am Chem Soc. Author manuscript; available in PMC 2011 January 27.
Published in final edited form as:J Am Chem Soc. 2010 January 27; 132(3): 1018–1022. doi:10.1021/ja9061272.
NIH
-PA Author Manuscript
NIH
-PA Author Manuscript
NIH
-PA Author Manuscript

in early detection of cancers, they require the availability of specific markers for differentcancers, a situation that is not the case with many cancers.10 There is therefore a need for thedevelopment of new biosensor strategies for the detection of cancer cells that can distinguishbetween cell lines based on more subtle differences.
Chemical nose-based sensor array approaches11 that exploit differential receptor-analytebinding interactions provide an alternative to lock-and-key approaches that use specificrecognition processes. “Electronic noses/tongues” have been employed for a wide variety ofanalytes, including metal ions,12 volatile agents,13 aromatic amines,14 amino acids,15
carbohydrates16 and proteins.17 While array approaches are quite useful for detection ofspecific analytes, the sensitivity of these systems to subtle changes in analyte ratios makesthem particularly promising for cell sensing applications, as demonstrated by the use ofnanoparticle-polymer systems to identify bacteria18 and mammalian cell types.19 In thiscontribution, we exploit the environmentally responsive fluorescence of poly(paraphenyleneethynylene)s (PPE) to provide an array-based sensing system (Figure 1) thatcan differentiate between cell types as well as discern cancerous from non-cancerousmammalian cells. In our approach, we use a differential affinity-based approach as opposed tospecific biomarker recognition. The major advantage of this approach is that we do not requireknowledge of specific ligands or receptors to differntiate between cell types and states.
Experimental SectionMaterials and Methods
Polymers P1-P8 were synthesized as reported previously.20 The NT2 cell line was obtainedfrom Prof. R. Thomas Zoeller (Biology Department, University of Massachusetts at Amherst,USA). All the cells were grown in DMEM media supplemented with 10% FBS and 1%antibiotics in T75 flasks at 37 °C in a humidified atmosphere containing 5% CO2. Cells wereregularly passaged by trypsinization with 0.1% trypsin (EDTA 0.02%, dextrose 0.05%, andtrypsin 0.1%) in PBS (pH 7.2).
Cell sensing studiesCells grown in T75 flasks were washed with DPBS buffer, trypsinized with 1X trypsin andcollected in the DMEM media. Cells were spun down, re-suspended in DMEM media (withoutserum proteins/antibiotics) and counted using hemocytometer. The polymers were dissolvedin DPBS buffer (1 ×) to make 100 nM of stock solutions on the basis of their molecular weights.200 μL of each polymer solution in DPBS was loaded into a well on a 96-well plate (300 μLWhatmanR) and the fluorescence intensity values at 465 nm was recorded on a MolecularDevices SpectraMax M5 microplate reader with excitation at 430 nm. 10 μL of cell suspension(5,000 cells) was added to each well. The fluorescence intensity values at 465 nm were recordedagain. The ratio of the final response to initial fluorescence response before and after additionof cells was treated as the fluorescence response. This process was repeated firstly for fourdifferent cancer cell types to generate six replicates of each. We have tested 4 cell types againstthe eight-polymer array (P1-P8) six times, to generate training data matrix of 8 polymers × 4cell types × 6 replicates. Similarly, a training matrix of 8 polymers × 3 cell types × 6 replicateswas generated for three Isogenic cell types. We have used the same volume and concentrationof DMEM media for all cell type experiments under identical conditions. Therefore the changesdue to DMEM media alone would be same for all the experiments.
LDA analysisThe raw data matrix was processed using classical linear discriminant analysis (LDA) inSYSTAT (version 11.0).21,22 In LDA, all variables were used in the model (complete mode)and the tolerance was set as 0.001. The raw fluorescence response patterns were transformed
Bajaj et al. Page 2
J Am Chem Soc. Author manuscript; available in PMC 2011 January 27.
NIH
-PA Author Manuscript
NIH
-PA Author Manuscript
NIH
-PA Author Manuscript
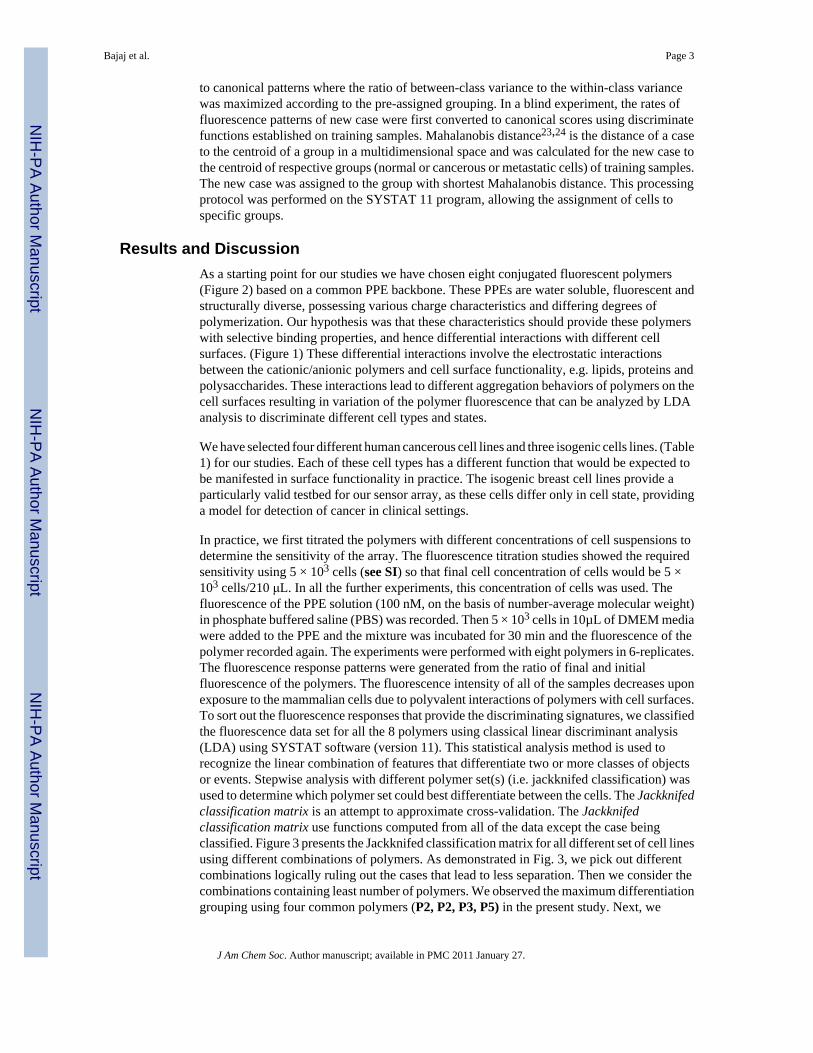
to canonical patterns where the ratio of between-class variance to the within-class variancewas maximized according to the pre-assigned grouping. In a blind experiment, the rates offluorescence patterns of new case were first converted to canonical scores using discriminatefunctions established on training samples. Mahalanobis distance23,24 is the distance of a caseto the centroid of a group in a multidimensional space and was calculated for the new case tothe centroid of respective groups (normal or cancerous or metastatic cells) of training samples.The new case was assigned to the group with shortest Mahalanobis distance. This processingprotocol was performed on the SYSTAT 11 program, allowing the assignment of cells tospecific groups.
Results and DiscussionAs a starting point for our studies we have chosen eight conjugated fluorescent polymers(Figure 2) based on a common PPE backbone. These PPEs are water soluble, fluorescent andstructurally diverse, possessing various charge characteristics and differing degrees ofpolymerization. Our hypothesis was that these characteristics should provide these polymerswith selective binding properties, and hence differential interactions with different cellsurfaces. (Figure 1) These differential interactions involve the electrostatic interactionsbetween the cationic/anionic polymers and cell surface functionality, e.g. lipids, proteins andpolysaccharides. These interactions lead to different aggregation behaviors of polymers on thecell surfaces resulting in variation of the polymer fluorescence that can be analyzed by LDAanalysis to discriminate different cell types and states.
We have selected four different human cancerous cell lines and three isogenic cells lines. (Table1) for our studies. Each of these cell types has a different function that would be expected tobe manifested in surface functionality in practice. The isogenic breast cell lines provide aparticularly valid testbed for our sensor array, as these cells differ only in cell state, providinga model for detection of cancer in clinical settings.
In practice, we first titrated the polymers with different concentrations of cell suspensions todetermine the sensitivity of the array. The fluorescence titration studies showed the requiredsensitivity using 5 × 10³ cells (see SI) so that final cell concentration of cells would be 5 ×10³ cells/210 μL. In all the further experiments, this concentration of cells was used. Thefluorescence of the PPE solution (100 nM, on the basis of number-average molecular weight)in phosphate buffered saline (PBS) was recorded. Then 5 × 10³ cells in 10µL of DMEM mediawere added to the PPE and the mixture was incubated for 30 min and the fluorescence of thepolymer recorded again. The experiments were performed with eight polymers in 6-replicates.The fluorescence response patterns were generated from the ratio of final and initialfluorescence of the polymers. The fluorescence intensity of all of the samples decreases uponexposure to the mammalian cells due to polyvalent interactions of polymers with cell surfaces.To sort out the fluorescence responses that provide the discriminating signatures, we classifiedthe fluorescence data set for all the 8 polymers using classical linear discriminant analysis(LDA) using SYSTAT software (version 11). This statistical analysis method is used torecognize the linear combination of features that differentiate two or more classes of objectsor events. Stepwise analysis with different polymer set(s) (i.e. jackknifed classification) wasused to determine which polymer set could best differentiate between the cells. The Jackknifedclassification matrix is an attempt to approximate cross-validation. The Jackknifedclassification matrix use functions computed from all of the data except the case beingclassified. Figure 3 presents the Jackknifed classification matrix for all different set of cell linesusing different combinations of polymers. As demonstrated in Fig. 3, we pick out differentcombinations logically ruling out the cases that lead to less separation. Then we consider thecombinations containing least number of polymers. We observed the maximum differentiationgrouping using four common polymers (P2, P2, P3, P5) in the present study. Next, we
Bajaj et al. Page 3
J Am Chem Soc. Author manuscript; available in PMC 2011 January 27.
NIH
-PA Author Manuscript
NIH
-PA Author Manuscript
NIH
-PA Author Manuscript

subjected the data obtained from different cancer cell types and isogenic cell to LDA analysisusing these common set of particles to determine the separation within each class (videinfra).
Figure 4a presents the fluorescence response of the four cell lines (HeLa, MCF-7, NT2 andHepG2) to polymers P1, P2, P3, and P5. The LDA analysis converts the patterns of trainingmatrix (4 polymers × 4 cell lines × 6 replicates) to canonical scores. The first three canonicalfactors contain 96.7, 3.0 and 0.3% of variance as shown in Figure 4b. In this plot, each pointrepresents the response pattern for a single cell type to the polymer sensor array. In the canonicalfluorescence response patterns, the different cell types are clustered into four non-overlappinggroups (95% level confidence ellipses) (Figure 4b), indicating the ability of this set of polymersto differentiate between the four different cancer cell types using simple polymer array.
These initial results validate our ability to differentiate cell types phenotypically based on theirsurface properties. A much more challenging goal is to differentiate cells based on cell state,i.e. the differentiation between genetically identical healthy, cancerous, and metastatic cells.To determine the ability of our sensors to detect and identify cancer, we used three cell linesfrom genetically identical BALB/c mice (Table 1). CDBgeo cells were prepared by retroviralinfection with a marker gene encoding the fusion of β-galactosidase and neomycin resistance.These cells exhibit normal outgrowths when transplanted into mammary fat pads. The TD cellswere prepared by treating CDBgeo-cells with 10 ng/mL TGF-β for 14 days,25 withdrawal forfive passages resulted in a persistent epithelial-to-mesenchymal transformation: tumorogenicgrowth resulted when transplanted. The V14 cell line was established from a primary mammarytumor arising in BALB/c-Trp53+/- mice.26 The cells lack p53 protein and form aggressivetumors that are locally invasive in mice. Therefore, CDBgeo and TD cells differ from eachother just a single cell-state transformation. As an example, V14 is different from CDBgeo andTD in just lacking the p53 tumor suppressor gene.
The three cell lines (CDBgeo, TD, and V14) were screened with the eight PPEs; the jackknifedanalysis (Figure 3b) indicates that optimal differentiation (94%) was achieved using the samefour polymers as before, i.e. P1, P2, P3 and P5. Figure 5a shows the fluorescence patternsobtained from four polymers P1, P2, P3 and P5 upon their incubation with isogenic cell types.These patterns were reproducible and subjected to LDA analysis (Figure 5b) generating thetraining matrix of 4 polymers × 3 cell types × 6 replicates with first two factors of 96.3 and3.7% of variance respectively with 94% accuracy. Therefore, using this array based approachwe can discriminate the subtle changes between different cell states, providing a model forcancer detection in clinical applications.
The robustness of the polymer array system was tested using unknowns generated from thethree isogenic cell lines. The fluorescence response patterns generated were subjected to LDAanalysis. During LDA, the cell types were classified to the groups generated through thetraining matrix according to their shortest Mahalonobis distances to respective groups. In thesestudies we observed 80% accuracy of unknown samples (19 out of 24).
Analysis of the combined results indicates that four polymers (P1, P2, P3 and P5) out of theoriginal eight can distinguish different mammalian cells effectively. Of the four polymersP1-4 are cationic and would hence be expected to interact with the negatively charged cellmembrane. Significantly, polymer length is important, as P3 and P4 have the same structure,but only the longer P3 was effective at differentiation, suggesting that polyvalency is animportant consideration in differentiation. Polymers P5-8 are anionic in nature, and theirinteraction with the cells is not clear. It is worth noting, however, that the least charged anionicpolymer (P5) was most effective at cell differentiation.
Bajaj et al. Page 4
J Am Chem Soc. Author manuscript; available in PMC 2011 January 27.
NIH
-PA Author Manuscript
NIH
-PA Author Manuscript
NIH
-PA Author Manuscript

ConclusionsIn summary, we have developed a conjugated fluorescent polymer PPE-based sensor array anddemonstrated its utility in cell sensing. Using this sensor array, we can distinguish betweenseveral cancer cell types as well as between isogenic healthy, cancerous, and metastatic cellsthat possess the same genetic background. Taken together, these studies provide an effectivesensor for differentiating cell types, as well as provide a potential direction in the creation ofpolymer-based imaging agents and delivery vehicles based on differential cell interactions;and “nose” based polymer sensor arrays are new ways for diagnostic, biophysical and surfacescience processes involving cell surfaces.
Supplementary MaterialRefer to Web version on PubMed Central for supplementary material.
AcknowledgmentsWe thank Professor R. Thomas Zoeller (Biology Department, University of Massachusetts at Amherst, USA) forproviding the NT2cell lines. This work was supported by the NSF Center for Hierarchical Manufacturing at theUniversity of Massachusetts (DMI-0531171), NIH Grants GM077173 (VMR), AI073425, CA095164 and CA105452to DJJ; and Department of Energy Grant DE-FG02-04ER46141 (U.H.F.B., V.M.R.)
References1. Thomas SW, Joly GD, Swager TM. Chem. Rev 2007;107:1339. [PubMed: 17385926]2. McQuade DT, Pullen AE, Swager TM. Chem. Rev 2000;100:2537. [PubMed: 11749295]3. a Yang JS, Swager TM. J. Am. Chem. Soc. 1998;120:11844. b Zhou Q, Swager TM. J. Am. Chem.
Soc 1995;117:12593. c Wang DL, Gong X, Heeger PS, Rininsland F, Bazan GC, Heeger AJ. Proc.Natl. Acad. Sci 2002;99:49. [PubMed: 11756675] d Kim IB, Erdogan B, Wilson JN, Bunz UHF. Chem.Eur. J 2004;10:6247. e Kim IB, Bunz UHF. J. Am. Chem. Soc 2006;128:2818. [PubMed: 16506758]
4. Mcrae RL, Phillips RL, Kim IB, Bunz UHF, Fahrni CJ. J. Am. Chem. Soc 2008;130:7851. [PubMed:18507462]
5. Kim IB, Shin H, Garcia AJ, Bunz UHF. Bioconjugate Chem 2007;18:815.6. Moon JH, McDaniel W, MacLean P, Hancock LE. Angew. Chem. Intl. Ed 2007;46:8223.7. Campagnolo C, Meyers KJ, Ryan T, Atkinson RC, Chen YT, Scanlan MJ, Ritter G, Old LJ, Batt CA.
J. Biochem. Biophys. Methods 2004;61:283. [PubMed: 15571777]8. Wingren C, Borrebaeck CA. Curr. Opin. Biotech 2008;18:55. [PubMed: 18187318]9. Petty RD, Nicolson MC, Kerr KM, Collie-Duguid E, Murray GI. Clin. Cancer Res 2004;10:3237.
[PubMed: 15161676]10. Croswell JM, et al. Ann. Fam. Med 2009;7:212. [PubMed: 19433838]11. a Kim I-B, Han MH, Phillips RL, Samanta B, Rotello VM, Zhang ZJ, Bunz UHF. Chem. Eur. J
2009;15:449. b Wang J, Liu B. Chem. Comm 2009:2284. [PubMed: 19377660] c Li HP, Bazan GC.Adv. Mater 2009;21:964. d Wright AT, Anslyn EV. Chem. Soc. Rev 2006;35:14. [PubMed:16365639]
12. Lee JW, Lee JS, Chang YT. Angew Chem. Int. Ed 2006;45:6485.13. Rakow NA, Suslick KS. Nature 2000;406:710. [PubMed: 10963592]14. Greene NT, Shimizu KD. J. Am. Chem. Soc 2005;127:5695. [PubMed: 15826210]15. Folmer-Andersen JF, Kitamura M, Anslyn EV. J. Am. Chem. Soc 2006;128:5652. [PubMed:
16637629]16. Buryak A, Severin K. J. Am. Chem. Soc 2005;127:3700. [PubMed: 15771496]17. You CC, Miranda OR, Gider B, Ghosh PS, Kim IB, Erdogan B, Krovi SA, Bunz UHF, Rotello VM.
Nat. Nanotechnol 2007;2:318. [PubMed: 18654291]18. Phillips RL, Miranda OR, You CC, Rotello VM, Bunz UHF. Angew Chem. Int. Ed. Engl
2008;47:2590. [PubMed: 18228547]
Bajaj et al. Page 5
J Am Chem Soc. Author manuscript; available in PMC 2011 January 27.
NIH
-PA Author Manuscript
NIH
-PA Author Manuscript
NIH
-PA Author Manuscript

19. Bajaj A, Miranda OR, Kim IB, Phillips RL, Jerry DJ, Bunz UHF, Rotello VM. Proc. Natl. Acad. Sci.U. S. A 2009;106:10912. [PubMed: 19549846]
20. a Kim I-B, Dunkhorst A, Gilbert J, Bunz UHF. Macromolecules 2005;38:4560. b Tan C-Y, PintoMR, Schanze KS. Chem. Commun 2002:446. c Kim I-B, Phillips RL, Bunz UHF. Macromolecules2007;40:5290. d Miranda OR, You C-C, Phillips R, Kim I-K, Ghosh PS, Bunz UHF, Rotello VM.J. Am. Chem. Soc 2007;129:9856. [PubMed: 17658813]
21. SYSTAT11.0 (SystatSoftware, Richmond, CA94804, USA, 2004).22. Jurs PC, Bakken GA, McClelland HE. Chem. Rev 2000;100:2649. [PubMed: 11749299]23. Mahalanobis PC. Proc. Natl. Inst. Sci. India 1936;2:49–55.24. Gnanadesikan R, Kettenring JR. Biometrics 1972;28:81.25. Deugnier MA, Faraldo MM, Teuliere J, Thiery JP, Medina D, Glukhova MA. Dev. Biol 2006;293:414.
[PubMed: 16545360]26. Blackburn AC, McLary SC, Naeem R, Luszcz J, Stockton DW, Donehower LA, Mohammed M,
Mailhes JB, Soferr T, Naber SP, Otis CN, Jerry DJ. Cancer Res 2004;64:5140. [PubMed: 15289317]
Bajaj et al. Page 6
J Am Chem Soc. Author manuscript; available in PMC 2011 January 27.
NIH
-PA Author Manuscript
NIH
-PA Author Manuscript
NIH
-PA Author Manuscript
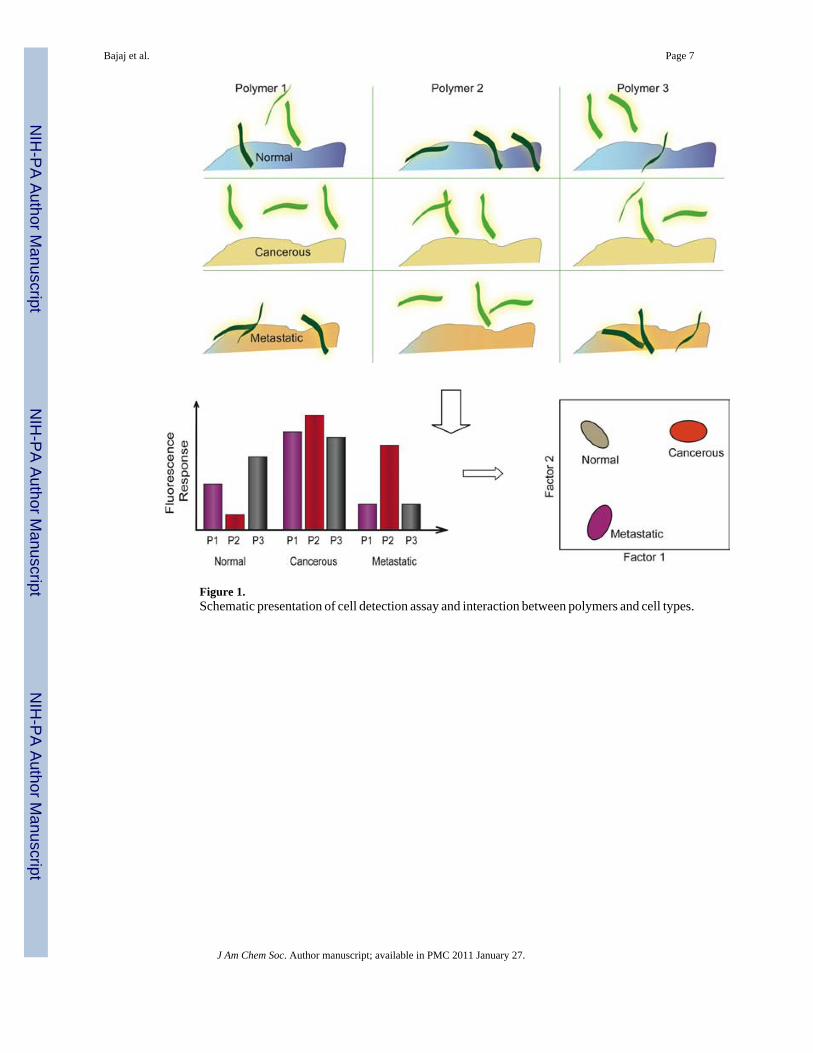
Figure 1.Schematic presentation of cell detection assay and interaction between polymers and cell types.
Bajaj et al. Page 7
J Am Chem Soc. Author manuscript; available in PMC 2011 January 27.
NIH
-PA Author Manuscript
NIH
-PA Author Manuscript
NIH
-PA Author Manuscript
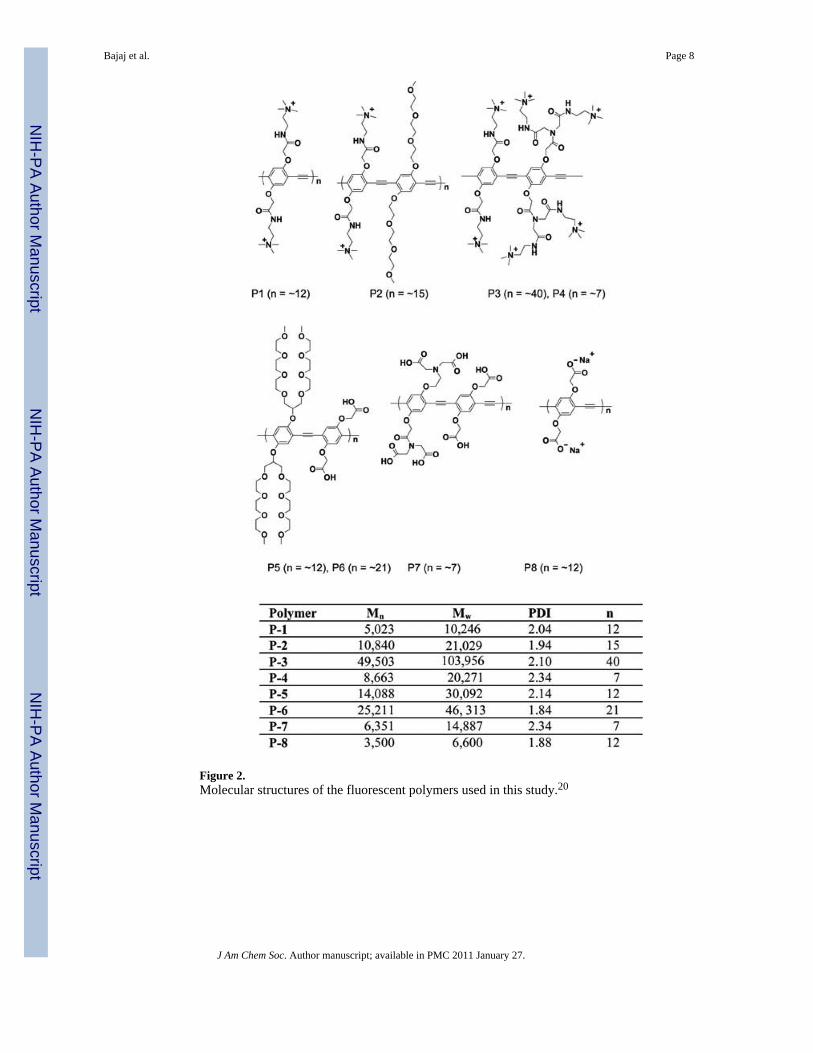
Figure 2.Molecular structures of the fluorescent polymers used in this study.20
Bajaj et al. Page 8
J Am Chem Soc. Author manuscript; available in PMC 2011 January 27.
NIH
-PA Author Manuscript
NIH
-PA Author Manuscript
NIH
-PA Author Manuscript
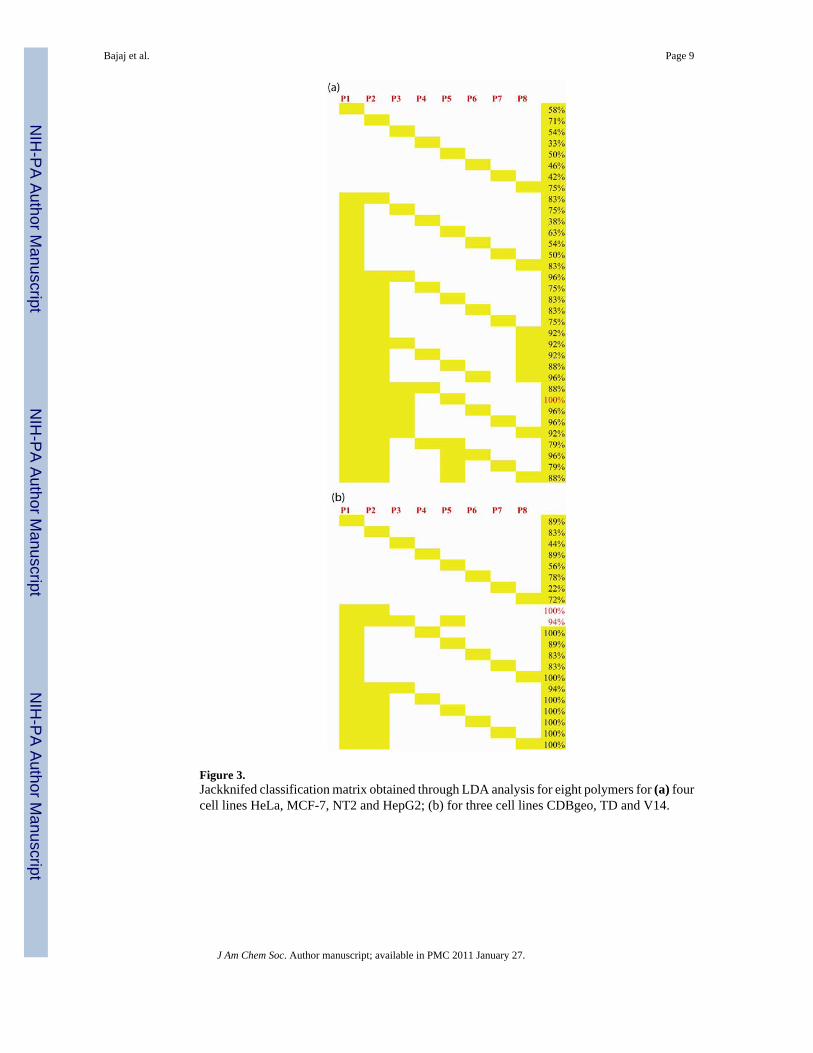
Figure 3.Jackknifed classification matrix obtained through LDA analysis for eight polymers for (a) fourcell lines HeLa, MCF-7, NT2 and HepG2; (b) for three cell lines CDBgeo, TD and V14.
Bajaj et al. Page 9
J Am Chem Soc. Author manuscript; available in PMC 2011 January 27.
NIH
-PA Author Manuscript
NIH
-PA Author Manuscript
NIH
-PA Author Manuscript

Figure 4.(a) Fluorescence responses for four different cancer cell lines HeLa (cervical), MCF7 (breast),HepG2 (liver) and NT2 (testes) using fluorescent polymers. Each value is average of six parallelmeasurements. (b) Canonical score plot for two factors of simplified fluorescence responsepatterns obtained with the fluorescent polymer arrays
Bajaj et al. Page 10
J Am Chem Soc. Author manuscript; available in PMC 2011 January 27.
NIH
-PA Author Manuscript
NIH
-PA Author Manuscript
NIH
-PA Author Manuscript
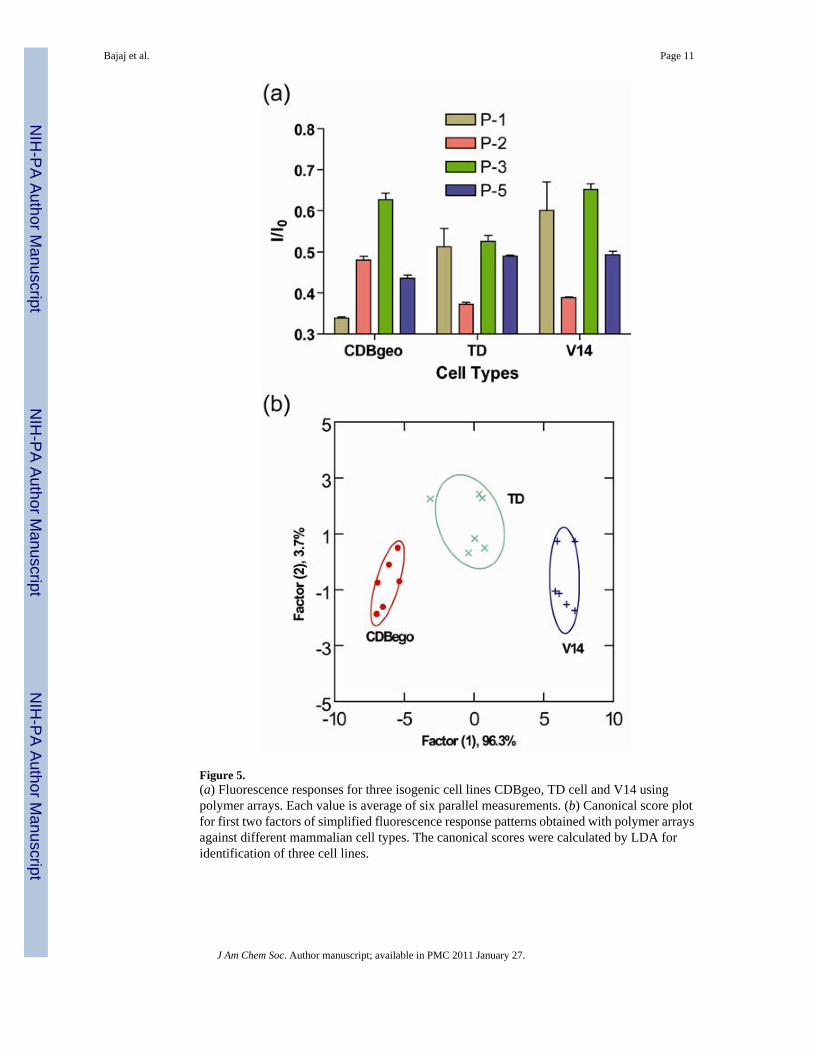
Figure 5.(a) Fluorescence responses for three isogenic cell lines CDBgeo, TD cell and V14 usingpolymer arrays. Each value is average of six parallel measurements. (b) Canonical score plotfor first two factors of simplified fluorescence response patterns obtained with polymer arraysagainst different mammalian cell types. The canonical scores were calculated by LDA foridentification of three cell lines.
Bajaj et al. Page 11
J Am Chem Soc. Author manuscript; available in PMC 2011 January 27.
NIH
-PA Author Manuscript
NIH
-PA Author Manuscript
NIH
-PA Author Manuscript

NIH
-PA Author Manuscript
NIH
-PA Author Manuscript
NIH
-PA Author Manuscript
Bajaj et al. Page 12
Table 1
Origin and nature of the mammalian cell lines used in this study.
Human cell lines Cervix HeLa Cancerous
Brest MCF-7 Cancerous
Liver HepG2 Cancerous
Testis NT2 Cancerous
Mouse cell lines BALB/c mice (Breast) CDBgeo Normal
Immortalized
TD Cancerous
V14 Metastatic
J Am Chem Soc. Author manuscript; available in PMC 2011 January 27.
Copyright © 2022 FDOKUMEN