the cis-trans isomerization of conjugated polyenes ... - PNAS
Upload
khangminh22Category
view
1download
0
Faculteit Bio-ingenieurswetenschappen
Academiejaar 2013 – 2014
The role of conjugated oligoelectrolytes on the
performance of anaerobic microbial strains in microbial
electrosynthesis
Charles Dumolin Promotor: Prof. dr. ir. Korneel Rabaey, Dr. Sunil A. Patil Tutor: Dr. Jan B. A. Arends.
Masterproef voorgedragen tot het behalen van de graad van Master na Master in de Milieusanering en het Milieubeheer


i
Acknowledgements
Time has come to speak a word of gratitude to all the people who helped me
to be able to submit this thesis.
A first word of gratitude I’d like to address to my promotor, professor Rabaey. I would like to
thank you for the opportunity to perform my thesis at LabMET, for the guidance throughout
the year and the generosity of sharing your thoughts on the performed experiments.
In general I like to thank the staff of LabMET. Drinking a coffee in the coffee room or on the
terrace was always nice while spending hours in the lab. A special thanks goes to Jana, who
taught me how to deal with the bugs, was always present with a helping hand and for a joke
in the microbial lab.
I would also like to thank the people of the technology hall. Being the strange one working on
pure cultures was a pleasant job amongst you. Special thanks to Kristof, Kim, Lien, Martin,
Maarten and Daniel.
I would also like to thank my guiding people, Sunil and Jan for helping me throughout the year
on the topic and teaching me the principles of microbial electrosynthesis. Special word of
appreciation on the help you both provided in order to finalize this thesis.
A next word of appreciation is addressed to my parents, my sisters Elise and Hélène for
supporting me through my years of education at the University and providing a welcome
home.
At last, I would like to address my gratitude to my girlfriend, Julie. Thank you for the support
you are giving me, even on my discussion to study for one more year. Hopefully time has come
now to settle ourselves in our new home!
ii
Abstract- Samenvatting Abstract
Microbial bioelectrochemical systems (BESs) are being studied intensively from the beginning
of the past decade, with focus on applications in environmental technology. At the start of
invention, the focus of research aimed mainly on the development of technologies where
microorganisms were used at the anode to generate an electrical current out of wastewater
and other substrates using so called microbial fuel cells (MFCs). Limited power output remains
the overall disadvantage of the MFC application. Later on, the possibility of using
microorganisms as biocatalysts at the cathode of electrochemical cells has attracted
considerable interest. In this concept the microorganisms catalyze the synthesis of high
valuable products from CO2 or organic substrates and electricity, referred to as microbial
electrosynthesis (MES). Implementation of MES from CO2 remains hampered due to a limited
set of known microorganisms capable of direct extracellular electron transport (EET) and
limited knowledge on the energy conserving pathways involved in the process. Most of the
studies are mainly based on gram-negative organisms, as most gram-positive have not shown
a strong capacity for EET thus far. This study tests the hypothesis if an EET mechanism can be
induced/improved in the gram-positive Acetobacterium woodii via the use of conjugated
oligoelectrolytes (COEs), focused on the use of DSSN+ These synthetic molecules merge into
the cell membrane, and possibly initialize an artificial electron shuttle mechanism over the cell
membrane. Similar experiments with the gram-negative bacteria Sporomusa ovata, which has
been reported to use electrons directly from the cathode in MES, are expected to support
these observations. Although previous studies (mainly on the anode) on these COEs suggested
a beneficial effect on the electron transfer capacity, their effect on different organisms is not
straightforward. Different minimal inhibiting concentrations indicate the different impact of
these molecules on the organisms. Where S. ovata was not inhibited up to 25 µM of COEs, A
woodii was clearly inhibited in growth at 5 µM. At a nontoxic concentration (2.5 uM) these
molecules did not induce a direct electron transfer mechanism in A. woodii. Moreover, the
COEs showed a clear negative effect on the proven H2 driven mediated electron uptake
mechanism of A. woodii. Next to this, a negative effect was observed on the proven direct
electron transfer mechanism of S. ovata. The COEs affected the MES performance of the gram-

iii
positive bacteria to a higher degree compared to gram-negative bacteria, also confirmed with
an enriched homoacetogenic mixed culture. The studies on the implementation of COEs in
anodic processes suggested these molecules as an easy method to introduce or enhance
organisms-electrode interactions. However, this study focusing on the implementation of
these molecules at the cathode could not extrapolate the beneficial effect of these molecules
on the electron transfer mechanisms of the 2 gram types of organisms in different modes of
implementation (at autotrophic biocathode).
A second topic in this thesis focuses on the possibility to control carbon fluxes in E. coli
MG1655 by altering the electrode potential. In a state of an overflow of electrons, E. coli
produces acetate. This process is known to limit growth and hamper product formation during
fermentations. By providing an electrode at different potentials, the carbon fluxes to lactate
and acetate, and the effect of COEs on these processes can be assessed. First attempts did not
succeed to alter the production in favor of lactate or acetate. Further optimization of the
research strategy or the reactor configuration are needed the be carried out in order to be
able to control the carbon flux to the favored product in E. coli via the provided electrode
potential.

iv
Samenvatting
Microbiële bio-elektrochemische systemen worden reeds een tiental jaren intensief
bestudeerd, met focus op toepassingen in milieutechnologie. Vroeger richtte het onderzoek
zich vooral tot technologieën waarbij micro-organismen gebruikt werden aan de anode om
elektrische stroom te genereren uit afvalwater en andere substraten. Deze zijn ook gekend als
biobrandstofcellen (BBC). Echter, de beperkte energie output blijkt het grootste struikelblok
van de BBC applicatie. Later trok het idee om micro-organismen als biokatalysatoren aan de
kathode van elektrochemische cellen te gebruiken veel aandacht. Hierbij katalyseren micro-
organismen de synthese van waardevolle producten uit CO2 en organische substraten; men
spreekt van microbiële elektrosynthese (MES). De implementatie van MES uit CO2 wordt
bemoeilijkt door het feit dat er slechts een gelimiteerde set van gekende micro-organismen
bestaat die in staat zijn om rechtstreeks extracellulair elektrontransport uit te voeren.
Bovendien is de kennis van de onderliggende moleculaire mechanismen beperkt. Vroeger
onderzoek is veelal gebaseerd op gram-negatieve bacteriën, omdat de meeste gram-positieve
organismen tot dusver geen sterke transportcapaciteit bezitten. Deze studie zal de hypothese
testen of een extracellulair elektrontransport mechanism kan geïnduceerd/verbeterd worden
in de gram-positieve bacterie Acetobacterium woodii door het gebruik van geconjugeerde
oligo-elektrolyten (COE’s). Deze synthetische moleculen fuseren met het celmembraan en
initiëren mogelijks een artificiële elektronenshuttle overheen het membraan. Uit gelijkaardige
experimenten op de gram-negatieve Sporomusa ovata, waarvan gerapporteerd werd dat deze
rechtstreeks elektronen overdraagt van de kathode, wordt verwacht dat de observaties de
hypothese ondersteunen. Hoewel inderdaad bewezen is dat COE’s een gunstig effect hebben
op de elektrontransfercapaciteit, blijkt dit nog niet evident voor verschillende organismen.
Verschillende minimale inhibitieconcentraties bewijzen dit. Waar S. ovata niet geïnhibeerd
wordt tot 25 µM COE, was duidelijke groei-inhibitie zichtbaar bij A woodii vanaf 5µM. Bij niet-
toxische concentraties (2,5 µM) was de molecule niet in staat om een direct elektrontransfer
mechanisme te induceren in A. woodii. Meer nog, COE’s hadden een negatief effect op de
gekende H2 gemedieerde elektronopname van A. woodii. Eveneens was een negatief effect op
te merken op de elektrontransfer van S. ovata. De observatie op een aangerijkte
homoacetogene gemengde cultuur was dat de MES inhibitie door COE’s de gram-positieve
v
bacteriën het meeste beïnvloedde. Deze studie weerlegt voorlopig vroeger onderzoek dat
stelt dat COE’s een makkelijke methode betekenen om organisme-elektrode interacties te
begunstigen, zeker voor andere organismen in andere setups.
Een tweede luik van de thesis handelt over de mogelijkheid om koolstoffluxes in E. coli
MG1655 te controleren door het elektrode potentiaal aan te passen. Bij elektron overflow,
produceert E.coli acetaat. Dit proces limiteert de groei en hinder productvorming tijdens
fermentatie. Door een elektrode te voorzien bij verschillende potentialen, kunnen de
koolstoffluxes naar lactaat en acetaat geëvalueerd worden, alsook het effect van COE’s op het
proces. Eerste pogingen slaagden er niet in om de productie te wijzigen richting lactaat of
acetaat. Verdere optimalisatie van de reactor configuratie en de onderzoeksstrategie leidde
uiteindelijk tot een beter gecontroleerde koolstofflux tot het gewenste product in E.coli bij
een aangegeven potentiaal.
vi
Table of Contents
Chapter 1: Introduction .......................................................................................................... 1
1. The 21st century shift in energy demands ....................................................................... 1
2. Bioelectrochemical systems ............................................................................................ 2
2.1. Basic mechanism and configuration of BESs ........................................................... 2
2.2. Electron transfer mechanisms in BESs ..................................................................... 3
2.3. Microbial fuel cells ................................................................................................... 7
2.4. Microbial Electrosynthesis ....................................................................................... 8
3. Conjugated oligoelectrolytes ........................................................................................ 11
4. Objectives ...................................................................................................................... 15
Chapter 2: Materials and methods ...................................................................................... 17
1. Conjugated Oligoelectrolytes ........................................................................................ 17
2. Microorganisms and cultivation methods .................................................................... 17
3. Measurements and analyses ......................................................................................... 18
3.1. pH measurement ................................................................................................... 18
3.2. Analysis of cell growth and cell numbers .............................................................. 18
3.3. Analysis of volatile fatty acids ................................................................................ 18
3.4. Microscopy ............................................................................................................. 18
3.5. Gas chromatography .............................................................................................. 19
3.6. Gas flow rate .......................................................................................................... 19
4. Electrochemical techniques .......................................................................................... 20
4.1. Cyclic voltammetry (CV) ......................................................................................... 20
4.2. Chronoamperometry (CA) ..................................................................................... 20
4.3. Chronopotentiometry (CP) .................................................................................... 20

vii
5. Minimal inhibitory concentration (MIC) test ................................................................ 21
5.1. Cell culture and cultivation .................................................................................... 21
6. MES with A. woodii and S. ovata ................................................................................. 22
6.1. Cell culture and inoculum preparation .................................................................. 22
6.2. Reactor setup ......................................................................................................... 22
6.3. Experimental parameters ...................................................................................... 24
7. MES Mixed culture ........................................................................................................ 24
7.1. Cell culture and cultivation .................................................................................... 24
7.2. Reactor setup ......................................................................................................... 24
7.3. Experimental parameters ...................................................................................... 25
8. MES E. coli MG1655 3KO ............................................................................................... 26
8.1. Cell culture and cultivation .................................................................................... 26
8.2. Reactor setup ......................................................................................................... 26
8.3. Experimental parameters ...................................................................................... 26
9. Calculations ................................................................................................................... 28
9.1. Standard deviation ................................................................................................. 28
9.2. Growth rate ............................................................................................................ 28
9.3. Coulombic efficiency .............................................................................................. 28
Chapter 3: Results ................................................................................................................ 29
1. Toxicity study: Influence of COEs on cell viability ......................................................... 29
1.1. .Influence of COEs on A. woodii ............................................................................. 29
1.2. Influence of COEs on S. ovata ................................................................................ 33
1.3. Influence of DSSN+ on E. coli MG 1655 .................................................................. 35
2. Performances of COE treated microbes in autotrophic MES........................................ 37
2.1. MES with A. woodii ................................................................................................ 37
2.2. MES with S. ovata .................................................................................................. 43

viii
2.3. ................................................................................................................................ 45
2.4. MES with an enriched mixed homoacetogenic culture ......................................... 46
3. Performance of COEs in heterotrophic BES .................................................................. 49
3.1. Batch 1: with standard concentration of N-sources in medium............................ 49
3.2. Batch 2: with low concentrations of N-source in medium .................................... 52
Chapter 4: Discussion ........................................................................................................... 55
1. Toxicity study: Influence of COEs on cell viability ......................................................... 55
2. Performance of COEs in autotrophic MES .................................................................... 58
2.1. MES with A. woodii ................................................................................................ 59
2.2. MES with S. ovata .................................................................................................. 60
2.3. MES with mixed homoacetogenic culture ............................................................. 61
3. Performance of COEs in heterotrophic BES .................................................................. 62
4. General conclusion ........................................................................................................ 64
ix
List of figures Figure 1: A high level overview of the concepts associated with bioelectrochemical systems (Rabaey et al,
2011) 3
Figure 2 ET mechanisms from electrodes to microorganisms 5
Figure 3: Wood-Ljungdahl pathway (Müller, 2003) 9
Figure 4: Hypothetical model of energy conservation in acetogens. 10
Figure 5: Conjugated oligoelectrolyte 13
Figure 6: Overview scheme of research strategy. 16
Figure 7: Reactor setup used for MES experiments with A. woodii and S. ovata: 23
Figure 8: Schematic overview of the reactor setup used for MES with a mixed homoacetogenic culture. 25
Figure 9: Reactor setup used for experiments with E. coli MG1655 3KO: 27
Figure 10: Influence of COEs on the growth and the VFA production profiles of A. woodii: 31
Figure 11: Microscopic analysis of incorporation of COEs in A. woodii. 32
Figure 12: Influence of COEs on S. ovata 34
Figure 13: Anaerobic growth curves E. coli WT and 3KO: 35
Figure 14: Influence of DSSN+ on E. coli 3KO 36
Figure 15: MES with A. woodii at fixed potential of -600 mV vs. Ag/AgCl (3M KCl) 39
Figure 16: MES with A. woodii at -0.6 V and -1 V vs. Ag/AgCl (3M KCl) 40
Figure 17: MES with A. woodii at -0.6 V and -1 V vs. Ag/AgCl (3M KCl) 41
Figure 18 MES with S. ovata at -0.6 V and -1 V vs. Ag/AgCl (3M KCl 43
Figure 19: MES with S. ovata at -0.6 V and -1 V vs. Ag/AgCl (3M KCl) 45
Figure 20 MES with an enriched homoacetogenic culture at a fixed current of-5 A m-2: 46
Figure 21: Microscopic analyses of influence of COEs on mixed homoacetogenic culture 48
Figure 22: Production of metabolites by non-stained and COE-stained E. coli 3KO at different applied
potentials. 50
Figure 23: Electrochemical analysis of first batch experiments with E coli 3KO 51
Figure 24: Production of metabolites by non-stained and COE-stained E. coli 3KO at different applied
potentials 53
Figure 25: Electrochemical analysis of second batch experiment with E coli 3KO: 54
Figure 26: Chemical structures of : A) MP196 and MP276, B) DSSN+ and DSBN (Wenzel et al, 2014; Garner et
al, 2010b) 58

x
List of tables
Table 1: Overview concentration range of COE tested in MIC tests ................................................................ 21
Tabel 2: Experimental parameter settings for MES with A. woodii and S. ovata............................................. 24
Table 3 : Experimental parameter settings: E. coli 3KO .................................................................................. 26
xi
List of abbreviations
3KO Triple knock out
Ag/AgCl Silver/ Silverchloride
BES Bioelectrochemical systems
CA Chrono amperometry
COE Conjugated oligoelectrolytes
CP Chrono potentiometry
CV Cyclic voltammetry
CVs cyclicvoltammograms
d day
DET Direct electron transfer
DSSN+ 4,4′-bis(4′-(N,N-bis(6′′-(N,N,N-trimethylammonium)hexyl)amino)-
styryl)stilbene tetraiodide
EAB Electrochemically active bacteria
Ean Potential of the anode
Ecat Potential of the cathode
EDTA Ethylenediaminetetraacetic Acid
GHG Greenhouse gas
HA Homoacetogen
IPCC Intergovernmental Panel on Climate Change
MEC Microbial Electrolysis Cell
MES Microbial Electrosynthesis
MFC Microbial Fuel Cell
MRC Microbial Remediation Cells
xii
MSC Microbial Solar Cell
PQQ Pyrroloquinoline quinone
RE Renewable energy
SHE Standard Hydrogen Electrode
SRB Sulphate reducing bacteria
t Time
TW Terrawatt
VFA Volatile fatty acids

1
Chapter 1: Introduction
1. The 21st century shift in energy demands
Over the last decades the use of energy and their sources became an issue of great interest.
Energy demands started to increase at the beginning of the industrial revolution (late 18the
century). Despite the technological evolution to a more efficient energy usage, yearly energy
demand has been estimated to increase to 27,0 terawatt (TW) by 2050 (Caspeta et al, 2013).
The energy production is estimated to stand for 83% of the total greenhouse gas (GHG)
emissions. As for CO2, the major GHG, the emission increased from nearly zero to 31 Gt CO2
by 2011 (IEA, 2013a). This increase in atmospheric CO2 concentrations is now proved to be
directly linked to climate changes observed over the past century (IPCC, 2013). To counter the
effect of CO2 on global warming and in order to reach the CO2 emission targets the
Intergovernmental Panel on Climate Change (IPCC) stated that 12 TWy-1 of energy needs to
be produced from carbon neutral fuels by 2050 (IPCC, 2013).
To reach this target the IPCC recommends to switch to renewable energy (RE) sources like
direct solar energy, geothermal energy, hydropower and ocean energy (IPCC, 2012). These
sources/techniques have in common the potential to produce sustainable electric energy. On
a global basis, the contribution of RE counts for 12.9% of the total energy supply (492
exajoules) in 2008 (IEA, 2013b). State of the art RE sources such as wind and solar energy
started to be implemented in the energy production of developed countries. with respective
gain in global cumulative installed capacity of 32% and 53% in 2009 (IPCC, 2012). A trend
driven by the financial support, these techniques gain from the governments leading to
decline in technological costs and changes in prices of fossil fuels (IPCC, 2012). However, the
switch to RE sources has their own limitations. The increased demand of these RE sources has
already shown that current technologies can rarely provide immediate response to demand
as these sources do not deliver a regular supply easily adjustable to consumption needs. Here,
the main bottleneck in the management of energy lies with the lack of versatile and easily
applicable energy storage mechanisms (Ibrahim et al, 2008; Hall & Bain, 2008).
2
2. Bioelectrochemical systems
Over the past decade, a rapidly growing sustainable energy production technology has been
developed, the platform of bioelectrochemical systems (BESs). This field of research combines
microbiology, electrochemistry, materials science, engineering to several interdisciplinary
techniques. At the first thought this technology offers an integrated solution for both waste
water treatment and energy or resource recovery (Logan et al, 2006). BESs are divided into
different sub-platforms each with specific applications. Some examples include: Microbial Fuel
Cells (MFCs), Microbial Electrolysis Cells (MECs), Microbial Electrosynthesis (MES), Microbial
Solar Cells (MSCs), Microbial Remediation Cells (MRCs). Two important BES types, MFCs and
MES, are discussed further below.
2.1. Basic mechanism and configuration of BESs
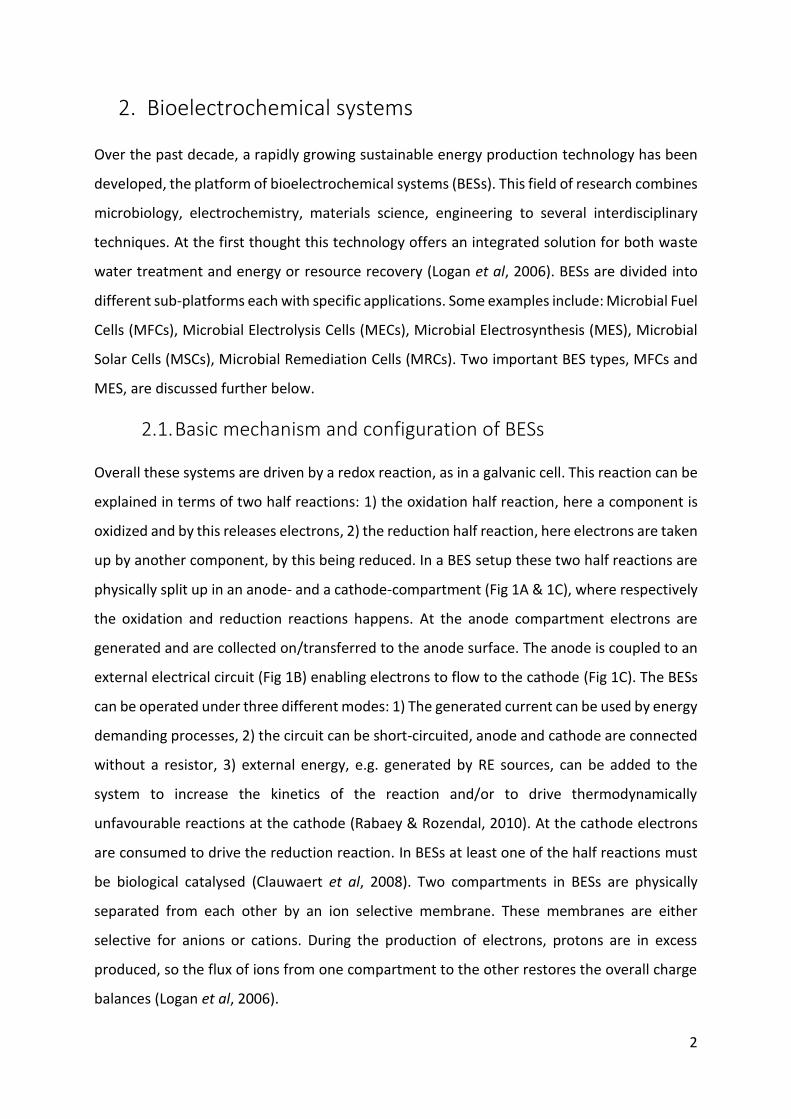
Overall these systems are driven by a redox reaction, as in a galvanic cell. This reaction can be
explained in terms of two half reactions: 1) the oxidation half reaction, here a component is
oxidized and by this releases electrons, 2) the reduction half reaction, here electrons are taken
up by another component, by this being reduced. In a BES setup these two half reactions are
physically split up in an anode- and a cathode-compartment (Fig 1A & 1C), where respectively
the oxidation and reduction reactions happens. At the anode compartment electrons are
generated and are collected on/transferred to the anode surface. The anode is coupled to an
external electrical circuit (Fig 1B) enabling electrons to flow to the cathode (Fig 1C). The BESs
can be operated under three different modes: 1) The generated current can be used by energy
demanding processes, 2) the circuit can be short-circuited, anode and cathode are connected
without a resistor, 3) external energy, e.g. generated by RE sources, can be added to the
system to increase the kinetics of the reaction and/or to drive thermodynamically
unfavourable reactions at the cathode (Rabaey & Rozendal, 2010). At the cathode electrons
are consumed to drive the reduction reaction. In BESs at least one of the half reactions must
be biological catalysed (Clauwaert et al, 2008). Two compartments in BESs are physically
separated from each other by an ion selective membrane. These membranes are either
selective for anions or cations. During the production of electrons, protons are in excess
produced, so the flux of ions from one compartment to the other restores the overall charge
balances (Logan et al, 2006).
3
2.2. Electron transfer mechanisms in BESs
Overall the important factors that affect the BES performances are situated at the level of the
microorganisms, the electrodes and the electron flow between them. In BESs, bioanode
electron transfer mechanisms are well studied and understood (Patil et al, 2012). Although
now a days the focus in BES research has shifted to the biocathode-based platforms, very little
is known on the molecular mechanisms involved in electron transfers from the electrode to
the microorganisms (Rosenbaum et al, 2011; Huang et al, 2011). It has been postulated that
the involved molecular mechanisms for biocathode and bioanode may be related to each
other but the components involved and the potential that they function may be slightly
different. Three main electron transfer mechanisms at biocathode in BESs are explained
below:
A
B
C
Figure 1: A high level overview of the concepts associated with bioelectrochemical systems (Rabaey et al, 2011b)

4
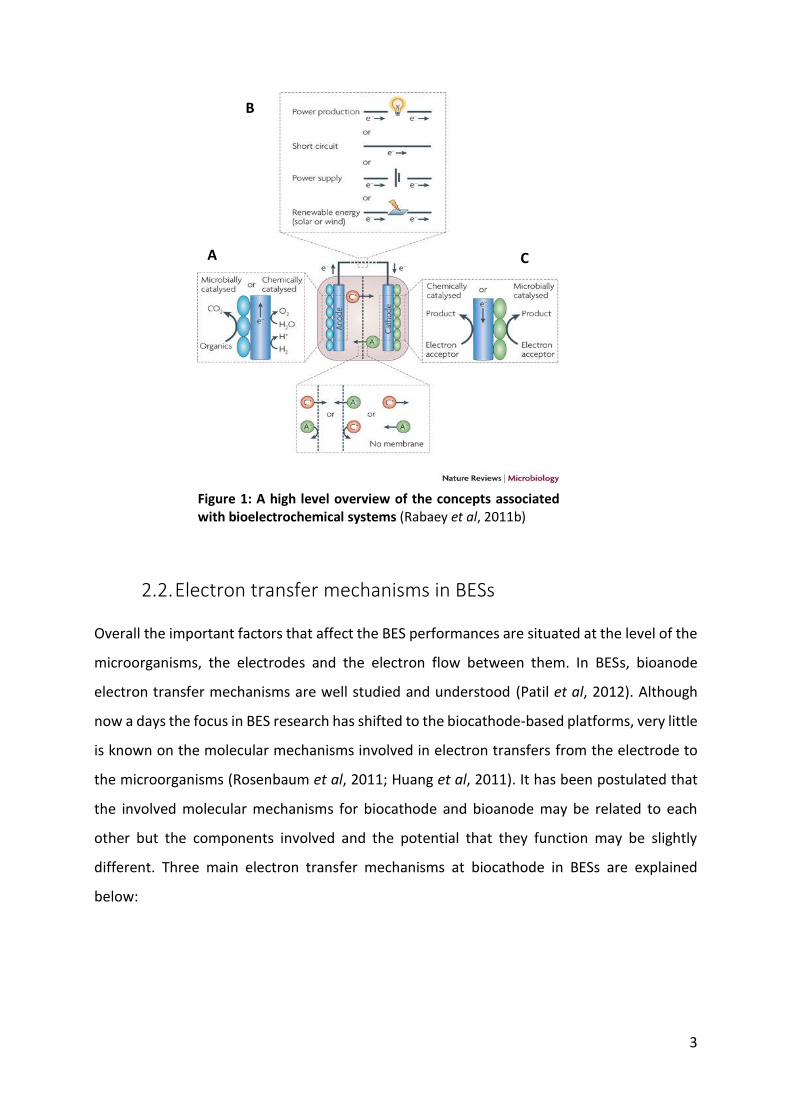
2.2.1. Direct electron transfer
Direct electron transfer (DET) (Fig 2A) mechanisms are well understood at the bioanode and
are represented by two main mechanisms. First, DET can occur via membrane bound
cytochromes. The involvement of terminal reductases are predominantly reported in
Shewanella oneidensis MR1 and Geobacter sulfurreducens (Inoue et al, 2010). It is genetically
determined that G. sulferreducens possesses over 111 different c-type cytochromes, but
several studies suggest that OmcZ is the main c-type cytochrome establishing an
electrochemical communication between the organism and the anode (Richter et al, 2009). At
the cathode it has already been proven that G. sulfurreducens is capable of accepting electrons
from the electrode (Geelhoed et al, 2010; Gregory et al, 2004). Second way of DET is via the
use of electronically conductive pili/nanowires. At the anode the production of these
structures is directly linked to a limited availability of electron acceptors (Gorby et al, 2006;
El-Naggar et al, 2010). These filamentous structures are essential to achieve high current
densities through thick biofilms of G. sulfurreducens. Interestingly in the case of current
consuming G. sulfurreducens at the cathode side, the gene expression for OmcZ and pili are
down regulated. Instead, another mono-heme c-type cytochrome located at the periplasmic
space substitute the direct electron uptake mechanism (Strycharz et al, 2011). Thus far species
like G. metallireducens, G. lovleyi, Anaeroeromoxybater dehalogenanas and
Methanobacterium palustre as well as several acetogenic bacteria as Sporomusa ovata,
Clostridium aceticum, Clostridium ljungdahlii have been reported to accept electrons from the
cathode indicating a DET mechanism to be involved (Gregory et al, 2004; Strycharz et al, 2011,
2010; Cheng et al, 2009; Butler et al, 2010; Nevin et al, 2011)
5
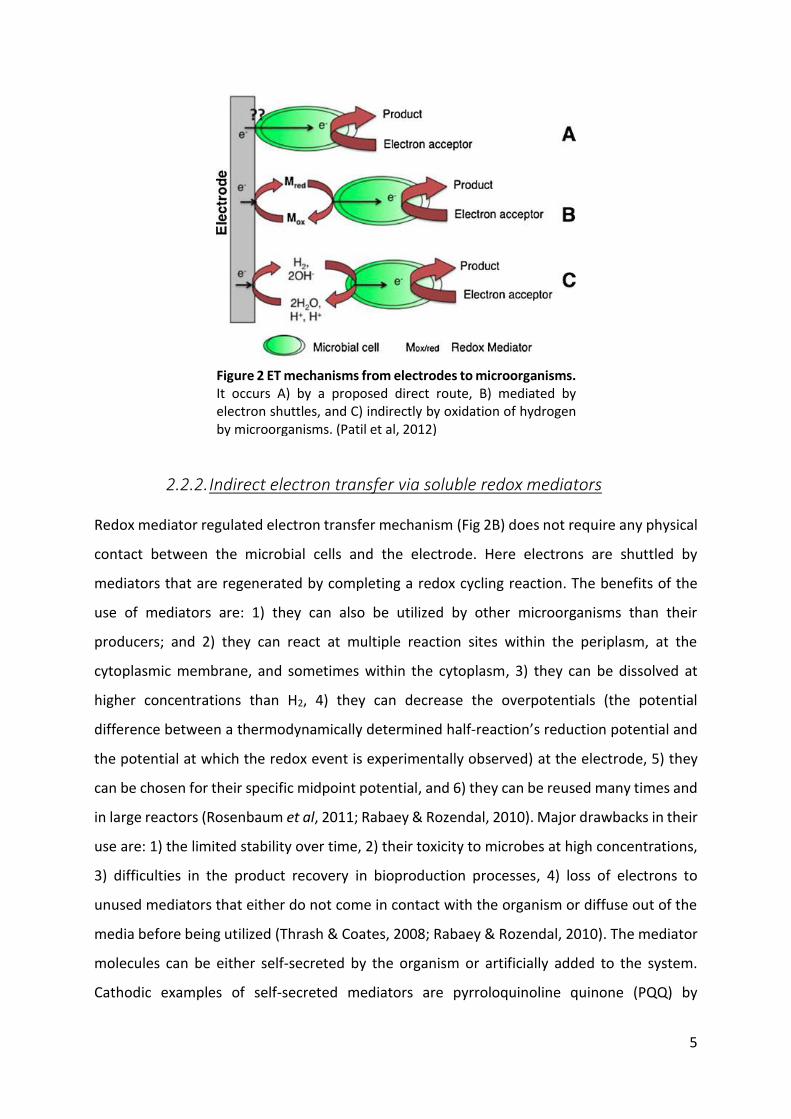
2.2.2. Indirect electron transfer via soluble redox mediators
Redox mediator regulated electron transfer mechanism (Fig 2B) does not require any physical
contact between the microbial cells and the electrode. Here electrons are shuttled by
mediators that are regenerated by completing a redox cycling reaction. The benefits of the
use of mediators are: 1) they can also be utilized by other microorganisms than their
producers; and 2) they can react at multiple reaction sites within the periplasm, at the
cytoplasmic membrane, and sometimes within the cytoplasm, 3) they can be dissolved at
higher concentrations than H2, 4) they can decrease the overpotentials (the potential
difference between a thermodynamically determined half-reaction’s reduction potential and
the potential at which the redox event is experimentally observed) at the electrode, 5) they
can be chosen for their specific midpoint potential, and 6) they can be reused many times and
in large reactors (Rosenbaum et al, 2011; Rabaey & Rozendal, 2010). Major drawbacks in their
use are: 1) the limited stability over time, 2) their toxicity to microbes at high concentrations,
3) difficulties in the product recovery in bioproduction processes, 4) loss of electrons to
unused mediators that either do not come in contact with the organism or diffuse out of the
media before being utilized (Thrash & Coates, 2008; Rabaey & Rozendal, 2010). The mediator
molecules can be either self-secreted by the organism or artificially added to the system.
Cathodic examples of self-secreted mediators are pyrroloquinoline quinone (PQQ) by
Figure 2 ET mechanisms from electrodes to microorganisms. It occurs A) by a proposed direct route, B) mediated by electron shuttles, and C) indirectly by oxidation of hydrogen by microorganisms. (Patil et al, 2012)
6
Acinebacter calcoaceticus, flavin-type mediators by S. oneidensis, heme-containing proteins
and individual purine and pyrimidine bases (Freguia et al, 2010; Rabaey et al, 2005; Marsili et
al, 2008). Artificial electron shuttles that are frequently used include 2;4-anthraquinone
disulfonate (AQDS), neutral red, methyl viologen and cobalt sepulchrate(Rosenbaum et al,
2011)
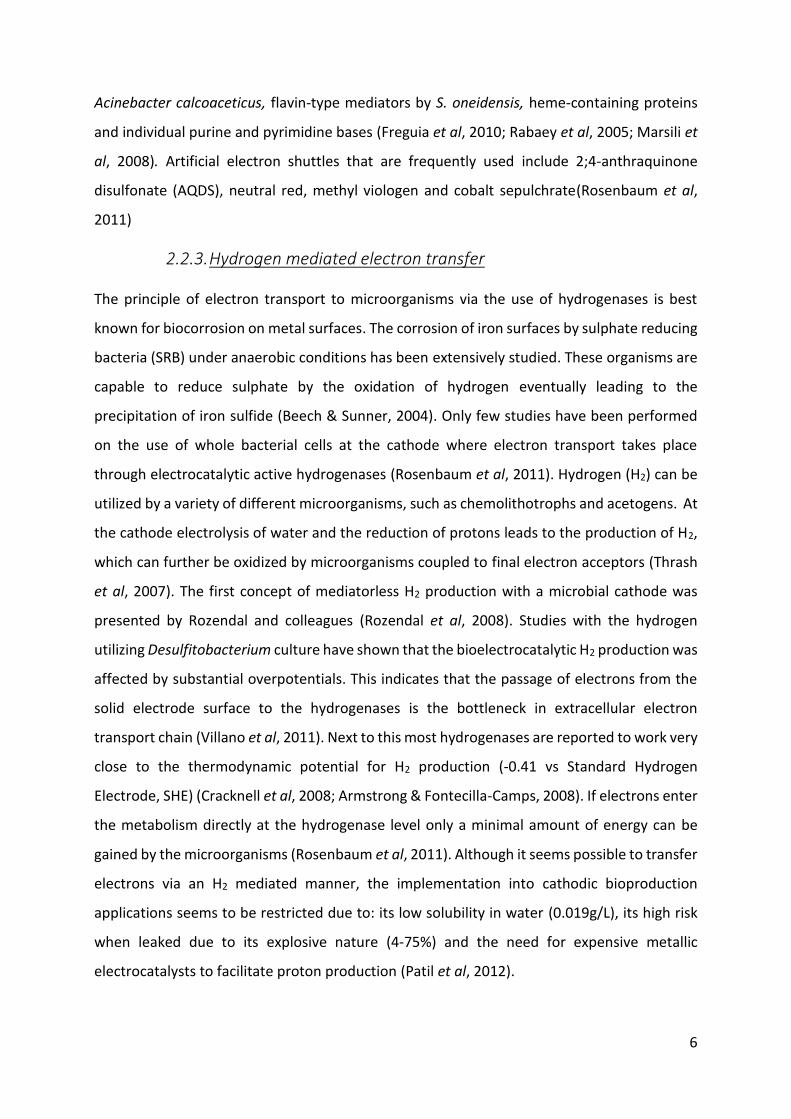
2.2.3. Hydrogen mediated electron transfer
The principle of electron transport to microorganisms via the use of hydrogenases is best
known for biocorrosion on metal surfaces. The corrosion of iron surfaces by sulphate reducing
bacteria (SRB) under anaerobic conditions has been extensively studied. These organisms are
capable to reduce sulphate by the oxidation of hydrogen eventually leading to the
precipitation of iron sulfide (Beech & Sunner, 2004). Only few studies have been performed
on the use of whole bacterial cells at the cathode where electron transport takes place
through electrocatalytic active hydrogenases (Rosenbaum et al, 2011). Hydrogen (H2) can be
utilized by a variety of different microorganisms, such as chemolithotrophs and acetogens. At
the cathode electrolysis of water and the reduction of protons leads to the production of H2,
which can further be oxidized by microorganisms coupled to final electron acceptors (Thrash
et al, 2007). The first concept of mediatorless H2 production with a microbial cathode was
presented by Rozendal and colleagues (Rozendal et al, 2008). Studies with the hydrogen
utilizing Desulfitobacterium culture have shown that the bioelectrocatalytic H2 production was
affected by substantial overpotentials. This indicates that the passage of electrons from the
solid electrode surface to the hydrogenases is the bottleneck in extracellular electron
transport chain (Villano et al, 2011). Next to this most hydrogenases are reported to work very
close to the thermodynamic potential for H2 production (-0.41 vs Standard Hydrogen
Electrode, SHE) (Cracknell et al, 2008; Armstrong & Fontecilla-Camps, 2008). If electrons enter
the metabolism directly at the hydrogenase level only a minimal amount of energy can be
gained by the microorganisms (Rosenbaum et al, 2011). Although it seems possible to transfer
electrons via an H2 mediated manner, the implementation into cathodic bioproduction
applications seems to be restricted due to: its low solubility in water (0.019g/L), its high risk
when leaked due to its explosive nature (4-75%) and the need for expensive metallic
electrocatalysts to facilitate proton production (Patil et al, 2012).
7
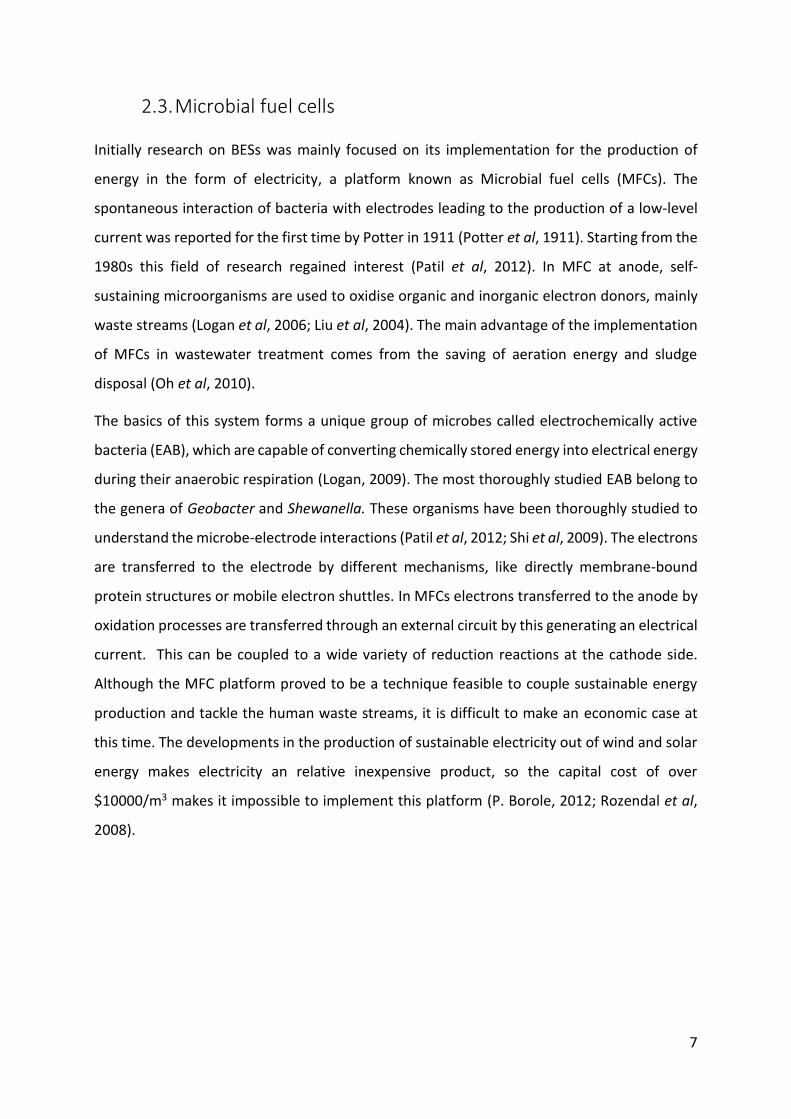
2.3. Microbial fuel cells
Initially research on BESs was mainly focused on its implementation for the production of
energy in the form of electricity, a platform known as Microbial fuel cells (MFCs). The
spontaneous interaction of bacteria with electrodes leading to the production of a low-level
current was reported for the first time by Potter in 1911 (Potter et al, 1911). Starting from the
1980s this field of research regained interest (Patil et al, 2012). In MFC at anode, self-
sustaining microorganisms are used to oxidise organic and inorganic electron donors, mainly
waste streams (Logan et al, 2006; Liu et al, 2004). The main advantage of the implementation
of MFCs in wastewater treatment comes from the saving of aeration energy and sludge
disposal (Oh et al, 2010).
The basics of this system forms a unique group of microbes called electrochemically active
bacteria (EAB), which are capable of converting chemically stored energy into electrical energy
during their anaerobic respiration (Logan, 2009). The most thoroughly studied EAB belong to
the genera of Geobacter and Shewanella. These organisms have been thoroughly studied to
understand the microbe-electrode interactions (Patil et al, 2012; Shi et al, 2009). The electrons
are transferred to the electrode by different mechanisms, like directly membrane-bound
protein structures or mobile electron shuttles. In MFCs electrons transferred to the anode by
oxidation processes are transferred through an external circuit by this generating an electrical
current. This can be coupled to a wide variety of reduction reactions at the cathode side.
Although the MFC platform proved to be a technique feasible to couple sustainable energy
production and tackle the human waste streams, it is difficult to make an economic case at
this time. The developments in the production of sustainable electricity out of wind and solar
energy makes electricity an relative inexpensive product, so the capital cost of over
$10000/m3 makes it impossible to implement this platform (P. Borole, 2012; Rozendal et al,
2008).
8
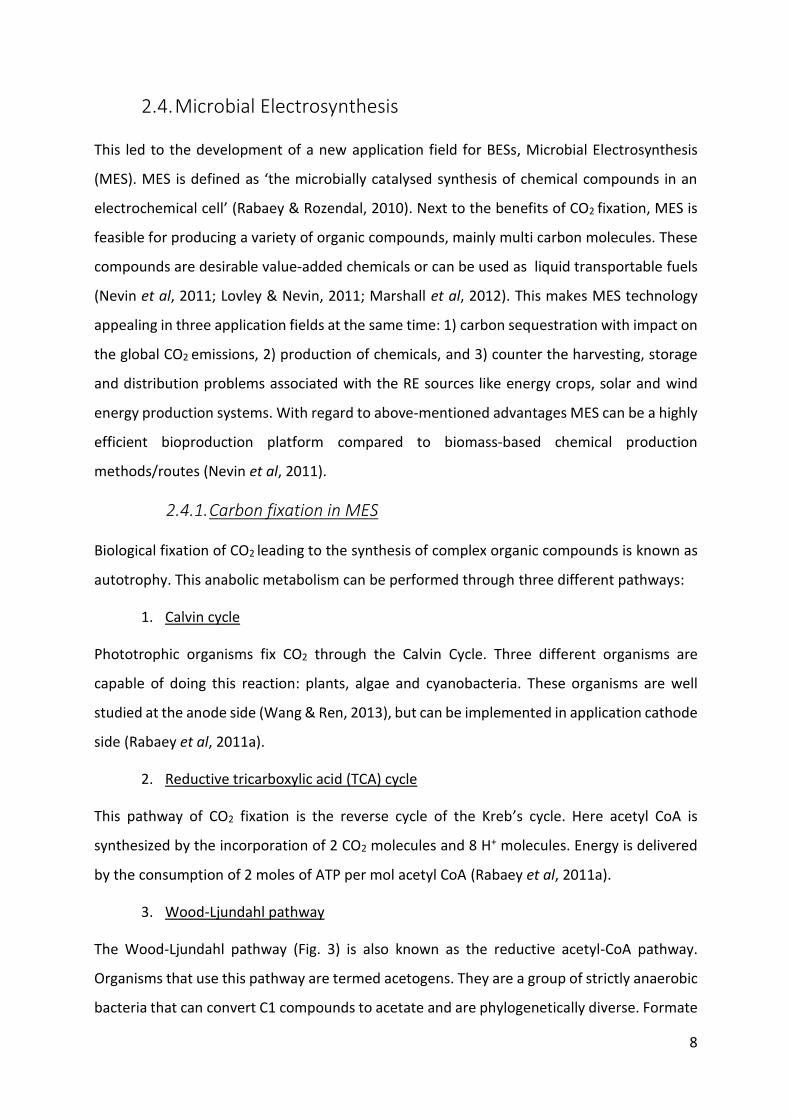
2.4. Microbial Electrosynthesis
This led to the development of a new application field for BESs, Microbial Electrosynthesis
(MES). MES is defined as ‘the microbially catalysed synthesis of chemical compounds in an
electrochemical cell’ (Rabaey & Rozendal, 2010). Next to the benefits of CO2 fixation, MES is
feasible for producing a variety of organic compounds, mainly multi carbon molecules. These
compounds are desirable value-added chemicals or can be used as liquid transportable fuels
(Nevin et al, 2011; Lovley & Nevin, 2011; Marshall et al, 2012). This makes MES technology
appealing in three application fields at the same time: 1) carbon sequestration with impact on
the global CO2 emissions, 2) production of chemicals, and 3) counter the harvesting, storage
and distribution problems associated with the RE sources like energy crops, solar and wind
energy production systems. With regard to above-mentioned advantages MES can be a highly
efficient bioproduction platform compared to biomass-based chemical production
methods/routes (Nevin et al, 2011).
2.4.1. Carbon fixation in MES
Biological fixation of CO2 leading to the synthesis of complex organic compounds is known as
autotrophy. This anabolic metabolism can be performed through three different pathways:
1. Calvin cycle
Phototrophic organisms fix CO2 through the Calvin Cycle. Three different organisms are
capable of doing this reaction: plants, algae and cyanobacteria. These organisms are well
studied at the anode side (Wang & Ren, 2013), but can be implemented in application cathode
side (Rabaey et al, 2011a).
2. Reductive tricarboxylic acid (TCA) cycle
This pathway of CO2 fixation is the reverse cycle of the Kreb’s cycle. Here acetyl CoA is
synthesized by the incorporation of 2 CO2 molecules and 8 H+ molecules. Energy is delivered
by the consumption of 2 moles of ATP per mol acetyl CoA (Rabaey et al, 2011a).
3. Wood-Ljundahl pathway
The Wood-Ljundahl pathway (Fig. 3) is also known as the reductive acetyl-CoA pathway.
Organisms that use this pathway are termed acetogens. They are a group of strictly anaerobic
bacteria that can convert C1 compounds to acetate and are phylogenetically diverse. Formate

9
dehydrogenase is the first enzyme of the pathway that is responsible for the fixation of HCO3
to enter the pathway. The energetics of this pathway are quite interesting, 1 mole of ATP is
produced by substrate level phosphorylation (SLP) in the acetate kinase reaction. But this is
again consumed at the formyl tetrahydrofolaat (formyl H4F) synthase reaction. So the net
production of ATP is zero which implicates that these organisms are totally dependent on the
production of ATP via ion gradient-driven phosphorylation driven mechanisms (Müller, 2003).
For MES application aimed at the production of value added chemicals, the use of acetogenic
bacteria for CO2 fixation pathway seems the most promising strategy. The finding that the
acetogenic bacteria Sporomusa ovata could use electrons derived from graphite electrodes
provided the proof of concept that it is possible to convert CO2 and water to extracellular,
multicarbon products with electricity as the energy source (Nevin et al, 2010a). Acetogenic
bacteria are used as model organism for de novo MES of organic compounds.
The use of the Wood-Ljungdahl pathway in MES has several advantages relative to the other
pathways described. This pathway is the most enegeticaally efficient known pahway for the
reduction of CO2 to organic compounds with H2 as electron donor. Next to this the Wood-
Ljungdahl pathway is also the only autotrophic carbon fixation pathway that can be coupled
with energy conservation, as a form of respiration. The energy yield of the pathway is low,
95% of the carbon and electron flow during H2 oxidation is used in the production of small
organic endproducts excreted from the cell rather than production of biomass (Lovley &
Nevin, 2013) .
Figure 3: Wood-Ljungdahl pathway (Müller, 2003)

10
2.4.2. Energy conserving mechanisms
In MES the energy conservation is mainly determined by the length of the electron transport
chain and the energy conserving mechanisms that are present (Desloover et al, 2012). To our
current knowledge only three energy conserving mechanisms are identified between all
known homoacetogens:
1) Formation of an H+ gradient over the cell membrane by means of cytochromes and
quinones and subsequent ATP formation by means of an H+- dependent ATPase. (Fout!
erwijzingsbron niet gevonden.,
2) Formation of an Na+ gradient and ATP generation by an Na+-dependent ATPase (Fout!
erwijzingsbron niet gevonden.,
3) Formation of a gradient via an RNF complex and the ATP generation by means of an H+
dependent ATPase.
To ensure that acetogenic bacteria can be successfully implemented in MES applications it is
clear that these energy mechanisms have to be well understood. They fulfil a crucial link in the
conversion of electrical energy put into the system towards the final high-energy containing
products. Optimisation of the electron flow from the electrode into the microorganisms may
be one of the most challenging parameters to obtain a successful MES system.
Figure 4: Hypothetical model of energy conservation in acetogens. (A) H-organisms; (B) Na-organisms (Müller, 2003)
11
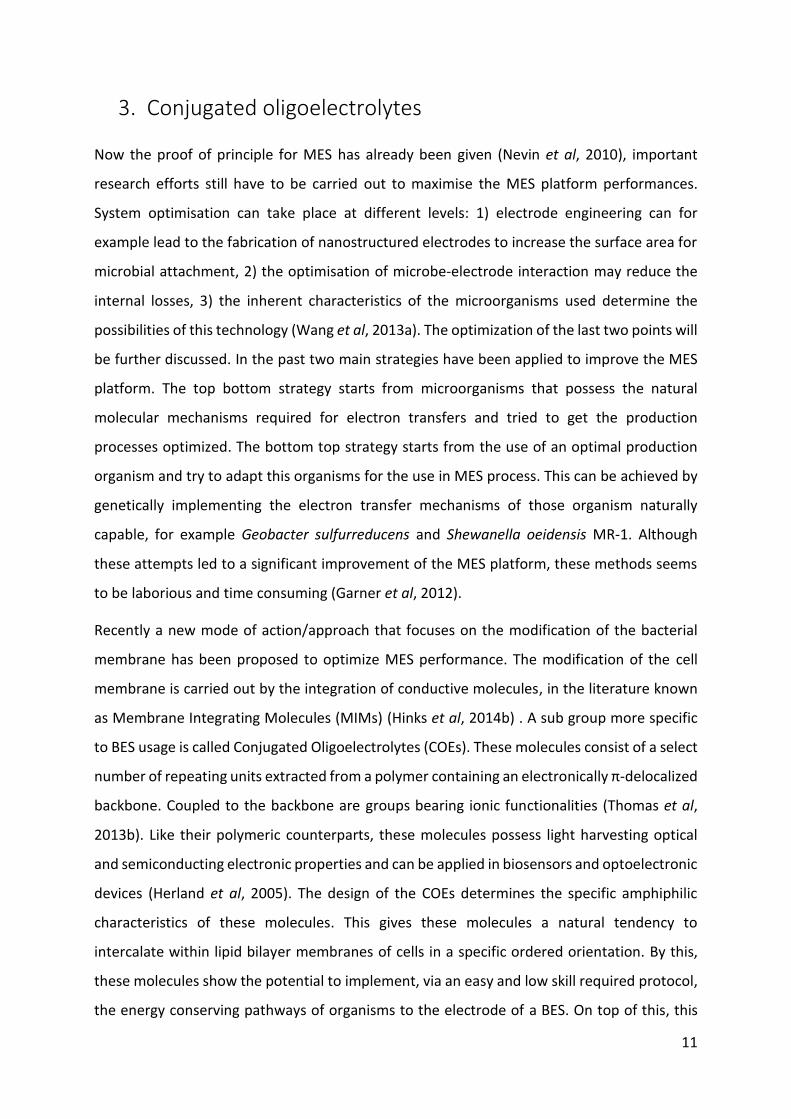
3. Conjugated oligoelectrolytes
Now the proof of principle for MES has already been given (Nevin et al, 2010), important
research efforts still have to be carried out to maximise the MES platform performances.
System optimisation can take place at different levels: 1) electrode engineering can for
example lead to the fabrication of nanostructured electrodes to increase the surface area for
microbial attachment, 2) the optimisation of microbe-electrode interaction may reduce the
internal losses, 3) the inherent characteristics of the microorganisms used determine the
possibilities of this technology (Wang et al, 2013a). The optimization of the last two points will
be further discussed. In the past two main strategies have been applied to improve the MES
platform. The top bottom strategy starts from microorganisms that possess the natural
molecular mechanisms required for electron transfers and tried to get the production
processes optimized. The bottom top strategy starts from the use of an optimal production
organism and try to adapt this organisms for the use in MES process. This can be achieved by
genetically implementing the electron transfer mechanisms of those organism naturally
capable, for example Geobacter sulfurreducens and Shewanella oeidensis MR-1. Although
these attempts led to a significant improvement of the MES platform, these methods seems
to be laborious and time consuming (Garner et al, 2012).
Recently a new mode of action/approach that focuses on the modification of the bacterial
membrane has been proposed to optimize MES performance. The modification of the cell
membrane is carried out by the integration of conductive molecules, in the literature known
as Membrane Integrating Molecules (MIMs) (Hinks et al, 2014b) . A sub group more specific
to BES usage is called Conjugated Oligoelectrolytes (COEs). These molecules consist of a select
number of repeating units extracted from a polymer containing an electronically π-delocalized
backbone. Coupled to the backbone are groups bearing ionic functionalities (Thomas et al,
2013b). Like their polymeric counterparts, these molecules possess light harvesting optical
and semiconducting electronic properties and can be applied in biosensors and optoelectronic
devices (Herland et al, 2005). The design of the COEs determines the specific amphiphilic
characteristics of these molecules. This gives these molecules a natural tendency to
intercalate within lipid bilayer membranes of cells in a specific ordered orientation. By this,
these molecules show the potential to implement, via an easy and low skill required protocol,
the energy conserving pathways of organisms to the electrode of a BES. On top of this, this
12
method is thought to be applicable to every microorganism of interest, as they all possess a
lipid bilayer membrane.
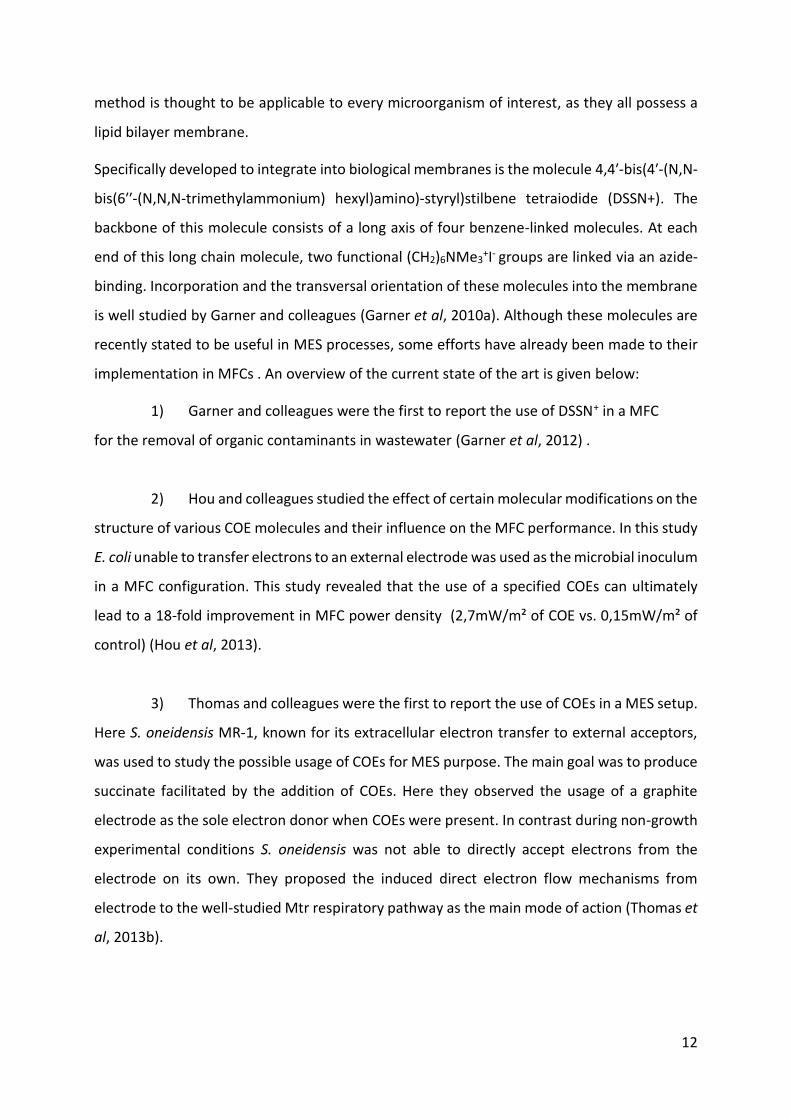
Specifically developed to integrate into biological membranes is the molecule 4,4′-bis(4′-(N,N-
bis(6′′-(N,N,N-trimethylammonium) hexyl)amino)-styryl)stilbene tetraiodide (DSSN+). The
backbone of this molecule consists of a long axis of four benzene-linked molecules. At each
end of this long chain molecule, two functional (CH2)6NMe3+I- groups are linked via an azide-
binding. Incorporation and the transversal orientation of these molecules into the membrane
is well studied by Garner and colleagues (Garner et al, 2010a). Although these molecules are
recently stated to be useful in MES processes, some efforts have already been made to their
implementation in MFCs . An overview of the current state of the art is given below:
1) Garner and colleagues were the first to report the use of DSSN+ in a MFC
for the removal of organic contaminants in wastewater (Garner et al, 2012) .
2) Hou and colleagues studied the effect of certain molecular modifications on the
structure of various COE molecules and their influence on the MFC performance. In this study
E. coli unable to transfer electrons to an external electrode was used as the microbial inoculum
in a MFC configuration. This study revealed that the use of a specified COEs can ultimately
lead to a 18-fold improvement in MFC power density (2,7mW/m² of COE vs. 0,15mW/m² of
control) (Hou et al, 2013).
3) Thomas and colleagues were the first to report the use of COEs in a MES setup.
Here S. oneidensis MR-1, known for its extracellular electron transfer to external acceptors,
was used to study the possible usage of COEs for MES purpose. The main goal was to produce
succinate facilitated by the addition of COEs. Here they observed the usage of a graphite
electrode as the sole electron donor when COEs were present. In contrast during non-growth
experimental conditions S. oneidensis was not able to directly accept electrons from the
electrode on its own. They proposed the induced direct electron flow mechanisms from
electrode to the well-studied Mtr respiratory pathway as the main mode of action (Thomas et
al, 2013b).
13
4) Wang and colleagues studied the improvement of bioelectrochemical device
performance using COEs along with cheap, high surface area, conductive, corrosion-resistant
and scalable materials such as carbon-based electrodes. For their study non-pathogenic and
non-natively electrogenic E.coli K-12 was used in a MFC setup. Here they observed increase
an current collection by 300% (up to 3.2 µA of 25µM DSSN+ vs 0.9µA of control) when E. coli
was stained with COEs and increased concentrations of these molecules were directly related
with an increased overall power generation (Wang et al, 2013b).
5) Lastly Wang and colleagues studied the effect of COEs on the direct electron
transfer mechanism of S. oneidensis MR-1. Here they observed that DSSN+ was not able to
restore flavin-related extracellular electron transfer (EET) mechanisms in an mtrC-OmcA
knockout mutant. But still an increased current output by 25% and 200% at 0 and 200mV,
respectively was observed in the presence of COEs. These results suggest that DSSN+
establishes an additional EET route that is complementary to the OMCs and microbially
produced flavins (Wang et al, 2014).
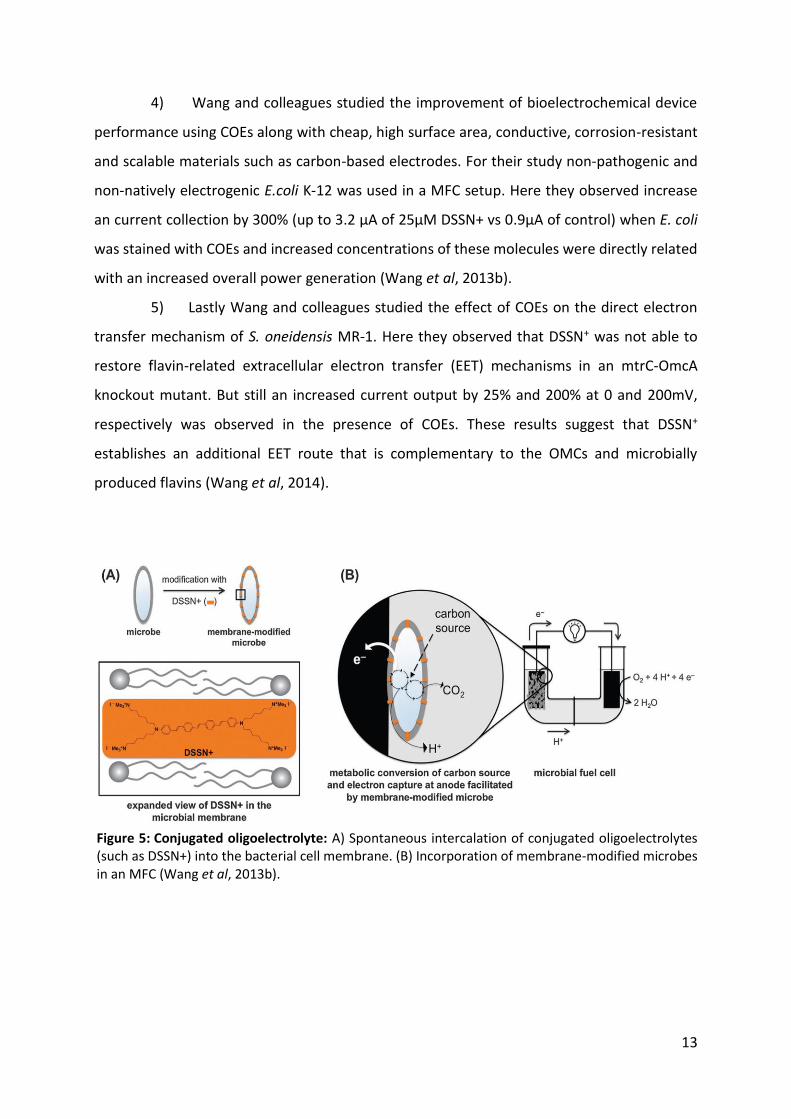
Figure 5: Conjugated oligoelectrolyte: A) Spontaneous intercalation of conjugated oligoelectrolytes (such as DSSN+) into the bacterial cell membrane. (B) Incorporation of membrane-modified microbes in an MFC (Wang et al, 2013b).

14
These studies provide the information on the possibilities of applications of COEs in BES
applications. How these molecules are capable of transferring electrons at the level of the
electrode and at the level of the organism membrane linked to the energy conserving
mechanisms is still unclear. Investigating their modes of actions would be of great interest to
the better understanding on how microorganisms interact with electrodes for the transfer of
electrons.
MES technology, although still in its infancy, shows the potential to help in solving the
problems of the new demands in energy sources management and production of value-added
chemicals in a sustainable manner. This platform makes it possible to convert the sustainable
electrical energy into chemical energy that can be easily stored and link this to the
consumption of CO2 thereby giving this platform an environmental value (Rabaey & Rozendal,
2010). Implementation of MES is until now limited due to some factors like the knowledge on
how the electron transfer mechanisms occur. So the optimisation of such underlying
mechanisms is not feasible. A second factor is the limited set of known electroactive
microorganisms at the cathode side for the use in MES purposes. This can be overcome by the
use of COEs, which have already shown their ability to induce in a simple manner the electron
transfer mechanisms between the electrode and the organisms of interest. This thesis will
focus on two main research questions on the implementation of these molecules.
15
4. Objectives
In order to fulfil the needs to develop a sustainable system to cope with the demands of the
21st century, research has been focussed on minimizing the human waste streams and
optimizing the energy production technologies. In this area of research over the past decade
the platform of MES has been developed. In order to maximize the system performances, the
mechanisms of electron transfer from the electrode to the microorganisms are up till now not
well understood. This turned out to be one of the major bottlenecks. Studies on the use of
COEs in MFCs have already proven that the transfer of electrons between microorganisms and
the electrode can be dramatically improved by these molecules. At this moment it is not well
understood if these molecules can be well implemented in the optimization of MES setups.
Besides limited efforts have been made to understand how the physical properties of the
microorganisms affect the effectiveness of these molecules. In this thesis work, the COE
molecules (DSSN+) were investigated 1) in electricity-driven bioproduction (MES) of acetate
starting from CO2 and 2) in altering microbial metabolism at different electrode potentials. An
overview scheme of the research strategy followed in this work is given in figure 6.
The first objective focuses on the use of COEs in facilitating cathodic electron transfer for
improving MES of acetate from CO2. Firstly, the toxicity of the COEs on the organisms used in
the study was determined by the minimum inhibition concentration (MIC) tests. The main goal
was to study the influence of COEs on the growth of different bacteria due to their different
cell wall structures. This led to find an optimal, non-lethal COE concentration that was
subsequently used in the MES studies. Two organisms Acetobacter woodii and Sporomusa
ovata, of gram positive and gram negative nature, respectively were chosen for MES studies.
The efficacy of these COE molecules in improving MES of acetate was also tested with an
enriched mixed homoacetogenic culture.
Another research objective focuses on the implementation of the COE molecules for altering
heterotrophic metabolism in E. coli MG1655 at different electrode potentials. In the industrial
use of E coli, recombinant protein production is inhibited due to a phenomenon known as the
overflow metabolism. Here acetate is produced which negatively affects the growth even at
very low concentrations of 0.5 g/L. The exact function of the acetate production is unknown.
The main hypothesis suggests that this is a mechanism to dispose of reducing equivalents
16
when electron acceptors are limited, for example in situations of excess glucose concentration
and limited oxygen in the system. The main objective was to steer the carbon metabolism in
E. coli MG1655 3KO by providing an electrode set at varying potentials. When set at high (0,2V
vs SHE) potentials the electrode functions as an electron acceptor and by this way removes
the excess of reducing equivalents in the system and is hypothesized to limit acetate
production. In the other case when the electrode is set at a low potential (-0,6 vs SHE), it
provides electrons to the system and by this way drives the carbon flow to the production of
acetate. This study was conducted with wild-type and genetically modified E. coli strains
developed by De Mey and colleagues (De Mey et al, 2007). In order to improve the interaction
of microorganisms and the electrode, the COEs were added to the system and its influence
was investigated.
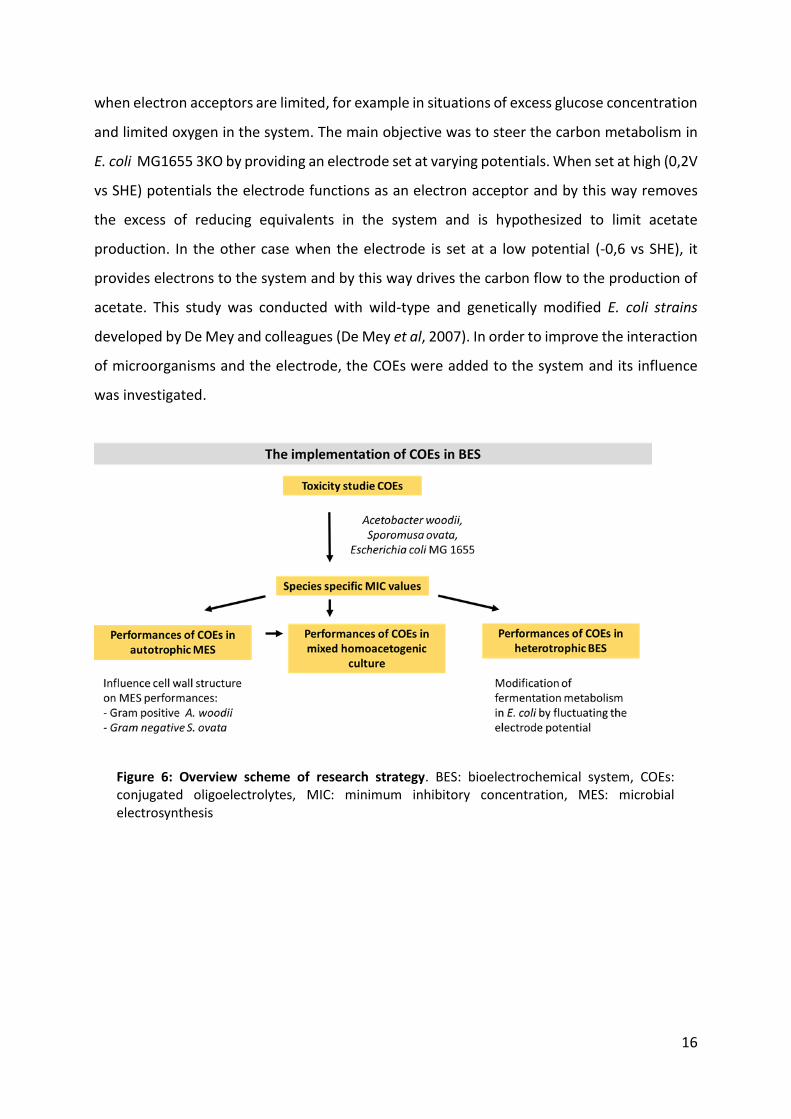
Figure 6: Overview scheme of research strategy. BES: bioelectrochemical system, COEs: conjugated oligoelectrolytes, MIC: minimum inhibitory concentration, MES: microbial electrosynthesis
17
Chapter 2: Materials and methods
1. Conjugated Oligoelectrolytes
The COEs used in this study, DSSN+, were synthesized and provided by Xiaofen Chen of the
Bazan research group (University of California). A general stock solution was made by
dissolving the molecules in autoclaved demineralised water to a final stock concentration of 1
mM. The stock solution was kept under aseptic conditions, stored at 4°C and kept away from
light. The final concentrations used in the experiments were 2.5 µM or as described in the
results section.
2. Microorganisms and cultivation methods
Acetobacterium woodii (DSM1030) and Sporomusa ovata (DSM2662) were cultivated under
dark conditions on their standard DSMZ media, respectively media 135 and 311 (composition;
see attachment A and B). Cultures were grown anaerobically (H2/CO2) in Hungate tubes at
28°C under static conditions. An enriched homoacetogenic mixed culture (Van Meerbergen J
(2011) Microbial strategies for steering bioenergy production in anaerobic systems. MSc.,
Ghent University) was grown on the general homoacetogenic medium (composition see
attachment C), grown in 120 mL penicillin bottles with a final medium volume of 40 mL.
Cultures were incubated in dark conditions at 28°C. Escherichia coli MG1655 ΔackApta,ΔpoxB
[ λ-, F-, rph-1, rfb-50, ilvG-, ΔackA-pta, ΔpoxB] was constructed in the Laboratory of Genetics
and Microbiology (MICR) (De Mey et al, 2007). E. coli was grown under dark conditions on
standard LB medium (composition see attachment D) under anaerobic conditions at 37°C on
a shaker at 100 rpm. MIC tests with A. woodii and S. ovata cultures were conducted in 120 mL
penicillin bottles with a final medium volume of 42.5 mL. MIC tests with E. coli cultures were
conducted on 40mL medium in 120mL penicillin bottles at 37°C on a shaker at 100 rpm.

18
3. Measurements and analyses
3.1. pH measurement
The pH was measured by a Consort SP10B pH electrode connected to a Consort C552
multimeter analyser (Consort, Turnhout, Belgium).
3.2. Analysis of cell growth and cell numbers
Cell growth was analysed by optical density measurement (OD610nm) using spectrophotometer
(Dr Lange, ISIS 9000). Demineralised water was used as blank sample. Samples were measured
in a 1.5 mL plastic cuvettes.
Cell numbers were measured by BD Accuri C6 flow cytometer with auto sampler (BD
Bioscience, USA). Samples were stained for Live/Dead cell analysis using 5 µL of sample, 5 µL
EDTA, 5µL syber green/ propidium iodide (final concentration 4µM). In case cell counts
exceeded 2000 counts/s, samples were prediluted with filtered (0.20 µM) Evian water with a
factor 10X to fit this technical parameter for optimal measurements. Analysis and gate settings
of the data were based on the comparison of a negative sample, a positive sample and a
positive dead sample. The positive dead sample consisted of a sample incubated at 100°C for
15 min to ensure the death of all cells.
3.3. Analysis of volatile fatty acids
Volatile fatty acid samples were prepared by filtering the sample through a 0.22 µM filter.
These samples were analysed using an AS1 column in a DX-500 BIOLC with ED500 conductivity
detector (Dionex). Samples were, pending on analysis, stored for short( <7days) periods in the
fridge (4°C) or for longer periods in the freezer (-20°C).
3.4. Microscopy
Samples were analysed by bright field light microscopy and fluorescence microscopy
(Axioskop Zeiss, Germany). COE-stained cells were visualized in fluorescence mode, aith
emission light at 412 nm. Gram staining was performed using crystal violet and Safranine O
solution (detailed protocol see attachment E).
19
3.5. Gas chromatography
Gas composition was analysed on a CompactGC (Interscience, Belgium). O2, N2, CH4 and H2 are
separated through a pre-column (Molsieve 5A) and a column (PorabondQ), and are analysed
via a Thermal Conductivity Detector (TCD). CO2 is separated using a pre-column (Rt-QS-bond)
and column (RTt-Q-bond), and analysed by a second TCD. Gas samples were taken by a flushed
(N2) syringe at the gas sampling point. After retrieving the syringe, it was immediately placed
on a rubber stopper in order to minimize air contact.
In order the measure bicarbonate (HCO3-), 1 mL of the medium was spiked in a vacuum gas
vacutainer (-0.2bar) containing 1mL of 1M H2SO4. Vacutainers were vortexed for 1min and
subsequently 1mL of the headspace was analysed by gas chromatography. Bicarbonate is
further reported as % CO2 .
3.6. Gas flow rate
Gas flow rates were measured by connecting the reactor gas outlet to the bottom of an
partially immersed and completely filled (H20) glass tube via a neoprene tube (Masterfex,
Belgium). The volume of gas produced over a period of time was measured the via length of
gas production in the cylinder (cm) multiplied by the inner transversal area of the glass
cylinder. Dividing the produced volume by the interval measured resulted in the gas flow rate.

20
4. Electrochemical techniques
All electrochemical techniques were applied using a potentiostat VSP, Biologic science
instruments, France or Multi Potentiostat/Galvanostat µStat 8000, Dropsence, Spain.
4.1. Cyclic voltammetry (CV)
Cyclic voltammetry is the technique in which the potential of the electrode ramps linearly
versus time. The ramping is achieved by applying a specific scan rate (V/s). Cyclic
voltammograms were recorded by applying a scan rate of 1mV/s. CV was conducted before
and after reactor inoculation as (controls), and after each experimental phase.
4.2. Chronoamperometry (CA)
Chronoamperometry is a technique by which a potential is fixed on the working electrode and
the resulting current is monitored as a function of time. Chronoamperograms were generated
by applying a potential further described in results.
4.3. Chronopotentiometry (CP)
Chronopotentiometry is a technique by which a fixed current is applied on a working electrode
and the resulting potential is monitored as a function of time. Chrono potentiograms were
generated via by applying a fixed current of -2 mA further described in results.
21
5. Minimal inhibitory concentration (MIC) tests
5.1. Cell culture and cultivation
For microorganisms A. woodii and S. ovata, minimal inhibitory concentrations of COEs were
tested on two different media. Complete medium with C-source fructose or casitone and
minimal medium with C-source C02 respectively for heterotrophic and autotrophic growth.
Complete medium consisted of the normal growth medium. Minimal medium consisted the
normal medium where carbon sources ; yeast extract, fructose, casitone and betaine xH2O
were omitted. Autotrophic conditions were obtained by removing 60 mL of the headspace
using a sterile syringe and replacing with 60 mL of H2: CO2 (70/30) gas mixture. Cultures were
grown under anaerobic conditions at 28 °C under static conditions. MIC concentrations of
COEs for E. coli were only tested using minimal media (composition see attachment C).
Different DSSN+ concentration ranges were tested for the different organisms (table 1).
Growth curves of E. coli MG1655 WT and E. coli MG1655 3KO on minimal medium were
analysed in parallel under strict anaerobic conditions at 28°C in an anaerobic chamber (GP-
Campus T2, Jacomex France). Growth was monitored over time via OD620nm using an automatic
spectrophotometer (Tecan Sunrise 96-well plate reader, Switzeland)
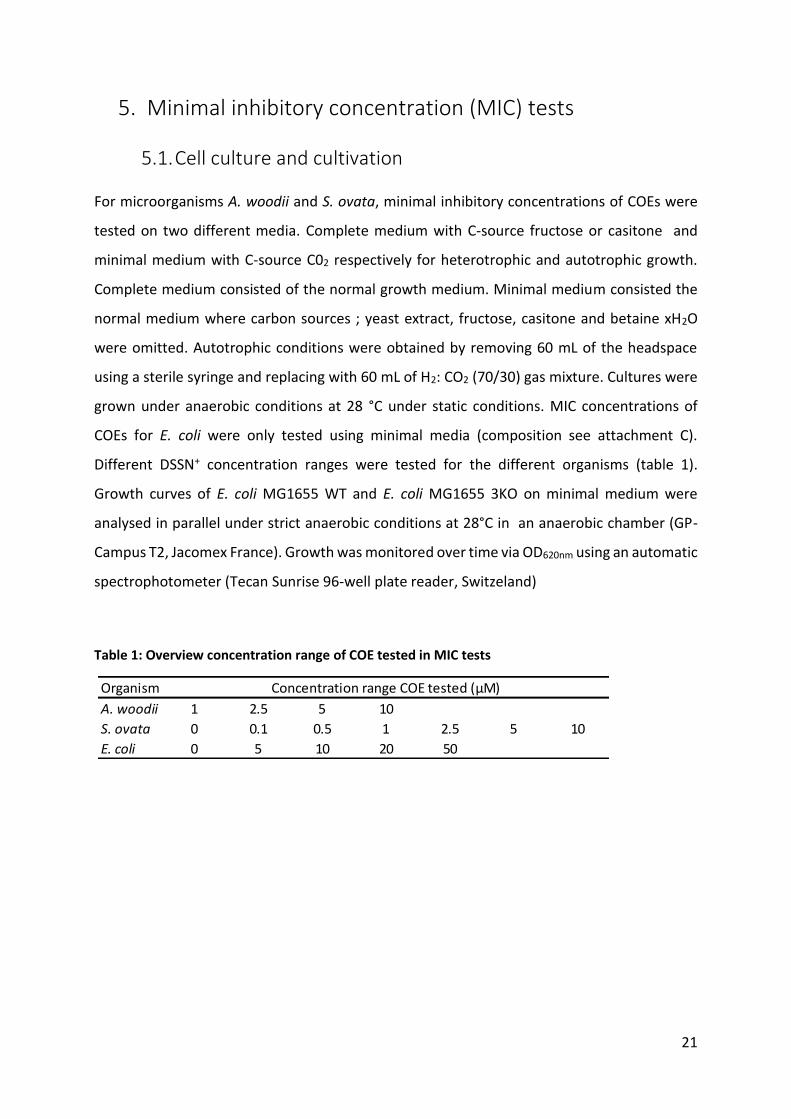
Table 1: Overview concentration range of COE tested in MIC tests
Organism
A. woodii 1 2.5 5 10
S. ovata 0 0.1 0.5 1 2.5 5 10
E. coli 0 5 10 20 50
Concentration range COE tested (µM)
22
6. MES with A. woodii and S. ovata
6.1. Cell culture and inoculum preparation
A. woodii and S. ovata were grown on their respective minimal medium in 120 mL penicillin
bottles. Yeast extract and carbon sources were omitted and the culture was grown
autotrophically on H2:CO2 (70/30) to a cell count that exceeds a final cell concentration of
107/mL in the reactor. Cultures were incubated at 28°C under static conditions.
Before inoculation, cells were washed and stained in the anaerobic chamber (GP-Campus T2,
Jacomex France). The cell culture was transferred to sterile 10mL tubes. These tubes were
centrifuged for 10 min at 5000 rpm (Centrifuges 5430, Eppendorf, Germany). The cell pellet
was afterwards suspended in 5 mL minimal medium under anaerobic conditions. Yeast
extract, resazurin, fructose, cysteine-HCl x H2O and Na2S x 9 H2O were omitted from the
medium composition (adapted minimal medium). Afterwards cells were stained with 2.5 µM
COEs and incubated for 1 h in the anaerobic chamber to ensure COEs could enter the cell
membranes. Afterwards the inoculum was transferred to a sterile 5mL syringe. Incorporation
of COEs into the membrane was confirmed by fluorescence microscopy.
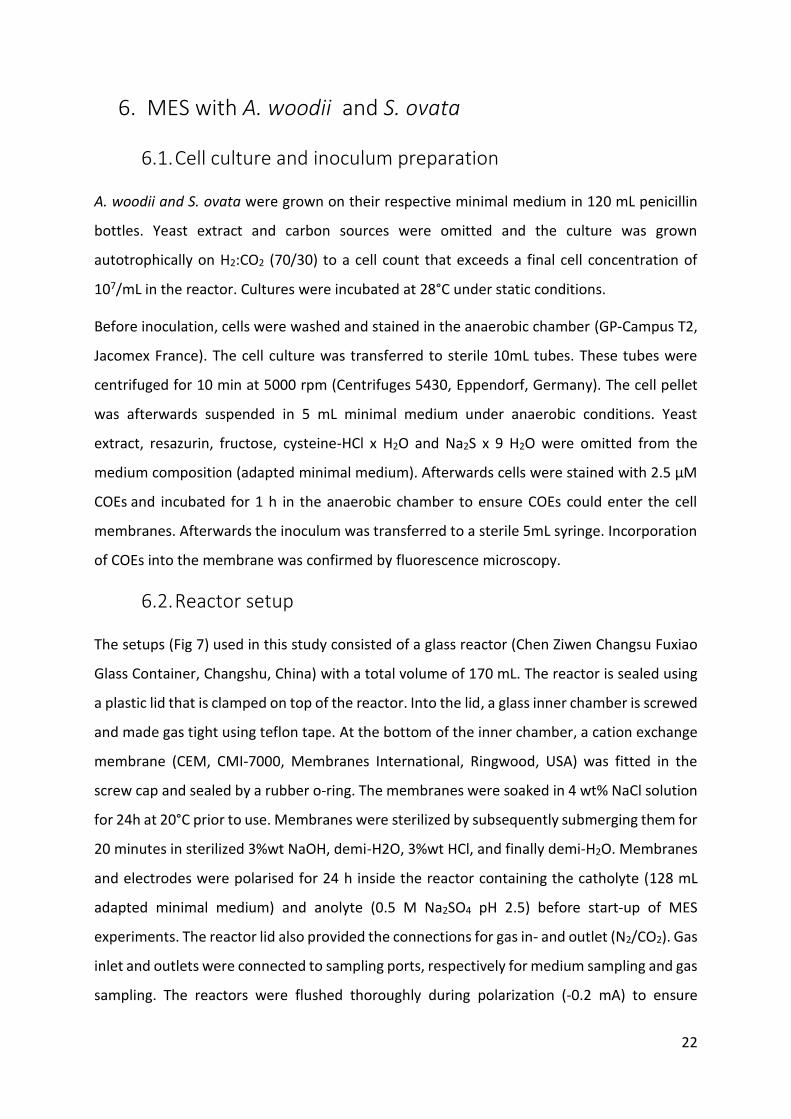
6.2. Reactor setup
The setups (Fig 7) used in this study consisted of a glass reactor (Chen Ziwen Changsu Fuxiao
Glass Container, Changshu, China) with a total volume of 170 mL. The reactor is sealed using
a plastic lid that is clamped on top of the reactor. Into the lid, a glass inner chamber is screwed
and made gas tight using teflon tape. At the bottom of the inner chamber, a cation exchange
membrane (CEM, CMI-7000, Membranes International, Ringwood, USA) was fitted in the
screw cap and sealed by a rubber o-ring. The membranes were soaked in 4 wt% NaCl solution
for 24h at 20°C prior to use. Membranes were sterilized by subsequently submerging them for
20 minutes in sterilized 3%wt NaOH, demi-H2O, 3%wt HCl, and finally demi-H2O. Membranes
and electrodes were polarised for 24 h inside the reactor containing the catholyte (128 mL
adapted minimal medium) and anolyte (0.5 M Na2SO4 pH 2.5) before start-up of MES
experiments. The reactor lid also provided the connections for gas in- and outlet (N2/CO2). Gas
inlet and outlets were connected to sampling ports, respectively for medium sampling and gas
sampling. The reactors were flushed thoroughly during polarization (-0.2 mA) to ensure
23
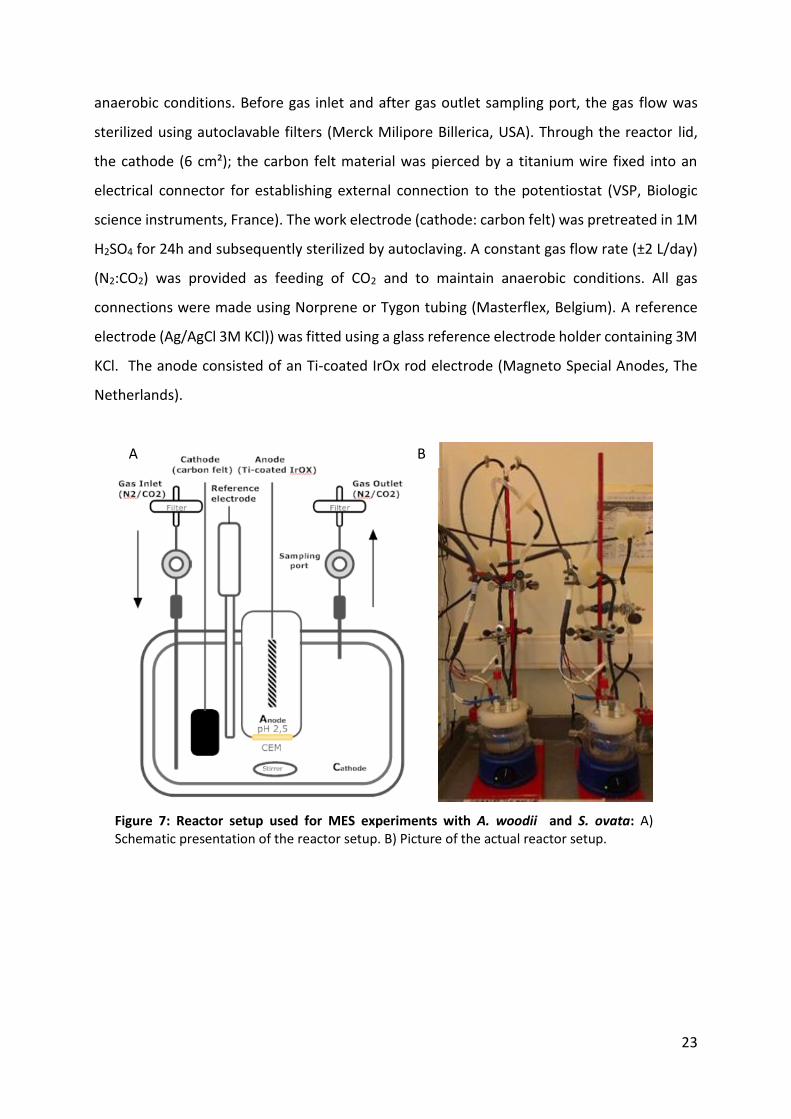
anaerobic conditions. Before gas inlet and after gas outlet sampling port, the gas flow was
sterilized using autoclavable filters (Merck Milipore Billerica, USA). Through the reactor lid,
the cathode (6 cm²); the carbon felt material was pierced by a titanium wire fixed into an
electrical connector for establishing external connection to the potentiostat (VSP, Biologic
science instruments, France). The work electrode (cathode: carbon felt) was pretreated in 1M
H2SO4 for 24h and subsequently sterilized by autoclaving. A constant gas flow rate (±2 L/day)
(N2:CO2) was provided as feeding of CO2 and to maintain anaerobic conditions. All gas
connections were made using Norprene or Tygon tubing (Masterflex, Belgium). A reference
electrode (Ag/AgCl 3M KCl)) was fitted using a glass reference electrode holder containing 3M
KCl. The anode consisted of an Ti-coated IrOx rod electrode (Magneto Special Anodes, The
Netherlands).
Figure 7: Reactor setup used for MES experiments with A. woodii and S. ovata: A) Schematic presentation of the reactor setup. B) Picture of the actual reactor setup.
A B
24
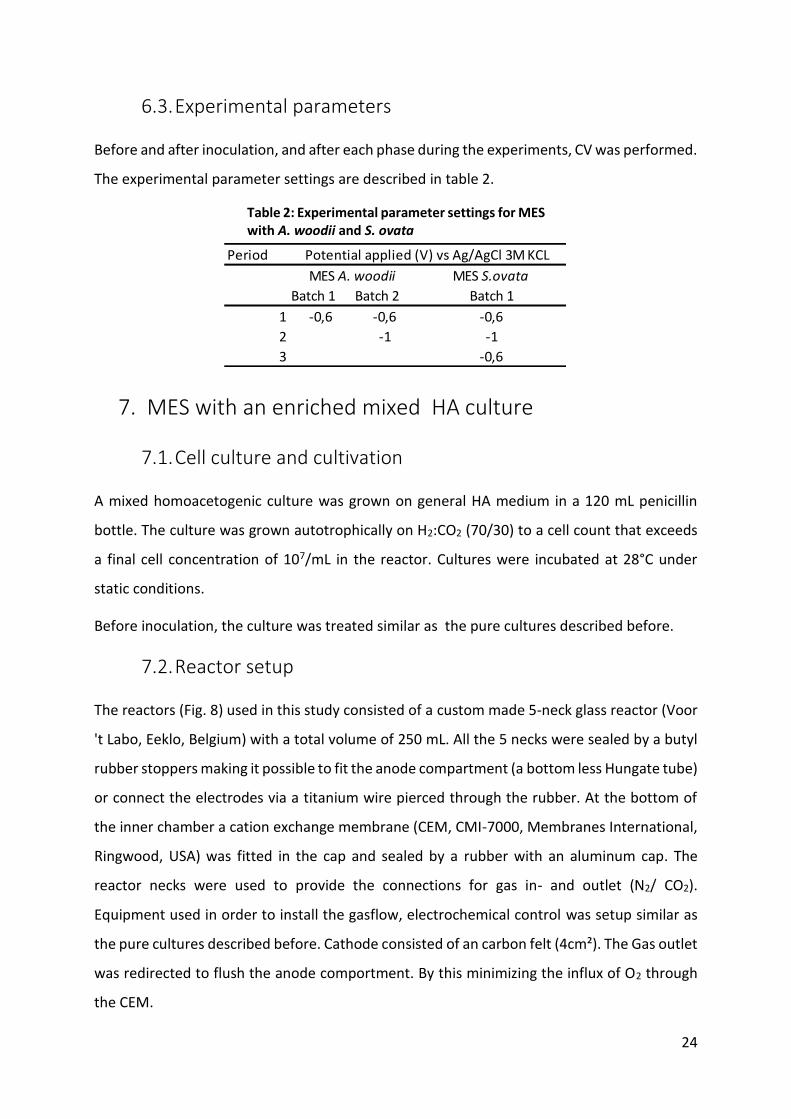
6.3. Experimental parameters
Before and after inoculation, and after each phase during the experiments, CV was performed.
The experimental parameter settings are described in table 2.
7. MES with an enriched mixed HA culture
7.1. Cell culture and cultivation
A mixed homoacetogenic culture was grown on general HA medium in a 120 mL penicillin
bottle. The culture was grown autotrophically on H2:CO2 (70/30) to a cell count that exceeds
a final cell concentration of 107/mL in the reactor. Cultures were incubated at 28°C under
static conditions.
Before inoculation, the culture was treated similar as the pure cultures described before.
7.2. Reactor setup
The reactors (Fig. 8) used in this study consisted of a custom made 5-neck glass reactor (Voor
't Labo, Eeklo, Belgium) with a total volume of 250 mL. All the 5 necks were sealed by a butyl
rubber stoppers making it possible to fit the anode compartment (a bottom less Hungate tube)
or connect the electrodes via a titanium wire pierced through the rubber. At the bottom of
the inner chamber a cation exchange membrane (CEM, CMI-7000, Membranes International,
Ringwood, USA) was fitted in the cap and sealed by a rubber with an aluminum cap. The
reactor necks were used to provide the connections for gas in- and outlet (N2/ CO2).
Equipment used in order to install the gasflow, electrochemical control was setup similar as
the pure cultures described before. Cathode consisted of an carbon felt (4cm²). The Gas outlet
was redirected to flush the anode comportment. By this minimizing the influx of O2 through
the CEM.
Table 2: Experimental parameter settings for MES with A. woodii and S. ovata
Period
Batch 1 Batch 2
1 -0,6 -0,6
2 -1
3
-1
-0,6
Potential applied (V) vs Ag/AgCl 3M KCL
MES A. woodii MES S.ovata
Batch 1
-0,6

25
7.3. Experimental parameters
Before and after inoculation, and after each phase during the experiments, CV was performed
.The experiment with the mixed homoacetogenic culture was performed using CP with a fixed
current of -2 mA.
WE
Graphite felt
Titanium wire
Rubber stopper
Glass tube
Sampling port
CEM
Stirrer bar
Shielded CE
IrOx Titanium
N2:CO2
Gases out
N2:CO2 to anode
chamber
RE
Ag/AgCl
Anolyte
pH 2,5 Catholyte
pH 7.5
Figure 8: Schematic overview of the reactor setup used for MES with a mixed homoacetogenic culture.
26
8. Experiments with E. coli MG1655 3KO
8.1. Cell culture and cultivation
E. coli 3KO was grown on minimal medium (40 mL) in a 120 mL penicillin bottle. The culture
was grown autotrophic on N2:CO2 (70/30) to a cell count that exceeds a final cell concentration
of 107/mL in the reactor. Cultures were incubated at 37°C under conditions shaking at 110rpm.
Before inoculation, the culture was treated similar as the pure cultures described before.
8.2. Reactor setup
The reactors (Fig 9) used in this study consisted of a 5-neck glass reactor (Voor 't Labo, Eeklo,
Belgium) with a total volume of 250mL. The reactor setup was similar as the mixed culture,
differences are stated below. The catholyte (125mL)and anolyte consisted of minimal medium
(composition attachment D). The cathode (carbon felt) was connected to the potentiostat
(Multi Potentiostat/Galvanostat µStat 8000, Dropsence, Spain). The anode consisted of a
treated carbon felt electrode (30 cm²).
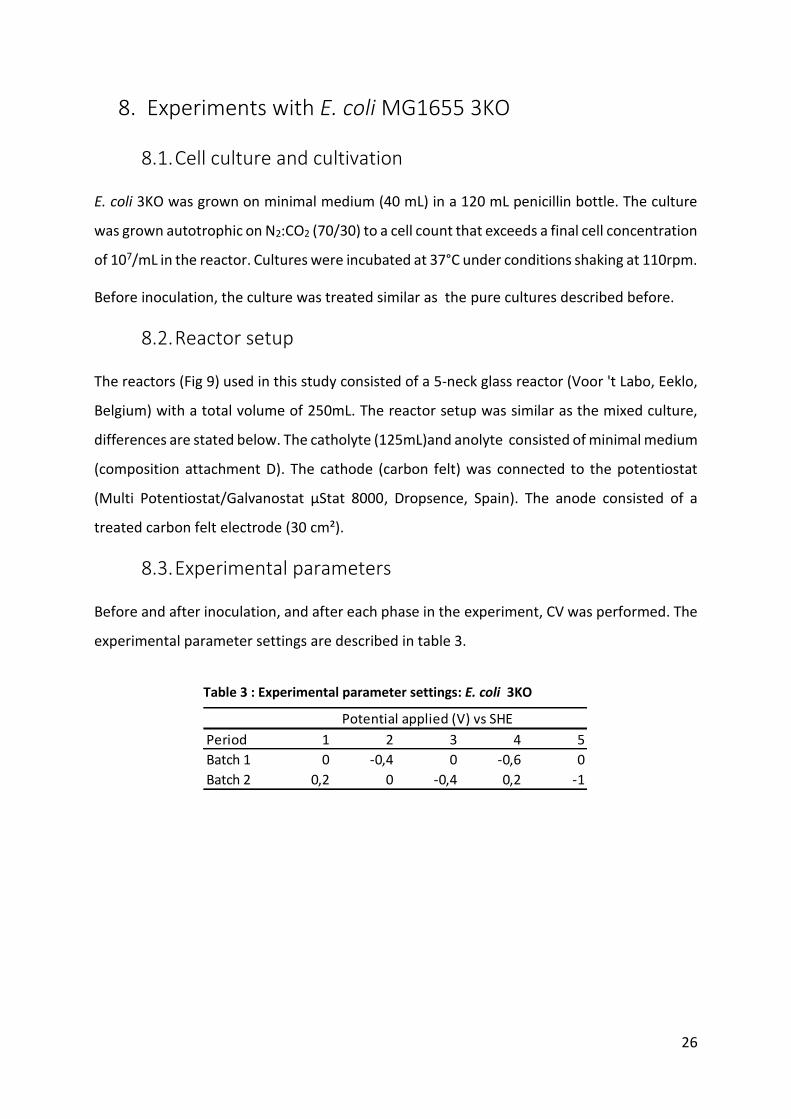
8.3. Experimental parameters
Before and after inoculation, and after each phase in the experiment, CV was performed. The
experimental parameter settings are described in table 3.
Table 3 : Experimental parameter settings: E. coli 3KO
Period 1 2 3 4 5
Batch 1 0 -0,4 0 -0,6 0
Batch 2 0,2 0 -0,4 0,2 -1
Potential applied (V) vs SHE

27
WE
Graphite felt
Titanium wire
Rubber stopper
Glass tube
Sampling port
CEM
Stirrer bar
Gas in/ out N2:CO2
RE
Ag/AgCl
Anolyte
pH 7 Catholyte
pH 7.
Coutner electrode
(carbon felt) A
B
Figure 9: Reactor setup used for experiments with E. coli MG1655 3KO: A) Schematic presentation of the reactor setup. B) Picture of the actual reactor setup.
28
9. Calculations
9.1. Standard deviation
When averages were calculated, the standard deviation σ was calculated by, with �̅� standing
for the sample mean and n the sample size.
𝜎 = √∑(𝑥 − �̅�)2
(𝑛 − 1)
9.2. Growth rate
Growth rates were calculated by plotting the semilog plot of the production over time. Fitting
the best-fit to the linear part of the graph. Subsequently calculating the production yield from
the equitation of the best-fit.
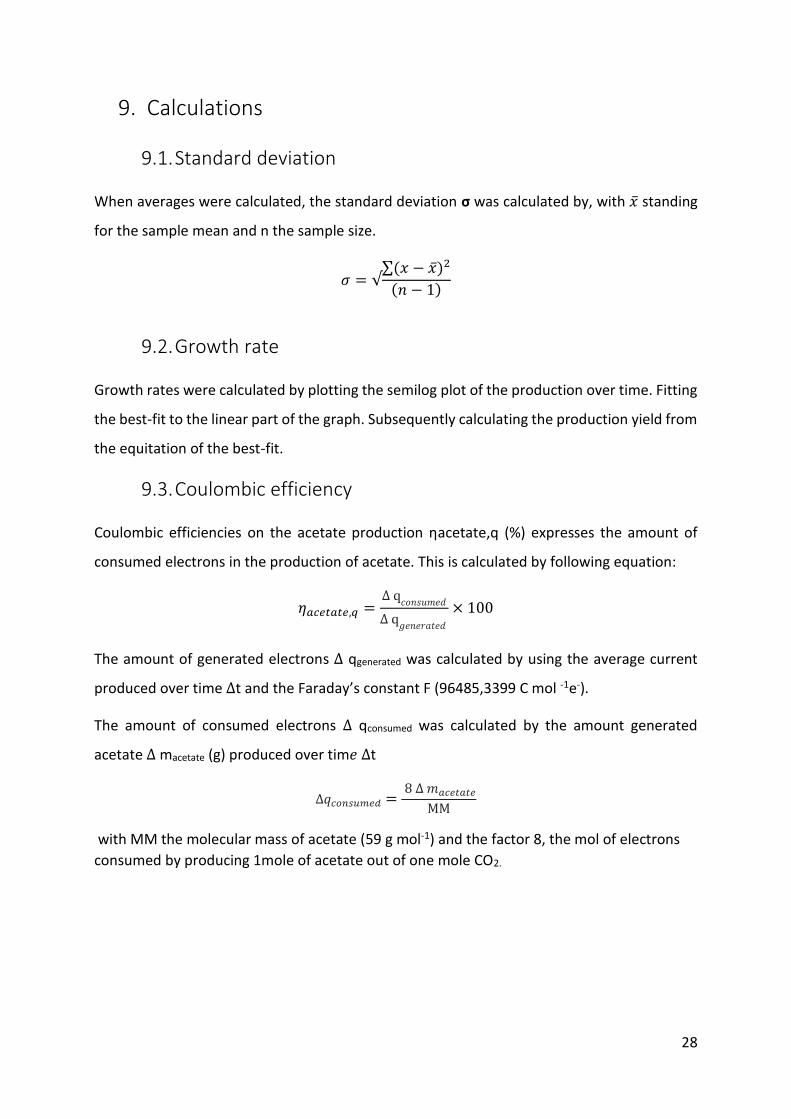
9.3. Coulombic efficiency
Coulombic efficiencies on the acetate production ηacetate,q (%) expresses the amount of
consumed electrons in the production of acetate. This is calculated by following equation:
𝜂𝑎𝑐𝑒𝑡𝑎𝑡𝑒,𝑞 =Δ q
𝑐𝑜𝑛𝑠𝑢𝑚𝑒𝑑
Δ q𝑔𝑒𝑛𝑒𝑟𝑎𝑡𝑒𝑑
× 100
The amount of generated electrons Δ qgenerated was calculated by using the average current
produced over time Δt and the Faraday’s constant F (96485,3399 C mol -1e-).
The amount of consumed electrons Δ qconsumed was calculated by the amount generated
acetate Δ macetate (g) produced over tim𝑒 Δt
Δ𝑞𝑐𝑜𝑛𝑠𝑢𝑚𝑒𝑑 = 8 Δ 𝑚𝑎𝑐𝑒𝑡𝑎𝑡𝑒
MM
with MM the molecular mass of acetate (59 g mol-1) and the factor 8, the mol of electrons
consumed by producing 1mole of acetate out of one mole CO2.

29
Chapter 3: Results
1. Toxicity study: Influence of COEs on cell viability
The influence on cell viability on/after the incorporation of the COE molecules in the cell
membrane was studied on gram negative and gram positive types of microorganisms.
Respectively S. ovata and A. woodii were chosen as model strains for both cell wall structures.
S. ovata has a proved direct electron transfer mechanism and A. woodii is able to accept
electrons in a hydrogen mediated way. The influence of COEs on the viability of the gram
negative model organism E. coli MG1655 was also studied. Batch cultures were analysed over
time for optical density at 610 nm (OD610), cell count (flow cytometry) and volatile fatty acid
(VFA) production (ion-chromatography). A. woodii and S. ovata were tested at both
heterotrophic and autotrophic growth conditions.
1.1. .Influence of COEs on A. woodii
1.1.1. Heterotrophic growth conditions
Four different COE concentrations were tested, 1 µM; 2,5 µM; 5 µM and 10µM. The four
concentrations were tested in duplicate, but duplicates were alternately sampled over time
due to the minimal culture volume (10 mL). Indicators of cell growth, OD610 and cell count
number (Fig 10A and C ), show clear growth inhibition at COE concentrations 5 µM and 10 µM.
A similar inhibitory trend was observed in VFA production. The concentration of formate
remained stable over time for all COE concentrations (66 ± 15mg/L) (Fig 10E). The
concentration of acetate showed a clear difference, for instance at 5 µM and 10µM COE no
acetate production could be detected (Fig 10G). Although the total cell number increased, the
absence of acetate production indicates that energy is needed to cope with the negative effect
of the COE at these high COE concentrations. For COE concentrations of 1µM and 2,5µM,
acetate production up to 5 g/L was observed. Overall, the minimal inhibitory concentration
(MIC value) of COEs for A. woodii under heterotrophic growth conditions was found to be 2.5
µM.
30
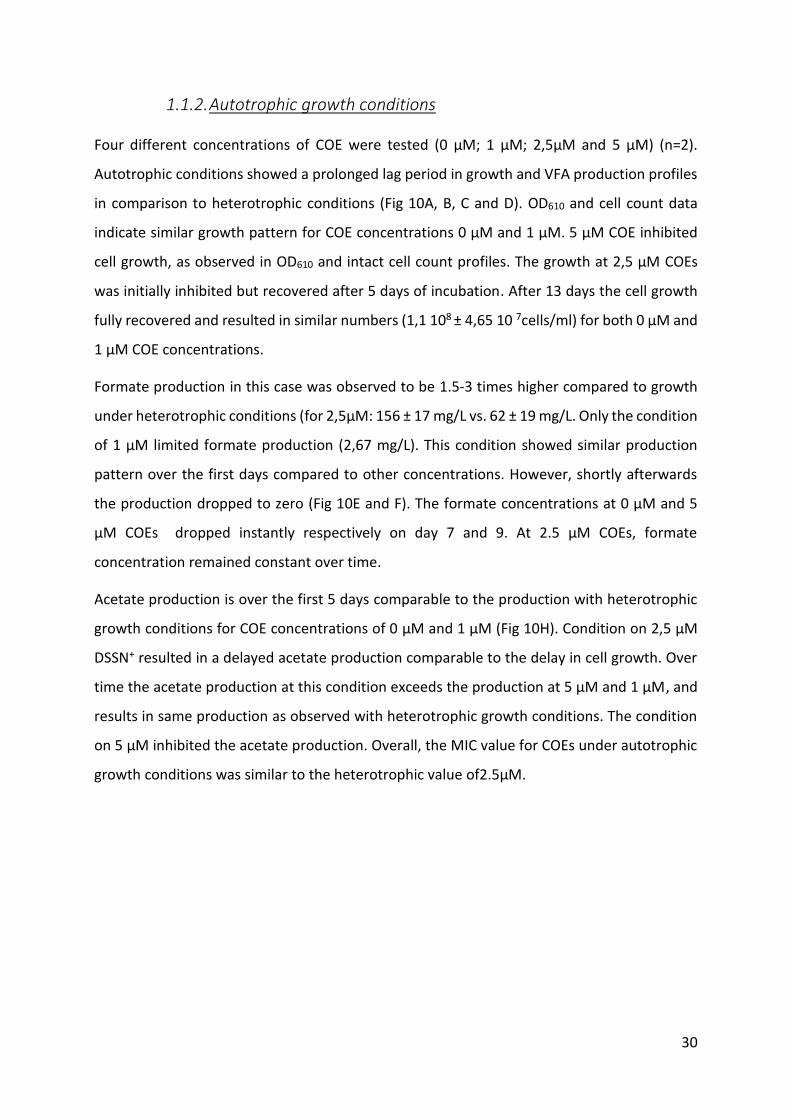
1.1.2. Autotrophic growth conditions
Four different concentrations of COE were tested (0 µM; 1 µM; 2,5µM and 5 µM) (n=2).
Autotrophic conditions showed a prolonged lag period in growth and VFA production profiles
in comparison to heterotrophic conditions (Fig 10A, B, C and D). OD610 and cell count data
indicate similar growth pattern for COE concentrations 0 µM and 1 µM. 5 µM COE inhibited
cell growth, as observed in OD610 and intact cell count profiles. The growth at 2,5 µM COEs
was initially inhibited but recovered after 5 days of incubation. After 13 days the cell growth
fully recovered and resulted in similar numbers (1,1 108 ± 4,65 10 7cells/ml) for both 0 µM and
1 µM COE concentrations.
Formate production in this case was observed to be 1.5-3 times higher compared to growth
under heterotrophic conditions (for 2,5µM: 156 ± 17 mg/L vs. 62 ± 19 mg/L. Only the condition
of 1 µM limited formate production (2,67 mg/L). This condition showed similar production
pattern over the first days compared to other concentrations. However, shortly afterwards
the production dropped to zero (Fig 10E and F). The formate concentrations at 0 µM and 5
µM COEs dropped instantly respectively on day 7 and 9. At 2.5 µM COEs, formate
concentration remained constant over time.
Acetate production is over the first 5 days comparable to the production with heterotrophic
growth conditions for COE concentrations of 0 µM and 1 µM (Fig 10H). Condition on 2,5 µM
DSSN+ resulted in a delayed acetate production comparable to the delay in cell growth. Over
time the acetate production at this condition exceeds the production at 5 µM and 1 µM, and
results in same production as observed with heterotrophic growth conditions. The condition
on 5 µM inhibited the acetate production. Overall, the MIC value for COEs under autotrophic
growth conditions was similar to the heterotrophic value of2.5µM.

31
A B
C D
E F
G H
Figure 10: Influence of COEs on the growth and the VFA production profiles of A. woodii: Different concentrations of DSSN+ were tested (n=2): 10 µM (square), 5 µM (triangle), 2.5 µM (round), 1 µM (diamond) and 0 µM (cross). Optical density (OD600) on heterotrophic (A) and autotrophic (B) medium, cell count (flow cytometry) on heterotrophic (C) and autotrophic (D) medium, production of formate on heterotrophic (E) and autotrophic (F) medium, production of acetate on heterotrophic (G) and autotrophic (H) medium.

32
1.1.3. Microscopic analyses of the incorporation of COEs in A. woodii
To ensure the incorporation of the COE molecules into the bacterial cell membranes, samples
from heterotrophic growth conditions were frequently analysed by light and fluorescence
microscopy. During the first days of incubation a clear incorporation of the COEs into the
bacterial cell membrane was observed. At concentrations of 5 µM and 10 µM, a very intense
fluorescent signal was observed. A fluorescent signal with low intensity was observed with
conditions of 2.5 µM and 1 µM COEs (Fig 11). After a longer period of incubation at
concentrations 5 µM and 10 µM, less cells were observed in comparison to the concentrations
of 1 and 2.5 µM (attachment F). This indicates the toxic effect of COEs on cell growth at higher
concentrations and agrees well with the observations on OD and VFA. All observed cells were
stained with COEs, however it was observed that the intensity of the signal decreased over
time. This might indicate the effective transfer of COE molecules over the different
generations.
1µM 48h 2.5µM 48h
10µM 48h 5µM 48 h
Figure 11: Microscopic analysis of incorporation of COEs in A. woodii. Overlay of bright field and fluorescent images of stained A. woodii cells after 48 hours of incubation. Pictures were taken at a magnification of 630x.

33
1.2. Influence of COEs on S. ovata
1.2.1. Heterotrophic growth conditions
Initially four different concentrations were tested (10 µM, 5 µM 2,5 µM and 1 µM). These four
conditions resulted in similar growth curves analyzed by OD610 and flow cytometry (Fig 3A and
C). A short, 1.5-2 days stationary period was observed, which immediately followed by the
death period for all conditions. No formate production was observed over time of incubation
(Fig 12E). With the four concentrations tested, a similar acetate production pattern (up to a
maximum of 2500 mg/L) was observed. To ensure that growth was not limited by the presence
of the COEs in comparison to a condition in the absence of COEs, a second range of COE
concentrations (1 µM; 0.5 µM; 0.1 µM and 0 µM) was tested. To be able to compare the two
batch tests, the concentration of 1 µM was incorporated in the second round of tests. Similar
growth curves were observed at different COE concentrations. A longer stationary period was
observed in comparison to the first batch tests. Comparison of 1 µM to other concentrations
in the same batch tests resulted in a similar growth curve. It can be assumed that the
difference observed in growth curves between the two batch tests was independent of the
effect of COEs. In general, under heterotrophic growth conditions S. ovata was not inhibited
in growth and acetate production up to 10 µM COE concentrations.
1.2.2. Autotrophic growth conditions
Four concentrations of COEs were tested (5 µM; 2.5 µM; 1 µM and 0 µM). Cell growth and cell
number data indicated a prolonged lag period in comparison to growth under heterotrophic
growth conditions, a shift from a couple of hours to 3 days was observed (Fig 12B and D). After
3 days of incubation, a small increase in cell count was observed at all four concentrations
tested (Fig 12D). This indicates that COEs have a possible toxic effect on cell growth. No
formate production was observed over time of incubation (Fig 12F). Following the prolonged
lag period, acetate production started on day 3 of incubation. No comparison of maximal
acetate production can be made for the growth on heterotrophic and autotrophic conditions
due to the short period of sampling on autotrophic growth conditions. Overall, the MIC of COE
value for S. ovata under autotrophic growth conditions was observed to be a higher
concentration than the maximum concentration tested (5 µM).
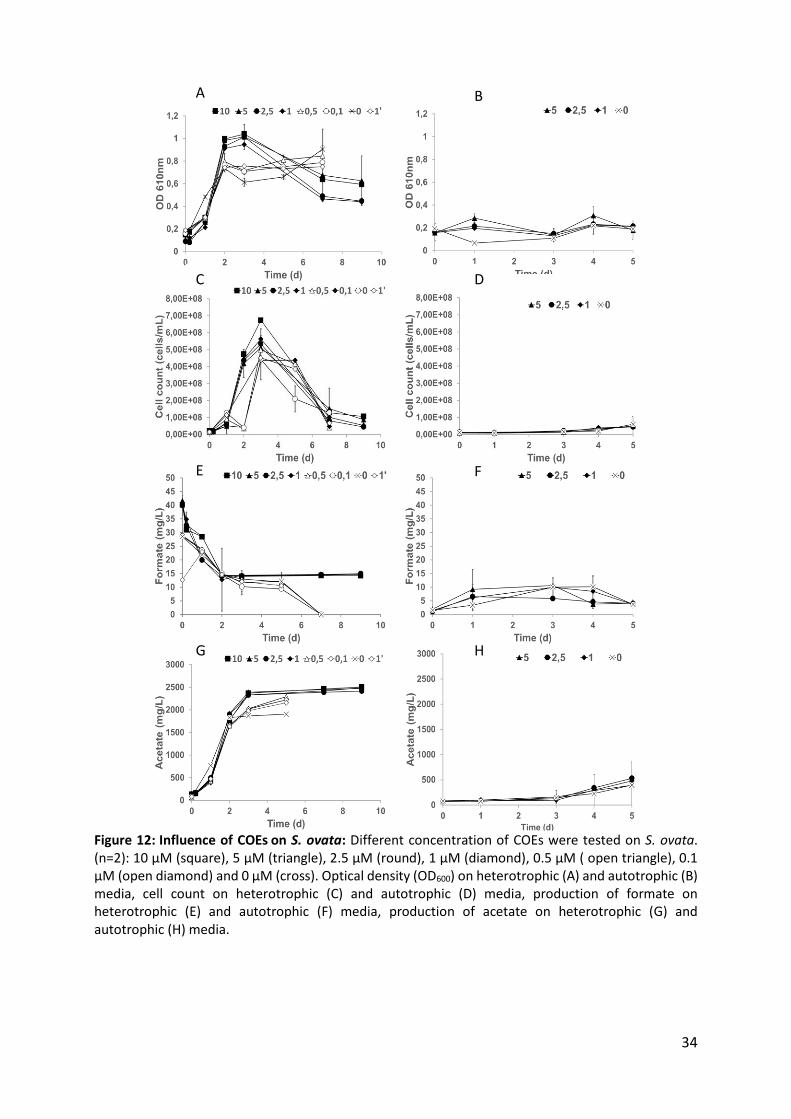
34
A B
C D
E F
G H
Figure 12: Influence of COEs on S. ovata: Different concentration of COEs were tested on S. ovata. (n=2): 10 µM (square), 5 µM (triangle), 2.5 µM (round), 1 µM (diamond), 0.5 µM ( open triangle), 0.1 µM (open diamond) and 0 µM (cross). Optical density (OD600) on heterotrophic (A) and autotrophic (B) media, cell count on heterotrophic (C) and autotrophic (D) media, production of formate on heterotrophic (E) and autotrophic (F) media, production of acetate on heterotrophic (G) and autotrophic (H) media.
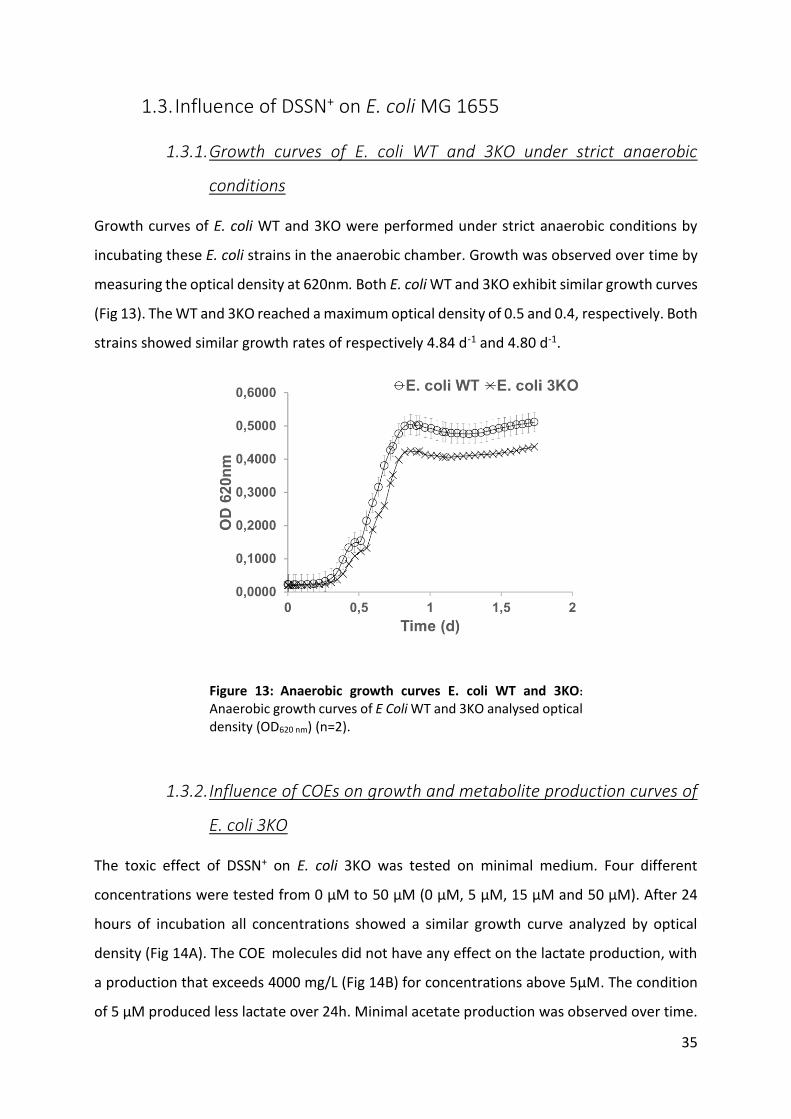
35
1.3. Influence of DSSN+ on E. coli MG 1655
1.3.1. Growth curves of E. coli WT and 3KO under strict anaerobic
conditions
Growth curves of E. coli WT and 3KO were performed under strict anaerobic conditions by
incubating these E. coli strains in the anaerobic chamber. Growth was observed over time by
measuring the optical density at 620nm. Both E. coli WT and 3KO exhibit similar growth curves
(Fig 13). The WT and 3KO reached a maximum optical density of 0.5 and 0.4, respectively. Both
strains showed similar growth rates of respectively 4.84 d-1 and 4.80 d-1.
1.3.2. Influence of COEs on growth and metabolite production curves of
E. coli 3KO
The toxic effect of DSSN+ on E. coli 3KO was tested on minimal medium. Four different
concentrations were tested from 0 µM to 50 µM (0 µM, 5 µM, 15 µM and 50 µM). After 24
hours of incubation all concentrations showed a similar growth curve analyzed by optical
density (Fig 14A). The COE molecules did not have any effect on the lactate production, with
a production that exceeds 4000 mg/L (Fig 14B) for concentrations above 5µM. The condition
of 5 µM produced less lactate over 24h. Minimal acetate production was observed over time.
Figure 13: Anaerobic growth curves E. coli WT and 3KO:
Anaerobic growth curves of E Coli WT and 3KO analysed optical density (OD620 nm) (n=2).
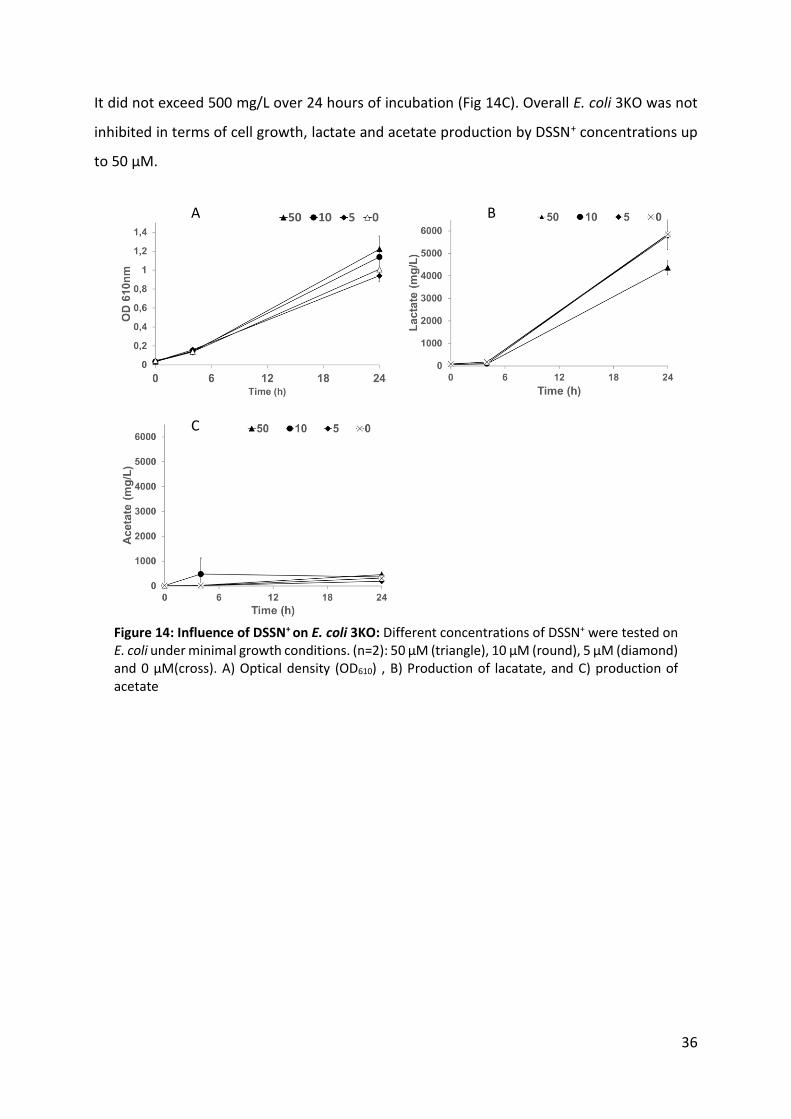
36
It did not exceed 500 mg/L over 24 hours of incubation (Fig 14C). Overall E. coli 3KO was not
inhibited in terms of cell growth, lactate and acetate production by DSSN+ concentrations up
to 50 µM.
C
A B
Figure 14: Influence of DSSN+ on E. coli 3KO: Different concentrations of DSSN+ were tested on
E. coli under minimal growth conditions. (n=2): 50 µM (triangle), 10 µM (round), 5 µM (diamond) and 0 µM(cross). A) Optical density (OD610) , B) Production of lacatate, and C) production of acetate

37
2. Performances of COE treated microbes in autotrophic
MES
The influence of the bacterial cell wall on the performances of COEs to enhance electron
transfer from the cathode to the microorganisms, was studied with the gram positive
organism A. woodii and the gram negative organism S. ovata. The MIC values of the COEs
under autotrophic conditions of these organisms were respectively 2.5 µM and above the
effective tested range (>5 µM). The concentration of 2.5 µM of COEs was chosen to stain/treat
the cells for 1 h in minimal medium in order to prepare an inoculum for MES reactors.
2.1. MES with A. woodii
2.1.1. Batch 1: MES at -0,6V vs Ag/AgCl (3M KCl)
The influence of COEs on the performance of A. woodii to accept electrons directly from the
cathode was studied by applying a potential at -600 mV (vs Ag/AgCl) using
chronoamperometry. Two reactors were set up at the same time, one inoculated with COE-
stained cells (the experimental reactor) and one control which was inoculated with non-
stained cells (control reactor).
The OD610nm, the indicator for bacterial cell growth, remained in the range of 0.002 and 0.014
for the control reactor and between 0.004 and 0.014 for the experimental reactor. These data
indicate only minimal pelagic bacterial growth in both reactors. In both reactors the pH in the
cathode and anode compartment remained constant over time, respectively around 7 and 2-
3 (Fig 15A and B).
The current density as a function of the time is shown in figure 15E. In the control reactor
current density stabilized at -0.001 mA/cm2 and for the experimental reactor -0.0005 mA/cm2.
In both reactors current densities did not increase over time, thus indicating that the bacteria
were not able to initialize direct electron uptake from the cathode in the presence and
absence of the COEs

38
The cyclic voltammograms (CVs) (Fig 15C and D) recorded at different time points during MES
experiments showed no differences in electrocatalytic profiles for both reactors. The CVs were
recorded at the end of the experiments and before and after microbial inoculation as a
reference. No reduction or oxidation peaks could be observed in CVs of the control reactor.
This indicates that the non-stained A. woodii was not able to facilitate direct electron transfer
from the cathode. For the experimental reactor the presence of COEs in the bacterial
membrane did not exhibit any redox peaks in CVs as well as it did not improve the
bioelectrocatalytic current generation. This indicates that the transmembrane electron
transfer from a solid surface was not initialized by the incorporation of COEs molecules in the
cell membrane of A. woodi.
Over time the concentrations of acetate and formate measured in the catholyte were below
detection limit (<1 mg/L) in both reactors (data not shown). These results suggest that the
incorporation of COEs in the membrane of A woodii did not initialize direct electron transfer
from the cathode to the organisms in order to fix CO2 to acetate. These observations further
confirm the inability of A. woodi to use the electrons directly from the cathode (as an energy
source) as has been reported earlier by Nevin et al 2010 (Nevin et al, 2010a).

39
A B
E
DC
Figure 15: MES with A. woodii at fixed potential of -600 mV vs. Ag/AgCl (3M KCl) : A) PH and OD610 nm evolution over time for reactor with non-stained cells. B) PH and OD610 nm evolution over time for reactor with COEs stained cells. C) cyclic voltammogram at scan rate of 1 mV/s performed before inoculation, after inoculation and at the end of the MES experiment with non-stained cells. D) cyclic voltammogram at scan rate of 1 mV/s performed before inoculation, after inoculation and at the end of the experiment with COEs stained cells. E) /Current density profiles of MES reactors with and without COEs stained cells.

40
2.1.2. Batch 2: MES at -0,6 V and -1V vs Ag/AgCl (3M KCl)
The second batch of the MES experiments with A. woodii was divided into two periods with
different applied cathode potential. In the first period, the applied potential at cathode was
the same as in the first batch experiments. In the second period (after 9 days) the applied
potential of the cathode was set at -1 V. At this potential hydrogen gas will be produced at the
electrode surface, which may act as mediator in the electron transfer. Here the main goal was
to study the effect of the COEs on the hydrogen mediated electron transfer mechanisms and
thus the MES performance of A. woodii. Two reactors were set up at the same time, one
inoculated with COEs stained cells (experimental reactor) and one as control (control reactor)
inoculated with non-stained cells.
A
C
B
D
Figure 16: MES with A. woodii at -0.6 V and -1 V vs. Ag/AgCl (3M KCl): A) PH and OD610 nm
evolution over time for reactor with non-stained cells. B) PH and OD610 nm evolution over time for reactor with COEs stained cells. C) Production of VFAs over time for reactor with non-stained cells at the applied cathode potential. D) Production of VFAs over time for reactor with COEs stained cells at the applied cathode potential. Dotted line indicates applied potential switch
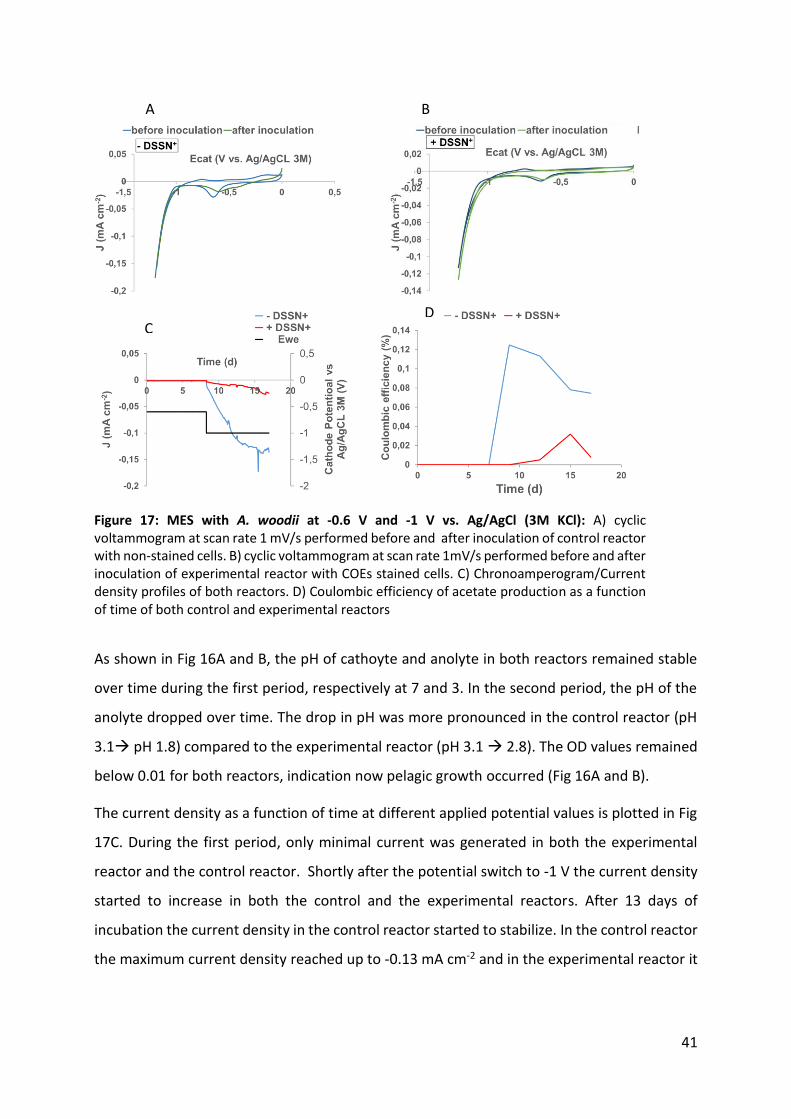
41
As shown in Fig 16A and B, the pH of cathoyte and anolyte in both reactors remained stable
over time during the first period, respectively at 7 and 3. In the second period, the pH of the
anolyte dropped over time. The drop in pH was more pronounced in the control reactor (pH
3.1 pH 1.8) compared to the experimental reactor (pH 3.1 2.8). The OD values remained
below 0.01 for both reactors, indication now pelagic growth occurred (Fig 16A and B).
The current density as a function of time at different applied potential values is plotted in Fig
17C. During the first period, only minimal current was generated in both the experimental
reactor and the control reactor. Shortly after the potential switch to -1 V the current density
started to increase in both the control and the experimental reactors. After 13 days of
incubation the current density in the control reactor started to stabilize. In the control reactor
the maximum current density reached up to -0.13 mA cm-2 and in the experimental reactor it
A
C
B
D
Figure 17: MES with A. woodii at -0.6 V and -1 V vs. Ag/AgCl (3M KCl): A) cyclic voltammogram at scan rate 1 mV/s performed before and after inoculation of control reactor with non-stained cells. B) cyclic voltammogram at scan rate 1mV/s performed before and after inoculation of experimental reactor with COEs stained cells. C) Chronoamperogram/Current density profiles of both reactors. D) Coulombic efficiency of acetate production as a function of time of both control and experimental reactors
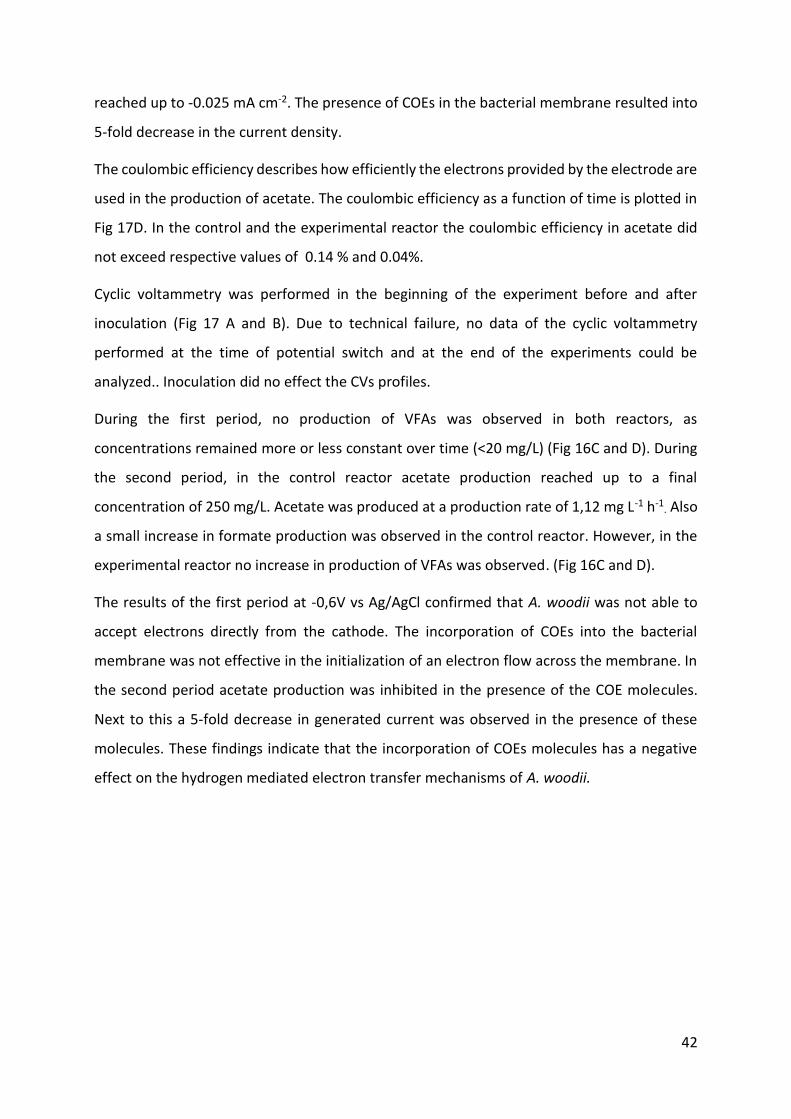
42
reached up to -0.025 mA cm-2. The presence of COEs in the bacterial membrane resulted into
5-fold decrease in the current density.
The coulombic efficiency describes how efficiently the electrons provided by the electrode are
used in the production of acetate. The coulombic efficiency as a function of time is plotted in
Fig 17D. In the control and the experimental reactor the coulombic efficiency in acetate did
not exceed respective values of 0.14 % and 0.04%.
Cyclic voltammetry was performed in the beginning of the experiment before and after
inoculation (Fig 17 A and B). Due to technical failure, no data of the cyclic voltammetry
performed at the time of potential switch and at the end of the experiments could be
analyzed.. Inoculation did no effect the CVs profiles.
During the first period, no production of VFAs was observed in both reactors, as
concentrations remained more or less constant over time (<20 mg/L) (Fig 16C and D). During
the second period, in the control reactor acetate production reached up to a final
concentration of 250 mg/L. Acetate was produced at a production rate of 1,12 mg L-1 h-1. Also
a small increase in formate production was observed in the control reactor. However, in the
experimental reactor no increase in production of VFAs was observed. (Fig 16C and D).
The results of the first period at -0,6V vs Ag/AgCl confirmed that A. woodii was not able to
accept electrons directly from the cathode. The incorporation of COEs into the bacterial
membrane was not effective in the initialization of an electron flow across the membrane. In
the second period acetate production was inhibited in the presence of the COE molecules.
Next to this a 5-fold decrease in generated current was observed in the presence of these
molecules. These findings indicate that the incorporation of COEs molecules has a negative
effect on the hydrogen mediated electron transfer mechanisms of A. woodii.

43
2.2. MES with S. ovata
The influence of COEs on the MES performance of gram negative organism S. ovata was
investigated by applying three different potentials: -0,6V, -1V and -0,6V vs Ag/AgCl (3 M KCl)
at different time points. Two reactors were set up at the same time, one inoculated with COE
stained cells (experimental reactor) and another inoculated with non-stained cells (control
reactor).
The pH of catholyte (pH 7) and anolyte (pH 2-3) remained stable over the period of the whole
experiment in the experimental reactor (Fig 9B). In the control reactor, the pH of both
catholyte and anolyte shifted during the second period (at -1 V) to respective range of 8-9 and
0-1 (Fig 18A).
A
D C
B
Figure 18 MES with S. ovata at -0.6 V and -1 V vs. Ag/AgCl (3M KCl): A) PH and OD610 nm evolution over time for reactor with non-stained cells. B) PH and OD610 nm evolution over time for reactor with COE-stained cells. C) Production of VFAs over time for reactor with non-stained cells at different applied cathode potential values. D) Production of VFAs over time for reactor with COE-stained cells at different applied cathodic potential values. Dotted line indicates potential switch
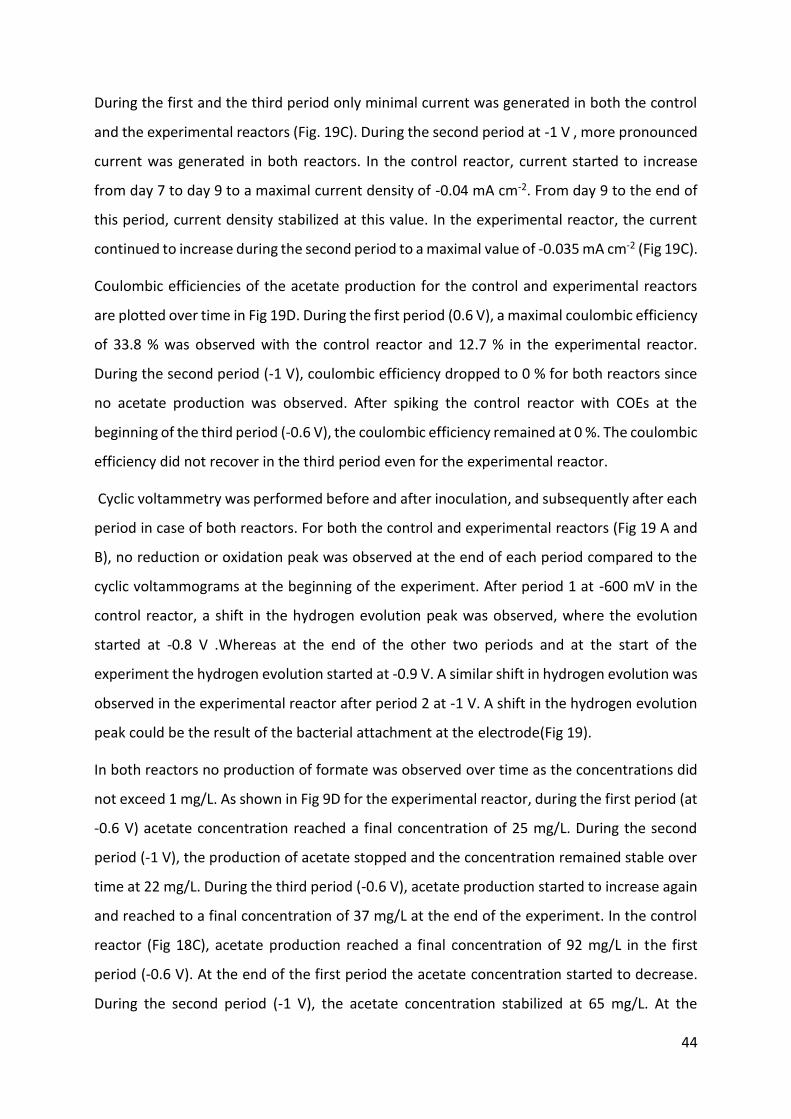
44
During the first and the third period only minimal current was generated in both the control
and the experimental reactors (Fig. 19C). During the second period at -1 V , more pronounced
current was generated in both reactors. In the control reactor, current started to increase
from day 7 to day 9 to a maximal current density of -0.04 mA cm-2. From day 9 to the end of
this period, current density stabilized at this value. In the experimental reactor, the current
continued to increase during the second period to a maximal value of -0.035 mA cm-2 (Fig 19C).
Coulombic efficiencies of the acetate production for the control and experimental reactors
are plotted over time in Fig 19D. During the first period (0.6 V), a maximal coulombic efficiency
of 33.8 % was observed with the control reactor and 12.7 % in the experimental reactor.
During the second period (-1 V), coulombic efficiency dropped to 0 % for both reactors since
no acetate production was observed. After spiking the control reactor with COEs at the
beginning of the third period (-0.6 V), the coulombic efficiency remained at 0 %. The coulombic
efficiency did not recover in the third period even for the experimental reactor.
Cyclic voltammetry was performed before and after inoculation, and subsequently after each
period in case of both reactors. For both the control and experimental reactors (Fig 19 A and
B), no reduction or oxidation peak was observed at the end of each period compared to the
cyclic voltammograms at the beginning of the experiment. After period 1 at -600 mV in the
control reactor, a shift in the hydrogen evolution peak was observed, where the evolution
started at -0.8 V .Whereas at the end of the other two periods and at the start of the
experiment the hydrogen evolution started at -0.9 V. A similar shift in hydrogen evolution was
observed in the experimental reactor after period 2 at -1 V. A shift in the hydrogen evolution
peak could be the result of the bacterial attachment at the electrode(Fig 19).
In both reactors no production of formate was observed over time as the concentrations did
not exceed 1 mg/L. As shown in Fig 9D for the experimental reactor, during the first period (at
-0.6 V) acetate concentration reached a final concentration of 25 mg/L. During the second
period (-1 V), the production of acetate stopped and the concentration remained stable over
time at 22 mg/L. During the third period (-0.6 V), acetate production started to increase again
and reached to a final concentration of 37 mg/L at the end of the experiment. In the control
reactor (Fig 18C), acetate production reached a final concentration of 92 mg/L in the first
period (-0.6 V). At the end of the first period the acetate concentration started to decrease.
During the second period (-1 V), the acetate concentration stabilized at 65 mg/L. At the

45
beginning of the third period, the control reactor was spiked with COEs in order to study the
influence of the staining method and the COEs on the MES performance of the active reactor.
This resulted in further decrease in acetate concentration to values below detection limit (Fig
19C).
A B
DC
Figure 19: MES with S. ovata at -0.6 V and -1 V vs. Ag/AgCl (3M KCl) A) cyclic voltammogram at scan rate of 1 mV/s performed before inoculation, after inoculation and at the end of each period with reactor inoculated with non-stained cells. B) cyclic voltammogram at scan rate of 1 mV/s performed before inoculation, after inoculation and at the end of each period with reactor inoculated with COE- stained cells. C) Chronoamperogram/current density profiles of both reactors D) Coulombic efficiency of acetate production for both reactors
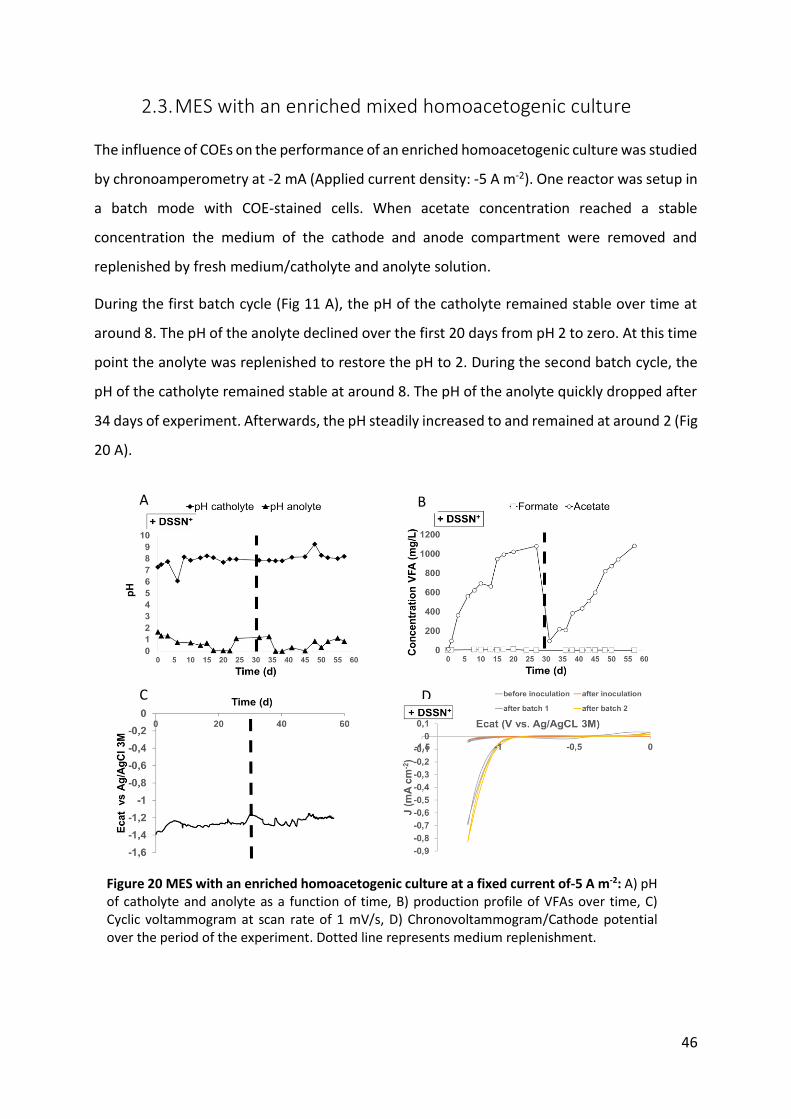
46
2.3. MES with an enriched mixed homoacetogenic culture
The influence of COEs on the performance of an enriched homoacetogenic culture was studied
by chronoamperometry at -2 mA (Applied current density: -5 A m-2). One reactor was setup in
a batch mode with COE-stained cells. When acetate concentration reached a stable
concentration the medium of the cathode and anode compartment were removed and
replenished by fresh medium/catholyte and anolyte solution.
During the first batch cycle (Fig 11 A), the pH of the catholyte remained stable over time at
around 8. The pH of the anolyte declined over the first 20 days from pH 2 to zero. At this time
point the anolyte was replenished to restore the pH to 2. During the second batch cycle, the
pH of the catholyte remained stable at around 8. The pH of the anolyte quickly dropped after
34 days of experiment. Afterwards, the pH steadily increased to and remained at around 2 (Fig
20 A).
C
A B
D
Figure 20 MES with an enriched homoacetogenic culture at a fixed current of-5 A m-2: A) pH of catholyte and anolyte as a function of time, B) production profile of VFAs over time, C) Cyclic voltammogram at scan rate of 1 mV/s, D) Chronovoltammogram/Cathode potential over the period of the experiment. Dotted line represents medium replenishment.
47
As shown in Fig 20B, during the whole experiment only minimal concentrations of formate
were detected (<10 mg/L). During the first batch cycle, acetate reached a maximum
concentration of 1082 mg/L. Acetate was produced at a rate of 1,65 mg L-1h-1. During the
second batch cycle, acetate production reached a maximum value of 1085 mg/L. Acetate was
produced at a rate of 1,58 mg L-1h-1 (Fig 20B)
During the whole experiment, the potential of the cathode remained constant in the range of
-1,2 to -1,4 V (Fig 20C). The results of the cyclic voltammetry performed at a scan rare of 1
mV/S are plotted in fig 20D. After batch cycles 1 and 2 a clear shift in the hydrogen evolution
potential took place, with a shift of the starting potential of the hydrogen evolution from -1 V
(control CVs)to -0.8 V over the period of experiment. This could be attributed to the
attachment of the microorganisms to the cathode material.
Gram staining of the enriched mixed homoacetogenic culture before inoculation indicated the
presence of both gram positive (bleu) and gram negative bacteria (red) (Fig 21A). After the
MES experiment gram staining was again performed on the cathode material and the
catholyte of the reactor. The microscopic images revealed the presence of only gram negative
bacteria on both the cathode and in the reactor medium (Fig 21B & C) thereby suggesting the
inhibition of gram positive organisms by COEs.
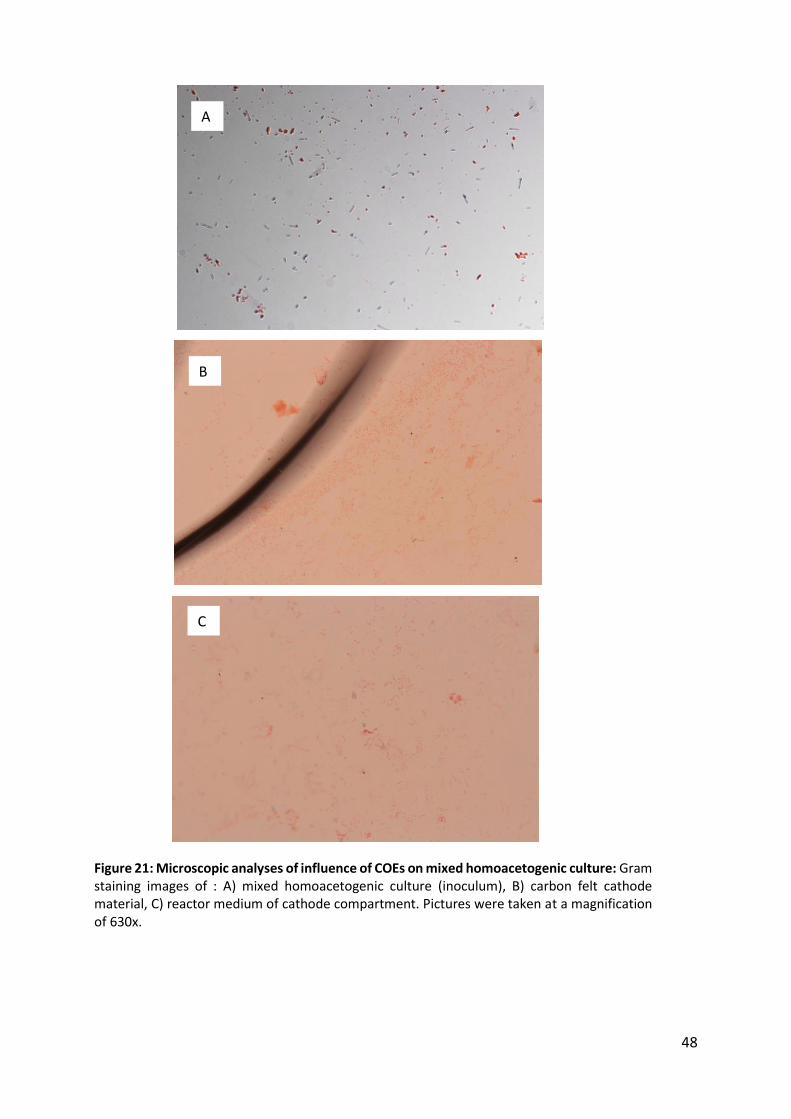
48
Figure 21: Microscopic analyses of influence of COEs on mixed homoacetogenic culture: Gram staining images of : A) mixed homoacetogenic culture (inoculum), B) carbon felt cathode material, C) reactor medium of cathode compartment. Pictures were taken at a magnification of 630x.
C
A
B

49
3. Performance of COEs in heterotrophic BES
The possibility to steer the carbon metabolism by means of altering the potential at the
electrode was studied on the model organism E. coli MG1655 3KO. Switching the electrodes
potential will lead to an alternation of providing electrons to the microorganisms (MES
system) with drawing the electrons from the microorganisms (MFC system). Four reactors
were set up for each batch experiment. Two reactors served as duplicate control reactors and
were inoculated with non-stained cells (reactors 3 & 4), and two were inoculated with COE-
stained cells (reactors 1 & 2) and served as duplicate experimental reactors. Production of
lactate and acetate was monitored in order to investigate the influence of the applied
potential on E. coli 3KO metabolism. The experiments were conducted with the 3KO mutant
in two batches. In the first batch normal minimal medium (see composition attachment D)
was used. In the second batch minimal medium with a low N-source components was used.
This was to limit the bacterial growth/biomass and stimulate the bacterial attachment to the
electrode.
3.1. Batch 1: with standard concentration of N-sources in medium
During the first batch experiments, three different potentials were set at the electrodes in all
four reactors, each varied after two days period. The experiments were conducted in five
different phases as explained further. During the first phase, the potential was set at 0 mV vs
SHE, the electrode thus acting as an anode. During this period, glucose is expected to be
consumed to produce lactate by E. coli 3KO cells. Only minimal acetate is expected to be
produced. At the second phase the electrode potential was set at -400 mV vs. SHE thus leading
to act as a cathode. Here glucose is expected to be consumed in favor to produce acetate.
During the third phase, the potential was again set at 0 mV vs. SHE as in the first phase. During
the fourth phase, the applied potential was set at -800 mV vs SHE. Here an enhancement of
the acetate production is expected. On top of this hydrogen will be produced at the electrode
surface, whichmay act as electron mediator to provide the electrons to the bulk biomass.
During the fifth phase the potential was finally set at 0 mV vs SHE in order to verify the ability
of the cell biomass to produce lactate.
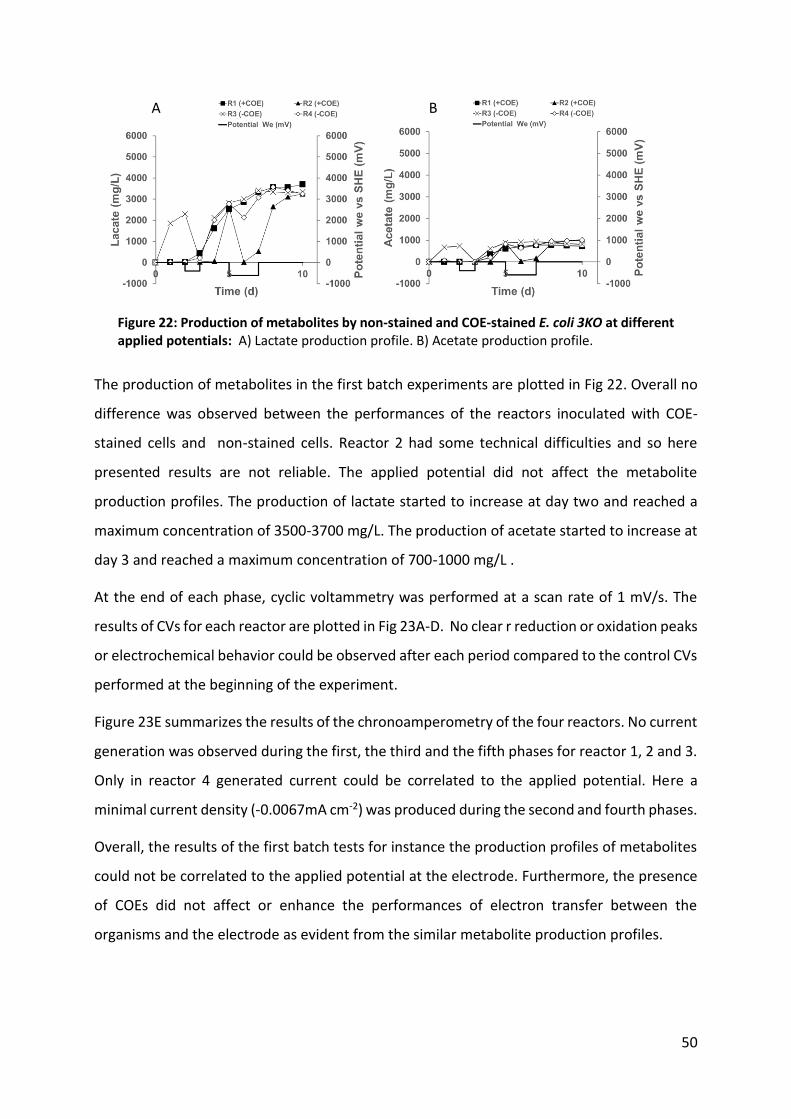
50
The production of metabolites in the first batch experiments are plotted in Fig 22. Overall no
difference was observed between the performances of the reactors inoculated with COE-
stained cells and non-stained cells. Reactor 2 had some technical difficulties and so here
presented results are not reliable. The applied potential did not affect the metabolite
production profiles. The production of lactate started to increase at day two and reached a
maximum concentration of 3500-3700 mg/L. The production of acetate started to increase at
day 3 and reached a maximum concentration of 700-1000 mg/L .
At the end of each phase, cyclic voltammetry was performed at a scan rate of 1 mV/s. The
results of CVs for each reactor are plotted in Fig 23A-D. No clear r reduction or oxidation peaks
or electrochemical behavior could be observed after each period compared to the control CVs
performed at the beginning of the experiment.
Figure 23E summarizes the results of the chronoamperometry of the four reactors. No current
generation was observed during the first, the third and the fifth phases for reactor 1, 2 and 3.
Only in reactor 4 generated current could be correlated to the applied potential. Here a
minimal current density (-0.0067mA cm-2) was produced during the second and fourth phases.
Overall, the results of the first batch tests for instance the production profiles of metabolites
could not be correlated to the applied potential at the electrode. Furthermore, the presence
of COEs did not affect or enhance the performances of electron transfer between the
organisms and the electrode as evident from the similar metabolite production profiles.
B A
Figure 22: Production of metabolites by non-stained and COE-stained E. coli 3KO at different applied potentials: A) Lactate production profile. B) Acetate production profile.

51
B A
D C
E
Figure 23: Electrochemical analysis of first batch experiments with E coli 3KO: Cyclic voltammograms recorded at 1 mV/s before inoculation and after each phase of the experiment for A) reactor 1 +COEs, B) reactor 2 +COEs ,C) reactor 3 -COEs, and D) reactor 4 –COEs.. E) Chronoamperogram/Current density profiles of the four reactors at different applied potentialsas a function of time.
52
3.2. Batch 2: with low concentrations of N-source in medium
Based on the results obtained in the first batch of experiments, the approach was adapted to
limit microbial growth and have a lower amount of bulk organisms in the reactors. The aim
was to facilitate the attachment of the cells to electrode and get limited biomass in the
reactor. To achieve this, the concentration of N-sources was limited through a 500 times
dilution of the NH4Cl concentration and the replacement of (NH2)4 SO4 by Na2SO4 in the growth
medium. The electrode potential was set at 0.2 V vs SHE initially to ensure the biofilm
formation on the electrode. After two days of chronoamperometry, the reactor medium was
removed to remove the planktonic microorganisms. Afterwards, the reactor was filled with
standard minimal medium. Amongst the four reactors set up two reactors served as control
reactors and were inoculated with non-stained cells (reactors 3 & 4) and two were inoculated
with COE-stained cells (reactors 1 & 2).
The applied potentials during the different phases of experiment were changed to more
extreme potentials in order to have more pronounced electron donating and withdrawing
characteristics. The first phase consisted of the attachment of cells on the electrode material.
During the second phase, the potential of the electrode was set at 0 V vs SHE for allowing the
microorganisms to form a dense growth on the electrode surface. During the third phase, the
electrode potential was set at -0.4 V vs SHE in order to drive the carbon flux towards the
production of acetate. During the fourth phase, the potential was set at 0.2 V vs SHE, as in the
first phase, with the aim to drive the carbon flux towards the production of lactate. During the
fifth phase, the potential of the electrode was set at -1.2 V vs SHE, so hydrogen would be
produced at the electrode surface and could act as mediator for electron transport.
The results of metabolite production at different applied potential are presented in Fig 24.
During the first phase, no lactate or formate was observed in reactors 1, 3 and 4. Reactor 2
did produce 105 mg/L of lactate. At the beginning of the second phase, lactate production
started in only reactor 4, and acetate production started in reactors 2 and 4. At the end of
second phase, lactate and acetate production started in both reactors 1 and 3. During the
followed phase, acetate was produced in equal amounts in all reactors. The production of
lactate in the reactor 2 dropped at the beginning of the fourth phase. Reactors 1, 2 and 4
produced an equal amount of lactate during the rest of the experiment, and reached a final
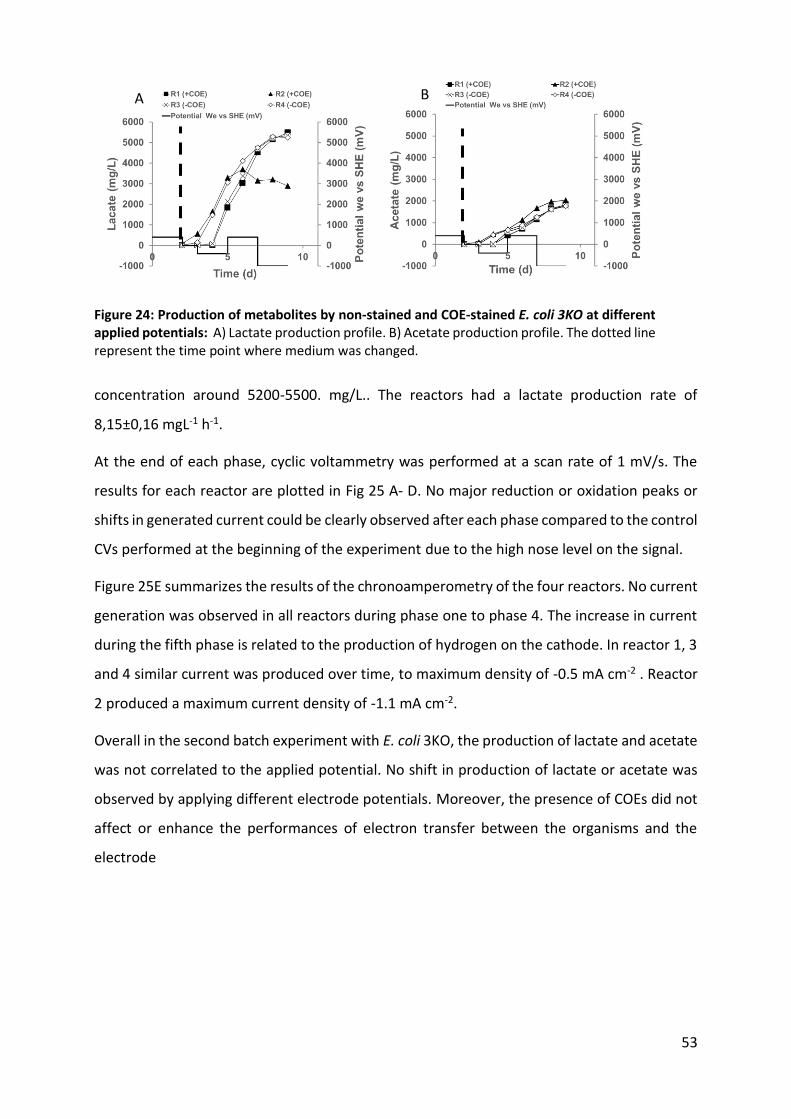
53
concentration around 5200-5500. mg/L.. The reactors had a lactate production rate of
8,15±0,16 mgL-1 h-1.
At the end of each phase, cyclic voltammetry was performed at a scan rate of 1 mV/s. The
results for each reactor are plotted in Fig 25 A- D. No major reduction or oxidation peaks or
shifts in generated current could be clearly observed after each phase compared to the control
CVs performed at the beginning of the experiment due to the high nose level on the signal.
Figure 25E summarizes the results of the chronoamperometry of the four reactors. No current
generation was observed in all reactors during phase one to phase 4. The increase in current
during the fifth phase is related to the production of hydrogen on the cathode. In reactor 1, 3
and 4 similar current was produced over time, to maximum density of -0.5 mA cm-2 . Reactor
2 produced a maximum current density of -1.1 mA cm-2.
Overall in the second batch experiment with E. coli 3KO, the production of lactate and acetate
was not correlated to the applied potential. No shift in production of lactate or acetate was
observed by applying different electrode potentials. Moreover, the presence of COEs did not
affect or enhance the performances of electron transfer between the organisms and the
electrode
B A
Figure 24: Production of metabolites by non-stained and COE-stained E. coli 3KO at different applied potentials: A) Lactate production profile. B) Acetate production profile. The dotted line represent the time point where medium was changed.
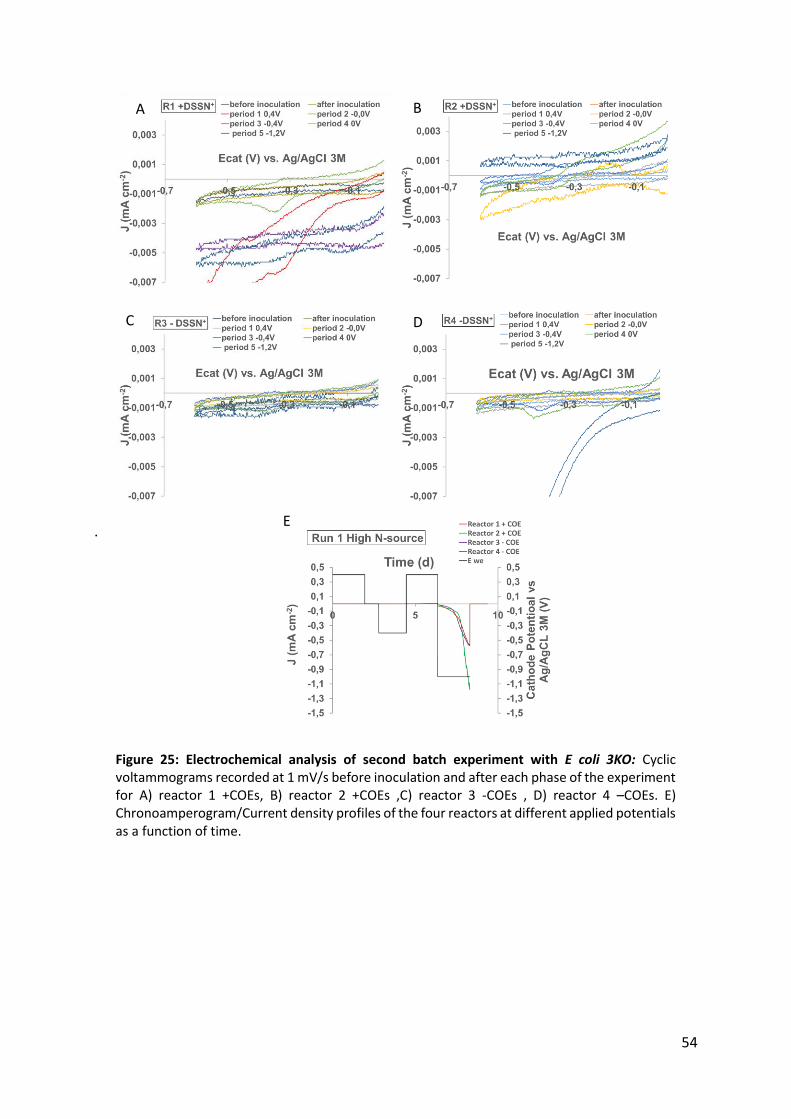
54
.
A B
C D
E
Figure 25: Electrochemical analysis of second batch experiment with E coli 3KO: Cyclic voltammograms recorded at 1 mV/s before inoculation and after each phase of the experiment for A) reactor 1 +COEs, B) reactor 2 +COEs ,C) reactor 3 -COEs , D) reactor 4 –COEs. E) Chronoamperogram/Current density profiles of the four reactors at different applied potentials as a function of time.

55
Chapter 4: Discussion
Over the past decades, the platform of BES has been developed in order to provide possible
answers to the 21st century evolution in energy production and consumption demands
(Arends & Verstraete, 2012; Patil et al, 2012). In this area of research the sub platform of MES
has gained attention because it creates the possibility to convert electrical energy into high
energy containing organic compounds or a high value product. This makes it possible to bypass
the inherent problems of storing the electric energy in a sustainable way (Rabaey & Rozendal,
2010). Nevin and colleagues (2010) have given the proof of principle of the MES platform. Still
a great effort has to be made to understand the basic principles in order to optimize the MES
platform’s performance. This thesis focused on the implementation of COEs in MES to
enhance the electron transfer between the electrode and the microorganisms.
The first research objective focused on the use of COEs in facilitating cathodic electron transfer
for improving MES of acetate from CO2.
1. Toxicity study: Influence of COEs on cell viability
The difference in bacterial culture viability was studied upon the incorporation of COEs into
the different cell wall structures of gram positive and negative bacteria. Tested on A. woodii
and S. ovata to determine the MIC values. The organisms were respectively chosen as they
were proven to be able to use direct electron transfer mechanisms and hydrogen mediated
electron transfer mechanism to accept electrons form an electrode (Nevin et al, 2010b). These
organisms were further studied for investigating the influence of the implementation of COEs
in the autotrophic MES experiments. The MIC tests were performed on both the heterotrophic
and autotrophic growth media. Next to this the MIC value was determined for E coli MG1655
3KO, which was further used to study the influence of the applied potential on the carbon flux
during fermentation.
The MIC tests for the gram positive bacterium A. woodii indicated a clear inhibition of cell
growth and production of acetate at concentrations above 2.5 µM in both the heterotrophic
and autotrophic growth conditions. The MIC tests for the gram negative bacterium S. ovata
did not result in an inhibitory concentration (>10 µM) in cell growth and acetate production
on the heterotrophic growth conditions. On autotrophic growth conditions the MIC value on
56
cell growth could not be determined due to the prolonged lag phase. But the production of
acetate started for all concentrations at day three of incubation indicating that concentrations
up to 5 µM were not inhibiting cell viability. The gram negative organism E. coli MG 1655 3KO,
which was only tested on minimal medium, was not inhibited in cell growth and in lactate
production up to concentrations of 50 µM. No MIC values for COE could be found in the
literature on gram positive bacteria, for gram negative bacteria similar MIC values were found
(Hou et al, 2013; Wang et al, 2013a; Hinks et al, 2014a).
These results indicate different toxic effects of the incorporation of the COEs into the bacterial
membrane between gram positive and gram negative organisms. The cell wall structure of a
gram positive bacterium consist of a cytoplasmic phospholipid bilayer and a thick (20-80nm)
peptidoglycan layer and an S-layer attached to the peptidoglycan layer. The S-layer is directly
linked to the outer membrane, which contains purines. Gram negative bacteria possess two
phospholipid bilayer membranes, known as the outer membrane and the inner membrane.
These two membranes are separated by a periplasmic space. Between these membranes a
peptidoglycan layer (7-8nm) is situated, this is consistency thinner compared to the gram
positive bacteria. The difference in toxicity could be the direct result of these differences in
cell wall structures. When a gram negative organism is stained with COEs, these molecules will
first insert into the outer membrane. Due to their amphiphilic properties it is
thermodynamically favoured to stay in the outer membrane (Garner et al, 2010a). To reach
the inner membrane, the COE molecules need first to migrate through the porins, as these
porins may form a physical barrier. The chance that a COE molecule will be incorporated into
the outer membrane will be higher compared to the chance of incorporation into the inner
membrane. By this way, COEs may primarily induce an electron schuttling mechanism in the
outer membrane of gram negative bacteria. As gram positive bacteria do not possess an outer
membrane, the COE molecules will only be able to incorporate into the single membrane.
Hinks and colleagues (2014) studied the effect of incorporation of membrane inserting
molecules (MIM) by molecular dynamic modelling, a tool that describes fundamental atomic-
level intermolecular interactions with a high resolution. MIM is a broad class of molecules that
consist both conjugated oligoelectrolytes and small antimicrobial agents, both groups share
the property to insert spontaneously into the bacterial membrane. They reported no
significant disruption of membrane order up to ratios of lipid to DSSN+ of 32:1. Their toxicity

57
tests conducted on E. coli K12 resulted in an MIC value for DSSN+ of 64 µM. This can be
compared to the results on E. coli MG 1655 3KO, which was not inhibited up to concentrations
of 50 µM in this study. According to their study two main factors determine the toxicity of
these molecules: 1) the length of the molecule must be compatible with the thickness of the
membrane bilayer, and 2) the degree to which membranes are pinched together upon the
intercalation of COEs can be designed by allowing greater range of movement of the
molecules within the bilayer (Hinks et al, 2014b). As COE might be present in higher
concentrations in the outer membrane of gram negative bacteria, this pinching of the
membrane would be less destructivein comparison to gram positive bacteria. As the outer
membrane of gram negative bacteria already contains porins. Making porins in the gram
positive bacteria cell membrane would directly lead to cell lysing.
Wenzel and colleagues (2014) studied the effect of small cationic antimicrobial peptides rich
in arginine and tryptophan residues on gram positive bacteria. The integration of the peptides
in the bacterial membrane caused delocalization of the peripheral membrane proteins
essential for respiration and cell-wall biosynthesis. The integration of the small cationic
peptides resulted in a thinner cell wall and by this losing its integrity resulting in cell-wall
lesions. Another observed effect was the impact on the energy metabolism with a reduction
up to 70% of ATP levels. In the work of Wenzel et al. (2014) these peptides did not directly
inhibit the ATP synthase activity but affected the respiratory chain upstream of ATP synthase.
It was found that the intercalation of the small cationic peptides resulted in the detachment
of the cytochrome c from the outer membrane leaflet, which lead to a breakdown of the
membrane potential and subsequent energy limitation. The toxic effects of the intercalation
of the small cationic peptides affected mostly gram positive bacteria, whereas it only has a
moderately toxic effect on gram negative organisms (Wenzel et al, 2014). This findings could
suggest a correlated mode of action of the intercalation of COEs on the different toxic effect
these molecules showed on gram positive organisms compared to gram negative organisms.
Structure comparison of these peptides an molecules reveal some similarities in the general
configuration and physical properties, but the peptides are generally larger (Fig 26). Where A.
woodii was inhibited at a concentration of 2.5 µM in cell growth and production of acetate,
the MIC concentration of COEs for S. ovata and E coli MG1655 3KO exceeded respectively of
10 µM and 50 µM.
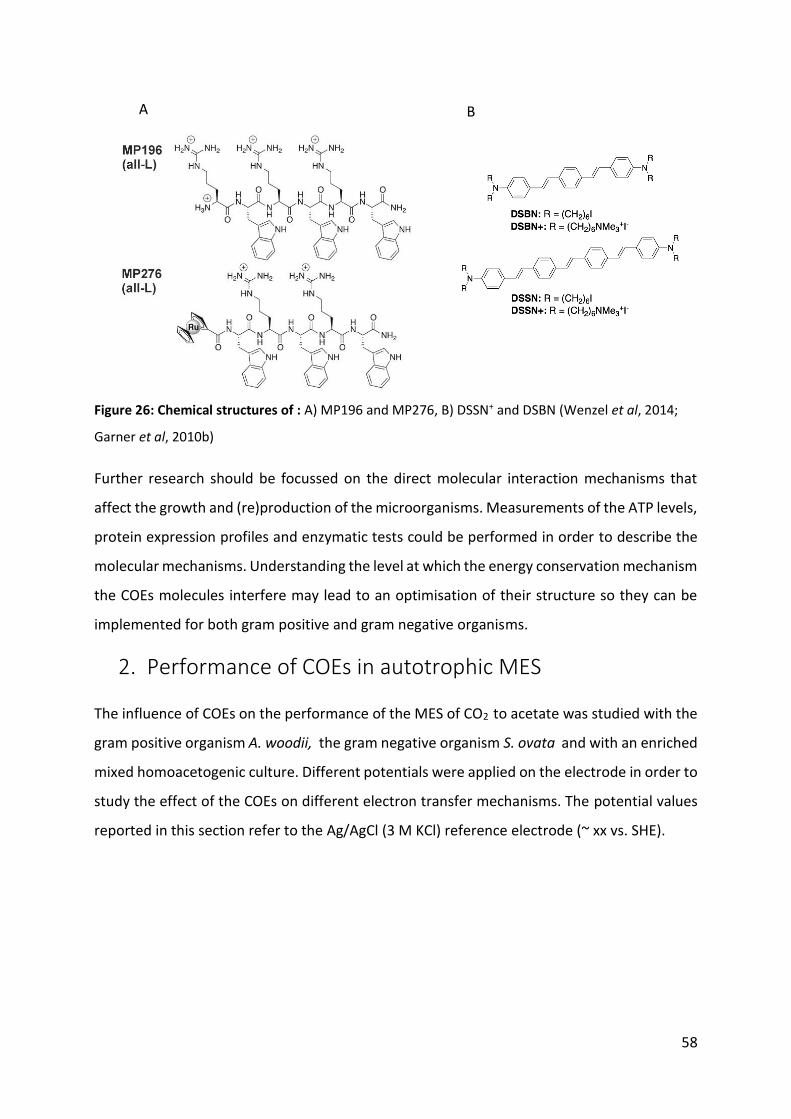
58
Further research should be focussed on the direct molecular interaction mechanisms that
affect the growth and (re)production of the microorganisms. Measurements of the ATP levels,
protein expression profiles and enzymatic tests could be performed in order to describe the
molecular mechanisms. Understanding the level at which the energy conservation mechanism
the COEs molecules interfere may lead to an optimisation of their structure so they can be
implemented for both gram positive and gram negative organisms.
2. Performance of COEs in autotrophic MES
The influence of COEs on the performance of the MES of CO2 to acetate was studied with the
gram positive organism A. woodii, the gram negative organism S. ovata and with an enriched
mixed homoacetogenic culture. Different potentials were applied on the electrode in order to
study the effect of the COEs on different electron transfer mechanisms. The potential values
reported in this section refer to the Ag/AgCl (3 M KCl) reference electrode (~ xx vs. SHE).
A B
Figure 26: Chemical structures of : A) MP196 and MP276, B) DSSN+ and DSBN (Wenzel et al, 2014;
Garner et al, 2010b)

59
2.1. MES with A. woodii
In the first batch setup, the influence of COEs on the production of acetate from CO2 was
studied by applying an electrode potential of -0.6V. Electron transfer from the cathode
through the microorganisms should thus be established by either direct electron transfer or
by the production of self-secreted mediators. No acetate or formate was produced during the
first batch experiment. As the cyclic voltammograms did not contain any reduction or
oxidation peak, no self-secreted mediators were produced to establish the electron transfer.
Over time no reduction current was generated indicating no electrons were captured from
the electrode surface. In both the reactors (+ and – COE) no electron transfer took place from
the electrode surface in order to produce acetate. In the presence or absence of COEs, A.
woodii could not establish a direct electron transfer mechanism with the electrode. This
confirms the excisting literature, until now no direct electrons transfer mechanisms were
observed in A woodii. Only the hydrogen mediated electron transfer has been proven (BALCH
et al, 1977)
In the second batch setup during the first period the electrode potential was set at -600 mV.
This experiment acted as a repetition of the first batch setup experiments. The results lead to
the identical observations of the first batch. Here again, A. woodii was not able to establish a
direct electron transfer mechanism with the electrode. During the second period, the
electrode potential was set at -1 V . At this potential hydrogen will be produced at the
electrode surface, and could act as an electron mediator. At the start of the second period,
the production of acetate started to increase in the reactor without COEs. In the reactor
containing COEs no acetate production could be observed. The generated reduction current
in the reactor without COEs was approximately 10 times higher compared to the reactor with
COEs stained cells. The coulombic efficiency of acetate production reached a maximum value
of 0.14% in the reactor with non-stained cells and 0.04% in the reactor with COE-stained cells.
During the second period, A. woodii was able to accept electrons form the electrode in order
to produce acetate via a hydrogen mediated electron transfer mechanism. The presence of
COEs had a negative effect on the hydrogen mediated electron transfer mechanisms of A.
woodii. Interestingly, in the absence of an electrode under autotrophic growth conditions, A.
woodii is able to produce acetate in the presence of 2.5µM of COEs as shown during the MIC
tests. When the same condition is adopted in the reactor configuration and the electrons are

60
provided via the production of hydrogen at the electrode, instead of providing hydrogen to
the gas phase, no acetate is produced. In the batch in the penicillin bottles setup, the
concentration of hydrogen will be very low (0.0016 g/L at standard conditions.). At the
electrode higher concentrations of hydrogen will be in contact to the microorganisms, here it
could be possible that an overload of electrons is provided to the microorganisms. If the COEs
have an effect on the downstream electron transport chain, an unbalance of electrons will
accumulate over the bacterial membrane. By this the energy conserving pathways could be
disordered and have an effect on the production pathways of acetate in A. woodii (Wenzel et
al, 2014). This hypothesis should be further investigated.
2.2. MES with S. ovata
The study on the influence of COEs on the performance of a gram negative microorganism in
the MES of acetate form CO2 was performed with S. ovata. During the first period the
electrode was set at-0,6V, to investigate the effect of COEs on direct electron transfer
mechanisms. In both reactors (+ and – COE) acetate was produced, however the maximum
concentrations detected over time were more than 2 times higher in the control reactor (92
mg/L) compared to the experimental reactor. By the end of the first period, acetate
concentrations started to decline in the control reactor and to stabilize in experimental
reactor. During the second period the electrode was set at -1V, to investigate the effect on
hydrogen mediated electron transfer mechanisms. In both control and experimental reactor
the acetate concentrations stabilized respectively at a concentration of 65 mg/L and 22 mg/L.
This indicates that S. ovata was not able to accept electrons via a hydrogen mediated electron
transfer mechanism during this experiments, however being capable . At the end of the
second period the presence of viable cells in the reactor medium was checked by flow
cytometry, in order to be certain that viable cells were still present. As this was positively
confirmed, the control reactor was spiked with COEs to a final concentration of 2.5 µM. This
was investigated in order to confirm that the applied staining method did not affect the
outcome of the experiments. During this in-situ staining experiment the potential of the
electrode was set at -600mV. In the control reactor acetate concentrations drastically
dropped. This indicates that S. ovata was not able to restore the direct electron transfer
mechanisms as a direct consequence of the presence of COEs. In the experimental reactor
acetate started slightly to increase at the end of the experiment. This reduced production of

61
acetate could be the effect of the applied potential during the second period. Here, the
production of hydrogen gas at the electrode surface could cause a washout of the attached
biofilm to the electrode surface. By this a prolonged time in order to re-establishing the direct
electron transfer mechanism could be the direct cause of the delay in acetate production.
The experiments performed on S. ovata resulted in the conclusion that implementation of
COEs had adverse effect on the proven direct electron transfer mechanisms from the
electrode to the microorganisms (Nevin et al, 2010a).
2.3. MES with mixed homoacetogenic culture
The experiment on the implementation of COEs in the MES of acetate from CO2 with an
enriched homoacetogenic culture was performed in order to study the influence of combined
use of gram negative and positive bacteria.
The experiment was performed in batch mode at a constant applied current of-5 A/m² for
providing a constant flux of electrons leaving the electrode. When the concentration of
acetate stabilized/became constant over time, the reactor medium was partially refreshed in
order to start the second batch cycle. The acetate production in the first batch cycle was
comparable to the acetate production in the second batch cycle (Fig 20). At several time points
during the reactor operation, the presence of COE-stained cells was confirmed by microscopic
analysis (data not shown). Although at the end the intensity of the signal of COEs was very
low, probably due to the fact that the total surface area of bacterial membrane increase in
time through growth, the bacterial cells still contained COEs in their membranes.
The start-up inoculum, and the electrode and reactor medium samples at the end of batch
cycle 2 were analysed for the presence of gram positive and gram negative bacteria via
microscopic analysis of gram stained samples. The images taken form the start-up inoculum
clearly indicated the presence of both gram positive and negative types of organisms (fig 20).
The images at the end could only reveal the presence of gram negative bacteria. It appears
that the presence of COEs have a negative effect on the viability of gram positive bacteria. By
this they are outcompeted by the gram negative bacteria. These results are comparable to the
results of Wenzel and colleagues, where small cationic peptides as antimicrobial agent seem
more effective on gram positive bacteria (Wenzel et al, 2014). These results also confirm the

62
results out of the experiments performed on A. woodii and S. ovata Still these results have to
be compared to a setup which is inoculated with non-stained cells.
3. Performance of COEs in heterotrophic BES
A second research objective focused on the implementation of COEs in the attempt to alter
the carbon flux in E. coli MG1655 to different end products of the fermentation metabolism,
lactate and acetate. Acetate is produced to get rid of the excess of reducing equivalents under
high glucose conditions (De Mey et al, 2007). The aim was to control acetate production by
providing an electrode to either collect the excess of electrons at high potentials and stimulate
lactate production or to enhance the acetate production by applying a low potential, so
electrons are provided to the organisms. The main strategy was based on the followed
publication:
Hou and colleagues (2013) reported the use of COEs in E coli K12 to induce electron transfer
mechanisms in the anode compartment. The incorporation of COEs in the bacteria led to an
18 fold improvement in generated power (2.7mW/m² in the DSSN+ reactor vs. 0.15 mW/m²
in the control reactor) (Hou et al, 2013). Sasaki and colleagues (2014) reported the use of
Corynebacterium glutamicum in a MES setup to enhance the lactate yield from glucose. They
reported an increase of 67% in lactate yield (1.10 ± 0.03 compared to 1.62 ± 0.04 mol
product/mol glucose) when an electrode was provided at -0.6V. Anthraquinone 2,6-
disulfonate (0.2 mM) was used as a mediator to facilitate electron transfer(Sasaki et al, 2014).
Other approached applied a strategy of genetic modification in order to inhibit the acetate
production pathways. Directly knock out the enzymes responsible for the production of
acetate should reduce the production. De Mey and colleagues reported the genetic
modification of E. coli MG1655. Modifications were made in the acetate production pathways,
resulting in a triple knockout strain (ΔackApta,ΔpoxB), in order to limit the acetate production
. This approach succeeded in the decrease of 7,6 times the acetate yields (De Mey et al, 2007).
In this work the aim was to compare the profiles of fermentation metabolites of E. coli WT vs.
3KO as a function of the applied electrode potential. Results of the first batch experiments on
the 3KO strain did not result in a correlation of lactate or acetate produced to the applied
potentials. In the second batch experiment a selection procedure was made to favour the
attachment of organisms to the electrode surface. This was achieved by operating the
63
experiment at high electrode potential (0,2V vs SHE)on minimal medium which was depleted
in N-sources, before the main experimental periods. The results of the second batch did not
resulting a correlation between the acetate and lactate produced and the applied potentials.
In both batches no influence of the implementation of COEs could be observed on the
production profiles of lactate and acetate.
Out of these experiments no conclusions could be made on the possibility to control the
carbon flux in E. coli by providing an electrode set at varying potentials. The main problem
observed in the applied strategy was the overgrowth of the reactors by pelagic organisms.
Attempts made to reduce this overgrowth did not succeed. Further research should be carried
out to optimize the experimental strategy or the reactor design in order to be able to control
the carbon flux by providing an electrode set at different potentials.
64
4. General conclusion
This thesis focussed on the implementation of COEs in order to enhance BES performances.
Several studies reported the beneficial properties these molecules possess to enhance the
electron transfer capacities of bacteria in BESs (Hou et al, 2013; Thomas et al, 2013a).
Two main research objectives were studied:
1) The implementation of COEs for the improvement of electron transfer mechanisms
from the cathode to the microorganisms in MES reactors did not improve the acetate
production by the organisms A. woodii and S. ovata. Contradictory to the hypothesis,
the presence of these molecules had an adverse effect on the hydrogen mediated
electron transfer mechanisms towards A. woodii and the direct electron transfer
mechanisms toward S. ovata. Next to this, the presence of COEs had a higher negative
affect on gram positive organisms compared to gram negative organisms as tested in
a mixed microbial community. These results indicate that more research has to be
carried out on the mode of action of these molecules on the energy conserving
pathways of the organisms. This knowledge could be used in the engineering of
electron transfer mechanisms into microorganisms in order to enhance their
performance in MES applications.
2) Implementation of COEs was studied in the attempt to steer the carbon flux of E. coli
MG1655. The followed research strategy did not succeed in establishing a control
mechanism for the carbon flux by providing an electrode at different potentials.
Further research has to be carried out in the optimisation of the research strategy and
reactor design.
65
Bibliography Arends JBA & Verstraete W (2012) 100 years of microbial electricity production: three
concepts for the future. Microb. Biotechnol. 5: 333–346 Available at: http://doi.wiley.com/10.1111/j.1751-7915.2011.00302.x [Accessed August 7, 2014]
Armstrong FA & Fontecilla-Camps JC (2008) Biochemistry. A natural choice for activating hydrogen. Science 321: 498–9 Available at: http://www.ncbi.nlm.nih.gov/pubmed/18653870 [Accessed May 8, 2014]
BALCH WE, SCHOBERTH S, TANNER RS & WOLFE RS (1977) Acetobacterium, a New Genus of Hydrogen-Oxidizing, Carbon Dioxide-Reducing, Anaerobic Bacteria. Int. J. Syst. Bacteriol. 27: 355–361 Available at: http://ijs.sgmjournals.org/cgi/doi/10.1099/00207713-27-4-355 [Accessed August 22, 2014]
Beech IB & Sunner J (2004) Biocorrosion: towards understanding interactions between biofilms and metals. Curr. Opin. Biotechnol. 15: 181–6 Available at: http://www.ncbi.nlm.nih.gov/pubmed/15193324 [Accessed July 21, 2014]
Butler CS, Clauwaert P, Green SJ, Verstraete W & Nerenberg R (2010) Bioelectrochemical perchlorate reduction in a microbial fuel cell. Environ. Sci. Technol. 44: 4685–91 Available at: http://www.ncbi.nlm.nih.gov/pubmed/20476736 [Accessed July 30, 2014]
Caspeta L, Buijs N a. a. & Nielsen J (2013) The role of biofuels in the future energy supply. Energy Environ. Sci. 6: 1077 Available at: http://xlink.rsc.org/?DOI=c3ee24403b [Accessed January 29, 2014]
Cheng S, Xing D, Call DF & Logan BE (2009) Direct biological conversion of electrical current into methane by electromethanogenesis. Environ. Sci. Technol. 43: 3953–8 Available at: http://www.ncbi.nlm.nih.gov/pubmed/19544913
Clauwaert P, Aelterman P, Pham TH, De Schamphelaire L, Carballa M, Rabaey K & Verstraete W (2008) Minimizing losses in bio-electrochemical systems: the road to applications. Appl. Microbiol. Biotechnol. 79: 901–13 Available at: http://www.ncbi.nlm.nih.gov/pubmed/18506439 [Accessed May 25, 2014]
Cracknell JA, Vincent KA & Armstrong FA (2008) Enzymes as working or inspirational electrocatalysts for fuel cells and electrolysis. Chem. Rev. 108: 2439–61 Available at: http://www.ncbi.nlm.nih.gov/pubmed/18620369 [Accessed May 8, 2014]
Desloover J, Arends JB a, Hennebel T & Rabaey K (2012) Operational and technical considerations for microbial electrosynthesis. Biochem. Soc. Trans. 40: 1233–8 Available at: http://www.ncbi.nlm.nih.gov/pubmed/23176460 [Accessed January 21, 2014]
El-Naggar MY, Wanger G, Leung KM, Yuzvinsky TD, Southam G, Yang J, Lau WM, Nealson KH & Gorby YA (2010) Electrical transport along bacterial nanowires from Shewanella
66
oneidensis MR-1. Proc. Natl. Acad. Sci. U. S. A. 107: 18127–31 Available at: http://www.pubmedcentral.nih.gov/articlerender.fcgi?artid=2964190&tool=pmcentrez&rendertype=abstract [Accessed May 2, 2014]
Freguia S, Tsujimura S & Kano K (2010) Electron transfer pathways in microbial oxygen biocathodes. Electrochim. Acta 55: 813–818 Available at: http://www.sciencedirect.com/science/article/pii/S0013468609011864 [Accessed May 7, 2014]
Garner LE, Park J, Dyar SM, Chworos A, Sumner JJ & Bazan GC (2010a) Modification of the optoelectronic properties of membranes via insertion of amphiphilic phenylenevinylene oligoelectrolytes. J. Am. Chem. Soc. 132: 10042–52 Available at: http://www.ncbi.nlm.nih.gov/pubmed/20608655
Garner LE, Park J, Dyar SM, Chworos A, Sumner JJ & Bazan GC (2010b) Modification of the optoelectronic properties of membranes via insertion of amphiphilic phenylenevinylene oligoelectrolytes. J. Am. Chem. Soc. 132: 10042–52 Available at: http://www.ncbi.nlm.nih.gov/pubmed/20608655
Garner LE, Thomas AW, Sumner JJ, Harvey SP & Bazan GC (2012) Conjugated oligoelectrolytes increase current response and organic contaminant removal in wastewater microbial fuel cells. Energy Environ. Sci. 5: 9449 Available at: http://xlink.rsc.org/?DOI=c2ee22839d [Accessed May 13, 2014]
Geelhoed JS, Hamelers HVM & Stams AJM (2010) Electricity-mediated biological hydrogen production. Curr. Opin. Microbiol. 13: 307–15 Available at: http://www.ncbi.nlm.nih.gov/pubmed/20206577 [Accessed February 18, 2014]
Gorby YA, Yanina S, McLean JS, Rosso KM, Moyles D, Dohnalkova A, Beveridge TJ, Chang IS, Kim BH, Kim KS, Culley DE, Reed SB, Romine MF, Saffarini DA, Hill EA, Shi L, Elias DA, Kennedy DW, Pinchuk G, Watanabe K, et al (2006) Electrically conductive bacterial nanowires produced by Shewanella oneidensis strain MR-1 and other microorganisms. Proc. Natl. Acad. Sci. U. S. A. 103: 11358–63 Available at: http://www.pubmedcentral.nih.gov/articlerender.fcgi?artid=1544091&tool=pmcentrez&rendertype=abstract [Accessed April 28, 2014]
Gregory KB, Bond DR & Lovley DR (2004) Graphite electrodes as electron donors for anaerobic respiration. Environ. Microbiol. 6: 596–604 Available at: http://www.ncbi.nlm.nih.gov/pubmed/15142248 [Accessed January 23, 2014]
Hall PJ & Bain EJ (2008) Energy-storage technologies and electricity generation. Energy Policy 36: 4352–4355 Available at: http://linkinghub.elsevier.com/retrieve/pii/S0301421508004497 [Accessed April 29, 2014]
Herland A, Nilsson KPR, Olsson JDM, Hammarström P, Konradsson P & Inganäs O (2005) Synthesis of a regioregular zwitterionic conjugated oligoelectrolyte, usable as an optical probe for detection of amyloid fibril formation at acidic pH. J. Am. Chem. Soc. 127:
67
2317–23 Available at: http://www.ncbi.nlm.nih.gov/pubmed/15713111 [Accessed May 12, 2014]
Hinks J, Wang Y, Poh WH, Donose BC, Thomas AW, Wuertz S, Loo SCJ, Bazan GC, Kjelleberg S, Mu Y & Seviour T (2014a) Modeling cell membrane perturbation by molecules designed for transmembrane electron transfer. Available at: http://www.ncbi.nlm.nih.gov/pubmed/24499294 [Accessed May 5, 2014]
Hinks J, Wang Y, Poh WH, Donose BC, Thomas AW, Wuertz S, Loo SCJ, Bazan GC, Kjelleberg SLA, Mu Y & Seviour TW (2014b) Modeling the Membrane Insertion of Molecules Designed for Transmembrane Electron Transfer. Available at: http://www.ncbi.nlm.nih.gov/pubmed/24499294 [Accessed February 10, 2014]
Hou H, Chen X, Thomas AW, Catania C, Kirchhofer ND, Garner LE, Han A & Bazan GC (2013) Conjugated oligoelectrolytes increase power generation in E. coli microbial fuel cells. Adv. Mater. 25: 1593–7 Available at: http://www.ncbi.nlm.nih.gov/pubmed/23345125 [Accessed February 12, 2014]
Huang L, Regan JM & Quan X (2011) Electron transfer mechanisms, new applications, and performance of biocathode microbial fuel cells. Bioresour. Technol. 102: 316–23 Available at: http://www.ncbi.nlm.nih.gov/pubmed/20634062 [Accessed April 30, 2014]
Ibrahim H, Ilinca a & Perron J (2008) Energy storage systems—Characteristics and comparisons. Renew. Sustain. Energy Rev. 12: 1221–1250 Available at: http://linkinghub.elsevier.com/retrieve/pii/S1364032107000238 [Accessed April 28, 2014]
IEA (2013a) CO2 EMISSIONS FROM FUEL COMBUSTION
IEA (2013b) Key World Energy Statistics. : 79
Inoue K, Qian X, Morgado L, Kim B-C, Mester T, Izallalen M, Salgueiro CA & Lovley DR (2010) Purification and characterization of OmcZ, an outer-surface, octaheme c-type cytochrome essential for optimal current production by Geobacter sulfurreducens. Appl. Environ. Microbiol. 76: 3999–4007 Available at: http://www.ncbi.nlm.nih.gov/pubmed/20400562 [Accessed May 2, 2014]
IPCC (2012) Renewable energy sources and climate change mitigation: special report of the Intergovernmental Panel on Climate Change Available at: http://www.cro3.org/cgi/doi/10.5860/CHOICE.49-6309
IPCC (2013) CLIMATE CHANGE 2013
Liu H, Ramnarayanan R & Logan BE (2004) Production of electricity during wastewater treatment using a single chamber microbial fuel cell. Environ. Sci. Technol. 38: 2281–5 Available at: http://www.ncbi.nlm.nih.gov/pubmed/20889062

68
Logan BE (2009) Exoelectrogenic bacteria that power microbial fuel cells. Nat. Rev. Microbiol. 7: 375–81 Available at: http://www.ncbi.nlm.nih.gov/pubmed/20632002
Logan BE, Hamellers B, Rozendal R a, Schroder U, Keller J, Freguai S, Aeltermans P, Verstraete W & Rabaey K (2006) Critical Review Microbial Fuel Cells : Methodology and Technology †. 40: 5181–5192
Lovley DR & Nevin KP (2011) A shift in the current: new applications and concepts for microbe-electrode electron exchange. Curr. Opin. Biotechnol. 22: 441–8 Available at: http://www.ncbi.nlm.nih.gov/pubmed/21333524 [Accessed January 31, 2014]
Lovley DR & Nevin KP (2013) Electrobiocommodities: powering microbial production of fuels and commodity chemicals from carbon dioxide with electricity. Curr. Opin. Biotechnol. 24: 385–90 Available at: http://www.ncbi.nlm.nih.gov/pubmed/23465755 [Accessed July 14, 2014]
Marshall CW, Ross DE, Fichot EB, Norman S & May HD (2012) Electrosynthesis of Commodity Chemicals by an Autotrophic. 78:
Marsili E, Baron DB, Shikhare ID, Coursolle D, Gralnick JA & Bond DR (2008) Shewanella secretes flavins that mediate extracellular electron transfer. Proc. Natl. Acad. Sci. U. S. A. 105: 3968–73 Available at: http://www.pubmedcentral.nih.gov/articlerender.fcgi?artid=2268775&tool=pmcentrez&rendertype=abstract [Accessed May 7, 2014]
De Mey M, Lequeux GJ, Beauprez JJ, Maertens J, Van Horen E, Soetaert WK, Vanrolleghem P a & Vandamme EJ (2007) Comparison of different strategies to reduce acetate formation in Escherichia coli. Biotechnol. Prog. 23: 1053–63 Available at: http://www.ncbi.nlm.nih.gov/pubmed/17715942
Müller V (2003) Energy Conservation in Acetogenic MINIREVIEW Energy Conservation in Acetogenic Bacteria. 69:
Nevin KP, Hensley S a, Franks AE, Summers ZM, Ou J, Woodard TL, Snoeyenbos-West OL & Lovley DR (2011) Electrosynthesis of organic compounds from carbon dioxide is catalyzed by a diversity of acetogenic microorganisms. Appl. Environ. Microbiol. 77: 2882–6 Available at: http://www.pubmedcentral.nih.gov/articlerender.fcgi?artid=3126412&tool=pmcentrez&rendertype=abstract [Accessed January 23, 2014]
Nevin KP, Woodard TL & Franks AE (2010a) Microbial Electrosynthesis : Feeding Microbial Electrosynthesis : Feeding Microbes Electricity To Convert Carbon Dioxide and Water to Multicarbon Extracellular Organic.
Nevin KP, Woodard TL & Franks AE (2010b) Microbial Electrosynthesis : Feeding Microbial Electrosynthesis : Feeding Microbes Electricity To Convert Carbon Dioxide and Water to Multicarbon Extracellular Organic.
69
Oh ST, Kim JR, Premier GC, Lee TH, Kim C & Sloan WT (2010) Sustainable wastewater treatment: how might microbial fuel cells contribute. Biotechnol. Adv. 28: 871–81 Available at: http://www.ncbi.nlm.nih.gov/pubmed/20688144 [Accessed April 30, 2014]
P. Borole A (2012) Bioelectrochemical Systems, Energy Production and Electrosynthesis. J. Microb. Biochem. Technol. 04: Available at: http://www.omicsonline.org/1948-5948/JMBT-04-e112.digital/JMBT-04-e112.html [Accessed February 18, 2014]
Patil S a., Hägerhäll C & Gorton L (2012) Electron transfer mechanisms between microorganisms and electrodes in bioelectrochemical systems. Bioanal. Rev. 4: 159–192 Available at: http://link.springer.com/10.1007/s12566-012-0033-x [Accessed February 6, 2014]
Potter AMC, Character B & Sep N (1911) Electrical Effects Accompanying the Decomposition of Organic Compounds Published by : The Royal Society Electrical Effects accompanying the Decormposition of Organic. 84: 260–276
Rabaey K, Boon N, Höfte M & Verstraete W (2005) Microbial phenazine production enhances electron transfer in biofuel cells. Environ. Sci. Technol. 39: 3401–8 Available at: http://www.ncbi.nlm.nih.gov/pubmed/15926596
Rabaey K, Girguis P & Nielsen LK (2011a) Metabolic and practical considerations on microbial electrosynthesis. Curr. Opin. Biotechnol. 22: 371–377 Available at: http://dx.doi.org/10.1016/j.copbio.2011.01.010
Rabaey K, Girguis P & Nielsen LK (2011b) Metabolic and practical considerations on microbial electrosynthesis. Curr. Opin. Biotechnol. 22: 371–7 Available at: http://www.ncbi.nlm.nih.gov/pubmed/21353525 [Accessed January 21, 2014]
Rabaey K & Rozendal R a (2010) Microbial electrosynthesis - revisiting the electrical route for microbial production. Nat. Rev. Microbiol. 8: 706–16 Available at: http://www.ncbi.nlm.nih.gov/pubmed/20844557 [Accessed January 23, 2014]
Richter H, Nevin KP, Jia H, Lowy DA, Lovley DR & Tender LM (2009) Cyclic voltammetry of biofilms of wild type and mutant Geobacter sulfurreducens on fuel cell anodes indicates possible roles of OmcB, OmcZ, type IV pili, and protons in extracellular electron transfer. Energy Environ. Sci. 2: 506 Available at: http://xlink.rsc.org/?DOI=b816647a [Accessed May 2, 2014]
Rosenbaum M, Aulenta F, Villano M & Angenent LT (2011) Cathodes as electron donors for microbial metabolism: which extracellular electron transfer mechanisms are involved? Bioresour. Technol. 102: 324–33 Available at: http://www.ncbi.nlm.nih.gov/pubmed/20688515 [Accessed January 23, 2014]
Rozendal R a., Jeremiasse AW, Hamelers HVM & Buisman CJN (2008) Hydrogen Production with a Microbial Biocathode. Environ. Sci. Technol. 42: 629–634 Available at: http://pubs.acs.org/doi/abs/10.1021/es071720%2B
70
Sasaki K, Tsuge Y, Sasaki D & Kondo A (2014) Increase in lactate yield by growing Corynebacterium glutamicum in a bioelectrochemical reactor. J. Biosci. Bioeng. 117: 598–601 Available at: http://www.ncbi.nlm.nih.gov/pubmed/24315531 [Accessed August 20, 2014]
Shi L, Richardson DJ, Wang Z, Kerisit SN, Rosso KM, Zachara JM & Fredrickson JK (2009) The roles of outer membrane cytochromes of Shewanella and Geobacter in extracellular electron transfer. Environ. Microbiol. Rep. 1: 220–7 Available at: http://www.ncbi.nlm.nih.gov/pubmed/23765850 [Accessed August 22, 2014]
Strycharz SM, Gannon SM, Boles AR, Franks AE, Nevin KP & Lovley DR (2010) Reductive dechlorination of 2-chlorophenol by Anaeromyxobacter dehalogenans with an electrode serving as the electron donor. Environ. Microbiol. Rep. 2: 289–94 Available at: http://www.ncbi.nlm.nih.gov/pubmed/23766080 [Accessed July 14, 2014]
Strycharz SM, Glaven RH, Coppi M V, Gannon SM, Perpetua L a, Liu A, Nevin KP & Lovley DR (2011) Gene expression and deletion analysis of mechanisms for electron transfer from electrodes to Geobacter sulfurreducens. Bioelectrochemistry 80: 142–50 Available at: http://www.ncbi.nlm.nih.gov/pubmed/20696622 [Accessed January 31, 2014]
Thomas AW, Garner LE, Nevin KP, Woodard TL, Ashley E, Lovley DR, Sumner JJ, Sund CJ & Bazan GC (2013a) A Lipid Membrane Intercalating Conjugated Oligoelectrolyte Enables Electrode Driven Succinate Production in Shewanella. : 1–4
Thomas AW, Garner LE, Nevin KP, Woodard TL, Franks AE, Lovley DR, Sumner JJ, Sund CJ & Bazan GC (2013b) A lipid membrane intercalating conjugated oligoelectrolyte enables electrode driven succinate production in Shewanella. Energy Environ. Sci. 6: 1761 Available at: http://xlink.rsc.org/?DOI=c3ee00071k [Accessed February 3, 2014]
Thrash JC & Coates JD (2008) Review: Direct and Indirect Electrical Stimulation of Microbial Metabolism. Environ. Sci. Technol. 42: 3921–3931 Available at: http://pubs.acs.org/doi/abs/10.1021/es702668w [Accessed August 7, 2014]
Thrash JC, Van Trump JI, Weber K a, Miller E, Achenbach L a & Coates JD (2007) Electrochemical stimulation of microbial perchlorate reduction. Environ. Sci. Technol. 41: 1740–6 Available at: http://www.ncbi.nlm.nih.gov/pubmed/17396669
Villano M, De Bonis L, Rossetti S, Aulenta F & Majone M (2011) Bioelectrochemical hydrogen production with hydrogenophilic dechlorinating bacteria as electrocatalytic agents. Bioresour. Technol. 102: 3193–9 Available at: http://www.ncbi.nlm.nih.gov/pubmed/21129958 [Accessed May 8, 2014]
Wang H & Ren ZJ (2013) A comprehensive review of microbial electrochemical systems as a platform technology. Biotechnol. Adv. 31: 1796–807 Available at: http://www.ncbi.nlm.nih.gov/pubmed/24113213
Wang VB, Du J, Chen X, Thomas AW, Kirchhofer ND, Garner LE, Maw MT, Poh WH, Hinks J, Wuertz S, Kjelleberg S, Zhang Q, Loo JSC & Bazan GC (2013a) Improving charge
71
collection in Escherichia coli-carbon electrode devices with conjugated oligoelectrolytes. Phys. Chem. Chem. Phys. 15: 5867–72 Available at: http://www.ncbi.nlm.nih.gov/pubmed/23487035
Wang VB, Du J, Chen X, Thomas AW, Kirchhofer ND, Garner LE, Maw MT, Poh WH, Hinks J, Wuertz S, Kjelleberg S, Zhang Q, Loo JSC & Bazan GC (2013b) Improving charge collection in Escherichia coli-carbon electrode devices with conjugated oligoelectrolytes. Phys. Chem. Chem. Phys. 15: 5867–72 Available at: http://www.ncbi.nlm.nih.gov/pubmed/23487035 [Accessed February 18, 2014]
Wang VB, Kirchhofer ND, Chen X, Tan MYL, Sivakumar K, Cao B, Zhang Q, Kjelleberg S, Bazan GC, Loo SCJ & Marsili E (2014) Comparison of flavins and a conjugated oligoelectrolyte in stimulating extracellular electron transport from Shewanella oneidensis MR-1. Electrochem. commun. 41: 55–58 Available at: http://linkinghub.elsevier.com/retrieve/pii/S1388248114000423 [Accessed May 26, 2014]
Wenzel M, Chiriac a. I, Otto a., Zweytick D, May C, Schumacher C, Gust R, Albada HB, Penkova M, Kramer U, Erdmann R, Metzler-Nolte N, Straus SK, Bremer E, Becher D, Brotz-Oesterhelt H, Sahl H-G & Bandow JE (2014) Small cationic antimicrobial peptides delocalize peripheral membrane proteins. Proc. Natl. Acad. Sci.: 1–10 Available at: http://www.pnas.org/cgi/doi/10.1073/pnas.1319900111 [Accessed March 26, 2014]
72
Attachments Attachment A
135. ACETOBACTERIUM MEDIUM
NH4Cl 1.00 g
KH2PO4 0.33 g
K2HPO4 0.45 g
MgSO4 x 7 H2O 0.10 g
Trace element solution (see medium 141) 20.00 ml
Vitamin solution (see medium 141) 20.00 ml
Yeast extract 2.00 g
D-Fructose 10.00 g
Resazurin 1.00 mg
NaHCO3 10.00 g
L-Cysteine-HCl x H2O 0.50 g
Na2S x 9 H2O 0.50 g
Distilled water 1000.00 ml
Dissolve ingredients except NaHCO3, fructose, cysteine and sulfide, bring to the boil and cool
to room temperature under 80% N2 + 20% CO2 gas mixture. Add NaHCO3 (solid) and
equilibrate the medium with the gas until a pH of around 7.4 is reached. Then distribute and
autoclave under the same gas. Before use adjust the pH to 8.2 by adding a sterile anoxic stock
solution of Na2CO3 (c. 0.25 ml of 5% (w/v) Na2CO3 per 10 ml medium) and add fructose,
cysteine and sulfide from anoxic sterile stock solutions. For autotrophic growth fructose is
omitted and a gas atmosphere of 80% H2 + 20% CO2 is used.
For DSM 1974 use only 1.0 g/l of NaHCO3 and omit Na2CO3 to reach a final pH of 6.5. In
addition, add 1 ml/l selenite-tungstate solution (see medium 385).
For DSM 4132 use fructose as substrate at final concentration of 0.1% (w/v). ©
Microor g anisms

73
Attachment B
311. SPOROMUSA MEDIUM
NH4Cl 0.50 g
MgSO4 x 7 H2O 0.50 g
CaCl2 x 2 H2O 0.25 g
NaCl 2.25 g
FeSO4 x 7 H2O 2.00 mg
Vitamin solution (see medium 141) 10.00 ml
Trace element solution SL-10 (see medium 320) 1.00 ml
Selenite-tungstate solution (see medium 385) 1.00 ml
Yeast extract 2.00 g
Casitone 2.00 g
Betaine x H2O 6.70 g
Resazurin 0.50 mg
K2HPO4 0.35 g
KH2PO4 0.23 g
NaHCO3 4.00 g
L-Cysteine-HCl x H2O 0.30 g
Na2S x 9 H2O 0.30 g
Distilled water 1000.00 ml
Dissolve ingredients (except phosphates, bicarbonate, cysteine and sulfide) and sparge
medium with 80% N2 and 20% CO2 gas mixture to make it anoxic (30 – 45 min). Add
phosphates, cysteine and sulfide to the medium after autoclaving from sterile stock solutions
autoclaved under 100% N2 gas and bicarbonate from a sterile stock solution prepared under
80% N2 and 20% CO2 gas mixture. Adjust pH of completed medium to pH 7.0.
For DSM 3132 prepare the medium without betaine; add 5.00 g/l D-fructose from a
filtersterilized anoxic stock solution.
For DSM 4440 use 1.35 g/l betaine; cysteine and sodium sulfide must be replaced by 0.15 g/l
DL-dithiothreitol (DTT) added from an anoxic stock solution sterilized by filtration.
Microor g anisms

74
For DSM 16652 replace betaine with 1.11 g/l N-acetyl-D-glucosamine added to the autoclaved
medium from a filter-sterilized anoxic stock solution.

75
Attachment C
Table 1. Composition of modified homoacetogenic medium (adapted from (Leclerc et al.,
1997))
K2HPO4 0.2 g/L
NH4Cl 0.25 g/L
KCl 0.5 g/L
CaCl2.2H2O 0.15 g/L
MgCl2.6H2O 0.6 g/L
NaCl 1.2 g/L ~ 20 mM
NaHCO3 30 mL from 84g/L stock
Trace metal solution* 1 mL
Vitamin solution** 2.5 mL
Tungstate-selenium solution*** 0.1 mL
*Composition of trace metal solution (g/L) (Balch et al., 1979):
Nitrilotriacetic acid (dissolve with KOH; pH 6.5) 1.5
Mg2Cl2.6H2O 3.0
MnCl2.2H2O 0.5
NaCl 1
FeCl2 0.1
CoCl2 0.1
CaCl2.2H2O 0.1
ZnCl2 0.1
CuCl2 0.01
76
AlCl3.6H2O 0.01
H3BO3 0.01
Na2MoO4.2H2O 0.01
**Composition of vitamin solution (mg/L) (Greening & Leedle, 1989):
Sodium ascorbate 10
Biotin 4
Folic acid 4
Pyridoxine hydrochoride 20
Thiamine hydrocloride 10
Riboflavin 10
Nicotinic acid 10
DL-calcium pantothenate 10
Vitamin B12 0.2
p-aminobenzoic acid 10
Lipoic(thioctic) acid 10
Myo-inositol 10
Choline chloride 10
Niacinamide 10
Pyridoxal hydrochloride 10
***Composition of tungstate-selenium solution:
0.1mM Na2WO4 + 0.1mM Na2SeO3 in 20mM NaOH
References

77
Balch, W.E., Fox, G., E., Magrum, L.J., Woese, C.R., Wolfe, R.S. 1979. Methanogens:
reevaluation of a unique biological group Microbiological Reviews, 43(2), 260-296.
Greening, R.C., Leedle, J.A.Z. 1989. Enrichment and isolation of Acetitomaculum ruminis,
gen. nov., sp. nov.: acetogenic bacteria from the bovine rumen. Archives of
Microbiology, 151(5), 399-406.
Leclerc, M., Bernalier, A., Donadille, G., Lelait, M. 1997. H2/CO2Metabolism in Acetogenic
Bacteria Isolated From the Human Colon. Anaerobe, 3(5), 307-315.

78
Attachment D
Strains Antibiotic resistance Optimal growth temperature Optimal shaking incubation
1 E.coli K12 MG1655 no AB resistance 37°C 200 rpm
2 E.coli K12 MG1655 ΔackAΔptaΔpoxB no AB resistance 37°C 200 rpm
Medium composition : LB Broth
Liquid medium Solid medium (plates)
Yeast extract 5 g/L Yeast extract 5 g/L
Tryptone 10 g/L Tryptone 10 g/L
NaCl 10 g/L NaCl 10 g/L
Agar 10 g/L
Minimal medium (synthetic medium)
NH4Cl 2 g/L
(NH4)2SO4 5 g/L
KH2PO4 3 g/L
K2HPO4 7,3 g/L
MOPS 8,4 g/L
NaCl 0,5 g/L
MgSO4.7H2O 0,5 g/L These two components have to be autoclaved separately with the other components due to Mailard reaction (reducing sugars)!
Glucose.H2O 16,5 g/L So for 1 liter, you make the first flask (ammonium sources) into 800 mL DM water and the second flask (sugar source) into 200 mL DM water.
The pH has to be set on 7 with 1M KOH solution
After autoclaving, you have to add
Filtersterilized vitamin solution 1 mL/L
Filtersterilized molybdate solution 100µL/L
Vitamin solution stock concentration = 1000 x concentrated
stock concentration (g/L)
Na2EDTA.2H2O 0,4
H3BO3 0,03
thiamine.HCl 1,01
ZnCl2 0,94
CoCl2.6H2O 0,5
CuCl2.2H2O 0,38
MnCl2.4H2O 1,59
CaCl2 3,77
FeCl2.4H2O 3,6
molybdate and SeO2 stock concentration = 10 000 x concentrated
stock concentration (g/L)
Na2MoO4.2H2O 0,967
SeO2 3
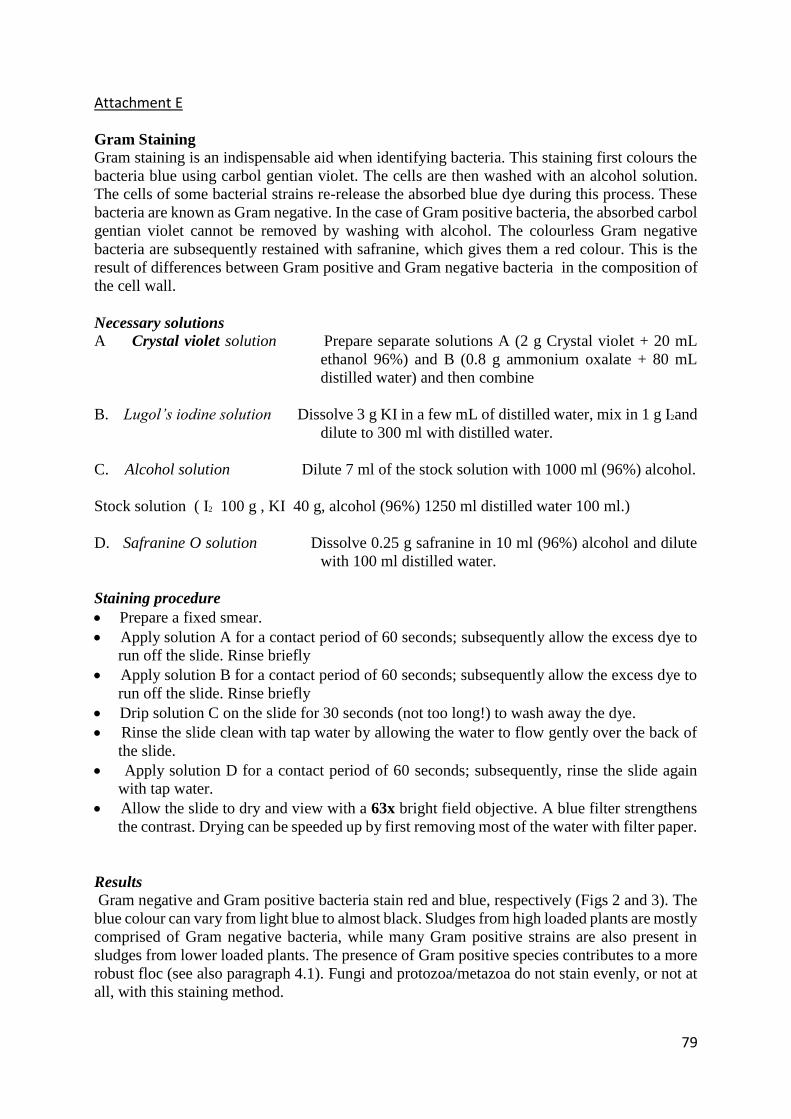
79
Attachment E
Gram Staining Gram staining is an indispensable aid when identifying bacteria. This staining first colours the
bacteria blue using carbol gentian violet. The cells are then washed with an alcohol solution.
The cells of some bacterial strains re-release the absorbed blue dye during this process. These
bacteria are known as Gram negative. In the case of Gram positive bacteria, the absorbed carbol
gentian violet cannot be removed by washing with alcohol. The colourless Gram negative
bacteria are subsequently restained with safranine, which gives them a red colour. This is the
result of differences between Gram positive and Gram negative bacteria in the composition of
the cell wall.
Necessary solutions A Crystal violet solution Prepare separate solutions A (2 g Crystal violet + 20 mL
ethanol 96%) and B (0.8 g ammonium oxalate + 80 mL
distilled water) and then combine
B. Lugol’s iodine solution Dissolve 3 g KI in a few mL of distilled water, mix in 1 g I2and
dilute to 300 ml with distilled water.
C. Alcohol solution Dilute 7 ml of the stock solution with 1000 ml (96%) alcohol.
Stock solution ( I2 100 g , KI 40 g, alcohol (96%) 1250 ml distilled water 100 ml.)
D. Safranine O solution Dissolve 0.25 g safranine in 10 ml (96%) alcohol and dilute
with 100 ml distilled water.
Staining procedure
Prepare a fixed smear.
Apply solution A for a contact period of 60 seconds; subsequently allow the excess dye to
run off the slide. Rinse briefly
Apply solution B for a contact period of 60 seconds; subsequently allow the excess dye to
run off the slide. Rinse briefly
Drip solution C on the slide for 30 seconds (not too long!) to wash away the dye.
Rinse the slide clean with tap water by allowing the water to flow gently over the back of
the slide.
Apply solution D for a contact period of 60 seconds; subsequently, rinse the slide again
with tap water.
Allow the slide to dry and view with a 63x bright field objective. A blue filter strengthens
the contrast. Drying can be speeded up by first removing most of the water with filter paper.
Results Gram negative and Gram positive bacteria stain red and blue, respectively (Figs 2 and 3). The
blue colour can vary from light blue to almost black. Sludges from high loaded plants are mostly
comprised of Gram negative bacteria, while many Gram positive strains are also present in
sludges from lower loaded plants. The presence of Gram positive species contributes to a more
robust floc (see also paragraph 4.1). Fungi and protozoa/metazoa do not stain evenly, or not at
all, with this staining method.

80
For some filamentous bacteria, particularly Type 0041, not all parts of a filament stain in the
same manner. This is usually caused by the attachment of other bacteria to the filaments. These
bacteria screen off the filaments to some extent so that the blue stain cannot be sufficiently
absorbed. When assessing the result of the staining in such a case, attention is principally paid
to the 'clean' tip of the filament.
The result of the staining depends upon the age of the cell for some species. Young cells stain
red
whereas older ones stain blue. This can also result in two colours occurring in one filament.
Remarks
The solutions can be bought ready made.
Numerous different recipes for Gram staining are mentioned in the literature. The recipe
described provides filamentous organisms with a good contrast.
Most solutions can be retained for an almost unlimited time. Solution C (not the stock
solution) must be renewed once a month.
The slides must be properly de-greased.
The slides must be viewed with bright field. The difference between red and blue is less
clear with phase contrast.
The slide must not contain too many sludge particles, as excess dye can then no longer be
removed by rinsing. Large 'blobs' of dye can be seen when viewing. If this is the case, the
staining must be repeated with fewer sludge particles on the slide.

81
Attachment F
1µM 192h 2,5µM 192h
5µM 192h 10µM 192h
Copyright © 2022 FDOKUMEN