
Analysis of the Role of Fundamental Financial Ratios ... - CORE
Upload
khangminh22Category
view
1download
0
Indian Journal Of Natural Sciences www.tnsroindia.org. © IJONS
Vol.5 / Issue 30 / June 2015 International Bimonthly ISSN: 0976 – 0997
7402
The Role of Financial Leverage in the Performance of Companies Listed in the Stock Exchange Morteza Dadgostar Moghadam1 and Mehrnoosh Jafari2* 1Department of Commercial Administration-Financial, Faculty of Commercial Administration, Saveh Branch, Islamic Azad University, Saveh, Iran. 2Department of Social Science, Faculty of Social Science, Roudehen Branch, Islamic Azad University, Roudehen, Iran. Received: 15 Mar 2015 Revised: 16 Apr 2015 Accepted: 29 May 2015 *Address for correspondence Dr.Mehrnoosh Jafari Department of Social Science, Faculty of Social Science, Roudehen Branch, Islamic Azad University, Roudehen, Iran.
This is an Open Access Journal / article distributed under the terms of the Creative Commons Attribution License (CC BY-NC-ND 3.0) which permits unrestricted use, distribution, and reproduction in any medium, provided the original work is properly cited. All rights reserved.
Financing decisions of firms, clearly the company’s capital structure has a considerable impact on its current and future performance. Available empirical evidence suggests that financing via liabilities improves potentially the profitability of the company. Since benefits of financial leverage are important in the success of the company, this article aims mainly to describe the role of financial leverage on the performance of listed companies in stock exchange. Sample under investigation consisted of 115 companies; their financial data was collected for the years 2007 to 2012 and analyzed statistically. Overall, the findings indicate that financial leverage has a significant positive relationship with the performance of sample companies. In other words, firms with higher debt levels are more profitable.
Key words: capital structure of the company, financial leverage, firm performance.
INTRODUCTION
With respect to the available strategies, managers should select a capital structure that needs less cost of capital to have a company with more profit; in other words, optimal capital structure occurs when the cost of capital reaches to the minimum (Tang & Jang, 2012). Desired performance of an activity is the motivator that encourages suppliers to apply their resources in a specific activity. Financial leverage shows the use of debt in the capital structure of the company and the companies providing the bulk of their capital structure by debt are called leveraged companies. For
RESEARCH ARTICLE
ABSTRACT
Indian Journal Of Natural Sciences www.tnsroindia.org. © IJONS
Vol.5 / Issue 30 / June 2015 International Bimonthly ISSN: 0976 – 0997
7403
companies, the cost of financing through liabilities is less. On the other hand, uncontrolled increase in liabilities increases default risk and decreases the value of the shares. Some believe that overuse return on equity increases of shareholders’ expected return and ultimately increases the cost of financing. Thus, taking into account the existing strategies, managers must choose a capital structure with lower cost of equity that increases the efficiency (Fosberg & Ghosh, 2006). Hence, the impact of financial leverage on profitability can be regarded as the resources that provide a means for companies. How to use this resource affects potentially the profitability of the company and causes success or failure of his company.
Theoretical and empirical evidence suggests that financial leverage may affect various aspects of the company's profitability and ability to compete in the product market. Since the company’s financial leverage reduces debt capacity, they move to an increasing reliance on domestic sources of finance and try to raise the cash flows through the overproduction of goods. This procedure reduces the production price and potentially reduces the profitability of the company; these conditions may also undermine competition in the product market (Fosu, 2013). Given that the benefits of financial leverage in the company’s success and ability to compete in the market is important for improvement of the benefits, the present study examines mainly the role of financial leverage on the performance of listed companies on the stock.
Theoretical foundations
Financial leverage
The ratio of liabilities to assets used as a criterion for determining a company’s capital structure. This measure, which is called financial leverage, is an indicator of financial risk and ability to pay debt (Nouravesh and Deilami, 2005).
Capital structure
There are generally two methods of financing: first, method of debt and second through the equity. Liabilities are also classified according to their nature in the form of short-term debt and long-termin terms of maturity. Financing is carried out through equity in the distribution and supply of stock to current and new shareholders and reinvestment of the profit not distributed. In addition, financial resources can be categorized in terms of internal resources and external resources. Local resources includes profit not distributed and the external resources includes release and offer new shares to existing shareholders, borrowing from banks and credit institutions, issuing bonds, and purchasing goods and services on credit (borrowing from creditors) (Bakhtiari, 2010).
The theory of capital structure was first studied by Modigliani and Miller (1985). They found that the value of the company is not affected by financial composition when the financial options are considered less. Modigliani and Miller found the known “capital structure irrelevance principle” saying the financial impact on the company's market value is not effective under conditions of full market. They show that if the investment policy of the company is accomplished properly, there will be no tax and transaction costs associated with raising capital and bankruptcy in the real world; thus, disclosure of all information is valid. Hence, capital structure does not influence on value.
Financial leverage and its impact on corporate performance
The impacts of financial decisions on the overall performance of companies have been investigated in different researches. The researches indicate that despite the good effects of financial leverage for some companies, it has negative effect on other companies. Capital structure supported by Zeitun and Tian (2007) has significant impacts on measures of accounting performance standard. This is consistent with idea of Mayers (2001) arguing that companies with short-term debts to total assets have high growth rates and high performance. These results indicate that high
Morteza Dadgostar Moghadam and Mehrnoosh Jafari et al.
Indian Journal Of Natural Sciences www.tnsroindia.org. © IJONS
Vol.5 / Issue 30 / June 2015 International Bimonthly ISSN: 0976 – 0997
7404
performance relates to high tax rate, which suggests that profitable firms pay the top tax rates. In addition, the company size has a positive effect on firm performance because large companies have low costs of bankruptcy (Ahmad et al., 2012). Chen et al (2008) found the results of effectiveness indicating the negative changes in performance. They show that the larger companies have less positive changes in the interest of assets and changes in financial leverage have positive relationship to the interest of shares. Jermias (2008) established that financial leverage and performance are considerably negative and the firm size has significant and negative relationship to performance. In this regard, intensity of competition and business strategy are so effective in performance that the factor is less negative for cost factors rather than distinctiveness of the product. The results is consistent with the idea that providing debt and debt obligations not only have tax benefits for companies but also are in accordance with the increased efficiency resulting from the restrictions for the debtors. Min Tsung Cheng (2009) studied the relative impact of debt and financing on the current performance. His findings indicate that the amount of debt and financing has a significant negative impact on their current performance regardless of its cash flow. Therefore, these findings suggest that the association or loading up on debt or equity to raise capital coupled to the risk. Nevertheless, financing through combination of both methods have less risk. These findings suggest for companies to attempt to finance and increase capital using both methods (with the advantages of a method, another’s problems are reduced); this is true for companies when there is a negative relationship between their performance and debts. Krivogorsky et al (2009) have also the same idea. Indeed, they confirm the previous findings because companies with high debts are usually regarded as risky investments by investors and it may affect wealth transfer from debtors to shareholders. This confirms Ebaid (2009). He suggests that the capital structure will not have any significant effect on equity returns when total debt and leverage have negative effects on the company’s return on assets. Study on 60 Chinese active companies in the field of real estate by Tao Wang et al (2010) confirmed that the results support the idea of financial leverage representation, especially the theory that concentrate on the disciplinary role of financial leverage for companies with less opportunities for growth. Based on their findings, there is a negative relationship in performance and financing for companies with little growth opportunities and high growth opportunities while this is positive for companies with medium growth opportunities. The results about return on shareholders equity are similar to the conclusion of Saidi and Mahmoodi (2009), but this is not true for return on asset because they found significant results in terms of relationships with the capital structure (Ahmad et al, 2012).
Research Background
In “the causes of changes in market share over the market reaction to reported earnings,” in United States, Swirsky (2004) introduced criterion of change in market share as indicators of firm performance and the relationship between earnings and stock returns considering the future growth opportunities. Using two models of unforeseen output and stock prices, he found that the relationship between the company’s current and future performance is under the influence of changes in market share and the current profit of companies with market share growth are useful information for investors.
In their research titled “The relationship between profitability and capital structure,” Fosberg and Ghosh (2006) studied American Stock Exchange and New York Stock Exchange. The show that the relationship between capital structure and asset efficiency ratio was negative in the New York Stock Exchange because companies in New York use more than 5 to 8 percent of their debt in their capital structure. Moreover, their findings indicated that the sample firms incur costs resulting from financial risks in their efforts to attract funds from debt and weaknesses in performance ratios increase the cost of their capital. Lee (2009), in “Cash holdings, corporate governance structure and firm valuation, review of pacific basin financial markets and policies,” investigated the relationship between capital structure and performance criteria. He used return on assets and return on sales as a measure of performance and concluded that there is a negative and positive relationship between performance and financial leverage ratio of short-term debt; he argued that Chinese companies rarely use of short-term debt. Findings showed that successful companies in obtaining long-term loans have greater efficiency and they apply effectively potential financing sources in profitable activities. Biglar’s research “The relationship between capital structure and functional characteristics o
Morteza Dadgostar Moghadam and Mehrnoosh Jafari et al.
Indian Journal Of Natural Sciences www.tnsroindia.org. © IJONS
Vol.5 / Issue 30 / June 2015 International Bimonthly ISSN: 0976 – 0997
7405
listed companies on the Stock Exchange” examined the relationship between capital structure and functional characteristics of the 117 companies through Pearson’s correlation coefficient and comparison test (2006). He found that there are significant relationships between capital structure and return on investment and return on shareholders equity and operating income to sales. The results showed that financial leverage is inversely related to the ratio of operating income to sales while the return on investment and return on shareholders equity has a direct relationship. Sinaee and Rashidi Zad conducted a research in 2009 titled “The relationship between changes of market share to the companies’ valuation of gains and opportunities for future growth”. The research contains details of 168 companies listed in Tehran Stock Exchange during the years 2001 to 2006. Simple and multiple regression techniques were used to test the hypotheses. The results reflect that the relationship between current and future performance is significantly related to changes in market share and this relationship can last up to three years. In addition, two models of unforeseen returns and prices were used to evaluate the effect of changes in market share over the current performance. The results indicate that the relationships in current income value increase with growth in market share; but there was no significant relationship between measures of changes in market share and growth opportunities. Arab Salehi et al (2012) studied the relationship between the risk of environment, corporate strategy and capital structure to the performance of listed companies on the Stock Exchange in “The impact of environmental risk, corporate strategy and capital structure on performance of listed companies on Tehran Stock Exchange.” The results showed that there is a significant relationship between the risks of environment to free cash flow per share, the environmental risks to return on equity, and the structure of capital and free cash flow per share.
Research Hypothesis
There is a relationship between financial leverage and corporate performance.
Field of study (subject, time and place)
This research is carried out according to companies’ historical information in line with accounting investigations based on representation theory. In terms of subject matter, this study explains the role of financial leverage in the performance of listed companies on stock exchange. The study period consists of 6 years from 2007 to 2012 based on real data published in 2014. Based on the objectives, the researchers studied information about the mentioned period and the companies listed in the period entered the examinations. Tehran Stock Exchange is the field of research.
Research Method
This is a descriptive and correlational research investigating the relationship between variables and tries to prove the relationship in the current situation based on historical data. Therefore, it can be included in the causal-facto classification. This is a practical research in terms of goals examining the impact of capital structure (as an internal factor) and competitive power of the product (as an external factor) on the performance of companies. In addition, this is a descriptive research in terms of data gathering and collects financial data of sample companies using library techniques. Classified and audited financial data of listed companies in Tehran Stock Exchange are used to test the hypotheses. The researchers employed systematic sampling and the following criteria were implemented in the systematic sampling: (1) they are present during 2006 to 2012, (2) their financial years end in March, (3) they have not change in financial year in the period, and (4) their trading symbols are active and they does not stop more than 4 months. After implementation of the limitations and conditions, 115 companies of listed companies on Tehran stock market have been selected as samples. Given the nature of this study, library based techniques were used to gather the needed information. Then, needed data is collected to test the hypothesis using Tehran Stock Exchange databases, website of the organization, and stock softwares like Rahavard Novin.
Research Variables and their Calculation Methods
Morteza Dadgostar Moghadam and Mehrnoosh Jafari et al.
Indian Journal Of Natural Sciences www.tnsroindia.org. © IJONS
Vol.5 / Issue 30 / June 2015 International Bimonthly ISSN: 0976 – 0997
7406
The dependant variable is return on assets ratio that offers the criteria for the performance of companies. Independent variable is financial leverage (as a measure of capital structure). The method of calculating each of these variables is as follows.
Return on assets (the dependent variable): it reflects the efficiency in the use of resources and the ratio of net income to total assets (Nouravesh & Deilami, 2005).
Financial Leverage (independent variable): The ratio of total liabilities to total assets reflects the amount of debt in the capital structure of the company (Nouravesh & Deilami, 2005).
Control variables
In the present study, the variables of firm size and growth of sales are included as a control variable in the model of hypothesis because they may affect the performance of companies. Operational definition and method of calculating these variables are as follows.
Firm size: Researchers have predicted many criteria for firm size. Logarithm of the book value of total assets is used to set the size of the firms in the model to test the hypothesis.
Size i,t=Ln(Assets i,t)
Sales growth rate Since the company reported earnings are heavily influenced by changes in sales revenue and the level of sales is a measure of managers’ performance, sales growth rate is considered as one of the control variables (Nouravesh & Deilami, 2005).
Hypothesis Testing
Hypothesis testing method is based on regression model in which return on assets (as a measure of performance) is a function of financial leverage and control variables. This model was presented and used by Fosu (2013) and it is as follows for proposed hypothesis.
The first hypothesis test
ROA i,t=β0+ β1Levi,t+ β2 Levi,t-1+β3Lev2 i,t-1+β4Sizei,t+β5 Size2i,t +β6Growi,t+€i,t
ROA: return on assets (net income to total asse
Morteza Dadgostar Moghadam and Mehrnoosh Jafari et al.
Indian Journal Of Natural Sciences www.tnsroindia.org. © IJONS
Vol.5 / Issue 30 / June 2015 International Bimonthly ISSN: 0976 – 0997
7407
Lev: financial leverage (the ratio of debt to total assets)
Lev2: square of financial leverage in order to investigate this variable’s nonlinear relationship to the dependent variable
Size: size as a control variable
Size2: the square firm size as a control variable in order to investigate this variable’s nonlinear relationship to the dependent variable
Grow: Growth rate of sales as a control variable
In the above regression model, the coefficients of β1 to β3 describe the relationship between financial leverage to performance in various aspects. In this regard, the coefficient of β1 reflects the relationship between current financial leverage and performance, the coefficient of β2 reflects the relationship between the previous period financial leverage and performance, and the coefficient of β3 reflects the non-linear relationship financial leverage and performance. Moreover, Coefficients β4 to β6 reflect the relationship between the dependent variables and control variables (Fosu, 2013).
FINDINGS
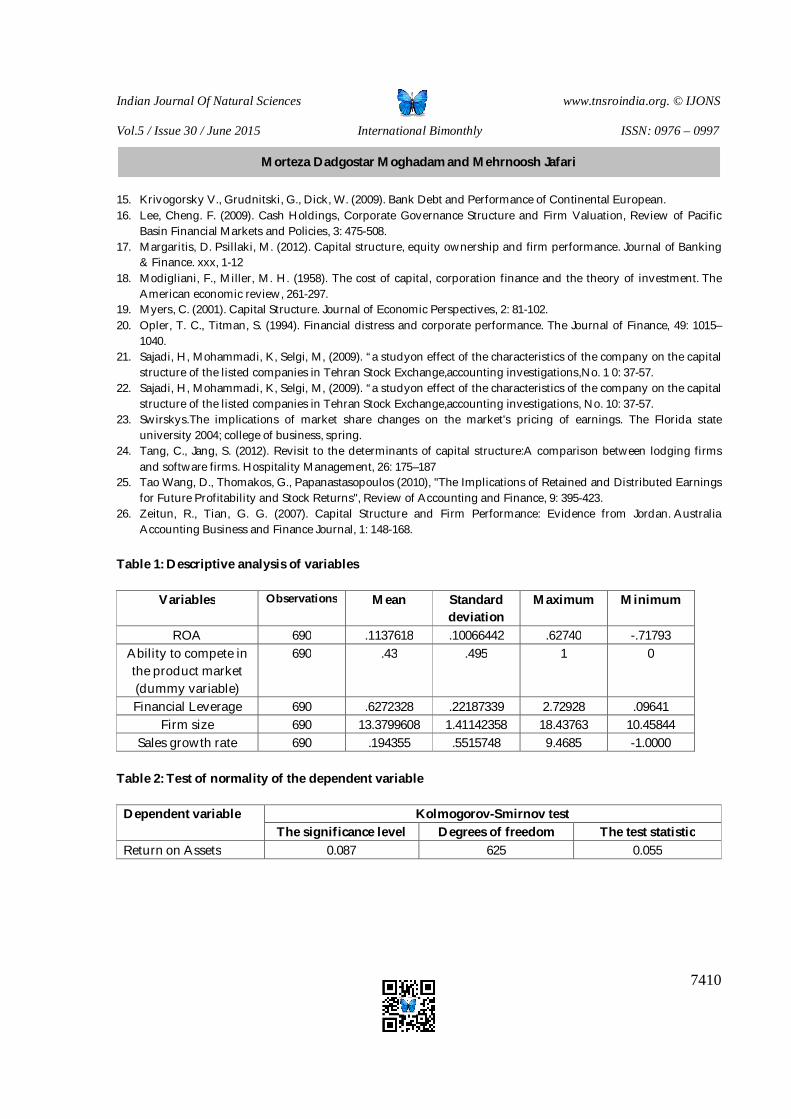
Descriptive analysis of the data the number of observation in this research is 690 year-company. These observations are the combination of data from 115 listed companies in stock exchange as samples during 6 years (2007 to 2012) (Table 1). As the results show, on average, the companies in the sample have been profitable during the investigation because the average results for the variable ROA is positive. In addition, the standard deviation of the variable is lower than the mean indicating that these data are variable with low volatility. Descriptive statistics of the the variable of financial leverage indicates that, on average, more than 62 percent of the capital of sample companies is funded through debt. Moreover, the obtained mean for sales growth rate is positive indicating that sample companies have improved their sales revenue during the investigation.
Check the normality of the dependent variable in the regression model of the present test hypotheses, return on assets is introduced as the dependent variable. The research test model assumptions are based on regression equations and normality of the dependent variable is one of basic assumptions of regression that also leads to regression residuals normality. In this study, the Kolmogorov-Smirnov test was used to assess the normality of the data. Statistical hypotheses for this test are as follows:
H0= data distribution is normal.
H1= data distribution is not normal.
The results of this test are shown in Table 2.
According to the results, the significance level of Kolmogorov-Smirnov test for the dependent variable is more than the experimental error (α=0.05), and the hypothesis H0 is accepted. In other words, data related to the variable of
stock returns follows a distribution close to the normal distribution. As a result, normality, as one of the basic assumptions of regression of this variable can be accepted.
Morteza Dadgostar Moghadam and Mehrnoosh Jafari et al.
Indian Journal Of Natural Sciences www.tnsroindia.org. © IJONS
Vol.5 / Issue 30 / June 2015 International Bimonthly ISSN: 0976 – 0997
7408
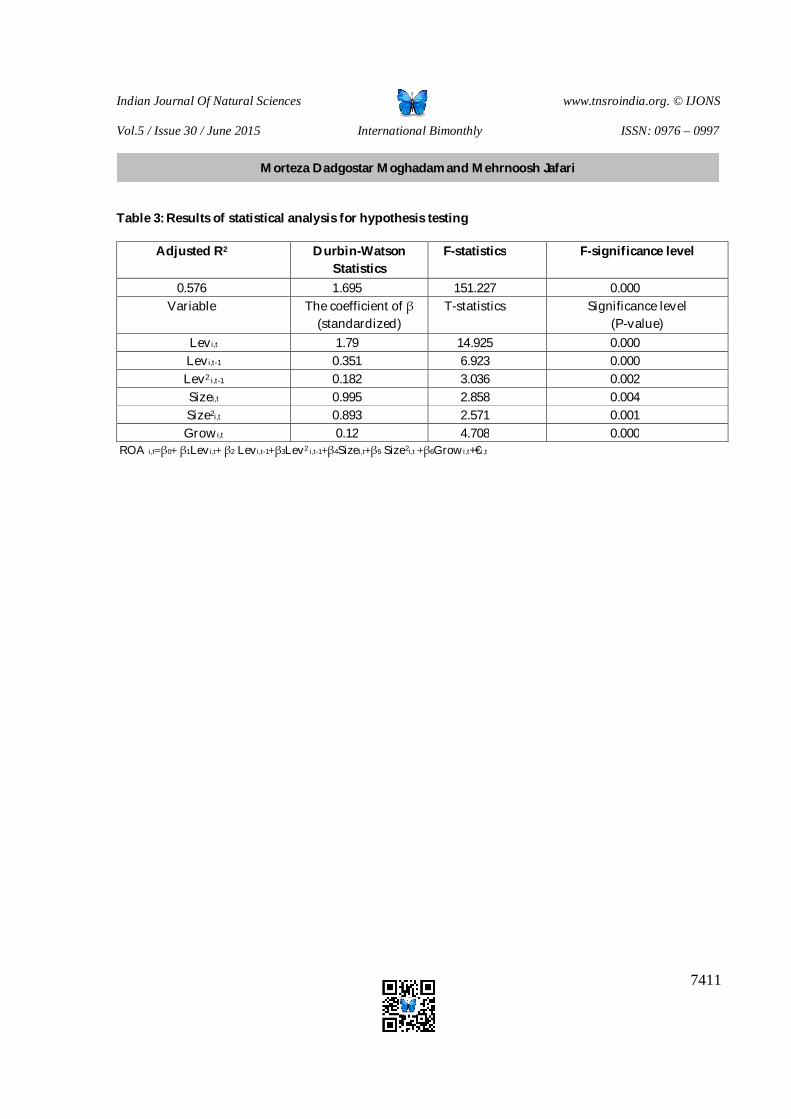
The results of hypothesis testing The hypothesis predicts that there is a direct relationship between financial leverage and performance. To test this hypothesis, a model in which the ratios of return on assets (as an indicator of performance), are functions of financial leverage and control variables are used (Table 3). Results of statistical analysis about the validity of the regression model are mentioned in the first part of the table.
Determination coefficient of regression model is 0.576 indicating that the model can explain 56.7 percent of changes of asset return in sample firmsthrough the independent and the control variables. In addition, the results show that the Durbin-Watson statistic is between 1.5 and 2.5. Hence, there is not a strong correlation between the errors of the regression model and the absence of autocorrelation between the errors is accepted as one of the basic assumptions of the regression model. Analysis of regression variance (ANOVA), having been decided based on F-statistics of he first hypothesis testing for model fitting is mentioned in the last two columns of Table 3. Statistical hypothesis for the analysis of F-statistics is as follows.
H0: βi=0; Regression model is not significant.
H1: βi≠0; Regression model is significant.
The significance level of F-statistic for the model is less than experimental error (α=0.05); therefore, the hypothesis H0 is rejected and the estimated regression is statistically significant and the relationships between variables are linear. Results of statistical analysis for each of the independent variables and control variables of the first hypothesis test pattern are presented the second part of Table 3. The estimated coefficients for variables Levi,t, Levi,t-1 and Lev2 i,t-1 are positive and their significance level are less than 0.05. These findings suggest a direct relationship between financial leverage and performance of sample companies. In other words, the relationship between current financial leverage and period prior financial leverage to performance are direct. This finding is consistent with the theoretical foundations of the research. Furthermore, the non-linear relationships between the variables are direct. Regarding the control variables, the results show that the size and growth of sales have direct relationships to firm performance. Overall, the findings indicate that there is a relationship between financial leverage and performance of sample companies during the investigation. This finding is consistent with the claim in the hypothesis and this hypothesis is accepted at 95% significance level.
DISCUSSION AND CONCLUSION
The results of hypothesis testing showed that there is a direct relationship between financial leverage and performance. The result is consistent with the theoretical foundations of research and the claims rose in the first hypothesis. In addition, these results are compatible with the results of Margarita and psylski (2012). These researchers found that, there is a positive and significant relationship between the efficiency and leverage; the relationship is more severe for companies with higher leverage. They argued that this relationship could carry the message to creditors that more efficient companies are more capable of paying their debts and can create more leverage. However, Min Tsung Cheng (2009) have shown that the amount of debt and its financing have significant negative effects on the current performance in spite of the high cash flow. Accordingly, these findings suggest that the association or loading up on debt or equity to raise capital coupled to the risk. However, financing by a combination of both methods has lower risk. Therefore, it suggest for companies to finance through both methods of debt and capital increase (with the benefits of a method, another case problems are reduced). This is useful for companies in which there is a negative relationship between debts and performance. This group of theoretical
evidence argues that firms with high debt are usually regarded as risky investment areas by investors and they may impact on the wealth transference from debtors to shareholders.
Morteza Dadgostar Moghadam and Mehrnoosh Jafari et al.
Indian Journal Of Natural Sciences www.tnsroindia.org. © IJONS
Vol.5 / Issue 30 / June 2015 International Bimonthly ISSN: 0976 – 0997
7409
Generally, the former empirical evidences suggest that there is not a fix agreement on the relationship between financial leverage and the performance of profit organizations. Researchers have reported different conclusions in different spatial and temporal conditions. In this regard, findings of this study suggest a direct relationship between these variables for Iranian companies. These findings can be interpreted in two main reasoning set. First, in this inflationary economy, the use of debt to finance the company is a good choice compared to internal financing and it provides greater benefits for companies because the company financed with investment can earn excess returns relative to avail the facility. This is due to the prevailing inflationary situation. Second, the companies with higher debts may be more capable of acquiring facility. Doing so, firms face fewer financial restrictions in absorbing and investing in new projects.
Research Recommendations
Based on the findings, the researchers propose the following practical point.
It is recommended to the managers of financial organizations to employ external resources in financing; this is more helpful in inflationary conditions.
REFERENCES
1. Bakhtiari, P. (2010). Financial Management, Industrial Management Institute Press, first edition 2000, 11. 2. Biglar, K. (2006). The relationship between capital structure and functional characteristics of listed companies on
the Stock Exchange. M.A. thesis, Shahid Beheshti University, Faculty of Management and Accounting. 3. Sinaee, H., Rashid Zadeh, F. (2009). The relationship between changes of market share to the companies’
valuation of gains and opportunities for future growth. Reviews of accounting and auditing. Tehran University, 59.
4. Arab Salehi, M., Moayed Far, R., Karimi, S. (2012). The impact of environmental risk, corporate strategy and capital structure on performance of listed companies on Tehran Stock Exchange. Journal of Financial Accounting. 13.
5. Nouravesh, I., Dianati Deilami, Z. (2003). Financial management. Volume I, Tehran University Press, 67. 6. Ahmad, Z., Abdullah, H., Shashazrina, R. (2012). Capital Structure Effect on Firms Performance: Focusing on
Consumers and Industrials Sectors on Malaysian Firms. International Review of Business Research Papers, 5: 137 – 155
7. Chen, H., Kacperczyk, M., Molina, H. (2008). "Do Non-Financial Stakeholders Affect Agency Costs of Debt?".WorkingPaper.University of British Columbia.
8. Chen, H., Kacperczyk, M., Molina. H. (2008). "Do Non-Financial Stakeholders Affect Agency Costs of Debt?".WorkingPaper.University of British Columbia.
9. Cheng, M. T. (2009). Relative effects of debt and equity on corporate operating performance: A quintile regression study. International Journal of Management, 26: 142.
10. El-SayedEbaid, I. (2009). The impact of capital-structure choice on firm performance: empirical evidence from Egypt. The Journal of Risk Finance, 10: 477-487.
11. Fosberg, R. H., Ghosh, A. (2006), Profitability and Capital Structure Of Amex And Nyse Firms, Journal of Business & Economics Research, 11: 57-64.
12. Fosberg, R. H., Ghosh, A. (2006), Profitability and Capital Structure Of Amex And Nyse Firms, Journal of Business & Economics Research, 11: 57-64.
13. Fosu. S(2013). Capital structure, product market competition and firm performance: Evidence from South Africa.The Quarterly Review of Economics and Finance
14. Jermias, J. (2008). The relative influence of competitive intensity and business strategy on the relationship between financial leverage and performance. The British Accounting Review, 40: 71-86.
Morteza Dadgostar Moghadam and Mehrnoosh Jafari et al.
Indian Journal Of Natural Sciences www.tnsroindia.org. © IJONS
Vol.5 / Issue 30 / June 2015 International Bimonthly ISSN: 0976 – 0997
7410
15. Krivogorsky V., Grudnitski, G., Dick, W. (2009). Bank Debt and Performance of Continental European. 16. Lee, Cheng. F. (2009). Cash Holdings, Corporate Governance Structure and Firm Valuation, Review of Pacific
Basin Financial Markets and Policies, 3: 475-508. 17. Margaritis, D. Psillaki, M. (2012). Capital structure, equity ownership and firm performance. Journal of Banking
& Finance. xxx, 1-12 18. Modigliani, F., Miller, M. H. (1958). The cost of capital, corporation finance and the theory of investment. The
American economic review, 261-297. 19. Myers, C. (2001). Capital Structure. Journal of Economic Perspectives, 2: 81-102. 20. Opler, T. C., Titman, S. (1994). Financial distress and corporate performance. The Journal of Finance, 49: 1015–
1040. 21. Sajadi, H, Mohammadi, K, Selgi, M, (2009). “a studyon effect of the characteristics of the company on the capital
structure of the listed companies in Tehran Stock Exchange,accounting investigations,No. 1 0: 37-57. 22. Sajadi, H, Mohammadi, K, Selgi, M, (2009). “a studyon effect of the characteristics of the company on the capital
structure of the listed companies in Tehran Stock Exchange,accounting investigations, No. 10: 37-57. 23. Swirskys.The implications of market share changes on the market's pricing of earnings. The Florida state
university 2004; college of business, spring. 24. Tang, C., Jang, S. (2012). Revisit to the determinants of capital structure:A comparison between lodging firms
and software firms. Hospitality Management, 26: 175–187 25. Tao Wang, D., Thomakos, G., Papanastasopoulos (2010), "The Implications of Retained and Distributed Earnings
for Future Profitability and Stock Returns", Review of Accounting and Finance, 9: 395-423. 26. Zeitun, R., Tian, G. G. (2007). Capital Structure and Firm Performance: Evidence from Jordan. Australia
Accounting Business and Finance Journal, 1: 148-168.
Table 1: Descriptive analysis of variables
Variables Observations Mean Standard deviation
Maximum Minimum
ROA 690 .1137618 .10066442 .62740 -.71793 Ability to compete in the product market (dummy variable)
690 .43 .495 1 0
Financial Leverage 690 .6272328 .22187339 2.72928 .09641 Firm size 690 13.3799608 1.41142358 18.43763 10.45844
Sales growth rate 690 .194355 .5515748 9.4685 -1.0000 Table 2: Test of normality of the dependent variable
Dependent variable
Kolmogorov-Smirnov test The significance level Degrees of freedom The test statistic
Return on Assets 0.087 625 0.055
Morteza Dadgostar Moghadam and Mehrnoosh Jafari et al.
Indian Journal Of Natural Sciences www.tnsroindia.org. © IJONS
Vol.5 / Issue 30 / June 2015 International Bimonthly ISSN: 0976 – 0997
7411
Table 3: Results of statistical analysis for hypothesis testing
ROA i,t=β0+ β1Levi,t+ β2 Levi,t-1+β3Lev2 i,t-1+β4Sizei,t+β5 Size2i,t +β6Growi,t+€i,t
F-significance level F-statistics Durbin-Watson Statistics
Adjusted R2
0.000 151.227 1.695 0.576 Significance level
(P-value) T-statistics The coefficient of β
(standardized) Variable
0.000 14.925 1.79 Levi,t 0.000 6.923 0.351 Levi,t-1 0.002 3.036 0.182 Lev2 i,t-1 0.004 2.858 0.995 Sizei,t 0.001 2.571 0.893 Size2i,t 0.000 4.708 0.12 Growi,t
Morteza Dadgostar Moghadam and Mehrnoosh Jafari et al.
Indian Journal Of Natural Sciences www.tnsroindia.org. © IJONS
Vol.5 / Issue 30 / June 2015 International Bimonthly ISSN: 0976 – 0997
7412
Love from the Perspective of Parvin Etesami and Forough Farrokhzad
Mojtaba Hosseini1* and Zivar Dehghani2
1Assistance Professor at Department of Persian Language and Literature, Faculty of Literature and Humanities, Bushehr branch, Islamic Azad University, Bushehr, Iran. 2PhD Student, Department of Persian Language and Literature, Bushehr Branch, Islamic Azad University, Bushehr, Iran. Received: 25 Mar 2015 Revised: 19 Apr 2015 Accepted: 29 May 2015 *Address for correspondence Dr. S. Mojtaba Hosseini Assistance Professor at Department of Persian Language and Literature, Faculty of Literature and Humanities, Bushehr branch, Islamic Azad University, Bushehr, Iran. E-mail: [email protected]
This is an Open Access Journal / article distributed under the terms of the Creative Commons Attribution License (CC BY-NC-ND 3.0) which permits unrestricted use, distribution, and reproduction in any medium, provided the original work is properly cited. All rights reserved. One of the most significant points in comparative literature is the unity of human thoughts that depicts how the thoughts and ideas of a scholar, writer, or poet in one side of the world take an opportunity to be expressed in some other way. Love is a necessary instinct in all creatures; in fact, it is the contrasting relationship between organisms to save their species. The most vital is love between two human beings that constitute the foundation of family. Love has many forms: love of the homeland, the family, nature, beloved, wealth, animals, plants, objects, beliefs, ideas, arts, sports and.... The history of Persian literature has experienced many female poets, but Forough Farrokhzad and Parvin Etesami are the shining stars of this sky. Parvin’s name and fame have remained and will remain so over the years because she attempted to inform the women of her age and realize their social rights through her language and punctilious words. Forough is also famous for his particular style and new blendings in poetry. This paper tries to study love from the perspective of Forough Farrokhzad and Parvin Etesami. This library base esssay will use books, articles, and digital sources that is common in humanities. Key words: Love, Parvin Etesami, Fourough Farrokhzad, Contemporary Poetry
RESEARCH ARTICLE
ABSTRACT
Indian Journal Of Natural Sciences www.tnsroindia.org. © IJONS
Vol.5 / Issue 30 / June 2015 International Bimonthly ISSN: 0976 – 0997
7413
INTRODUCTION
“I have not seen more than the words of love, A souvenir will remains in this circular cupola”
Speaking of love and its eternal governance is the constant companion of human beings. Appeals and tensions engulfed the whole of existence are the manifestations of love. Love sits down in hears in various ways and utters its words in different speeches. Love is described as, “it is an excessive desire and refers to the extremes of friendship and affection, and it also indicates the last stand of affection and the ultimate goal of life. Then the true meaning of life will be fulfilled if one obtains the ultimate goal, or union. Literature, especially poetry, is full of love and secret codes. Romantic poetry, based on lyrical minds of poets, has had some vicissitudes different periods of Persian poetry, but Persian literature cannot ever be conceived without the presence of Persian “love”. Romance poems began mostly in form of sonnet-like odes; however, the propagation of love largely depended on the presence and popularity of lyric. For instance, Sanaei, who is an avant garde of lyric in Persian poetry, wrote in two categories. First, lyrical poems that refer to earthly love, and later reached a peak in Saadi; second, moral – spiritual lyrics that reached its climax in its evolution through the works of poems such as Nezami, Khaghani, Attar and Rumi” (Shamisa 2002: 211).
Saadi is considered as the pinnacle of romantic lyric in Iraqi style, Rumi the climax of mystical poetry, and Hafiz takes the responsibility to combine both mystical and romantic lyrics. Love has its particular journey in the course of periods and styles in such a way that its footprints are observable in contemporary poetry as well as classical poems. In the poetry of some contemporary poets beloved is still an unfaithful beautiful friend whose separation causes the constant complains of poet, but some contemporary poets pays their realistic attention to love. Earthly love leads to a heavenly love. Forough Farrokhzad is among the later poems, but Parvin refers to supreme love and love is the theme of all his poems, while she did not speak of love.
Biography of Parvin Etesami
Parvin Etesami, the famous Iranian poet, was born in Iran on March 1907. Her father, Yousef Etesami, was writer, scholar, translator who advocates early constitutionalism, the first president of the National Council Library and editor of the literary magazine Bahar. (Arian Pour, 1997, vol 2, p 539).
She was educated first by her father, then moved to Tehran to continue her education, and achieved her diploma in 1925. In 1934, she married by the force of her father and began a life aside a man much far from her internal feelings; the destructive impacts of this life can be seen in some of her poems,
“Oh flower, what have you tased from the mass of other flowers? Except snubs, and the harassments of thorns, Walked into lawn, but achieved prison, Except cage, what hae you seen, the prisoned bird?” Parvin’s father died and she broke again, therefore, her depression increased. Contrary to other poets, Parvin does not talk about herself, therefore the majority of her literary figure, taste and thoughts must be inferred from the lines of her poems. Her poetic and thought scope includes all classes of society such as kings, ministers, judges, lawyers, governors, muhtasib, workers, farmers, men and women. She wrote mostly in forms of Qet’eh, Qasida and Masnavi.
Mojtaba Hosseini and Zivar Dehghani
et al.

Indian Journal Of Natural Sciences www.tnsroindia.org. © IJONS
Vol.5 / Issue 30 / June 2015 International Bimonthly ISSN: 0976 – 0997
7414
Analysis of literal, semantic and intellectual characteristics shows that she took the simplicity of Khorasani style and eloquence of Iraqi style to combine masterfully emotions and ideas and new messages with the old forms. Rhetorically, most of her poems are symbolic. Rarely used she difficult words, blendings and expressions, and other verbal and meaning complexities in her book of poems (Ahmadi-Givi, P. 21).
Her poetry collection has 6500 distichs, which has been reprinted repeatedly. Parvin died of typhoid on fifth of April 1941 in Qom and buried in the family tomb.
“Beneath this soil which verdure refuse, Lies Parvin, literary star and muse; Who, While suffering the bitterness of Times, Composed charming, sugar-laden rhymes” (Parvin, 2010, p. 86)
Expressions of love in the Poems of Parvin Etesami
Many believe that Parvin does not care about love, but a careful reading of her poems uncovers that love is the most enduring and prominent element of her poetry.
“From love, union, separation, and contact, You read a word, and I do a book” (Ibid, p. 263)
In his introduction to the first print of Parvon’s book, Malek o-Sho’arā Bahār, claims, “Maybe an insane reader asks: What does this book says about love, the only detonator of poetry?
Of course, we should not ignore this meaning; because while the poet of these lines did not walk in a path to mention about love due to her self-esteem, chastity and virtue, if you look more carefully, you will see it is not empty of love. It is not the kind of love taught in the school of Leili and Majnun. It was a love whose integral parts were separation of sweetheart, yellowness of face, persecution, competitor, burning, melting and thousands of other legends; this love has lost its true connotations and only some uncertain terms have remained of the classic school for its imitators. Such love and vulgar way would not arise in Parvin’s book because of its opposition to truth and inconsistent with the character of the poet. Beyond this, one walks into the path of real love, which is desired by most of great poets. It is a love for truth and spirituality on which bases the foundation of human creation is laid. This love is the base of Parvin’s poems.
The art of the female poet is the fact that she is able to cultivate this great meaning anywhere in his speech with a subtle style in order to express the truth of love like the separation of a holy and pure fruit from the tough fibers and toxic wastes of branches and leaves. In this regard, she can foster meaning by the purity of fire, the shining of light and flavor of soul” (Ibid., pp. 47-46).
In fact, true love and compassion is the essence of Parvin’s poetry and looms all over her book. Love of the truth is the same as a touchstone that removes material pollutions from soul and makes heart a place for manifestation of the divine lights. Some may burn and ash due to the sparks of love. It is clear that if one realizes the truth of love, he will ignore the world and everything in it, therefore he is called insane by people unaware of the fact that he is insane of God’s love. Parvin considers the insanes of truth wiser than intellectuals because the insanes moves in field superior to intellectual fields. Their scope is paradise in paradise with the slightest resemblance to the material world:
“Oh my friend, you may call me insane,
Mojtaba Hosseini and Zivar Dehghani
et al.

Indian Journal Of Natural Sciences www.tnsroindia.org. © IJONS
Vol.5 / Issue 30 / June 2015 International Bimonthly ISSN: 0976 – 0997
7415
But I am wiser than wise men, If all wise men were as insane as me, The world was full of intellectuals, As gnostics heard this speech, Lost themselves and found God, I can see Beauty in beauty, You see nothing but hallucination and illusion, I see heaven in the heaven, You see nothing but soil and clay” (Ibid, p. 44)
Parvin believed that the soul must be sacrificed for his beloved in the real love
“Oh, it is blessed to serve the sweetheart eagerly, To have a heart devoid of goodness and badness of green loop, To come to the goshawk of love with no feathers, To have the ceremony of a dove in front of falcon, To burn, smelt and to fire like a party candle, To burn the body in the ardor of beloved face, To cultivate tears like gem in the red sea of affection, To have a merchant eye that trades red ruby, To lose myself, where the fire is present, To behave like a Samandar where the fire is” (Ibid, p. 102) Theses lines describes a kind of love free from modern human materials, one in which lover sacrifices himself for the progress of beloved; the only thing that survives is beloved. It is achieved when the Lover heart is devoid of good and evil of the universe. (Ghanoon Prvar, 1981, pp. 316-314).
Parvin does speak of sincere love in this way
“Love is the one, who occupies heart, Speech is the one, who lives in tongue, Lover might die for beloved, You must perform, it is only some words” (Parvin, 2010, p. 116) In this way, she separates the path of love from temporary feelings, knows it as coming from the heart and conditions it to the honest actions; in her viewpoint, speech is not included to what comes from tongue.
She insists true lover must see itself mortal in comparison with beloved in such a way that nothing will remain from the lover; the lover should not complains the unfaithfulness of beloved. She characterizes the true lover by describing the mood of candle and butterfly; while the candle is talking about the butterfly’s absence unaware of its life… and complains, the butterfly has vanished its life to meet candle.
“I lose my soul and body for you, My day is much better than your, I burn my feather and keep quiet, While the of butterfly’s ornament is feathers, No one knew that I was burning,
Mojtaba Hosseini and Zivar Dehghani
et al.

Indian Journal Of Natural Sciences www.tnsroindia.org. © IJONS
Vol.5 / Issue 30 / June 2015 International Bimonthly ISSN: 0976 – 0997
7416
Burning, keeping quiet, is the art” (Ibid, p. 110)
Not surprisingly, Parvin talks about earthly love in her poems because love is the consequence of human feelings and it accompanies human beings always. Parvin personalizes flower and nightingale to describe the joy specifications in some of his poems and explains her inside enthusiasm in their language.
“A flower hides itself behind a leaf, the nightingale said, Do not cover your face; it is the reason of our happiness, Do not burn the true lovers by the fire of distance, Our fame is the result of journey to your path” (Ibid, p. 164)
In one of her poems, Parvin warns clearly man of sensuality in love and believes that paying attention to God will lead man to avoid sensuality.
“Decreased his price, on who humiliate himself, We afraid the deal, increase our price, Two days is the sensuality of eagles, It is enough to become the purpose of gardener” (Ibid, p. 165)
In her poem “Eye and Heart”, eye complains to heart and talks about the crude thoughts and displaced desires of eye that results in its disgrace and has turned into a gushing fountain of blood. The eye invites the heart to contemplate on the sea of love and the roaring waves of intrigue; it reminds how the essence of Life has been vanished through this journey:
“The ways of intrigue coming from the sea of love, One who asserts his love, lose his life” (Ibid, p. 63)
It addresses the eye versus the complaints of unblessed heart, and starts to talk
“You went and carry me with yourself, You give me to the prison of love, Your affairs devaluate me, You saw first, then I demaned” (Ibid, p. 64)
To see more, the eye continues: it was you who showed love for me a clean and safe way while it is a cliff. You were satisfied by the hope of union; bu separation smashes me into pieces.
“You said that the way of love is empty of intrigue, As I saw, it was a macabre cliff, If a rock comes from the beloved mountain, It hurts your feet, but my head, If an idol throws his arrow, it touches your garment, but my body, You touched the fire, but I burnt, You have one word, but I have many words” (Ibid, p. 64)
Mojtaba Hosseini and Zivar Dehghani
et al.

Indian Journal Of Natural Sciences www.tnsroindia.org. © IJONS
Vol.5 / Issue 30 / June 2015 International Bimonthly ISSN: 0976 – 0997
7417
Although she considers this material love as a fatal precipice, she likes love with all of its pains, and wishes “In the rush of riders and archers of love, To have a thoracic ready to execute” (Ibid, p. 103)
Parvin sees life cool-looking without a beautiful beloved; since love empower human beings to achieve salvation with its stability, has had she any beloved? She certainly has. About what beloved does she talk? Heavenly or earthly? While heavenly beloved is supreme but the earthly is essential for growth. Regarding the fact, she attended constantly with his father in literary circles where men were present; so, who is her beloved? So why is there no name of any man in his poems?
“One must choose a beautiful beloved, See in him everything, and put the world aside, Caper in the way of love affairs, Peace or war in the way of union, Being drown in a drop, To move largely, pass the sea, While my path is clear due to the light of his face, I have no fear if I see a wave or hurricane” (Ibid, p. 33)
In “Without Love, our Night Had not Dawn”, the subject is the griefs of a nightingale prisoned in a cage. It is so sad that forgets flying and is afraid of the extension of distance and death in pain. However, it burns in the fire of love and does not try to fly. It does not cry, not because it has no tears, but because it aims to hide this gem in the shell of its soul, and this gem is rare.
“Our night will not meet dawn without the beloved, The melting of candle, heart, and me is ineffective, A medic visits the three patient, but It was late, and treatment was without effect, You know when the panacea reached to Sohrab, When he has only a dead body, Yesterday, a nightingale saw a flower in cage and died, It had not the hope to be free, It did not resist avoiding imprisoning, Did’t has this misfortune prey the wings and feather, The butterfly did not burn, but due to its eager affection, It saw the flame, but was indifferent to its head, I have cultivated my tears like gem in the sea of eye, For you not to say that I ave not a gem” (Ibid, 101)
The poem portrays Parvin’s most romantic feelings while no sign of desire for a male company is seen in all through of his book (Behbehani, 1991, 969).
Moreover, she has never worshiped her beloved in the realm of imagination; it indicates that no beloved has shown himself deserving her true love. The other reason may be her short and unsuccessful life (Soltani Gard Faramarzi, 1991, pp. 212-13).
If Parvin has not died before 30th years of her life, did she fell in love with a man?
Mojtaba Hosseini and Zivar Dehghani
et al.

Indian Journal Of Natural Sciences www.tnsroindia.org. © IJONS
Vol.5 / Issue 30 / June 2015 International Bimonthly ISSN: 0976 – 0997
7418
If Parvin has not died before 30th years of her life, did she continue not to talk an=bout her beloved? Biography of Forough Farrokhzad
Forough Farrokhzad was born in 1935 from a Tafreshian father and Kashanian mother. She is the fourth child of Toran Vaziri Tabar and Mohammad Farrokhzad. She spent his childhood in a middle class family. Finishing the third garde at high school, she went to the women school and learned sewing and painting. She sewed very well and claimed, “When better I back sewing, I say better poems” (Jalali, 1996, p. 559).
Forough began his career by collection of poems such as The Captive, The Wall and Rebellion in forms like lyric, chahar pareh (four parts), masnavi and Nimaian poetry. She married to Parviz Shapour who was 15 years older in 1940; very soon, she got divorced in spite of having one child called Kamyar.
Her father states motive for the separation: “I have encouraged her when she started writing poems, but I was sad when her poems lead to various conflicts and challenges for her while they damage her private life. She was so decisive that separated from her husband. Apparently, I was sad but I admire her inwardly. In fact, her desire to compose poems was so severe that she could not suppress this this inner need.
In the year 1947, he was seriously starting poetry. First sonnet form was chosen by her. The first collection of poems called “The Captive" was released in 1952 and the second in his series called "The Wall" was published in 1956. The third in his series called "Forough" was published in 1957 and "Another Birth" is the fourth collection of poems published in 1964. In the last book, Forough had recognized the human existence; she felt all moments of her earlier culture nd tried to change them.
“Let us believe in the beginning of the cold season” is a collection of poems released along with some other poems after the publication of “Silence”.
Iranian spirit flew I forough; if she remains alive, she could achieve flourishing and further development. Moreover, she would truly become one of the greatest poets of the twentieth century in Iran (Azad, 1997, p. 41).
In February 1967, forough died in a car crash. She actually made his life in the love of children. While she was going to Golestan Movie Studio by jeep, a minibus cut her way, she went out of the road […], and as she had said, “I am afraid to die sooner than I think and works remain undone., …” she moved to the next world be she done her jobs that is a great pity (Ibid, p. 43).
Forough’s Earthly Love
The main characteristics of his poems are the sincerity and frank expression of inner emotions and clear visualization of emotions. These features lead her poetry to a place that pays a special attention to physical or earthly aspects of love. It seems that the most important point of emphasis among her proponents and opponents - especially in the lifetime. In other words, her opponents protested mostly for her expression of lovely emotions with an emphasis on the physical aspects presented repeatedly all through her works. On the other hand, her proponents considered these features a reason for her success (Rahimi, 2004, p. 2).
Her love began at the age of sixteen. She felt in love with the man whom she had married. The result of the marriage was failure and separation. In fact, the earthly love did not satisfy her, therefore, she sought it permanently. In her earlier series, she talks about earthly love because she is hungry for physical love.
Mojtaba Hosseini and Zivar Dehghani
et al.

Indian Journal Of Natural Sciences www.tnsroindia.org. © IJONS
Vol.5 / Issue 30 / June 2015 International Bimonthly ISSN: 0976 – 0997
7419
“The moonlight, falling on his face, in the stardust of his gaze, in the shaking sparkle of his eyes, the flames of sin ignited and smiled.
The helpless flash of light, fleeing away the flaming fight, sheltered in the silence of his mouth.
Confused, shying away, yet tamed– by the might of a vague urge, he said: “The gardeners of night spread to grow– now ripped, with a golden glow…” (The Captive, Kiss)
“Once again, from the spring of my lips, a thirsty was watered ending his wild trips. Again in my bosom, my bosom’s deep–s A pilgrim is fallen sleep, sleep! I look into his eyes with an air to seduce, Yet I know not what it’s all meant to induce. I think I look for a mad lover to tame– To forgo for me his name and fame! And he asks from me the wine of my kiss, What shall I tell my heart about this bliss? For my heart is after the eternal joy– But only lust seems to be his ploy!” (The Captive, The Stranger)
“Why do you ask about the color of his eye? The eye’s color will not limit me, The fire flame of his eyes, Strapped the insane heart, I lost in the abyss desert of love, In a night, like my fortune dark, Abruptly, without the chance to run, The rain of sin fell on me” (Wine and Blood) “My heart beats, and in each beat, Your tale is repeated” (Bitter Meeting)
“One night, tired eyes of a man on me, Slipped, weakened and sleept, I wanted to break the string of watch, My heart beatened, and pushed me to him again” (The Captive)
Love and a Return to Childhood In her poetry, love for his childhood sweetheart, marital beloved, shared love and beloved of intellectual and poetic maturity arise. Sometimes her earthly beloved takes ambiguous and transcendent figure. She wants spiritual and transcendence love away from the whims.
Mojtaba Hosseini and Zivar Dehghani
et al.

Indian Journal Of Natural Sciences www.tnsroindia.org. © IJONS
Vol.5 / Issue 30 / June 2015 International Bimonthly ISSN: 0976 – 0997
7420
“From my bright eyes snatch the eagerness to run to another; . . .and teach my eyes to shy away from the shining eyes of others. . . O lord, O lord. . . show your face and pluck from my heart the zest for sin and selfishness. do not tolerate an insignificant slave's rebelliousness and refuge-seeking in others. . . hear my needful clamor, O able, unique God.” (The Captive, Face to Face with God)
Forough represents he sharp female sensations in “Love Poems” and poems that refer to nature, love and a return to childhood. She is satisfied by experience love, and regrets that she had not already been in love (Moradi Kouchi, 2000, p. 129).
Forough is truthful because all her wounds come from love. It is not possible for her to tell such lies because she is filled with love that burns the bases of lie in her heart; no well experienced one may tell lie and accept this humiliation.
“I shall give up lines and give up counting syllables too. and I will seek refuge from the mob of finite measured forms In the sensitive planes of expanse. I naked, naked, naked, I naked as silence between words of love, and all my wounds come form love, from loving...
This wandering island, From the revolution of ocean, From the blast of mountain, Ans smashing, I save, Its secret was a unified being, whose trivial parts made sun” (Let’s Belive in the Beginning of Cold Season) In his title “The Eternal Life,” Dr. Behrouzi states, “forough is sincere because she is a lover; she tells frankly her words on what she sees and feels. We have seen no contradiction and tension in her earliest works and his successful poems only because of Forough’s constant immersion in the sacred nature of love, which resulted in unity in thought. True lover does not see anything fictitious and contemptible and judges based on his cosmopolitan ideas due to his attachment to the greatest the phenomenon of the creation, or love.
Lover is not small to see small objects, not disdained to look humiliated. What we see is all the aura of a magnitude. Forough, according to her poems and her life, was among the rarest of people. She had spent all moments of her life with love. Following her instincts, forough had always walked in the path of love, and this natural love was the code of her honesty to herself, people and God.
Mojtaba Hosseini and Zivar Dehghani
et al.
Indian Journal Of Natural Sciences www.tnsroindia.org. © IJONS
Vol.5 / Issue 30 / June 2015 International Bimonthly ISSN: 0976 – 0997
7421
In her poems, Forough thanks God for creating the infinite beauties surrounded her and fulled her eyes because she is a lover.
“All we have is from you, you that say: My love is like a sea, and anger is like a storm Anybody I want will be dark heart, Anybody I choose is immaculate. So what for are theses vain efforts, We may penetrate into the holes of an ivory, May move, may call, All is your desire, We may not disobey your command, oh God” (Rebellion)
Love and Unity
The last perspective of any love is to meet the sweetheart, or to join the beloved and reach union. Egoism is removed by love and faded gradually in the beloved. Caprice is to follow the manifestations of “self”, in which poems forough did highlighted her “self”? If we analyze her poems in a chronological order, Forough’s “self” is gradually faded and finally no sign of “self” and “body” is found in her poems, only the beloved exists. Beloved is manifested in various forms, first as human being and humanistic attributes, then as God and divine attributes.
Love awakened in my heart, All my being sacrificed for desire, This is not me, Alas the life I spent with my ‘self’” (Another birth, Lovely)
“You draw me on canvas, How did not you discover my secret? I give up your body, in the world No body is my object” (Wall, tantrum)
My whole being is a dark chant” which will carry you perpetuating you to the dawn of eternal growths and blossoming in this chant I sighed you sighed in this chant I grafted you to the tree to the water to the fire.” (Another birth)
“If I run to you such, I am in love with love not your union, For the darkness of my night, The fancy of love is better than yours” (Wall, tantrum)
“Warn the one who cries, Oh my heart to his sadness, This forgiveness is the peak of love,
Mojtaba Hosseini and Zivar Dehghani
et al.

Indian Journal Of Natural Sciences www.tnsroindia.org. © IJONS
Vol.5 / Issue 30 / June 2015 International Bimonthly ISSN: 0976 – 0997
7422
Your heart for mine, your body hers” (Ibid)
“Be aware of what I like, I will be you, you all you, If life repeats thousand times, You again, you again” (Captive, From love)
Forough had never lived without love; therefore, the same message is indicated in all of her poems, from the first ones to the last ones. While she moans about the sickness of her child in a bed in her early poems, the late poems shows her moan at her son as the representative of all unfaithful and hollow men. He is the man whom been found by Forough. Sh loves him madly and tries to offer him a window to consciousness and a view to Gnosticism.
“One window is enough for me, One window to the moment of consciousness And looking and silence. When my faith was hanging By the weak thread of justice and in the whole city The hearts of my lamps were Being torn to pieces, When the childlike eyes of my love Were being blindfolded by law's black kerchief, And fountains of blood were gushing forth From the distressed temples of my desire When my life was no longer anything, Nothing but the tick tock of a wall clock, Discovered that I must, That I absolutely had to Love madly.” (Let’s Believe in the Beginning of the Cold Season, Window)
Confession of Love
Forough is wounded by the sword of love and frankness; this bitter result is the punishment of apparent and free living (Jalali, 1996, p. 28).
“I naked, naked, naked, I naked as silence between words of love, and all my wounds come from love, from loving...” (Let’s Believe in the Beginning of the Cold Season)
Forough affirms, “I feel that there is confusing pressure under my skin […] I want to delve everything, penetrate into the earth and to get deep into the ground. My love lives where beans are born, roots come together, and creation is carried on among decay. As if is always existed, before birth and after death, as if my body is a temporary form, I am going to get my own originals [...] I want my heart to hang from tree branches like a ripe fruit (Jalali, 1996, pp. 61-60).
Mojtaba Hosseini and Zivar Dehghani
et al.

Indian Journal Of Natural Sciences www.tnsroindia.org. © IJONS
Vol.5 / Issue 30 / June 2015 International Bimonthly ISSN: 0976 – 0997
7423
Love of Mysticism
Dr. Hamid zarrinkoub, in his book “Eternal Life, Staying in Peak”, claims, “Forough’s motif for life and poetry is initially love. Nevertheless, the love covering all of her real and real life led to nothing but frustration and failure. The mark of failure resulted in her rebel against everything. Eventually, her opinion about love is changed, the emergence of “Another Birth” shows that the concept of love has changed for her in the course of time ibid, p. 314).
Therefore, Forough considers gradually a kind of mysticism through love, which is manifested in her masnavies and love poems. The view seems to some extent oriental. She moves to find a window for the hope of human beings and does not accept the wicked ultimate of the world. The viewpoint is reflected in form of metaphors such as ‘to plant in a garden,’ ‘may be opened, ‘may be born’ and ‘may grow.’ This is an oriental theory that affirms her development (Ibid, p. 365).
In her poem “face to face with God,” she confesses her sin and asks God to commit her heart to loyalty and faith and devoid of lust and caprice because it is captured permanently by Earthly loves. She seeks for a man in whom to find God’s purity, n love with him and loyal to him. She talks about sacred love without physical aspects:
“Yes, it is the beginning of love, While the end is unclear, I do not think of other endings, Because the love is beautiful, Be aware of what I like, I be you, you all you, If life repeats thousand times, You again, you again As I am full of you, Collapse like a dust of me, Carve figures in the stones, Swim in big seas” (Captive, From love)
In spite of all of her sins and physical loves, Forough relies on God like immaculate mystics. She mocks false pious and carves his name on the the stone of universe disregarding all tags and insults because her heart is shined due to true love.
“Warn the one who cries, Oh my heart to his sadness, This forgiveness is the peak of love, Your heart for mine, your body hers, You draw me on canvas, How did not you discover my secret? I give up your body, in the world No body is my object” (Wall, tantrum)
“Your long forehead in the light of candles, Was calm and subdued like a clear sea, Was sitting with silver legs, A clear dream under your eyelids, I was hungry for your sound that sang
Mojtaba Hosseini and Zivar Dehghani
et al.
Indian Journal Of Natural Sciences www.tnsroindia.org. © IJONS
Vol.5 / Issue 30 / June 2015 International Bimonthly ISSN: 0976 – 0997
7424
Those blessed words in my ears” (rebellion, The Crystal of Dream)
“Fly to dark clouds, My hopeful clear eyes I moan for heart, Oh God I love him, I love” (Rebellion, Sound)
The lover of morning’s star, The lover of wandering clouds, The lover of rainy days, The lover of what your name is on” (Rebellion, life)
“You came from far places, far places, From the land of perfumes and lights I sit for you under your flag, From ivories, clouds, crystals Take me, my Orphic hope, Take to the city of poems and passions, You drag me to a way full of stars, You sit me above the stars” (Another birth, Sun Comes)
“Maybe my love, Is a cradle for the birth of another Jesus, I saw that my skin cracked of the expansion of love” (Another birth, Union) “Love awakened in my heart, All my being sacrificed for desire, This is not me, Alas the life I spent with my ‘self’” (Another birth, Lovely)
Frequency of the Word Love in Forough’s Collection of Poems
She used the word “captive” 75, “wall” 25, “rebel’ 25, “another birth”, 45 and “let’s believe” 13 times in the poems (Hoghoghi, 2000, pp. 13, 15).
CONCLUSION
Customs governing the society in which Parvin lived show that men were free to express their love. The fact might lead some women not to express their inner emotions frankly in a fair situation. Parvin’s love is the base of being and exists in all creatures.
Parvin’s womanish love lives in an aura of chastity, and one cannot imagine her physical and earthly love to be infected by the whims and caprices. Parvin’s love includes her worldview and expresses her beliefs. It is enriched by religion and does not diverted in the journey of love and lover. None of her poems describes a love of men while talking much about earthly love. Earthly love is not enough for Parvin; she believes that love must be connected to the divine love to end in real peace.
Dr. Mitra in his book about Fouough Farrokhzad says, “Unlike Parvin Etesami who entwined her emotions with the social logic and and gave it a philosophical spirit, Farrokhzad has stated her emotions in immature, non-stylized and
Mojtaba Hosseini and Zivar Dehghani
et al.
Indian Journal Of Natural Sciences www.tnsroindia.org. © IJONS
Vol.5 / Issue 30 / June 2015 International Bimonthly ISSN: 0976 – 0997
7425
spontaneous manner. Parvin reveals the depth of her being, digs inside the root of her deprivation, passes the sensory cortex of desires and frustrations and reaches the depth of social relations, hence, she regards her deprivation as a social exclusion; Farrokhzad regards her deprivation as a physical exclusion and speaks only to describe this aspect of feelings. Parvin’s emotions are sublimated and come out of raw mode of instincts while Forough’s emotions stay in the cover of instincts” (Moradi Kouchi, 2000, p. 146).
However, the lifestyle of both poets was different and they have different fathers. Parvin’s father was a great teacher and guide for her while Forough’s father was tyrant and opinionated with less attention to religious matters, and it is natural that each child is the offsping of her family education. In addition, the two female characters’ needs, thoughts, and ideas varied; therefore, they were love in different ways. Although Forough walked mostly around earthly love, finally, she prospered and found true love, and it is important that she accomplished the process of perfection. Parvin’s love is very different in such a way that she did not talk about earthly love unless through symbols. . Both poets have thought of earthly and heavenly love but each expresses them in an exclusive way.
Actually, the message of Forough’s poems and the purpose of her life are like all great poets such as Hafez and Rumi. Love is the center of her life and her poetry. Forough’s love has a wide range and his beloved is one specific man. Parvin has love but in a different way.
REFERENCES
1. Ariyan Pour, Yahya (1997). From Nima to our Age. Tehran, Zavar, Vol. 2, 2nd edition. 2. Azad, M. (1997). The Distracted Girl of Poetry: Life and Poetry of Forough Farrokhzad, Sales publication. 3. Etesami, Parvin (2010). A Collection of Poems. Tehran, Sales publication, 9th edition. 4. Behbahani, Simin (1991). Parvin, the Poet of thoughts and Emotions. Papers in the Memorial of Parvin Etesami,
Edited by Ali Dehbashi, Tehran, Mother. 5. Jalali, Behrouz (1996). Eternal Life, Staying in Peak. Morvarid, Publication, Tehran, 2nd Edition. 6. Hoghoghi, Mohammad (2000). Our Age Poetry (4): Forough Farrokhzad. Tehran, Negah publication. 7. Soltani Gard Faramarzi, Ali (1991). The City of Parvin’s Poetry. Papers in the Memorial of Parvin Etesami, Edited
by Ali Dehbashi, Tehran, Mother. 8. Ghanon Parvar, Mohammad Reza (1991). Parvin’s Ideal World. Papers in the Memorial of Parvin Etesami,
Edited by Ali Dehbashi, Tehran, Mother. 9. Moradi Kouchi, Shahnaz (2000). Undrstanding Forough Farrokhzad. Qatreh publication, Tehran.
Mojtaba Hosseini and Zivar Dehghani
et al.

Indian Journal Of Natural Sciences www.tnsroindia.org. © IJONS
Vol.5 / Issue 30 / June 2015 International Bimonthly ISSN: 0976 – 0997
7426
Comparison of Multi-grade School Teachers’ Behavior in Using Strategies of Time and Space Management Considering Gender, Level of Education, Teaching Experience, and Different Levels of Acquired Courses
Golnoosh Mirsaidi* and Maryam Yaghoubi
Faculty of Paramedical Sciences, Tehran Medical Sciences Branch, Islamic Azad University, Tehran, Iran. Received: 19 Mar 2015 Revised: 23 Apr 2015 Accepted: 29 May 2015 *Address for correspondence Golnoosh Mirsaidi Faculty of Paramedical Sciences, Tehran Medical Sciences Branch, Islamic Azad University, Tehran, Iran.
This is an Open Access Journal / article distributed under the terms of the Creative Commons Attribution License (CC BY-NC-ND 3.0) which permits unrestricted use, distribution, and reproduction in any medium, provided the original work is properly cited. All rights reserved.
This article aims to explain strategies of class management in multi-grade schools of west of Mazandaran. The research is carried out through descriptive survey method. Statistical society is all teachers of multi-grade classesin the west of Mazandaran including 129 persons. Thestudysample consisted of85subjects (10 females and75males) who were selectedby stratifiedrandom samplingaccording to thetowns. This study employs a questionnaire made by researcher with 90 percent reliability.T and Ftestswere used to analyzethe data. The results show that women are more agree than menwiththe proposedstrategiesto managetime and place(Class) requirements. Moreover, Teachers who have adiplomaorassociate degree are more agree with theproposedstrategiesofprofessional experience andteachingmethods. Rather than teachers who have bachelor’s degreeor higher.Otherresults ofthe study indicate that there is no significant difference between the proposedstrategies in the view of teachers withteaching experienceandteachers withdifferent levels ofacquired courses.
Key words: Multi-grade class, time management, space management;
RESEARCH ARTICLE
ABSTRACT
Indian Journal Of Natural Sciences www.tnsroindia.org. © IJONS
Vol.5 / Issue 30 / June 2015 International Bimonthly ISSN: 0976 – 0997
7427
INTRODUCTION
Multi-grade teaching refers to a kind of teaching in elementary schools in which a class contains students of different grades. In Nepal, multi-grade teaching is considered as an opportunity that allows teaches to teach students simultaneouslyin the same classordifferent classes. In Malaysia, multi-grade teaching is training students of two or more grades in a single class. In multi-grade teaching, successive grades are combined together. In China, this type of teaching is called multi-group teaching or multi-grade class because this combination of words explains appropriately grouping according toage andability ofstudents. In Indonesia, multi-grade classes are observed in both small and big classes (Berch&Lali, 2000). In these schools, a teacher teaches lessons to students of several grades at a same time in different classrooms or in classrooms separated by temporary walls. In the sample learning centers of temporary teachers, ateacher orlocalgroup ofteachers teachstudents of all grades inasmall class. Inthe Philippines, the term multi-class teaching is used for the case of teaching to two or more grades. The term may be different for educatingstudents of differentability levelsinaclassordifferent racialgroups in a class, which the lessons are taught them in native languages (2007).
In the educational system ofIran, the existence of multi-grade classrooms is inevitable and considerable (Haji Eshaghi, 2009).Statisticsforthe past 15 yearsshows that the process of constructing multi-grade classrooms has been developed and every year the number of multi-grade classrooms will be increased.In this regard, there are about 44032 lessons for multi-grade classrooms in Iran and it contains 17.21 percent of all classes hold in Iran (Faraji, 2000). Of course, thisaccelerated rise is not a particular feature of Iranian system and this issue is observed in many countries throughout the world. Distribution ofvillages,specific geographicalfactors, population declinesin general, lackofcompulsoryeducationstudentsinsome villages, using children in agriculture, otherlivelihood affairs of rural households, and lack of education for girls are barriers preventing the establishment of regular educational units that are single-grade classes (Samadian, 2008). With respect toa globalagreement(the successor meetingin Thailandin 1990), since this decadewas named “Decade of Education for All” in order to help all elementary school students to accessthebasic education, need todevelopmulti-grade classesincreased. However, this decision not only removes the causes of claiming the economic loses of classes with the small number of students but also helpsto completebasiceducation. About 30 percentof classroomsaround the worldare multi-grade classes and this classesarealwaysneglected(Methout, 2005).
Educatorsorteachers of multi-grade classes have received the least training in multi-grade classroom management (RaufZiaee,1993). Presence of a teacher and administration of all educational and training affairs by him, time limitations, presence of students in both genders, diversity in the grades ofstudentsofbasiceducation, small physicalenvironment forthe classroomor school, and limited training andeducationalfacilities are the common conditions for this type of educational places (Motamedian, 1992).
Teachers of multi-grade classes should organize both lessons and physical space of the class appropriately. The position of seats in class and the methods of using ofwalls, ceilingsand floors ofclass have a huge impact onclassroomperformanceof teachersandstudents. Nevertheless, one may see that this classes are organized the same as ordinary classes and no difference with ordinary classes is observed. In this regard, of multi-grade classes areexamined in two dimensions: (1) educational dimension and (2) teaching space dimension (Aghazadeh&Fazli, 2007). This studytries toexaminethe factors influencingstrategies tomanage time and space of multi-grade classes. Thus, the research questions are:
Is there any difference between male and female teachers’ attitude towards the effective strategies on the management of time and space of class?
Golnoosh Mirsaidi and Maryam Yaghoubi
et al.
Indian Journal Of Natural Sciences www.tnsroindia.org. © IJONS
Vol.5 / Issue 30 / June 2015 International Bimonthly ISSN: 0976 – 0997
7428
Is there any difference between teachers with different educational degrees towards the effective strategies on the management of time and space of class?
Is there any difference between teachers with different professional experiences on the managementstrategies of time and space of class?
Is there any difference between teachers with different levels of acquired courses towards the effective strategies on the management of time and space of class?
Method
The research is carried out through descriptive survey method.
Statistical Population and Samples
Research statistical society is all teachers of multi-grade classesin the west of Mazandaran (Neka – Behshahr – Galogah) including 129 persons. According to Krejcieand Morgantable, thestudysample consisted of97subjects who were selectedby stratifiedrandom samplingbased on thetowns.
Tools for Data Collection
Data was collected by questionnaires. By studying the theoretical foundations, reviewing domesticand foreign studies, utilizing experiences ofteachinginelementaryclasses, and having been occupied in the position of guidance teacher in single- grade and multi-grade schools, researcherbuildsathree-partquestionnaire including introduction and demographic information, questions abouttime managementstrategies, and questions about space (place) managementstrategies. The questionnaire consists of 34 closed questions in Likert’s rage of responses (very much, much, average, little, very little); the questionnaires were delivered to teachers and manager-teachers of multi-grade classes in west of Mazandaran. Content validityof the questionnaire was confirmed bysupervisorsandprofessionalsin thisarea.To obtainreliability, 30 ofthe subjectsweregivena questionnaire in theimplementation ofapilot scheme; the reliability coefficientwas 90 percent indicating goodreliability coefficient oftheinstrument.
Methods of Data Analysis
To analyzethe data,factor analysiswas performedusing SPSS software.
FINDINGS
T independent test was used to find whether there is a difference between male and female teachers’ attitude towards the effective strategies on the management of time and space.
Accordingto Table1,it is clear that there is no significant difference (sig≥ 0.05) between male and female teachers in terms of some factors including locations within the class, teaching method, tools and equipment, and teachers’ professional experiences. Nevertheless, there are significant differences (sig ≤ 0.05) between male and female teachers in terms of some factors including teachers’ flexibility, software and hardware technologies, organization of the learning environment, delegation of authority, and joyful learning environment. Since the obtained means in factors including teachers’ flexibility, software and hardware technologies, organization of the learning environment,
Golnoosh Mirsaidi and Maryam Yaghoubi
et al.

Indian Journal Of Natural Sciences www.tnsroindia.org. © IJONS
Vol.5 / Issue 30 / June 2015 International Bimonthly ISSN: 0976 – 0997
7429
delegation of authority, and joyful learning environment for female teachers is higher, in comparison the male teachers, female teachers comply more with the strategies.
T independent test was used to find whether there is a difference between teachers with different educational degrees towards the effective strategies on the management of time and space of class.
Accordingto Table2it is clear that there is no significant difference (sig≥ 0.05) betweendiploma and advanced diploma teachers with B.A. and higher teachers in terms of some factors including locations within the class, flexibility, software and hardware technologies, organization of the learning environment, evaluation, tools and equipment, delegation of authority, and joyful learning environment.Nevertheless, there are significant differences (sig ≤ 0.05) betweendiploma and advanced diploma teachers with B.A. and higher teachers in terms of some factors includingteachers’ professional experiences and teaching method. Since the obtained means in factors including teachers’ professional experiences and teaching method for diploma and advanced diploma teachers are higher, in comparison the B.A. and higher teachers, they comply more with the sixth and ninth factor considering management of space and time in multi-grade schools.
T independent test was used to find whether there is a between teachers with different professional experiences on the managementstrategies of time and space of class.
Accordingto Table3it is clear that although there is no difference between the two groups in terms of all the above ten factors. As F-testfor verifies equalityof variances between attitudes of the two groups with different professional experiences in six factors (flexibility, evaluation, tools and equipment, delegation of authority, teachers’ professional experiences, and joyful learning environment), t-test was applied to both groups. The results of this test show no significance difference for each of the six factors because the observed significance level for each of factors was (sig ≤ 0.05) higher than 0.05. In terms of factors of locations within the class, software and hardware technologies, organization of the learning environment, and teaching method, F-test does not show any equalityvariance between the attitudes of the two groups. Therefore, SPSS software recalculates them and it shows no significant differences betweenthetwo groupsineach ofthe four factors by considering inequality ofvariances of thetwo groups. Since a significance level higher than 0.05 was observed, one can say with 95 percent confidence that the both group of teachers with below 5 years experience and between 5 to 10 years experience are consistent withthe proposedstrategies tomanagespace and time in multi-grade schools at a same level.
F test was used to find whether there is a difference between teachers with different levels of acquired courses towards the effective strategies on the management of time and space of class.
As in Table 5, analysisof varianceineach ofthe tenfactorsindicates that there is no significant difference between the attitudes of the three groups in terms ofnone of the factors because the significance level for all factors is higher than 0.05. Therefore, one can say with 95 percent confidence that the three groups of teachers with different levels of acquired courses are agree at the same level with proposed strategies in management of time and space in multiple-grade schools.
DISCUSSION AND CONCLUSION
This article was designed to compare and contrast teachers’ effective strategies in time and space class management in according to their gender, level of education, teaching experience, and different levels of acquired courses.
Golnoosh Mirsaidi and Maryam Yaghoubi
et al.
Indian Journal Of Natural Sciences www.tnsroindia.org. © IJONS
Vol.5 / Issue 30 / June 2015 International Bimonthly ISSN: 0976 – 0997
7430
Research findings indicate that there are no significant difference between male and female teachers in terms of some factors including locations within the class, teaching method, tools and equipment, and teachers’ professional experiences. It means that both groups confirm the effect of proposed strategies on management of multiple-grade classes.Nevertheless, there are significant differences between the two groups in terms of teachers’ flexibility, software and hardware technologies, organization of the learning environment, delegation of authority, and joyful learning environment. In this regard, female teachers comply more with proposed strategies on management of multiple-grade classes.
Moreover, this investigation shows that there is no significant difference betweenteachers with different educational degrees in terms of locations within the class, flexibility, software and hardware technologies, organization of the learning environment,evaluation, tools and equipment, delegation of authority, and joyful learning environment.Nevertheless, there are significant differences betweenteachers with different educational degrees in terms ofteachers’ professional experiences and teaching method. Therefore, teachers with diploma and advanced diploma degrees agree proposed strategies for management of space and time in multi-grade schoolsin comparison with the B.A. and higher teachers.
This study has also showed that none of the ten factors reveals a significant difference between attitudes of teachers with different professional experiences. In other words, both the groups of teachers with below-5-yearsexperience and the group of 5-to-10 years agree with proposed strategies on management of multiple-grade classes.
Another research finding is that there is no significant difference among the three groups of teachers in terms of the ten items. Therefore, the three groups of teachers agree at a same level with proposed strategies on management of multiple-grade classes.
Practical Recommendations
It is recommended that teachers of multi-grade classes use strategies related to location within classrooms, proper evaluation, proper teaching methods, tools and equipment, and professional experience of teachers accepted by both male and female teachers. They should use strategies of teachers’ flexibilty, technologies, organization of educational environment, teachers’ professional experience, and joyful learning environment, which are among good factors for management of multi-grade classes. Although the female teachers more agree with the latter items, both male and female teachers should employ these factors.
It is suggested for all teachers with different education degrees to take the advantages of strategies related to first, second, third, fourth, fifth, seventh, eighth, and tenth factors that are consistent with the attitudes of teachers with diploma, advanced diploma degrees, B.A., and higher than B.A. degrees. All teachers should use the factors related to sixth and ninth factors that are consistent with the idea of teachers with diploma and advanced diploma degrees because students’ assessment is an essential elements in education. According to the traditional evaluation methods (quantity), four weeks of each term were spent to assess students. By proper implementing quality evaluation by teachers, which has begun from some years ago in Iran, this timeisspent teaching. It is natural that teachers with more skill in verbal and non-verbal communication are more successful in makinggooduseoflimited classtime andspace.
In addition, it is recommended to all teachers of multi-grade classes to take the advantages of the ten strategies related to management of time and space whether they have below 5 years experiences or between 5 to 10 years experiences.
Golnoosh Mirsaidi and Maryam Yaghoubi
et al.
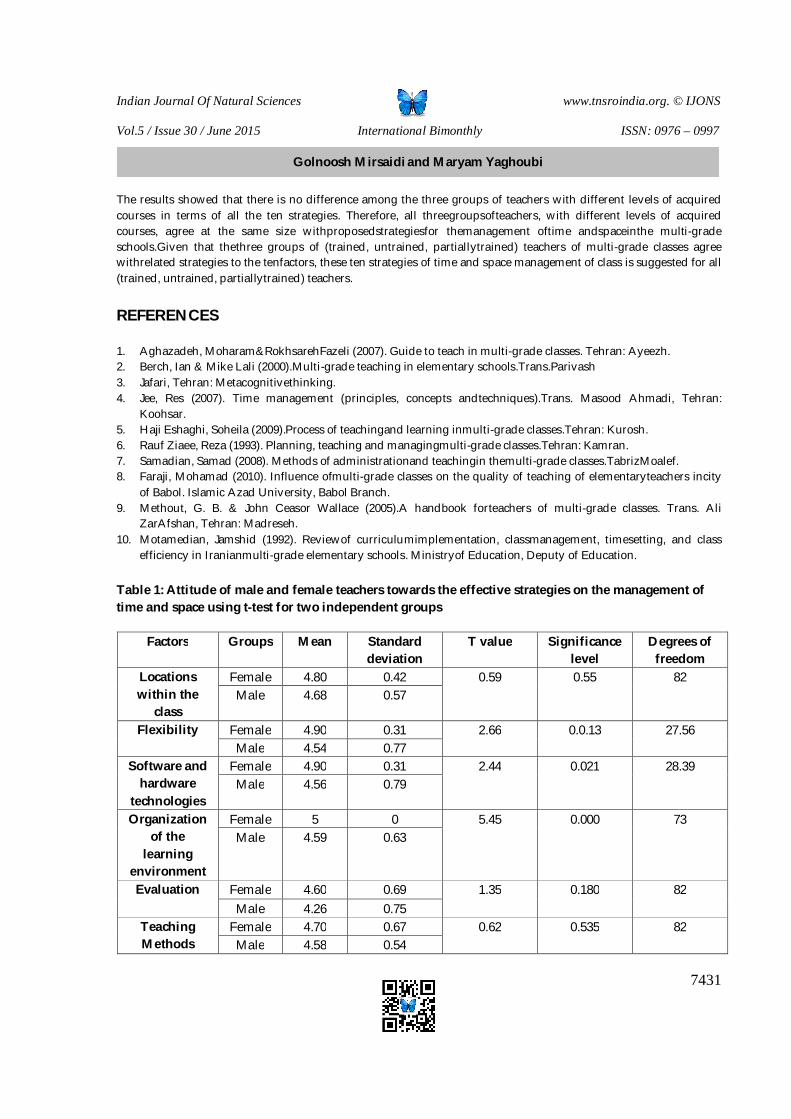
Indian Journal Of Natural Sciences www.tnsroindia.org. © IJONS
Vol.5 / Issue 30 / June 2015 International Bimonthly ISSN: 0976 – 0997
7431
The results showed that there is no difference among the three groups of teachers with different levels of acquired courses in terms of all the ten strategies. Therefore, all threegroupsofteachers, with different levels of acquired courses, agree at the same size withproposedstrategiesfor themanagement oftime andspaceinthe multi-grade schools.Given that thethree groups of (trained, untrained, partiallytrained) teachers of multi-grade classes agree withrelated strategies to the tenfactors, these ten strategies of time and space management of class is suggested for all (trained, untrained, partiallytrained) teachers.
REFERENCES
1. Aghazadeh, Moharam&RokhsarehFazeli (2007). Guide to teach in multi-grade classes. Tehran: Ayeezh. 2. Berch, Ian & Mike Lali (2000).Multi-grade teaching in elementary schools.Trans.Parivash 3. Jafari, Tehran: Metacognitivethinking. 4. Jee, Res (2007). Time management (principles, concepts andtechniques).Trans. Masood Ahmadi, Tehran:
Koohsar. 5. Haji Eshaghi, Soheila (2009).Process of teachingand learning inmulti-grade classes.Tehran: Kurosh. 6. Rauf Ziaee, Reza (1993). Planning, teaching and managingmulti-grade classes.Tehran: Kamran. 7. Samadian, Samad (2008). Methods of administrationand teachingin themulti-grade classes.TabrizMoalef. 8. Faraji, Mohamad (2010). Influence ofmulti-grade classes on the quality of teaching of elementaryteachers incity
of Babol. Islamic Azad University, Babol Branch. 9. Methout, G. B. & John Ceasor Wallace (2005).A handbook forteachers of multi-grade classes. Trans. Ali
ZarAfshan, Tehran: Madreseh. 10. Motamedian, Jamshid (1992). Reviewof curriculumimplementation, classmanagement, timesetting, and class
efficiency in Iranianmulti-grade elementary schools. Ministryof Education, Deputy of Education.
Table 1: Attitude of male and female teachers towards the effective strategies on the management of time and space using t-test for two independent groups
Degrees of freedom
Significance level
T value Standard deviation
Mean Groups Factors
82 0.55 0.59 0.42 4.80 Female Locations within the
class 0.57 4.68 Male
27.56 0.0.13 2.66 0.31 4.90 Female Flexibility 0.77 4.54 Male
28.39 0.021 2.44 0.31 4.90 Female Software and hardware
technologies 0.79 4.56 Male
73 0.000 5.45 0 5 Female Organization of the
learning environment
0.63 4.59 Male
82 0.180 1.35 0.69 4.60 Female Evaluation 0.75 4.26 Male
82 0.535 0.62 0.67 4.70 Female Teaching Methods 0.54 4.58 Male
Golnoosh Mirsaidi and Maryam Yaghoubi
et al.
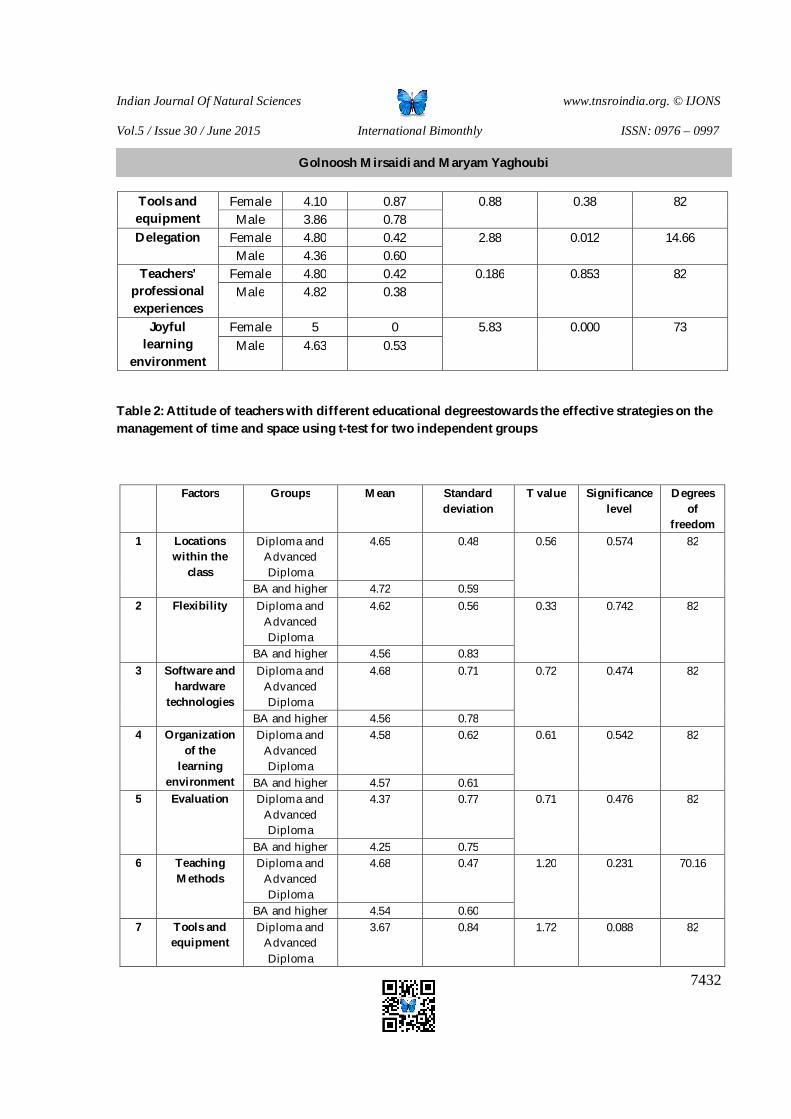
Indian Journal Of Natural Sciences www.tnsroindia.org. © IJONS
Vol.5 / Issue 30 / June 2015 International Bimonthly ISSN: 0976 – 0997
7432
Table 2: Attitude of teachers with different educational degreestowards the effective strategies on the management of time and space using t-test for two independent groups
82 0.38 0.88 0.87 4.10 Female Tools and equipment 0.78 3.86 Male
14.66 0.012 2.88 0.42 4.80 Female Delegation 0.60 4.36 Male
82 0.853 0.186 0.42 4.80 Female Teachers’ professional experiences
0.38 4.82 Male
73 0.000 5.83 0 5 Female Joyful learning
environment 0.53 4.63 Male
Degrees of
freedom
Significance level
T value Standard deviation
Mean Groups Factors
82 0.574 0.56 0.48 4.65 Diploma and Advanced Diploma
Locations within the
class
1
0.59 4.72 BA and higher 82 0.742 0.33 0.56 4.62 Diploma and
Advanced Diploma
Flexibility 2
0.83 4.56 BA and higher 82 0.474 0.72 0.71 4.68 Diploma and
Advanced Diploma
Software and hardware
technologies
3
0.78 4.56 BA and higher 82 0.542 0.61 0.62 4.58 Diploma and
Advanced Diploma
Organization of the
learning environment
4
0.61 4.57 BA and higher 82 0.476 0.71 0.77 4.37 Diploma and
Advanced Diploma
Evaluation 5
0.75 4.25 BA and higher 70.16 0.231 1.20 0.47 4.68 Diploma and
Advanced Diploma
Teaching Methods
6
0.60 4.54 BA and higher 82 0.088 1.72 0.84 3.67 Diploma and
Advanced Diploma
Tools and equipment
7
Golnoosh Mirsaidi and Maryam Yaghoubi
et al.
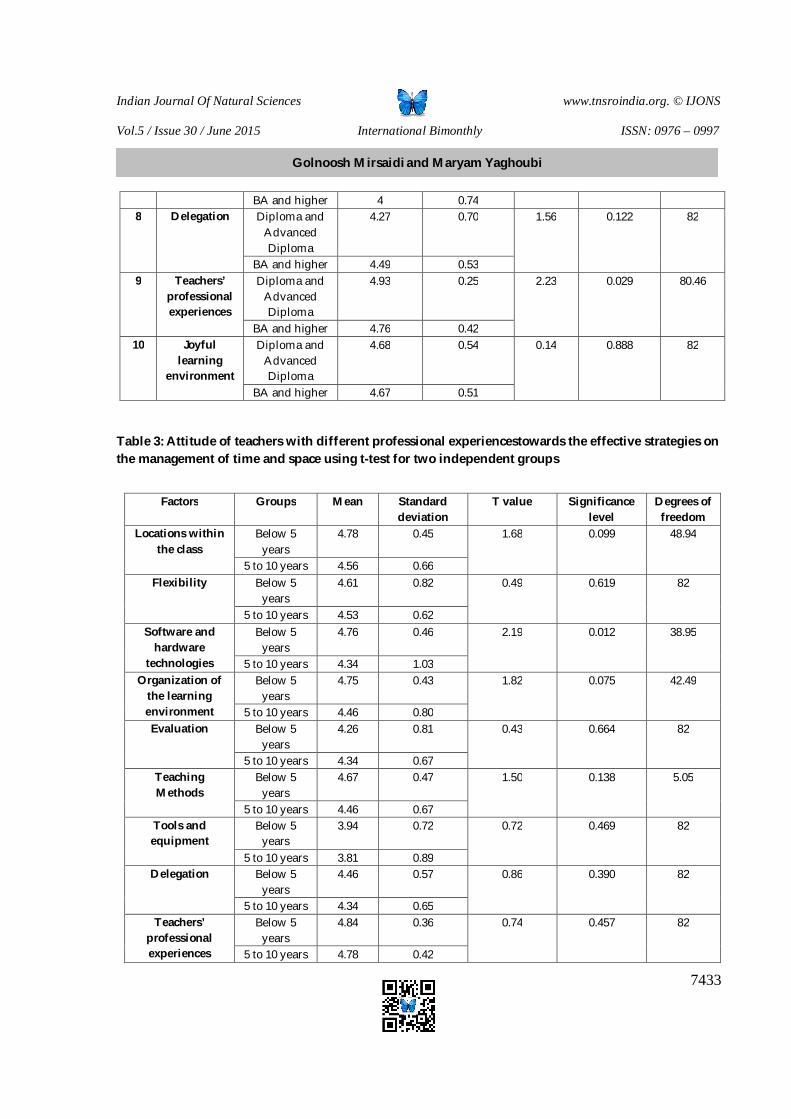
Indian Journal Of Natural Sciences www.tnsroindia.org. © IJONS
Vol.5 / Issue 30 / June 2015 International Bimonthly ISSN: 0976 – 0997
7433
Table 3: Attitude of teachers with different professional experiencestowards the effective strategies on the management of time and space using t-test for two independent groups
0.74 4 BA and higher 82 0.122 1.56 0.70 4.27 Diploma and
Advanced Diploma
Delegation 8
0.53 4.49 BA and higher 80.46 0.029 2.23 0.25 4.93 Diploma and
Advanced Diploma
Teachers’ professional experiences
9
0.42 4.76 BA and higher 82 0.888 0.14 0.54 4.68 Diploma and
Advanced Diploma
Joyful learning
environment
10
0.51 4.67 BA and higher
Degrees of freedom
Significance level
T value Standard deviation
Mean Groups Factors
48.94 0.099 1.68 0.45 4.78 Below 5 years
Locations within the class
0.66 4.56 5 to 10 years 82 0.619 0.49 0.82 4.61 Below 5
years Flexibility
0.62 4.53 5 to 10 years 38.95 0.012 2.19 0.46 4.76 Below 5
years Software and
hardware technologies 1.03 4.34 5 to 10 years
42.49 0.075 1.82 0.43 4.75 Below 5 years
Organization of the learning environment 0.80 4.46 5 to 10 years
82 0.664 0.43 0.81 4.26 Below 5 years
Evaluation
0.67 4.34 5 to 10 years 5.05 0.138 1.50 0.47 4.67 Below 5
years Teaching Methods
0.67 4.46 5 to 10 years 82 0.469 0.72 0.72 3.94 Below 5
years Tools and equipment
0.89 3.81 5 to 10 years 82 0.390 0.86 0.57 4.46 Below 5
years Delegation
0.65 4.34 5 to 10 years 82 0.457 0.74 0.36 4.84 Below 5
years Teachers’
professional experiences 0.42 4.78 5 to 10 years
Golnoosh Mirsaidi and Maryam Yaghoubi
et al.
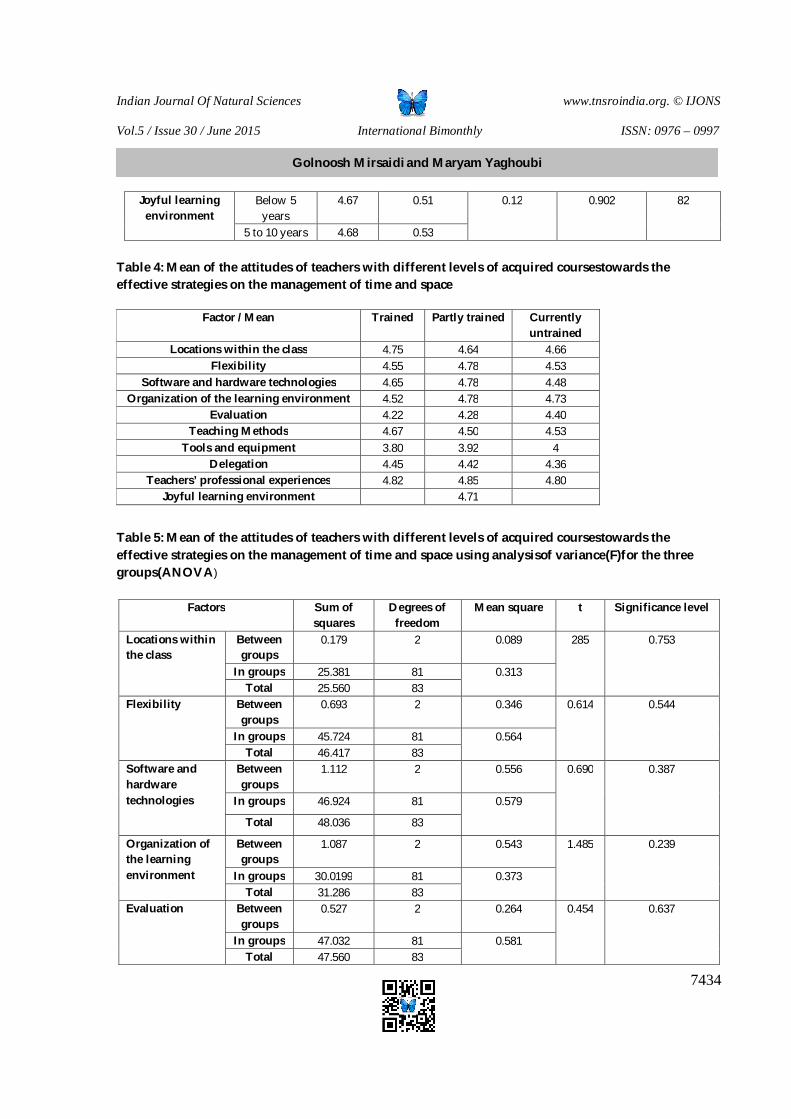
Indian Journal Of Natural Sciences www.tnsroindia.org. © IJONS
Vol.5 / Issue 30 / June 2015 International Bimonthly ISSN: 0976 – 0997
7434
Table 4: Mean of the attitudes of teachers with different levels of acquired coursestowards the effective strategies on the management of time and space
Table 5: Mean of the attitudes of teachers with different levels of acquired coursestowards the effective strategies on the management of time and space using analysisof variance(F)for the three groups(ANOVA)
82 0.902 0.12 0.51 4.67 Below 5 years
Joyful learning environment
0.53 4.68 5 to 10 years
Currently untrained
Partly trained Trained Factor / Mean
4.66 4.64 4.75 Locations within the class 4.53 4.78 4.55 Flexibility 4.48 4.78 4.65 Software and hardware technologies 4.73 4.78 4.52 Organization of the learning environment 4.40 4.28 4.22 Evaluation 4.53 4.50 4.67 Teaching Methods
4 3.92 3.80 Tools and equipment 4.36 4.42 4.45 Delegation 4.80 4.85 4.82 Teachers’ professional experiences
4.71 Joyful learning environment
Factors Sum of squares
Degrees of freedom
Mean square t Significance level
Locations within the class
Between groups
0.179 2 0.089 285 0.753
In groups 25.381 81 0.313 Total 25.560 83
Flexibility Between groups
0.693 2 0.346 0.614 0.544
In groups 45.724 81 0.564 Total 46.417 83
Software and hardware technologies
Between groups
1.112 2 0.556 0.690 0.387
In groups 46.924 81 0.579
Total 48.036 83
Organization of the learning environment
Between groups
1.087 2 0.543 1.485 0.239
In groups 30.0199 81 0.373 Total 31.286 83
Evaluation Between groups
0.527 2 0.264 0.454 0.637
In groups 47.032 81 0.581 Total 47.560 83
Golnoosh Mirsaidi and Maryam Yaghoubi
et al.
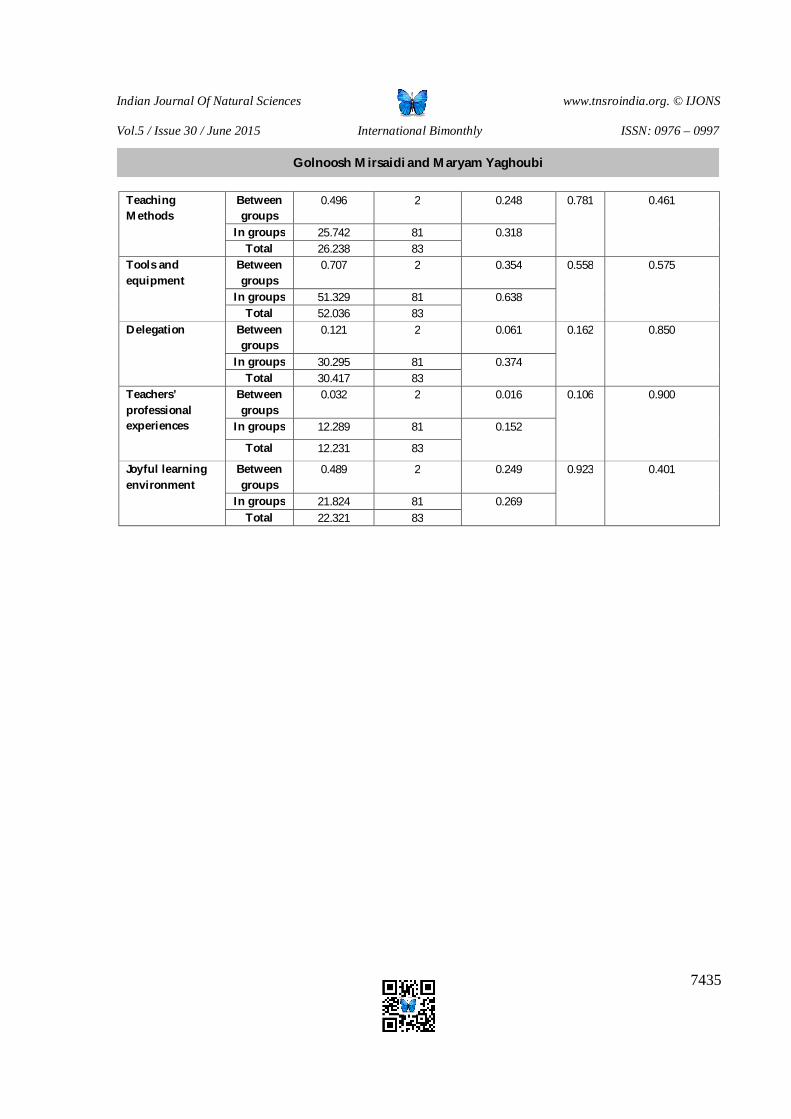
Indian Journal Of Natural Sciences www.tnsroindia.org. © IJONS
Vol.5 / Issue 30 / June 2015 International Bimonthly ISSN: 0976 – 0997
7435
Teaching Methods
Between groups
0.496 2 0.248 0.781 0.461
In groups 25.742 81 0.318 Total 26.238 83
Tools and equipment
Between groups
0.707 2 0.354 0.558 0.575
In groups 51.329 81 0.638 Total 52.036 83
Delegation Between groups
0.121 2 0.061 0.162 0.850
In groups 30.295 81 0.374 Total 30.417 83
Teachers’ professional experiences
Between groups
0.032 2 0.016 0.106 0.900
In groups 12.289 81 0.152
Total 12.231 83
Joyful learning environment
Between groups
0.489 2 0.249 0.923 0.401
In groups 21.824 81 0.269 Total 22.321 83
Golnoosh Mirsaidi and Maryam Yaghoubi
et al.
Indian Journal Of Natural Sciences www.tnsroindia.org. © IJONS
Vol.5 / Issue 30 / June 2015 International Bimonthly ISSN: 0976 – 0997
7436
Comparative Analysis of Islamic Penalties from the Perspective of Verses and Hadith
Reza Ameli Elahi Department of Islamic Jurisprudence and Law, College of Human Science, Mahallat Branch, Islamic Azad University, Mahallat, Iran. Received: 26 Mar 2015 Revised: 22 Apr 2015 Accepted: 29 May 2015 *Address for correspondence Reza Ameli Elahi Department of Islamic Jurisprudence and Law, College of Human Science, Mahallat Branch, Islamic Azad University, Mahallat, Iran.
This is an Open Access Journal / article distributed under the terms of the Creative Commons Attribution License (CC BY-NC-ND 3.0) which permits unrestricted use, distribution, and reproduction in any medium, provided the original work is properly cited. All rights reserved.
Hudud is a kind of Islamic penalty. This penalty includes various punishments such as whip, stoning, rejection (exile), death (including the throwing from a mountain, beheading with a sword, burning, cutting off fingers and toes, crucifixion, etc.). The important point is that the variation in the sort of punishment is more than the diversity of crimes. In the Islamic vision, execution of God’s hudud is one of the most crucial social issues and the principles of the Islamic government. This article tries to uncover the importance and objectives of hudud execution according to hadiths and sayings of the holy prophet and the infallible Imams. Undoubtedly, the role of punishment for the crime prevention cannot be denied. Nowadays, to reform criminals is not only one of the goals of retribution and punishment but also the most basic and most consistent goal. Apart from all rules that have been delivered to humankind, God has predicted some sanctions. Perhaps, the most severe punishment or at least some of them is hudud playing important preventive role in a community. Here, the researcher investigates and collects different perspectives of Imamia ans Sunni jurists. With contemplation on the ideas of Shiite jurists, hadiths and sayings, it is not far to make known the supremacy of Islamic Jurisprudence and Shiite researches on the topic. It helps human beings to understand the laws of Islam at the peak of glory and honor consistent with the higher interests of humankind.
Key words: Adultery, Apostasy, Consuming Alcohol, Defamation, Enmity Against God, Had, Theft.
RESEARCH ARTICLE
ABSTRACT
Indian Journal Of Natural Sciences www.tnsroindia.org. © IJONS
Vol.5 / Issue 30 / June 2015 International Bimonthly ISSN: 0976 – 0997
7437
INTRODUCTION
All Islamic sects agree that the Almighty God is the source of all Islamic rules, the rules of Islam is based on divine revelation, and no one but God has the right to impose law and ordinances. The decrees issued by someone except God will not be of any value is a general and comprehensive rule is derived from some verses like (the judgment is only Allah's; He relates the truth and He is the best of deciders. Therefore, the right to legislate belongs only to God because he is the Omniscient and knows the secrets and unseen parts of all human needs. He has sent complete and comprehensive rules away from deficiencies; the rules are mostly universal, absolute flexible, and compromising with time and place.
In terms of the general and absolute competence and conformity, Mujtaheds can easily obtain divine judgment of any new event in the light of logic of Islamic law, or the principles of jurisprudence. The values of religion, life, reason, honor and property are the most important spiritual and material values of the human beings that are sources of growing minds and bodies and Islam and its legislation aimed at protecting them. Protection of these essential needs of people causes their good fortune. If one of the values has been being ignored, disorder overcomes the human body and spirit, and society is placed out of its desired position, the community will never achieve victory and salvation. Therefore, Islam has imposed serious penalties for their violations as well as a comprehensive support of these values and norms. Holy Prophet said, “Performing one had is better than the forty days of rain;” (Wasā'il al-Shī a, vol. 28, p. 12, H. 4) and elsewhere says, “An hour of justice Imam is superior to seventy years of worship and one had executed on earth is better than the forty days of rain.” (Ibid, p. 13, H. 5). These hadiths show the importance and necessity of execution of had. Unfortunately, despite these words, sometimes some people doubt the advantages of implementing hudud due to sympathy or enmity with Islam or under the influence of others and they even believe that execution of hudud is harmful to Islam and Muslims. A little reflection on this topic uncovers that such beliefs are contrary to reason and wisdom, and the malice and inconsistent with the facts; beyond, they are against Islamic law and commandments of the Lord. With a bit diligence and meticulousness, one realizes that God has created man from a certain wisdom and prudence and He is aware of all aspects of existence.
In the common criminal law, penalties have lost their intimidating role with emergence of seventeenth and eighteenth century’s new ideas and social movements declaring the maintenance of individual rights and liberties and the need to respect human dignity in a society. In this manner, some philosophers and thinkers argue that prison and other penalties should be regarded as tools for correction and rehabilitation. Thus, the Holy Quran has imposed the punishment for theft and introduced its aim as, “And [as for] the man who steals and the woman who steals, cut off their hands as a punishment for what they have earned, an exemplary punishment from Allah;” (AL-MAEDA, 38) the Arbic word “نكال” in this verse refers to a punishment preventing prohibiting him from returning to the former state and the prohibiting others from committing similar to his practice (Al-Mizan fi tafsiri'l-Quran, vol. 5, p. 321).
Literal Meaning of Had
Al-Fiyomi states that had literally means separation and the prohibition (Al-Misbah al-Munir). Kazem Modir Shaneh Chi argues in Ayat al-Ahkam that had has three definitions: separation and distance, barrier, ultimate of everything (Ayat al-Ahkam, p. 309). Ayatollah Fazil Lankarani believes the source of all definition is same (Ayat al-Ahkam, p. 309).
The Number of Crimes Punishable by Had
There is not an agreement about the number of crimes deserving had between Shiite and Sunni jurists. Hence, it is necessary to explain these views.
Reza Ameli Elahi et al.
Indian Journal Of Natural Sciences www.tnsroindia.org. © IJONS
Vol.5 / Issue 30 / June 2015 International Bimonthly ISSN: 0976 – 0997
7438
Shiite jurists’ perspective
Shiite jurists do not agree on the number of this type of crimes; the available ideas are as follows.
After defining had in Sharā i al-Islām, Muhaqiq Hili counts the six crimes deserving had; he claims that hudud has six reasons: adultery and its functions, defamation, drinking alcohol, theft and brigandage (Sharā i al-Islām fī masā il al- alāl wa-al- arām, vol. 4, p. 136). He considers ta’zir for clearing the ground for rebellion and apostasy (Ibid). Shahid Thani has entered the punishments of clearing the ground for rebellion and apostasy in hudud section (Masālik al-afhām). Some jurists have counted eight crimes deserving had. However, there disagree even about the crimes.
Sunni jurists’ perspective
There is not an agreement among Sunni jurists on crimes deserving had. Some opinions are as follows:
Hanafi School
Al-Imam Abdullah ibn Afzal Majd al-Din al-Moseli states five crimes deserving for had in his book Al-Ikhtiar: adultery s, defamation, drinking alcohol, theft and enmity against God (A kām al-jarīmah wa-al- uqūbah fī al-sharī ah al-Islāmīyah: dirāsah muqāranah, p. 229).
Maliki School
Ibn Rushd limits hudud in his book, Bidāyat al-mujtahid wa-nihāyat al-muqta id, as the following five items: adultery, defamation, drinking alcohol, theft and enmity against God (A kām al-jarīmah wa-al- uqūbah fī al-sharī ah al-Islāmīyah: dirāsah muqāranah, p. 229).
Hudud Execution and Time Requirements
It is noteworthy that if execution of hudud is contrary to social and regime expedient, or insults Muslims and Islam, one may ask whether it is possible to convert some hudud punishments like stoning, crucifixion, cutting hand or foot, cutting neck, burning, and throwing down from mountain to other punishments like hanging, killing by shooting, air embolism, electric chair, without suffering and pain killing or imprisonment or not.
First referendum (Istifta)
If a man or woman was condemned to stoning under the Sharia court, can we change the death tool from stoning to another one?
With respect to the fact that the enemies of Islam are trying to find excuses to show a bad picture of Islam to the people in their countries through representing those aspects of Islam that is not consistent with, and also is strange to, their culture and traditions, they uses these penalties in their propaganda against Islamic Revolution to damage it without considering the consequences of the decree.
Reza Ameli Elahi et al.
Indian Journal Of Natural Sciences www.tnsroindia.org. © IJONS
Vol.5 / Issue 30 / June 2015 International Bimonthly ISSN: 0976 – 0997
7439
Answer
It may be said when the sentence is death by stoning, like the case of proved adultery, the death is fix if stoning is impossible; but if the religious sentence is stoning not death, like the case of a woman who have escaped from excavation, the had is terminated and death is not legitimated due to the presence of an excuse.
Second referendum (Istifta)
When the Holy lawgiver has stipulated a specific way or tool for execution of punishment, such as stoning or killing by sword, please say:
A. Are the above-mentioned methods or tools relevant? In other words, whether the lawgiver has decided to take the soul even through modern tools or the soul should be taken by the specific tool?
B. If relevance, when the execution of the stoning, or penalties of sodomy with specific tools, does not provides the expediency of Islam (for instance, insults Islam and Muslims or shows a harsh face of Islamic regime), can we execute the death penalty through another tool.
First answer
The purpose of the Holy lawgiver is mostly to take the soul by the specific quality and tool, and this type of taking soul is not relevant and one cannot kill the person by another tool; for example in adultery, the condemned should be stoned and in sodomy with its determined quality in the jurisprudence, and in some cases we should use a sword. Therefore, it is not possible to hang or shoot the guilty.
Second answer
Apparently, evidences say that all provisions determined by the Holy lawgiver in the subject are relevant and concentration on the methods is contrary to the principle; but if this is contrary to a more important issue, such as insulting Islam and Muslims, the more important issue is prior and the secon decree is terminated. However, I believe that the sentence is terminable by referring to Marja by the Supreme Leader, who has qualified priest or the leader, etc (Ruhani, Sadeq, the department of answering to questions, Research Center for the Judiciary. 1999).
Third answer
A. It is not relevant.
B. If the method insults Islam and Muslims, conversion is permitted and using modern tools is not prohibited because the Holy lawgiver strictly prevents insulting Islam and Muslims and the evidence is : “Don not execute had in the lands of non-Muslims (Hashtroodi, M. 1999).
Fourth answer
A. Apparently, evidences show the relevance, but it can be expanded by the secondary provisions and choosing stoning and specific had for sodomy has some problems in some places and times.
B. the above answer responds the question as (Makarem Shirazi, Naser, ibid. 1999).
Reza Ameli Elahi et al.
Indian Journal Of Natural Sciences www.tnsroindia.org. © IJONS
Vol.5 / Issue 30 / June 2015 International Bimonthly ISSN: 0976 – 0997
7440
Fifth answer
A. In some cases, the difference between ways of taking soul is relevant, and the Holy lawgiver does not intend a specific method; but in some cases like stoning, the way is relevant.
B. If the Sharia judge realizes open-handed that some cases insult Islam and Muslims, he can convert the way of executing the punishment on condition that the execution of the particular way has a sequence consequence like killing and so on (Gorgani, Muhammad Ali, ibid).
The Conditions of Executing Hudud
The Necessity of Execution of Hudud
This section investigates the ideas of Muslim jurists, hadiths and saying about the necessity of execution of divine hudud.
Non-delayed execution of hudud
As stated earlier, after proving the reasons for had, the penalty should be executed as soon as possible and delay is not permitted (al-Nihāyah fī mujarrad al-fiqh wa-al-fatāwá, vol. 2, p. 711; al- Muhazzib, vol. 2, p. 535 & vol. 3, p. 476). Some jurists believe the rule is mandatory not only in hudud but also in ta’zir (Husseini Shirazi, Seyed Muhammad, al-fiqh(al-hudud and al-ta’zirat), vol. 87 p. 236; Tafsi l al-shari ah fi sharh Tahri r al-wasi lah, p. 219). Some jurists also argue that the execution of had is religiously obligatory (Masālik al-afhām ila tanqi sharā'i' al-Islām, vol. 14, p. 417; Mabānī takmilat al-minhāj, vol. 1, p. 184). The evidences of Shiite jurists are hadiths and sayings that are mentioned in the following.
Sukuni says from Imam Jafar Sadeq (pbuh), as he says from Ali (pbuh), that “one should not hesitate in the execution of hudud.” (Wasā'il al-Shī'ah ilá ta īl al-sharī'ah, vol. 28, p. 47, H. 1). In another one, Ali ibn hussain (pbuh) says from Ali (pbuh), “if one enters ‘may and perhaps’ in hudud, it will be suspended.” (Ibid, H. 2).
Non-termination of executing hudud
According to the sayings about the advantages of executing hudud, Shiite jurists argue that the execution is an essential in religion (Mafatih sharā'I, vol. 2, p. 50), and it is more important than religious duties (Al-Muhadhdhab al-bāri fī shar al-Mukhta ar al-nāfi , vol. 5). Every Muslim must try to implement the sentence (Husseini Shirazi, Seyed Muhammad, al-fiqh (al-hudud and al-ta’zirat), vol. 87 p. 8).
The evidences of Shiite jurists are hadiths and sayings that are mentioned in the following.
In a Hadith Qudsi, it is stated
O Prophet, everybody who terminates one of my hudud, he rises against me and seeks my animosity (Anwar al-fiqaha (hudud wa ta’zirat), p. 9 qtd, in al-masdar, chpter 25, introductions to hudud, vol. 1). Imam Muhammad Bagher (pbuh) narrates from Prophet Mohammad (pbuh), “Prophet Mohammad interdicted the termination of hudud and says that Children of Israel were annihilated because they had executed hudud for weak persons and terminated it for noblesse.” (Doaem al-Islam, vol. 2, p. 442).
Reza Ameli Elahi et al.

Indian Journal Of Natural Sciences www.tnsroindia.org. © IJONS
Vol.5 / Issue 30 / June 2015 International Bimonthly ISSN: 0976 – 0997
7441
Execution in Public
This section argues the necessity of calling people to attend to the execution of hudud. In addition, it discusses whether it is necessary to execute the decree in public r not; the ideas of Shiite jurists will be stated.
Announced to the Public the Execution of Hudud
The Almighty God says about the attendance of people, (let a party of believers witness their chastisement) (An-Noor, verse 2). In this regard, all agree on the calling for public attendance in the execution of hudud (Al-maqnae, p. 780; Nihāyah fī mujarrad al-fiqh wa-al-fatāwá, vol. 2, p. 701, Al-Muhadhdhab, vol. 2, p. 528).
Necessity or Non- Necessity of People Presence at the Execution of Hudud
Maybe, state officials have done their job and called the people for the punishment, but people do not attend by any reason.
The question here is whether state officials can implement the sentence by themselves or a group of people must attend to the execution. If public attendance is essential, how many people should be present at least? Are any body, with any condition, is allowed to attend at the ceremony?
These questions will be answered in this section according to the opinion of jurists.
There is not a disagreement about the presence of people in the execution ceremony of had and their (Masalik al-afham, vol. 14, p. 387; al-sarā ir al- āwī li-ta rīr al-fatāwī, vol. 3, p. 453; Riadzh al-masael fi Bayan al-ahkam bel-dalael, vol. 10, p. 74) evidence is (let a party of believers’ witnesses their chastisement) (An-Noor, verse 2).
The Number of People at the Ceremony
There is a disagreement about the number of people who should attend the ceremony of had among Shiite an Ameh jurists.
At least one person
Some argues that the attendance of a group and at least one person is necessary. Many Imamia jurists including Shaykh Tusi (Nihāyah fī mujarrad al-fiqh wa-al-fatāwá, vol. 2, p. 701), shaykh Tabarsi (Majma' al-bayān fī tafsīr al-Qur'ān, vol. 7, p. 197), Allameh Hilli (Irshād al-adhhān ilá a kām al-īmān, vol. 2, p. 173), and Fakhr al- Muhaqiqin (Ī ā al-fawā'id fī shar ishkālāt al-qawā'id, vol. 4, p. 482) believes that the presence of one person is enough because the minimum number for the word “طائفھ” in the verse in one.
An absolute order carries the minimum number of components because the lawgiver wants to exclude the surplus components (Sharh Lo’meh, vol. 13, p. 64). In Nihāyah, Shaykh Tusi claims that since the word is defined by some philologists (Lesan al-Arab, vol. 9, p. 226) as a piece of a thing that is true by one part and while exclusion of surplus is considered, just one person is enough for this case.
Reza Ameli Elahi et al.

Indian Journal Of Natural Sciences www.tnsroindia.org. © IJONS
Vol.5 / Issue 30 / June 2015 International Bimonthly ISSN: 0976 – 0997
7442
At least two persons
This idea belongs to Muhaqiq Yusefi (Kashf al-rumūz fī shar al-Mukhta ar al-nāfi. Vol. 2, p. 554). The evidence of this group is that the term “طائفھ” is used for a group and the least number for a group is two; when Arab speakers says that the meaning of group is more than two is related to the speakers not to the lexical meaning (Ibid). Some Sunni jurists like Ishaq (Mughnī 'alá Mukhta ar al-Khiraqī, vol. 8, p. 118), Ahmad (Bidāyat al-mujtahid wa-nihāyat al-muqta id, vol. 4, p. 1725) and Akrameh (Khalaf, Seyed Ali khorasani, Seyed Javad Shahrestani, Shaik Mehdi Najafi, vol. 5, p. 375) agree this idea.
At least three persons
Among Imamia jurists, ibn Idris (Al-Sarā’ir al- āwī li-ta rīr al-fatāwá, vol. 3, p. 453), Imam Khomeini (Tahrir al-Wasilah, vol. 2, p. 421) and Shirazi (Al-fiqh (hudud and ta’zirat), vol. 87, p. 181) consider three as the least number for because of tradition, conditions of the case, and clearance from obligation (Islamic criminal law, hudud and ”طائفھ“ta'zirat, p. 181).
Some argue that three is the minimum number of people who should attend the ceremony (Abbasi Jame, p. 426) and most of Imamia jurists consider three as the true number (Al-fiqh (hudud and ta’zirat), vol. 87, p. 181).
At least four persons
Among Muslim jurists, Malek (Ibid; Bidāyat al-mujtahid wa-nihāyat al-muqta id, vol. 4, p. 1725) and Shafei (Khalaf, vol. 5, p. 375) (one of the two available sources) agree this idea. Rabie, a Sunni jurist, considers five as the number of .(Ibid) ”طائفھ“
At least ten persons
In his book Khalaf, Shaykh Tusi introduces this idea and his reason is caution (Ibid). However, some responds him that caution is not a reasonable excuse and there is no place for caution (Al-Sarā’ir al- āwī li-ta rīr al-fatāwá, vol. 3, p. 454). Some other Sunni jurists like Hasan Basri (Mughnī 'alá mukhta ar al-Khiraqī, vol. 8, p. 118) and others agree this idea (Tashrī' al-jinā'ī al-Islāmī, p. 445).
After proving had, there is no intercession opportunity to terminate the sentence (Nihāyah fī mujarrad al-fiqh wa-al-fatāwá, vol. 2, p. 711. Al-Sarā’ir al- āwī li-ta rīr al-fatāwá, vol. 3, p. 476. al- Muhazzib, vol. 2, p. 518; Mabānī takmilat al-minhāj, vol. 1, p. 1854) and it is not effective; this is an agreement among Imamia jurists like the delay in the execution of hudud even if he regrets that he has done such behavior (Wasā'il al-Shī a, vol. 28, p. 43, H. 4). It is said that intercession for the divine hudud is forbidden after the ruler’s notice (Al-fiq al-Islamia wa Adeleh, vol. 6, p. 181). Of course, some jurists believe that the prevention by religion refers to its reverence (Jāmi al-madārik fī shar al-Mukhta ar al-nāfi , vol. 7, p. 88).
Non-execution of Hudud by Bondsman
As stated earlier, had should be executed immediately after its proving; therefore, assigning a bondsman for trial is not acceptable because it suspends the execution to another action. It was said that if the punishment is postponded, one could choose a bondsman (Masālik al-afhām, vol. 14, p. 417).
Reza Ameli Elahi et al.
Indian Journal Of Natural Sciences www.tnsroindia.org. © IJONS
Vol.5 / Issue 30 / June 2015 International Bimonthly ISSN: 0976 – 0997
7443
Adultery
Adultery and prostitution is the dirtiest and ugliest action condemned by all religions. Islam has also denounced this heinous act. There are many verses in this regard in Quran in order to prevent this behavior and introduce some punishments for this action. There are also many sayings by Imams in this regard. In sura Al-Isra verse 32 God says, “And go not nigh to fornication; surely it is an indecency and an evil way.”
Different Types of Penalties for Adultery and their Execution
There are some verses in the Holy Quran about adultery and its punishments. In ‘Kanz al-irfān’, all verses are discussed and explained. Different punishments for adultery are as following, killing (execution) by sword and so on (Sharhe lo’me, Trans. Ali Shiravani, vol. 13, p. 42), Stoning (that is a kind of killing), flogging and stoning (both of the punishments), flogging alone (hundred lashes), exile and head shaving.
Sodomy Had
Sodomy is one of the ugliest and most harmful crimes that cause the disintegration and decay within families and threatens society by collapse. Due to severe and irreparable damages that this heinous crime brings for family and the community, Islamic criminal law has stipulated severe and decisive punishments for this action that all lead to death. This crime is even worse than adultery in terms of enormity, shame and honor rape that is one of the five great Islamic values (A comparative study of the Criminal Law of Islam, p. 425).
Defamation Had
Islam devotes a special respect for individuals’ personality and dignity and blames any offense or crime against a person. Therefore, many verses talks about defamation had. “And those who accuse free women then do not bring four witnesses, flog them, [giving] eighty stripes, and do not admit any evidence from them ever; and these it is that are the transgressor. Except those who repent after this and act aright, for surely Allah is Forgiving, Merciful.” “Surely those who accuse chaste believing women, unaware [of the evil], are cursed in this world and the hereafter, and they shall have a grievous chastisement.” These verses signify that God has a particular toughness about defamation as He says that the defamer is cursed in this world and the hereafter, and He promises a grievous chastisement. There are also many sayings in this regard. In Wasā’IL al-Shī a, the holy prophet says that the action of anybody who accuses chaste believing women and men (about adultery and prostitution) will be eliminated by God and seventy thousand angels flog him in confront and behind, then he will be carried to fire.” (A comparative study of the Criminal Law of Islam, p. 140, qtd in al-Jarimeh and al-oqubeh by Muhammad Abuzahreh, p. 188).
Drinking Alcohol Had
Drinking alcohol is one of the greatest sins in the Great Sins that has the worst effect in human life in terms of moral health. Some regards it as the worst so great sins (al-fiqh 'alá al-madhāhib al-arba'ah, vol. 5, p. 442). In the Holy Quran, God talks about the ugliness and wickedness of drinking alcohol as, “O you who believe! do not forbid [yourselves] the good things which Allah has made lawful for you and do not exceed the limits; surely Allah does not love those who exceed the limits.” “And eat of the lawful and good [things] that Allah has given you, and be careful of [your duty to] Allah, in Whom you believe.” “O you who believe! Intoxicants and games of chance and [sacrificing to] stones set up and [dividing by] arrows are only an uncleanness, the Shaitan's work; shun it therefore that you may be successful.” “The Shaitan only desires to cause enmity and hatred to spring in your midst by means of intoxicants and games of chance, and to keep you off from the remembrance of Allah and from prayer. Will you then desist?”
Reza Ameli Elahi et al.
Indian Journal Of Natural Sciences www.tnsroindia.org. © IJONS
Vol.5 / Issue 30 / June 2015 International Bimonthly ISSN: 0976 – 0997
7444
Abuharireh narrates from the prophet, “Four groups will not be permitted to enter paradise: alcohol drinker, those who commit usury, those who usurp the orphans’ proerty, and those who are disowned by parents.” (Al-fiqh 'alá al-madhāhib al-arba'ah, vol. 5, p. 443). In another saying by the prophet, Abuharireh says, a person who drinks alcohol has killed the light of faith with his body.” (A comparative study of the Criminal Law of Islam, p. 453).
Theft
Theft is a heavy sin and crime that the legislator has predicted a heavy punishment to eradicate it. There is no other crime punished so heavily by law in the second or third repetition (A comparative study of the Criminal Law of Islam, p. 453).
Muharebeh (Enmity against God)
Crime titled as “Muharebeh and Enmity against God” noted in Islamic sources as “muharebeh, Cutting the road, or Great robbery” is included in the category of crimes threatening public security and welfare. All Islamic sects agree on the punishment of had for this crime (Comparetive fiqh, vol. 1, p. 117). Two verses of Quran talks about muharebeh, “he punishment of those who wage war against Allah and His apostle and strive to make mischief in the land is only this, that they should be murdered or crucified or their hands and their feet should be cut off on opposite sides or they should be imprisoned; this shall be as a disgrace for them in this world, and in the hereafter they shall have a grievous chastisement.”; “Except those who repent before you have them in your power; so know that Allah is Forgiving, Merciful”.
Apostasy Had
Great jurists usually considers adultery, defamation, consuming alcohol, theft, enmity against God, as crimes deserving had with a certain and categorizes other crimes under the title of “Various penalties” (A comparative study of the Criminal Law of Islam, p. 457. Qtd in Shahid Aval) or “Other punishment” (Tahrir al-Wasilah, vol. 2, p. 243). On the other hand, some jurists regard it as hudud (Al-fiqh (hudud and ta’zirat), vol. 87, p. 52). Some believe that apostasy is regarded as ta’zirat and it is studied in ta’zirat chapter (Islamic criminal law (hudud and ta’zirat), p. 163; qtd. in Masalek al-afham). Hoever, whether it is regarded as hudud or not, there is no difference in its legal nature because it has a certain punishment in both of the categories. It is certain for men or women, and there is no disagreement among Shiite jurists (A comparative study of the Criminal Law of Islam, p. 475). God has condemned apostasy in Quran “and whoever of you turns back from his religion, then he dies while an unbeliever-- these it is whose works shall go for nothing in this world and the hereafter, and they are the inmates of the fire; therein they shall abide.” (Al-Baqara: 217); “And whoever desires a religion other than Islam, it shall not be accepted from him, and in the hereafter he shall be one of the losers.” (Al-e-Imran: 85). In a hadith narrated by Shiite ans Sunni scholars, the prophet says, “whoever, [Muslim], changes his religion should be killed.” (Ibid. p. 146; qtd in al-Jarimeh and al-oqubeh by Muhammad Abuzahreh, p. 188). Ibn Masoud narrates from Muhammad (pbuh) that the blood of any Muslim who bears witness to the oneness of God and my mission is not permitted unless he commits one of the followings: adultery, killing due to qisas, and detachment of the Muslim community (Ibid. dtd. By Nayel al-aotar Shokani, vol. 7, p. 146).
CONCLUSION
This article has collected and investigated different ideas presented by Shiite and Sunni jurists. The researcher tries to realize the supremacy of the Shiite Islamic jurisprudence and researches with contemplation on the views of jurists, Quran, hadith and sayings and show how Islamic legal rules are consistent with human excellent interests. With
Reza Ameli Elahi et al.
Indian Journal Of Natural Sciences www.tnsroindia.org. © IJONS
Vol.5 / Issue 30 / June 2015 International Bimonthly ISSN: 0976 – 0997
7445
respect to the fatawa of Shiite maraje and studying juridical books, related hadiths, the holy prophet and pure Imams have insisted on the execution of hudud so that even they do not allow delay or conversion. The Holy lawgiver have predicted heavy punishments such as crucifixion, cutting a hand or foot, cutting neck by sword, throwing down from a mountain, etc for crimes that are harmful to the bases of society and institution of family; in this regard, God has decided to prevent mankind to commit sins. On the other hand, four equitable witnesses should be present for confirming the action of penetration. Is it possible to find four witnesses who see the action at the same time? On the other hand, the guilty should confess four times to allow us to execute the punishment. Many sayings confirm that when people came to Imams to confess, they tried to deter the person or they guide them so that the punishment terminated in the execution phase. This does not mean that one should not execute divine hudud, or we should not guilty of adultery or sodomy because it is insisted that the guilty must be punished on the case of proving the crime; this brings justice and safety to the society. Otherwise, chaos and injustice overcome the society.
With regard to the raised issues, it can be concluded that we can change the ways and tools of punishment according to time and place expediency. In any case, Islam is the most complete divine religion and it aims to the proud of Muslims in all areas to provide the ground for the propagation of Islam and conversion of the followers of other religions to Islam. The researcher believes that due to the time requirements while the execution of some penalties insult Islam and Muslims, one must reflect on the issue and investigate the case. If there is a contradiction between two duties, (which one of them is more important), we should ignore the less important item to save the more important item to secure the expediency and proud of Muslims; if possible, we can convert some punishments to other forms of penalties.
REFERENCES
1. Abu Hasan, M. (1987) .A kām al-jarīmah wa-al- uqūbah fī al-sharī ah al-Islāmīyah, Amanar publications, first edition.
2. Al-dhaibani, A. (2000). Al-Tashrih al-jenaee al-Islami al-Moqaren. Al-dar al-Jamahir, first edition. 3. Al-Fiomi, A. M,. Al-Mesbal, A. (1978). Darolketab al-elmiyeh. Beirut. 4. Al-Kazemi, M., Fazel, J. (1986). Masālik al-afhām ilá āyāt al-a kām. Vol. 4, Mortazavi, Second Edition, Tehran. 5. Allameh Helli, H. (1989). Irshād al-adhhān ilá A kām al-Īmān. Vol. 2, Islamic Press, first edition. 6. Al-Nihāyah fī mujarrad al-fiqh wa-al-fatāwá, vol. 2, p. 711; al- Muhazzib, 2:711. 7. Al-oroos, Alameh ibn Manzooreh. Lesan al-Aarab. Vol. 3, p. 173/ 8. Al-Tamimi al-Maqrebi, N. Doaem al-Islam wa-dhikr al- alāl wa-al- arām. Ale Bayt institute, Daer al-Maaref,
second edition. 9. Al-Zahili, W.(1990), Al-fiqh al-Islami wa-adlleh. Vol. 6, Darol fekr, third edition. 10. Ameli, Sh. Jame Abbasi. Farahani Press, lithography, n.d. 11. Anwar al-fiqaha (hudud WA ta’zirat), p. 9 qtd, in al-masdar, chpter 25, introductions to hudud, vol. 1. 12. Fakhr al- Muhaqiqin al-helli, M. (1969), Ī ā al-fawā'id fī shar ishkālāt al-qawā'id, vol. 4, Ismailian, Qom. 13. Feiz Kashani, M.(1989), Mafatih al- Sharye. Vol. 2, Islamic ammunition complex, Qom. 14. Gorgani, M. A. Department of questions. Investigations Center Imam Khomeini (RA) affiliated to judicial syatem
and Yousef Saanei. 15. Hashtroodi, M. (1999), Department of answering to questions, Research Center for the Judiciary. 16. Hur Ameli, M.( 1993), Wasā'il al-Shī'ah ilá ta īl masā'il al-sharī'ah, vol. 18, Reviving the Heritage of Al al-Bayt.
Second edition, Qom. 17. Hussaini Shirazi, M. Al-fiqh (hudud WA ta’zirat). Vol. 87, p. 236. 18. Hussaini Shirazi, M. Al-fiqh (hudud WA ta’zirat). Vol. 87, p. 8. 19. Hussaini Shirazi, M. Taf īl al-sharī ah fī shar Ta rīr al-wasīlah. Author: Fāz il Lankarānī, Mu ammad;
Markaz Fiqh al-A immah al-A hār, p. 219.
Reza Ameli Elahi et al.

Indian Journal Of Natural Sciences www.tnsroindia.org. © IJONS
Vol.5 / Issue 30 / June 2015 International Bimonthly ISSN: 0976 – 0997
7446
20. Ibn Fahd al- illī, A. (1992), Muhadhdhab al-bāri' fī shar al-Mukhta ar al-nāfi, vol. 5, Publication of the Islamic Foundation, Qom.
21. Ibn Idris Hilli, M. (1990). Al-sarā ir al- āwī li-ta rīr al-fatāwī, vol. 3, Islamic Press, second edition, Qom. 22. Ibn Qudāmah, A. Mughnī 'alá Mukhta ar al-Khiraqī, vol. 8, Darolketab elmiyeh, Beirut, Lebanon. 23. Ibn Rushd al-Qartabi, M. A, Bidayat al-Mujtahid wa-Nihayat al-Muqtasid. Vol. 4, Majid al-Nahwi research, Dar
ibn Hazm institute, first edition, Lebanon, Beirut. 24. Jaziri, A. Al-fiqh 'alá al-madhāhib al-arba'ah. Vol. 5, first edition, Daralehia Alktherat Arabi. Beirut. 25. khorasani. A, Shahrestani, J. Najafi, M. Khalaf, vol. 5: 375. 26. Khansari, Ahmad. Jami(1985), ' al-madarik fi sharh al-Mukhtasar al-nafi, vol. 7, edited by Ali Akbar Ghafari,
second edition. 27. Lankarani, M. (2000), A comparative study of the Criminal Law of Islam, Publications of the Ministry of Culture
and Islamic Guidance, Fifth Edition. 28. Lankarani, M. (1985) Tafsi l al-shari ah fi sharh Tahri r al-wasi lah: Al-hudud. Moalef Publications, first
edition, Qom. 29. Makarem Shirazi, N. Department of questions. Investigations Center Imam Khomeini (RA) affiliated to judicial
syatem and Yousef Saanei. 30. Mardāwī, A. (1956), Al-In āf fī ma rifat al-rāji min al-khilāf, vol. 10, Mohammadiyah Press, Egypt. 31. Mosavi Bojnrdi, M. (1978), Comparative fiqh, vol. 1, Miad Publications, first edition. 32. Muhammadi, A. (1988), Islamic criminal law (hudud and ta’zirat). A translation of ‘Masalik al-afham’ by Shahid
Thani and ‘Sharaye al-Ahkam’ by Muhaqiq Helli. Center of academic publishing, first edition, Tehran,. 33. Muhaqiq Abi, H. (1989), Kashf al-rumūz fī shar al-Mukhta ar al-nāfi. Vol. 2, Islamic Press, Qom. 34. Najafi, S. (1984), Jawāhir al-kalām fī shar Sharā'i' al-Islām, vol. 41, Darolketab Al-Islamia, second edition,
Tehran. 35. Razmjoo, p. Nihāyah fī mujarrad al-fiqh wa-al-fatāwá, vol. 2: 700; Kāfī fī al-fiqh al- anafī, 407. Sharhe Lomeh,
vol. 13: 63, Qawā'id al-a kām, vol. 2: 254. 36. Ruhani, Sadeq, (1999). the department of answering to questions, Research Center for the Judiciary. 37. Shaikh Mufid, M. (1989). Al-maqnae, vol. 2, Islamic Publications Press, Qom. 38. Abulqasem, A. (1994). Sharaye al- Islam. Trans.. Collected by Danesh pajoh, Tehran University, Fifth Edition,
Tehran,. 39. Tabatabaee, M., Al-Mizan fi tafsiri'l-Quran. Qom Seminary Teachers Association. 40. The Holy Quran.
Reza Ameli Elahi et al.
Indian Journal Of Natural Sciences www.tnsroindia.org. © IJONS
Vol.5 / Issue 30 / June 2015 International Bimonthly ISSN: 0976 – 0997
7447
Relationship between Information Asymmetry of Shareholders and Dividends Policies in Companies Listed in Iran Stock Exchange (Case Study: Tehran Stock Exchange) Maryam Talimi and Abolfazl Danaei*
Department of Management Faculty, Semnan Branch, Islamic Azad University, Semnan, Iran. Received: 23 Mar 2015 Revised: 24 Apr 2015 Accepted: 29 May 2015 *Address for correspondence Abolfazl Danaei Department of Management Faculty, Semnan Branch, Islamic Azad University, Semnan, Iran.
This is an Open Access Journal / article distributed under the terms of the Creative Commons Attribution License (CC BY-NC-ND 3.0) which permits unrestricted use, distribution, and reproduction in any medium, provided the original work is properly cited. All rights reserved.
Main purpose of current research is investigating relationship between information asymmetry of shareholders and dividend policies in companies listed in Tehran Stock Exchange. Information asymmetry is information inequality between manager of the company and other stakeholders. Dividend policy means a trend which is adopted by the managers in paying profit and earning management plays significant role in which. In order to test hypotheses, information of companies listed in Tehran Stock Exchange during 2007 to 2012 was investigated. In order to measure information asymmetry, bid/ask spread model was used. Bid / ask price represents gap between bid price and ask price. Divide dent policy is divided into four components: profitability, market value, asset growth, and Tobin’s Q. relationship between each of components and information asymmetry is investigated within 4 hypotheses. Descriptive statistics, regression and correlation were used as statistical methods in this research. In testing hypotheses, considering correlation coefficient and significance level, significant relationship is observed between all components of dividend policy and information asymmetry. Using stepwise regression results, overall research hypothesis was supported, i.e. effect of dividend policy on information asymmetry. And a model was estimated based on regression coefficients for information asymmetry. Research results showed in case of dividend increase among shareholders, information asymmetry between manager and stakeholders would be reduced.
Key words: information asymmetry, dividend policy, earnings management, Tehran Stock Exchange
RESEARCH ARTICLE
ABSTRACT
Indian Journal Of Natural Sciences www.tnsroindia.org. © IJONS
Vol.5 / Issue 30 / June 2015 International Bimonthly ISSN: 0976 – 0997
7448
INTRODUCTION
Information symmetry is present when managers and the market have similar information about the company. Thus, managers and the market tolerate identical uncertainty about the company. But if there is information asymmetry, managers have more and better information regarding the market due to having private and confidential information about the company. That is, they have access to company’s information prior to the market. Company’s specific information istransferred to the market over the time through information disclosure events. Company’s information asymmetry means total uncertainty about the company, because it is probable that managers and market have identical awareness of the effect of market variables on the company’s value. Market reaction to the earnings announcement can be the first measure of the company’s information asymmetry through information disclosure.
In accounting theory, information asymmetry is crucially important, because stock exchange markets experience threats resulting from information asymmetry, and it is due to presence of inter-organizational information. Even if the price reflects all its information perfectly in the market, yet it is probable that individuals within the organization have more information compared to individuals out of the organization. In this case, these individuals utilize advantage of having information and obtain more profits.
Dividend policy is one of most important issues in financial management, because dividend represents major cash payments of the companies and it is regarded as one of the main options and decisions for the managers. The manager should decide on dividing the company’searrings and investing it in the form of retained earnings. Although paying dividend directly benefits the shareholders, it influences company’s ability in retainingearnings in order to utilize growth opportunities. In addition, this policy in the stock market has information content and changing it also contains information for shareholders. Every investor purchases stocks of the company according to the type of taste which provides optimal dividend policy. Dividend proposed by the board of directors also contains information regarding expectations of the managers regarding future profitability of the company.
Statement of Problem
Presence of private information increases information asymmetry between shareholder and owner. Thus, it can be predicted the lower is information asymmetry level, agency costs is also significantly reduced.
Information asymmetry can be regarded as a common problem in the companies. Information asymmetry is defined as information inequality between manager of the company and other stakeholders. In case of information asymmetry, not only awareness of one of the transaction parties compared to other parties regarding some important attributes would be more, but also it is probable he also benefits from hiding this information.
Financial reports are initialsources of information about investment performance of the companies, but managers can influence these information. Thus, dividend policy may limit managers’ authority in accounting information; hence earnings report can be more accurate. Even if the price reflects all its information perfectly in the market, yet it is probable that individuals within the organization have more information about company’s qualitative situation compared to individuals out of the organization, and through which they can act for obtaining more benefits. Here one of the sub-branches of information asymmetry discussion known as adverse selection appears. Adverse selection is applied to the situation in which sellers have some information that purchasers are not aware of them (and vice versa). It happens exactly before the transaction. When the transaction parties in the market become aware of non-informed individuals, adverse selection is increased. In this case, increased information asymmetry level is represented through extending bid –ask spread range, and market makers take advantage of increasing this difference to compensate adverse selection risk. In other words, presences of non-informed individuals in capital market allow that professional investors obtain higher rate of return.
Maryam Talimi and Abolfazl Danaei
Indian Journal Of Natural Sciences www.tnsroindia.org. © IJONS
Vol.5 / Issue 30 / June 2015 International Bimonthly ISSN: 0976 – 0997
7449
In this research, it will be shown how dividend policy can cause disclosing more information in accounting report. Also, effect of earnings management on dividend policy will be investigated. In addition, not any study has been yet conducted in our country in this regards so that relationship between information asymmetry, dividend policy and earnings management is specified. Thus, current work attempts to examine it using adequate sample size.
Research Goals
Main Research Goal
Main research goal is investigating relationship between information asymmetry of shareholders and dividend policies in companies listed in Tehran Stock Exchange. It is a case study in Tehran Stock Exchange.
Minor Research Goals
First Minor Research Goal: investigating effect of company’s profitability on information asymmetry in companies listed in Tehran Stock Exchange
Second Minor Research Goal: investigating effect of company’s market value on information asymmetry in companies listed in Tehran Stock Exchange
Third Minor Research Goal: investigating effect of company’s asset growth on information asymmetry in companies listed in Tehran Stock Exchange
Fourth Minor Research Goal: investigating effect of company’s Tobin’s Q on information asymmetry in companies listed in Tehran Stock Exchange
Research Hypotheses
Main Research Hypothesis
According to main research hypothesis, there is significant relationship between advantage of information asymmetry of shareholders and dividend policies in companies listed in Tehran Stock Exchange which is shown within a case study in Tehran Stock Exchange.
Minor Research Hypotheses
First Minor Research Hypothesis: There is significant relationship between company’s profitability and change in information asymmetry.
Second Minor Research Hypothesis: There is significant relationship between company’s market value and change in information asymmetry.
Third Minor Research Hypothesis: There is significant relationship between company’s asset growth and change in information asymmetry.
Fourth Minor Research Hypothesis: There is significant relationship between company’s Tobin’s Q and change in information asymmetry.
Maryam Talimi and Abolfazl Danaei
Indian Journal Of Natural Sciences www.tnsroindia.org. © IJONS
Vol.5 / Issue 30 / June 2015 International Bimonthly ISSN: 0976 – 0997
7450
Fifth Minor Research Hypothesis: There is significant relationship between change in dividend policy and change in information asymmetry.
Research Local and Temporal Scope
Research Local Scope: It includes all companies listed in Tehran Stock Exchange. Data related to variables during 2007 to 2013 (7 years) are tested. Thus, temporal scope of the research includes all companies listed in Tehran Stock Exchange during 2007 to 2013 (7 years).
Definition of Terms
Information Distribution Quality
One of the factors effective in decision making is suitable information relevant to the decision subject. In case information isdistributed asymmetrically, (information transfer is done unequally among individuals), it may bring about different results for a single subject. Thus, prior to importance of the information itself for the decision maker, it is the information distribution quality which should be accurately evaluated (GhaemiandVatanparast, 2005).
Adverse Selection
One of the main issues in capital markets especially in stock exchange markets is market efficiency issue, according which all information in the market reflect its effects on stock price. According to Efficient Market Hypothesis, existential cause of the accounting can be information asymmetry. In information asymmetry, one parties of the transaction has more information than the other party. It happens due to internal transactions and information. When the transaction parties in the market become aware of non-informed individuals, adverse selection is increased. In this case, increased information asymmetry level is represented through extending bid –ask spread range, and market makers take advantage of increasing this difference to compensate adverse selection risk. In other words, presences of non-informed individuals in capital market allow that professional investors obtain higher rate of return.
Price Fluctuations
When new information is distributed about situation of the companies in the market, this information is analyzed by analysts, investors and other users and accordingly decision is made for share bid or ask. This information and the way of reaction to them influence behavior of users,especially potential shareholders, and reduce or increase price and transaction volume of shares, because the way of dealing with new information shapes price fluctuations. Hence, in case of disclosing confidential and heterogeneous information, different reactions by the investors are observed due to information asymmetry in the capital market. It would result in inappropriate and misleading analysis about current market situation (Ghaemi and Vatanparast, 2005).
Information Asymmetry
Fundamental role of accounting information in financial markets is providing a basis for resource allocation. Thus, outcomes and factors affecting accounting information quality have always been interested by the investors, managers, regulators and formulators of the accounting standards. One of the main outcomes related to information quality is information asymmetry which refers to information superiority of one of the transaction parties over other party. Information asymmetry in the market has adverse collective and individual outcomes such asminimum
Maryam Talimi and Abolfazl Danaei
Indian Journal Of Natural Sciences www.tnsroindia.org. © IJONS
Vol.5 / Issue 30 / June 2015 International Bimonthly ISSN: 0976 – 0997
7451
investment, high transaction costs, diluted markets and reduced earnings resulting from transactions. Considering importance of information asymmetry concept, it is now accepted that economic analysis is incomplete without information asymmetry inclusion in the models. Recently considerable efforts have been done for studying information asymmetry in financial markets aiming at describing failure of these markets in achieving optimal investment level (Kashanipour, Momeni, and Yansari, 2011).
Information Asymmetry among Investors
Information asymmetry among managers and investors results from agency relationship. There is information asymmetry also among different groups of investors. Informed investors have access to confidential information, but some non-informed investors have access merely to general information.
Hence, information asymmetry among different groups ofinvestors is due to the fact that some of them have access to confidential information of the business unit, while other investors are deprived in such information. It leads to adverse selection, so that investors with access for confidential information make decision based on these information (which is not in favor of non-informed investors) (Chang, M., D Anna, G., Watson, I., Wee, M., 2008).
Cash Holdings
Generally in information asymmetry situation, cash holdings can prevent from costs of inappropriate selections which increase by foreign funding. Thus, company’s value is increased. On the other hand, cash holdings without return leads to reduced efficiency and ultimately reduced company’s value.
Bid-Ask Price
When the transaction parties in the market become aware of non-informed individuals, increased information asymmetry level is represented through extending bid –ask spread range. Price difference range of bid / ask price represents gap between bid price and ask price. Bid price is the price which is offered by the investor or market maker for purchasing a specific share. Ask price is the price which is offered by the share seller or market maker for its sale.
Disclosure Quality
Overall, higher information asymmetry levels (informed transaction) will be accompanied by higher bid price (Ben Alichiraz., 2009).
Thus, ask – bid spread is widely used as information asymmetry criterion in the literature. There is considerable experimental evidence on positive relationship between information asymmetry and ask – bid spread. Regarding evidence on ask – bid spread ability in controlling information environment of the company, studies by Hily, Palipo and Sowini (1995) and Wolker (1995) can be referred, all of them found negative (positive) relationship between bid / ask spread and disclosure quality (information asymmetry) (Richardson, V.J., 2000).
Earnings Management
Degeorge et al. define earnings management is artificial manipulation of earnings by management to achieve expected levels of earnings for some special decisions (including analysts or estimating trend of previous earnings for
Maryam Talimi and Abolfazl Danaei
Indian Journal Of Natural Sciences www.tnsroindia.org. © IJONS
Vol.5 / Issue 30 / June 2015 International Bimonthly ISSN: 0976 – 0997
7452
predicting future earnings). In fact, main motivation for earnings management is management of the perception of the investors regarding the business unit (Degeorge F. R.J, Zeckauser P., 1999).
Overall, earnings management includes aware actions of the management to achieve specific goals in accounting procedures framework (Chen, 2009).
Tobin’s Q
It is a measure for estimating future investment and it is a good index regarding overall economic conditions. Tobin’s Q ratio is one of the tools for performance of the companies. This ratio is used for predicting future of investment activities. Aim of this ratio is establishing a causal relationship between Tobin’s Q index and investment level done by the company. If Tobin’s Q calculated for the company is above 1, there is high motivation for investment. In other words, high Tobin’s Q represents valueof company’s growth opportunities. If Tobin’s Q is smaller than 1, investment is stopped. In fact, Tobin’s Q is result of market value to book value or it is regarded as replacement value. According to the current research Tobin’s Q will be obtained from result of market value of the company over last year’s asset.
Earnings Management Motives
One of the earning management motives is reducing earnings prediction error in the present and future period. Managers like that their predictions regarding budgeted earnings realize. Managers manage earnings using some tools. Authors have confirmed positive relationship between stock price and management prediction errors. If earnings are less than predicted amount, probably stock price of the company will reduce (EbrahimiKordlar and Zakeri, 2009).
Research Conceptual Model Extracted from Research Literature
Research theoretical design means theoretical attitude or perspective which is used for investigating research problem Qivi, 2003). The model in this research deals with investigating relationship between information asymmetry of shareholders and dividend policies in companies listed in Tehran Stock Exchange as a case study in Tehran Stock Exchange. Research conceptual model is shown in Fig 1.
Research Methodology
Data Collection Method
Descriptive – correlation research type is used in this work which is in positive accounting research. It is conducted using real data and it is an applied research, since it can have application in the process of using data. Descriptive and inferential statistics are used in this research for data analysis. In descriptive statistics, min and max score, mean and standard deviation is used. In inferential statistics, regression and Pearson correlation coefficient is used for supporting or rejecting hypotheses and describing relationship between dependent and independent variables are used.
Following selection of sample companies and their classification, EXCEL software will be used form some calculations. SPSS software will be used for data analysis.
This research is based on real information of stock market, financial statements and notes with financial statements. Using data from Stock Exchange Organization website, Stock Exchange library, and Stock Exchange Hall, data
Maryam Talimi and Abolfazl Danaei

Indian Journal Of Natural Sciences www.tnsroindia.org. © IJONS
Vol.5 / Issue 30 / June 2015 International Bimonthly ISSN: 0976 – 0997
7453
needed for testing hypotheses were collected. Data were also collected from documents. Considering research statistical population, data should be collected from documents in Tehran Stock Exchange. To this end, part of data was collected from official website of Stock Exchange, Tehran Stock Exchange central library, and stock exchange hall.
Research Variables
Independent Variables
Dividend Policy
Overall relationship between dividend and earnings per share shows company’s dividend policy. Dividend policy is one of the main discussions in financing literature. Many authors have provided theoretical foundations and experimental evidence related to dividend policy criteria. However, dividend policy is yet an unsolved problem and there is no clear guide regarding optimal dividend policy. Corporations often adopt specific policy regarding dividend. Various factors such as policies used in other similar companies, past dividend policy, legal limitations and stability of profitability are considered in formulating this policy. Despite of various policies, companies often use such policies as dividing fixed amount, dividing a fixed percentage of profits, fixed dividend plus a variable margin and dividend surplus (Baker, H.K. ,Powell, G.E. and Veit,T. (2002), PP.230-205).
Dependent Variable
Information Asymmetry
Information asymmetry is considered as dependentvariable in this research. In fact, when one of the transaction parties have information advantage over the other party, it is said economic system is asymmetric in terms of information. In order to measure information asymmetry between investors, the model proposed by Venkatesh and Chiang for determining bid / ask spread was used. This mode has been used in various research works. Ghaemi, Vatanparast, Ahmadpour, and Rasaeeian used this model to measure information asymmetry in Iran. The model is described as follows:
SPREAD: stock ask and bid price difference range
t: the year under study
i: the company under study
AP: average stock ask price for company i at period t,
BP: average stock bid price for company i at period t,
According to above model, the larger bid / ask spread, it suggests more information asymmetry. In testing hypotheses, absolute value resulting from this model is used.
Maryam Talimi and Abolfazl Danaei
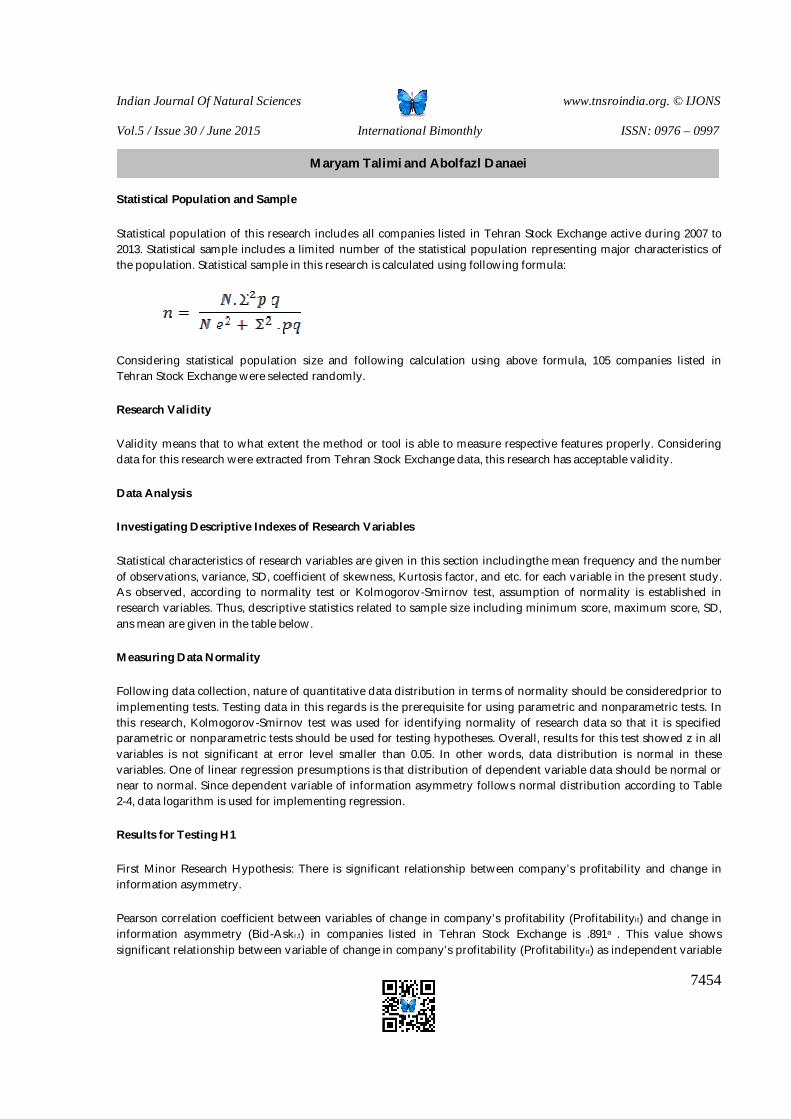
Indian Journal Of Natural Sciences www.tnsroindia.org. © IJONS
Vol.5 / Issue 30 / June 2015 International Bimonthly ISSN: 0976 – 0997
7454
Statistical Population and Sample
Statistical population of this research includes all companies listed in Tehran Stock Exchange active during 2007 to 2013. Statistical sample includes a limited number of the statistical population representing major characteristics of the population. Statistical sample in this research is calculated using following formula:
Considering statistical population size and following calculation using above formula, 105 companies listed in Tehran Stock Exchange were selected randomly.
Research Validity
Validity means that to what extent the method or tool is able to measure respective features properly. Considering data for this research were extracted from Tehran Stock Exchange data, this research has acceptable validity.
Data Analysis
Investigating Descriptive Indexes of Research Variables
Statistical characteristics of research variables are given in this section includingthe mean frequency and the number of observations, variance, SD, coefficient of skewness, Kurtosis factor, and etc. for each variable in the present study. As observed, according to normality test or Kolmogorov-Smirnov test, assumption of normality is established in research variables. Thus, descriptive statistics related to sample size including minimum score, maximum score, SD, ans mean are given in the table below.
Measuring Data Normality
Following data collection, nature of quantitative data distribution in terms of normality should be consideredprior to implementing tests. Testing data in this regards is the prerequisite for using parametric and nonparametric tests. In this research, Kolmogorov-Smirnov test was used for identifying normality of research data so that it is specified parametric or nonparametric tests should be used for testing hypotheses. Overall, results for this test showed z in all variables is not significant at error level smaller than 0.05. In other words, data distribution is normal in these variables. One of linear regression presumptions is that distribution of dependent variable data should be normal or near to normal. Since dependent variable of information asymmetry follows normal distribution according to Table 2-4, data logarithm is used for implementing regression.
Results for Testing H1
First Minor Research Hypothesis: There is significant relationship between company’s profitability and change in information asymmetry.
Pearson correlation coefficient between variables of change in company’s profitability (Profitabilityit) and change in information asymmetry (Bid-Aski,t) in companies listed in Tehran Stock Exchange is .891a . This value shows significant relationship between variable of change in company’s profitability (Profitabilityit) as independent variable
Maryam Talimi and Abolfazl Danaei
Indian Journal Of Natural Sciences www.tnsroindia.org. © IJONS
Vol.5 / Issue 30 / June 2015 International Bimonthly ISSN: 0976 – 0997
7455
and change in information asymmetry (Bid-Aski,t) in companies listed in Tehran Stock Exchange as dependent variable at error level 5 percent. Thus, considering outputs of SPSS software and outputs of Eviews econometric software given in above tables it can be stated H0 is rejected at error level 5 percent, since significance level is smaller than 5 percent, and correlation between two variables is supported. Also, adjusted coefficient of determination is 0.793, which is acceptable and provides suitable fit for changes in information asymmetry variable (Bid-Aski,t) by variable of change in company’s profitability (Profitabilityit) in companies listed in Tehran Stock Exchange. On the other hand, independence of errors is the other assumptions of regression. If this assumption is rejected and errors are correlated, regression cannot be used. One of the main tests for identifying errors independence assumption is Durbin – Watson test. Thus, Durbin – Watson test is used in order to investigate independence of errors. If it is between 1.5 and 2.5, assumption of errors correlation is rejected and regression can be used. Durbin – Watson statistics is 2.161 according to Tables 4-5, and it suggests errors are independent and there is no correlation between errors and assumption of correlation of errors is rejected and regression can be used.
Results for Testing H2
Second Minor Research Hypothesis: There is significant relationship between company’s market value and change in information asymmetry.
Pearson correlation coefficient between variable of change in company’s market value (Delta.MVit) and change in information asymmetry (Bid-Aski,t) in companies listed in Tehran Stock Exchange is .890a . This value shows significant relationship between variable of change in company’s market value (Delta.MVit) as independent variable and change in information asymmetry (Bid-Aski,t) in companies listed in Tehran Stock Exchange as dependent variable at error level 5 percent. Thus, considering outputs of SPSS software and outputs of Eviews econometric software given in above tables it can be stated H0 is rejected at error level 5 percent, since significance level is smaller than 5 percent, and correlation between two variables is supported. Also, adjusted coefficient of determination is 0.790, which is acceptable and provides suitable fit for changes in information asymmetry variable (Bid-Aski,t) by variable of change in company’s market value (Delta.MVit) in companies listed in Tehran Stock Exchange. On the other hand, independence of errors is the other assumptions of regression. If this assumption is rejected and errors are correlated, regression cannot be used. One of the main tests for identifying errors independence assumption is Durbin – Watson test. Thus, Durbin – Watson test is used in order to investigate independence of errors. If it is between 1.5 and 2.5, assumption of errors correlation is rejected and regression can be used. Durbin – Watson statistics is 2.321 according to Tables 9-4, and it suggests errors are independent and there is no correlation between errors and assumption of correlation of errors is rejected and regression can be used.
Results for Testing H3
Third Minor Research Hypothesis: There is significant relationship between company’s asset growth and change in information asymmetry.
Pearson correlation coefficient between variables of change in company’s asset growth(G.ROEit) and change in information asymmetry (Bid-Aski,t) in companies listed in Tehran Stock Exchange is .840a . This value shows significant relationship between variable of change in company’s asset growth(G.ROEit) as independent variable and change in information asymmetry (Bid-Aski,t) in companies listed in Tehran Stock Exchange as dependent variable at error level 5 percent. Thus, considering outputs of SPSS software and outputs of Eviews econometric software given in above tables it can be stated H0 is rejected at error level 5 percent, since significance level is smaller than 5 percent, and correlation between two variables is supported. Also, adjusted coefficient of determination is 0.702, which is acceptable and provides suitable fit for changes in information asymmetry variable (Bid-Aski,t) by variable of change in company’s asset growth (G.ROEit) in companies listed in Tehran Stock Exchange. On the other hand,
Maryam Talimi and Abolfazl Danaei
Indian Journal Of Natural Sciences www.tnsroindia.org. © IJONS
Vol.5 / Issue 30 / June 2015 International Bimonthly ISSN: 0976 – 0997
7456
independence of errors is the other assumptions of regression. If this assumption is rejected and errors are correlated, regression cannot be used. One of the main tests for identifying errors independence assumption is Durbin – Watson test. Thus, Durbin – Watson test is used in order to investigate independence of errors. If it is between 1.5 and 2.5, assumption of errors correlation is rejected and regression can be used. Durbin – Watson statistics is 2.246 according to Tables 13-4, and it suggests errors are independent and there is no correlation between errors and assumption of correlation of errors is rejected and regression can be used. Considering Table 5-4, correlation coefficient calculated for asset growth and information asymmetry is 0.33 which is significant at level 0.001. It suggests significant relationship between two variables. I.e. by increase in asset growth and considering company’s dividend policy, change in information asymmetry is expected. Thus, third hypothesis is supported.
Results for Testing H4
Fourth Minor Research Hypothesis: There is significant relationship between company’s Tobin’s Q and change in information asymmetry.
Pearson correlation coefficient between variable of change in company’s Tobin’s Q (Q.Tobini.t) and change in information asymmetry (Bid-Aski,t) in companies listed in Tehran Stock Exchange is .731a . This value shows significant relationship between variable of change in company’s Tobin’s Q (Q.Tobini.t) as independent variable and change in information asymmetry (Bid-Aski,t) in companies listed in Tehran Stock Exchange as dependent variable at error level 5 percent. Thus, considering outputs of SPSS software and outputs of Eviews econometric software given in above tables it can be stated H0 is rejected at error level 5 percent, since significance level is smaller than 5 percent, and correlation between two variables is supported. Also, adjusted coefficient of determination is 0.528, which is acceptable and provides suitable fit for changes in information asymmetry variable (Bid-Aski,t) by variable of change in company’s Tobin’s Q (Q.Tobini.t) in companies listed in Tehran Stock Exchange. On the other hand, independence of errors is the other assumptions of regression. If this assumption is rejected and errors are correlated, regression cannot be used. One of the main tests for identifying errors independence assumption is Durbin – Watson test. Thus, Durbin – Watson test is used in order to investigate independence of errors. If it is between 1.5 and 2.5, assumption of errors correlation is rejected and regression can be used. Durbin – Watson statistics is 2.106 according to Tables 17-4, and it suggests errors are independent and there is no correlation between errors and assumption of correlation of errors is rejected and regression can be used.
Results for Testing H5
Fifth Minor Research Hypothesis: There is significant relationship between change in dividend policy and change in information asymmetry.
Pearson correlation coefficient between variable of change in dividend policy (DIVit) and change in information asymmetry (Bid-Aski,t) in companies listed in Tehran Stock Exchange is .934a . This value shows significant relationship between variable of change in dividend policy (DIVit) as independent variable and change in information asymmetry (Bid-Aski,t) in companies listed in Tehran Stock Exchange as dependent variable at error level 5 percent. Thus, considering outputs of SPSS software and outputs of Eviews econometric software given in above tables it can be stated H0 is rejected at error level 5 percent, since significance level is smaller than 5 percent, and correlation between two variables is supported. Also, adjusted coefficient of determination is 0.870, which is acceptable and provides suitable fit for changes in information asymmetry variable (Bid-Aski,t) by variable of change in dividend policy (DIVit) in companies listed in Tehran Stock Exchange. On the other hand, independence of errors is the other assumptions of regression. If this assumption is rejected and errors are correlated, regression cannot be used. One of the main tests for identifying errors independence assumption is Durbin – Watson test. Thus, Durbin – Watson test is used in order to investigate independence of errors. If it is between 1.5 and 2.5, assumption of errors
Maryam Talimi and Abolfazl Danaei
Indian Journal Of Natural Sciences www.tnsroindia.org. © IJONS
Vol.5 / Issue 30 / June 2015 International Bimonthly ISSN: 0976 – 0997
7457
correlation is rejected and regression can be used. Durbin – Watson statistics is 2.165 according to Tables 21-4, and it suggests errors are independent and there is no correlation between errors and assumption of correlation of errors is rejected and regression can be used.
Considering results for four first hypothesis, that is, supporting relationship between dividend policy components and information asymmetry, fifth hypothesis which is the general research hypothesis is also supported.
Considering above results, all research hypotheses are supported. Overall, research results suggest relationship between information asymmetry and dividend policy. That is, increasing in dividend reduces information asymmetry and reduction in dividend increases information asymmetry.
Results for Testing Main Research Hypothesis
Main Hypothesis: There is significant relationship between advantage of information asymmetry of shareholders and dividend policies in companies listed in Tehran Stock Exchange.
Pearson correlation coefficient between variable of change in dividend policy (PDIVit) and information asymmetry advantage (Bid-Aski,t) in companies listed in Tehran Stock Exchange is .962a . This value shows significant relationship between variable of value of change in dividend policy (Profitabilityit) as independent variable and information asymmetry advantage (Bid-Aski,t) in companies listed in Tehran Stock Exchange as dependent variable at error level 5 percent. Thus, considering outputs of SPSS software and outputs of Eviews econometric software given in above tables it can be stated H0 is rejected at error level 5 percent, since significance level is smaller than 5 percent, and correlation between two variables is supported. Also, adjusted coefficient of determination is 0.921, which is acceptable and provides suitable fit for changes in shareholders’ information asymmetry variable (Bid-Aski,t) as dependent variable and value of changes in dividend policy (PDIVit) in companies listed in Tehran Stock Exchange as independent variable. On the other hand, independence of errors is the other assumptions of regression. If this assumption is rejected and errors are correlated, regression cannot be used. One of the main tests for identifying errors independence assumption is Durbin – Watson test. Thus, Durbin – Watson test is used in order to investigate independence of errors. If it is between 1.5 and 2.5, assumption of errors correlation is rejected and regression can be used. Durbin – Watson statistics is 2.408 according to Tables 25-4, and it suggests errors are independent and there is no correlation between errors and assumption of correlation of errors is rejected and regression can be used.
CONCLUSION
Information asymmetry is a negative phenomenon which often happens in stock exchange markets leading to inappropriate economic decision making by the investors. Information asymmetry occurs when one of transaction parties have more information over the other party, and uses these information effectively in communicating with the other party. Such higher awareness mainly causes economic benefits for the party having more information. Information asymmetry is defined as information inequality between manager of the company and other stakeholders. In case of information asymmetry, not only awareness of one of the transaction partiescompared to other parties regarding some important attributes would be more, but also it is probable he also benefits from hiding this information.In accounting theory, information asymmetry is crucially important, because stock exchange markets experience threats resulting from information asymmetry, and it is due to presence of inter-organizational information. Even if the price reflects all its information perfectly in the market, yet it is probable that individuals within the organization have more information compared to individuals out of the organization. In this case, these individuals utilize advantage of having information and obtain more profits.
Maryam Talimi and Abolfazl Danaei
Indian Journal Of Natural Sciences www.tnsroindia.org. © IJONS
Vol.5 / Issue 30 / June 2015 International Bimonthly ISSN: 0976 – 0997
7458
Dividend policy is one of most important issues in financial management, because dividend represents major cash payments of the companies and it is regarded as one of the main options and decisions for the managers. The manager should decide on dividing the company’s earrings and investing it in the form of retained earnings. Dividend policy also considerably affects financing decisions. According to the recent studies, dividend as a payment to stakeholders reduces information asymmetry risk, and on the other hand, managers may be able to change stock price fluctuations by change in dividend policy. In fact, they may use dividend policy as a means to control stock price fluctuations. Earnings management includes aware actions of the management to achieve specific goals in accounting procedures framework (Chen, 2009).
Management has access to information which is accessible to others. If managers intend to transfer information which represents realities and real value of the business unit using earnings management, it cannot be fault. Worry is made when aim of managers for earnings management is a factor for misleading users of information related to company’s performance. Since investors pay attention to earnings as one of the main decision making factors, these research works have special importance. Various studies have examined relationship between dividend policy, information asymmetry, and earnings management.
Main purpose of current research is investigating relationship between information asymmetry of shareholders and dividend policies in companies listed in Tehran Stock Exchange.Information asymmetry is defined as information inequality between manager of the company and other stakeholders. Dividend policy means a trend which is adopted by the managers in paying profit and earning management plays significant role in which. In order to test hypotheses, information of companies listed in Tehran Stock Exchange during 2007 to 2012 was investigated. In order to measure information asymmetry, bid/ask spread model was used.Bid / ask price represents gap between bid price and ask price. Divide dent policy is divided into four components: profitability, market value, asset growth, and Tobin’s Q. relationship between each of components and information asymmetry is investigated within 4 hypotheses. Descriptive statistics, regression and correlation were used as statistical methods in this research. In testing hypotheses, considering correlation coefficient and significance level, significant relationship is observed between all components of dividend policy and information asymmetry.Using stepwise regression results, overall research hypothesis was supported, i.e. effect of dividend policy on information asymmetry. And a model was estimated based on regression coefficients for information asymmetry. Thus, inferential statistics such as variance analysis was used for testing hypotheses. Inferential statistics methods including Pearson correlation coefficient were used. In order to answer research questions, mean standard deviation and medium was used. Thus, descriptive and inferential statistics were used for data analysis using Excel and SPSS as well as Eviews econometric software. Also, in order to test significant of research hypothesis, inferential statistics including Pearson correlation and regression as well as t test were used for measurement of variables. All steps of statistical analysis were done using SPSS and Eviews econometric software. Results of research hypotheses indicate that all research hypotheses are supported.
That is, research findings showed information asymmetry between manager and stakeholders would be reduced if dividend is increased among shareholders.
REFERENCES
Persian References
1. EbrahimiKordlar, A., Zakeri, H. (2009). Investigation of earnings management through asset sales, Accounting Research, 3: 122 - 135.
2. Bülow, G., Babakhani, J., EbrahimiMeymand, M. (2012). Considering information content of earnings components by management and investors in anticipation of profit, Financial Accounting Research, 4: 47 - 66
Maryam Talimi and Abolfazl Danaei
Indian Journal Of Natural Sciences www.tnsroindia.org. © IJONS
Vol.5 / Issue 30 / June 2015 International Bimonthly ISSN: 0976 – 0997
7459
3. Pourheydari, O., Mohammadi, A.,Rahimi, A. (2009). Stability of dividend policy in companies listed in the Stock Exchange, Accounting Research, 1: 96 - 111
4. PooladiKhoshtinat, M., YousefiAsl, F., (2007). Relationship between information symmetry and asymmetry and conservatism, Journal of Accounting, 20: 37-59
5. Saghafy, A.,Naderi, K. (2012). Conservatism in financial reporting, Journal of Empirical Research in Financial Accounting, First Year, 2.
6. Hijazi, R., Qeytasi, M.B. (2011). Income smoothing and information uncertainty, Accounting and Audit Reviews, School of Management, Tehran University, 63: 63 - 80
7. Khodadadi, V., Janjani, R. (2011). Relationship between earnings management and profitability of companies listed in stock exchange, Financial Accounting Research, Second Year, 1.
8. Khoobani, M.A. (2010). Relationship between earnings quality and information asymmetry, MS Thesis,Qazvin Raja Nonprofit Institute.
9. Zare, R., Moradi, J.,Valipour, H. (2013). Dividend policy and information asymmetry in terms of signaling theory 10. Foroughi, D., Saeedi, A.,Ajdar, M. (nd). Impact of institutional investors on dividend policy in listed companies
in Tehran Stock Exchange" 11. Moradi, M., Deldar, M. (2012).Effect of non-institutional shareholders on dividend policy, Empirical Research in
Financial Accounting, Second Year, 2: 106 - 124. 12. Moradi, J., Valipour, H.,Aghami, M. (2011). Effect of accounting conservatism on reducing the risk of falling
stock prices" 13. Mehrani, S. (1994).Creating a model for the relationship between dividend and investment, MS Thesis, Tehran
University. 14. Beidleman, C. (1973), Income smoothing : "The role of management", The accunting review; 48: 653-667. 15. Bhattacharya, N., Desai, H.,Renkartaraman, K . (2010), " Earnings quality and information asymmetry: evidence
from trading costs", Under review insecond round at contemaccounting review. 16. Bollen , N. (2004), "Modeling the Bid/Ask spread: Measuring the Inventory- Holding Premium", Journal of
financial economics,12:97-147. 17. Brown, S., Hillegeits, S.A. (2007), "How disclosure quality effects the level of information asymmetry", Springer
bussiness media, 12: 443-447. 18. Copeland, T. Galai, E. (1983), "Information effects on the bid-ask spread", journal of finance 38: 57-69. 19. Chay, J.B.,Suh, J. (2009), "Pay out policy and cash flow un certainly", Journal of financial economics, 93. 20. Chen, L.H. (2009), "Income smoothing, information uncertainty, stock returns, and cost of equity", Working
paper, Arizona. 21. Dechow, P.M., Sloan, R, Sweeny, A. (1995), "Detecting earning managment", The accounting review, 10: 193-225. 22. Defond M.L., Park C.W. (1997), "smoothing in come in anticipation of future earnings", Journal of accounting
and economics, 22: 115-139 23. Demsetz, H. (1968), "The cost of transacting", The quarterly journal of economics, 82: 33-53. 24. Feldstein, M., Green, J. (1993), "why do companies pay dividends?", The American economic review, 73: 17-30. 25. Francic, J.R., La Found, P., Schipper, k.(2004), "Costs of equity and earnings attributes", The accounting review;
79: 967-1010. 26. Hashemijoo, M. (2012), " The impact of dividend policy on share price volatility in the Malasian stock Market", 4. 27. Kcith, T .(2004), "Determinants of dividend policy in Stonian enterprises", university of Tartu working paper. 28. Lafound, R., watts, R. (2006), " The information role of conservative financial statements." 29. King Fuei, L. (2010), " Retail minority shareholders and corporate reputation as determinated of Dividend policy
in Austuralia " Pacific – Base Finance Journal,18: 351-368. 30. Lobo , G.,ZhaoJion, J. (2007), "Disclosure quality and earning managment", Asia- pacific journal of accounting
and economics symposium in Hong Kong. 31. vojtech, Cindy, M. (2012), "The relationship between information asymmetry and dividend policy",
www.ssrn.com.
Maryam Talimi and Abolfazl Danaei
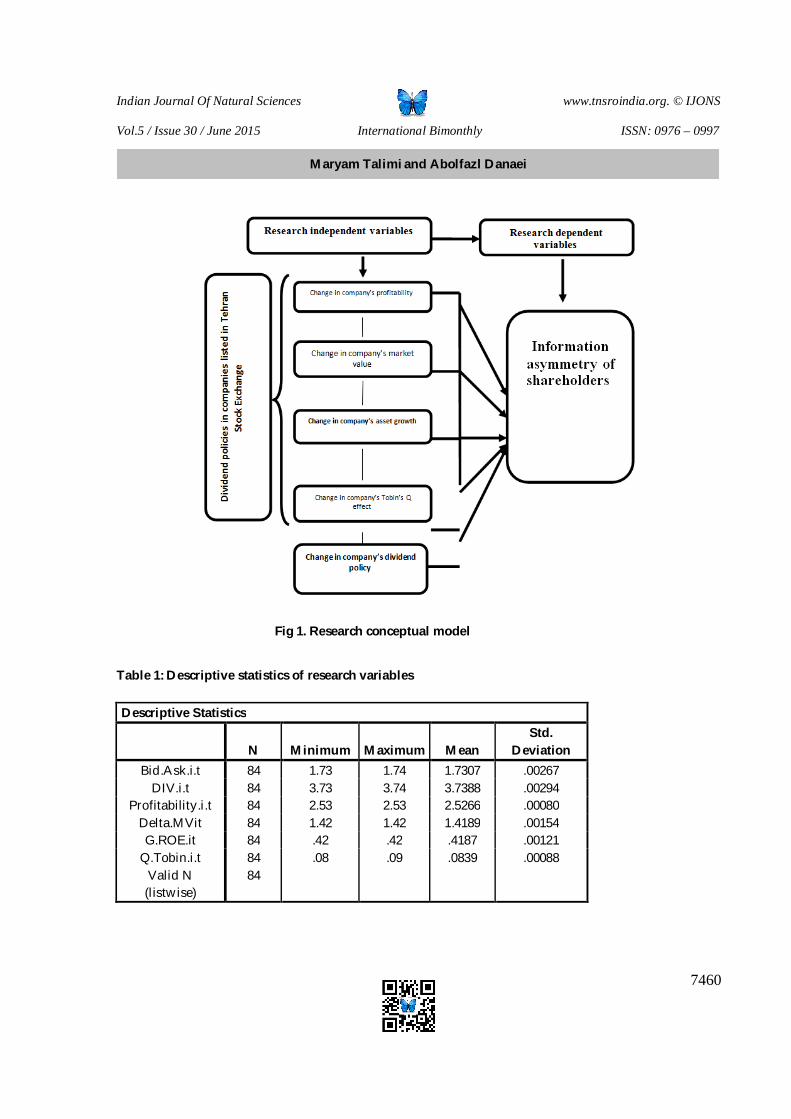
Indian Journal Of Natural Sciences www.tnsroindia.org. © IJONS
Vol.5 / Issue 30 / June 2015 International Bimonthly ISSN: 0976 – 0997
7460
Fig 1. Research conceptual model
Table 1: Descriptive statistics of research variables
Descriptive Statistics
N Minimum Maximum Mean
Std. Deviation
Bid.Ask.i.t 84 1.73 1.74 1.7307 .00267 DIV.i.t 84 3.73 3.74 3.7388 .00294
Profitability.i.t 84 2.53 2.53 2.5266 .00080 Delta.MVit 84 1.42 1.42 1.4189 .00154 G.ROE.it 84 .42 .42 .4187 .00121
Q.Tobin.i.t 84 .08 .09 .0839 .00088 Valid N (listwise)
84
Maryam Talimi and Abolfazl Danaei
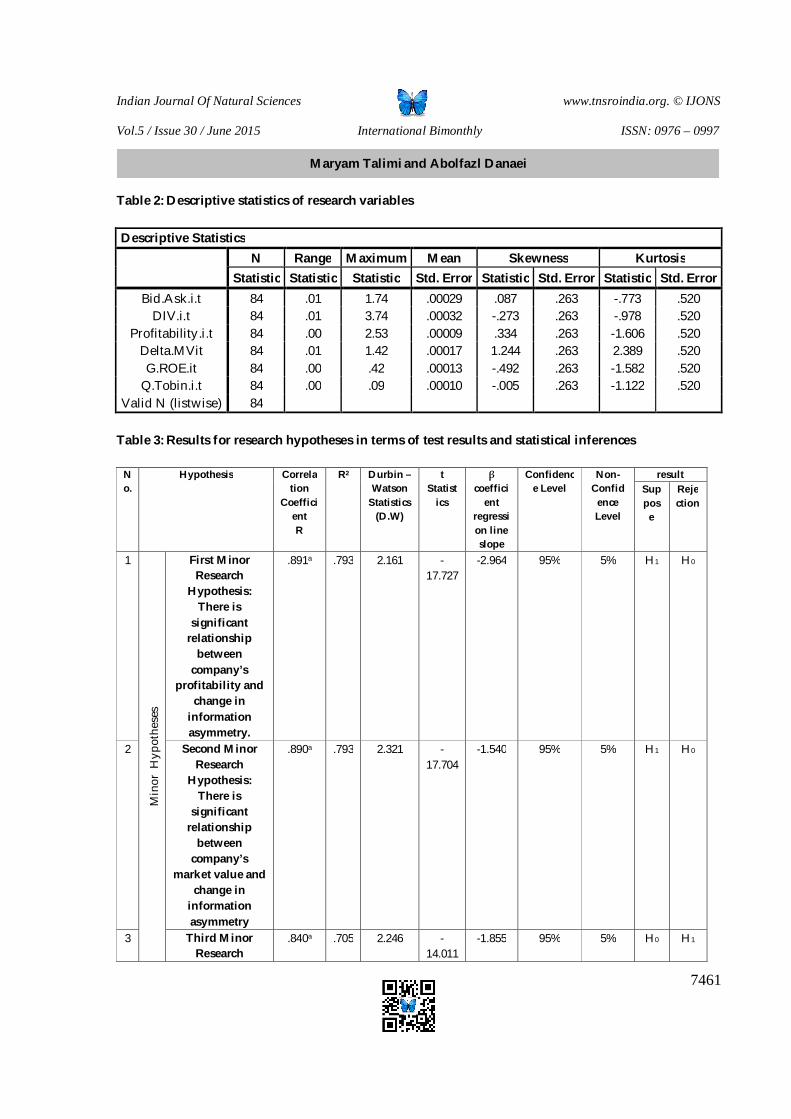
Indian Journal Of Natural Sciences www.tnsroindia.org. © IJONS
Vol.5 / Issue 30 / June 2015 International Bimonthly ISSN: 0976 – 0997
7461
Table 2: Descriptive statistics of research variables
Descriptive Statistics
N Range Maximum Mean Skewness Kurtosis
Statistic Statistic Statistic Std. Error Statistic Std. Error Statistic Std. Error Bid.Ask.i.t 84 .01 1.74 .00029 .087 .263 -.773 .520
DIV.i.t 84 .01 3.74 .00032 -.273 .263 -.978 .520 Profitability.i.t 84 .00 2.53 .00009 .334 .263 -1.606 .520
Delta.MVit 84 .01 1.42 .00017 1.244 .263 2.389 .520 G.ROE.it 84 .00 .42 .00013 -.492 .263 -1.582 .520
Q.Tobin.i.t 84 .00 .09 .00010 -.005 .263 -1.122 .520 Valid N (listwise) 84
Table 3: Results for research hypotheses in terms of test results and statistical inferences
No.
Hypothesis
Correlation
Coefficient R
R2 Durbin – Watson
Statistics (D.W)
t Statist
ics
β coeffici
ent regression line slope
Confidence Level
Non-Confid
ence Level
result Suppos
e
Rejection
1
Min
or H
ypot
hese
s
First Minor Research
Hypothesis: There is
significant relationship
between company’s
profitability and change in
information asymmetry.
.891a .793 2.161 -17.727
-2.964 95% 5% H1 H0
2 Second Minor Research
Hypothesis: There is
significant relationship
between company’s
market value and change in
information asymmetry
.890a .793 2.321 -17.704
-1.540 95% 5% H1 H0
3 Third Minor Research
.840a .705 2.246 -14.011
-1.855 95% 5% H0 H1
Maryam Talimi and Abolfazl Danaei
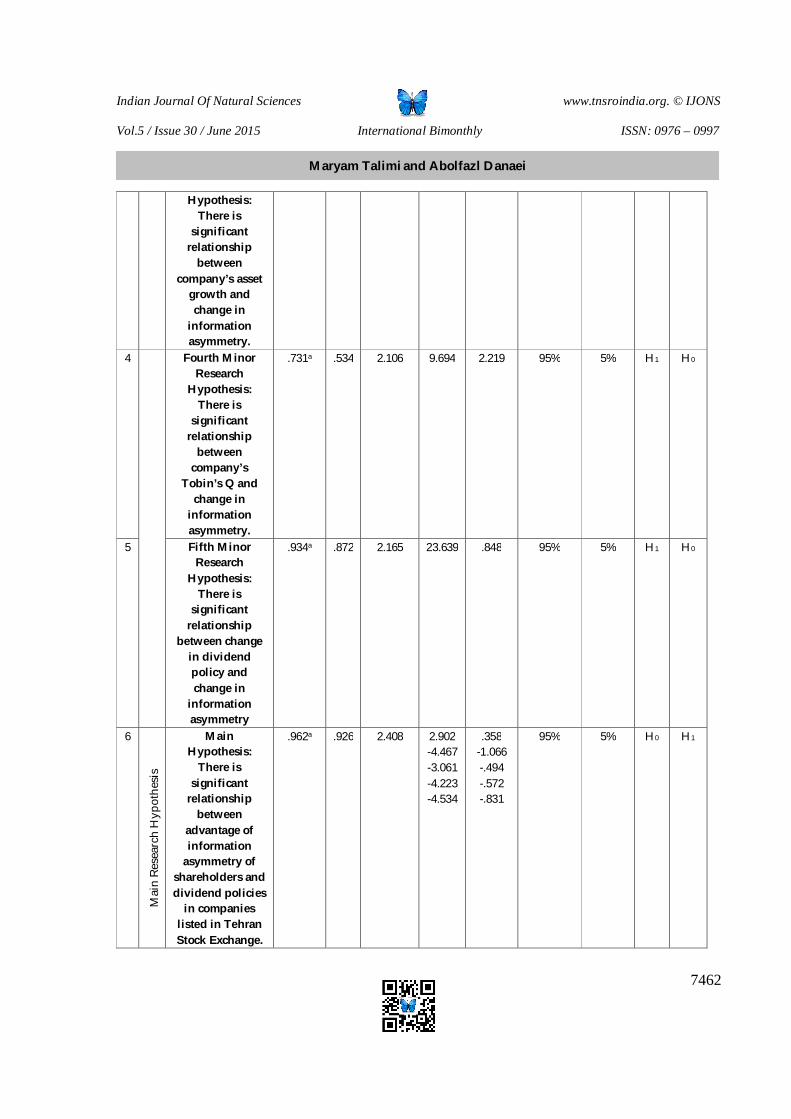
Indian Journal Of Natural Sciences www.tnsroindia.org. © IJONS
Vol.5 / Issue 30 / June 2015 International Bimonthly ISSN: 0976 – 0997
7462
Hypothesis: There is
significant relationship
between company’s asset
growth and change in
information asymmetry.
4 Fourth Minor Research
Hypothesis: There is
significant relationship
between company’s
Tobin’s Q and change in
information asymmetry.
.731a .534 2.106 9.694 2.219 95% 5% H1 H0
5 Fifth Minor Research
Hypothesis: There is
significant relationship
between change in dividend policy and change in
information asymmetry
.934a .872 2.165 23.639 .848 95% 5% H1 H0
6
Mai
n Re
sear
ch H
ypot
hesi
s
Main Hypothesis:
There is significant
relationship between
advantage of information
asymmetry of shareholders and dividend policies
in companies listed in Tehran Stock Exchange.
.962a .926 2.408 2.902 -4.467 -3.061 -4.223 -4.534
.358 -1.066 -.494 -.572 -.831
95% 5% H0 H1
Maryam Talimi and Abolfazl Danaei
Indian Journal Of Natural Sciences www.tnsroindia.org. © IJONS
Vol.5 / Issue 30 / June 2015 International Bimonthly ISSN: 0976 – 0997
7463
A Review of Theory of Ludwig Wittgenstein: Distinguish between Language of Religion and Science
Seyyed Mohammad Musavi Moqaddam1*, Ali Almasi2 and Shima Mahmudpur Qamsar3
1Department of Hadith and Qur’anic Sciences Department, Faculty of Farabi, University of Tehran, Tehran, Iran. 2Ph. D. of Islamic Studies Course, International Institute of Islamic Studies of Qom, Qom, Iran. 3M. A. Student of Hadith and Qur’anic Sciences Course, University of Tehran, Tehran, Iran. Received: 22 Mar 2015 Revised: 18 Apr 2015 Accepted: 29 May 2015 *Address for correspondence Seyyed Mohammad Musavi Moqaddam Department of Hadith and Qur’anic Sciences Department, Faculty of Farabi, University of Tehran, Tehran, Iran.
This is an Open Access Journal / article distributed under the terms of the Creative Commons Attribution License (CC BY-NC-ND 3.0) which permits unrestricted use, distribution, and reproduction in any medium, provided the original work is properly cited. All rights reserved.
Wittgenstein is one of the small numbers of twentieth-century philosophers who is well known outside philosophical circles. This may be due to his exceptional life and personality and the number of biographies and memoirs written about him. However, it is also because his writing has the power to interest the non-specialist reader in a way that other works of philosophy do not.In this article we decided to statement Early Wittgenstein with Picture Theory of Meaning and Later Wittgenstein with Language Games Theory. For example in Language Games Theory, Due to the importance of language games here from the perspective of Wittgenstein The meaning of words attain through usage in verbal and nonverbal vase. Then we will explain Aspects of the problem of philosophy Wittgenstein and specially interpret the difference between Language of Religion and Science. The Most Important his Ideas are about Family Resemblance and Private Language Distinction between Religion and Science. In this article we will try to explain these theories.
Key words: Language, Religion, Science, Language Games, Ludwig Wittgenstein.
RESEARCH ARTICLE
ABSTRACT

Indian Journal Of Natural Sciences www.tnsroindia.org. © IJONS
Vol.5 / Issue 30 / June 2015 International Bimonthly ISSN: 0976 – 0997
7464
INTRODUCTION
It is important to know that the family is very effective in forming the identity of a person. Such as all, Wittgenstein is not an exception of the story. As it is written in the encyclopedia of philosophy.
Ludwig Josef Johann Wittgenstein, (1889- 1951) was born in Vienna, the youngest of eight children. Ludwig paternal grandfather, a convert from Judaism to Protestantism, had been a wool merchant in Saxony before moving to Vienna. Ludwig father, Karl Wittgenstein, had, as a strong-willed boy, rebelled against a classical education, running away to America when he was 17. After two years he returned to Vienna and underwent a brief training in engineering. … Ludwig mother was a Roman Catholic and Ludwig baptized in the Catholic Church(Malcolm, The Encyclopedia of Philosophy; Wittgenstein 1967).
And then about his education Malcolm adds that he:
…was educated at home until 14. … His parents decided to send him to a school at Linz…; after three years at Linz … (Malcolm, The Encyclopedia of Philosophy; Wittgenstein 1967).
He was sent for two years in Berlin. Then, he went to England and continued his studies in engineering; but after three years he shifted again to the mathematics and then to the philosophical foundations of mathematics. But under Russell's supervision he engaged in logic which led to his logical and philosophical life and was an introduction for writing the Tractatus, the most important book in his first season of life. (We can call this season as first Wittgenstein)
After Russell, he was greatly stimulated by G. E. Moore in two areas:
His attempts to reply to skeptical arguments by asserting things he took it to be plain that he knew (for example that Earth had existed for a long time.) and by Moore's discussion of the paradoxical character of saying "I believe he has gone out, but he has not."(Diamond 2006).
Later he wrote On Certainty and he tried to criticize Moore's view in epistemology especially his theory which is famous by the name Commonsense.
In the twentieth century, surely we can count him one of the greatest philosophers in the west. After Kant, he could turn philosophy historically from epistemological issues to the new area of analytical and linguistic issues. Connection of the philosophy and language –and also philosophy of religion and language as a result- opened a new window for improving the situation of philosophy in this century. About his philosophy, Pears says:
Wittgenstein's philosophy is a strange product of genius, which differs in many ways from the work of his contemporaries and predecessors.(Pears 1971).
One of the particularities of his philosophy refers to the division between two seasons of his life. He, in fact we can say, was two distinguished philosopher because of his two divided era of philosophical life. David Pears holds:
The most striking thing about his achievement is that he produced two different philosophies, one in the Tractatus Logico-Philosophicus… and other in Philosophical investigations.(Pears 1971).
Firstly, Tractatus, which is a short and précised book, was published in a German journal and then it published as the two-language book –German and English- with the introduction of Russell in England in 1922. In the second era of
Seyyed Mohammad Musavi Moqaddam et al.
Indian Journal Of Natural Sciences www.tnsroindia.org. © IJONS
Vol.5 / Issue 30 / June 2015 International Bimonthly ISSN: 0976 – 0997
7465
his philosophical thinking, he wrote Philosophical investigations in 1949 and two years after the death of Wittgenstein, it was published the copy of this book in English in 1953. The main part of this book is in critique of Tractatus. In the Philosophical investigations he replaced his picture theory of meaning to the theory of function and usage of language. As Wittgenstein holds:
But how many kinds of sentence are there? Say assertion, question and command? There are countless kinds: countless different kinds of use of what we call "symbols", "words", and "sentences". (Wittgenstein, Philosophical Investigations 1973, 23)
Thus in the Philosophical investigations he asserted on the function and usage of language. (McGinn 2004), But despite of this replacing, he had believed to the symmetry of the two books. The last book of him is called On Certainty that contains his last epistemological view. (Mahdavi Nejad 2005).
The Early Wittgenstein: Picture Theory of Meaning
In the first book of Wittgenstein –Tractatus- there is a different theory from the last view of him. One of the beginning claims of him is that there is a challenge for solving the philosophical problems with the classical methods.
These philosophical problems are solved by a critique of language which fixes the limits of factual discourse. (Pears 1971).
Thus his goal in this theory is to show that we can solve the problems of philosophy with a correct and true understanding of language and its function. If we find the logic of our language, then we can understand the problems of philosophy. See )Grayling 2009, 35-6( as Malcolm holds:
It –Tractatus- presents an original and comprehensive theory of the nature of the language, of the nature of thought and of the nature of reality. ((Malcolm, Wittgenstein: A Religious Point of View 1993).
The main issue of Tractatus is that what is the structure of language? What is its relationship with outside world and how it is possible to picture it? Wittgenstein tries to understand the structure of reality with understanding the structure of language. Thus his attitude in Tractatus is the attitude of formal language. For explaining this standpoint, he faces to the theory of logical atomism. And then based on this theory, he introduces picture theory of meaning. In his view, language is a logical picture of reality. In the other word, language is a picture that can represent the reality.
In his view, the unit that can mean is the proposition and the meaningful proposition is a proposition that can portrait the reality of things, but it is not necessarily true. If we find for this picture that is made by the proposition an extension and instance, than it will be true and otherwise it is false. He explains:
The thought is a proposition with a sense.(Wittgenstein, Tractatus Logico- Philosophicus 1989).
And then he adds
A proposition is a picture of reality. (Wittgenstein, Tractatus Logico- Philosophicus 1989)
In fact there can be different forms of propositions which can show different forms of reality. He explains:
Seyyed Mohammad Musavi Moqaddam et al.

Indian Journal Of Natural Sciences www.tnsroindia.org. © IJONS
Vol.5 / Issue 30 / June 2015 International Bimonthly ISSN: 0976 – 0997
7466
My whole task consists in explaining the nature of the proposition. That is to say, in giving the nature of all facts, whose picture the proposition is.(Wittgenstein, Notebooks1914-1916 1979).
In this regard, his thinking in Tractatus is that language is a compound of propositions which are the picture of reality of the world, but the world is not only limited and pictured in the language; it embraces the painting, photo, the geographical plan and even a note or a part of music. See (Mahdavi Nejad 2005).
Then he tries to present a mechanism for the propositions and dividing between atomic and compound propositions and also the relationship between them and real which have in correspondence one by one. In some points he is similar to Russell. But for him the meaningful proposition is a truth-function proposition and metaphysical propositions and even mathematical propositions are pseudo statements or they are tautology. He says:
Mathematics is a logical method. The propositions of mathematics are equations, and therefore pseudo propositions.(Wittgenstein, Tractatus Logico- Philosophicus 1989).
A proposition of mathematics does not express a thought.(Wittgenstein, Tractatus Logico- Philosophicus 1989).
So in his view, all metaphysical statements – in both cases of tautology and pseudo propositions- are meaningless. The point that later on has gotten the main belief of Vienna circle, because of that in the first sentence of Tractatus he asserts that:
The world is all that is the case.(Wittgenstein, Tractatus Logico- Philosophicus 1989).
There is a one by one correspondence between the logical elements of a sentence and the elements of real things and the names of things are representation of things. But in the third statement of Tractatus he explains that "the logical picture of real facts is a thought." But there are three structures in relation with each other: 1. the status of things and facts in the world, are a structure of simple things; 2. A thought is a structure of mental elements; 3. A linguistic proposition, is a structure of signs. Only when these three structures are in harmony, we can say a proposition is true. There are tree parallel structures in three different areas –the area of reality, the area of thinking and the area of language-. Thus a thought is a picture and a picture is a model of reality. As Malcolm holds, there is an important point about the relationship between these three structures is that:
An important feature of the notion of picturing is that a picture and what is depicts must have the same number of elements. 'in a proposition there must be exactly as much to be distinguished as in the situation that it presents. The two must possess the same logical (mathematical) multiplicity.' (T, 4.04) ((Malcolm, Wittgenstein: A Religious Point of View 1993).
As it was mentioned, metaphysical propositions –in the view of early Wittgenstein- are meaningless, because the only criteria of being meaningful is having extension in the outward and real world; in this situation, its contradictory, also, will be meaningful. But in the both contradictory situations, for metaphysical proposition, we have to be silent. In his view, either language speaks about facts clearly, or it should be silent, because its duty is only explaining the facts. The limitation of language is the reason of limitation of the world, because there are many things in the world that cannot be contained in the frame of the language. (Pears 1971)All issues about metaphysics, life, regarded to God, morality, aesthetics and religion are meta-language. These things can be shown, but cannot be explained all of them belong to the mystical realm.
Seyyed Mohammad Musavi Moqaddam et al.

Indian Journal Of Natural Sciences www.tnsroindia.org. © IJONS
Vol.5 / Issue 30 / June 2015 International Bimonthly ISSN: 0976 – 0997
7467
There are, indeed, things that cannot be put into words. They make themselves manifest. They are what is mystical. (Wittgenstein, Tractatus Logico- Philosophicus 1989).
In this sense, Wittgenstein ends Tractatus by this sentence:
What we cannot speak about, we must pass over in silence.(Wittgenstein, Tractatus Logico- Philosophicus 1989).
This sentence was very interesting for the Vienna circle. But it seems they interpreted his view in order that he was not satisfied.in fact by the word meaningless, he does not want to reject the mentioned issues, but he wants to sheer the direction of them from knowledge to the faith –like Kant. In his view, these issues are placed in the category of mystical experiences. As Gillies says:
Wittgenstein's attitudes were somewhat different from dose of Carnap and most of other members of the Vienna circle. Wittgenstein, certainly, as we have seen, held the view that metaphysics was meaningless. He was, however, a man of strong religious leanings, even though not a member of any organized religion; and in the Tractatus he developed a theory of mystical. The key point here is that, for Wittgenstein in the Tractatus, the limits of what can be meaningfully said do not coincide with the limits of what can be thought. On the contrary, there are things which cannot be said, but which can none the less be shown or thought or which make themselves manifest. Such things constitute the mystical. As Wittgenstein himself puts it in the preface to the Tractatus:
Thus the aim of the book is to set a limit to thought….(Gillies, Philosophy of Science in the Twentieth Century: Four Central Themes 1993).
For supporting this view, he gives the example of life. We can proceed and find the meaning of life in the mystical experience, but we cannot show and purports it to others by the words. See (Gillies, Philosophy of Science in the Twentieth Century: Four Central Themes 2002).
However because it is not the final work of Wittgenstein and after a while he started to critique himself and began to introduce a new system of philosophy – and also a new point view of relationship between mentioned things such as religion with science- we don't proceed and critique his early view, and we shift to the later Wittgenstein which has more importance in the history of philosophy and more effective.
Language Games Theory; Later Wittgenstein
In the third decade of twentieth century, Wittgenstein's philosophy of language changed from picture theory of meaning to the applied theory of meaning and then to the theory of language games. This thought revolution started by writing the book philosophical investigations which become famous after his death. In this era, the contrary and in critique of first theory that he was asserting to the explaining the real by language, he asserts that the meaning of a word is the usage of that word in the language. He explains:
For a large class of cases – though not for all- in which we employ the word "meaning" it can be defined thus: the meaning of a word is its use in the language.(Wittgenstein, Philosophical Investigations 1973).
When he starts this book, by criticizing the Austin's concept of language, tacitly he criticizes his first view which is in Tractatus. In the beginning of philosophical investigations, after quoting a paragraph of Confession of Austin, he explains:
Seyyed Mohammad Musavi Moqaddam et al.

Indian Journal Of Natural Sciences www.tnsroindia.org. © IJONS
Vol.5 / Issue 30 / June 2015 International Bimonthly ISSN: 0976 – 0997
7468
These words, it seems to me, give us a particular picture of the essence of human language. It is this: the individual words in language name object – sentences are combinations of such names- in this picture of language we find the roots of the following idea: every word has a meaning. This meaning is correlated with the word. It is the object for which the word stands. (Wittgenstein, Philosophical Investigations 1973).
In this regard, the language is a combination of distinguished words that finds its inner coherency from a social institution's frame. We can use the words in a widespread and heterogeneous usage of different goals and because of that the duty of philosophy is not only logical analysis, but its duty is to explaining the different frames of language that he calls them language games. When he names this term, he means that the usage and trueness of meaning of words has its special norms of itself, and if we use them in another norm, there will happen the mistake in the meaning.
But these games are not arbitrary phenomena, and they happen because of the diversity in the interests and wishes of human. These different interests are the causation of many different institutions. The institution of science and also the institution of religion are such these social institutions. Moreover, it is not necessary to indicate the rules of the games and for finding these rules, it should see exactly in the quality of the usage of language in its natural place. This natural place can be called as form of life and it indicates to the point that a person cannot understand the correct usage of language except after using language in its proper interest and after cooperating in using some significant concepts.
In his view, understanding the meaning of a word depends on its various usages. A word can be explained by its usage, like an instrument that can be explained by its usage. He indicates:
Think of words as instruments characterized by their use, and then think of the use of a hammer, the use of a chisel, the use of a square, of a glue pot, and of the glue.(Wittgenstein, The Blue and Brown Books 1958).
This example, clearly, shows the diversity of goals in using words and the unlimited usage of them. Also there is not one function that is unit and similar for all words and propositions. Thus, in his view, language, for him is a collection of instruments which is used for different goals. Language has different games which each of them are independent in to its area. These different language games, in his view, can be listed as:
Giving orders, and obeying them; Describing the appearance of an object, or giving its measurements; Constructing an object from a description; Reporting an event; Speculating about an event; Forming and testing a hypothesis; Presenting the results of an experiment in tables and diagrams; Making up a story and reading it; Play-acting; Singing catches; Guessing riddles; Making a joke; telling it; Solving a problem in practical arithmetic; Translating from one language into another; Asking, thanking, cursing, greeting, and praying.(Wittgenstein, Philosophical Investigations 1973).
Seyyed Mohammad Musavi Moqaddam et al.

Indian Journal Of Natural Sciences www.tnsroindia.org. © IJONS
Vol.5 / Issue 30 / June 2015 International Bimonthly ISSN: 0976 – 0997
7469
All of mentioned usage of words and languages are placed in their proper language games. Moreover, each language game has its own rules. In this sense, the routine and everyday language will become important and language will not be only a row and line of words and signs. The real language is related to the collection of actions and reactions and is counted as a part of our life style and form. Different language games are rooted from forms of life. In other words, each particular form of life is related to its language that is different from other language of forms of life.
Language is an inseparable part of human acts that can be defined in clear frame of life and culture. Language is a social act; it is not a limited essence which we can reach to it only by mental and subjective pure argument. In this regard, the word can find its meaning only among the context which is used, and because of differentiate in the context; there are many different language games. In this regard we only have to see to the different language games how show itself to us and then describe what is being. (Mahdavi Nejad 2005) He indicates:
Philosophy simply puts everything before us, and neither explains nor deduces anything. (Wittgenstein, Philosophical Investigations 1973).
However, in his view, the duty of a philosopher is to put language in its correct context. Its duty is clearing the rules and meta-rules and guidelines that solve the ambiguities and problems of using the language. As Malcolm describes the vantage point of Wittgenstein:
This 'putting before us' the use of a word includes comparing and contrasting its use with the use of other words.(Malcolm, Wittgenstein: A Religious Point of View 1993).
Then Malcolm gives an example about the words ' reason' and 'cause' that have some similarities and differences; then he says: "the noting of these differences may take us by surprise." (Malcolm, Wittgenstein: A Religious Point of View 1993)But he explains that language games are not like grammar.
Here the term "language game" is meant to bring into prominence the fact that the speaking of language is part of an activity, or a form of life.(Wittgenstein, Philosophical Investigations 1973).
And because of that he adds in On Certainty:
You must bear in mind that the language-game is so to something unpredictable. I mean: it is not based on grounds. It is not reasonable. It is there- like our life.(Wittgenstein, On Certainty 1969).
Thus language phenomena have not a formal unit. In this sense Anscombe describes that:
The difference of opinion about what belongs to grammar arises from belief in and practice of a 'formal' science of grammar on the one hand, and a study of what a given use of words amounts to or achieves or tells us on the other.(Anscombe 1981).
But this is not the end of story; other element in the Wittgenstein's later view is related to the terms family resemblance and private language. Let us explain these two important terms in his view.
Family Resemblance
It is, previously, mentioned that the later Wittgenstein said: "don’t ask of a meaning of a proposition, but ask about its usage." And the usage of proposition should be understood from the linguistic and social backgrounds. If a
Seyyed Mohammad Musavi Moqaddam et al.

Indian Journal Of Natural Sciences www.tnsroindia.org. © IJONS
Vol.5 / Issue 30 / June 2015 International Bimonthly ISSN: 0976 – 0997
7470
language has not a proper usage, thus it will be meaningless. In this regard language is not going to discover the reality and the essence of trueness and it is not regarding to a specific and definite thing. It is enough that things and phenomena are in a spectrum of similar and joint qualities and attributes to have one form of life and then one language games. Thus we can name things according to their family resemblance between their extensions and denotations. In this respect, we cannot find any reason for judging one form of life, each other. Because of that Hudson explains his view by the phrase:
One example, which he discusses at some length, is belief in a Last Judgment. If a theist says, 'I believe in a Last Judgment' and an atheist says, ' I do not', what is the nature of disagreement between them? Wittgenstein is surely correct in thinking that it is not simply a case of one predicting an empirically observable event and the other denying it. …
If Wittgenstein is correct here, does not simply means that people are not reasonable where religious belief is concerned? His answer is that, in one sense of the word, they are reasonable, but not in another. (Hudson 1968).
Wittgenstein, however, knows the best name for this kind of similarity, family resemblance and he tries to give some patters for that. In philosophical investigations, he indicates:
I can think of no better expression to characterize these similarities than "family resemblances"; for the various resemblances between members of a family: build, features, colors of eyes, gait, temperament, etc. etc. overlap and criss-cross in the same way. _ And I shall say: 'games' form a family.(Wittgenstein, Philosophical Investigations 1973).
But in answer to the question about the criteria of this similarity, he refuges to no exact criteria. If they can be count as a family, there are many things to create this similarity which are not less. He explains:
Consider for example the proceeding that we call "games". I mean board-games, card-games, ball-games, Olympic Games and so on. What is common to them all? _Don't say: "There must be something common, or they would not be called 'games' "_but look and see whether there is anything common to all._ For if you look at them you will not see something that is common to all, but similarities, relationships and a whole series of them at that. To repeat: don't think, but look!(Wittgenstein, Philosophical Investigations 1973).
Private Language
According to the Wittgenstein's view, the meaning is objective and thus, its existence is not related to mind or mental knowledge of people. In the contrast of classical philosophers, who believe to the implication of words to the mental concepts, in his belief, the meaning is a common issue; not subjective and mental. In this regard there is not any private language. Sentences and propositions, in fact, are used for expressing the feelings and emotions. Anscombe quotes a story about this form of life:
I once had the following dialogue with a four-year-old who had a piece of paper in her hand: I: Give me that. C: Whose is it? (Hands it over) I: How many words did I say? C: When? I: When I asked you to give it to me. C: One. I: What was that one word? C: "Can I have paper, please."
Seyyed Mohammad Musavi Moqaddam et al.

Indian Journal Of Natural Sciences www.tnsroindia.org. © IJONS
Vol.5 / Issue 30 / June 2015 International Bimonthly ISSN: 0976 – 0997
7471
… The story is no very weighty support for, but is an excellent illustration of, my contention: the division of utterances into distinct word is a sophisticated proceeding… primitive sense of "word" is "thing said".(Anscombe 1981).
Explaining the Distinction between Religion and Science in His View
In this respect, bring the reader's mind, as a conclusion, to the theory of language games. There is variety of games in different languages. Each language of science, religion, philosophy, art and etc. has its especial game. The language of science has employed for describing the empirical phenomena; the language of art is used for stimulating the emotions and feelings; the language of religion is for spiritual guidance of human; this is on one hand. And on the other hand, each language game has own laws and principles which are different from others.
In this sense, religion and the religious action has its own language game and form of life. We should see on it in its context and background; and because of that religious language has its specific logic and it is wrong using the scientific and positivistic context, background and language in that. Religion is a form of life which is completely, distinguished and in contrast with, from the scientific form of life. Each of them has its own laws and each of them is understood in its context and background.
Thus the scientific form of life is required the scientific language game and the religious form of life is required the religious language game. For understanding each of them it is necessary to understand its proper form of life; or it is better to say that for understanding each of them, we should enter its world; for finding the religious language we should be a religious man and should see to God, cosmos and human with their eyes, until have a true judgment for religious teachings. For recognizing all language game, we ought to play in that game as a player not as a bystander.
It is possible, in the first seeing, to find some common and similar words in both languages of science and religion and because of that it is possible to be in conflict – or in support-, some scientific propositions with religious propositions; but these propositions find incomparable meanings in each context of their different usages. Thus their relationship is only an illusion. Malcolm gives an example and explains the situation:
The function of the words, 'it is God's will', when said religiously and seriously, in a time of trouble, is not to offer the final explanation, nor any explanation at all. Instead, they are an attempt to bring to an end the torment of asking 'why did it have to happen?' an attempt to give the tormented one rest, to provide peace.
In secular life, when something distressing occurs and there is a demand for explanations for why it happened – at some stage someone may say: 'it is pointless to continue seeking for an explanation. We are faced with a fact which we must accept. That's how it is!' the words 'it is God's will', have many religious connotations: but they also have logical force similar to 'That is how it is!' Both expressions tell us to stop asking 'why?' and instead to accept a fact!(Malcolm, Wittgenstein: A Religious Point of View 1993).
This is the reason that Wittgenstein says
It might be asked: how did human beings ever come to making verbal utterances which we call reports of past wishes or past intentions…Look on the language game as what is primary! (Wittgenstein, Philosophical Investigations 1973).
Seyyed Mohammad Musavi Moqaddam et al.

Indian Journal Of Natural Sciences www.tnsroindia.org. © IJONS
Vol.5 / Issue 30 / June 2015 International Bimonthly ISSN: 0976 – 0997
7472
And in another place he answers
You make a study of a particular language-game. Then you can say to someone: 'Look at it! That's how it is! Don't ask why, but take it as a fact, without explanation!' We need 'to accept the everyday language game' (Wittgenstein, Philosophical Investigations 1973).
In this regard, on one hand, the form of consideration of religion to the cosmos is different from science, even in the common issue. In his view, it is not true to say: science proves that miracle is impossible, thus believing to the religious teachings is similar with using religious concepts and also having the feelings and emotions which are necessary for them. This is because the instrument of religious belief is not contained in the words, prediction and hypothesis. It is a kind of commitment frenzy and enthusiastic to the system of reference. He indicates:
A miracle is, as it were, a gesture which God makes. As a man sits quietly and then makes an impressive gesture, God lets the world run on smoothly and then accompanies the word of a saint by symbolic occurrence, a gesture of nature. I would be an instance if, when a saint has spoken, the trees around him bowed, as if in reverence. – Now, do I believe that this happens? I don't.
The only way for me to believe in a miracle in this sense would be to be impressed by an occurrence in this particular way(Wittgenstein, The Wittgenstein Reader 1994).
On the other hand, somehow, there is a combination between pure religious belief and superstition. The defenders of religion who have mistaken the religious belief with the scientific hypothesis and try to make some proofs for religious claims, they don't distinguish, clearly, religious beliefs from superstitions. The wrong way which they have passed is that they use the criteria which are used for justifying the empirical finding, exactly for justifying the religious beliefs. But, finally, his assertion on the religious actions without any logical and philosophical proofs and arguments, led him to the Wittgensteinian fideism. See (Mahdavi Nejad 2005). In his view, "Wisdom is cold and that extent stupid. (Faith on the other hand is a passion.)(Wittgenstein, The Wittgenstein Reader 1994).
Briefly, the basic element of Wittgensteinian fideism is that: in a religious form of life, there is not any place for theories, hypothesis and even religious rational roots; the only thing which has the importance is religions actions. In the sense of his view, Christianity –and also any other religions, is not a doctrine:
Christianity is not a doctrine, not, I mean, a theory about what has happened and will happen to the human soul, but a description of something that actually takes place in human life.(Wittgenstein, The Wittgenstein Reader 1994).
Finally, in his view, we can reform our life's form and style with assertion on the religious faith in the way of religious actions. We should come back and change our way of life. These are the actions and deed in the context of religion which, in fact, fix our religious concepts. The concept of God for a theist makes his meaning of life and its effect shall be shown in his religious deeds; while in the contrast, this concept for an atheist is not only a meaningless concept.
The fundamental point in his fideism is that there is only one language for religion and understanding and examining it only can be happen by the criteria of a unit and independent religious language.
Seyyed Mohammad Musavi Moqaddam et al.

Indian Journal Of Natural Sciences www.tnsroindia.org. © IJONS
Vol.5 / Issue 30 / June 2015 International Bimonthly ISSN: 0976 – 0997
7473
Critical points
One of the fundamental elements of Wittgenstein's philosophy is the concept of forms of life. He mentions this concept in the book philosophical investigation in five times. But the problem is that there is an ambiguity in this concept even in his writings. In this sense Michael Martin in the book Atheism; A Philosophical Justification and Kai Nielson in the article Wittgensteinian Fideism indicate to this point. Furthermore, there are many explanations from the commentators of Wittgenstein that show this ambiguity. Thereby, the question remains that what is the exact meaning of this element of his philosophy. (Mahdavi Nejad 2005).
According to the last critique, the question arises when this problem transmits to the concept of language game, because these two elements are completely related to each other. The foundation of both refers to the social quality of human life. But there is not any criterion to bounding each society from other. For example, in the first step, we can divide easily, religious form of life from scientific form of life – or religious language game from scientific language game; but when we go throw deeply, is religion a united form of life or in that form of life, also there are other language games? If no! So why and with which criterion, is divided religion from others? And if Yes! So what are the boundaries in the religions? Are those divided to the monotheistic religions from polytheistic? Or Abrahamic from others?
Also in each religion itself, we see many forms of life in different denominations that sometimes forces us to believe in differentiate between those as different forms of life.
In this regard, as a hypothesis, we can divide religious language game from scientific –and also other- language games. But this is not the end of the story. The religion itself can be divided to the monotheistic language games and polytheistic language games. Also if we see in the – for instance- monotheistic, we find the division of Abrahamic and non-Abrahamic religions which all of them have own language games and forms of life. In continue, for example- in the Abrahamic religion, we can find Islamic form of life, Christian form of life, Jewish form of life and etc. But yet, -as a sample- in Christianity, there are different forms of life and language games like Catholic form of life, Orthodox and Protestant language game. Also in Islam and other religions there is this differentiate form of life. Nonetheless, in the Catholic there are many divisions which lead to make other forms of life, because of different cultures and societies in this denomination. And it is possible to continue the process intolerable end which can guide us to individuals and persons.
If Wittgenstein accepts that it will reach to persons, this is breaking his law that the different societies cause different forms of life and language games. And if he doesn't accept this extremity, thus he should give a criterion for the stop point and he should specify clearly and obviously, the limitations and boundaries of each form of life and language game.
If we accept the concept of language games and forms of life, that Wittgenstein asserts on the differentiate between different form, and he, also, asserts that we cannot understand each proposition of one language game in another language game, on one hand, but on the other hand, we know there are many similarities and connections between different societies and – in his view- different form of life. But he says that we cannot understand and interpret each proposition of one form of life, in the context of other form of life – the examples have mentioned in last part.
Despite of this view, we see there are many links between different societies with cause the communication of people in different cultures and form of life. This relationship between them is to the extent that makes possibility of living with each other. If they couldn't understand each other, so how they can live with each other, even as a couple? Like a religious wife and scientist husband?
Seyyed Mohammad Musavi Moqaddam et al.
Indian Journal Of Natural Sciences www.tnsroindia.org. © IJONS
Vol.5 / Issue 30 / June 2015 International Bimonthly ISSN: 0976 – 0997
7474
In his view, it is impossible critique of religious beliefs with logical and philosophical proofs on one hand, and also on the other hand, trying to convince others with these proofs for believing in the religion is a vain and unfruitful attempt –which led to the Wittgensteinian fideism. But if religion is immune of logical proofs, so it shows that it is possible to be immune of each kind of critique. But we know that ability of reasonable and logical critique is an advantage for religion. If we cannot critique religion, thus what is the criterion of trueness of that religion as a form of life which has the duty of guidance of human? And what is the criterion of right religion from wrong religion?
In his view, what can give to human a form of life, it is not knowledgeable. But the problem arises when we say that all attitudes and views to the world are not argumentative; empirical and non-empirical, theistic and atheistic and etc. even the view which Wittgenstein himself, has to the world and does according to that. Thus all claims of him will be not knowledgeable and he cannot prove the points of views like form of life, language game, private language, fideism and etc. See (Sajedi 2005).
There are some views that whether Wittgenstein is idealism and also relativism or not? Some scholars like Alston see him idealist, because the necessity and required of his view refers to that, but some like Searle do not agree with Alston. But there are many evidences which support Alston's view.
Whether, in the field of epistemology, we can know him as a realist and in this regard as a fundamentalist or not? It seems that there is no any basic belief for human, in his view. But the problem is that if it is true, so on which basic knowledge is based his theories, too? In this sense, it seems that his view, guides us to a kind of epistemological idealism. See (Sajedi 2005).
CONCLUSION
According to the Wittgenstein view, language is not only an instrument for explaining the ideas, but the language is a combination of distinguished words that finds its inner coherency from a social institution's frame. We can use the words in a widespread and heterogeneous usage of different goals and because of that the duty of philosophy is not only logical analysis, but its duty is to explaining the different frames of language that he calls them language games.
Each language, related to its social function, has own game. Thus religion –like other institution- has its language with its rules of game and science also has its language. For understanding each language we have to play according to the rule of that language game. Religious language game leads to a kind of fideism by the name Wittgensteinian fideism. In this regard, we are not allowed to compare language of religion with the language of science. The occupations and duties of religion and science are different, because of that there is not any relationship between religion and science. Only if a person has religious form of life and he is challenging with religion in his life, can speak about religion. Also because the language of religion is distinguished from science, there is not any conflict between them.
As the conclusion, we can say shortly, the elements and basis of later Wittgenstein's view consist of: 1. Applied theory of meaning, 2. Differentiate in the usage of the words, 3. Lack of common form in the different usages, 4. Forms of life, 5. Language games and finally 6. Differentiate in the religion language game and scientific language game.
Thereby, it seems that his view leads to a kind of relativism and also we can count him idealist.
Seyyed Mohammad Musavi Moqaddam et al.
Indian Journal Of Natural Sciences www.tnsroindia.org. © IJONS
Vol.5 / Issue 30 / June 2015 International Bimonthly ISSN: 0976 – 0997
7475
REFERENCES
1. Anscombe, G. E. M. (1981). Perspectives on the Philosophy of Wittgenstein. Edited by Irvin Block. Oxford: BAsil Blackwell.
2. Diamond, Cora. (2006). The Encyclopedia of Philosophy; Wittgenstein. Edited by Donald M. Borchert. Vol. 9. New York: Thomson Gale.
3. Gillies, D. (1993). Philosophy of Science in the Twentieth Century: Four Central Themes. Oxford: Blackwell. 4. Philosophy of Science in the Twentieth Century: Four Central Themes.Translated by Haasan Miandari .Qom:
Taha, 2002. 5. Grayling, A C.(2009). Wittgenstein: A Very Short Introduction.Translated by Abulfazl Haqiri .Tehran: Basirat. 6. Hudson, W. Ludwig, W. (1968). the Bearing of his Philosophy upon Religious Belief. Edited by D. E. Nineham
and E. H. Robertson. Virginia: John Knox Press. 7. Mahdavi Nejad, M. (2005). Din o Danesh (Religion and Science .(Tehran: Imam Sadiq University. 8. Malcolm, N. (1967). The Encyclopedia of Philosophy; Wittgenstein. Edited by Paul Edwards. Vol. 8. New York:
Macmillan Publishing Co. 9. Wittgenstein: A Religious Point of View. Edited by Peter Winch. London: Routledge, 1993. 10. McGinn, M. (2004)The Routledge Guidebook to Wittgenstein's Philosophical Investigations. Translated by Iraj
Qanuni .Tehran: Ney Publicatio. 11. Pears, D. (1971). Wittgenstein. London: Fontana/ Collins. 12. Sajedi, A. (2005). .” Imangarai va Falsafeye Wittgenstein (Fideism and the Philosophy of Wittgenstein. 159-180. 13. Wittgenstein, L. (1979). Notebooks1914-1916. Edited by H. G. Wright and G. E. M. Anscombe. Translated by G.
E. M. Anscombe. Chicago: The University of Chicago Press. 14. On Certainty. Translated by Denis Paul and G. E. M. Anscombe. New York: Harper Torchbooks, 1969. 15. Philosophical Investigations. Translated by G.E. M. Anscombe. New York: Macmillan Publishing, 1973. 16. Philosophical Investigations. Translated by G. E. M. Anscombe. New York: Macmillan Publishing, 1973. 17. The Blue and Brown Books. New York: Harper Torchbooks, 1958. 18. The Wittgenstein Reader. Edited by Antonny Kenny. Oxford & Cambridge: Blackwell, 1994. 19. Tractatus Logico- Philosophicus. Translated by D. F. Pears and B. F. McGuiness. London and New York:
Routledge, 1989.
Seyyed Mohammad Musavi Moqaddam et al.
Indian Journal Of Natural Sciences www.tnsroindia.org. © IJONS
Vol.5 / Issue 30 / June 2015 International Bimonthly ISSN: 0976 – 0997
7476
The Realistic View of Ma mūdTaymūr by Reviewing the Novel “Al-A lāl” Razeyh Alibakhshi
Department of Arabic Language and Literature, Faculty of Language and Literature, Science And Research Branch, Islamic Azad University, Tehran, Iran. Received: 23 Mar 2015 Revised: 24 Apr 2015 Accepted: 29 May 2015 *Address for correspondence Razeyh Alibakhshi
Department of Arabic Language and Literature, Faculty of Language and Literature, Science and Research Branch, Islamic Azad University, Tehran, Iran.
This is an Open Access Journal / article distributed under the terms of the Creative Commons Attribution License (CC BY-NC-ND 3.0) which permits unrestricted use, distribution, and reproduction in any medium, provided the original work is properly cited. All rights reserved.
Ma mūdTaymūr, Egyptian writer, wrote many literal activities in various fields, short story, novel, drama and etc. in the half century. He started his work by being inspired by his family loving science and literature and also he was inspired by his parents. His brother Mu ammad, inspired him by realistic views and encouraged Ma mūd to study the works of French Maupassant and Russian Chekhov and Hadith Isa IbnHesham story by Muwaylihi and Zaynab written by Haykal work guided him to realism school.Al-A lāl novel is one of his works based on realism school. This psychological novel is based on hidden aspects of Sami, hero of story and how the conditions guided him to unsuitable behavior and such psychological depth of Characterization is the sign of realism.This study views the realistic views in story elements including personality and Characterization, point of view, theme, plot and setting.
Key words: Realism, Ma mūdTaymūr, Story elements, Novel, Short story
INTRODUCTION
Realism in its specific concept refers to the school in literature and it was common in the mid-19th century in Europe and US (SeyedHosseini, 1988, 251). This school focuses on realities of society and it depicts a true image of society with a simple expression (Grant, 1996, 44).
RESEARCH ARTICLE
ABSTRACT

Indian Journal Of Natural Sciences www.tnsroindia.org. © IJONS
Vol.5 / Issue 30 / June 2015 International Bimonthly ISSN: 0976 – 0997
7477
By realistic views to life, Ma mūdTaymūr wrote good works. In his school, the influence of his brother, Mu ammad is considerable. Ma mūd also studied the great works of Maupassant and Chekhov by the insistence of his brother and he also got familiar with their storytelling technique after taking a trip to Europe (Heykal, 35, 20, 10).
Regarding the inclination of Ma mūd to realism school, we shouldn’t ignore the effect of political and social life of that period. After the end of First World War and changes of political, economic and social life and namely poverty and negative war aftermath, most writers were inclined to realism and depicting reality (Alsirfi, 1941, 69). In some of his works, he showed realistic view to psychological analysis of story hero and also ignored considering external appearance of personalities. Taymūr focused mostly on internal and psychological problems of characters in this story and analyzed the problems during the story events and various behaviors of heroes (Al-Sharuni, 2001, 96).
One of the works based on realistic view regarding the psychological analysis of story hero is Al-A lāl novel. Al-A lāl novel is about the youth from a wealthy family, environment and society deviated him.
In this work, Ma mūdTaymūr wrote about a psychological involvement for the reader and depicted weakness of people by it and his position to the story character is similar to the position of a psychologist than the position of a writer (Al-Mavash, Bita, 360).
Based on review of literature, Ma mūdTaymūr is a famous writer conducting many researches about him and his works as the transition of Ma mūdTaymūr from tradition to modernism, realism in the style of Arabic and Persian story writing pioneers as Ma mūdTaymūr and Mu ammad Ali Jamalzade and theses of personality and Characterizationin five famous works of Ma mūdTaymūr and the investigation of style and content of short stories of Ma mūdTaymūr.
The present study attempted to answer the question “Is Al-A lāl novel a realistic work or not? then, story elements determine the realism of this work.
The summary of “Al-A lāl” story
Al-A lāl is the story of a young person from a rich family that different conditions of family, society deviated him and destroyed his life. Sami, hero of story loses his parents in childhood and his brother brings him up. Hemade, his brother was cruel to him and he didn’t love his brother. The cruel brother had a kind wife, MudeHanem and she liked Sami. Their house was located in Hamzavi, a big house like castle with many servants and maids. He was comfortable with the great freedom, Mohdehanem gave him. Tahani, an aristocrat girl, originally Turkish was going to their house with her grandmother “EjlalHanim”. Sami had good memories of his childhood with Tahani, they were playing, talking and had simple friendship.
In school, Sami makes friend with MohyedinAfandi (supervisor of school), a kind person, there was a great age difference between them. He allowed Sami to go to his house. Sometimes, Sami and his two classmates Kheiri and Abdolhamid were going to MohyedinAfandi house but later he was going alone. Later, Sami fall in love with his daughter, Fathe, a kind girl. Mode Hanim was always inviting Fathie and her grandmother “Set Hajar” to the house and this increased this love and affection and family relations were tied among them.
Thus, two girls try to be close to Sami and Tahani and Fathie were jealous to each other. When Tahani went to Turkey with her grandmother, this enmity was reduced and Sami and Fathie had close relationship. After the death of Fathie father, Mode Hanem accepted her as the permanent guest.
Razeyh Alibakhshi

Indian Journal Of Natural Sciences www.tnsroindia.org. © IJONS
Vol.5 / Issue 30 / June 2015 International Bimonthly ISSN: 0976 – 0997
7478
Suddenly, Tahani went to Egypt and visited Sami family with her grandmother and the family welcomed them warmly. Without ignoring Fathie, Sami also loved Tahani. One day, at sunset, Sami was looking for Fathie but saw Tahani in the garden and Tahani flirted with him and the made love. Fathie saw this scene and went away. Sami felt guilty and his love to Fahie increased. Later, “Hemade” brother of Sami married Tahani and provided a new house for her. Thus, Sami love to Fathie was great. After Fathie went to the house, Mode Hanim gave freedom to them and his brother was rarely at home. Sami talked with Mode Hanim and asked her to talk with his brother to be approved of their marriage. His broth was disagree and ordered to throw out Fathie and her grandmother and banned their relationship. Later, Sami got ill and later he found his brother forced Fathie to marry the Sheikh of Khafra, a rural old man, thus he was drunk often and made with friends with hooligans. His cruelty to his brother was much as he tried to take revenge. He decided to start an affair with “Tahani”, wife of his brother and he was going to their house sometimes.
After a while the brother dies, without being informed of his brother betrayal, Moudehanim died and the house was turned into a dark place for him. He also hated Tahani.
Sami escaped from that house and went to the house of Sheikh Khafra, where his love “Fathie”, the victim of the story was living. He saw “Sethajar”, grandmother of Fathie and when he asked about Fathie, she said that she is dead. Sami saw a small child, son of Fathie and tried to love him as his son. He cared for him a lot and tried to teach him to have a noble life.
Point of view in “Al-A lāl” novel
This story is narrated from first person view (I), the author is Sami, hero of story and is hidden from the reader. This facilitates the rate of story and makes it more realistic and as the story is narrated directly from the view of character participating in the events, there is no person like author between the reader and story.
Theme of “Al-A lāl” novel
Al-A lāl novel is a psychological view of the hidden views of Sami, hero of story and shows how the conditions deviated him and such psychological depth of characterization indicates realism.
Thus, the author attempted to depict an exact scene of Sami life as deviated. Cruelty of the brother and as he is not a good model for his smaller brother, the more freedom of the wife of brother and the lack of strict rules at home allowing the free relationships to the adolescents. Also, The temptations of some of the maids and encouragement of friends all deviated our hero of story. These causal relations indicated the logical theme of this work.
In addition to these items, there is a social aim in this novel and it is avoiding hate and enmity with the adolescents.
Character and characterization in Al-A lāl novel
Any noble and realist novelist writing a novel discovers the reality from the beginning as his heroes and sometimes some of the heroes are similar to him or one dimension of his dimensions. It can be said the realist author despite the great interest to creating real characters, doesn’t imitate any specific character and internal and emotional features are used in the characters processing (Al-Ashkari, 2007, 238).
Razeyh Alibakhshi

Indian Journal Of Natural Sciences www.tnsroindia.org. © IJONS
Vol.5 / Issue 30 / June 2015 International Bimonthly ISSN: 0976 – 0997
7479
It seems that Taymūr in the story “Al-A lāl” depicted his life in the early youth and his love was also depicted (Aljondi, 1956, 48). Like Taymūr, Sami is from a rich family and the house is like a castle with many maids and servants. The character of Sami is mostly shyness and simple character like Taymūr.
In the book “Qeram Al-Odaba”, AbasKhezr referred to this issue and said: Sami character as he is Taymūr himself was revealed in this story. I talked to him about the love in this story as real, he didn’t accept (Khezr, 1956, 53).
In this story, the character of Sami is introduced as two features of orphan and academic failure in school and it depicts a part of Taymūr character as he lost his mother in childhood and his father was mostly studying in the library (Nofel, 1997, 14). Also, we can say, he was deprived of the love of his mother and father and he couldn’t finish schooling for his disease and these two features are seen in some characters including Sami as Sami talked about himself in A lāl novel (Hossein, 2007, 14).
Another point is as realism novel character should be mostly individual not typical (Parham, 2001, 58). The great attention of novelist to make the characters specific is wide as some of the aspects are referred here. As each person has a specific name in his real life, the novelist by naming the story characters attempted to show them as special. The realist novelist also chose some names for his novels and showed that they are special people in the social environment of that period (Lashkari, 2007, 232).
Naming the characters give them individuality and sometimes it seems Taymūr considered the individual, mental , intellectual and moral features of character and most of the names are chosen based on personalities. In the story of A lāl, the name of wife of the brother (Mode Hanim) refers to her kindness, also EjlalHanim refers to her attributes. Sami character means being away from excellence and the reasons of this naming refer to the class bias (Hossein, 2007, 150).
Character naming gives individuality and all its dimensions and realism aspect are possible via description. Description is one of story techniques clarifying all aspects of character. Description has its own importance and it cannot be ignored. Via description, if it is natural and effective, imagination is created and the reader forgets that it is a story, he is separated from his own space and feels the characters are close to him ( Al-Shekari, 2007, 237). In describing the characters, external form is also considered and sometimes viewing the depth of character layers and analysis of effective aspects of his behavioral motivations and personality and physical issues are also considered (Hedare, 1994, 386).
In the story of A lāl, psychological description of hidden views of Sami, hero of story can be seen and different conditions deviated him to unsuitable behaviors. Thus, the author attempts to depict an exact scene of the life of Sami as deviated. To describe the characters of this story, it is better to divide it to aristocrat and the people with the same social class. Like Sami (hero of Hemade story”, “Mode Hanim”, “EjlalHanim”, “ Tahani”, Taymūr in these characters less considered sensory description and even Sami is story hero, his appearance is not described. Regarding Hemade, Mode Hanim and EjlalHanim, some terms were described (Taymūr, 1934, 10). This is true also about Tahani as (Ibid). There is no direct reference about physical features of the rich character in A lāl novel and the reader should found about it in the story and technically, it is the strength of story and respect to the reader.
For example, regarding Tahani as a rich and proud girl, this pride is revealed in his conduct with Fathie. When both of them were guests of Sami family, Tahani took mockery of Fathie and teased her regarding her appearance (Taymūr, 1934, 36). In this method, story characters are shown in practice and as they talk, or do, we know which type of person they are (Mirsadeghi, 1997, 90). Also, in some of the characters, the mental states are described. Taymūr described Hemade (Taymūr, 1934, 2).
Razeyh Alibakhshi
Indian Journal Of Natural Sciences www.tnsroindia.org. © IJONS
Vol.5 / Issue 30 / June 2015 International Bimonthly ISSN: 0976 – 0997
7480
Regarding the low social class characters, their appearance is described and these descriptions are not only about the main characters also, minor characters are also included (ibid, 45).
Setting in A lāl novel
Ma mūdTaymūr, realist author explained the setting as the reader becomes familiar with the setting with heroes and their mental state. For example, description of house refers to the rich family of Sami, hero of story (Taymūr, 1934, 2). As it was said, family of Ma mūdTaymūr was living in Darbolsaade of Cairo and Darbolsaade and Hamzavi are similar regions in Cairo. The description of the house of Sami is a castle with tall walls and big rooms full of valuable furniture like the house of Ma mūdTaymūr house in Darbolsaade and this shows his inclination to realism (Khezr, 1956, 56).
The story location is described based on story characters, social status and their social class. Based on the description of Fathie house, she belongs to the average class of society. Indeed, story setting description is dispersed in A lāl novel and it plays important role in creating reality.
The time or era and period of event are the factors creating the setting (Mirsadeghi, 1997, 453).
In A lāl novel, definite time and era is not considered by the author but sometimes, it is referred to the events occurrence time. In sum, the author in realism path described story locations and story period and it is necessary to keep “reality concept”.
CONCLUSION
“Al-A lāl” story is narrated from first person view (I). The story is narrated directly from the view of the character participating in the events, there is no person like author between the reader and story and it becomes more realistic.
Ma mūdTaymūr combined the events in the theme as it is logical for the reader as we observed the events based on causal relations. As by which reason, the event is occurred and which events based on which reasons are occurred.
Regarding characterization in the novel, it seems Taymūr depicted his life in the early young period and this helps the realistic view of the work.
To describe the events by realistic style, Taymūr described the appearance of people, place and the space in the story and this helps the information of the reader.
Ma mūdTaymūr explained the settings as the reader based on the settings gets familiar with the mental state of the heroes.
REFERENCES
1. Taymūr, Ma mūd . 1934. Al-A lāl. Cairo. Al-Matbae Al-Selfie. 2. Parham, Sirus. 1997. Realist and anti-realist in literature. Tehran. 3. Aljondi, Anvar. 1956. AzvaAla Hayat Alodaba Al-Moaserin. Cairo. Arabic books. 4. Hossein, Hamdi. 2007. Al-Shakhsie Al-RavaieEndeMahmūdTaymūrBein Al-Nazarieva Al-Tatbigh. Al-Matbe Al-
Sanie. Cairo AlHia Al-Mesrie Al-AmeLelketab.
Razeyh Alibakhshi

Indian Journal Of Natural Sciences www.tnsroindia.org. © IJONS
Vol.5 / Issue 30 / June 2015 International Bimonthly ISSN: 0976 – 0997
7481
5. Khezr, Abas. 1956. Qaram Al-Odaba. Egypt. Darolmaaref. 6. SeyedHosseini, Reza. 1997. Literal schools. Tehran. Amirkabir. 7. Alsharuni, Yusef. 2001. Derasat Fi Al-Qese Al-Qasire. Cairo. Darolgharib. LeltabaevaAlnashrva Al-Tuzi. 8. Al-Shekari, Fadvavi, 2007. Realism in contemporary literature of Iran. Tehran: Negah publications. 9. Alsirfi, Hassan Kamel. 1941. Fan Taymūr Fi Asar Al-Qesasie. Majale Al-Moghtaf. Al-Joze Al-Aval Men Al-
JeldTase, Al-Tasien. 10. Grant, Dimian. 1996. Realism. Translated by Afshar Hassan. Tehran: Markaz publication. 11. Al-Maush, Salem. Bita. Al-Adab Al-arabi Al-Hadis. Beirut. Darolmosem. 12. Mirsadeghi, Jamal. 1997. Story elements. Tehran: Sokan publications. 13. Nofel, Yusef. 1997. Tajlilat Al-Khatab Al-Adabi. Beirut: Darolmashregh. 14. Hedare, Mostafa. 1994. Bahus Fi Al-Adab Al-Arabi. Beirut. Al-Nehzate Al-ArabiLeltabaeva Al-Nashr. 15. Haykal, Ahmad. 2010. Aladab Al-QesasivaAlmosrehi Fi Mesr. Altabe Al-Ola. Cairo. Darogheib.
Razeyh Alibakhshi
Indian Journal Of Natural Sciences www.tnsroindia.org. © IJONS
Vol.5 / Issue 30 / June 2015 International Bimonthly ISSN: 0976 – 0997
7482
The Comparison of Marital Satisfaction among the Male Tour and Non-Tour Employees of Iranian Offshore Oil Company Arash Ghoncheh Department of General Psychology, Faculty of Psychology, Roudehen Branch, Islamic Azad University of Roudehen, Tehran , Iran. Received: 27 Mar 2015 Revised: 26 Apr 2015 Accepted: 29 May 2015 *Address for correspondence Arash Ghoncheh Department of General Psychology, Faculty of Psychology, Roudehen Branch, Islamic Azad University of Roudehen, Tehran , Iran.
This is an Open Access Journal / article distributed under the terms of the Creative Commons Attribution License (CC BY-NC-ND 3.0) which permits unrestricted use, distribution, and reproduction in any medium, provided the original work is properly cited. All rights reserved.
The present study aimed to compare the marital satisfaction of male tour and non-tour employees of Iranian offshore oil company. The study is causal-comparative and ex post facto. The study population is all male tour employees and non-tour employees working in southern oil platforms (ministry of oil) in 2013. The sample size is 100 by systematic random method. Marital satisfaction questionnaire of Enrich (short-form) is used for data collection. The study hypothesis shows that among male tour and non-tour employees, there is difference in terms of marital satisfaction. The findings show that there is a significant difference between the mean of marital satisfaction scores (total score) of the participants in tour and non-tour employees. However, there is a significant difference between the mean of scores of people in two groups in conflict resolution component. The means show that conflict resolution scores are high in tour employees compared to non-tour employees. The results of the study showed that the type and quality of job of people can have important role in their marital satisfaction.
Key words: Marital satisfaction, Tour and non-tour plan, Iranian offshore
INTRODUCTION
Family is the first social organization a person lives in it. Family is a relieving center in which the mental pressures on members are reduced and they can be developed. In all cultures, family is the center of an individual identity. No person is defined separated from his family and the family is the main principle of a person and his personality.
RESEARCH ARTICLE
ABSTRACT
Indian Journal Of Natural Sciences www.tnsroindia.org. © IJONS
Vol.5 / Issue 30 / June 2015 International Bimonthly ISSN: 0976 – 0997
7483
Family is one of the main principles of society. WesterMarck considers family as the initial core of society (Sanayi, 2001). The marital life despite its emotional and sexual attractions is the gradual start of differences in various fields. The failure of couples to solve marital conflict is the effect of many factors but clinical experiences in couples consulting indicate the reality that this failure is based on inexperience, weakness of skill of couples to keep love in the early periods. Many of couples have romantic marriage but later they continue based on the past problematic experiences not based on their mental needs recognition (SoltaniFotovat, 2001). Family as the first social center is formed by marriage and marriage is one of the necessities of social life and many of human needs are met by this method. Family as a useful center makes the other members comfortable and mental pressures of the members can be reduced to fulfill their talents. If family environment is a healthy space for the members and their mental and physical needs are met, family therapy is required less (Sanayi, 2001). There are various factors on marital satisfaction and family performance and some of them are much important. One of the most important factors is respecting each other. Danesh and Heidarian (2006) showed that 1) The spouses with more respect to each other had high marital satisfaction, 2) There was a positive correlation between respect and mutual interest of spouses, 3) The spouses with high respect to each other had high marital satisfaction, 4) There was a positive association between marital satisfaction and interest of couples. Locky and Bin studied on 80 satisfied and dissatisfied couples of marital life. 68% of satisfied couples considered the spouse friendship as the major satisfaction factor and only 18% of dissatisfied couples considered spouse friendship as the major satisfaction factor of marital life (cited in Michel, 1975). Mental-behavioral health of couples and personality features are the factors associated directly or indirectly or by relational association with family performance namely marital satisfaction as referred in many local and foreign studies. A study showed that the couples with neurotic personality are less satisfied of their marriage and their family cohesionis low. There was a positive relation between extraversion, openness to experience, Agreeableness, Conscientiousness, marital satisfaction and family cohesion. In other words, if the couples show these personality attributes more, they can be satisfied of their marriage and they have much family cohesion(Zare ,Nasir&Mastor, 2011). Other studies showed that marital satisfaction had positive correlation between Conscientiousness and Agreeablenessand negative correlation with neuroticism. Two factors of Conscientiousness (positively) and Conscientiousness (negatively) predicted marital satisfaction (Razeghi, Nikijou, Keraskian and ZahrabiMasihi, 2011). One of the effective issues on marital satisfaction and family trend is the job of couples. The quality, income, employment hours and etc. can affect marital satisfaction. The studies of review of literature regarding marital satisfaction show that labor division among couples and parallel participation have positive impact on working on their marital satisfaction (Saginak&Saginak, 2012). Based on these issues, the researchers consider various factors effective on marital satisfaction of spouses as similarity in belief, emotional growth, religious similarity, economic status, social class, academic condition, expressing love to each other, agreement in sexual relations and having communicative skills and these factors and their impact on marital satisfaction are supported repeatedly. Based on the items, the researcher attempts to answer this general and important question that whether the marital satisfaction of male tour and non-tour employees of Iranian offshore oilcompany is different?
As it was said, various researches on family and marital satisfaction show that there was a negative and significant relation between marital satisfaction and psychological problems (Azad Marzabadi, Amiri, Taghavi and Salimi, 2008). A study on marital satisfaction of married employees of two universities showed that the major dissatisfaction among the componets of marital satisfaction regarding sexual relations and conflict resolution and the employees dissatisfied with their marital life need specialized interventions of family and couple therapies (Vaghei, Miri and Qasemipour, 2009). Job and relevant components have direct relation on family namely marital satisfaction. A study showed that job and relevant components had direct impact on family namely marital satisfaction. A study showed that there was a positive and significant association between economic condition and marital satisfaction (Atari, AmanElahifar and MehrabizadeHonarmand, 2006). In most of the local and international studies, mostly marital satisfaction and family performance are emphasized separately. A few studies are regarding this issue and based on theoretical and applied considerations, including the theories of family performance and marital satisfaction with each other. None of the studies emphasize on the work shifts and hard jobs. Thus, it is required to perform a study on these dimensions to evaluate the family performance and marital satisfaction among groups with various work shifts
Arash Ghoncheh
Indian Journal Of Natural Sciences www.tnsroindia.org. © IJONS
Vol.5 / Issue 30 / June 2015 International Bimonthly ISSN: 0976 – 0997
7484
and the relevant differences. This study attempted to fill the gap by evaluation on employees with different job models.
Theoretical basics
Marital satisfaction: Marital satisfaction is happiness, satisfaction and experienced enjoyment of wife or husband (Ellis, 1992). Marital satisfaction is positive and enjoyable attitude of couples of various aspects of marital relations (Soleimanian, 1997). Marital satisfaction is the process in couples life as it is based on consistency of tastes, recognition of personality attributes, creating behavioral rules and formation of communicative models. In other words, marital satisfaction is an evolutionary process between the wife and husband. The adaptable couples are the wives and husbands with high agreement and are satisfied with the type and level of their relations and are satisfied with the type and quality of their leisure time and have good management on their financial issues (Ahmadi, 2007). By training life skills in guidance school, high school and University, we can train the love expression to improve the satisfaction of couples (Davoudi, 2009). Elis (1992) considers marital satisfaction based on the feelings of happiness, satisfaction and experienced enjoyment of wife or husband. Ellis considers the role of thought in marital satisfaction important and considers ignoring the interests and thoughts of the other party as failure in marital relation. Operating definition of marital satisfaction: Here, marital satisfaction is the score the participants achieve in a 47-item marital satisfaction survey.
Satisfaction component: Satisfaction and consistency of people with 10 aspects of marital relation includes personality issues, marital relation, conflict resolution, financial management, leisure activity, sexual relations, marriage and children, relatives and friends, equality roles and religious orientations (Asude, Mohammad Hossein, 2010). The adaptation between wife and husband has great association with happiness and satisfaction of life. Even, the relevant happiness is higher than the happiness of income, education and job success. According to a scientific study, married people have high level of happiness and satisfaction of life compared to other people (Ahmadi, 2007). Operating definition of satisfaction: Satisfaction (marital satisfaction) is the score the participants in 47-item marital satisfaction survey of Enrich can achieve.
Conceptual definition of communication component: Communication, feeling, attitudes and personal beliefs to the amount and method of marital relations (Asude, Mohammad Hossein, 2010). Operating definition of communication: Communication is the score the participants achieved in 47-item marital satisfaction survey of Enrich.
Conflict resolution component: It includes attitudes, feelings of spouse to create conflict resolution of couples to finish the disputes (Asude, Mohammad Hossein, 2010). Operating definition of conflict resolution component: Conflict resolution is the score the participants achieve in 47-item marital satisfaction survey of Enrich.
The Idealistic Distortioncomponent: This component shows the tendency of couples to good social behaviors (Asude, Mohammad Hossein, 2010). Operating definition of Idealistic Distortion: It is the score the participants achieve in 47-item marital satisfaction survey of Enrich.
REVIEW OF LITERATURE
Local studies
Although the presence of women in various jobs is increased considerably, the major part of house responsibilities is dedicated to them (Qobadi, Dehghani, Mansur, Abbasi, 2011). A study has been conducted with the aim of evaluation of effective factors on hose chores division among the couples, perceived justice of house work division
Arash Ghoncheh
Indian Journal Of Natural Sciences www.tnsroindia.org. © IJONS
Vol.5 / Issue 30 / June 2015 International Bimonthly ISSN: 0976 – 0997
7485
and their impact on marital satisfaction. 162 working women were selected by convenient sampling method and 150 housewives were selected by multi-stage clustering sampling among the married women in Kamyaran town. The results showed that there was a weak association between house chore division and marital satisfaction and a strong relation between perceived justice of house chores and marital satisfaction.
A study investigated the relationship between happiness and marital satisfaction among teacher and housewives in Arak city. The study population was all the women working in education department and housewives in Arak city. Among working women (100) women were selected by systematic sampling method and among housewives (100) women were selected as matched in terms of the number of wedlock years and number of children. The study measures were Oxford happiness survey and Marital satisfaction survey of Enrich. The results showed that there was an association between happiness and marital satisfaction in working women, 2- There was an association between happiness and marital satisfaction among housewives. 3- The happiness of housewives and working women was not different. 4- There was no difference between marital satisfaction of working women and housewives (Amirimajd, ZariMoghadam, 2010).
A study has been conducted with the aim of evaluation of the predicting role of personality features and marital satisfaction on job satisfaction of employees of martyrdom foundation and war veterans of Shiraz city and 112 fully-employed employees were selected by simple random sampling method. The study measure is job satisfaction survey, five-factor survey of personality features (Neo FFI) and marital satisfaction survey of Enrich. The results showed that personality features had predicting power of job satisfaction in the study population but there was no significant relation between marital satisfaction and job satisfaction. On the other hand, personality features had significant relation with marital satisfaction. Also, the gender of employees couldn’t have significant relation with job satisfaction and marital satisfaction (Razavie, Moein, BehluliAsl, 2010).
The findings show total internal consistency of scales in women and men and two extracted factors indicate high validity. The correlation coefficients between each of scale items and total score of items are significant statistically. The validity coefficient between this scale and Enrich marital satisfaction survey in total sample is 0.83 (Rajabi, 2009).
The present study aimed to determine the relation between interest among the spouses and their marital satisfaction. 30 couples , at least one of them teacher were selected by clustering sampling method among high schools of Qom city and three questionnaires of marital satisfaction, respecting spouse and love scale were completed at the same time under controlled conditions. The results at confidence interval 99% showed that :1- The spouses with high interest and respect to their spouses, had high marital satisfaction. 2- There was a positive correlation between respect and mutual interest of spouses, 3- The spouses with high respect to each other, had high marital satisfaction, 4- There was a positive relation between marital satisfaction and interest of couples (Danesh, Heidarian, 2006).
Foreign studies
In a study, life satisfaction and marital satisfaction of intelligent couples were studied. The data were collected twice and for 5 years on 120 couples. The results showed that marital satisfaction had important relation with life satisfaction. They had positive and significant relation with couples intelligence and their job condition (Perrone-McGovern,.Boo, and Vannatter, 2012).
Marital satisfaction is evaluated in psychological studies to identify the factors leading to divorce. This study evaluated the relation between personality traits, marital satisfaction and family cohesion. It was assumed that the couples with neurotic personality are less satisfied with their marriage and their family cohesion is low. There was a positive relation between extraversion, openness to experience, Agreeableness,Conscientiousness, marital satisfaction and family cohesion. In other words, if couples show these personality traits more, they feel satisfied of their
Arash Ghoncheh
Indian Journal Of Natural Sciences www.tnsroindia.org. © IJONS
Vol.5 / Issue 30 / June 2015 International Bimonthly ISSN: 0976 – 0997
7486
marriage and they have high family cohesion (Nasir. Anwar Mastor: Zare, 2011). Alcohol overuse and its dependence are effective on marital satisfaction, family and perceived life quality from couples. A study has been conducted regarding the marital life of 30 women dependent upon alcohol by marital satisfaction scale, family environment scale and life quality. The findings by one-way variance analysis showed that alcohol dependence had different effects on couples namely on their marital satisfaction (AryaTanwar&Ranga, 2009).
The study aimed to detect the marital satisfaction of couples by 100 Holland theories regarding individual and environment interaction. The study sample was 37 married couples in Ball University. The study created coordination among the couples. The short test of marital adaptability of Locke-Wallace measured the couples satisfaction. The personal data form was filled out by participants. The results showed that the coordination among the couples had no association with marital satisfaction. Gender had no significant relation with marital satisfaction (Anzivino, Susan.Riccardi, 2005).
The children with specific disabilities had influence on marital satisfaction, divorce and family performance among the parents, the data didn’t support this position. Most parents of these children had normal marriage. The review of literature showed two main positions as 1) There was not much difference in the parents’ divorce and other parents. 2) These differences among their parents were higher than normal parents. These studies showed that marital problems were due to having disable child and family inefficiency increased divorce (Sobsey, 2004).
Study method
The present study aimed to achieve marital satisfaction among tour and non-tour employees and the researcher couldn’t manipulate the information and the study method is causal-comparative and applied.
The study population, sample and sampling method
The study population is including all male tour and non-tour employees working in 2013 in Iranian offshore oil company (oil ministry). To estimate the sample size, the authorities in causal-comparative studies, consider 15 people adequate for each variable. The sample size is based on it. This study has 4 variables and the sample for each variable is 20 and sample size is 80 for tour employee and 80 for non-tour employee and based on exclusion probability, 100 people are selected of each group (Delavar, 2013). The sampling method is systematic random method as our population is recognized and a list of studied population is available. By I=N/n formula, sampling distance is defined and the participants are selected based on the existing list.
Study measures
The following measures are used in the present study
Demographic features questionnaire: This questionnaire collects individual information of subjects including age, work experience, job and type of employment.
Enrich couple satisfaction scales
The scales of this questionnaire include as: Marital satisfaction: This scale measures satisfaction and consistency of people with 10 marital association aspects as personality features, marital communication, conflict resolution, financial management, leisure activity, sexual affairs, marriage and children, tribes and friends, equality roles and religious orientations. High score shows high marital satisfaction (Asude, 2010). Communication: This scale evaluates
Arash Ghoncheh
Indian Journal Of Natural Sciences www.tnsroindia.org. © IJONS
Vol.5 / Issue 30 / June 2015 International Bimonthly ISSN: 0976 – 0997
7487
emotions, attitudes and beliefs of people to the amount and manner of marital relations. The high score shows awareness of spouses and satisfaction of level and type of communication in their relations and low score indicates dissatisfaction of conflict resolution method. Conflict resolution: This scale evaluates attitudes, feelings of spouse to create conflict resolution and couples methods to finish disputes. High score shows realistic attitudes about the conflicts in marital relations and low score indicates dissatisfaction of conflict resolution method (Asude, 2010).
Idealistic distortion: The questions of this scale are based on the modified scale of agreement and marital tradition of Edmond. This scale measures the tendency of couples to respond the questions based on good social behaviors. The high score indicates unrealistic relation about marital relation (Asude, 2010).
Statistical analysis method
For data analysis and hypotheses test: After collection of completed questionnaires, a) At first descriptive statistical indices as mean, standard deviation and histogram charts are computed, b) In inference statistics by independent t-test and variance analysis to compare variance of male tour and non-tour employees are used.
STUDY FINDINGS
As shown in the above Table 1, more than half of participants had BAj, 16.5% MA. The people with below diploma, Diploma were 14.5% and11.5%. There was only one PHD degree.
As shown in the above table 2, most of the participants (83.5%) had full-employed contract and the remaining were little.
Data description
In this section, the data of measuring various variables are described by suitable statistical methods as mean, standard deviation and distribution indices.
Based on the above Table, various descriptive indices as mean, standard deviation, skewness and kurtosis and normality test results of Kolmogrov-Smirnov of total participants in marital satisfaction (total score) and four components of satisfaction, communication, conflict resolution and idealistic distortion (except satisfaction component) showed that distribution of sample group scores approaches to normal distribution.
Based on the above table data, various descriptive indices as mean, standard deviation, skewness and kurtosis indices and normality tests of Kolmogrov-Smirnov test of the scores of the participants in tour group in marital satisfaction (Total score) and four components of satisfaction, communication, conflict resolution and idealistic distortion showed that distribution of the scores of sample group in measured variables was approaching normal distribution.
Based on the above table data, various descriptive indices as mean, standard deviation, skewness and kurtosis indices and normality tests of Kolmogrov-Smirnov test of the scores of the participants in non- tour group in marital satisfaction (Total score) and four components of satisfaction, communication, conflict resolution and idealistic distortion showed that distribution of the scores of sample group in measured variables was approaching normal distribution.
Arash Ghoncheh
Indian Journal Of Natural Sciences www.tnsroindia.org. © IJONS
Vol.5 / Issue 30 / June 2015 International Bimonthly ISSN: 0976 – 0997
7488
The hypotheses of the study are as
First hypothesis Marital satisfaction is different among male tour and non-tour employees.
Second hypothesis The components of satisfaction, communication, conflict resolution and idealistic distortion of male tour and non-tour employees were different.
Hypotheses analysis
To test the first hypothesis, t-test of independent groups and second hypothesis of study based on the number of dependent variables and type of data of their measurement (quantitative) and independent variable type (qualitative), multi-variate variance analysis method (MANOVA) are applied. Detailed explanation of statistical calculations is shown in the followings.
First hypothesis The marital satisfaction of tour and non-tour employees is different.
Based on calculated t value (2.191) and significance level (0.05) with confidence interval 95%, H0 is rejected. In other words, we can say there was a significant difference between scores of marital satisfaction (total score) of tour and non-tour participants. Thus, there were adequate evidences to support the first hypothesis. The means showed that the mean of marital satisfaction of tour participants was high compared to non-tour employees.
Second hypothesis: There was difference between satisfaction, communication, conflict resolution and idealistic distortion of tour and non-tour employees.
Based on calculated F (1.031) and significance probability (0.414), we can say the data don’t violate the homogeneity assumption of variance-covariance matrix.
Based on calculated F and their significance probability in three variables, variance homogeneity assumption is supported. Although this assumption is not observed regarding communication variable, we should be careful to interpret the results.
Based on Wilks's lambda test (0.955) and calculated F (2.282) with degree of freedom 195 and 4, we can not reject H0. In other words, the difference of the mean of satisfaction, communication, conflict resolution and idealistic distortion at the same time between two participant groups of tour and non-tour is not significant but significance probability is considerable (Sig=0.062).
Based on the results of effects test between the subjects (F values and their significance level), we can say there was a significant difference between the mean of scores of people in two groups only in conflict resolution variable. The mean values showed that conflict resolution scores of tour group compared to non-tour were higher.
DISCUSSION AND CONCLUSION
First hypothesis: The martial satisfaction of male employees of tour and non-tour was different. According to the general results of analysis, the mean of marital satisfaction of tour employees was higher compared to non-tour employees. Among the components, this difference was only in conflict resolution among two groups and in three other groups, these differences were not observed. By social changes and the change of life style of people, marriage and its satisfaction are affected. Today, for some reasons, the marriage of working couples is common. The life of
Arash Ghoncheh
Indian Journal Of Natural Sciences www.tnsroindia.org. © IJONS
Vol.5 / Issue 30 / June 2015 International Bimonthly ISSN: 0976 – 0997
7489
these couples is different from traditional couples in which husband is the bread winner. This life style has positive impact on quality of marital relations as in which balance is observed more than power and decision making compared to traditional relations. Shared decision makings lead to high respect of spouses to each other based on equality and they can be close to each other. They experience the increase of personal value and perception of their competence as they can share their occupational and non-occupational issues with each other and experience fair relation. Based on the results, tour designs had better situation in terms of marital satisfaction and the reasons are clear. Tour designs lead to responsibility among the family members. Due to the lack of presence of spouse or father in a period, mostly for two weeks, housework division and participation of family members can be increased and discussion can be also increased among family members. Family members namely couples mostly consider each other needs and try to meet them.
Second Hypothesis The components of satisfaction, communication, conflict resolution and idealistic distortion of male tour and non-tour employees were different. Based on the results of analyses, the mean of marital satisfaction component (marital satisfaction) of tour participants had not difference compared to non-tour participants. In other words, in terms of marital satisfaction component, there was no difference between two groups and marital satisfaction of them was similar. The various studies showed that marital satisfaction of couples could be affected by the type of job of two sides namely husbands, responsibility of women and the relation with relatives. Also, income as a factor meeting the economic security of people is one of the factors with effective role on marital satisfaction. It means that low income was effective on reducing marital satisfaction and dissolution. Marital satisfaction and job satisfaction had mutual relation with each other and each can influence another one. Also, the results of analyses showed that the mean of communication (marital satisfaction) of tour employees had no difference compared to non-tour employees and both groups had similar communication. The highest shared time of couples is dedicated to communication and quality and quantity of discussion among the spouses has the important role in happiness, success and continuity of wedlock or its failure. On the other hand, the spouse expectations of each other are other important factors of disturbance in marital relations. One of the reasons of high expectations is lack of recognition of spouses of personality features and their abilities. Thus, couples enter marital life by illogical expectations and this leads to some problems in their relations. Generally, it is expected that in a balanced marital relation, satisfaction and dissatisfaction is balanced and is for the benefit of two sides. Two of them have specific share. Their satisfaction or dissatisfaction shouldn’t be increased. f the couples relations are started well, good life image is created for them and if their relations have no good start, it can create unsuitable emotions. The satisfactory relation between the couples based on the job quality of two sides can increase their mental health and wedlock life quality is improved. Based on the results of analyses, only in conflict resolution variable (marital satisfaction), there is difference between tour and non-tour employees. In other words, tour group compared to non-tour group had high conflict resolution ability. The conflicts in marital relation can be due to job tensions, much work, role conflict and the problems of child care and keeping the adults and the issues regarding the balance between job, family and personal needs. Finally, mental pressures affect other aspects of life. Generally, work and family conflicts are created when the pressures of role and expectations in work and family are inconsistent as when the work place of a person in a role can make participation in another role impossible. Different types of mental pressures affect the relation between wife and husband in family. These mental pressures include job expectations to personal and family expectations, the competition between couples, work division, child care order, time dedication, geographical migrations and keeping identity to identity dispersion. The best method to fight against these conflicts is fairness in couples relations, it means the observed balance between the needs and individual goals, couples, family and fair relation between the couples. Fairness doesn’t mean equality and is not achieved by equal division of responsibilities. Fairness is meaningful when the couples to achieve common goal. One of the effective factors on increasing marital satisfaction is increasing life equality and increasing conflict resolution power among the male tour employees and holding the specific conflict resolution classes with high influence on improving marital satisfaction and conflict resolution among tour employees of Iranian offshore oil company. Tour jobs cause that the couples solving their relation problems have exact planning of their life and divide the duties and plans among themselves and have better and suitable interaction. It is because the conflicts are low among them and they achieve agreement suitably. Briefly, job type has
Arash Ghoncheh
Indian Journal Of Natural Sciences www.tnsroindia.org. © IJONS
Vol.5 / Issue 30 / June 2015 International Bimonthly ISSN: 0976 – 0997
7490
important role in marital satisfaction. Marital satisfaction is the interest of couples to each other and positive attitude to married status depending upon some factors as idealistic distortion, personality issues, communication, conflict resolution, financial management and leisure time activities. The relation between the type of job of couples and marital satisfaction is a vital issue important regarding all people. As it was said, various factors lead to spouses satisfaction in marital relation as: The most important success factors in marital life are emotional and intellectual growth, similarity of interests and attitude, religious similarity, educational and class similarity and attitude to sexual affairs, similarity of interests in life and speed in works and finally with wife and husband family and economic issues are important. It can be said, based on the study findings, idealistic distortion was different in two groups. The misunderstandings can lead to marital dissatisfaction and they are created when wife or husband has not good image of each other. This image creates the conditions in which wife or husband misunderstands the behavior and speech of his spouse and attributes unsuitable motivations to it.
Study recommendations
The study regarding couples satisfaction in tour and non-tour design and measuring marital satisfaction, interview with the couples as additional.
Achieving exact criteria to identify marital satisfaction and other relevant components
Informing the authorities
The interaction between the type of job and coping method
The continuance of holding specific conflict resolution classes in islands and south oil platforms to increase marital satisfaction and increasing life quality among tour employees.
REFERENCES
1. Ahmadi, Kh. (2007). Family pathology, Research and studies organization of Basij. Tehran. Reduction of couples non-adaptation. Psychology journal. 8: 893-403.
2. Asude, M. H. (2010). Effective factors on successful marriage from the view of happy couples .MA thesis of family consulting.Tehran University.
3. Amiri, Majd., M., Zarimoghadam, F. (2010). The relationship between happiness and marital satisfaction among teacher and housewives of Arak city.Behavioral science journal.2: 9-21.
4. Sanayi, B.(2001). Consulting and psychotherapy of marriage.Besat publications. Tehran. 5. Danesh, A., Heidarian, M. (2006).The relationship between mutual interests with marital satisfaction of spouses
in Qom town.Consulting researches. 5: 59-76. 6. Davudi, A., (2010). Probabilities and applied statistics in psychology and educational sciences. Roshd
publications. Tehran. 7. Delavar, A. (2013). Study method in psychology and educational science. Tehran. Nashr. 8. Razeghi, N., Nikiju, M., Keraskian, A., ZohrabiMasihi, A. (2011).The relation between five factors of personality
and marital satisfaction.Transformational psychology (Iranian psychologists).7: 269-277. 9. Rajabi, Gh. R., (2009). The factor structure of marital satisfaction scale among married employees of
ShahidChamran University of Ahvaz.Psychotherapy and clinical psychology of Iran (thought and behavior). 15: 59.
Arash Ghoncheh

Indian Journal Of Natural Sciences www.tnsroindia.org. © IJONS
Vol.5 / Issue 30 / June 2015 International Bimonthly ISSN: 0976 – 0997
7491
10. Razavie, A., Moein, L., Bohluli, Asl, F. (2010). The role of personality features and marital satisfaction in job satisfaction of married employees of Martyr foundation and war veterans of Shiraz city. Women sociology (woman and society), 4: 1-17.
11. Soltani, Fotovat, D. (2001). Some recommendations to increase love and intimacy among the spouses.Peivand journal.
12. Soleimanian, A., (1997). The evaluation of the impact of illogical thoughts and marital dissatisfaction.Published MA thesis.TarbiatMoalem University of Tehran.
13. Atari, Y..A., Amanolahifard, A., Mehrabizade, Honarmand, M. (2006).The evaluation of the relationship between personality features and individual-family factors with marital satisfaction in the employees of state offices of Ahvaz city.Educational science and psychology journal. 13: 81-108.
14. Qobadi, K., Dehghani, M., Mansur, L., Abasi, M. (2011).House work division among the couples, perceived justice and marital satisfaction.Family research journal.7: 207-222.
15. Mischel, Andre. (1975). Family sociology and marriage.Translated by F. Ardalan.Social sciences. Tehran. 16. Vaghei, Y., A., Miri, M., R. Qasemipour, M. (2009).The evaluation of relevant factors with marital satisfaction of
employees in Birjand University. Scientific journal of Medical science University of Birjand. 16: 43-50. 17. AryaTanwar S, RangaSwamy R ( 2009 ), Alcohol Dependence and Its Influenceson Marital Satisfaction, Family
Environment and Quality of Life of the Spouses. Department of Clinical Psychology, Sweekaar Rehabilitation Institute for Handicapped,Secunderabad Indian Association of Clinical Psychologists (IACP).
18. Ellis, B. J, (1992). The evolution of sex attraction: Evolution mechanisms in women. In The Adapted Mind, Evolution of Psychology and Generation of Culture, edited by J. H. Barkow, L. Cosmedes , and J. Tooby , 267-88.
19. Perrone-McGovern KM,. Boo JN, and Vannatter A.(2012) Marital and Life Satisfaction Among Gifted Adults. RoutledgeRoeper Review, 34:46–52.
20. Riccardi, D. J.Anzivino, Susan A. (2005) Husband-wife congruence and marital-vocational satisfaction, Master's Theses, Thesis (M.A.)--Ball State University, LD2489. Z72 1980. R53.
21. Saginak KA , Saginak MA, (2012), Balancing Work and Family: Equity, Gender, and Marital Satisfaction, The family journal, 20: 3.
22. Sobsey, D,(2004) Marital Stability and Marital Satisfaction in Families of Children with Disabilities: Chicken or Egg? Developmental Disabilities BulletinJ.P.Das Developmental Disabilities Centre. 6-102, Education North, 32: 82-83.
23. Zare, B., Nasir, R., Anwar Mastor, K. (2011). Personality, Marital Satisfaction and Family Cohesion: Empirical evidence from Iranian Employers of Air line Company, International multidiscipline, Malasyia conference.
Table 1- The statistical summary of Enrich couple scale
Mean score SD Range Alpha Test re-test Marital
satisfaction 32.2 8.6 10-15 0.86 0.86
Communication 31.6 9.2 10-50 0.90 0.81 Conflict
resolution 30.2 7.4 10-50 0.84 0.90
Idealistic distortion
15.5 4.6 5-25 0.83 0.92
Arash Ghoncheh
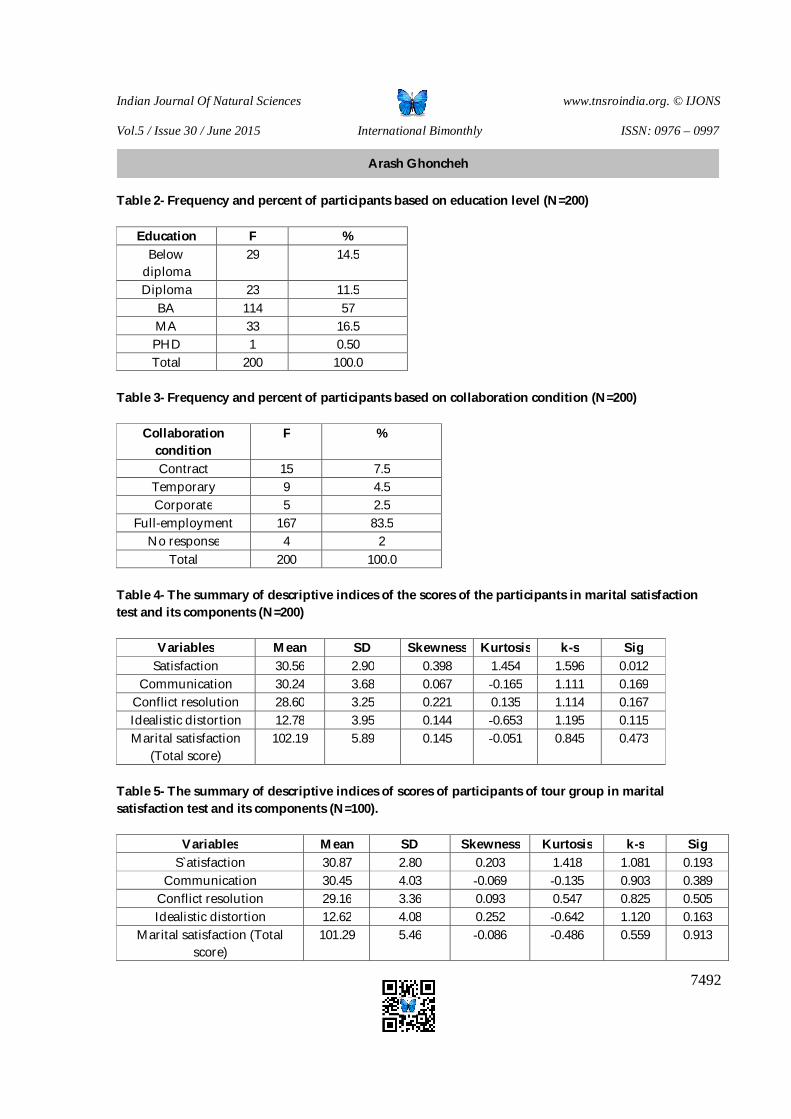
Indian Journal Of Natural Sciences www.tnsroindia.org. © IJONS
Vol.5 / Issue 30 / June 2015 International Bimonthly ISSN: 0976 – 0997
7492
Table 2- Frequency and percent of participants based on education level (N=200)
Education F % Below
diploma 29 14.5
Diploma 23 11.5 BA 114 57 MA 33 16.5 PHD 1 0.50 Total 200 100.0
Table 3- Frequency and percent of participants based on collaboration condition (N=200)
Collaboration condition
F %
Contract 15 7.5 Temporary 9 4.5 Corporate 5 2.5
Full-employment 167 83.5 No response 4 2
Total 200 100.0 Table 4- The summary of descriptive indices of the scores of the participants in marital satisfaction test and its components (N=200)
Variables Mean SD Skewness Kurtosis k-s Sig Satisfaction 30.56 2.90 0.398 1.454 1.596 0.012
Communication 30.24 3.68 0.067 0.165- 1.111 0.169 Conflict resolution 28.60 3.25 0.221 0.135 1.114 0.167 Idealistic distortion 12.78 3.95 0.144 0.653- 1.195 0.115 Marital satisfaction
(Total score) 102.19 5.89 0.145 0.051- 0.845 0.473
Table 5- The summary of descriptive indices of scores of participants of tour group in marital satisfaction test and its components (N=100).
Variables Mean SD Skewness Kurtosis k-s Sig S`atisfaction 30.87 2.80 0.203 1.418 1.081 0.193
Communication 30.45 4.03 0.069- 0.135- 0.903 0.389 Conflict resolution 29.16 3.36 0.093 0.547 0.825 0.505 Idealistic distortion 12.62 4.08 0.252 0.642- 1.120 0.163
Marital satisfaction (Total score)
101.29 5.46 0.086- 0.486- 0.559 0.913
Arash Ghoncheh
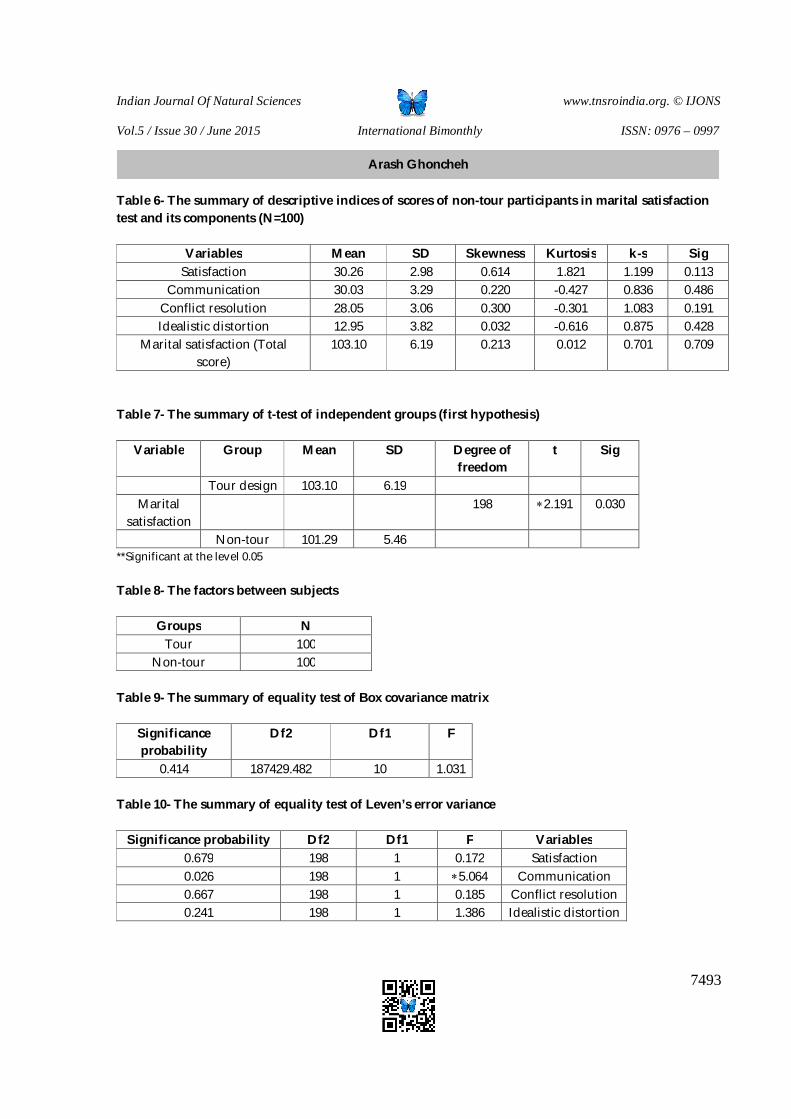
Indian Journal Of Natural Sciences www.tnsroindia.org. © IJONS
Vol.5 / Issue 30 / June 2015 International Bimonthly ISSN: 0976 – 0997
7493
Table 6- The summary of descriptive indices of scores of non-tour participants in marital satisfaction test and its components (N=100)
Variables Mean SD Skewness Kurtosis k-s Sig Satisfaction 30.26 2.98 0.614 1.821 1.199 0.113
Communication 30.03 3.29 0.220 0.427- 0.836 0.486 Conflict resolution 28.05 3.06 0.300 0.301- 1.083 0.191 Idealistic distortion 12.95 3.82 0.032 0.616- 0.875 0.428
Marital satisfaction (Total score)
103.10 6.19 0.213 0.012 0.701 0.709
Table 7- The summary of t-test of independent groups (first hypothesis)
Variable
Group Mean SD Degree of freedom
t Sig
Tour design 103.10 6.19 Marital
satisfaction 198 2.191 0.030
Non-tour 101.29 5.46 **Significant at the level 0.05 Table 8- The factors between subjects
Groups N Tour 100
Non-tour 100 Table 9- The summary of equality test of Box covariance matrix
F Df1 Df2 Significance probability
1.031 10 187429.482 0.414 Table 10- The summary of equality test of Leven’s error variance
Variables F Df1 Df2 Significance probability Satisfaction 0.172 1 198 0.679
Communication 5.064 1 198 0.026 Conflict resolution 0.185 1 198 0.667 Idealistic distortion 1.386 1 198 0.241
Arash Ghoncheh

Indian Journal Of Natural Sciences www.tnsroindia.org. © IJONS
Vol.5 / Issue 30 / June 2015 International Bimonthly ISSN: 0976 – 0997
7494
Table 11- The summary of multi-variate tests
Effects Tests F values
F Degree of
freedom
Error degree of freedom
P Squared Eta
Wilks's lambda
0.955 2.282 4 195 0.062 0.045
Table 12- The summary of tests of effects between subjects
Variance Dependent variables
SS 1df 2df MS F Squared Eta
Group Satisfaction 18.605 1 198 18.605 2.221 0.011 Communication 8.820 1 198 8.820 0.650 0.003 Conflict
resolution 61.605 1 198 61.605 5.944 0.029
Idealistic distortion
5.445 1 198 5.445 0.348 0.002
**Significant at the level 0.05
Arash Ghoncheh
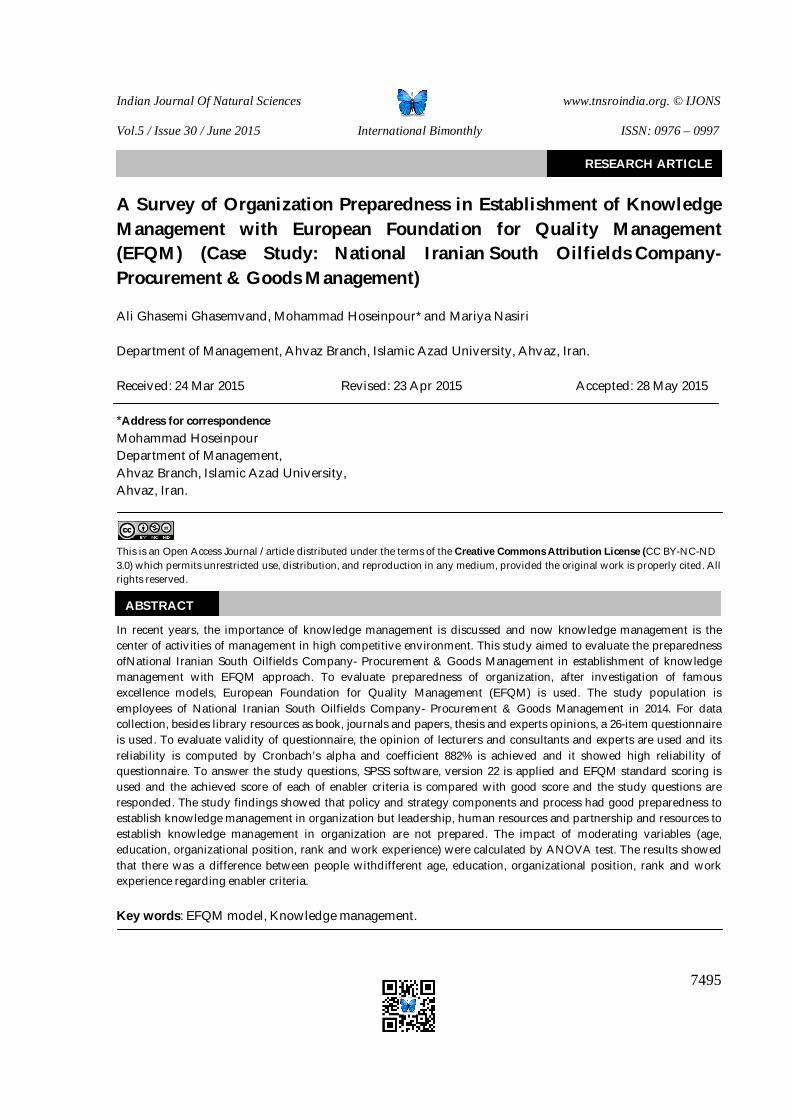
Indian Journal Of Natural Sciences www.tnsroindia.org. © IJONS
Vol.5 / Issue 30 / June 2015 International Bimonthly ISSN: 0976 – 0997
7495
A Survey of Organization Preparedness in Establishment of Knowledge Management with European Foundation for Quality Management (EFQM) (Case Study: National Iranian South Oilfields Company-Procurement & Goods Management) Ali Ghasemi Ghasemvand, Mohammad Hoseinpour* and Mariya Nasiri Department of Management, Ahvaz Branch, Islamic Azad University, Ahvaz, Iran. Received: 24 Mar 2015 Revised: 23 Apr 2015 Accepted: 28 May 2015 *Address for correspondence Mohammad Hoseinpour Department of Management, Ahvaz Branch, Islamic Azad University, Ahvaz, Iran.
This is an Open Access Journal / article distributed under the terms of the Creative Commons Attribution License (CC BY-NC-ND 3.0) which permits unrestricted use, distribution, and reproduction in any medium, provided the original work is properly cited. All rights reserved.
In recent years, the importance of knowledge management is discussed and now knowledge management is the center of activities of management in high competitive environment. This study aimed to evaluate the preparedness ofNational Iranian South Oilfields Company- Procurement & Goods Management in establishment of knowledge management with EFQM approach. To evaluate preparedness of organization, after investigation of famous excellence models, European Foundation for Quality Management (EFQM) is used. The study population is employees of National Iranian South Oilfields Company- Procurement & Goods Management in 2014. For data collection, besides library resources as book, journals and papers, thesis and experts opinions, a 26-item questionnaire is used. To evaluate validity of questionnaire, the opinion of lecturers and consultants and experts are used and its reliability is computed by Cronbach’s alpha and coefficient 882% is achieved and it showed high reliability of questionnaire. To answer the study questions, SPSS software, version 22 is applied and EFQM standard scoring is used and the achieved score of each of enabler criteria is compared with good score and the study questions are responded. The study findings showed that policy and strategy components and process had good preparedness to establish knowledge management in organization but leadership, human resources and partnership and resources to establish knowledge management in organization are not prepared. The impact of moderating variables (age, education, organizational position, rank and work experience) were calculated by ANOVA test. The results showed that there was a difference between people withdifferent age, education, organizational position, rank and work experience regarding enabler criteria.
Key words: EFQM model, Knowledge management.
RESEARCH ARTICLE
ABSTRACT
Indian Journal Of Natural Sciences www.tnsroindia.org. © IJONS
Vol.5 / Issue 30 / June 2015 International Bimonthly ISSN: 0976 – 0997
7496
INTRODUCTION
The current world is a changing world, a world in which external organization changes are increased compared to internal organizational changes and this leads to elimination of a group of organizations form competition in market. An efficient approach to help organizations to promote internal changes from surrounding changes is equipping to the tools guaranteeing organization presence in this field and provides organization competition in market with other competitors (MohebiMoqadam, 2008). In the current world, everything is changing and this issue is true regarding the organizations we live or deal with them. In the varied organizational environment and varied environment outside the organizations, classic management styles are not efficient (Khanifar et al., 2008). At the present age as “information and knowledge” age the main advantage is “knowledge capital”. Now, the greatest companies all around the world achieved their main superiority not in the assets cumulated arising factories and even great market but the knowledge in processes flow (Hasnavi et al., 2010). According to Peter Drucker, the future development belongs to the communities with high share of knowledge. In addition, knowledge organizations in future can achieve empowerment to make great power with weak force (Jafari et al., 2011). Knowledge management isappropriate knowledge acquisition for appropriate people at appropriate lace which is used to achieve organization goals (Afraze, 2010). Steve Hales (2001) believes that knowledge management is a process by which organizations can turn data to information and information to knowledge and can apply the acquired knowledge effectively in their decisions. The aim of knowledge management and knowledge deployment is its access for all employees as they perform their works better (Sharifzade and Budlayi, 2008). Self-assessment is a regular, systematic process in organization as helping the leaders to achieve comprehensive cognition of organization. One of the most important models applied for establishment of self-assessment process is Deming model (in Japan), Malcom Baldrige (in US) and European Foundation For Quality Management (EFQM)(MohebiMoghadam, 2008). By EFQM model, the authorities of organization processes besides achieving valuable information in financial and non-financial fields can achieve awareness of strengths and improvement cases (MohebiMoghadam, 2008). EFQM model is a non-perspective model composed of 9 criteria. EFQM criteria are divided into enablers and results (Najmi and Hosseini, 2009). The enablers of model (EFQM) are composed of five criteria “leadership”, “policy and strategy”, “People”, “Partnership and resources” and “processes” (Amiri and Sokaki, 2008). EFQM model results are composed of four criteria, “people results”, "customerresults", “society results” and “key performance results”(Pouragha and Jamarani, 2013). The measurements of productivity and human resources studies in “national price of productivity and organizational excellence” (as the main authority of this prize from industry and mine ministry at national level) provided an organizational excellence model in Iran and also paved the way for excellence culture among Iranian organizations. The Iranian excellence model is mostly similar to EFQM model and exact familiarity with this model for authorities of Iranian business and organizations is a challenging requirement (Najmi and Hosseini, 2009). Based on thesesimilarities, in this studyEFQM model is used to evaluate preparedness of organization to establish knowledge management. Procurement & Goods Management of National Iranian South Oilfields Companyas providing all goods and required machineries of affiliated companies of National Iranian South Oilfields ,has great importance in terms of the role playing to provide the required goods of relevant units and the correct performance of this sector besides direct impact on increasing production can lead to the fulfillment of macro organizational goals. The present study aimed to evaluate the preparedness of National Iranian South Oilfields Company- Procurement & Goods Management in establishment of knowledge management with EFQM approach. Among 9 enablerand results criterion, 5 criteria of enablers as “leadership, policy and strategy, people, partnership and resources and processes are used. The great question of organizations is by which tools we can identify the various items as comprehensive with all strengths and weaknesses and improved fields? The main question of the present study is evaluation of preparedness of Procurement and Goods Management of National Iranian South Oilfields Company in establishment of knowledge management with EFQM model and enabler criteria are used to define preparedness of organization.
Mohammad Hoseinpour et al.
Indian Journal Of Natural Sciences www.tnsroindia.org. © IJONS
Vol.5 / Issue 30 / June 2015 International Bimonthly ISSN: 0976 – 0997
7497
Theoretical Basics
Knowledge management: Knowledge management is discovery, acquisition, development and creation, sharing, maintenance, evaluation and deployment of knowledge at appropriate time for appropriate person in organization and it is used via a link between human resources, ICT and good structure to achieve organizational goals (Afraze, 2010). Today, knowledge is raised as a valuable and strategic source and an asset and presenting products and services with high quality without management and appropriate use of this valuable source is an impossible issue. In this attitude, knowledge as valuable source beside labor, land, capital (emphasized in economy) is raised as valuable asset (Afraze, 2010). According to King (1999) knowledge management is the process of creation, organizing, dissemination and reliability of required information perception for a task. According to Gurteen (1999), knowledge management is a set of principles, processes, organizational structures and applied technologies helping the people in sharing and deployment of knowledge to encourage the goals (Hosnavi et al., 2010).
EFQM model: EFQM model is a set of methods and tools applied for assessment and self-assessment of organization and it is a model to movement to organizational excellence (MohebiMoghadam, 2008). EFQM is a non-perspective model composed of 9 criteria. These criteria are the center of this model and they are the evaluation basis of organizations. The goals are ambitious and to achieve these goals, the organizations need the criteria as performing them in organizations can lead to attaining goals. EFQM criteria are divided into enablers as leadership, policy and strategy, human resources, partnership and resources and processes and results include people results, customer results, society results and key performance results (Najmi and Hosseini, 2009). EFQM model is a comprehensive tool with comprehensive attitude to aspects of organizations and can help the managers to exact recognition of organization. Compared to other models and organizational assessment models, these models are used rapidly and they have good results. The main cause is the lack of need to design and establishment of complex systems, high measurement and flexibility of these models (based on rapid changes of internal and external organizational conditions). In this model, a set of evaluation criteria of organization and guiding are presented for evaluation. This model besides enabling the organization to evaluate its success in plans in various periods can provide this possibility that organization achieves valuable information of the function of processes and entire system. Indeed, in case of proper self-assessment a real image of current condition of organization is presented and managers can be aware of organization preparedness for establishment of new managerial systems.
Enabler criteria: Leadership: In this criterion, it is defined that how organization leaders can achieve mission and vision and how the values are fulfilled for long-term success of organization and how organization leaders can participate in development and execution of managerial system (Najmi and Hosseini, 2009). Policy and strategy: In this criterion, it is defined how organization can fulfill his mission and perspective via a transparent strategy by considering the benefits of organization beneficiaries and how this strategy is supported via policies, plans, goals, intentions and processes (Najmi and Hosseini, 2009). Human resources: In this criterion, it is defined how organization manages, develops and applies knowledge and abilities of human resources individually, team and in organization level and formulates them as organization policy and strategy and effective performance of processes are supported (Najmi and Hosseini, 2009). Partnership and resources: In this criterion, it is defined how organization can manage external and internal partners and resources to support the organization policies and strategies and effective execution of organization processes (Najmi and Hosseini, 2009). Processes: In this criterion, it is defined how organization manages and improves processes to support the policy and strategy of organization and besides full satisfaction for customers and other beneficiaries can create value increasingly for them (Najmi and Hosseini, 2009).
Mohammad Hoseinpour et al.
Indian Journal Of Natural Sciences www.tnsroindia.org. © IJONS
Vol.5 / Issue 30 / June 2015 International Bimonthly ISSN: 0976 – 0997
7498
REVIEW OF LITERATURE
Chen (2011) in a study “Modeling and Initiating Knowledge management Program Using FQFD: A Case Study Involving a Healthcare Institute Springer” evaluated the infrastructures of knowledge management and presenting a model in terms of processes and empowerment of knowledge management. He found that leadership, IT and organizational culture as enablers of knowledge management had required preparedness for implementation of knowledge management. Hof and Hausman (2009) in a study evaluated the knowledge sharing management in six state organizations. This study evaluated the impact of organizational structure factors, individual social relations, social cognitive relations, organizational culture and IT on knowledge sharing management. The results of study showed that organizational structure and organizational culture were encouraging factors and wide application of IT was important in knowledge sharing management. Rowley (2009) in a study “Is Higher education ready for knowledge Management” found that to create knowledge-based environment, there are some problems in University. The results of study showed that for successful implementation of knowledge management in University, organizational structure and rewarding system should be modified. Kim and Ju (2008) in a study on attitude of faculty members and their collaboration to knowledge sharing, trust among the members, open social relations of people, collaboration among people and encouraging systems led into effective knowledge sharing and a positive and significant relation was achieved between trust, collaboration of members and encouraging systems in University to knowledge sharing.
Sheikhi (2012) in a study “evaluation and assessment of effective factors on knowledge sharing in ICT projects of National Iranian South Oilfields Company, evaluated the effective factors on knowledge sharing. He found that human factor was one of the effective factors on knowledge sharing and in ICT management of National Iranian South Oilfields Companyhad good condition. Kazemi and Malekzade (2012) in a study “explanation of effective factors on implementation of knowledge management in small technology companies in technology growth centers” evaluated the effective factors on establishment of knowledge management and found that the companies established in technology growth centers had empowerment to implement knowledge management at good level. Some components as leadership and managerial support, organizational strategies, access to resources, management of human resources, infrastructures and IT to establish knowledge management are at good level.
Study Questions
The present study applies a main question and five minor questions.
Main question
How is the preparedness of National Iranian South Oilfields Company- Procurement and Goods Management in establishment of knowledge management with EFQM model?
Sub questions
First sub-question How is the preparedness ofleadership of National Iranian South Oilfields Company- Procurement and Goods Management in establishment of knowledge management?
Second sub-question How is the preparedness of policy and strategy of National Iranian South Oilfields Company- Procurement and Goods Management in establishment of knowledge management?Third sub-question How is the preparedness of human resources of National Iranian South Oilfields Company- Procurement and Goods Management in establishment of knowledge management?
Mohammad Hoseinpour et al.

Indian Journal Of Natural Sciences www.tnsroindia.org. © IJONS
Vol.5 / Issue 30 / June 2015 International Bimonthly ISSN: 0976 – 0997
7499
Fourth sub-question How is the preparedness of partnership and resources of National Iranian South Oilfields Company- Procurement and Goods Management in establishment of knowledge management?
Fifth sub-question How is the preparedness of processes of National Iranian South Oilfields Company- Procurement and Goods Management in establishment of knowledge management?
Study population, study sample and sampling method
The number of employees of Procurementand GoodsManagement of National Iranian South Oilfields Company in December 2014 is 469. Based on complex concepts in knowledge management and EFQM organizational model and the need to full perception of participant of these concepts, a population composed of manager, deputies, chiefs of offices, supervisors of sectors and experts of organization are selected and it has good capability to respond the questions of current condition of organization regarding preparedness for knowledge management establishing as 219. This study applies stratified random sampling method. Based on limited study population, to determine the required samples, the following equation is used (Azar and Momeni, 2011).
Formula 1- Sample size determination
Based on above formula, the samples are 140 and the questionnaires are distributed.
Table 1 shows the sample size, population size and number of questionnaires.
Study Method
The present study is descriptive in terms of type and is applied in terms of purpose. The researcher attempts to use observation method and by questionnaire measure and interview with employees regarding preparedness of organization can evaluate for establishing knowledge management.
Data collection method and measure
The present study applies observation, interview and questionnaire for data collection. A researcher-built questionnaire is used in this study and based on EFQM enabler criteria as leadership, policy, strategy, human resources, partnership and resources and processes, the questions are designed to evaluate the preparedness of organization to establish knowledge management. To formulate the questionnaire, the concepts in standard questionnaire of EFQM and knowledge management processes are used. The number of questions and studied fields are consistent with the number of questions of enabler dimensions of EFQM as shown in Table 2.
Besides questionnaire, interview and observation, library, databases and journals are used for data collection. In addition, the papers in conference in Emerald site and presented papers in human sciences research sites are referred and they are used in research enrichment and the list of all books, papers and journals in resources at the end of thesis are based on Persian, English and alphabet order.
Mohammad Hoseinpour et al.
Indian Journal Of Natural Sciences www.tnsroindia.org. © IJONS
Vol.5 / Issue 30 / June 2015 International Bimonthly ISSN: 0976 – 0997
7500
Reliability of study questionnaire
Cronbach's alpha is used in the present study to evaluate reliability. This index is ranging 0 to 1 and to have high reliability, a measure should have Cronbach’s alpha higher than 0.7 (Momeni, 2008). The reliability of questionnaire is computed by Cronbach's alpha and SPSS software version 22. The results of Cronbach's alpha test for enabler criteria and its five components are shown in Table 3.
Findings Analysis
In this section, after data collection by a questionnaire and descriptive statistics, the data are classified and summarized. For analysis of each of enabler criteria, the questions are classified in questionnaires and are presented separately in a Table and numerical value of choices are computed and the answers with four-item scale are defined and their mean and standard deviation are obtained. The results of table of evaluation of preparedness of Procurementand GoodsManagement for establishment of knowledge management with EFQM model showed that processes criterion with 43.36 showed the highest percent and partnership and resources with 34.87 showed the lowest percentage of preparedness in establishment of knowledge management. The results of scores of each of enabler criteria for knowledge management establishment are shown in Table 4.
In this Table, choice D means that no work is started and coefficient zero is considered for it. Choice C means little progress and coefficient 1 is considered for it. Choice B means considerable progress and coefficient 2 and in choice A, completely is considered and coefficient 3 is considered for it. Values 100, 30 are used to turn the formula to percent and 130 is the number of study samples responding to the questionnaire. If the percent of scores is achieved, EFQM model enablers’ criteria to establish knowledge management in organization from the highest preparedness to lowest are ordered. The following result is achieved:
Processes criterion 43.36%
Policy and strategy criterion 41.73%
Leadership criterion 38.30%
Human resources criterion, 36.92%
Partnerships and resources criterion, 34.87%
To establish knowledge management, Procurement and Goods Management organization should consider enabler components with high preparedness and enabler components with low preparedness. The preparedness of enabler components of EFQM model to establish knowledge management in Procurement and GoodsManagement is shown in Chart 1.
Responding the study questions
To respond the study questions, the score of each of enabler criteria is evaluated with good score and if the score is good, criterion preparedness is good and if it is higher than good score, it is higher than good level and if less than good score, the preparedness is less than good level. In other words, if the score is good or higher than it, the criterion has good preparedness to establish knowledge management and if the score is less than good level, the investigated criterion has not good preparedness to establish knowledge management.
Mohammad Hoseinpour et al.
Indian Journal Of Natural Sciences www.tnsroindia.org. © IJONS
Vol.5 / Issue 30 / June 2015 International Bimonthly ISSN: 0976 – 0997
7501
The results of comparison of scores of enabler criteria with good score are shown in Table 5.
First question response
How is the preparedness of leadership of National Iranian South Oilfields Company- Procurement and Goods Management in establishment of knowledge management?
As the achieved score of leadership is less than minimum good score, preparedness of leadership of National Iranian South Oilfields Company- Procurement and Goods Management in establishment of knowledge management is less than good level. In other words, leadership of Procurementand GoodsManagement in establishment of knowledge management has not good preparedness.
Second question response
How is the preparedness of policy and strategyof National Iranian South Oilfields Company- Procurement and Goods Management in establishment of knowledge management?
As the achieved score of policy and strategy is at good level score, preparedness of policy and strategyof National Iranian South Oilfields Company- Procurementand Goods Management in establishment of knowledgemanagementis at good level. In other words, policy and strategy of Procurementand GoodsManagement in establishment of knowledge management has good preparedness.
Third question response
Subquestion3-How is the preparedness of human resourcesof National Iranian South Oilfields Company- Procurement and Goods Management in establishment of knowledge management?
As the achieved score of human resourcesis less than good level score, preparedness of human resourcesof National Iranian South Oilfields Company- Procurement and Goods Management in establishment of knowledgemanagement is less than good level. In other words, human resources of Procurement and Goods Management in establishment of knowledge management havenot good preparedness.
Fourth question response
How is the preparedness of partnership and resources of National Iranian South Oilfields Company- Procurement and Goods Management in establishment of knowledge management?
As the achieved score of partnership and resources is less than good level score, preparedness of partnership and resources of National Iranian South Oilfields Company- Procurement and Goods Management in establishment of knowledge management is less than good level. In other words, partnership and resources of Procurementand GoodsManagement in establishment of knowledge management has not good preparedness.
Mohammad Hoseinpour et al.
Indian Journal Of Natural Sciences www.tnsroindia.org. © IJONS
Vol.5 / Issue 30 / June 2015 International Bimonthly ISSN: 0976 – 0997
7502
Fifth question response
How is the preparedness of processes of National Iranian South Oilfields Company- Procurement and Goods Management in establishment of knowledge management?
As the achieved score of processes is at good level score, preparedness of processes ofNational Iranian South Oilfields Company- Procurement and Goods Management in establishment of knowledge management is at good level. In other words, processes of Procurementand Goods Management in establishment of knowledge management has good preparedness.
Main question response
How is the preparedness of National Iranian South Oilfields Company- Procurement and Goods Management in establishment of knowledge management with EFQM model?
As the achieved score of enablers is less than good level score, preparedness of enablers ofNational Iranian South Oilfields Company- Procurement and Goods Management in establishment of knowledge management with EFQM model is less than good level. In other words, ProcurementandGoods Management in establishment of knowledge management with EFQM approach have not good preparedness.
CONCLUSION
The present study aimed to evaluate the preparedness ofNational Iranian South Oilfields Company- Procurement and Goods Management in establishment of knowledge management with EFQM approach. To evaluate the preparedness of organization to establish knowledge management, enablers of EFQM model are investigated and the achieved scoresfor each of enabler components are compared with goodscore and the following results are achieved. The leadership component of Procurement and Goods management in establishment of knowledge management with score 38.30 is less than good score (40-60) and has not good preparedness. In other words, leadership of Procurement and Goodsmanagement in establishment of knowledge management has not good preparedness. The findings of this study are consistent with the findings of study of Farmanfarmayi and Javadianzade (2005), DastranjMamghani et al., (2009) and study of Hassanzade (2007). Policy and strategy of theorganization in establishment of knowledge management with score 33.46 as good score (48-32) has good preparedness. In other words, policy and strategy of theorganization in establishment of knowledge management has good preparedness. The findings of the study are consistent with the findings of study of Kazemi and Malekzade (2012). Human resources of Procurement and Goods management in establishment of knowledge management with score 33.22 as less than good score (36-54) has not good preparedness. In other words, human resources of theorganizationin establishment of knowledge management has not good preparedness.The findings of study are consistent with the findings of the study in educational sciences and psychology department of Isfahan University in 2007, study of Hassanzade (2007) and study of Dari and Talebnejad (2008). Partnership and resources of the organization in establishment of knowledge management with score 31.38 as less than good score (36-54) has not required preparedness. In other words, the partnership and resources of Procurementand Goods management of National Iranian South Oilfields Companyin establishment of knowledge management has not required preparedness. The findings of the study are consistent with the findings of study of Dari and Talebnejad (2007). Processes of Procurement and GoodsManagement in establishment of knowledge management with score 60.70 has good score (56-84) and has good preparedness. In other words, processes of theorganization in establishment of knowledge management has good preparedness. The findings of study are consistent with the findings of study of Kazemi and Malekzade (2012), the findings of study in educational science and psychology department in Isfahan University in 2007, study of Sajadisini et al., (2007), study of Seyedi et al., (2007) and study of Ravali (2009).
Mohammad Hoseinpour et al.
Indian Journal Of Natural Sciences www.tnsroindia.org. © IJONS
Vol.5 / Issue 30 / June 2015 International Bimonthly ISSN: 0976 – 0997
7503
The enablers of Procurement and GoodsManagement in establishment of knowledge management with score 197.06 as less than good score (200-300) has not good preparedness. In other words, Procurementand GoodsManagement of National Iranian South Oilfields Company in establishment of knowledge management with EFQM model have not good preparedness. The findings of the study are consistent with the findings of study of Farmanfarmayi and Javadianzade (2005), DastranjMamaghani et al., (2009) and Dari and Talebnejad (2008). Based on the evaluation of moderating variables (age. education, organizational position, rank and work experience), the following results are achieved. Among investigated criteria, only regarding leadership, there is a significant difference between people with different ages but for other criteria, there is no significant difference between people with different ages.
Among the investigated criteria, only there is a significant difference regarding policy and strategy among people with different education but there is no significant difference for other criteria among people with different education. Among the investigated criteria, only regarding policy and strategy, there is a significant difference between people with different positions but for other criteria, there is no significant difference between people with different organizational positions. Among the investigated criteria regarding leadership, policy and strategy and processes, there is a significant difference among people with different positions but there is no significant difference for other criteria among various people. Among the investigated criteria, only regarding leadership criterion, there is a significant difference between people with different experiences but there is no significant difference for other criteriaamong people with different work experiences.
Recommendations
In this section of study, based on the results and findings of the study, the recommendations for high preparedness of organization for knowledge management establishment can be presented.
The organization should direct its policy and strategy for optimal use of knowledge resources inside and outside the organization and by moving to knowledge-based organization paves the way to establish knowledge management. The organization should adapt commercial strategy, general goals, operational goals and knowledge management strategies.
To establish knowledge management in organization products or services, the organization can use knowledge management processes and creates a team for control of optimal use of knowledge in presenting the products and services.
The organization can plan the processes as knowledge assets are used in activities and can be used for continuous improvement of processes and identify the opportunities and knowledge requirements.
Top managers should participate in establishing knowledge management and knowledge management processes should be considered in the design of organizational structure. The support and participation of managers of knowledge management processes and emphasizing on it can pave the way for knowledge management establishment.
For successful knowledge management, the organization should perform exact planning regarding human resources. Human resources processes can be taken into attention, the knowledge and competence of employees can be developed. The plans of employees as employment, education, development, etc. should beaccording to knowledge requirements of organization. Regarding knowledge management processes in commercial collaborations, the communication should be developed via a futuristic approach. The organization should allocated financial resources for strategic goals and knowledge management intentions and knowledge activities success can be guaranteed.
Mohammad Hoseinpour et al.
Indian Journal Of Natural Sciences www.tnsroindia.org. © IJONS
Vol.5 / Issue 30 / June 2015 International Bimonthly ISSN: 0976 – 0997
7504
Preparedness of leadership, policy and strategy, human resources, partnership and resources and processes can pave the way for establishment of knowledge management in organization.
Offers and ideas for other researchers
The evaluation of the impact of knowledge management on creativity and innovation
The evaluation of the impact of knowledge management on strategic management of human resources
REFERENCES
1. Afraze.A. (2010).Knowledge management (concepts, models, measurement, implementation). Tehran. Moalef publications.
2. Amiri, M., Sokaki, M., (2008).The guidance of evaluation of performance of organization based on EFQM model by Radar logic. Tehran. Saramad publications.
3. Azar, A., Momeni, M. (2011).The statistics and its application in management.Second Vol. Tehran.SAMT. 4. Chen, C.W.(2011). Modeling And Initiating Knowledge management Program Using FQFD: A Case Study
Involving a Healthcare Institute Springer.Science.Business Media B.V. 5. Dari, B., Talebnejad. A.(2008). The investigation of condition of strategic factors of knowledge creation in
affiliated Universities of science, research and technology ministry. Journal of study and planning in high education, 49: 1-21.
6. DastranjMamaghani, A., Taghafi, F. (2009).The investigation of preparedness of knowledge management in organizations based on effective factors on success of knowledge management.Journal of research of IT in Iran. 3:493-517.
7. Farmanravayi, T., Javadianzade, M.(2005).Establishment of knowledge management by EFQM.Case study of water and Wastewater Company.Water and wastewater organization publications.
8. Gurteen, D. (1999). Creating a knowledge Sharing culture, knowledge Management Magazine, 2:7. 9. Hales, S. (2001). Dimensions knowledge and it's management. Available at: www.Insighting.co .uk. 10. Hassanzade, M. (2007).The infrastructural barriers of knowledge management in Iran.The first national
conference of knowledge management. Iran. Tehran. The center of international conferences of Razi.13-14 Bahman.
11. Hosnavi, R., Akhavan, P. Sanjaghi. M. (2014). Key success factors of knowledge management. Tehran. Atinegar publications.
12. Jafari, M., Akhavan, P., Akhtari, M. (2011).Knowledge management.A full view on tools and techniques. Tehran. Rasa publications.
13. Kazemi, M., Malekzade, Q. (2012). Explanation of effective factors on implementation of knowledge management system in small technology companies located in technology growth centers. Research-scientific journal of future management. 32, 45-62.
14. Khanifar, H., Zarei, Matin. H., Khodaparast. H.(2008).The system of recommendations in organization from theory to application. Tehran. Tehran University applications.
15. Kim, S; Ju, B. (2008). An Analysis of faculty perceptions: Attitudes toward knowledge sharing and collaboration in an academic institution, Journal of Information Science Research, 30, pp: 282-290.
16. King, N. (1999). Knowledge Management: Applying Manufacturing Thoery in knowledge Based Industries. Management Accounting.Vol. 77, No. 3, pp 38- 48.
17. MohebiMoghadam. A.(2008).EFQM model. Executive approaches and techniques. Tehran. YasBehesht publications.
18. Momeni, M.(2008). Statistical analyses by SPSS. Tehran. Ketab No publications. 19. Najmi, M., Hosseini, S. (2009).EFQM model from idea to practice. Tehran: Saramadpublicatiosn
Mohammad Hoseinpour et al.
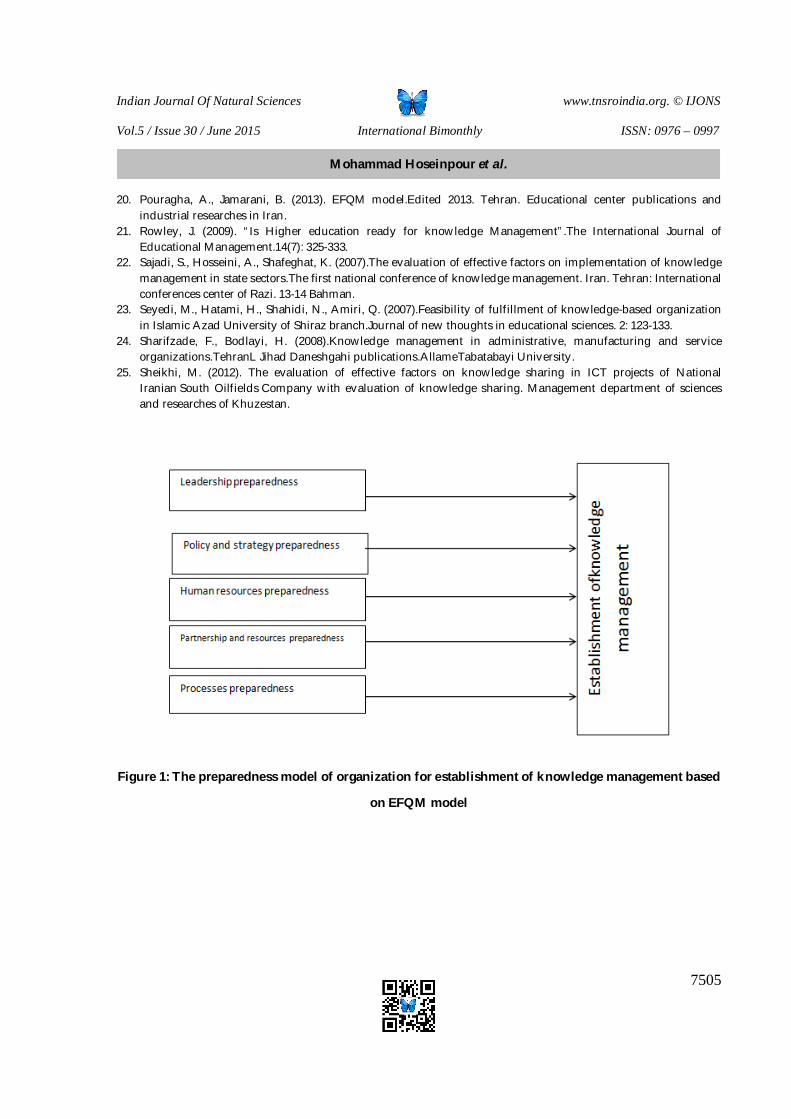
Indian Journal Of Natural Sciences www.tnsroindia.org. © IJONS
Vol.5 / Issue 30 / June 2015 International Bimonthly ISSN: 0976 – 0997
7505
20. Pouragha, A., Jamarani, B. (2013). EFQM model.Edited 2013. Tehran. Educational center publications and industrial researches in Iran.
21. Rowley, J. (2009). “Is Higher education ready for knowledge Management”.The International Journal of Educational Management.14(7): 325-333.
22. Sajadi, S., Hosseini, A., Shafeghat, K. (2007).The evaluation of effective factors on implementation of knowledge management in state sectors.The first national conference of knowledge management. Iran. Tehran: International conferences center of Razi. 13-14 Bahman.
23. Seyedi, M., Hatami, H., Shahidi, N., Amiri, Q. (2007).Feasibility of fulfillment of knowledge-based organization in Islamic Azad University of Shiraz branch.Journal of new thoughts in educational sciences. 2: 123-133.
24. Sharifzade, F., Bodlayi, H. (2008).Knowledge management in administrative, manufacturing and service organizations.TehranL Jihad Daneshgahi publications.AllameTabatabayi University.
25. Sheikhi, M. (2012). The evaluation of effective factors on knowledge sharing in ICT projects of National Iranian South Oilfields Company with evaluation of knowledge sharing. Management department of sciences and researches of Khuzestan.
Figure 1: The preparedness model of organization for establishment of knowledge management based
on EFQM model
Mohammad Hoseinpour et al.
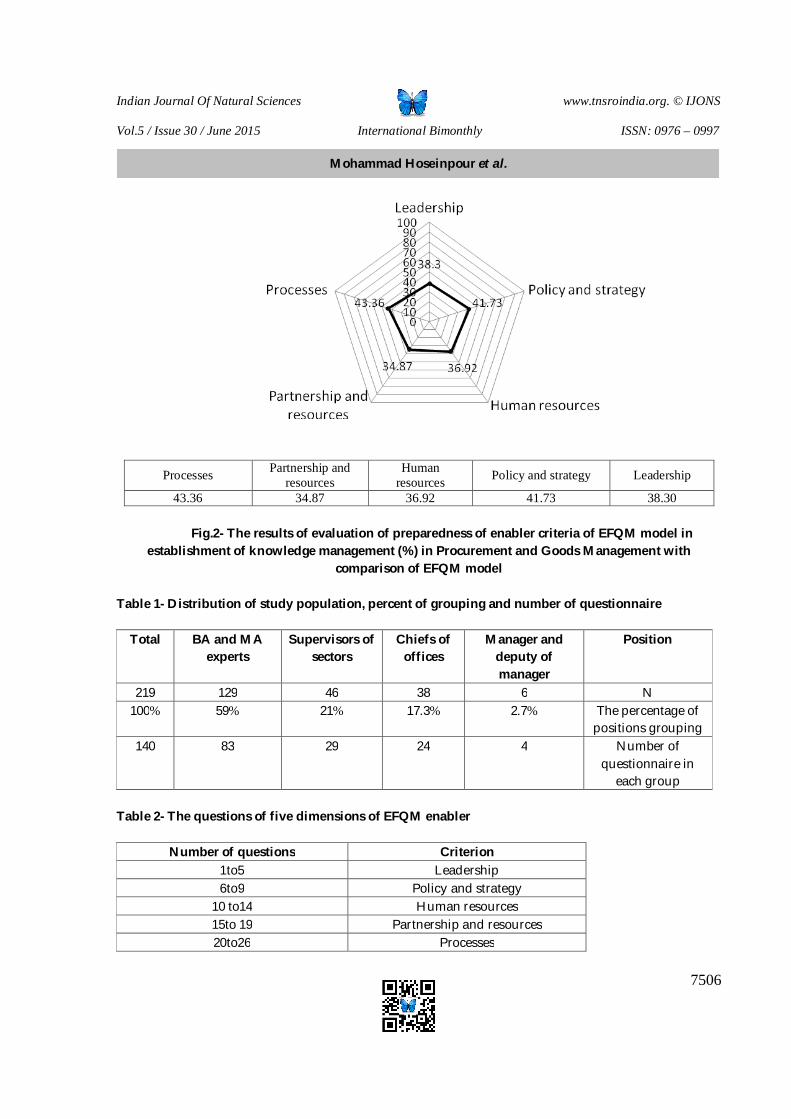
Indian Journal Of Natural Sciences www.tnsroindia.org. © IJONS
Vol.5 / Issue 30 / June 2015 International Bimonthly ISSN: 0976 – 0997
7506
Leadership Policy and strategy Human resources
Partnership and resources Processes
38.30 41.73 36.92 34.87 43.36
Fig.2- The results of evaluation of preparedness of enabler criteria of EFQM model in establishment of knowledge management (%) in Procurement and Goods Management with
comparison of EFQM model
Table 1- Distribution of study population, percent of grouping and number of questionnaire
Position Manager and deputy of manager
Chiefs of offices
Supervisors of sectors
BA and MA experts
Total
N 6 38 46 129 219 The percentage of
positions grouping 2.7% 17.3% 21% 59% 100%
Number of questionnaire in
each group
4 24 29 83 140
Table 2- The questions of five dimensions of EFQM enabler
Criterion Number of questions Leadership 1to5
Policy and strategy 6to9 Human resources 10 to14
Partnership and resources 15to 19 Processes 20to26
Mohammad Hoseinpour et al.
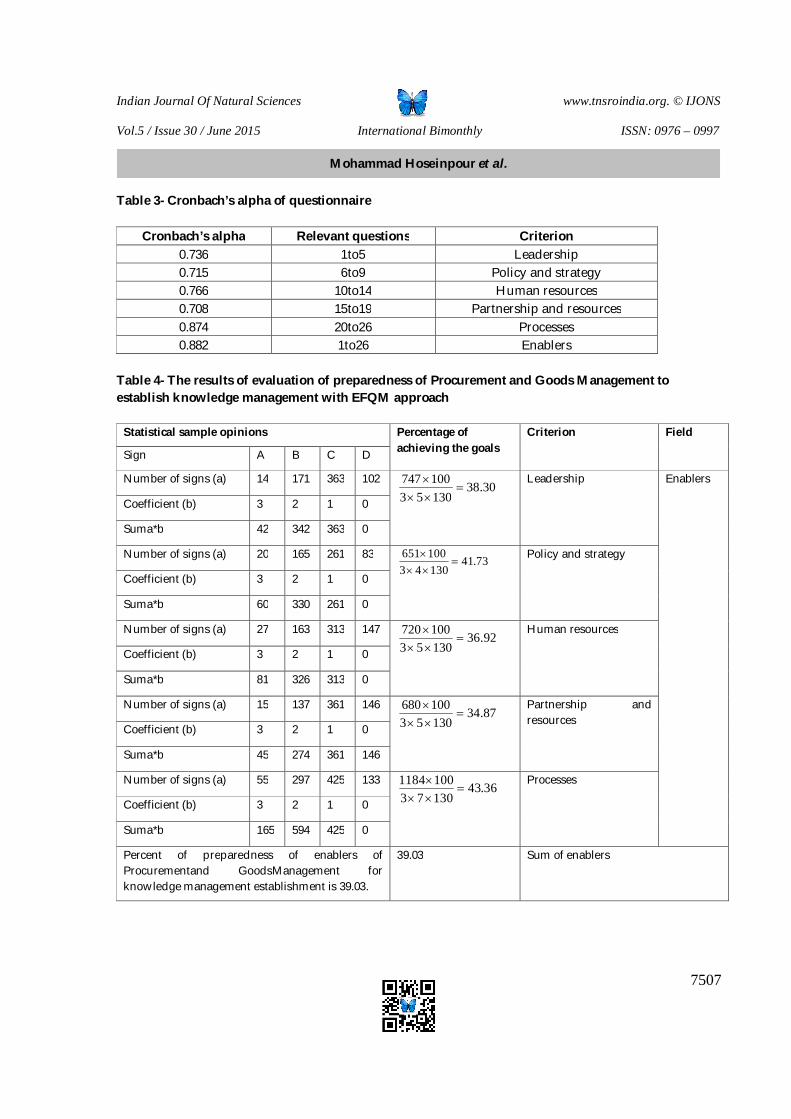
Indian Journal Of Natural Sciences www.tnsroindia.org. © IJONS
Vol.5 / Issue 30 / June 2015 International Bimonthly ISSN: 0976 – 0997
7507
Table 3- Cronbach’s alpha of questionnaire
Criterion Relevant questions Cronbach’s alpha Leadership 1to5 0.736
Policy and strategy 6to9 0.715 Human resources 10to14 0.766
Partnership and resources 15to19 0.708 Processes 20to26 0.874 Enablers 1to26 0.882
Table 4- The results of evaluation of preparedness of Procurement and Goods Management to establish knowledge management with EFQM approach
Field Criterion Percentage of achieving the goals
Statistical sample opinions
D C B A Sign
Enablers Leadership 30.38
13053100747
102 363 171 14 Number of signs (a)
0 1 2 3 Coefficient (b)
0 363 342 42 Suma*b
Policy and strategy 73.4113043100651
83 261 165 20 Number of signs (a)
0 1 2 3 Coefficient (b)
0 261 330 60 Suma*b
Human resources 92.36
13053100720
147 313 163 27 Number of signs (a)
0 1 2 3 Coefficient (b)
0 313 326 81 Suma*b
Partnership and resources 87.34
13053100680
146 361 137 15 Number of signs (a)
0 1 2 3 Coefficient (b)
146 361 274 45 Suma*b
Processes 36.43130731001184
133 425 297 55 Number of signs (a)
0 1 2 3 Coefficient (b)
0 425 594 165 Suma*b
Sum of enablers 39.03 Percent of preparedness of enablers of Procurementand GoodsManagement for knowledge management establishment is 39.03.
Mohammad Hoseinpour et al.
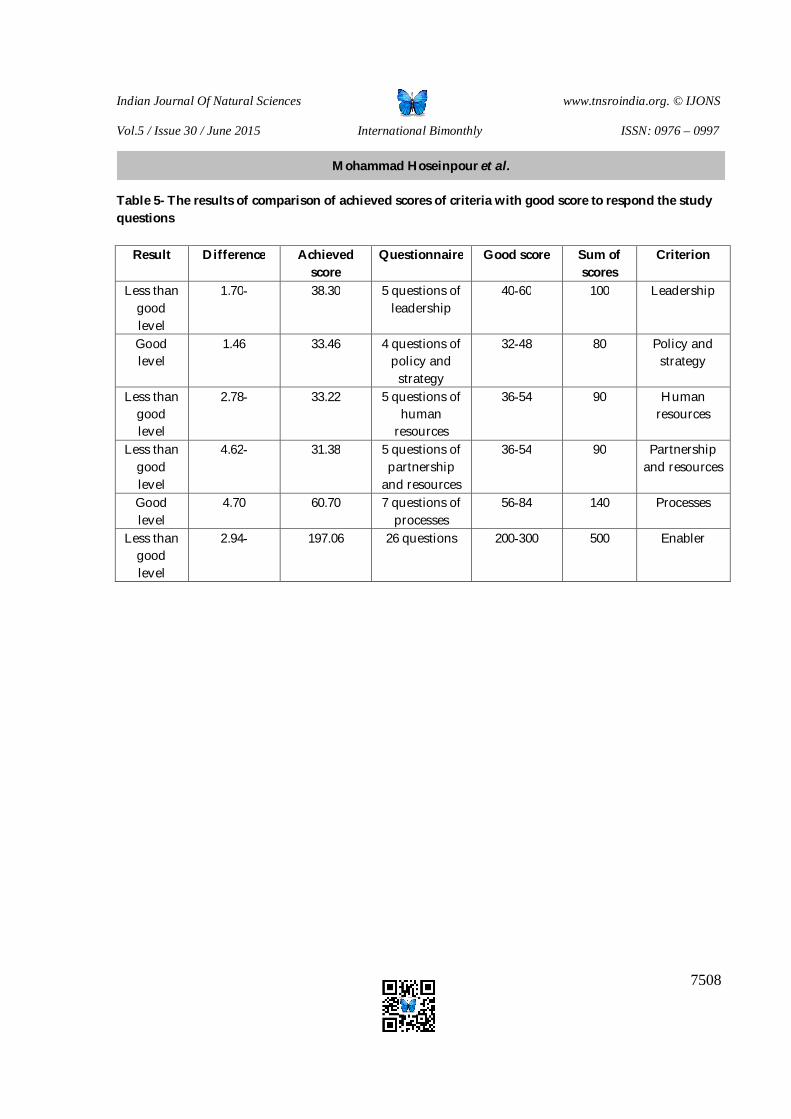
Indian Journal Of Natural Sciences www.tnsroindia.org. © IJONS
Vol.5 / Issue 30 / June 2015 International Bimonthly ISSN: 0976 – 0997
7508
Table 5- The results of comparison of achieved scores of criteria with good score to respond the study questions
Criterion Sum of scores
Good score Questionnaire Achieved score
Difference Result
Leadership 100 40-60 5 questions of leadership
38.30 1.70- Less than good level
Policy and strategy
80 32-48 4 questions of policy and
strategy
33.46 1.46 Good level
Human resources
90 36-54 5 questions of human
resources
33.22 2.78- Less than good level
Partnership and resources
90 36-54 5 questions of partnership
and resources
31.38 4.62- Less than good level
Processes 140 56-84 7 questions of processes
60.70 4.70 Good level
Enabler 500 200-300 26 questions 197.06 2.94- Less than good level
Mohammad Hoseinpour et al.

Indian Journal Of Natural Sciences www.tnsroindia.org. © IJONS
Vol.5 / Issue 30 / June 2015 International Bimonthly ISSN: 0976 – 0997
7509
Anticipating Sources and Expenses of Social Security Organization (SSO) Using Artificial Neural Network (ANN) and Autoregressive Integrated Moving Average (ARIMA) Model Amir Mohammadzadeh1 and Kamran Argountan1*
1Department of Management, Faculty of Accounting and Management, Qazvin Branch, Islamic Azad University, Qazvin, Iran. . Received: 15 Mar 2015 Revised: 16 Apr 2015 Accepted: 28 May 2015 *Address for correspondence Kamran Argountan Department of Management, Faculty of Accounting and Management, Qazvin Branch, Islamic Azad University, Qazvin, Iran.
This is an Open Access Journal / article distributed under the terms of the Creative Commons Attribution License (CC BY-NC-ND 3.0) which permits unrestricted use, distribution, and reproduction in any medium, provided the original work is properly cited. All rights reserved.
There are various statistical models in sciences to anticipate and to classify. The statistical and econometric methods such as regression and time series are used to anticipate and to classify a particular subject in terms of variables and available data. Statistical models are affected by many assumptions and limitations; this is why neural networks are applied recently as a new method of anticipation because there is no need to have assumptions and limitations in data distribution and their higher efficiency. The purpose of this study is to anticipate the sources and expenses of social security organization (SSO)using ArtificialNeural Networks (ANN) and Autoregressive Integrated Moving Average (ARIMA) model. The present study is applied in terms of purpose and descriptive survey based on data collection method. Required data have been collected for the period of1981-2014 from the statistical yearbook and financial statements of SSO. Results of anticipation method comparison showed that Artificial Neural Network (ANN) has superiority to Autoregressive Integrated Moving Average (ARIMA) model.Results of the present study can be used by associated organs especially SSO in planning and decision-making.
Key words: Artificial Neural Networks, Autoregressive Integrated Moving Average model, Sources and expenses of organization.
RESEARCH ARTICLE
ABSTRACT
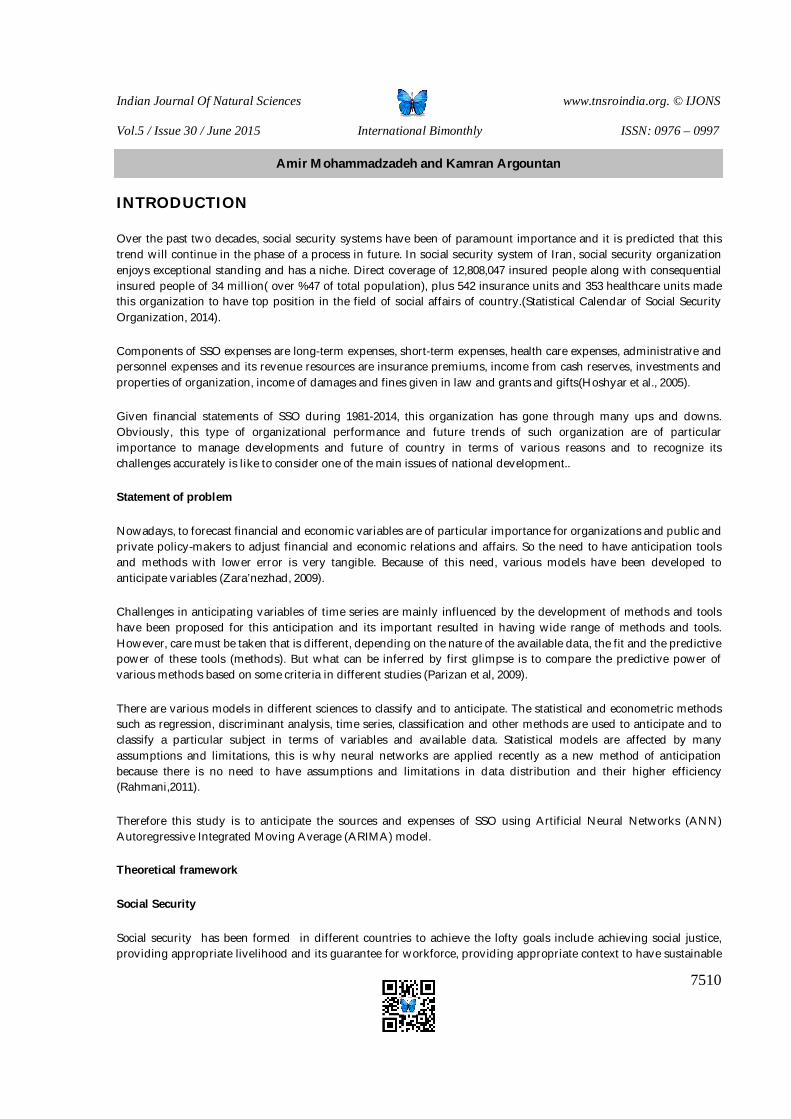
Indian Journal Of Natural Sciences www.tnsroindia.org. © IJONS
Vol.5 / Issue 30 / June 2015 International Bimonthly ISSN: 0976 – 0997
7510
INTRODUCTION
Over the past two decades, social security systems have been of paramount importance and it is predicted that this trend will continue in the phase of a process in future. In social security system of Iran, social security organization enjoys exceptional standing and has a niche. Direct coverage of 12,808,047 insured people along with consequential insured people of 34 million( over %47 of total population), plus 542 insurance units and 353 healthcare units made this organization to have top position in the field of social affairs of country.(Statistical Calendar of Social Security Organization, 2014).
Components of SSO expenses are long-term expenses, short-term expenses, health care expenses, administrative and personnel expenses and its revenue resources are insurance premiums, income from cash reserves, investments and properties of organization, income of damages and fines given in law and grants and gifts(Hoshyar et al., 2005).
Given financial statements of SSO during 1981-2014, this organization has gone through many ups and downs. Obviously, this type of organizational performance and future trends of such organization are of particular importance to manage developments and future of country in terms of various reasons and to recognize its challenges accurately is like to consider one of the main issues of national development..
Statement of problem
Nowadays, to forecast financial and economic variables are of particular importance for organizations and public and private policy-makers to adjust financial and economic relations and affairs. So the need to have anticipation tools and methods with lower error is very tangible. Because of this need, various models have been developed to anticipate variables (Zara’nezhad, 2009).
Challenges in anticipating variables of time series are mainly influenced by the development of methods and tools have been proposed for this anticipation and its important resulted in having wide range of methods and tools. However, care must be taken that is different, depending on the nature of the available data, the fit and the predictive power of these tools (methods). But what can be inferred by first glimpse is to compare the predictive power of various methods based on some criteria in different studies (Parizan et al, 2009).
There are various models in different sciences to classify and to anticipate. The statistical and econometric methods such as regression, discriminant analysis, time series, classification and other methods are used to anticipate and to classify a particular subject in terms of variables and available data. Statistical models are affected by many assumptions and limitations, this is why neural networks are applied recently as a new method of anticipation because there is no need to have assumptions and limitations in data distribution and their higher efficiency (Rahmani,2011).
Therefore this study is to anticipate the sources and expenses of SSO using Artificial Neural Networks (ANN) Autoregressive Integrated Moving Average (ARIMA) model.
Theoretical framework
Social Security
Social security has been formed in different countries to achieve the lofty goals include achieving social justice, providing appropriate livelihood and its guarantee for workforce, providing appropriate context to have sustainable
Amir Mohammadzadeh and Kamran Argountan
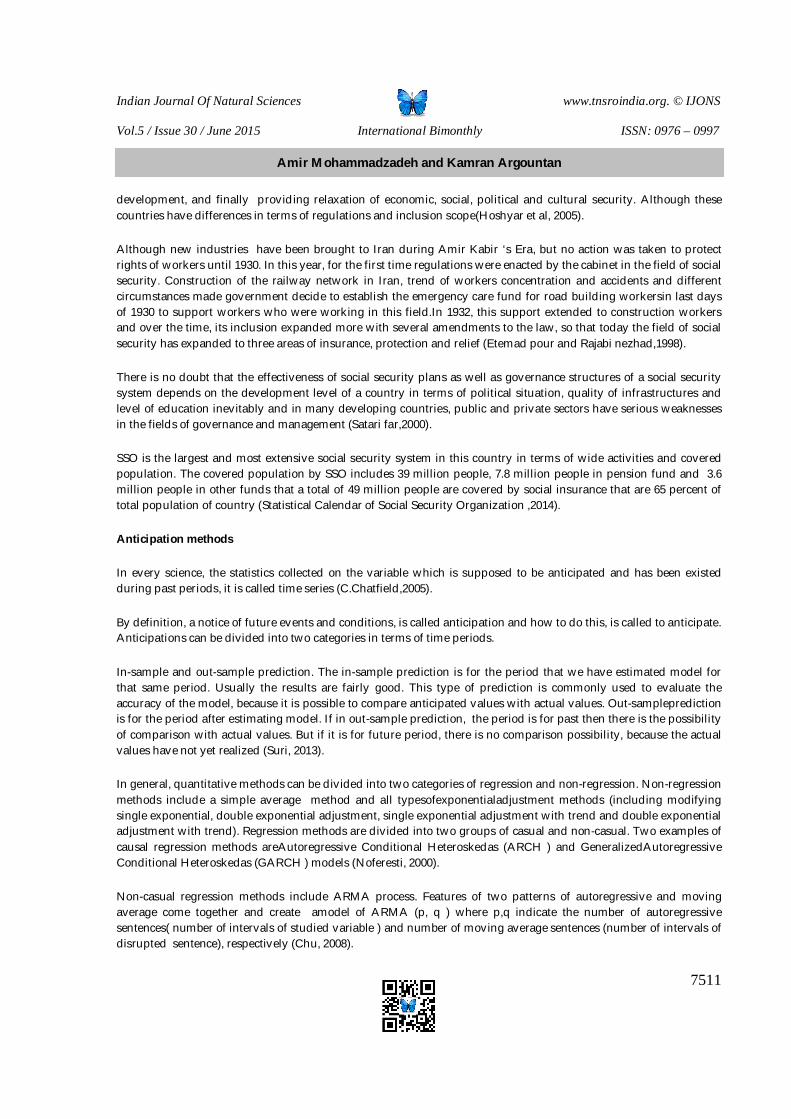
Indian Journal Of Natural Sciences www.tnsroindia.org. © IJONS
Vol.5 / Issue 30 / June 2015 International Bimonthly ISSN: 0976 – 0997
7511
development, and finally providing relaxation of economic, social, political and cultural security. Although these countries have differences in terms of regulations and inclusion scope(Hoshyar et al, 2005).
Although new industries have been brought to Iran during Amir Kabir ‘s Era, but no action was taken to protect rights of workers until 1930. In this year, for the first time regulations were enacted by the cabinet in the field of social security. Construction of the railway network in Iran, trend of workers concentration and accidents and different circumstances made government decide to establish the emergency care fund for road building workersin last days of 1930 to support workers who were working in this field.In 1932, this support extended to construction workers and over the time, its inclusion expanded more with several amendments to the law, so that today the field of social security has expanded to three areas of insurance, protection and relief (Etemad pour and Rajabi nezhad,1998).
There is no doubt that the effectiveness of social security plans as well as governance structures of a social security system depends on the development level of a country in terms of political situation, quality of infrastructures and level of education inevitably and in many developing countries, public and private sectors have serious weaknesses in the fields of governance and management (Satari far,2000).
SSO is the largest and most extensive social security system in this country in terms of wide activities and covered population. The covered population by SSO includes 39 million people, 7.8 million people in pension fund and 3.6 million people in other funds that a total of 49 million people are covered by social insurance that are 65 percent of total population of country (Statistical Calendar of Social Security Organization ,2014).
Anticipation methods
In every science, the statistics collected on the variable which is supposed to be anticipated and has been existed during past periods, it is called time series (C.Chatfield,2005).
By definition, a notice of future events and conditions, is called anticipation and how to do this, is called to anticipate. Anticipations can be divided into two categories in terms of time periods.
In-sample and out-sample prediction. The in-sample prediction is for the period that we have estimated model for that same period. Usually the results are fairly good. This type of prediction is commonly used to evaluate the accuracy of the model, because it is possible to compare anticipated values with actual values. Out-sampleprediction is for the period after estimating model. If in out-sample prediction, the period is for past then there is the possibility of comparison with actual values. But if it is for future period, there is no comparison possibility, because the actual values have not yet realized (Suri, 2013).
In general, quantitative methods can be divided into two categories of regression and non-regression. Non-regression methods include a simple average method and all typesofexponentialadjustment methods (including modifying single exponential, double exponential adjustment, single exponential adjustment with trend and double exponential adjustment with trend). Regression methods are divided into two groups of casual and non-casual. Two examples of causal regression methods areAutoregressive Conditional Heteroskedas (ARCH ) and GeneralizedAutoregressive Conditional Heteroskedas (GARCH ) models (Noferesti, 2000).
Non-casual regression methods include ARMA process. Features of two patterns of autoregressive and moving average come together and create amodel of ARMA (p, q ) where p,q indicate the number of autoregressive sentences( number of intervals of studied variable ) and number of moving average sentences (number of intervals of disrupted sentence), respectively (Chu, 2008).
Amir Mohammadzadeh and Kamran Argountan

Indian Journal Of Natural Sciences www.tnsroindia.org. © IJONS
Vol.5 / Issue 30 / June 2015 International Bimonthly ISSN: 0976 – 0997
7512
Artificial neural networks (ANN)
The term “neural network” refers to a family of models with a large parametric space flexible structure is specified and is inspired by brain studies (Hikin, 1998).
The neural network is a parallel distributed processor that has a natural tendency to store experimental and usable knowledge. In the nervous system, neurons are known as the main elements of processing. Neuron consists of three main parts: cell body (Soma),dendrites and axons. Neuron has some dendrites and an axon. Dendrites act as the electric signalrecipientsandcarry electrical signals from axon of other neurons to cell body .Cell body provides required energy for neuron activity and acts on incoming signals (that is modeled with a simple algebraic sum and comparison with a threshold level). Axons also transmit electrochemical signals from cell body tothedendrites of other neurons. The commissure of an axon from one neuron to dendrites of other neurons is called synapse. Synapses are small units that establish connections between neurons.When neural signals arrive to a neuron from an axon of other neurons, stimulates it. Neuron receives a low voltage by neural signals from each of incoming connections and collects them altogether. If this amount reaches the threshold value, neuron fires and sends an output voltage to its axon and axon may send a signal by synapse to a dendrites of other neurons according to the intensity of voltage or it does not pass any signal because of it is weak ( Maria Norosis,2010).
Figure 1 presents an example of a processing unit with respect to the performance of a neuron. As it can be seen, axons can be resembled tooutput, weight to voltage and inputs to dendrites.
Different neural networks has been developed that we can refer to multi-layer perceptions (MLP), Hopfield network and Kohonens self-organizing network. MLP has been widely used among other networks (Oskuii, 2003).
In the time series predictions, inputs of artificial neural network are observations with time series intervals and network output is their future input value from n. In this case, each educational pattern consistsof a fixed number of observations with series interval. In fact, if past observations are in series, then the artificial neural network formulates following function:
Where y is an observation at t- time. As we can see, in this case artificial neural network is equivalent to autoregressive model in predicting time series. Hf we have N observations y1,y2,…yN in educational center, in order to predict one step forward, the artificial neural network should have n input neuron and N-n educational pattern. First educational pattern consists of y1,y2,…yN as input and yN+1 as desirable output. Second educational pattern consists of y2,y3,…yn+1 as input and yn+2 as desirable output. Finally the last educational pattern consists of yN-n, yN-
n+1,…, yN-1 as input and yNas desirable output (Zara Nezhad et al, 2009).
Performance Evaluation of prediction methods
1.Mean Absolute Deviation (Mean Absolute Error) :This criterion calculates the average of error values regardless of being positive or negative.
Amir Mohammadzadeh and Kamran Argountan

Indian Journal Of Natural Sciences www.tnsroindia.org. © IJONS
Vol.5 / Issue 30 / June 2015 International Bimonthly ISSN: 0976 – 0997
7513
Mean Square Error (MSE): This criterion calculates the average of error value in terms of observations.
Mean Absolute Percentage Error (MAPE): This criterion is of those criteria that have high popularity and is one of the most used non-unit criteria.
Research background
Pradhan and Kumar (2010)used perceptron neural network in order to predict and determine the trend of changes in dollar, euro, pound and yen exchange rates. In this study, the data of exchange rates of mentioned currencies for the period of 1992 -2009 has been used as prediction horizon of next day and next month. Results indicate that neural network is able to predict studied exchange rates with acceptable accuracy.
Wu and Shahidpour (2010) improved the prediction performance of crude oil price by using artificial neural networks in a study.The results of simulation test show that artificial intelligence (AI) method acts better in terms of RMSE and direction statistics ( Dstat) and this shows that AI has a good performance in predicting crude oil price according to complexities of crude oil market.Sozen et al (2007) considered to develop a neural network model to predict consumption of oil products in Turkey. They designed three various models in which different variables have been used and finally selected an appropriate model to predict consumption of oil products in Turkey by using error criteria.
Malekian et al (2014) evaluated the use of artificial neural network in prediction and simulation of the climate index of meteorological drought rainfall decilesinSistanBaluchestan province. The results showed that artificial neural network is able to predict drought index based on rainfall decileswith a correlation of 97% and an average error of less than 5%. The prediction results of drought index in terms of rainfall deciles indicate that the drought has increased in general during 2010-2013.
Mohammad zadeh et al (2011) examined the prediction of last price of water using neural network in Esfahan municipality. The results show the better performance of neural network than regressive methods.
Ghadimi&Moshiri (2003) examined modeling and prediction of economic growth in Iran using artificial neural network. In this study, artificial neural network efficiency has been compared with efficiency of alinear regression model to predict economic growth of Iran. Results show better performance of neural network than other methods.
METHODOLOGY
Since the objective of this studyis to predictsources and expenses of SSO, therefore an applied research is based on archival information in terms of objective and it is descriptive survey in terms of method. The data needed to predict the sources and expenses of organization extracted from financial statements of SSO during 1981 to 2014.In order to
Amir Mohammadzadeh and Kamran Argountan

Indian Journal Of Natural Sciences www.tnsroindia.org. © IJONS
Vol.5 / Issue 30 / June 2015 International Bimonthly ISSN: 0976 – 0997
7514
model the prediction of neural networks, proforecaster-2014R1 software and to model the prediction of ARIMA,SPSS19 have been used.
RESULTS
Given the financial statements of SSOandofficialreports, total revenue resources of this organization has been about 192270 million Rials in 1981 and has reached to 462840819 million Rials in 2014. Income from premiums collected in 1981has been about 180,022 million Rials and has reached to 420088212 million Rials in 2014, incomes from cash reserves, investments and properties of the organization has been about 11417 million Rials in 1981 and has reached to 33127996 million Rials in 2014, incomesfromfines has beenials in 1981 and has reached to 3408317 million Rials in 2014 and incomes from grants and gifts has been about 0 million Rials in 1981 and has reached to 6216294 million Rials in 2014.
Given financial statements of SSO and official reports, total expenses of organization has been about 90815 million Rials in 1981 that has reached to 295701636 million Rials in 2014 and in fact, it has been 3256 times. Short-term liabilities has been 3561 million Rials in 1981 and has reached to 36815929 million Rials in 2014, long-term liabilities has been about 41380 million Rials in 1981 and has reached to 162976617 million Rials in 2014, health care costs has been 37789 million Rials in 1981 and has reached to 53216193 million Rials in 2014 and administrative and personnel costs has been 8085 million Rials in 1981 that has reached to 42692897 million Rials in 2014.
Prediction of revenue resources of SSO using ANN and ARIMA
Table 1 shows the income prediction of SSO by ANN and ARIMA during 2015-2019.
Table 2 shows the results of the artificial neural networks (input layers, latent layers, etc.) and ARIMA (significance level)
In Table 3, the evaluation of prediction models are presented based on revenue resources of SSO in terms of the mean absolute error(MAE), root mean square error (RMSE) and the mean absolute percentage error (MAPE).
As we have seen, the values of MAE,RMSE and MAPE in ANN were less than ARIMA. Therefore, the neural network method has better accuracy.
Prediction of total expenses of SSO using ARIMA
Table 4 shows the prediction of total expenses of SSO during 2015-2019 using ANN and ARIMA.
Table 5 shows the results of artificial neural networks (input layers, latent layers, etc.) and ARIMA (significance level).
Table 6 shows the evaluation of prediction models of total expenses of SSO in terms of MAE, RMSE and MAPE.
As it can be seen, MAE,RMSE and MAPE in ANN are less than ARIMA. Therefore, the neural network method has better accuracy.
Amir Mohammadzadeh and Kamran Argountan
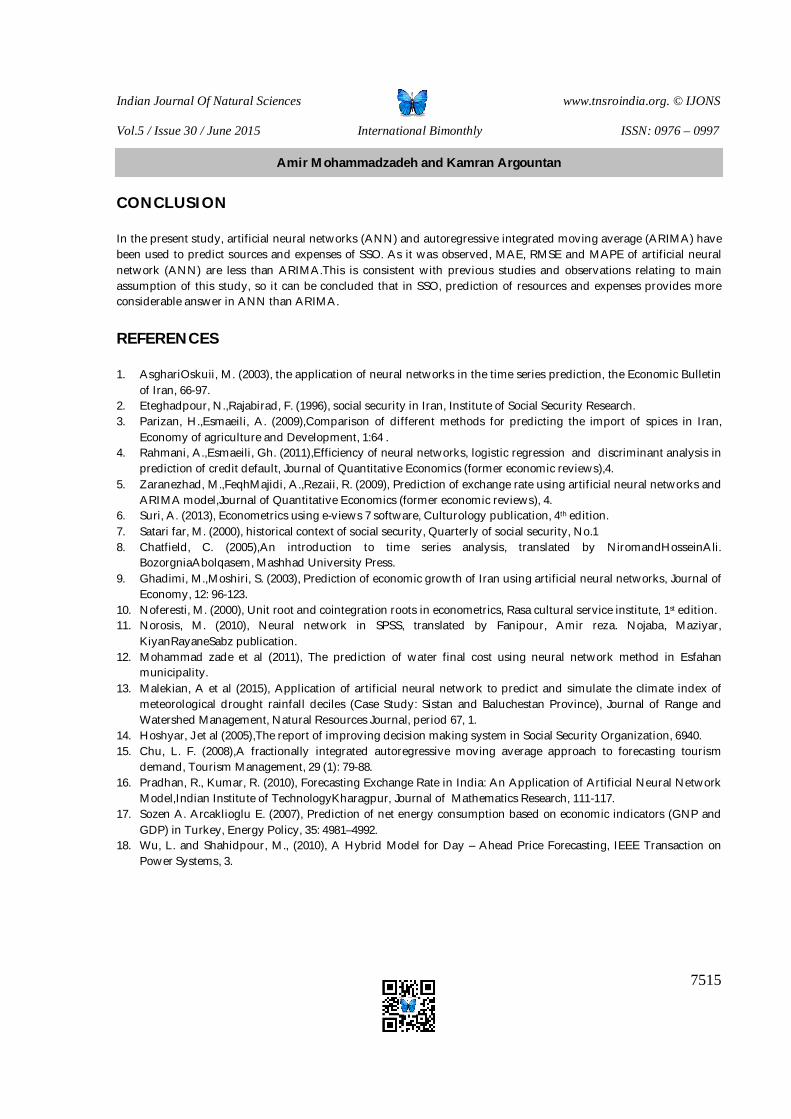
Indian Journal Of Natural Sciences www.tnsroindia.org. © IJONS
Vol.5 / Issue 30 / June 2015 International Bimonthly ISSN: 0976 – 0997
7515
CONCLUSION
In the present study, artificial neural networks (ANN) and autoregressive integrated moving average (ARIMA) have been used to predict sources and expenses of SSO. As it was observed, MAE, RMSE and MAPE of artificial neural network (ANN) are less than ARIMA.This is consistent with previous studies and observations relating to main assumption of this study, so it can be concluded that in SSO, prediction of resources and expenses provides more considerable answer in ANN than ARIMA.
REFERENCES
1. AsghariOskuii, M. (2003), the application of neural networks in the time series prediction, the Economic Bulletin of Iran, 66-97.
2. Eteghadpour, N.,Rajabirad, F. (1996), social security in Iran, Institute of Social Security Research. 3. Parizan, H.,Esmaeili, A. (2009),Comparison of different methods for predicting the import of spices in Iran,
Economy of agriculture and Development, 1:64 . 4. Rahmani, A.,Esmaeili, Gh. (2011),Efficiency of neural networks, logistic regression and discriminant analysis in
prediction of credit default, Journal of Quantitative Economics (former economic reviews),4. 5. Zaranezhad, M.,FeqhMajidi, A.,Rezaii, R. (2009), Prediction of exchange rate using artificial neural networks and
ARIMA model,Journal of Quantitative Economics (former economic reviews), 4. 6. Suri, A. (2013), Econometrics using e-views 7 software, Culturology publication, 4th edition. 7. Satari far, M. (2000), historical context of social security, Quarterly of social security, No.1 8. Chatfield, C. (2005),An introduction to time series analysis, translated by NiromandHosseinAli.
BozorgniaAbolqasem, Mashhad University Press. 9. Ghadimi, M.,Moshiri, S. (2003), Prediction of economic growth of Iran using artificial neural networks, Journal of
Economy, 12: 96-123. 10. Noferesti, M. (2000), Unit root and cointegration roots in econometrics, Rasa cultural service institute, 1st edition. 11. Norosis, M. (2010), Neural network in SPSS, translated by Fanipour, Amir reza. Nojaba, Maziyar,
KiyanRayaneSabz publication. 12. Mohammad zade et al (2011), The prediction of water final cost using neural network method in Esfahan
municipality. 13. Malekian, A et al (2015), Application of artificial neural network to predict and simulate the climate index of
meteorological drought rainfall deciles (Case Study: Sistan and Baluchestan Province), Journal of Range and Watershed Management, Natural Resources Journal, period 67, 1.
14. Hoshyar, J et al (2005),The report of improving decision making system in Social Security Organization, 6940. 15. Chu, L. F. (2008),A fractionally integrated autoregressive moving average approach to forecasting tourism
demand, Tourism Management, 29 (1): 79-88. 16. Pradhan, R., Kumar, R. (2010), Forecasting Exchange Rate in India: An Application of Artificial Neural Network
Model,Indian Institute of TechnologyKharagpur, Journal of Mathematics Research, 111-117. 17. Sozen A. Arcaklioglu E. (2007), Prediction of net energy consumption based on economic indicators (GNP and
GDP) in Turkey, Energy Policy, 35: 4981–4992. 18. Wu, L. and Shahidpour, M., (2010), A Hybrid Model for Day – Ahead Price Forecasting, IEEE Transaction on
Power Systems, 3.
Amir Mohammadzadeh and Kamran Argountan
Indian Journal Of Natural Sciences www.tnsroindia.org. © IJONS
Vol.5 / Issue 30 / June 2015 International Bimonthly ISSN: 0976 – 0997
7516
Figure 1: structure of an artificial neural neuron
Figure2. Sources of income of SSO (1981-2014)
Figure3.Expenses of SSO (1981-2014)
Amir Mohammadzadeh and Kamran Argountan
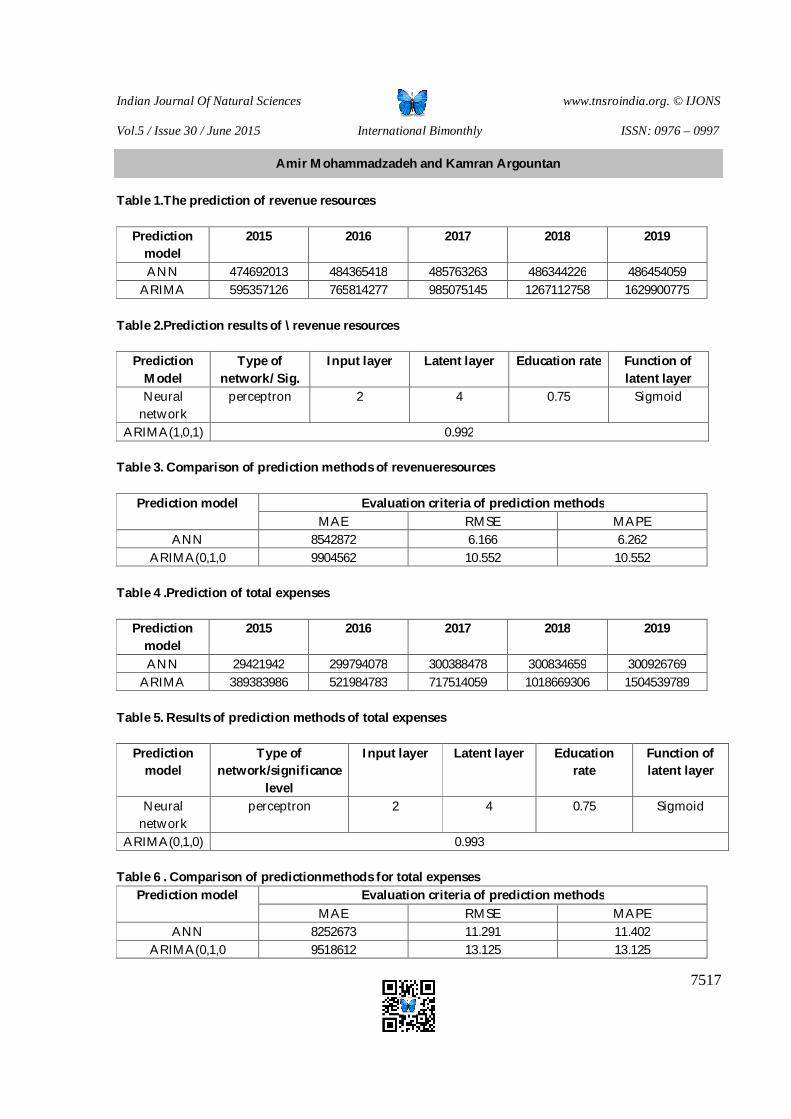
Indian Journal Of Natural Sciences www.tnsroindia.org. © IJONS
Vol.5 / Issue 30 / June 2015 International Bimonthly ISSN: 0976 – 0997
7517
Table 1.The prediction of revenue resources
Prediction model
2015 2016 2017 2018 2019
ANN 474692013 484365418 485763263 486344226 486454059 ARIMA 595357126 765814277 985075145 1267112758 1629900775
Table 2.Prediction results of \ revenue resources
Prediction Model
Type of network/ Sig.
Input layer Latent layer Education rate Function of latent layer
Neural network
perceptron 2 4 0.75 Sigmoid
ARIMA(1,0,1) 0.992 Table 3. Comparison of prediction methods of revenueresources
Prediction model Evaluation criteria of prediction methods MAE RMSE MAPE
ANN 8542872 6.166 6.262 ARIMA(0,1,0 9904562 10.552 10.552
Table 4 .Prediction of total expenses
Prediction model
2015 2016 2017 2018 2019
ANN 29421942 299794078 300388478 300834659 300926769 ARIMA 389383986 521984783 717514059 1018669306 1504539789
Table 5. Results of prediction methods of total expenses
Prediction model
Type of network/significance
level
Input layer Latent layer Education rate
Function of latent layer
Neural network
perceptron 2 4 0.75 Sigmoid
ARIMA(0,1,0) 0.993 Table 6 . Comparison of predictionmethods for total expenses
Prediction model Evaluation criteria of prediction methods MAE RMSE MAPE
ANN 8252673 11.291 11.402 ARIMA(0,1,0 9518612 13.125 13.125
Amir Mohammadzadeh and Kamran Argountan
Indian Journal Of Natural Sciences www.tnsroindia.org. © IJONS
Vol.5 / Issue 30 / June 2015 International Bimonthly ISSN: 0976 – 0997
7518
A Survey of the Relationship between the Dimensions of Organization Structure and Empowerment of Employees Zahra Akhoundzadeh1* and Asghar Alam Tabriz2
1Department of Business Management, Islamic Azad University, Buin Zahra Branch, Islamic Azad University, Iran 2Assist Professor of Mohit Zist University, Iran. Received: 15 Mar 2015 Revised: 16 Apr 2015 Accepted: 29 May 2015 *Address for correspondence Zahra Akhoundzadeh Department of Business Management, Islamic Azad University, Buin Zahra Branch, Islamic Azad University, Iran
This is an Open Access Journal / article distributed under the terms of the Creative Commons Attribution License (CC BY-NC-ND 3.0) which permits unrestricted use, distribution, and reproduction in any medium, provided the original work is properly cited. All rights reserved.
The present study is applied in terms of purpose and descriptive-survey in terms of data collection. The study population is central building of Mahan airline in the west of Tehran city with the number of sale staffs as 80. The sampling method is systematic sampling method and is applied as the main measure of study of psychological empowerment questionnaire of Spritzer and organizational structure questionnaire investigating formality, complexity and centralization in organization. The reliability of Spritser empowerment questionnaire was achieved above 0.91 by Cronbach’s alpha and SPSS software by Abdollahi (2005) and the computed alpha for the questions of organizational structure was 0.81 and it showed the reliability of questionnaire to investigate the required item and Pearson correlation coefficient was used for hypothesis test and to study significant difference between the mean of organizational structure items, ANOVA test was used. All the tests are performed by SPSS software. There was a positive, direct and significant association between employees’ empowerment, organizational structure, structure centralization and employees’ empowerment, organization formality and empowerment between employees and complexity and empowerment of all employees.
Key words: Empowerment, Mahan airline, Organizational structure dimensions.
RESEARCH ARTICLE
ABSTRACT
Indian Journal Of Natural Sciences www.tnsroindia.org. © IJONS
Vol.5 / Issue 30 / June 2015 International Bimonthly ISSN: 0976 – 0997
7519
INTRODUCTION
The most important component of organization is human resources guiding a country to development goals. Correct use of human resources as the most valuable and greatest wealth of society is mostly considered by governments. In other words, we can say human being is the goal of development and its factor and fulfillment of development goals is mostly dependent upon the management of this vital source (PeimanHasri, 2011:1). According to the report of management and planning in seven programs of administrative system change, the share of human resources in production in Japan is 885, in Germany 85% and the share of Islamic Republic of Iran is 33%. A deep review of these statistics shows that we can consider human factor mostly. The most important consideration to human resources is their empowerment. According to Spritzer, empowerment like fundamental change of traditional hierarchy structure is to the challenging structure of contemporary organizations. From psychological aspect, it is mutual process in which people can control their life and the change of social structure in organization is the required not adequate condition for personal behavior change (Spritzer, 1995). The empowerment of employees is an important factor affecting the behavior of employees to create profitability in organization. Most of organizations attempt to keep their work efficiency and productivity by employees empowerment and more committed employees are developed. Today, by growth of organizations, the organizational structure has a definite and logical framework. Organizational structure with operational , management and mission and organization strategy can be associated and they have direct relation with human resources. In other words, organizational structure is associated with human resources via moderating variables. Airline companies are encountered with local and international competitive market and not achieving competitive advantage means elimination from business world. Generalizing this legalization is true for airline companies including Mahan airplane. One of the factors in achieving competitive advantage is having empowered employees. One of the tools helping Mahan company to use these empowerments is organizational structure. Organizational structure not only facilitates using employees’ empowerment, but also it is a good factor to increase empowerment. The researcher in this study investigates the relationship between organizational structure for employees empowerment. The indirect association of structure and human resources can affect various dimensions of human resources as employment, improvement, maintenance and using and as this study attempts to investigate the impact of structure and various dimensions of empowerment, empowerment issue is one of the minor duties of improvement. The relationship between structure and human resources is evaluated mostly in terms of empowerment.
Theoretical Basics
According to AmitayEtzioni, our society, our community is an organizational society. We start in organization, grow, learn, work, marry and continue our survival and die in organization. In civilization of human communities, a few examples can be found to have long history than social organizations. Thus, scientific recognition of this complex phenomenon requires analysis of organizational structure and various operational processes or functions (PesaranGhader, 2001:58). Organization has various definitions as classification of people in systematic forms as their efforts in a varied environment is a tool to achieve organization goals (Irannejad, 2001, 203). According to another definition, organization is a social phenomenon as coordinated consciously, with definite limits acting to fulfill goal or goals based on permanent basics (Robins, 2000, 23). The goal or goals of organization are a) Internal organizational goals, the profit for capital owners, fulfillment of the needs of organization employees and achieving success for management, b) External organizational goals, and the mission that organization is created for it, human resources and hierarchy. Organizational structure is defined and classified by various methods, first based on the difference of organizations in centralization or non-centralization, second based on pure structure including global range, global branches, global products sector, geographical regions and matrix regions, third classic organizational structures as duty, project and matrix group, fourth based on mechanic or organic and each of these divisions are defined based on the differences in allocation of duties among the organization sectors and decision making power. The organizational structure is decision making about duties to sectors, power and some of coordination mechanisms and briefly, duties
Zahra Akhoundzadeh and Asghar Alam Tabriz
Indian Journal Of Natural Sciences www.tnsroindia.org. © IJONS
Vol.5 / Issue 30 / June 2015 International Bimonthly ISSN: 0976 – 0997
7520
classification structure is along with performing the task (Australian Journal of basic and applied science, 2012, 128). Today, no organization without empowered employees and annual listing of educational needs can not continue life. Empowerment is neither duty, nor the end of a work, it is the process of becoming and it should be considered as a part of organizational culture. The researches show that by performing empowerment and continuity of training employees, we can achieve organization goals easily. One of the benefits of empowerment is increasing profit, quality, customer satisfaction, belonging and ownership of employees to organization, improvement of work conditions and reduction of costs, waste, neural pressure, accidents, direct supervision of supervisor. Empowerment is a permanent movement and its importance is increasing. The goal of empowerment is to active brains of people like their arms. The work conditions oblige the managers to empower the employees. Empowerment is good even it is verified by force by managers (Kinla, 2006, 145). Empowerment has important behavioral results. For example, empowerment can increase self-confidence of employees and it increases adaptability of employees and they can fulfill the customers need rapidly and waste less time for referring the customer requests to managers.
REVIEW OF LITERATURE
Anderson (2007) in a study as the impact of employees’ empowerment on customers satisfaction and organization performance showed that employees empowerment can improve organization performance. Also, employee’s empowerment can improve productivity. Yagil (2009) performed a study “evaluation of the impact of motivation sources on empowerment improvement of employees and it showed that motivation sources included financial, cultural, political, social and internal resources. The highest impact is regarding the internal resources on improvement of employees’ empowerment as tendency to achievement and power. MA thesis regarding determining the type of bureaucracy based on Mintsberg (2004) by ShabanMoradiAydishe showed that :1- Organizational structure of none of the studied colleges were professional and it was a combination of professional and machine structure and mostly it is inclined to machine structure. 2- Organizational structure of studied organizations had not considerable difference and most of investigated factors were similar in both colleges. 3- The investigations showed that the consistency of structural and content dimensions with professional structure was low and guiding these factors to professionality is necessary. PhDthesisof presenting strategy model based on Iran culture by Hassan Bonyanian, 2006. MA thesis of evaluation of the relationship between organizational culture and complexity of organizational structure by Mehdi Mirazimzade. This study evaluated the relationship between organizational culture features and complexity of organizational structure by questionnaire. The study population is employees of management and planning organization. The results of study showed that the strongest positive and direct relation with complexity was close distance to power center as +0.083. Clarity and lack ambiguity with +0.040, clarity feature with +0.026 was in the third priority and short-term thinking was +0.016. Two features had negative relation with complexity. Matriarchy feature with -0.07 and quantitative view feature with -0.08 with complexity had negative and inverse relation.
Study Model
To evaluate the relationship of organizational structure (structural dimensions) and employees empowerment, psychological empowerment model of human resources of Spritser is used. Figure 1 shows conceptual model of study.
Based on the study model, the hypotheses include
Main hypothesis: There is a relationship between organizational structure(structural dimensions) and employees empowerment.
Zahra Akhoundzadeh and Asghar Alam Tabriz
Indian Journal Of Natural Sciences www.tnsroindia.org. © IJONS
Vol.5 / Issue 30 / June 2015 International Bimonthly ISSN: 0976 – 0997
7521
The present study applied structural dimensions (centralization, formality and complexity) as stated by Robins, the subhypotheses of study are as follows:
First subhypothesis There is an association between centralization and employees empowerment.
Second subhypothesis There is an association between formality and employees empowerment.
Third subhypothesis There is an association between complexity and employees empowerment.
STUDY METHOD
The study method is field. To study the relationship between organizational structure and employees empowerment, survey, descriptive-analytic method is used and the study is correlation.
The study population, sample and sampling method
In the present study, the study population is all employees and managers of Mahan airline as 100. Based on sample size and Kerjicie and Morgan Table, the sample size is 80. Due to lack of collaboration, 5 people we excluded and the sample size was determined 75. The sampling method in this study is systematic sampling method. At first the list of those working is received from the employment section of Mahan Company and then it was selected as 3 to 1 for statistical sample.
Study measure
In this study, questionnaire is used as the main measure of study to deal with the problems of members of study sample. Following the design of basic questions, they are scored by Likert scale. The respondents are evaluated regarding some items. Likert scale includes some items with five choices as very much to very low. The numerical scores are determined as score 1,5 are values of two spectrums and score 3 is the value of average item.
Validity and reliability of study measure
The reliability of Spritzer empowerment questionnaire is achieved by Abdollahi (2005) by Cronbach’s alpha by SPSS software. The calculated alpha of empowerment is 0.91 and the calculated alpha for questions of organizational structure is 0.81 showing the reliability of questionnaire to evaluate the required item.
The data analysis methods
The analysis methods in this study are divided into two types: Descriptive and inferential. The descriptive analysis is as frequency distribution Tables and charts and in inferential analysis, Pearson correlation coefficient is used and to evaluate significance of difference between the means of items, ANOVA test is used. All tests are performed by SPSS software.
STUDY FINDINGS
At first, we have a descriptive report of demographic features. Demographic features include age, education, experience and gender. Based on the results, 44% of respondents were at age group 20-25 years, 24% at age group 26-
Zahra Akhoundzadeh and Asghar Alam Tabriz
Indian Journal Of Natural Sciences www.tnsroindia.org. © IJONS
Vol.5 / Issue 30 / June 2015 International Bimonthly ISSN: 0976 – 0997
7522
30 years, 20% at age group 31-35 years and 12% at age group above 35 years. In terms of evaluation of education, 41.3% of respondents had associate, 42.7% BA and 16% above BA. In terms of experience, 52% of respondents had experience 5 years and less, 25.3% between 6-10 years, 17.3% between 11-15 years and 5.3% more than 15 years and based on gender, 20.0% of respondents were men and 80.0% were women.
The evaluation of the hypotheses test results
By suitable tests, we evaluate the test results and take decisions based on these results to support or reject them. Based on the study hypotheses, it is predicted that there is a significant relationship between organizational structure and employees empowerment. To evaluate the significant relation between the investigated items, the dimensions of organizational structure and employees empowerment, based on interval nature of items, Pearson correlation coefficient is used. Pearson correlation coefficient is ranging +1,-1 and if the value is positive, it means that the changes are occurred at the same direction in both items but if the value is negative, the changes in items are opposite and by the increase of one item, another one is reduced and if the correlation coefficient is zero, there is not significant relation between two items. +1 indicates direct relation of two items and -1 shows the inverse relation of two items. One of the important statistics in support or reject of hypotheses is significance level in the results of tests denoted by sig. Significance level is the basis of their analysis for the significance of result and relation of items. If significance level is smaller than 0.01, by confidence interval 99%, the result is explained and if it is smaller than 0.05, the result is explained with confidence 95%.
Main hypothesis: As shown in Table 1, positive sign of correlation coefficient indicates the direct and positive relation between two items, As significance level is smaller than 0.05 (sig<0.05), the significant relation between two items is explained with confidence 95%. Later, we investigate the relationship between structure dimensions with empowerment items.
As shown in Table 2, significance of correlation coefficient between two items shows that there is a significant relation between empowerment and organizational structure. As significance level is smaller than 0.05, in the relationship between organizational structure and meaning of job and competence, the relation between two items by confidence 95% and due to small significance level between choice and effectiveness of 0.01, there is a significant relation between two items and organizational structure with confidence 99%.
Here, we evaluate the significant difference between empowerment regarding organizational structure. Based on the results of ANOVA test, and small significance level in all items of 0.01, by confidence 99%, there is a significant difference between the mean of empowerment compared to organizational structure.
First subhypothesis: As shown in Table 4, as correlation coefficient of centralization and empowerment is +0.349, there is a direct relation between two items and as significance level is smaller than 0.05, the relationship is explained with confidence 95%.
As shown in Table 5, based on significant relation between two items, the significance level in choice is 0.015 smaller than 0.05 and effectiveness item is smaller than 0.01. Thus, we can say there is a significant relation between these two items and centralization of organizational structure dimensions.
Based on the results of ANOVA test, there is a relation between the mean of competence, choice and effectiveness of empowerment dimensions in complexity dimension of organizational structure due to small significant level from 0.01 and by confidence 99%, we can explain the significant difference between the items. In significance dimension, due to small significance level of 0.05, there is a significant difference with other items in centralization with confidence 95%.
Zahra Akhoundzadeh and Asghar Alam Tabriz
Indian Journal Of Natural Sciences www.tnsroindia.org. © IJONS
Vol.5 / Issue 30 / June 2015 International Bimonthly ISSN: 0976 – 0997
7523
Second subhypothesis: As shown in Table 7, as correlation coefficient of formality and empowerment is +0.209, there is a direct relation between two items and as significance level is smaller than 0.01, the relationship is explained with confidence 99%.
As shown in Table 8, based on significant relation between two items, the significance level in formality and effectiveness and competence smaller than 0.01, the significant relation between two items is rejected. The correlation coefficient between two items is observed and there is a significant relation between effectiveness and formality of organizational structure dimensions.
Based on the results of ANOVA test, we can say there is a significant difference between the mean of competence, choice and effectiveness of empowerment dimensions in complexity of organizational structure dimensions due to small level of 0.01 and in meaning dimension, as significance level is bigger than 0.05, there is no significant difference with other items in formality dimension.
Third subhypothesis: As shown in Table 10, as correlation coefficient of complexity and empowerment is +0.339, there is a direct relation between two items and as significance level is smaller than 0.01, the relationship is explained with confidence 99%.
As shown in Table 11, based on the result and smaller significance level than 0.01, there is a significant relation between choice and effectiveness with confidence 99% and based on bigger significance level between competence and job meaning and complexity than 0.01, we can say there is no significant relation between two items and complexity.
Here, we evaluate the significant difference between empowerment regarding organizational structure. Based on the results of ANOVA test, there is a significant difference between the mean of meaning, choice, effectiveness of empowerment dimensions in complexity dimension of organizational structure. In competence dimension, as significance level is bigger than 0.05, there is no significant difference with other items in organizational dimension.
CONCLUSION
By evaluation of the results, we can come to the conclusion regarding the support or rejection of study hypotheses. Regarding the main hypothesis of study, as correlation coefficient of the empowerment and organizational structure shows, there is a positive, significant and direct relation between two items. Based on small significant level of 0.05, this result is explained with confidence 95%. Regarding the first subhypothesis, as the correlation coefficient of structure centralization and employees empowerment shows, there is a positive , direct and significant relation between two items. As significance level is smaller than 0.01, this result is explained by confidence 99%. Regarding the second subhypothesis, as correlation coefficient of formality and empowerment shows, there is a positive, direct and significant relation between two items. Based on small significance level of 0.01, this result is explained with confidence 99%. Regarding the third subhypothesis, as the correlation coefficient of complexity and empowerment of employees shows, there is a significant, positive and direct relation between two items and as significance level is smaller than 0.01, this result is explained with confidence 99%.
REFERENCES
1. PesaranQader, M. (2001).Management and organization.Third edition. Tehran. Arghanun publication. 2. Hasri, P. (2011).Empowerment of human resources.Management scientific papers. 1.
Zahra Akhoundzadeh and Asghar Alam Tabriz
Indian Journal Of Natural Sciences www.tnsroindia.org. © IJONS
Vol.5 / Issue 30 / June 2015 International Bimonthly ISSN: 0976 – 0997
7524
3. Abdollahi, B., Nave Ebrahim, A. (2006).Empowerment of employees, golden key of human resources management. Tehran.
4. Spritzer, (1995).Psychological empowerment of Spritzer. 5. Irannejad, M. (2001).Organization and management from theory to practice.Fifth edition. Tehran. High
institution of Iran banking. 203. 6. Robins, S. (2012).The basics of organizational behavior.Translator, QasemKabiri.Fifth edition. Tehran. Islamic
Azad University. 2000. Australian journal of basic and applied sciences. 128. 7. Denis, K. (2006).Empowerment of human resources.Translated by Irannejad, Parizi.Soleimanian.Second edition.
145.
Figure 1- Conceptual model of study
Table 1-The calculation of correlation coefficient between empowerment and organizational Structure
Structural dimensions
Complexity Formality
Centralization
Psychological empowerment
Effectiveness
Meaning Competency
Choice
Zahra Akhoundzadeh and Asghar Alam Tabriz
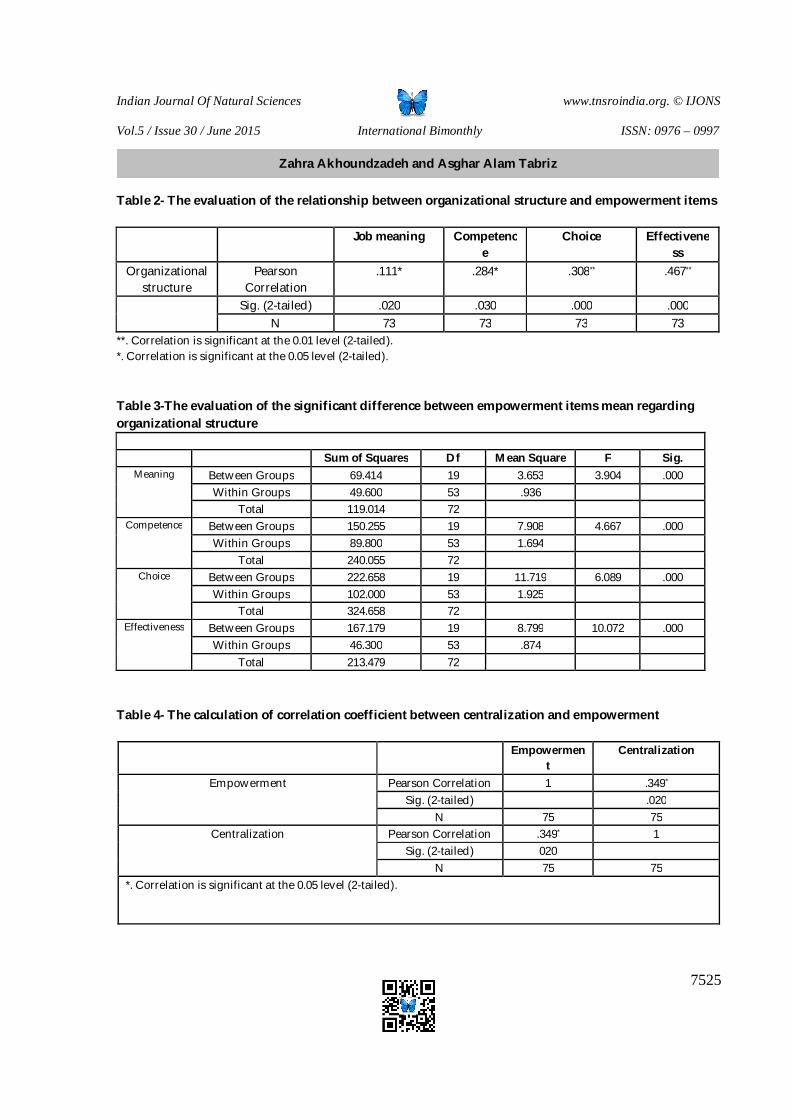
Indian Journal Of Natural Sciences www.tnsroindia.org. © IJONS
Vol.5 / Issue 30 / June 2015 International Bimonthly ISSN: 0976 – 0997
7525
Table 2- The evaluation of the relationship between organizational structure and empowerment items
Job meaning Competence
Choice Effectiveness
Organizational structure
Pearson Correlation
.111* .284* .308** .467**
Sig. (2-tailed) .020 .030 .000 .000 N 73 73 73 73
**. Correlation is significant at the 0.01 level (2-tailed). *. Correlation is significant at the 0.05 level (2-tailed). Table 3-The evaluation of the significant difference between empowerment items mean regarding organizational structure
Sum of Squares Df Mean Square F Sig.
Meaning Between Groups 69.414 19 3.653 3.904 .000 Within Groups 49.600 53 .936
Total 119.014 72 Competence Between Groups 150.255 19 7.908 4.667 .000
Within Groups 89.800 53 1.694 Total 240.055 72
Choice Between Groups 222.658 19 11.719 6.089 .000 Within Groups 102.000 53 1.925
Total 324.658 72 Effectiveness Between Groups 167.179 19 8.799 10.072 .000
Within Groups 46.300 53 .874 Total 213.479 72
Table 4- The calculation of correlation coefficient between centralization and empowerment
Empowerment
Centralization
Empowerment Pearson Correlation 1 .349* Sig. (2-tailed) .020
N 75 75 Centralization Pearson Correlation .349* 1
Sig. (2-tailed) 020 N 75 75
*. Correlation is significant at the 0.05 level (2-tailed).
Zahra Akhoundzadeh and Asghar Alam Tabriz
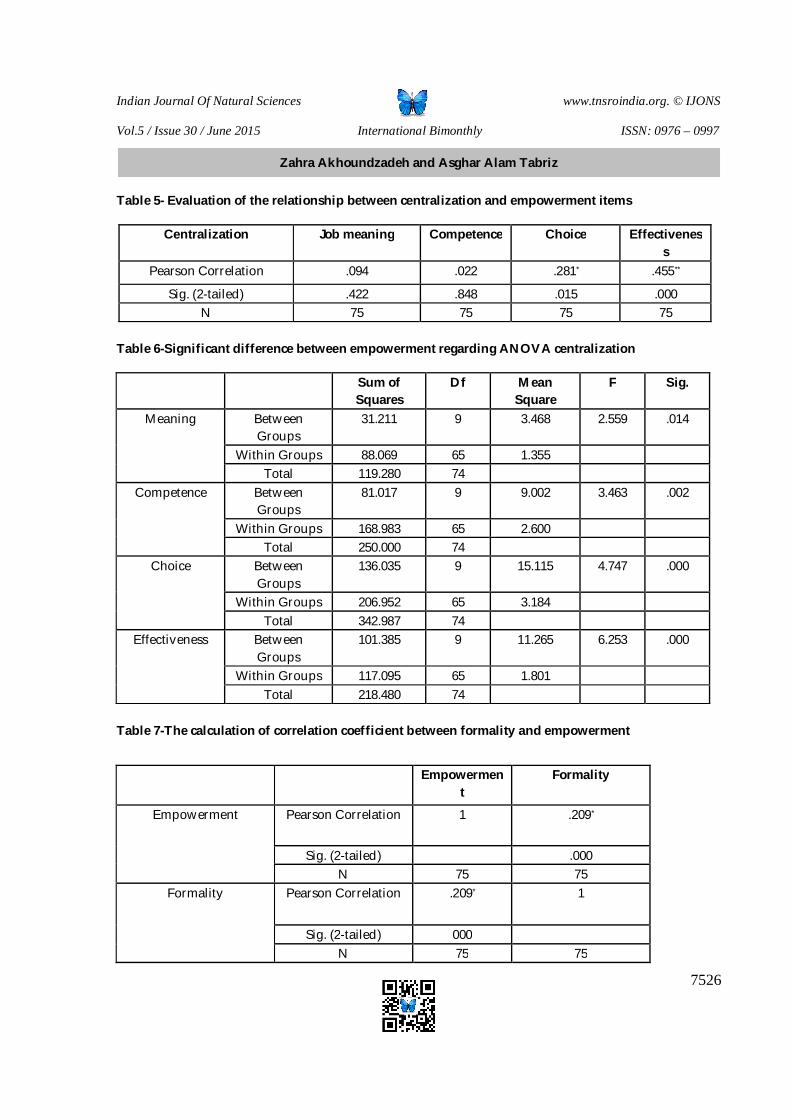
Indian Journal Of Natural Sciences www.tnsroindia.org. © IJONS
Vol.5 / Issue 30 / June 2015 International Bimonthly ISSN: 0976 – 0997
7526
Table 5- Evaluation of the relationship between centralization and empowerment items
Table 6-Significant difference between empowerment regarding ANOVA centralization
Sum of Squares
Df Mean Square
F Sig.
Meaning Between Groups
31.211 9 3.468 2.559 .014
Within Groups 88.069 65 1.355 Total 119.280 74
Competence Between Groups
81.017 9 9.002 3.463 .002
Within Groups 168.983 65 2.600 Total 250.000 74
Choice Between Groups
136.035 9 15.115 4.747 .000
Within Groups 206.952 65 3.184 Total 342.987 74
Effectiveness Between Groups
101.385 9 11.265 6.253 .000
Within Groups 117.095 65 1.801 Total 218.480 74
Table 7-The calculation of correlation coefficient between formality and empowerment
Centralization Job meaning Competence Choice Effectiveness
Pearson Correlation .094 .022 .281* .455**
Sig. (2-tailed) .422 .848 .015 .000 N 75 75 75 75
Empowerment
Formality
Empowerment Pearson Correlation 1 .209*
Sig. (2-tailed) .000 N 75 75
Formality Pearson Correlation .209* 1
Sig. (2-tailed) 000 N 75 75
Zahra Akhoundzadeh and Asghar Alam Tabriz
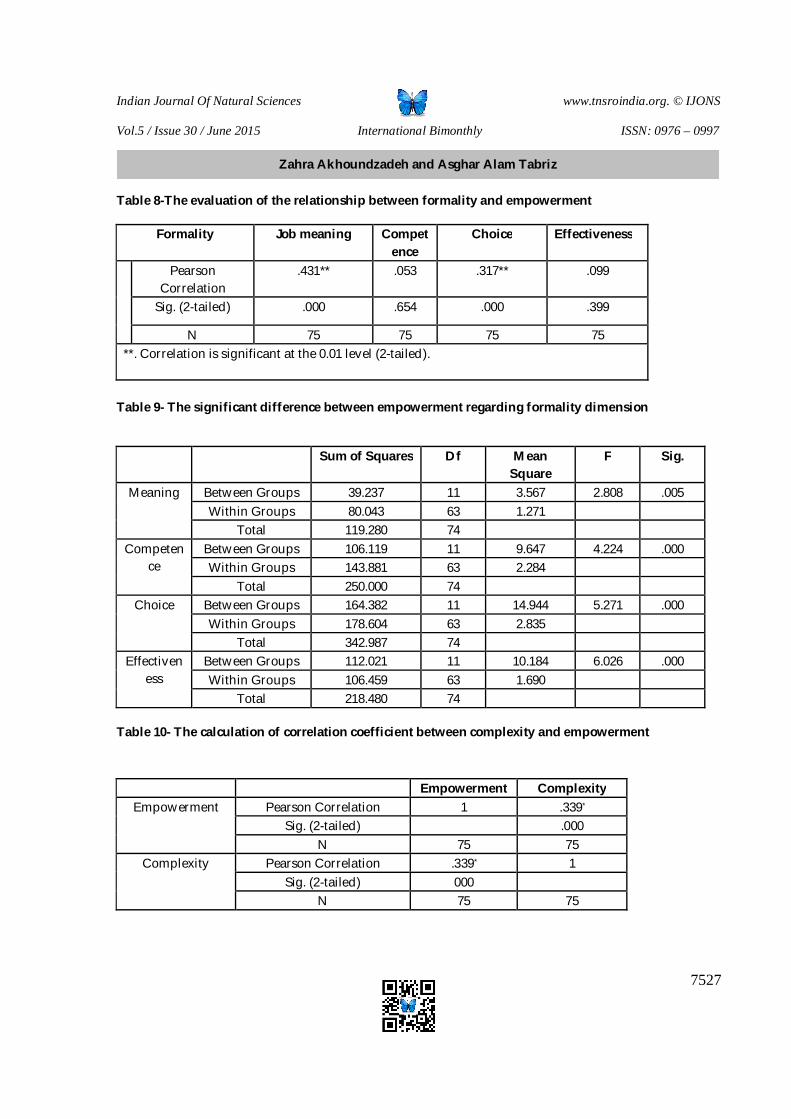
Indian Journal Of Natural Sciences www.tnsroindia.org. © IJONS
Vol.5 / Issue 30 / June 2015 International Bimonthly ISSN: 0976 – 0997
7527
Table 8-The evaluation of the relationship between formality and empowerment
Formality Job meaning Competence
Choice Effectiveness
Pearson Correlation
.431** .053 .317** .099
Sig. (2-tailed) .000 .654 .000 .399
N 75 75 75 75 **. Correlation is significant at the 0.01 level (2-tailed).
Table 9- The significant difference between empowerment regarding formality dimension
Sum of Squares Df Mean Square
F Sig.
Meaning Between Groups 39.237 11 3.567 2.808 .005 Within Groups 80.043 63 1.271
Total 119.280 74 Competen
ce Between Groups 106.119 11 9.647 4.224 .000 Within Groups 143.881 63 2.284
Total 250.000 74 Choice Between Groups 164.382 11 14.944 5.271 .000
Within Groups 178.604 63 2.835 Total 342.987 74
Effectiveness
Between Groups 112.021 11 10.184 6.026 .000 Within Groups 106.459 63 1.690
Total 218.480 74 Table 10- The calculation of correlation coefficient between complexity and empowerment
Empowerment Complexity Empowerment Pearson Correlation 1 .339*
Sig. (2-tailed) .000 N 75 75
Complexity Pearson Correlation .339* 1 Sig. (2-tailed) 000
N 75 75
Zahra Akhoundzadeh and Asghar Alam Tabriz
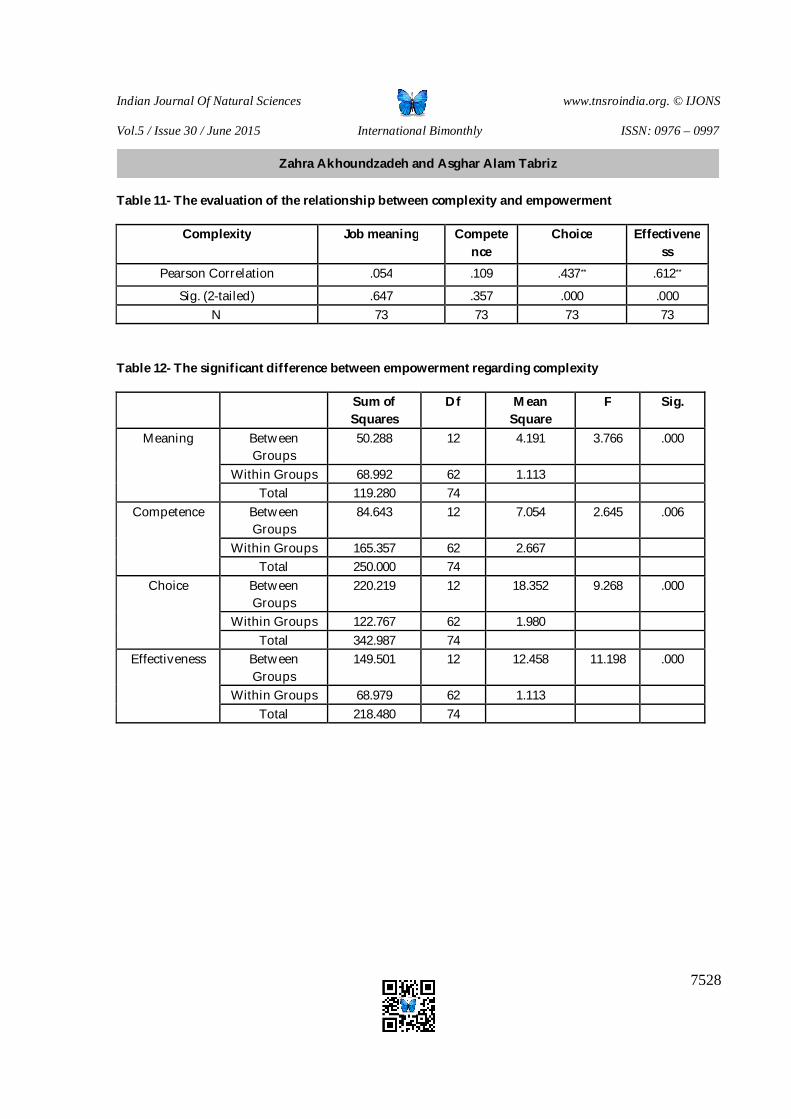
Indian Journal Of Natural Sciences www.tnsroindia.org. © IJONS
Vol.5 / Issue 30 / June 2015 International Bimonthly ISSN: 0976 – 0997
7528
Table 11- The evaluation of the relationship between complexity and empowerment
Complexity Job meaning Competence
Choice Effectiveness
Pearson Correlation .054 .109 .437** .612**
Sig. (2-tailed) .647 .357 .000 .000 N 73 73 73 73
Table 12- The significant difference between empowerment regarding complexity
Sum of Squares
Df Mean Square
F Sig.
Meaning Between Groups
50.288 12 4.191 3.766 .000
Within Groups 68.992 62 1.113 Total 119.280 74
Competence Between Groups
84.643 12 7.054 2.645 .006
Within Groups 165.357 62 2.667 Total 250.000 74
Choice Between Groups
220.219 12 18.352 9.268 .000
Within Groups 122.767 62 1.980 Total 342.987 74
Effectiveness Between Groups
149.501 12 12.458 11.198 .000
Within Groups 68.979 62 1.113 Total 218.480 74
Zahra Akhoundzadeh and Asghar Alam Tabriz

Indian Journal Of Natural Sciences www.tnsroindia.org. © IJONS
Vol.5 / Issue 30 / June 2015 International Bimonthly ISSN: 0976 – 0997
7529
Relationship between Managerial Optimism and Income Smoothing and Profit Surprise Adel Rezae Hadid1 and Roya Darabi2*
1Department of Accounting, College of Humanities, Qom Science and Research Branch, Islamic Azad University, Qom, Iran 2Department of Accounting, Faculty of Management, South Tehran Branch, Islamic Azad University, Tehran, Iran. Received: 15 Mar 2015 Revised: 16 Apr 2015 Accepted: 29 May 2015 *Address for correspondence Roya Darabi Department of Accounting, Faculty of Management, South Tehran Branch, Islamic Azad University, Tehran, Iran.
This is an Open Access Journal / article distributed under the terms of the Creative Commons Attribution License (CC BY-NC-ND 3.0) which permits unrestricted use, distribution, and reproduction in any medium, provided the original work is properly cited. All rights reserved.
Current work investigates relationship between managerialoptimism and income smoothing and profit surprise in Tehran Stock Exchange. To this end, two hypotheses were raised. For testing research hypotheses, data from 97 companies listed in Tehran Stock Exchange were selected using systematic purposive sampling method, and data for time periods between 2009 and 2013 was used for performing statistical test as multipleregressions in SPSS 17 software. Results indicate there is significant inverse relationship between managerial optimism and income smoothing and direct relationship between managerial optimism and profit surprise.
Key words: managerial optimism, income smoothing, profit surprise
INTRODUCTION
Information related to dividend of companies is among information whichareconsidered by users of financial information of companies in their decision making. Meanwhile, any information which is related to the company and associated with the company’s performance and financial status influences dividend. To this end, various research studies have been done on dividend changes in companies and dividend behavior against disclosure of information related to the company has been studied in various methods. It is expected that accounting profit is part of information which is used by investors of risk and return evaluation. Thus, it can be predicated that accounting profit
RESEARCH ARTICLE
ABSTRACT
Indian Journal Of Natural Sciences www.tnsroindia.org. © IJONS
Vol.5 / Issue 30 / June 2015 International Bimonthly ISSN: 0976 – 0997
7530
and specificallyprofit surprise, income smoothing and management optimism toward future profitability of the company during different periods have information content. Also, it is expected that price fluctuations and thus information content of such cases as reactions of investors in comparison with management action and optimisms and comparison of predictions with the reality is done. In the current research, reactions of investors will be differently measured which is known as profit surprise, and it is expected that income smoothing and profit surprise are influenced by managerial optimism (Jeffrey Ng et al., 2012). Bouwman in his work entitled Managerial Optimism and Earnings Smoothing in USA stock Exchange stated that optimism is a skill based on positive expectations which keeps our view toward future situation improvement as stable and optimistic. In other words, optimism is the ability to look the life smartly and reinforcing positive attitudes to life, even in the event of disasters and negative emotions. Optimist people believe that good events are frequent and long term. Bad events are limited and transient. Even solution of a problem is not discovered, they are sure that the solution is implicit somewhere and at least they can at least control the problem, and accordingly it is stated that managerial optimism is when anticipatory profit is greater than Earnings Per Share (EPS). Income smoothing is defined as aware reduction of profit level fluctuations so that the profit of the company seems normal. Managers smooth the income in various reasons. One of the reasons for income smoothing is creating a more stable trend for supporting higher paid profit level. More stable profit trend can be perceived as lower risk which leads to higher stock prices and lower borrowing costs. The other aim of income smoothing is tendency of the business unit management to increase prediction power of investors and reduce company’s risk. Due to increase income stability and reduce its volatility, investors can have more precise predictions about future incomes. The other goal of income smoothing is considerations of political costs, taxes and debt contracts. Bouwman (2014) considered income smoothing resulting from managerial optimism behavior (Bouwman, 2014). Since traditional evaluation criteria of performance such as ROA, TOI, EPS, etc. are all dependent on accounting profit, and net profit has ambiguities such as income smoothing possibility by company’s management for acquisition of higher reward, using estimates in accounting profit calculation like estimation of cost of doubtful receivables, they are disadvantages for voluntary use of acceptable accounting methods. Thus, it is expected that manipulation of accounting profit or income smoothing and profit surprise is influenced by managerial optimism. Current work aims at investigating relationship between managerial optimism and income smoothing and profit surprise.
Theoretical Foundations
Managerial optimism: managerial optimism means increase in forecasted profit of current year, stated by the management, compared to te past year (Bouwman, 2014). One who views everything well and considers good aspect of affairs and people and instead of seeing empty part of the glass (evils) pays attention to full part of the glass (merits) is optimistic person. Considering above, as well as research by Bouwman (2013), managerial optimism in this work means anticipatory profit is greater than Earnings per Share. Optimism is a skill based on positive expectations which keeps our view toward future situation improvement as stable and optimistic. In other words, optimism is the ability to look the life smartly and reinforcing positive attitudes to life, even in the event of disasters and negative emotions. Optimist people believe that good events are frequent and long term. Bad events are limited and transient. Even solution of a problem is not discovered, they are sure that the solution is implicit somewhere and at least they can at least control the problem. Webster dictionary defines optimism as follows: “principles or ideas which indicate reality is essentially food or it seems optimal as much as it is perceivable; or it is tendency toward the most optimal structure against actions and events; it is minimizing adverse aspects, conditions and probabilities or prediction of the best possible outcomes even in confrontation with oppositions. Optimism assumes hope scale in people’s approach and their reliance in their life. Daily life is considered as a positive approach itself. Optimism is contrast to pessimism, which is a symptom of depression” (Goodarzi, 2013). Income smoothing can be defined as method which is used by management for reduction of reported income items’ changes by artificial accounting or real accounting (transactional) so that it reaches to the respective income trend (Badri, 1999). Income smoothing is defined as aware reduction of profit level fluctuations so that the profit of the company seems normal. Managers smooth the income in
Adel Rezae Hadid and Roya Darabi
Indian Journal Of Natural Sciences www.tnsroindia.org. © IJONS
Vol.5 / Issue 30 / June 2015 International Bimonthly ISSN: 0976 – 0997
7531
various reasons. One of the reasons for income smoothing is creating a more stable trend for supporting higher paid profit level. More stable profit trend can be perceived as lower risk which leads to higher stock prices and lower borrowing costs. The other aim of income smoothing is tendency of the business unit management to increase prediction power of investors and reduce company’s risk. Due to increase income stability and reduce its volatility, investors can have more precise predictions about future incomes. The other goal of income smoothing is considerations of political costs, taxes and debt contracts (Ibrahimian, 2010).
Surprise of profit announced by management: if management predictions of the profit at the time of announcement are different from expectations of investors and financial analysts it causes market surprise (Ng, Tuna, and Verdi, 2012).
REVIEW OF LITERATURE
Bouwman in his work entitled Managerial Optimism and Earnings Smoothing in USA Stock Exchange stated and tested two hypothesis that there is relationship between managerial optimism and profit surprise and income smoothing. Ng, Tuna, and Verdi (2012) in their work entitled Management Forecasts, Disclosure Quality, and Market Efficiency studied relationship between surprise of profits forecasts by management and systematic risk and stock market reactions. They found that there is direct significant relationship between management predictions and surprise. Xie (2008 - 2009) sought for new models for profit prediction and development of existing models and stated an important strike on income prediction is related to influence of personal factors in scattering of predictions. Belkaoui and Picur (2004) divided companies into pivotal and marginal industries and tested this hypothesis that companies in pivotal sector show lower level of smoothing compared to companies in marginal sector. Gholami advised by Dr. Darabi (2013) studied relationship between profits predicted by management and disclosure quality and market surprise in Tehran Stock Exchange. To this end, they posed three hypotheses. For testing hypothesis, the used data from 116 companies from companies listed in Tehran Stock Exchange using purposive sampling method, and they used data from period 2001 to 2011 or conducting statistical test as multiple regressions in SPSS 17 software. MohamadiSharme (2012) studied relationship between board bonus and income smoothing in companies listed on Tehran Stock Exchange. In this research, in order to specify smoother and non-smoother companies, Acle model was used, and for collecting data, library website of Tehran Stock Exchange Organization and financial statements of companies listed on Tehran Stock Exchange were used. 117 companies listed on Tehran Stock Exchange were investigated during time period 2005 – 2009.
Research Hypotheses
There is significant relationship between managerial optimism and income smoothing.
There is significant relationship between managerial optimism and profit surprise.
METHODOLOGY
This research is applied research in terms of purpose. Research method is correlation in terms of nature and content. The research was conducted in deductive - inductive reasoning framework. That is, theoretical foundations and review of literature was done using library studies, reviewing papers and websites in inductive manner, and information collection for support or rejection of hypothesis was done in deductive manner.
Adel Rezae Hadid and Roya Darabi
Indian Journal Of Natural Sciences www.tnsroindia.org. © IJONS
Vol.5 / Issue 30 / June 2015 International Bimonthly ISSN: 0976 – 0997
7532
Statistical Population
The number of companies listed on Tehran Stock Exchange at the end of 2013 was 475.
Assumptions
The number of companies exiting Stock Exchange during time domain (159) The number of companies entering Stock Exchange during time domain (156) The number of companies which were investor and financial broker (32) (Due to irrelevance to research subject) The number of companies with trading interval during time domain (17) The number of companies that their fiscal year does not end in March 2013 (14) (Due to uniformity of fiscal years in terms of activity) Total population under study (9)
Research Analytical Model
A regression model as following will be used for investigating relationship between income smoothing and managerial optimism:
SMOOTH = income smoothing
In the current work, in order to identify income smoothing behavior, Acle model is used. This index is not able to identify all companies attempting at income smoothing. In other words, if companies fail partially or totally in income smoothing, they are classified as non-smoother according to this index. Although this feature is regarded as positive in conservatism view, because companies which are classified as smoother according to this basis, they are smoother in high confidence coefficient. Anyway, considering all features, and in comparison with other income smoothing criteria, Acle index is acceptable criterion for goals of this work. If a company is smoother at least in one of operational levels, net or gross, it will be considered as smoother in this work.
In this research, Acle model is used for following reasons:
Acle model does not rely on mental judgment for profit prediction and cost estimation.
Acle model considers effect of several variables together instead of considering effect of each smoother variable separately.
In this model, cvcoefficient of changes or coefficient of dispersion or variability is used which obtains one of relative indexes of mean. Theoretical framework of Acle model defines smoother institute as a unit which uses several accounting variables so that outcome of their effects minimizes profit volatility. According to this model, the company is considered as smoother where coefficient of dispersion of changes in one period of gross profit, operational profit or net profit by coefficient of dispersion of changes of a period of sale is smaller. In other words, smoothing index is calculated as follows:
Adel Rezae Hadid and Roya Darabi
Indian Journal Of Natural Sciences www.tnsroindia.org. © IJONS
Vol.5 / Issue 30 / June 2015 International Bimonthly ISSN: 0976 – 0997
7533
Where
Denotescoefficient of dispersion of changes in profit in Ith Company in research time period and denotescoefficient of dispersion of changes in sale in Ith Company in research time period. If , then
the company has not smoothes its income and if , the company has smoothed its income. Aim of this model is artificial income smoothing. Natural income smoothing is not essentially related to any managerial action or decision. Also, real income smoothing denotes an economic situation which is not included in this research. However, artificial income smoothing actually reflectsintentional management actions for time series of reported profits, which explicitly leads to distortion in provision of economic realities. The other point which should be noted is that theoretical framework of Acle is merely for identification of instituteswhich attempt at income smoothing the fail (Mashayekhi and Panahi, 2007).
= managerial optimism (it is a dummy variable, which is 1 if anticipatory profit is greater than Earnings per Share, otherwise it is 0).
For investigation of relationship between surprise and managerial optimism, regression model as follow is used:
= profit surprise
If management predictions of the profit at the time of announcement are different from expectations of investors and financial analysts it causes market surprise. Profit surprise in this research is calculated using method of Ng, Tuna, and Verdi (2012).
= management forecast of company’s profit
= average forecasts of profit by management during recent years
= stock price at the end of fiscal year
If results of this formula for three consecutive years are obtained as positive, it suggests surprise of profit of the company. BX means a controlling variable in which research which equals to natural logarithm of total assets of the company.
Descriptive Indexes of Variables
In order to test research hypothesis using statistical tests, firstly the number of data – years when companies were non-smoother – as 50 data were eliminated so that related hypothesis are studied. Total number of data – years was 485 data – year and 435 data –year smoother was obtained.
CV iCYCV s
Adel Rezae Hadid and Roya Darabi

Indian Journal Of Natural Sciences www.tnsroindia.org. © IJONS
Vol.5 / Issue 30 / June 2015 International Bimonthly ISSN: 0976 – 0997
7534
Thus, prior to testing research hypothesis, researchhypothesis are summarized in the Table 1.
Table 1 indicates features of research variables. Frist line of the table indicate that number of total data for all variables is 435 number – year, and second line indicates average of collected variables separately. For example, average firm size is 13.573. Sixth line indicates variance and dispersion of variables around the average. Firm size variance is 1.9. Fifth and eighth lines indicate Skewness and Kurtosis of data toward normal bell-shaped curve. Among research variables, firm size shows 0.75 Skewness toward right. Ninth and tenth lines describe changes of largest ad smallest numbers as range of changes. Meanwhile, firm size variable has minimum data as 10.031 and maximum data as 18.437.
Investigation of Variable Normality Assumption
Since normality of dependent variable leads to normality of residuals of the model, it is necessary to control its normality prior to model fit.
Kolmogorov - Smirnov Test (KS)
For performing regression analysis, firstly normality test of variables is investigated using Kolmogorov - Smirnov Test (KS).
Judgment considering Table 2, since significance level is smaller than 0.05 for variables, it does not follow normal distribution. For normalization of thesevariables mathematical transformation (square logarithm) is used. Following test investigates normality assumption of transformed variables.
Judgment considering Table 3, since significance level is smaller than 0.05 for variables, H0 is supported and H1 is rejected. In other words, data have normal distribution. Thus, assumption of normality of dependent variables in this research is supported.
Testing Research Hypotheses
Testing Frist Hypothesis
There is significant relationship between managerial optimism and income smoothing.
Null hypothesis and alternative hypothesis are defined as follows:
H0: There is no significant relationship between managerial optimism and income smoothing.
H1: There is significant relationship between managerial optimism and income smoothing
Adel Rezae Hadid and Roya Darabi
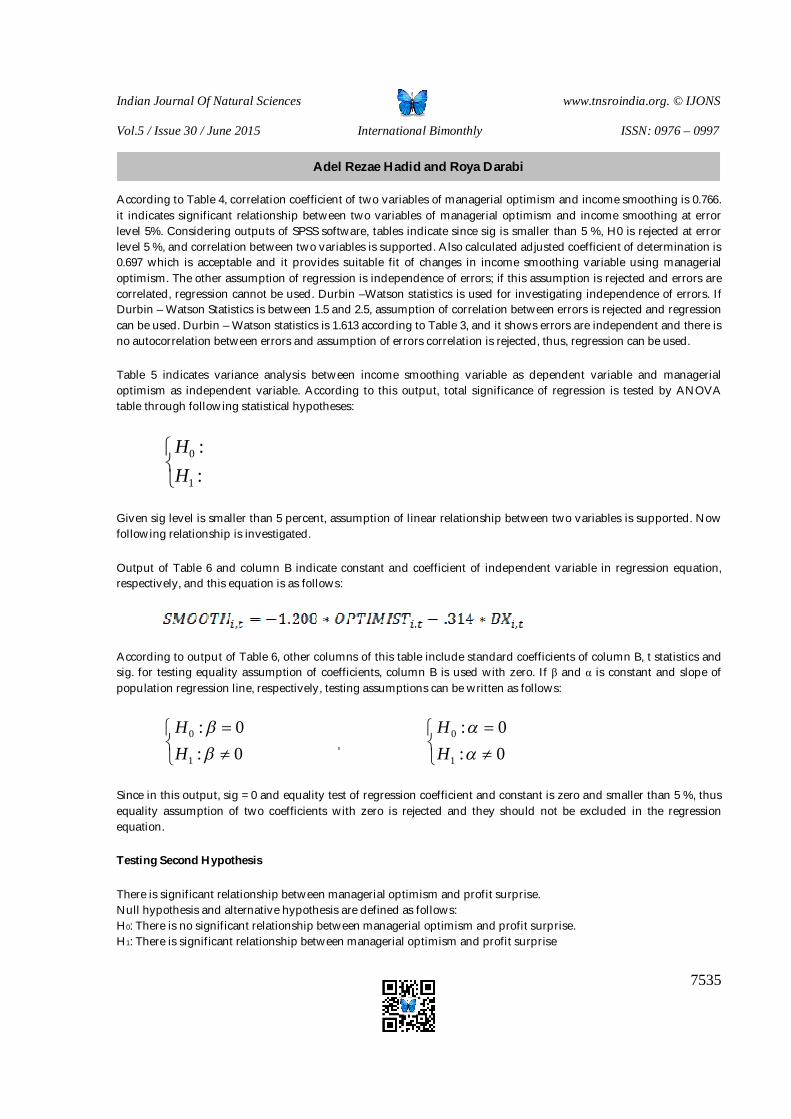
Indian Journal Of Natural Sciences www.tnsroindia.org. © IJONS
Vol.5 / Issue 30 / June 2015 International Bimonthly ISSN: 0976 – 0997
7535
According to Table 4, correlation coefficient of two variables of managerial optimism and income smoothing is 0.766. it indicates significant relationship between two variables of managerial optimism and income smoothing at error level 5%. Considering outputs of SPSS software, tables indicate since sig is smaller than 5 %, H0 is rejected at error level 5 %, and correlation between two variables is supported. Also calculated adjusted coefficient of determination is 0.697 which is acceptable and it provides suitable fit of changes in income smoothing variable using managerial optimism. The other assumption of regression is independence of errors; if this assumption is rejected and errors are correlated, regression cannot be used. Durbin –Watson statistics is used for investigating independence of errors. If Durbin – Watson Statistics is between 1.5 and 2.5, assumption of correlation between errors is rejected and regression can be used. Durbin – Watson statistics is 1.613 according to Table 3, and it shows errors are independent and there is no autocorrelation between errors and assumption of errors correlation is rejected, thus, regression can be used.
Table 5 indicates variance analysis between income smoothing variable as dependent variable and managerial optimism as independent variable. According to this output, total significance of regression is tested by ANOVA table through following statistical hypotheses:
::
1
0
HH
Given sig level is smaller than 5 percent, assumption of linear relationship between two variables is supported. Now following relationship is investigated.
Output of Table 6 and column B indicate constant and coefficient of independent variable in regression equation, respectively, and this equation is as follows:
According to output of Table 6, other columns of this table include standard coefficients of column B, t statistics and sig. for testing equality assumption of coefficients, column B is used with zero. If β and α is constant and slope of population regression line, respectively, testing assumptions can be written as follows:
0:0:
1
0
HH
,
0:0:
1
0
HH
Since in this output, sig = 0 and equality test of regression coefficient and constant is zero and smaller than 5 %, thus equality assumption of two coefficients with zero is rejected and they should not be excluded in the regression equation.
Testing Second Hypothesis
There is significant relationship between managerial optimism and profit surprise. Null hypothesis and alternative hypothesis are defined as follows: H0: There is no significant relationship between managerial optimism and profit surprise. H1: There is significant relationship between managerial optimism and profit surprise
Adel Rezae Hadid and Roya Darabi
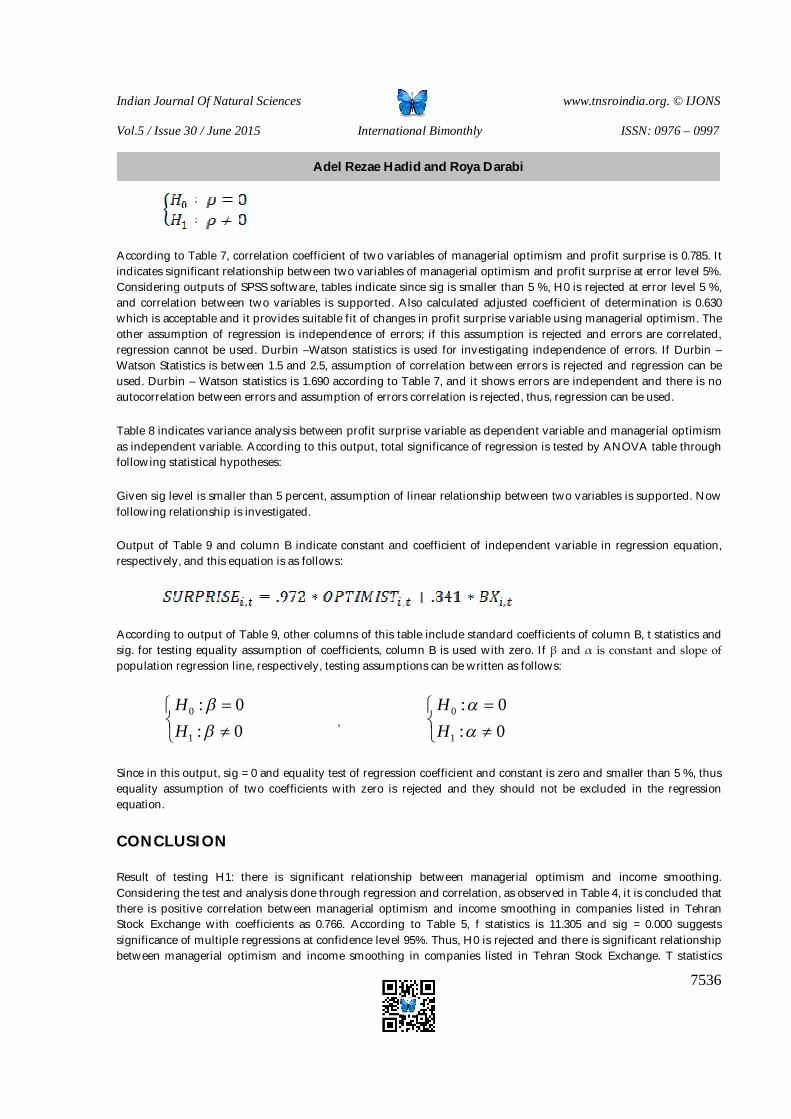
Indian Journal Of Natural Sciences www.tnsroindia.org. © IJONS
Vol.5 / Issue 30 / June 2015 International Bimonthly ISSN: 0976 – 0997
7536
According to Table 7, correlation coefficient of two variables of managerial optimism and profit surprise is 0.785. It indicates significant relationship between two variables of managerial optimism and profit surprise at error level 5%. Considering outputs of SPSS software, tables indicate since sig is smaller than 5 %, H0 is rejected at error level 5 %, and correlation between two variables is supported. Also calculated adjusted coefficient of determination is 0.630 which is acceptable and it provides suitable fit of changes in profit surprise variable using managerial optimism. The other assumption of regression is independence of errors; if this assumption is rejected and errors are correlated, regression cannot be used. Durbin –Watson statistics is used for investigating independence of errors. If Durbin – Watson Statistics is between 1.5 and 2.5, assumption of correlation between errors is rejected and regression can be used. Durbin – Watson statistics is 1.690 according to Table 7, and it shows errors are independent and there is no autocorrelation between errors and assumption of errors correlation is rejected, thus, regression can be used.
Table 8 indicates variance analysis between profit surprise variable as dependent variable and managerial optimism as independent variable. According to this output, total significance of regression is tested by ANOVA table through following statistical hypotheses:
Given sig level is smaller than 5 percent, assumption of linear relationship between two variables is supported. Now following relationship is investigated.
Output of Table 9 and column B indicate constant and coefficient of independent variable in regression equation, respectively, and this equation is as follows:
According to output of Table 9, other columns of this table include standard coefficients of column B, t statistics and sig. for testing equality assumption of coefficients, column B is used with zero. If β and α is constant and slope of population regression line, respectively, testing assumptions can be written as follows:
0:0:
1
0
HH
,
0:0:
1
0
HH
Since in this output, sig = 0 and equality test of regression coefficient and constant is zero and smaller than 5 %, thus equality assumption of two coefficients with zero is rejected and they should not be excluded in the regression equation.
CONCLUSION
Result of testing H1: there is significant relationship between managerial optimism and income smoothing. Considering the test and analysis done through regression and correlation, as observed in Table 4, it is concluded that there is positive correlation between managerial optimism and income smoothing in companies listed in Tehran Stock Exchange with coefficients as 0.766. According to Table 5, f statistics is 11.305 and sig = 0.000 suggests significance of multiple regressions at confidence level 95%. Thus, H0 is rejected and there is significant relationship between managerial optimism and income smoothing in companies listed in Tehran Stock Exchange. T statistics
Adel Rezae Hadid and Roya Darabi
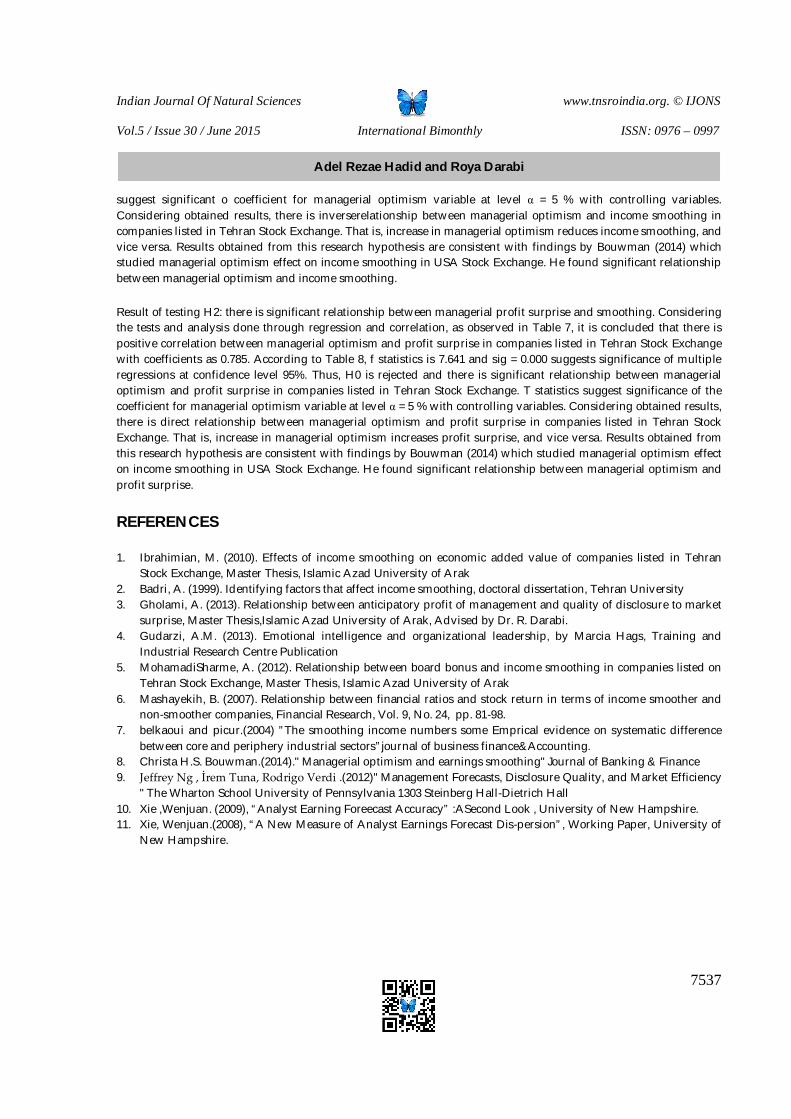
Indian Journal Of Natural Sciences www.tnsroindia.org. © IJONS
Vol.5 / Issue 30 / June 2015 International Bimonthly ISSN: 0976 – 0997
7537
suggest significant o coefficient for managerial optimism variable at level α = 5 % with controlling variables. Considering obtained results, there is inverserelationship between managerial optimism and income smoothing in companies listed in Tehran Stock Exchange. That is, increase in managerial optimism reduces income smoothing, and vice versa. Results obtained from this research hypothesis are consistent with findings by Bouwman (2014) which studied managerial optimism effect on income smoothing in USA Stock Exchange. He found significant relationship between managerial optimism and income smoothing.
Result of testing H2: there is significant relationship between managerial profit surprise and smoothing. Considering the tests and analysis done through regression and correlation, as observed in Table 7, it is concluded that there is positive correlation between managerial optimism and profit surprise in companies listed in Tehran Stock Exchange with coefficients as 0.785. According to Table 8, f statistics is 7.641 and sig = 0.000 suggests significance of multiple regressions at confidence level 95%. Thus, H0 is rejected and there is significant relationship between managerial optimism and profit surprise in companies listed in Tehran Stock Exchange. T statistics suggest significance of the coefficient for managerial optimism variable at level α = 5 % with controlling variables. Considering obtained results, there is direct relationship between managerial optimism and profit surprise in companies listed in Tehran Stock Exchange. That is, increase in managerial optimism increases profit surprise, and vice versa. Results obtained from this research hypothesis are consistent with findings by Bouwman (2014) which studied managerial optimism effect on income smoothing in USA Stock Exchange. He found significant relationship between managerial optimism and profit surprise.
REFERENCES
1. Ibrahimian, M. (2010). Effects of income smoothing on economic added value of companies listed in Tehran Stock Exchange, Master Thesis, Islamic Azad University of Arak
2. Badri, A. (1999). Identifying factors that affect income smoothing, doctoral dissertation, Tehran University 3. Gholami, A. (2013). Relationship between anticipatory profit of management and quality of disclosure to market
surprise, Master Thesis,Islamic Azad University of Arak, Advised by Dr. R. Darabi. 4. Gudarzi, A.M. (2013). Emotional intelligence and organizational leadership, by Marcia Hags, Training and
Industrial Research Centre Publication 5. MohamadiSharme, A. (2012). Relationship between board bonus and income smoothing in companies listed on
Tehran Stock Exchange, Master Thesis, Islamic Azad University of Arak 6. Mashayekih, B. (2007). Relationship between financial ratios and stock return in terms of income smoother and
non-smoother companies, Financial Research, Vol. 9, No. 24, pp. 81-98. 7. belkaoui and picur.(2004) ”The smoothing income numbers some Emprical evidence on systematic difference
between core and periphery industrial sectors”journal of business finance&Accounting. 8. Christa H.S. Bouwman.(2014)." Managerial optimism and earnings smoothing" Journal of Banking & Finance 9. Jeffrey Ng , İrem Tuna, Rodrigo Verdi .(2012)" Management Forecasts, Disclosure Quality, and Market Efficiency
" The Wharton School University of Pennsylvania 1303 Steinberg Hall-Dietrich Hall 10. Xie ,Wenjuan. (2009), “Analyst Earning Foreecast Accuracy” :ASecond Look , University of New Hampshire. 11. Xie, Wenjuan.(2008), “A New Measure of Analyst Earnings Forecast Dis-persion”, Working Paper, University of
New Hampshire.
Adel Rezae Hadid and Roya Darabi
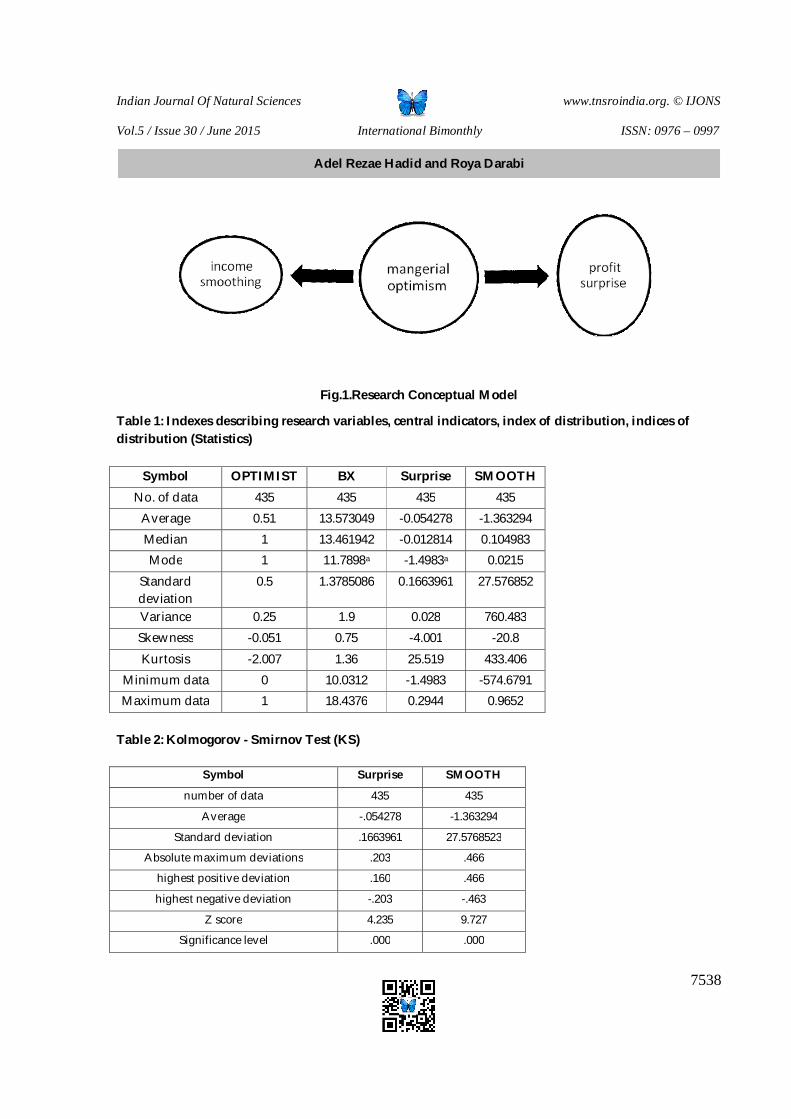
Indian Journal Of Natural Sciences www.tnsroindia.org. © IJONS
Vol.5 / Issue 30 / June 2015 International Bimonthly ISSN: 0976 – 0997
7538
Fig.1.Research Conceptual Model
Table 1: Indexes describing research variables, central indicators, index of distribution, indices of distribution (Statistics)
Symbol OPTIMIST BX Surprise SMOOTH No. of data 435 435 435 435
Average 0.51 13.573049 -0.054278 -1.363294 Median 1 13.461942 -0.012814 0.104983 Mode 1 11.7898a -1.4983a 0.0215
Standard deviation
0.5 1.3785086 0.1663961 27.576852
Variance 0.25 1.9 0.028 760.483 Skewness -0.051 0.75 -4.001 -20.8 Kurtosis -2.007 1.36 25.519 433.406
Minimum data 0 10.0312 -1.4983 -574.6791 Maximum data 1 18.4376 0.2944 0.9652
Table 2: Kolmogorov - Smirnov Test (KS)
Symbol Surprise SMOOTH
number of data 435 435
Average -.054278 -1.363294
Standard deviation .1663961 27.5768523
Absolute maximum deviations .203 .466
highest positive deviation .160 .466
highest negative deviation -.203 -.463
Z score 4.235 9.727
Significance level .000 .000
Adel Rezae Hadid and Roya Darabi
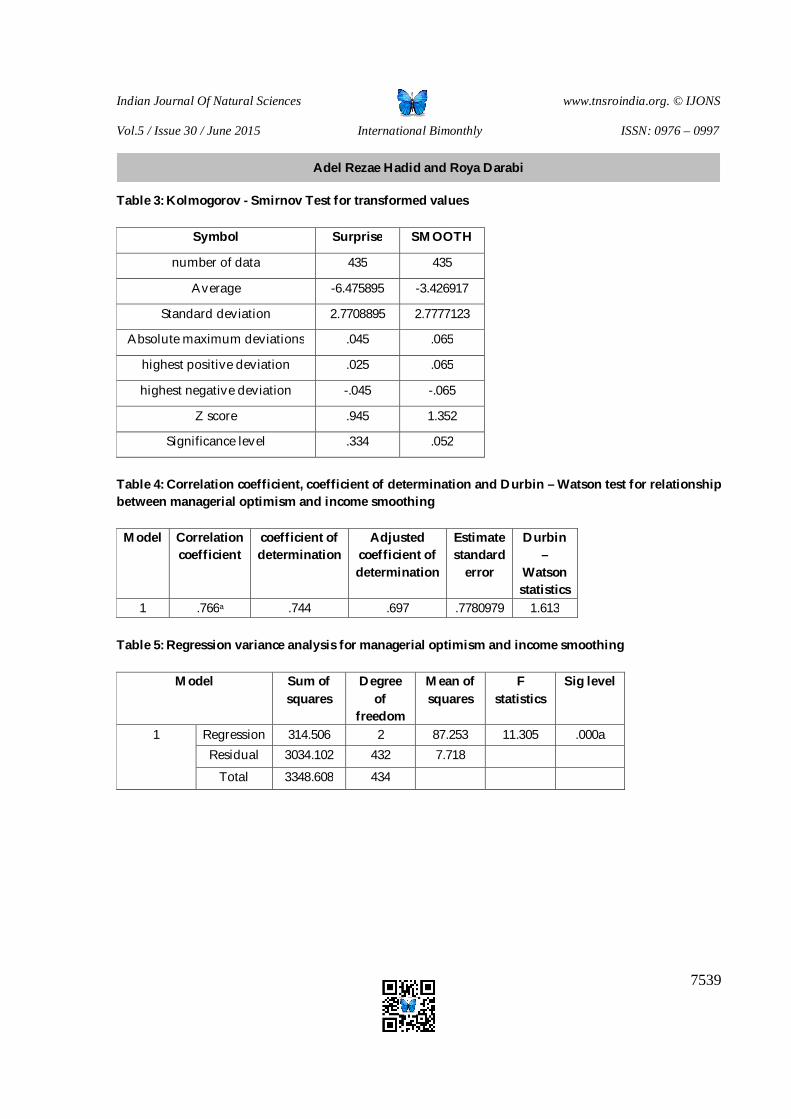
Indian Journal Of Natural Sciences www.tnsroindia.org. © IJONS
Vol.5 / Issue 30 / June 2015 International Bimonthly ISSN: 0976 – 0997
7539
Table 3: Kolmogorov - Smirnov Test for transformed values
Symbol Surprise SMOOTH
number of data 435 435
Average -6.475895 -3.426917
Standard deviation 2.7708895 2.7777123
Absolute maximum deviations .045 .065
highest positive deviation .025 .065
highest negative deviation -.045 -.065
Z score .945 1.352
Significance level .334 .052
Table 4: Correlation coefficient, coefficient of determination and Durbin – Watson test for relationship between managerial optimism and income smoothing
Model Correlation coefficient
coefficient of determination
Adjusted coefficient of determination
Estimate standard
error
Durbin –
Watson statistics
1 .766a .744 .697 .7780979 1.613
Table 5: Regression variance analysis for managerial optimism and income smoothing
Model Sum of squares
Degree of
freedom
Mean of squares
F statistics
Sig level
1 Regression 314.506 2 87.253 11.305 .000a Residual 3034.102 432 7.718
Total 3348.608 434
Adel Rezae Hadid and Roya Darabi
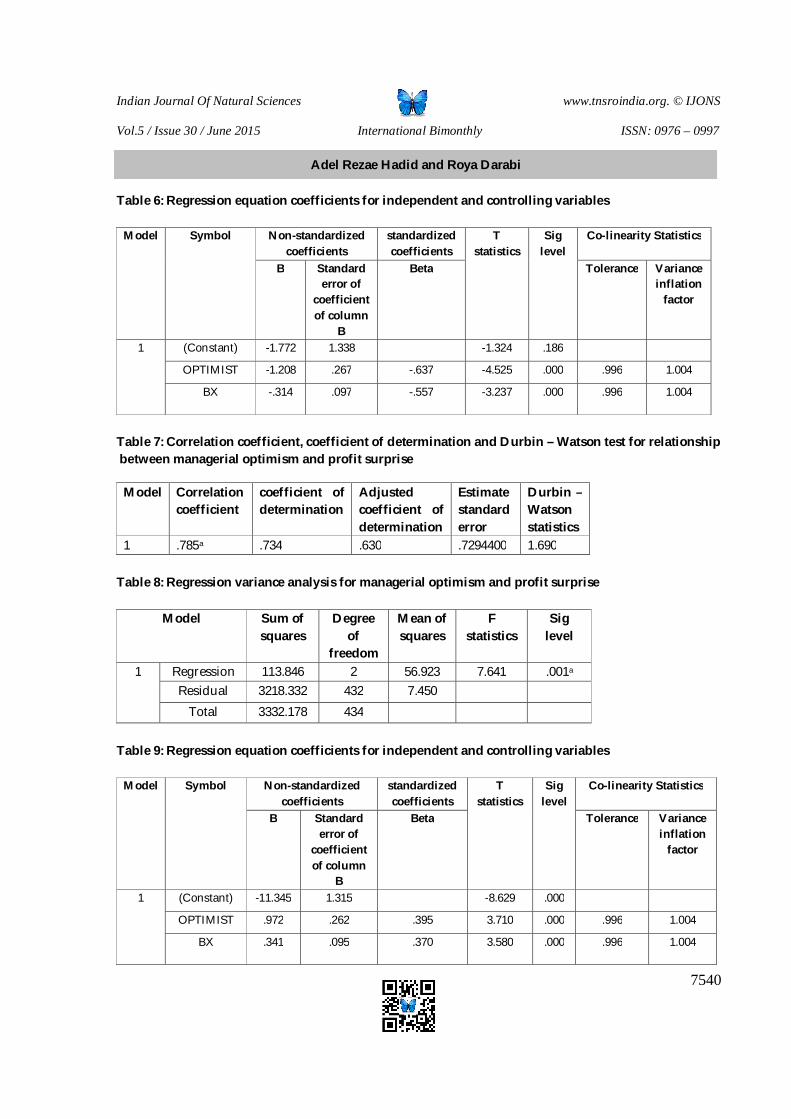
Indian Journal Of Natural Sciences www.tnsroindia.org. © IJONS
Vol.5 / Issue 30 / June 2015 International Bimonthly ISSN: 0976 – 0997
7540
Table 6: Regression equation coefficients for independent and controlling variables
Model Symbol Non-standardized coefficients
standardized coefficients
T statistics
Sig level
Co-linearity Statistics
B Standard error of
coefficient of column
B
Beta Tolerance Variance inflation
factor
1 (Constant) -1.772 1.338 -1.324 .186
OPTIMIST -1.208 .267 -.637 -4.525 .000 .996 1.004
BX -.314 .097 -.557 -3.237 .000 .996 1.004
Table 7: Correlation coefficient, coefficient of determination and Durbin – Watson test for relationship between managerial optimism and profit surprise
Model Correlation coefficient
coefficient of determination
Adjusted coefficient of determination
Estimate standard error
Durbin – Watson statistics
1 .785a .734 .630 .7294400 1.690
Table 8: Regression variance analysis for managerial optimism and profit surprise
Model Sum of squares
Degree of
freedom
Mean of squares
F statistics
Sig level
1 Regression 113.846 2 56.923 7.641 .001a Residual 3218.332 432 7.450
Total 3332.178 434
Table 9: Regression equation coefficients for independent and controlling variables
Model Symbol Non-standardized coefficients
standardized coefficients
T statistics
Sig level
Co-linearity Statistics
B Standard error of
coefficient of column
B
Beta Tolerance Variance inflation
factor
1 (Constant) -11.345 1.315 -8.629 .000
OPTIMIST .972 .262 .395 3.710 .000 .996 1.004
BX .341 .095 .370 3.580 .000 .996 1.004
Adel Rezae Hadid and Roya Darabi
Indian Journal Of Natural Sciences www.tnsroindia.org. © IJONS
Vol.5 / Issue 30 / June 2015 International Bimonthly ISSN: 0976 – 0997
7541
The Role of Legal Environmental Policies in Attracting Foreign Investment
Mohsen Abdollahi1 and Samira Mohsenpour2*
1Associate professor, Department of International Law, Faculty of Law, ShahidBeheshti University, Tehran, Iran. 2Ph.D candidate, Department of International Law, Faculty of Law, ShahidBeheshtiUniversity, Tehran, Iran. . Received: 21 Mar 2015 Revised: 19 Apr 2015 Accepted: 29 May 2015 *Address for correspondence Samira Mohsenpour PH.D candidate, Department of International Law, Faculty of Law, ShahidBeheshtiUniversity, Tehran, Iran.
This is an Open Access Journal / article distributed under the terms of the Creative Commons Attribution License (CC BY-NC-ND 3.0) which permits unrestricted use, distribution, and reproduction in any medium, provided the original work is properly cited. All rights reserved.
Economic theories suggest that the development of trade and investment will reinforce global welfare because increased investment is followed by the distribution of factors such as land, labor, and capital. Accordingly, foreign investment should be set in such a way that it not only promotes economic development, but also provides human rights norms and environmental standards. But developing countries in order to attract more capital, try to compete to make easier rules which affects the process of environmental protection. This issue has been manifested in funding for investment attraction policies and bilateral treaties. In contrast, some countries also believe that strict environmental regulations will reinforce business competition and increased investment. Now the question is that whether policies to race to bottom , race to up and pollution haven will lead to greater investment or not. The main purpose of this paper is to achieve a precise answer to this problem and in case of answering that we will show: although environmental standards can be a competitive issue in attracting investment, the cost of reducing pollution and observing environmental standards against issues such as access to markets, raw materials and labor costs, export credits and investment insurance are not important in attracting foreign investment and the host governments will have a greater role in attracting foreign investment by providing initiatives to backup foreign investment rather than merely reducing environmental standards.
Key words: Environment, Foreign Investment, Pollution Haven, Race to Bottom, Race to up
RESEARCH ARTICLE
ABSTRACT
Indian Journal Of Natural Sciences www.tnsroindia.org. © IJONS
Vol.5 / Issue 30 / June 2015 International Bimonthly ISSN: 0976 – 0997
7542
INTRODUCTION
Each society has some norms regarding keeping healthy population, avoiding environmental damages and regularization of using live and non-live natural resources (Clive Pointing (1999)). The identification of environmental rights in domestic legal systems an acceptance by executive institutions caused that the countries in their international positions to environmental issues enter this local popularity to the international arena (Human environmental rights (2010)). The policy making of governments is not similar in this regard and we cannot expect that developing countries have environmental policies like developed countries as objective conditions and environmental priorities in these countries are different. The evidences by Lucas et al (1992)Birdsall and Wheeler (1993) show that industrial pollution in developing countries was high in 70,80s. This rate was reduced in developed countries(Neumayer (2001)). In addition, pollution in developing countries in the east and south East Asia is increased. In most of developing countries, law making regarding environmental issues dates back to 70s, for example India in 1974 considered some rules regarding the water and air pollution prevention. However, in most of developing countries, we are encountered with the lack of comprehensive environmental law making and ministries or institutions dealing specifically with environmental issues. It can be said that domestic environmental law are turned into a competition factor among the governments to absorb foreign investment. The governments by approving easy rules to reduce production costs in environment protection encourage economic formations to enter in their domain. Some of the critics believe that increasing competition for direct foreign investment and training leads to the reduction of environmental rules and standards (Erlinda (2005)). In other words, competition in investment leads to inverse effects on environment. Reduction of hard environmental rules leads to high inclination of investment in these countries and sometimes, these countries are turned into pollution haven. The mentioned risk as it is real or is predicted creates law making fear as the law makers in the countries make themselves strong to avoid losing existing capitals or they make their environmental rules harder or they lose their potential trading investment in their country (Habibi (2009)). If some countries have such fear at the same time, the global community cannot improve the rules guaranteeing environmental sustainability.The race to up vs. the race to bottom. It means that some governments by improving environmental policies can improve competition in market and innovations and creation of new technologies.
If an important market implements high standards, its impact is on issuing the mentioned standards to the countries and manufacturers as related to the market via investment. Sometimes this effect is called “California effect” and it is great US state directing global and national markets with environmental standards. The question is raised do such policies (race to bottom, pollution haven and race to up) lead to much investment absorption? What is the effect of such policies on environment? This study attempted to answer these questions. It is assumed that although environmental rules can be an important factor to absorb foreign investment, other issues as easy access to market, raw materials costs and labor, credits of export and investment insurances in decision making and selection of investment location are taken into attention of investors as the importance of environmental rules is less emphasized. This study is organized by 5 main sections. First and second sections deal with convergence of environmental international law and investment and influence of environmental rules in investment contracts and third to fifth sections explain the competition hypotheses for reduction, pollution haven and race to up.
Convergence of international environmental law and investment
In the current varied world, as the population is increasing and life standards are in progress, the pressure on ecosystem and human demand in using natural resources is increased. It is necessary to select a way to avoid poverty and creating models with ecosystem destruction. The development of foreign investment in two recent decades created problems regarding pollution and environment problems namely in developing countries. Direct foreign investment by their companies in beyond the borders was reliant upon using natural resources by minor affiliations or joint companies. Although this trend is changed in recent years, in poor countries with great part of investment
Mohsen Abdollahi and Samira Mohsenpour
Indian Journal Of Natural Sciences www.tnsroindia.org. © IJONS
Vol.5 / Issue 30 / June 2015 International Bimonthly ISSN: 0976 – 0997
7543
dedicated to natural resources, these investments are with destruction of environment as greenhouse gas emission, deforestation and lack of biodiversity as economic considerations have been dominant to environment protection.
Thus, some events as Liberian Tanker and Torrey Canyon raised concerns regarding environmental issues(Carson (1962)). The most important concern was regarding environmental issues “first generation” as prevention of pollution or endangered species(Convention on Wetlands of International Importance Especially as waterfowl Habitat (1971)). The conflict between environment protection and economic development formed the evolution of environment rights. This issue was emphasized 20 years later in RIO Conference (1992) regarding development and environment. It was emphasized on normative development in Rio and the environment protection with economic development and the result was affirming the concept of sustainable development(International Union for Conservation of Nature (1987)). This concept presented an agreement regarding environment protection and development improvement(Magraw and Hawke (2007)). Thus, relationship between development and environment was in most of environment negotiations.
As it was said by one of the interpreters, sustainable development is a multi-level concept with various meanings in various levels (Doboson (1999)) and it is defined as achieving present needs without any damage to the needs of future generation. Such wide definition is god to create a general agreement in an international negotiation. This definition has not adequate guidance in this regard and the important issue is how to associate the two terms of development and environment (Slovakia (2008)). Regarding the relationship between these two concepts, we can not ignore the role of private sector in environment protection. In Johannesburg conference (2002) in World Summit on SustainableDevelopment (WSSD), the role of private sector as a key factor regarding the Water, Energy, Health, Agriculture and Biodiversity (WEHAB) was considered(Schrijver (2008)). In addition, on December 2009, UN general assembly ratified a resolution for the world summit of environment in 2012 enabling the states to establish their economic models on environmental issues and in this framework, foreign investment in the sectors of great importance for environment protection as energy, water, wastewater management and renewable energy, etc. is the main element of moving to green economy(United Nations Environment Programme (2011)). Thus, the role of private sector in global governance of environment is much more emphasized. Therefore, foreign investment approach is changed and environmental considerations are reflected in investment contracts and investment claims with environmental components are increased. The next sections in this study explain these issues and influence of environment in investment contracts and environmental policies in absorption of foreign investment can be considered.
The influence of environmental rules on investment contracts
Based on the published reports by economic development and collaboration in 2011 based on 1623 international investment agreement (about 50% of international agreements of investment), only 8.2% of these agreements were including items regarding environmental issues (Gordon and Pohl (2011)). Indeed, the report of this organization shows that in the mid-90s, these agreements with environmental issues were increased and 2008 is the most emphasized issue and 89% of agreements were regarding environment. By comparison of international conventions of investment as concluded already with present conventions, we can say the interaction between environment and investment law is increased. The role of foreign investment in global environment arena included a position for environmental issues in international investment conventions. Based on the difference of approaches of countries and environmental conditions, there are some conflicts: Regarding the first criterion, we can say based on the report of organization for economic cooperation and development and , despite the fact that some countries as Egypt, Germany and Britain didn’t consider environment issues in international investment conventions. Other countries as Canada, New Zealand, Japan, US or Finland were more inclined on this issue. There are some differences between convention concluding states not as the member of this organization and those member states of these organizations. The share of investment international conventions including environmental conditions is in final rank, in the conventions between organization for economic cooperation and development member states with non-member
Mohsen Abdollahi and Samira Mohsenpour
Indian Journal Of Natural Sciences www.tnsroindia.org. © IJONS
Vol.5 / Issue 30 / June 2015 International Bimonthly ISSN: 0976 – 0997
7544
states is higher (e.g. 9.5%) in conventions between member states of this organization is about 6% and in non-member states is about 3.4%. These results can explain the result of UN watch for human rights and trading in using stability conditions in investment contracts (Shemberg (2008)). Based on UN report, the contracts between investors and non-member states of organization for economic cooperation and development were highly inclined to include stability conditions than contracts between investors and member states of this organization. Thus, although high stability conditions to foreign investors in non-member states of organization for economic cooperation and development are applied, investment international treaties as concluded by member states of this organization with some of non-member states, they are mostly based on environmental rules and this approach causes that investors make efforts to observe environmental rules. In addition, it seems that imposing obligations on transnational investors requires giving priorities to them in international investment treaties(Peterson et al (2003)). There is no global comprehensive document regarding investment and the states concluded bilateral investment conventions and in some of the bilateral conventions, executive mechanism are predicted to violate human rights and environmental damages occurred by private party and inclusion of environmental mechanisms in investment bilateral treaties, the weakness of international investment treaties and procedural requirement of companies is compensated. Inclusion of norms regarding environment rights in investment bilateral treaties is not a good solution to control environmental issues in investment as:
Bilateral investment treaties are concluded among those without equal trading power and the governments follow maximum benefits and if environmental norms in investment bilateral treaties are in contrast with benefits maximization, the performance of these norms needs wide collaboration and importing capital countries with facilitation of national rules, reduction of environmental standards and human rights can absorb more investors.
More than 2400 bilateral investment treaties have between concluded among the states and only supporting investor and foreign investors was considered and environmental norms were ignored.
Based on the report of organization for economic cooperation and development , evaluation of environmental issues in investment treaties is associated with its goals and these goals are divided into seven parts as(Shemberg (2008)).
General definition in introduction regarding environmental concerns refers to environment protection as one of the concerns of treaty parties and among 133 contracts, 66 of them have such definitions.
Keeping a framework for policy makings regarding environmental issues and of 133 contracts, 82 have such rules and they are considerable and the scope of such conditions is varied. Most of them refer to environmental issues as a whole and others refer to specific issues as plant and plant health, non-renewable natural resources or specific other issues. Various treaties refer to environmental issues without defining the border of such concepts. For example, article 1114 NAFTA states that : Nothing in this treaty should avoid member states take, maintain or execute actions except what is in this treaty and it should be considered for environment protection (NAFTA (2005)). Also, in bilateral treaty of Russia-Hungary federation in 1995, this treaty shouldn’t prevent that member states take the actions required to protect national security, pubic order or environmental protection, morality and public health (Hungary (1995)). Most contracts refer to the contracts in which two members can create the rules. For example, health of animals and people or natural resources. For example, article 20 of General Agreement on Tariffs and Tarade(GATT) is one of the examples.
Creating a framework for policy making regarding environmental rules for specific issues and the first treaty with these conditions is Canada treaty in 2001 as: The measurement requiring investment to use a technology for environment protection, security and public health shouldn’t be inconsistent with paragraph f (Canada (2006)). Article 1106 of NAFTA states that : Provided that such measures are not applied in an arbitrary or unjustifiable manner, or do not constitute a disguised restriction on international trade or investment, nothing in paragraph 1(b) or
Mohsen Abdollahi and Samira Mohsenpour
Indian Journal Of Natural Sciences www.tnsroindia.org. © IJONS
Vol.5 / Issue 30 / June 2015 International Bimonthly ISSN: 0976 – 0997
7545
(c) or 3(a) or (b) shall be construed to prevent any Party from adopting or maintainingmeasures, including environmental measures: (a) necessary to secure compliance with laws and regulations that are not inconsistentwith the provisions of this Agreement;(b)necessary to protect human, animal or plant life or health; or (c)) necessary for the conservation of living or non-living exhaustible natural resources(NAFTA (2005)).
The rules showing that non-biased environmental rules are not indirect. 12 contracts have included such rules. Contract rules keeps a space to regularize environmental issues and can not avoid compensation claim based on changing the environmental rules. The governments restricting the contract rules are exposed to compensate claim for indirect issuing. US and Canada in 1990 included some conditions in their treaties by which environmental issues can not be considered as indirect. These conditions are stated that “……except exceptional conditions, non-biased actions of one of member states to reach the goals of public welfare as public health, security and environment is not indirect issuing. These conditions are rare and are observed in most of bilateral investment contracts as bilateral investment treatment of Canada and US.
The rules avoiding the reduction of environmental rules to achieve investment absorption. Some of governments concluding investment international treaty and including some conditions in these treaties can avoid reduction of standards regarding environment. These conditions attempt to guarantee the respect to environmental standards and avoid that the governments reduce the rules of environment for investment absorption. Such conditions were emerged since 1990 and Nafta also mentioned this issue in 1992 (NAFTA(2005)).
Also, we can say, 49 international investment treaties include such conditions. The rules of visiting environment experts by judgment centers 16 contracts have such conditions. The rules encouraging the collaboration and environment principles and 20 contracts deal with these issues. The bilateral investment treaties stated limited environmental issues as: Health of human being, animals, plants, avoiding the epidemic of diseases, pests in plants and animals Non-renewable natural resources protection Keeping the treasures with artistic, historical and ancient value To achieve these goals, the applied methods are: Avoiding, reduction or control of environmental pollution epidemic Control of toxic chemical substances, wastes and relevant information exchange Protection of wild animals and plants as endangered species and protected natural areas
Despite mentioning these issues in contracts, there are some conflicts in this regard between investors and governments and countries take the policies leading to reduction of rules of environment protection and it is discussed later.
Race- to- the- Bottom
By increasing globalization and foreign investment growth, it is expected that foreign investment improves managerial capabilities, reduction of shortage of foreign exchange, balance in payment in less developed countries. Thus, liberalization of investment and easy transfer of capital in terms of environment is of great importance. In a global economy, to be released of pollution control rules, labor standards, environment and social tax, transfer their activities to all over the world. Such condition caused that the relationship between foreign investment and environment is the discussion of many scientific circles. In developed countries, the major concern of environmental organizations is prediction of a “race to bottom” as they attempt to reduce environmental standards and absorb foreign investment as the investors compete in two issues. Environment protection costs and work security (Richard (1992)). Assume that government (a) reduces environment protection and increases work security and government (b) considers high environment protection but doesn’t support labor and workers security. Indeed, investment is
Mohsen Abdollahi and Samira Mohsenpour
Indian Journal Of Natural Sciences www.tnsroindia.org. © IJONS
Vol.5 / Issue 30 / June 2015 International Bimonthly ISSN: 0976 – 0997
7546
remained in government (a) and it is not migrated to government (b). But government (b) in competition with government (a) by reduction of environmental standards can absorb much investment . In other words, to avid the disadvantages of competition, some actions are performed to reduce environment protection. This condition creates some problems for both developing and developed countries. Developed countries fear of transferring investment from their country to the countries with easy environmental rules. In addition, these governments attempt to have high environmental standards. Their attempt despite easy rules is reduced (Richard (2005)). Finally, such condition leads to reduction of environmental standards and if such effect is not direct, it can affect the rules of countries competing at international level regarding foreign investment and trading (Jeffrey (2009)). The developing countries are concern about environment damages as the result of investment activities in their country. In these countries race to bottom is with environment problems. In these governments, macro profits of foreign investment and employment are prior to environmental rules. Some critics believe that the higher the hard rules of high income countries regarding environment, pollution is high in the countries reducing environmental standards to absorb them(Elinda (2005)). For example, in April 1992, eight north west governments concluded a treaty regarding the reduction of oxide nitrogen gases by electric devices (Mathew (1992)). The control of such gases as clean air law was approved in 1990. It was estimated that executive cost of such treaties was ranging 10 million to 50 million $. This cost was imposed on industry sector and such condition led into competition with the states not as the members of this treaty and many industries to avoid costs thought about investment in other governments. Some believe that race to bottom was with environment destruction but there are evidences showing their concerns are not important. The scientific studies show that there is no real relation between environmental standards and investment location (Geddes). According to the report of the world summit of economy regarding economic sustainability, the governments with high environmental standards absorb much investment and majority of international trading is between the governments with high standards. Normally, transnational companies prefer to remain in developed countries and they are not inclined to go to poor countries with low standards as behavior cost is based on environmental standards, even if these standards are very hard, a small part of total costs of investment and trading is considered. Investment in countries with low standards is with some risks as political instability, weak infrastructures and lack of considering ownership rights. On the other hand, by the investment growth, there is much request for quality of environment. It means that the countries with high income have high environmental quality and we can say there is a close relation between poverty and environment destruction.
Pollution haven hypothesis
As it was said, we can not expect developing countries to have environmental policies like developed countries. In developing countries, environmental rules are lower than that of developed countries. Thus, investors, namely those involved in polluted industries prefer to go to the countries without hard environmental standards. This condition of developing countries encourages the process of transferring investment in polluted industries to their country as investment in these countries has the advantages of low environmental rules (Aminu (2005)). In other words, we can say that pollution haven hypothesis is based on two variables. One industrial migration showing that polluted industries in developed countries, namely economiccooperaton and development member states should pay much to observe environmental rules (Zarsky (2008)). Thus, they transfer to the locations to pay less and if these industries don’t migrate, new investment can be on countries with weak standards. Another variable is “attraction”, it means that developing countries, can attract investment and use lower environmental standards. To analyze this hypothesis and achieving the support or reject it, at first we should define pollution haven.
Definition of pollution haven hypothesis
Despite the reputation of “pollution haven”, we can hardly define that what the exact meaning of pollution haven is. Each government with easy and limited environmental standards is accused of pollution haven establishment (Zarsky (2001)). This definition is a little misleading as we can not expect the countries have equal environmental standards without absorbing foreign investment. Another definition is presented by Eskeland, Harison as “pollution
Mohsen Abdollahi and Samira Mohsenpour
Indian Journal Of Natural Sciences www.tnsroindia.org. © IJONS
Vol.5 / Issue 30 / June 2015 International Bimonthly ISSN: 0976 – 0997
7547
haven hypothesis is one of the minor dimensions of comparative advantages. As pollution control creates costs for industry in some countries, other countries by reduction of pollution control costs in the same sector of industry can achieve some advantages. This definition is not complete as the governments can approve suitable environmental standards but they are unable to execute it. We can define this hypothesis as: If environmental standards in a country are low and to absorb investment and competition with the countries with high standards, they can reduce their environmental rules and the country can create pollution haven. It is worth to mention that except investment absorption and economic progress, pollution level is associated with priorities of people in a society. It means that social priorities of people in developing countries are different with the priorities of developed countries. For example, developing countries as an environment issue regarding healthy water are more concerned than global warming and it is not fair that they are at the same environmental rules and the result is losing investment market for developing countries(Habibi (2009)). By this definition of pollution haven, is the difference of environmental standards effective on allocation of capital and pollution haven?
The difference of environmental standards and its effect on pollution haven
Generally, there are not many studies regarding the effect of environmental standards in pollution haven and a few studies are regarding the evaluation of the effects of environmental rules on investment. Two environment researches as Levinson, Keller reviewed the foreign direct investment on US states and showed that the governments with environmental standards were effective on investment transfer but this effect was little. The studies of List regarding the effects of environmental rules on direct foreign investment, were different with the previous studies results and he found that high environmental standards reduced the share of countries of direct foreign investment. Other researchers as Mani, Pargal, Hug evaluated the condition of Indian countries and found that difference of environmental rules severity had not high impact on new projects and establishment of factories in India. Based on the statistics in world bank in 1998 and World Economic Forum (1999) regarding competition ranking, environmental factors didn’t play important role in competition. Some of polluted industries due to their dependencies on products market can not migrate to other locations. Electronic productions sector is one of the examples. This issue is not including all industries. In addition, although pollution control costs are of great importance for managers, owners of factories an investment projects, they are not main criteria for decision making in activity country. Environmental costs are lower than playing crucial role in investment decisions (Wheeler (2007)) . According to OECD organization, although pollution reduction costs were increased during 1992 to 1985, it was estimated that these costs were less than 2% of total investment costs. Low cost of pollution reduction in investment showed two other issues as foreign investors were not inclined to migrate to pollution haven: First, migration is costly and second, some factors except environmental costs as cheap labor force of natural resources and taxes in decision making regarding investment location are of great importance (Neumayer (2001)). It is worth to mention that pollution haven hypothesis is with some problems as in these investment places, the labor force is not trained, economic infrastructures are weak and there is no political and economic stability. Thus, investment in developing countries is with risk compared to other countries and one of the factors investors escape is political instability (Sheldon (2006)). The detailed study in various sectors of industry is useful.
Tanning industry
Tanning industry leads to emission of toxic substances and this industry is in polluted industry group. According to the studies, environment protection costs in tanning industry are ranging 2 to 4% of total trading volume (Foreign Direct Investment and the Environment (1999)). In the past decades, this industry has been changed considerably. In the second half 80s, due to pollution of this industry, Northern Europe countries considered strict environmental rules in this regard. These rules are of great importance in taking out this industry from Northern Europe to Eastern Europe and Brazil and Argentina(Odegard (1999)). This industry dedicates 72% of export in Brazil. Based on such condition in second half 80s, we observed contracts in this regard and some countries including Italy and Germany imported raw materials from this industry to Brazil (Knutsen (1999)). Italian countries by providing facilities, training
Mohsen Abdollahi and Samira Mohsenpour
Indian Journal Of Natural Sciences www.tnsroindia.org. © IJONS
Vol.5 / Issue 30 / June 2015 International Bimonthly ISSN: 0976 – 0997
7548
employees and new technologies in some countries as Brazil turned the skin to high quality leader. The reliance of Brazil on this industry as one of the most polluted industries in the world not only led into unavoidable environmental damages, it imposed many economic costs in elimination of pollution. In other words, environmental rules in Europe led into transferring investment to developing countries and indirectly, these countries crated pollution haven but due to competition, in these countries, the environmental rule changes were slow and local authorities in these countries didn’t incline the execution of hard rules at the price of losing many jobs in their country.
Fertilizer and Nitrate industry
The structure of fertilizer industry has been change considerably in the past three decades. This industry emits nitrate oxide and Western Europe reduced fertilizer production (Bartzokas and Yarime (1999)). The technology development in 70, 80s modernized this industry and reduced many environmental issues in this industry. Due to strict environmental rules of EU, the companies couldn’t dump fertilizer waste to river or sea and many companies were obliged to omit phosphoric acid. This capacity reduction not only restricted the fertilizer, but also increase import from countries with lenient rules. In Europe, this industry was isolated and investors invested in other countries as these investors had no tendency to compensate the increase of environmental costs (Demandt (1999)).
Iron and steel industry
Traditionally, steel industry is national capital and is controlled by state countries and this shows the importance of steel industry. Since 70s, steel sector was with great changes. In Europe, privatization led into the reduce of area of this industry (Barton (1999)).
By reduction of domestic demand, steel export was of great importance. In the past decades, the investors in developing countries as China, Brazil and Korea were the most important actors of this industry. In the developed countries, the request for steel sheets was reduced considerably, much efforts were made to produce high quality steel. In Iron and Steel companies of EU, 10% of total investment is dedicated to environmental projects annually. In this sector, a combination of cheap labor costs, raw materials and low environmental costs led into the export of the product from Eastern Europe and central Europe to Western Europe markets in 90s. In iron and steel industry, the difference of environmental rules is not an important factor to select investment country. We can say, Are exports and productions in developing countries with high pollution or not? This question is answered in the next section.
Developing countries and pollution volume
If developing countries create pollution haven by reducing environmental rules, by increasing production in these countries, pollution is increased and polluted industries can go to these countries. The recent researches show that developing countries have high growth rate of pollution of industry productions in 70, 80s. However, pollution severity in developed countries is reduced (Oman (1999)). Pollution severity in developing countries in the east and south East Asia is higher than average mean but we can not say these changes are directed to developing countries due to movement of polluted industries or they show environmental outcomes in industrialization trend. If we review investment process in the late 60, and early 70s, before developed countries improve their environmental rules, we can say environmental standards have not negative impact on investment and export of severely polluted industries(Neumayer (2001)). The World Bankconducted a study on export of pollution severity from developed and developing countries. This institution evaluated import-export rate in 6 very polluted sectors, iron, steel, metal, chemical industry, oil, non-metal mineral products and paper in 53 countries and found that low income countries in 80,90 decades are turned into pollution haven but in high income countries, pollution is less (World Bank (1997)).Some factors are the reasons of such condition as: First, supervision costs and standards of pollution in
Mohsen Abdollahi and Samira Mohsenpour
Indian Journal Of Natural Sciences www.tnsroindia.org. © IJONS
Vol.5 / Issue 30 / June 2015 International Bimonthly ISSN: 0976 – 0997
7549
developing countries are high as these countries required modern equipment and labor force training. Second developed countries with high income are encountered with high request of people regarding clean air in developing countries with low income, they try to find job, than health and pollution reduction. Third, in developing countries, economic growth transfers agriculture economy to industrial economy and investment in industry sector and this condition leads to pollution increase but in developed countries, growth can transfer from industry to services and pollution is reduced
Race- to- the Top
Race to the top vs. race to bottom and pollution haven. This hypothesis states that investment and competition can improve environmental standards. If an important market performs high standards, its effect on is on issuing required standards to countries and producers related via investment and trading with the market (Kevin ). According to Portroude theory, direct foreign investment as a production factor developed economic growth in host country and provided access of host country to efficient technology in environment protection and access to clean and environment-friendly technology improved the quality of environment (Newell (2001)). This hypothesis has other titles as Pollution halo or California effect. The similarity is as USA by environmental standards issued such standards in other governments(Vogel (1995)). Based on this hypothesis, the governments in foreign investment apply minimum environmental standards to reduce economic adverse effects and can show enforcing rules for transparency of investment and environment management of environment (Adler (2012)). Thus, the host government can provides innovations to support the investment institutions showing the best performance in environment protection. For example, the host government by easy access to export and investment insurance credits can encourage investment that investors can put environment protection on priority. We can say based on liberalization theory, foreign trading and investment can lead to the increase of environmental standards and income increase can increase ability of countries for environment protection(Michael. Dorsch, Fergal McCann). Liberal investment can lead to the increase of achieving new technology and a competitive space is created. Sometimes, foreign investment by establishing environmental institutions for environment protection can include managerial and technical innovations (Jeffrey (2009)). This hypothesis shows that a government can consider standards for pollution control of cars and by liberal foreign investment and its transfer to other governments, these standards are used in other governments. Advanced companies creating factories in abroad have useful technologies for the environment and they force the local competitors to apply clean technologies to increase productivity in their production operation. Multi-national companies play important role in such condition as they are inclined to transfer clean production techniques from the countries with high standards to host governments not using such techniques. We cannot claim that all multi-national companies can use higher environmental standards during operation in other countries (Ruggie (2002)).
Most of companies importing capital have pollution control technology, educational plans and costs reduction and by achieving good position in public mind at international arena can increase economic growth and innovation can be increased and it is useful for environment (Wheeler (2000)). In addition, performance rules can create new ways and the companies can follow environmental goals in other governments and this can makes international collaborations among countries to improve environment. Also, these groups have good relation with environmental groups. In terms of the first group, achieving profit and from second type, friendship with nature is the motivation of collaboration. Achieving high standards is for the benefit of environment and the sectors taking benefit. In addition, by increasing income, people demand for clean environment. This shows inverse U-shape relation between environment destruction and economic growth as called Kozentes environment curve. In other words, by increasing economic power in society, environment destruction is increased. After achieving maximum pollution, as awareness to environment destruction or moving to service-based economy, curve descending trend is started.
Developing countries have different problems regarding environment standards and environment standards of export goods markets are not clear and the government defining standards doesn’t give adequate data or they don’t
Mohsen Abdollahi and Samira Mohsenpour
Indian Journal Of Natural Sciences www.tnsroindia.org. © IJONS
Vol.5 / Issue 30 / June 2015 International Bimonthly ISSN: 0976 – 0997
7550
give required warning to change their method. In some cases, with clear standards, their observing is problematic as they are determined at higher level of international agreed level(Habibi (2009)) . It is possible the standards are common but there are not complex facilities in the exporting countries. Thus, costly trips of foreign inspectors (as the specific problem of less developed countries) can be considered or with internal inspectors, they are not highly qualified.All these problems show that environmental standards are competitive issue for most of developing countries and they are barriers for export markets. Also, investment competition can show most of investors for execution of suitable environmental policies.
CONCLUSION
From economic aspects, investment is vital sector of economic growth and plays important role in sustainable development. Investment should be as human being with improving life standards can protect environment. This issue should be considered that formal and informal rules, policies and norms on investment play important role in determining social effects, environmental and economic in foreign investment.
Based on plan 21, investment is necessary for economic growth of less developed countries and sustainable development needs the increase of private foreign investment in infrastructural resources. It is expected that foreign investment improves managerial abilities, reduces foreign exchange and creates balance in payment in less developed countries. To absorb foreign investment, they reduce environmental rules. One of the important issues is pollution haven. In this theory, the countries with low environmental rules are called pollution haven as the investors look for the countries with less costly investment and this makes foreign countries attempting to pollute the environment.
High production cost due to environmental rules as taxes on pollution, is a motivation for multinational companies transferring their products to other countries with weak environmental rules (most of developing countries). In other words, low production costs is one of the motivations of absorbing foreign investment to the countries with cheap natural resources or without strict environmental policies. Some governments follow race to the up. This theory states that strong environmental policies can improve competition in market and new technologies.
Some theorists believe that environmental rules are affected by society income and if income of society is increased, environment quality is also increased. Trading liberalization can cause that developing countries use new technologies leading to a clean production trend and such condition leads to allocation of resources, improvement of economic growth and public welfare.
In addition, although pollution control costs are of great importance for managers, owners of factories and investment projects, the main factor in decision making of activity location is not considered and pollution control doesn’t impose extra costs on commercial companies. and the low-income countries with weak environmental rules, as there are not such rules, punish dangerous pollutants and NGOs or civil society groups follow informal rules as the investors are convinced to behave based on environmental and social norms. Also, local communities via economic, social and political channels can punish them and even the banks can avoid giving credits to them and consumers avoid purchasing the products of companies as contaminating. Thus, some factors as costs of raw materials, labor, transparent rules in support of ownership rights are of great importance in investment considerations. Thus in such condition that reduction of environmental rules can not encourage foreign investment, the race to up is considered by governments as direct foreign investment not only leads to rapid economic growth of host country, it provides access to efficient technology in environment protection and transnational companies achieving a good image in public mind by resorting to clean technologies attempt to reduce pollution and even force the competitors to use these technologies and this can improve environment quality and economic growth.
Mohsen Abdollahi and Samira Mohsenpour

Indian Journal Of Natural Sciences www.tnsroindia.org. © IJONS
Vol.5 / Issue 30 / June 2015 International Bimonthly ISSN: 0976 – 0997
7551
REFERENCES
1. Asghari, M. (2014).The role of corruption and direct foreign investment in environment quality. Economic researches journal. NO. 14.
2. Habibi, M. (2009).International trade and environment.Andishe publications. Peace group of human rights and UNESCO democracy. ShahidBehesht University.Environmental rights.Dadgostar.
3. Doboson, A. (1999).Fairness and Futurity: Essays on Environmental Sustainability and Social Justice (Oxford University Press.
4. Shemberg, A. (2008).Stabilization Clauses and Human Rights: A Research Project Conduct for IFC and the United Nationas Special Representative to the Secretary General on Business and tluman Rights, 11 March 2008 (UN Report).
5. Aminu, A. M. (2005).'' Foreign Direct Investment and the Environment: Pollution Haven Hypothesis Revisited'', Paper Prepared for eight annual Conference on Global Economic Analysis, Lubeck, Germany, P. 3.
6. Bartzokas, A., Yarime, M. (1999).The European Fertilizer Industry, A Research Project for the EU on Environmental Regulation, Globalization on Productions and Technological Change, United Nations University, Institute for New Technologies, Brussels
7. Barton, J. R.(1999). Environmental Regulations, Globalization of Production and Technological Change in the Iron and Steel Sector, Paper Presented at a Conference on Environmental Regulations, Globalization of Production and Technological Change, University of East Anglia, 1-2.
8. Charles P. Oman (1999). '' Policy Competition for Foreign Direct Investment'', P. 5. 9. Clive Pointing, (1991).A Green History of the World.The Environment Collapse of Great Civilisation, Penguin
Books. 10. Magraw, D. B., Hawke, L. D. (2007). '' Sustainable Development'', in D. Bodansky, J. Brun'ee and E. Hey (eds),
The Oxford Hand book of International Environmental Law. 11. Vogel, D. (1995). '' Trading up: Consumer and Environmental Regulation in the Global Economy'', Harvard
University Press. 12. Wheeler, D. (2007). '' Racing to the Bottom? Foreign Investment and Air Pollution in Developing Countries''. 13. Demandt, I. (1999). The World Phosphate Fertilizer Industry, A Research Project for the EU on Environmental
Regulation, Globalization of Productions and Technological Change, United Nation University, Institute foe new Technologies Brussels
14. Neumayer, E. (2001). '' Pollution Havens: An Analysis of Policy Option for Dealing with Elusive Phenomenon'', Journal of Environment & Development, 10: 2.
15. Neumayer, E. (2001).'' Pollution: An Analysis of Policy Option for Dealing with Elusive Phenomenon'' , Journal of Environment & Development, 10: 2.
16. Erlinda, M.,Medalla and Dorothea Lazaro, C. (2005). '' Does Trade Lead to a Race to the Bottom in Environmental Standards? Another Lock at the Issues'', Philippine Institute for Development Studies, Discussion Paper Series 23.
17. Sheldon, I. (2006). '' Trade and Environmental Policy: A Pollution Havens?'', Journal of Agricultural Economics, 57: 3.
18. Jeffrey, F. (2009). '' Environmental Effects of International Trade'', Paper for Presentation for Swedish Globalization Council, January 20.
19. Adler, H. (2012). '' Interstate Competition and the Race to the Top'', case western Reserve University, Faculty Publication, P.2.
20. Gordon, K., Pohl, J. (2011).''Environmental Concerns in International Investment Agreements: A Survey'. 21. Kevin R. Gray ''Foreign Direct Investment and Environmental Imports: in the Debate Over?'' 22. Knutsen, H. G.(1999). Leather Tanning, Environmental Regulations and Competitiveness in Europe: A
Comparative Study of Germany, Italy and Portugal'', F. I. L Working Papers, No 17, University of OSLO, OSLO.
Mohsen Abdollahi and Samira Mohsenpour
Indian Journal Of Natural Sciences www.tnsroindia.org. © IJONS
Vol.5 / Issue 30 / June 2015 International Bimonthly ISSN: 0976 – 0997
7552
23. Eric Peterson, L., Kevin R. Gray, (2003). '' International Human Right in Bilateral Investment Treaties and in Investment Treaty Arbitration'' , A Research Paper Prepared by International Institute for Sustainable Development (IISD) for the Swiss Department of Foreign Affairs, PP. 32-27.
24. Lyuba, Z. (2008). ''Havens, Halos and Spagetti: untangling the evidence about Foreign Direct Investment and the Environment'', Published in Multinational Enterprises and Host Economic, 2.
25. Michael. D., Fergal, M. '' Foreign Investment, Regulation and Democracy: Another Race to the Bottom?'', Department of Economics, The American University of Paris.
26. Schrijver, N.(2008).'' The Evolution of Sustainable Development in International Law: Inception Meaning ans Status'', in Recueil de Cours de L' Academie de droit International, 329, P. 93
27. United Nations Environment Programme, (2011).Towards a Green Economy: Pathway to Sustainable Development and Poverty Eradication .
28. Newell, P. (2001). " Managing Multinational : The Governance of Investment for Invironment" , Journal of International Development,13(7).
29. Odegard, J. T. (1999). '' Leather Tanning in Brazil]], F. I. L Working Paper, No. 19, University of OSLO, OSLO 30. Carson, R. (1966).Silent Spring K. E. Boulding, '' The Economics of the Coming Spaceship Earth'', in H. Jarrett
(ed.), Environmental Quality in a Growing Economy. 31. Richard L, R. (1992). '' Rehabilitating Interstate Competition: Rethinking the Race- to- the- Bottom Rationale for
Federal Environmental Regulation'' Paperwork. 32. Ruggie,J. (2002).''Trade, Sustainability and Global Governance'', Columbia Journal of Environmental Law, 27. 33. UmedTemurshoev, '' Pollution Haven Hypothesis or Factor Endowment Hypothesis'' Charles University, Center
for Economic Research and Graduate Education (CERGE), Working Paper Series. 34. Convention on Wetlands of International Importance Especially as waterfowl Habitat, 2 February 1971, 996
UNTS 945. 35. Convention for the Prevention of Marine Pollution by Dumping of Wastes and other Matter, 29 December 1972,
as modified by the Protocol of 7 November 1996, 1046 UNTS 120 36. Convention Concerning the Protection of the World Cultural and Natural Heritage, 16 November 1970, 1037
UNTS 151 37. Convention on International Trade in Endangered Specied of Wild Fauna and Flora, 3 March 1973, 983 UNTS
243 38. Convention for the Prevention of pollution from Ships 17 February 1973, as Modified by the Protocol 1978
Relating thereto, 17 February 1978, UNTS 1340 I- 22484 39. International Union for Conservation of Nature, (1987).United Nations Environment Programme and World
Wildlife Fund, World Conservation Strategy. Living Resource Conservation for Sustainable Development, 1980; Report of the World Commission on Environment and Development: Our Common Future.
40. Canada- Romania BIT (1996) 41. Canada- Peru BIT, 2006 42. Canada- Latvia BIT (2009) 43. United States- Uruguay BIT (2005) 44. United States- Rwanda BIT (2008)
Mohsen Abdollahi and Samira Mohsenpour

Indian Journal Of Natural Sciences www.tnsroindia.org. © IJONS
Vol.5 / Issue 30 / June 2015 International Bimonthly ISSN: 0976 – 0997
7553
Heating Energy Saving in Long Delay HVAC Systems Based on Reset PI+CI Controller
Maryam Fakour1* and Amin Ramezani2
1Department of Electrical and Computer Engineering, Science and Research Branch, Islamic Azad University, Tehran, Iran 2Ph.D. in Control Systems Theory, Assistant Professor of Control Engineering, Department, School of Electrical and Computer Engineering, Tarbiat Modares University (TMU), Tehran, Iran. Received: 15 Mar 2015 Revised: 16 Apr 2015 Accepted: 29 May 2015 *Address for correspondence Maryam Fakour Department of Electrical and Computer Engineering, Science and Research Branch, Islamic Azad University, Tehran, Iran.
This is an Open Access Journal / article distributed under the terms of the Creative Commons Attribution License (CC BY-NC-ND 3.0) which permits unrestricted use, distribution, and reproduction in any medium, provided the original work is properly cited. All rights reserved.
An optimal multivariable reset control for HVAC systems has been proposed in this paper. The process of HVAC control system can be described as a first order plus dead time model for each element in transfer function matrix. A reset controller could be designed to solve optimization problems. In order to achieve this, focus is on the use of PI+CI and the tuning rules are IMC method proposed by Skogestad. To evaluate the effectiveness of reset controller, the proposed method has been compared with PI controller. The simulation results justified that the reset controller is more effective than the PI controller. The results have been presented on the 4-zone HVAC system.
Key words: HVAC system, reset control, multivariable system, energy saving
INTRODUCTION
As the energy consumption in the world is growing and the energy resources are reducing, investigation of new methods to reduce the loss of energy is essential. HVAC (heating, ventilating and air conditioning) is one of the biggest energy consumers in buildings, therefore control of HVAC system is important and many research are focused on this field.
Adaptive control, fuzzy control, robust control, multivariable control and so forth can be related to controlling of the HVAC systems and reducing energy consumption (Afram & Janabi-Sharifi, 2014; Anderson et al., 2002; Bai & Zhang,
RESEARCH ARTICLE
ABSTRACT
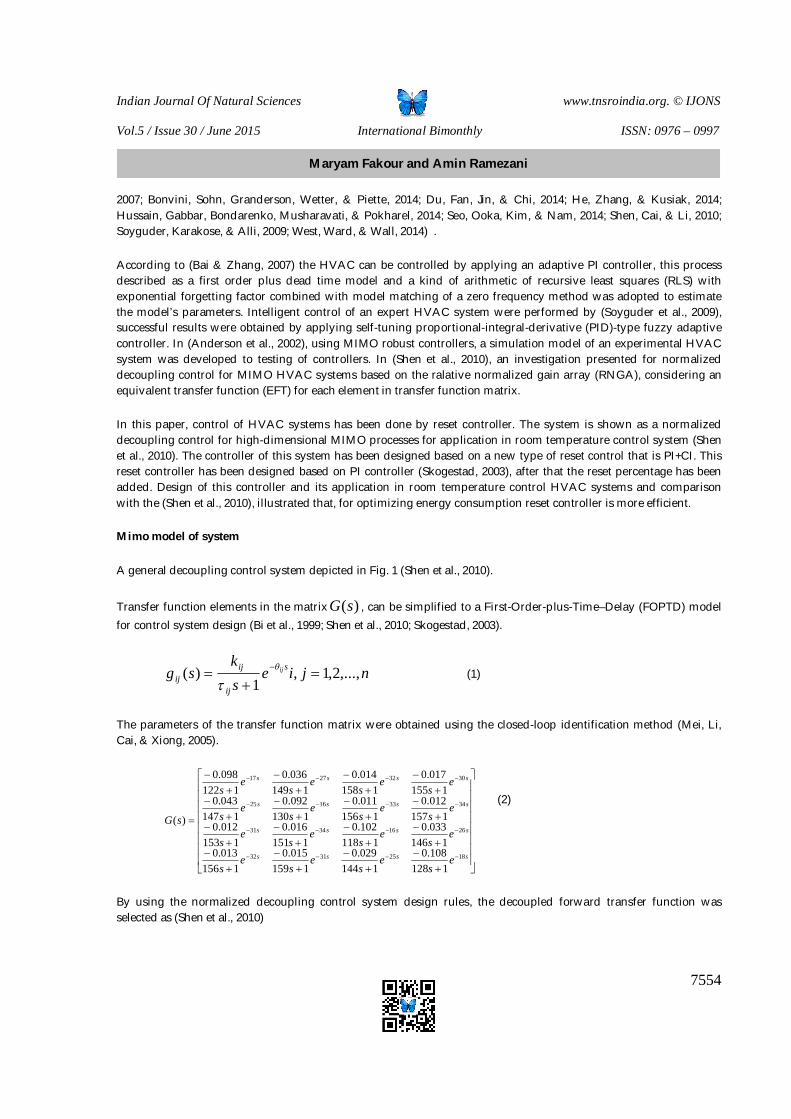
Indian Journal Of Natural Sciences www.tnsroindia.org. © IJONS
Vol.5 / Issue 30 / June 2015 International Bimonthly ISSN: 0976 – 0997
7554
2007; Bonvini, Sohn, Granderson, Wetter, & Piette, 2014; Du, Fan, Jin, & Chi, 2014; He, Zhang, & Kusiak, 2014; Hussain, Gabbar, Bondarenko, Musharavati, & Pokharel, 2014; Seo, Ooka, Kim, & Nam, 2014; Shen, Cai, & Li, 2010; Soyguder, Karakose, & Alli, 2009; West, Ward, & Wall, 2014) .
According to (Bai & Zhang, 2007) the HVAC can be controlled by applying an adaptive PI controller, this process described as a first order plus dead time model and a kind of arithmetic of recursive least squares (RLS) with exponential forgetting factor combined with model matching of a zero frequency method was adopted to estimate the model’s parameters. Intelligent control of an expert HVAC system were performed by (Soyguder et al., 2009), successful results were obtained by applying self-tuning proportional-integral-derivative (PID)-type fuzzy adaptive controller. In (Anderson et al., 2002), using MIMO robust controllers, a simulation model of an experimental HVAC system was developed to testing of controllers. In (Shen et al., 2010), an investigation presented for normalized decoupling control for MIMO HVAC systems based on the ralative normalized gain array (RNGA), considering an equivalent transfer function (EFT) for each element in transfer function matrix.
In this paper, control of HVAC systems has been done by reset controller. The system is shown as a normalized decoupling control for high-dimensional MIMO processes for application in room temperature control system (Shen et al., 2010). The controller of this system has been designed based on a new type of reset control that is PI+CI. This reset controller has been designed based on PI controller (Skogestad, 2003), after that the reset percentage has been added. Design of this controller and its application in room temperature control HVAC systems and comparison with the (Shen et al., 2010), illustrated that, for optimizing energy consumption reset controller is more efficient.
Mimo model of system
A general decoupling control system depicted in Fig. 1 (Shen et al., 2010).
Transfer function elements in the matrix )(sG , can be simplified to a First-Order-plus-Time–Delay (FOPTD) model for control system design (Bi et al., 1999; Shen et al., 2010; Skogestad, 2003).
njiesk
sg s
ij
ijij
ij ,...,2,1,1
)(
(1)
The parameters of the transfer function matrix were obtained using the closed-loop identification method (Mei, Li, Cai, & Xiong, 2005).
ssss
ssss
ssss
ssss
es
es
es
es
es
es
es
es
es
es
es
es
es
es
es
es
sG
18253132
26163431
34331625
30322717
1128108.0
1144029.0
1159015.0
1156013.0
1146033.0
1118102.0
1151016.0
1153012.0
1157012.0
1156011.0
1130092.0
1147043.0
1155017.0
1158014.0
1149036.0
1122098.0
)(
(2)
By using the normalized decoupling control system design rules, the decoupled forward transfer function was selected as (Shen et al., 2010)
Maryam Fakour and Amin Ramezani
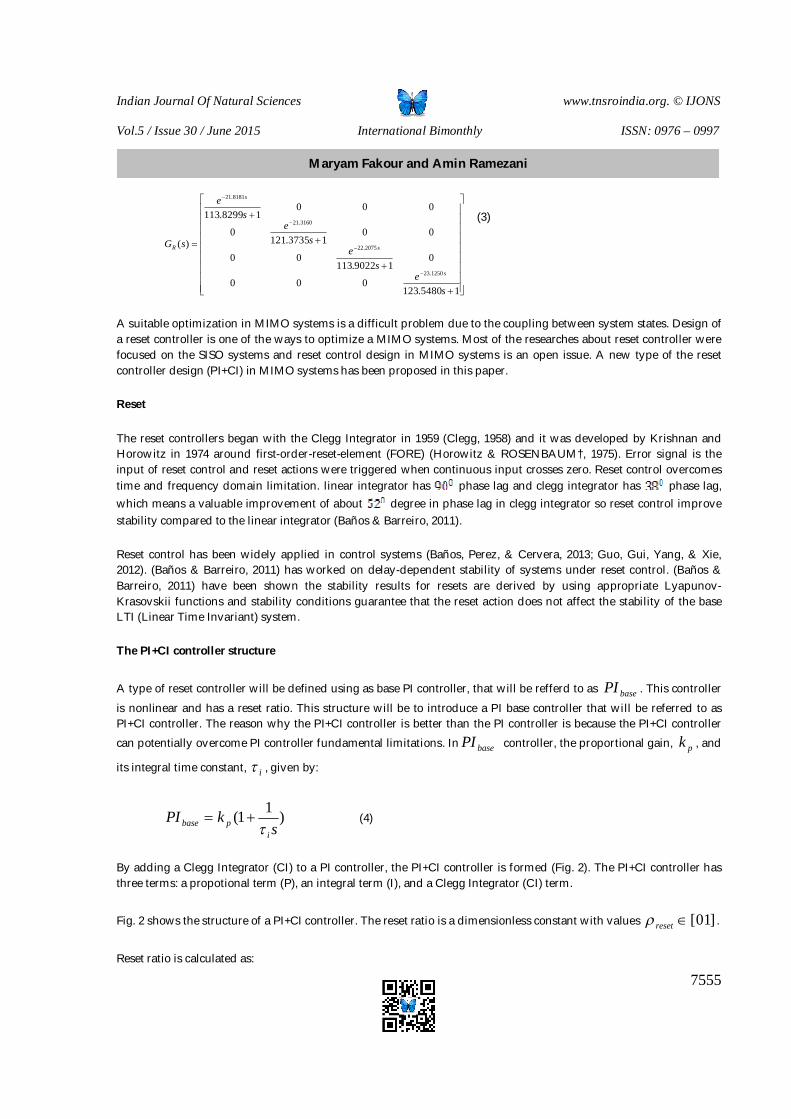
Indian Journal Of Natural Sciences www.tnsroindia.org. © IJONS
Vol.5 / Issue 30 / June 2015 International Bimonthly ISSN: 0976 – 0997
7555
15480.123000
019022.113
00
0013735.121
0
00018299.113
)(
1250.23
2075.22
3160.21
8181.21
se
se
se
se
sG
s
s
s
R
(3)
A suitable optimization in MIMO systems is a difficult problem due to the coupling between system states. Design of a reset controller is one of the ways to optimize a MIMO systems. Most of the researches about reset controller were focused on the SISO systems and reset control design in MIMO systems is an open issue. A new type of the reset controller design (PI+CI) in MIMO systems has been proposed in this paper.
Reset
The reset controllers began with the Clegg Integrator in 1959 (Clegg, 1958) and it was developed by Krishnan and Horowitz in 1974 around first-order-reset-element (FORE) (Horowitz & ROSENBAUM†, 1975). Error signal is the input of reset control and reset actions were triggered when continuous input crosses zero. Reset control overcomes time and frequency domain limitation. linear integrator has phase lag and clegg integrator has phase lag, which means a valuable improvement of about degree in phase lag in clegg integrator so reset control improve stability compared to the linear integrator (Baños & Barreiro, 2011).
Reset control has been widely applied in control systems (Baños, Perez, & Cervera, 2013; Guo, Gui, Yang, & Xie, 2012). (Baños & Barreiro, 2011) has worked on delay-dependent stability of systems under reset control. (Baños & Barreiro, 2011) have been shown the stability results for resets are derived by using appropriate Lyapunov-Krasovskii functions and stability conditions guarantee that the reset action does not affect the stability of the base LTI (Linear Time Invariant) system.
The PI+CI controller structure
A type of reset controller will be defined using as base PI controller, that will be refferd to as basePI . This controller
is nonlinear and has a reset ratio. This structure will be to introduce a PI base controller that will be referred to as PI+CI controller. The reason why the PI+CI controller is better than the PI controller is because the PI+CI controller can potentially overcome PI controller fundamental limitations. In basePI controller, the proportional gain, pk , and
its integral time constant, i , given by:
)11(s
kPIi
pbase (4)
By adding a Clegg Integrator (CI) to a PI controller, the PI+CI controller is formed (Fig. 2). The PI+CI controller has three terms: a propotional term (P), an integral term (I), and a Clegg Integrator (CI) term.
Fig. 2 shows the structure of a PI+CI controller. The reset ratio is a dimensionless constant with values ]01[reset .
Reset ratio is calculated as:
Maryam Fakour and Amin Ramezani

Indian Journal Of Natural Sciences www.tnsroindia.org. © IJONS
Vol.5 / Issue 30 / June 2015 International Bimonthly ISSN: 0976 – 0997
7556
e
ereset
1
(5)
and is as below:
21 kk p
(6)
i
p kk
2 (7)
Where pk and i tuning by the method described in (Skogestad, 2003) for a First-Order-pluse-Time-Delay (FOPTD)
model when time delay is much smaller than its time constant ( h ).
Case study
To examine the performance of a proposed reset controller, HVAC system including 4-zones has been used Fig. 3 (Shen et al., 2010).
This system has 4 rooms. In each room a temperature sensor ( RT ), supply air control damper ( DM ), exhausted air
vent (VT ) on the ceiling of the room and one air pressure sensor ( AP ) are installed. The manipulated inputs for the
system are the positions of the dampers ( 321 ,, DMDMDM and 4DM ) (Shen et al., 2010).
Simulation Result
Considering the Eq. (3) and Fig. 1. For each element of )(sGR , reset structure have to be determined (Fig. 2) and for reset structure, reset ratio needs to be calculated.
In Table 1, tuning rules of reset control for each elements of )(sGR Eq. (3), has been shown:
To evaluate the effectiveness of reset controller, the proposed method has been compared with PI controller designed using the method described in (Shen et al., 2010), and yields:
s
s
s
s
sGC
0136.06784.1000
001415.0611.100
0001474.0789.10
0000144.0639.1
)(
(8)
Maryam Fakour and Amin Ramezani
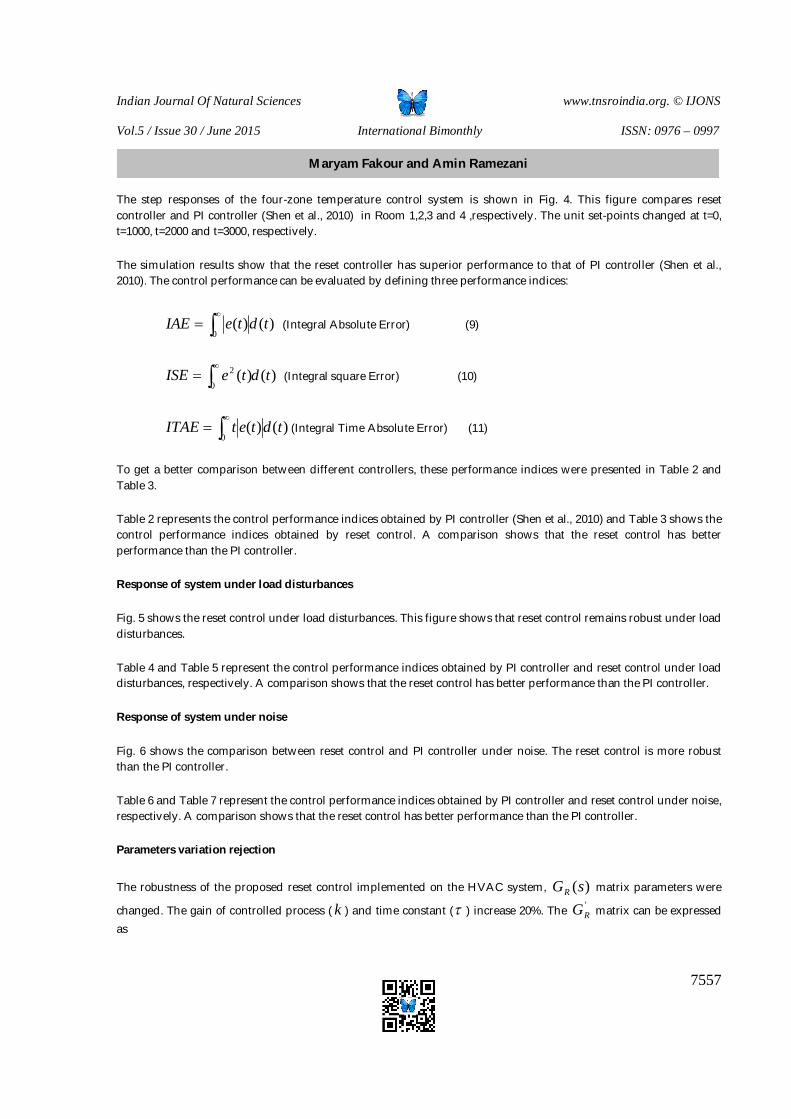
Indian Journal Of Natural Sciences www.tnsroindia.org. © IJONS
Vol.5 / Issue 30 / June 2015 International Bimonthly ISSN: 0976 – 0997
7557
The step responses of the four-zone temperature control system is shown in Fig. 4. This figure compares reset controller and PI controller (Shen et al., 2010) in Room 1,2,3 and 4 ,respectively. The unit set-points changed at t=0, t=1000, t=2000 and t=3000, respectively.
The simulation results show that the reset controller has superior performance to that of PI controller (Shen et al., 2010). The control performance can be evaluated by defining three performance indices:
)()(0
tdteIAE
(Integral Absolute Error) (9)
)()(0
2 tdteISE
(Integral square Error) (10)
)()(0
tdtetITAE
(Integral Time Absolute Error) (11)
To get a better comparison between different controllers, these performance indices were presented in Table 2 and Table 3.
Table 2 represents the control performance indices obtained by PI controller (Shen et al., 2010) and Table 3 shows the control performance indices obtained by reset control. A comparison shows that the reset control has better performance than the PI controller.
Response of system under load disturbances
Fig. 5 shows the reset control under load disturbances. This figure shows that reset control remains robust under load disturbances.
Table 4 and Table 5 represent the control performance indices obtained by PI controller and reset control under load disturbances, respectively. A comparison shows that the reset control has better performance than the PI controller.
Response of system under noise
Fig. 6 shows the comparison between reset control and PI controller under noise. The reset control is more robust than the PI controller.
Table 6 and Table 7 represent the control performance indices obtained by PI controller and reset control under noise, respectively. A comparison shows that the reset control has better performance than the PI controller.
Parameters variation rejection
The robustness of the proposed reset control implemented on the HVAC system, )(sGR matrix parameters were
changed. The gain of controlled process ( k ) and time constant ( ) increase 20%. The 'RG matrix can be expressed
as
Maryam Fakour and Amin Ramezani
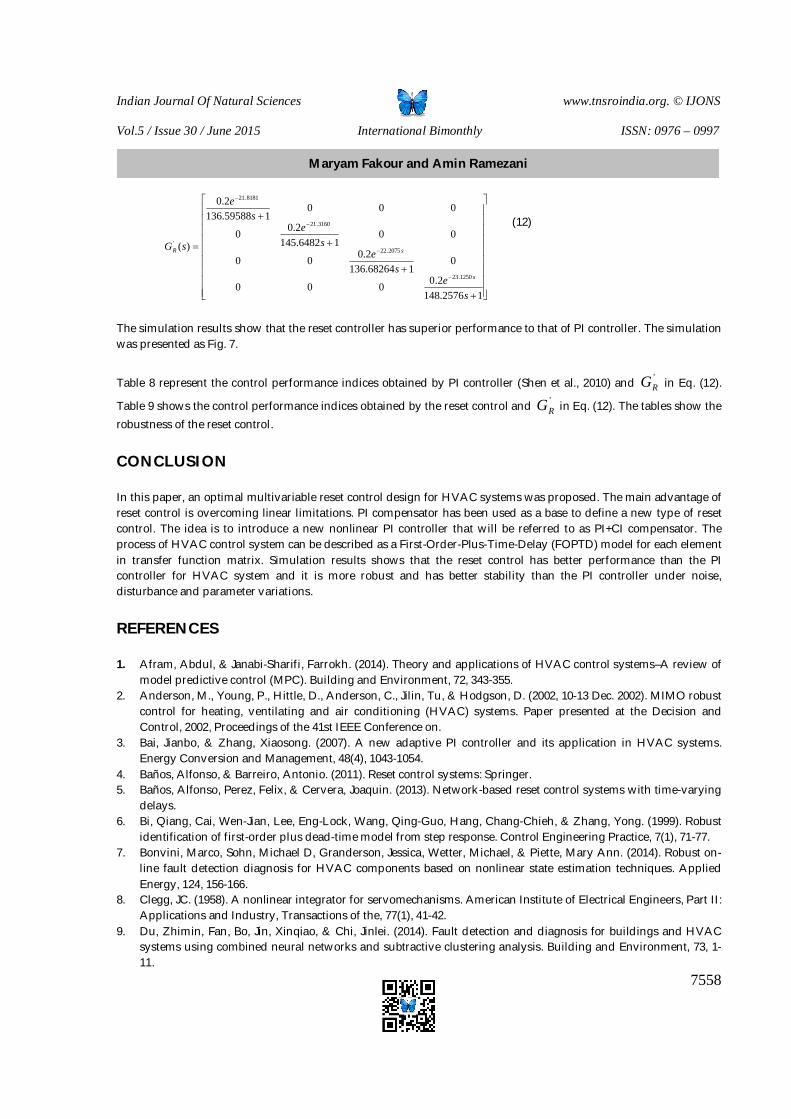
Indian Journal Of Natural Sciences www.tnsroindia.org. © IJONS
Vol.5 / Issue 30 / June 2015 International Bimonthly ISSN: 0976 – 0997
7558
12576.1482.0000
0168264.136
2.000
0016482.145
2.00
000159588.136
2.0
)(
1250.23
2075.22
3160.21
8181.21
'
se
se
se
se
sG
s
sR
(12)
The simulation results show that the reset controller has superior performance to that of PI controller. The simulation was presented as Fig. 7.
Table 8 represent the control performance indices obtained by PI controller (Shen et al., 2010) and 'RG in Eq. (12).
Table 9 shows the control performance indices obtained by the reset control and 'RG in Eq. (12). The tables show the
robustness of the reset control.
CONCLUSION
In this paper, an optimal multivariable reset control design for HVAC systems was proposed. The main advantage of reset control is overcoming linear limitations. PI compensator has been used as a base to define a new type of reset control. The idea is to introduce a new nonlinear PI controller that will be referred to as PI+CI compensator. The process of HVAC control system can be described as a First-Order-Plus-Time-Delay (FOPTD) model for each element in transfer function matrix. Simulation results shows that the reset control has better performance than the PI controller for HVAC system and it is more robust and has better stability than the PI controller under noise, disturbance and parameter variations.
REFERENCES
1. Afram, Abdul, & Janabi-Sharifi, Farrokh. (2014). Theory and applications of HVAC control systems–A review of model predictive control (MPC). Building and Environment, 72, 343-355.
2. Anderson, M., Young, P., Hittle, D., Anderson, C., Jilin, Tu, & Hodgson, D. (2002, 10-13 Dec. 2002). MIMO robust control for heating, ventilating and air conditioning (HVAC) systems. Paper presented at the Decision and Control, 2002, Proceedings of the 41st IEEE Conference on.
3. Bai, Jianbo, & Zhang, Xiaosong. (2007). A new adaptive PI controller and its application in HVAC systems. Energy Conversion and Management, 48(4), 1043-1054.
4. Baños, Alfonso, & Barreiro, Antonio. (2011). Reset control systems: Springer. 5. Baños, Alfonso, Perez, Felix, & Cervera, Joaquin. (2013). Network-based reset control systems with time-varying
delays. 6. Bi, Qiang, Cai, Wen-Jian, Lee, Eng-Lock, Wang, Qing-Guo, Hang, Chang-Chieh, & Zhang, Yong. (1999). Robust
identification of first-order plus dead-time model from step response. Control Engineering Practice, 7(1), 71-77. 7. Bonvini, Marco, Sohn, Michael D, Granderson, Jessica, Wetter, Michael, & Piette, Mary Ann. (2014). Robust on-
line fault detection diagnosis for HVAC components based on nonlinear state estimation techniques. Applied Energy, 124, 156-166.
8. Clegg, JC. (1958). A nonlinear integrator for servomechanisms. American Institute of Electrical Engineers, Part II: Applications and Industry, Transactions of the, 77(1), 41-42.
9. Du, Zhimin, Fan, Bo, Jin, Xinqiao, & Chi, Jinlei. (2014). Fault detection and diagnosis for buildings and HVAC systems using combined neural networks and subtractive clustering analysis. Building and Environment, 73, 1-11.
Maryam Fakour and Amin Ramezani

Indian Journal Of Natural Sciences www.tnsroindia.org. © IJONS
Vol.5 / Issue 30 / June 2015 International Bimonthly ISSN: 0976 – 0997
7559
10. Guo, Yuqian, Gui, Weihua, Yang, Chunhua, & Xie, Lihua. (2012). Stability analysis and design of reset control systems with discrete-time triggering conditions. Automatica, 48(3), 528-535.
11. He, Xiaofei, Zhang, Zijun, & Kusiak, Andrew. (2014). Performance optimization of HVAC systems with computational intelligence algorithms. Energy and Buildings, 81, 371-380.
12. Horowitz, Isaac, & ROSENBAUM†, PATRICK. (1975). Non-linear design for cost of feedback reduction in systems with large parameter uncertainty†. International Journal of Control, 21(6), 977-1001.
13. Hussain, Sajid, Gabbar, Hossam A, Bondarenko, Daniel, Musharavati, Farayi, & Pokharel, Shaligram. (2014). Comfort-based fuzzy control optimization for energy conservation in HVAC systems. Control Engineering Practice, 32, 172-182.
14. Mei, Hua, Li, Shaoyuan, Cai, Wen-Jian, & Xiong, Qiang. (2005). Decentralized closed-loop parameter identification for multivariable processes from step responses. Mathematics and computers in Simulation, 68(2), 171-192.
15. Seo, Janghoo, Ooka, Ryozo, Kim, Jeong Tai, & Nam, Yujin. (2014). Optimization of the HVAC system design to minimize primary energy demand. Energy and Buildings, 76, 102-108.
16. Shen, Yuling, Cai, Wen-Jian, & Li, Shaoyuan. (2010). Normalized decoupling control for high-dimensional MIMO processes for application in room temperature control HVAC systems. Control Engineering Practice, 18(6), 652-664.
17. Skogestad, Sigurd. (2003). Simple analytic rules for model reduction and PID controller tuning. Journal of process control, 13(4), 291-309.
18. Soyguder, Servet, Karakose, Mehmet, & Alli, Hasan. (2009). Design and simulation of self-tuning PID-type fuzzy adaptive control for an expert HVAC system. Expert Systems with Applications, 36(3), 4566-4573.
19. West, Samuel R, Ward, John K, & Wall, Josh. (2014). Trial results from a model predictive control and optimisation system for commercial building HVAC. Energy and Buildings, 72, 271-279.
Maryam Fakour and Amin Ramezani

Indian Journal Of Natural Sciences www.tnsroindia.org. © IJONS
Vol.5 / Issue 30 / June 2015 International Bimonthly ISSN: 0976 – 0997
7560
1r
2r
nr
1y
2y
ny
Fig. 1 Block diagram of a decoupling control system (Shen et al., 2010)
ix
Fig. 2 PI+CI controller structure
1DM
2DM
3DM
4DM4VT
3VT1VT
2VT
AP
Fig. 3 Four-zone HVAC system (Shen et al., 2010).
)(sGC
)(sGR
Maryam Fakour and Amin Ramezani
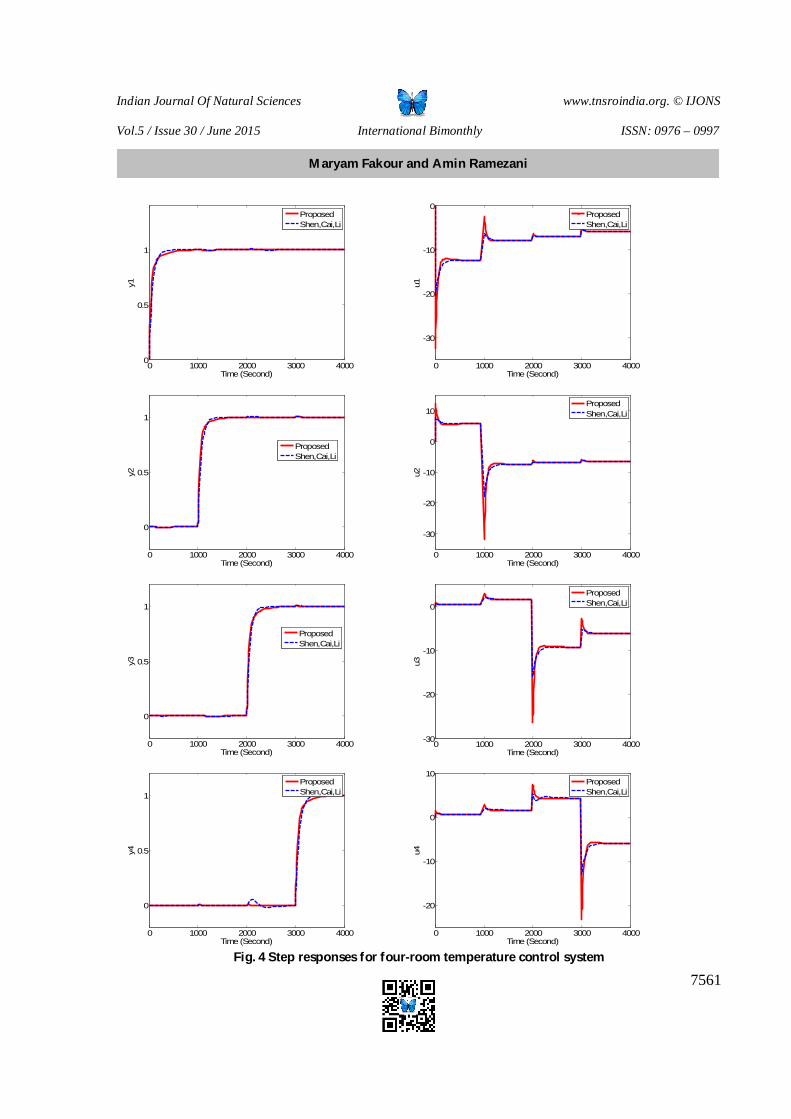
Indian Journal Of Natural Sciences www.tnsroindia.org. © IJONS
Vol.5 / Issue 30 / June 2015 International Bimonthly ISSN: 0976 – 0997
7561
0 1000 2000 3000 40000
0.5
1
Time (Second)
y1
ProposedShen,Cai,Li
0 1000 2000 3000 4000
-30
-20
-10
0
Time (Second)
u1
ProposedShen,Cai,Li
0 1000 2000 3000 4000
0
0.5
1
Time (Second)
y2
ProposedShen,Cai,Li
0 1000 2000 3000 4000
-30
-20
-10
0
10
Time (Second)
u2
ProposedShen,Cai,Li
0 1000 2000 3000 4000
0
0.5
1
Time (Second)
y3
ProposedShen,Cai,Li
0 1000 2000 3000 4000-30
-20
-10
0
Time (Second)
u3
ProposedShen,Cai,Li
0 1000 2000 3000 4000
0
0.5
1
Time (Second)
y4
ProposedShen,Cai,Li
0 1000 2000 3000 4000
-20
-10
0
10
Time (Second)
u4
ProposedShen,Cai,Li
Fig. 4 Step responses for four-room temperature control system
Maryam Fakour and Amin Ramezani
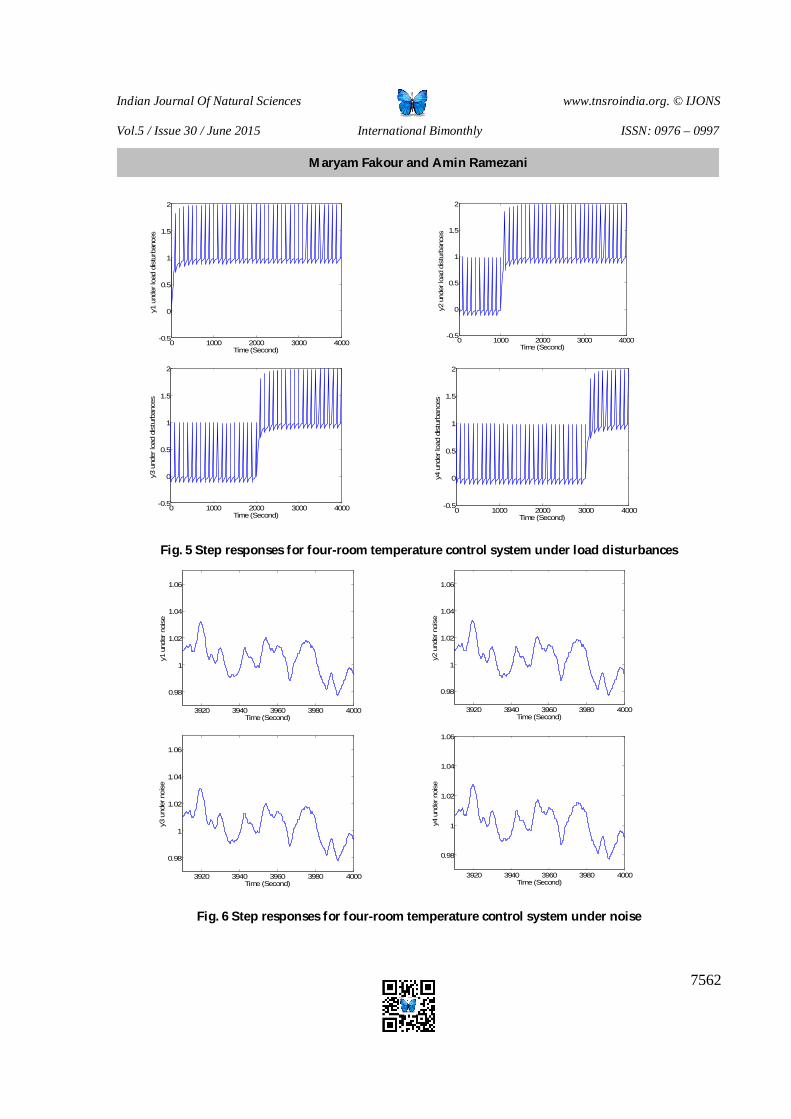
Indian Journal Of Natural Sciences www.tnsroindia.org. © IJONS
Vol.5 / Issue 30 / June 2015 International Bimonthly ISSN: 0976 – 0997
7562
0 1000 2000 3000 4000-0.5
0
0.5
1
1.5
2
Time (Second)
y1 u
nder
load
dis
turb
ance
s
0 1000 2000 3000 4000
-0.5
0
0.5
1
1.5
2
Time (Second)
y2 u
nder
load
dis
turb
ance
s
0 1000 2000 3000 4000-0.5
0
0.5
1
1.5
2
Time (Second)
y3 u
nder
load
dis
turb
ance
s
0 1000 2000 3000 4000-0.5
0
0.5
1
1.5
2
Time (Second)
y4 u
nder
load
dis
turb
ance
s
Fig. 5 Step responses for four-room temperature control system under load disturbances
3920 3940 3960 3980 4000
0.98
1
1.02
1.04
1.06
Time (Second)
y1 u
nder
noi
se
3920 3940 3960 3980 4000
0.98
1
1.02
1.04
1.06
Time (Second)
y2 u
nder
noi
se
3920 3940 3960 3980 4000
0.98
1
1.02
1.04
1.06
Time (Second)
y3 u
nder
noi
se
3920 3940 3960 3980 4000
0.98
1
1.02
1.04
1.06
Time (Second)
y4 u
nder
noi
se
Fig. 6 Step responses for four-room temperature control system under noise
Maryam Fakour and Amin Ramezani
Indian Journal Of Natural Sciences www.tnsroindia.org. © IJONS
Vol.5 / Issue 30 / June 2015 International Bimonthly ISSN: 0976 – 0997
7563
0 1000 2000 3000 4000 5000 60000
0.1
0.2
0.3
0.4
0.5
0.6
0.7
0.8
0.9
1
Time (Second)
y1 w
ith p
aram
eter
var
iatio
n
Reset ControllerPI Controller
0 1000 2000 3000 4000 5000 6000
0
0.1
0.2
0.3
0.4
0.5
0.6
0.7
0.8
0.9
1
Time (Second)
y2 w
ith p
aram
eter
var
iatio
n
Reset ControllerPI Controller
0 1000 2000 3000 4000 5000 60000
0.1
0.2
0.3
0.4
0.5
0.6
0.7
0.8
0.9
1
Time (Second)
y3 w
ith p
aram
eter
var
iatio
n
Reset ControllerPI Controller
0 1000 2000 3000 4000 5000 6000
0
0.1
0.2
0.3
0.4
0.5
0.6
0.7
0.8
0.9
1
Time (Second)
y4 w
ith p
aram
eter
var
iatio
n
Reset ControllerPI Controller
Fig. 7 Step responses for four-room temperature with parameter variation Table1.Tuning of Reset control for )(sGR matrix.
174.5448 2.6086 0.01048
170.528 2.847 0.00923
177.66 2.564 0.01085
185 2.6713 0.01014
Maryam Fakour and Amin Ramezani
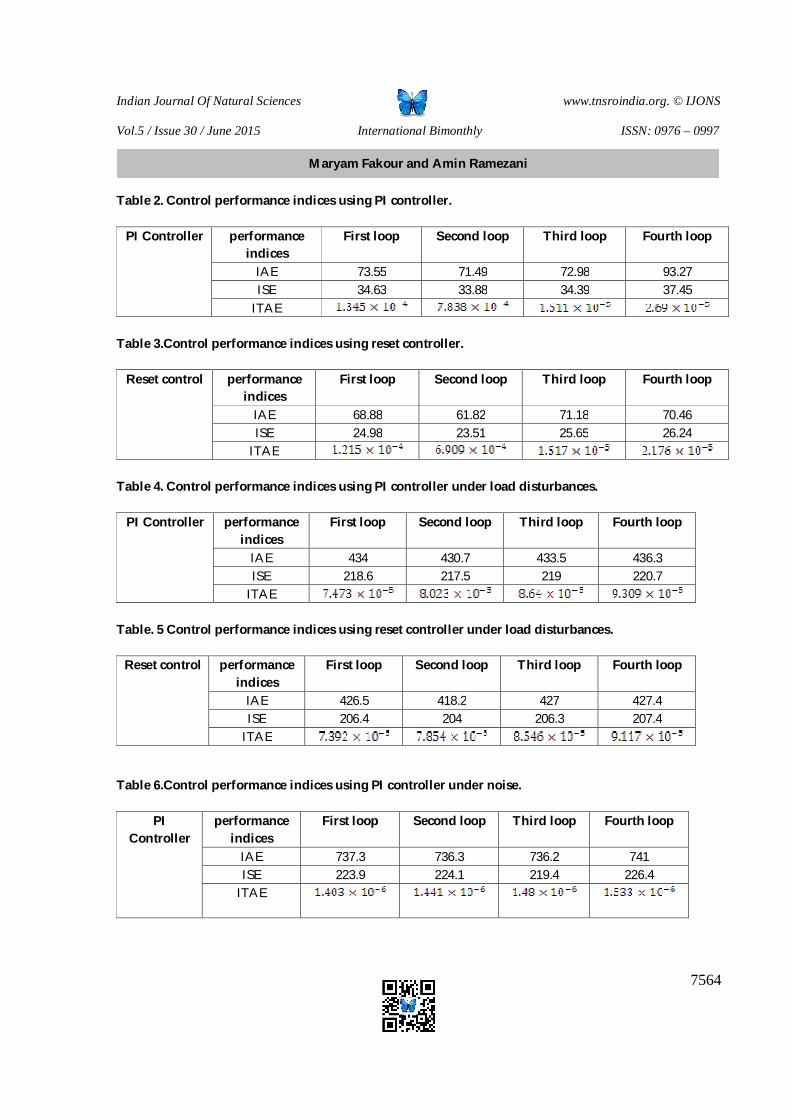
Indian Journal Of Natural Sciences www.tnsroindia.org. © IJONS
Vol.5 / Issue 30 / June 2015 International Bimonthly ISSN: 0976 – 0997
7564
Table 2. Control performance indices using PI controller.
Fourth loop Third loop Second loop First loop performance indices
PI Controller
93.27 72.98 71.49 73.55 IAE 37.45 34.39 33.88 34.63 ISE
ITAE Table 3.Control performance indices using reset controller.
Fourth loop Third loop Second loop First loop performance indices
Reset control
70.46 71.18 61.82 68.88 IAE 26.24 25.65 23.51 24.98 ISE
ITAE Table 4. Control performance indices using PI controller under load disturbances.
Fourth loop Third loop Second loop First loop performance indices
PI Controller
436.3 433.5 430.7 434 IAE 220.7 219 217.5 218.6 ISE
ITAE Table. 5 Control performance indices using reset controller under load disturbances.
Fourth loop Third loop Second loop First loop performance indices
Reset control
427.4 427 418.2 426.5 IAE 207.4 206.3 204 206.4 ISE
ITAE
Table 6.Control performance indices using PI controller under noise.
Fourth loop Third loop Second loop First loop performance indices
PI Controller
741 736.2 736.3 737.3 IAE 226.4 219.4 224.1 223.9 ISE
ITAE
Maryam Fakour and Amin Ramezani
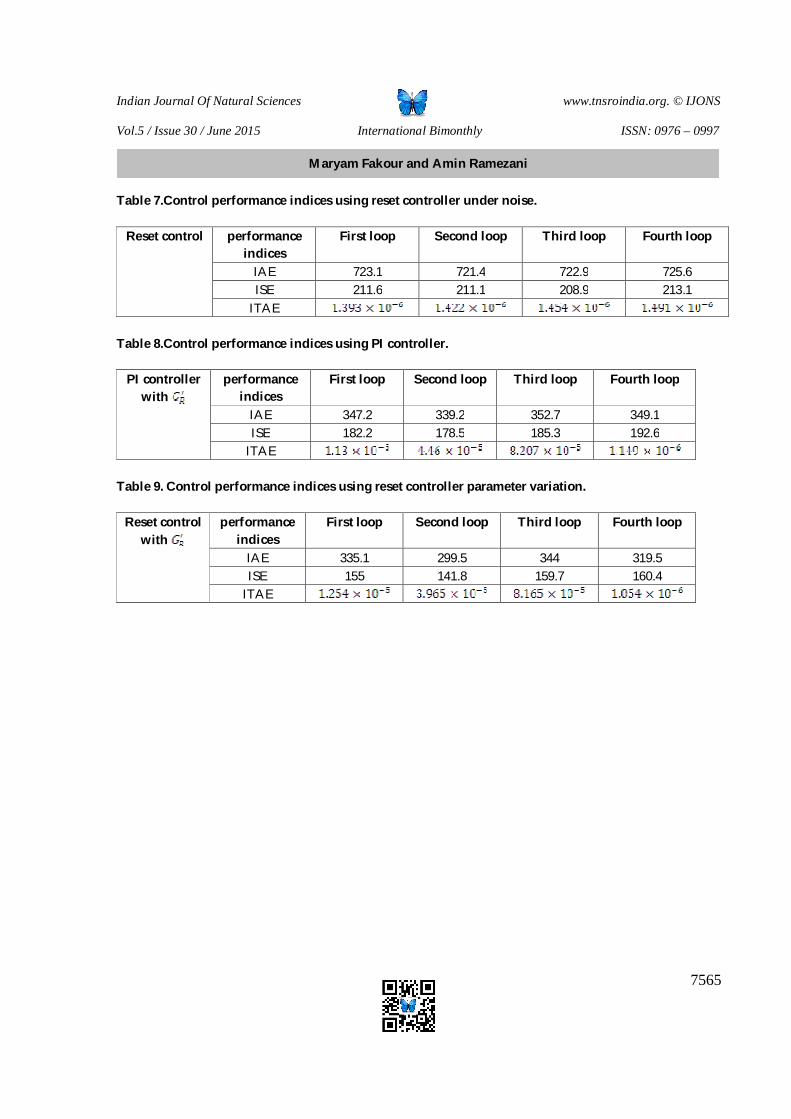
Indian Journal Of Natural Sciences www.tnsroindia.org. © IJONS
Vol.5 / Issue 30 / June 2015 International Bimonthly ISSN: 0976 – 0997
7565
Table 7.Control performance indices using reset controller under noise.
Fourth loop Third loop Second loop First loop performance indices
Reset control
725.6 722.9 721.4 723.1 IAE 213.1 208.9 211.1 211.6 ISE
ITAE Table 8.Control performance indices using PI controller.
Fourth loop Third loop Second loop First loop performance indices
PI controller with
349.1 352.7 339.2 347.2 IAE 192.6 185.3 178.5 182.2 ISE
ITAE Table 9. Control performance indices using reset controller parameter variation.
Fourth loop Third loop Second loop First loop performance indices
Reset control with
319.5 344 299.5 335.1 IAE 160.4 159.7 141.8 155 ISE
ITAE
Maryam Fakour and Amin Ramezani
Indian Journal Of Natural Sciences www.tnsroindia.org. © IJONS
Vol.5 / Issue 30 / June 2015 International Bimonthly ISSN: 0976 – 0997
7566
Comparison and Analysis of Traditional Circles and Modern Squares in Iran
Amir Masoud Rahimi1* and AmirMohammad Parvini2
1Faculty of Engineering, Department of Civil Engineering, University of Zanjan, Zanjan, Iran. 2Department of Civil Engineering, Faculty of Engineering, Zanjan Branch, Islamic Azad University, Zanjan, Iran. Received: 15 Mar 2015 Revised: 16 Apr 2015 Accepted: 29 May 2015 *Address for correspondence Amir Masoud Rahimi Faculty of Engineering, Department of Civil Engineering, University of Zanjan, Zanjan, Iran.
This is an Open Access Journal / article distributed under the terms of the Creative Commons Attribution License (CC BY-NC-ND 3.0) which permits unrestricted use, distribution, and reproduction in any medium, provided the original work is properly cited. All rights reserved.
Modern Squares due to higher safety and performance levels, less polluting vehicles, lower manufacturing costs, lower fuel consumption and less environmental pollution justify the need to replace the traditional squares in order to achieve better traffic performance. Given thetrafficimportance and high fuel consumption in the red light times at the intersection, the need to decrease rates in squares and also the maintenance of the psychological effects is required.Since in generalthe distinctive difference between the two squares cannot be seen and the most squares have the traffic circles, theneed for familiarity with the modern squares is felt more than ever. Geometric design changes, unique signs and line drawings, changes in priority and the regulations in circumstances such as the location of the park and … are some of the issues that are addressed in this study.
Key words: the traditional squares, the modern squares, Safety
INTRODUCTION
Modern squares in recent years have been considered as very interesting issues in US. The appeal is partly based on the great success in Europe and Australia, where the intersection is basically changed primarily as a result of good performance of squares and public acceptance. Modern squares follow design principles that are different from the principles of traffic circles (the traditional ones), which were built in the first half of this century in America.
RESEARCH ARTICLE
ABSTRACT
Indian Journal Of Natural Sciences www.tnsroindia.org. © IJONS
Vol.5 / Issue 30 / June 2015 International Bimonthly ISSN: 0976 – 0997
7567
Modern squares are designed based on the slower pace and their dimensions are determined by number of branches, capacity and larger turning radius vehiclesand while the right of way to traffic was for entry in the old traffic circles and the old squares were designed with the spiral movement.
Traffic circles at least since 1905, when one of the first traffic circles known as the Columbus traffic circle was designed in New York by "William flap types" were considered as a part of the transportation system in the US. Consequently, many traffic circles were built in the United States. Current designsmake integration and screw movement of high-speed vehicles possible. Priority was given to entry vehicles that made the high-speed arrival possible. But the experience of many accidents and severe congestion in traffic circle caused it loosed its popularity after the mid-1950s in the US. At the international level, theexperience of the traffic circles is equally negative, and many countries were experiencing closed traffic circle with traffic increasing.
The modern squares were innovated to overcome the problems associated with traffic circles in the UK in 1966, British law applied in circular intersections where traffic input was required to give priority to traffic circulation and in other words to yield it. This law, by preventing the entry of vehicles to the intersection until the traffic circulation in there was far enough, would prevent the closure of the square. In addition, smaller squares were proposed that provide sufficient horizontal deviation to achieve lower speed. Modern squares indicate significant progress in terms of performance and safety compared to the old traffic circles.These changes improved safety and reduced the number and severity of crashes. In general, squares improved the rate of accidents and injuries caused by accidents, especially in a wide range of categories (urban, suburban and rural). (1) Higher safety, (2) less delay, (3) lower cost, (4) aesthetic causes and urban design are the reasons for the modernsquarepopularity [3].modern square have similarity in some properties with the old way traffic circle but basicallythey are different in some scale and key features such as: (1) the angle of a tangent to the outer entrance road to the center of the island in order to smooth the flow direction, (2) emphasis on developing existing routes by reducing line are different.
Thematic Literature
Modern square is a one-way intersection around a central island where the incoming traffic is conveyedto passing traffic circulation. Delivery lodge at the entrance are known as the left conveyanceor offside priority, Left Conveyance of entries requires that the present right of way to be conveyed to vehicles on the road around the square and all the incoming vehicles wait for a gap in the flow of movement.CONVEYANCE sign is input control to maintain high mental capacity.Modern squares unlike inconsistent old circles are not designed for the spiral movements and therefore require less in diameter. Deflection or diversion for incoming traffic:Tangential entries are not allowed and the traffic does not move straight through the intersection.Traffic entering the central island and the vehicles will be diverted to the right and thus leads to a lower speed inentry.To create more capacity in the modern squareincludes the input aperture that is created by adding a line before the conveyanceline and has a wider circulation path.
The square use cases are: high-accident locations, especially in places with many accidents caused by transverse or left or right circular movements, delayed location, places that do not need traffic lights,A four-way stop intersections, intersections with more than four legs, intersections with unusual geometry (Y or three-way intersection and cross intersection with the sharp angle),intersections with abundant left turn, intersections with variable traffic pattern, intersections withabundant or desirable U turn i.e. in connection with the available management strategies along the commercial zones, in places where storage capacity is limited to signalized intersections or lines caused by signalized intersection leads to operational or safety problems, intersections near the railway underpasses, bridges and tunnels. Replacing a pair of short distance along the road arterial intersections instead of widening the entire length of the road.Intersections that features road speed changes, for example, at the entrance to a community or connecting
Amir Masoud Rahimi and Amir Mohammad Parvini
Indian Journal Of Natural Sciences www.tnsroindia.org. © IJONS
Vol.5 / Issue 30 / June 2015 International Bimonthly ISSN: 0976 – 0997
7568
locations where the shortcut is connected to an arterial path. Intersections that are important from the point of view of urban design or visual (as long as they meet the basic criteria and safety engineering). [3]
Square elements
Safety and square
The using of squares is a proven safety strategy to improve intersection safety by the elimination of their conflict or change, reducing the severity of accidents, and forcing drivers to reduce their speed while crossings and passing intersection. Reduction of vehicles speed will cause with speed difference with other users of the road
Safety enhancement reasonsin the square include
The conflicts number of vehicles in the squareis less than conventional intersections. Potential severe conflicts such as right angle accident and head-on collision in the left turn dramatically decreased using squares.
Lower absolute speed that essentially is because of the squaregive the driver more time to react to potential conflicts and help to improve the safety square.Low-speed vehicles that reduce the severity of accidents and also make fatal and serious accidents in the field more uncommon.
Since most users of a way move the similar speed in the square (i.e. have little relative velocity) crash severity decreases in comparison with some traditional controlled intersections.
In contrast to many traditional intersections, when pedestrians crossing the square at any time,they need to pass only one direction of traffic (i.e. two stage pass). Points of conflict between pedestrians - vehicles are low in the square. In the vision of pedestrians conflicting vehicles enter fewer ways. Speed of input and output vehicles decreases with a good plan and the time available for the cavalry to respond increase and the potential of the severity of accidents will reduce while multiline intersections is a challenge for pedestrians, but lower speed environment helps to reduce the risk of collisions.
RECOMMENDATIONS
In Iran, it only pay attention to change the priority of the squareswhile they are traffic circles rather thansquares and to change them, first, the geometry changes must be applied (Figure 5)and then the rules on the penalties in case of non-regard to priority must be revised. "811/292: Failure to conveyance right of way in the squares, exceptions, fine
(1) If a person drives a motor vehicle in the direction of multi-line circulation and does not convey the second legally removed from the square cross in front of him and do not give the left turn priority of his vehicle, has violated ingiving the right of way in the square. (2) If a traffic control device identifies the driver of the vehicle must take other action, this measure is not applied to this section. (3) The offense described in this section i.e. the failure to surrender the right of way is placed in class c violation. 400/ 811. Failure to use proper traffic lights for turning left or right, the line change, or leave the square, fine. If someone under ORS.811.395 using traffic lights or hand signals not properly and was driving the vehicle that: (a) is turning left or right, changing the line, stopping or accelerating suddenly, or (b) exit from any place of squareshas violated fromusing the proper sign to turn left or right, changing the line, or the cancellation or withdrawal of the square. (2) Where the use of traffic lights under ORS.811.405 is required. This section does not permitted the use of
Amir Masoud Rahimi and Amir Mohammad Parvini
Indian Journal Of Natural Sciences www.tnsroindia.org. © IJONS
Vol.5 / Issue 30 / June 2015 International Bimonthly ISSN: 0976 – 0997
7569
hand signs to indicate when turning left or right, changing the line, stopping or accelerating. (3) The offense described in this section i.e. the failure to use the proper guidance to turn left or right, or stop, or change the line is placed in violation class B.
Lines (Figure 6 and 7) and the required signs should be installed in accordance with the regulations (Figure 8), and informed nationally (the national media, newspapers, briefings questions and answers, brochures, information, Web Design related to the topic or writing in showbiz systems) [6] to use the high safety of such modern squares.
CONCLUSION
In this paper, the modern squares and traditional traffic circles were compared together. Modern squares follow the design principles that are different with the principles of traditional traffic circles. In the traditional one right of way was for traffic entrance with original spiral design but modern design is based on the slower pace and its dimensions are determined by number of branches, capacity, and a larger turning radius.According to the modern square advantages which includehigher performance and safety, lower emission levels of vehicles, lower manufacturing costs, lower fuel consumption, resulting in less environmental pollution, it is necessary to replace the traditional squares with modern ones. Without using suitable lines and signs, the appropriate hindering laws and regulations, understanding and correct information before, during and after the construction of the requirements in terms of performance and the following rules, cannot achieve the better performance and safety compared to traditional traffic circles only by changing the priority, as happened in Iran.
REFERENCES
1. Development of Guidelines for Implementation of Roundabouts in Texas, FHWA/TX-08/0-6414-1, Center for Transportation Research, The University of Texas at Austin 1616 Guadalupe Street, Suite 4.202 Austin ,TX 78701, 2011
2. Transportation Research Board,NCHRP Report 672, Roundabouts : An Informational Guide Second Edition, 2010, Published by the National Research Council, Washington DC.
3. Transportation Research Board,Synthesis of Highway Practice 264, Modern Roundabout Practicein the United States, 1998, Published by the National Research Council, Washington DC.
4. Transportation Research Board ,NCHRP Report 572, Roundabouts in the United States, 2007, Published by the National Research Council, Washington DC.
5. Roger P.Roess , Elena S.Prassas, William R. McShane. Traffic Engineering.Fourth edition. 2010. PearsonPress. 6. Dana Newsome, Effective communication for transportation projects, Traffic Engineering Handbook,
2010,HNTP corporation,USA. 7. Behbahani, h. Ziarat, H., Marouf, H., Squares in Iran, geometric correction for more safetythe ninth Conference
of Traffic and Transportation Engineering, Tehran, Iran.
Amir Masoud Rahimi and Amir Mohammad Parvini
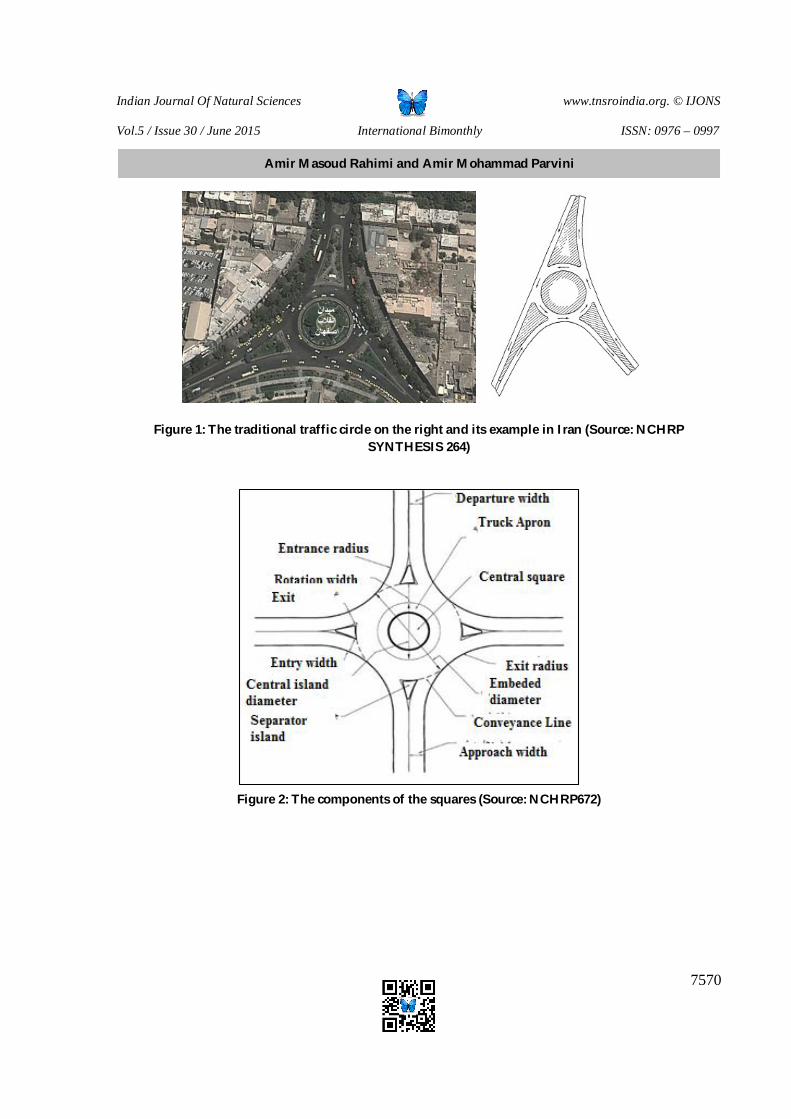
Indian Journal Of Natural Sciences www.tnsroindia.org. © IJONS
Vol.5 / Issue 30 / June 2015 International Bimonthly ISSN: 0976 – 0997
7570
Figure 1: The traditional traffic circle on the right and its example in Iran (Source: NCHRP SYNTHESIS 264)
Figure 2: The components of the squares (Source: NCHRP672)
Amir Masoud Rahimi and Amir Mohammad Parvini

Indian Journal Of Natural Sciences www.tnsroindia.org. © IJONS
Vol.5 / Issue 30 / June 2015 International Bimonthly ISSN: 0976 – 0997
7571
Figure 3: Key features of the square (Source: NCHRP672)
Figure 4: Speed reduction in the square (source: NCHRP SYNTHESIS 264)
Amir Masoud Rahimi and Amir Mohammad Parvini

Indian Journal Of Natural Sciences www.tnsroindia.org. © IJONS
Vol.5 / Issue 30 / June 2015 International Bimonthly ISSN: 0976 – 0997
7572
Figure 5: Speed reduction for the safety of pedestrians (source: NCHRP672)
Figure 6:Comparison of the cross-sectional severity of collisions (Source: NCHRP672)
Figure 7: Schematic plan of the traffic circle modification (Source: Dr.Behbahani
Amir Masoud Rahimi and Amir Mohammad Parvini

Indian Journal Of Natural Sciences www.tnsroindia.org. © IJONS
Vol.5 / Issue 30 / June 2015 International Bimonthly ISSN: 0976 – 0997
7573
Figure 8: the line right before the squares (Source MUTCD)
Figure 9: the line in the Square (Source MUTCD)
Figure 10: Square signs (Source MUTCD)
Amir Masoud Rahimi and Amir Mohammad Parvini

Indian Journal Of Natural Sciences www.tnsroindia.org. © IJONS
Vol.5 / Issue 30 / June 2015 International Bimonthly ISSN: 0976 – 0997
7574
Table 1: Characteristics of the designed squares (Source: NCHRP672)
The input aperture The separator island
The input aperture means widening to several lines for
capacity increase and additional storage in the input
line.
Some of the fields are small with high separator island and are designed to separate the traffic in the opposite direction, diverting incoming traffic, and creating opportunities for pedestrians to pass through two stages. Small squares have separatingisland that are
characterized by marked asphalt.
Pedestrian crossing Pedestrian crossing located in the right sid and typically at least the length of a vehicle
removed from the circulation path.
Parking Parking is not permitted in the input field or circular path. Parking maneuvers such as parking in some roundabout at the intersection of circulation interfere with the flow and is a potential safety risk.
Sufficient speed reduction A good design leads vehicles
to cross the square in low speed and when it places in the circular path, its path is
deviatedmore by central island
Vehicle design A good square design plans for vehicle an appropriate design which
may require the use of the dock area of the truck (Truck Apron).
Table 2: Comparison of square categories (Source: NCHRP672)
Design element Small Square One-line square Multi-line field Maximum design speed 15-20 miles per hour 20-25 miles per hour 25-30 miles per hour
Favorable input 25-30 km per hour 30-40 km per hour. 40-50 km per hour. The maximum number of
input lines in the maturation 1 1 +2
Usually inscribed circle diameter
13-27 m 55-27 46-91
Central Island processing Fully crossing High High Operation without detailed
capacity analysis (vehicles / day)
Up to 15,000 Up to 25,000 Up to 45,000 for the right lines
Amir Masoud Rahimi and Amir Mohammad Parvini
Indian Journal Of Natural Sciences www.tnsroindia.org. © IJONS
Vol.5 / Issue 30 / June 2015 International Bimonthly ISSN: 0976 – 0997
7575
Influence of Low and High Population Density on Mouse Sertoli Cells and Spermatozoa Maryam Ghasemi1* and Farzad Rajaei2
1Ph.D Student in Anatomical Sciences, Faculty of medicine, Shiraz University of Medical Sciences, Shiraz, Iran. 2Professor of Histology & Embryology, Cell and Molecular Research Centre, Qazvin, Iran. Received: 20 Mar 2015 Revised: 17 Apr 2015 Accepted: 29 May 2015 *Address for correspondence Maryam Ghasemi Ph.D Student in Anatomical Sciences, Faculty of medicine, Shiraz University of Medical Sciences, Shiraz, Iran.
This is an Open Access Journal / article distributed under the terms of the Creative Commons Attribution License (CC BY-NC-ND 3.0) which permits unrestricted use, distribution, and reproduction in any medium, provided the original work is properly cited. All rights reserved.
Humans in the modern developed world typically face several types of stressors that originate largely from social and interpersonal interactions. Epidemiological data suggest that stress is linked to the development of metabolic disease and infertility. The importance of sertoli cells in spermatogenesis has been demonstrated. Also quantity and quality of spermatozoa are two important factors for fertility. Whereas dysfunction of sertoli cells and spermatozoa is often associated with changes in the reproductive system's function, in the present study the effects of low and high population density on the number of sertoli cells and the shape and number of Spermatozoa were investigated. Sixty male mice were divided into six groups. Two Control groups (five mice/cage), two groups � (ten mice/cage) (mild stress) and two groups �� (fifteen mice/cage) (severe stress). Three groups were kept for one month and three groups were kept for two months. The mice were anaesthetized with an intra peritoneal injection of ketamine and xylazine after one and two months, respectively. Spermatozoa were harvested from the caudae epididymis. The samples of testes were removed and processed for light and Transmission Electron microscopic studies and the number of sertoli cells was investigated. The caput epididymis was prepared for Transmission Electron Microscopic (TEM) studies and the shape of spermatozoa in it was investigated. The data has been compared using statistical methods (SPSS, ANOVA, Kruskal Wallis test and P<0.05). After one month the results showed that the number of sertoli cells in groups wasn't significant. The number of collected spermatozoa in group � as compared with control group showed a significant decrease (P< 0.03). A Transmission electron microscope revealed a decrease in the number and
RESEARCH ARTICLE
ABSTRACT
Indian Journal Of Natural Sciences www.tnsroindia.org. © IJONS
Vol.5 / Issue 30 / June 2015 International Bimonthly ISSN: 0976 – 0997
7576
an increase in residual bodies of spermatozoa in the mice of group �� as compared with control group. After two months The results showed that the number of sertoli cells in group �� has significantly decreased as compared with group � (P< 0.004), but the differences in other groups weren't significant. Moreover the numbers of collected spermatozoa in group �� as compared with group � showed a significant decrease (P< 0.004); whereas the differences in other groups weren't significant. These results suggest that crowding stress can affect the number of sertoli cells and the number and structure of spermatozoa in male mice.
Key words: mouse, population density, sertoli cell, spermatozoa.
INTRODUCTION
In recent decades, the number of couples who need infertility treatment has enormously risen, and fertility (the final number of children) obviously decreased (Leridon, H. et al (2008)) One of the risk factors of infertility is mental stress. Therefore, lowering the mental stress may reduce the risk factor of infertility (Campagne, D.M. (2006), Nunberg, G. (1997)). In the past few decades, with the progress of science and research, new techniques have been available to solve infertility but the gathered evidence shows the need to program medical fertility treatment, considering both chronic and acute stress levels, and to solve this problem before starting the main fertility process (Selye, H. (1976)). The unification of a healthy egg and a healthy sperm is essential for breeding of the mammalian species, so any element that disturbs the normal production of female or male gametes can be a threat to the production routine. Both clinical and environmental sources may derive perils to gonadal activity, and can influence either somatic cell or germ cell lineages, or even both, with equivalent consequences like loss of fertility (Tilly, J.L.(1998)). One of the important stress factors is increasing the number of animals per cage(Tsukamoto, K., et al.(1994)). Stress commences in the brain and influences it, in addition to the rest of the body. The responses of neural, autonomic, immune, cardiovascular and metabolic systems to acute stress help conformity and survival. Chronic stress can intensify pathophysiology via the same systems that are deregulated (McEwen, B.S.(2008)). Seating the animals in large groups may lead to violence, trauma, and spread of disease (Woolverton, W., et al.(1989)). When the cages are crowded the animals can’t ambulate easily, and their physical activity will be limited. Also they may not grow well because of cage density consequences like gas accumulation, high humidity and temperature or inadequate food (Anderson, A.,et al (1968), Armario, A., et al (1984), Monteiro, F., et al (1989), Serrano, L.J., (1971), Yildiz, A., et al., (2007)). As well as the adrenocorticotropin surge other results of crowding can include decreased excitatory responses and increased defecation rates (Armario, A. et al (1984)). Other researchers have used different methods, and this may have caused various outcomes. For example housing conditions, population density and the period of experiment are factors that can be changed by the researcher and even though the stressors may be one of a kind but the nature of studied species make them show different reproductive outcomes and physiological response to stressors (Ishida, H., et al., (2003), Schreck, C.B.(2001)). The factors that cause stress in humans in modern world mostly originate from society and their interpersonal interactions while physical stressors are less considerable. These social stressors have been modeled in the laboratory in different ways, including acute or chronic failure, social submission, social instability, crowding, and isolation. Researchers who have used these models indicate that social and principally psychological stressors can have a deep impact on the individuals’ functions [17]. Studies show that when the cages are crowded, the hypothalamic-pituitary-adrenocortical axis, the sympathoadrenomedullary system and the sympathetic nervous system act like when they are under psychological stress (Ishida, H., et al., (2003)). The present study aims at testing the effects of different densities stress samples on sertoli cells and spermatozoa.
Maryam Ghasemi and Farzad Rajaei
Indian Journal Of Natural Sciences www.tnsroindia.org. © IJONS
Vol.5 / Issue 30 / June 2015 International Bimonthly ISSN: 0976 – 0997
7577
MATERIALS AND METHODS
Animals
The study was performed on 60 eight-week old NMRI mice. The animals were housed in metal wire cages, in a temperature-controlled room under a 12-h light-dark cycle at 22–24 _C and 50–60% relative humidity. They were fed ad libitum with standard laboratory chow and tap water. In order to avoid additional types of stress, such as adaptation to novelty, the animals were maintained in the same cages for at least two consecutive weeks. During the last week, the animals were placed in the experimental cages.
Experimental protocol
Animals were randomly seated in cages measuring 14×21×27 cm (floor area 564 cm2) into six groups of five (control) (floor area 113 cm2 Per mouse), ten (floor area 57 cm2 Per mouse) and fifteen (floor area 36 cm2 Per mouse) and each three groups were subjected to different lengths of social stress disposal which varied from one to two months (Liu and Keefe (2000), Peng, et al., (1989)).
Light microscopy
After one and two months, the mice were sacrificed under anesthesia with an intra peritoneal injection of ketamine and xylazine. Spermatozoa were harvested from the caudae epididymis. A drop of the watered down sperm was taken to ready smears, smeared across a glass slide, and dried by air. The sample slides were stained for 40 min with the haematoxylin technique. Sperm morphology was studied at a magnification of 100× with a Zeiss light microscope and the number of Spermatozoa was counted in three accidental fields. The testes were rapidly removed and fixed in 4% paraformaldehyde, and the usual procedures including: Dehydration, Clearing, Impregnation and embedding were followed. Thin sections about 5 microns thick were serially cut, and one out of five sections was mounted on a clean glass slide. The sections were stained with H&E, then observed at a magnification of 100× with a Zeiss light microscope and the number of sertoli cells was counted in three accidental fields.
Electron microscopy
The testes and caput epididymis were dissected out and small fragments, about 2 mm wide, were plunged in a solution comprising 4% paraformaldehyde and 1% glutaraldehyde in 0.1 m phosphate buffer, pH 7.2 for 1 h at 4 _C. After washing in the buffer, the pieces were post-fixed in 1.3% osmium tetraoxide in phosphate buffer for 1 h, dehydrated and embedded in Epon, following the usual procedures. Thin sections about 0.5 micron thick were serially cut and one out of four sections was mounted on a single hole formvar filmed grid. The sections were stained with saturated uranyl acetate in 50% alcohol and with lead citrate, then observed with a LEO906 Transmission electron microscope.
Statistics
The number of sertoli cells and spermatozoa from each experimental group was compared by SPSS, ANOVA and Kruskal Wallis test. Data are expressed as mean ± SD. Significance was considered at the 0.05 level.
Maryam Ghasemi and Farzad Rajaei
Indian Journal Of Natural Sciences www.tnsroindia.org. © IJONS
Vol.5 / Issue 30 / June 2015 International Bimonthly ISSN: 0976 – 0997
7578
RESULTS
Table 1 shows the effect of cage density on the number of sertoli cells in the mice which were kept for one and two months. Housing density did not statistically change the number of sertoli cells in the mice which were kept for one month. However, the ultra structural study of the testis tissue showed only small amounts of disruption between the sertoli cells from stress groups of mice as compared to control group and in large amounts between the sertoli cells of the animals subjected to high stress (Fig. 1). Housing density decreased the average number of sertoli cells between the low stress group and high stress group significantly in the mice that were kept for two months (P < 0.004). Also the ultra structural study showed the qualitative changes in morphology of the cells, a collection of cell death signs such as disruption between sertoli cells, nuclei swelling and dense nucleolus in the sertoli cells in the stress groups as compared to the control group. Also the changes increased in the high stress group as compared to the low stress group (Fig. 2).
The results showed that the mean number of spermatozoa of animals in the low stress group was significantly reduced as compared to control group but the differences in other groups were not remarkable in the mice that were kept for one month (P < 0.03). (Table. 1) The ultra structural study of the epidydimis tissue from the mice of control group and the high stress group revealed spermatozoa with abnormal morphology (cytoplasmic residual body) tended to increase with stress and a decrease in the number of spermatozoa when compared with control group (Fig. 3).
The mean number of spermatozoa in the high stress group was significantly lower than those found in the low stress group (P < 0.04). Also the mean number of spermatozoa tended to decrease between other groups, but this reduction was not significant. (Table. 1)
DISCUSSION
As far as our literature reviews on previous studies, there are no morphometric studies about the effects of stress on the number of sertoli cells in mice testes. Based on this research, there were no significant differences in the total number of sertoli cells among study groups which were kept for 1 month under social stress which may be a result of sertoli cells resistance against inadequate conditions (20). This study proves that strains of mice, its age, the cage size and duration of the study are related to the population density in mice and the incidence of the lesion(Chapman, J.C., et al., (2000)). In this study, animals were kept for 2 months and the results show that the number of sertoli cells in high stress group has a considerable decrease as compared with the low stress group (P< 0.004); however, the differences between the low stress group & control group and also between the high stress group & control group weren't significant, but the qualitative study under electron microscopy showed the obvious changes in morphology of the cells, a collection of cell death signs such as disruption between sertoli cells, nuclei swelling and dense nucleolus (fig 2). It is obvious that for developing spermatogonia, spermatocytes, and spermatids, sertoli cells must provide both physical and trophic support. A network of reciprocal signaling interactions among Leydig cells, Sertoli cells, peritubular cells and germ cells in the testis and on top of these hormonal regulations from the pituitary affect the trophic support (Danno, S., et al., (2000)). In Cameron’s study (1997), it is stated that both acute and chronic psychological and social stresses can damage reproductive hormone secretion in a range of nonhuman primate species. This impairment can be subtle, comprising a gentle interception in reproductive hormone secretion, or dramatic, underlying a full inhibition of fertility and reproductive behavior. During some stresses, several reasons that appear to affect the mediating outcomes of behaviorally induced stresses on reproductive axis are activation of the adrenal axis, endogenous pathways and changes in sensitivity to gonadal steroid hormone feedback (Cameron, J.L. (1997)). Donadio et al’s research in 2007 showed that the function of the autonomic nervous system and the endocrine system can be affected by different types of physiological and psychological stress, which may lead to changes in certain organs (Donadio, M.V.F., et al., (2007)). McGrady, reported that mild-to-severe emotional stress
Maryam Ghasemi and Farzad Rajaei
Indian Journal Of Natural Sciences www.tnsroindia.org. © IJONS
Vol.5 / Issue 30 / June 2015 International Bimonthly ISSN: 0976 – 0997
7579
whether mild or severe decreases testosterone and may intervene spermatogenesis in the human male (McGrady, A., (1984)). Therefore, the change in the number of sertoli cells in mice which were subjected to a two- month period of stress in the present study following crowding stress could be due to the effect of increased levels of some hormones but the assessment of these hormone levels in future studies is needed.
The results of the present study show that the number of collected spermatozoa in low stress group has a significant decrease in comparison with control group (P< 0.03). However, the differences between the other groups weren't significant in mice which were kept for one month under social stress, but in mice were kept for two months under social stress, the number of collected spermatozoa in high stress group as compared with low stress group significantly decreased (P< 0.004). It is obvious that an abnormal head may lead to a greater impact on sperm abnormality of fertility, especially a breakdown in the structural totality of the plasma membrane and other important organelles (Pesch, S., et al., (2006), Veeramachaneni, D. et al (2006)), which has been identified under an electron microscope in the current study. The qualitative ultra structural study of the epidydimis tissue from the mice in the control group and the high stress group revealed sperm with abnormal morphology (cytoplasmic residual body) tended to increase with stress and decrease in the number of spermatozoa when compared with control group (fig.3). High temperature of the cage due to crowding may lead to the decrease in the number of collected spermatozoa in this study. Danno et al, 2000 reported that the temperature of the testis is kept at a particular temperature between 30 to 33°C according to the species and a critical element for spermatogenesis would be the variation of a few degrees between the body and scrotum(Danno, S., et al (2000)). Moreover, a study was conducted to determine successive exposure of male mice to high temperatures. This effect led to falls in the number of spermatozoa in the testis and epididymis (Yaeram J et al., 2006). Also Gonçalves et al., 2008 reported that psychological or biological stress is accountable for an important rise in the oxidative stress markers so there are relationships between social stress and immune response (Gonçalves, L. et al (2008)). According to Grosshans, Calvin study, the mammalian testis is especially susceptible to oxidative stress. A high polyunsaturated fatty acid level of sperms, high oxygen consumption and exposure to particular toxins make the testis very sensitive to oxidative damage (Grosshans, K. and H.I. (1985)). A potential role of oxidative stress in male infertility has lately been described. One of the considerable factors in inducing poor sperm function and infertility is Free-radical induced damage to spermatozoa (Agarwal, A. (2006)). The amount, exposure duration and type of ROS involved in the study effect the extent of oxidative stress-induced damage (Saleh, R.A. and A.A. (2002)). Gil-Guzman et al’s study confirms that immature spermatozoa with abnormal morphology and cytoplasmic residual are the most sources of ROS production in semen. Their study demonstrates that ROS levels and the rate of abnormal forms in semen are significantly related to each other (Gil-Guzman, E., et al., (2001)). In our study, the changes under a transmission electron microscope were obvious (fig.3). Therefore, the assessment of ROS in future studies is needed.
It is concluded that the social stress has a detrimental effect on male infertility by a decrease in the number of sertoli cells and spermatozoa.
Figure Legends.
Fig.1 TEM micrographs of sertoli cells from mouse exposed to stress for one month in different groups. (a), control group: sertoli cell possess normal ultrastructure. (Magnification 3597×) (b), from mouse exposed to low stress (10 mice/cage): small amounts of disruption between the sertoli cells (arrow). (Magnification 3597×) (c), from mouse exposed to high stress (15 mice/cage): disruption between the sertoli cells in large amounts (arrow). (Magnification 2656×)
Maryam Ghasemi and Farzad Rajaei
Indian Journal Of Natural Sciences www.tnsroindia.org. © IJONS
Vol.5 / Issue 30 / June 2015 International Bimonthly ISSN: 0976 – 0997
7580
Fig.2 TEM micrographs of sertoli cells from mouse exposed to stress for two months in different groups. (a), control group: sertoli cells possess a normal ultrastructure. (Magnification 3597×) (b), from mouse exposed to low stress (10 mice/cage): the qualitative changes in morphology of the cells, a collection of cell death signs such as disruption between sertoli cells, nuclei swelling and dense nucleolus in the sertoli cells cells (arrow). (Magnification 3597×) (c), from mouse exposed to high stress (15 mice/cage): cell death signs increased in high stress group as compared low stress group. (Magnification 3597×)
Fig.3 TEM micrographs of spermatozoa from mouse exposed to stress for one month in different groups. (a), control group: spermatozoa possess a normal number and ultrastructure. (Magnification 10000×) (b), from mouse exposed to high stress (15 mice/cage): spermatozoa with abnormal morphology (cytoplasmic residual body) (Arrowhead) and a decrease in the number of spermatozoa is visible. (Magnification 10000×)
REFERENCES
1. Leridon, H. and R. Slama, (2008). The impact of a decline in fecundity and of pregnancy postponement on final number of children and demand for assisted reproduction technology. Human Reproduction. 23(6): 1312-1319.
2. Campagne, D.M., (2006). Should fertilization treatment start with reducing stress? Human Reproduction. 21(7): 1651-1658.
3. Nunberg, G., (1997). The American Heritage College Dictionary. Boston, MA: Hoghton Mifflin Co. 4. Selye, H., (1976). Forty years of stress research: principal remaining problems and misconceptions. Canadian
Medical Association Journal. 115(1): 53. 5. Tilly, J.L., (1998). Molecular and genetic basis of normal and toxicant-induced apoptosis in female germ cells.
Toxicology letters. 102: 497-501. 6. Tsukamoto, K., et al., (1994 ). [Effects of crowding on immune functions in mice]. Nihon eiseigaku zasshi.
Japanese journal of hygiene. 49(4): 827-836. 7. McEwen, B.S., (2008). Central effects of stress hormones in health and disease: Understanding the protective and
damaging effects of stress and stress mediators. European journal of pharmacology. 583(2): 174-185. 8. Woolverton, W., et al., (1989). Effects of environmental conditions on the psychological well-being of primates: a
review of the literature. Life sciences,. 44(14): 901-917. 9. Anderson, A., J. Werboff, and E. Les, (1968). Effects of environmental temperature-humidity and cage density on
body weight and behavior in mice. Experientia. 24(10): 1022-1023. 10. Armario, A., Castellanos, J. Balasch, J. (1984). Effect of crowding on emotional reactivity in male rats.
Neuroendocrinology. 39(4): 330-333. 11. Monteiro, F., et al., (1989). Effect of immobilization stress on food intake, body weight and weights of various
organs in rat. Ind J Physiol Pharmacol. 33: p. 186-190. 12. Serrano, L.J., (1971). Carbon dioxide and ammonia in mouse cages: effect of cage covers, population, and activity.
Laboratory Animal Science. 21(1): 75-85. 13. Yildiz, A., et al., (2007). Physiological profile of juvenile rats: effects of cage size and cage density. Lab animal.
36(2): 28-38. 14. Armario, A., Ortiz, R. Balasch, J. (1984). Effect of crowding on some physiological and behavioral variables in
adult male rats. Physiology & behavior. 32(1): 35-37. 15. Ishida, H., et al., (2003). Study of active substances involved in skin dysfunction induced by crowding stress. I.
Effect of crowding and isolation on some physiological variables, skin function and skin blood perfusion in hairless mice. Biological and Pharmaceutical Bulletin. 26(2): 170-181.
16. Schreck, C.B., Contreras-Sanchez, W., Fitzpatrick, M.S. (2001). Effects of stress on fish reproduction, gamete quality, and progeny. Aquaculture, 197(1): 3-24.
17. McKittrick, C., et al., (2009). Social stress effects on hormones, brain, and behaviour. Hormones, brain and behavior. 341J347.
Maryam Ghasemi and Farzad Rajaei

Indian Journal Of Natural Sciences www.tnsroindia.org. © IJONS
Vol.5 / Issue 30 / June 2015 International Bimonthly ISSN: 0976 – 0997
7581
18. Liu, L. and D.L. Keefe, (2000). Cytoplasm mediates both development and oxidation-induced apoptotic cell death in mouse zygotes. Biology of reproduction. 62(6): 1828-1834.
19. Peng, X., et al., (1989). Effect of cage population density on plasma corticosterone and peripheral lymphocyte populations of laboratory mice. Laboratory Animals. 23(4): 302-306.
20. Chapman, J.C., et al., (2000). Female house mice develop a unique ovarian lesion in colonies that are at maximum population density. Proceedings of the Society for Experimental Biology and Medicine. 225(1): 80-90.
21. Danno, S., et al., (2000). Decreased expression of mouse Rbm3, a cold-shock protein, in Sertoli cells of cryptorchid testis. The American journal of pathology. 156(5): 1685-1692.
22. Cameron, J.L. (1997). Stress and behaviorally induced reproductive dysfunction in primates. in Seminars in reproductive endocrinology.
23. Donadio, M.V.F., et al., (2007). Effects of acute stress on the day of proestrus on sexual behavior and ovulation in female rats: participation of the angiotensinergic system. Physiology and behavior,. 92(4): 591-600.
24. McGrady, A., (1984). Effects of psychological stress on male reproduction: a review. Systems Biology in Reproductive Medicine. 13(1): 1-7.
25. Pesch, S., et al., (2006). Advanced fertility diagnosis in stallion semen using transmission electron microscopy. Animal reproduction science. 91(3): 285-298.
26. Veeramachaneni, D., Moeller, C.L., Sawyer, H.R. (2006). Sperm morphology in stallions: ultrastructure as a functional and diagnostic tool. Veterinary Clinics of North America: Equine Practice. 22(3): 683-692.
27. Yaeram, J., B. Setchell., S. Maddocks, (2006). Effect of heat stress on the fertility of male mice in vivo and in vitro. Reproduction, Fertility and Development. 18(6): 647-653.
28. Gonçalves, L., et al., (2008). A temporal analysis of the relationships between social stress, humoral immune response and glutathione-related antioxidant defenses. Behavioural brain research. 192(2): p. 226-231.
29. Grosshans, K. and H.I. (1985). Calvin, Estimation of glutathione in purified populations of mouse testis germ cells. Biology of reproduction. 33(5): 1197-1205.
30. Agarwal, A., Gupta, S. Sikka, S. (2006). The role of free radicals and antioxidants in reproduction. Current Opinion in Obstetrics and Gynecology. 18(3): p. 325-332.
31. Saleh, R.A. and A.A. (2002). HCLD, Oxidative stress and male infertility: from research bench to clinical practice. Journal of Andrology. 23(6): 737-752.
32. Gil-Guzman, E., et al., (2001). Differential production of reactive oxygen species by subsets of human spermatozoa at different stages of maturation. Human Reproduction, 16(9): 1922-1930.
Maryam Ghasemi and Farzad Rajaei

Indian Journal Of Natural Sciences www.tnsroindia.org. © IJONS
Vol.5 / Issue 30 / June 2015 International Bimonthly ISSN: 0976 – 0997
7582
Fig.1
c
a
b
Maryam Ghasemi and Farzad Rajaei

Indian Journal Of Natural Sciences www.tnsroindia.org. © IJONS
Vol.5 / Issue 30 / June 2015 International Bimonthly ISSN: 0976 – 0997
7583
Fig.2
b
a
c
Maryam Ghasemi and Farzad Rajaei

Indian Journal Of Natural Sciences www.tnsroindia.org. © IJONS
Vol.5 / Issue 30 / June 2015 International Bimonthly ISSN: 0976 – 0997
7584
Fig.3 Table 1- Comparison of the variables in study groups
Data are means ± SD. N.S: non significant *Significant difference between Low stress & High stress **Significant difference between control &Low stress
P-Value High stress Low stress Control variables
N.S 5.56±19.07 5.18±14.8 6.62±18.4 Size number of sertoli cells (one month)
<0.004*
4.76±12.33 7.64±20.8 4.44±17. 2 Num number of sertoli cells (two months)
<0.03**
75.94±163.33 34.91±142.4 93.17±244 Num number of spermatozoa (one month)
<0.04*
64.42±114.33 111.97±204 86.58±244 Num number of spermatozoa (two months)
a
b
Maryam Ghasemi and Farzad Rajaei
Indian Journal Of Natural Sciences www.tnsroindia.org. © IJONS
Vol.5 / Issue 30 / June 2015 International Bimonthly ISSN: 0976 – 0997
7585
Globalization and Contemporary Iranian Art Fahimeh Jamalfarid Faculty of Art, Soore University, Iran. Received: 15 Mar 2015 Revised: 16 Apr 2015 Accepted: 29 May 2015 *Address for correspondence Fahimeh Jamalfarid Faculty of Art, Soore University, Iran.
This is an Open Access Journal / article distributed under the terms of the Creative Commons Attribution License (CC BY-NC-ND 3.0) which permits unrestricted use, distribution, and reproduction in any medium, provided the original work is properly cited. All rights reserved.
Globalization is the compression process of space and time that includes proximity, growing relationship, and interdependence of individuals, groups and different communities. Compression and interrelatedness of the world have led individuals to be aware that all are parts of the human world and they are involved as partners in all the affairs of the kingdom. The human awareness of the interrelatedness provides a proper ground for cultural dialogue and transactions; it forces cultures to interact with each other. This cultural transaction challenges the traditional definition of culture and disregards culture as a location-based and land-based phenomenon. Globalization process eliminates traditional system of space and time, relieves humankind from enclosed domination and limitations of space, and provides a wide range of human relationships with each other. In this cultural sphere, all thoughts of traditional communities disrupted and location-based sphere of culture disappears due to the permeability of borders as the results of the revolution in information and communication. With the elimination of cultural borders, cultural elements are separated from the substrate and are suspended in a global environment, which clears the way for the presence and clash among different cultures; this may end in a ground for other discourses including Coexistence and cultural intercourse. In such circumstances, cultural traditions of a given society do not identify individuals and any fix and integrated thought patterns is rejected. Persons of this cultural sphere form their ideal world based on their subjective values, by using a variety of sources and boundless information and communication. Nowadays, globalization and its consequences have exposed human art and identity to integration and composition and have made major changes in intellectual paradigms. This has terminated all traditional definitions and conventions of art, as well. Indeed, the process of globalization has brought about a fundamental change in the consciousness of art and has changed significantly the artists’ mentality and vision.
Key words: Globalization, contemporary Iranian art, identity composition, art fusion
RESEARCH ARTICLE
ABSTRACT
Indian Journal Of Natural Sciences www.tnsroindia.org. © IJONS
Vol.5 / Issue 30 / June 2015 International Bimonthly ISSN: 0976 – 0997
7586
Globalization and Contemporary Iranian Art
Present human human beings have indeed multiple identities; this multiple identities or Multiculturalism is a postmodern phenomenon associated with loss of legitimacy of the national government and economic globalization. In the present situation, as one is aware of events in his social environment, he is aware of the transformation of other nations and societies. This awareness, or recognition, has never been so widespread (Hosseini, 2006). However, economy, politics, and technological communication have integrated the world; the integration has made the emergence of a global information network on the Internet possible and it provides a more suitable condition for the information and cultural exchange. Thus, the world is on the verge of entering a different life. (Madad Poor, 2006). Nowadays, people can involve in common social, commercial, activities simultaneously and non-territorial and they can participate in different locations and situations. The situation has improved the interpretation of Heidegger “new experience” for humanity.(Goodarzi, 2003).
In this regard, cultural interactions have paved the way for significant changes in the mental paradigms (Nancy, 2006). The cultural interactions have led to self-consciousness and sustainable cultural diversity in the world. This empowers nations to maintain their cultural values as well as to understand and accept diverse cultural values and identities. Global cultural influence on local cultures and subcultures causes the emergence of a new cultural identity combined from both cultures (Rahmatollahi, 2005). This multiple context, which is the result of postmodern perspective, covers many cultures of the world; due to extensive communication facilities, it transfers and publishes every new achievement in a short time and puts it in the huge current of technology.
Due to its continuous genesis and internal rebirth as well as the extensive use of facilities (TV, internet), it possesses arena of creativity in art and all its related terms(Aghdashloo 2006).
This fusion welcomes the interaction of situations and allows a space in which a common point between self and other is available. In this intermediate space, the existence of one object depends on the existence of another object. Languages and cultures are similar and yet so different in this cultural fusion. Cultural meanings and concepts are created in a dialogue; in other words, they are made in boundaries where the two types of awareness are connected. It means that cultural meanings and concepts are met at the differences between one and the other, which signifies fusion (Kimani Anjugu, 2006).
As Mohammad (Zeimaran, 2006) notes, “with the victory of liberalism over Soviet Communism, crystallized in the downpour of the Berlin Wall, all the walls and barriers among human groups were removed and the field of scientific and technological innovations were provided (Zeimaran, 2006). The wide availability of information and ease of communication with others, have undoubtedly significant impacts on our perception of art, artistic styles, artistic messages and its application in life and social status.
Globalization has created opportunities and facilities that cannot be denied for the growth and development of gifted artists. Artists have better facilities and areas to create their work, which artists in previous centuries had not such facilities (Hemmati, 2006). Any internal creation enriches a culture. It is clear that one employs various external sources in any kind of cultural creativity. This does not mean that he has made his culture multiple to enrich it. He adds it from other cultures (Torabi, 2006).
If globalization is regarded as an “age” or a “condition, which is a consequence of the ICT industry, by disregarding its political and economic, and international aspects with respect to the opportunities created by this process and its cultural and intellectual sources, it will be revealed that it has influenced on the entire realm of human thought and culture (Hemmati, 2006). Undoubtedly, globalization process has greatly influenced the art world and all aspects of the human mind and heart and it has transformed all of its achievements.
Fahimeh Jamalfarid

Indian Journal Of Natural Sciences www.tnsroindia.org. © IJONS
Vol.5 / Issue 30 / June 2015 International Bimonthly ISSN: 0976 – 0997
7587
The influence of globalization on different aspects of art and artists is clear including: “The impact on personality, behavior, thinking and worldview of artists. The impact on the content and message of art. Impact on the process and process of creating artwork. Impact on the horizon and interpretation of works of art by the audience (the hermeneutics of art). Impact on the language of art. Impact on artistic styles and techniques. The impact on artistic events and communications. Impact on the supply and delivery of artistic products. Impact on the artists’ lifestyle. Impact on the effects and repercussions of artistic actions.” (Ibid: 265) As the result of international achievements, young artists do review historical and cultural resources; these new values and cultural elements cause transformation of their identity and authenticity. The hasty changes can be seen clearly in the artistic achievements of this generation (Zeimaran, 2006).
Naturally, art is a universal phenomenon. A work made by an artist’s effort on culture or religion to represent the subject acquires artistic dimensions to pass the borders of his hometown and move into a new environment. In this manner, he disregards all technical elements, cultural elements, and the origin of its production. Present art has inevitably complied with the progress and evolution. This set may juxtapose a series of disparate objects. It is noteworthy that such disparate things may come together in a implausible manner. The important point is the expansion of the intellectual-cultural horizon, which is multiple.
According to (Jean Harder, 2006) Baudelaire calls art as “general object” because art is beautiful to everyone. Separation is a kind of freedom. Artwork is release from a certain conditions that is meaningful in the domestic customs of a small town; thus, it is not necessary for the audience to be born in that special town to understand the aesthetic meaning. This makes a work as an artwork (Jean Harder, 2006).
When the boundary between an artwork and an ordinary work has been removed, it is not easy to discern an artwork and an ordinary work because one is not facing an aesthetic, but different aesthetics have been emerged. This may be the reason for analysis of aesthetic creations as a “text,” not as an “artwork.” The creation of artwork by multimedia tools has contributed this process. It has eliminated the boundary between art and its context; then, art and its context have been integrated (Ehsani, 2006).
The theme of the current aesthetics has unstable and diverse essence; its doctrines depend on relative thinking to release fix definitions and conventions and unconventional combination of past and present theory and styles for satisfaction of various preferences that may be considered simultaneously. This aesthetic perspective trends constantly to change the styles and techniques. However, coexistence of contradictory, unconventional hybridization, or exotic and ephemeral choices have defined a certain time and space started from few decades ago. In fact, the themes of styles, methods and techniques of the present decades represent the general character of a certain era (Boghrati, 2003).
Theme of contemporary art is an integrated vision, not a hybridization separating artist from his own time and place of living. With recognition beyond the initial observation, the artist separates himself from his tradition and cultural context and goes back into his life by acquiring a universal epistemology. This recognition relies on self-consciousness, which is the root of fusion in art and culture. As (Nosratollah Moslemian, 2009) states, “The certain point is that the connective idea is not the result of imitation; it recalls a kind of local output. Nevertheless, hybridization is the blind consumption and ingestion of cultures (Moslemian, 2009).
Fahimeh Jamalfarid

Indian Journal Of Natural Sciences www.tnsroindia.org. © IJONS
Vol.5 / Issue 30 / June 2015 International Bimonthly ISSN: 0976 – 0997
7588
Since globalization is a diversity-oriented, decent red, and variety seeking approach, it tries in the voluntary and continuous process of creation to validate the other as well as self. In this regard, multiplicity emerges not only in different integrations of cultures but also in the integrations of different cultures and arts, removal of the space between native and non-native art, and the formation of different native and non-native combinations (Sasani, 2006).
Nowadays, media and cyberspace (digital / electronic) help in the development, or becoming, of universal art; imagination of artist in this manner moves from personal to interpersonal mentality. While this space is still virtual and intangible, it is subjective because it is heard and seen. Although it is non-real, it is real in its own discourse; of course, it is not the same type of material real. In this way, imagination is real and even more real that the tangible world (ibid: 195).
There are multiple perspectives about the idea of identity in present art. On the one hand, one is greatly affected from asceticism of thought in national art and all outcomes of extreme nationalism and patriotism; on the other hand, there are many factors associated with the reduction of national identity stability either in art or in other fields; namely, transactions having been possible through media, diffusion of effects, and synchronization of life styles having been created under the pressure of economic mechanisms and new technologies to create an increasing patriotic worldview, combine races and ethnicities (Misho, 2007).
A contemporary artist may work with old and new formats in traditional or mixed methods, techniques, and styles without obligation to follow conventional traditions, or without concerning with identity. In fact, style has lost its universal meaning that represented unique identity of particular era aesthetics. It creates a meta-discourse space so that the original art, with its previous characteristics and innovations, is nonsense because art is a multidimensional concept. This multidimensional characteristic is the result of multiplicity in cultural hegemony (Rajabloo, 2003).
Although arts have influenced on each other during the history, the interaction have been consciously and intentional; it adopts points from met cultural contexts. Therefore, global art has capability of meta-cultural recognition; it goes beyond the common points of two or three cultures and approaches to multiculturalism (Sasani, 2006).
Being in the global space, contemporary culture of Iran has taken a different situation that is neither contrary to international culture and nor isolated from it. In line with the process of globalization, one cannot assume cultural separation and differentiation, but he should assume cultural impact and interaction. Thus, pure culture cannot be found anywhere. According to (Azad Armaki, 2007), every culture has a special compound. There are established elements from other cultures in every levels of culture. This impact does not associated solely to material elements such as IT, but non-material elements, namely f non-symbolic elements of culture are present in every culture (Azad Armaki, 2007)
Iranian culture is an element of global culture. This idea results from the belief in Iranian culture as a dynamic living interacting with the global whole. Iranian identity is one representation of identity among other representations. This idea signifies both synchronization of all identities in the contemporary world and independence of marginalized identities, which all are independent in the centralization.
Iranian identity has always been changed for political, historical and social reasons because Iran has tendency to be a center as well as it has been located on the outskirts of civilization for many times and periods. The dual condition that is more “paradoxical” has introduced Iranian identity as a multifaceted one (ibid: 138, 143).
As Iranian artists have been under the influence of global art and events, it is not possible to ignore the impact of globalization and cultural relations in the artistic community of Iran. Iranian artists combine continuously artistic
Fahimeh Jamalfarid
Indian Journal Of Natural Sciences www.tnsroindia.org. © IJONS
Vol.5 / Issue 30 / June 2015 International Bimonthly ISSN: 0976 – 0997
7589
traditions in the world with modern ideas and forms of art and culture. They mix all techniques, materials, spaces, and artistic trends to represent common ideals and the great spirit of time. As said by (Kummarsing, 2009) with respect to aliens’ impact on art in every time, artists have been able to combine a variety of different artistic styles and traditions to create coordinated compounds while they have never ignored traits of native culture (Kummarsing, 2009).
Studies show that Iranian artists have been naturally selectors; but the new selection is carried out in global context and they select the elements of their works from this context. Living in the context of globalization and world media that stabilize everything, Iranian artist knows his mission in creating art, which is the sum of allegoric layers with modern components. Doing so, Contemporary Iranian artists acts like a mosaic worker who can combine various elements to portray a colorful world. However, a third world man should make bridges to cover gaps and release him from mythical framework of mind and the old definition of culture and tradition. In this day, man requires interaction and dialogue among cultures and civilizations. Culture and art of every land acts as a shared memory; hence, artist has a multifunctional roles. He is not solely a painter and illustrator, but he is an intellectual taking step in the center not in the margins. Therefore, he represents his multifaceted face and personality (Ghare Baghi, 2001).
CONCLUSION
1. The relationships among cultures have created significant cultural transformations in contemporary societies. Since the current communities are not self-centered like old communities, the cultural transformation and multiplicity have inevitably entered in the societies and Iran is not excluded from this provision. 2.Contemporary culture of Iran has fundamental differences with Iranian culture known with traditional features; thus, Iranian culture requires a new definition. 3.Original art has lost its meaning in the process of globalization and multi-dimensional conception of art. Then, speaking of the original art in the present situation is absurd. 4.By staying in the course of cultural interaction, artists have created works that are influenced by the local culture, but with the universal language. 5. The process of globalization has led to re-reading of cultural and historical values by Iranian young generation; this new values and cultural elements involve a change in their identity and authenticity. 6. In today's society, artists have self-consciousness because of global interactions. The self-consciousness helps artists to find harmony in their compositions and works, without disregarding native and non-native elements.
REFERENCES
1. Azad Armaki, Taghi. Iranian culture and identity and globalization. Tehran: Iranian civilization publishing, first edition, 2007.
2. Ghare Baghi, Ali Asghar. Genealogy of postmodernism, Tehran: Publishing Office of Cultural Research, first edition, 2001.
3. Aghdashloo, Aidin. “Art is global.” Proceedings: Journal of art, especial issue for art and globalization, sixty-seven, Tehran: Art Research Center, spring 2006.
4. Boghrati, faegheh. “New media: video art", Journal of Civil Society of Iranian Painters Eleven Report, winter 2004.
5. Torabi, Seyed Mohammad. “Globalization and ethnic cultures.” Proceedings: Journal of art, especial issue for art and globalization, sixty-seven, Tehran: Art Research Center, spring 2006.
6. Hosseini, Mahdi. “Globalization and art.” Proceedings: Journal of art, especial issue for art and globalization, sixty-seven, Tehran: Art Research Center, spring 2006.
Fahimeh Jamalfarid

Indian Journal Of Natural Sciences www.tnsroindia.org. © IJONS
Vol.5 / Issue 30 / June 2015 International Bimonthly ISSN: 0976 – 0997
7590
7. Rajabloo, Ali. “Deconstruction of modern concepts in the cultural stage of capitalism.” Bimonthly Journal of Cultural Spectrum, especial issue for art and globalization, No. 2, Tehran: Institute of Culture and Islamic Art, 2003.
8. Rahmatollahi, hossein. “Globalization and its impact on ethnic and national identity.” Legal thoughts, third issue, No. 8, spring and summer 2005.
9. Jean Harder, Eve. “Art in the age Art decline.” Proceedings: Journal of art, especial issue for art and globalization, sixty-seven, Tehran: Art Research Center, spring 2006.
10. Sasani, Farhad. “Globalization and Museum of Art, the dynamics of globalization and artistic tradition.” Proceedings: Journal of art, especial issue for art and globalization, sixty-seven, Tehran: Art Research Center, spring 2006.
11. Zeimaran, Mohammah. “Globalization, artistic worldview and its dissatisfaction.” Proceedings: Journal of art, especial issue for art and globalization, sixty-seven, Tehran: Art Research Center, spring 2006.
12. Kummarsing, Abhi. “Flooded art: The legacy of globalization.” Trans. Farhad Sasani. Proceedings: Journal of art, especial issue for art and globalization, sixty-seven, Tehran: Art Research Center, spring 2006.
13. Kimani Anjugu, Simon. “Works of art in the Age of Globalization.” Proceedings: Journal of art, especial issue for art and globalization, sixty-seven, Tehran: Art Research Center, spring 2006.
14. Goodarzi (Dibaj), Morteza. “Media, art and modern the world.” Bimonthly Journal of Cultural Spectrum, especial issue for art and globalization, No. 2, Tehran: Institute of Culture and Islamic Art, 2003.
15. Madad Poor, Mohammad. “The impact of globalization on Islamic Iranian art and the art of West.” Proceedings: Journal of art, especial issue for art and globalization, sixty-seven, Tehran: Art Research Center, spring 2006.
16. Moslemian, Nosratollah. “Integration or hybridization, necessity or transfusion.” Professional Artist, No. 28, spring 2009.
17. Misho, Eve. “Tips on identity in current global and indigenous art.” Trans. Vahid Hakim. Professional Artist, No. 22, fall 2007.
18. Nancy, Jean-Luc. “Art in the Context of Globalization.” Proceedings: Journal of art, especial issue for art and globalization, sixty-seven, Tehran: Art Research Center, spring 2006.
19. Hemmati, Homayoun. “Meanings and implications of globalization for culture and art.” Proceedings: Journal of art, especial issue for art and globalization, sixty-seven, Tehran: Art Research Center, spring 2006.
Fahimeh Jamalfarid
Indian Journal Of Natural Sciences www.tnsroindia.org. © IJONS
Vol.5 / Issue 30 / June 2015 International Bimonthly ISSN: 0976 – 0997
7591
A Survey of the Relationship between Corporate Entrepreneurship and its Debt Funding in the Companies Listed on TSE Maryam Tizro1 and Hoda Hemmati2*
1Department of Accounting, Electronic Branch, Islamic Azad University, Tehran, Iran. 2Department of Accounting, Faculty of accounting, Roodehen Branch, Islamic Azad University, Roodehen, Iran. Received: 24 Mar 2015 Revised: 19 Apr 2015 Accepted: 29 May 2015 *Address for correspondence Hoda Hemmati Department of accounting, Faculty of accounting, Roodehen Branch, Islamic Azad University, Roodehen, Iran.
This is an Open Access Journal / article distributed under the terms of the Creative Commons Attribution License (CC BY-NC-ND 3.0) which permits unrestricted use, distribution, and reproduction in any medium, provided the original work is properly cited. All rights reserved.
In financial literature, one of the external funding methods is receiving loans from banks. This study aimed to evaluate the relationship between corporate entrepreneurship and debt funding in the companies listed on TSE. To do this, the data of 124 companies listed on TSE during 2009-2013, multi-variate regression models, random effects model and estimated generalized least squares were applied. The studies showed that there was a direct and significant association between management entrepreneurship and financial leverage (debt funding). Control variables as investment opportunities, tangible assets, and firm size had significant effect on financial leverage of companies.
Key words: Management entrepreneurship, Funding, Debt
INTRODUCTION
This issue is supported in financial literature and bank debt has important role in providing valuable resources of funding (Berger, A. and Udell, 1998). The problem of agency and information asymmetry is the barriers of access of companies to suitable funding sources. According to Chowdhury, R.H. and Maung (2013), the company ability for entrepreneurship is a factor to reduce information asymmetry and agency problems. There are a few direct evidences that how entrepreneurship level of management is useful to reduce information asymmetry and agency problems. Also, in financial literature, the importance of human capital to start the work is supported (Zingales, 2000).Clarification of the effect of corporate entrepreneurship on debt funding is one of the main goals of project. Indeed, it is investigated whether creditors consider the ability of corporate entrepreneurship and its management
RESEARCH ARTICLE
ABSTRACT
Indian Journal Of Natural Sciences www.tnsroindia.org. © IJONS
Vol.5 / Issue 30 / June 2015 International Bimonthly ISSN: 0976 – 0997
7592
team or not. On the other hand, economic development of country requires equipment of capital resources and its optimized allocation to economic productive activities and fulfilling this issue requires development of financial sector of economy namely capital market development and TSE. Investors’ need the information by which can evaluate intrinsic risk and expected return of investment decision making regarding purchase, maintenance or selling it. The present study evaluates the relationship between entrepreneurship and funding in the companies listed in TSE. Indeed, another sign of funding ability of companies and their escape of financial limitations can show new aspect of issues regarding investment and TSE.
Theoretical basics
Entrepreneurship is the process that is started by identification of service from a risk taking person with thoughtful aspects and after taking several stages as idea, screening idea, feasibility and business plan, etc. ends into company formation. To formulate the features of this process, destruction of existing frameworks by creativity destruction or replacing new frameworks can be used (Lewellyn, N. and Jones, 2003). In financial literature, the importance of human capital to start is supported (Zingales, 2000). The ability of company for entrepreneurship is a factor to reduce information asymmetry and agency problems. There are a few direct evidences that how entrepreneurship level of management is useful to reduce information asymmetry and agency problems. The results of the study of Mccline et al., (1987) showed that entrepreneurship quality is the most important factor on decisions of investors for funding.
On the other hand, economic enterprises and institutions to continue their manufacturing activities and development of activities need macro capital. These economic enterprises need financial markets for funding. The role of these markets (financial) is providing required capitals to institutions and companies. Thus, one of the decisions taken by managers of economic unit to maximum wealth of shareholders is the decisions of funding. Financial resources of each economic unit are composed of internal and external resources. The internal resources are cash flows from operations, cash of assets sale and external resources as borrowing from financial markets and stock issuing. Economic enterprises and institutions namely activists in industry sector to continue their manufacturing activities, and development of activities needs macro capital. Also, these economic enterprises are mostly dependent upon financial markets to fulfill required capital. The role of these markets is providing required capital for institutions and companies. Different types of funding sources in the country are divided into cost-based financial resources and non-cost financial resources.
Non-cost financial resources include advance payment of customers, commercial creditors, paid profit and paid costs. The cost-based financial resources are divided into internal sources (accumulated profit) and external sources (short and long-term loans and issuing new stock). One of the important goals of financial management is maximizing wealth of shareholders. To do this, the financial managers try to find funding sources methods to achieve this goal (Sheikh et al., 2013). Based on the literature, various factors affect funding of companies. Based on funding sources, the companies have different risk and return in capital supply markets. Based on funding sources, the companies have different risk and return in capital funding markets. Thus, decisions of capital structure play important role in efficiency of companies in funding institutions (Sheikh et al., 2013). Many developing countries including our country in the past two decades have found that creating capital market and financial institutions to fund the companies and economic growth are necessary. Funding and investment are two important decision making fields in a company. Regarding the decisions of funding, the manager tries to determine the best funding composition or capital structure for the organization. Decision making regarding capital structure is a combination of debt and equity as an organization applies for business funding (Damodaran, 2001). After the study of Modigliani and Miller (1958), capital structure theory and its relation with company performance is turned into an interesting issue in accounting and funding literature. Maximizing value is a common goal among the managers. Investors can get loan with similar interest rate and they have similar expectations about profits of organization. Capital structure in determining organization value is irrelevant (Modigliani and Miller, 1963). Indeed, creating an optimal capital
Maryam Tizro and Hoda Hemmati
Indian Journal Of Natural Sciences www.tnsroindia.org. © IJONS
Vol.5 / Issue 30 / June 2015 International Bimonthly ISSN: 0976 – 0997
7593
structure is difficult (Siddiqui and Shoaib, 2011). On the other hand, entrepreneurship is one of the necessities of present century as called information era. We can say that it has some outcomes as globalization, learning new technologies, rapid changes in trading and competition in business. IN such space, corporate entrepreneurship is used as development factor and one of the most important indices to achieve good future (Mccline, 2004).
REVIEW OF LITERATURE
Lopez-Gracia and Sogorb-Mira (2014) in a study “Sensitivity of external resources to cash flow under financial constraints” evaluated the relationship between external funding and cash flow based on capital structure theory and dividing the companies to financial distress and no financial distress. The results showed that in the companies listed on Spain stock market and in delisted companies during 1996 to 2010, there was an inverse and significant relationship between cash flow and external funding.
Chowdhury, R.H. and Maung (2013) in a study “Corporate entrepreneurship and debt financing: evidence from the GCC countries” evaluated the relationship between entrepreneurship and debt in GCC countries during 2001-2008. They found that increasing entrepreneurship activities led into the increase of company ability in bank borrowing.
Ogden and Wu (2013) in a study “Reassessing the effect of growth options on leverage” found that based on review of literature and balance theory, profitable growth opportunities were important factors in explaining financial leverage of Italian companies during 2000 to 2011.
The results of investigations showed that there was a non-linear relationship between growth opportunities of company and financial leverage. Honjo and Harada (2006) in the study “SME policy financial structure and firm growth: evidence from Japan applied the information of SME manufacturing Japanese companies during 1993-2003 and found that leverage had positive effect on sale growth. They found this result consistent with other studies in Japan and found that SME conditions were similar to other companies.
Rahimian and Tavakolnia (2013) in a study “financial leverage and its relation with financial distress and growth opportunities in the companies listed on TSE (linear and curvature relations) found that (using the data 2007-2011) showed the lack of effect of financial distress on financial leverage. Also, the results showed the relationship of inversed U-shape )∩( between growth opportunities and financial leverage in the companies listed on TSE. Sinayi et al., (2011) by the data of the companies listed on TSE in a study “the effect of growth opportunities on relationship between capital structure, dividend and ownership with company value” (by the data of 2004-2008) found that there was a significant relationship between capital structure (leverage) and dividend with company value. In case of growth opportunities, this relation is negative and significant. Noravesh and Yazdani (2010) in a study “evaluation of the effect of financial leverage on investment in the companies listed on TSE” evaluated the relationship between leverage and investment decisions in the companies listed on TSE during 2001-2006. To do this, two criteria are used for leverage and three empirical models. The results showed that there was a negative and significant relationship between leverage and investment. The results showed that the relationship between leverage and investment in the companies with less growth opportunity was stronger than the companies with high growth opportunities.
METHODOLOGY
This study is applied in terms of purpose. The results can be used in decisions of investors, analysts and managers. IN terms of reference regarding the study hypotheses, the study is descriptive-correlation as it discovers the relationship between study variables and regression techniques and correlation and it is also deductive. The results of study are in proving theories. For data collection, library method is used. The required data to test the study
Maryam Tizro and Hoda Hemmati
Indian Journal Of Natural Sciences www.tnsroindia.org. © IJONS
Vol.5 / Issue 30 / June 2015 International Bimonthly ISSN: 0976 – 0997
7594
hypotheses are extracted from annual financial statements of companies, report of board to general assembly of shareholders and website of TSE.
Hypothesis and study variables
The study hypothesis is as: There is a significant relationship between entrepreneurship and debt funding. The variables of study for study hypothesis test include: Independent variable It is entrepreneurship and in this study, it has strong link with management efficiency and based on the study of Chowdhury, R.H. and Maung (2013), management inefficiency model is used to measure it. Indeed, management inefficiency is equal to the shortage of entrepreneurial measurements. The following model is used for its calculation:
ln (Yi,t) = α + β1ln (Wi,t) + β2ln (Qi,t) + i,t
Where,
Y=Sale income of company
W=It is based on two separatedvariables as used in regression: Cost of cost of goods sold (COGS) and general, administrative, distribution and sale costs (SGA)
Q=Two separated control variables as used separately in regression: Total assets (TA) and total fixed assets (FA)
Dependent variable
Debt funding in this study is the ratio of long-term debts of company to its assets. Indeed, the amount of assets as fulfilled via long-term debt (Chowdhury, R.H. and Maung, 2013) and it is called financial leverage
Control variables
Investment opportunities as equal to the ratio of equity market to its book value. Tangible assets are equal to the ratio of fixed assets to total assets. Profitability growth is net profit growth rate of this year compared to the previous year. Liquidity of company is turnover period of received accounts plus turnover period of goods inventory minus paid accounts and firm size as equal to logarithm of company assets.
To test the study hypothesis, the following model is used:
LEVi,t = Constant + β1 log ui,t + β2 INVOPPi,t + β3 TASSETi,t + β4 PROFi,t + β5 LIQDi,t + β6 SIZEi,t + i,t
Where,
Log u = Management inefficiency logarithm LEV:Financial leverage of company
Maryam Tizro and Hoda Hemmati
Indian Journal Of Natural Sciences www.tnsroindia.org. © IJONS
Vol.5 / Issue 30 / June 2015 International Bimonthly ISSN: 0976 – 0997
7595
INVOP=Investment opportunities TASSET:Tangible assets PROF=Profitability growth LIQD=Company liquidity SIZE=Firm size LEVi,t = Constant + β1 log ui,t + β2 INVOPPi,t + β3 TASSETi,t + β4 PROFi,t + β5 LIQDi,t + β6 SIZEi,t + i,t
Study sample, population
The study population is the companies listed on TSE. The study sample is selected by systematic elimination method. The sample is based on all companies in study population meeting the following criteria:
It has not fiscal period change in the study period. It is not active company in financial activities as investment, banks, insurance and financial institutions. The required data during 2009 to 2013 are available. Their fiscal period leads to 12/29 of year to put the data beside each and panel is used.
Data analysis measures
The software of data analysis is Eviews 7 software. To determine suitable method of pooled data, various approaches are used. The common approach is to use Chow test to use pooled data and their homogeneity or non-homogeneity. The results of this test are based on using data as panel data and to estimate study model, one of fixed effects or random effects models is used and Hausman test is performed to select one of two models.
STUDY FINDINGS
The study findings are based on two parts:1- Descriptive, 2- Inferential.
Descriptive statistics of study variables
The study sample during 2009-2013 includes 124 companies. The mean, median (central measures), standard deviation, maximum and minimum (distribution criteria) of variables are calculated and shown in Table 1.
As shown in Table 1, the mean of profitability growth is 0.113. The median of management entrepreneurship is 0.097. This value is equal to the mean of Sahand rubber companies in 2011 and drug Distribution Company in 2012. Generally, distribution criteria are those comparing the distribution of observations around the mean. One of the most important dispersion criteria is standard deviation. As shown, this criterion for management entrepreneurship is 0.096. The highest value of management entrepreneurship is dedicated to Alborz Daru Company in 2009 and is 0.478 and the lowest value is regarding AlomeradCompany in 2011 as -0.154. The maximum and minimum values of financial leverage are 0.613, 0.0009 dedicated to Artaviltire in 2012 and Sahand rubber in 2013. The mean and median values are 0.086, 0.052.
Other variables in Table 1 are investment opportunities and tangible assets as their mean and median are 1.85 and 1.514, respectively. For investment opportunity as 0.252 and 0.218 for tangible assets. The mean and median values of profitability growth and liquidity of company are 0.131, 0.084, respectively for profitability growth and 0.667, 0.609 for company liquidity. The mean and median of firm size are 5.827, 5.766.
Maryam Tizro and Hoda Hemmati
Indian Journal Of Natural Sciences www.tnsroindia.org. © IJONS
Vol.5 / Issue 30 / June 2015 International Bimonthly ISSN: 0976 – 0997
7596
Regression test
In each regression model, specific assumptions are established in case of elimination of each of them, good features of regression factors or hypothesis test faced problems. Some basic assumptions of regression in this study are 1) The mean of disturbance term (residuals), et is zero and if we have a fixed term in regression, this assumption is not violated, 2) Disturbance term (et) has normal distribution and based on central limit, high number of data can eliminated this problem, 3) Disturbance terms in various observations are non-correlated or independent and Durbin-Watson test is used in this regard, 4) Variance of disturbance term is equal to fixed value as 2δ, as V(et)=δ2 and using estimated generalized least squares eliminates this problem (Asadi, 2013).
The test of normality of regression disturbance components Jark-Bra test is used to investigate normality of regression disturbance terms. The results of this test are shown in Table 2. As significance level is less than 0.05, regression disturbance term distribution is not normal.
Study hypotheses test
To define the method of pooled data and determining homogeneity or non-homogeneity, Chow and F Limers test are used. The statistical hypotheses of this test are as:
H0=Pooled Data
H1=Panel Data
H0 is based on lack of individual effects not observed and H1 is based on individual non-observed effects. If H0 is supported, it means that the model has not non-observed individual effects. Thus, it is estimated by pooled regression model. If H1 is supported, it means that non-observed individual effects are seen. If the results of test are based on using data as panel data, to estimate the study model, one of fixed effects models or random effects model is used. To select one of these two models, Hausman test is used.
H0=Random Effect
H1=Fixed Effect
Null hypothesis of Hausman is based on suitability of random effects to estimate regression models of panel data.
As shown in Table 3, chow test shows that F statistics is less than 5%. To test this model, the data are used as panel. In the continuing of Table 4, by performing Hausman test, fixed or random effects method is used.
As shown in Table 4, significance level of Hausman test is less than 0.05. To estimate the coefficients of mentioned model, fixed effects model is used. The result of mentioned model test by fixed effects model and estimated generalized least squares are shown in Table 5.
Based on the coefficients in estimation of management entrepreneurship, management entrepreneurship value is calculated. To estimate the model coefficients, at first to determine pooled data and determining homogeneity or non-homogeneity, Chow and F Limer statistics are used. The results of this test are shown in Table 6.
Maryam Tizro and Hoda Hemmati
Indian Journal Of Natural Sciences www.tnsroindia.org. © IJONS
Vol.5 / Issue 30 / June 2015 International Bimonthly ISSN: 0976 – 0997
7597
As shown in Table 6, Chow test shows that probability in F statistics is less than 5% and to test this model, the data are used as panel. In continuance of Table 7, by Hausman test, fixed or random effects methods are used.
As shown in Table 7, significance level of Hausman test is above 0.05. To estimate coefficients of mentioned model, random effects model is used. The result of test by random effects and estimated generalized least squares is shown in Table 8.
As shown in Table 8, t statistics of management entrepreneurship is bigger than +1.965 (+4.614) and its significance level is smaller than 0.05. There is a direct and significant relationship between management entrepreneurship and financial leverage (debt funding) of the companies listed in TSE. Thus, study hypothesis is supported. As t statistics of investment opportunities is bigger than -1.965 (-2.026) and its significant level is smaller than 0.05, there is an inverse and significant relationship between investment opportunities and financial leverage of companies listed in TSE. Similar conditions are for firm size variable. The tangible assets variable has significant and direct relationship with financial leverage and profitability growth and liquidity of company have no significant effect on financial leverage. As shown, Durbin-Watson statistics is 1.792 ranging 1.5 to 2.5. Significance level of F statistics is 0.000 as lower than 0.05 and it shows model significance. Another point in Table 8 is coefficient of determination. The coefficient determination value is about 26% and it shows that about 26% of changes of dependent variable are explained by control and independent variables and it is acceptable value. Generally, findings of study show that creditors have positive reaction to increasing entrepreneurship and efficiency of management of companies. In other words, management efficiency and entrepreneurship have direct effect on debt funding of company. Other important findings of this study are direct effect of tangible assets on debt funding. It is proposed to the companies listed on TSE to consider attention of creditors to tangible assets as mortgage assets to take credits and have available tangible assets. Also, the lack of profitability and liquidity effect of company on debt funding is another results of study.
CONCLUSION
The results show that there is a direct and significant association between management entrepreneurships and financial leverage (debt funding). Control variables of investment opportunities, tangible assets and firm size had significant effect on financial leverage of companies. It was shown that:
Management entrepreneurships had significant and direct effect on debt funding. Investment opportunities had significant and inverse effect on debt funding of company. Tangible assets had direct and significant effect on debt funding. The firm size had significant and inverse effect on debt funding.
The mentioned result is consistent with the studies of MacMillan et al., (1987), Bruderl et al., (1992), Zingales (2000), Kaplan, S.N. and Stromberg (2000) and Chowdhury, R.H. and Maung (2013) and there is no contradiction in review of literature. The reason is regarding the theoretical basic of most of review of literature. The study of Chowdhury, R.H. and Maung (2013) is only a previous review of literature.
Chowdhury, R.H. and Maung (2013) in a study “Corporate entrepreneurship and debt financing: evidence from the GCC countries” evaluated the relationship between entrepreneurship and debt level in GCC countries during 2001-2008. After the analysis of some models, they found that increasing entrepreneurships led into the increase of company ability in bank borrowing.
On the other hand, study findings show that creditors have positive reaction to increasing entrepreneurship and efficiency of management of companies. Efficiency and entrepreneurship of management has direct effect on debt
Maryam Tizro and Hoda Hemmati
Indian Journal Of Natural Sciences www.tnsroindia.org. © IJONS
Vol.5 / Issue 30 / June 2015 International Bimonthly ISSN: 0976 – 0997
7598
funding. The most important recommendations of present study are regarding this issue. It is recommended to the decision makers of companies listed on TSE to consider this issue that increasing entrepreneurship can lead to increasing of funding of company in case of taking decisions on entrepreneurship. In addition, it is recommended to the investors in TSE to consider the positive effect of entrepreneurship and efficiency on access of company to external funding in case of making investment and stock trading and they should consider the efficiency and entrepreneurship of management and probable reactions of creditors.
The present study applies long-term debt ratio to total assets to measure financial leverage and in future studies, some criteria as ratio of debts to assets and ratio of bank debts to total assets are used and the results can be compared. In addition, it is recommended to test the relations of this study in future studies as non-linear.
REFERENCES
1. Asadi, Z. (2013). The investigation of the non-linear relationship between investment in fixed assets and performance of companies listed on TSE (based on industry). MA thesis of accounting. TarbiatModares University.
2. Rahimian, N., Tavakolnia, E. (2013). The financial leverage and its relation with financial distress and growth opportunities in the companies listed on TSE (Linear, curvature). Scientific, research journal of financial accounting. 20: 109-130.
3. Sinayi, H., Selgi, M.,Mohammadi, K. (2011). The effect of growth opportunities on the relationship between capital structure, dividend and ownership structure with value. Journal of financial accounting researches. 3(4): 87-102.
4. Sheikh, M., Dehghani, J.,RaeiEzabadi, M.(2013). The effect of inflation rate on funding of companies listed on TSE (bank debts and stock issuing). Scientific and research journal of assets management and funding. 1(2): 51-68.
5. Noravesh, I.,Yazdani, S. (2010). The investigation of the effect of financial leverage on investment in the companies listed on TSE. Financial accounting research. 2: 35-48.
6. Berger, A., Udell, G. (1998). The economics of small business finance: the roles of private equity and debt markets in the financial growth cycle. Journal of Banking and Finance, 22 (6-8): 613-673.
7. Bruderl, J., Preisendorfer, P., Ziegler, R. (1992). Survival chances of newly founded business organizations. American Sociological Review, 57 (2): 227-242.
8. Chowdhury, R.H., Maung, M. (2013). Corporate entrepreneurship and debt financing: evidence from the GCC countries. International Journal of Managerial Finance, 9 (4): 294-313.
9. Damodaran, (2001). Corporate Finance. Theory and practice (2nd edition). New York: Wiely. 10. Honjo, Y., Harada, N. (2006). SME policy financial structure and firm growth: evidence from Japan. Small
Business Economics, 27: 289–300. 11. Kaplan, S.N., Stromberg, P. (2000). How do venture capitalists choose investments.working paper, University of
Chicago, Chicago, IL, August. 12. Lewellyn, N., Jones, G. (2003). Controversies and conceptual development. Public management Review, 5 (2):
245- 266. 13. Lopez-Gracia, J., Sogorb-Mira, F. (2014). Sensitivity of external resources to cash flow under financial constraints.
International Business Review. 14. MacMillan, I.C., Zemann, L., Subbanarasimha, P.N. (1987). Criteria distinguishing successful from unsuccessful
ventures in the screening process. Journal of Business Venturing, 2 (2): 123-137. 15. Mccline, R.L. (2004). Opportunity recognition: An exploratory investigation of a component of the
entrepreneurial process in the context of the health care industry: Theory and practice. Tertiary Education Management, 25(2): 81-94.
Maryam Tizro and Hoda Hemmati
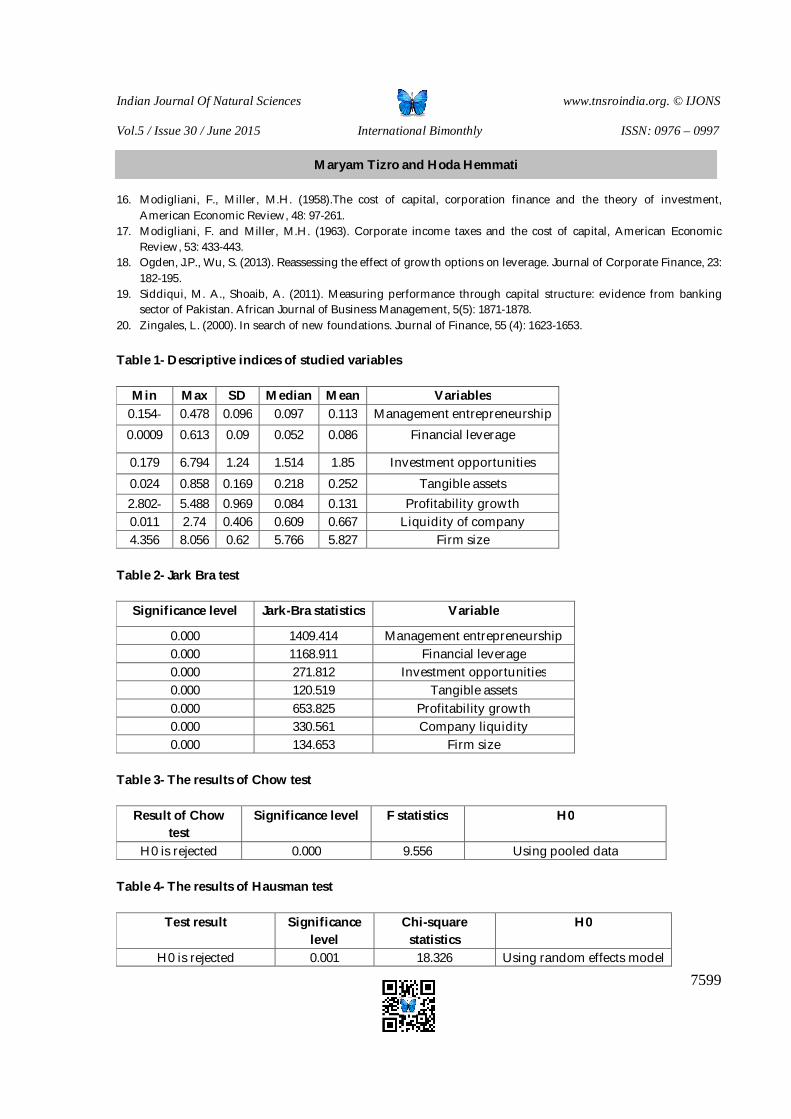
Indian Journal Of Natural Sciences www.tnsroindia.org. © IJONS
Vol.5 / Issue 30 / June 2015 International Bimonthly ISSN: 0976 – 0997
7599
16. Modigliani, F., Miller, M.H. (1958).The cost of capital, corporation finance and the theory of investment, American Economic Review, 48: 97-261.
17. Modigliani, F. and Miller, M.H. (1963). Corporate income taxes and the cost of capital, American Economic Review, 53: 433-443.
18. Ogden, J.P., Wu, S. (2013). Reassessing the effect of growth options on leverage. Journal of Corporate Finance, 23: 182-195.
19. Siddiqui, M. A., Shoaib, A. (2011). Measuring performance through capital structure: evidence from banking sector of Pakistan. African Journal of Business Management, 5(5): 1871-1878.
20. Zingales, L. (2000). In search of new foundations. Journal of Finance, 55 (4): 1623-1653.
Table 1- Descriptive indices of studied variables
Variables Mean Median SD Max Min Management entrepreneurship 0.113 0.097 0.096 0.478 0.154-
Financial leverage 0.086 0.052 0.09 0.613 0.0009
Investment opportunities 1.85 1.514 1.24 6.794 0.179
Tangible assets 0.252 0.218 0.169 0.858 0.024 Profitability growth 0.131 0.084 0.969 5.488 2.802-
Liquidity of company 0.667 0.609 0.406 2.74 0.011 Firm size 5.827 5.766 0.62 8.056 4.356
Table 2- Jark Bra test
Variable Jark-Bra statistics Significance level
Management entrepreneurship 1409.414 0.000 Financial leverage 1168.911 0.000
Investment opportunities 271.812 0.000 Tangible assets 120.519 0.000
Profitability growth 653.825 0.000 Company liquidity 330.561 0.000
Firm size 134.653 0.000
Table 3- The results of Chow test
H0 F statistics Significance level Result of Chow test
Using pooled data 9.556 0.000 H0 is rejected
Table 4- The results of Hausman test
H0 Chi-square statistics
Significance level
Test result
Using random effects model 18.326 0.001 H0 is rejected
Maryam Tizro and Hoda Hemmati
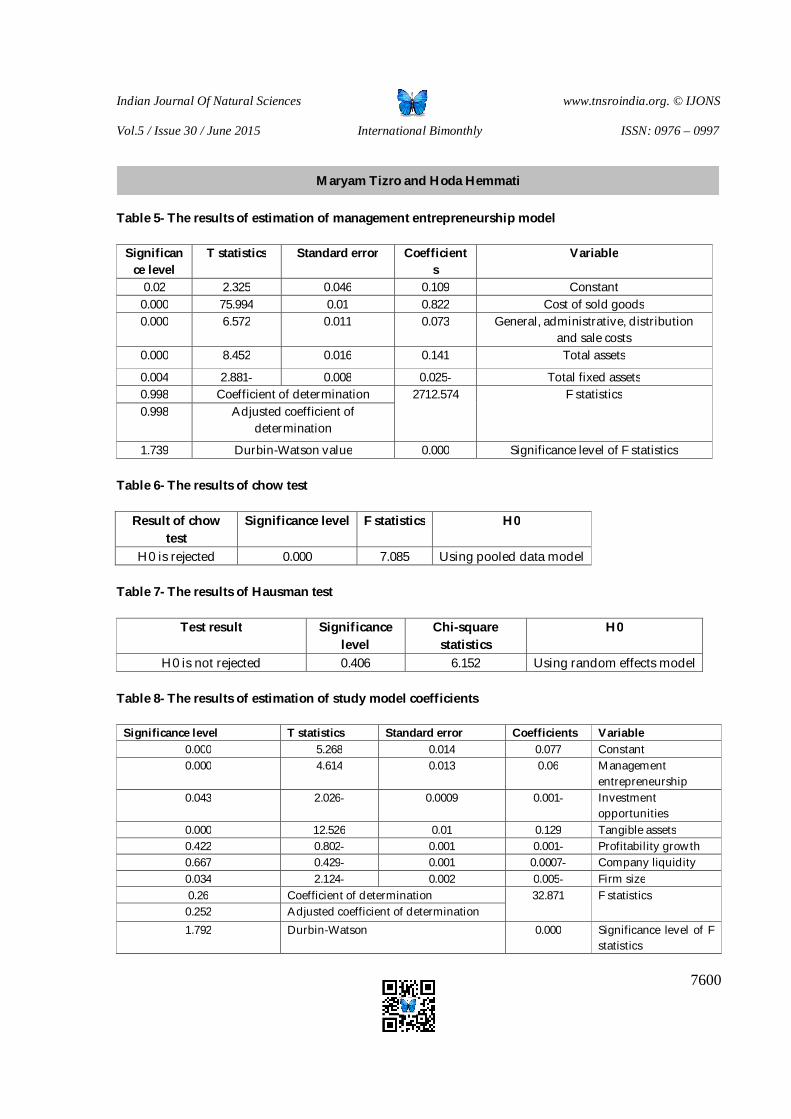
Indian Journal Of Natural Sciences www.tnsroindia.org. © IJONS
Vol.5 / Issue 30 / June 2015 International Bimonthly ISSN: 0976 – 0997
7600
Table 5- The results of estimation of management entrepreneurship model
Variable Coefficients
Standard error T statistics Significance level
Constant 0.109 0.046 2.325 0.02 Cost of sold goods 0.822 0.01 75.994 0.000
General, administrative, distribution and sale costs
0.073 0.011 6.572 0.000
Total assets 0.141 0.016 8.452 0.000
Total fixed assets 0.025- 0.008 2.881- 0.004 F statistics 2712.574 Coefficient of determination 0.998
Adjusted coefficient of determination
0.998
Significance level of F statistics 0.000 Durbin-Watson value 1.739
Table 6- The results of chow test
H0 F statistics Significance level Result of chow test
Using pooled data model 7.085 0.000 H0 is rejected Table 7- The results of Hausman test
H0 Chi-square statistics
Significance level
Test result
Using random effects model 6.152 0.406 H0 is not rejected Table 8- The results of estimation of study model coefficients
Variable Coefficients Standard error T statistics Significance level Constant 0.077 0.014 5.268 0.000 Management entrepreneurship
0.06 0.013 4.614 0.000
Investment opportunities
0.001- 0.0009 2.026- 0.043
Tangible assets 0.129 0.01 12.526 0.000 Profitability growth 0.001- 0.001 0.802- 0.422 Company liquidity 0.0007- 0.001 0.429- 0.667 Firm size 0.005- 0.002 2.124- 0.034 F statistics 32.871 Coefficient of determination 0.26
Adjusted coefficient of determination 0.252 Significance level of F statistics
0.000 Durbin-Watson 1.792
Maryam Tizro and Hoda Hemmati
Indian Journal Of Natural Sciences www.tnsroindia.org. © IJONS
Vol.5 / Issue 30 / June 2015 International Bimonthly ISSN: 0976 – 0997
7601
The Reasons for Importance of Khorasan to the Umayyads Simin Hasanvad* and Amir Teymour Refaei Department of Humanities, Faculty of history, Mahallat Branch, Islamic Azad University, Mahallat, Iran. Received: 27 Mar 2015 Revised: 18 Apr 2015 Accepted: 29 May 2015 *Address for correspondence Simin Hasanvad Department of humanities, Faculty of history, Mahallat Branch, Islamic Azad University, Mahallat, Iran.
This is an Open Access Journal / article distributed under the terms of the Creative Commons Attribution License (CC BY-NC-ND 3.0) which permits unrestricted use, distribution, and reproduction in any medium, provided the original work is properly cited. All rights reserved.
Arabs were interested in some areas of Iran such as Khorasan due to its geographical location and climate, which was consistent with the nature of the Arabs. When the Arabs entered this area, they apparently began to advertise Islam, but they forgot to propagate Islam by observing the trophies in Khorasan. The Umayyads used Islam to advance their goals, which was to collect trophies and Ransom. It was a reason to impose pressure on people; thus, people protested against Umayyad rule and resulted in movements that overthrew the Umayyad rule.
Key words: Khorasan, movement, the Iranian government, the Umayyads.
INTRODUCTION
The necessity of this research was to identify the position and to count the causes the Umayyads’ attention to Khorasan. The article consists of four parts; the first section describes four reigns of khorasan including Nishapur, Herat, Marv, and Balkh. The second part is devoted to the creation of Umayyad rule in Khorasan that was attacked by them immediately with arrival in Iran because Khorasan was a perfect opportunity. The third part explores the internal situation of Khorasan during the reign of the Umayyads that founded on a regular basis according to the wishes of the people. Because the Arabs knew themselves superior to the Iranians, Iranian were oppressed by Arabs in the mid and late Umayyad rule that resulted in anti-Umayyad movements. The fourth section is dedicated to analyzing the movements and uprisings against the Umayyads in Khorasan that caused the fall of the Umayyads. Finally, a conclusion will be presented. The article will use twelve library-based sources. The most important available sources are Iran and the Umayyad period written by Abdollah Mahdi Al-Khatib, History of Iran in the Early Centuries of Islam by Bertold Spuler, and Historical Geography of Eastern Caliphate Territories by Gay Lestrange.
RESEARCH ARTICLE
ABSTRACT
Indian Journal Of Natural Sciences www.tnsroindia.org. © IJONS
Vol.5 / Issue 30 / June 2015 International Bimonthly ISSN: 0976 – 0997
7602
The geographical location of Khorasan
In Old Persian language, Khorasan means the Eastern land. The name was applied generally to all the States in the east of the Lut desert to the mountains of India; thus, it contains all cities of Transoxiana with the exception of Sistan in the northeast and Ghohestan in the south. External border of Khorasan was Chinese desert in the Middle East and Pamir and the Hindu Kush mountains by India. Later, the border was smaller and more accurate as far as it can be said that Khorasan was one of the provinces of Iran in the Middle Ages. From the northeast, it did not have the external borders of the Oxus River, but it contained all the heights behind Heart that is now the northwest part of Afghanistan. However, the Arabs regarded the lands located in the upper side of Oxus River, in the Pamir region, as Khorasan.
The Arabs had divided Khorasan to four parts or quarters namely Nishapur, Marv, Herat and Balkh. Khorasan province bases were Balkh and Marv after the early conquests of Islam; later, Taherid dynasty rulers moved the center of their empire to the west and selected Nishapur, which was an important city, as the center of their empire. The town’s name is pronounced in modern Persian as Neishabour. The name is derived from Old Persian “Neisha Pur” meaning good thing or place, or a good place for the King; it is attributed to Sassanid king Shapur II who initiated to renew the city in the fourth century. The founder of Nishapur was Shapur I, the son of Ardashir I who had founded the Sassanid dynasty. In the early Islamic state, Nishapur was also known as the “mega city,” mentioned on the coins that were minted by the Umayyad and Abbasid caliphs in the city (Lestrange, 1998, pp. 408-9). In the first Hijr century, they noticed Hamadan, Isfahan, and Fars as well as from Qom, Kashan and Rey to Qazvin and Azerbaijan on the one side and Ghomes, Khorasan and Sistan the other side. Some of these places were occupied by the nomads due to climate and agreement with their primitive nature (Zarrinkoub, 2009). In general, some cities of Iran that were consistent with the Arabs’ nature were interested by them. The extent of Marv in Khorasan was as such (Zarrinkoub, 2008).
The Creation of Umayyad Rule in Khorasan
This section first explores the importance of Khorasan that explains the main reasons for the Umayyads’ attention to this land. Arab attackers looked toward Khorasan when they placed a foot on Iranian soil. It was not easy to conquer a large area and high-wealth land enriched by silver, gold and turquoise stones, good horses, and brocade garments of all kinds as well as favorable climate, and healthy and strong people. Since the early caliphate of Umar to the middle of the caliphate of Uthman, means that within twenty years, Land of Khorasan remained unopened on Muslim armies despite repeated attempts by Islamic rulers. However, Tabas residents embraced Islam before the rest of Khorasan leave the cult of their ancestors for fear of sword. The gradual conquest of other areas lasted untill the governance of Muawiya in 42 Hijri, or perhaps long after that date. (Taheri, 1969). In the Arab migration, Khorasan geographical situation was more consistent than many other parts of the with Arabs’ manner of living; an Arab man could move and relocate easily with his camels in the deserts around Khorasan, while he could not simply pass the rivers or ascent of the mountains. Hence, Arab immigrants showed more interest in the surrounding areas of Ghomes and Khorasan. In 52 Hijri, fifty thousand fighting men settled in Khorasan with their wives and families, half were from Kufa and others were from Basra (Zarrinkoub, 2009). East of Iran, especially Khorasan that was almost completely separated from Sistan by the vast desert, could not in fact be under the supervision of Mesopotamia. This fact and numerous related unrests in Khorasan resulted from Arab tribal feuds and civil wars required for this area appointment of local agents; only governors were allowed to mint coins under their our names (without mentioning the Caliphate’s name) (Ishpouler, 1970).
Khorasan fall slightly into the hands of the Arabs with Yazdgerd’s death and division of the remainder of his army. Kanarang Tous who had resigned the signs of Yazdgerd was submitted to peace. Bulgaria was opened by Amir Waef ben Qeis and Hiataleh who had resisted with the help of people was defeated. Harat, Balkh, and Marv were
Simin Hasanvad and Amir Teymour Refaei

Indian Journal Of Natural Sciences www.tnsroindia.org. © IJONS
Vol.5 / Issue 30 / June 2015 International Bimonthly ISSN: 0976 – 0997
7603
conquered by peace. Marv was a nomadic place for Arabs as another Basra a few years later. Abdollah ibn Amir attached it and all Khorasan to Basra governance. With the capture of Khorasan, Arab army reached the edge of Transoxiana; afterwards, the Umayyad rulers passed marv and led Arabs in Transoxiana. The inroads had lasted for years were carried out by the tribes. Winter ended summer wars and conducted fighters to their garrisons in Khorasan. The goal was to fight for the trophy rather than to spread Islam. As noted by Said Khazineh, the Umayyad governor of Khorasan, Arabs regarded these places as the property of the Caliphate and their own lands. In the Sassanian era, the Arab tribes lived in southern and western sides of Iran.
Therefore, the Arab immigrants flowed into Iran especially following the Islamic conquest mainly from Kufa and Basra. Meantime, these seekers of “life opportunity” were mostly entered Khorasan for Jihad in the boundaries; there were some Shia or Khawarij travelers had decided not to live in Syria and Iraq. Some of them moved to Qom like Ale Saeb because they were persecuted by the Umayyad rulers in Iraq. They moved to this far place to get rid of what was detestable to them. Despite their conquest, the Iranians reject their company as they were called “Demon” in Madain or the Sistani devils did not accept their company; people would curse them when they stood to pray, or stone their houses. The Arabs were gradually bought land and properties, communicated and interacted with local people, fawn, and empowered themselves through polygamy and the multitude of children. Tribal prejudices and Arabic support were other empowerment factors in the early years before long-standing conflicts occurred between them (Zarrinkoub, 2009).
The Umayyad was the first Arab dynasty that began to conquer the Middle East. It is necessary to say that Umayyad was a dynasty descended from Ishmael son of Abraham that was divided into two groups of northern and southern Arabs. Qhahtani was the ancestor of northern Arabs and Ishmael was the ancestor of southern Arabs. In general, the Umayyad dynasty, which is a subfamily of the Quraish tribe, was first founded by Muawiyah. (Howthing, 2007). With the rise of the Umayyads, Arab relations with Iran endured many changes because the nature of the Umayyad Caliphate was different with Rashedin caliphates and their government was based on tribal aristocracy that was rooted in Ignorance Era. (Moftakhari, 2007). There has not been reported any notable conquers in the governance of Muawiyah and most of the conflicts was limited to subdue the rebellion of the inhabitants of the national territory. Muawiyah assigned Said ibn Uthman as the ruler of Khorasan. When Hajaj became the general governor of Khorasan and Iraq in 697, conquest of Transoxiana was extended. He appointed Mohlab ibn Abi Safreh as his agent in Khorasan. Continuous clashes between Muslims and people of Transoxiana, which were neighbors, were dangerous for Muslims; these incited them to attach Transoxiana to Islamic land to avoid further conflicts, to spread Islam there, and control the region under their hegemony before conditions worsened.
Despite civil conflicts, people would ally with each other if the feel any threat from outside. Military operation was important in Central Asia and related to success in the land of Mavra’alnhryn. The Muslim commander of Khorasan, Qatibeh ibn Moslem Baheli, dominated the Umayyad control over the land and he could prove his competence in leadership (Toqoush, 2001). In 705, Qatibeh ibn Moslem Baheli became the general commandar of Khorasan by Hjaj ibn Yousef. He was appointed to this position when he expelled Ale Mohlab from Kerman to attach Khorasan directly to Iraq in military terms because Ale Mohlab had decided to free the land from the governance and control of Arab tribes. In this manner, Qatibeh became the general commander of Khorasan.
The Arabs continued to go to Khorasan, but Islam had been limited to some cities of Khorasan, especially in Transoxiana that was the center of incessant revolts of the Turks. With the leadership of Qatibeh ibn Moslem Baheli and the support of ojaj ibn Yousef Saghafi and Walid ibn Abdol Malik in east Khorasan, Arab armies spread throughout Khorasan, crossed the Oxus or Amu Darya River, and fought in the cities of Transoxiana. This attack was fulfilled when Qatibeh united the Arabs of Khorasan and diverted them from political problems and tribal clashes in Basra because the clashes between Arab tribes living in Basra and Kufa had influenced the Arabs living in Khorasan. While Khorasan did not have tribal problems, it was a good place for implementation of personal objectives due to its
Simin Hasanvad and Amir Teymour Refaei

Indian Journal Of Natural Sciences www.tnsroindia.org. © IJONS
Vol.5 / Issue 30 / June 2015 International Bimonthly ISSN: 0976 – 0997
7604
distance from the center of Arabic caliphate and the central power. Qatibeh succeeded to unite Arabs in Khorasan only when he succeeded to eliminate the political atmosphere full of envy, hatred, revenge and vendetta in the land. This was carried out by settlement of economic issues that had risen envy and hatred among Arabs. Qatibeh’s policy in Khorasan was settlement and solving all problems (albeit in rapid and shallow cases). Society was divided into the ruling and the condemned classes of Khorasan (the Arab and Ajam). As the result of Qatibe’s harsh and cruel policy and the power of Arab army over Iranian and Arab farmers, shopkeepers and artisans, Iranian elites, feudals and aristocrats, which occupied important political position in political system later, were subdued (Al-Khatib, 1999, pp. 13-17). Indeed, after one century from the beginning of Khorasan and Jibal conquest, Islamic caliphate was turned to Arabic governance; all religious enthusiasm and ideals of the Muslims were removed so that some groups rose to overthrow the Arabic regime under the title of supporting religion and the family of the holy Prophet (pbuh) (Zarrinkoub, 2009).
Internal Situation of Khorasan during the Umayyads
With the establishment of Arab tribes in Iran in the Umayyad period, in order to develop and maintain the conquests, Wali, or the governor, was in charge of a sort of civil administration centered by Iraq and the governors were sent to different cities from Jibal to Khorasan and Sistan; they also supervise the conquests. The most famous governors were Abdollah ibn Ziad, Hajaj ibn yousef, Khaled ibn Abdollah Qasri. Sometimes, the Caliphate chose the governor himself because of the sensitivity and importance of certain areas, such as Khorasan. In times of weakness of the central government and strength of the tribes, tribal aristocracy elected the governor of the time.Beyond Wali, war and tax agents were important figures. After the death of Yazid, Conquests were slower due to crisis caused by the weakening of the Umayyad and tribal clashes untill Qatibeh ibn Moslem Baheli was appointed commander of conquests and the governor of Khorasan after the consolidation of the Marwan branch Umayyad caliphate by Hajaj ibn Yousef in 86 Hijri (Moftakhari, 2007).
Abdol Malik ibn Marwan gave Khorasan to one of his relatives named Omayeh ibn Abdollah (74 Hijri). He was loved by the Caliphate, but he splurged as much as once he wrote to the Caliphate that the revenues of province were not enough to afford his kitchen. Moslem ibn Abdollah who had became the governor of Iraq and Khorasan by his brother Yazid ibn Abdol Malik, did not give any of the tributes to the Caliphate. Yazid ibn Mohleb who was selected by Soleiman ibn Abdolmalik as the governor of Khorasan was imprisoned by his deputy, Omar ibn Abdol Aziz, to return all he has taken from province tributes. Collecting tributes in the far land of Khorasan occupied by new Muslims was very difficult and strict, but the Arab governors forced mostly the new Muslims to pay expenses and neglect the Arabs even if they were owner of properties. This fact and further violence and cruelty in obtaining a variety of gifts and tax caused dissatisfaction and complaints (Zarribkoub, 2009).
In the Umayyad period, expansionism was solely for personal and private accumulation of wealth, and personal purposes, not to spread Islam. Many jurists disagreed with this fact and they even motivated people to rise against territorial policy of the Umayyads and asked the governments to behave people in Khorasan and Transoxiana according to the Islamic principles of justice and equality. The recent openings of the Umayyad regime was provoked tribal nervousness spirit. Newly formed groups in the political life of Khorasan were very influential in order to achieve socio-economic benefits and access to high financial posts in the government. In this regard, Soleiman ibn Abdolmalik led strict attacks to clear government agencies in most parts of the Arabic Caliphate. Khorasan was one of the most covered places under the attacks of Soleiman. Khorasan was extremely turbulent, distracted and irritable and its residents complained their governors and demanded extensive and public reform. The chaos resulted from improper political-social-economic stances of Umayyad regime and the developments in the social structure of the Arab empire. Moreover, the Umayyads disregard the demands of people in Persian lands. In this manner, there were contradictions between secular dictatorship and the resulting transformation of Islam in territories conquered by force or peace.
Simin Hasanvad and Amir Teymour Refaei
Indian Journal Of Natural Sciences www.tnsroindia.org. © IJONS
Vol.5 / Issue 30 / June 2015 International Bimonthly ISSN: 0976 – 0997
7605
Soleiman ibn Abdolmalik oppose to the anti-popular policies of Hajaj in Iraq and Khorasan. Thus, Soleiman adopted a good political tradition. Appease the downtrodden, the release of prisoners, and the return of exiles were parts of the corrective actions. Since the beginning of Soleiman Caliphate, the political events of Khorasan were immediately transformed against Walid ibn Abdolmalik; central policies governed all parts of government and people dere to challenge the political legacy of the previous government imposed by force and brutality. Arabic Caliphate eastern cities, the cities of Khorasan and its subsidiaries and Kufa in Iraq, marched obviously and reckless towards revolution because the cities had powerful tribal groups rose against Qatibeh ibn Moslem Baheli and they called strongly for economic and social freedom. Arab tribes had endured many losses and damages by people of Khorasan, particularly economic so that they had lost all their economic resources and their factories were closed due to migrations to remote villages.
The opposition center of Umayyad regime was in Khorasan because the structure of the Arab migrant tribes in Khorasan had been changed. In this regard, Arabs living in Khorasan was divided into two broad categories. First, mercenaries of war and politics who lived actually by the spoils of war; their name was registered in army official documents. Second group was engaged as agriculture, trade and other tasks. Over time, these two groups were separated and they had not mutual understanding and common interests; their relationship was the relationship between state and taxpayer. Therefore, each group had defined political philosophy and heterogeneous ethics (Al-Khatib, 1999). Jaraj ibn Abdollah Hakami was the agent of Omar ibn Abdol Aziz in Khorasan. He did not receive tribute from the people who had brought Islam in Khorasan, appointed them to some tasks, built some caravanserais, and appointed Abdolrahman ibn Abdollah Qoshers ar his agent to receive tribute (Al-Balathari, 1985, p. 181). Hesham ibn Abdolmalik began to organize a new office in Khorasan to correct the bad conditions, especially what related to Arab tribes. After they refused to join the military (the followers had accustomed to peace), he ordered the general governor of Khorasan, Asem ibn Abdollah Helali, to erase their names from army book and relied on the organization of only fifteen thousand men. He also allowed Mavali tribes to live in the center of province while opponent tribes went new sites outside the city. In order to fill this military gap, the Caliphate along with twenty thousand people moved to support him and settled them in Marv. The reaction of Arab tribes of Khorasan was very different, some accepted them and others rejected based on their interests (Taqoush, 2001). Complaints and dissatisfaction by non-Muslim people and the Khorasanians were the main oppositions in the age of Ummayad. However, tribute did not receive from all people and it was received from persons who lived in villages and had occupied a land. Nevertheless, the non-Muslims in either villages or cities should pay poll tax called Jaziyeh. Jaziyeh was received for the support the government provided for them; it was the mark of inferiority and poorness of the non-Muslims and superiority of the Muslims. Hence, they received it with special rituals signifying their inferiority (Zarrinkoub, 2008).
Anti-Umayyad Movements in Khorasan
People had lost their trust in Umayyad regime because of its past performance, joined to any battle against the regime to express opposition, and gathered under the flag of any revolutionary movement. Persians and Arabs were alike in this dissent and hatred. This was obviously the opposition in the eastern part of Arabic vicariate, especially Khorasan and Transoxiana. (Al-Khatib, 1999). Here we will explain some of the movements and revolutions.
Yahya ibn Zayd’s Rebellion
Yahya ibn Zayd was the son of Zayd ibn Ali, a Shia scholar and leader and the son of Imam Sajjad (AS). He claimed to the Caliphate, regarded it as his own right, and openly denied the clear wording of determination of Ali (as) by Muhammad (pbuh) for leadership. He did not accept the determination of a future Imam by Ali (as) and ignored the religious texts. Zayd collected many Shia of Kufa, Ctesiphon, Khorasan, Basra, Mosul, Wasit and revolt against the Umayyads in Kufa. Yousef ibn Taqafi, Hesham ibn Abdolmalik’s agent in Iraq, appointed Hakam ibn Abi Salt, the
Simin Hasanvad and Amir Teymour Refaei
Indian Journal Of Natural Sciences www.tnsroindia.org. © IJONS
Vol.5 / Issue 30 / June 2015 International Bimonthly ISSN: 0976 – 0997
7606
governor of Kufa, to to suppress the movement. Hakam threatened and bribed many of Zayd’s followers to scatter them. Zayd remained alone with only 218 followers. In 212 Hijri, Zayed was killed in a battle against the Umayyads in Kufa. The most important reason for his defeat was the diversity of his followers. After the murder of Zayd, his son Yahya ibn Zayd moved to Khorasan and revolt against the Umayyads in Jozan in 125, the Caliphate of the time was Walid ibn Yazid. His motto was rebellion against pervasive oppression on the people. Nasr ibn Sayar, the governor of Khorasan, sent a woman called Salab ibn Ahzama to him. She followed Yahya and killed him in Anbar. Killing yahya, Nasr ibn Sayar separated himself from the governance of the Umayyads since they wereweak. The story of Zayd ibn Ali’s revolution and his son’s rebellion was suppressed severely by the Umayyads (Zarinkoub, 2009).
Al-Harith ibn Surayj Rise up
The governors of Hesham ibn Abdolmalik in Khorasan were respectively Ashrath ibn Abdollah Salami, Joneid ibn Abdolrahman Mari, Asem ibn Abdollah Helali, Asad ibn Abdollah Qasri, and Nasr ibn Sayar. When Joneid ibn Abdolrahman Mari was the governor of Khorasan, Hesham ordered him to eliminate Arab tribe rejecting to participate in wars and forced many Arab tribes to settle outside the city of Marv. The first notable rebellion against this policy was carried out by Hareth ibn Sarij in 734 that resulted in his attack on Balkh; he beleaguered the city and regarded as a misfortune for the Umayyads. Hareth invited people to God’s book, the prophet’s tradition, and allegiance of Reza. He wore black dress and allied with the Turkish Khans. The only common point between Hareth and Hephthalite Empire was enmity against the Umayyads. The forces fought against the general governor and attacked on Marv. Meantime, Asem ibn Abdollah Helali became the governor of khorasan. Due to his limited experiences in Khorasan, Asem found that Ahl al-Bayt are very popular and influential in the land; therefore, the overthrow of Hareth is possible only when Khorasan attach to Iraq that was the center of governance. He made the offer to Hesham. The Caliphate accepted his idea, dismissed him from Khorasan governance, and attached the land to Iraq that was governed by Khalid ibn Abdollah Qasri. Then, Khaid’s brother, Asad, was appointed as the general governor by Hesham. Asad continued war against Hareth, fought against Turks in Takharistan, and defeated them. Finally, Hareth ibn Suraij was killed by Jodaie Kermani who was one of the Yemenis rebell commanders of Khorasan. Jodaie was killed by Nasr ibn Sayar in 129 Hijri (Taqoush, 2001).
Rise of Abu Muslim Khorasani
Khorasan, Persia Cradle of heroic legends, was the most adequate place for Iranian uprisings because it was away from the center. Hence, when Umayyad power was declining, The Abbasids’ invitation became very popular. The invitation by Abu Muslim was welcomed by many people who had harassed and sought for glad tidings of freedom (Zarrinkoub, 2008). Abu Muslim who schismatize between Terars and Yemenis forces and caused Nasr ibn Sayar to run from Khorasan became powerful. The men in black began to rebel all through Khorasan including Nesa, Balkh, Herat, Mervrood, and other places, but there were some gaps that the rebellions could not fill. The Arab opponents of Umayyad regime refused to help their governors because regarded them as the enemy of Islam. As the result of his skill and experience in war and politics employed the difference in the Arab Umayyad army and kept his army seven months outside Marv. Meantime, he drew the attention of Yemenis concierge, controlled all parts of Khorasan without any damage to his army, and killed all opponent heads of tribes. Frustration and powerlessness overcame them in late Umayyad age. The Abbasids’ invitation was confidential; only the Naqibidds knew it untill a letter of Imam Ibrahim to Abu Muslim was found by Marwan ibn Muhammad. Ibrahim ordered him to kill any person who talks Arabic in Khorasan. Abu Muslim expanded Abbasids’ invitation in Khorasan. The revolution was announced in 25 the Ramadhan of 129 Hijri by Soleiman ibn Kathir. The followers of the Abbasids gathered around Abu Muslim and used black garments and flags as their motto, thus, they are known as “the men in black.” They said thier first Congregational Prayer on Eid ul Fitr in Sefidenj and began their journey. The men in black lash their donkeys with sticks, called Kafar koub (or infidel beaten), and shouted the name of second Marwan, the Umayyd ruler. Most of
Simin Hasanvad and Amir Teymour Refaei

Indian Journal Of Natural Sciences www.tnsroindia.org. © IJONS
Vol.5 / Issue 30 / June 2015 International Bimonthly ISSN: 0976 – 0997
7607
these men, which were called by some historians as black evils, were rural farmers, artisans, and other populations. They were called by the Arabs “Sons of Siraj” because Abu Muslim was saddler.
Abu Muslim was known as “the trustee of Muhammad’s familly” and “Abumojrem.” In the late 132 Hijri, the black flag of Abbassids was raised on the top of Damascus peaks and the Umayyad government was extincted, and Abbasid government was founded by Abol Abbas Safah (Ibrahim Hassan, 1371).
CONCLUSION
1. Due to demographic combination, geographic location, a climate consistentent with the nature of the Arabs, and other features, land of Khorasan was from the inception considered as center of political and cultural developments in the Umayyad Age.
2. Khorasan was full of trophies and precious stones. Umayyad reigime began war in Khorassan first with claim and pretending to spread Islam; but indeed, they began war with the aim of gaining booty because the Umayyad conquests was solely for personal purposes, private accumulation of wealth, and individual greed, not to spread Islam.
3. The people were dissatidfied because of oppression, violence and cruelty imposed on them in taxes and donations by the Umayyad rulers.
4. Khorasan was the center of opposition against the Umayyad reigime as it was located in the east of Rabic Caliphate system.
5. Successive uprisings arose in the land of Khorasan that the most important one was led by Abu Muslim Khorasani. It paves the way for Abbasid government formation and an important factor in the overthrow of the Umayyad government.
REFERENCES
1. Lestrange, G. (1998). Historical Geography of Eastern Caliphate Territories. Trans. Mahmood Erfan, Tehran, Cultural and Scientific Publishing Company, 3.
2. Spuler, B. (1970). History of Iran in the Early Centuries of Islam. Trans. Maryam Mir Ahmadi, Tehran, Cultural and Scientific Publishing Company, 2.
3. Taheri, A. (1969). Khorasan historical geography for tourism. Publications the Central Council of celebrate the Shah of Iran.
4. Hassan Ibrahim, H. (1992). Islamic Political History, translated by Abolghasem Payandeh, Javidan Press. 1. 5. Al-Balazhari, A. (1985). Futuh al-Buldan: on Iran. Trans. Azartash Azarnoush, edited by Mohammad Forozan,
Tehran, Publications of the Islamic Republic of Iran Broadcasting (IRIB), 2. 6. Taqoush, M. S. (2001). The Umayyad Government. Trans. Hojatollah Joodaki, Qom, Research Institute of
seminary and university. 7. Zarrinkoub, A. (2009). History of Iran. Amir Kabir Publications, 5. 8. Zarrinkoub, A. (2008). History of Islam, Amir Kabir Publications, 6. 9. Zarrinkoub, A. (1999). Two centuries of settlement. Sokhan Publications, 4 10. Howthing, J. (2007). Umayyads: The first ruling dynasty in Islam. Trans. Isa Abdi, Tehran, Amir Kabir
Publications. 11. Al-Khatib, M. (1998). Iran and the Umayyad period. Trans. Mohammad Reza Iftekhar zadeh, Tehran, Resalat of
Qalam 12. Moftakhari, H., Zamani, H. (2007). History of Iran from arrival of Muslims until Taherid Age. Tehran, SAMT, 3.
Simin Hasanvad and Amir Teymour Refaei
Indian Journal Of Natural Sciences www.tnsroindia.org. © IJONS
Vol.5 / Issue 30 / June 2015 International Bimonthly ISSN: 0976 – 0997
7608
Evaluating Capability and Accuracy of Predictions Based on Statistical Analysis for Stocks of Active Companies in Bourse Shayan Hajimoniri1 and Mohamad Reza Shoorvarzy2*
1Master Accounting Student, Department of Accounting, Faculty of Humanities, Neyshabur Branch,Islamic Azad University,Neyshabur, Iran. 2Professor of Accounting, Department of Accounting, Faculty of Humanities,Neyshabur Branch, Islamic Azad University, Neyshabur, Iran. . Received: 19 Mar 2015 Revised: 16 Apr 2015 Accepted: 29 May 2015 *Address for correspondence Mohamad Reza Shoorvarzy Professor of Accounting, Department of Accounting, Faculty of Humanities, Neyshabur Branch, Islamic Azad University, Neyshabur, Iran.
This is an Open Access Journal / article distributed under the terms of the Creative Commons Attribution License (CC BY-NC-ND 3.0) which permits unrestricted use, distribution, and reproduction in any medium, provided the original work is properly cited. All rights reserved. Shareholders and economists are much concerned about predicting market value of companies which are active in stock exchange markets. The predictions are made through two prevalent methods which are based on statistical analysis or based on experiences of company CEOs. Predictions made by CEOs are usually biased and non-scientific; but experiences in other countries have shown that they can identify the growth direction very well. However, managers of Iranian companies refrain from expressing those issues explicitly. A second method based on regression modeling exists which its levels of “accuracy” and “reliability” are examined throughout the present study. 102 active companies in bourse were monitored during an 8 year period of activity up to 2012. Statistical results have shown that although highly accurate regression models could be fitted in order to perform predictions, but extrapolations for future years lacked appropriate accuracy and were unstable. Models used for predicting were: decision tree, CART, neural network (NN) and multi-phase multivariate linear regression (MLR). Hypotheses were tested using t-test, Pearson correlation test, P binomial ratio test and Weiner’s T accumulation meta-analysis test.
Key words: analytic prediction, estimation accuracy, Iranian bourse, prediction reliability, stocks value.
RESEARCH ARTICLE
ABSTRACT
Indian Journal Of Natural Sciences www.tnsroindia.org. © IJONS
Vol.5 / Issue 30 / June 2015 International Bimonthly ISSN: 0976 – 0997
7609
INTRODUCTION
Since some of the factors effecting stock value variations are unknown, the analysts tend to continuously predict the stock prices for companies. Financial managers prefer to have a mechanism in hand which can help them with their decisions. Therefore, prediction methods are receiving such a high level of attention. Since the variations in stock market are high, managers would less likely comment about determining expected revenue per share while trying to consider preventative measures against any lawsuit. On the other hand, voluntary disclosure of financial news of the company along with managerial considerations can be considered as an important part of information environment around any organization and its managers (Herst, Kanss and Venkatamaran, 2008). Meanwhile, management forecasts have to be based on a scientific approach. Some predictions are in concordance with organizational know-how and experience about estimating the market fluctuations. Predictions of that type are not much accurate in some cases, but can estimate the growth direction of the stocks. Those predictions are usually called “biased predictions”; andare skewed in estimation but reliable for decision making process in sense of negative or positive direction of growth for market value of the stocks. A second method for this task is obtaining management forecasts based on analytical methods. Predictions of this type are more accurate; and in statistical words they have non-skewness characteristics as well. However, those predictions perform weaker than those based on experience in sense of determining direction or decision reliability.
Therefore, investment market experts have spent many years to study the market and identify various patterns in order to make those predictions. A combination of pattern recognition and experiences based on observation of causal relations has been used to tackle this problem. Many computer software also exist which can help with the decision making process and are used asprediction engines. Nevertheless, some conditions are imposed in financial trends which call for distortion in customary rules; making predictions using mentioned methods much difficult.
Various methods can be found in literature regarding this topic. Techniques are categorized based on type of the tools which are used and type of the data. Four main categories are:
Methods of Technical Analysis, Methods of Fundamental Analysis, Prediction methods based on Traditional Time Series, Machine Learning methods.
However, management forecasts have to be based on a scientific approach. Some predictions are based on organizational knowledge approach and experiences about estimating market fluctuations. Predictions of this type are usually associated with lower accuracy but can correctly estimate the growth direction of stock value. Such predictions are called “directional” which are skewed in sense of estimation but are reliable regarding to making decisions about positive or negative direction of changes in stock market value. An alternative is management forecasts based on analytical methods. This type of predictions yield more accurate results; and are non-skewed in statistical words. However, they perform weaker than predictions based on experience in sense of direction determination and decision reliability.
Technical analysts try to predict the price in a future time using the patterns which exist in market price history data charts. Fundamental analysts on the other hand, make their predictions based on the real and natural value of stocks. In predictions made by traditional methods, it is assumed that future prices will follow the trend established by previous values. Machine learning methods follow linear and non-linear patterns which already exist in market data, trying to guess the process which creates those patterns [6].
Shayan Hajimoniri and Mohamad Reza Shoorvarzy
Indian Journal Of Natural Sciences www.tnsroindia.org. © IJONS
Vol.5 / Issue 30 / June 2015 International Bimonthly ISSN: 0976 – 0997
7610
There are various indices for determining the accuracy and reliability of predictions; and many studies have used the prediction accuracy (difference between predicted value of revenues and actually realized revenues) for probing the quality of predictions or even managerial ability of the boards. Those studies have concluded that organizations or companies which predict more accurately had more effective on the prices itself and analysts’ viewpoints (Williams 1996; Yang 2010) and performance of CEOs (Li, Matsonaga and Park 2012) as well.
Managers who do predictions with a stable extent of error would be having higher ability in determining prices and reviewing analyses even after controlling for effect of accuracy. We found, in accordance with previous studies, that when we are unable to control the effects of stability issues, prediction accuracy would lead to higher ability of managers to change prices and analysts to predict them. Nevertheless, statistical significance of accuracy usually fades away when we control the process for stability. Economical significance of “stability” effect is about two to five times higher than that of “accuracy”. The findings of this study are in accordance with definitions of systematic bias in the subject of managerial and analytical predictions (Rager and Staken 2005); also they are acknowledged by executives of non-ExecuComp database (Ragers and Von Boskerk 2009) and used by revenue prediction reports as well (Ragers and von Boskerk 2013). Moreover, those findings hold for potential confound variables(Jenings2007; Bakinsky, Conrad, Ro and Sook 2011).
Problem Statement
Statistical estimations and management forecasts have been always two rivals in estimating company stock values. Statistical estimations rely on company’s financial data; while managers rely on market probes and their own hunches to make predictions, analyze the market and identify effects of various factors on a company’s market value. Management forecasts – which are in fact guessable variations of earnings without having stochastic errors – convey more data than unbiased probing which merely are based on unpredictable errors. This holds even when management forecasts are biased and less accurate. In accordance with this, we found that managers who make wrong predictions are more able to affect behaviour of investors and analyst revisions. This even holds after controlling for effect of accuracy. This method is more significant and provides higher level of statistical integrity in comparison to method of prediction accuracy examination. Expert investors and experienced analysts are aware of advantages of integrated and uniform predictions by the managers more than anyone else. The presented study has addressed this issue from different aspects.
First, since previous studies concerning revenue prediction management have been based on absolute error of predicted values in most cases, we have tried to focus on the level of consistency instead of error magnitude (accuracy) in the present study. We prove that “consistency” is a key aspect of the measurement for Bayesian statisticians. In fact our findings prove that consistency is an important (and extensible) measure for management forecasts (in other words, is capable to change user preferences). This concept has been mainly ignored previously. Our findings extend previous studies which stated that market forecasts would change into a biased state under the effect of earning predictions made by managers (Rogers and Staken 2005).
Second, although our results show that users’ behaviour are in concordance with Bayes model in general, but less experiences people may act quite differently. As our results show, this is true and less experienced micro-investors and inexperienced analysts are concerned with accuracy more than consistency of forecasts. These results are especially valuable for regulators since they aim for understanding and analyzing the deals which various users in field of biased predictions pick. This is related to findings of Rogers and Staken (2005). “Forces present in the market are not strong enough to prevent managers from making personal predictions”.
And third, our study is in concordance with texts considering downward biases in management forecasts. We have addressed this point that most managers tend to make downward biased forecasts; while previous studies have
Shayan Hajimoniri and Mohamad Reza Shoorvarzy
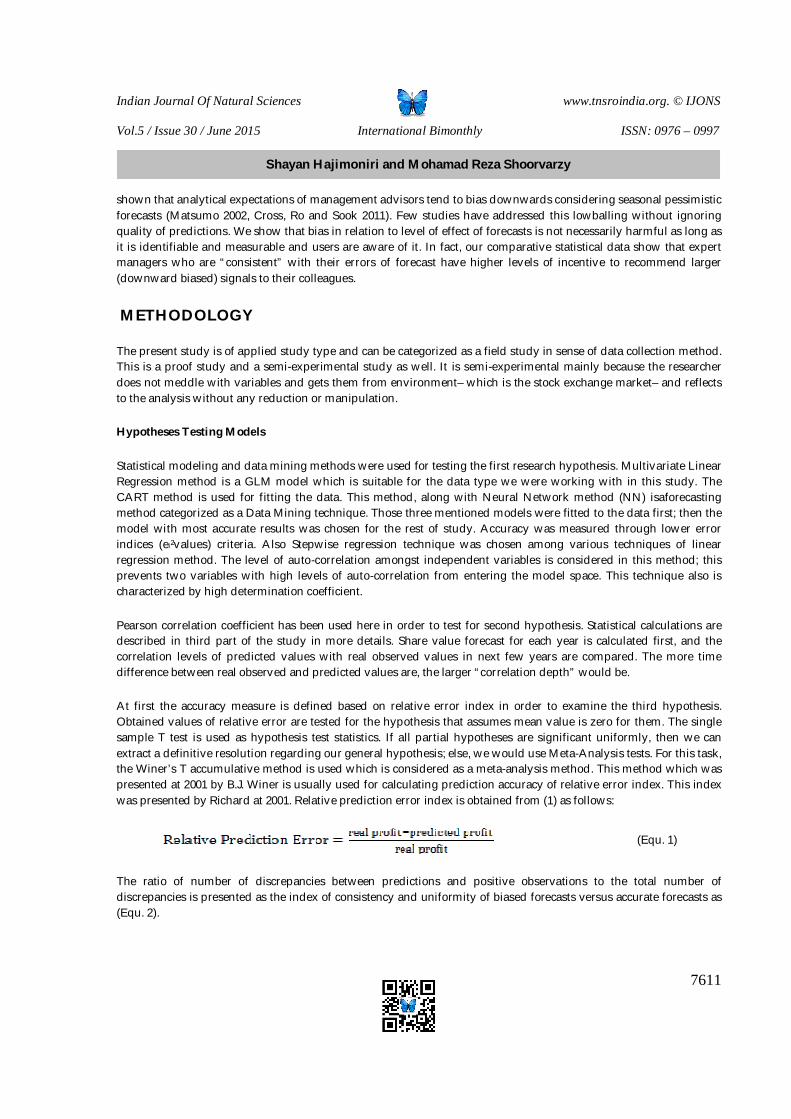
Indian Journal Of Natural Sciences www.tnsroindia.org. © IJONS
Vol.5 / Issue 30 / June 2015 International Bimonthly ISSN: 0976 – 0997
7611
shown that analytical expectations of management advisors tend to bias downwards considering seasonal pessimistic forecasts (Matsumo 2002, Cross, Ro and Sook 2011). Few studies have addressed this lowballing without ignoring quality of predictions. We show that bias in relation to level of effect of forecasts is not necessarily harmful as long as it is identifiable and measurable and users are aware of it. In fact, our comparative statistical data show that expert managers who are “consistent” with their errors of forecast have higher levels of incentive to recommend larger (downward biased) signals to their colleagues.
METHODOLOGY
The present study is of applied study type and can be categorized as a field study in sense of data collection method. This is a proof study and a semi-experimental study as well. It is semi-experimental mainly because the researcher does not meddle with variables and gets them from environment– which is the stock exchange market– and reflects to the analysis without any reduction or manipulation.
Hypotheses Testing Models
Statistical modeling and data mining methods were used for testing the first research hypothesis. Multivariate Linear Regression method is a GLM model which is suitable for the data type we were working with in this study. The CART method is used for fitting the data. This method, along with Neural Network method (NN) isaforecasting method categorized as a Data Mining technique. Those three mentioned models were fitted to the data first; then the model with most accurate results was chosen for the rest of study. Accuracy was measured through lower error indices (ei2values) criteria. Also Stepwise regression technique was chosen among various techniques of linear regression method. The level of auto-correlation amongst independent variables is considered in this method; this prevents two variables with high levels of auto-correlation from entering the model space. This technique also is characterized by high determination coefficient.
Pearson correlation coefficient has been used here in order to test for second hypothesis. Statistical calculations are described in third part of the study in more details. Share value forecast for each year is calculated first, and the correlation levels of predicted values with real observed values in next few years are compared. The more time difference between real observed and predicted values are, the larger “correlation depth” would be.
At first the accuracy measure is defined based on relative error index in order to examine the third hypothesis. Obtained values of relative error are tested for the hypothesis that assumes mean value is zero for them. The single sample T test is used as hypothesis test statistics. If all partial hypotheses are significant uniformly, then we can extract a definitive resolution regarding our general hypothesis; else, we would use Meta-Analysis tests. For this task, the Winer’s T accumulative method is used which is considered as a meta-analysis method. This method which was presented at 2001 by B.J. Winer is usually used for calculating prediction accuracy of relative error index. This index was presented by Richard at 2001. Relative prediction error index is obtained from (1) as follows:
(Equ. 1)
The ratio of number of discrepancies between predictions and positive observations to the total number of discrepancies is presented as the index of consistency and uniformity of biased forecasts versus accurate forecasts as (Equ. 2).
Shayan Hajimoniri and Mohamad Reza Shoorvarzy
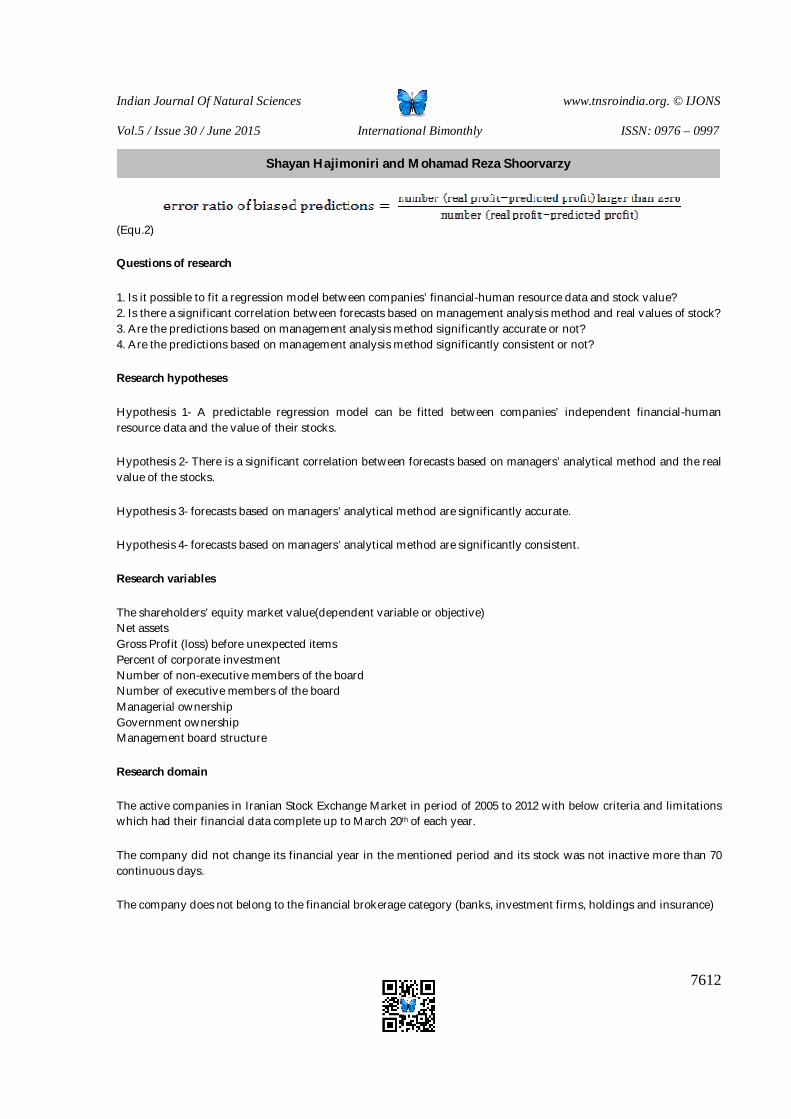
Indian Journal Of Natural Sciences www.tnsroindia.org. © IJONS
Vol.5 / Issue 30 / June 2015 International Bimonthly ISSN: 0976 – 0997
7612
(Equ.2)
Questions of research
1. Is it possible to fit a regression model between companies’ financial-human resource data and stock value? 2. Is there a significant correlation between forecasts based on management analysis method and real values of stock? 3. Are the predictions based on management analysis method significantly accurate or not? 4. Are the predictions based on management analysis method significantly consistent or not?
Research hypotheses
Hypothesis 1- A predictable regression model can be fitted between companies’ independent financial-human resource data and the value of their stocks.
Hypothesis 2- There is a significant correlation between forecasts based on managers’ analytical method and the real value of the stocks.
Hypothesis 3- forecasts based on managers’ analytical method are significantly accurate.
Hypothesis 4- forecasts based on managers’ analytical method are significantly consistent.
Research variables
The shareholders’ equity market value(dependent variable or objective) Net assets Gross Profit (loss) before unexpected items Percent of corporate investment Number of non-executive members of the board Number of executive members of the board Managerial ownership Government ownership Management board structure
Research domain
The active companies in Iranian Stock Exchange Market in period of 2005 to 2012 with below criteria and limitations which had their financial data complete up to March 20th of each year.
The company did not change its financial year in the mentioned period and its stock was not inactive more than 70 continuous days.
The company does not belong to the financial brokerage category (banks, investment firms, holdings and insurance)
Shayan Hajimoniri and Mohamad Reza Shoorvarzy
Indian Journal Of Natural Sciences www.tnsroindia.org. © IJONS
Vol.5 / Issue 30 / June 2015 International Bimonthly ISSN: 0976 – 0997
7613
Data collection method
Considering the statistical population and the methods of approach in this study, the sample analysis method has been used, i.e. required data and information are extracted as samples from Iranian Stock Exchange records between 2005 and 2012. Data were collected from databases held by official stock brokers whichgather and record financial transactions.
Statistical population, sampling method
Statistical population is a set of people or items that have at least one characteristic in common. Statistical population in the present study involves Iranian Stock Exchange records which are growing constantly.
STUDY FINDINGS
Methods of Multivariate Linear Regression (MLR), Decision Tree (CART)and Neural Network (NN) were used for examining the first hypothesis of the study. First, three models were fitted to the data; MLR model was more accurate among them. The measure of comparison was the magnitude of errors or ei for each model.
Among various techniques of Linear Regression, the “stepwise” technique was chosen.
Our examination shows that Linear Regression model with stepwise technique yields the highest level of accuracy. Therefore, regression model is significant with 99% confidence; and only three out of eight variables were significantly effective on forecasting market value of shareholders’ equity. Those three variables are: gross profit/loss before unexpected items, net assets, and number of non-executive members of the management board.
Hence, the stepwise regression model was applied for each year and predicted values were compared with observed values for future years. Comparison was performed based on two approaches. First approach had to answer the study question that whether a significant correlation existed between real observations on future years and predictions made by regression model? Statistical results showed that no significant correlation is observed between those two variables. Even reverse correlation was detected in some cases. Second approach was based on level of accuracy for predictions. Results have shown no significant difference between predicted and observed value for later years based on mean values. Nevertheless some results of t-test showed insignificance level. Therefore, meta-analysis was performed and the results showed that significant difference is generally present.
Since a model can show significance level in general but insignificance for partial segregated data, a premium hypothesis was examined in order to understand the origin of this difference: whether separated regression models for each year were significant? Findings showed that correlation was strong for all years under examination(up to 96% for 2009) except for 2010 for which correlation level was moderate.
Results regarding significance level of consistency and uniformity index for biased predictions were examined in order to test the fourth hypothesis. Those results showed that none of the years was associatedwith a biased forecast. The method of binomial test was used in this regard.
In general, results obtained for study hypotheses were as Table (2) shows below.
Therefore, it can be stated that although management analytical methods in Iranian Stock Exchange market are capable to be fitted with high accuracy regression models, but cannot provide high precision and consistency levels
Shayan Hajimoniri and Mohamad Reza Shoorvarzy
Indian Journal Of Natural Sciences www.tnsroindia.org. © IJONS
Vol.5 / Issue 30 / June 2015 International Bimonthly ISSN: 0976 – 0997
7614
for decision making process. In other words, they not only lack unskewness characteristics but cannot even identify the correct direction of growth for the stocks. A reason for that finding is the lack of correlation between real observed values of the stocks and the expected values. This evidently shows the absence of measures for determining stocks value based on real price. Counterfeit indices are prevalent in determining the market value of company stocks in that Stock Exchange market.
CONCLUSION AND SUGGESTIONS
It seems that unreal values given to the shares can be a reason of inappropriate difference between forecasts and real values of stocks. Many reasons such as high liquidity and directing it to the stock exchange or aligned markets like construction, foreign exchange, gold, etc… have lead to this situation. Those positive and negative high tides (high demand and resentment) have caused the stock values to be affected by high fluctuations of country’s financial state. For instance, market fluctuations during 2009-2010 period can be considered by studies. In this regard, brokerage companies can also exacerbate those fluctuations by counterfeit transactions of purchasing and selling stocks in order to gain more profits. That is a reason why CEOs refrain from commenting about stocks value in their reports submitted to clients and shareholders. They are not able to identify the market direction and are prone to accusations of lobbying and internal deals in stock exchange market as well.
Therefore, technical analysis forecasts usually prove useful in identifying sinusoidal tides of market values of shares, and are not capable of forecasting at a long term one year period. Hence, we suggest to use analytical forecasts in short term. Of course, combinatory method models of forecasting could partially improve the outputs.
Competing markets such as gold coins, gold, foreign exchange, and construction markets can be examined regarding the fundamental effective factors which lead to variations in stock exchange market. This is considered as a research necessity by the authors.
We suggest other measures like corporate governance measures to be examined in this regard in future research; effects of those measures on stock values can be further investigated. Authors suggest that studies like this can be conducted as a comparison study for privatized companies, before and after privatization. It is suggested that the same study can be repeated as a comparison study between Iranian Stock Exchange member companies and member companies of Over The Counter (OTC) market.
REFERENCES
1. Hosmer, D., Stanley, L. (1989, 2000). Applied Logistic Regression. 2nd ed., NY: Wiley and Sons. A much-cited. 2. Kleinbaum, D G., (1994). Logistic regression: A self-learning text. New York: Springer-Verlag. What it says. 3. Breiman, L., Friedman, J. H., Olshen, R.A., Stone, C.J. (1984). “Classsification and Regression Trees”, Belmont,
CA: Wadsworth. 4. Jiwaei,H., Micheline, K. (2006).Jian Pei Data mining: Concepts and Techniques, Morgam Kaufmann Publishers. 5. SPSS Clementine help file. http//www.spss.com 6. Khalili, M,.Pakgohar, A, (2012). Data Analysis and Using SPSS Software, Islamic Azad University, branch
Meybod Pub. 95-108.
Shayan Hajimoniri and Mohamad Reza Shoorvarzy
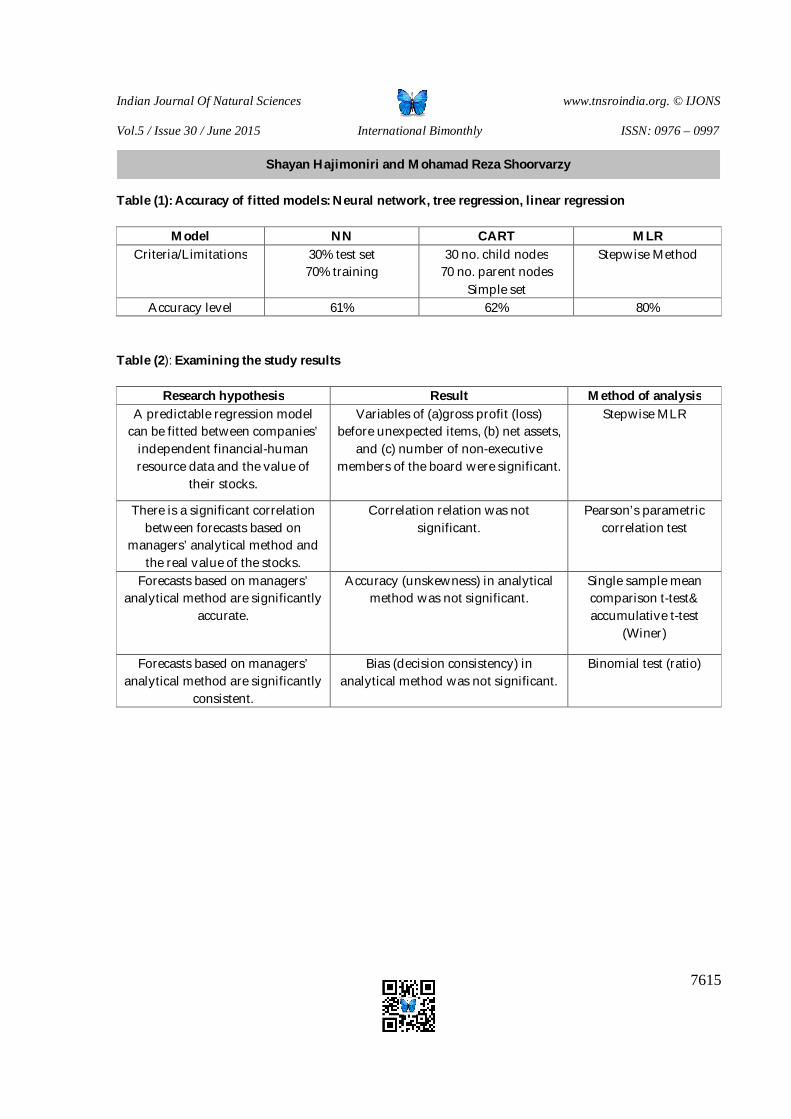
Indian Journal Of Natural Sciences www.tnsroindia.org. © IJONS
Vol.5 / Issue 30 / June 2015 International Bimonthly ISSN: 0976 – 0997
7615
Table (1): Accuracy of fitted models: Neural network, tree regression, linear regression
Model NN CART MLR Criteria/Limitations 30% test set
70% training 30 no. child nodes
70 no. parent nodes Simple set
Stepwise Method
Accuracy level 61% 62% 80%
Table (2): Examining the study results
Research hypothesis Result Method of analysis A predictable regression model
can be fitted between companies’ independent financial-human resource data and the value of
their stocks.
Variables of (a)gross profit (loss) before unexpected items, (b) net assets,
and (c) number of non-executive members of the board were significant.
Stepwise MLR
There is a significant correlation between forecasts based on
managers’ analytical method and the real value of the stocks.
Correlation relation was not significant.
Pearson’s parametric correlation test
Forecasts based on managers’ analytical method are significantly
accurate.
Accuracy (unskewness) in analytical method was not significant.
Single sample mean comparison t-test& accumulative t-test
(Winer)
Forecasts based on managers’ analytical method are significantly
consistent.
Bias (decision consistency) in analytical method was not significant.
Binomial test (ratio)
Shayan Hajimoniri and Mohamad Reza Shoorvarzy
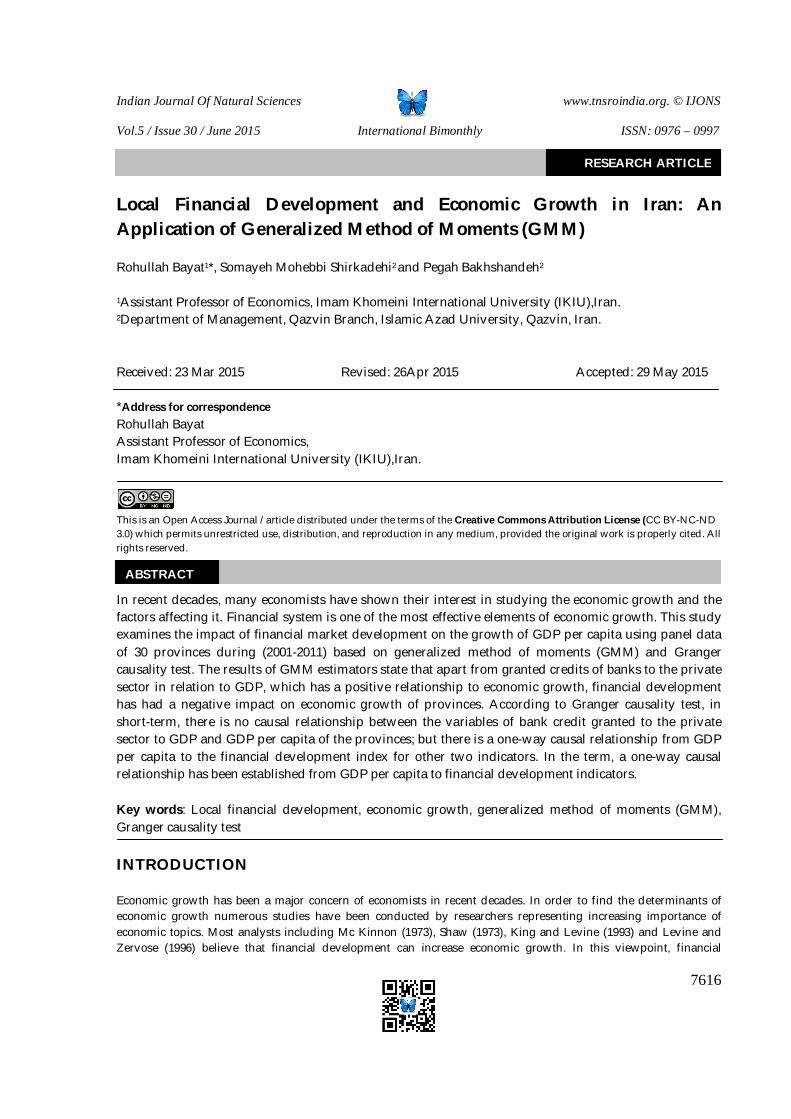
Indian Journal Of Natural Sciences www.tnsroindia.org. © IJONS
Vol.5 / Issue 30 / June 2015 International Bimonthly ISSN: 0976 – 0997
7616
Local Financial Development and Economic Growth in Iran: An Application of Generalized Method of Moments (GMM) Rohullah Bayat1*, Somayeh Mohebbi Shirkadehi2 and Pegah Bakhshandeh2
1Assistant Professor of Economics, Imam Khomeini International University (IKIU),Iran. 2Department of Management, Qazvin Branch, Islamic Azad University, Qazvin, Iran. Received: 23 Mar 2015 Revised: 26Apr 2015 Accepted: 29 May 2015 *Address for correspondence Rohullah Bayat Assistant Professor of Economics, Imam Khomeini International University (IKIU),Iran.
This is an Open Access Journal / article distributed under the terms of the Creative Commons Attribution License (CC BY-NC-ND 3.0) which permits unrestricted use, distribution, and reproduction in any medium, provided the original work is properly cited. All rights reserved.
In recent decades, many economists have shown their interest in studying the economic growth and the factors affecting it. Financial system is one of the most effective elements of economic growth. This study examines the impact of financial market development on the growth of GDP per capita using panel data of 30 provinces during (2001-2011) based on generalized method of moments (GMM) and Granger causality test. The results of GMM estimators state that apart from granted credits of banks to the private sector in relation to GDP, which has a positive relationship to economic growth, financial development has had a negative impact on economic growth of provinces. According to Granger causality test, in short-term, there is no causal relationship between the variables of bank credit granted to the private sector to GDP and GDP per capita of the provinces; but there is a one-way causal relationship from GDP per capita to the financial development index for other two indicators. In the term, a one-way causal relationship has been established from GDP per capita to financial development indicators.
Key words: Local financial development, economic growth, generalized method of moments (GMM), Granger causality test
INTRODUCTION
Economic growth has been a major concern of economists in recent decades. In order to find the determinants of economic growth numerous studies have been conducted by researchers representing increasing importance of economic topics. Most analysts including Mc Kinnon (1973), Shaw (1973), King and Levine (1993) and Levine and Zervose (1996) believe that financial development can increase economic growth. In this viewpoint, financial
RESEARCH ARTICLE
ABSTRACT
Indian Journal Of Natural Sciences www.tnsroindia.org. © IJONS
Vol.5 / Issue 30 / June 2015 International Bimonthly ISSN: 0976 – 0997
7617
development is regarded as the engine of economic growth; then, policymakers should focus their attention on the creation and promotion of financial institutions for economic development (Abu Noori and Teimuri, 2013).
Financial development is an important determinant of economic growth. Nevertheless, the effect of financial development on economic growth is uncertain due to its broad definition and interdependence with other areas of economic development. Periodical experimental studies have re-evaluated the relationship between financial development and economic growth as a new theory, data collection, and available experimental tools (Ductor & Grechyna, 2015, p. 1). The channels through which financial development leads to economic growth has been widely been discussed in economic literature. Associated theories may be specified with the optimistic or pessimistic views. According to the former approach, the best financial systems are systems that facilitate the mobilization of savings and the efficient allocation of resources (Greenwood et al, 2010; King and Levine, 1993), reduce organizational costs and increase innovative activities (Aghion et al, 2005) and help the quick-yielding of investments with sharing risks (Bencivenga & Smith, 1991; Greenwood & Jovanovic, 1990; Saint-Paul, 1992).
According to the new approach, financial development may lead to a high systemic risk (Allen & Carleti, 2006; Gai et al, 2008; Gennioli et al, 2012; Wagner, 2007), suboptimal savings (Jappeli & Pagno, 1994), allocation of labor to the financial sector more than optimal (Bolton et al, 2010; Philippon, 2011), overheat economic capacity (Zeira, 1999), and imposing high inefficient costs on the economy (Santomero & seater, 2000). Based on the structure of this pare, next section is a theoretical review and the third part reviews to the former empirical studies. The fourth part argues the methodology of the study; part five is dedicated to the analysis of research findings. Finally, conclusions and recommendations will be presented.
Theoretical Foundations
Financial development is a process in which quantity, quality and efficiency of the financial intermediary services are improved. It indicates interaction between many activities and institutions. Since it brings an experience of being exposed to a higher growth rates, countries with more developed financial systems are on the path to faster economic growth (Abu Noori and Teimuri, 2013, p. 30).
Financial development and economic growth was first proposed by Schumpeter (1912); it shows how important is financial sector for the development of the capitalist economy. Schumpeterian analysis is based on the idea that credit, when in the hands of “entrepreneurship”, is conducive to growth and prosperity. Open looking at credit allows an entrepreneur to change the normal flow of economic through innovation that, in turn, creates growth (Bittencourt, 2012, p. 343).
According to the theory of economic growth (Lucas, 1988; Romer, 1986, Solow, 1956), the basic elements of per capita growth are initial level of GDP, human capital, and the accumulation of physical capital. Economic growth per capita should have a negative relationship to the initial level of GDP because economies tend to converge to a stable state with a reduction in the rate of accumulation of capital (which is known as the convergence effect); it should also have a positive relationship to the level of human capital in the country because higher human capital means more innovative ideas and potentially faster economic growth. In addition, experimental models include many of the economic, political, institutional, and geographic elements of growth (see Durlauf et al, 2005).
The available literature regards the effect of financial development on economic growth as a specific set of control variables related to government policies and economic stability of a country; indicators of fiscal policy, measurement of trade openness, and measurement of price stability (for example, Levine et al, 2000) are associated with actions of financial development. Recently, Arcand et al, 2012 has used a quadratic regression model for growth and they have found a nonlinear relationship between financial development and economic growth.
Rohullah Bayat et al.
Indian Journal Of Natural Sciences www.tnsroindia.org. © IJONS
Vol.5 / Issue 30 / June 2015 International Bimonthly ISSN: 0976 – 0997
7618
Theoretical justification for the effect of financial non-uniformity on growth can be included in the following:
1. Financial development can reduce economic growth by increasing economic fragility. The accumulated systematic risk is the result of financial innovation and financial liberalization, both of which have been adopted by financial development (Allen & Carleti, 2006; Allen & Gale, 2004; Gennioli et al, 2012; Wagner, 2007). The higher systemic risk implies frequent or more severe crisis, which, in turn, weaken economic growth in the short and medium periods.
2. Financial development can reduce economic growth through resource misallocation. A fast growing financial sector increases rent and makes the resources more interesting; in the ideal case, these resources should be used in other sectors (Bolton et al, 2011; Philippon, 2010; Santomero & seater, 2000). Optimal allocation of resources suggests that possible short-term and long-term growth rate may not be accessible. For example, if the financial sector employs too much skilled workers to help its development, other sectors suffer from depression along with backwardness in development due to the absence of sufficient human resources. The second case has a negative effect on growth of economic input and output.
Indexes Measuring Financial Development
With respect to the various components, there are several indices to measure financial development. Levine et al have presented several indicators of financial development, these indicators are:
Financial deepening :This indicator measures the size of financial intermediaries and is equal to the ratio of cash liabilities and debts of financial system (coins and bills plus interest-bearing liabilities of banks and non-bank financial intermediaries) to GDP.
Growing of banks :This indicator measures the degree to which the central bank allocates credit for commercial banks and it is obtained by the ratio of banking credits to the sum of credit and local assets of central bank. Two main disadvantages are presented for these indicators. First, banks are not the only financial intermediaries providing valuable financial functions; second, banks may also lend to the government and state-owned companies.
Credit allocation index: This is the ratio of credits allocated to private companies and institutions to total domestic credit (excluding credit to banks).
Performance index: This index is the ratio of given credit to private companies and institutions to GDP. This index assumes that financial systems giving more funds to private companies insist more on investigations and inspection of companies, applying corporate control, providing risk management services, mobilizing savings and facilitate transactions; this is not true for financial systems centralizing credit to government or state-owned companies. The index presents information of funds allocated to the private sector by commercial banks compared to the size of economy.
Renewed interest in the relationship between financial development and economic growth stems mainly from the insights and techniques of endogenous growth models. It shows that sustainable growth takes place without exogenous technical progress. In this manner, growth rate may be related to preferences, income distribution and institutional arrangements and it can present a theoretical ground for financial markets (financial intermediaries) to use surfacing advantages and growth effects.In order to evaluate the potential effects of financial development on economic growth, this research uses the simplest model of endogenous growth, or AK model, where total product is a linear function of the total saving capital.
Rohullah Bayat et al.

Indian Journal Of Natural Sciences www.tnsroindia.org. © IJONS
Vol.5 / Issue 30 / June 2015 International Bimonthly ISSN: 0976 – 0997
7619
(1)
This function of production is the reduced form of one of two following forms. First, competitive economy is associated with exogenous savings where each technologic firm faces a constant scale, but efficiency is an ascending function of total saving capital of . For instance, imagine an economy with N similar firms producing
products by saving capital ; if every firm regards as the index, the average amount of capital will be
and will be as Function (1). AK model can be obtained by another formula. As Lucas
assumed as a combination of human and physical capitals; both capitals l have the ability to be reproduced with the same technology.
For simplicity, it is assumed that it has the population of static status and economy produces only one production
that is consumed or invested. If it is invested while depreciation rate for each period is , gross investment is equal to:
(2)
In a closed economy without government, capital market equilibrium requires the equity of gross saving to
gross investment. For reasons that will become clear later, of savings flow is eliminated in the process of
financial intermediation; capital market equilibrium means . According to Formula (2), the growth rate in t+1 is:
(3)
Using Formula (2) and eliminating time index, sustainable growth rate is:
(4)
Equation (4) is pressed to show that financial development can have positive effect on growth through influencing , a fraction of the savings that can be directed towards investment, , rate of private savings (both parts affect
capital accumulation) , and , final outcome and product of social capital (which represents changes in technology innovations).
In the process of converting savings into investment in firms, financial intermediaries (agents and brokers) receive sources in the form of fees and commissions so that a dollar saving by households creates less than a dollar investment. If financial development reduces this fees, will enhance and growth rate is accelerating. The main function of financial intermediaries to allocate funds to projects with highest final product of capital (improvement of capital allocation). It is achieves in two ways: (A) gathering information to evaluate various investment projects; (B) providing risk partnership by encouraging people to invest in technologies with high risks are but with greater return instead. In contrast to individual investment, financial intermediaries can choose the technologies with their
Rohullah Bayat et al.
Indian Journal Of Natural Sciences www.tnsroindia.org. © IJONS
Vol.5 / Issue 30 / June 2015 International Bimonthly ISSN: 0976 – 0997
7620
diverse portfolios that can best counteract shocks of total return. In fact, financial intermediaries (banks) can increase the efficiency of investment by directing capital to technologies with high efficiency and reducing investment losses due to cashing before maturity.
The third factor that affects the growth is changes in the savings rate ( ); the financial development effect on this factor is ambiguous. Preliminary studies of Mc Kinnon (1973) and Shaw (1973) assume that savings rate is positively correlated with interest rates. Then, they presuppose that financial repression of lack of competition, which determines interest rate paid on savings under the competitive market, leads to lower savings, and it restricts growth. On the contrary, financial market liberalization in financial development increases savings and accelerates growth. However, the effect of the real interest rate on savings is ambiguous (because of the substitution and income effects) (Kazeruni, 2003).
Financial development includes improvement in (1) presenting intended information about possible investments; (2) investment monitoring and implementation of the regulatory system; (3) trade, diversification and risk management; (4) mobilization and integration of savings; (5) the exchange of goods and services. Each of these financial functions can affect savings and investment decisions and hence influence on economic growth (Levine, 2005).
The research question is:
How is the relationship between financial development and economic growth in the provinces of Iran?
REVIEW OF LITERATURE
Some Studies Conducted in the World
Andrea Vaona and Roberto Patuelli (2008) examined the relationship between financial development and local economic growth in Italy. The results show while local economic development is a key factor for economic growth, it may lead to a reduction in economic growth in regions with inefficient credit due to opportunistic behaviors and misallocation of funds.
Xiaoqiang Cheng and Hans Degryse (2009) analyzed the relationship between finance and economic growth in a rapidly growing country such as China. Using data from 27 provinces of China during the period (1995-2003), they studied the effect of financial development of two different types of financial institutions (bank and non-bank) on economic growth. The results indicate that development of banking has a more significant statistical and more prominent economic impact local economic growth.
Jalil & Feridun (2011) have addressed the effects of financial sector development on economic growth in Pakistan for 1975 to 2008. They used principal component analysis (PCA) to build composite index of financial depth; moreover, they performed cointegration test using auto regression with distributed lag (ARDL). The findings showed that there is a positive and significant relationship between financial development and economic growth in Pakistan’s economy.
Bittencourt (2012) discussed the theory of Schumpeter about the financial development and economic growth in four countries in Latin America during 1980-2007. Based on analysis of time series panel, results confirm Schumpeterian estimation that entrepreneur can invest in productive activities and hence economic growth is created. In addition, not only the importance of freedom, competition and active financial sector is outstanding in transferring financial resources for entrepreneurs but also the relationship between economic stability and institutional framework
Rohullah Bayat et al.

Indian Journal Of Natural Sciences www.tnsroindia.org. © IJONS
Vol.5 / Issue 30 / June 2015 International Bimonthly ISSN: 0976 – 0997
7621
(including the independence of the central bank and financial responsibility laws) highlight structural reforms in 90s as necessary condition for economic development, sustainable growth and prosperity in the region.
Jake Kendall (2012) investigated the relationship between the development of the banking sector, human capital and economic growth in India using exclusive data of economic growth in the region. Results suggest that local regions are limited financially due to the underdevelopment of the banking sector and the possible relationship is non-linear. In addition, an increase in human capital can reduce financial constraints.
Zeynep Onder and Suheyla Ozyildirim (2012) analyzed the relationship between the credits of state and non-state sectors and local economic growth in Turkey during the crisis and election year. They concluded that the share of state-owned banks during the crisis and in local elections in the credit market is significantly higher than their share in non-crisis periods and non-elections. Real per capita credit provided by state-owned banks during the crisis is accompanied with positive local growth in all provinces. The results also indicate although state-owned banks may loan for political reasons during the elections, it appears that these loans will also play an important role in modulating the adverse effects of economic shocks, especially in the developed provinces.
In “Economic growth and financial development in Asian countries: A bootstrap panel Granger causality analysis, Economic Modelling,” Hsueh et al (2013) examined the causal relationship between economic growth and financial development in ten Asian countries between 1980 and 2007. Their results suggest that causality direction to the variables of financial development is more sensitive in the ten countries. Furthermore, the results confirm Supply-leading hypothesis where financial development variables lead economic growth in the ten countries, especially China.
Bayar et al (2014) studied the effect of stock market development on economic growth of Turkey during 1999 to 2013 using Johansen-Juselius cointegration and Granger causality tests. Experimental results showed a long-run relationship between economic growth to stock market value, the total value of traded shares, and turnover of stock transactions. Moreover, there is a one-way causality from the market value of shares, the total value of shares traded and the trading stock turnover ratio to economic growth.
Wadad Saad (2014) investigated the relationship between financial development and economic growth of Lebanon from 1972 to 2012 using the model of vector error correction. He examined the Granger causality relationship between financial development and economic growth. Evidence shows that credit markets were still underdeveloped in the country and the distribution of growth had been limited. The article focuses on measuring the financial development of the banking sector. There was a positive two-way causal relationship between financial development and economic growth in short run; but this relationship was not significant in the long run. However, the results revealed that the efficiency of the banking sector plays an important role in Lebanese economic growth. Using data on 101 developed and developing countries for the years 1970 to 2010 and with the use of panel data methods, Ductor & Grechyna (2015) examined the association of financial development with production of the real sector as well as their impact on economic growth. The results of the study indicate that the effect of financial development on economic growth is negative if the rapid growth occurs in private credit, not growth in the real sector. Furthermore, consequences support theories that emphasize financial desired level.
Caporale et al (2015) observed the relationship between financial development and economic growth of 10 new members of the Europe Union. They estimated the relationship between for a period of 1994-2007 using dynamic panel. The findings reveal that capital and stock markets are still undeveloped in these countries and economic growth is still distributed limited due to lack of deep financial sector although one banking sector may increase rapidly.
Rohullah Bayat et al.
Indian Journal Of Natural Sciences www.tnsroindia.org. © IJONS
Vol.5 / Issue 30 / June 2015 International Bimonthly ISSN: 0976 – 0997
7622
Studies Conducted in Iran
Nazifi (2004) examined the relationship between financial development and economic growth in the period (1959 -2002) using indicators of financial efficiency; he showed that financial development had a negative impact on economic growth of Iran. Based on the results, financial development had a negative impact on economic growth due to poor management of the financial system, lack of the formation of an integrated financial market, taking advantage of the rules, and the release mode of the financial markets.
Asari, Naseri and Khondabi (2008) studied and compared the relationship between financial development and economic growth in non-oil producing countries countries and OPEC countries. The investigation was conducted based on a dynamic panel model using GMM estimators during the period 1990 to 2004. The results of these estimates and comparisons state that financial development in the oil producing countries of OPEC have a negative impact on economic growth in the period under review because of oil revenues and inefficiency of financial institutions in the mobilization of financial resources. The effect of financial development on capital accumulation in these countries is negative.
Akbarian and Heidari Pour (2009) looked into the impact of financial market developments on economic growth of Iran in the short-term and long-term period (1966-2007). For this purpose, two different indicators of financial market development (the ratio of financial savings to GDP and the ratio of domestic credit to GDP) is used in in two distinct models in form of auto regression with distributed lag (ARDL). The results of estimating equations of show that in both models, financial indicators have negative impact on economic growth in the short-term; but in long-term, the relationship between indicators of financial development and economic growth reveal lack of close supervision in the banking system on the facilities.
Sadeqi et al (2012) studied the relationship between financial development and economic growth in the period 1973-2009. In this regard, vector auto regression model (VAR) and Johansen-Juselius cointegration were used to peruse long-term relationship between financial development and economic growth. The results of the model imply the existence of a significant relationship of financial development and variables of physical capital stock, real interest rates and revenues from oil exports with economic growth. One-way causal relationship from financial development to economic growth reflects the consistency of results with some experimental studies in this field.
Abu Noori and Teimuri (2013) investigated and compared effect of financial development on economic growth in the 26 countries of the Organization for Economic Co-operation and Development (OECD) and 23 countries with upper-middle-income (UMI). Models’ estimation was carried out using panel data econometrics during the period1980-2009. The results showed that financial development has a significant negative effect on economic growth in selected countries. Since the members of Organization for Economic Co-operation and Development are more developed, the impact for these countries is fewer. Besides, the effect of other variables including government size, inflation and real GDP per capita gap, investment and openness is consistent with theoretical expectations.
Elmi and Ariani (2013) studied effect of the development of financial markets on income distribution in Iran using panel data of 28 provinces of Iran in the years 2000 to 2006. According to the results obtained from the alternative variable of development and financial depth, performance Index has a significant effect on reducing inequality in provinces of Iran. Unlike inflation rate, public spending is among the factors driving inequality reduction. In addition, Kuznets inverted U relationship was confirmed in the provinces of Iran and it is reasonable to claim that financial development in Iran reduces inequality.
Ehsani (2014) looked at the effect of effect of stock market development on economic growth, as well as variables such as savings, physical capital, human capital and ... using panel data of D8 countries during the period 1988-2011.
Rohullah Bayat et al.
Indian Journal Of Natural Sciences www.tnsroindia.org. © IJONS
Vol.5 / Issue 30 / June 2015 International Bimonthly ISSN: 0976 – 0997
7623
Stock market development was described by 5 agents and was estimated by 5 models. The results indicate the existence of significant positive effect of stock market on economic growth in these countries.
Mohammadi et al (2014) compared the causality among financial development, trade openness and economic growth in Iran and Norway using vector error correction model (VECM). The analyzed period in Iran is 1967-2009 and in Norway is 1967-2006. Research results indicate that indicators of financial development and trade openness are the reasons for short-term economic growth in Iran. In long-term, there is a two-way casual relationship between both indicators of financial development and economic growth. The results of causality in Norway suggest that there is a one-way casuality from economic growth to the index of granted credit to the private sector in short-term. In addition, there is a two-way casual relationship between indicators of granted credit to the private sector and commercial intensity; there is also a one-way relationship from economic growth to index of granted credit the private sector in long-term. Therefore, it can be said that the idea of supply side is true about Iran and the idea of demand side is true about Norway.
Recent studies about the relationship between financial development and economic growth has been based on cross-country studies; thus, the important issues are target countries, estimation methods, the frequency of the data, consequential form considered for the production (growth), and substitute variables that are often very different. This research examines the relationship between economic growth and financial development in the provinces of Iran.
METHODOLOGY
One can define models in which financial development is an independent variable and the dependent variable is economic growth. The general model is as follows:
( 5)
The variables of this equation are GDP per capita as the best explanation of economic growth ( ), local
financial development ( ), and a vector of the other independent variables ( ).The definition of other independent variables in the model depends on the economic conditions of each province in Iran. The size of government associate with its intervention in social and economic aspects. The government size refers to the volume of operations carried out by organizations, agencies and the affiliated institutions including regional, state, municipal and social security organizations. The state budget, as an important national economic document that indicates the program and goals of the government, can show the size of government. Currently, the expenditure of the public sector to GDP is one of the most common indicators to measure the size of government. Many studies claim that the best scale for measuring the size of government is the ratio of total government spending to gross domestic product. Therefore, this study regards indicators of ratio of current government expenditure to GDP, and ratio of government construction spending to GDP as other affecting factors on economic growth in the provinces. As a result, the research equation can be expressed as follows:
(6)
Where is error term, index of “i” indicates the number of provinces (i=1, …, 30), t reflects period from 2001 to
2011, intercept, coefficients of the explanatory variables so that (k=1, …, 4), the logarithm of GDP
Rohullah Bayat et al.
Indian Journal Of Natural Sciences www.tnsroindia.org. © IJONS
Vol.5 / Issue 30 / June 2015 International Bimonthly ISSN: 0976 – 0997
7624
per capita for provinces i at time t-1, financial development index of province i at time t, ratio of
government current expenditure to GDP in the province i at time t, and is the ratio of government construction spending to GDP in the province i at time t.
Appropriate indicators of financial development should be defined with respect to other studies in the world and conditions in province’s financial system. Iranian financial system is formed according to the banking system and securities markets. Iranian stock market has little effect on the economy of the provinces for reasons such as the closure of and recession. In the research, three indexes are presented for financial development; the data are derived from the banking system. Three indexes are:
DGDP: ratio of deposits to GDP
N: Number of bank branches
TGDP: the ratio of total bank credits granted to the private sector to GDP
Consider the following dynamic model to explain algebraic approach of GMM:
1it it it i t ity y X (7)
In the above equation, y is the dependent variable, X vector of explanatory variables, individual or fixed effects
of countries, time constant effects, error term, i the country, and t period. In specification of Model (7), it is assumed that error terms are correlated with individual effects or constant effect of countries and dependent variable
values is not interrupted. If is correlated with some explanatory variables, first order differencing will be one of the suitable methods to remove the constant and individual effects of countries because using constant effect method results in biased estimators of coefficients; thus, it first order differencing is necessary for Equation (7). Therefore, Equation (7) is converted to the following formula:
ittititit Xyy 1 (8)
In Equation (8), interrupted difference of dependent variable ( 1 ity ) correlates to firs order difference of error term
( it ); in addition, there are endogenous problems related to some explanatory variables that were not included in the model. Hence, it is necessary to fix the problem of instrumental variables used in the model. This study uses method of Arellano-Bond (1991) as a good GMM estimator. The estimation is performed using instrumental variables.
RESEARCH FINDINGS
Model Specification Using Generalized Method of Moments
With regard to the economic structure of the provinces and provincial statistical information, following model is used to evaluate the factors affecting the economic growth in the provinces:
Rohullah Bayat et al.

Indian Journal Of Natural Sciences www.tnsroindia.org. © IJONS
Vol.5 / Issue 30 / June 2015 International Bimonthly ISSN: 0976 – 0997
7625
(9)
Where is error term, index of “i” indicates the number of provinces (i=1, …, 30), t reflects period from 2001 to
2011, intercept, coefficients of the explanatory variables so that (k=1, …, 6), the logarithm of GDP
per capita for provinces i at time t-1, , is the ratio of deposit to GDP for province i at time t, is the
number of bank branches per every 10000 persons in province i at time t, the ratio of total bank credits
granted to the private sector to GDP for province i at time t, ratio of government current expenditure to GDP
in the province i at time t, and is the ratio of government construction spending to GDP in the province i at
time t. variables and are regarded as other effective variables (control variables) on economic growth.
The reliability of the parameters of the model should be examined to avoid estimating false regression. Contrary to what is customary in the case of time series data, Dickey-Fuller test and generalized Dyky- Fuller test cannot be used to check reliability of panel data; but it is necessary to examine the collective reliability of variables. For this purpose, Levine, Lin and Chu test (2002) is used in this study. H0 hypothesis in this test indicates lack of reliability of variables. According to Table (1), all variables in the order I(0) are static.
GMM estimators’ compatibility depends on the validity of applied tools. Statistics suggested by Arellano and Bond (1991), Bondle and Bond (1998) and Arellano and Bower (1995) were used to test the hypotheses. The test, known as Sargan test, measures the total validity of the applied tools.
GMM estimations may be carried out based on one-stage or two-stage estimators. In one-stage estimation, error term ( ) is defined according to independence and random assumption among provinces and times. In two-stage estimation, the remainder of the first stage is used in compatibility form for the estimation of variance matrix of residuals’ covariance. The difference between these two methods (Arellano and Bond with Arellano-Bower/Bondle and Bond) lays in the approach considering individual effects. The first method increases precision, reduces bias in sample size restrictions, brings more efficient and accurate estimations. The results of estimating model in a two-step GMM estimator are shown in Table 2.
Sargan test statistics indicate the proper selection of applied tools, the validity of instrumental variable matrix used in the model, and the lack of restrictions over the identification of the estimated model. Wald tests of Chi-square distribution with freedom degree of the explanatory variables number except intercept and virtual variable show that the null hypothesis (zero value of all coefficients except the intercept and virtual variable) cannot be accepted and regression coefficients are significantly different from zero.
According to Table (2), this research investigates autocorrelation order of error terms based on Arellano-Bond test because first order differencing method is suitable for eliminating constant effects when autocorrelation order of error terms is not from stage two.
According to the results in Table 2 it can be stated that autocorrelation order of error terms is one; therefore, Arellano-Bond test is suitable for eliminating constant effects of the model and it has no specified bias.
According to Table 2, the ratio of deposits to GDP of provinces (DGDP) has negative relationship to economic growth, so that for every one percent increase in bank deposits (0.17) percent economic growth decreases. It can be
Rohullah Bayat et al.
Indian Journal Of Natural Sciences www.tnsroindia.org. © IJONS
Vol.5 / Issue 30 / June 2015 International Bimonthly ISSN: 0976 – 0997
7626
due to a high inflation rate in the country. Given that the inflation reduces the purchasing power and reduces the value of money, if accrued interest on bank deposits is below the inflation rate, the value of deposited money in bank will be reduced and banking system will not be able to pay fair rights. In addition, due to the attractiveness of other markets and their higher profitability, the liquidity of the banking system is removed and it goes to other markets; in this case, both bank and economy suffers from deficiencies.
Moreover, the variable N (the number of branches) has a negative relationship to economic growth so that for every one percent increase in the number of bank branches in provinces, economic growth decreases (-0.021) percent. The existence of high liquidity is a reason for increasing the number os banks, or branches. With this increase, banks and institutions try to collect liquidity in community, but it is not useful because the country has not focused on production policies. Investments are allocated into foundation of new branches in a situation that financial resources should be injected directly to production in order to increase employment and efficiency rates. This negative relationship between the number of bank branches and economic growth in provinces may be due to the following reasons:
- Independency and autonomy of banks with minimum supervision of the central bank.
- Lack of adequate supervision of authorities over people’s deposits while deposit of people is several times greater than bank capital.
- Higher than the standard employment of public funds by the banks (which is deposited) in order to buy property, management building and maintenance of the property.
- Giving huge loans to ordered and beneficiary persons.
- Irrational evaluations by banks for assessment of the collaterals.
According to Table (2), the variable TGDP (the ratio of total bank credits granted to the private sector to GDP) has positive relationship to economic growth of provinces. One percent increase in credits granted to the private sector enhances economic growth of provinces for 0.086 percent. This means that there is a one sided relationship between credits granted to private sector by bank and economic growth; this can be named as a key factor in the economic growth of provinces. In other words, since the volume of state economy is huge in provinces, strengthening the private sector through this index of economic growth will be more effective. As the index is significant, regulatory and legal defects and problems in the banking system should be eliminated and money market management should be coherent and integrated.
Variable GR (The ratio of government current expenditure to GDP) is regarded as the real part of economy and control variable. According to the table (2) and as it was expected, government current expenditure has a negative relationship to the economic growth of provinces. It specifies that pathology and economic reforms of the current government expenditures in Iran are more effective in the economic growth of provinces. In addition, According to expectations, the variable GO (the state construction expenses) has a positive relationship with economic growth.
Granger Causality Test Results
Separate indexes of Granger causality test was used to investigate the casual relationship between the logarithm of financial development indexes and the logarithm of GDP per capita (LGDP). With regard to the the reliability of the
Rohullah Bayat et al.
Indian Journal Of Natural Sciences www.tnsroindia.org. © IJONS
Vol.5 / Issue 30 / June 2015 International Bimonthly ISSN: 0976 – 0997
7627
values of the variables, Granger causality test was performed on the variables. The results of this test indicate short-term causal relationship between GDP and index of financial development.
Table (7) shows the results of Granger causality tests for financial development indexes and the logarithm of GDP non-oil per capita. The figures indicate that reason for short-term economic growth in Iran has been financial development in provinces; but it should be noted that there is no casual relationship between the ratio of granted credits to the private sector by banks to GDP and the ratio of deposits to GDP. Moreover, there has been no causality from financial development indexes to economic growth in Iran. In addition, the casual relationship of LTGDP and LDGDP in short-term changes from LDGDP to LTGDP.
Table (8) shows the results of Granger causality tests for the logarithms of financial development indexes and the logarithm of GDP per capita in long-term. Based on these results at significance level of 5%, long-term casual relationship between the logarithms of financial development indexes and the logarithm of economic growth in provinces is from economic growth to financial development indexes, like casuality of short-term. This means that the economic growth in provinces of Iran occurs because of financial development. Long-term casual relationships among explanatory variables are presented in Table (8).
CONCLUSION
There are many ideas about economic growth and financial development. First, financial development leads to economic growth; it is known as supply theory. Second, economic growth creates demand for financial services and the need for new financial instruments. Therefore, economic growth is a reason for formation of financial development. Third, the relationship between economic growth and financial development is not significant. Fourth, the relationship between economic growth and financial development is simultaneous and mutual; in other words, both supply theory and demand theory are ongoing. In this regard, further experimental researches are required for accurate identification of these relations in the economy. The results of this study using GMM estimator show the negative influence of deposit to GDP ratio and the number of bank branches on the economic growth of provinces during 2001 -2011. In addition, the ratio of credit granted to the private sectors by banks has a positive relationship to the economic growth of provinces. In this regard, financial development of the private sector has been more efficient than financial development of the banking sector. In means that the ratio of private sector credit to GDP has increased so that the increase refers to improvement of the private sector productivity. Based on the results, there has been a negative relationship between ratio of deposit to GDP and economic growth during 2001-2011. It could be due to the lack of sufficient development of the capital market in Iran that has led money market to carry out the duties of capital market and supply resources needed for long-term investments. Therefore, it has been unable to provide demand for short-term funds.
The structure of current and development expenditures of the government of Iran in the economy is very important. The relationship of aggregate demand components including consumption and private investment to current and construction costs of state is not negligible so that components of aggregate demand react to current and development expenditures of the government. The estimated coefficients for the variables of government current expenditure show that the government has a large and inefficient consumptive body in the provinces. This is due to expelling the private sector and allowing economic rent opportunities as one of the main obstacles to economic growth is the provinces.
The results of this study reflect the positive impact of the increase in development expenditure on the increase of per capita GDP in the provinces. Given these results, it can be stated that if the government of Iran increases its development expenditure more than consumption expenditure, it will help more to the economic growth of provinces.
Rohullah Bayat et al.
Indian Journal Of Natural Sciences www.tnsroindia.org. © IJONS
Vol.5 / Issue 30 / June 2015 International Bimonthly ISSN: 0976 – 0997
7628
Granger causality test results indicate that according to indexes of deposit ratio to GDP and synthetic indicator, economic growth is the only reason for financial development in the provinces of Iran. Moreover, there is no casual relationship between index of the credit granted to the private sectors ratio to GDP and economic growth in the provinces of Iran. However, there is a long-term causality between the logarithm of financial development index and the logarithm of economic growth of the provinces from the economic growth to the financial development index at significance level of 5%. In other words, economic growth results in financial development in the provinces of Iran. In addition, causality in the short-term and long-term between the indexes of deposits ratio to GDP and the private sector credit to the GDP is from deposit to the credit granted to private sectors by banks. This means that a change in bank deposits in the provinces of Iran (financial savings) results in a change in credit to the private sectors.
It is suggested that the banks of provinces optimize their activities and try to lead more credits to productive investment projects which is implemented by the private sector by private sector.
With regard to the negative effect of financial development indexes on economic growth, it can be due to weakness of expertise and lack of proper supervision of the banking granted facilities, so, it is suggested to banking system to employ skilled forces and supervise more accurate on the appropriate use of granted facilities for production.
REFERENCES
1. Abu Noori, Abbas Ali & Manijeh Teimuri (2013). “The effect of financial development on economic growth: a comparison between OECD and UMI countries.” Journal of Research and Economic Development, No. 11, pp. 29 -40.
2. Abrams, B. A., M. Z. Clarke and R. F. Settle (1999), "The Impact of Banking and Fiscal Policies on State-Level Economic Growth", Southern Economic Journal 66, pp. 367–378.
3. Akbarian, Reza & Seyed Mohsen Heidari Pour (2009). “The effect of financial market development on economic growth in the years 1966-2007.” Economic Research, No. 3, pp. 43-63.
4. Aghion, P., Howitt, P., & Mayer-Foulkes, D. (2005). The effect of financial development on convergence: Theory and evidence. The Quarterly Journal of Economics, 120(1), 173–222.
5. Andrea, Vaona. Roberto, Patuelli (2008), "New empirical evidence on local financial development and growth", Lett Spat Resour Sci 1, pp. 147–157.
6. Apergis, N., Filippidis, I., Economidou, C (2007), "Financial deepening and economic growth linkages: a panel data analysis", Rev. World Econ 143, pp. 179–198.
7. Asari, Abbas, Naseri, Alireza & Majid Agaee Khondabi (2008). “Financial Development and Economic Growth: Comparison of OPEC and non-oil developing countries, using generalized method of moments (GMM).” Journal of Economic Research, No. 82, pp. 141-161.
8. Bayar, Y,. Kaya, A,.& yildirim, M,. (2014). Effects of Stock Market Development on Economic Growth: Evidence from Turkey, International Journal of Financial Research, Vol(5), pp 93-100.
9. Bittencourt, M. (2012). Financial development and economic growth in Latin America: Is Schumpeter right?. Journal of Policy Modeling vol(34), pp 341–355.
10. Bolton, P., Santos, T., & Scheinkman, J.A. (2011). Cream skimming in financial markets. Working paper no. 16804. National Bureau of Economic Research.
11. Boulila, G. and M. Trabelsi (2004), "The Causality Issue in the Finance and Growth Nexus: Empirical Evidence from Middle East and North African Countries", Review of Middle East Economics and Finance 2, pp. 123-138.
12. Caparole, G, M. Rault, C. Sova, A, D. & Sova, R. (2015). FINANCIAL DEVELOPMENT AND ECONOMIC GROWTH: EVIDENCE FROM 10 NEW EUROPEAN UNION MEMBERS, International Journal of Finance & Economics, vol (20), pp 48-60.
Rohullah Bayat et al.

Indian Journal Of Natural Sciences www.tnsroindia.org. © IJONS
Vol.5 / Issue 30 / June 2015 International Bimonthly ISSN: 0976 – 0997
7629
13. Derakhshan, Masoud (2006). Econometrics. Volume I, Tehran: SAMT. 14. Ductor, L. Grechyna, D. (2015). Financial development, real sector, and economic growth, International Review
of Economics and Finance, pp 1-13. 15. Ehsani, Mohammad Ali (2014). “The effect of stock market development on economic growth: A case study of
D8 countries.” Journal of Financial and Economic Policy, Vol. II, No. 6, pp. 105-122. 16. Elmi, Zahra, Faezeh Ariani (2013). “The effect of financial development on income distribution in Iran.”
Quarterly Journal of Commerce, No. 69, pp. 133-158. 17. Fafchamps, Marcel, Schundeln. Matthias (2013), "Local financial development and firm performance: Evidence
from Morocco", Journal of Development Economics 103, pp. 15-28. 18. Farzinvash, Asadollah, Mohammad Ghafarifard (2006). “The effect of fiscal decentralization on economic growth
and stability in Iran.” Journal of Economic Research, No. 77, pp. 1-26. 19. Greenwood, J., Sanchez, J.M., & Wang, Ch. (2010). Financing development: The role of information costs. The
American Economic Review, 100(4), 1875–1891. 20. Guiso, L., Sapienza, P., Zingales, L (2004), "Does local financial development matter?", Quarterly Journal of
Economics 119, pp. 929–969. 21. Gujarati, Damodar (2004). Basic Econometrics. Trans. Hamid Abrishami, Tehran University Press. 22. Hao, C (2006), "Development of Financial Intermediation and Economic Growth: The Chinese Experience",
China Economic Review 17, pp. 347-362. 23. Hoshmand, Mahmood, Mohammad Danesh Nia (2011). “The effect of financial development on economic
growth in Iran.” Journal of Monetary-Financial Economy (Knowledge and Development), No. 2, pp. 45-61. 24. Hosseini, Seyed Mahdi, Ashrafi, Yekta & Ibrahim Siami Araqi (2011). “Relationship between financial
development and economic growth in Iran with the introduction of new parameters.” Journal of Economic Policy, No. 60, pp. 19-34.
25. Hsueh, S,. Hu, Y,. Tu, C,. (2013). Economic growth and financial development in Asian countries: A bootstrap panel Granger causality analysis, Economic Modelling, Vol(32), pp 294-301.
26. Jalil, A,.& Feridun, M,. (2011). Impact of financial development on economic growth: empirical evidence from Pakistan, Journal of the Asia Pacific Economy, Vol(16), pp 71-80.
27. Kazeruni, Seyed Alireza (2003). “The relationship between financial development and economic growth: the experiences of Iran.” Proceedings of the Conference on Monetary and Foreign Exchange Policy, Monetary and Banking Research Institute, Central Bank of the Islamic Republic of Iran.
28. Kendall, Jake (2012), "Local financial development and growth", Journal of Banking & Finance 36, pp. 1548–1562. 29. King, R.G., & Levine, R. (1993). Finance and growth: Schumpeter might be right. The Quarterly Journal of
Economics, 108(3), 717–737. 30. Koetter, M. and M. Wedow (2010), "Finance and growth in a bank-based economy: Is it quantity or quality that
matters?” Journal of International Money and Finance 29, pp. 1529-1545. 31. Levine, R (1997), "Financial development and economic growth: views and agenda", The Journal of Economic
literature 35, pp. 688–726. 32. Levine, R. (2005). Finance and growth: theory and evidence, in P. Aghion and S. Durlauf (eds), Handbook of
Economic Growth, Chapter 12, pp. 865–934. 33. Miller, M.H (1998), "Financial Markets and Economic Growth", Journal of Applied Corporate Finance 11, pp. 8-
14. 34. Mohammadi, Teimur, Nazeman, Hamid, Younes Khodaparast Pir Saraei (2014). “Studying the relationship of
dynamic causality among financial development, trade openness and economic growth: The case of two oil producing countries, Iran and Norway, Journal of Iranian Energy Economics, third issue, No. 10. pp. 151-178.
35. Motamani, Mani (2009). “Social Capital and Financial Development in Iran.” Business Studies, No. 34, pp. 59 -66. 36. Nazifi, Fatemeh (2004). “Financial development and economic growth in Iran.” Economic Bulletin, No. 3, pp. 97-
130. 37. Nkusu, Mwanza. and Sayek, Selin (2004), "Local Financial Development and the Aid-Growth Relationship",
International Monetary Fund 238.
Rohullah Bayat et al.
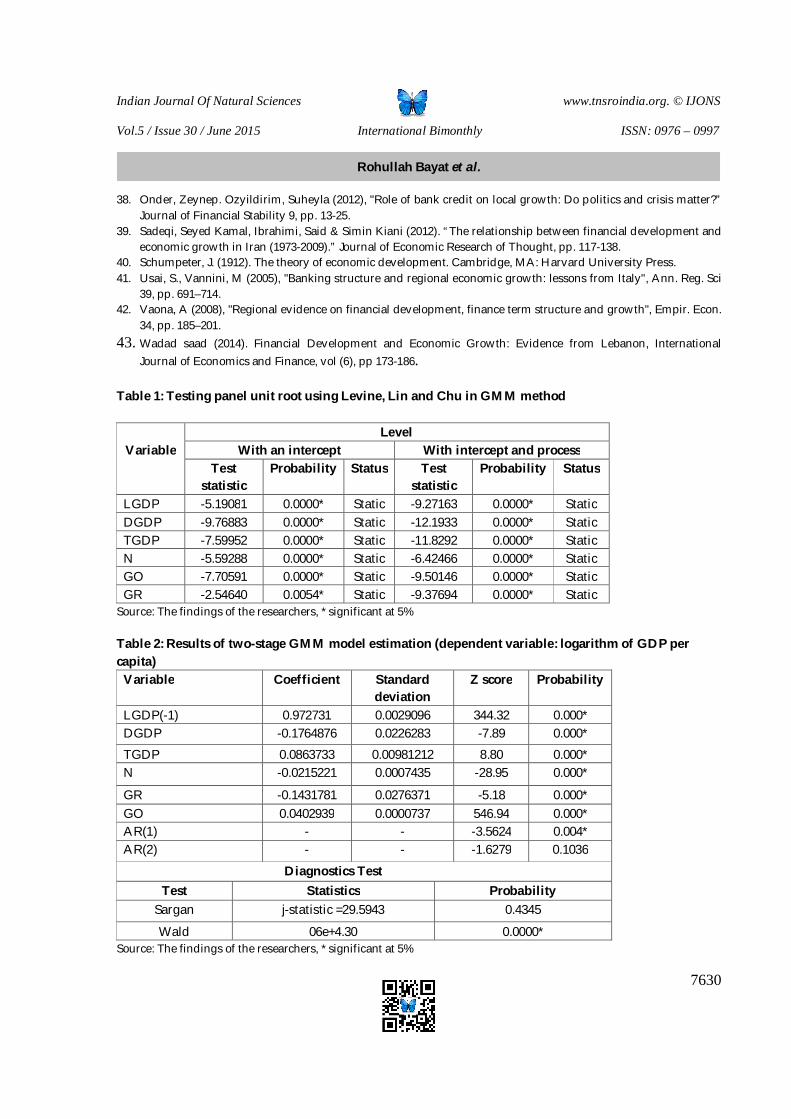
Indian Journal Of Natural Sciences www.tnsroindia.org. © IJONS
Vol.5 / Issue 30 / June 2015 International Bimonthly ISSN: 0976 – 0997
7630
38. Onder, Zeynep. Ozyildirim, Suheyla (2012), "Role of bank credit on local growth: Do politics and crisis matter?” Journal of Financial Stability 9, pp. 13-25.
39. Sadeqi, Seyed Kamal, Ibrahimi, Said & Simin Kiani (2012). “The relationship between financial development and economic growth in Iran (1973-2009).” Journal of Economic Research of Thought, pp. 117-138.
40. Schumpeter, J. (1912). The theory of economic development. Cambridge, MA: Harvard University Press. 41. Usai, S., Vannini, M (2005), "Banking structure and regional economic growth: lessons from Italy", Ann. Reg. Sci
39, pp. 691–714. 42. Vaona, A (2008), "Regional evidence on financial development, finance term structure and growth", Empir. Econ.
34, pp. 185–201. 43. Wadad saad (2014). Financial Development and Economic Growth: Evidence from Lebanon, International
Journal of Economics and Finance, vol (6), pp 173-186.
Table 1: Testing panel unit root using Levine, Lin and Chu in GMM method
Level With intercept and process With an intercept Variable
Status Probability Test statistic
Status Probability Test statistic
Static 0.0000* -9.27163 Static 0.0000* -5.19081 LGDP Static 0.0000* -12.1933 Static 0.0000* -9.76883 DGDP Static 0.0000* -11.8292 Static 0.0000* -7.59952 TGDP Static 0.0000* -6.42466 Static 0.0000* -5.59288 N Static 0.0000* -9.50146 Static 0.0000* -7.70591 GO Static 0.0000* -9.37694 Static 0.0054* -2.54640 GR
Source: The findings of the researchers, * significant at 5% Table 2: Results of two-stage GMM model estimation (dependent variable: logarithm of GDP per capita)
Probability Z score Standard deviation
Coefficient Variable
0.000* 344.32 0.0029096 0.972731 LGDP(-1) 0.000* -7.89 0.0226283 -0.1764876 DGDP
0.000* 8.80 0.00981212 0.0863733 TGDP 0.000* -28.95 0.0007435 -0.0215221 N
0.000* -5.18 0.0276371 -0.1431781 GR 0.000* 546.94 0.0000737 0.0402939 GO 0.004* -3.5624 - - AR(1) 0.1036 -1.6279 - - AR(2)
Diagnostics Test
Probability Statistics Test 0.4345 j-statistic =29.5943 Sargan
0.0000* 06e+4.30 Wald Source: The findings of the researchers, * significant at 5%
Rohullah Bayat et al.
Indian Journal Of Natural Sciences www.tnsroindia.org. © IJONS
Vol.5 / Issue 30 / June 2015 International Bimonthly ISSN: 0976 – 0997
7631
Structural Model of Organizational Support, Talent Management, Knowledge Creation and Organizational Agility Parvin Abbaspour
Department of Human Resources Management, Faculty of Management, UAE Branch, Islamic Azad University, Iran. Received: 27 Mar 2015 Revised: 26 Apr 2015 Accepted: 29 May 2015 *Address for correspondence Parvin Abbaspour Department of Human Resources Management, Faculty of Management, UAE Branch, Islamic Azad University, Iran.
This is an Open Access Journal / article distributed under the terms of the Creative Commons Attribution License (CC BY-NC-ND 3.0) which permits unrestricted use, distribution, and reproduction in any medium, provided the original work is properly cited. All rights reserved.
Organizations and institutes are forced to seek for agility for competition in 21th century, because modern organizations face increasing pressure for finding new ways of efficient competition in dynamic global market. Thus, current work aims at investigating effect of organizational support and talent management on organizational agility with emphasis on mediatory role of knowledge creation using path analysis. To this end, 231 employees of Gas Company took part in the research. They completed questionnaires of organizational support, talent management, knowledge creation and organizational agility. Path analysis results showed direct impact of talent management, organizational support, and knowledge creation on organizational agility is positive and significant. Direct effect of talent management and organizational support on knowledge creation is positive and significant. Indirect effect of talent management and organizational support on organizational agility through knowledge creation is positive and significant. Overall, findings emphasize significant effect of organizational support, talent management, and knowledge creation on organizational agility.
Key words: Organizational support, talent management, knowledge creation, organizational agility
INTRODUCTION
Ability of the company or organization for rapid and flexible response to environmental dynamics probably creates better performance, since contemporary companies needs to identify market opportunities and utilize them quality. This specific type of dynamic capability enables the company to gather its needed assets, knowledge and business
RESEARCH ARTICLE
ABSTRACT
Indian Journal Of Natural Sciences www.tnsroindia.org. © IJONS
Vol.5 / Issue 30 / June 2015 International Bimonthly ISSN: 0976 – 0997
7632
relations flexibly. The company with such capability constantly perceives opportunities for new competitive action in its market and seeks for finding knowledge and assets needed for achieving these opportunities. This type of dynamic ability is known as organizational agility, which can be defined as high level dynamic capability of the company for identifying environmental changes and quick and flexible response to changes by gathering organizational resources (Goldman et al., 1995; Sambamurthy et al., 2003).
Agility means ability to respond and quick and successful reaction to environmental changes. Like producers, other organizations and institutes are forced to seek for agility for competition in 21th century, because modern organizations face increasing pressure for finding new ways of efficient competition in dynamic global market. Agility promotes ability of the organization for offering high quality products and services and thus it is an important factor for organizational productivity (Dolat Modeli, 2008). An agile organization survives sudden events and changes. An agile organization is quick, compatible, and powerful, and quickly reacts to sudden changes, new market opportunities, and customer needs. Agile organization is designed for understanding and predicting business environment changes and it restructures itself in this line (Jafarnejad and Shahaee, 2007).
Today world is the world of ongoing changes and era of instabilities which deeply affect organizations. Thus, organizations should adopt to changes threatening the organization directly or indirectly in order to survive. Organizations shouldeffectively overcome constant and unexpected changes as well as new challenges in low cost. Hence, ability for rapid and effective reaction has become a certain characteristic of competition. In fact, agility is a necessity for survival against competitors under changing environments for coping with challenges of quick product and service delivery, quality, and customer satisfaction (Ebrahimian Jelodar, Ebrahimian Jelodar, 2011). Considering major outcomes of organizational agility and requirements of today organizations to agility, current research aims at investigating effect of talent management, organizational support, and knowledge creation on organizational agility in structural model framework.
In considering growing development in global competition, changing markets, and unpredicted events in today business world, presence of expert human resources is regarded as a strategic asset for the organization (Gagne, 2007; Skuza, Scullion, and McDonnell, 2013). Human beings with having greatest source of power, i.e. thinking, can create grounds for excellence, movement and development of organizations. Considering various challenges for achieving competitiveadvantagein coping with complex environment, the organizations need elites. Thus, in recent years, talent management has been raised as a key management activity more than ever (Lewis and Heckman, 2006; Skuza, Scullion, and McDonnell, 2013).
The most comprehensive definition of talent management has been provided by Gay and Sims (2006). They define talent management as follows: facilitating career advancement and making people very talented and skilled in the organization using formal and documented processes, resources, policies, procedures, and practices. Talent management focuses on preparing employees and leaders for the future of organization. According to Showir (2004), talent management includes all process of human resources, affair management and technologies. Talent management generally means exploring, discovering, choosing, preserving and holding, development and optimization, application, and reconstruction of labor force. Organizations consider the fact that talent management can help them in absorbing, nurturing, and developing next generation of the general leaders (Al Ariss & Crowley-Henry, 2013; Bjorkmanet al., 2013).
Talent management is a relatively new area in public and private organizations. In most organizations, which have started experiencing “fight for talent”, interest for talent management has turned to a strategic matter (Marcus & Marion, 2008; Schuler and Tarique, 2012). Talent management was developed as a solution for challenges in human resources and it is regarded as a key for organizational effectiveness (Gelens et al., 2014; Hunt, 2014) even in non-industrial environments (van den Brink et al., 2013). Effective talent management leads to increased job satisfaction (Magolego,
Parvin Abbaspour
Indian Journal Of Natural Sciences www.tnsroindia.org. © IJONS
Vol.5 / Issue 30 / June 2015 International Bimonthly ISSN: 0976 – 0997
7633
Barkhuizen, and Lesenyeho, 2013), organizational energy (Mpofu and Barkhuizen, 2013), and reduction of tendency to leave the job (Du Plessis, Stanz, and Barkhuizen, 2013). According to McDonnell (2011), talent management is one of the main factors for guaranteeing sustainable organizational success. Talented people as source of sustainablecompetitiveadvantage (Pornrat, 2010) play significant role in realization of organizational goals and preserving competitive advantage. Thus, talent management is considered as one of the factors affecting organizational agility in this work.
Knowledge creation is the other factor which affects organizational agility. Knowledge creation refers to the organization’s ability for creating and developing efficient and new solutions and ideas. Through shaping and recombination of new knowledge with previous knowledge, the organization will be able to create new concepts and realities. Hence, knowledge creation is a fundamental process where motivation, ability, experiences, and potential capabilities of individuals play basic role (Bhatt, 2001). Through various collections of interactions and by restructuring and recombining backgroundknowledge, the organization can creates new concepts and realities. Knowledge creation is an emerging process in which motivation, inspiration, experience and chance play significant role. The criterion for measurement of new knowledge is its effective role in solving problems effectively and efficiently or it leads to innovations in the market. However, it is not recommended that organizations create new knowledge at any conditions (Abtahi, 2007). One of the factors affecting knowledge creation in the organization is using talented human resource and preserving them. Thus, in case talents of the individuals and organization are managed, they will become learning and knowledge management flow would be facilitated, and these individuals will give knowable to others and turn their tacit knowledge into explicit knowledge in the organization.
Perceived organizational support is the other factor which affects organizational agility and knowledge creation. Perceived Organizational Support is a new concept introduced originally by Eisenberger et al. (1986) in the early nineties of the twentieth century. They define perceived support as “belief of employees to the fact that organization to whatextent values their cooperation and their welfare” (Aubè et al., 2007). According to this theory, employees tend to assign human characteristics to the organization. Perceived support concept from organization originates from this tendency of employees to personification of the organization. Employees view organization as a human being and accordingly judge pleasance of the organization based on its pleasant or unpleasant dealings with themselves (Eisenberger and Rhoades, 2002).
Perceived organizational support has optimal outcomes for organizations at individual and organizational level. Perceived support from organization at individual level leads to increased job satisfaction and positive feeling in employees. At organizational level, perceived organizational support leads to increased emotional commitment and performance of employees and on the other hand, it reduces tendency to leave the job (Eisenberger and Rhoades, 2003). Thus, considering outcomes of perceived support, it is assumed in the current research that perceived organizational support influences knowledge creation and organizational agility.
Review of literature show a few studies have been dedicated to relationship between organizational support, talent management, knowledge creation and organizational agility within structural model framework. Thus, the main research question in the current work is investigating relationship between organizational support, talent management, knowledge creation and organizational agility within structural model framework so that richness of research and experimental literature in this area is improved and a step is taken for improvement of organizational agility.
Research Conceptual Model
Considering research literature, research conceptual model is given in Fig 1. research hypotheses are described as follows:
Parvin Abbaspour
Indian Journal Of Natural Sciences www.tnsroindia.org. © IJONS
Vol.5 / Issue 30 / June 2015 International Bimonthly ISSN: 0976 – 0997
7634
H1: Organizational support has direct effect on knowledge creation and organizational agility. H2: Talent management has direct effect on knowledge creation and organizational agility. H3: Knowledge creation has direct effect on organizational agility. H4: Knowledge creation has mediatory role in relationship between organizational support and organizational agility. H5: Knowledge creation has mediatory role in relationship between talent management and organizational agility
Methodology
It is a descriptive (non-experimental) research and research design is correlation of path analysis type, because relationship between variables is investigated in this research in the form of causal model.
Subjects
Gas Company employees were subjects of the study. 248 questionnaires were distributed among Gas Company employees. Out of 248 questionnaires, 237 were completed. 6 ones were excluded in analysis since a large number of items were left unfilled. Finally, 231 questionnaires were entered in analysis.
Data Collection Tool
Organizational Support: In order to measure organizational support, the questionnaire developed by Eisenberger et al. (1986) was used. It includes 8 items. The items are measured based on Likert scale from totally disagree (1) to totally agree (5). Internal consistency coefficient was obtained as 0.81 using Cronbach alpha. Also, indexes obtained from confirmatory factor analysis as GFI = 94, RMSEA = 0.043, and AGFI = 0.90 suggest fit of model with data.
Talent Management
In order to measure talent management, the Oehley’s questionnaire (2007) was used. It includes 36 items. The items are measured based on Likert scale from totally disagree (1) to totally agree (5). Internal consistency coefficient was obtained as 0.86 using Cronbach alpha. Also, indexes obtained from confirmatory factor analysis as GFI = 95, RMSEA = 0.057, and AGFI = 0.91 suggest fit of model with data.
Knowledge Creation
In order to measure knowledge creation, Phyllis Inventory (2000) was used. It includes 4 items. The items are measured based on Likert scale from totally disagree to totally agree. Reliability was obtained as 0.74 using Cronbach alpha for the whole questionnaire. Also, indexes obtained from confirmatory factor analysis as GFI = 96, RMSEA = 0.029, and AGFI = 0.94 suggest fit of model with data.
Organizational Agility
In order to measure organizational agility, the Jarafi’s questionnaire (2013) was used. It includes 16 items. The items are measured based on five-point Likert scale from totally disagree (1) to totally agree (5). Internal consistency coefficient was obtained as 0.78 using Cronbach alpha. Also, indexes obtained from confirmatory factor analysis as GFI = 92, RMSEA = 0.061, and AGFI = 0.89 suggest fit of model with data.
Parvin Abbaspour
Indian Journal Of Natural Sciences www.tnsroindia.org. © IJONS
Vol.5 / Issue 30 / June 2015 International Bimonthly ISSN: 0976 – 0997
7635
Data Analysis
Following calculation of descriptive indexes of the research variables, structural equations method was used for investigating causal relationship between variables. LISREL software was used for data analysis.
RESULTS
Since correlation matrix is basis of analysis in causal models, correlation matrix, mean and SD of the variables is given in Table 1.
As observed in Table 1, among research variables, talent management (r = 0.51), knowledge creation (r = 0.44), and organizational support (r = 0.40) have highest correlation with organizational agility. Also, among research variables, talent management (r = 0.32) and organizational support (r = 0.29) have highest correlation with knowledge creation. Correlation of talent management and organizational support is positive and significant at level P < 0.01. Fig 2 shows tested research model.
Fig 2 shows fit model of the research. Figures on the paths are standardized parameters. According to Fig 2, all paths are significant at level P < 0.01. Among variables in the model, talent management has highest direct effect on organizational agility.Features of fit of path analysis model are given in Table 2.
According to Table 2, chi square ratio to degree of freedom (x2/df = 2.76), goodness of fit index (GFI = 0.96), adjusted goodness of fit index (AGFI = 0.93), and Root Mean Square Error of Approximation (RMSEA= 0.069) are at acceptable level. Thus, model fit is acceptable in this research.Since current work aims at investigating mediatory role of knowledge creation regarding talent management, organizational support, and organizational agility variables, Table 3 gives direct effect, indirect effect, total effect, described variance and significance level of research variables.
As observed in Table 3, direct effect of talent management (β = 0.48), organizational support (β = 0.33) and knowledge creation (β = 0.41) on organizational agility is positive and significant at level P < 0.01. Direct effect of talent management (β = 0.30) and organizational support (β = 0.24) on knowledge creation is positive and significant at level P < 0.01. Indirect effect of talent management and organizational support on organizational agility through knowledge creation is positive and significant at level P < 0.01. Overall, 51 per cent of organizational agility variance and 15 per cent of knowledge creation variance is described by the research model.
DISCUSSION AND CONCLUSION
Current paper aims at investigating effect of organizational support and talent management on organizational agility with emphasis on mediatory role of knowledge creation using structural equations method. Results of path analysis showed proposed model is in relatively good fit to the research data and it can describe 51 per cent of organizational agility variance and 15 per cent of knowledge creation variance.
Results of structural equations method showed organizational support have direct positive significant effect on knowledge creation. According to Organization Support Theory (OST) (Eisenberger et al., 1986), employees shape their general perception about to what extent the organization values their cooperation and their welfare based on fulfillment of emotional – social needs and evaluation of advantages resulting from their working attempts. Such perceived support from the organization causes that employee feel they are forced to help the organization in achieving its goals and their affective commitment to the organization and expectation of people regarding better reward for better performance is increased. Behavioral outcomes of perceived support from organization include
Parvin Abbaspour
Indian Journal Of Natural Sciences www.tnsroindia.org. © IJONS
Vol.5 / Issue 30 / June 2015 International Bimonthly ISSN: 0976 – 0997
7636
improved in role and extra role performance. Thus, organizational support leads to increased knowledge creation through its outcomes.
The other finding of structural equations model is that organizational support directly affects organizational agility. Agile organization is the organization which has broad view regarding novel global order of business, and it is able to confront chaos with limited abilities and capabilities, and it can dominate competitive advantages. According to Lengial, agility is the ability of the institution for survival and development in a competitive environment where change is constant and unpredicted. It is quick response to quick changes of markets which result from valuing customers on products and services (Richards, 1996). Hence, considering features of agility, organizational agility is not feasible without organizational support. Organizations which act in a dynamic environment need more agility compared to organizations which work in business environments with lower chaos (Moitra and Ganesh, 2005; Tallon, 2008). Agility actually requires a basic ability which perceives, receives, considers, analyses and predicts changes in business environment of the company, and it is not possible without organizational support.
Results of structural equations showed talent management has direct effect on knowledge creation and organizational agility. In describing this finding it can be saidin case talents of the individuals and organization are managed, they will become learning and knowledge management flow would be facilitated, and these individuals will give knowable to others and turn their tacit knowledge into explicit knowledge in the organization. Organizational leaders have found they should view “learning” as a valuable phenomenon and nurture such organization which is constantly and effectively learning for success in creating a better future. Such organization should adapt to changes in order to survive, and it should not act passively against challenges and it should seek for knowledge creation. On the other hand, knowledge creation is possessing organizational knowledge and even externalknowledge and disseminating it for performing tasks in the organization which provides knowledge capital development for realization of organizational goals. In addition, quick reaction to opportunities and threats, creating competitiveadvantages, and speed in responding market ad customer needs would not occur without knowledge and knowledge creation, and it needs talented human resource. In other words, it requires talent management in the organization so that organizational agility is increased through identification, absorption, development, and maintenance of talents in the organization.
Results of structural equations showed knowledge creation has direct positive significant effect on organizational agility. Knowledge creation refers to the organization’s ability for creating and developing efficient and new solutions and ideas. Through shaping and recombination of new knowledge with previous knowledge, the organization will be able to create new concepts and realities. Hence, knowledge creation is a fundamental process where motivation, ability, experiences, and potential capabilities of individuals play basic role (Bhatt, 2001), thus organizational agility is affected.
Results of structural equations showed knowledge creation has mediatory role in relationship between organizational support and organizational agility. This finding shows organizational support influences knowledge creation in the organization through encouraging and supporting creative and innovative ideas, innovative solutions and use of intellectual and practical capacities, hence it leads to rapid identification of opportunities and threats and creating competitive advantages in the organization. Findings showed knowledge creation has mediatory role in relationship between talent management and organizational agility. It shows identification, recruitment, deployment, development and maintenance of talented human resources leads to knowledge creation in the organization, and it would result in organizational agility through sharing and spreading knowledge. Overall, research findings emphasize role of organizational support, talent management and knowledge creation in organizational agility.
Parvin Abbaspour
Indian Journal Of Natural Sciences www.tnsroindia.org. © IJONS
Vol.5 / Issue 30 / June 2015 International Bimonthly ISSN: 0976 – 0997
7637
REFERENCES
1. Abtahi, H. (2007). Pathological perspective on knowledge management projects in organization, selected papers of the first National Conference on Knowledge Management.
2. Al Ariss, A., Crowley-Henry, M. (2013). Self-initiated expatriation and migration in the management literature: Present theorizations and future research directions. Career Development International, 18: 78-96.
3. Aubé, C., Rousseau, V., Morin, E. M. (2007). Perceived organizational support and organizational commitment: The moderating effect of locus of control and work autonomy. Journal of managerial Psychology, 22: 479-495.
4. Bhatt, G. D. (2001). Knowledge management in organizations: examining the interaction between technologies, techniques, and people. Journal of knowledge management, 5: 68-75.
5. Björkman, I., Ehrnrooth, M., Mäkelä, K., Smale, A., & Sumelius, J. (2013). Talent or not? Employee reactions to talent identification. Human Resource Management, 52:195-214.
6. Du Plessis, L., Stanz, K., Barkhuizen. (2010). The relationship between Perceived talent management practices, PerceivedOrganizational Support (POS), Perceived Supervisor Support(PSS) and Intention to quit amongst Generation Y employees inthe Recruitment Sector. Paper presented at the 3rd Annual People and Organization's Conference, Wharton School, McGillUniversity.
7. Eisenberger, R., Fasolo, P., Davis-LaMastro, V. (1990). Perceived organizational support and employee diligence, commitment, and innovation. Journal of applied psychology, 75: 51.
8. Eisenberger, R., Huntington, R., Hutchison, S. and Sowa, D. (1986). Perceived organizational support, Journal of Applied Psychology, 3: 500-7.
9. Gagné, F. (2007). Ten commandments for academic talent development. Gifted Child Quarterly,51: 93-118. 10. Gay, M., Sims, D. (2006). Building tomorrow’s talent: A practitioners guide to talent management and succession
planning. Bloomington, IN: Authorhouse. 11. Gelens, J., Dries, N., Hofmans, J., Pepermans, R. (2013). The role of perceived organizational justice in shaping
the outcomes of talent management: A research agenda. Human Resource Management Review, 23: 341-353. 12. Goldman, S. L., Nagel, R. N., Preiss, K. (1995). Agile competitors and virtual organizations: strategies for
enriching the customer, New York: Van Nostrand Reinhold. 13. Hunt, S. T.(2014). Common Sense Talent Management: Using Strategic Human Resources to Improve Company
PerformancePaperback, Pfeiffer; 1 edition. 14. Lewis, R.E. and Heckman. R.J. (2006), Talent management a critical review, Human ResourcesManagement
Review, Vol.16, pp.139-154. 15. Magolego. H., Barkhuizen, E.N. Lesenyeho, D.L. (2013). Talent Management and Job Performance: The
Mediating Role of JobSatisfaction. In S.M. Lee & G. Roodt (Eds.), 30th Pan Pacific Conference, Johannesburg, South Africa,1:132-135.
16. Marcus P., Marion D. (2008). Talent management in the public sector, The Ashridge Journal, Autumn. 17. McDonnell, A. (2011). Still fighting the “war for talent”? Bridging the science versus practice gap. Journal of
Business and Psychology, 26: 169-173. 18. Moitra, D., Ganesh, J. (2005). Web services and flexible business processes: towards the adaptive enterprise.
Information & Management, 42: 921-933. 19. Mpofu. L., Barkhuizen, E.N. (2013). The Impact of Talent Management Practices on Employees in a Government
Institution. In S.M.Lee & G. Roodt (Eds.), 30th Pan PacificConference, Johannesburg, South Africa, 1:129-131. 20. Rhoades, L., Eisenberger, R. (2002). Perceived organizational support: a review of the literature. Journal of
applied psychology, 87: 698. 21. Richards, C. W. (1996). Agile manufacturing: beyond lean?. Production and Inventory Management Journal, 37:
60-64. 22. Sambamurthy, V., Bharadwaj, A., Grover, V. (2003). Shaping agility through digital options: Reconceptualizing
the role of information technology in contemporary firms. MIS quarterly, 237-263.
Parvin Abbaspour
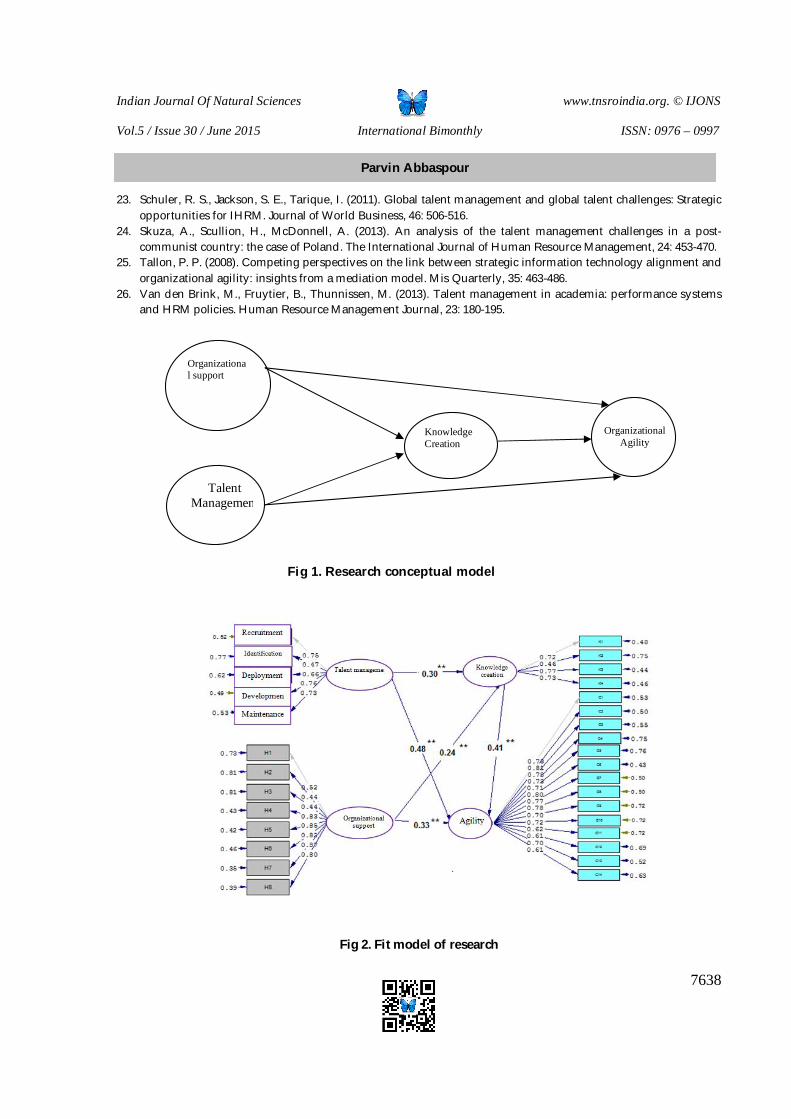
Indian Journal Of Natural Sciences www.tnsroindia.org. © IJONS
Vol.5 / Issue 30 / June 2015 International Bimonthly ISSN: 0976 – 0997
7638
23. Schuler, R. S., Jackson, S. E., Tarique, I. (2011). Global talent management and global talent challenges: Strategic opportunities for IHRM. Journal of World Business, 46: 506-516.
24. Skuza, A., Scullion, H., McDonnell, A. (2013). An analysis of the talent management challenges in a post-communist country: the case of Poland. The International Journal of Human Resource Management, 24: 453-470.
25. Tallon, P. P. (2008). Competing perspectives on the link between strategic information technology alignment and organizational agility: insights from a mediation model. Mis Quarterly, 35: 463-486.
26. Van den Brink, M., Fruytier, B., Thunnissen, M. (2013). Talent management in academia: performance systems and HRM policies. Human Resource Management Journal, 23: 180-195.
Fig 1. Research conceptual model
Fig 2. Fit model of research
Organizational support
Knowledge Creation
Organizational
Agility
Talent Management
Parvin Abbaspour
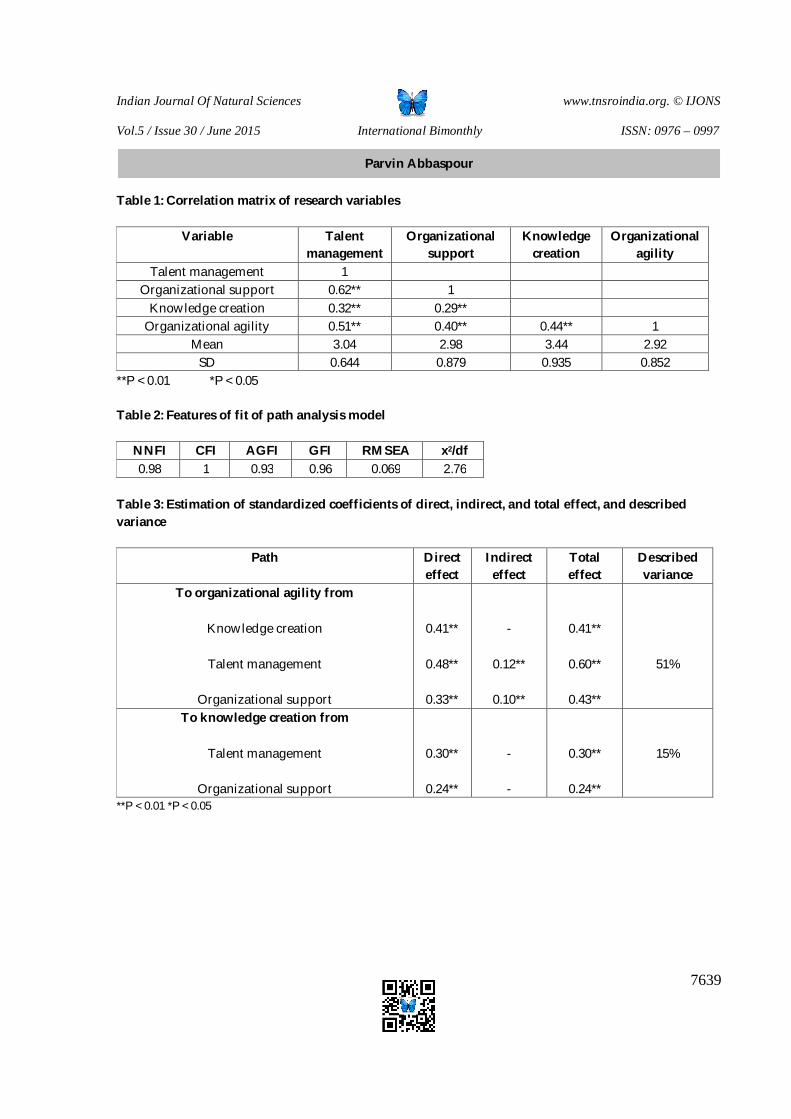
Indian Journal Of Natural Sciences www.tnsroindia.org. © IJONS
Vol.5 / Issue 30 / June 2015 International Bimonthly ISSN: 0976 – 0997
7639
Table 1: Correlation matrix of research variables
Variable Talent management
Organizational support
Knowledge creation
Organizational agility
Talent management 1 Organizational support 0.62** 1
Knowledge creation 0.32** 0.29** Organizational agility 0.51** 0.40** 0.44** 1
Mean 3.04 2.98 3.44 2.92 SD 0.644 0.879 0.935 0.852
**P < 0.01 *P < 0.05 Table 2: Features of fit of path analysis model
x2/df RMSEA GFI AGFI CFI NNFI 2.76 0.069 0.96 0.93 1 0.98
Table 3: Estimation of standardized coefficients of direct, indirect, and total effect, and described variance
Path Direct effect
Indirect effect
Total effect
Described variance
To organizational agility from
Knowledge creation
Talent management
Organizational support
0.41**
0.48**
0.33**
-
0.12**
0.10**
0.41**
0.60**
0.43**
51%
To knowledge creation from
Talent management
Organizational support
0.30**
0.24**
-
-
0.30**
0.24**
15%
**P < 0.01 *P < 0.05
Parvin Abbaspour
Indian Journal Of Natural Sciences www.tnsroindia.org. © IJONS
Vol.5 / Issue 30 / June 2015 International Bimonthly ISSN: 0976 – 0997
7640
Effects of Relationship Marketing Andcommunication Quality on Customer Loyalty in Saderat Bank MasoudReyhani and ToorajSadeghi* Department of Business Management, Neyshabur Branch, Islamic Azad University, Neyshabur, Iran.
Received: 22 Mar 2015 Revised: 21 Apr 2015 Accepted: 24 May 2015 *Address for correspondence ToorajSadeghi Department of Business Management, Neyshabur Branch, Islamic Azad University, Neyshabur, Iran.
This is an Open Access Journal / article distributed under the terms of the Creative Commons Attribution License (CC BY-NC-ND 3.0) which permits unrestricted use, distribution, and reproduction in any medium, provided the original work is properly cited. All rights reserved.
Now, the service sector has undergone changes that have not experienced before in its history. These changes have had a profound impact on industry structure and competitive nature. Not surprisingly, in this turbulent environment of accelerating change, organizations are forced to practice their response to market changes. The hypotheses are as follows: 1- The dimensions of relationship marketing (quality of service, staff competence, conflict management) BSI influence on customer loyalty. 2- The quality of communication (satisfaction, trust, commitment) BSI influence on customer loyalty.The study included all branches of the bank customer is Khorasan.Samples intended for the study, 196 samples, which is an acceptable value for the factor analysis. Data collection through a questionnaire. The results show that trust and commitment of the staff of the Bank's influence on customer loyalty. And the other variables and there is no significant relationship between customer loyalty. Key words: communications, customer loyalty, relationship marketing. . INTRODUCTION Requires that the nature of the banking industry in customer satisfaction and retain customers move because of its durability depends on its customers and whatever they can to keep their current customers, will be more successful.Development of private banksandthe spread of information and communications at international level, for the comparison of different banks in different partsof the worldthat putspeople. Today, companies in different industries with better performance moving to retain customers and attract them because most markets are located in maturation. The customer is the only source of profitable companies in the present and future but itis alwaysa good customer that creates greater benefit, It is possibleto lose because competition is fierce achievegood customer ( Doaei& et al, 2011).Now,the service sectorhasundergone changes that have not experiencedbeforein its history. These changes have had a profound impact on industry structure and competitive nature. No wonder that in this turbulent
RESEARCH ARTICLE
ABSTRACT
Indian Journal Of Natural Sciences www.tnsroindia.org. © IJONS
Vol.5 / Issue 30 / June 2015 International Bimonthly ISSN: 0976 – 0997
7641
environment of accelerating change,institutions and practices have been forced to react to market changes,so that fewer products and more focus on customer relations rather than short-term vision, to take the long view( Harker, 1999).On the other hand, continued to maintain and strengthen the relationship with the customer is the only way that one party service organizations in the use of defensive strategies to maintain and increase its current clients must pass through (Gary and Byun,2001). Intoday's businessmarket, attention to the relationship between service providers and customers. This concept has been enthusiasticallyaccepted by the academic and practitioners in the fieldis located. Terms of Communications both the practical and theoretical lacks a clear definition. Basically,are lationship may exist in theare as of application. Barnes states that when a relationship is created by the ongoing conflict, As a result of the purchase of service for at least two intervening factors, it is necessary to build a relationship. Hestates thatbefore arelationship, both sides must be a relationship of mutualunderstandingandrelationshipshouldbe determinedby the specificsituation. Communication set oftransactionsthatsharedknowledge ofthe relationshipof trustandcommitmentamongnumerous other variablesprovided. Customer Relationship Considered by many scholars and activists have been marketingIncreasedemphasis onrelationship marketingdue tothe assumption that committeed relationships with customersresulting incustomer satisfaction, customerreferences, trustandoralpropagandacustomers. Relationship marketing on trade marketing is dominant with the aim of establishing long-term relationships based on trust and mutual benefit relationship with our valued customers.(Halimi& et al, 2011)
THEORETICAL RESEARCH The superior performance of firms in different industries are moving to retain customers and attract their loyalty,because most of our markets are mature, competition is increasing and new customer acquisition costs are greatly increased.Customer retention and gain the loyalty of its considered vital for the continuation of the business. Meanwhile, the banking industry is not an exception. The bank also needs to improve its customer loyalty various management strategies are followed.The bank managers to avoid the tendency to find customers to competitors than any time in understanding customer needs and demands to better meet their needs and have established long-term business relationship with them. Therefore,any approach that isbetterable torealizetheseissueswillbeaddressedmore. Relationship marketing as a new approach to research and practice has proved to be one of the most successful approaches.The proof of relationship marketing has brought various benefits to organizations, the trend has caused an unprecedented this is the approach (Fariz Abdullah& et al,2013). Recent studies on this subject in the study of factors affecting the quality of the relationship with the customers have paid and suggest how each of these factors can create opportunities for managers to design and implement strategies that lead to relationship marketing is. Relationship quality is one of the factors leading to the success of the relationship. Most marketing research in this field, the importance of the relationship between the three dimensions of trust, satisfaction and commitment relationship have referred. CRM is one of the best ways to grow and progress, and the increase of service companies to account. In order to increase the subjective perception of the quality and level of customer loyalty and satisfaction of customer needs in the service sector, can be used to increase the benefits of customer relationship marketing activities used(keler,2008). Relationship marketing with its ability to build customer loyalty through a better understanding of customer needs and services in accordance with the requirements can be driven to reduce costs. Base of banking system,is customer and Most useful and the most appropriate strategy for banks,is Customer orientation. On the other hand, continued to maintain and strengthen the relationship with the customer only one way by which banks use a defensive strategy and maintain its current customers must go through.Nowadays,the traditional banks in accordance with the principles of relationship marketing on customer loyalty as the main target focused,customer oriented and have beenwork with customer-oriented strategy to achieve a competitive advantage. Banks can use relationship marketing
MasoudReyhani and ToorajSadeghi
Indian Journal Of Natural Sciences www.tnsroindia.org. © IJONS
Vol.5 / Issue 30 / June 2015 International Bimonthly ISSN: 0976 – 0997
7642
is understanding the desires and needs of our customers and long-term relationships with themCreate customer loyalty. Literature
Rauyruen& et al(2007)conducted the research as a result of communication quality on customer loyalty. They used the dimensions of trust, commitment, satisfaction and service quality to evaluate the quality of communication. The results show that maintaining customer loyalty to the company, the quality of communication (trust, commitment, satisfaction and quality of service) is a positive relationship.Fariz Abdullah & et al study, entitled Effects of relationship marketing and communication quality in customer loyalty did.They were used to evaluate the quality of communication of satisfaction, trust, commitment and were used to examine the relationship marketing aspects of service quality, staff competence, conflict management by the staff. The results show that there is a significant relationship between satisfaction, quality of service, conflict management and customer loyalty but there is no significant relationship between other variables and customer loyalty. Jesri& et al did a research on the impact of marketing communication on customer loyalty. The main objective of this study was to investigate the relationship between the components of relationship marketing and customer loyalty. Statistical population was all clients with state bank account. Sampling, simple random and 384 questionnaires were analyzed. Data were analyzed using correlation coefficient and regression was performed using SPSS software. The findings showed that there is a relationship between the components of relationship marketing, including trust, commitment, communication quality, and competence in customer loyalty. Hypothesis
1. Quality Servicesof Bank, impact on the bank's customer loyalty. 2. Staff competence of Bank in providing services, impact on the bank's customer loyalty. 3. Conflict management at Bank, impact on the bank's customer loyalty. 4. The satisfaction of the customers of Bank, impact on the bank's customer loyalty. 5. Build trust by Bank, impact on the bank's customer loyalty. 6. The Bank's commitment in providing services, impact on the bank's customer loyalty.
The population, Sampling Method and The sample size The populationof research areall of the people who are supposed to have extrapolated the findings of the survey. Basic units or elements of society that is supposed to be measured, Characteristics of the basic units or an element of society is called. The research population consists of all customers Branch of the Bank Saderat in KhorasanRazavi.Scientific research is done with the knowledge of a phenomenon in a statistical population. For this reason, the subject may understand the characteristics and features, functions and variables, or the relationship between variables, characters, action and reaction and its influencing factors in the population studied. Do any scientific researches is expensive and time consuming, For this reason, there is no possibility of complete population census. The researchers regard to such reality In trying to come through the sample, possible information by analyzing the obtained data, obtained on the sample and finally, by extension, the data are attributed to the original community. Thus, each city is a cluster of KhorasanRazavi statistically and accordingly, multistage cluster sampling is done, thus, the total number of existing city are identified and then select the number of the city then selected from each of the city Number of customers branches Are surveyed.According to the qualitative variables, the minimum sample size the population of the research mentioned in the spatial domain obtained from the following formula:
d
ppZn 2
)1(2
2
MasoudReyhani and ToorajSadeghi
Indian Journal Of Natural Sciences www.tnsroindia.org. © IJONS
Vol.5 / Issue 30 / June 2015 International Bimonthly ISSN: 0976 – 0997
7643
In this formula 2Z is The critical value of the normal table in the alpha(α)error that because the 95% confidence
intervals have considered, So
p: is the proportion of people who respond to the confirmation of the hypothesis that because no information is not available, put it equal to 0/5. D: accuracy or maximum extent error that in this research, we have placed it equal to 0/7. Accordingly, putting these values in the above formula is obtained sample volume 196 . In this research, The Confidence level 95 % is considered. Due to this topic The sample size is:
196)07/0(
)5/01(5/0)96/1(2
2
n
In all relationships for the sampling use The population Assuming normal No statistical population, A basic assumption. Analysis of the Data Method Data analysis is a multi-step process that during the data that is collected through the use of tools are provided in the sample , in short , coding , classification , and finally processed to Establish the types of analyzes and the relationship between these data to test the hypothesis provided.In the analysis, the important thing is that it seems the researcher must information and data on the course of research, answer questions and self- assessment questions and hypotheses ,direction and analyzed it.The data for this research, after logging in to the computer using suitable software,analyzed and the purpose of data analysis, reducing their and conversion understood and interpreted as a so that, researcher to examine the relationship between the research variables.To analyze the data collected in this research, both descriptive statistics and inferential statistical methods were used.First, using statistical methods to assess demographic variables such as gender, employment status, age, education level are paid. To analyze the data in this section, we use statistical software SPSS version 20 .Then to analyze the data in this study, the analytical level, we use the LISREL software. A graph of the test Statistic t, observed a significant correlation at the 5% error. In this diagram, the numbers of t-value statistics be replaced with factor loadings. If any of the values smaller than 1/96, it will be red and show the correlation observed in standard mode , not significant .In the research model just confirms relationship management and customer loyalty and significant. In other words, the test statistic is shown in the following diagram. The size of this number which can be determined the relationship between the each variables to what extent is significant. In other words, we can determine if we accept the relationship between two factors, how much will the error. Where more than 5% error is marked in red. Evaluation of hypotheses of research LISREL software used to investigate research questions. The software uses the correlation and covariance between the measured variables (exogenous variables), can be a factor loading values, variances and latent errors (endogenous variables) estimated or inferred, and it can be used for the several of the path analysis (causal modeling with latent
MasoudReyhani and ToorajSadeghi
Indian Journal Of Natural Sciences www.tnsroindia.org. © IJONS
Vol.5 / Issue 30 / June 2015 International Bimonthly ISSN: 0976 – 0997
7644
variables) used.In this section deal with the Evaluate hypotheses and test each of them. In this section dealt with the Evaluate hypotheses and test each of them. As well, Path coefficient test or The estimated parameters are also included. The test statistic, t-student who, according to the hypothesis test (null hypothesis) can be rejected or accepted. If the absolute value of the t-statistic is greater than the number 1/96, test the null hypothesis is rejected in error 0.05. The first hypothesis testing First research hypothesis is as follows: "Quality Services of Bank, impact on the bank's customer loyalty." In other words, statistically, we have: H0: Quality Services of Bank, impact on the bank's customer loyalty. H1: Quality Services of Bank,no impact on the bank's customer loyalty. Based on the information given in the diagram t- value, hypothesis (1) has been investigated. Relation between the latent variables of service quality with customer loyalty is obtained -0.59 that relatively strong correlation.The t-statistic is obtained -0.74 that shows no significant correlation was observed.This number is displayed in red. So this hypothesis is not acceptable. The second hypothesis testing Second research hypothesis is as follows: "Staff competence of Bank in providing services, impact on the bank's customer loyalty." In other words, statistically, we have: H0: staff competence of Bank in providing services, impact on the bank's customer loyalty. H1: staff competence of Bank in providing services, no impact on the bank's customer loyalty. Based on the information given in the diagram t- value, hypothesis (2) has been investigated. Relation between the latent variables of staff competence of Bank with customer loyalty is obtained 0.89 that relatively strong correlation. The t-statistic is obtained 0.39 that shows no significant correlation was observed Due to being smaller than 1.96. This number is displayed in red. So this hypothesis is not acceptable. The third hypothesis testing Third research hypothesis is as follows: "Conflict management at Bank, impact on the bank's customer loyalty." In other words, statistically, we have: H0: conflict management at Bank, impact on the bank's customer loyalty. H1: conflict management at Bank, no impact on the bank's customer loyalty. Based on the information given in the diagram t- value, hypothesis (3) has been investigated. Relation between the latent variables of conflict management at Bank with customer loyalty is obtained 0.75 that relatively strong correlation. The t-statistic is obtained 0.74 that shows no significant correlation was observed Due to being smaller than 1.96. This number is displayed in red. So this hypothesis is not acceptable. The fourth hypothesis testing Fourth research hypothesis is as follows: "The satisfaction of the clients of Bank, impact on the bank's customer loyalty." In other words, statistically, we have: H0: The satisfaction of the customers of Bank, impact on the bank's customer loyalty. H1: The satisfaction of the customers of Bank, no impact on the bank's customer loyalty. Based on the information given in the diagram t- value, hypothesis (4) has been investigated. Relation between the latent variables of Satisfaction of Bank with customer loyalty is obtained 0.2 that relatively trivial correlation. The t-statistic is obtained 0.75 that shows no significant correlation was observed Due to being smaller than 1.96. This number is displayed in red. So this hypothesis is not acceptable.
MasoudReyhani and ToorajSadeghi
Indian Journal Of Natural Sciences www.tnsroindia.org. © IJONS
Vol.5 / Issue 30 / June 2015 International Bimonthly ISSN: 0976 – 0997
7645
The fifth hypothesis testing fifth research hypothesis is as follows: "Build trust by Bank, impact on the bank's customer loyalty." In other words, statistically, we have: H0: Build trust by Bank, impact on the bank's customer loyalty. H1: Build trust by Bank, no impact on the bank's customer loyalty. Based on the information given in the diagram t- value, hypothesis (5) has been investigated. Relation between the latent variables of Building Trust By bank with customer loyalty is obtained 0.62 that relatively strong correlation. The t-statistic is obtained 2.03 that shows significant correlation was observedDue to being larger than 1.96. This number is displayed in red. So this hypothesis is acceptable. The sixth hypothesis testing Sixth research hypothesis is as follows: “The Bank's commitment in providing services, impact on the bank's customer loyalty." In other words, statistically, we have: H0: the Bank's commitment in providing services, impact on the bank's customer loyalty. H1: the Bank's commitment in providing services, no impact on the bank's customer loyalty. Based on the information given in the diagram t- value, hypothesis (6) has been investigated. Relation between the latent variables of the Bank's commitment in providing services with customer loyalty is obtained 0.89 that relatively strong correlation. The t-statistic is obtained 1.99 that shows significant correlation was observed Due to being larger than 1.96. This number is displayed in red. So this hypothesis is acceptable.
DISCUSSION AND CONCLUSION Today, companies have found that factors of production, marketing, sales and product quality have their own importance and like a mountain range and the customer’s needsPlaced at the top of the mountain and circumstances of the relationship and communication studies are very important. Security services and direct contact centers require frequent interaction with customers and customer service representatives the centers need to offer a variety of after-sales services according to customer demands and also tend to create interconnected relationship marketing and customer relationship in order to achieve customer loyalty and identify customer needs and enhance the quality of services. One of the reasons given to loyal customers, profitability and reduce marketing costs. Therefore, companies are looking for information which would make customers loyal to the organization.One of these cases, the influence of the organization to better understand customer needs and provide satisfactory products and services to them. After the formulation of hypotheses, and set the operating parameters to test them, taking advantage of previous theoretical and research variables were determined to test the hypothesis. After determining variable, efforts will continue to search for ways to conduct research. Using the right tools, the data needed to test the hypothesis, collect, classify and analyze the collected data and the assumption of 195 bank customers were tested. Structural equation modeling was used to examine the hypotheses above. Summary results of hypotheses testing, is presented below: The first hypothesis test results: Service quality on customer loyalty affects banks.After confirmation of the primary needs to be interpreted. The model estimated that the first hypothesis is rejected and one can say with 95%confidence between service quality and customer loyalty there was no bank Khorasan. Considering that the findings indicate that there is a significant relationship between service quality and customer loyalty and considering the quality of the research aspect of reliability in service, dedicated service, offering a professional service, fast service, facility services, the appearance and behavior of employees, customers, employees expressed interest in the study; therefore, it is suggested that due to the needs and demands of customers will change over time, therefore, managers should regularly conduct surveys to measure customer loyalty. Managers should also look at the consistency of the staff so that customers of all employees in their effort to look decent. The unit is required to review and research on new
MasoudReyhani and ToorajSadeghi
Indian Journal Of Natural Sciences www.tnsroindia.org. © IJONS
Vol.5 / Issue 30 / June 2015 International Bimonthly ISSN: 0976 – 0997
7646
services that increase the diversity of banking and bank-specific aspects of it can be formed. Finally, it is suggested, director of communications for staff training to work with all customers alike. Test results of the second hypothesis: The competence of employees in the service of the bank's customer loyalty is effective. After confirmation of the primary needs to be interpreted. The estimated model showed that there was no merit employee and customer loyalty. There is research that has been done in this area. Based on customer feedback indicated that customers encounter bank employees and bank employees flexibility in dealing with customers are not happy. This is a decrease of staff competence in serving the clients stated. In this regard, the bank can increase the number of hours the employee to reduce mental tension resulting in increased staff morale and openness in dealing with its clients. Test results of the third hypothesis: The bank has an impact on customer loyalty and conflict management. After confirmation of the primary needs to be interpreted. The estimated model show that conflict management and thus have a significant impact on customer loyalty third hypothesis is rejected. The fourth hypothesis test results: The satisfaction of the Bank's influence on customer loyalty.After confirmation of the primary needs to be interpreted. The estimated model showed that no significant effect of satisfaction on customer loyalty. The fourth hypothesis is rejected. Another problem identified is how the bank to customer satisfaction. And lack of attention to the cause of the negative attitude of goods and services and may also response operations, such as negative word of mouth advertising, stop buying goods and services from their work. Each of these reactions alone can cause great damage to the firm and its reputation. As a result of the bank's failure and poor performance leads to customer dissatisfaction, transfer their experience to others and ultimately the loss of negative publicity about the bank and the customer. The fifth hypothesis test results: Confidence building customer loyalty is affecting the bank. After confirmation of the primary needs to be interpreted. The model estimated that the trust has a significant impact on customer loyalty. The fifth hypothesis is confirmed. The sixthhypothesistest results: the commitment of the bank is effective in providing customer loyalty. After confirmation of the primary needs to be interpreted. The model estimated that the commitment is therefore a significant impact on customer loyalty sixth hypothesis is confirmed.
REFERENCES
1. Doaei, H., Rezaei, A., Khajei, R. (2011). The Impact of Relationship Marketing Tactics on Customer Loyalty: The Mediation Role of Relationship Quality. International Journal of Business Administration, 2.
2. Gary, P. and Byun, J. (2001). "Customer relationship management", University of California, 1-57. 3. Fruchter, G., E . , Sigué,S. P.(2005), « Transactions vs. Relationships: What should thecompany emphasize? »,
Journal of Service Research, 8: 18-36. 4. Harker, M.J. (1999), "Relationship marketing defined? An examination of current relationship marketing
definitions", Marketing Intelligence and Planning, 1: 13-20. 5. Halimi, A. B., Chavosh, A., Choshali, S. H. (2011). The Influence of Relationship Marketing Tactics on
Customer’s Loyalty in B2C Relationship – the Role of Communication and Personalization. European Journal of Economics, Finance and Administrative Sciences, 31: 50-56.
6. Keller, K.L.(2008). Conceptualizing, Measuring, and ManagingCustomer-Based Brand Equity", Journal of Marketing, 1: 1-22.
7. Rauyruen, P. Miller, K.Barrett,N.(2007).Relationship Quality as a Predictor of B2B Customer loyalty.
MasoudReyhani and ToorajSadeghi
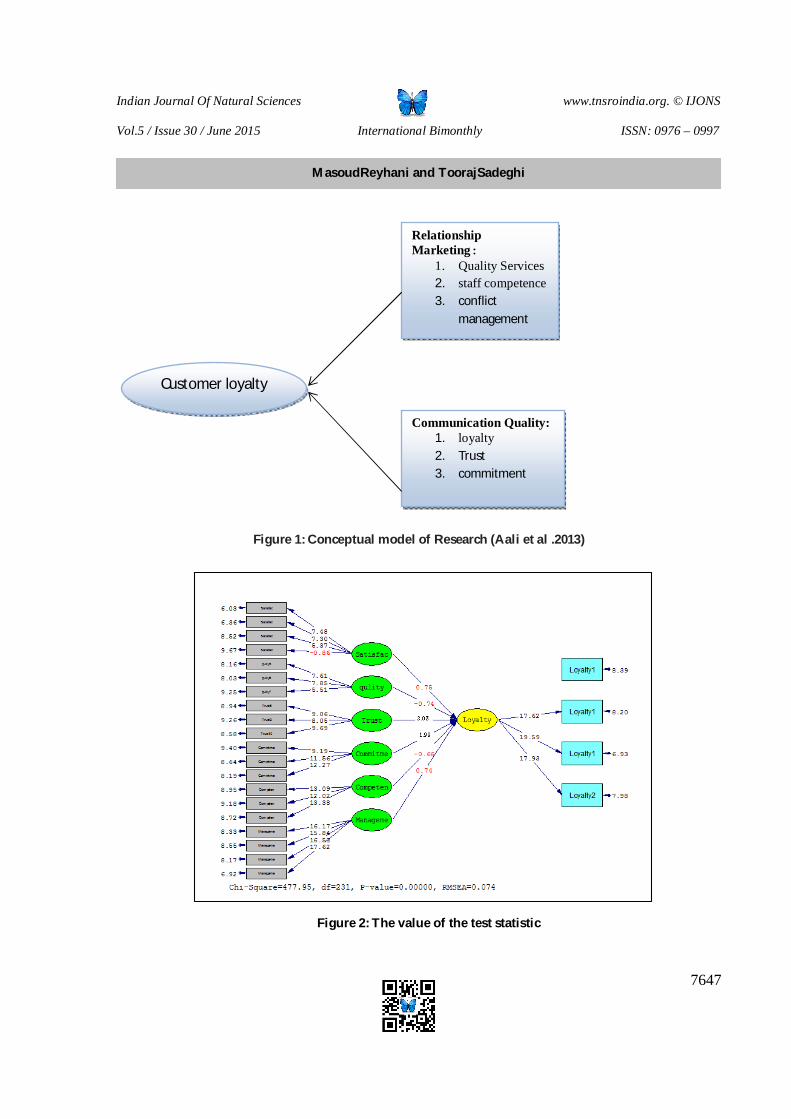
Indian Journal Of Natural Sciences www.tnsroindia.org. © IJONS
Vol.5 / Issue 30 / June 2015 International Bimonthly ISSN: 0976 – 0997
7647
Figure 1: Conceptual model of Research (Aali et al .2013)
Figure 2: The value of the test statistic
MasoudReyhani and ToorajSadeghi
Customer loyalty
Relationship Marketing:
1. Quality Services 2. staff competence 3. conflict
management
Communication Quality: 1. loyalty 2. Trust 3. commitment
Indian Journal Of Natural Sciences www.tnsroindia.org. © IJONS
Vol.5 / Issue 30 / June 2015 International Bimonthly ISSN: 0976 – 0997
7648
Death in Abu-Nuas's Poems Kowsar Bidad and Ardashir Sadraddini* Department of Arabian Language and Literature, Mahabad Branch, Islamic Azad University, Mahabad, Iran.
Received: 21 Mar 2015 Revised: 18 Apr 2015 Accepted: 26 May 2015 *Address for correspondence Ardashir Sadraddini Department of Arabian language and literature, Mahabad branch, Islamic Azad University, Mahabad, Iran. E.Mail:[email protected]
This is an Open Access Journal / article distributed under the terms of the Creative Commons Attribution License (CC BY-NC-ND 3.0) which permits unrestricted use, distribution, and reproduction in any medium, provided the original work is properly cited. All rights reserved.
Death of the loved ones and the consequent sorrow of their death have affected the minds of many of Arabian poets and have caused them to talk about volatility of the world and certainty of death and extinction of beings. Abu-Nuas is one of the famous Arabian poets who have rhymed several different subjects; one of the most frequently used subjects in Abu-nuas's poems is the description of hardships of the life and the elegy for death of friends and monarchs. In these elegies, in addition to mourning for the deceased, he tries to mention the deceased's good traits and behaviors and unlike his real personality which usually tends to talk about drinking and having fun and playing, he emerges like a scholar who tries to reveal the frightening and dominant face of death. In this research, in addition to introducing the view of Abu-nuas regarding death it will be explained that poems of him which contain subjects of death are mostly under the influence of Arabian poets during the era of ignorance and the purpose of the poet by writing these poems was to manifest his poetic capability. Keywords: Abu-nuas, death, poem, Abbasid era. INTRODUCTION Death is one of the most complicated subjects which have occupied the minds of human. By inheritance, human tends to know the nature of death and its manner of occurrence for beings. Although that from the beginning of the time human has continuously tried to perceive the concept of death and has even tried to identify ways to avoid it and prophets, scholars and philosophers have each answered these questions in a way; but still death is an unopened secret and a mystery to man. In Arabian literature, every poet has tried to describe death based on his or her thoughts and special methods.
RESEARCH ARTICLE
ABSTRACT
Indian Journal Of Natural Sciences www.tnsroindia.org. © IJONS
Vol.5 / Issue 30 / June 2015 International Bimonthly ISSN: 0976 – 0997
7649
Arabian poets have stated their views towards death from the age of ignorance till the present time; most of their works include the subject of sorrow for the death of their loved ones and at the end of the poems they have becalmed themselves by reminding themselves that death comes to everyone and that it’s a certain event.After the emergence of Islam and descent of holy Quran, poets' views towards death and life became majorly under the influence of holy Quran.Although that Islam had invited the believers to accept death as a certain event and although that Islam had becalmed the righteous people regarding the issue that the world is a passage to the eternity and the eternity is the place for eternal calamity, but the spread of philosophy during the Abbasid era caused the Arabian poets to take effects from different and paradoxical views regarding the destiny of the soul after the death of the body. Although in harsh and critical situations he used to refer to Quran in order to find the truth about death in order to calm his worried self (Hamood, 1996: 292). Statement of problem The concept of death in artistic, philosophic and literary works of all scholars, poets and writers of every nation is the same and every person based on his or her personal perspective has a special perception of it. Many Arabian poets have discussed their perspective towards the manner of death and its other aspects alongside with other concepts such as elegy, praise, description and odes.Abu-nuas is considered as a great Arabian poet during the Abbasid era that was under the focus of several critics and after his death, many story books and legends have mentioned him; most of Abu-nuas's poetic popularity is regarding alcoholic beverages. From the poems of this great poet it can be realized that he was a person who did not hold any values for his era's religious beliefs. Like many other Arabian poets, he has also expressed his view towards death especially in his elegies. This research tries to investigate the concept of death from the perspective of Abu-nuas. Necessity of research Since Abu-nuas was Iranian-born and is famous in Arabian literature and that there are no previous researches regarding death in his view, therefore the main purpose of this research was set as investigating his view towards death. Research goals The goals of this research regarding the subject matter are as follows: Finding poems of Abu-nuas which express his view towards death Determining Abu-nuas's view towards death with respect to his poems Research questions To what extend did death and thinking about its dimensions occupy Abu-nuas's mind? What is Abu-nuas's perspective towards death and what schools and people does he follow in terms of his view towards death? Research history There are several researches regarding death from the perspective of holy Quran or some Arabian poets; but there are no previous researches regarding Abu-nuas's point of view and therefore, the present research is a fresh study.
Kowsar Bidad and Ardashir Sadraddini
Indian Journal Of Natural Sciences www.tnsroindia.org. © IJONS
Vol.5 / Issue 30 / June 2015 International Bimonthly ISSN: 0976 – 0997
7650
Death in Abu-nuas's poems Literally death means the voidance of animalistic strength and instinctive passion, the extinction of life and deletion of being and death or leaving the world and is opposite to life and livening (Dehkhoda, 1956). Also Ibn-Manzoor has defined it as anti-life in his book of Lesan-alarab.With respect to these definitions, it can be said that death means the end of worldly life and the freedom of soul from body and loss of body strength and apprehension of any kind of movement from the body. Abu-nuas's history Abu-nuas is a great Arabian poet and was born in 140 AH in Ahwaz. He lost his father during his childhood and his mother had left him with a druggist so that he could enter the work market in Basra. In his young hood he learned different sciences from great scholars and at the time of Aaron-Rashid when he was thirty years old, came to Bagdad and started his life with companionship of Emirs of Abbasid reign (Forookh, 1997: 158-159). In this era, Abu-nuas became the private poet of Aaron and got close to him. He liked Rashid and used to take tips from him until he turned to lavishing in luxury and drinking and Rashid's generosity was no longer able to satisfy him, therefore he went to Egypt and eulogized Khasib the ruler of Egypt at that time.it is obvious that Khasib was satisfied and happy with eulogies of this poet and that he had saved the poet from his misery with his gifts. But Egypt could not take the place of Bagdad and Khasib's gifts couldn’t also satisfy the poet's lavishness. For this reason he returned to Bagdad and titled Khasib as a tight fisted man (Albastani, 1997: 63). After returning to Bagdad and death of Aaron-Rashid, Abu-nuas found his way to Amin's court. These days were the finest days of his life. Whatever he desired, he could have and since he his friendship with the new Caliph had a history, he was never bothered for writing a poem regarding him. He used to write whatever he could think of him in terms of eulogy (Fakhari, 2000: 300). When he realized his sins and wrong doings when he became old, he returned to his God and asked for his forgiveness with expressing his regrets (Forookh, 1988: 198). Abu-nuas was deceased in 195 AH or 199 AH (Zeif, 1960: 158). Among western poets and researchers, Abu-nuas holds a special place for himself and as Ibn-Khalkan quotes Mamoon: even if the world itself had tried to describe itself, it couldn’t have done it better than Abu-nuas (Ibn-Khalkan, 1986: 97-2).Also Jahez considers him as the wisest person in terms of vocabulary. Ibn-Manzoor states: concepts were buried under the ground until Abu-nuas came and extracted these concepts like treasures. Asceticism of Abu-nuas When Abu-nuas got old and most of his strength had been washed away and he had no longer the ability to attend his parties, he gave up drinking and turned to asceticism and also wrote some odes in this regard. In these odes, he has beautifully expressed his feelings and has described the humility and servility which he had felt during his last moments (Abu-nuas, 1987: 457).These odes are known as the asceticism of Abu-nuas and have shown his poetic strength well in a way that Abu-nuas has overtaken many other Ascetics of his time in terms of asceticism and even some of his ascetic poems have been used as expressions and idioms by people (Abu-nuas: 1987: 501).The major part of Abu-nuas's ascetic poems is about the volatility of the world and mortality of life and the inevitable death of every being. In these odes, he expresses his views towards death with a wise perspective and discusses issues such as the incapability of beings towards fate and lack of worth of hope in this world. In these poems, he uses his personal experiences and his wisdom and thoughts to unveil the concept of death and reveal its truth.
Kowsar Bidad and Ardashir Sadraddini

Indian Journal Of Natural Sciences www.tnsroindia.org. © IJONS
Vol.5 / Issue 30 / June 2015 International Bimonthly ISSN: 0976 – 0997
7651
Death from the point of view of Abu-nuas In the book of Alresa, Dr. Shoghi Zeif has divided eulogy into three parts of delegation, eulogy and attribute and in description of attribute he states: in terms of thinking, attribute is held higher than eulogy. In this type of eulogy, the poet is faced with thinking about the reality of life and death and sometimes this type of thinking even leads to deep philosophical concepts and is sometimes after answering the philosophy of existence or lack of existence of immortality. (Zeif, 1955: 6)With respect to this definition provided by Shoghi Zeif, it can be said that in Abu-nuas's poems, the used type of eulogy is attribute. In his eulogies, Abu-nuas does not suffice with mere mourning for the dead and instead, elaborates on human life's main issues such as death and life with a philosophical view and expresses the opposition of concepts such as immortality and mortality with sadness and unconsciously gives advices about the certainty of death and the volatility of the world. While discussing the subject of death in Abu-nuas's poems, different aspects of life include: Certainty of death Death is an inevitable fact which will be faced with by everyone and it can be said that the most certain fact which exists in the world, is the death and destruction. Regarding this concept, the following verse is brought by holy Quran: every being will taste death. In the following poems Abu-nuas considers death as an :(Al-Omran, 185) کل نفس ذائقةالموتinevitable and certain fact:
لا تبعدن أبا أسا -1
مة؛ فالمنیة واجبھ
کل امریء تغتالھ -2
منھا سھام صائبھ
کتب الفناء علی العبا -3
د فکل نفس ذاھبھ
You Abu-same, I wish you didn’t have to die but death is certain Every human will be killed by accurate arrows of death Destruction is inevitable for every being and every life fades Death is not specific to a special kind of beings and every alive being, whether strong or weak will die. In the following lines, Abu-nuas talks about dominance of death on every capable and incapable being:
لما رأیت المنون آخذة
كل شدید وكل ذي ضعف
Death of the deceased families and lack of world's friendship with them can be a strong evidence of death of every being and volatility of the world.
دھر کلھفیا آملا أن یخلد ال -1
سل الدھر عن عاد و عن أختھا إرم
یخبرک أن الحین رسم مؤبد -2
و لن یعدل الرسم القدیم الذي رسم
You wishful person who think the world is immortal, ask me about the tribe of Aad and other tribes just alike.They will inform you that death is an immortal role and will never return from its ancient way.
Kowsar Bidad and Ardashir Sadraddini

Indian Journal Of Natural Sciences www.tnsroindia.org. © IJONS
Vol.5 / Issue 30 / June 2015 International Bimonthly ISSN: 0976 – 0997
7652
Contrast of life and death Death is in contrast with life and every alive being instinctively tries for continuity of its life. Also in Abu-nuas's poems, death is contrasted by life and if there is no death, there can be no concept imagined for life. In his view people are divided into two groups regarding death: some people are happy for being alive and some others are sad for that death comes anyway.
الناس ما بین مسرور ومحزون
و ذي سقام بکف الموت، مرھون
There are two groups of people: happy and sad, and the sad people are captivated by death. (Abu-nuas, 2010: 438) In this poem he feels sorry for his cheerful youth and becoming old:
إن الذي رد الشباب کھولا
لا آملا أبقی، و لا مأمولا
(438) In fact the person who gets old does not remain wishful and no one puts his hope in him: Also in some of the poems he thinks life is being drunk all the time:
ھي الخمر: أال فاسقني خمرا، و قل لي -1 فما العیش إلا سکرة بعد سکرة -2
و لآ تسقني سرا إذا أمکن الجھر فإن طال ھذا عنده قصر الدھر
(202) 1- Give me wine and tell me: this is wine. When you did it in public, then do not bring me wine in secret. 2- Life is not anything else but being drunk all the time. If this drunkenness remains all the time, then the drunkard is the most prosperous of all. Although in some other poems he regards life as being worthless, because of death:
رأیت طویل العمر مثل قصیره -1
فإذا کان مفضاه إلی غایة، تؤم
و ما طول عمر لا أبا لک ینقضي - 2
و ما خیر عیش قصر وجدانھ العدم
(Abu-nuas, 2010: 447) 1-A short lived and a long-lived person are both the same to me (a short life and a long life are the same in this world) when their times come, it is terminated anyway. 2-Father! What is the use of a long life which passes? What is the good thing about a life which its end is nothingness? -Personal experience of death In Abbasi reign some poets used to write elegies for themselves when they felt that death was approaching and describe thing that would happen to them when they die. (Shoqi, Zeif, 2002: 202)
Kowsar Bidad and Ardashir Sadraddini

Indian Journal Of Natural Sciences www.tnsroindia.org. © IJONS
Vol.5 / Issue 30 / June 2015 International Bimonthly ISSN: 0976 – 0997
7653
The innovative aspect Abu-nuas’ work about death is to describe his own experience of death and his gradual death. It shows that death is so important to him. After becoming old and being near to death he writes in a poem:
دب في الفناء سفلا و علوا -1
عضوا فعضوا و أراني أموت
لیس من ساعة مضت لي إلا -2
نقصتني بمرھا بي جزوا
(436) 1-Death penetrated in my upper body and lower body, I see myself as I die little by little. 2-every minute that pass, I see one part of my body being abated. It can be said that Abu-nuas has written both about the external aspect of death and devouring creatures and the internal aspect of death which is the mental aspect and its presence in the mind. The poets’ writings about the internal aspect of death inspire the importance of death in the readers’ minds indirectly:
یموت منی کل یوم شي -
والجسم منی ثابت و حي
(436) -Each day one part of my body dies, although my whole body seems to be alive. Offering an Ugly and Fearsome Picture of Death Humans have an innate and natural tendency toward immortality and runs away from destruction and death. As death destroys the connection between humans and this world, it is regarded as a fearsome thing. Reasons like love of life, not achieving the wishes and goals, the fear of the way we die are the main reasons why we are afraid of death.Abu-nuas’ natural reaction toward death is a fearful and direful reaction like most other people. This is because death is an unknown phenomenon in his mind; because the human’s reaction toward an unknown phenomenon toward death is fear and terror. No one can escape from death and he believes anyone who runs away from death, will face it in his very escape. For showing the fearsome face of death, he offers a real picture using a sensual comparison. He pictures death as a vampire who devours all the people.
و المنـــایــا آكـــلات
شــاربـات لألنــــام
(508) -Deaths are the eaters and the drinkers of the people. In the following poem he likened death to a wild animal that has attacked Abulbaida, the poet’s narrator, and has torn him in pieces.
زار الحمام أبا البیداء مخترما
و لم یغادر لھ في الناس مطراقا
(432) -Death met Abulbaida and it torn him in pieces and left no one like him among people.
Kowsar Bidad and Ardashir Sadraddini

Indian Journal Of Natural Sciences www.tnsroindia.org. © IJONS
Vol.5 / Issue 30 / June 2015 International Bimonthly ISSN: 0976 – 0997
7654
Also in the following poem he regards death as a crafty archer who throws his arrow at everyone and no one can escape from it:
ألقاه مشتعب النفوس برمیة
لملقف الکفین أو محبولا
(439) The separator of lives has thrown his arrow at a fast and imprisoned person. These ideas of death and descriptions makes one believe it at the first glance that he knows death as the end of everything and it causes a kind of nothingness. Human Beings and Other Creatures’ Weakness and Complete Resignation Confronting Death In Abu-nuas’ poems the human beings and all the other creatures’ endeavor is to escape from death and not to lose life. Death is always ambushing*humans and it can attack them any moment and capture them. Any human or alive creature who tries to fight death, will fail. In Abu-nuas’ idea death will d=find all the creatures whether they are on earth, in the sky or in the sea.
و کم ساور العقبان في الجو صرفھ -1
و کم خاوص الحیتان في زاخر الحوم
و کم نھش الحیات في ھضباتھا -2
رس األسدالخوادر في األجموکم ف
و کم أدرک الوحش التي لج نقرھا -3
یغور لھا طورا، و یطلع األکم
1-And the happenings of the time, there were so many eagles which death attacked them in the sky and there were so many sharks which death sank them in the depth of sea. 2-And there were so many snakes that death stank them in their hills (their nests) and so many canebrake lions which were attacked in the grove. 3-And there were so many wild animals which death sheltered them in its nest and these animals will go down to the low floor or they will go up to the hills. Thinking of remedies and taking shelter in high and impassable places will not keep the people away from death.
و لیس بناج ملحوادث والردی
شواھق أطواد الجبال ولا ألأکم
(446) The peak of high mountains and hills will not help people escape death. Describing Animals’ Death About describing death, Abu-nuas writes about the animals’ death which has resided in the peaks of mountains. And their being surrendered by death seems impossible because of the long distance and the difficulty. In his poems, describing the deaths of deer, fish and eagle are seen in abundance.
Kowsar Bidad and Ardashir Sadraddini

Indian Journal Of Natural Sciences www.tnsroindia.org. © IJONS
Vol.5 / Issue 30 / June 2015 International Bimonthly ISSN: 0976 – 0997
7655
ئ حتفھ عفر بشاھقةھل مخط -1
رعى بأخیافھا شثا و طباقا
مسور من حباء اللھ أسورة -2
یركبن منھا وظیف القین و الساقا
أو لقوة أم انھیمین في لجف -3
آماقاشبیھتیھا شفا خطم و
(Abu-nuas, 2010: 431) 1-Does a deer which eats walnuts and tebaq in the upper parts of the mountains stay safe from death? (Or death let go of it). (Death will find the animals that have taken shelter in the high mountains and will devour them) 2-By God’s generosity, some bracelets are put around their elbows, hands and legs. (Survivor! Do not act impatiently, because death will find all of the people). 3- Or the female eagle that is the mother to two eaglets in a pathway which looks like the corner side of the eagle’s beak and eye. (Death will even find the eagle that resides on a high mountain which is out of the reach of humans). Repentence at the Time of Death Most of the Abu-nuas’ poems have this theme that death is only the destruction of the people’s bodies and the poet does not talk about the soul’s fate when it is separated from the body; it is because his point of view about death is not only about human beings and all of the creatures are included. It seems that in such poems he is a body-oriented philosopher who only cares about body and the apparent shape and does not care about soul and spirit. Considering these poems of Abu-nuas, it can be said that he believes the by creatures’ death their souls will be destroyed like their bodies and the creatures that has tasted death will be destroyed completely.Although in some of the poems he writes about his faith about the life after death and the penalty of the judgment day and asks for God’s forgiveness for his sins:
یاء حیا و أکثريأراني مع األح -1
تخرمھ الدھر علی الدھر میت قد
فما لم یمت مني بما مات ناھض -2
فبعضي لبعضي دون قبر البلی قبر
فیا رب قد أحسنت عودا و بدأة -3
إحسانک الشکرإلي فلم ینھض ب
فمن کان ذا عذر لدیک وحجة -4
فعذري إقراري بأن لیس لي عذر
(Abu-nuas, 2010: 436) 1-I see myself alive among the livings and most of the men are dead as time has destroyed them. 2-any part of my body which is not dead is established with the dead parts. A part of my body is a grave for the other part (I am not dead and not buried in a real grave, but a part of my body is my grave, and because my organs are dead I cannot do anything). 3- God! Indeed you have shown me benefaction in the beginning and at the end, but I have not appreciated you (appreciation is not enough to compensate your forgiveness and God cannot be appreciated in language). 4-If anyone brings you any excuse; my excuse is declaring that I have no excuse.
Kowsar Bidad and Ardashir Sadraddini
Indian Journal Of Natural Sciences www.tnsroindia.org. © IJONS
Vol.5 / Issue 30 / June 2015 International Bimonthly ISSN: 0976 – 0997
7656
Although the Great God says in the Nesa verse:
.﴾18والالذین یموتون﴿النساء،ولیست التوبةللذین یعملون السیئات حتی إذاحضرأحدھم الموت قال إني تبت الآن The people who repent when their deaths approach and say: “I repent now” is not accepted.But Abu-nuas repents when the time of his death comes and after that complete preparation for the time of death and the other world is recommended in his poems. In the following poem he deems repenting and defecting sins, before the time passes, necessary:
یا نفس توبي قبل أن
لا تستطیعي أن تتوبي
-Conscience! Repent before the time you are not able to do it anymore. (Abu-nuas: 2010: 74) It seems that this group of Abu-nuas’ poems was written when he was old. After becoming old, he has blended the certainty and inevitability of death and recommending goodwill with the flavor of some philosophies about life in his poems. CONCLUSION In the poems of many Arab poets the theme of death is present with the other current themes like eulogy, description, sonnet and especially odes and most of the poets have discussed their ideas about the quality of death and its other aspects.Abu-nuas has declared his idea about death alongside other themes and goals. In most of his poems he tries to declare that death is only the destruction of humans’ bodies and shapes and he does not talk about the fate of soul after death; it is because his point of view about death is not only about human beings and all of the creatures are included. It seems that in such poems he is a body-oriented philosopher who only cares about body and the apparent shape and does not care about soul and spirit.Considering these poems of Abu-nuas, it can be said that he believes the by creatures’ death their souls will be destroyed like their bodies and the creatures that has tasted death will be destroyed completely. From this aspect Abu-nuas’ poems are like the poets of the Pre-Islamic period and devoid of any Islamic visions, he imagines death as something fearful and dreadful and pictures an ugly and direful face for it. It seems that his purpose in writing these poems is to show his art of poetry and his artistic penchant to other poets. Although in some of the poems he writes about his faith about the life after death and the penalty of the judgment day and asks for God’s forgiveness for his sins. REFERENCES
1. Holy Quran. 2. Ahmad ibn Muhammad Ibn Khallikan: mortality Alayan, R Ehsan Abbas, C 2, Qom, Leaflets Alrzy Sharif.
1364.sh. 3. Ibn order, Mohammad holy: Arab language, C 3, Beirut, Darsadr, 1414 BC. 4. Ibn order: rare blue Nvas news, research, Albqay Joseph, Beirut, Institute Alalmy Llmtbvat, 2003.m. 5. Abu Hassan al-Hani: Diwan, Ahmed Abdul Majid al-Ghazali Hqqh and Shrhh, Beirut, Daralktab Arabi, 2010.m. 6. Abu Hasan ibn Hani: Diwan, description Alhavy Elijah, Beirut, Alshrkh universal Llktab, 1987.m. 7. Abu Hassan al-Hani: Diwan, Hqqh Ali Favr, Beirut: Daralktab Arabi, 1987.m. 8. Hassan bin Thabit Al-Ansari 8: Court, R: Abdullah document, Daralktab Almrfh, Beirut, and 2006.m. 9. Albstany Btrs: Arab Adba’ per Alasr Albasyh, Beirut, had like Abboud, 1997 AD. 10. Trjany born Ahmed description ferocious pendants, suspension Jalil praised Iran Soroush, 1382.sh.
Kowsar Bidad and Ardashir Sadraddini

Indian Journal Of Natural Sciences www.tnsroindia.org. © IJONS
Vol.5 / Issue 30 / June 2015 International Bimonthly ISSN: 0976 – 0997
7657
11. Hamoud Mohammed: Alhdash per Almasr expression and manifestation Hair-Arabi, Beirut, Alshrkh universal Llktab, 1996.m.
12. Dehkhoda AA: dictionaries, Tehran, Tehran University, 1334.sh. 13. Alzbyany, Alnabghh Court, Beirut, Daralfkralrby, 1996.m. 14. Shoghi Zyf: Painter and Mzahbh Fi Hair Arabi, over 10, Alqahrh, Daralmarf, 1960.m. 15. Shoghi Zyf: Alrsa’, Floor 4, Alqahrh, Daralmarf, 1955.m. 16. Shoghi Zyf, ignorant literary history, translation Lyrzazkavty Gharagozlou, no 3, Tehran, Amir Kabir, 1381.sh. 17. Lbyd al-Amri bin Rbyh: Court of doctor Ehsan Abbas, i 2, Kuwait, the Kuwait government Mtbh 1984 AD. 18. Fakhvry Hana: History of Arabic Literature, vol. 4, Tehran, birch, 1378.sh. 19. Sold-life: the poet Abu Harun and Mohammad Amin, Beirut, Daralktab Arabi, 1988.m. 20. Sold life history of Adab Al-Arabi, Beirut, Dar al Llmlayyn, 1969.m. 21. Village Haji Ghasemi 21. L: life and death in the poetry of Arabic encyclopedia Journal, Volume 4, Tehran,
1390.sh.
Kowsar Bidad and Ardashir Sadraddini
Copyright © 2022 FDOKUMEN