LEVERAGE AND INTERNATIONAL CAPITAL STRUCTURE
337
LEVERAGE AND INTERNATIONAL CAPITAL STRUCTURE: An Extension of the Modighani and Miller Propositions on Capital Structure for Multinationals Dissertation Presented to Liverpool John Moores University In Partial Fulfilment of the Requirements of the Degree of Doctor of Philosophy Robert T.M. van Gestel December 1995
-
Upload
khangminh22 -
Category
Documents
-
view
2 -
download
0
Transcript of LEVERAGE AND INTERNATIONAL CAPITAL STRUCTURE

LEVERAGE AND INTERNATIONAL CAPITAL STRUCTURE:
An Extension of the Modighani and Miller Propositions
on Capital Structure for Multinationals
Dissertation Presented to
Liverpool John Moores University
In Partial Fulfilment of the Requirements
of the Degree of Doctor of Philosophy
Robert T.M. van Gestel
December 1995

Abstract. Existing financial theory originated by Modigliani and Miller(M&M) prescribes that the capital structure of a firm does not matter,i.e. the cost of capital is the same irrespective of the way the firmchooses to structure its capital. The M&M propositions have beenmodified to suggest that inclusion of i) the tax shield and ii)bankruptcy or financial distress costs modify this conclusion to suggestan optimal capital structure does exist. However, financial leverage istoo narrow a concept. Hence the study's approach via total leverage. Inany case the extension noted above is still inadequate since it fails toallow for other important considerations such as cultural influences oninternational capital structure. This suggests that the optimal capitalstructure will vary accordingly. The M&M indifference in the face ofthe real world appears untenable, in particular as pertains tomultinationals. A number of studies have been conducted on theimpact of various factors on international capital structure. This thesispresents the results of empirical study of the debt-to-equity structure of87 firms in 19 industries headquartered in 29 countries. The resultstend to agree with the hypothesis that cultural differences arecorrelated with the significant country grouping and minimal industryinfluences which are found. Additionally, there appear some countryinfluences based on the underlying cultural patterns of a few specificcountries.

ACKNOWLEDGEMENTS
The author is grateful to the large number of quoted companies and
privately held firms in the UK and overseas who have collaborated
and to the numerous persons who have assisted in obtaining the
necessaiy research data internationally. This study on leverage and
international capital structure would not have been possible without
their help.
Assistance was further received from the authorities and from a
number of outstanding individuals in National Governments and
industly in the European Community, Middle East, Asia Pacific and
the United States. Special appreciation is due to the primaly research
supervisor, Dr. John Thompson, Professor of Finance at the Uverpool
Business School and to several professors in the UK and the United
States with whom information on the subject was exchanged.
Special thanks are also due to Malcolm Young who assisted with the
typography of the final manuscript. I thank especially all of my family
and loved ones for their patience through the many years spent in
cartying out this research and in preparing the dissertation.
December 1995
Moore, Cheshire
ENGLAND Robert T. M. van Gestel

CHAPTER IPage
INTRODUCTION
1.Aims of the Study I
2. Central Theme 2
3. Problem Definition 2
4.Scope 3
5. Limitations 4
6. Work Plan 6
7. Importance 7
8. Contribution 8
9. Summaly 9
(i)

CITIAPTER II
Page
LITERATURE REVIEW
11
1. Different Types of Leverage 12
1.1 Discussion of Operating Leverage 12
1.2 Discussion of Financial Leverage 15
1.3 Discussion of Total Leverage 19
1.3.1 The Theory of the Degree of Total Leverage 22
1.3.2 Total Leverage as Optimised 24
1.4 The Debt-to-Equity Relationship of Leverage 27
1.4.1 Debt-to-Equity applied under Total Leverage 27
1.4.2 Debt-to-Equity applied under Financial Leverage 31
1.4.3 Debt-to-Equity applied as Capitalisation and
Ratio Comparison 34
2.The Formal Theory of Leverage and Capital Structure 37
2.1 Formal M&M Theory 37
2.1.a M&M Proposition I with Taxes 39
2.1.b M&M Proposition II with Taxes, WACC
and no Distress Cost 39
2.2 Discussion of M &M Proposition I 39
2.3 Discussion of M&M Proposition II 41
(ii)

3.Different Aspects of Total Leverage 44
3.1 Value-added in Operating Leverage 44
3.2 Value-chain Effect of Integrated Operating
and Financial Leverage 45
4.Economic Determinants of Debt Capacity 48
4.1 Capital Struc±ure
52
4.2 Cost of Capital
53
4.3 Leverage for R&D
56
5. Cultural Influences on International Capital Structure 60
5.1 The Cultural Determinant
64
5.2 Significance of Industry and Country
Influences 66
53 Significance of Country Group Influences 68
6. Summary
70
(iii)

CHAFFER III
Page
MEFHODOLOGY
1. Introduction
72
2. Hypothesis and Test Format
76
2.1 Standards 76
2.2 Criteria 80
2.3 Hypothesis Test
81
2.4 Cross-sectional Data 82
2.4.1 Cross Section versus Time Series
82
2.4.2 Cultural Realms 83
3.Construction of the Data Bank
84
3.1 Procedure
85
3.2 Role of the Questionnaires 86
3.2.1 Method 1: Financial Statements
88
3.2.2 Method 2: Quantitative Questionnaire
88
3.2.3 Method 3: Qualitative Questionnaire 89
3.3 Statistical Values 90
(iv)

4. Statistics on Capital Structure 91
4.1 Measurement of Debt-to-Equity 92
4.1.1 Basis of Measurement
92
4.1.2 Formulation of Measurement
93
4.2 Historical Costs 95
4.2.1 Book versus Market Values 95
4.2.2 Quoted Companies under GAAP
98
4.2.3 Private Companies under GAAP
99
4.3 Exposure Adjustments 99
4.3.1 Inflation 99
4.3.2 Exchange Rates 101
4.3.3 Differential Rates of Inflation 102
4.3.4 Consolidation and Translation Rules 102
4.3.4.a Rule FASB8 on Exchange Reporting 103
4.3.4.b Rule FASB2O on Hedging 104
4.3.4.c Rule FASB33 on Inflation 105
4.4 Accounting Adjustments 106
4.4.1 Uniformity 106
4.4.1.a Accounting Conventions 107
4.4.1 .b Auditing Standards 108
4.4.l.c National Laws 109
4.4.2 Balance Sheet
111
4.4.3 Role of Convertibles and Warrants 114
4.4.3.a Hybrid Securities 1154.4.3.b Warrants
116
(v)

5. Statistics on R&D, Growth
117
6.Classification by Cultural Realm 118
6.1 Worldwide Realms 118
6.2 Regional Realms 119
6.3 Strata Clusters 121
6.4 Cultural Realms 123
7. Sources of Information 124
7.1 Companies Contacted
124
7.2 Companies Retained
125
7.3 Primary Data 126
7.4 Randomisation 126
7.5 Comparative Data 127
8. Summary 128
(vi)

CHAPTER IV
Page
RESU LTS
I. Validation 133
1.1 Variability in Debt-to-Equity Ratios 136
1.2 Variability within and between Cultural Realms 137
1.3 Tests of Significance 138
1.4 Kruskal-Wallis Ranking Test 139
1.5 Kruskal-Wallis Procedure 141
1.6 Kruskal-Wallis Test Statistic 143
2. Hypothesis
144
2.1 Differences between Industries -
Hypothesis 1: 144
2.2 Differences within and between Cultural Realms -
Hypothesis 2, Hypothesis 3 145
2.3 Debt Ratios for Selected Industries and Countries 146
2.4 Debt Ratio Ranks for Selected Industries
and Countries 146
(vii)

2.5 Industiy Analysis 147
2.5. a Findings on fndustiy Analysis
147
2.5. b Comparative Results of Industly Analysis
and the First Hypothesis Test
147
2.5. c Conclusion of the First Hypothesis Test
148
2.6 Countly Analysis 148
2.6. a Findings on Country Analysis 148
2.6. b Comparative Country Analysis
149
2.6. c Conclusion on Country Analysis 149
2.7 Cultural Analysis 150
2.7. a Findings on Cultural Analysis
150
2.7. b Comparative Cultural Analysis 150
2.7. c Conclusions on Cultural Analysis 151
2.7. d Preparation for Further Hypothesis Tests 151
2.8 Results of the Third Hypothesis Test
152
2.8. a Comparative Results of the Third
Hypothesis Test
153
2.8. b Conclusion of the Third Hypothesis Test
153
2.9 Results of the Second Hypothesis Test
154
2.9. a Comparative Results of the Second
Hypothesis Test
155
2.9. b Conclusion of the Second Hypothesis Test
155
(viii)

3. Comparative Analyses 155
3.1 Leverage and Geographical Expansion 1563.1. a Debt-to-Equity versus Overseas Sales 1573.1. b Debt-to-Equity versus Export Sales 158
3.2 Effects of Merger and Accluisition Leverage onR&D Expenditures 160
4. Summary 161
(ix)

CHAPTER V
Page
INTERPRETATION AND CONCLUSIONS
1. Interpretation 164
1.1 Aims 164
1.2 Results 165
1.3 Evidence 166
1.4 Importance 166
1.5 Statistics 168
1.6 Limitations 169
1.7 Contribution 170
2. Conclusions 172
2.1 The Issue of Total Leverage 172
2.2 Optimal Capital Structure 1722.3 Total Leverage 173
2.4 Cultural Influences on International
Capital Structures 173
(x)

CHAPTER VIPage
RECOMMENDATIONS FOR FURTHER RESEARCH 176
I Leverage, Growth and Size Effect
176
2 Capital Structure and Organisational Fit 180
(xi)

Page
LIST OF ABBREVIATIONS USED
182
LIST OF CARDINAL DEFINITIONS AND
TECHNICAL NOTES
184
SELECTED REFERENCES
189
APPENDIX
Al
(xii)

CHAPTER I
INTRODUCrION
1. Aims of the Study
Perhaps one of the themes most discussed at present in financial theoiyis that of leverage and international capital structure. The assumptionfrequently made is that important factors influencing a firm's capitalstructure are its levels of debt, growth and Research and Development(R&D). To the extent that an optimal capital structure exists,management need only finance these proportions optimally to assurean optimal capital structure at minimum capital cost. However, in aninternational environment this subject becomes much morecomplicated given that the different substructures of the multinationaloperating in different markets may require different levels of debt.Management needs to know how to plan for a most optimal financingof the parent multinational, its foreign subsidiaries, or the group as asum of the parts. The aims of this study are to investigate leverage inthe context of international capital structure, indicating defects andfilling a gap with existing theory.
Before continuing this introduction with the central theme of thestudy, it is necessary to provide brief definitions of operating leverage,financial leverage and total leverage. These are as follows:
Operating LeverageThe degree to which a firm relies on fixed costs, the risk being thebusiness risk
•1

Financial LeverageThe extent to which fixed income securities can be relied upon in thecapital structure, the risk being the financial risk
Total LeverageThe effective or potential change in value brought about by operatingleverage in the face of financial leverage, the actual gains (or losses)resulting from a combination of the financial and business risks.
2.Central Theme
The central theme of the research is that of leverage as relates to anoptimal capital structure for multinationals. The multinational isdefined here as a Company that operates in more than one countly, i.e.beyond mere export activities, and in a way deemed material to both itsrevenue volume and profitability. This type of firm was selected forstudy because it seeks to maximise results on a multinational basisrather than treat international activities as a portfolio of diverse andseparate country companies. In this context, geographical expansionperhaps can be seen as a form of financial diversification. Motivationsvary; e.g. the domestic market for the firm's products being toorestricted, shareholders expecting higher investment returns fromoverseas activities, management seeking economies of scale andimproved earnings from international operations. From observation itwould appear that multinationals offer the most rewarding scope foroptimal capital structures.
3.Problem Definition
The most immediate problem has been to extend the existing literatureon leverage and cultural influences on international capital structure
2

of firms headquartered in different cultural realms. This problem canbe broken down in four distinct parts:
3.1 To specify leverage as total leverage, i.e. in the accounting as wellas socio-economic sense so as to include cultural influence. To applythis debt-to-equity ratio, in short the debt ratio, consistent with cross-cultural characteristics of a database of multinational firms.
3.2 To build a significant empirical database of debt ratios in terms ofparticipating firms and industries, as well as of geographical coverage,countries and country groupings. Such a database did not existelsewhere and therefore had to be built.
3.3 To incorporate factors of R&D and growth into the database forfurther comparative analysis. To interpret for post-merger oracquisition influences of leverage as may impact levels of R&D inrelation to the debt ratios. To identify areas for further research.
3.4 To conduct an examination of differences in debt ratios betweencompanies in different countries and industries, and the effect ofcultural influences on capital structure.
4. Scope
The study extends the existing literature dealing with leverage andinternational capital structure of multinationals headquartered indifferent cultural realms. In this respect the scope of the study istwofold:
4.1 The literature survey encompassed a full examination of thecapital structure propositions and invariances put forward by
3

economists Modigliani and Miller (M&M), [19581. These are generallyviewed as formal financial theoly as exists on the subject. Theliterature was then analysed for any other aspects relevant to thecentral theme which firstly seeks to identify existing economicvariables related to an optimal but international capital structure. Thecombination of these variables was then complimented with findingson cultural influences that may affect international capital structure.
4.2 ExtensiVe examinations were conducted of the differences incapital structure between multinationals headquartered in differentcountries, operating in different industries. Various aspects on thistheme have been studied in a number of previous studies. Thehypotheses adopted to test differences between and within culturalgroupings of countries were first used by Collins and Sekely [19871.These hypotheses had until then not been addressed directly inprevious literature. In this study, as an important improvement on theCollins and Sekely study, they are based on primary data.
5. Limitations
5.1 The study does not attempt to predict success of investors. Nordoes it seek to simulate price/earnings ratios, securities valuations offuture and current cash flow streams or market size assessments. Thisencompasses any impact of inflation and nominally denominated debtcontracts on the valuation of corporate equity.
Where reference is made to value-maximisation this is intended in thesense of corporate performance at the level of the firm with thepurpose to attain an optimal capital structure, i.e. not in the sense ofstock market performance with the purpose of securities valuation.The latter is not the subject of this study. Put differently, the study is
4

primarily concerned with the value of a firm's income as a function ofcash flow, not of the forms in which the different parts are packagedand priced on the market.
5.2 For the purposes of this study the use of the generic words"company", "corporation" or "firm" is interchangeable except wherethe legal meaning is intended.
5.3 The thesis does not as such study the subject of culture. Wherethe notion of culture is referred to in the context of total leverage, thisis done on the basis of geographical areas of financial diversificationMultinational companies sampled conduct their business in theseareas subject to the cultural influences on international capitalstructure. This is reflected by the effective level of leverage by samplefirm and the aggregate of all firms compared between cultural realmsof defined country groupings.
The cultural variant determines a broad cultural influence on capitalstructure beyond the count!)' and industry difference. Culture here isnot the entire set of a population's perceived norm, behaviour andbelief system in a given country. What is meant is primarily materialculture as most closely relates to capital structure patterns in thatcountry or group of countries. Thus, the cultural influences reflectsocietal tendencies. These in turn exhibit differences in fiscalregulations, the legal system and importantly the treatment of propertyrights as relate to debt and equity.
5.4 The study does not measure R&D but uses published R&D figures.Measurement would be beyond the scope of the study which focuses onleverage. However, the question frequently arises as to what wouldhappen in the case of a merger or acquisition. One assumption oftenmade is that this would increase debt levels and as a consequence there
5

could be a tendency to economise on R&D. This study surveys forpossible influences of leverage, following mergers and acquisitions asmay affect levels of R&D in relation to the debt ratios. R&D is definedas the cost of basic research as well as product development expendedagainst profit.
The purpose, as in the foregoing points, is to enable the reader to drawmeaningful interpretations and conclusions from the results of thestudy within these constraints.
6. Work Plan
To achieve the aims of the study the following work plan was adopted.
6.1 Uterature Review (Chapter II)
The literature survey encompasses a detailed review. The outline is asfollows:
6.1.1 Different types of leverage6.1.2 Formal theory of M&M propositions6.1.3 Different aspects of total leverage6.1.4 Determinants of debt capacity6.1.5 Cultural influences on international capital structures
An indication of the gaps and defects in the literature sets theframework of the study.
6.2 Methodology (Chapter Ill)
The chapter sets out the study's analysis including the data collection. It
6

specifies the research procedure followed including why the particularprocedure was followed and indicates problems and solutions as wellas any remaining pitfalls.
6.3 Results (Chapter IV)
This chapter essentially consth:utes a statement of the processed resultsof the quantitative and qualitative study.
6.4 Interpretation and Conclusions (Chapter V)
The concluding chapter distinguishes between interpretation andconclusions.
6.5 Recommendations for Future Research (Chapter VI)
This chapter provides evidence of further thought.
7. Importance
The importance of the study can be summarised as follows:
A number of studies have been carried out before on the impact ofmany different factors on financial structures. Yet no prior study hasestablished a significant relationship between any economic variableand international differences in capital structure. Thus, there must beother influences. This study examines for evidence of culturalinfluences on international capital structure.
7

The concern of this study is not with the determinants of aggregateeconomic investment by the business sector. The thesis takes furtherMiller's unfinished work on capital structure at the level of the firm. Itthen examines its findings within an international context.
8. Contribution
The study's contribution is fourfold as is set out below:
8.1 The literature survey answers the question 'what is leverage?'. Itdefines what constitutes leverage, specifying the concept of totalleverage. It brings together from an incoherent universe the variouseconomic and management variables as may determine and stimulateleverage. It categorises the interrelationship of these variables. In doingthis it answers the next question, 'what does leverage mean?', i.e. interms of international capital structure.
8.2 The study validates the underlying assumption of culturalinfluences on international capital structure. It identifies thesignificance of industly, country and countly grouping that exist andmay affect capital structure.
8.3 Where cultural influence is significant among cultural realms,this is reflected in the similarities of capital structure in themultinationals located in geographical regions with similarbackgrounds. The debt patterns that emerge from this will helpmanagers determine the nearest or near-perfect situation of what anoptimal capital structure could be in an international operatingenvironment.
8.4 This original contribution on the topic of leverage and optimal
8

capital structures further closes the gap between established theory onthe M&M theme and practical requirements as relate to financialplanning and capital provisions for multinationals.
9. Summary
The foregoing constitutes a number of interesting research challengeswhich can be summarised as set out below. The first two items listedcan be seen as the main issues to be attended to during this research:
9.1 To close the gap between existing theory on the subject ofleverage and practice as prevails in the real world of multinationals.The latter, however, prerequisites the development of a unique databank and the undertaking of empirical research based on this databank
9.2 To examine for any industry or country influences that wouldexplain the differences between various capital structures ofmultinationals. Only one previous study exists that has researchedthese variables, that of Collins and Sekely [1983] but only secondary datawere used.
9.3 To demonstrate on the basis of primary data, any evidence of alink between optimal capital structure and the cultural influences oninternational structure.
9.4 To provide as a result, a direction of guidance on the abovesubject which, as a pattern, is of immediate practical use to theinternational manager.
The last two items are a consequence of the first two items listed. The
9

assumption made here is that as multinationals gain in size andimportance, the findings of this study will also help internationalmanagers to be better equipped to understand how capital structure candiffer internationally.
The main research questions therefore can be formulated as follows:
1. How can an optimal capital position be defined andstructured? In the event, how can the economic and cultural variablesinvolved best be measured and this consistently so across variousindustries and countries in which multinationals operate?
2. Do firm-specific decisions result in different capital structuresfor firms in the same industry and/or country but these differencesbeing less than the differences one finds across all industries orcountries? In the event, is there a discernible pattern by industry orcountry groupings?
3. Is there an indication of direction in the pattern of culturalinfluences on international capital structure? In the event does itappear clear and significant?
10

CHAPTER II
LITERATURE REVIEW
The prime objective in this study is to assess whether there is anyrelation between the debt ratio of firms and their industry or countryassociation. This requires an analysis of the debt structure, and further,an examination of any industry or country differences as may affectsuch a structure.
In studying the suitability of existing theory, this required a broadlybased critical analysis on the theme, supported by the detail. This workdetails the literature fully, allowing the methodology and research toflow out of the previous research in the area. At the end of this chapter,having examined the literature, one will be able to appreciate themethodological issues, how the work relates to the main body of theliterature and why a particular methodology is decided upon tocomplete the research.
Meanwhile, the discrepancies between theory and practice appearsignificant. The truth of this can be seen if one looks at the conditionsthat prevail. For example, banks now judge a firm more on its ability tomanage a given level of debt operationally and generate cash than tocreate assets. This view has been supported for example by Rybczynski[19891. Rybczynski observed that banks, lenders and the equity investinginstitutions were increasingly lending not against assets but against thecash flow generating ability of client operations based on the level ofdebt that could be acquired (pp. 3-11), i.e. covenanted loans. This viewis often taken as Rybczynski said regardless of where the operationsthat have to produce this cash flow are geographically located. Thisstudy focusses on the capital structure of multinationals. We will
11

therefore come back to this geographical issue as well as related culturalissues later in the text.
To start with, the thesis discusses the three different stages or types ofleverage; "operating" (first stage leverage), "financial" (second stageleverage) and "total" (third stage leverage). It is useful at this point toprovide a further description of these various stages of leverage and tocompare these with existing theoly. Comparisons have been madewith the theory as described, for example by Solomon and Fringle [19861(pp. 138-142). It is also important to explain in simple language whatthe three main concepts behind these stages entail. This is set out asfollows:
I Different Types of Leverage
ti Discu.sioh of Operatmg Leverage
To specify operating leverage, a simple statement explaining this can bemade. A high proportion of fixed costs means that a firm's profits arevery sensitive (responsive) to variation in sales. This incidentally, isthe same effect as that derived from the so-called value chain discussedlater.
Operating leverage is an important and necessary concept to (a)appreciate fully the role of financial leverage as explained in the nextsubsection and (b) understand total leverage as set out thereafter. Totalleverage, as will be discussed in detail further in this text, combines theconcept of operating leverage with the financial leverage formula.
Operating leverage as stated earlier represents the degree to which afirm relies on its fixed costs. There is of course a certain risk in this in
12

that the costs must be matched with revenues leaving sufficientoperating profits before income tax One has therefore to bear in mindthat any firm has a certain amount of risk inherent to its operations.This is its business risk (not the financial risk) as defined by theuncertainty inherent in projections of the operation's pretax futureearnings. Capital intensive firms naturally may tend to have a higherdegree of operating leverage than firms with low fixed costs but what iscrucial is to measure to what extent costs at any level could be held asfixed, while increasing revenues from operations. The question can beasked as to what the results would be if quantity sold were to rise by e.g.10%. To understand the concept of operating leverage, a simplenumerical example referring to the H J Heinz Company sample isadded
In 1989 the H J Heinz cost of goods sold was $3.5 Bin, on worldwide revenues of $5.8Bln.
Cost of goods sold thus represented 6(3 percent on a consolidated basis. The estimated
average selling price of certain canned products at one of its foreign subsidiaries is thern
equivalent of $12 per can Given fluctuations in worldwide prices for raw materials and
commodities, variable costs are assumed to be 67%, allowing for 33 cents in the dollar
for fbd costs. With variable cost of 80 cents per can, an estimated fixed cost of $345.000
per annum and depreciation of 13%, the break-even level in accounting terms is
$390.00t]/0.40 = 975.030 cans. At this level, operating cash flow equals depreciation of
$45.000. Returning to our question as regards operational leverage, we wish to know
what the increase in operating cash flow will be if the quantity sold were to rise to e.g
10 percent above the break-even, ignoring taxes. For this we need to define the degree of
operating leverage (DOL). This is a standard formula:
DOL =1+FC/OCF
Note:
FC = Fixed costs. OCF = Operating cash flow. OCF is calculated as 975.000 x 0.41) -
345.000 = $45.000
DOL 1 + $345.000/$45.000
= 8.6
13

Thus, a it) percent improvement in the number of cans sold will increase operating cash
flow significantly. i.e. by 86%. Put differently, if sales rise by 10 percent, quantity of
cans sold effectively rises to 975.000 x 1.1 = 1.072.500 cans. Pre-tax cash flow from
operations then becomes 1.071500 x 0.40 -345.000 = 584.000. When compared to the
previous cash flow of 545.000, this is 86% more, i.e. 584.000/45.000 = 1.86.
Soume H J Heinz Company, Profit and Liss Statement (Appendix A), General
Appendix
This example immediately indicates the importance of the operatingrelationships between market size, volume and cash flow as well as thenecessity to take into account the capital structure of the firm.However, these complex relationships in e.g. the multi-country, multi-cultural setting of a multinational, would be difficult to quantifywithout taking into account the cultural determinant. Whenconducting business on a geographically diversified basis, as the studywill show, cultural influences on international capital structure tend toplay an overriding role. The intention thereforeis to derive at least asense of direction set by these influences and to allow managers ofmultinationals to identify some pattern amongst debt-to-equity ratios,geographically and culturally, as may affect their internationaloperations.
To achieve this, the debt-to-equity relation of leverage must becalculated on such a basis that the resulting debt ratio not merelyreflects long-term debt funding or the advantage of short-term financebut also those advantages that come with (a) the effective day-to-daymanagement of those multinational operations in their respectiveenvironments and (b) their related returns on investment. Suchcalculation is set out in Section 1.4, subsection 1.4.1, where debt-to-equity under total leverage is applied. In that section Digital EquipmentCorporation (DEC) is used as a case sample, illustrating how totalleverage is calculated. A comparative sample calculation on the total
14

leverage position of, for example, Avon Products Inc., thendemonstrates differences in interpretation of different total leverageratios. In the next section however, it is important to first review andunderstand the workings and influence of financial leverage on totalleverage
1.2 Discussion of Financial Leverage
Financial leverage (or second stage leverage), in the UK also referred toas gearing, is the extent to which fixed income securities (debt andpossibly preferred stock if convertible) can be relied upon in the capitalstructure. Financial leverage thus directly reflects the financial riskbeing taken. This is quite different of course from operating leveragewhich as was said, is concerned with the business risk If a companydecides to borrow large sums, it can do so expecting to expand itstrading Or business operations withoutnecessanly increasing its eqUity.-Put differently, it is then effectively undertaking a large amount oftrading with relatively little equity. When "trading on equity" asdescribed above, the percentage of debt relative to total capitalisationwill increase. This forms the essence of the theoiy of financial leverage.In the event, corporate managers or business leaders consider takingthe risks associated with debt financing which are absent in equityfinancing. Obviously, the willingness of firms to face financial risk isaided and stimulated in line with opportunities present to takeadvantage of those tax savings associated with debt financing, ascompared with financing with common or preferred stock
However, from a legal and ownership point of view, the foregoing isnot without any downside. When the firm is financing its businessexclusively with proprietary capital, the owners have sole rights andthus potential claims on all of the earnings and assets. On the other
15

hand, from the moment the firm starts borrowing it is "trading away"to creditors these rights of owners to its earnings and assets. Hence theposition of equity holders becomes less important as the business goesfurther into debt. It can be argued therefore, that when funds areborrowed by a business undertaking, the conditions under whichcapital is supplied by creditors and received by the equity owners, mustbe such that its use can be put to mutually advantageous result.
In practice, debt financing or trading on equity will tend to magnifypotential gains or losses of the firm. Further, the extent to which acompany undertakes debt financing relative to equity depends on thestability of its income. A significant aspect of trading on the equity hereremains the leverage factor, i.e. the larger the proportionate change inreturn to common stock when there is a change in operating income.An example will illustrate this:
Assume two firms earning12 percent pre-tax on capital cofliting of £1.4M net worth in
both situations. This would mean the following
total Assets
-0-
-a-£1400000
FIRMY
Balance Sheet
Total debt
Net worth
Total Claims
-0-
£1 .400.000
£1 .400.000
total Assets
-0-
-0-
£1.400.00ci
FIRMZ
Balance Sheet
total debt
Net worth
Total Claims
-0-
£1 .400.000
£1400000
16

Now, if fit-rn Y in the same example is to purchase £700000 worth of treasuty stock ( ie.
shares of its own common stock), replacing capital by e.g. floaling a 6 percent bond issue
of identical value, the new balance sheet appears as:
FIRM Y
Balance Sheet
-0- Total debt
£7001300-0- Net worth
£700.000
Total Assets £1 .400.000
£1.400.000
Assuming the same pre-tax earnings between both companies, i.e. £1 68.000, the pre-tax
earnings assignable to common stock would be:
Total debt (interest 6%)
Capital and retained earnings
Total liabilities and capital
Earnings
Less interest
Total earnings
Percent earned on total capital
FIRMY
£700.000
E700.000
£1 .400.000
£168.000
£42.000
£126.000
18%
FIKMZ
-0-
£1.400.00
£1 .400.00
£1681100
-0-
£168000
12%
Total earnings have now gone down by one quarter but the percentage return on equity
has increased by a half.
For some time, the increased leverage, as illustrated above, allowsmanagement to increase the rate of return on equity capital. However,when the increase in the cost of borrowing and the increase in the costof equity exceeds the expected return from new funds, trading on equity
17

will no longer be attractive. Again, a practical example will bestillustrate this:
Assume finn Y now is to pay 13 percent on borrowed funds instead of 6 percent. As
depicted below, the leverage effect is no longer favourable. In fact, the percentage
return on equity of the levered firm Y is less than the percentage return on equity of the
unlevered firm Z
Total debt (interest 13%)
Capital and retained earnings
Total liabilities and capital
Earnings
Less interest
Total earnings
FIR.MY
£7LJ0.OtJO
700.000
£1 .400fl00
£168.000
£91 .000
£77.000
FIRM Z
-0-
£1 .400.000
£1 .400.000
£168.000
-0-
£168.000
Percent earned on equity 11%
12%
Here, leverage does not work to the advantage of the owners of firm Y.
The above shows that the leverage factor can work both ways. When ina negative way, leverage will affect a greater proportionate decrease inreturn on common stock than the decrease in operating incomealready being experienced
Hence, it makes little sense to leverage a firm where maximisedincreases in operating income are still in doubt. Conversely, whereoperating income is being maximised, the effects of financial leveragetend to lead to a larger proportionate increase in return on commonstock than the actual increase in operating income.
Using the DEC example referred to earlier, the application of financial
18

leverage is shown in Section '1.4, subsection 1.4.2. By using debt andconvertibles as financial leverage, the firm concentrates its risk on theshareholders. It can be said in this context that the financial riskresulting from financial leverage is the portion of the shareholders'risk over and above the firm's business risk On the same basis, it couldbe argued that as far as strictly financial leverage goes, if willing to takethe risk (regardless of the operating leverage situation), a firm mighttake all of its money as available and yet borrow additional money.What this means, and therefore its relevance, can be understood in thecontext of a situation where a firm takes advantage of some, hopefullyprofitable opportunity, but the risk is very high. There would in theevent not necessarily be the underlaying foundation of operatingleverage to reduce this risk This exemplifies to some extent the varietyof forms leverage can take. However, the additional issue of culturalinfluences on international capital structure will prove , to be arecurrent and in the end overriding theme.
1.3 Discussion of Total Leverage
At the third stage, the concept of total leverage comes into being. Herethe two types of leverage (operating, financial) do not merelyinterrelate. Rather, the notion of total leverage based on "value-added"is created. What value-added means in this context is explained furtherbelow. The concept of value-added itself is explained under DifferentAspects of Total Leverage, Section 3, subsection 3.1.
Whilst the theory of finance has not developed to the point whereoptimal levels of operating and financial leverage can be specifiedsimultaneously so as to capture value-added, one can start observingand analysing how these types of leverage interact within the conceptof total leverage. Total leverage as proposed, becomes the change in
19

value brought about by operating leverage in the presence of financialleverage and must be assessed as such. This is done at the level of thefirm, i.e. not in isolation from its operations, and geographically bycultural realm. As to the latter, what is being studied here is the capitalstructure of multinationals. Referring once more to the previousexample, Section 1.4, subsection 1.4.1 sets out how total leverage isapplied to DEC. This section illustrates how the concept of operatingleverage in combination with financial leverage, can lead to a debt-to-equity position under total leverage. Another practical example usedpreviously, Avon Products Inc., is then studied. This sample wasselected because it shows some of the balance sheet intricacies that canoccur when applying total leverage.
Total leverage (i.e. third stage leverage) thus occurs when thecombination of operational and financial leverage results in "value-added". This "value-added" is the amount or measure of "morevalue" that has been obtained above that of either operational orfinancial leverage in isolation. This needs further explanation, whichwill be found in this section and the next two subsections. In practicefor example, if financial leverage were applied non-sequentially, thiswould mean that the firm did not start the process of value-addedcreation with operating leverage. Put differently, value-added cannottotally be created by the application of operational or financial leverageonly.
The above further explains why in this study a debt-to-equitycalculation under total leverage is favoured to support the hypotheses(Ch. III Methodology). In creating more value, the result of totalleverage invariably is experienced in terms of cash flow in excess ofoperating requirements. Again, this is how value capital is created.After all, an investment is worth undertaking or pursuing only if itcreates value for its owners in line with expectations of value-
20

maximisation. Ross, Westerfield and Jordan [1991] claimed that in themost general sense, one creates value by identifying an investment thatis worth more in the market place than it costs to acquire. Howsomething can be worth more than it costs Ross explained, lays in thefact that it is a case of the whole being worth more than the cost of theparts (a p. 196) but this, as is well known, is subject to the effectiveoperational realisation of such an opportunity.
It is precisely this opportunity or '\'alue window" of imperfections inthe market that is widely regarded as the capital value incentive whichkeeps businessmen going. Ross [1977] examined these incentives aswell as the investment return and risk (pp. 23-40). It is the cumulativeincreases in capital value which ultimately lead to the additional cashflow that creates value capital. The I-I J Heinz sample in Section 1showed how such cash flow is created as a result of operating leverage.However, what this means in terms of value added requires somefurther clarification. For example, a reduction in operating leveragemight tend to lead to an increase in debt levels (i.e. a decrease inowners' worth) simply because a less than optimal use of assets in placenecessitates additional funding. In the event, such excess fundingarguably is not necessary if the application of total leverage isconsidered from the start of the financing process. An increase inoperating leverage would then result in a lower call for debt (andeffectively an increase in owners' worth).
Some may still claim that a firm's capital structure is comprised of allpermanent (long-term) financing generally represented by commonstock, preferred stock, retained earnings and long-term debt, thusexcluding current liabilities [Prather, 1971, a. p. 4451. However, manycompanies nowadays rely on lease financing e.g service industries.Therefore, current liabilities must be considered for inclusion indetermining the debt position relative to owners' equity. For instance,
21

the Marks & Spencer sample in this study is typical of a moderndepartment store. It tends to lease buildings and fixtures. With most ofthe current assets in merchandising the balance sheet (see Appendix B,General Appendix) therefore puts relatively less emphasis on fixedassets. Hence the inclusion of current liabilities into the total leveragecalculation has been considered in estimating the soundness of owners'equity position.
13.1 The Theoty of the Degree of Total Leverage
Taking a more detailed view of the capital structure debate, anassessment was made of the Weston and Brigham study [19871 whichadvocated that, if not the optimal level, interactions of financial andoperating leverage could still be defined technically through analysis ofthe degree of leverage (a. pp. 229-233). Thus, reference was made to a'Degree of Total Leverage' (DTL). As the authors pointed out,combining the effects of operating and financial leverage, at leastwould show that there exists an increased reward and risk factor it isgenerally accepted, that leverage tends to magnify profits (as well aspotential losses). Under total leverage, these profits (or losses) alsomagnify as a function and percentage of equity. This reinforces theimportance of the degree of total leverage. However, the DTL concepton its own will not define what the level of leverage ought to be. To setan acceptable degree of leverage, Weston then recommended thetimes-interest-earned method (TIE).
The TIE concept results from the ratio of earnings to interest and taxes.The formula is set as follows
TIE = EBflInterest
22

Some comments however, need to be made. This approach falls underthat of cash coverage ratios and is meant to manage for a reducedexposure. It is in no way a substitute for the debt-to-equity ratio underTotal Leverage (Section 1.4) but a worthwhile starting point tounderstand its concept. In practice, the TIE is determined by the abilityof a multinational to measure its annual worldwide interest paymentscompared to earnings, i.e. earnings before interest and taxes (EBIT). Thehigher this ratio, the lower the probability that the company willdefault. The TIE as used for different capital structures can thus be set atdifferent levels (Ibid. b. pp. 595-596). For example, one could have a TIEat 3 times versus an industiy average of 5. However, as indicated, theDTL theory and related TIE method fall short of total leverage. The TIEcan also be criticised in that it appears firm specific only. For example,the following two TIE calculations drawn from the sample populationshow extreme values of the ratio:
H.J. Heinz Company TIE =
$ 834.527 Mlfl. 10.74$ 77.694 Mm.
Platignum plc TIE =
£ (267) K. = (0.44)£ (598) K.
Sotn
The full balance sheet (Appendix C) and profit and loss statement (Appendix A) of the
a j. Heinz Company and of Platignum pk (Appendices D,E) appear in the General
Appendix
In the above example, obviously the H. J . Heinz Company has little toworty about in terms of its TIE. This can hardly be said however ofIlatignum plc Rose and Fraser [1988] referred to TIE as simply arelationship between interest rates and the amount of loanable funds
23

(pp. 102-103). Beyond the TIE, there did not appear to exist any clearcriterion.
Another question which arises is that of an appropriate starting pointin measuring the degree of leverage. In this study, the view is takenthat this is best defined by first establishing the break-even levelbetween over and under-leverage. Without going into the policy issuesof high or low leverage, which naturally surround the subject ofoptimisation, the so called principle of static theoiy of capital structurecan nevertheless be applied. What this means is well explained byRoss, Westerfield and Jordan in their latest review on corporatefinance. Ross et al [1991] stated that over-leverage will occur when thefirm operates beyond the static point of optimal capital structure. Thisprinciple is defined as:
'The thec*y that a flim bcw up to the pdntwh thetaxbit uttm an tha dollarin de s efly equal to ffothatcsfitiitheedpt*a1y cI financialdtz'(IIIhp 4
The quotation from Ross surely refers to financial leverage andequilibrium of capital structure. Having said this, there is no reasonwhy the theory can not be extended to total leverage. The next sub-section discusses total leverage in this regard.
1.3.2 Total Leverage as Optimised
From the discussion so far it has gradually evolved that financialleverage appears largely a matter of capital structure policy. Operatingleverage on the other hand is a measure of the firm's actual operatingperformance on its debt contracts as well as on the total shareholders'
24

equity entrusted. This is an important point which must be kept inmind as it is linked into the empirical analysis later (Ch. IIIMethodology, Ch. IV Results). Meanwhile, it can be said that theoptimal degree of leverage, or rather total leverage, is the optimisedcombination of financial and operating leverage, the difference beingthe aforementioned value-added (Section 1.3, subsection 1.3.1) in theform of value capital. This perception of an optimal capital structure iscommented upon below and further in the survey.
The next step is to gain a better understanding of what value-addedmeans since this stands as a cardinal difference between total leverageand the DTL theoiy. The latter, discussed before, makes no mention ofvalue-added. Such an understanding must start with the principle ofvalue-maximisation. This principle as one knows it demands a strongfocus on the day-to-day running of operations and related risk takingin terms of the firm's business economics. Such ties in with the use ofthe debt-to-equity ratio under Total Leverage as mentioned before.Importantly, much of this also has to do with how not only operationalbut discretionary investments are made within the realm of financialrisk taking Kensinger and Martin [1989] took a similar view. As theyput it, if the company's role is to run existing operations efficiently inorder to increase assets under its management, it will have to competefor alluring opportunities offered in the market place for capital (pp. 20- 22). The assets to be increased however can be assets in place, forexample a building or discretionary assets, e.g. specific discretionaryinvestments in marketing advertising or R&D. Commons [19851 camea step closer to total leverage in this way, when defining leverage as:
"Aacwaticx'te ct battrwed capital loircrease earningson its equity Leva piu advantageaisif the ainpary
Can earn tT ai the bclltMed ñir,c than the intenst it tsngftTthem"p 146)
25

Leverage on this basis is the value-adding use of relatively fixed-costsources of funds, principally debt, in order to increase returns to thefirm's owners and debt capacity. A practical example of how value canbe added, using this principle, is that of the multinational takingadvantage of its potential for size effect in the presence of leverage.This is a proper consideration, for example if a high debt growthstrategy where the object and the aim is to value-maximise. If appliedon the basis of total leverage, the results will tend to have a furtherpositive impact under conditions of growth and size effect,characteristic to the multinational and because of the efficienciesderived thereof.
An important aspect in the attainment of total leverage is therefore todefine how the debt is to be treated. Collins and Sekely [1988] treatedleverage as total debt to total assets at book value and calculated as oneminus the rate of shareholders' equity to total assets (a. p. 90). With theinclusion of total equity, this technically is a correct approach to totalleverage, as is explained in more detail (Section 1.4). However, alsoimportant for the purposes of this study is to understand that totalequity, more so than debt, ties into different fiscal regulations andproperty rights in different countries and cultural realms. These inturn correspond directly with the operating realities multinationalsface.
A comparative review with the work of Ross indicated this procedureto be technically correct (Ross et al [19911, Ibid c. p. 452) both in theaccounting and soclo-economic sense [Ibid, d. p. 25]. The fact thatCollins underutilised the formula's potential by using secondary dataonly, is another issue. This will be discussed further (Ch III), whenstudying the methodology used. In contrast, Choi [1983] proxied thedebt ratio as an expression of debt to assets only, that is the debt-to-equity of financial leverage. Using financial leverage, Choi arrived at
26

the debt-to-equity by dividing the total debt at book value by totalassets at book value (pp. 113-131, p. 396). This approach is notsufficiently comprehensive or complete for the purpose of measuringtotal leverage as is evident from the next section.
1.4 The Debt-to-Equity Relationships of Leverage
There exist essentially three ways of expressing the debt-to-equityrelationship of leverage:
1.4.1 Debt-to-Equity under Total Leverage1.4.2 Debt-to Equity under Financial Leverage1.4.3 Debt-to Equity as Capitalisation
These are reviewed in detail as follows. Practical comparisons havebeen made with existing financial theoty, especially as set out byRàss,Westerfield and Jordan [19911 (Ibid e. p. 5, p. 25, pp. 56-57, pp. 368-381)and earlier work by Prather [1971] (Ibid b.. pp. 445-459). Other materialsconsulted on the subject include the works of Sharpe and Alexander[19851 on investment theory and those of Tunick and Saxe [19691 onfundamental accounting.
1.4.1 Debt-to-Equity applied under Total Leverage
This study emphasises leverage at the level of the firm, looking at theapplication of debt both in the operational and financial sense. Hence,it uses the debt-to-equity ratio under the total leverage approach asfollows:
Debt-to-equity = Total Uabilities
(under total Total AsSets + Total Shareholders' Equityleverage)
27

Here shareholders' equity equals total equity, i.e. total shareholders'funds encompassing common stock and retained earnings pluspreferred stock, convertibles including hybrids and reserves (Ross et al[19911 Ibid f. p. 56, p. 377, Solomon and Pringle [19861 p. 741). Thenumerator is calculated as Total Assets minus Total Shareholders'Equity. An equivalent numerator of total liabilities would be currentliabilities plus long-term debt (depicted in Ch. III, Methodology, Fig 2,Balance sheet Model). Hybrids are discussed separately (Ch.III, Section4.4.3 Role of Convertibles and Warrants).
As a practical example, when applied to [)igital Equipment Corporation(DEC) this gives the following result
$2.632.106 = 0.1407 i.e. 14.1%$1 0.667.779 + 8.035.673
Source: DEC Balance Sheet Statement (Appendix F), General Appendix
Confirmation received from the respondent as to the result obtainedcan be found in the General Appendix To help understand easily howthe results can be calculated, a simple aggregated balance sheet sheet ofDEC is included:
28

$ 6.895.008
3.772771
$1 0.667.779
Digital Equipment Corporation
Consolidated Balance sheet
July 1, 1989
(Aggregated)
Assets
Cuzrent Assets
Property, Plant and Equipment; at cost
and other assets, net
Total assets
Liabilities and Shareholders' Equity
Current Liabilities
Net deferred Federal and foreign
income tax credits
and long-term debt
Total Liabilities
Shareholders' Equity
Preferred stock
Con stock
Additional paid-in capital
Retained earnings
Currency translation adjustments
Treasury stock, at cost
Reseive for employee stock
ownership plan debt retirement
Total Shareholders' Equity
Total Liabilities and Shareholders' Equity
Extract: Full DEC Balance Sheet Statement
Source: Appendix F, General Appendix
$ 2.394039
$ 102.048
136.019
283067
$ 2.632.106
$ -130.008
2.469.711
6.366.418
(930.464)
8. 0 3 5 .6 73
$l0.667.779
29

In contrast to DEC, a sample such as Avon Products Inc. for example,using the same method, shows a significantly higher total leverage of80.4% based On:
¶1.869.7 = 0.8037 i.e. 80.4%$2.326.3
Source: Avn Products Inc., Balance Sheet Statement (Appendix G), General Appendix
The above example indicates that Avon's total leverage comparesnegatively to that of DEC. The Appendix shows the full balance sheet ofAvon Products Inc.
In this context, debt-to-equity as total leverage reduces over reliance ondebt, putting equal importance on returns on equity from operations(Prather [19711 c. pp. 446-447). When overall results are poor as in thisexample of Avon, this is translated into a higher total leverage factor..At the same time, it emphasises the important distinction between debtand equity. Debt after all is not an ownership interest in the firm.Creditors in the main do not cany voting power. Also, the cost to servethe debt is a tax deductible business expense (unpaid debt being thefirm's liability).
The use of hybrid securities further demonstrates that it is difficult todistinguish between debt and equity where companies attempt to createa debt security that is in fact equity. This aim then is to obtain the taxbenefits of debt as well as the bankruptcy benefit of equity (equity beinga residual ownership interest). However, this should not beundertaken at the expense of equity returns from operations whichclearly must outweigh the advantages of excessive debt, especiallywhen unfunded. As an important side note, it can be said that thereexists no universally agreed upon distinction between short-term and
30

long-term debt, albeit funding generally meaning long term. In theevent, long term debt may have a maturity of three to five or ten years,as opposed to maturities of one year. The meaning of funding canfurther be applied to intermediate debt of over one year and less thanthree years (Ross et al [19911 Ibid h. p. 368). In the end it should beargued therefore, as this study does , that when the debt relation is notstated on the basis of total equity, such debt when considered at thelevel of the firm may in fact be overstated.
The section following explains this study's reluctance to apply debt-to-equity under financial leverage, especially where multinationals areconcerned. Much of this has also to do with the role of preferred stock.foreign laws and international taxation
1.42 Debt-to-Equity applied under Financial Leverage
In contrast to total leverage, under financial leverage, the ratio becomes
Debt-to-equity Total Assets - Net Worth(under financial = Total Asss
leverage)
Shareholders' equity in this case is limited to common equity plusretained earnings, or net worth. Preferred stock is not included -preferred stock is a form of equity, both from a legal and tax standpoint. Strictly defined, it is stock with dividend priority over commonstock. normally with a fixed dividend rate, albeit often without votingrights. Some may argue that preferred stock is debt as a sort of equitybond. However, corporate investors, almost universally, pay apremium for preferred stock as an asset because of the significant tax
31

exclusion on dividends. For example in the United States, theexemption may be as high as seventy percent. In the same case, yieldsfrom preferred stock held not as an asset will be fully taxable as if itwere interest received. Also, from the firm's point of view, unpaiddividends in case of bankruptcy are not payable as they are notconsidered a debt. This further underscores this study's preference forthe use of debt-to-equity as total leverage, discussed earlier.
Returning to DE using the same example applied earlier under totalleverage, financial leverage is calculated as follows:
$W667.000 - $8.035.673 = 02467 i.e. 24.7%$1 0.667.779
Source: DEC Balance Sheet Statement (Appendix F), General Appendix
Note:The aggregated balance sheet; listed in the previous subsection 1.4.1 is used As thereare no preferential shares, net worth here equates to total shareholders' equity.
The absence of preferential shares in the capital structure of DEC isunusual but reflects its capital distribution as is. To give an examplethat shows the relationship of financial leverage and net worth in amore comprehensive way, another example, that of the Proctor andGamble Company (P&G) is used to calculate the same measure. Theaggregated balance sheet is set out below:
32

$ 6578
9.773
$ 16351
The Proctor and Gamble Company
Consolidated Balance Sheet
June 3Q 1989
(Agegated)
Assets
Cunent AssetsProperty, Plant and Equipment at cost
and other assets, net
Total assets
Uabihties and Shareholders' Equity
Current Liabilities
Net deferred Federal and foreign
income tax oedits
and long-term debt
Total Liabilities
Shareholders' Equity
Preferred stock
CotTmn stock
Additional paid-in capital
Retained earnings
Currency translation adjustments
Treasury stock, at cost
Reserve for emplcyee stock
ownership plan debt retirement
Total Shareholders' Equity
Total Liabilities and Shareholders' Equity
Extract: Full P&G Balance Sheet Statement
Source: Appendix H, General Appendix
$ 4.656
$ 1.782
3.698
5.480
$ 10.136
$ 1.000
162
529
5.58 7
(63)
(1.000)
$ 6215
$1 6.351
33

Hence the financial leverage measure Is:
$11.136 = 0.681 i.e. 68.1%$1 6.351
Source: P&G, Balance Sheet Statement ( Appendix H), General Appendix
Note..The full balance sheet of P&G can be examined in the General AppendixThe aggregated balance sheet is used for this example. As will be noticed, thepreferential shares have been excluded, this was not the case when calculatingoperating leverage.
1.4.3 Debt-to-Equity applied as Capitalisation and Ratio Companson
As concerns debt-to-equity as capitalisation, this formula reflects thelong-term debt position from a security analysis rather than operatingpoint of view. It is therefore an inappropriate measurement for thepurposes of the study. Financial analysts frequently calculate this ratiousing only long-term debt. Some refer therefore to the debt ratio. Thishas caused confusion. Most people mean different things by the termdebt ratio (Ross et al [19911 Ibid i. p. 57). In this study, when using theterm debt ratio, reference is made to the debt-to-equity ratio under totalleverage. This is quite different from the debt-to-equity ratio ascapitalisation stated below:
Debt-to-equity - Lonci Term Debt - Lanci Term Debt(as capitalisation) Long Term Debt +Total Equity - Total Capitalisation
34

Going back to the main comparison on DEC, capitalisation is calculatedas follows:
$136019 = 0.01 67 i.e. 1.7%$136.019 + $8.035.673
Source: DEC, Balance Sheet Statement (Appendix F), General Appendix
To make a quick comparison, in the next example we look at (P&G),calculated on the basis of (a) total leverage, (b) financial leverage and (c)leverage based on P&G's capitalisation. Including DEC, a comparisonwould then look as follows:
DEC
P&G
(a) Total Leverage 14.1
42.0 (1)
(b) Financial Leverage 24.7
68.1
(c)Leverage based on Capitalisation 1.7
37.3
Source: P&G Balance Sheet Statement (Appendix 1-0, General Appendix
Note:
(1) An adjustment made to the P&G balance sheet under (a), adding back in the reserve
for employee stock ownership plan debt retirement, results in total leverage of 42.0
instead of 44.9. Convertible Class A preferred stock is also included. Conversely, under
financial leverage, in determining net worth (subsection 1.4.2) these items were
excluded.
The foregoing indicates leverage as total leverage or as leverage basedon capitalisation to provide more conservative leverage ratios thanthat based on solely financial leverage. In these examples, P&G, a fastmoving consumer goods company, shows higher ratios than DEC, amanufacturer of computer equipment.
The above calculation following debt-to-equity as capitalisation is not35
appropriate for the objective of this study. The next section shows thatthis observation on debt-to-equity as capitalisation (as well as that ondebt-to-equity under financial leverage) is maintained whenevaluating the formal theory on capital structure.
Before going into the review of existing formal theory on capitalstructure [In Modigliani and Miller (M&M), leading economic theoristson the subject between 1958-88] it is important to be reminded of theconcepts that are being emphasised in this study. These are the debtratios, geography and cultural influences (within identified culturalrealms), and R&D investment as relates to leverage.
To close this section, the Table following provides an overview of thevarious subjects discussed, related data and references by Appendbc bysubsection, comparing various ratios determined in the examples:
36

a)
0
a)cI.
a) 0)0000(a (a
0)0)0)0) a)00 00 00 > >
I- I-0) 0) 0 0
n-- c(a (0 (a (0
a)00
I- ;.. - I-.
a) a) '.- '.- 'I- a) 0) a) a)
000 •- D0cd,
(0(0w0 •00 •0t 0)0)
w_c (a (a (0(0
L) - - -' >-, > ^4_ •4 '4- 4-' 4-' 4-' -4-.
'5 0 0 0 •5 •5 • .
:' ?' - - D- 0- 0- 0-
00 000 r.
. 0) 0) ) 0 Ô 0 ó 0 c4 .4;.4 44.I- 4-' --. 4 4-' 4-'
(I0)0) a) .0.0 .0.0 .0,0
a) a) a) a) a) 0)
g
I'-4 '-4 cs-I
'- '-I '-
4j(1) (IrM rf(/j IJ t1J
ZZ' ' N-' henco Z co '.
co cs-a .o en
l) '--4—— )ILJ) E—EE- E— E- L,
u UUa) (a (a ct i-LI oj iLI
< i-LU Li
>0
0)00(aI-0)>
(a-o
(0
3
00 (0(ai-0) (0>i
CO4-' II
as-0)
CO
>
b0
4-' —
0)
ORas u H
zO

2 The Formal Theoty of Leverage and Capital Structure
2.1 Formal M&M Theoty
The theme of Modigliani and Miller in their original article consistedof two propositions. Put in a language that an intelligent layman canunderstand these propositions state that:
Firstly, the capital structure of a firm is irrelevant as long as the firm'sinvestment decisions are given. This arises because an individualshareholder can indulge in "home-made" arbitrage, (i.e. borrowingand purchase of stock) to obtain the level of leverage he wishes. Home-made arbitrage referred to above relates directly to the formal theoiy onhome-made leverage. In this respect, Ashton [19861 extended the debateon the use of personal versus corporate leverage. However, throughnew, high leverage limited-liability securities, firms may enhancevalue by offering risk, and return combinations that fully-liableinvestors are not feasible of obtaining on their own. As relates to thereal world pertaining to multinationals, it is unlikely that suchmagnitude of finance could any longer be raised by individuals on thebasis of home-made leverage. Hence, home-made leverage, in the viewof this study, remains largely a theoretical concept.
Secondly, the expected return on common stock of a levered firmincreases in proportion to the debt-to-equity ratio expressed in marketvalue, or alternatively, book value. Here, the assumptions lying behindthe original M&M Propositions are important in that they include:
(a)The absence of taxes(b) The existence of a perfect capital market which includesthe ability to borrow and lend unlimited amounts at thesame (i.e. risk free) rate of interest.
37

(c) The absence of distress costs which vary with the degree ofleverage.
Cleaiiy, these assumptions do not represent conditions in the realworld. Miller introduced corporate taxes in a second article (In TheCommission on Money and Credit [1963L pp. 381-470) and consideredpersonal taxes (In Journal of Finance [1967L pp. 261-275). As it isunderstood, the presence of a tax shield is given by:
(1 -TPE) (l-TC) / (1-TP)
Where:
T =Taxrate
FE = Personal tax rate on equity income
C = Corporate tax rate
p = personal tax rate on interest
Provided (1 - TP ) is greater than ( I - TC) (1 - TPE ), the logicalconclusion is to finance the firm by 100% debt. The restraint is given bythe existence of distress costs provided they rise with the debt-to-equityratio. On this basis, the value of a firm according to the modified M&Mthesis can be summarised as:
Value if all equity financed + PV of Tax Shield - PV of distress costs
PV Present Value
The literature search in this chapter develops from the original M&Marticle to this modification and in effect links into this modifiedproposition.
A note also needs to be made about M&M Proposition I with taxes, andM&M Proposition II with taxes, WACC, and no distress cost. This is set
38

out in the two subsections below.
2.1.a M&M Proposition I with Taxes:
The interest tax shield is the tax saving attained by a firm from interestexpense just like the unlevered cost of capital is the cost of capital of afirm that has no debt. The value of the firm increases as total debtincreases because of the interest tax shield; this is the basis of M&MProposition I with taxes.
2.1.b M&M Proposition II with Taxes, WACC and no Distress Cost:
The conclusion that the best capital structure is 100% debt, givenProposition I with taxes, also can be seen by examining the WACC.The weighted average logically will tend to be substantially lowerthan the cost of capital for the firm with no debt, so debt financing ishighly advantageous. This average declines as the debt-to-equity ratiogrows. The more debt the firm uses, the lower the weighted averagecost. This relationship between the cost of equity, the after-tax cost ofdebt and the weighted average cost of capital as it may affect capitalstructure, constitutes M&M Proposition II with taxes, WACC, and nodistress cost.
These notes reflect on established M&M theoiy; they do not reflect anycriticism, argument or opinions as are further debated below
2.2 Discussion of M&M Proposition I
Under M&M Proposition I as Modigliani and Miller [1958] argued, thevalue of the firm is independent of the capital structure (it isdetermined by its real assets) (pp. 261-297). Miller [1988] aspired theideal world to be "frictionless" (Ibid a. p. 112). However this cannot be
39

at any condition as was also postulated in the initial M&Mpropositions. It is the more interesting to note therefore that inreviewing the original propositions after thirty years, Miller stilldefined Proposition I as holding the value of a firm to be independentof its capital structure. This has since given rise to the so calledinvariance theoiy or Proposition II (in that principally nothing hadchanged or needed to be changed). In this respect, the purpose of theliterature review in part has been to identify ways and means oflooking beyond what otherwise in the opinion of this study would be arather limited perception of the possibilities of wealth creation. As aresult, much more can be said about the formal M&M Proposition I inthis respect. However, in the end as can be seen, the assumptions inany event do not represent conditions in the real world. This holdstrue also in the case of Miller's modified propositions published later,even as these include reference to corporate and personal taxes. Thatthis remains the case is simply because the assumptions do notcorrespond with the practicalities of the world of rnultinationals.Theseassumptions pertain more to the imperfections of a national economicmarket in the macro-economic sense and how these may affect a firm'scapital structure than the real world at the micro-economic that is thefirm-specific level of the multinational. The multinational,geographically diversified, is subject rather to cultural influences asmay impact its international capital structure. Also, the interpretationof its R&D policy as a result may be different in this respect.
Even if there is merit in the M&M theoiy, if showing what doesn'tmatter by implication also shows what does, as Miller put it (b. p. 100),the assumptions simply do not hold. These, as said were too macro-economic. What is meant by this was best expressed by Stiglitz [1988].Stiglitz's view on the M&M work is that of a systematic exploration ofmarket irrationalities enhancing one's understanding of hithertounexplained quandaries (p . 126). The meaning of this has been
40

reviewed in more detail below under Proposition II, in particular theroles of debt, equity and taxation as relate to capital structure. Ifanything, these at least are important factors that relate directly to thedebt-to-equity approach under total leverage referred to earlier.
2.3 Discussion of M&M Proposition II
In M&M's second line of argument, i.e. M&M Proposition II, Miller infact implies that the cost of capital to a firm, whether incurred in debtor equity averages out to be the same no mailer what combination offinancing sources were actually chosen. Equivalently if capitalstructure always consists of some form of debt and equity, the firm'scost of equity increases when the expected return on equity increases.However the cost of leveraging is offset in that interest on debt is taxdeductible whereas interest on equity is not. Looked at this way, thepoint most relevant to understanding the M&M formulations in thecurrent business environment is that the financial structure of the firmdoes not matter as much as its ability to leverage" growth; meaning tocreate more growth within the totality of its existing means, bothoptimally as well as financially. Having said this, the "ability toleverage growth" does not lessen the importance of capital structure.Rather, it stresses the opportunity to attain an optimal capital structureunder Total Leverage. This perception however, is not included in theProposition II theory which by all accounts limits itself to strictly themechanics of debt, equity and taxation as relate to capital structure.
Keeping the issue of culture aside for a moment, the ability to attaintotal leverage beyond Proposition II can be achieved (a) with thesupport of the firm's financial backers and the cash flow capabilitiesderived from the firm's operations, and (b) in combination with therelatively low cost of money and benign government policies on debtfinancing that generally prevail. Having said this, one will no doubt
41

bear in mind that financial markets from time to time may constrainsuch government policies.
The above observations technically may appear as a side note in thesense of pure theory to date, but they are important in terms of theobjectives of this study. For example, Guisinger [19881 pointed to theadverse impact government intervention could have on investmentprofitability, were the leverage opportunities as highlighted above notto apply (pp. 280-295). Jensen [1989L went as far as saying that as long asthe equilibrium was held (meaning no bankruptcy contraction orfinancial distress), what mattered was to find the right architecture tosupport growth through maximum loading of debt (a. p. 61). However,it must be said in this regard that the cost of capital is always to equatewith some minimum required corporate earnings rate. Otherwise itmight just not be worthwhile to be or to remain in business. Only fromJensen's point of view does it not matter what the debt-to-equity undertotal leverage is. As Miller himself has since conceded, total value(meaning value capital as discussed before) might well be enhancedincreasing the proportion of debt, thus suggesting that the debt ratioafter all was not indeterminate (Ibid. c. p. 102). This is the case if oneincludes distress costs - as indicated by the earlier quotation from Ross.
To Miller, the debt-to-equity was merely an implication of equilibriumin perfect capital markets (Ibid. d. p. 99, Ibid e. p. 103). Again, this is notpractical. As far as multinationals are concerned, not all of these areheadquartered or operate strictly in countries and regions where capitalmarkets are sufficiently developed for this to be applicable.
Next, Miller's second defence of Proposition II, expressed most vocallyby Jensen, must also be contested. Under conditions of perfect capitalmarkets, Jensen argued, the value of all assets should be seen as afunction of their payments or expected payouts using risk adjusted
42

probabilities (Jensen, referred to in Introductions to Modern No-arbitrage as provided by Vanan [19871 (a. pp. 55-72)). By no-arbitragetheory, one is referring to the M&M argument that individual agentscan engage in home made arbitrage so that the market will ensure thattwo firms different only in capital structure must have the same value.Hence equilibrium requires a condition that such arbitrage is notpossible. In theory at least, as also Dybvig said [1987L it would be feasibletherefore to replace one company's cash flow by that of another (pp.100-106). This in turn would depend on the expected probability ofsuccess of certain industry categonsations using risk-based Marshallianclassifications on which such probabilities are based. What is meant by"Marshallian" is to group firms by industries, a practice originallyconceptualised by Marshall [19271 and as a modified version still inwide use today. However, the problem with this, as the study willdemonstrate, is that the value attached to industry classifications hasbecome highly debatable.
Miller subsequently attempted to make Jensen's theory work by addingthe perspective that details of functions at the firm level (R&D,production, sales) be included. Leaning on industry classification, thetest of this theory perhaps became too macro-economic and hence tooabstract to have any real impact at the level of the firm (Ibid e. p. 103).Miller by now stated the wish to transform his perception into cashflow. However, equilibrium presupposes the presence of operatingleverage as relates directly to the firm's business risk Also, operatingleverage specifically is not adequately addressed in Miller's theory.Further, whilst as far as multinationals are concerned the culturalinfluences on international capital structure are most important inthis, again, the M&M theory pays minimal attention to theinternational variant. The literature survey therefore reviews theseissues further. It does so by studying in more detail (a) the differentaspects of total leverage, (b) the economic determinants of debt capacity,
43

and (c) the cultural influences of international capital structure. Thisreview of different aspects starts with the topic of value-added inoperating leverage, examined below.
3 Different Aspects of Total Leverage
3.1 Value-added in Operating Leverage
The value-added concept of operating leverage as discussed earlier, itmust be pointed out should not be confused with investor return.When a yield is obtainable but strictly derived from financial leverage,under the latter criterion, danger in fact may be imminent. Whilst notproviding an immediate answer to the problem as posed, Argenti11 9761 nevertheless appeared correct in his forewarning that:
"I-lI aiing ari êwtum ckthim are the dass136)
Whilst the capital structure that produces the highest firm value at thelowest cost of capital to its investors under high gearing may indeedseem to be the most optimal one, without the benefit of total leveragesuch structure is due to fall short of actual value-maximisation. Theultimate result i.e. value capital, is the monetary value or value-addedbeyond the value that could have been obtained on the basis of eitheroperating or financial leverage only. It is the combination of increasedefficiencies in the utilisation of assets and the careful and effectiveapplication of financial leverage that can significantly increase resultsfrom operations.
44

32 Value-chain Effect of Integrated Operating and Financial Leverage
The value chain represents the business process of the firm, usuallymoving from one department to another, whereby the monetarycontribution to profit or value-added may differ from one function ofthe business to the next. For example, warehousing and distributionfollow onto production but their contributions to profit differ. Toomuch unnecessary inventory prior to client sales for example, wouldnot add value in this chain of events.
The impression which seems generally held about the value-chain isthat conceptually it is applied in what would be regarded aseconomically good times, thus further augmenting the prospects andresults of the firm. The fact is that the value-chain effect of integratedoperating and financial leverage can be mobilised in prosperous as wellas declining economic periods. To use an example, in a depressedeconomic climate; some may argue that value-added would at best notbe much more than the necessary cash flow to prevent depletion of afirm's working capital. However, this is better than having theworking capital eroded or falling away. Value-added under thiscircumstance can still be obtained by improving quality and loweringcost. Having said this, the value-chain can effectively add more valueon a compounded basis through its incremental processes if based ontotal leverage. That is, efficiency and value-added achieved in onedepartment in the chain of operating events will have their naturalmultiplier effect on subsequent departments, increasing results. By wayof illustration:
A well published business case which also appeared in the Economist [1991] quoted
companies subjected to high debt repayments to be highly stimulated in reducing
delivery times of goods and improving operating earnings almost immediately. A
particular case referred to was that of Sealed Air, a worldwide packaging firm (pp. 94-
45
95). Bringing under-performing companies out of their relative complacency by injecting
fresh capital together with the discipline of debt, a method reportedly applied with
much success at Sealed Air, was suggested as a way forward. Yet, even in this example,
value-added dearly is achieved by enhanced quality and lowered cost in the face of
leverage. Without this, results would not be sustainable.
In this respect, under the M&M theorem, the clear lack of emphasis oroversight regarding operating leverage has resulted in a less thanadequate focus on the issue of optimal capital structure. Perhaps toomuch emphasis was left on high leverage strategies in the purelyfinancial leverage sense. Naturally, it is easy to adopt an over-censorious attitude towards any unfounded high debt theoiy. To besure, what is not intended is to criticise the M&M tax-adjusted leverageproposition which offsets the costs of debt finance (see Section 2.1).Instead, of concern is the absence in formal M&M theoly of the valuecapital effect, reflected in total leverage. An argument can be made thatif this concern was not justified, the optimal capital structure would beall debt.
The above statement regarding all debt is of course only valid in theabsence of distress and other costs. From the foregoing it should also beclear that where reference is being made in this study to a high debtstrategy, such is strictly under conditions of total leverage. Even then,the resulting high debt cost structures are not entirely without hazards.For example, restrictive covenants in loan agreements may still resultin a foreclosure on the firm before valuable initiatives on the part ofthe firm itself can be implemented. This in any event is a relativelywell known exposure as a potential cost of debt finance. Also, it wouldbe difficult to see how a less than reasonable debt exposure couldoutweigh the advantages of interest writeoffs under current tax laws.
46

However, there are additional reasons why an integrated approachappears sensible. Put in financial terms, a major issue in creating avalue-chain effect revolves around the question of how much riskshould be taken in assuming debt for operational requirements. Onthis basis, no one should dispute that in business reasonable risks mustbe taken. This is what "leveraging" means. Cooper and Fraser [19901confirmed leveraging", in terms of financial leverage at least, to meanthe following:
"Lng ts the i.e cI lcm-int bcrtrd funds toaauire lii-intert assd albwing the investa tonicrease the expeded Tate of rnhi, bt ai, th acxmnnBte irxie in risk' (p. 364)
In terms of operating leverage, there naturally have been variousoccurrences of significant change, paradox to the established formaltheory, now under criticism. For example, following detailed analysisof 12 large US multinationals, Donaldson [19841 found managers ofmultinationals not necessarily driven any longer by the maximisationof their firm's value (a. p. 3). Rather, their interests most frequentlyhad become one of maximising corporate wealth, as opposed toshareholders' wealth. Corporate wealth then was defined as theaggregate purchasing power available to the firm for strategic purposesduring any given planning period (Ibid. b. p. 22). Similar observationshave since been made by Mahimi [1988] who also studied suchdecision-making patterns relating to multinationals. These managers,Mahimi found, did not negate maximisation of shareholders' wealth;they merely approached it from a different, integrated basis.
What the foregoing describes is yet another example that the M&Mtheory did not adjust on a timely basis in step with developmentswhich have taken place in the real world of multinationals. In
47

retrospect, much of Miller's focus on the resolve of the disequilibriumproblem in the opinion of this study, is still born out of M&M's failureto address more forcibly this issue of operating leverage at the level ofthe firm. Equilibrium under the established M&M theorem thus farhas remained illusive. What matters should not be voluntary re-capitalisation for purposes of tax benefits, alternatively in defence of anunwelcome takeover or as a form of self takeover. Yet, often thisappears as what is emphasised under formal M&M theoiy. Rather, atissue is the attainment of an optimal capitalisation which makes theidea of voluntary re-capitalisation redundant. Therefore, what mattersis a design for leverage-increasing capitalisation which preempts theneed for leverage-increasing re-capitalisations. The value capitalconcept can play an important role in this. This is embodied in the totalleverage approach which appears consistent with the requirement ofmultinationals for adequate debt capacity.
The next sectidn reviews further the economic determinants of.leverage's underlaying debt capacity. The survey later in the textoccupies itself with the cultural determinant in the context of culturalinfluences on international capital structure.
4. Economic Determinants of Debt Capacity
The foregoing sections discussed the merits of a capital structure policybased on total leverage to achieve the desirable chain effects of value-added from operations and create value capital. These effects arefrequently based on synergetic improvements derived from financialleverage with the additional benefits of operating leverage but stilltreated as a separate issue. This study proposes a more integratedapproach. However, such prerequisites that the necessary debt capacityis in place. The link of debt capacity to this study is explained in further
48

detail below. However, as indicated earlier, evidence will show that thecapital structure issue cannot be totally divorced from geography andcultural influences, one of the main concepts in this study.
First, in the economic sense at least, it is important to appreciate thatwhile a capital restructuring may take place under financial leveragewhenever a company decides to substitute one capital structure foranother, such is by no means a measurement of business risk In orderto value-maximise shareholders' wealth, the firm has to maximisepresent value of its expected cash flows subject to balance sheetconstraints. It is these constraints that constitute the debt capacity.Bower [19831 made a similar observation. As Bower said, the debtcapacity of the firm to reflect the timing, certainty, and magnitude ofits cash generating capacity while determining limitations on debt-to-equity (pp. 83-90).
The above in a way sums up the effect of debt capacity but does notdefine it. Debt capacity in this study is defined specifically as the abilityto borrow. For value-maximisation, good financial planning is critical.Powell [1986], when studying high growth companies was sufficientlyperceptive to forewarn that the planning of financing requirementsinduced by growth should not be overlooked (p. 265). Without value-added and the value-chain effects, this would be difficult to realise. Theassumption made for this example therefore concerns a firm with acapital structure based on debt-to-equity under total leverage. Even so,it can be argued that assuming a given firm does borrow up to its debtcapacity, the growth rate that can be achieved under equilibrium willstill be relative to this, meaning that it has its limitations. The resultinggrowth rate therefore becomes the firm's sustainable growth rate. It isthe growth rate the firm can maintain given its debt capacity, return onequity (ROE) and retention ratio. Put differently, that is to what extentthe firm can grow without changing its debt ratio.
49

Whilst the above debt ratio maintains an equilibrium, for growth tochange, the firm will be compelled, bar some exceptional capacity (e.g.access to expertise to turn around the company's fortunes), either to sellequity or seek external financing.
Apart from the financial-economic considerations in the technicalsense, the study takes the position that at the practical level most firmsunderstand intuitively that it takes money to grow. Multinationals areno exception to this. Also, culturally, this will hold true in mostcountries. However, a distinction can be made between the funding ofshort term versus long term assets. At some point, any reasonablegrowth in revenues is going to call for increased assets in the form ofaccounts receivable, inventory, or fixed plant. Such in turn requiresmoney to pay for these assets. The growth component arises from anexcess of the rate of return on investments over the cost of capital buttypically does not always take into account the inevitable time lagsunderlaying reinvéstmen'ts in these assets.1 Hece a differentiátioh ismade here between short and long term assets. Bower, asaforementioned, does point at the importance of timing inconsiderations of capital structure but this may need even moreemphasis within the complexities of a multinational environment.Naturally, at the practical level, most people tend to be well aware thatnot having the funds available or not having the growth when neededcan easily bring the firm into a situation of distress. The need forgrowth states these intuitive truths so explicitly that one is remindedquickly of the need for an equilibrium of growth and profitability.Prudence in timing thus remains all important.
A fundamental challenge continuously facing investors andcompanies alike therefore, is how the multinational's considerabledebt capacity and total leverage can be brought into unison. Theobjectives of this study are not to resolve this much wider issue. It is
50

mentioned only to set the opportunity for debt capacity into its propercontext. Within this, the study takes into account those aspects thatenable the multinational to position itself most optimally in terms ofcapital structure. In this respect, the study acknowledges that culturalinfluences and international capital considerations must bedistinguished. As said, this has not been sufficiently addressed informal M&M theory.
The main concepts of this study as indicated from the outset remainthose of the debt ratios, geographical and cultural influences and R&Dinvestment as relates to leverage. The issue as concerns debt capacity,aside from geography and culture, in the first place relates to theeconomic variables. It is in this regard that the survey has identifiedthree specific economic determinants of debt capacity for furtherreview. These are:
4.1 Capital Structure4.2 Cost of Capital4.3 R&D from Leverage
Each of these determinants is discussed in the subsections following.This is undertaken before addressing the international variant whichconfronts multinationals operating in different geographical regions ofthe world as it addresses the overriding issue of the cultural influenceson international capital structure.
The above three economic determinants as highlighted below arelinked to the qualitative analysis of the empirical study. From this, theimportance of cultural influences on international capital structurethen emerges. For example, subsection 4.1 following, links capitalstructure to geography and cultural influences. Subsection 4.2 furtherdetails the link of cost of capital and the debt-to-equity relation in this
51

respect. The last subsection, 4.3, points at the link of R&D levels asderived from leverage within the same setting of cultural realms.
4.1 Capital Structure
This part of the review discusses in further detail what a correct capitalstructure should entail. For example, as Stiglitz and Weiss observed[19831 firms may be credit-rationed or equity-rationed (pp. 912-927).Prather [19711 talked of the optimum size (p. 467) in the financing ofbusiness (Ibid d. p. 448) denoting an optimal capital structure. Capitalstructure in this way can be seen as an appropriate mix of debt andequity maintained by the firm.
This inevitably opens the question of what the best way to raise cashcould be in order to fund fixed assets and what an optimal mixture oflong term debt and equity holdings ought to be. .It is the firm. that mustdecide sooner or later on the specific mixture of long term debt andequity it will need to fund its operations. The debt-to-equity positionsof multinationals as a result, bar geographical and cultural differences,tend to be firm-specific.
This needs to be put into further context. For example, Duffie [19861made the interesting observation that as long as leverage and activecorporate allocations to financial policies were being satisfied, prospectsfor innovative and creative finance would present themselves. Hecht[19861 confirmed that where the cost of debt is tax deductible, theremaining equity indeed attracts high leverage. This is especially thecase in the event earnings potential in equity is high (p. 38). Thus,composition of debt-to-equity, hence capital structure, does matter. AsRobbins and Stobaugh [1972] already observed, the internationalmobility and movement of capital (pp. 354-357) is another balancing
52

factor. Money simply tends to seek the better investment returns fromoperations, even if it has to search on a worldwide basis. This presentsanother interesting aspect on the same theme of geographicaldiversification. Such can be observed from the link between the debtratio based on total leverage, its geography, and ultimately the culturalinfluences as affect the multinational's international capital structure.
The ensuing question as to whether adequate funding is available tonot only fund these capital structures but to do so on a sustainablebasis, should not be an issue. Not only investors but also principals ofcompanies appear continuously on the lookout for oppoltunities toinvest in what they perceive as attractive firms. Internationalinvestors, corporate financiers and some entrepreneurs by the sametoken naturally will follow the performances of firms internationallyand therefore increasingly invest in multinationals as opportunitiespresent themselves.
4.2 Cost of Capital
According to Ross et al in their recent study [19911, the capital structurethat maximises the value of the firm should also be the one thatminimises the cost of capital (Ibid j. p. 491). Earlier, Shapiro [19781already noticed the relation between financial structure and the cost ofcapital, as concerns multinationals (pp. 211-266). When dealing withmultinationals, it is also the case that the subject of the cost of capitalcannot be entirely segregated from that of inflation because of thepossible impact on the expected corporate earnings rate. Internationaltrends in financing are already such that they are increasingly havingan impact not only on the firm's access to funding but also the returnsit could expect. Because the relative currency values will vary, theexchange rate itself must be taken into account. This is discussed indetail in Chapter III, subsection 4.3.2. Notwithstanding the increased
53

mobility of capital worldwide mentioned before, some countries thathave a different inflationaly trend and balance of payment outlookmay well offer lower levels of capital costs (the actual cost of moneybeing the difference between the inflation and interest rates). AlsoHarvey-Jones [1993] observed that the cost of capital and financingcustoms of a countly can differ enormously, citing Germany, Korea,Japan and the US (a. p. 49). It can be said therefore that variation in costof capital and expected corporate earnings rates is born out of thedifference of the financial market system between different countries orcountry groupings. For example, UK institutions expect roughly doubledividend payout compared to Japanese. There is also a strongexpectancy for these to happen within forecast and with regularity. Atfirst glance, the foregoing may appear to some as a cultural factor ratherthan one of the economic determinants of a firm's debt capacity.
Having said this, one must bear in mind that, regardless of locationand culture, firms in the main still have to deal with shareholders andbondholders. The interests and time horizons of these shareholdersand bondholders as relate to leverage options may not be the same. Asthe financing mix naturally becomes adjusted from time to time thisfrequently results in the uncompensated transfer of wealth betweenbondholders and shareholders. Ironically, in the real world, resultinglitigation demonstrates that capital structure of debt and equity mattersa great deal after all. Meyers [19771 in fact suggested close monitoring ofbond financing transactions and their costs was necessary (a. pp. 147-175, Ibid. b. p. 207). Much of this has to do with time horizons and theirperceived risks. Durand [19521 even dismissed the longer term viewaltogether when assessing riskier capital structures (pp. 215-247). Thecapital market still appears to react to short term profit potential as itdid before. Here the predominant view is that capital markets do notdiscount dysfunctional consequences that might accrue from decisionsbased on short term horizons. However, not everyone agrees. The
54
question as to whether capital markets are myopic according to Marshremains debatable [In Short-Termism on Trial, 1990]. Taggart in hisobservations takes a moderate view, albeit leaning towards the longerterm nature of debt. In summing up his survey on corporate debt,Taggart [19861 concludes that in view of the volatility of thecomposition of total fund sources, measured over a period of 15 years,it would be premature to assume any long-run trend towards riskiercapital structures (pp. 35 - 42). At the same time, Taggart stressed thelong-term cyclical nature of debt ratio patterns. Thus, except for thehigher risk/higher reward capitalisations, changes if surveyed across allfirms, take place only slowly and over considerable periods of time.This is further commented upon later in this survey (Section 5.Cultural Influences on International Capital Structure).
The foregoing would seem to imply that in the main, the emphasis onprofitability by the capita! market assumes the underlying finance mixto be firm-specific at any point in time. Specifically, the cost of capital inrelation to this is less of an issue if one assumes that managers andtreasurers of multinationals have the whereabouts to find the mostoptimal financing and funding for their respective finance mix.However, to be complete, there are further costs of capital to beconsidered. Jensen and Meckling [19761 identified agency costs (costs ofmanagement) as being of distinct relevance when evaluating corporateinvestment considerations. The costs incurred by shareholders inensuring that managerial decisions conform to the interests of thosesame shareholders, they must be measurable (pp. 305 - 360). Buser andHess [1986] implied that the cyclical behaviour of the debt ratio (referredto by Taggart) be linked to tax induced levels of leverage, debt capacityas well as "debt weight" cost of capital incurred by the managementnecessaty to run the firm. This "debt weight" cost as generally known isthe agency cost of management representing shareholders or owners byweighting the firm's debt. Such costs in fact encompass the agency costs
55

of managerial decision-making, that is other than loss of deferral ofinterest tax-shields due to prospective contraction in the form ofbankruptcy and present value of such prospective contraction costs.Buser found that:
"The -npiiical evidence ai the cyclical behavic&iriittiredly anfim the predetion cl lheais that
are dtActhat ansefi fl ti d1bdveen fl n persthetax-shieki value 'sus cghci "deli wie' costs Cl deli"
a35-356)
More as matter of principle than practice, Miller [1967] (in "Debt andTaxes") suggested a role for offsetting these types of costs of debt indetermining optimal leverage choices (pp. 261-275). Stiglitz [1988]further provided models for such costs to be incorporated. Anobservation of these models did not remove the suspidOn ofinadequacy and contributed to the decision made later in the researchnot to resort to econometric models for purposes of the aims set in thestudy.
This may well function as a reminder of Miller's theoretical, primarilymacro-economic propositions which saw equilibrium as the resultantof perfect capital markets. As Solomon [1963] already cautioned, theolyand precise models may lead to an illusion of a degree of precision andcompleteness that simply does not exist in the real world of business (p.273).
4.3 verage for R&D
The importance of possible influences of leverage on a firm's mergeror acquisition activities as may affect levels of R&D in relation to the
56

debt ratio has been mentioned at the beginning of this review (Ch. I, p.3). The impact of leverage on R&D (referred to as R&D from leverage)is a pivotal issue which must be understood so that properinterpretations may be drawn from the results of the study.
The background question as often arises is whether a higher level ofdebt resulting from a merger or acquisition might result in a lowerlevel of R&D investment. An immediate answer could be that,essentially, highly leveraged acquisitions have been suspect. Theimplication was that after the cost of funding not enough would be leftto spend on R&D or alternatively that R&D would become a functionto be economised, at least in the short term. However, the results fromthis review seem to point to the contrary. For example, a major surveyof 800 R&D intensive companies in the US between 1984 - 1987,representing 95% of total private sector R&D, indicated an increase inR&D parallel to intensive acquisition. activities undertaken during thesame period ([1984, 1985, 1986 and 1987] R&D Scoreboards). In additionand separate from this, data released by the Securities and ExchangeCommission (SEC) [1985] also measured the effect of leverage on R&D.Similarly, as the SEC study revealed, increases in institutional holdingsdid not decrease R&D. As acquisition activities increased, totalspending on R&D remained competitive, the increase beingindependent. Having studied the same SEC data, Jensen [1988]concluded:
UI know c no dence that suats the arumits thattakeos reduce R&D expditure n thc*igh this is
a parunent argumt amcig many c those 4iofaxir i&icIia ath '(]Id c p 27)
Furthermore, Hall B. [19871 having studied manufacturing firms in theUS in this context (Survey [1976 - 1985]) states that acquired or non-
57

acquired firms in the same industly do not behave in a markedlydifferent manner. In her study, acquired firms did not have higherR&D expenditure prior to acquisition while non-acquired firms did nothave higher or lower R&D versus those acquired. R&D expenditure inHall's study, similar to that of the previous studies mentioned, wasmeasured by the percentage of R&D to revenues. The same criteriontherefore is applied later when integrating the results of this study.Hall based her findings on approximately 600 acquisitions, concludingthat:
"Fimis in.olved in meis showed no diffc inthar pie -and pct m R&D peifomiarce oflue nd so noY' (ni 1
In fact Narapareddy [19871 went as far as to say that he saw a linkbetween R&D intensity (fixed capital + working capital/R&D) andcapital intensity (fixed capital + working capital/sales). Griliches [inBoskin, 1988] even suggested incorporation of R&D into some form ofgrowth accounting (a. pp. 14-15; [1979] b. pp. 92-116) and to treat it asanother type of capital (c. In Williams [1973], pp. 59-95). Others likeTerleckzjy [19741 claimed to perceive (but did not prove) a strongercorrelation between new R&D investments where new funds wereapplied, versus ongoing financing of R&D investments already inplace. Put differently, new R&D investments in new technology wouldyield better increases than that of capital of existing R&D investment.No evidence was found. Boskin [19881 attempted to clarify a similarthought through his so called Embodiment Theoty stating that:
'It is mudi too epvetobodynewtethncogyindd caçñtal I crnwtiing it - enthodiment lil<e learningcreates a positiw cotTelaliofl between the investmentand gmrvAh rates" çp 76-77)
58

However, the literature does not appear unanimous about underlyinginfluences that would support this perception or how R&D should beleveraged. Also timing, again, seems to be an important factor. AsSchmookler already said (in "Invention and Economic Growth" [19661),the direction R&D takes in the short run depends largely upon profitpotential. On this basis, technological change in the short run mainlyoccurs as an unplanned process in the unrelated pursuit of manyindependent firms. Yet Mesthene's view (in "Technological Change"[19701) was that technological change, also in the long run, dependslargely upon the state of scientific knowledge i.e. basic R&D. Suchdevelops haphazardly Mesthene said, that is through the accretion ofmany small items of knowledge from many independent sources.Thus, with the literature continuing to disagree, the incentives had tobe other ones.
To Varian, it was the market for corporate control, i.e. takeovers, thatserves as an incentive device for firms to perform in the sharehdlders'interest (Ibid. b. pp. 8 - 15). The relation between leverage and R&Dwould seem to play an important role in this. If working efficiently asRybczynski said [19891, the market for corporate control itself will helpto accelerate the phasing out of activities no longer viable due to lack ofcompetitive advantage or simply bad performance. One can speak inthis instance of the efficiency of leverage as affects value-maximisation.However, in the context of leverage for R&D, the question then quicklybecomes whether e.g. a Japanese firm with a high debt-to-equity andhigh R&D is necessarily more efficient. This is difficult to answer. Acomprehensive study conducted by the Organisation for Economic Co-operation and Development (OECD [19841) documented howdifferences in funding and capitalisation versus R&D costs can makecomparisons difficult. For example, some R&D funding occurs off-balance sheet on a project basis. Differences in accounting and balancesheet interpretation are another and complex matter. Also, as is well
59

known, R&D may be expended and written off against the profit andloss account or capitalised on the balance sheet. In this study, theseissues are further dealt with in Chapter III. Methodology.
5 Cultural Influences on International Capital Structure
This section relates to the second and third research questions whichdeal with the critical issue as to whether there exist industiy or countryinfluences that would explain the differences between capital structuresof multinationals and whether or not there is an indication ofdirection of such pattern.
Operating in different geographical areas of the world as a result offinancial diversification is a serious challenge to the variations inoverall debt capacity of the multinational. Amongst all variablesexamined in this study, the one on cultural influence carried most ofthe surprise element. It is fair to say that at the outset of this research,its importance may have been underestimated. The awareness of theexistence of cultural influences on capital structure has brought a newdimension to the interdependence argument of economic and culturalvariables. Cultural influences as experienced by multinationals resultfrom financial diversification on the basis of geographical expansionand thus the debt capacity factor. As Lessard [19781 observed, there areworld, country and industry relationships in equity returns whichimply risk reduction through international diversification (pp. 32-38).Senbet [19791 further saw an equilibrium between international capitalmarkets and multinationals (pp. 445-480). In addition, the combinationof geographical financial diversification and the firm's debt capacityimpacts the aforementioned time concept, i.e the timing of financingand investment decisions and thus the debt ratio relations and cashflow. Therefore, geography and debt capacity can be seen as linked to
60

produce well timed cash flows, in turn providing debt financing.Examples are given further below. Preempting Jensen in this respect, itwere Gentry, Newbold and Whitford [1987] who stated that it was thelevel of speed of each cash inflow and outflow component that reflectthe operating investment and financing decisions of the firm (pp. 595 -605).
The above was a step in the right direction but the variable of culturalinfluence is still absent amongst the various theoretical considerationsthis entails. Having said this, international transactions, policies issuedor decisions taken by multinationals are rarely entirely free of culturalinfluence. For example, in contrast to Jensen, when Tsumuri K [1983]observed that the Japanese always place investment decisions beforefinancing decisions there was no doubt an implication of culturalinfluence (pp. 43-50). This is explained in fact by Japan's latedevelopment of its stock market. Trading volumes in equity on theTokyo stock market compared to other major stock exchanges in theworld remain relatively thin. The supply of debt financing on the otherhand has been rather abundant compared to other financial markets.For example, Japanese firms are known to frequently use debt financeto fund sub-contractors. In this way, short to medium term accountsreceivable are rolled over regularly, eventually adopting features ofequity.
Ignoring these type of observations as relate to cultural influences oninternational capital structure, would make comparisons difficult andgiven the growing interdependence of global business, probably lessthan accurate. The situation described derives from different historicaland socioeconomic evolvement across main areas of world markets.
As a method to measure leverage relationships in this sense, Broek[19731 perceived the world as homogeneous groupings of cultural
61

realms. These realms differentiate from other groupings based onsignificant differences in composition, and their integrated traits. Ofthose studies on capital structure surveyed, only Collins and Sekely(in their 1983 exercise) attempted to explain the reasons behind thecountry effect of culture on leverage (pp. 45 -51), [Publication 1988] (b. p.88). The study by Collins and Sekely [19831 seems to be important and istherefore worth an explanation in the sense of what variables wereused and in what way. This explanation is set out in the remainder ofthis chapter and further into the next chapter on methodology. Thepremise of these authors has been that any movement towards optimalcapital structure reduces the cost of capital and increases the value ofthe firms. However, they found the topic becoming more complexwhen moving from consideration of domestic to multinational firms,concluding that capital structure differs internationally.
Earlier studies as are detailed further in this survey (Section 5.1. TheCultural Determinant) foUnd differences of country and industry incapital structure to be significant, e.g Stonehill and Stitzel [19691 albeitnot in all cases, e.g. the studies of Remmers et al [19741, pp. 23 - 32, Toyet al [19741, pp. 875 - 886, Errunza [19791 pp. 72 - 77 Aggarwal [19811 pp.75 - 88. Here the significance was not in every case examined. Othersfound no significant difference by industry or country-specificeconomic variables but did find significance of cultural influences, asin the case of Ball and McCulloch [1982]. Collins and Sekely however,had examined several economic variables (size, tax rate, inflation) butfound no significant relation to capital structure.
In the subsequent study by Collins and Sekely, referred to earlier (1983),a breakthrough was achieved when significant differences were foundin capital structures of firms headquartered in different countries andless evidence for significance of industry. A total of 411 companies in 9industries in 9 countries were studied. In their most comprehensive
62

review, Collins and Sekely [19881 presented the combined results of 677firms in 9 industries in 23 countries. These results reflect on the capitalstructure and debt capacity of the firm and can be summarised asfollows: (a) there appear significant differences in capital structures forfirms headquartered in different countries, but less evidence is foundas to the significance of industly, (b) on this basis, high debt appearsmore of a phenomenon in the Mediterranean countries and countriesof the Indian Peninsula, and (c) medium debt seems more typical forWestern companies (Ibid c. pp. 91-96).
In view of what has been said in the foregoing paragraphs, it needscarcely be emphasised that any debt ratios in the sense of total leveragemust be related to cultural influence which comes with geographicaldiversification. Collins and Sekely found that disciplines (other thansize, tax rate or inflation) such as cultural factors had to be considered.They asserted that minirnising cultural differences, as financial theolytends to do, might be a serious mistake. To make their point theyquoted Ball and McCulloch who had said that:
'flie study cI faeign ailtures is ci pimaly impottanceto thce in intemal.icnal business because culturaldifferces emit a perszve influe cn all txisines.sfunclioris" (p 88)
The views as have emerged through the entirety of this literaturereview are no different. In the empirical study, as in that of Collins andSekely, there remain three areas of topical interest that are critical inthe definition of cultural influences on international capital structure.These are:
5.1. The cultural determinant5.2. Significance of industry and country influences
63

5.3. Significance of countly group influences
The theory as exists on each if these areas is reviewed in thesubsections following before entering the actual analysis stage.
5.1 The Cultural Determinant
The cultural determinant can be defined as the sum of the culturalelements that play an important role in the totality of culturalinfluences. These cultural influences affect international capitalstructure. Cultural aspects of debt do influence capital structure in agiven geographical area. Importantly, the material culture that is mostclosely related to capital structure tendencies of a given marketincludes different fiscal and legal aspects that give rise to differences inproperty rights. Immediately, one is reminded that the debt-to-equityposition under total leverage is the preferable type of debt ratio to beused. In the main, most countries tend tobe balance sheet oriented. Atotal leverage approach in the debt-to-equity calculation is responsiveto this. Different capital market phenomena, each tend to have theirown historical and socio-economic explanation. As indicated earlier,Collins and Sekely felt that specific areas most likely to influencecapital structure included:
"dilletent legal and tax systeim di then g nse topopeityiits aats ailftnes" (d p 9)
Having said this, as these authors acknowledged, if this culturalinfluence exists it should be reflected in the similarities oforganisations situated in countries having similar culturalbackgrounds.
Given the previous studies that indicated cultural factors to be
64

important determinants of capital structure, this study attempts toestablish if some underlying relationship among country groupings,matching world markets, can be shown to influence capital structureand help explain capital structure differences. Earlier work for example,in this respect supports the contention that firms headquartered in thesame country have more similar capital structures than those firmsheadquartered across countries (Collins and Sekely 1983), and thatfirms within an industry have more similar capital structure thanfirms across industries (Scott 1973).
In this study, the same variables are used as in that performed byCollins and Sekely, i.e. those of the debt structure of firms studied onthe significance of industry and country effects in determining capitalstructure, and the basis of countly differences. However, whereas thoseauthors used secondary data, (resorting to Moodey's, commented uponin Ch. III, Methodology) this is an empirical study using only primarydata.
Interestingly, Kogut and Singh [1988] having studied the effect ofnational culture on the choice of entry mode when doing businessinternationally, also focus on the cultural distance between countries(p. 411, p. 414). However theirstudy was of a more contextual value.The cultural distance by countries in practice is perhaps best measureddirectly at the level of the firm where its impact is most immediate.This is reflected in the capital structure. As Harvey-Jones observed:
'The levels of borrowing and geaiing which areacxable to tuticx-isha'e always ned encmislybetvei ccinthi&' (lId Ii p 51
Harvey-Jones further concludes that history, national preference,vested interests and political factors all tend to hold back our ability to
65

take advantage of the opportunities that modern technology andcommunications have created for a single, efficient market. Givenwhat has been said so far, it should need little further elaboration thatthe debt ratio in the sense of total leverage must be related to culturalinfluence which comes with geographical diversification. Rutterford[1988] stressed this importance of cultural interpretation bygeographical area. As pointed out by Rutterford, a high tax-to-debt ratioin a given country for example is not necessarily related to a highaggregate leverage ratio (pp. 194-206). Thus, there had to be more tototal leverage than the tax incentive. Hofstede [1989] observed thatmanagement culture in the geographical areas concerned could rangefrom a relatively low level of risk aversion e.g. Anglo-Americancountries, to those countries that are medium to stronguncertainty/ avoidance oriented e.g. countries of the South East Asiarealm.
Given the above, some cultural rather than purely fiscal interpretationof the resulting capital structure may be required. Therefore it was feltthat an examination of the variables of debt structure, industry andcountry effects was necessary. Cultural differences could then becorrelated. The so-called Kruskal-Wallis Methodology shows how thismeasurement was built up (Ch. III. Methodology).
5.2 Significance of Industry and Country Influences
The literature still indicates differing views on the significance ofindustry and country influences in the determination of capitalstructure. In a first examination of this kind no significant industryeffect was found for firms of the same industry but who have theirhead office in different countries (Stonehill and Stitzel 1969, a. pp. 91 -96). These authors, having examined economic variables such as size,tax rate, inflation, by country, found no significant relation, to capital
66

structure (Ibid. b. pp 618 - 619). Next, Scott's study (1973) contended thatfirms within an industry are more similar than those across industries.Later, other studies, as previously noted, showed industry as well ascountry effects to be significant but as in the case of Scott, none of theseexplained the reason behind the country effect (Remmers et al, Toy etal, Errunza, Aggarwal). Having said this, whilst the concept of firm-specificness is not free of ambiguity, that of industry lacks precision.
Therefore, the question here is probably more whether it is stillsensible to classify firms that produce quite diverse products which aredistributed on a multinational or global basis and to then refer to theseas industry? The word industry just may be too imprecise. Noteveryone will agree with this view. For example, Bowen, Daley andHubert [19821 claimed to have evidence on the existence anddeterminance of inter-industry difference in leverage (pp. 10-20). Thus,some importance was attached to the use of industry comparisons. Toresolve the industry issue, rather than replacing industry classificationswith cash flows, as some may have viewed it, an argument can bemade to do so within the proposed total leverage approach. As thisstudy will show, this approach afterall provides more commonality forbalance sheet comparisons of multinationals, taking into account thecultural influences on capital structure.
As to specific country influences, in the latest Collins and Sekely study,significant differences were found in the capital structures for firmsheadquartered in different countries. Whilst the researchers suggestcultural difference as the factor influencing the capital decision, it wasonly after the most recent study that the cultural factor could bedemonstrated as an important determinant of capital structure. Noattempt had been made in their earlier study to measure the culturalinfluence. Stonehill and Stitzel earlier did suggest significance ofcultural influences but in fact did not measure or explain this
67

phenomenon either. The contention following the last Collins andSekely study is that firms headquartered in the same country havemore similar capital structures than those headquartered acrosscountries.
Established financial theory as aforementioned, still minimises thesignificance of cultural differences. The M&M propositions andinvariances as seen exclude the international variable altogether. Thisis a serious shortcoming given that cultural differences can haveinfluence on policy decision. The author of this thesis, as did Collinsand Sekely in their paper, accepts that a capital structure results fromfirm-specific policy decisions. There is also agreement on the view thatthese are mostly based on management's assessment of risk relative tothe benefit of applying fixed-cost debt financing. The firm-specificdecisions taken by management utilising this basis naturally make fordifferent capital structures for firms in the same country or industry.Yet such differences are bound to be less than the differences that existacross all countries or all industries. Therefore, cultural influences oninternational capital structure do appear critical.
5.3 Significance of Country Group Influences
To date, none of the studies conducted has evidenced significances ofrelationship between economic variables and the internationaldifferences that exist in capital structure. Given this and based on themore recent conclusions of Collins and Sekely that the cultural factor isan important determinant of capital structure within a country, thisresearch further examined whether some underlying relationshipamong countries could be established. Such a pattern of countrygroupings or cultural realms influencing capital structure, goes beyondthat of simple economic variables. Capital structure differences on thisbasis lead to the necessity of having to explain what is meant by the
68

relation between debt and culture.
Interesting patterns for management can be derived from this so as toidentify the use of debt based on firm-specific debt ratios by majorregions of world markets. The results in turn can be linked to theapplication of leverage to corresponding regional markets for products,goods or services. In this way the firm's financial resources areoptimised. However, what is important is to keep in mind that debtrelationships are of a longer cyclical nature than generally perceived.For example, the use of debt by companies in the US (Survey Taggart[1986]) whilst reaching 45% of fund sources in 1984 on the whole hasbeen declining since 1974. As Taggart explained [Ibid 19861, when thedata were adjusted for inflation (in 1984), debt proportions did notappear unusually high by historical standards. However, the levels ofthe debt ratios may well vaiy considerably from countty to countly andbetween or• within country groupings, given the cultural influences oninternational capital structure. Therefore, the assumption being madeat this stage is that knowledge and understanding of debt patterns canbe critical to effective financial planning for multinationals.
The variability of firm-specific debt ratios by cultural realm (not theiraggregate cycles of debt relationships which as said are slow) thenbecome the subject for further examination. However, this requirescapital structure patterns, where consistent, to be analysed for industry,country or country group effect. This exercise links the theory and theabove assumption to the empirical analysis.
69

6. Summary
This survey fits the central theme of leverage and optimal capitalstructure for multinationals. It answers to the question 'what isleverage?', defining what constitutes total leverage in this context. Itbrings together from an incoherent universe the various economicvariables as may determine and stimulate leverage, as well as thedeterminant of cultural influences on international capital structure. Itthen categorises and explains the interrelationship of these variablesand answers the question what leverage means in terms ofinternational capital structure. In doing so it helps close the gapbetween existing theory and the real world of multinationalcompanies.
This structured review suggests that the optimal capital structure• . should be one where its debt-to-equity relation is based on total
leverage and one where debt patterns of cultural realms have beenconsidered in financial planning and the provision of capital. Thestudy explains the concept of total leverage and directly related to this,the importance of equity and cultural realms. It then explains why adebt-to-equity position under total leverage is preferable to one basedon financial leverage only. This allows for the multinational firm toapply leverage fully and to arrange its capital structure most optimallyin line with which geographical area of the world it wishes to operatein at any given point in time. However, the existing literature on thesubject remains discordant and flawed with defects. The level of detailprovided on selected important studies shows this gap. The defects canbe summarised as follows:
(a) Financial theory, even in its most recent modified form suggests theabsence of an optimal capital structure under total leverage. Financialleverage is too narrow a concept.
70

(b) Extensions to the theory are inadequate in that they fail to allow forother considerations such as the cultural influences on international
capital structure.
The survey confirms these gaps in the existing literature. This studyindicates the need for a total leverage approach as opposed to thatrestricted to financial leverage. This takes into account themultinationaVs total equity and the cultural influences oninternational capital structure which need to be measured. Thechapters following concentrate on this specific matter.
71

CI-IAFTER III
METHODOLOGY
1. Introduction
This chapter is mainly concerned with the data, the role of thequestionnaires and how the data bank was acquired. It demonstrates inthis manner how the study differs from that of Collins and Sekelyreferred to in the previous chapter, even though the samemethodology is being applied. In the opinion of this study, the sole useof secondary data by Collins and Sekely [19881 (a. p. 90) as a basis fromwhich to extrapolate meaningful, remains debatable; the nuances andcomplexities of the real world of multinationals necessitates the use ofprimaiy data.. For this reason, this study initiated the use of such :data.
The objective of this study as reviewed in the literature review, is toassess the relation between the debt ratio of multinationals and theirindustry or country association. The basis on which the capita!structure is being examined is that of the debt-to-equity relationshipunder conditions of total leverage, as explained before. What is new isthe development and use of a primary database. The study investigatesthe extent to which disclosure requirements of the London StockExchange as related to annual reports are complied with or exceeded.This includes voluntary disclosures made by foreign firms. Theconception and development of this database was a formidable task asdiscussed later in this chapter. The more significant requirementrelating to foreign company's annual reports has been the compliancesought with professional accounting standards i.e. (a) Statements ofStandard Accounting Practice (S SAPs) issued by the UK professionalaccounting bodies and (b) the equivalent standard as conforms to the
72

practice in the United States i.e. as issued by the United States Securitiesand Exchange Commission (SEC) and the Financial AccountingStandards Board (FASB).
Whilst only a certain proportion of the sample population in this studymust comply with US requirements, it is believed that the strongdisclosure system of the US can exert reporting pressure on (a)multinational firms whose securities are internationally traded eventhough there is no direct requirement to comply, and (b) privately heldfirms who either seek international status or funding Also Choi [19731found competitive market pressures and pressures to raise capital wereensuring continuation of the trends towards extensions in disclosure.
Compilation of the database required extensive use of questionnaires,samples of which are provided in the General Appendix As indicatedin the literature review, it was felt that the use of secondary data wasinadequate. This explains why an empirical study was necessary. As isfurther commented upon, this constitutes a major difference betweenthis study and that of Collins and Sekely.
The resulting database allows for a more thorough treatment ofleverage in all its aspects at a level of much greater detail, providing fora deeper analysis and interpretation. It positions the relation betweenthese variables and their relative ranking so as to establish discerniblepatterns from which such interpretations can be derived.
The proposed examination of debt ratios to analyse industry! countryrelationships (which Collins referred to as industry/country cells) forconsistency will shed further light on the issue. The examination is totest in this respect (a) the industry rankings among countries and (b)the country rankings among industries. Where such patterns ofconsistency can be identified in capital structure by industries,
73

countries, or furthermore, countly groupings, these may then provideclues for further analysis of cultural influences on international capitalstructure.
This chapter prepares the data for such examination. It is broken downinto six specific sections:
(a) Hypothesis and Test Format(b) Construction of the Data Bank(c)Statistics on Capital Structure(d) Statistics on R&D, Growth(e) Classification of Cultural Realms(1) Sources of Information
These sections describe the research procedure, problems encountered• and . solutions.. The chapter fully substantiates the difficulty
encountered in setting up the database. For example, it must be kept inmind, again, that not all firms in the sample are publicly held and thatsome are located in developing countries. Therefore, in addition to thestandard questionnaires, specially structured questionnaires had to beused on a consistent basis, individually completed by firm. Even so,due to observed inaccuracies and proneness to culturalmisinterpretation, these needed further verification.
The following procedure was used to establish the necessaiy data onany of the sample multinationals. (For the purposes of this study, thedefinition of a multinational is given in Chapter I, Section 3).
Firstly, information was initially derived from published accountswhere available. However, this often proved either incomplete and / orunsatisfactory. Therefore, structured questionnaires as aforementionedwere designed and completed. Additional information and/or
74

clarification was obtained by way of supplementary interviews with keystaff and scrutiny of company reports. Much of the backgroundknowledge of the companies being researched was obtained in thismanner. The procedure followed is detailed in Section 3, Constructionof the Data Bank and Section 7, Sources of Information. Any othergeneral source where useful was accessed for additional information,e.g. the Financial Times, the Economist, Forbes, and Standard & Poor'sRegister of Corporations (including geographically Standard & Poor'sindexed companies in countries other than the United States).
The procedure outlined above permitted the construction of a uniquedatabank This is explained in detail in section 3 of this chapter -Construction of the Databank Considerable attention was given to thequalification of the data; all of the primary data have been subject toaccounting verification. This is important as it is these data that areutilised in the formal non-parametric method of .aialysis . specified inthis study (Chapter IV). Hence, the study is unique from previousstudies. Using Moodey's as a single source of secondary data (as wasthe case in the most recent comparative study by Collins and Sekely[19881), would not have been considered sufficiently reliable. Thus, inthis study, only empirical data were used. These were verified againstthe following standard:
(a)Standards for treasury management of company exposurethat may lead to inflation and exchange rate adjustments underspecific accounting rules.(b)Standards of uniformity, balance sheet preparation and rolesof convertibles and warrants that may lead to further accountingadjustments or as set the way for a better interpretation of thedata.
It is felt that the strict use of carefully examined empirical data
75

constitutes additional value and a contribution beyond the otherwiseexemplary research by Collins and Sekely. This difference of databasewill be a a major recurring factor throughout the examination.
2. Hypothesis and Test Format
2.1 Standards
Further to the above, it was necessary to establish standards ofcomparison and means of measuring to try to examine how capitalstructures are being arrived at and on what basis. Here generallyaccepted accounting principles (under GAAP) were adhered to. Howdefined these standards and measurements in fact are, is also a matterof practical importance. If only because of lack of study, shareholdersand management tend to constantly pass judgment. althoughcommonlyquite ill-founded. Whilst there will always remain a needto distinguish between actual and optimal capital structures, this is•largely a matter of performance interpretation as to how managementhas deployed or not the capital that was or could have been madeavailable.
Having said this, it was felt that using the US equivalent if SSAPsunder GAAP was probably the most stringent standard. This is set bythe FASB, the main accounting standard-setting body. The SEC isresponsible for ensuring adequate accounting and reporting standardsfor those firms whose shares are publicly traded in the US. In thisrespect, the London Stock Exchange requirements as aforementionedare an appropriate benchmark.
However, the London Stock Exchange has no requirement fordisclosures on Research and Development (R&D). Section 5.4 Ch.Idefines R&D as the cost of basic research as well as product
76

development expended against profit. The Company Act 1985 requiresUK companies to indicate R&D activities but not their expendituresand investment in R&D. In comparison, in the United States, the SECinsists on filing and disclosure of amounts expended. Yet when lookedat on a worldwide basis, in practice, the issue remains complex. Forexample, the guidelines of the Organisation for Economic Cooperationand Development (OECD) which suggests disclosure of R&D expenses,are not compulsory. Also Gray, Campbell and Shaw [19841 found littleevidence of disclosing R&D or accounting policy for R&D. Similar tothe experience of these researchers, this study found R&D spending asensitive issue. An example is given in subsection 3.2.2 Method 2:Quantitative Questionnaire, related to the Pentel company. Fewcompanies are willing to voluntarily provide information on theirR&D. Nevertheless, voluntary disclosures can be judged against theLondon Stock Exchange requirements as a benchmark. There is everyreason for this.. First, London continues to be one of the majorinternational centres in the world. Further, the exchange's accountingand disclosure obligations are stringent. In this respect, when Meek andGray [19881 conducted a similar survey, they found that, with theexception of the United States, none of the world's stock exchangesinvolved added in any substance to the disclosure requirements facedby their sample companies. This observation also applies in this study.
The above also holds true as to voluntary disclosures that pertainfurther to the debt ratio. The obvious choice of variable on which tofocus remains the debt ratio, since all theoretical determinants areformulated in terms of more or less leverage. Thus, in terms of datacollection, other participative incentives such as the sharing ofcollective data had to be introduced. As indicated earlier, this approachis supported in the theory which suggests that in markets with rationalexpectations there will be managerial and owner incentives to discloseinformation which will enhance future benefits f or the multinational
77

[Kelly; 1983, McKinnon; 1984, Watts and Zimmerman; 1986, Gray andRoberts;1 988. This subject is discussed further form a pragmatic pointin subsection 4.4.2 Balance Sheet, which details the participativeincentive mentioned above, giving various examples.
A last word about the debt ratio and R&D as concerns standards; in thisstudy's view, the underlying capital structure relationship of, forexample, debt-to-equity and R&D, should be such that no further scopefor profitable change exists. At the same time it is accepted that thisrelationship always assumes fluctuations in the possibilities for growthand in the case of a multinational operation, within each countly andbetween the countries or regions where geographical financialdiversification takes place. Having said this, from the point ofconstructing the databank, this was not without difficulty. Consideringthe sensitivity of this type of information (in that it can benefitcompetitors), initially it appeared , unlikely that very much would be.revealed in the annual reports to be examined. Much of the answerwould lay in what standard was to be applied, as is commented uponbelow.
Nothing has been said so far about what can be considered standardpractice by multinationals pertaining to segment data. Gray, Campbelland Shaw [1984] noted the overall level of segmental reportingdisclosure to be low and reporting on the firm's line of business moreprevalent than geographic reporting. Cairns, Lafferty and Mantle [19841who surveyed 250 annual reports of large worldwide companies across33 countries found much inconsistency and variability as to howsegment data were presented. Later, Gray and Robert [1988] observedthat information about revenue and profits, when line of business andgeography is defined by specific product or country, becomes highlysensitive to potential voluntary disclosure. However, if broadly definedby product business or country grouping this was less the case,
78

management perceiving relatively high net disclosure benefits.
In this study, the expectation has been for annual reports to contain,atleast broadly designated, (a) business segmentation, and (b) geographicinformation on revenues and profits. This requirement was applied inthe original selection of companies to be contacted (Section 7,subsection 7.1 further in this text). Standard practice as concerns theStock Exchange obliges disclosure of (a) breakdown by continent whenrevenues outside the UK reach 50% or more of the total and (b)geographical analysis of trading profits when area ratio of profit torevenues is substantially out of line with the norm. Requirements inthe United states under regulations of the Securities and ExchangeCommission (SEC) are broadly similar. At the time of the Gray,Campbell, Shaw study [1984], only 20% of the companies studiedshowed full segment information by line of business and/orgeography, another 20% having restricted segment data. Hence apotential sample fallout of 60 to 80% was observed. In this study, fiveyears later 119891 60% of the initial sample was found in compliancewith either broad or narrow segment data; an improvement incomparison to 1984.
An example amongst the research sample is the Coca Cola Company(Coke):
Coke (Appendix I) in its notes to the balance sheet ("Lines of Business") provides a
breakdown between (a) its principal activity in the soft drinks industry, (b) other
products in the Foods Business Sector (citrus, fruit drinks), and (c) corporate
(investment) activities. In addition ,the company provides a simple breakdown
between its domestic and international business in the core area as under (a) above.
Although not readily provided, calculation of these data available shows that in
1989, the sample year, 81.6% of consolidated operating revenues came from this core
business. Further, geographical distribution was 28.6% domestic, 53.0% international.
In terms of operating income, international proved even more important, i.e. 76.0%
79

versus domestic 19.6%. In addition, the analysis reveals corporate investment to reduce
net income by (1 35)% The Foods Business Sector only contubuted 44%.
Note:
The above example underlines the importance of segment information. However, not all
information may be as useful; e.g Coke further provides data by geographic region
(Appendix I "Operations in Geographic Areas") but these do not follow established
cultural realms (e.g Coke's "Pacific and Canada" area has no value in this sense).
These cultural realms am discussed in subsedion 2.4.2.
2.2 Criteria
The above criteria, springing from analysis, helped in formulating theright questions: for example, does geographical diversification as aform of financial diversification appear a more likely option thandomestic multi-product diversification? Neither of these variationsnecessarily implies a more efficient approach. Geographicaldiversification may depend on how debt-to-equity ratios vaiy bygeographical region in terms of financing needs, and how thiscorresponds with demand in regional world markets for goods orservices. In the event, would a high debt growth strategy then be theway for expansion? These questions can be responded to as a result ofthis research. A more detailed question as surveyed (Ch. II) was whatwould happen in the case of business combinations, a take-over oracquisition; will there be a reduction in R&D expenditure, or anincrease? Do levels of R&D spending at the company usuallydeteriorate after it has been taken over, and the debt increase, or doesthis concern not apply? In short, what is the impact of capital structureinfusions on R&D? These research questions reinforced earlierobservations made during the literature survey. Yet, not all of thesequestions as relates to the use of cross section data can be answeredfully, even with the given database. Having said this, useful qualitativeinterpretations can be derived.
80

In any event, the above kind of criteria and questions were mainlyconcerned with preparing the data for examination. In addition, asindicated earlier, the resulting data bank had to be of sufficient depth torespond to further and critical questions arising from this. For example,is it possible to compare the capital performances of firms, the samefirms in their respective industries, in different countries, with anydegree of statistical validity and accuracy? Is it possible to establish byuse of traditional criteria the appositeness of the questions which seemright in theory, to get a sense of proportion about such things? Forexample, about the influences of culture between geographical regionsand the impact of this on the debt ratios of multinational corporationsheadquartered in any of such regions? These were the more complexquestions. This research will start answering these questions in thisand the following chapter. The criteria encompass determining whatsort of companies needed to be contacted. This is further commentedupon in Section 7 of this chapter.
2.3 Hypothesis Test
The foregoing explains why the hypothesis test for differences in debtratios as impact the capital structure of multinationals can be seen asfourfold. The test reflects this. It examines four corresponding ratios asfollows:
Debt Ratios:1 Between industries among the test countries2 Between the countries themselves3 Between country groups or cultural realms4 Within cultural realms
The format adapted for the testing itself, as indicated earlier, consists of
81

a cross-section of empirical data. This is further explained in the nextsection.
2.4 Cross-sectional Data
2.4.1 Cross-sethon versus Time Series
The decision to use a cross-section of data rather than time series wascrucial and one would expect to be asked to defend this choice. Asidefrom the difficulty of obtaining data in the real world ofmultinationals, there are a number of reasons why this study uses across-section of empirical data. To start with, the stoW told by the debt-to-equity figures is born out of the balance sheet which was specificallyselected as a measure of findings at a given point in time.
Upon further examination, this remained the case. Also, there wouldhave been little point in using for example, a combination of bothtime and cross section series (technically pooling). This was one of thealternatives considered at one point. However, as this researchindicates, structural changes in the constitution of a multinational'score business often have become too variable to be measured over aperiod of time for meaningful interpretations to be derived. Nor is itany longer that unusual for multinationals to effectively change thenature of their mainstream business within a relatively short period oftime. These changes often result from major strategic restructuring andsubsequent market repositioning, involving wholesale divestments.This may entail for example, the disposal of an entire division oralternatively multiple acquisitions in order to form a completely newproduct business group. Company samples in the study that can bereferred to in this way, include Guinness plc (from "diversified foodand drinks group" back to predominantly a brewer and distiller), and
82

Mitsubishi Corporation (from heavy steel, manufacturing andconstruction, to electronics, banking). Whilst Guinness returned to itsorigins, Mitsubishi's business transformed away from it. Whilst thefinancial structure needed to carry out the change could be measured,the business directly related to it would no longer be comparable.
Further reference is made to this issue in Section 4.2, Historical Costs;subsection 4.2.1, Book versus Market Values. This section explains whyintrinsic value at the level of the firm at a point in time based on across-section of data, is preferable over that of market values based ontime series. That this is the case is in part due to the judgmental bias ofthe market itself and the need for comparable data (both from quotedand privately held firms). Other than the inherent variability of amultinational's core business activities, the spread, size and differencesin geography and culture as evidenced in this study, provide sufficientinformation to substantiate why, for example, a ten year time serieswould not have been appropriate. No prior empirical studies exist onthis basis.
2.42 Cultural Realms
The country groups mentioned in the literature to which the data wereapplied are based on countries identified as having similar culturalattributes. This may help explain differences in international capitalstructure between different multinationals headquartered in differentregions of the world. Following the Broek Model [1973; 1976]mentioned in the literature, groups of countries were classified bycultural realm. For this particular study, six cultural realms wereidentified using the Broek Model for the 29 countries used.
83
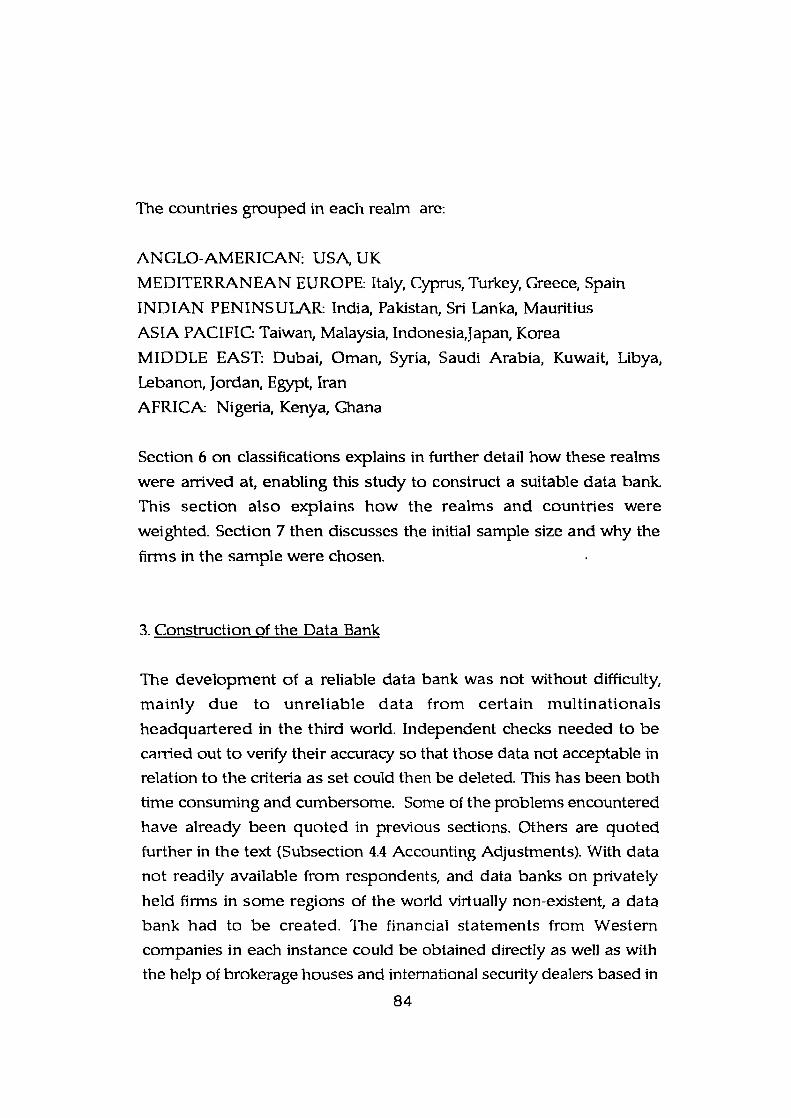
The countries grouped in each realm are:
ANGLO-AMERICAN: USI\ UK
MEDITERRANEAN EUROPE: Italy, Cyprus, Turkey, Greece, Spain
INDIAN PENINSULAR India, Pakistan, Sri Lanka, Mauntius
ASIA PACIFIC Taiwan, Malaysia, Indonesia,Japan, Korea
MIDDLE EAST: Dubai, Oman, Syria, Saudi Arabia, Kuwait, Libya,
Lebanon, Jordan, Egypt, Iran
AFRICA Nigeria, Kenya, Ghana
Section 6 on classifications explains in further detail how these realms
were arrived at, enabling this study to construct a suitable data bank
This section also explains how the realms and countries were
weighted. Section 7 then discusses the initial sample size and why the
firms in the sample were chosen.
3. Construction of the Data Bank
The development of a reliable data bank was not without difficulty,
mainly due to unreliable data from certain multinationals
headquartered in the third world. Independent checks needed to be
carried out to verify their accuracy so that those data not acceptable in
relation to the criteria as set could then be deleted. This has been both
time consuming and cumbersome. Some of the problems encountered
have already been quoted in previous sections. Others are quoted
further in the text (Subsection 4.4 Accounting Adjustments). With data
not readily available from respondents, and data banks on privately
held firms in some regions of the world virtually non-existent, a data
bank had to be created. The financial statements from Western
companies in each instance could be obtained directly as well as with
the help of brokerage houses and international security dealers based in
84

London, such as Merrill Lynch and Paine Webber. These company
publications in general needed relatively less adjustment. However,
financial statements of third world companies on the contrary were
less straightforward. These often required a time consuming process of
development with the respondent in order to bring the data required
in line with standards. Section 7. Sources of Information, sets out all
sources accessed in this study.
In all of the cases, the study has engaged the assistance of either the
Company's management and/or intermediaries such as stock brokers,
private owner-families and their representatives in the UK, members
of their family and their advisers. Much help was also received from a
wide network of national government agencies and international
organisations, e.g. the US Manufachirers Association, Washington DC,
The High Commission of Pakistan in London, The World Bank
representative office in London, the OECD, Paris, and The Atlantic and
Pacific Exchange, Rotterdam, and the Tinbergen Institute (Netherlands
Research Institute and Graduate School for General and Business
Economics), Rotterdam.
3.1 Procedure
This has been an important section. A conscious attempt was made to
clearly enunciate any strengths or weaknesses of the data base in the
main body of the thesis. The procedure followed in the construction of
the data bank is specified below:
(a) initial use was made of financial statements. Respondent
firms were classified by their respective cultural realms, initially
by headquarters location. The procedure has been to extract data
from balance sheets and then to ask for confirmation from the
85

finns.(b) The above had to be followed up with a questionnaire whichsought elaboration/additional information on a quantitativebasis. The response received gave rise to amendments of theoriginal data and sample size. As is referred to, a number offirms had to be removed from the sample as a consequence.
(c)This was then followed through with a further questionnairefor additional quantitative and qualitative information. Thischapter's summary highlights a number of case samples beforeand after adjustment.
Note
The Genera' Appendix shows the debt-to-equity data by individual fimi of
the sample population.
The next section states explicitly the relationship between the abovethree methods used, what additional information was obtained by thetwo questionnaires and why it was necessary to do this.
3.2 Role of the Ouestionnaires
The pivotal role of the questionnaires in this study cannot be overemphasised. In this light, the aforementioned procedure can becaptured as follows;
(a) Method 1: financial statements(b) Method 2: quantitative questionnaire(c) Method 3: qualitative questionnaire
The next figure provides an overview of the procedure applied and
86

type of data used, detail of which is the main subject in this section.
Fig. I Procedural Review of the Research
Response Data Type of Data Used
H. Test Ap1ied
Questionnaires:
1989 Quarter 1, Prirnaty Non-parametricQuantitative (Feb.)
1990 Quarter 2, Primary
Qualitative (Aug)
1991 Returns and
confinnations
(June) Primary
Normative
obseiations based
onpattern of norm Secondary
The first questionnaire was sent in Februaly 1989. For purposes ofconsistency the data pertain to the 1989 operating period, Decemberending. Alternatively, the period 1989-90 was used in case themultinational's fiscal year did not correspond with the calender year.For example, the consolidated balance sheet of Lucas Industries plcends at 31 July). Following verification, a transmission letter wasdispatched June 1991, asking companies to confirm the debt ratio, R&Dand growth percentages, based on standard calculations (as defined inSection 4. Statistics on Capital Structure). Where confirmation wasincomplete, further adjustments had to be made. An example of this is
87

the case of Allied Ghee Industries Ltd, a diversified trading group andlarge producer of vegetable oils, headquartered in Pakistan. Thedialogue with the Assistant to the Chairman, Mr Adnan Jalil, to obtainfurther information as to the calculation of the debt-to-equity ratio, wasinterrupted on several occasions due to soda-economic events in thecountry. The political risk at the time (1989-90) as perceived by themanagement and shareholders was directly related to possible changesin the value of the debt ratio and other variables that arose because ofthe circumstance but which were difficult to ascertain, causing delaysduring the research process. The dialogue as a result effectively tooknearly two years. Similar examples can be quoted, indicating thecomplexity in obtaining primary data
The methodology followed during the procedure is set out below:
3.2i Method 1: Financial Statements
This first method allowed for the pro-forma calculation of debt-to-equity under total leverage, R&D and growth statistics but this was notimmediately possible in all of the cases. Many of the respondent firmsresearched were headquartered in the Middle East and Asia Pacificregions where as indicated earlier, public information can be scarce.This fact was further complicated in that a substantial number of firmsin these regions were privately held. The General Appendix exhibitsthe necessary primary data collection tables. The master sheet andsupport schedule (Tables 8, 9) set out the information required bycompany, country where headquartered, and the individual companydebt ratios.
3.2.2. Method 2: Quantitative Questionnaire
The second method invited the company to take part in the extended
88

research portion of the study by sharing quantitative information oncapital structure and further data that could determine or stimulateeconomic variables of leverage such as R&D and growth. Eachparticipating company was regarded as a stakeholder and receivedwritten assurances on data confidentiality. Following this principle, theparticipants are entitled to share in the general findings, reflecting therelative position of their particular company. Nevertheless, obtainingdata was not without difficulty. For example, Pentel Co. of Japanproved rather reluctant to provide written communication exceptthrough a Japanese intermediary. Being sensitive about its debt,growth and R&D data (it produces unique technology based writinginstruments), the company did not permit any printed material to bereleased. Under the circumstance, the study had to rely much on Ms.Akiko Matsudo, a Japanese citizen in London who had the relevantrapport with Pentel in Japan (Table 8). Similar to the case of Pentel, allquestionnaires used during the survey contain a confidentiality clause.
3.2.3. Method 3: Qualitative Questionnaire
The third method sought clarification on the country of nationality,corporate structure/business activity, and cultural realm of themultinational. A further purpose of this extension was to obtainadditional information on patterns of financial expenditures on R&Dprior to and after mergers and acquisitions. Information ondiscretionary investments in R&D was obtained in this manner. Thissecond, predominantly qualitative questionnaire was sent duringAugust 1990 in light of the extension sought to the main financial test.The R&D emphasis here was on the profit and loss statement ratherthan the balance sheet. Contrary to expectation, this examinationproved equally testing if nothing else because many companiesmaintain different strategic and financial policies about their R&D costsand expenditures, subject to many interpretations. The definition of
89

R&D given in Chapter I Section 6.4 was maintained as a standard. Forreasons of consistency certain companies which insisted on R&D beingcapitalised instead of expended were deleted from the sample. Thewriting off of R&D expenditure is seen as the more conservative policy.Part of the strength in the role of these questionnaires andmethodological approach has been that it brings together a body of datathat does not exist anywhere else. The result is an amalgamation andanalysis of this data set. It has been allowed, courtesy of DEC, todisclose in this thesis, as an example, the completed questionnaires andtransmittal letter confirming DEC's debt ratio. To balance this NorthAmerican multinational with an example of a large internationalgroup from the Middle East, the study has been allowed, courtesy of AlGosaibi, to make reference to selective data as relate to the finalquestionnaire as completed. Copies of the DEC and Al Gosaibidocuments as referred to, are provided in the Appendix
3.3 Statistical Values
In order to provide statistical values from which meaningfulinterpretations could be derived, predominant use has been made ofthe primary data. Particular attention was given to safeguard these datafrom influence of bias, continuously seeking non-bias. In terms of datainterpretation this was not immaterial. For example, a conscious effortwas made to keep the questionnaire simple and clear in language. Toovercome impersonality, as mentioned earlier, foreign firms whennecessary were interviewed with the help of intermediaries of theirown country (Table 10). In this manner, the value of the data wasstrengthened.
Further, non-sampling errors to do with misinterpretation of questionsposed to respondents, or possibly coding, were reduced. For example,
90

face-to-face interviews and long distance telephone follow-ups wereconducted to ensure that the data used for calculation were checked.The relative debt position of each company under conditions of totalleverage could then be analysed.
The data subsequently drawn upon therefore are standardised in linewith the criteria set. This was found to be necessaly, not only to controlthe actual research effort but also to ensure integrity in the research.The results provide a common basis of understanding of what is beingstudied.
4. Statistics on Capital Structure
This research had to start by specifying precisely what data, would beused in an ideal world and then specify the restraints imposed becauseof the absence of a desired data bank. Section 3 describes theconstitution of the databank, what procedure was used, the role of thequestionnaires in this context, the underlying method used and thestatistical values obtained.
As to statistics on capital structure, in an ideal world one might havepreferred to use accurate market values if available. Instead, one hashad to learn how to use balance sheet data valued at historical costs,simply because of the absence of other data in the different geographicalareas in which the study was conducted. This remains the case,particularly in the third world as is commented on in more detail. Asthe result of the examination will evidence, the use of balance sheetdata at historical cost does not detract significantly from the value ofthe study.
Another issue has been how to define and justify the main criterion for
91

an examination of capital structure amongst the multinationals thatconstitute the sample. The terms by which the capital structureperformance of multinationals is generally assessed tend to be thoseconceived in terms of volumes of investment and debt financingreflected in valying levels of debt ratios and rate of geographicalexpansion, the latter being a function of international as well as home-based factors. Therefore, quantitative statistics on debt ratios were themain criterion dealt with, and then briefly, for purposes of furtherqualitative interpretation, other criteria such as growth and R&D. Thestatistics on total leverage in part reflect the potential of the samplemultinationals for subsequent value-maximisation at the level of thefirm. This basis was used for measurement of the debt-to-equity todetermine an optimal capital structure, taking into account culturalinfluences as may affect such structures in an internationalenvironment.
4.1 Measurement of Debt-to-Equity
4.1.1 Basis of Measurement
In order to further help remove the effects of aggregate debt ratios dueto distorted accounting principles and practices internationally, thestudy uses total leverage as the basis of measurement. This is reflectedin the formulation as to how debt-to-equity should be calculated as hasbeen specified during the literature survey. Total leverage secondly isapplied to reflect the legal concerns over ownership of wealth.Theliterature explains the link to cultural influences on capital structure.All of the 87 firms in the study's sample were measured on this basis.
92

4.1.2 Formulation of Measurement
The most optimal formula, i.e. debt-to-equity (as total leverage) can belinked to the earlier definition of total leverage in the literature. Thus,in defining the treatment of the various items from the balance sheet,total liabilities were measured as total assets - shareholders' equity. As abasic definition, the balance sheet model following (fig 2) shows howshareholders' equity is the difference between the total value of assets(current and fixed) and the total value of liabilities (current and long-term).
A word needs to be said about the special use of hybrids. The use ofhybrid securities was verified in terms of maturity and cost and treatedas posted. Thus, options have been ignored unless due to be exercised.Similarly, any derivatives held have been ignored. Hybrids are furthercommented upon in Section 4.4.3 Role of Convertibles and Warrants,highlighting a number of examples from the sample. Usefulinterpretations could be deducted from these convertibles and warrantsin their form of hybrids. This too is commented upon in Section 4.4.3.
The foundation underlaying the measurement of the debt-to-equity assaid, is the balance sheet. The balance sheet model used during theresearch was as follows:
93

Long-term debtFixed assets
1. Tangible fixedassets
2. Intangible fixedassets
Shareholders'equity(l)
Total value of assets Total intrinsic value of the firm
Fig, 2 Balance Sheet Model
Current assets
Networkingcaptta) Current liabilities
Source: Ross, Westerfield and Jordan. 1991, p. 6.(1) Note: Calculated as Total Shareholders' Equity see Section 1.4.1
The study's view of the intrinsicvalue of the firm, using book values,in this respect again is not different from that if it had used marketvalues. The balance sheet principle remains the same. This is furtherexplained in the next subsection 42. Historical costs (4.2.1 Book versusMarket Values). The intrinsic value of the firm represents thedistribution of value amongst the creditors, bondholders andshareholders.
As this model reflects, if the company were to sell all of its assets anduse the proceeds to pay off its debt obligations, any residual valueremaining would belong to the shareholders. The net working capitalposition is the difference between the company's current assets andcurrent liabilities. It becomes negative where current liabilities exceedcurrent assets. This is further commented on in chapter IV.
94

The alternative debt-to-equity formula based on capitalisation, asindicated in the same literature, would have been more useful in theassessment of long term-debt by financial analysts. They might haveargued that short-term debt, e.g accounts payable, is more a reflectionon trading practice than the management of debt capacity. However,this study is concerned with a company's debt capacity wheremultinationals are concerned. This cannot be entirely divorced fromtrading practices.
4.2 Historical Costs
This section discusses historical costs as relates to the quoted as well asunquoted companies in the sample. In other words, some judgementat the firm-level was used in defining the cost basis of the samplequestionnaires. Supplementary interviews were used to verifyhistorical cost data as obtained from, for example, privately heldMiddle East based multinationals.
4.2.1 Book versus Market Values
Given the need for international comparisons it is critical that thevalues are the same so that meaningful comparisons can be made. Thiswas achieved. This section explains why book values instead of marketvalues were preferable. The need for comparable data has been themain issue in this. It should be pointed out however, that:
(a) The historical costs were generally already adjusted in thefinancial statements of respondents. Yet, with differentaccounting procedures followed by various firms, someadjustment to a common standard had to be carried out. Specificexamples are being given in many of the following sections
95

which specifically treat this issue. It is therefore more accurate tospeak of adjusted historical costs, accounting values or better stillbook values, adjusted where appropriate as current values. Thisgoes some way towards eliminating the problem of comparisonsalthough the problem is not totally solved. This is where someof the difficulties arose in constructing the data bank and whichis where the original work for this study took place.
(b) Further, in this study the issue of comparable data has in factbeen resolved on the basis that all firms in the sample aremeasured at the level of the firm i.e. not in terms of marketvaluation, which would not have been possible geographically.This can easily be understood. For example, some of thecountries do not have a stock exchange. Also, the reliability ofvaluations in the private sector even if obtainable in certain ofthe developing countries, remains questionable. This in turn.prevents effective comparison. In this study; debt and equityvalues have been treated the same on a total leverage basis,using book values, adjusted where necessaly, so the comparisonfirms are indeed comparable.
In earlier empirical work on M&M, also White [1963] used book valueswhen he measured financial leverage (p. 1259). This is because, inaddition to comparability, there exist other advantages to the use ofbook instead of market values. Gordon and Mailkiel [1981] explainedthat the advantage of writing off increased costs of borrong againstearnings is soon levelled due to the higher pretax income. This meansthat whilst leverage at that stage does no longer increase the value ofthe firm, it does increase the cash flow. This confirms previousobservations in the literature survey. As Gordon and Mailkiel [19811concluded, there is no net effect in terms of valuation due to highearnings that result from leverage (pp. 131-191). Therefore, there
96

appears no particular reason why the use of market valuation wouldtell us something about leverage that book values would not.Bhattachaiya, [19881 confirmed these and similar observations, alsomade by Fama [19811, explaining that in any event revised marketvalue reflects discounted value of further future prospects giveninformative self-selection (a. pp. 135-147). Thus, as market valuesremain in part subjective, book values seemed preferable after all.
For the reasons stated above, the delimitations of this study excludeany securities valuations of future and current cash flow streams orstock market assessments. For the same reasons, value as calculatednaturally does not parallel stock market appreciation. There is no needfor this. The study is conducted at the firm level. It is firm-specific inthe corporate sense rather than stock market specific in the securitiesand valuation sense. As seen in the literature survey, it is mostlyconcerned with the debt capacity of the multinational in this respect.Some may argue that reliable estimates of the values of debtand equitycould have been sought in each individual sample case. As indicatedabove under point (b), in practice, this would appear highly unfeasible,geographically and technically. Moreover, if what needs to be tested isdata on total leverage, who is to say that adjusted book values asdescribed, would be less reliable than their converted equivalent atmarket prices taken at an identical point in time? There appears to beevery reason to prefer book values on this basis given their consistencyand comparative lack of judgmental bias. Also, changes in depreciationpolicy for example, still need to be consistent and supported in order tomeet even routine auditing queries This study, as explained, uses bookvalues because they reflect best the intrinsic values at the firm level at agiven point in time. Furthermore, under Generally AcceptedAccounting Principles (GAAP), there is an explicit preference for thebalance sheet to be expressed at book rather than market values and tostate adjustments for inflation or exchange rates separately. It can be
97

said that amongst afi existing accounting conventions, GAAP standards(in the UK, SSAPs) tend to be universally acceptable and thus areapplicable to all companies in the sample. Additional detail anddefence if necessary as to why there exists this preference in this studyfor the use of nominal value of issued equity plus reserves (rather thanstock market valuation) is set out in the General Appendix (Section 1.4Nominal Values), [Elte, 1994, Bank Mees Pierson].
4.2.2 Quoted Companies under GAAP
The study sample represents a mix of both privately held and quotedcompanies. This constitutes, as explained, one of the prime reasons forthe use of book values. The proportion of the two types of companiesin the final sample is as follows:
No. %(a) Privately held 32 37(b) Publicly held
Total 87 100
The input data used on public companies were obtained directly fromthe annual statements. Given the accounting adjustments underGAAP, footnoted in these reports, assets are often booked at adjustedhistorical costs. For example, Hanson plc's accounts [1989] that werelooked at in detail, in fact had been prepared "using the historical costconvention adjusted for revaluations of certain fixed assets". A copy ofthe firm's accounting policies referring to this accounting convention[Item (b) p. 521 is included in the General Appendix. However, evenhere, where book value may approach market value, this is notnecessarily the case or not in each country. In the event, clarifyingstatements were necessary and were provided by Hanson. In anotherexample, under US GAAP, i-evaluations would not be permitted. The"Information for US Investors" section of the English and China DayGroup plc (ECC) [19891, a copy of which is filed in the General
98

Appendix, indicates this material difference between UK and USversions of GAA1' [Item (2), p. 391. It shows reversed adjustments madefor interpretation by US investors (p. 38) as opposed to UKstockholders.
4.2.3 Private Companies under GAAP
As said from the beginning there are a number of importantobservations as to why this study has used historical cost data directlyfrom the balance sheet rather than market values. Whilst changes inthe capital market and tax systems have removed a certain bias fromthe structure of privately owned firms and have improved themobility of capital or access to capital markets, there still exists apredominant culture of secrecy surrounding financial data. Asindicated in previous subsections 2.1 Standards, 2.2 Criteria, the studycertainly experienced considerable reluctance towards disclosure whichcould have rendered the examination and conclusions non viable.These observations are confirmed again and in further detail in thischapter when discussing the balance sheet (Section 3.4.2).
4.3 Exposure Adjustments
In this section, the study reviews the exposure adjustments that neededto be made to the sample. It examines the criteria used and theappropriateness of each type of such adjustment. These includeadjustments for differential rates of inflation, exchange rates andconsolidation and translation rules.
4.3.1 inflation
Another aspect in the use of book values is that of inflation as a type ofexposure. At the level of the firm, this kind of adjustment is to portray
99

a realistic and thus current value. What is important here to the firm isto preclude any possible market bias entering the data. The effects ofinflation are usually expressed in exchange rate variations, at least in sofar as may impact the operations of the firm. Understandably, noeconomist will be happy with this explanation. At the macro-economiclevel, inflation differentials cannot be expressed in exchange ratevariations, especially in the short term. In such context, the economictheory of Purchasing Power Parity indeed has at best only very long runapplications. However, at the micro-economic level of the firm, wherethis study is concerned, the issue of inflation and exchange rates are asmuch an accounting as treasury management problem. Admittedly, itis a treasury management problem first, keeping the firm tied into therealm of macro-economic theory. However, at the firm level,technically, a distinction must be made here between (a) exposure and(b) accounting adjustments. Therefore, these issues are, discussedseparately.
In this study, the view taken towards inflation has been that one isconcerned with real returns, not nominal returns. The differencebetween the nominal return and rate of inflation actually experiencedtherefore may not necessarily lead to a decrease in sustainable earningsor any default in the expected corporate earnings rate of underlyingsecurities. In the absence of uniform accounting standards, differentialrates of inflation normally would have been expected to cause somedifferences. Therefore this study must to some extent share theargument of practising international managers that at the firm level,inflation is often assumed to be reflected through reasonable priceadjustments and the corresponding revenue stream. As an example,the Annual Report of H.J. Heinz Company, one of the multinationalsin this study's sample, states that:" the impact of inflation on both thecompany's financial position and results of operations has beenminimal and is not expected to adversely affect next year's results"
100

(General Appendix, H.J. Heinz [19891).
Finally, how multinationals in this sample were treated for inflation interms of exchange management, translation and consolidation, so as tomake comparison possible, is discussed in more detail in the next threesections. However, it must be kept in mind that the only formalreporting requirement regarding the effects of inflation and changingprices is a brief textual presentation of management's view [SEC 1982,pp. 54764-54790, Deloitte Haskins & Sells 1983]. (See also subsection4.3.4.c Rule FASB 33, on inflation).
4.32 Exchange Rates
The use of exchange rates specifically needs further discussion. Here,exposure management (i.e. not speculation) has developed into amuch wider and much more complex subject than that of simply cashmanagement. The subject is highly pertinent to multinationals asobviously, the exchange rate risk is the risk to having internationaloperations in a world where relative currency values vary. Inexamining the data it was important therefore to look for
(a)Short-run exposure as relates to contractual agreements tobuy and sell goods in the near future at set prices(b) Long-run exposure in terms of substantial hedgingoperations, e.g. buying of currencies on forward markets on theassumption of adverse economic trends(c)Translation exposure, i.e. the conversion into the parentcompany currency and treatment of gains or losses from foreigncurrency.
Any of these exposures could have a material impact on the debt ratiosof multinationals as is discussed in the sections following
101

4.3.3 Differential Rates of Inflation
An average exchange rate was used for the end of the period so as toallow for consistency in the sample. This means that in as far as theincome statement is concerned, the exchange rate is the average value(mid point or bid / offer) spread for the period of the income statement(monthly rates) consolidated on the last day of the fiscal period (andadjusted versus any budgetary rate). Balance sheet items on the otherhand are valued at the rate ruling at the end of the period Naturally,in an inflationary economy in which accounts are measured under asystem that presumes a constant value of the monetary unit, exchangeproblems and accounting problems will appear. In the event, long-runinflation may be related to currency devaluation of the country'scurrency but this correlation will not show in the short term. Properinterpretation of the financial statement by the foreign subsidiarymanagement and the parent group therefore required inflation-adjusted accounts where appropriate, reflecting reasonablerevaluations of historic costs. These restatements had to be insistedupon. Otherwise, net worth on the balance sheet or reported net profiton the income statement for example might possibly have beendistorted as a consequence of the original asset and expense distortion.The literature takes a similar view (Eiteman and Stonehill [1973, 19891a. p. 38, b. pp. 618 - 619, Ross et al [1991]).
4.3.4 Consolidation and Translation Rules
The consolidation of accounts and reporting thereof also required aspecific exchange rate. For the same reasons as quoted above, anaverage exchange rate was used as standard. As set out below, thisprocedure, following GAAP, is also in compliance with FASB8(Financial Accounting Standards Board Statement No. 8). This USstandard, endorsed by the SEC (equivalently ED2I in the UK) has been
102

in use since the mid seventies to provide a basis for foreign exchangereporting (Beresford in Underwood [19791 pp. 29 - 31, Dufey [19871, pp.95 - 270, PP. 291 - 390).The procedure followed under FASB8 andfurther amendments thereto (FASB2O, FASB33) are discussed below.
4.3.4. a. Rule FASB8 on Exchange Reporting
Using the FASB8 criterion, recorded foreign currency amounts forconsolidation had to be translated at the balance sheet date, e.g. usingthe current rate for claims related to cash (receivables, payables) andamounts carried at historical cost (property, inventory, goodwill)translated at historical rates. Specifically, the procedure adhered to hasbeen as follows:
1.Monthly Income StatementsExcept for depredation expenses the profit and lossstatement is translated at the average rate of exchangeof the accounting period.
2.Balance SheetAssets of cash and inventories except fixed assets ordeferred charges and prepared expenses are translatedat the current rate. On the liabilities side, all debt(whether short or long run, hard or local soft currency)is translated at the current rate. Only shareholders'capital or any legally required reserves (equivalent toshareholders' invested capital) is held at historicalrates.
For example, in the case of ICI plc, one of the sample multinationals,the company's long standing procedure had already been to categorise
103
exchange differences into those relating to:
(a) Fixed assets, investments and long-term loans on the onehand and
(b) "items of a trading nature" on the other.
This is in compliance with the procedure followed and as applied tothe other samples. The second category, as indicated abov is reportedwith the ordinary income for the year. The first category is dealt withdirectly through the balance sheet reserves.
For purposes of applying FASB8, the current rate has been the rate ineffect at the balance sheet date and the historical rate the rate in effect atthe date the transaction or specific event occurred. As to retainedearnings, the rule maintained for unrealised foreign exchange gainshas been to offset these against unrealised foreign exchange losses, withany balance held in a suspense account (until realised or absorbed byfuture unrealised exchange losses).
4.3.4. b. Rule FASB2O on Hedging
Under FASB2O as an amendment to FASB8, hedging activities havebeen incorporated in the data only where intended to provide a hedgeas relates to operations i.e. coverage (at cost) of normal risk-exposure,measurable on an after-tax basis. This has meant, no acceptance of dataon speculative hedging for profit. Most of the companies examined, inany event, had adopted a "loss limiting posture". Forward positionswere usually taken to reduce any underlying trait or financial exposure.Thus, also foreign exchange was normally regarded as a cost ratherthan a profit centre. As confirmed later through the financial press, in anumber of cases there were grounds to suspect that the level of hedging
104

activity appeared either (a) disproportionate, e.g. as in the case ofFerranti International plc (misappropriation of funds) or (b) potentiallyexcessive to the normal operations of the business, e.g. Allied-Lyons plc(unauthorised foreign exchange losses). In each of these cases, thesample was removed. Retention of these samples could have impairedconsistency in the comparability of debt ratios.
The disproportionate exchange activity of Ferranti, using pub'ñc'tyavailable information, could be traced back to its large US defencesubsidiary, International Systems and Controls. This has since led tothe collapse of the group. In the case of Allied Lyons (since renamedAllied Domecq), the unauthorised risk position assumed by the group'streasury, which entailed excessive hedging resulted in an interim overexposure, eventually corrected.
The advantage of the FASB8/ 20 criteria as applied in this study is thatit provides a uniform and consistent method of consolidation andreporting notwithstanding differences caused by inflation and exchangerates. The latter is further commented upon below.
4.3.4. c. Rule FASB33 on Inflation
There has been considerable argument in the theory about inventoriesin that these might relate to more than one accounting period.Applying the FASB33 criterion, firms were encouraged to providesupplementary inflation-adjusted statements, allowing for a moreaccurately estimated level of their sustainable earnings, achieved byreplacing historic cost with estimated future replacement cost whencalculating profits. Such inventory valuation adjustments thenrepresent the excess of replacement cost over the reported cost.Incidentally, also the resulting price changes come under FASB33.
105

Theorists have long confirmed this principle procedure (Weston andBrigham [19871, c. pp. 595 - 596, d. pp. 7 - 8, Sharpe and Gordon [1989,I 990D.
4.4 Accounting Adjustments
Quite separate from the exposure adjustments, which as seen above arenecessary, the accounting adjustments refer rather to the need for auniform approach when accounting for all business transactions, (i.e.including compliance with existing conventions, auditing standards,national laws), the balance sheet, and the role of convertibles andwarrants. These are explained individually below.
4.4.1 Uniformity
In terms of comparability, the absence of uniformity in accountingstandards amongst the cross-cultural environment of multinationalscaused further differences. However, by and large, in terms ofaccounting conventions, these were not firm-specific. They concernedmostly differences to do with accounting conventions and standards ofa given country rather than those of a specific multinationaloriginating from or headquartered in that country. At the same timethe compilation of financial statements that would be internationallycomparable was frequently hindered by lack of uniformity in auditingstandards and difficulties in obtaining full disclosure. For example, theformal reporting requirement as to changing price data itself is nolonger mandatory: in 1986 the FASB concluded that the costs ofreporting were not worth the benefit. In the UK, the equivalent ofFASB 33 (SSAP 16) was withdrawn the same year. For example, inBritain, managers of UK multinationals were found to view thedisclosure of inflation adjusted profits to be among the top items withthe highest cost/lowest benefits [Gray and Roberts 1988]. Therefore, to
106

make comparisons possible it was found there was a need todifferentiate between:
4.4.1. a. Accounting Conventions4.4.1. b. Auditing Standards4.4.1. c. National Laws
Each of these subsections is dealt with as follows:
4.4.1. a. Accounting Conventions
As Eiteman and Stonehill [19891 observed, accounting principles vaiyworldwide in at least seven specific areas; consolidation, goodwill,deferred taxes and long-term leases, discretionary reserves, inflationand adjustments, and exchange translations (pp. 618 - 619). Of these,consolidation, goodwill, inflation, exchange translations anddiscretionary reserves pertain directly to this study.
Balance sheets amongst the research samples generally have requiredsome adjustment, allowing a firm's total leverage position to becomemore transparent. For example, in exploring Coke's leverage the case asregards goodwill is as follows:
Elimination of goodwill, $ 232 Mm. (Appendix I); retention would have made
comparison with other samples difficult. This also pertains to country-to-country
comparisons within and between cultural realms.
Deferred taxes and long-term leases were considered as less critical onthe assumption that the debt-to-equity is cyclical over long periods oftime (Ch. I!, Taggart). However interpretations can easily be biased.Given that practices still vary enormously between countries and to alesser degree multinationals themselves, any generalisation must be
107

accompanied by recognition that many exceptions continue to exist. Asan example, methods by which asset values and depreciation expensesare determined were not always found to be well explained. Forexample, in certain cultural realms e.g. Middle East, Africa, notes tofinancial statements do not appear in the profusion to which US or UKobservers have come to expect.
In resolving these differences, internationally active companies fromdifferent countries had, in the accounting sense at least, to be treateddifferently and this for different reasons. For example, firms from theUS and Japan tended to provide inflation adjusted financial statementson a fairly consistent basis whilst British firms usually providedadditional inflation adjusted statements or footnotes to their reports.This could not be said for example, for firms from the Middle East.Here, clarification had to be sought. Where this proved anunsurmountable problem, for example in one case in Israel, Tako Ltd,and one in Lebanon, Veladaile Ltd, (Table 12, Adjustments), thesefirms were removed from the sample. In both instances, the firms wereunquoted and privately held.
4.4.1. b Auditing Standards
To ensure standards, rules FASB8/ 20,33 were enforced for compliancethroughout the sample. Where compliance was not observed and noreasonable adjustments/explanations were forthcoming theobservation was excluded. The Appendix incorporates a listing (Tables10, 12, 15) briefly stating, against those excluded, the reason for theirexclusion. In contrast, in four instances, compliance with standards wasobtained by respondents of private companies taking appropriateaction. This followed identification of and communication about, anumber of deficiencies. As a result of respondent compliance, the
108

companies concerned were then not removed from the sample. Thesecase examples, all privately held firms, are set out individually:
(a) Example 1: sale of assets mixed with operating profits,hindering the ability to judge true earnings potential and thusthe potential debt capacity [Remalux Paints Co., Jordan].(b) Example 2: consolidation concealed earnings of non-consolidated subsidiaries, with same effect as above. [Plastic Co.AM. Zaghioul, Egypti.(c)Example 3: understatement of earnings for purposes ofminimisation of tax [Reserve Services Ltd, Lebanon].(d) Example 4: use of reserves to smooth fluctuations in earnings[Yong Lee Rubber Company, Malaysial.
Where changes could not readily be made, cooperation was received inthe form of pro-forma adjustments. The problems of consolidation arefurther elaborated upon in the balance sheet review (Section 4.4.2).
4.4.1. c. National Laws
In this study, national laws have had a further effect on fiscalregulations and property rights. Enforcing GAAP over nationalaccounting systems at times would have been impractical in light oflocal law. The reason for this is best explained by the fact that GAAP areeffectively Anglo-Saxon accounting principles which rely on aconvention of agreed rules. Yet these may not have any legal bindingas is the case in those countries where accounting rules are tied to thelaw of the land. In certain sample countries for example, Saudi Arabiaor Iran, even religious laws can play a role. Limitations on the cost ofdebt should be a constant reminder of this.
109

Examples were not limited to non Anglo-Saxon countries, especiallywhere tax laws are concerned. In this context, the question arises forexample, what the debt ratio could be at a national subsidiary levelversus that of a group. This study firstly measures the debt ratios of theconsolidated positions of groups headquartered in their country oforigin. As a reminder, at this stage read the debt ratio as synonymouswith the debt-to-equity relation under total leverage. Secondly, wheresubsidiaries are concerned, it is known that authorities and centralbanks usually take the view that these must adhere to directinvestment standards. This means that there is usually a limit on socalled thin capitalisation. Without precise definition, thincapitalisation is generally taken as meaning to apply where a subsidiaryhas indebtness considered excessive in relation to its equity. Anacceptable ratio for tax authorities in many countries is a financial debt-to-equity not exceeding three to one. This can be higher as firm-specificcircumstances are often taken into account.
There exists also the point of view on debt as taken by the parentversus that of the national subsidiary. The points of view may notnecessarily reconcile. This has been taken into account in this study.For example, an overall debt transfer can be beneficial, permitting theparent to leverage the balance sheets of each of its subsidiaries with aminimum effect on the parent borrowing capacity. However, such mayconflict with the desired debt-to-equity of a single specific nationalentity. An example amongst the sample population is the Walt DisneyCompany. The debt-to-equity needs evidenced for example by WaltDisney's European subsidiary, Disneyland, have been a notable case.Here the lack of congruence between parent and subsidiary on the issueof debt have been paramount. National laws may be as important afactor as parent-subsidiary perceptions on debt. If not in compliancewith the direct investment rules, problems can arise. For example, aUK subsidiary having a long-term loan from an overseas parent could
110

have the loan considered as part of the subsidiary's fixed capital, theinterest cost disallowed and the loan treated instead as a distribution onwhich advance corporation tax was payable. In the event, theconsequences would be grave. Ongoing parent-subsidiary disagreementon debt levels would only worsen the situation.
4.4.2 Balance Sheet
In an empirical study such as this, naturally much attention is given tothe balance sheet. That this was not without problems should not comeas a surprise. Obtaining data from developing countries has never beenan easy task but obtaining financial information from companies inthese countries must be ranked among the hardest. Most companies inthese parts of the world tend to be privately held and in some instancesmuch convincing was necessary to obtain reliable data based on GAAPcriteria. Where these were not being met, the sample was excluded.
However, how reliable can even an audited balance sheet receivedfrom a privately held group in Saudi Arabia really be? As is known, theMiddle East is a highly cross-cultural region in its own right Therefore,interpretations can vary widely from country to country. Amultinational operating across this region as well as internationallymakes for a challenging analysis. The Al Gosaibi Group referred toearlier, can be highlighted as one such sample case. This organisation isa major conglomerate, operating mainly in Kuwait, Bahrain and SaudiArabia but with worldwide licensing joint venture and productrepresentation arrangements. The subject of accounts identification forexample, needed considerable scrutiny and clarification. Importantly,there was a need for correct interpretation. However, this wasencumbered in a number of ways. As set out in the General Appendbcpart of the annual report for example had not been translated fromArabic. Also, proper cultural interpretation was a recurring issue. In
111

this instance, and to overcome cultural issues, a number of personalmeetings were held with one of the Al Gosaibi managers in London,Mr A Rahim A Fakhro.
In contrast, the work required on the balance sheet of DEC, whichprovides computer systems, is US based, publicly held, and global, wasrelatively straightforward. Following analysis of the DEC AnnualReport it necessitated only further telephone and fax contacts withDEC's Financial Officer in the UK, Mr John Reeve (see GeneralAppendix). No personal meetings were necessary in this way.
Not all cases were either as complex as those of the Al Gosaibi Group oras relatively straightforward as DEC's. Many sample cases weresomewhere in the middle of this spectrum. An example is theEvergreen Maritime Corporation. Despite its Anglo-Saxon name,much of what was faxed was in Chinese. There being a number ofquestions, it took a Chinese speaking Taiwanese intermediary inLondon, Mr Kuo-Hsiang Kuo to relate to one of Evergreen's seniorexecutives in Taipei in order to verify the correct interpretation ofcertain response data.
These difficulties were not inconsiderable. They were generallyexperienced with other multinationals headquartered in eitherdeveloping or fast emerging countries. Companies in these countriesoften tended to be closely held and most sensitive to any type of datarelease. As a result, full disclosure invariably proved to be the greatestobstacle. As indicated earlier, the single most convincing incentive forcooperation was the opportunity for respondents to share at some laterdate comparative data derived from the collective results. Companiesin the event can then apply their own benchmarking. In the main thisapplied mostly to companies in the Middle East, who on the one handappear rather sensitive, yet through relative isolation, given the lack of
112

valid company comparisons, appeared highly motivated to participate.Due to confidentiality, the details related to many of these participantscannot be quoted. The substantial Al Gosaibi Group makes a favourableexception to this. The confidentiality agreement entered, was waivedfor this purpose.
In the Al Gosaibi case as well as in general, to achieve full disclosure ofthe balance sheet, extra attention was paid to having holdingcompanies represent their total leverage position. This ernphasisesonce more the importance of the use of questionnaires during thisresearch. It also reminds the reader that data were not merelyextrapolated for examination. Judgement also had to be applied beforethe data extracted from the profit and loss statement and balance sheetinformation could be formally tied back to an acceptable data bank Theholding type of company has been known to not always provide fulldisclosure, in part as may relate to the respective accounting system ofthe country of the parent and or that of the related subsidiaty. AsFrancis [1986] remarked, some debt reporting can be limited to parentsonly, excluding fully consolidated statements (pp. 393-403). Earlier workof Lewftwich and Wilson [1970] was consulted to ensure that rules oninclusion of capital structures of foreign subsidiaries were obeyed interms of consolidated results reported (a., b. pp. 79 - 125).Multinationals at times have been known to deviate from thisaccounting convention. Compliance in fact, was not invariably the caseand corrective measures therefore had to be taken. For example,Megabyte Espana S.A was removed from the sample on this basis. Inanother example, a meeting with a representative of Khurma TradingEstab. Ltd, Mr Sumer Hasan Khurma, affirmed that business activitiesin Holland were included in the consolidation. Khurma which hasactive interests in the Netherlands actually proved to be a legitimateimporter/re-exporter of Dutch cut flowers and bulbs in the Middle East.These examples illustrate and reinforce the importance which was
113
given to supplementary interviews in addition to the questionnaires,in order to obtain directly verifiable information. This also highlightsthe problems of multinational definition described in Chapter I Section3.
After all, interpretations even in clear print, can vary substantially, alsoin the financial-economic and technical sense. This must beemphasised. Whilst traditional balance sheet standards on financingand liquidity were consulted in the process (De Langen andIJselmuiden [1973], p. 66), not all samples could be analysedsatisfactorily in this way. For example, in one particular case it wasimpossible to identify the specific industrial investment activities of arespondent bank holding company. This sample's balance sheet(included in the Appendix), simply did not provide adequate detailunder the caption "Other Investments". Disaggregation of this datawas not forthcoming. Following confirmation of this Observationmade from the organisation concerned, the sample, UnitedCommercial Bank Ltd (UCB), Bangladesh, was removed from the databank In addition it was noted that UCB did not appear an isolated caseamongst this study's sample population. To ensure similar rigidity insegregation of activity and to avoid bias, all other bank holdings withindustrial activities were removed. Many of these were Japanese.
4.4.3 Role of Convertibles and Warrants
This subsection sets out the role of convertible securities and warrantsin defining debt. These types of instruments tend to blend interestincome and equity security, allowing shareholders to convert theirloan stock at specific dates. Equivalently, it has enabled several of themultinationals in the sample to extend their financial base and options
as is explained below. In the subsections following the role ofconvertibles and warrants is being related to the companies in the
114

sample.
4.4.3. a. Hybnd Securities
In reviewing annual statements and audited accounts of sample firms,the periodic use of hybrids was noted. Hybrid securities, havingfeatures of equity, at times may be treated as debt solely to leveragecorporate tax benefits of debt. Whilst differences due to warrants (Sub-section 3.4.3. b below) could be largely ignored for quantitativemeasurement purposes, some notable cases needed highlighting forqualitative reasons as concerns specific interpretation at the individualfirm level. A most striking example is Avon Products Inc. With a debtratio of 80 versus the US sample average of 43.4, the company wasconsidered highly geared. The advantages accompanying such asituation, and as relate here to the sample, have been both explainedand questioned by the theorists, these advantages are reviewed below.
Amongst the academic researchers, Ross et al [1991] asserted that somecompanies might follow this approach with the intention ofmaintaining benefits of equity in case of bankruptcy. Technically thiscan be achieved for example by issuing specific warrants attributedsimultaneously to a non-convertible bond, as the case with AvonProducts. In the event, the data enter the data bank unaltered as debt.From all publicly available information there did not seem to exist anyevidence to suggest that the intention of Avon would have been toavert loss of benefits under the prospects of an imminent bankruptcy.Also the so called 10-K full disclosure report to the US authorities,which is statutory, and filed with the Securities and ExchangeCommission (SEC), does not suggest any other interpretation on thissubject.
115
4.4.3. b Warrants
A better appreciation of hybrids was gained by a deeper understandingof the use of warrants. Such will allow certain firms to take a riskexposure of incurring a technical default which can be deferred orpassed on directly during adverse years whilst actually benefiting of theinterest deductions during financially positive years. Equity can also beimpacted albeit in a different way. Under the treatment of totalleverage, in the legal sense, equity interest is a residual claim rankedafter debt securities such as notes, debentures and bonds due to debtholders. This is the case whether these concern public issues or issuesprivately placed, equity being subject to valuation and debt having beenset at a fixed amount.
Therefore, the use of securities encompassing warrants, as critics haveargued, may obscure somewhat the issues of debt and equity.Technically, Hayes and Reiling [1969] were among . the, first .to foreseethis phenomenon (pp. 137-150). They were followed by Welham [1975]and Ritchie [19831 confirming the same. However, the formation ofoptimal capital structures at times may necessitate the use of warrants.The problem associated with warrants was more that of losing sight ofthe distinguishing qualities of debt and equity.
Returning to the link between total leverage and warrants, in the legalsense, warrants relate to both the issue of ownership and that of value-maximisation. This issue tends to be more firm-specific than thegeneral issues of accounting or economics designed to serve the publicat large.The warrant thus, must also be seen in a socio-economic lightand respective cultural realm of the multinational concerned. Thewarrant, apart from this, after all, is a financial instrument to gear upthe company's potential performance on the basis of its total leveragecapacity. This in fact is the case also in the example given of Avon
116

Products. It explains to some extent why hybrid convertible securitiesand warrants usually go together. In addition, the followingobservations were made:
(a) Observation 1: some of the smaller multinationals in thesample regard the convertible as intermediate leveraging whileearnings from fast growth are building up [Example: EconomicInsurance Co., Greece].
(b) Observation 2: in certain countries, e.g. the US, conversionperiods in principle tend to be long (15 to 20 year lives) takingthe character of debentures. Provisions were made to enforceearly conversion (at the cost of the company). This makes theuse of warrants for deferred equities potentially expensive butprovides a strong financial stature and options for increased debtcapacity to the larger multinational [Example: Proctor & GambleCompany, (P&G) US].
(c)Observation 3: companies in notably cyclical industries likeprimaiy commodities or building materials, are anotherexample of uses of warrants [Example: BPB Industries plc, UK].
5. Statistics on R&D and Growth
In selecting data, the R&D/Revenue and the Growth/Revenue ratioswere used to bring all respondents onto one common denominator.Where secondary data are concerned, these were used for comparisonwith the primary data of the descriptive group (detailed in Section 7.3Primary Data, 7.4 Randomisation, 7.5 Secondary Data). The use of dataon R&D need some comment. As was the case for statistics on debt, across-section was utilised. In the long run as was stated, "R&D develops
117

haphazardly through the accretion of small bids, taking an adaptive
form" (Survey Mesthene [19701). Similar to the view taken on debt-to-
equity, this study sees R&D as cyclical and over long periods of time.
The position of growth and its interrelationship with debt-to-equity
and R&D were explained in Section 2. Hypothesis and Test Format.
6. Classifications by Cultural Realm
Given the cultural influence of international capital markets, a most
important area for consideration were the geographical areas of
financial diversification themselves. These are detailed in the next
three subsections. These start with the classification of data, firstly by
worldwide realm and strata clusters, secondly by regional realm, and
finally, following adjustments made, by cultural realm.
6.1 Worldwide Realms
Aside from ratio analyses encompassing relationships of debt-to-equity,
R&D, and growth, leverage relationships were analysed for cultural
influences within respective regions of world markets. These and
underpinning strata clusters of regional country groupings are
contained in Tables 12-13. The main classifications initially identified
for further analyses were:
'1. The Anglo-American realm
2. The Far Eastern realm
3. The Third World realm
These realms were identified on the basis of distinct cultural models
referred to earlier (Section 2. Hypothesis and Test Format). Other
118

potential realms such as e.g. Northern Europe were not selected forstudy on the basis that multinationals headquartered in this region, asis generally known, traditionally have tended to seek their expansionprimarily in the Americas and the Far East and appear to continue todo so. Examples would have been Philips, Unilever, Royal Dutch Shell,Siemens. Both of these areas, i.e. the Americas and the Far East areincluded in the study.
In this study's sample, numerically, the majority of largemultinationals with the exception of the Japanese, form part of theAnglo-American realm. Here, data was not unduly difficult to obtain.The Far Eastern and Third World realms in contrast proved difficult topenetrate. These needed relatively more analysis, information incertain cases being virtually non-existent. This problem was in partovercome by some degree of earlier developmental research.Anticipating the severity of data accessibility, steps were talen early on,with the start of an observational sub-study [1988]..
To reduce bias versus the quantitatively more controllable informationin the first two realms, the minimum sample size for the third worldrealm from the outset was specified as having to be at least one thirdlarger. This has to do simply with the sheer size and number ofmultinationals in one realm versus that of another. The actual samplesize acquired meets this criterion by being almost twice that of either ofthe two other realms.
6.2 Regional Realms
The population of each of the three distinct realms as studied containsdefinite cultural strata of countries with naturally differing statistics.Each stratum has a proportionate ratio in terms of number of members
119

to every other strata. For example, the population type of the ThirdWorld realm consists of three cultural strata, each with distinctregional aspects:
1. Middle East and Near Eastern countries2. Countries of Southern Europe and the Mediterranean3. African countries
The Far East realm is also made up of three cultural strata:
1. Asia Pacific countries2. Japan3. Countries of the Indian Peninsula
The Anglo-American realm, in principle encompasses all Anglocountries and North America. For purposes of this study it consists oftwo main cultural strata:
1. United States2. United Kingdom
The Anglo-American region for this purpose excludes Australia,Canada and New Zealand. A number of adjustments had to be made.For example, using the empirical sample, Sri Lankan companies suchas Lanka Lloyd and the Jerzina Group of Companies (to comply withthe cultural models referred to earlier) were transferred from the AsiaPacific categorisation to that of Countries of the Indian Peninsula(Table 10, Adjustment). Similarly, Mimosa Co. Ltd was classified intothis realm given that Mauritius's business community and economicties are predominantly Indian, despite its obvious proximity to theAfrican mainland.
120

6.3 Strata Dusters
Given the above, a word needs to be said about the strata clusters thatunderlay each of the major realms in the world, ultimately by region,as applied in this study. If one looks at the Third World realm as anexample, its population consists of strata clusters whose characteristicsare similar, yet whose countiy characteristics are as heterogeneous asthose of 19 different countries and 40 individual firms. Thus, the orderof unit countries and strata clusters amongst the realms represents arandomisation factor for size effect of countly and regional economics.The same applies to the individual firms sampled.
Given the above, the population of each realm was found to beessentially conglomerate in nature. Main realms could be broken downinto stratified population subgroups of individual firms and countries,making up the strata clusters. A similar observation can be made of theFar Eastern realm which in thIs study lists .8 strata and contains 22...•.firms. In contrast, the Anglo-American realm reflects a morehomogeneous situation. On the other hand, in the Far East there is stillas much heterogeneity found between, for example, a firm in the AsiaPacific countries versus one from Japan, as there is between firmswithin the strata cluster of the Asia Pacific countries. Having said this,these differences amongst multinationals appear to becomeincreasingly blurred albeit that this is a gradual process. As will bediscussed next, this has contributed to further consolidate Japan andthe Asia Pacific countries into one Asia Pacific group and shouldtherefore in part be a reflection of the developments that are takingplace in the Asia Pacific region. It also indicates to some degree theevolution that has taken place leading to, once again, the Broek modelfor cultural realms, referred to in the literature review. Theclassifications used for this study are patterned towards this. Theoverall build up and context of the worldwide realms, and how these
121

8 22
have been adjusted to reflect new realities in converging worldmarkets, is included in the figure below. This also shows how the stratafit into the new realms of countiy groupings and relate the originalrealms to the same groupings.
Fig. 3 Architectural Relation of Realms
Worldwide Country Grouping No. No.by Region Strata Firms
The Anglo- 1. United States
American 2. United Kingdom
Realm
Subtotal
2
25
The Far Eastern 1. Asia Pacific Countries*
Realm 2. Japan
3. Countries of the IndianPeninsula*
Subtotal
The Third 1. Middle East - and
World Near Eastern Countlies*
Realm 2. Countries of Southern
Europe and the Mediterranean*
3. African Countries*
Subtotal
19
40Total
29
87strata clusters
122

6.4 Cultural Realms
Given the worldwide population of multinationals, also when
grouped regionally, it was necessary to further consolidate and
designate these in some manner. Such was eventually accomplished
on the basis of six distinct cultural realms (as listed in Section 2.
Hypothesis and Test Format). Leaving the Anglo American realm as is,
Japan as said was added to the Asia Pacific group. The other realms
concluded upon were Mediterranean Europe; consolidating Southern
Europe and certain Mediterranean countries, Africa, The Middle East;
following consolidation with the Near East, and the Indian Peninsula.
In addition, reclassifications directly related to a firm's management
and cultural issues had to be implemented in line with accounting
rules and classification standards. Some examples follow:
Example 1: Noble Air plc UK This company was found to have its de
facto operating headquarters in a countiy other than its own, i.e. in
Northern Cyprus. In this study the main operating headquarters were
an important criterion for geographical classification of the company.
The classification in this case became that of Mediterranean Europe.
Example 2: Lonrho plc (London and Rhodesia Corporation), UK. Many
critics would argue this to be an African company. Upon further
scrutiny, Lonrho was found to be substantially diversified in other
parts of the world including North America and Australia. On this
basis,and given its London quotation on the main Exchange, it was left
classified as British.
Example 3: Hanson plc, US! UK. With this group having its volume of
operations more or less equally divided between the US and the UK. it
would have been a classic Anglo-American case. However, it had to be
123
removed from the sample. The group could not be classified forpurposes of this study as either British or American, there being noAmerican management representation on the UK main board for theperiod related to the test data. Yet more than half of the profits werederived from the United States.
7 Sources of Information
A word also needs to be said about how companies in the sample wereinitially selected, whether there was a sample frame, or if they wereselected by chance. This is reviewed in this section
7.1 Companies Contacted
Initially, a total of 278 companies in 51 countries were approached withthe invitation to make their interests part of this research. These resultfrom the following standards and criteria used:
(a) The sample had to represent a cross-section ofmultinationals. Reference is made to Ch. I, Section 2 which
defines the multinational as a Company that operates inmore than one countly, i.e. beyond mere export activities,and in a way deemed material to both its revenue volumeand profitability.(b)Materiality as above was assessed by individual firm, i.e. atthe firm-specific level on the basis of segment data. However,the main focus was on line of business and geographiccoverage, this being in compliance with standard practice.Reference is made to Chill, Section 2, subsection 2.1.(c) The sample had to reflect cross-cultural characteristics of
124
multinationals headquartered in certain countries acrosscertain cultural realms and active in certain industries asdefined in Ch.I, Section 3, subsections 3.1, 3.2. This, inter alia,encompassed an openness to private companies willing tomeet the criteria, i.e. not merely publicly quoted groupsalready subject to more regulatoly scrutiny.
The approach was based on a mixture of contacts as well as publishedlistings. It is doubtful whether all of the information necessary couldhave been obtained for the time period indicated and within the dataarchitecture specified without such contacts. This is especially the casegiven the sensitivities as exist surrounding some of the data (asexplained further under point 7.3 Primary Data). The data concernedrelated directly to capital structure, R&D and growth. A subsequentobjective of the research was then to test these data independently andto assess the relative position of each respondent surveyed within theappropriate cultural realm. This was carried out on a comparative basisin relation to other cultural realms. A first questionnaire was proposedto the companies contacted. Those interested received an appropriatequantitative questionnaire towards this aim. A second questionnaire,for further quantitative input and qualitative data was then sent sixmonths later. A number of conclusions were derived from thisexercise. These and underlying analyses were referred to earlier in thischapter (Sections 3. Construction of the Data Bank, 3.2 Role of theQuestionnaires). As specified below, not all of the firms contacted couldbe retained.
7.2 Companies Retained
After a number of repeat requests for additional information, a total of135 firms could be retained. Following further analysis, this was
125

reduced to 90, subsequently 87 firms (Tables 9-10). These firms providedthe data required and were representative of the region in which theywere headquartered. In this manner, the firms as remaining wereselected by chance rather than within a sample frame. If there is anyaspect of judgment of convenience attached to the sample in thisregard, such emerged purely by necessity and given the environmentin which data had to be obtained.
7.3 Primary Data
The descriptive group of primary data emanates from selectivesampling as applied to a random network of contacts assumed to havea shared but individual interest to participate. The actual participationwhich was not gained easily in the end testifies to this.
Notwithstanding the interest and co-operation demonstrated on thepart of the respondents, considerable sensitivities were encountered asto the use and protection of data. This of course was the case more so incertain cultural areas than in others but sensitivities invariably tendedto be highest where private firms were concerned, regardless ofcultural realm. This explains to a large extent the considerable samplereduction.
7.4 Randomisation
The population of primary data in principle is considered to behomogeneous given that multinationals selected, in the socio-economic sense at least, belong to a standard industrial society.Nevertheless, randomisation was applied at the individual firm levelin order to prevent bias. The previous subsection describes how a start
126

was made with 278 companies. The resulting sample, set at N= 87,represents a country population of 29 distinct nations (Table 10). Noneof the observations of indMdual firms geographically represented bycluster segmented strata is less than N <10. In meeting this criterion, anumber of necessaiy adjustments had to be made. The sample had tobe extended by one firm as concerns the Indian Peninsula (SineInternational Ltd). This further applied to the Mediterranean Europestratum which was also extended (A. Mouragas Company).
7.5 Comparative Data
The comparative group, the data being mostly secondaiy, results fromselected randomisation. These data compilations (Tables 14-17) are filedin the Appendix. The largest set of such data in the study amounts to1000 (The Global 1000) and was used for comparative purposes (Table14). Some application has also been made of the largest 50 US GlobalExport Firms (46 after adjustments made due to foreign ownership).
The quality of primaly data could be put to good use, for comparativepurposes. The relatively isolated (secondary) data from thecomparative group were used as a benchmark against which (pnmaiy)data on debt-to-equity, R&D and growth from the descriptive groupcould be observed. Thus, further adjustments had to be made.Subsequently, primary and secondary data comparisons were applied;for example, to the issues of discretionary investments in R&D. Theseanalyses assess what impact if any, mergers and acquisitions could haveon the level of leverage and discretionary investments in R&D, Theresults of these analyses in turn were then used for furtherinterpretation.
127

8. Summary
The methodology allows the observations of the literature survey to
flow into the results, subject to examination and interpretation.
The first question to be asked in relation to the population statistics has
been the sample size, N= 87, and its build up (Tables 8-10). An overall
result of the questionnaire procedure as relate to the data base
development between 1989 and 1992, can be seen below:
Numberof 278companies
135 Number ofrespondentqualifiedbetottransmission
confirmation
1990 1991 1991
Database: 1989
Number of I 87 I Number ofcornpanes I companieseligible qualified
19
The study explains how the sample was adjusted and the make-up of
the underlaying sample detail constituted. The development of a
primary database in this way took over three years (1 989-1 992). This did
not affect the consistency of the data as it originated from the same
time period. As depicted, from the 278 firms in 1990 that trace to the
original 1989 database established for this study, no more than 135
appeared qualified by 1991. Once the company confirmations
outstanding were cleared later in 1991, of these firms only 90 were
found eligible. In 1992, following further accounting adjustments, 87 of
the initial respondents could be retained as fully qualified. In the
context of a growing globalisation in the activities of multinationals,
the significance of the London Stock Exchange disclosure requirements
appears to be relatively minimal compared to competitive pressures
128

associated with the need for international status and raising of capital.As a result, voluntary disclosure amongst the sample has beensubstantial. This has particular reference to the debt-to-equity and R&Ddata. At the same time, persistent national characteristics were evidentin that consistent patterns of behaviour could be observed in eachcountry. Taken overall, these findings are consistent with the view thatmultinationals must disclose more than the minimum requirementsif they are to compete in international capital markets and the marketsfor goods and services. As all theoretical determinants of capitalstructure in this study are formulated in terms of more or less leverage,the debt ratio was the obvious choice of variable to be explainedfurther.
Going back to the earlier examples given in Ch. II, the schedule belowshows the debt-to-equity data by individual firm of the populationsampled, before and after adjustments:
Raw data Adjusted datacalculated under totalas leverage leverage
24.7 14.1
89.9 80.4
68.1 42.0
Referenceto Section Referenceexplaining to Balance
Company reason for Sheetname change Appendix
DEC 1.4.1 F
1.4.2
An 1.4.2
C
1.4.3
P&G 1.4.2
Fl1.4.3
The position taken by Collins and Sekely that secondary data wouldhave the advantage of a more consistent accounting treatment remainsdebatable. The authors themselves must have realised this limitationwhen they qualified their paradoxical statement by adding that these
129

accounting inconsistencies were reduced but not eliminated (Collinsand Sekely, Methodology).
The hypothesis for differences of capital structure by industries,countries or country groupings ideally requires empirical data of debtratios by individual firm sampled and in the country where theparticular multinational is headquartered. Thus, the development of aunique data bank was mandatoty. It did not exist. The main measurefor which data had to be obtained were the debt-to-equity positionunder total leverage and the cultural realms. The following overviewexhibits the sample companies discussed in this chapter with referenceto the sections which describe the nature of the adjustments:
EL Company Name
1 Coca Cola
2 Guiness
3 Mitsubishi
4 Lucas Industries
5 Allied Ghee Industries
6 Pentel Co.
7 DEC
8 Al Gosaibi
9
Hanson
10
ECCii
H.J.Heinz12
ICI13
Allied Lyons14
Ferranti International
Ch.IIISection Section Title
2.1 Standards
4.4.1 .a Accounting Conwntions
2.4 Cross-sectional Data
2.4 Cross-sectional Data
3.2 Role of the Questionnaires
3.2 Role of the Questionnaires
3.2.2 Method 2: Quantitative Questionnaire
3.2.3 Method 3: Qualitative Questionnaire
4.4.2 Balance Sheet
3.2.3 Method 3: Qualitative Questionnaire
4.4.2 Balance Sheet
4.2.2 Quoted Companies under GAAP
6.4 Cultural Realms
4.2.2 Quoted Companies under GAAP
4.3.1 Inflation
4.3.4.a Rule FASB8 on Exehange Repoiting
4.3.4.b Rule FASB2G on Hedging
4.3.4.b Rule FASB2O on Hedging
130

15
16
17
18
19
20
21
22
23
24
25
26
27
28
29
30
31
32
33
34
Tako
Veladaile
Remalux Paints
A M. Zaghioul
Yong Lee Rubb
Walt Disney
Evergreen Maritime
Megabyte
Khurnia Trading
UCB
Avon Products
Econorric Insurare
P&G
BPB Industries
Lanka Lloyd
Jerzina Group
Mniosa
Noble Air
Lonrho
A Mouragas
4.4.1 .a Accounting Conventions
4.4.1 .a Accounting Conventions
4.4.1.b Auditing Standards
4.4.1 .b Auditing Standards4.4.1 .b Auditing Standards
4.4.1.c National Law
4.4.2 Balance Sheet
4.4.2 Balance Sheet
4.4.2 Balance Sheet
4.4.2 Balance Sheet
4.4.3.a Hybrid Securities
4.4.3.b Warrants
4.4.3.b Warrants
4.4.3.b Warrants
6.2 Regional Realms
6.2 Regional Realms
6.2 Regional Realms
6.4 Cultural Realms
6.4 Cultural Realms
7.4 Randomisation
For comparative purposes it was further necessary to obtain data for
R&D and growth. The research cited earlier suggests that few firms are
likely to voluntarily disclose R&D expenditures. In this study, contrary
to expectations, most of the financial information provided by the
respondents contained R&D disclosures. However, few firms
disaggregated R&D spending by business and geographic region in theirdisclosure.
The procedure followed in the construction of the data bank includes
the analysis of financial statements followed up by quantitative and
qualitative questionnaires which seek qualified data/elaboration and
additional information. The combination of these three methods has
131
provided statistical values from which meaningful interpretations canbe derived.
This chapter encapsulates the measurement of debt-to-equity undertotal leverage; histoncal cost; exposure adjustments related to inflationand exchange rates; accounting adjustments as pertain to accounting-rules/uniformity, the balance sheet under different accountingprinciples, and the role of convertibles and warrants in defining debt. Itdetails how the problems compare to the ideals, standards and criteriaset by this study, how these were overcome, which are left unresolved,and in the latter case the implications for the study.
132

CHAPTER IV
RESULTS
1. Validation
In this study the relevance of some debt ratio determinants from therecent theory of finance, discussed in the literature review andmethodology, is empirically investigated in the multinational businesssector. The data focussed on in this study are financial data of 87multinationals in 19 industries headquartered in 29 countries. Thecharacter of the data allows the use of a methodology (that of Kruskal-Wallis) aimed at reducing if not avoiding the biasing effect that othervariables not represented might otherwise have had on the outcome,given this omission. Whilst the theoretical determinants of capitalstructure appear relevant, the influences observed prove that in thereal world of multinationals, the hypothesised theoretical effects areless straightforward. Influences on total leverage and optimal capitalstructure are found to be not the industiy specific effects or those ofgrowth and R&D, but those of cultural influences on internationalcapital structure.
This chapter examines the empirical evidence necessary to support orreject any of the related hypotheses. The hypotheses formulated in thischapter (subsections 2.1, 2.2, 2.3) as a priori expectations are tested.These concern differences in the debt ratios respectively betweenindustries and within and between cultural realms, as are set outfurther below. For this purpose, the rationale and the method of testingare set out fully. To start with, the chapter justifies fully the use of theKruskal-Wallis test. Initially, there appeared a need for association or
133

independence so the obvious test would have been the analysis ofvariance. This requires normal distribution assumptions which werelooked for and rejected in some cases, as is commented upon further inthe text (Section 1.3 Tests of Significance). Hence the chapterconstitutes essentially a statement of the processed results of thequantitative study. These results have been augmented withobservations derived from subsequent qualitative research. Thecombined results thus allow for interpretations from both primaiy aswell as secondary data and, as indicated in earlier chapters, additionalinformation obtained from the questionnaires.
The observed capital structures in this study's sample are notcompatible with formal M&M theory as was reviewed in the literaturereview.This theory postulates capital structure irrelevance and thusoptimal capital structure at a 100% level of debt, corporate tax offsettingthe loss of debt financing Therefore an extension to the M&M theorywas sought to accommodate an optimal capital structure in particularas pertains to multinationals.
In this light, this examination has deployed the data collected asdiscussed in the methodology. It ranks the industry/country cellsselected from an initial sample of 278 firms in 33 industriesheadquartered in 51 countries. The elimination of over two thirds ofthe original sample as seen in the foregoing chapter has largely beendue to (a) inadequacies in disclosure standards and (b) distortions inaccounting principles and practices internationally.
Since the publications of Modigliani and Miller on the theory offinance [1958, 19631 in their seminal papers, extensions to the theoryhave been sought by many ( see Cli. II, Literature Review), resulting ina less than 100% debt financing in the optimal capital structure. Thesecertainly were steps in the right direction. The criticism is that the tax
134

benefits of costs of debt financing were not economically significant
enough to have material impact on optimal leverage. This gave rise to
considering operational characteristics which were assumed to
influence these benefits and costs. In this study, the relevance of certain
debt ratio determinants from the recent theory of finance
encompassing those of an operational nature, is empirically
investigated, i.e. a test of the relevance of theoretical determinants is
performed. These, as reviewed, are the debt ratio under determining
conditions of leverage, growth and investment in R&D.
Organising some of the results initially posed some difficulty due to the
many variables involved. Therefore, to distil the essence of what the
study has been saying with no material loss to the message, a
comparison had to be made with other studies and paradigms. The
McKinsey 7-S paradigm, for example, was found to address perceptions
similar to those of this study, in particular as concerns the significance
of cultural influences. Peters and Waterman [19881 when introducing
the 7-S framework claimed that it would assist in forcing explicit
thoughts about hard data, i.e. strategy and structure, as well as soft data,
i.e. style, systems, staff, skills and shared values (pp. 8-lI); hence the 7-
S's. Their method was of interpretative assistance in this researchbecause it naturally directed attention to the more intractable data of
cultural influences on international capital structure when sifting and
codifying results. Other paradigms identified were less useful. For
example, Goodwin's [1977] was limited to its socio-cultural bias; that of
Bun-eli and Morgan [19791 was only socio-organisational and thus
restricted in this way.
135

1.1 Variability in Debt-to-Equity Ratios
In evaluating the results of the data acquisition after adjustments
(Table 10), debt ratios of country strata generally seemed in line with
what could have been expected. For example, multinationals in Asia
Pacific (excluding Japan) had the highest debt-to-equity ratios under
total leverage, averaging 84.2. The Near East averaged 66.4. Followed in
that order, the Indian Peninsula showed an average debt-to-equity of
59.8 and Japan 59.4. Mediterranean Europe reported 54.5, the Middle
East 51.5, and Africa 45.0. All indicated higher levels than either the US
or UK where firms had average debt-to-equity levels of 44.2 and 42.3
respectively. The resulting adjusted average debt-to-equity for these
nine strata was 54.5. Thus the variability was noticeable. The strata
were then organised into six cultural realms. In these realms, as
aforementioned, Japan has been included in the overall Asia Pacific
region. Also, the Near East, including countries such as Turkey and
Iran, was merged with the countries of the Middle East. The UK and
US are represented by the Anglo-American realm. In retrospect, this
gave no noticeable change to the categories except for Asia Pacific due
to the influence of Japan. The average debt-to-equity ratios after these
adjustments are set out below:
Cultural Realms:
Asia Pacific 69.3
Indian Peninsula 59.8
Mediterranean Europe 54.5
Middle East
55.2
African 45.0
Anglo-American 43.4
Average 54.5
The Asia Pacific category can be quoted with or without Japan. In this
136

presentation, again, Japan is included. The use of the original
worldwide realms such as that of the Far East, as first introduced, may
be too broad. This would have included e.g. India and Sri Lanka which
are characterised instead by customs that are found to be quite different
from those prevalent in the Asia Pacific realm. Hence the above
categorisation.
In ranking primary data by individual firm (Summary Table 36), the
highest debt-to-equity reported was 150.0, associated with the Pt. Tn
Atmaja Company, Indonesia. Thus the highest leveraged firm in the
sample, it would appear, is Pt. Th Atmaja Company. As indicated in
the previous chapter, a ratio > 100 means that, as in this example,
equity obviously was negative. This needs further comment. Negative
equity, it can be stated, results from an accumulated profit and loss
statement deficit (as was also the case in theses instances). Conversely,
the single lowest debt ratio found in the sample was that of S.R
Textiles Ltd, India, with a debt-to-equity of 6.0. The variability of debt
ratios is further demonstrated in the debt-to-equity Distribution
Histogram (Summaiy Table 25). However, as concerns international
capital structures, variability appears also a matter of cultural influence
if not the overriding determinant. This is investigated in the
subsections following.
1.2 Variability within and between Cultural Realms
By defining different levels of leverage of multinationals within and
between different cultural realms, preliminary conclusions could be
formulated. This revealed the uniqueness of various capital structuresby cultural realm and clues for further analysis. For example, at the
time of the study, certain countries amongst the sample were either in
recession or becoming affected in some way. On the face of it,
137

recessionary conditions would put an unprecedented strain onleverage levels, making interpretations of otherwise valuable statisticsmore difficult. However, differences of culture between realms wereless subject to these relatively short periods of recession than they werefor the individual firm or an individual country. Also, theinterpretation can be made that in the macro-economic sense, theoverall trade cycles between the various realms in which the firmsoperate, tend to synchronise - albeit with some degree of imperfectionas markets are not perfect. The latter was discussed before in theliterature survey. However, this remains more of an assumption as noevidence was sought specifically at the macro-economic level. Theentirety of this study is devoted to micro-economic analysis at the levelof the firm. The cultural realms are to provide only a reasonablyrepresentative basis for statistical examination.
In preparation for this examination of the hypothesis, debt ratios werecalculated for all 278 firms in 33 industries and 51 countries. Utilisingthe Kruskal-Wallis test to measure for cultural differences, the debtratios for 87 firms, 19 industries and 29 countries, ultimately qualifiedfor the database and were adopted.
1.3 Tests of Significance
Tests of significance were required to determine the proportion of casesof certain debt structures amongst the firms in the sample so as toestablish an indication of direction of the debt pattern. The significancetests had to be introduced because the sample is fairly small and thussampling errors potentially can be large. Also, it made sense to test thestatistical significance of the hypothesis, it being well-supported byprior knowledge and studies.
The results of these tests are indicated in the next section. These138
specifically set out the findings of the examination conducted on the
hypothesis. A probability of 0.01 has generally been used as the cut-off
point for statistical significance, i.e. for rejecting the null hypothesis
and accepting the sample results at their face value (Section 1.2
Significance Levels, in the Appendbc sets out further detail). The tests
of significance as conducted sought to confirm or reject the null
hypothesis from the evidence of the observed sample data. The rule as
stated above was consistently applied. Other values were referred to for
interpretative purposes.
Further, the x 2 - distribution (Table 23) was used as the theoretical
yardstick. (Section 1.3 Chi-square Goodness-of-Fit Test, in the
Appendix, provides detail on this). This test and associated rules
established the non-normality of the observed debt-to-equity cases in
the sample versus the expected distribution and thus helped determine
the Kruskal-Wallis procedure as the most appropriate methodology on
which to base the statistical analysis.
1.4 Kruskal-Wallis Ranking Test
Insofar as patterns of relationship needed to be identified and ranked by
country, culture and industry, effective use was made of the Kruskal-
Wallis hypothesis test. The results of the test as conducted and as
explained, justify the study conclusions. The test used the median
ranks of the various industry and country debt ratios to test for
differences of ranks between the multiple samples; hence "ranking"
test. This may of course raise the question why the median was used in
the Kruskal-Wallis ranking tests. Clarification regarding selection of
the median rank is simple. To be sure, in exchanges with Collins [1994L
the author confirmed the rationale of using the median rank. The
following specifies the procedure used with respect to the median rank:
139

1. If the question concerns why to test on medians using theKruskal-Wallis method, it follows the same argument for usingthe non-parametric statistic. Without confidence, theassumptions for parametric statistics hold; indeed having foundthey do not hold, one moves to a less restrictive test. If theunderlying distribution is skewed, the median provides ameasure more in the population centre than the mean. And,even if the distribution is symmetrical (which it is not), themedian is an equally valid measure of central tendency as thetwo would coincide.
2. If the question concerns how the median was selected, thestandard definition was used: the median is the value of theobservation with the rank (n-i-1)f 2 where the n items are rankedfrom 1 to n in ascending order. If n is even, the median wascomputed as the arithmetic average of the observations withranks n and n^1.
During this research the question also arose as to why the Kruskal-Wallis test was used in the first place. This chapter, as Collins (whoread it) commented, seems to cover well the question raised about theuse of the Kruskal-Wallis test. Quoting Collins "it should no doubthave satisfied this question". In his remarks, Collins confirmed thatthe choice is between the parametric analysis of variance and the non-parametric Kruskal-Wallis test; "once the assumption of normality isrejected, Kruskal-Wallis must be used". The use of the median as ameasure of location then follows. More detail of the basis for this testis given in the next section, which sets out the Kruskal-WaIlisprocedure, and in the Appendix (Section 1.1 Measurements). TheKruskal-Wallis specifically examined the industry/country cells forconsistency of country ranking among industries and industry rankingamong countries. To the extent that patterns could be found in these
140

analyses, conclusions were drawn as to the consistency of capital
structure approaches undertaken by multinationals in various
countries, industries, or cultural realms.
The test therefore can be seen as a correlational-effectiveness
measurement of industry and cultural influences on total leverage
that result in varying capital structures at the firm level. Due to the
differences in size of the industry/country cells and any remaining
uncertainty of the underlying distribution, the non-parametric test was
necessary to examine for individual differences. The test for differences
of ranks between multiple samples fitted this aim.
1.5 Kruskal-Wallis Procedure
As indicated above, the Kruskal-Wallis procedure is used as an
effectiveness measure of industrial, country and cultural influences on
capital structures amongst multinationals to test the hypothesis. As a
non-parametric tool, it allowed for a most fitting means test of the null
hypothesis. The procedure followed is stated fully.
In considering the Kruskal-Wallis, a number of works were consulted
on its formal theory. Conover [19711, defined the Kruskal-Wallis test
for one way analysis by ranks as a non-parametric procedure used in
the experimental situation where K random samples have been
obtained, one from each of K possibly different populations. Theobjective was to test the null hypothesis that all of the populations are
the same. Some populations naturally will tend to have greater
observed values than other populations. Following Lapin [1985], the
sampling distribution of K is approximately a chi-square distributionwith m - 1 degrees of freedom, where m is the number of categories (p.
141

654). To find the critical value, the Appendix Table 23, provided critical
values for specific tail areas. The decision rules related to this are set
out in the next subsection, 1.6 Kruskal-Wallis Test Statistics. The
Wonnacotts, [1985, p. 4841 and Leedy, [1989, p. 2111 regarded the
procedure as an appropriate method to infer meanings from data in
discerning clues within these data. Technically, the Kruskal-Wallis can
be seen as an extension of the Mann-Whitney U test, for situations in
which there are more than two independent samples being compared.
Luck and Rubin [1987] defined the Mann-Whitney U test as a procedure
to examine hypotheses about the central tendency of ordinally scaled
variables from two independent samples (p. 464). The Kruskal-Wallis
instead is a rank test for K independent variables. It was W H Kruskal
and H Wallis who introduced this test [19521 actually as an extension of
the Wilcoxon rank-sum test to the analysis of several samples [Lapin,
1985, p. 652].
An initial observation of the debt ratios in this instance did not suggest
that the sampled populations were normally distributed with equal
variances. Thus, the use of a one-way Analysis of the Variance
(ANOVA) had to be dismissed. The Appendix comments as to why the
ANOVA or alternatively the Analysis of the Co-Variance (ANOCOVA)
would not have been appropriate to serve as a basis for statistical
analysis (Section 1.3 Chi-square Goodness-of-Fit Test). The alternative
Kruskal-Wallis was applicable to this study because the debt-to-equity
determinant has a continuous distribution, the data are least ordinal
and the samples are independent. To use the variance of analysis, the
first step was to establish the relative ranking. The Kruskal-Wallis
procedure could then determine whether the sums were so different
that it was not likely they came from populations with equal
medians.The test statistic is defined below.
142

1.6 Kruskal-Wallis Test Statistic
lithe samples actually do come from populations with equal means,
then the H statistic calculated as below is distributed as a chi-square
variable with K - I degrees of freedom, where K = the number of
populations under study.
The general formula for the Kruskal-Wallis test is:
[__ K21H
=12 R - 3(N^1)
LN(N^1) j1 ni]
Where:
N = total of all observations
K = number of sample groups
Rj = the sum of ranks in the jth sample
nj = the size of the jth sample group
The requirements as exist f or the test to be valid [Lapin L, 1982, Daniel
W.f Terrel J., 1985, Groelner D. / Shannon P., 1987] are stated briefly as
below. On this basis, no limitations were found in the use of this
formula, given that the following requirements were met:
(a) the samples are independently selected
(b) the rule-of-thumb that, provided no more than 25 percent of
the observations are involved in ties, no correction is required,
does apply. The debt ratios tend to be unique. Only one case of
ties was observed [debt-to-equity: 71.5. Industry: Food, Drink and
Tobacco. Country: Pakistan, (Table 2)].
(c) There is no case of fewer than three groups in combination
143

with five or fewer observations in each group.
(d) the computed values of H were compared to the tabulated
values of x with K - I degrees of freedom.
The methodology applied meets each of these requirements. Where Hwas larger than x criticaI , the hypothesis of equal medians was rejected. It
was concluded that the populations from which the samples were
selected could have different medians. The decision rule was thenapplied as follows:
2If H <x acceotHo.critical
If H > X ritical 1ject Ho.
Where the calculated value was greater than the critical value, as
pertains to cultural influences on international capital structure, it was
concluded that there was a significant difference between the twogroups being compared.
2. Hypothesis
The work examined the capital structure of a number of companies
against three hypotheses. The hypotheses being tested are set outformally as follows:
2.1 Differences between Industries - Hypothesis I:
The First Hypothesis Test is stated as follows:
Ho: multinational companies across various industries have the
same financial structure
144
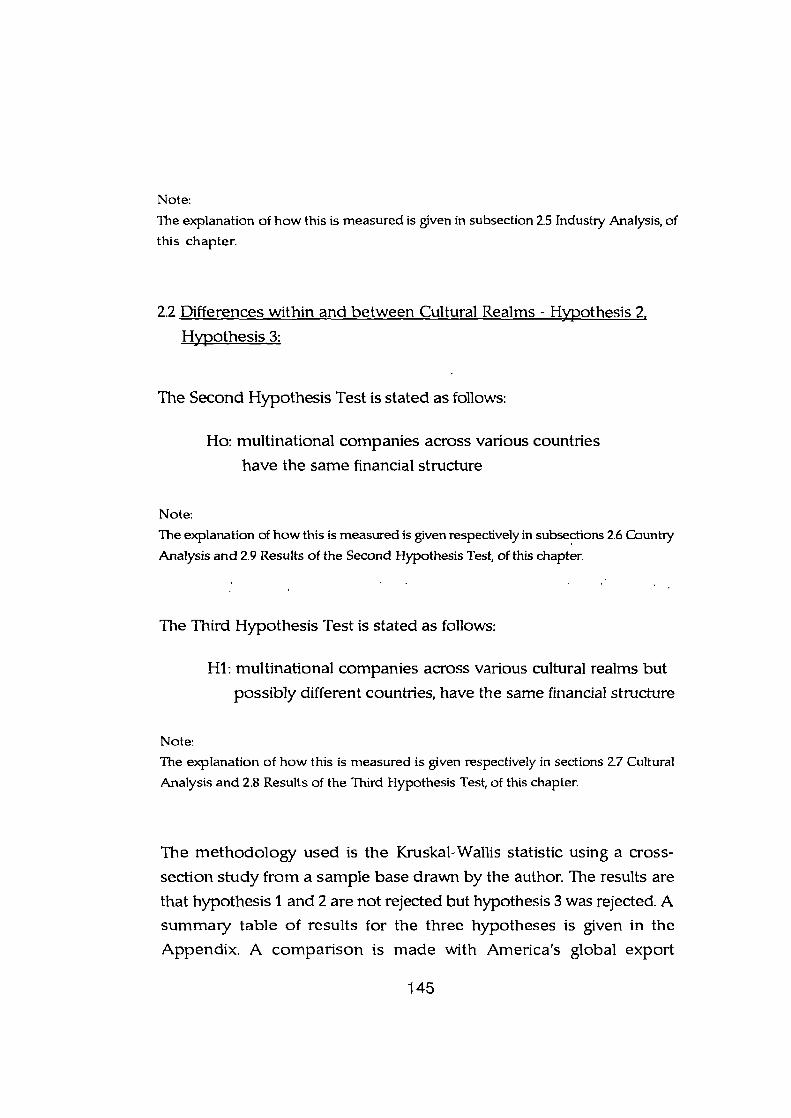
Note:
The explanation of how this is measured is given in subsection 2.5 Industry Analysis, of
this chapter.
2.2 Differences within and between Cultural Realms - H ypothesis 2,
Hypothesis 3:
The Second Hypothesis Test is stated as follows:
Ho: multinational companies across various countries
have the same financial structure
Note:
The explanation of how this is measured is given respectively in subsections 2.6 Country
Analysis and 2.9 Results of the Second Hypothesis Test, of this chapter.
The Third Hypothesis Test is stated as follows:
HI: multinational companies across various cultural realms but
possibly different countries, have the same financial structure
Note:
The explanation of how this is measured is given respectively in sections 2.7 Cultural
Analysis and 2.8 Results of the Third Hypothesis Test, of this chapter.
The methodology used is the Kruskal-Wallis statistic using a cross-
section study from a sample base drawn by the author. The results are
that hypothesis 1 and 2 are not rejected but hypothesis 3 was rejected. Asummary table of results for the three hypotheses is given in the
Appendix. A comparison is made with America's global export
145

corporations regarding post and pre-merger R&D expenditure.
2.3 Debt Ratios for Selected Industries and Countries
As aforementioned, the averages for 87 industiy/ country cells were
calculated but arranged in order of increasing use of debt (Table 1).
These indicated how much debt a given industiy and count!y assumed,
i.e. in each individual case and ranked. They were then applied as the
basis for further analysis.
2.4 Debt Ratio Ranks for Selected Industries and Countries
Also, the median ranks in debt ratio were computed for 19 industries
and 29 countries and arranged in order of increasing use of debt (Table
2). Individual comparisons .with the cell rankings were subsequently
used as a basis for specific pattern analysis by industry (among the
countries) or by country (across the industries). Further comment on
Tables I and 2 is provided in the Appendix.
The work below reiterates the findings in more detail without seeking
to duplicate the explanations. Returning to the hypotheses, three
hypotheses are involved as follows:
(a) The financial structure is the same for differing industries.
(b) Multinational companies located in the same cultural realm
but possibly different countries have the same financialstructure.
(c) The financial structure is the same for multinational
companies located in different cultural realms.
The following subsections set out the findings of industry, country and
146

111
0
0
Li
tI N 0' N
I
F.1
Ii
Li
U
fi
h1

I-
- -- - -
J
Lfl - Ui
C
I. . CU -0
I-.
U
0U
N UO
U
N
I-
c L17 U,
N N
C -
iiC, C,
0
UCi
C
NC)

cultural analyses. Table 3 referred to below (and Tables 4 and 6 further
in the text) refer to the calculation in the Kruskal-Wallis test (i.e. Ri2).
More detail is given in the Appendix
2.5 Industry Analysis
2.5. a Findings on Industry Analysis
The Kruskal-Wallis first examined for differences between selected
industries in the use of debt. The ranks of all the industries among the
test countries and the median rank for each industry are indicated
(Table 2). The cut off point for statistical significance was set at 0.05,
establishing a 95% confidence level that the observations made are
indeed significant. The General Appendix details the significance level
used as relates to the sample distribution (Section 1.2 Significance
Levels). The differences in median ranks were not found to be
significant at the 0.05 level, the influence of industry groupings in the
use of debt being minimal. No pattern could be established even at the
0.10 significance level. The results of the Kruskal-Wallis test as
conducted on the industry data is shown (Table 3). Most industries, 17
out of 19, had median ranks in the middle two fourths of the total
sample. The debt ratios thus did not vary significantly between the
industries.
2.5. b Comparative Results of Industry Analysis and the FirstHypothesis Test
Similarly, Collins and Sekely in their most recent study [19881 found 8
out of 9 industries to have median ranks in the middle third of the
total sample. Differences between industries were not found to be
significant at the 0.10 level. These researchers explained their findings
as due to the relative decrease in industry differentiation. The data
147

bO
bO
UCi
CC
u,i-' '-. aU CC
0I-
It)a'C.'J
C)
Cd)
CC
Cl)C)
U)
CC
CC
Cl)
0)>C)
Inq
C)-C-4-.4Ca
CCC)
I0)0
CCC.)
Cl)
'4-0C)>
m
0)
-DCC
I
0
z<
_ d-c-c3Lr' cqr-. — a'. '.0 t' — '.0
'.0 N- c .— .-. c N-
0 0)
ci
0w
— (1)h -—Q Ci
C) ci0. (.)
; -5 Ci-
0)0)' - Q ci
.. •
00 C) oj cicZ 0UUF-UUUU

used in their test, as seen, date from 1979 when industly differentiation
may have been on the decline. This condition appeared to still hold
true at the time of their manuscript's revision [19851, subsequent
revisions [1986-87] and its completion [19881.
2.5. c Conclusion of Industiy Analysis and the First Hypothesis Test
Ten years after the initial Collins and Sekely database was established
(this study's database is of 1989), many multinationals indeed seem to
have become less industiy and more core product differentiated, i.e.
their orientation increasingly focused towards mainstream businesses.
This condition from all observation continues to prevail at the time
of this study's revision [1995]. Yet core products today tend to strongly
identify with their specific industly categorisations. They usually are
classified much the same. The overriding reason for non-significance
of industry groupings therefore must be another one. The analysesfollowing seem to provide some indication why this may be the case.
These will concentrate on the remaining two hypotheses to be tested
further
2.6 Country Analysis
2.6. a Findings on Country Analysis
The test examined for differences between countries. Looked at on a
country by country basis, some of the countries show relatively low
debt, for example the UK, and high debt in Japan, but these samples did
not influence the country pattern (Table 4). Differences between
countries did not appear significant at the 0.05 level. Thus, there was
no definite relationship between country and debt as the results
indicate. Similarly to industries, the countries were concentrated on
148

c c — '.0 ('1 — O — u '.0 U) . (fl ('.1 ) r) '.p a'. I
(1) ('.1 — 0'. It) U)N — O N N —
>
Inq
w
(\J
U
.0
w ._O ).,' .o • <I . . .h . . gw0 m -u
a
0.0F-

the middle two fourths of the sample.
2.6. b Comparative Countly Analysis
In contrast, the Sekely and Collins study had experienced clear
groupings of differences. Compared to the 165 countiy/industiy cell
rankings, 7 countries had overall median rankings in the bottom third,
10 countries in the middle third, and 6 countries in the top third of all
rankings. The difference was found to be significant at greater than
0.001 level, indicating a most definite relationship between countty and
the use of debt. Importantly, the authors justified their findings on the
basis that with the exception of Australia and South Africa, all
countries with little debt were less developed nations and that with the
exception of Pakistan, all countries using high debt levels were
industrialised countries. A fairly strong pattern of economic
development was correlated with the degree of debt used in various
countries.
2.6. c Conclusion on Countly Analysis
Again, the time period of the database used for this study [1989] as
opposed to that of the above study [1979] may in part explain here the
difference found in findings between the two studies. It is probable that
much did change during this intermediate decade in terms of financial
policies and the decision processes of multinationals related thereto.
There can be little doubt that between 1979-89, the methods used in the
planning of an optimal capital structure became more advanced but
there are many possible reasons for this. For example, the availability
of choice in the financing of international capital structure, partly due
to new information technology! communication links between capital
markets, altered substantially during this period. This appears to have
led to a more sophisticated capacity of the firm, in particular the
149

multinationals. Corporate financial planning and capital markets today
tend to reinforce one another.
2.7 Cultural Analysis
2.7. a Findings on Cultural Analysis
The foregoing examination did not proclaim significant differences
between industries or countries. Yet differences between cultural
realms seem to support the idea for there to be a cultural variance in
international capital structures between different country groupings.
Whilst the subject of culture generally and as a belief system falls
outside the scope of this study, some reference had to be made to the
element of material culture. That is, in as far as it relates to the capital
structure tendencies of a country grouping. Here a link is made with
the country grouping's economic structure or if put in a societal
manner, that of a specific cultural realm. Different legal and tax systems
appeared likely to influence capital structure amongst various cultures.
However, if there did exist some broad cultural influence on capital
structure beyond the influences of either industry or country, it had to
be tested. The premise on this basis was that it could then be
determined whether this was to be reflected in the similarities of
capital structure of firms situated within certain country groupings
having similar cultural backgrounds, or in comparing between such
groupings. As shown in the methodology and further discussed in this
chapter, appropriate groupings of countries were grouped as cultural
realms.
2.7. b Comparative Cultural Analysis
Returning to Collins and Sekely, cultural realms were described as a
150

type of grouping characterised by their "fundamental unity of
composition, arrangement, and integration of significant traits which
distinguish them from other realms" (Ibid. e. p. 92). Detailed
comparative cultural analysis is provided on this basis further in this
chapter, setting out the differences found between cultural realms as
part of the hypothesis test.
2.7. c Conclusions on Cultural Analysis
As a result of doing business internationally, it would seem that one is
to be increasingly aware of possible differences of financial structures of
firms as a group between different continents or major regions
corresponding with world markets. Only in a minority of instances it
would seem, will this apply to differences between countries and
industries. The variance by cultural realm as will be seen, further
outweighs any country or industty variance. The debt structure does
differ between cultural realms. This is discussed below.
2.7. d Preparation for Further Hypothesis Tests
The differences between the median ranks for cultural groups were
tested and further examined. The median ranks were computed for
each of the cultural realms (Table 5). Analyses were then conducted
between the median ranks of cultural groups and country/industry
cells to assess if patterns of difference could be determined. The two
remaining hypotheses as follow were used. Specifically, these are the
same as those used in the Collins and Sekely study but results and
interpretations differ materially as regards the significance of financial
structures between cultural realms.
Starting with the cultural realms, the test first seeks the results
"between" cultural realms, i.e. listed as the third hypothesis test. From
151

0
" i:::;i ::::;;
U..-. ', - -- -- - - - - •1
0'
I-.
¶1
C 1i ---2
(.2 - -- -
g
U U
•1
111 1 1 - 1 1 _
N
I-0 0
--
h
IiIj
C
UZ-o? ?
U00(JU
00 -
i
-o.

this, the results of debt ratios "within" cultural realms can be
calculated, i.e. the second hypothesis test.
2.8 Results of the Third Hypothesis Test
Using the computation from Table 5, the Kruskal-WaIlis test for
differences of rank was used on the median ranks of these six cultural
groups. Table 6 shows the calculations for this test and allows
examination of whether multinationals located in different cultural
realms have significantly different leverage structures. The results of
the test indicated this difference between the groups. Variance between
cultural groups in the use of debt does become significant. At the 0.05
level, the cut off point for statistical significance, the difference is real.
On this basis and in the context of the observations made, the null
hypothesis of no significant differences between cultural groups had to
be rejected.
Put differently, the median ranks of the cultural groupings in Table 5
do support the result from these calculations in Table 6 in that there is
a significant difference at the level of 0.025 and greater. The results
meet the 95% level of confidence required and are in compliance with
the statistical significance rule of 0.05 as applied. The variance between
the groups is widespread, i.e. not limited to, for example, one large
deviation between one group and all of the other groups. Using the
Broek Model (referred to in Ch. III, Section 2. Hypothesis and Test
Format), high debt levels were represented by Asia Pacific and the
Indian Peninsula. In applying the same model, Mediterranean Europe
and the Middle East appeared in the middle of the rankings. The
Anglo-American group and Africa showed a relatively low to medium
use of leverage. The foregoing confirms earlier observations in theliterature review. The results at the same time reflect that within this
152

(I,
0
I-
.2
U
LI
a)I-.a)
H
0
Ill
a)
05-,
0
CaI-
.2
U
en
en
U
Cr1
CU
C'.)
CU
Ca
0H
CU
Cr1
a)
'a•0
caLI
a)
To
en
in
tn en in en
en
0I-.
Ca.'- a)Cr1
Ca
0)
a)
inq
a)
CU a)
Ca
U C
C)
U
toC.)
'4-
U,
0
a)
1)-J

data base, the development and industrialisation of the countly does
not have a powerful effect on the debt ratios. For example, the Anglo-
American group used only little leverage but the Asia Pacific one
comparatively speaking used rather a lot.
2.8. a Comparative Results of the Third Hypothesis Test
In comparison to the results of the first hypothesis test in this study,
the Collins and Sekely study of cultural realms indicated significance
beyond the 0.001 level. The variance between cultural groupings was
very widespread. This study further observed that whilst there was a
relationship between the level of economic development and debt, it
was not a strong one. This was exemplified by the lower than average
use of debt in the Anglo-American Group, yet representing some of the
most developed and industrialised countries. At the same time the
researchers highlighted the Indian Peninsula as heavy users of debt
coupled with very low levels of development and industrialisation.
Some conclusions can be attached to this as set out below.
2.8. b Conclusion of the Third Hypothesis Test
A decade passed since these comparable data were first collected. In this
study, the debt ratio of the Anglo-American group did not materially
change. Debt at UK and US multinationals at this point of
measurement (1989-90) was at a low to medium level, much as was the
case before (1979). However, the Anglo-American realm in comparison
to other realms in relative terms is probably less industrialised than it
was ten years earlier. Also, it could no longer be said even at the time
of this study sample [1989-90] that the Indian Peninsula had very low
levels of development and industrialisation. Thus, whilst the findingsin some ways appeared the same, in other ways they were not. The
economic situation in the real world has become rather different.
153

Much of this has had to do with major shifts in world economies and
the development of certain realms, primarily Asia Pacific and the
Indian Peninsula. As a result, interpretations have changed. Today
[1995] these interpretations (as relate to the 1989-90 sample period)
appear even more credible than they might have then. Another reason
has been the changes that took place in multinationals themselves.
The increasing practice of these types of firms to source their activities
on a worldwide basis have added to the diminishing role of countries
and industries and the increasing importance of specific regions. An
example of this has been the high debt usage in the Asia Pacific region
as was noted also in the study. These regions in particular are
increasingly being matched, even today, with geographical target
markets for products, goods and services as well as with the individual
multinational's debt capacity. This has led to an ever increasing need
for reasonably corresponding international capital structures.
2.9 Results of the Second Hypothesis Test
As a result of the second hypothesis test, the null hypothesis of non-
significance was accepted. This was obtained from tests of each cultural
grouping of countries for differences between the median ranks of the
specific country/industry cells that constitute such groups. At the
individual group level, the null hypothesis could not be rejected in the
case of the Anglo-American and Asia Pacific groups (Table 7). In other
cases, the null hypothesis of no difference in ranks could not be
accepted. Africa had differences at the 0.01 significance level, the Indian
Peninsula at the 0.02 and the Middle East at the 0.05 level. The
difference inside the Indian Peninsula came mostly from the
variations in India. In the Middle East group, almost all countries
experienced large differences inside this cultural realm. A similarphenomenon was observed in the African realm.
154

U
0 U
-J
0I-.
0I-.
U
U
.4-
I-
U
a)
o
O E-
U,
a)
Lf) rr1cDZZZdO
\ c'1 .— r4
.— o m c.i
0
I.11
.4-.U,c '..-..0 •
- U, -
a)
(a
U
U,
0
-7

2.9. a Comparative Results of the Second Hypothesis Test
There did appear some similarity here with the previous Collins and
Sekely findings. These reported differences at the 0.05 and 0.10 levels
albeit for different regions and variations within them. This is further
commented on below.
2.9. b Conclusion of the Second Hypothesis Test
While some variations may exist within the cultural realms, as is the
case in this study as well as previous comparative research, these
variations tended to be confined to differences in a few countries only.
3.Comparative Analyses
At this stage, a number of further questions could be asked. It seemed
that, beyond the hypothesis tests two additional observations were
relevant. One was that of leverage in relation to geographical
expansion. The inclusion of this section is more fully justified if one
considers the necessity to enforce the earlier observation made that
there does not seem to exist a direct relation between debt and
geographical diversification. Rather, the D/ E appears a matter of
headquarters location by country grouping and cultural realm as may
influence international capital structure at the level of the individual
firm. This on the basis of its consolidated activities as a multinational.
The secondary data appear to support this. They do not manifest a
relation between the DfEand geographical expansion
The other observation was one of the leverage impact on R&D
expenditure under pre or post acquisition conditions. Here the
secondary data would seem to support the observation that leverage
155

brought about by mergers and acquisitions does not appear to adversely
affect the level of R&D expenditure.
Finally this section demonstrates the necessity to include interpretative
information clues, such as above, for additional investigation in the
future ( Ch.VI Recommendations for Further Research). As explained
below, the scope of this study does not provide for such an extensive
further examination.
3.1 Leverage and Geographical Expansion
Here the question may arise as to what the debt-to-equity levels were
of multinational companies outside the primaly sample and how they
averaged out? To others it may also be important to exhibit whether
any relation between debt levels and geographical diversification could
be observed. For example, did multinationals with comparatively
higher overseas sales or export sales have a higher debt-to-equity?
These questions have been answered in the qualitative sense, subject to
interpretation. They are not measured in the quantitative sense, e.g.
applying the Kruskal-Wallis methodology would have been beyond
the scope of this study. However, as aforementioned, it is
recommended that this be considered in the future (Ch.VI.
Recommendations for Further Research).
First reviewed were America's 50 largest global export corporations,
[Fortune, July, 1990], reclassified in order of debt assumption LDebt-to-
equity per Value Line Data Base Service, Lotus CD Investment, Forbes,
Januaiy, 1990]. Foreign held US companies that formed part of these US
based global export firms were excluded. Two examples are (a) Celanese
Corporation; because it is controlled by Hoechst of Germany, and (b)
Combustion Engineering as it is consolidated with the balance sheet ofNorthern Engineering Industries (NEI), a British quoted company. A
156

complete list of those excluded can be found in Table 14. These type of
adjustments reduced the sample from 50 in total to 46. The same
companies were then matched against the 500 largest US industrial
companies, [Fortune, April, 19901. All forty six of the exporters were
identified amongst the Fortune 500 group and ranked by overseas sales
revenues (i.e. the foreign sales derived from foreign subsidiary
operations prior to consolidation). The composite debt table (Table 15)
allowed for comparisons with debt levels ranked by firm. Table 14 on
growth, ranks overall sales (i.e. domestic plus overseas revenues)
listing separately the ranking in overseas sales revenues. It also lists the
percentage revenues from export activity (i.e. the foreign sales not
derived from foreign subsidiary operations but from the parent by way
of direct exports). The results from these comparative analyses
conducted on this basis are further commented upon in the next two
subsections.
3.1. a Debt-to-Equity versus Overseas Sales
In this comparative analysis (Exhibit 1), the FMC Corporation ranks
first in debt assumption. However, even with a negative debt-to-equity
of 101.30, it ranked only 10th in overseas sales. In comparison, Boeing
ranked 44th in debt assumption with a debt-to-equity of only 4.3 but
was first in overseas sales. On the basis of this qualitative observation,
there seemed no obvious relation between the level of debt and
geographical diversification. The results of high debt and an
international expansion policy are by no means automatic in this
respect. Having said this, the observation only concerns two examples.
However, as indicated earlier, the aim was only to obtain some further
information clues. Inferences for complimentary qualitative
interpretation can then be derived from this..
157

Exhibit 1
nEieographical Diversification (1)
Global
Total
DebtcQp
Debt Ratio Overseas Sales Assniiption
FMC
101.3
10
01
Boeing 43
01
44
(Extract Tables 14, 15)
Note:
Table 16 shows the ranking of FMC. Boeing amongst the Global 1000 ranking.
Table 17 indicates those sample companies excluded as of 1988-89 from this ranking.
3.1. b Debt-to-Equity versus Export Sales
The next question was whether there appeared to be any relationbetween debt-to-equity and direct export sales, i.e. as opposed to
overseas sales derived from foreign subsidiary operations. This was not
evident (Exhibit 2 below). For example, in the case of FMC, the
company ranked 37th in total sales but only exported 19.7%. Boeing on
the other hand ranked third, exporting almost half of its total sales. Yet
it managed to do so with considerably less debt than FMC.
Extending this analysis, the study added General Motors (GM) which
ranked first in total sales. GM's debt-to-equity of 47.9, although
substantially lower than FMC's, still represented much more of a debt
assumption than Boeing's 4.3 ratio. Yet, GM was found to export only
7.8% whereas Boeing did export 46.3% of its products. Even total
overseas sales, i.e. GM products sold locally overseas plus those
exported from the US, made GM rank no further than 41st out of the 46
158

largest US exporting multinationals. Boeing again occupied the first
position.
To be sure, another global automotive manufacturer and direct GM
competitor, Ford Motor Go, was then included in the analysis. Once
again, the earlier observation seemed confirmed. Ford with a debt-to-
equity of 72.6 followed immediately onto FMC in terms of debt, yet
only exported 9.5%.
Using the definition of multinationals (Chapter I), in the face of
geographical diversification, the following exhibit would indicate that
there is no relation necessarily between high debt levels and extensive
geographical diversification. In this sample, despite normal debt levels,
both Ford and GM remain well outside the top quartile of
multinational performers in terms of non-US domestic sales, even
when export sales are added to revenues generated overseas.
Exhibit 2:Ranking Geographical Diversification (2)
GlobalCompany
FMC
Boeing
GeneralMotors
FordMotor
Total
Debt Overseas Debt Total
Ratio Sales Assmptns Sales
101.3 10 01 37
4.3 01 44 03
47.9 41 07 01
42.6 35 02 02
% ExportSales
19.7
46.3
7.8
9.5
(Extract Tables 14, 15)
159

The foregoing tends to support earlier observations that an optimal
capital structure is the result of debt levels capacity that, importantly, is
also (a) firm-specific, and (b) subject to cultural influences on
international capital structure. This is commented upon further (Ch.
VI Recommendations for Further Research). This study does not
measure debt capacity (which would prerequisite definition of
equilibrium at the level of each firm). The study does measure
however, as has been indicated, for influences of culture on
international capital structure.
3.2 Effects of Merger and Acquisition Leverage on R&D Expenditures
The recurring question of the effect of leverage on R&D following a
merger or acquisition (M&A) warranted further analysis.. In sorting the
R&D percentages between companies within different cultural realms
and between major rgionsin the world, the uniqueness :of various
R&D patterns could be ascertained (Table 10, Summaly Tables 27, 30).
However, an effective way of demonstrating the importance of
resulting discretionary investments in R&D before and after
acquisition events, has been to analyse each firm's comparative
position. This is commented upon below.
Of the 87 firms in the primary sample, 37 were found to have been
associated with a merger or acquisition during the last five years (Table
18). Of these, 12 firms diversified their core product range (a) vertically,
i.e. within the same core business (b) horizontally, i.e. within a related
field of activity, or (c) both (Table 19). This is a limited observation but
nevertheless provides some indication that, for example, a takeover or
acquisition is not by definition followed by a reduction in R&D. This
indication is supported by the literature survey. Specifically, only in 5
cases amongst the sample population did the event result in slight
160

decreases. Another 5 firms reported no change at all. The remaining 15
firms declared their post-M&A periods as not applicable for purposes of
this analysis. No significance was observed as to possible changes in
R&D spending patterns after the M&A transactions. This appeared to
confirm earlier observations seen in the literature survey that M&As
do not affect the level of R&D expenditures. The same firms as a result
do not tend to become more vulnerable to takeovers than other firms.
4. Summary
The present analyses of capital structure amongst multinationals give
rise to several conclusions. Firstly, most of the determinants of
financial structure as were presented, appear indeed relevant for the
multinational business sector investigated here. Growth levels, of
which no significant influences were found, are an exception. It should
be noted that growth,. as :a macro-ecbnomic variable (in the same
category as interest rates, inflation) in terms of explanation tc the debt
categories, is limited. Growth, at the level of the firm, is approximated
by R&D levels; little debt funded or leveraged investment in R&D
expenditures would take place were it not in anticipation of demand
and market growth, for which such investments take place. Secondly,
however, the influences encountered surrounding the debt ratios on
which the tests focussed, are far less straightforward than the
hypothesised effects in the theory. Most variables available in the
theory influence the debt structure rather than leverage. The effects of
theses variables tend to cancel out or are insignificant. Checks on any
relationship between the assumed determinants of optimal capital
structure (the debt ratio, growth and R&D) did not produce a variable
with corresponding patterns. This makes the influences on total
leverage and an optimal capital structure with multinationals not only
smaller but also more susceptible to the effects of cultural influences.
161

The Kruskal-Wallis helped provide a better assessment than could be
obtained from mere observations to complete the answers being
sought. The test supports the hypothesis that:
(a) Multinationals located in different cultural realms have
significantly different financial structures.
(b) These differences in financial structures result from cultural
influences between major geographical areas of the world.
The test allowed to determine for any significance of cultural influence
on alternative finance structures of firms relative to different cultural
realms. In cartying out this test, when the results were run by industly,
country or within cultural realms, no significant relationship was
found. However when geographical groups classified by cultural realm
were compared to each other, the results did indicate a significant
relationship, rejecting the null hypothesis. The test was run industry
wide.
The differences in debt patterns would confirm that multinationals can
improve their financial planning on the basis of cultural analysis as
relates to a capital structure which falls in the pattern of internationally
recognisable capital structures. The cultural influence to some extent at
least implies the existence of regionally segmented international capital
markets. The assumption is made here that these differences are
optimal. In sum, this examination does not proclaim significant
differences within country groupings and industries. Yet differences
between country groupings support the idea that there exists a
variance, culturally, due to differences of international capital
structures. The capital structure was measured at the individual firm
level.
A comparison could be made where secondary data appeared.similar
162

to the same means in the sample. In this presentation, the purpose wasto isolate evidence of levels of leverage and geographical expansion.However, no apparent and direct relation could be established betweendebt and geographical diversification on this basis. Thus,multinationals do not seem to indicate that their ongoing expansionswould be fundamentally based on leveraged growth only. As the studydemonstrates, this cannot be achieved in isolation. The secondaiyanalysis further supports these findings.
In another secondaly analysis (but using primary data) the problem ofpre- and post merger and acquisition conditions was addressed.Multinationals involved in M&As did not indicate adverse effects intheir post-merger R&D, over those with limited involvement. Thosemultinationals not having been involved in M&A activity did notreflect more effective R&D spending patterns versus those involved.There appears no material merger and acquisitions effect on theoptimal capital structure of the firms in this respect.
Having stated the processed results of the quantitative study andqualitative observations, Chapter V of the study is reserved for furtherinterpretative discussion leading towards final conclusions. Chapter VIthen provides recommendations for further research. As a concludingremark for this chapter it can be noted that quantitative tests of theempirical implications of the established theory of finance as pertainsto multinationals are an extensive and promising area of research; itappears as yet largely neglected in tests of this sort and in the literatureon both finance and the multinationals.
163

CHAPTER V
INTERPRETATION AND CONCLUSIONS
This chapter constitutes a brief summaty of what has been done. To
reinforce the remarks made in Chapter 4, it summarises clearly the
empirical results, using this chapter to point out their salient features.
This provides a link with the earlier work
1. Interpretation
ii Aims
The study links the results obtained to the aims of the research. The
aim essentially was to close the observed gap between formal M&M
theoiy and the real world pertaining to multinationals as concerns
leverage and optimal capital structure. This required (a) defining debt-
to-equity under total leverage, (b) an examination as to what the
economic determinants were and (c) to examine for cultural influences
on international capital structure.
At the practical level this meant to assess:
(a) whether there exists between operational, financial, and
total leverage, and what this means.
b) whether the debt-to-equity relation under total leverage is
the most optimal positioning known to be applied in the real
world of multinationals
(c) whether culture as relates to geographical expansion, the
latter as a means of financial growth diversification, can be a
164

significant factor of influence in specifying an optimal capital
structure.
(d) whether high debt growth for multinationals under
conditions of total leverage can be considered a possible route
for optimal policy formulations as pertains to capital
structure.
1.2 Results
As indicated in Chapter 4, the data arguably may not tell us anything
about optimal capital structure, the theoty tending to influence the debt
structure rather than leverage. Also, as aforementioned, this makes
influences on total leverage and optimal capital structure less
significant but opens up multinationals to the possibly significant
effects of cultural influences. In fact the results of this study tend to
confirm and strengthen the interpretation that:
(a) debt-to-equity under total leverage appears the most
appropriate ratio known to represent the capital structure at
the firm level for a multinational
(b) cultural differences can be of significant influence to the
significant country grouping and minimal industry and
country differences.
This is different from earlier research which strengthened the
conclusions that:
(a) debt-to-equity under financial leverage is sufficient a ratio
to represent the capital structure at the firm level.(b) there were cultural differences contributing to the
significant country and minimal industry and country groupdifferences.
165

The shift of importance as obseived above under (b), i.e. from single
countries to countries grouped by cultural realm, may in part reflect the
growing sophistication in policy formulations that take place amongst
multinationals. These appear to focus on regional country groups that
correspond with perceived world markets for goods and services. Thus
while cultural groupings did not conclusively prove a cultural impact
on financial structure, they do give an indication of influence in that
direction. Subject to future research, these developments may further
influence multinationals in their ongoing attempts to finance the
proportions of debt, R&D and growth optimally whilst ensuring value-
maximisation of the resources made available at the operating level.
Therefore as concerns point (a), the debt-to-equity under total leverage
may well be the more appropriate ratio to reflect the proportions of
capital structure within the cultural context of a given multinational
headquartered in a certain cultural realm from which it were to operate
on a worldwide basis.
1.3 Evidence
As the results of the study already demonstrate, there appears a link
between optimal capital structure and the cultural influences on
international capital structure.The underlying link between the
policies on debt levels as maintained by multinationals and cultural
influences on international capital structure support as well as
reinforce this.
1.4 Importance
A renewed awareness of potential cultural influences on capital
structure will at least serve the purpose of setting a limit to instability.
This is important because more firms in the future are likely to become
multinational in structure. Much the same as those multinationals
surveyed in this study, their mutual competition will be based largely
166

on this geographical pattern, and because of the strong global focus,across their respective industiy sectors. It appears only reasonabletherefore to expect that some of the same characteristic internationalindustrial attitudes such as great drive for expansion and R&D, will beinfused in their activities.
The latter in this study's evaluation stands a better chance when takinga global form. While this particular study does not focus on strategy, inthe context of this research, global growth strategies as indicated wouldmost likely be derived from:
(a) the economic attraction to distribute R&D costs across ageographically diversified and thus larger market than that ofthe firm's national market only.(b) capitalisation on size economies to reap the advantages oflarger scale business operations across the world.(c)making best use of firm-specific resources on a global basisby function or business process, e.g. finance, recapitalisation.Note: as to (a) above, under the definition used chl, Section 64, all R&D is
written off against profit and loss instead of being capitalised on the balance
sheet.
This may be relevant to further research in future (Ch VI). In practice,most multinationals will probably tend to combine one or more of theabove strategies. In the same vein, many of the sample firms canalready optimise their activities as if the world were a single market,based on organisational and operating logic.
Further, analysis of pre -and post M&A activities showed, at least in thequalitative sense, that there was no negative effect to be expected frommergers or acquisitions on R&D levels. This subject has already beenconsidered as pertains to the influence of discretionary investment
167

policy on R&D. A full discussion, no matter how important, would beinappropriate in a final chapter which must reflect the scope and becircumspect in length. Here it is merely to interpret and commentconclusively on specific aspects of leverage which emerged in thestudy.
In terms of importance, some mention must be made about therelative success in geographical diversification as a form of financialdiversification. This has been a useful criterion, also for internationalcomparison, albeit that this issue varies in importance for differentfirms and between cultural realms. In this situation certain types offirms, as indicated earlier, stand to gain differentially. Access to andchanges in the capital market due to cultural influence and the taxsystem might further remove a certain bias from the financial structureof multinationals; this, it is believed will improve the mobility ofcapital but differences between major regional realms and geographicalgroupings remain.
Most important is that the answers this research has brought about inanswering the questions posed, in effect provide practical guidance forthe international manager, thereby further closing the gap betweentheory and practice. These managers after all will be better equipped tooperate internationally. They will be able to determine what a capitalstructure in certain parts of the world is likely to be i.e.for thosecompanies headquartered there - not simply operating there. They aretherefore likely to understand better why and how capital structurediffers internationally.
1.5Statistics
The examination of statistical criteria in the quantitative sense,generally underlined what in any case is not surprising the statistical
168

evidence as commented in the study is on branch information, bearingon the subject. Other evidence includes a theoretical rationale andgeneral belief on the basis of qualitative analysis and judgment.Obviously, each corporate situation in a multinational environmenthas to a large extent to be treated on its firm-specific merits. This wasimportant and therefore the limitations and ambiguities of the criteriawere identified early in the study. The uniqueness of specifications andcircumstances of the firm as well as its limitations are equallyimportant in practice but not always easily applied.
The difficulty in creating a data bank and the limitations this posed onstatistical application is an example of this. As a result, only non-parametric statistics could be applied. The use of parametric statistics, ifthis had been possible, arguably could have provided a strongerstatistical foundation. This is not to say however that the data bank asobtained has not been sufficient from which to draw a meaningfulinterpretation and subsequent conclusions. In relation to this, the useof the Kruskal-Wallis procedure has been the most appropriatemethodology (Section 2. Conclusions).
1.6 Limitations
In this study, it was imperative to survey the pressures of leverage andits impact on debt, growth and R&D. These economic determinantsmay either retard or hasten change and adaptation of an optimal capitalstructure in the complex business of multinationals. The concerntherefore has been to try and assess the outcome of this kind of surveyaccording to the previously defined criteria. Access to information atthe firm level however, as indicated, also varied. This createdlimitations in terms of interpretation.
In retrospect, the realm of multinationals consists of various culturally
169

defined world regions which would appear to have significant effecton leverage. In an extensive study of multinational business onetherefore would also have to devote a great deal of attention to thecultural influences of international capital markets, i.e. in addition tothe cultural influences on international capital structures, and this, atthe level of individual firms in the different countries concerned.Thus, this analysis could be extended further but it is quite impossibleto do this in a single chapter of a thesis and within its limited scope.
Further, the entirety of the discussion here has per force almost whollybeen confined to the issue of total leverage and optimal capitalstructure. In the outcome of this study it is recognised that this is aserious omission. This is commented upon further in the text (Ch. VIRecommendations for Further Research).
17 Contribution
Does all of the foregoing really mean that the original M&Mpropositions and their invariance will prevail and that it does notmatter what the capital structure is? If not in the real world ofmultinationals, in theory this may be the case but only to some extent.it would not be true to say that the proposed extension to the literaturehas therefore added nothing to what was implied in the M&Minvariance analysis. It was after all the failure of the latter analysis tocope with total leverage on a multinational scope that led to theevolution of this proposed extension that counters existing invariancetheory. This is where the study narrows the gap between existingtheory and practice as generally prevails among multinationals.
On the matter of M&M beyond the suggested improvements andextensions for the international manager, one would agree with one'scritics that the results do not close the M&M issue altogether, albeit that
170

it may have shed some light on the issue of total leverage thatsurrounds it. The problems here are far too complex to be settled by anyone empirical study. One trusts there will be agreement that the resultsshow a contribution to the ongoing M&M debate while providingpractical relevance to those international practitioners who, in searchof an optimal capital structure, wish to apply total leverage at the firmlevel.
In critical exchanges of this kind in which some of the emphasis isinevitably on technical details, the danger is always to lose perspectiveeasily and to overlook the progress towards agreement that has beenmade. In terms of substantive findings, it is felt that there should beagreement at least that the study's assessment of cultural influencebetween country groups on the leverage issue within multinationalshas been conducted with due care.
If there is a link between cultural influence and decision-making onthe subject of leverage, the cultural variant will affect capital structureto differ between country groupings. This is another importantconsideration to be taken into account by international managers in anincreasingly global environment. Therefore, the influence of culturewould warrant future research. An example would be to examine infurther detail the effects of property and ownership laws andregulations by country in the arrangements of respective optimalcapital structures (see Ch. VI Recommendations for Further Research).
171

2. Conclusions
2.1 The Issue of Total Leverage
One immediate conclusion of the study is that if multinationalsprogressively occupy a larger, more important place in the world intheir respective markets, they cannot be immune to the issue of totalleverage. Where multinationals have had a growing proportion ofturnover and profits from foreign operations over the last severaldecades, it is manifest that notwithstanding the pressures of debtaccompanying this, they have acquired positions of strength. Havingsaid this, the chances that certain multinationals will tend to becomeless vigorous and not retain their position are always there.
2.2 Optimal Capital Structure
The foregoing goes some way in explaining the studs interest in thesubject of total leverage and optimal capital structure. Put differently,what has been studied, has in fact been (a) the feasibility of a high debtgrowth policy under conditions of total leverage for purposes of value-maximisation of operating resources at the firm level, and (b) this,taking advantage of geographical expansion as a form of financialdiversification. The assumed route to effect this has then been theefficient application of leverage towards an optimal capital structure.This provides a slightly different perspective on the same subject.
It has further been argued, that the theoretical assumption of perfectcapital markets hardly applies to some of the developing countriesamongst the primary sample. The results of the research support thisargument in that there appear country effects on capital structurewhich derive at least in part from cultural influence between countrygroupings or cultural realms. Hence the varying degree of impact oftotal leverage.
172

2.3 Total Leverage
Any process that underpins total leverage also needs specification of
the firm's know-how, monopolistic advantage, or owner-specific
advantage. Thus, the capital structure discussed in the literature
becomes applied to a dynamic issue, that is not only to the levels of
debt but also to those of the circumstances of firm-specific operational
advantages.
The study also encountered other complexities. For example, in the
relation of leverage and R&D. The suspicion was that the constant
financial creativity required to generate new leverage opportunities
and funding in the form of M&As had to lead to a curtailment of
discretionary investments in R&D. It was feared that ultimately,
negative effects would then occur, mainly due to lack of R&D e.g. a
curtailed product development. Yet, in this study, multinationals
involved in M&As do not appear affected in their post-transaction
performance over those with limited involvement. Firms not acquired
did not have significantly higher or lower R&D versus those acquired.
In fact, R&D expenditures would seem to increase in parallel with
intensive acquisition activities where R&D intensive companies are
concerned. No significant and negative effects were observed. The
overriding determinant it appears, remains that of cultural influences
on international capital structures. The main findings in this respect
are as set out below.
2.4 Cultural Influences on International Capital Structures
It has been apparent from this study that the capital structure adopted
by companies and the resulting levels of leverage, country, type of
industry, and geographical region of the world, are subject tospecifically the cultural influences at the level of regional realms in
173

world markets. The decision-making process at the firm level would
appear to fall in step with this.
The analysis conducted, in effect indicates that the total leverage of the
firm is not necessarily influenced by the countiy or industry it is active
in. As seen, there is a minimal relation between countries as pertains
to the use of leverage. Industry groups rate also as minimal. Only the
relation between cultural realms in the use of leverage appears
significant. The influencing factors for differing degrees of total
leverage at the level of the individual firm can thus be related to
culture.
Therefore, it can be stated at least tentatively, that firm-specific
decisions may result in different capital structures for firms in the same
industry and/or country but these differences are less than the
differences one does find across all industries or countries. To firm up
these conclusions, as indicated earlier, more similar research needs to
be conducted. Having said this, the indication of direction in the
pattern of these cultural influences on international capital structures,
appears clear and significant.
The database used encompasses both, less developed as well as
industrialised countries. In conducting business internationally,
obviously one increasingly has to be aware of differences of financial
structure between different country groupings. Only in a minority of
instances perhaps will this be applicable to differences between
individual countries and industries specifically. Thus, this research is
of immediate practical use for the international manager. It provides
an insight into the likely capital structure of multinational firms
headquartered in certain cultural realms of the world. At the same
time it provides the international practitioner with an indication of
what sort of capital structure would be likely to be optimal if
174

representative for these same cultural realms. In addition, the culturalrealms and corresponding capital structures appear to parallel majorworld markets for goods and services.
175

CHAPTER VI
RECOMMENDATIONS FOR FURTHER RESEARCH
This chapter addresses in more detail why culture is important rather
than a statistical artifact. The data imply why there is a cultural
influence internationally on capital structure and why further research
on this topic would be welcome. Behind the data remain two other
important considerations as relate to the geographical expansion and
capital structure of multinationals. These can be categorised as follows:
I Leverage, Growth and Size Effect
2 Capital structure and Organisational Fit
As outlined in the next two sections, these issues also reflect the effects
of property and ownership laws and regulations by country that arise
when arranging respective optimal capital structures under total
leverage.
1. Leverage. Growth and Size Effect
The issue of debt naturally flows over into that of growth and size
effect, providing opportunities for total leverage. According to Prahalad
and Doz [1987]:
'If an aspect cI bsbiess is sthx t-ntisi egR&D, nianufacturthg the need to lec that
thstnient ftxreas the need icr gldal cn-ordinatioriand nientabcii qukkly to make brge hinwstments pofitable" (p• 13-
176

No empirical study was identified linking debt, growth and size effect
at the level of the firm. However, as Keegan [19861 observed:
"k isposslbk tocmtea gbalsüateg,'thatrecognscs
s1aiit aml tak ivantage ci qJpat1.nlles to
age xice, pndlk± R&D, and maricting whidi
also recopises dffereres whthls rspci-e is r*
at effcth" (a p 3)
This might have indicated a potential loss of flexibility and speed of
response that comes with economies of scale against the benefits that it
may bring Any trade-off must be sufficiently attractive.
The above raises other related topical areas that stand to gain from
further study. For example, Sullivan [19741 (pp. 7-14), Lyn and
Papaisannou [19851 saw a relation between market power and leverage.
Kimura [19891 associated worldwide product scope with the motives for
direct foreign investment (pp. 295-314). Firms can further optimise
their activities as if the world were a single market. As Keegan said:
"Researdt wifi gate pofita gtiwth if the reseaith
h 24-52)
The factor of size effect in this respect is of particular relevance to the
multinational. However, existing argument on the issue begs a
resolution. Ohmae [19901 still advocates a borderless world, with Porter
[19901 taking a diametrically opposing view. According to Porter [19871
it was a firm's national virtue that in part by association to the country
of origin created the opportunity to cross borders (pp. 43 - 59). Today,
[19951 neither of these authoritative authors has changed his position
on this issue. In this study's view, how management acts on these
opposing views has been very much a function of a multinational's
177

own firm-specific situation at a specific point in time.
This subject needs further attention. As Galai and Masulis [19761already explained the fiscal savings obtained from geographicaldiversification relate directly to increased levels of debt due to sizeeffect and global scope. This the authors said therefore could be a ratherinexpensive way of raising funds, giving the firm an advantageousleverage while the business is expanding (pp. 53-82). Later, Dow [19891under such conditions recommended an international interlisting onmore than one stock exchange (p. 394). This could be another specialistarea for further research. For those who seek to understand this issueof leverage, growth and size effect, in all its economic depth andcomplexlly, Scitovsky [1990] describes the benefits of monopolistic,asymmetric, and non-price competition and why these cannot easily beignored (pp. 135 - 148).
Some critics no doubt may argue against the research topics as proposedabove. They may claim that the price to be paid for growth and size issimply an intolerably high debt. Yet there already exists good evidenceto support the view that the debt ratio is not higher withmultinationals as compared to those of the domestic firm. Lee andKwok (19881 conducted empirical tests to investigate whethermultinationals are significantly different from domestic companies inthis respect (pp. 195-217). Their conclusion was that:
"Contraiy to onventional wisdom the empincalfirKllngs show that multhiaIicial aporatTiors tend tohave lowe' dth ratk than their daitestic QX1nteqDartSp195)
Some explanation is needed to put this conclusion into context;Mathur and Hanagan [1985] in their survey confirmed that barriers due
178

to partial segmentation of international capital markets are easier
overcome by multinationals. These as the authors said possess certain
assets, such as financial economies and managerial efficiency, which
make them more efficient in overcoming such restrictions and costs
(pp. 135-1 46). Scott and Martin [19711 also stressed the importance of
firm size in this respect (a. pp. 67-73). Also, shareholders and investors
have experienced multinationals as tending to outperform large
domestic groups. The latter has been confirmed on the basis of
empirical evidence provided by Sharpe [1985], indicating superior
foreign versus domestic investor returns (pp. 703-713). Sharpe [1990]
then incorporated Solnik and Nemeth's [1982] time series analysis of 17
countries during 1971-1980 with consistent results (p. 782). Also
Ibbotson [1982] having compiled investor returns during the 1960s,
1970s confirmed excess market value of foreign returns versus
domestic returns .Similar findings were later reported by Kim W. and
Lyn [19861 (pp. 119-125) as well as Cheol [1989] (pp. 345-348). Khan [1989]
recognised the gains to be derived from international diversification (p.
388).
Such evidence naturally marks international market imperfections,
also at the level of the firm. It reflects the real option value, i.e. the
opposite of the potential opportunity loss of multinationals. At the
firm level, management subsequently is concerned with total
variability of the total net cash flow rather than an investor's risk
component only. What matters, as Levy and Sarnard [19701 observed
early on, is that large firms at the same time will continue to have
better access to capital markets (pp. 795-802). This presents a quite
formidable argument in favour of the large firm operating
internationally and warrants further empirical research.
179

2. Capital Structure and Organisational Fit
In studying the debt-to-equity ratios in terms of total leverage, the
question arises as to what type of organisation is required to fit
leveraged growth, size effect and its accompanying capital structure.
This too requires further research. On the face of it, given the
complexity of factors influencing the corporate organisation, capital
structure and growth of the firm, there is little basis on which to argue
that a particular type of organisation would necessarily be the best. The
capital structure of each firm, it can be said, reflects its unique histoty
and its own particular way of meeting the changing situation.
However, apart from the technical and commercial considerations
which influence the organisation and size of firms, there is the
problem of dealing with the risks of fluctuating demand or growth. In
this case, there is no evidence of a single best solution. Marshall
already observed that:
"Crxisurn- demand after al], gownis traders demand
(Rid b.p92)
This prompts the question what the optimal organisation for a certain
level of debt ought to be. For example, one concern has been that as
conglomerates grow, their inherent organisational design might
prohibit capturing the full benefits of increased levels of leverage
beyond a certain threshold. A review of the work by Marshall, Yavitz
and Greenberg [19841 on the incentives for diversification and resulting
structure of the conglomerate does not provide a satisfactory answer
on this important technicality (pp. 1-23). Boulding [1981L a contingency
theorist, expressed the relationship between growth and capital
structure as a survival of the fitting rather than the fittest (pp. 197-208).
Scott and Martin [1971] expressed this same notion of fit saying that:
180

Dynairnc equilhlánn thi changes the ayclthe syst€ni to pserve its thtonal slructi.we ciielalionships despite a channg annenl'(11*1hp427)
Provided such organisational and environmental fit are present,growth and capital structure conceivably could be held in equilibrium.Looking at the issue from within, Wu [19871) even saw inter-organisational strategy as a way of increasing the firm's effective levelof leverage. As Higgins and Diffenbach [19891 pointed out, anycorporate structure has its own payoffs and risks (pp. 133-139). As hasbeen observed throughout the thesis, this is no different in terms ofcorporate financial structure, specifically as pertains to leverage and theoptimal capital structure of multinationals at the firm level.
181

LIST OF ABBREVIATIONS USED
ANOVA
ANOCOVA
B/S
CAP
DIE
Dli
DOL
EBIT
FASB
Analysis of the Variance
Analysis of the Co-variance
Balance Sheet Statement
Capitalisation
Debt-to-equity relationship in Leverage
Degree of Total Leverage
Degree of Operational Leverage
Earnings Before Interest and Taxes
Financial Accounting Standards Board
FL Financial Leverage
GAAP Generally Accepted Accounting Principles
M&A Mergers and Acquisitions
M&M Modigliani and Miller
OCF Operational Cash Flow
OFED Organisation for Economic Co-operation andDevelopment
01 Operating Leverage
P&L Profit and Loss Statement
plc Public Limited Company
R&D Research and Development
182

ROE Return on Equity
SEC Securities and Exchange Commission
S SAPs Statements of Standard Accounting Practice
TIE Times-Interest Earned
TL Total Leverage
WACC Weighted Average Cost of Capital
183

LIST OF CARDINAL DEFINITIONS AND TECHNICAL NOTES
Accounting Break-even
Dividends
EBIT
Exchange Rates
Geanng
Geographical Diversification
Global
Inflation
Junk Bonds
Leverage
Shareholders' Equity
TIE
WACC
184

Accounting Break-even
The Accounting Break-even is simply the sales level that results in
zero operational net income. It is the most widely used measure of
break-even
DividendsDividends are payments due to shareholders on a residual claim or
where such relate to arbitrage as the process of selling overvalued
assets versus undervalued assets - or their equivalent cash flows- in
markets related and which are temporarily out of equilibrium.
EBITAbbreviation of "Earnings before Interest and Taxes" used in the TIE
ratio.
Exchange Rates:
The exchange rates as relate to inflation and the exchange risk is the
uncertainty and the return on foreign financial assets due to theunpredictability regarding the rate at which the foreign currency can be
exchanged into the investor's own currency.
Note:
In this thesis the exchange rate is referred to in relation to inflation and the historical
cost statements of annual reports of the international companies in the primary sample.
Conventional accounting standards as relate to the treatment of currency exchange,
their translation or their conversion, have been adhered to in the evaluation of
consolidated financial statements, encompassing parent as well as subsidiary reporting
on a worldwide basis.
GearingGearing is the UK term used to indicate the relationship between
equity capital and fixed interest capital, i.e. technically equivalent to
the American term of financial leverage. Under this definition, after
185

deducting interest on debt, profits are available for dividends on the
equity. The effect of high gearing makes it more uncertain that
dividends can be paid but if the debt is financing profitable business,
dividends can grow more than proportionally.
Geographical Diversification
Geographical diversification is interpreted as a form of financial
diversification in the context of reduced portfolio risk
Global
The term "Global" used to refer to global industty structures as reflect:
(a) homogeneous market demand in non-fragmented industries,
(b) heterogeneous market demand in fragmented industries,
(c) the economic imperative for the firm to distribute R&D costs,
economies of scale, and firm-specific resources.
Inflation
The percentage change in the purchasing power of a unit of currency
over a certain period of time. Equivalently, the rate of change in the
price index of a certain period of time.
Note:
As pertains to the study, US and Japanese firms tend to provide supplementaiy
inflation adjusted statements on a consistent basis. On this basis annual reports are
stated at historical cost. UK firms do not adhere in full to a historical cost basis for
their basic reports but provide additional inflation-adjusted statements or footnotes to
their annual reports. The data used therefore are real rather than nominal data. That
is, the data have been adjusted for inflation.
Junk Bonds
Junk bonds are high-risk/high-yield bonds in the context of financial
leverage, as opposed to low risk investment bonds.
186

Note
The study does not mention junk bonds as a specialised bond when referring to bond
financing as part of capital structuring. The issue of junk bonds is outside the scope of
this study.
Leverage
Leverage is referred to as:
(a) the use of relatively fixed-cost sources of funds, achieving an
equilibrium by applying low interest borrowed funds relative to the
acquisition of high interest assets - or their equivalent cash flows - for
an increase in expected rate of return to the firm's shareholders but
only with a commensurate increase of risk
(b) the efficient and effective integrated use of the debt capacity and
management capacity of a specific firm.
(c) the whole operation being based on a defined appropriate total
leverage position and optimal capital structure by linking financial
strategy and business policy, taking into account cultural influences on
international capital structure.
Shareholders' Equity
Shareholders' equity initially is treated as the net worth of a business
firm, including capital stock and certain net worth reserves, leaving
common equity as part of the total net worth that belongs to common
shareholders and total shareholders' equity as the worth that includes
the preferred shareholders. The latter, aside from capital stock and
reserves includes capital (paid-in surplus) and earned surplus (retained
earnings).
TIE
The Times Interest Earned ratio (EBIT/interest) is referred to in the
context of a measure of long-term solvency pertaining to a company'sability to cover interest obligations.
187

WACCThe weighted average of the costs of debt and equity referred to infinancial theory is the required return of any investment of the firmthat must be earned on existing assets to maintain the current value ofthe firm (100% capital = E/V-*- D/V).
Consequently, the formula used as a discount rate where evaluatingcash flows from proposed investments or existing operations. TheWACC encompasses the weights (debt and equity percentages) andexpected returns (costs of debt and equity). The expected returns xweights when added constitute the WACC ,LWACC (E/V) x Re + (D/V)
RdL V denoting value, and Re, Rd as the required returns (or costs of)equity and debt.
188

SELECTED REFERENCES
Aggarwal R., "International Differences in Capital Structure Norms:
An Empirical Study of Large European Companies",Management
International Review. 1981, pp. 75-88.
Argenti J., Corporate Collapse: The Causes and Symptoms, New York,
NY: McGraw-Hill, 1976, p. 136.
Ashton R K., "Personal Leverage vs Corporate Leverage: An Extension
of the Debate", The University of Nottingham. Journal of Business
Finance and Accounting, Vol. 3, No. 4, Winter 1986, pp. 619-625.
Ball D. A/ McCulloch W. H., 1982. In Collins J. M/Sekely .W., "Cultural
Influences on International Capital Structure',Journal of International
Business Studies, Spring 1988, p. 88.
Bank Mees Pierson. See Elte.
Beresford D. In Underwood," United States Accounting Standards for
Foreign Currency", Foreign Exchange Yearbook, Cambridge:
Woodhead-Faulkner (Publishers) Ltd, 1979, pp. 29-31.
Bhattachaiya S., a. "Corporate Finance and the Legacy of Miller and
Modigliani", Journal of Economic Perspectives, Vol. 2, No. 4, Fall 1988,
a. pp. 135 - 147.
1979, b. "Imperfect Information, Dividend Policy, and the Bird
in the Hand Fallacy', Bell Journal of Economics, 1979, Vol. 10,
pp. 25 9-270.
189

Black F. and Cox J ., "Valumg Corporate Securities: Some Effects of
Bonds In denture Provisions ", Journal of Finance, May 1976, Vol. 31
No. 2, PP. 351 -367.
Boskin M., "Distinguishing Permanent and Temporary Increases in the
Growth Rate, Tax Policy and Economic Growth: Lessons from the
1980's", Journal of Economic Perspective. Vol. 2, No. 4, Fall 1988, pp. 76-
77.
Boulding K., Evolutionary Economics, Beverly Hills, CAL Sage, 1981 &
"General Systems Theory - The Skeleton of Science, "Management
Science, Ann Arbor University of Michigan Press, 1956, pp. 197-208.
Bowen R M./ Daley L A.! Hubert C C., "Evidence on the Existence and
Determinants of Inter-industry Difference in Leverage", Financial
Management. Winter 1982, pp. 10-20.
Bower J ., "Managing for Efficiency, Managing for Equity", Harvard
Business Review. August 1983, pp. 83-90.
Broek J., A Geography of Mankind, New York: McGraw-Hill, 1973.
1988. In Collinsf Sekely.
Burrell G./ Morgan G., Sociological Paradigms and Organisational
Analysis. London: Heinemann Educational Books, 1979.
Buser S.f Hess P., "Empirical Determinants of the Relative Yields on
Taxable and Tax-Exempt Securities", Journal on Financial Economics,
Vol. 17, 1986, pp. 335-356.
Cairns D./Lafferty M./ Mantle P., "Survey of Accounts and Accountants
1983-1984", Lafferty Research, London: Lafferty Publications, 1985.
190

Cheol E S., "International Portfolio Diversification. Global Risk
Diversification: A Case for International Investment". In Eiteman
David K/Stonehill A. I., Multinational Business Finance, Reading,
MA: Addison-Wesley Publishing Company, 1989, PP. 345-348.
Choi F. D., "Financial Disclosure and Entry to the European Capital
Market"journal of Accounting Research 1973, Autumn, pp. 159-197.
Choi J . J ., "Analysing Foreign Financial Statements: The Use and
Misuse of International Ratio Analysis", Journal of International
Business Studies. Spring/Summer 1983, Pp. 113-131, p. 396.
Collins J. M. / Sekely W., "Cultural Influences on International Capital
Structure", Journal of International Business Studies. Spring 1988, a. p.
90, Ibid. b. p. 88, . c. pp. 91-96, . d. p. 89, Ibid, e. p. 92.
1983. "The Relationship of Headquarters, Country and
Industry Classification to Financial Structure", FinancialManagement. Autumn, pp. 45-51.
1994. Collins, Correspondence
Commons, L Tender Offer. The Sneak Attack in Corporate Takeovers,
Berkeley, CAL University of California Press Ltd., 1985, p. 146.
Conover W. J ., Practical Nonparametric Statistics, New York John
Wiley & Sons, 1971.
Cooper S. / Fraser D., "Risk, Return and the Efficiency of Financial
Markets", The Financial Marketplace, (3rd ed.), Reading MA Addison-
Wesley Publishing Company, 1990, p. 364.
Daniel W./Terrell J., "The Kruskal Wallis Test", Business Statistics,Boston: Houghton Muffin Company, 1987.
191

De Langen W. J . / Ysselmuiden T. S., "Financiering en Liquiditeit",
(Financing and Liquidity) Inleidinq tot Balanslezen (Introduction to
Balance Sheet Interpretations), Samson Uitgeverij, Aiphen aan den
Rijn: 1973, p. 66.
Deloite, Haskins & Sells, Offerings by Foreign Issuers of Securities in
the United States of America - Simplified Disclosure Rules, New York
DH&S Research, 1983.
Donaldson G., Managing Corporate Wealth, New York, NY: Praeger,
1984, a. p. 3, Ibid. l. p. 22.
Dow S. M., "International Interlisting: A Study of Firms Listed on the
Toronto Stock Exchange and Major U.S. Stock Exchanges", Journal of
International Business Studies, Summer 1989, p. 394.
Duffey G., "International Funding and Hedging Decisions", "Hedging
and Positioning in International Markets for Financial Assets", Fifty
Cases in International Finance, Reading, MA: Addison Wesley
Publishing 1987, pp. 95-270, pp. 291-390.
Duffie D., "Equilibrium and the Role of the Firm in Incomplete
Markets". August 1986, Stanford University, Manuscript.
Durand D., "Cost of Debt and Equity Funds for Business: Trends and
Problems of Measurement. In the Conference of Research in Business
Finance", New York, NY: National Bureau of Economic Research, 1952,
pp. 215-247.
Dybvig P. H., "Arbitrage". In Eatwell J . / Milgate J . M./ Newman eds,
New Palgrave, A Dictionary of Economics, London: The MacmillanPress, Ltd., 1987, Vol. 1, pp. 100-106.
192

Economist, Editorial, Business Survey, London, "Sealed Air. By the
throat", September 14th, 1991, pp. 94-95.
Eiteman D. K. / Stonehill A. 1., a. "The Foreign Exchange market",
Multinational Business Finance, Reading, MA: Addison-Wesley
Publishing Company, 1973, p. 38.
1989 b. "Cost of Capital and Financial Structure" & "Financial
Structure of Foreign Affiliates", Multinational Business
Finance, Reading MA: Addison Wesley Publishing
Company, 1989, pp. 618-619.
Elte K, "Average Yield on Corporate Debt". Source: Datastream,
August 24, 1994, Amsterdam: Research Department. Bank Mees
Pierson.
Errunza Vihang R., " Determinants of Financial Structure in the
Central American Common Market", Financial Management, 1979 pp.
72-77.
Fama E. F., "Stock Returns, Real Activity, and Inflation", American
Economic Review, Vol. 71, 1981,
Forbes. debt-to-equity for value Line Data Base Services via Lotus CD
Investment, Janualy 8, 1990.
Fortune, Global Rankings, April 23, 1990.
Francis J.R, "Debt Reporting by Parent Companies: Parent-Only vs.
consolidated Statements", The University of Iowa Journal of Finance
and Accounting Vol. 13, No. 3, Autumn 1986, pp. 393-403.
193

Galai D./ Masulis R W., "The Option Pricing Model and the Risk Factor
of Stock", Journal of Financial Economics, Januaiy 1976, pp. 53-82.
Gentry J . A./ Newbold P./Whitford D.T., "Funds Flow Component,
Financial Ratios and Bankruptcy", The University of Illinois Tournal of
Business Finance and Accounting. Vol. 14, No. 4, Winter 1987, pp. 595-
605.
Goodwin N., "The Basic Paradigm of a Future Socio-cultural System".
In World Issues. Hine Virginia H., Center for Democratic Institutions,
April/May 1977.
Gordon R./ Mailidel B., "How Taxes Affect Economic Behaviour". In
Aaron and Perihamer, eds., Corporate Finance. Washington: Brookings
Institute, 1981, pp. 131-191.
Gray S. J. / Campbell L G./ Shaw J . C., "A Comparative International
Survey of Accounting Requirements and Practices in 30 Countries",
International Financial Reporting London: McMillan Publishing 1984.
Gray S.J./ Roberts C B., In A G.Hopwood, ed., "Voluntary Information
Disclosure and the British Multinationals: Corporate Perceptions of
Costs and Benefits", International Pressures for Accounting Change,
London: Prentice-Hall, 1988.
Griliches, a. In Boskin, 1988, pp. 14-15.
1979. b "Issues in Accounting. The Contribution of R&D toProductivity Growth", The Bell Journal of Economics,
(Spring), Vol., 1, No. 1, pp. 92-116.
1973. c "Research Expenditures and Growth Accounting". In
Williams B. R., ed., Science and Technology in EconomicGrowth, London: Macmillan, pp. 59-95.
194

Groelner D./ Shannon P., "Kruskal-Wallis", Essentials of Business
Statistics, Columbus, OH: Merrill Publishing 1987.
Guisinger S., "Total Protection: A New Measure of the Impact of
Government Intervention on Investment Profitability", Journal of
International Business Studies. 1988, pp. 280-295.
Hall B., 1987. In Jensen, 1988, & Hall, "The Effect of Takeover Activity
on Corporate Research". Research and Development, working paper,
NBER. 1987.1989. In Jensen.
Harvey-Jones J ., Managing to Survive, A Guide to Management
Through the 1990s, BCA London, 1993, a. p. 49, Ibid. b. p. 50.
Hayes S. L/ Reiling H. B., "Sophisticated Financing Tool: The
Warrant", Harvard Business Review. Vol. 47, 1969, pp. 137 - 150.
Hecht L, "Managers who Succeed as Bosses". In Eummoney. December1986, p. 38.
Higgins B./ Diffenbach J ., Communicating Corporate Strategy: The
Payoffs and the Risks", Long Range Planning. June 1989, pp. 133-139.
Hofstede G., "Organising for Cultural Diversity", Nature of National
and Business Culture Differences within Corporations and their
Implications for the Structuring of the Organisation. In European
Management Journal, Vol. 7, No.4, 1989.
Ibbotson R. G./ Can' R Cl Robinson, A. W., "International Ecuity and
Bond Returns", Financial Analysts Journal. July-August 1982.
195

Jensen M. C., "Eclipse of the Public Corporation", Harvard Business
Review, September-October 1989, a. p. 61.
. 1988 b. "Takeovers: Their Causes and Consequences", Toumal
of Economic Perspectives. Winter, Vol.2, p. 28.
1988 c. Ibid. p. 27.
Jensen M. C. / Meckling W.H., "Theories of the Firm: Managerial
Behaviour, Agency Costs and Capital Structure", Journal of Financial
Economics, October 1976, pp. 305-360.
Keegan W.J. The Decline and Fall of the Multinational Corporation: A
Typology of Stages of Corporate Development. Center for Applied
Research, Pace University: New York, NY: Working Paper No. 62,
September 1986, a. p.3.
1986 b. Ibid. pp. 24 - 54.
Kelly L., "The Development of a Positive Theory of Corporate
Management's Role in External Financial Reporting", Journal of
Accounting Literature, 1983, pp.1 11-50.
Ken singer J.W./ Martin J.D., "The Decline of Public Equity: The Return
of private Enterprise ?", Business Horizons. November - December
1989, pp. 20-22.
Khan M. M., "Active Portfolio Management and the Gains from
International Portfolio Diversification", tournal of International
Business Studies, Summer 1989, p. 388.
Kim W. S./Lyn E. 0., "Excess Market Value, The Multinational
Corporation, on Tobin's q Ratio: A Note", Journal of InternationalBusiness Studies, Spring 1986, pp. 119-125.
196

Kirnura Y., " Firm Specific Strategic Advantages and Foreign Direct
Investment Behaviour of Firms: The Case of Japanese Semiconductor
Firms", Strategic Advantages and FDI Behaviour ", Journal of
International Business Studies, Summer 1989, pp. 295-314.
Kogut B./ Singh I-I., "The Effect of National Culture on the Choice of
Entry Mode", Journal of International Business Studies. Fall 1988, p.
411, p. 414.
Kruskal W. H./Wallis H., see Lapin, 1985; Daniel and Terrell,1987;
Groelner and Shannon, 1987.
Lapin L, "Testing for Independence and the Chi-square Distribution",
Statistics for Modern Business. New York Harcourt Brace Jovanovich
mc, 1982, 3rd Ed., pp. 501 -507.
1985. pp. 652-654.
Lee K. C./ Kwok C.Y., "Multinational Corporations vs. Domestic
Corporations. International Environmental Factors and Determinants
of Capital Structure", University of Southern Carolina, Journal of
International Business Studies. Summer 1988, pp. 195-217.
Leedy P.D., Practical Research Planning and Design (4th Ed.), New York
Macmillan Publishing Company, 1989, p. 201, pp. 208-209, p. 211, pp.222-223.
Lessard D.R. "Investor Recognition or Corporate International
Diversification", Journal of Finance. September 1977, pp. 1049 - 1055,
1978. "World, Country and Industry Relationships in Equity
Returns: Implications for Risk Reduction through InternationalDiversification", Financial Analysts Journal. Vol.. 32, January-February1978, pp. 32-38.
197

Levy H./Sarnard M., "Diversification, Portfolio Analysis and the
Uneasy Case of Conglomerate Mergers", Journal of Finance, September
1970, pp. 795 -802.
Lewftwich R. B./ Wilson B. D., a. "U.S. MNCs, Financial Leverage and
Effective Income Tax Rates", Special Survey of U.S. MNCs. U.S.
Department of Commerce, 1970.
______ 1970. b. "An Examination of the Capital Structure of the
Foreign Subsidiaries of MNCs". University of Virginia. Working Paper
pp. 79-125.
Lyn E. L./ Papaisannou G., "The Empirical Relationship between
Capital Structure and Market Power". A Paper presented at the Finance
Management Association. 1985.
Mahimi A., Making Decisions in Multinational Corporations. New
York John Wiley & Sons, 1988.
Marshall A., "Hypothesis of Stationaty State. Equilibrium of Normal
Demand and Supply, p. 366.
.1927 "Stable Equilibrium", a. p. 345 & b. "Introduction",
Principles of Economics, (8th ed.), London: Macmillan and Co. Ltd.,
1927, p. 92.
Marshall W. J./Yavitz J . B./Greenberg E., "Incentives f or
Diversification and the Structure of the Conglomerate Firm", Southern
Economic Journal, July 1984, pp. 1-23.
Mathur/ Hanagan K., "Are Multinational Corporations Superior
Investment Vehicles for Achieving International Diversification ? ",
Journal of International Business Studies, Winter 1985, pp. 135-146.
198

McKinnon S. M., "A Cost-benefit Study of Disclosure Requirements for
Multinational Corporations", tournal of Business Finance and
Accounting. 1984, (Winter Ed), pp. 451-468.
Meek G. K/ Gray S. J ., "Globalisation of Stock Markets and Foreign
Listing Requirements: Voluntaty Disclosures by Continental European
Companies Listed on the London Stock Exchange", Journal of
International Business Studies, Summer 1989, pp.315-336
Mesthene E. G. In Technological Change, New American Ubraiy, New
Yorlç NY: 1970.
Meyers S. C., a. "Determinants of Corporate Borrowing", Journal of
Financial Economics, November 1977, a. pp. 147-175, b., Ibid. p. 207.
Miller M. H., The Modigliani-Miller Propositions After Thirty Years,
Journal of Economic Perspectives. Vol. 2, No. 4, Fall 1988, Ibid., a. p. 112,
Ibid.. b. p. 100, Ibid., c. p. 102, Ibid.. d. p. 99, Ibid.. e. p. 103, Ibid.. f. p. 107,
and Ibid.. g. p. 113.
______ 1977. "Debt and Taxes", Journal of Finance. May 1977, Vol. 32,
No. 2, pp. 261 - 275.
1963. "The Corporate Income Tax and Corporate Financial
Policies", The Commission on Money and Credit. Englewood Cliffs, NJ:
Prentice-Hall, pp. 381-470.
Modigliani F./ Miller M. H., "The Cost of Capital, Corporation Finance
and the Theoly of Investment", American Economic Revue, No. 3,June1958, pp. 261-297.
__.1967. In "Leverage, Risk of Ruin and the Cost of Capital",
Baxter N., Journal of Finance, No.3, September, pp. 39 5-403.___.1982. "Debt, Dividend Policy, Taxes, Inflation and Market
Valuation", Journal of Finance. May, Vol. 37, No. 2, pp. 255-273.
199

Narapareddy V. U, "Input, Competition and Bankruptcy: The Impact of
Industry Structure", University of illinois at Urbana and at Champaign,
Ms., 1987.
Nemeth E., 1982. In Shape, 1985, 1990.
OECD. Paris, 1984.
Ohmae K., The Borderless World, New York, NY: Harper BusinessPublishing 1990.
Peat Marwick International, Worldwide Financial Reporting and Audit
Requirements: A Peat Marwick Inventoly, New York PMI 1983.
Peters T. J . / Waterman J.H., In Search of Excellence. New York Harper
& Row, 1988, pp. 8-11.
Porter M. L., The Competitive Advantage of Nations. London: The
Free' Press, 1990, & Porter, "From Competitive Advantage to Corporate
Strategy, Harvard Business review, May-June 1987, pp. 43-59.
Fowel J.B., High Tech Investing New York, NY: The Dow Jones-Irwin,1986, p. 265.
Prahalad C. K./Doz Y. L., The Multinational Mission. NY: The FreePress - Macmillan mc, 1987, pp. 13-90.
Prather C. L., "Optimum Size", Financing Business Firms, Homewood,
ILL Richard D. Irwin Inc., 1971, a. p.2145, b. p. 455-459, Ibid. c. p. 446-
447, Ibid. d. p. 448, Ibid. e p. 467.
200

"R&D Scoreboard: Reagan & Foreign Rivalry. Light a Fire Under
Spending", Business Week, July 8, 1985, & 1986-1987.
.1987. "R&D Scoreboard: Research Spending is Building up to a
Letdown", Business Week, June 23, pp. 139-140."
Remmers L/ Stonehill A./ Wright R & Beekhuizen T., "Industry and
Size as Debt Ratio Determinants in Manufacturing Internationally",
Financial Management. Summer 1974, pp. 23-32.
Ritchie J . C., "Convertible Bonds and Warrants". In The Handbook of
Fixed Income Securities. Fabozzi F. J./Pollack I. M., Homewood, ILL:
Dow-Jones Irwin, 1983.
Robbins S./Stobaugh R. B., "International Mobility and Movements of
Capital - Comments". In Machiup F./Salant W./ Tarshis L, eds.,Columbia University Press for National Bureau of Economic Reseatch,
1972, pp. 354-357.
Rose P. S./ Fraser D. R., Financial Institutions (3rd ed.), Piano, TX:
Business Publications Inc., 1988, pp. 20-21 & "Relationship between
Interest Rates and the Amount of Loanable Funds", Ibid. pp. 102-1 03.
Ross S. A, "The Determination of Financial Structure: The Incentive
Signalling Approach", Bell fournal of Economics, Vol. 8, No. 1, Spring
1977, pp. 23-40..1988. "Comments on the Modigliani-Miller Propositions",
Journal of Economic Perspectives, Vol. 2, No. 4, Fall, p. 129, p. 196._.1976 "Return, Risk and Arbitrage". In Friend, Irving and James
Bicksier, eds., Risk and Return in Finance. Vol. 1, Cambridge, MA:
Ballinger, pp. 189-219,
201
Ross S. A. /Westerfield, R. W. /Jordan, B. D., Fundamentals of
Corporate Finance. Richard D. Irwin inc., Homewood Iii.: 1991, a. p. 196,
Ibid. .b. p. 490, Ibid. c. p. 452, Ibid. d. p. 25,Ibid. e. p. 5, p. 25, pp. 56-57, pp.368-381, Ibid. f. p. 56, Ibid. g. p. 377, Ibid h. p. 368, Ibid. 1. p. 57 & Ibid. j. p.491.
Rutterford J., "An International Perspective on the Capital Structure
Puzzle. In: Stern/ Chew, New Developments in International Finance.
New York, NY: 1988, pp. 194-206.
Rybczynski T. M., "Financial Systems and Industrial Restructuring",
Quarterly Review. National Westminster Bank, 1989, pp. 3 - 11.
Schmookler J ., Invention and Economic Growth, Cambridge, MA
Harvard Press, 1966.
Scitovsky T., "The Benefits of Asymmetric Markets", Journal of
Economic Perspectives. Vol. 4, No. 1, Winter 1990, pp. 135-148.
Scott D. F./ Martin J.D., "Industry Influence on Financial Structure",
Financial Management. Homewood, ILL: Richard D. Irwin Inc., 1971, a.
pp. 67-73, b. p. 427.
___.1972. "Evidence on the Importance of Financial Structure",
Financial Management, Summer, pp. 45-50, & Scott D., New Edition,1973.
Securities and Exchange Commission (SEC), "Adaptation of ForeignIssues Integrated Disclosure System", Federal Register. 47 (234),
Washington D.C.: 1982, December 6; 54764-54790
Senbet L., "International Capital Market Equilibrium and the
Multinational Firm Financing and Investment Policies", Journal of
202

Financial and quantitative Analysis, September 1979, pp. 445-480.
Shapiro A. C., " Financial Structure and the Cost of Capital in the
Multinational Corporation", Journal of Finance and Quantitative
Analysis. June 1978, pp. 211-266.
Sharpe W. F., "Extended Diversification. Exchange Risk Foreign and
Domestic Returns", Investments (3rd ed.), Englewood Cliffs, NJ:
Prentice-Hall Inc., 1985, pp. 703-713.
.1990. "Extended Diversification. Foreign and Domestic
Returns", Investments (4th ed). p. 782; incorporating Bruno Solnik's
and Eric Nemeth's "Asset Returns and Currency Fluctuations: A Time
Series Analysis", paper presented at the second Tagung Geld Banken
und Versicherungen, (EngI.: Money, Banking and Insurance),
Universitaet Karisruhe, December 1982, & Sharpe/ Gordon, Mns., 1989,
1990.
Solnik B. H., 1982. In Sharpe, 1990, & Solnilç "An Equilibrium Model
of the International Capital Market", Journal of Economic Theoiy.
August 1974, pp. 500-524.
Solomon E., "Leverage and the Control of Capital", Tournal of Finance,
No.2, Vol. XVVIII, 1963, p. 273.
Solomon R/ Pringle J . J., Anjntroduction to Financial Management,
Glenview, ILL Scott, Foresman and Company, 1986, pp. 138-142.
Stiglitz J . E., "Why Financial Structure Matters", Journal of Economic
Perspectives. Vol. 2, Fall 1988, p. 126.
203

Stiglitz J . E./ Weiss A., "Incentive Effects of Termination: Applications
to the Credit and Labour Markets", American Economic Review,
December 1983, PP. 912-927.
Stonehill A. / Stitzel T., "Financial Structure and Multinational
Corporations", California Management Review. Fall 1969, a. pp. 91-96,b. Ibid. pp. 618-619.
Sullivan T., "Market Power, Profitability and Financial Leverage",
Journal of Finance, Vol. 14, December 1974, pp. 7-14.
Taggart jr. R.A., "Corporate Financing: Too Much Debt ?", Financial
Analyst Journal. May-June 1986, pp. 35-42.
Terleckzyj N.E., "Effects of R&D on the Productivity Growth of
Industries," Washington D.C.: National Planning Association Report,
No. 140, 1974.
Toy N./Stonehill A./Remmers L/Wright R./Beekhuizen T., "A
Comparative International Study of Growth, Profitability and Risk as
Determinants of Corporate Ratios in the Manufacturing Sector",
Journal of Financial and Quantitative Analysis, November 1974, pp.
875-886.
Tsurumi R, "American Origin of Japanese Productivity", Operations
Management Review, Spring 1983, pp. 43-50.
Tunick ./ Saxe E., Fundamental Accounting, Theory and Practice,
Englewood Cliffs NJ: Prentice-Hall Inc., 1969.
Varian H., "The Arbitrage Principle in Financial Economics' TheJournal of Economic Perspedives. Fall 1987, a. pp. 55-72, b. pp. 8-15.
204


A
• •.
:-
"4
j,.
3- I)"' 4- .4441* 4 .444 1 -_ r,,, ,
- - i'4' .4
.4 -4. 41 3-
4 1 - 3 ' " - 4...'.- - .. 3-
-
-. /
I 1 -
-, .4 -
1 '4.4
.4w '4 44',-. .-" ,
'4 ,1 , 1 .,
I 4'4. t 3 4 J4 ,4.-_•I .!
1.'
'4 A 2
" '3-''4.- --'
''
i".' * 4
-
.4/"%
1 4' 4J4, \1.43 '444 •'4'4 1*
- '.1:- - -.------- •.1.'4.1'_
1. 1 ' 1-"'
I' 4' '4" v
4 3- 4 .. .4 -
' . 4' 4h4
-' -
- -'I'
4. . -'. r t- '.'
- Y .2 -' -- -' - '- r -
5.4 " ".' 4 1 3- 1 '1., - - '3
,'1,.'..,',_•'-'4)I',,._ 4_."••.,.--.,-,•-.'.4 ' 4 "".4 4
44 .,.., -4.'-' -4
.4
I.4
4. ,c. \ .4
: ' ';:'
- -'.'-"4. 4'4'f 43.4.4
4 44, 114'.. ,
1',
'4 4,3 -'4; .? 4.1114k, $4' -/4. ." .4 * I1'. "."3"$"r 4$ I
4
'A' '3,1'.,> ' .4• 1 •
4.4 4'.
-.
"44 p4' .. .' , , 4' .4 1 k-'- "- , 1./'. A
4
1 M.
J
.4.44
?
1
•, .4.'. 4
1 . '--' _
-4'
4
.4,
'-
4
.444.'31
1 •'f'.,I •". 3- ,. - •'
'- ':
!4-'3.';1--1t '. .4.4 4'3-4
'
.•- 4
,,4
1•44,
.4 .4 ,,-
.4 4 .4 -. 1 .4
-"'44,•,1 A .411
.4 _> 4
•_4, •,1
" ' ,.
.. -fl-I I 4
I.' "A-
I(4-' t1 1.
4, ( ¼t,4.4 ,, 11 I
4.- ,,r''4- ' 4.4("' ..'.4.'.
I4' .4
I
11-,
'4
', '344 1
4'
1
I
1. '4- 14
44 44".4'4.
'3,I'9
"
I .4
'-4 .44. -
-:
44
-.--;- '': '-- -
• '.-' •
•- :- --- ••;.:::'. ----: ' •i'
I ' 4
4
1-'3
4,4,
1M'
4 44
' 43, 1.4,
-y.441.
3- 1

GENERAL APPENDIX
Table PageI
NOTES TO THE STUDY
AS
2.
1.1 Measurements
12 Significance Levels
1.3 Chi-square Goodness-of-Fit Test
1.4 Nominal Values
DATA COLLECTION AND ANALYSIS
2.1 Data Collection
2.1.1 Master Sheet
2.1.2 Support Schedule
2.1.3 Sample Selection
2.2 Data Analysis
2.2.1 Classification by Industiy
2.2.2 Classification by Geographical
Cultural Realm
2.2.3 Classification by Ouster of Cultural
Realm
2.3 Extracts from Company Annual Reports
2.3.1 H.J. Heinz Company:
Management's Discussion and Analysis
2.3.2 Al Gosaibi Group:
Notes to the Balance Sheet on Structureand Ownership
A5
AS
A6
A7
.8 A9
9 A13
10 A14
11 A23
12 A29
13 A30
A31
A32
Al

2.3.3 Hanson plc:
Accounting Policies and Accounting
Convention on Historical Cost
A342.3.4 ECC plc:
Notes to the Balance Sheet on UK and
US GAAP as relates to Historical Cost
A362.3.5 UCB Ltd.:
Balance Sheet Other Investments Section A39
3. COMPARATIVE ANALYSIS
3.1 U.S. Multinationals (Growth)
3.2 U.S. Multinationals (Debt)
3.3 Company Ranking (Global, Multinational,
Internationally Active)
3.4 Development and Ranking (Corporate)
3.5 PLC Mix Effect vs. M&As
3.6 PLC Diversification Effects vs. M&As
14 A4t3
15 A42
16 A44
17 A48
18 A49
19 A52
4. DATA LOCATION
Primary and Secondary Data Soumes 20 A54
5. SAMPLE QUESTIONNAIRES
5.1 Al Gosaibi Group:
Respondent Questionnaire
5.2 Digital Equipment Corporation:Respondent Questionnaire
A2
21 A55
22 A61

28 A83
29 A83
30 A83
31 A84
32 A85
33 A85
34 A85
35 A85
6. CHI-SQUARE DISTRIBUTION 23 A74
Note to Chi-Square Distribution A76
7 SUMMARY TABLES
7.1 debt-to-equity Distribution Histogram
7.2 Growth Distribution Histogram
7.3 R&D Distribution Histogram
7.4 Geographical Dassifications
7.4.1 Consolidated
7.4.2 Sorted by Growth
7.4.3 Sorted by R&D
7.4.4 Sorted by debt-to-equity
7.5 Cultural Classifications
7.5.1 Consolidated
7.5.2 Sorted by Growth
7.5.3 Sorted by R&D
7.5.4 Sorted by debt-to-equity
7.6 Descending debt-to-equity by Respondent
25 Afl
26 A79
27 A81
36 A86
A3

8. DETAIL APPENDICES
8.1 Heinz
8.2 M&S
8.3 Heinz
8.4 Platignurn
8.5 Flatignum
8.6 DEC
8.7Avon
8.8 P&G
8.9 Coke
Reference Financial Pageto B/S Statement____ P&L
A
A88
B
A89
C
A90
D
A91
E
A92
F
A93
G
A94
H
A95
I
A96
A4

I NOTES TO THE STUDY
1.1 Measurements
In this study, the principal measurement has been that applied to the
financial-economic composition of the firm as expressed in its debt ratio under
total leverage. In this context, the debt-to-equity and R&D are defined as
determinants controllable at the level of the firm, i e. the two variables that
can limit expansion and growth.These therefore are said to be model-interior,
also in terms of effective management influence on the functionality of the firm.
Growth is seen rather more as model-exterior in character. Many more external
factors than internal ones appear to influence growth. Thus, growth is
considered to be primarily of a macro-economic nature, i.e. rather than micro-
economic at the firm-specific level.
12 Significance Levels
Because the observed results might differ from the hypothesis but were based
on a sample, tests of significance were needed. The significance level was set at
0.05. By using this test of significance, this gave the probability that any
difference between the sample value and the hypothesised value would only
be due to a sampling error. The hypothesised value is referred to as the null
hypothesis. Where the test showed the difference to be highly improbable,the sample value was found to be statistically significant, i.e. the difference
probably being real in case of the differences in debt ratios between cultural
realms at the level of 0.025 and greater.
The extract of a Norma] distribution as set out below indicates the probability
of the sample value being different from the population mean. The significance
levels listed are the ones used in the examination. They are also referred to in
the comparative analysis. As indicated above, the decision rule was set at the
0.05 significance level.
A5

exhibit: Significance Levels Used
Distance from p. Significance Probability of Level of(S/'Vn is the Level sample mean Confidenceestimated outside statedstandard error) limit
-.-21)S/Vn 0.05 5% 95%
+ 2.24 S/n 0.025 2.5 % 97.5%
+2.65S/In 0.01 1% 99%
+335 S/Nfl 0.001 0.1 % 99.9 %
+3.9 S1n 0.0001 0.01 % 99.99 %
Level of significance = 100 - level of confidence
1.3 Chi-square Goodness-of-Fit Test
The chi-square goodness-of-fit test was used to measure how well the observed
data fitted with what would be expected under specified conditions, here the
theoretical frequency as the expected frequency in relation to the observed
frequency. The following null and alternative hypotheses were established:
Ho: the levels of debt-to-equity, R&D and growth in the sample constitute anormal distribution.
HI: the levels of debt-to-equity, R&D and growth in the sample do notconstitute a normal distribution.
A6
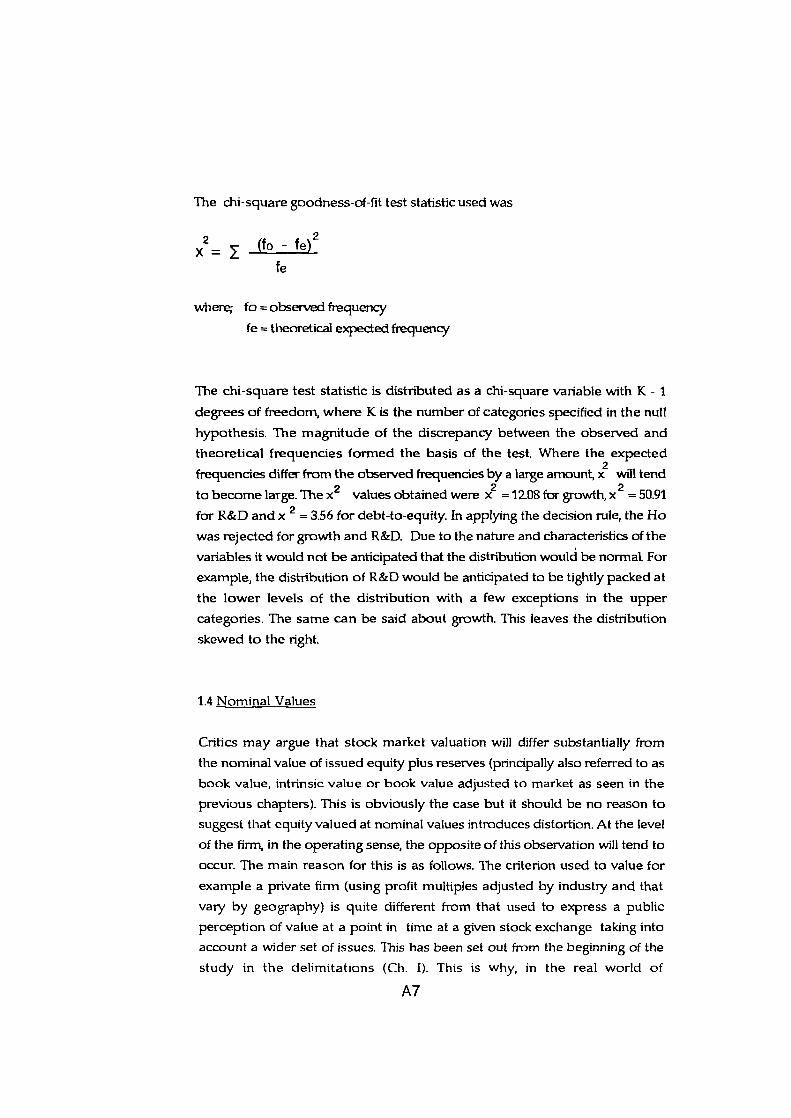
The chi-square goodness-of-lit test statistic used was
2x= (fo -fe)2
fe
where fo = observed frequency
fe = theoretical expected frequency
The chi-square test statistic is distributed as a chi-square variable with K - I
degrees of freedom, where K is the number of categories specified in the null
hypothesis. The magnitude of the discrepancy between the observed and
theoretical frequencies formed the basis of the test. Where the expected
frequencies differ from the observed frequencies by a large amount x2 will tend2 . 2 2to become large. The x values obtained were x = 12.08 for growth, x = 50.91
for R&D and x 2 = 3.56 for debt-to-equity. In applying the decision rule, the Ho
was rejected for growth and R&D. Due to the nature and characteristics of the
variables it would not be anticipated that the distribution would be normat For
example, the distribution of R&D would be anticipated to be tightly packed at
the lower levels of the distribution with a few exceptions in the upper
categories. The same can be said about growth. This leaves the distribution
skewed to the right.
1.4 Nominal Values
Critics may argue that stock market valuation will differ substantially from
the nominal value of issued equity plus reserves (principally also referred to as
book value, intrinsic value or book value adjusted to market as seen in the
previous chapters). This is obviously the case but it should be no reason to
suggest that equity valued at nominal values introduces distortion. At the level
of the firm, in the operating sense, the opposite of this observation Will tend to
occur. The main reason for this is as follows. The criterion used to value for
example a private firm (using profit multiples adjusted by indusby and that
vary by geography) is quite different from that used to express a public
perception of value at a point in time at a given stock exchange taking intoaccount a wider set of issues. This has been set out from the beginning of the
study in the delimitations (Ch. 1). This is why, in the real world of
A7

multinationals, the Chief Executive Officer will not always agree with
security analysts as to the value of his firm. Put differently, the performance
value at the level of the firm and public perception do not always agree.
Where there could be agreement, although this is not exactly within the scope
of this study, is that is that Price/ Earnings indicators on debt-to-equity, as
expressed through quoted listings, generally perform better than e.g. yields on
medium term treasuty bonds. However, this is relative to the risk involved and
differs from region to region. For example:
(a) during the period 1984-89, Price/ Earnings in the UK ranged 13.5 - 12.8. In
the US this was 112 - 14.2.
(b) whereas yields on bonds held around the same level in the UK, i.e. 10.25, in
the US these decreased from 11.79 to 7.9 and have not recovered since. In
comparison to (a), to date, Price/Earnings in the UK have soared to 16.3, and
17.3 in the US.
(c) as to dividends, these have seen remarkably little change in the UK, i.e
from 4.4 in 1984 to 3.7 in 1994, but in the US decreased from 4.7 to 0.7 for the same
period.
Source: Bank Mees Pierson
Within the scope and from the perspective of this study, the observations made
in the study point towards significance of cultural influences on multinational
capital structure.
A8


4-J
0I-i
0
C.) .
a)
"-4C.)
-'-4I-c
"404
C0zu
-'-4
C)
000.
J-'0-'-4
0. IJ
Qo0c
C)4-i I-t0
'4-'woE014
1-I
-4
r.rCC(D (DC OcC(DCC O(DC(Dua\Lr, o
oLr '-40 c'1rC(D00C OuOr-Qc-OC ( II ' .-4 O C'4 ,-4 C') t'l C') C- C1 -4 C') .-4 -4 .-(
1
o 0 a c C 0 r ¼0 en O ) 0 C C C lfl (DCCC r- C
CLILr omouo.oud-4 - - .-4 .-4 ,-4 C') C1 '-4 en
- C C C C C - en C. CC 0' C C C C C C C 0 C C C tfl C
000 r-CLrCr--r-- Cr--lr If i N- en C II - - C') 'O C '-0 - N- .0 en c'4 0
-
U) CC0
CC 0 0 00 4-i •i-i •0CC0 )-CC 0
-'-4 -0< U) .u,CCC)Q) -,- 0• cC • ,-4 • .-4 • . ,4 cc cC • • •
0CC 0.U)X4141i14• . -CC -CC • • a)I-iO 14EC) • 0.
0001'.
0. cC I0
• 0 Q)OQ
. 14 •.-4 0.-I •-'-4
- 1-iOWa)1-i I-Ill)
E -)Z4- 0 Ci-CC 0 0
0. .-4 - 1- s U CC • J 9-i • 04-4 '0
o -' -40UECC 1-i0C CCCCOi-' p-
.c CC CC '-4 -.4 E-' C) 0) 1-i 14 C/)C) • 1.) 0. ,-4 CC 0 0 0) 0 0) 4)
Er40 I CC9- 4)4) •CC,..) C)cj CC
•-4 0 Z l '-4 0 00 E E '0 4) 0 -4 0 CC) E •0
C -'-40.0. • 144)C)U)0.--4 0)0) i-14s IJO.0Z 'i-i E 0 '0 '0 N CC . C '0 • 4) 4)'0 a) a) U) Cl) U)
• >> • -40 1')C .04-J CC 1414 • C/) C C 000.0)'0'0a) 0 o a) U) 0. 4) U) r-4 C I C) -i < • i-i -4 -.4 0 0) 0. 0 0 4)4) ZU)C •4 CCCCI.i '-I U< I4CC.I
C)CcC.0 C-,-41-.iCCCCU) 0-'-4 0000CC'0C CCOC)14 Ci ,-.4 0) C0) Cia) 4) ,-4 144. CC CC CC0 CC 1414 CC CCC)-4CC--4EC1-1
4-i cc CC'-4 • E CC CCC) CC 0 (Ca)1' 41'40O
-4CC r-4 14-.-4 CC 4)i-I 4 .0 .O N- 0' 0 .-4 C-1 en - If) O F- 0 ,-4 c') en'-414E
4.-I (A
a) C -.rJ
0 01
1.J-4J
'-4 0(Nj0. ' ClE I-' -I
-•:< << ..CC C)
Cl) 0. 01
AlO

4-i
0
Li
0.
Q
-4
0.
o1-I
co
-'-4
0)
00.U)
-'-4'.' J
0. JEU)o .-40
0)'4_4 1-40
'4-10)0E
I.114
fr..cJ
0Qc0OOc0.r-iN. L, aD N. 0 N- .-4 O\ c-.J N. 0 C .1 C' D CD 'O .-i cn a u b C' N.CI '-4 ,-4 c c'4 .-4 .-4 c.J -4 -4 Cl C'1 ,-4 ,- 0 .-4
S.-
CDCD0o00000000O0000O0
u is-, a' ,- a ,r, c .- o c-. 0 u - 0 c c-i - CD 0 'f'-4 4 - N. .-4 ,-4 C-I .-4 0 -4
C'00000CD000000.-40
C\00000Q0u4r-.oui0s.0 ui '.0 ui N. '.0 - c-i - CD 'Ii - c-i N- C'.4 '.0 '.0 ç-.I ui
'-4
I-i
U) CO
-4 cC CO4-' 0) -C 0 • 1-i 1-I
cC-4 CcC CJCL <CC C<10 I-u CO CC .4 cO • C) CC 0. • • • cC • • • ,-4 '-, . -4 -4 4c 0.0..0 0. 0) C C. 1-iCO0)COcCcC>-c0 .4CCOO •0 -0) .•CC0)0)CC'sC
CC.)
r-4 C'-I
0 4.40r4 - •
• 0 .0 . c • aC 1- -4 C.0 - 4.4 . U) U) U) .,-4o - CC -1 0 ,- 4.4 O r-4
CC 1'- • ,-) '-14_i U) I-u 0 0 U) 1 ,-4 .,4(04-' 0 ,.. 0) CC U)Z-'1-4 C 0. Z -4 C 0 0) 0) u-C C.) 40C)I., • .oai cj ,a)oC-0.E4-'o Cc <OE,a 0.WI-u-r4oC
0- .-CCC 4-u 0.1--u J00U) < 0I40CWI4(01_iU000) •-,4 • C) .0 (0-4cjC)1-iE0C
>0_Co >W)0)0o-uCC.) U)0 0-CO CO 0)0 Ci.1 0-u-C
I-4 -u-I UC4XU)C)C C0) CC .0 -.-4 u-) 0 4 4 00 0 I-i > ,-4 CC I C) C.0.CU)0 OWN-iu-44J-4W1-10EU)'-4 0)-u-C_C
c00U)U)c0 4i.J0)UcC.iC)_C.-4ECOCC_C.000Iu.0 E'-i i-i acJ0 I-u CCC COO E (I) U)4.-I 0 CC CO CCC G)-r4u-4,-4 Cz) 0(0 0).-4.4 1- C) 0) 0),4 000(0 CC.C.0,-IZZZZZZZZCI)C/)Cfl
'-4
'-4 0 C)
•.-41-E
0) 0 -i-IE C' 01
'-4 0C-
< -4: -4: .4:-4:< <-4:
CC Ci -IC/) 0.
All

0
OJCD
CCJ .
0..
C
'-4Ca0.
C.)
'-4
0.
4-1o
1-i
Z C)
-4
4J
a)
00.U,
-'-4
Ca0.
Ecno •.-i
0)4-4 10
'4-40)0
04-1
fr4ci
0OCC0CC0C\00CCr- Ccc Q iP' C cc uO 0
,-4.-4c-_ -4C'
000000 0• 0 0 C• 0 00• 0
00Cr-C' '-4 -Z7 .-4 4 C - C .1 .-4 -
0C00CC00C00QLfl
C4 OO'.0CN V7C4 C
0 CaCa
0) . 4 -4 Ca Ca • • - 01-i.-4C/) CaCaO
• • •4.0OJ-4 Z -I 0.. 4-4 4-1 4-4 Z
1-I-)
U)00
4.)). 4_J•
0 0U) CO Ca
COO) 0. 0. •,-4• • • E EU cfl..-.4r4 $-1 0 o) 4-1.O1 4-J1144 U OP.. 00
q3 _)I_Ii -.O •c:-,-4
I U3a7a) 0) .0)00 0)0)0) .0OI.1 .00O
'_•) 4-4 1.) ,-4 4.4 0 i ci 0)
Ca- CO i)--4 E )-.1-..04-4 •.44.i-.-4 Ca •0a)
• 0) U4icOO. •0W0cW,-Ii.j •
CO cO E-1 C)) 0) ,-4 CI) IP. Cl) cO,)cOc,-4
.0 '-4 • 1-4 l
OtO O)COWWOCa0 CflO.-40)>O>>4 4.) + • + COO O).0 Ca 0)0) 0)
-4
Ca -4 4-iCa a)
'-41-i Err-o0
a) 0 - IE 0' 01,-4 0 -I
a) '-'I.-4 0 CNI
E I-iCa a) .-4(1)0.
Al2

0)
0)
UCo
4-i
0
Co
i-i0)0)
Co'-4 CO
o0j
i-i0)0)
0
ZC.)
-4
0)
-'-4C)
'-41-i
0-
'4-4 >-01-i4-I
0)0EC-)
c)
C\ .-I b IJ - C C%J C-) C'4 C'4 .-4 .-1 -4 ,-4 -4 .-4 -4 -4 '-4 .-4 '-I .-4 -4 - '-4 4 I 4 0.-4 0 0 0 0 0 0 0 0 0 0 0 0 0 0 0 0 0 0 0 0 0 0 0 0 0 00 0 0 0 0 a
0)--4.0
0) 0) CO 0)4-i
CC CC CO -,-4-,-4 <
0) 4-4 i-i 0 0) CO 0) 4 CO 4-4 0-0)0)u0)CO0)0)'.-40) 0)440)-4lJ0) 0)0)4I0)
• •0)0) 4-i0)00),-4W0)--4CO 0- 0) 1-i 4-i .0 .0 CC w4 4-i Co 0- >- 0) (0 4-i (0 4-i ,-4 (0 --1
• • CC0)Ii C00ZZZZCocoE-4
- c-4 c - v. o ai CI -• I1 r— a 0.4 c..i r - %1 r- .--4 .- - .-1 .-1 .-4 4 .-4 .-4 .-1 C4 Cl C 'l ('4 ('4 C' ('1 ('J ('1 C"
o) 0 C-')E 0' 01- C-' — I
- 0c-'1I0- -4 CIE 4-i —I
0) -4Co 0-
A13

0
Cu0
Cu4-J
Cuci
ci4-1
U,Cl,
'-4C-,
0
1-I
ci
w'-4
C,,
-4
C,,
Cu'
4Ici
-4'-400
Cu
-4Cu-4
'-S.-1 Ci)
5-
"-4 Cu0
(1-4 Cl,
0C)
C)
(ui-iCuci
Cu
-4 ii
Cu-4
i-i
CC)
Cu00.Cl,'1)010
-'-4
Cu0. i-o -4
'1)4_I I-i0
4-4'1)0ECu
I-i-4 0
C',
Cu0
.-4
ci
'-4
-40.
C
'-S
OQCTIr -4 -4 .-1 ri
5--,
o:ic'c0'
C'J-I
0000 c%0o
Cl)
'1) '-4 Cu Cu
0 Cu CO-4, •0.- .0 cu (I) C)
'-4 = Cu .0 0 Cu
Cu 0 U •-Cu 4 •
Ci .-4 0 Cu E-' C)WC) Cu 0
Cu i-i .0 E Cu4-a (I .0 .0 E 'o .' -4 Cu Cd ,-4
C0
-'-4
i-i
Cu4_I
00.
:'- i•
CuCC 0Cu>s0. CuCu
sECO E0.
>Cu 0 E0. CuCu0O
• E i.J E-IC-)0000. '1)o o Cl E I .-4
E0 .0C)0) 0.0 • E C1-J,-4-4 UCu0)C.) 0 N C 0 -'-4
•0 z-40CC '1)0 i-iI-a C.) .-4 Cu Cl.i ,-.4
OCu 1.10CC
04.1 •I.41J
C •'-')C)cI
0C)CiO iOJ
• C
C 0' LE'I 0 0 ini 00' 0
e ,4 ,-4 (_4 U -4 (54 -4
ci C' - (51 c'l 0) 00' N- 0
0-90)LtiC'4Lt0s0
(54 -
0D0r-4'.00QOOOUl
N' 0 (51 0) - 0' 0 (51 (54 N- -
-4
0
CCu
0-4 -'-4
'-4 4-aN-, Cd1JCu 0 C
.0CuCu ,-4.0 CuDQ E.0 Cu-'-4 • '1)
Cu .0Cu
'l-4.0 Cu Cu.0 Cu I Cd'- ICC'0r4 E Cu'-4-I Ct3,-4,--4
U0' C Z
CO ClOClZ.-4 4-I I.iCCu Cu.-4'1) -'-lCuWa)E >C CuE (U 0).004.1 B(l) B Cu.0.C.-4 Ca Cu.0
0-i
0)C)
"-4I-Ii-iU,
000 ii .
Cu 0
-4 -0 0
Cui.J 0Cu 0)
CuCJ0 •-4c) Ci(I) 0.i•-4 r4 .-I 0.. r4 4CiEOI.10 0 E '-S4 0 4-i Cu40 Q.',W 4-
;-I0 J 4.I4 0 C).0 (1)
U)1.1 U 0 0.. I.i.'-IOC)
C)
0)0)0.. 0.0. 4.1.0 (-)•4i 0)UCae-4P..0
Cu
0.0Ooa)X<Cd I-I -'-4
Cu 0 0)0 4-a '1) r4 0 1.1
4-4 O0CuI.00)
Cu• '" 0Cu4-aC)4-ICu
0
0)C)40-,-4Cu0.Cci 05--
1-1
(uC)
-4 C-1 ("I IP( C N-
0 C Ccci C) C CC -4 ,-4 -4 ,-4 -4 ,-4 -4 -4 -4
0
A14

-4CO
4-I
4_i
o-.,-4 Cl)
U) •.-4 -0E
CO -
0
(J,-00(0G)1-4 Cl) .0 Cl) C) Cl) I-iOs-i Cl) .-4 s-i U) CJ .
a)
s-i W(0a)a)
(0 E . 0 =•DU 4 00.
(04-i
0 0 4 C0 4 04-)
(0
a,(0 .-4U)-4 41
4 t4_.1 C) C-4
0 -4 E -4 0. s-i0 (0 CO - .0
C.)0
o (000-4 -
I-iO i-i
(0Cj .. 0000G)0C.) W0.s-i
i_i a)Cl) Q-i 0 0 C) E
41 ,-4cJCO-0 E -.0000 aSo
00) 004CO 1-4
a) 4) .,..4 a) E 0) 44- .-4 i.i i .0 i-I a)44 .0 c 1-3 ,-4 >(0 0 -4 ai 0 0 (0
4-i
a)0
00.
a)C-i
i_J
0.
o -4o iC
a)'4-4 s-i0
(4-iWOEC0(-
'I-4
r4U
CD Or-a
N-.0Ocn
0
0
CDIn
'-4'-4
CO•0a,
-'-4
•0a)
Cl)a)
-'4444-)C
00
0'-400C
Cl)
•01.4
CC
(00)E
00. 1.J
(0a,
C-)0 -'-4
I-I '-4
0
a)(0
0
• I-I I-I(0 0)
• •0 .1-I
CI) Cl) 13
s-i• '-4 CO
-0
a)a)CO(01.JC
'0 0)('1 (1
s-ia)0.
'3
0
IPi ( C-4 r tr O .-4C-i
O .-4 CD a - c a
CO41
C_I . • CDOO(I 3 CD u - 4 -4
a)
r- Lr) Q 4 0CUI-
1-4 44(04)
. r1rUC- E .-4 cs c'i c' C'l C'J C'J
C/)
0 5-.5-4 C)4) 4.1.0 Cl)1.4 CO
00C/) 5-i .-4
0.0 0-I1.J CC
0-IC C-i-I-I -1 0
(0fl . 4 4)Co a)i.i
._4 Cl)'i E(04)0s-i Es-ia) (0 14.1
0. Cl)
o Es-i .-4
Cl)a)(0Cl) ' 4)
• 4 C/)(I) a)
-4 ._4.0 00 s-i
04-iCl) -4 04-4-0 D-1-4 C-i 0
0 011-4 Ci0(10
(0 -I1-3 00a, -0 0o a)E-4
'1-4-0Cl) -.-I'3Cl)C4Cia,
-0 .-4 (00(10o 41(is-i s-i
a)U)
•0 4a)s-i •0 .0a) O1-4.4(0 5.4Cl) 0'-4 EZ00.-S
5.4 41.044i.I
.0U)(0 0
•1-4 (01-i1.34)•1-4 C -05-1(04)
s-I •0- 4.5 o
4-I (0o --4
zC 0.o -o
0 01_i a) CO 44
044 001(00
E C01J a)-4Cl) a) 0.ra
I 0 -0-'-(.0 C-i (1) (1)-0 0 -4 •-I
A15

00 -4-4
(--4-
r-cn
-1
a)OE
CO
0)0)FI-aC)
1.JE-I
0---'-4(00
,-4 0•0 -.--a) (3-4000'4-4 . 4 C)-'-I 0-'(3 a) (4-a
CO Cl)
-40 (1)
CO
-4I-a 'a C)
J 1-4 1.1
4-3 COC) W.0.0.0 4-3
4-,
a) I-i
14 (4.4 3)tO O'a
0
a).0 -4 -CO 1-1 3)3)4.10)
1403)COO 1.4
CO
U)a)
W.0 a)
,.41.J -0 0CO 14.00.a) CO
o 00)
C)CO
0 00)
CCI-4 I-a. COW
•.0a).01-1(0140
a) '-40E'-4 CO
4-i I-i I-i -40) Cl) CO
1-I1
-I a) -4 14a)
-E-4 C) a)
0CO0.
CO
'aC
1-i CO0Ci a)E
a)1.1 -'-4(1) I-I
4-i
"-i
C
-aCO
0C-)
1.4a)
C) C)4.1 --4 -_444.1 al_I 4-4
CO '-4
C) C.)0)
CCI CO
a)
4 p4
00
C
CO
COCO CO
4-iC
(3(00)
a)C-)I-ia)
0..
014
OJL
4-J
C) .0
a)
-4Ca
'-441 -
'-4 (1)
-'-400)
014a)
a)
Ca- ._1
-
-'-4
00.U)
140-'-4
0. 1.1
EU)o •.-4OOi
a)(1-4 14
C)0 -'-4
14-1wo -'-4E
C-)CO
0141.1
'-4U)
cC uOQOill-4 -4
C 9io-,2.c'J c_ C'1 r-J c-i 0 C
-4 ,-4 -4
C 0000 all
C CCtllr-. 0'Ill c-- all 0 r '0 r-4
-400 .0oa) .l (I)
CO-'-4
0-4 a)-4 a;I-i .00) F< oOWEX
01 CaC•,-4 (0014.0014<
01.1a)U)
J- .c - U)U) 3)a) - --4
> 004 -CO 0
-.4CO0.0. CO0.
'-400 FOEOO 0(03) 0
.0 a)%i.4I-a
(0(0 a)14 0. .0
COCJCOCO •0F 0 -Z O•4-3(00 110 000.-41 a) -43)
•PX4 -sa) CO a)
I-a 01-a0CO 00-4 31
00 0. I-a N . 00•c0 03)1400
i-i 3) 0 G) CO 0
09 90 ill
- N- r- - N-al1CJ4 .-1j
'-I-
00 N- N- - 0\cfl0000 allr
.0a)
'-40(0
0 O.Z.0 0CO 3) CCI 3) 'a
'-4 EX NCOCn
(0 a) --4 4-3-a Cl) ,-4 I-I
CO W(0
0)000 00
tO 0) -4(0 0 : CO .
000 r404.1
COOI-aOI.0.0140
- .00 •o--4 0)0
r40'-1 I-i.0 3).0 '-I 0.-I
01 U,QOW(0! CO0)0) i*0J(0 --4 CO'-z a)
-, XXZZ3.a
-4 I-aCOG)
0140
(1)0
,- O0-4
('1 C1 c-1 en en
A16

a)::-
'-4 0).-4 14Ca0(a
Eoa.a) Oi.4
- 1-i
1 • (', (C'
cci
'C CC'(a '4(a 0 .-4 0
44 caC (a-.1• 'C 0
0) --4 1-1
-'-4 '4 0)0 '-4 Ca 1-iZ 0) (a Ca0.14 '-4EEG)0) 0 i-i 'CJQ(aa)
' .4 5-4'C-4 'C
'1-4 4) 0) CC'
oO)C'41.4 (a
.0 ua)1.40) a)
-.00 0)14 -. (a a,00- 0 (a
-(a.000 0) 0) 'C.44.J N (a (a.0 --4 .4 Ca Ca
C') 1-ii-ic))
-4 0 a) 0).4-4Ca.0 0.-I CC'
0-I
(a5.i 1.40
00 0) 0) 145.0 cci 11.4
4-4 a)OiJE(a_(a(a a)0)J 0,-lwE 44(a.41.40CC' (a(aU) 44 C)) -4 c
U)E000.a) 0) -4 E
'C -i 14 0<C 0 C)
04-i
a)E(a
.0 CC'<U,
Ca
0)0) 4-1
CC'S-i
•'C'C 1
-4
a)(a0)0-I--I
0)5.4
4-ia)
5-4.4E0)0(a0 .4xc,)
CC''-I
0)(a
(a4)
p-I
(a(a.4
(a4-4
a).04.3
11-4
0
0)
-'-4
1-i
44
C
0
0
'(a
4-i
0
QQ0uC-:r• CCC N-1-4 C 3 C u' Q I- 'fl C
,-4 ¼0 c'- - r-.) c-'J C -.4 .-4 c'J
Ca) '-Icflc.'l C.')
Ca4-i
(a
C 4d 0 9 . 0 00 0
009 I-
C) O m cj ci C c in in C-.4 ,-4 ,-1 - -4 -4
C)
00 00 00 0 000
CCC
C - -; ui 0 -; C '.0 0 '.0 N.
00 0N. -3• '.0 N. r- r- '.0 '.0 in '11
N. N. N.
(a.41-i #-,.4 a,
(a '-r4(a
0'4-1 0)
014a)
a)ECail
Ca4-i
(a-'-4
1-i
(aa)
(a00.a,
s-I 0-'-I(aCa(as-i0.4-i
0-Ioc
0) C',
(I-I 11
(a0 -'-4
(4-4
C
0)0 a)E(a::'-
(as-i (a
'4 (a
'-4
(a-4
-4 .ICaC)-I .0
11-(a
0 Cn
. a) a)ca i-i .(a.0N .0 Ca 00000
14
'C (a Ca 4 .4(a a) .4 (a a) 1 -a: Cl)
a''-, a> (a'-lE .0 •
(a 'C 0 .0 C/) a:-, CO'-)Xa) CO
E N Ca Ca(a CO N Ca E.0 (aca cC' (a CC' .4 (a - (0 5-4
(a (a 14.0 i-i E ca.0. 14
(a .4 0 CC' .0 0 '-4 EXoZ<
•C'4
0)-(a
1.4 0)- -'-4
1-i .0
E 0),-4 (a1-4 0 • -
a,o 'C'C'C.-1 0.4(a_-I
,-4 '1-4 _) - - Z i-'C.4 0 -4
5-4 0. @Ja)QJ0(a1-I '4'-44.liJO-r,
0) (a 0 'C cC' Ca 1.4 0 40)0014 s.4'4.4 0 .0.0 0 0 C) C.) 0 11 (a0cI) r-I0a)0 -,-IcO
ca p.) a,E-4 a, -a:U) 0)0)
w-.-4.4 (a- •< W.0.0-'-40) N. .00000-40)14(a- U)Ca(a
0) CC' + • + .(a-I.4<= ') - U) U) U) U) U) U)
a.' C C - 4 C'J rfl in '0r - (1 r - -)• - -a- - :-
A17

000009900Dc-190tr,u00
-.1
9 99901 0c'J0u'.-1
-. l'i %O c-I '.0 r '-0 '.0 '-0 '.0
('I
If'
'-4
4-i
a)
00.Cl)
-'-4
0. i.i
o -iU bC
U'4- $40
4-i11.4
0)
E
a)i-I
-4-'.4
z
Ca
Ca4-.iO) .-4.-4(4 CI) N 4) 4)
z - o 0-'-I
'-4 4 (4(44)0)o I-a N >-. i..
>.i U) -.4 4) 4)E
• C) .r4
Cl)
a)--I
Cfl .-4 U)•.0 •Cl)CI)<0<..
OQ,(4 CCI Cl)
(4 (4(4Il-I 4-4 i.1
0
CI)4)
'-44-44-i
0C.)
4-44)4-i0)'4
CU
I-I(aa)z
CCI
1.JCl,(CI
CU
U-4•0.
z
4-i03(4
I-I(4a)z
4-I
0
C.)4)
(I
4)
cc,Cccc,00C 00000-ho
0 aD0C- .- c' c'J r .-i c-J
000000
C iI0.00O\,-4_ ,-4_4 c) - 0 -4 0
-0900 c-I-000r-I It;en en - r- -
r--h ('.1 c - ('4
'-I4-I .-.s
4 Cl,
0'4-1 Cfl0
a)a)Ecu-I
CJ
.-4 1-i-.4
-4Ca
0.-I E 0
-.-4 4i.c4-,.4a) ,.4
4-i N'4 Cfl Ca 000
1x.. .-4 . (4 -.-I C4,-4 ,-4 -.-, -'.4<(/ 4 4-I(4 N c4N-'.l
< I (4.-I C4 .-4 i a •ZN-4 Ca. E I (I) -41i.4 0(4
E-4 < c4.-4(4 <(4• <
• C4•-4 Ci ZCar-I_-h (4 4-i .-4 E 4-i E
c4r4C0Wc4a)U (4(4(44)-,-4(4
oEou)-.-,E (l)r-IE.• CaCa4ECa Ca-4oO<<.4Q<<I ZZCI-i<
(4 I0
o •i .-4 Ca0.
0. 4.14.IQ) 0Cl, 0CJ '-4 0
• 0 4 . 0
0<4-4 .4-114.1.00
Cn • C.) .0 1I.1 (4 Cl)
C/) (4<O4.1' E 4i
0. ,-1c4 Cl)I.l).i •0 -4C4Car-4
0 • U< • 4)41(44-I o.cj 00EEU .U]C.)Ci • 4JCa(4I Ci1O<4J'.I
'.NC/. •.r.4Cl)WI.i 4j4i.j (4I'e-i cuwoiaJ ..r44-1U3
. 04-iCa.OI400.C/3O
.40(4O UE-4,-4-4 0
C0
0(4'.I 0EI4i.1i.'II.i4• CJr-4. 4-4(4(4(40) (4
I I I.0ECaEE0)CaCl) (4(4 (4.4 41..-I a) OJ.
,-1 )-1
0 C .-4 c en it O r. 0" C) .-4 c--h en. u iI ir ,r ir in in ini In 0 -0 '.0 '.0
'.0 '.0 '-0 '.0 '.0
A18

14 ,-4
_-I JCO
a) '-4C '-4Ca)00)
C/)
C)Cto0.0)
0)1i_i Cl)
(CC)00000)0)
'-4
c r-
N-3
0 .. ii- ir CD . C'. a a'. 0 r-. N-
14
c-1 C-' C'.l - c) .-i.a)
C)4-I
lf CD CD I/1 0 CD ill CD CD 0 "I
I',
C.) .0
ii tt • OD CD c1 IPI 0
'.014 .-s CD -1- CD N. -1
-4
a)0..
C.:.' 000N.o'.QQQ 9°k2 UI
V4 CD i/-i C•-1 N. OD 0 C) 0 '0 -
4'.OU
I'-)
CO'-4
•,-4 Cl)C'-4 C
011.4 Cl)
014C)
C)CCO 4.4
CC.)C)4.-iC
DOCx.. .j
C-4
1.4
CC)
C00.C))
140'-4
>s 4-I
C)CC)
0Ii
E )o 4000
a)
C
'4-1 14
C)0
C)
4.1
C
0)0
CCE
1414
Cli
a)
4-s
1-i-4 C
'-4
C)z
11(00),-I .0 0'. CD - C-4 0 ('. - If) '.0 r-.)- C '.0 r- r-. N- C'.i N. r- N. r-. N-
("C
0CC
Cl) CCCOO
C CO.CC
.,-4 C).-4 0-C114.1
(0 0 a C4 .0 -4 CC C)C C) U' C)
C) Ii C) . D N14 -4U) C CO CCCO.CC)O)00 -'-44-i
4J 0CI) CCZU)00
-4COCCC0 •,-1C)4-s (C .-4 C - 14 C
E CO 0 a) D -I - C)Cx.: Z ' Cx.. < 0 Q
4..1
C..) C.)
•.' 0)
• C OC.)IcO
E U) 11
CflO '.0 Cl)
0 COOC)oo - < 11 a) -4 (CCx0 •.414 00CC
0 Cl) < C) U C
CCCL. -i-1 0 Ca4 0)0) E$-I'-u)Cfl0W0(CN0) 0 E 14 .-1 C Z -4
ii-1U)0..00 Ii14)40 -0 c) • C)
0)'-4
C-40 W,
4--. 'a(1)1.1cC)-& O-iE
(C i.JU)OE0.
0)0CCC) .. N'4C0a),-I -4.C14144.) 0)1-1
C 1l-U)a) C)CO
..-4(J ,-.l-rl
.Ca) 0. 4-14.114 CEUI
C) - -'-40-4 0CCC.-4
a)Ci-) W.1414
•,-4C) • .0 0)C 4-i ,- 4.4
•a 0 (00)a) _,-4 a) s-i C)
• -4 -.4i C)) D E14.4 C) C) 4I
(0 14 a) ,-.4 _-4C) 0.1-I 1. D CO0) 0)• U U 1-1C)0.-4C •,-4a)
,-4 C.) C -'-4 00 4-1C) •.-I CC)a) i-' E 0 CC 14liO'al.J 0
-'-4 < 11 -CCCli -a 00)0)41) C. Ii 411 '4-4 .0 'a0) '.a)CC 'i-a
0-a-a C) (0C C)N C
C).0 -'-400)(CU) CC) (C.C-4a) i:
. 0 0) 0) 0o -. C - -4 a E
0. 144& -0) E
0 CC C) C) '4-4C C)-.0 U) :0 .. a)
- . -a, C)EC).04.) 0) ,-I - (C D CO E-
C 14 -1 U 00 E 00a) C) CC 0) D -4 DC 4 0.. 0 C 0 Cl)4-I 4-I li-.-4140)U' a) C -. CC C CO '-4
C.-,.0 U'-4 0) C00 U) 0 •.0 • CO< Z a) 0-. < U)
-
CCCC)CCC141-.a)1-i-'-4
-CC41)
a)
1-1
CCC
a)C..01-.
CLI
Cs-ia)
-C4-i
0C/)
(1-I0
(I,a)
-I144.)C
00
A19

0 0 c-J 0 C 0 0 ini C) 0 0
C •4 .-4 4 - -
0QOD00000Q0c
-r-'-4 .-4
4-i
0(-I
a)
(3i-I
cJ'-I
a)
0
'-I
N-.
Il-I
u-i
0
u-I
-4
',-144',-4 aa
a0014
a)a)
a
CO.-4 4_i
a
C.)
a-'-4
i-i
aa)
•0a0U'
140-4
>i.i
(0140. 1-iEu'o -.-4
(1-4 140
9_Ia)0
i-I
'-4:)
4C)
14cOO)
a):)a
0')
0)-414'Iaa00
a(0c_I
--4
I-i
'4-4
0)00(0
'.4a)
'Oa)
4_I
C,)
a
'a
0 0 r 0000 ii C)
0000 I L U 0
-4
-4 C-4 (0(0 ,-) :):)
O)'4-Ia) :):):):)
0(0014 '-.-4- .a c .i .i cCO -4 c a) Cl) c C a
CO
(n•Cn
a)a)a:)a)a) 1414a a a a a)
(0 . CO 03 .3 c ( ...
•0 •044
• .U) -a -a -1.4 44o ,-I_I
:) U, -4 IJOC.3 44
a•I.i aj-a 0U''a i.4_i E -4Ø(0U) iJ3 1.1)4
U)c .0) •
-a 0 ••Q) 0) a)ja
(0-4 4-I(0 -4 I4C.) :)(0.U) 4.444
•,-4 Q,-4(00(000014a)a)14
(i4 -.-4 J a) . 4 :) CO (0 44 a) a)
< ZXci,t
C'. 0 .-4 C"i - ini \3 N-
(0U)()CO.-4. (0
14.40 0')CO
g.. aa
, r4 00)14 Z'1-I
-1
- -'-4 C (0U) 41 CO
.-4.a.-4
oE C_) U
-.-4 .-1 14 :)
ca)> .a14 14 ,-4 0) 14a) •a4aC
0
0 CO a)
a -4 4-i-4 4.1 -r4 44 14.4CO -4 Cl) C 0)
:) 0-44-i c.) 0) Ci:) CO 0).3 a.a 1.' 1-i
(0 0)0
r-4 U 4-i .a (1-4a) -_4 :) 4-i a)
CO 14 .3 0 1414(4.4 a)
c
a . 14 ) '.44 (4.4 ,-4 >
CO CO
(0.0.
a)-4a-4 E.a -,-4 0) 0
(044 CUc.) -.-1 0) CO
0 a i-i •'-i.-4 00)CO(0
a0)a)i.I 0)0,.1 .,-4 (0 0) (0-4(0(4-414
03 03 0. Cl) 000 0) 0 -4 i. -0(0 (00)44
4-i -a ci (0 0')0-4 ".40 E0)0 U34.J 0
:) a-I c.oi j OCO1-JUU3($3 4-4 4-I i-I CO ,-4 -4
O) U314144.i"1 > - . a)'a 0)0:) 0.E 14
<N C CI) 0-
A20

zI cri I0 I 0
'.t Lfl '.0 I000 I
c'1(') I00 I
-0
5-4
(Uc U)'.D
o E0• .-4 s—S I'-4
aj wo
iX 14-j
'S..-4J(I)
(U
I'.) (U
01-i
(U 14
z c-.5.
C-,.-
(U
IJ IJC (n
(U (U
1-4 LzJ
1-i
(U iii4J .—i
.5-4 -o
(U .5-4
EE
4)1-4 U)
(U (U114
(U
I C)o
—I 1-
C E
C' C
C.)rp 0C'
-ci
C-
(U
(U1-i
rJ
5-'
0
5--s
o
—I
0
(U0
.5-4
in
5-4 5_4
1.4 (U
o a)314
CU0
(1 I0 I
(10 I
(1
0
In14
ma) I
(U (UI14
(flOI
00C'-) C-i
za)
—4
U.
E(U
(I)
0
CU0
('4
0
In
a).5-4
1-44-s
C
0
0
No
cr3 c)
-"5
z
a)
'-4U.
(U
u-i
0
(1
('I
If)
('4
4-1
05-4
(U (U
o
O -' E
14
C(fJ . .-4 (
A21

00
G ()
z
a)-4
a.
a(UU)
0
1.4
(1)a.
"-4 00a)Ex
(0 U)
zI'
a)-4
0 4-'0 U)
(UELi
0-4
0-4
(1)0
U)'-4
z
(U
C U) N(0 C
..-4 _-4
0 CC 1)
C(Ua 0(04-)
()-4
(U 4 0
..-4 (_)U) (U
a.
• a),-1
U)
cc0
U) U)
1-i --4 C
t44t4.4
0-4 >
tn nia
•-i-t, C(0 •-' :1a) >01-i -4 0
C >4U) •.-4 .0
cli
La0).c
0Ci-)
-0 2:(Al-)4-,
U)Ct '-4a) a) a.0)4-) a01(0 (U
(11
4-)1-.
4-)
C-0
- C0 >40' (n 1-.
-4
4-)C
z
C
00(0
04-)
U)N 4-)cc
C
01.4>4
(44 1.4
Ci-'4i j
COW
U) 0 E
a
4-' >40)U).Q ;
U) 0•Ol- (U(0 C
cli a)
NU) E-'-4 j (U(I) •-, (U
0a) (DC
4-4 0
a
a clii-'(01-' (U
W •'- a.•C U) 0H a.
A22

a)
0-4
a)C)
"-4'4.4-4
U)a)H0
U) >-4 )1U, 4-
0,
Ha) .0
•0 >
a)
0o -4
1-3
Ci Cia) .,4HHo 0)o 0)
Ca0) '-I4.3 C.Ia) 0)
.9o:0.0
HHC4-C'4
0-00H
0Q'1rH H
100Lnr-
I/-I I- r -
0
•01 •
"-40 U)H•: icip4 04:.0 04: <-'-4o i-a4i0) 4:E >)-4a) .00)C-) 0 4-3
C.) 4:> I
4.40)4-34-20)4.30)0)>4:>>a)ci 0) 0)
p4
4-3
00)0Ca
1-34:.0)0Ci .0
0)
-S
0
0) 0)1- NI1.3 -4I
0)1'+4 Io 0)1
HI
U)
0)Ici'
-'-4H
4: CI)
a).0
0 a,
C-,
ci(I
-'-401.1
'-4 1.-i4:>
0)o '-4
CI).r44.1 Ci
0)U)
Ci
0).,-4 0) 4:'.4-1 0) "-4
-H 0) a,
0) '.4(00)H0.0 -4
HH
ui 00 0 ir 0 0 0 - C OD
c'i c r- r- - r--. fl 0' r-. - 0 0'HHC.4HHHH HsH
Or . 90 0u1C0H
O 0 0 Lfl - u tt If) Hs1 H H H c'.1 c"i H C'4 H
If) C a c' 0 0 0 0 - 0 C4-1' 0 0' a r- c'.1 0 .4H r %0 .O --
'-4H
•0'3
0).4:
-00 H
0.0 H
4: 0 .00 4:4: • 00
0 4:-4 -4a)'O Ca
p.4 01-1 4:4:'Jt4p. -,4 o.l_:
iJIi •.-4a) cio0)04.iO. -,-4' a)
•'-4 )0)-4 .010)U) 4.p40.O 4:0 i.J IjC..) 0r-4.o U)0)0 040)o c. C.) • .0 > 0 Cl) U)o .0> ,4:O4.4:0L)
-4 4:..-I cJ C.).Ca 0).0'.-I13 0? - .0 H ci'-' CiHa)Q700a) QTCi'3
C)H1-'1J4:4:E Ci'4.l.4a) 0. ci -.-4 -4 4 '-4 0) H0 p4=
9 000ri Ira'U-r'.4 H c-
a ocot/-a c'-ac)c
HOH
9 000
C-I OC-lo-- r-cr-
0
0p.4p.3_a 4.4
0)0)0)'-4 4.1
4-3 0) 4-4a)>
•04-4 a)Ci
'-4 0
H Ca 0) 0 <ci .00 -CJHO CI'-Ia) 0)
'-4 H 1.3 4)0) Ci a) 4: 'i-I.4: >-40Ca0a)4
ci)H H'.4I Ua)
Ci '-4 4:4:-4 4..CaHa)E 0)000.0)E4) Qa)EE.4: 4:0)00)0o t-400fr..
C-i
H I.icia)
u-,0r- 03 - u, '.o u o 0' 0 - 0
'.003 HIf)C'4C H C1 ca c) - - 'f) '.0 'O '.0 _C._1 '0'.0
CI)A23

0 0
0)N.403
'4.4
00)'-4
0)
(00)
Ui0
N-
C
0.0) 0
0 • .-i.3 P.ia, 0.Cii.a (0 0a) - 1.4 )4J 0.4 0Cu O1..3 • .4I-' 3Ci.0
.. .40 03E ,-4c0 0)0 o.-4ao E 00.4 0 (0.1.
03 1.i.jCflICn0 0.4.-4 (0 0 (0,-i0 0
-7 Ui
.3
Cu0.E00
01.h•1-4
0.41-ho0)0)U•1•403'44 w
0,.4
03
(00).4.31-1
C99Q-0 03Q&1Q
-4rci
0)
Cu1 r-90Qo
.4
0)
000 0r.r0'.0cu
0
Ui - 3
- _-% -Ucs-.. QcQUi990r-1- C C' Ui C O U) C' - r-. 00 U)- C'4 .4 - C3 - C') - .4 IJ C')
.- ,
0 Ui - 0 0 0 Ui 0 U) U) Ui 0 00 r-
C') 0 .-i
0 -I '0 00.4 0 3 C C\ 0\ 00 0 O
c.iu trc cooc'i - C'-b C') U) C') .O -.? -.4 C') Ui U) Ui -.7'-4
0-44.)
(0.. 1.4
Cu 00. (0 03 0.E 0.0 E 0 0
C..) 0 .4 0)0
C_) 1-I 0.Cu E>'.
0 0 U 0.4 U
Ø.CI3 0 (00 .4 i.)Cfl.4 1J. E -4- 0 C) E 0)1 Cu.U '-4. • 0 E
i.i0) 1.iCI U 0.• 0)0)4.11.4 (00) .4.4 ,-4tj •1.1 l.4(0'0303 .003 031J0) C$.-44.I .4)
.1.ou0 a z) , •oJ 0o ).Cu 0 Ii 0.00)0O 00 0 0)
0 I.) CuiJ.00,.Cu• .4(0'-4
i-I -. .0 .-4 . X .4 0) Cu Cu 04-I '.3ECu E JIJOC/)OOE
(0.4 • 0 .4 '-lOt) + 0)'-41-4 0CI3. U 0zcnXZ
F-
Ui .4 ...4 C') Ui - r it ci N- cl O --4 -.4 Ifl Ui .O N- 00 c., C - F-- U)
A24

Wa)
1.) •,-4Ca
'4.4OW
—1a) 0
a)o.
.0 C.)a) •14 Oa)0I 0EE.ua)Oo uooz •o an ans-I 0 4-)a) 14140E ooan
ooa)o0 <E-
Co
.0
a)0E0
C.)
01.l
O•-4
4.JC)
C)._4 Co'i. Ca
In ..-4
0.0
4I ccc
0 0clI/
14
a)
0a'0'o
(Jan
a)
000'O
oecc0
0 m 0 - 0 C' 00 r 0 C) r-. 0 0
- Co iPi C' C) _4 .-. 00 o CO 0C'l 4 .-4 uii m C•4 c1
C' 0000 Co0004-00Ui C.4 - (11 Ui Co - Cl Co r 00r -
O 0 Co 0 'O 0 C' 00 c'4 00 0 00Co 00 C' -a r- C' 0 I DO 00- - i en en en - %fl r-.r- '.0
en0 0
00 a., o-'-4 1-I
1-4 p.3a)E 0 •. o.-i U7
C.) 1-4 an 0 - a) a)s. -<- 0 0.(1.4 0' 1-' •C)0 0 Ca 0. 0-4 lJd)0
E 1-4 0 .0 E U ni .-i i-i .-10 0. U Caa) .0 • E-4 QE ,-40 •O,4 U
) 0 .-4 )-'CaOZInUo " 0 U .0 Ca 0 0 a) .,-) 1-4 0) Ca __14 o an .- . - s-i- i-i an1-I 0) 'O . ONp.30 E0)CaCaL an0) E 0 14 0 0 14 1-4 U 01 00 l '0 0)
0 04 0 -4 ..-1 .i -< ,,0 U a).4 4.1 0 14 Ca0)Øa) 0) C.)0 0.-4 In U 0 U an an 0
an c aoc -4 1-i C.) ..Ø -iW-,-< 01-' 0) U '0 0 0 ' 4 a) • 0." 0) I 0 01 -'-Ia) U •,-1Ca-jIn Ci
o .0a)'0 0 .0 • i.i OJ-I+UCo zJ 'a X4
C' 0'-4
'-4
C) r-c--414 0 0 0 .-4 0 C'J (P1 0 0 .- p-I C') C') 61 - - Ui
A25


00
W)
U 4C',
'4-400)0)CI)E(0(0p:iC',
'-I0
>
0
(0 p4C.I-i
0 0)C-) U
'4.4
0)o
C.
-'-4
C,)
o •,-4-4 J
.r-4—4
U ,.-4 a
.4 0
(0'4-4 0
' -'
ci
0) (0z
01
(001
o .
C.''-4
(00)•.-4.0
c/DC
3 U,0
0•'ci
CO
rl
U,
Q
'4,
c o C 0 Q 0 0
rQc ,— ,-4
'J CQQQ C.'
-tr-
000Qcc;c;c;c;c;
.O N. iJ - U, %O
00044,00 c,Q0'•-4r'J rlcfl 4
000• 199'4c00 QC.'cr'-
000 Or-0-4
Qc'1O U,-1•rc'0 C1U
'-4
010)
—4 .U
toC.E 01o•-i
4-'-'-1 (0.4-' - xo o
C. 0) 0 U C,)
04U 441.JO4
01 0) 1- .4.)0)
..-4 --4 • 0) t.,-l(0U
I-i (0.4øO•,-,a) a) •.(00)0)
E- "1C/)C/)C/)P4
N-.-1
0
.0
U 4G)p. CU
.4-'u,41) •C'4•4 •0-.0 U
4-a -01 0101 0)0) 0)
-'.4 ooE C'
1 .c:1-a1.a -.-4s-iC.'.4
U s-i .0)1-. E-4 '-I -4
a).(0s-i
E-i
0 c .l - U 0.'c - - - r-. r- N-
N- 0 N- -
- U U, 44,
A27

._l
Cc)'-4
- r-o
.0
0.E0L)
O.i".4
0-4.4 3
1411JcJ 0ILi'4 U,-I a 14U,
'-I0.0 —I
'-4 l.i
" .0QJ;
r r-
C1-i
a)
Li o
a)
c,r-OC
c.'J .-4
000. u-
r- Q IP '4'.0 III r-
'.3
0.140U
0-;,a)
.,-1 a
oc (:
a)14 0".4c O)r-4'
a,a) o
14 - $4a) 0.
o
a.'i1
U)
a)'-4ci.
U,
'-4
0
A28

J-)
0
ci 0
a)J-)
a) C)
ci
C)
ci wJ- I4Jr4
t Io cit
'--4'cicU
>
>'Ca)0E0(-)
'4-40
o p-ir4 a)
C-)
a).,-4 _1
(n
Cl) .J
a) p-i
C) C)
N
a
cja)
1-i'-408
U] ,-O
r1 (Jj
or-4
r-4
a)
a)
aD - r- c r- C)
¼0 r- C) '-0aD ,- C'-J C'4 p-i ,-1'--4
N- O ' N- C'Z 0 0-r-4 4J
C) Cx) CD C'J '0 '-0
p-I p-I r-I a) ci'0-4 • '0
oJ_J -a) - c' a) C) U)• . . • . C_ .i_p-I c' o c -zr t( 0
- c tr- tr-, ci ci -
• 0
CJ(J) ci
U, ••-I -'--I
'0 ci
cia) cC) CD, -
c'.1 p- ,-4 C'J .-1 r-4 U)
-
'-4
C-
.°O4.J
C', (I, -4.0 .ja) a) a) 0r4 r-1 r4 '0 (1)-a a) 3-, C a)
a] .41 a) - p-Ia) C .4.40 rI
r1 a) 4-4 a)o C 0 S 'aU -0 a) C) 0 0'4-4 a)C
C P-4 3-1 i-I.'--o a) C '4-4W a)cz'-4 3-i C')
U) CU a)a) -H .41
. -,-4 - U) 3-i 4-)
CU a) cUCfl cc-a .ii 4-I 11C C C a] '- ,-'I_CU a) 3-s a)
0 .0 CU 0a) •r-4 '-4bC r-I'4-ci J ci Ci)C 3-s -IQ) cj
C a) z CU - o-1 a)'))0 CJ U '4-i '4-43--i
H •rI 0 'a 0 3-4 Cl) > 0) C4-i a) 0 a)Ci a) U) a) Cl)4-J Ua) S C) a) I 0Jr4 .. C). '.-..'c
a) ,-4 •rI 'a C J 0 Ea) p., 3--s a) 3-ia) CU C-0 .ctCl) .0 .l- p-I 4- Z C) 0) p.i 0 •o41 a) C - C •r-I Eci s-, ,- - 0) 3-s iW
l 0 Cl] 0 4 0 '4-4 U) 0 .0< 0 X 0 i U) 4- 0
S -r-,Ca) . • • • -aCUCl) CUz
Cl) p-I C'- c) - In C) < a) E-' '-
A29

(Y)
E
'4
U)
U) 0,
U)
'.1<a'
4JC) CD
o --'-4.1-)I 0
•1-4
r4I—I C)o '-4
.1-i C3U)
0
0'-I
U)1)
C)U'4C)
C)
- t41
t)l9-4 Io a)
0U)
0. QJ
0
U)11-4 '4o
r-1o-,-4 C)
U) 9-4Uo
•1-44-1 '.4
4 C)U)J.JtJ)CI)
C) C)
U)4.)
a)
.4.)
r4r, Ci
-C) a)Ci 4
Or-4
r4 '4
O•4.
'--4c)
'4-'
r-0
CD-C)
'-4a)CiE .'-' "
0) 4-1
•r) ai-.O ci
E- E
'1 0' c
- C..J C-4 r
ccJr-4
o '/' I'.' -
Ln r— ir -
Q e.i0' c4 c-.JcO
,-r4
r4 +E
+ r4r:j
c-4 .+ C)'-1
U)z '-4
:jCd
U) -zjE '4
) r4
U)Cd 4$
O) rH
r• Cd '4
)4
rIll
C) r-
i::a- al
c) CUr-4 C)rI
• •-, c) )4
C)Cd U
3
- U)
ci G)Ci I
.4_Jo 0'-4
'4
ci )L4-i
ci. -
•d
A30

2.3 Extracts from Company Annual Reports
2.3.1 H.J. Heinz Company:Management's Discussion and Analysis
The dividend rate in effect at the end of each
fiscal year results in a payout ratio of 44.2% in
1990. 43.1% in 1989 and 42.8% in 1988. Common
dividends of S 178.3 million were paid in 1989 and
$154.4 million in 1988.
The impact of inflation on both the company's
financial position and results of operations has
been minimal and is not expected to adversely
affect the 1991 results.
Liquidity and Capital ResourceiReturn on average shareholders' equity improved
for the twelfth consecutive year. reaching 27.5%
MANAGEMENT1SDISCUSSIONAND ANALYSIS
H J Heinz company
and Subsidiaries
14
A3 1

4
S J) (33 1-
1 47)I *
-
• (j S
$
E
gJ
_ -3
r)
.
-
•i3a)
v-:
t-
- .I $
a)
4]) J)D
1
21tI 0)
$34U?4] ].3'i
5-v-
:tj 01 ;.i0)
•3
(I)
s4
a)
0(U
.1-)a)a)
(I) --1-C
G)U)(U
CC).. (U C
0C.)
(Uo
E
$-i •i0 OWCs-I
4-I ..-I 4)
C)U)
—I 0 1.14)
(U4)
0
ci) 4)(U
0(1)01-1
4JI1p-I Q.LJ
ZU)
N
N N
A32

(I,t0
4-.U)ci)1.0)a)
.4-0
U)a)
cci
U)
>U)
0
>0a)
ci)
ccir4-.
ci)
cci.4-
ci)
U,
0a)2:U)
E(I)
-c4.-
-o0)CCcci0.
cci
ci)I
cci
U)
'II
0)
C
Ca)E
I-a)>0a)I-
0>..0
0a)0)cciccci
E
>0
00.
0)U)
a)-C
>.'.0
ci)
0
0U-
U)t0
ci)U)
±
0CI-0
C
0
0
a)
4-.
I
I
Ccci
ci)-CU)
U-
0)C
I
ci)
ccici)
0.4-0
'5
ci)
-C
.0
cciU)0
0cci
EcciI
cci
E-C
J
-
4.---
4 ii
'
\4
l ,
'r
1'
.4- 4-•
ci) U).- ci)
cci
0) U)'4-
00)c: .cU)4-.
U)
I!U)0U)a)o =
a)
0). .
'-2
., .
11
A33

.
0-Ii
w
0U)
04-)
0—1
1)
4-)
r-4 0
(U 0
0
(U(U
U)W4i
E
_-1 U)0
000 -H 0
E
or-I0 4(U
•. 0o b--4rl-4
U)
Q.i--1 04-)
4)4)
0
U)(U 0 .-1
U) 04)
(U00
re-)
cn
N N
I-
Ca
0
0C)
0C)
C)
C).-.
<a,
;j
0
._..0 i .-.C).t20
g
g
00
iflI 1C)C)0Ca C) a)
a)
g
Ca
Cfl 0o0ø.) G)cnC)i . i .Hui.flca•1
I I °. ifl0 •—£fl <a)
0
A34

.1
IQ)
0)- ...
0 0
0
0•
o
00c
oI-.— - )o4-
o 04-
- c
-. 0
) . .
004--.
0) . 0) 0)
0) 0)
0)0)
o000 0
5
..
0)
,
4- 0)c . 0)
0_ U
r0
0)O .0)
• 10
80)
t)
A35

U
U)
•1-
0xc-)
1)
H
00Cu
Q)4J
Cl) -'-I
00
Cu
-1-
0
'4-1
I-'
(I)
..0
0 .lJO
0
'-4
Cu
Q)U
4-,
00(1)
lv,
N N
C,)-
'U
- x 0 i.. 0
ZEc
— C.-. Cu
z
E
c 0II— 'S 0) v
I_1c Cu oorfl
CU C
ACCs- 0 9 0.U 00 00 C)
•' .0 0
...M r
ZI J.Do
IuI 1._.CI)'.s
C) -0 .0
> bOC. C) - . •
00)0)g - .-. Cu
c, .9 .
C)
Eci -
Cu
0 Cu
2 tu 0.I-
C) .- C)
C) C)'
- . . .C) 0
CU C)
2 oiD
'I)C) u s
Cu
. . .J0
I-. 0 0-g C)C) Cu i_. -
.0< X=<
- C2 ci C) • .0 0.
'.- '.0
o •:; -
C)V ci.
IU
L.0UCU
0.00Cu0.)
• - .E00
Cu
. 2 Cu 0)00C) 0 0.
C.' C). - I-.
C-. .000Cu
Cl)
00
2c 2.
o C) C-.00 0 ij0 C) ... -'Cuci
. . -i
C) Cu
rj<
A36

CI,0
— 0•0U- • 0U U Cl
Cl 0. 0
LU
-''-I
-E
-5UU
U• U•0
Cl
U 0U -Cl
'4U0.
- U,
Cl
EI-Cl
LU LU
- o R - r
'---.-(N
In -
—.-- In— r
-4
rn
ll
>
C/),j jrfl
I-
Cl Cl-- ..J
,. Q. -
Cl 'j J - -
Cl t.. C
_;7 :::=Cl Cl
-Jr.
- - J._,_I-. -
-
-. -ECl -
2-'-C . LI U ECl
U -
. -O
.a.E#C. •-
Cl U Cl
-
U CI
>'.
Cl S- . .. -o o
Cl Cl
E o
Li -
,U bO Cl U
C5Cl bOc
Q. -LI
-&
-U
oF-' o.E-'
o_. r-1 •'i
'J_ ',
• -ri '1'4
—
— I I
'4 'a—
0
U
Cl E - ClEeU0 0
U •-' V
AIi, UUl. •
I-. U
4-
U C• U -
A37

Clr-
N
LU
NC)
00c00•0LUNCl
CD
C)C)LUNN
NLULU
0
0LU6LU
C
U)
aa)E
.4J(I)w
CC
H
C
0)CtC 4.1
F
0C
E 4.)
C
a)
4- -CU)
U-I-C
4-)OOCtS. (j4)-I-> OW
C'
I
]
0)030)I-
U LU
C/)
L-
o 0 N 0o 0 (0 0o 0 (0 N6 (0 C coo a C aC C) - LUo ClLU LU(I
0)- C
. .
Ui
U)
zCa
b
LU -
- I
W UJ U)CI .b I LU
-_o i-•e 0)Z '_i z
U ;I.- -D.
C.) i.I-•
>-W'' - I ° (rC
CiC.) (D LU
I9Wc za) wI CD) Ui (j) C
-<LU
w
LUI 0 0 0 0'N 0 0 0 NI(C 0 0 0 N1
0_ Cl ; ( iC- 0 0) 0 0)j(0 (dI 6 (DIC) NI 0 (0C RI I
03 - I
LUC)
C)
(0
Cx
NN(0
N (0
N
Cl ClC) LULU LU
Cv)_ U)LU
NC).
A38

ci
C.,,
(i
ci
00 ' '00
lr o - r t I
00 - -..'--
IIII 0
0
0% © 0%. 00 ri H00. •0%. t— mlnhI— 00N00 '-• I —
— - — '-..II00- I
—II •
00 0 r 00 00 II
- - - I o(, - -.'-- I'i-
Ilb'li
ii
0% —i . I Ø II.II
,.a0% — — — I1I '-' 4 I"0 IlIc.
I I -V
V
o
c.':I Cn.
U
E.
1;; . - 0
VC.)
V-
I-. V0 g 2Zc, - . U
hi •
CO
.
-c C
I-. V9 •0 D
0)0.) 0.0
00 '-•0.
.E
00
---e 0) 0)
2
C oj-
UI..VCO•0
- •.- 0 90. CO
—0E i. CO C CO(>0)
E-'%
A39

0-i)0
Ci
'-4
i-i
CC
4-'-4
x
V
Ca0)
CUa) .-4
a) -
(I'4-4 CO0
4-I
00 0(0
Ca)a)(J1.40
00
0). 1.'C 0
a)
C(0cl)0.-
00,-I
CO
00-4
0)OCa(04.4
Ca)0)
-43-4
Ca0)
C
C
CO
I) (l
CflcU
,-
aic:
1x
>0)0>
a) • ir .-4 0\ 0' aD'0 um C -D .-4 v- aD c'l '0 r- ri i-. l aD 0. C -'-4 C c C ei ri C') C') C') C') -4 r -4 C') C') - -1
CI,
COcO
a)00CO0-I
0 r C') ri Ci C C') I 0 C'- C- C C') C'- 0' aD COD 0 COD aD C') O
a) -..-- N Cj C C'- (N -D C') C') -D '.0 I r- C'. C') '.0 '.0 u C') f- 0 .-4 C'. '.0 C'-- ( ,-I '.0 - cn C') -.D Cfl '.0 -I um c Cl - - '.0 Cl
a)
um c,'0 Cl C') 0'. 0 .-4 aD '11 C'i C Cl Cfl .-4 r-.- r-. r 0 r- 0 00 0' '.0
0''0 - 00 C') Cl 03 Il Cl 00 .-4 C) r-. .-I 0) '.0 C') - '0 '.0 Il'. 0)'0,-4 - C-) C') -4 .-4 .-4 C-) C') C') 4 ,-4 .-4 .-4 .-4 ,-4
-4CO -4:
C.) a..
-C:-C • 0) 000 4 ,-4 • 1-4o • • (0 0) ',
ca o bO . .C.) Ca 1- • o C Z C
0 '- '-4 0 Z (0 - -4: 0 C 4I ,
- .- '- -o 0 • 4 0 • U C)C.) 4) - 0•4-4 - U ,-4a) 00) ••4--4
--4 ,-4 • Ca .-) .-4 $. 1-i U) -4 -4 0 0 03 I-I a.. Z4.J Z . 3- -I (0 0) 0) .4: I-I ,-) - 0 (0
1.4 1-4 • I-4 4-I 0' • 4-a 4.) '. Z0 • 4 (00 -I Cfl,-4 0(00 .0) 1.44-iC CO a..E Q3 --a) .-4a..>-00Eo--l(0 --4C
CO4)0 0Z •-.-4Wcj -0) $-a0C0C)1-I,-4
.0 -•C a-.-f04.J '-(4).0.--4 00001-)CC)V4-a U)-004) • CO00OC -r-4ZO0)X(0C)bO4)W
-(0 4)'-1 •-4U.--4.--4 0)0 4) - 4) $-I U Es Clif-IX0) -I 1. Z .0 0) 00 -. '-4 • E • 4-' CO 4I '4 -4-4 -.-4 u
1..04.JI a3oJ 0.0.a)(0 (43C:a)E,-4 WX> -0 J-U --'-C 04-4 -(O0)0 - .C:O(0Q4-1C.l) CC0)-,-4,.)l-.00(004.iO).-4OD a..0 (0C)OOZCO'-44-4 .-400O).0Z 0 Cl) ) 0 - 0 .-, 4 a) Cx) P.. 0 . CO C) -'-4 I-a 0 -'-4
1 EI-4-1,-4.-4E-4 -I X(04.I CI)a)(OC .C:Es-I 0 s--I 4.1 4) C) 00 43 's-I C '-4 ' - 4 C s--4 (0 0 0 C 4)COZ b0 (0 .4: s--4 C C Q.- (0 ) 0.0 a) -.0 a) 0 C.
C1- Caa) •' 0) - '-4 E 0 0) 1.4 1.4 -s-I C s--I 0) '-4 0 's-I 0) -'-4 0) 0 U 4.4 4.4
C) 4.1's-Ia) b04's U C.) Cs-'s-44 0)4) 0 0 43C •'-I C) (0 C C0-.-4 (04) C.0 0 Ci aJ,-I 0) C CO 0)0)0
0)
C4)
Q) aDaD0'
.0 s--.1C'4CT IJl'-Or-- U)C'C.- C')riC
0 0 C 0 C CC) CC ,-4 ,-4 s-I s- -4 -4 .-4 ,-4 4-4 s-I C') c-I c-i ('4 c-I C').1
a)- a)Co
U,a)
C-44-)
C0
C)
A40


U-C
Co
0)U)
0)U)>0)
-4 >0)
00
--4 (I)a)-4
(a
a,E
-'-4
0-J
(00
D0)0)
Ca v
>'
(0(0
EQo .-4L) OC
L&
oca
0)
COcciz'-1
L
a)00CO
a) -S
Iia)
5(a0'-4UCo
"-4U'-4
c/-C
'-I
IJ
CD ma' u-C 03'Om Cfl - C'1 - C'J C 4 - 4 - C'4 0 ,-1
(JUE
(ci0) E aJ,-1
'-4 D QUO-C 0o 0) 0)CoCO U .-4
,-4 .-I(J..-4 '-I 4.)• 1.J(a Q 00
o Cfla)&. 0) '-0 0s4ICo0)D0 .
4.J0)0)U)E -4 0)Co0)JI-i .-40ciP..0 0 ,-IQU (cio o Co 0 0 .-4 -i •-4 -4 Q ,. 4U I-i Z U 0) (a .E 0 .-4 (0 Co E i-i .-4 -4 .-iOEC) a aQC000 0)0)0 ,-iw 4-4 iiZO-4Q0)COW WQ.(a
0 '-4Q0 EE O0)aa Co0)Co-UOEE0)00'4Co 0 OUOJ
OCiZ.Qo xt
(. 0 03 m 0' 03 m - c'4 0 m ,- c-Wi -o c 03 c'4 03 aD a'
.-4 0-4c4 '-4 03'00Q Cflc1rcflcn m'-4
U-40
U-CEEQ-i -,-4
U
EED C'J c - iI \O 1- CO O\ C) ., -- r '.0 rs ) a' C -4 c- c'"-4 ca C-4C'lc-4
U-C
-co co
a)
. UE
A42

Cl)
EI-i
-'-4
Oh-i
CoC-
. x
CC U
r-4
o .-40 0
4- 4_J
00)Ci
Z.-4
O\ c'- Q C' Irl '.0 r- '.0 C\1 CO C) N- .-4 0 ,-4 - CO
-. - C'.4 Cfl - .-4 - C'.) II C'1 C) 4 -4
CC4-ICC
CO
CC • CO
00 C'CC 4-1
1-4CC Z1.4 () w•-4 0 Cl)C) C)C-. -.-4 <-'-( 4..W(CC) 00 Z cC-4
0 )-i 0 '4-i 0 C)
C) -4 0 Cl) 1-4 4-I )4 4J .,-4 E'-4 E 1IO •.-1 CiQ) C.(CCC •C) 4l
C 0-4 UOZ0>, EU 0CC I-4 CC.0
•'-I OC) CC I-I (C(C1-i LiE-I OECC '-4 Im-
-4 -4 1.J 0 0.-I
CCCC)O GIC) 4-)IJC)Cl0 C)(C1-41-.40(CQ) CCC)C)C)CJC.4J
0 E-'-lX CC UlI.&.) C) C) .o Ci -CCC) EoCCO,-41-OCCOIXC).C.-4OC)CC,-4
'.0 v, - .4 - r r .,o '.0 '.0 c'- c- ("4 N- N- '-0 C'4 .-4 r4 0C.-)
'4-I0
Eo1-4 .-4
r-4 Cl)
Cl). CCCi
- 'I
CCC)0
Cl-c
0
Cli
C)Cli
0
C.1-4
C.
0
I.
Cl)p—I
0'-4001-IU)C)00
'-C
-'-4,-CC)
U)o1-Ct
0C) ')
00C) •4-C
0
•0 PC)
-'-'(CCC(C>,
0'-'()C1)
4-I -'-40 0 .0z
U,
cI
C-)
(I)
Q)U)
> a'
-'-4>C)
00
,-4 Cl)
C1)
C)
00(C1.J
C) -
I-IC)
A43

-4'-4
Ca
0-4
Ca
a)4-i
1-4
Ca
0-44-i
Ca
-44-i
(0 ,-4...4
-'-4
-4 -ca .-4 o
0 1-i '-4-4 .0
0
Ca. '-4
ca Ca
ca
.0
OEr-4 0
0- .-,-44-i .
'-40>-
Ca
(U
cao
00.CO
Id0-'-4
> 4-i
0. 4-iEa,o -,-1
a)'-4-4 -'0
'4-4
E
4-i'-I
a)
"-I
C)
0''-4
-40•
0•0
0.
'-4
-Ca
a 0O',-4'-40
-U,
a)
>- CO_4 0.
')00
-'.4(04-4(0(0
-,-4 a)(1i
••O
C)I_I -
00)
Ca)0.0.r4 i.i4.4(00UI-i
'-4(1-i 0),-4 0U,U,(0
-4ua,
0 iO 00 i-i
(00)
.04-40
'-'4C.)
C' O 0 r- '.01,111 Ia IC.4Cl.'-4I'.0I lIii II Ic-iI I
ç. -
.0Ca
• W(00.
E EE. • 4.i-04-i -Ti • u0 >- 4-i
-> a, Ca
(0• 0 0.
00 > I-4Ca0 0<
0 >' 0 U i 0 0Ca ,- --4 0 cj
• a)
a,0 ' EQ. CaaJ -i0.QE .Ca OCa
Ti0 .CaO0. (Uca 0-40 0-o U CaUs,i •Ti •'-, E -4 0. 1-1 0 Ca .0 E U
-40 •-ici,aO0)0E Cai.i 4G 0.0ca
.•-4COaJ CaCaUCaNa)-44-- 0iU $Ii0 •O-'-40(U0<Ti4-J0 fl0.0<0Ca0 •D -4
.0 . 0 o (0 • • -4 0. 0. Ca• 00 iJ<CaI.i ci-4I.i-.-4 Ca4-J
a) z. ..0 0 U Ca 1-1 0 4 0 0(0000r-4Ua,O0 Ca$-Ez.W0Ca1COE Ca'-4ca4.jo-.-10EiW o UE0..0.-4,-4,-4
,.4 . i_ X P.i I-' . . ' 0 0 >- Ca ca 0 4 a) 4 0 U J
'-4CO 4- (O 0)4-i
CO
- '.0 r C 0 4 C') - IIt '.0 N. 0 0 4 C') e.-
0 0 0 C) 0 0 0 00 '— -4 -4 _4 -4 -4 ' 4 C-i C'4 C-I C-I C')
A44

OcWo- •c
- C4OEOUcø
-1
00.U)
$40
0. i.JEU)o .-40CC
01
0 iI I ii.ri I'1...-ir1I0'-TI I I I IjI I
_4 r- a
o
0•0
.uO $4oXU) ..-4
oci• 0 U)0
Q- ,-4 p- . 0 U ( • '4-1 • 00-. -4 0- . •0 0 3
o '- <0 i-i0 I • 0 0 U) •0 C3 0 4- A.
c-1,-4 0O U) i.• •- 00 U)0 U)W
E . UE4 '4-1 W43 •U)1r4 4.J .-4 0 Z r I .-4 0 CO . 4 .,.4
1444 iJU)0cJc0- 1-40.0.U) ,-40.0 • • $4
X '4-i 0 ) U) 0 - • 'ii U U U 0) U) U)r-4.r4$4A.140440000H0)0U)U)
U)$4$-i0 £.i'4 0-.40E-'< -4-4r-l0 O)A. 00 U)0)000)03 0-.
0) Z 0) .-4 U) U) 1.4 p- C) o i-i i-i
oj 0 -4iJ o'.-4 0COO U) •tI U) 0 C) ••- $4 $4 cC E Co U).-441.1 U E 0) U3') 0)0)0) ..-1 $-ii-i CO CO U)GJ-4COI-4E044cOOI-c0U)-
.-4 ICO $41-r4 CO 0)1
1 .0 0 r- 0 0 -4 c-i -- 'D 0' 0 - c• 4 c.U•I O r- 0' 0 -1$4 El0 0) I'-4 0) 01
A45

C
CCCcjo
.0
.0
OE- COcJ aj
C
C0)0C0ci.
0,.
0J4.4 I.0
9-10)0
1-i
.-4 a - .-4I I0Jc( III III lc'4I 11111
-
UCo > H
C . • OO0 0 o • CO • C
E C ij.0ø,-1o 0 4.1 0 bo .-I C C
CO C) • r4 C r-4 0 01-i ca s.' • 0 1.1 r1COi.i 0 .- X 0)0 O CO14C 0) COU0).-I U--I0W0 • • .0 ci 3.-40CCQJ 0 Cd) <0 E s-' 0 I4 C
0 • - CO C ci$1 4.14.10oca 0<00) • 0) •0
• ,JWQO$d0 QCO CO O0 0r1
0-4 -.-4 CmØC0) CO 0 -I ,..) 0 '-4 .-4 r4 Q 0 i ,-4 CO 03 C
CO0otnCO1J4.1 mOci E cn ca-ir-4 0)) COCOC
CO :I 0 CO O).-4.-4 0)0) 0)-I 000 CO
CO -4 I.irICOQJ
r E C - If '.0 r. CX) 0 C - C.4 - If '.0 r- 0' 0 .-1 C4 r'i - (I-i '.C)
I-ltfl C
A46

00
o0(00)o -i .-•'-4 . v-I
>. CO
11111111 I,I II $
(--1'-4
CO CO .-4.D Q..-1OE
01.) (0
4_i
a)g
4_ia]
-'-4
4-i
a)•0
00.In
-,-1
0. 4-1
o •.-40 04
a)'4-1 1.40
'4-10)0Eai
4_i
•0i-i
CO
0
4-i
CO CO -(130) Q. 0.
E E0 (fl'-1c i-i CO
iJ4_J4_1 00- 0ai p-),--.2 tO
I-iI U31fl Q)E0)0
0)0)u .01.'-f-li-I 1J,-4j .0 UI 0)r4 (13,-I .,-1 1-I..01.4 • 4J .,-4 .00)
• ,.-i oi-
0 (13 < C!) (-i Q 4_i ) .,-4 ,-I '- C/) I I-I
Q., O InI CO c13.-4fI • 4 f-I 1-i
001.4(0 000(0 a)(0a)4)C/),-40)00>
i-i + • + tO 0 o (0 a) 0)-4tN)
- ICO .-.I 1-il•_I(OQil
,.0 r— 0 O 0 C1 -. LI 'C r- a O C) O•.-4 I-I
El0 IA47

0) a) C)U) 0) oca) a) -4I-iiIo (J0 0) a)
S.-.- 4
a)I-'
0
U)-40(1)0
-4(t ec
0<-4•00
o o-4 (U1.1o J
,-4 a)
0000
-4a)
a)E00)
'-4.1 I-I
mi '-4 1-4-Ii
0(a0
0)
CC 0C) 0 (a'-4
'-4 01-4((1 (a.0 a)0'-4 (as-'0
a)
00(0
I-I0
4-I
S-i
-Ii
0S-I
C
'-4
0
0c
a)a)
'-4
NH
a) C0 C
0.-4 C)E -4
0,-I c,
0 00s C(1,-4
0
r4 (N o r- a) 0' C ,- (N ifl L 'C N- ) 0. C) -4 (N SD0 C C) C 0 0) 0) 0 0 '-4 .-i .- .-4 .-4 .-( .-i .-I .-4 ,-1 (N (N (N (N (N (N (N
Ca.'0.'-4
i-I0
C'a)0''-4
a)00CD 0
r-4 I-i
-4
0000
-,-4 4J
(1)0--4 -4
"4-'-I
1.10)
p.. -40
a)(1) 0a) 000
'-4
0-4(a
0)0OrI-'-40.0El)0.0UI-I
0 i.11.10
0)4-i
Ca0.
'a
4.10)(I) 00-'-40.-4 0
-41-i00zz
II H
0)-IC -
0 j- -zzz
__-4 . ,. - __ __ , .- , ,_ -IC IC 4C 4C(N (N (N N- C a) C - (N .-4 'C C%1 it 'C <
- u N CN N- S . (N a) - a) -i C' N- N- Ss...d ....) s Z .-1 ...j s (N (N ...Z Z Z Z Z
+ + + ++ + +
I-. c- tt' c'4 a C N- 0 a) C 'C - - 'C 'C u1 0 c-1 - < < << <.-4 (N (N , U f C' (N r - I1•i If C' C' C a) c'i - (N 'C S.. -
.-4 .-1 .-I .-4 .-4 ,-4 - (N u' 'C N- Z Z Z Z Z
N-. 0' c C N- a) - (N () IJ (N (N 0' r' 4 N- ,-4 0' 0' <,-1 ri ci 'C r-4 C\ (N ,-4 ., O\ O\ (N 'C (N 0' N- t N- - -
-4 (N .-4 Cs) .-1 .-4 (N (N .- - 'C N- - N- Z Z Z Z
4CN- 'C C) ..-4 a) a) 'C <,-1 V 0 a) a) N- .-I (N N- 0 0' 0\ 'C 4 c
C1a)-a) 4r-4.r-II'(a) C'4C'1.-4 Z .-4 ,-4 .-4 ('4 (N - 'C a) ( N- .-1 (N N- a) a)
(I)
U) Cla)
0I-'1.1 Cl(1) 0
'-4 --a Cl .00 0 0I-I 0
0 -'-1 .0E 4 1.16(1 41 (1)
Ca o- (aw,-4 U a)i-4 s-i 0.4 .0 ,4 E v-4 0) 1-4 0) 00 -IO E o.o o a)
a) -40. 0 1.11-JO .0 o a) 00) .U)-i U)
(1) --4 0 5. Ø I-I U 0) 1.-I(a -. .0 4-' Ct) 0 0 (0 0.
(1) ,-4cI) 0) .,-IrI (1)0((1U).-4 .0)0 0
.000)0.0 0-40)(a ,-I 1-IW ClU -,-I4.J oi.o-4-iw .0o,6ø.0 I-IOU)
ClCl1.iUU) 0)0)0,-400).1.1 .i..Or-4a$I4J0 CaUOOOa)(aIS.i)1-01J ,-40O 0a)0o
-'-40 4Cz.)(l-1'-l-.-4ClW •Cl000Cl0Ca>ø-.0
-4Cl -I 1.i._4 (I a)
.-4 .011.4E
'-4 0)0
) C .. C) (N O C (N C' C) C) O - (N .-I C' C 0' CD 'C N- 0' r) Cl'cfl -1 -4 'C L( fl c) Cq ('1 (N U 0 Cfl .-4 'C N- m - cc C C (N ..
A48

+ S.- 4 + Qzz--
-5- -U:<< -U:I+ ------------- + 0-.0'--.- 2:2:2:2: 2: Z
Q)J
11Ocij
0.0
CD
xU,a)x
C-)
C.)
a)4-1 1-i--4 0-4
Cl
C-)
•0 I)04-i1.' 4-1
Cl
•00
Cl 0.
(I)
C-)
0
zE
1.4
4-i('3El-'
0-'-4
(I
EL)0)00.
a)-40.Ea)a)
1-i
a) .I-4. a)
o ,-i0. a)
1.4a,
c)
0. CiEloci0i,
-'-4t'4,-40
4-i
a) .,00
1-'0
'-4
I
a),-1a)
-4a)
a,a)
0-'-44.100Ci
'-a
- e- -D '.0 r-.CDO0 0 00 c--I .-4 .-4 I--i -4 -4
A49
I-'Cla)•-4,0
- I laDciDC,-..
C ooci lO0Q
C-)
C-) -• - s:-
0)4-4
In ooC4OCcDc,00
- 0-
00
'-44-'a)1-00.4-4
0Cl 0>0.
00 •ClQ.a) 0 p'-, o. 00)00E .1.'a)E-1 0
a,E I .-4 >-.E0 .ow
0) 0.0 • E 04.i,-.4.4 U0)a)o o N 00. --4
0 0p-4'a) •00) WO 1-44-4 Ci -I $. ..-0.00) 1-40 0)
04-i •4-iU00a)bO 1101)>.--4 •01.<E-4 C = 1-4 Q
'.0 C) I i I I - '. CD I
00 00 0In 9- I I I 00 0 I
-4
In - -t I -4• C-) In - C-)
oOO Q000000o In C) 0C), C In 0
It '. I1' C" 0 cfl - -
ti-I In C-) C-I -I -
0
0.
a)a)
'-4I1
a)0
00 ,- 'a)0. 0 0
1-1 :i
0 0 0.a) '-4
a,0)440 -4.)U a)
a) 0..-4 r4 -4 P-I -Ia,E0i-L) 0 E I-,-4 01-i a),-0 0.-Q) 4-'
1.101-4 1.i0...-1 044.0 (1)
i.i 040 O41J400a3 0)0.0.0. 4.1.0 .-a)
1_4 l-,0)440)P0' 0.000 Z-.* a) 1-4000)01-444 r40l-4'-4 00a)a)41.00)
.i>-s 00)-4a)1-C4a)•4 0-,-4 Cl 0.0 C-)
p., .0 1-i a) 0 1-a a) E 0

-4(0s-I
4-i—1
C)
a)
1_i
01-4
a)
0.
01.1
C-,
'-4'-I
CO
U)-4
.0
a)-4.C. 0)E-'-4call)0)10
0a)
1,J-'-4
"-4C)
('a)10,-4 1i
C. 03
'-4
-4
(010
000--4
140)0(0
a)0)0)1014)a)
' 0a)
1-30a) -,-4
__4 1_i00 (0a)s-I1.4W
C.a)
a)1_I -
140
a)-14
o ca
P_I
0.0' 0
4-i a)Z
a) CO "4E 0
4-4cfla)E
'-4'0
' 0 U1-4
•d ,<+ -S + I -.- +z '-'z
- IQD lcn
o oo 0u-i 10010
C.,) .ou-i
I l-'---J
000o'rlo
II • .1
0
01-3•,410
100140.0140.05-10
' 01J0
.0 •00) 0 0.0
•.-I-,-4 14. a).0r4 0.-I
I U.o0WcOl Iaa)a) i-iC)101 -'-IIa-'-I-ra)'-j ZXXzo.
c) si- Il-i %0 r-c'S) c cfl Cfl In
a)j
I1Oc -.+Q I I__)_ z '- z
0
xr-r--.7 I
—4
C-,
C_I .
lxa)
(4-4 14
'-4 000000I 000c100 I
4iEC)
a)
04-i4-. "4
Cl,
U '-4 r.j C'4 -4 -.i m
014<
.0
E(OIj14
000000000 000000trlO
C1 - C r- C'l - C'.
0-4
0-
o
'-I0 Ia
P.4 0 0-'-4 '-
110 1-3Ia
UP_I
a)0 WP114Q.C.0,.. 1-i a)(I) - Pi C) a) E 0
a)
14EP_I s0O0)0
Ia 03001.iIa ,-4,-1
In a) •-4 aJ 6 a) 1-i Ia
_-4 1.1 1-3 —4 a) 1I-i .0 ta i-i .-i . a,'0 0 -4 a) 0 0 10Xz
'-4 14Iaa)-I .0 c 0 .-4 c'.i ci - ,Pc
a)
—4
E
a)
i-ia)
a)0)
o -C. ca(n
14
a)
CC.)
C. CJ
El0a)
—4"4—I0
18
Ia
1.1
-4
A50

+ +C')
zz
I C'4 Ia)
r4C.)
C.)a)ZI
'4-41.11
C) C
-' C) C)
(II •
LiE1 C
a)1o Li11.4
001_:
Cl,Li
U41 C-) C)
•00
t $.4 I •Cl)
1.'
1.41'I
' E1C
CC
(0E h0
•'-iCO
EL)I
•0a)
'-.40.E(003
Ii
4-4 •• 0-4a) 0-40.
• (00
Or') . ,')• 1.1
i-i
•• 01—S -
.•,_,
1.4 • .,-4-. -s(0
, p-4 , 1.1o .— a)
C) 'e.4o03(0
(0 ,.,- Li u
Urz03 (I) 1-i
El •. (0ri (0 1.1
o a)I -- -.
a,
U Z r-1 00
44.4 -s-I.4 (0 (0
o .j, ØZ•,.4• ' •
Li '-00 z,,
o...''-E '-'
(0 • UI
I L.41•
S0 030)
).,.4 w.-4
a)1(0 1-41.4
.- a,44-1 o
il 0j0
0 -x3 0 ' E L)L)
'-'HCO a),
I ,
C')
C') _a)
A51


0'-'-40'JoUNu-v-I
><
-v-Il-.'1-10
>1-4(1
1-i
ua
00l.i0. Cl,
U)
0
-
C
(JO) U)(U
>J >-.C)C) . •.•4
(U '-4 -4 (U 1b
1.1
CU a)
I)
P4 E-C',
U) 00
C C.-4 C)1.1 •v-4a3 (U
0. C',
U) .. ,-4 Ca)U)J CU
(U
cia)U)
0'-4 a)4-4 4-iC) 0)
U
P4. 0 (U a)(U
U) E-.-4
01-i
v-I a) (U-'-4 C) .0 a)
CLI Ci P4
-'-4
C
• 00C
Cc
(UCU
E a-.-4 - - 0
oc -v-4 C - 0
CL. (U (U
4)
'-I
0.
(U
U
C4)
000.
(I,
(U U>-. _)
P4
EU) Coo
.0 E'wE 00 0
1-i4)0 0)
E 1000 05-i
-4v-I a)
0CZI'.I El
><
><
>
a) - 0 00C 4-i C
U) 0 C a) ca -j - 0 0 0 -v-44-' I (4 5-' 0 'i C a) 0 -i v-IC 5-4 C4 4-10 CU(U 0 - a) - i 0 00 0 - CU '4 Q) 0 4) 00
5-a) U) 3J0,-400 04J(U a) 5-411 .0 0 0 -.-4 0 -v--I '-i-i (U i-i 00.0 4) 0 '-I
CU t C -v-I -v-I C) U) -v-I C/) (U i-i a) C) 4-' d '-4'-'(U 0) 0000C/)-4-v-q C1)4-iCUC 0)4.1U) E CC.-5-i-v-I (UC)OJa) a)v-4 C(Ua) LIa)4) 4--' •v-4Cx > CO-v-I i Q.4--i.0 E 4.i C I-l-4
(U cU 4.1 -4 <c '-I E ,-4 I-i P. 4--'
-0 03 C - 4) 0 (0 a) -v--I U) El ci 4-i-I C (fl dJz, v--I 0v-4a)0
0 50U)0(U0 C 0 U) 00) P.. v-4 a) 0 0 0 4) 0) J 4-4 (U,-.' 5- (U . 4 4-'
(I)v-I-v-4 '-4 4)0 00(U - 0 -v-I -v-i U) .0 i-i U I-i E v-4 (U C/) 0 0
°-' C >4v-1 C 0 a) (U a) s-Iz-,-4i) .0 v--I 0 4 )U > v-I .0 0 0 1-I 0 00 5.' -. U) 0 4-
(U '-4 v-4 ,- •v- -p-i s-i ci C 00 0 t,i ci -i.i s-i 0)P4.0 (00) 0) El0$-i 1.1 4) (UCU oZi-ir4CI C/) 00 •'-I 00 (4 . -- 5.1 0) 5-i 4) C i-i i-I
- a) >C -oo-u s-.a)CUo ci U)4-i • 1,-i C) -v-I ,1 v.4 C C C -v-I 0) 4.1 54 5-4 00 I-i C C) Z U) -
- '- C .0 .0 0 v-4 0 0 0. (U P-i C (U '-' '- '- I P U).0(00 CUU) 0)-v-IC,-1 0540) iJ-v-I .CCP-i)-i C)
U) .-) C 5-i v4 v-4 •'.I 0) v1 U) 5-i 30 v-I a) r 4.1 4) Z C) (4 0) • v4v1 4-i 00 C a) v--I v4 X -4 0 5-i - a) .4) 0 0) 0) C/) - 4-i 0. 0) 4.1 0) >-' 4'-' -.0 >' 4_j4_J-v-4 .-.-v-I i-I'-4E)05-'-'-I>-.E I-4 0'-I0--40 000v--4 X0 OOJQJ0P4CzCj) -i-o-'-oZ El,-4.0U) CiU) P4U)0ZC4U)
C-)-P-i
CCl 0'-.1 () I.-)--I P..v--I P..0 0 00. 0 -0 0.) .0 P.. 04-i -I U a)
.0 - 5-i E P-ia) U) P-i CUZ P C
0 03 4-1CU .0 0) -v--I 4)
C 5-i 5-i v-I 4.1 4.1CU C (U4--i Cl 0 0 v-I U)0 - - Z P-i
(44)-v-4.0 0' - u-_i 0 v-IC-.E 0 v-I v-I C', C'1 ('4
(/)0
A53

4. DATA LOCATION
Table
4.1 Primary and Secondary Data Sources 20
Data has been obtained from:
4.1.1 Annual reports and private company
records (1989 and 1989 90).
4.1.2 Forbes 1000 ranking 1990. Source: Value Line Data Base
Service via Lotus CD Investment, Forbes Magazine, New
York, January 8th, 1990, pp. 119 214
4.1.3 Standard & Poor's Register of Corporations, Standard &
Poor's Corporation, New York, 1986 ed, p.1 - 2661, Vol. l.Standard &
Poor's Register of Directors and Executives, Ibid, pp.1 - 1484, Vol.2.
Standard & Poor's Register of Corporations, Directors and Executives -
Indexes, Ibid, p. 1 - 1109, Vol. 3: Standard Industrial Classification Index
pp. 1 - 419. Geographical Index, pp. 501 - 658. Countries other than U.S.
and Canada - Geographical Index, pp.658 - 660. Cross-Reference Index, pp.
701 - 753. Ultimate Parent Index, pp. 802 - 847. New Individual Additions,
New Company Additions - Updates to the Register.
The above registers were on tease from Standard & Poor's Coiporation.
A54

ci)
14
(U
0I. -H044.3iU)OW
-.4 4.3
.,-1 c)
00004
U)
-1
IL-I
Li
Li'-4
0
(N
cr4
'-:1
H
zcr4
I-I
zo
Hz
H
04
U)
0
.4-i
(ci
04
0
-'-4- 4.3
(I) 14(U
ci) 044.)
0(U U)
ci)-' 1.4
c- ti
--4 -H14W 'i
0 --44-Ic:: U)0(0 .0(014
U)U)
c:c: c:(OH 0-'
-'-I- ci)
14o-'c:: 0
_4 4-4•,.4 4.)'00 -(0(0 (01414
E-4 4-) 0.. -H
- 0__ U)
(I) ,-4
0 U)'d--I .n
r4.0-'-i
04 ,-, -H-H '-:
0-''-40 C ..
d rcj >10 fli'-4 4-
.,-44 0"4.) 14>1.0 >oot:: -'-IC 04(0 (fl 4-
(001-1-4 0'43
(00-H>i140.0 0-'
.QE-' -H ,;:a" 0 -'.4
U) .4.30) 0-'-4 0 'o0 C V 0 14
-H - '-1,-4 U)040
-OU)
-.4
(U1-i
.3::
(004
'4-4
0
a)4.3(04-iU)
04
0140
-'.4(0U)00
'--4
I.
r4
40
0-'.44-)'0
4.10
14-Ii
0
U
-H(Ii14.0cci..04>,
4.)
(U-ri-'.3
rUU-H (U.0(flU)14(l)
It,
'U
41)4-'
4-)0
4.1-4-)U)
U)4-I'U140044-1
0
U
r4 U)(DE
r$ -H4-)'ow
.i 4-)
'U0'IO144.)0'IniU)
04-)_r1 (U
ow0414
wIn
.4.)
4JQ)
ow.014UQ4
U)
14
U)
0
H 443
r1 E0
wuU)'ow
1.-I 4.3 ..o
'HO0i U)
o .o
04.h•.-, 3
,•1(0:.c.iJOWU)0.0 (A
0
14
(U1:..
E-'-4
c0
'I
14ZU)
I.U) 40
E Q
'0 E' 0
U14
U)
o .0
Li
U)0)0-'
'-(C(0(00.000'-IX
U)
(0>10)0)
- '.4 04-' E
>114
03-HC4-)
-H(1)0)
0)00'O0 '4-a4-lIt, 00.40
'-.4-(0
U) U)--I 0) 14EU)
'-4(0
(00 14---4
U)r4 4.3-cci -
.00) C)0'Ot,C >1
(004.30) -H1414.
4-)Ec)(0(00)4-4 4-114 04
(0(0(0
EC
-H 4--i '43
(00'H4-1
U) Q-'.4 0)
---I0"14 U0 0 -.--i04-) .j1404.3(0044-1
'UU)'-4p4
><
U)-'-4
144 ..4.3 (1)0 • U)
.rI0 14.10 4-)
CU) 10 •'O41) Ui••tUQ-H ..
4.341)14 04u 4-iC -H 4-. 10 41)
Ii U) P ri 4.30-4i 4-J CU)(.4 0-'.i '4 a) '43
'o ooir000)(U
0'C C V U) -'-I U)
'3 o -ri V ZU) '43 140
'0040000 CU)(014(UCJiUW
wO.0 -.-4CC(:1 04oi 014443 0 1.4Jo 01404-lU) C-ri 8-4 .rl 04-i :314O)I44 (1)042)4 '.IUIIOC)EW00W14
U) p4 4-iU) 'U.0.0.0 .4Jr-4C)4.34.3 4J U C '0 -'.41-i 14 :3-H 3 140 0 0 U) 0 -.- 4-1llu)U.1
..aa_ a_ -t'U 1-
- 1_ W
A55

a)4)a)
1-4
01.404
a)
U)a)
4-1'4-I0
U—44)
a)Ina)a)
r-4p4
>1I-ia)
0-'-4-4-Ia)1-iUU)
.5-4
'a
a)'C4)
141
0
4)U)0E
U)a)
.5-4a)Ua)I-i
-4-ICa)
4-)I-i
ci,
04(4)
41)4)
a-)
.44-I
U)a)
a)>-'CCEl
m
a)
r1a)0a)I-i
U)4-I
41)
4-i
I-i
a)04a)V
tYIU)
.5-4 CWa).-4 E4)4.)1.4Wala)
' -'-4
V>-i
(010
bO
• r4 4.)
1.4(1)(a .rI
-a)'n.04)4-i'-410'4-4(1)0
4-I
WIn
>('.1
>'-IEl
El'-4
0
a).4-I
00
0._ 4.)
.0W(I)
>1UU)•.•i E-w04)Q4."-4
a)W.c
4)0
4J4-I
ow.0Wa)4-I
(aU) '-4
a)1-4
1-lU)
0a)'4-1
-il
a)U)
Wa)U)1-i
Wa)'-I 1-404
0>-i
>1
0000
01.-i
4-I
U) U)1-4 a)a) '-Ia)>1 a)
'C4I
0
4-I •rl(4) 1.4a)I-I S.
CWo v.C—.4 a)4)4-I tP
a) 1-441)
-.0
0 1-4
vU 0
Wa) a)1.4O 1-ir11-4 r4
W ::iD1
C) C)a)1-i a)
a)C
WI-i a)
WO> a) x.0 .0
(cia) U)40 a)
'C
>1C
401-i a)Ø.a) Qi
Eo o•-0(1) 0(4)
I-iWI-I Wa).00 'Cci-)E44 E>i
—
U)'-4
a)C/)
a)
0
a)
-0C)4J
U)
0"(UU) s-I
0(flu)
41) WOo'-1.5-4 I-i (
—I -
0 U)•5-1 -oa)C1-40 -Q . ,-4 'a4-4 4) 4)
(4-11.100•
0404-4 1-10r-40iUO a).c. 0
01-1C4J0 -•4 U)
0 -4U"')
'-I 'Cl(U -a)
(U.l.)a) -4 •5-1u)OC
•.-4 04)I-i . '-1 .'-1a) u)'Cl
'Cla)(UP.iU)
r-4(UC0
—14-I.(0>-iZC
(U• 5-1 04
(00C))
U)Wa)
.. El •.-1U) >-1-4 -Q)C a)C (0(1)4)01-4 4)(Ur-4 1-404400
4)04
4.1 a)'a.5-I C C:-1 (U
.l)WCa)I0u)
0 '-14.) '.. -1C 04W01-i>- a)
H4-)4-) CC 041)
0 0 •s-I1- 'a
C (U. r-1 s--I C/)
(U.lJ4) -CC >-ia)a)CEC(Ua) '-I QLfl4-) E.5-I C 0.4)001.40a) a)>W04'a_C -'-I
El 04
-
A56

U)
H
0-
(U
C
C.)..
0 -o
0
-1
C -IQ4) QHC 0 C
a) fl-I (U --1 0 >1 (U
-C
4J4J 4i (O-d b'0••
0
(UC o S-i4-) -CCC-r14-)
0
Q.1a)
0(U •(UQ(U5
I-i - '-4 U) 5-i -i 54 C) U) -c-I ? a) a)4.) ow 4.) QQC -i--'EU)
a)
4 5-4 U) Z Q.IH (U (U a)4JQ
C 5-i 45-4 S-I
0 (fl0-40U] •Q.(US-i o >o (U E Q.1.S C (1)
C
(U CO5-irU5-i
(U
a) ' r-I0U)00EC'-IW-I O54>i
U) (U.a)4) - wi-I
a) fl-I
(U $) iU ' D,-I 0 '-I
0
Q4) U)CflC4-)CW (U--I
5-1
s-1i-.-Ia) -o
(U .CU) I-i4JCW 54J.C--I
$-i U) 0 C040a)U)U)4-)
a)
oQ.C-IW •U)
In U) H C E Q.il-I 5-i C (U C (1).IJH 0 S-44 'U
U)
U)W 5-1 '-I Z (U 0 C) (U C) 0
(U
'-1
ai: H (U -IWCb 'C,
fl-I a)
s-i
1zi -0-i0E0 -C
wIn (U '0) rC,0
C 4) .-4J--4 00S-U)
(U
0
C
(U U) a) >i 4-4 Q)
C
S-i U)
Q.S-0 "-I
-4
ID
U) WOE-I -WC
4-4 •,.I0.4(U 4J'b(U U)S-I l -C-H04
U)
C fl-I l)
tT0 -'ti'C, WInE 0
a)
(U
C - fl-I C 4) E 0U)U) CiQ 0 'C,
.. 5.IH(UU) ..-1
0
'-I
a).Q
C
OQ)Q.i •CW s-I
0
5-1 ..-I .,-I 4)
a)E -otrowC
(U(U .QC • 4.)QwQc-.-Iw
-'-I
U)
-U)U5-i 4-)C '-.4
(1)0
00 QrC, (U
C
o-
0 4- CO E E4-1 5-i Q. 0
0
a),-'
(U (U 0 (U -'--I
fl-I C 05Q'D'--I
(UC a) (1)(U4J4-4(U05-1
a)
(U
0r .C(U U) 5.F-)owl50r -C
0
Ca) WC '-IOC 0
--1 (U4) -'-ICU - (U
4-1
(U0x)5-i(U 0
(U
-4
0 -I
WE-IE-I.'E
a)
U)
-C E4 C (U50U) C
(9C C) IUC(U4J-,-I (U
a)
(U
a)
U)a)
WO U)
fl-4 -C-C
C --I
0-I--IU)(U05-i '-4E-IH
cn
('4
H
A57

c—I
(04.)I-'a)Di
—1
0
014.4
0).c:4.)
-4>
'-4F-'
-4F-'
z
0
4.)..-1
U,
a)V..-4
0Di
0U,-4€0
a)U) e.
wi:- (0
E
00>1
14
00Q4J
N
cj
N'-1 .-1
'-4'4-1 (00
a)(0
.. (j
.-.4-) ,-4(0
4Ja)•.-lC) 4.)
1.4 C)010) '0
0(0 4J4-) U)u a)
'a€i .iJa) €0WV '-4OW
Di 0)0)0(1) .0l
'0 •.-i(0(1)0) 4J
.cW
.'J0•i-'•QL OWW 1-iQ.,V 01
14.4(44 1U4-)00 o:
0W 0) w
(0(0Wii4.J4 0)4-ia)
000)00)14 14 14 >0)0)0)0)0)
14 Di 14
€0.0 C.)
WV a) a) U)U) 0)a) 1)34-) 4-) 0
'0.4-) 0
>i4- 'i144-10 .-410o 010)0)
a) Z i4-) .-, ..-'
:: U) 44ir4o • .-s •.-I 40 (0.rl U) '0 C.).J 1- (I)•'- 0 l- a) .'iU) C) (1)44.4r1 Di.-'
€014
U O .€J 140(, •00i
VU) '.0)
1) 4)0)01W
4.1 0 0 .- U 1-4
Di.V '0a)
r1 jWtDi
41)v1o'u
0 14 41)0'0-'-4 0 ' .0 0' C
0 E.-i a)(U 1-Q)• -14 Di0 -€0a) • a):0Di(004u a140 (o €0 -e4UVOJV 0
'-40 i1-4 Q.i>i00 1) '04.)
i 1-i 0 Di
a) .041) WV 0'WV4.) Wr-u C 1z.. Cm :l..-4 I 0
• '-4 04'aDiU 0(DCfl(1)4-i4-,aW
C >iW .-i 14Di'0UDi 1-4Di4J '0 0'O 0(01414 04)
0 mDi0c0 1-44.)
a) E Ua 0)0-r1 40 1 Di
'a a) 'l 4-4W.0 (00.4J.4J Ii(U a)CWOCO14 4.i a)4-' tP4-
-'-4C U)
WOWO.0-ri ) Di
€0 a)
0) 0-rI(-4 14 -i4-• €0: 4i -
a)41)4.414
(0 1-€
(UV 0)V .0
4114.)Cl-I
• .-4 40 01a)(I) 'i U) •rIQ).-i 4-).CC U4.) 0 O'a)
4-Jr-I4-4
4JVV 0)100) '014
4JW0'-.-1 >i-4 0)'
'0 i.Q C
1-4 '-'U)DiDV'-' EU) . .-i 0W(0;:WU'0 -'1
>1 4-(04.1.-I -4U)-4 0)4.a) 00
•,-'4.).4.)ç.0 U) 140)001(0
WV 1-4 C DiU) .,-, fl-ri(04-1 WV 1-4
- 0 0) r4 0Di U 1-44-4 i
A58

.4-)"-4
UI:3
a)V•1-4
0c:L4
I.W>i4.iCj
4-40U
1.-f(U0
Iz
r-1
.4-)
1.-f
CI-f
.1-4
z
1f.I-)
ow0
C
0I-f0
a).c:4.)
'Ii
•1-4
1.4 ••0)11)411.4'0(0
>1Ca)
09-44-)
1411)0(0
• r4 r-I140.10)
.0
Cr1 0CC0 •I-1
•e-f 1-44J:3• 'CU)01-i040)
010)1,
0)OE>1014
0a)
•( 0r-414)
4) -f011):3 'rI'0:300114004(0
ITJ
a)
0>1U
a)4-4
4)C):3'001-f04
4)U:3'001-f04
a)1-i0(-3
U)1-4(0a)>1
4-i0
0C
U'-IU>1U
0)'4-4
4)U
V01-f04
4)U
'001,
0.1
a)140C)
U) (011)11)11)1-i 141414(U (UrU(TjrUa) a)0)0)>1 >1>1>1>1
I44 c,r'-'C0 -( -I'--1
0
Cr-I:3 '0
'CO
0 U),w U)
Wa)
a) .0 "-4• 1'1 4) U)9-4 :3.1-f ,Q
I.4fUa) E
'0 a)'C4-1 )i
.4-)'0 U)
InC4 '1-4
4-4 '0
.1-,
U) a)'U Cn.0
U
• rf '0 0- 0I-f 'I
4J a)Q) Or-f'-I WUO W.4 >i>-ii4- U000)U a)
a) 4-4'4-4 a) tT''-4.- c r-4- 0 •-i II EV4
4)
0 -'0'0 W00 >)
0 Q)
0) (0 ri044 .4-)(0 .-f U'-fOUWa) a)::I. 04(04-4# U).c: w
(0.4-)
. J0C :3a) 'CE 0
0 4-4a.1
:30' 01'a C
r'4U)'-4 -4r-4 '11 -l- a)raOCa)
..-i . ,-1 a) C1-4 Ca) 'a 0401.J .0 . 4 C'aD :3I:z)
a)0'
01) 'C 0'-1 0
•1-4 (-4 'ar04J4J C-( 0 .-r4 a) 04 0:3,- 'a a)
01C
•1-10404
.1-Icn.0clJU)0
U)"--4
a)Q)
00
0 (0-.1-I
0)0) ).t44 0 0) •'
C 4) U)r-4 (U '(3 1-iI 14'a.1J:3 a)0 U)
'C a)014 -0411) C4-i
0) .U) 0- -'-QU)04>r- 'a
00)014 (1)0
14
C
a)0 1401
1-ia)
ciw01
CE0) 1-0
O E
(4 :3 0 1-40
a)>iC C
••i 0In(44 )I 4)
o- CU ":3
0011-4004'U
.0
'Ca)
'-40-10'11
a)-Q
4)0CC'aC)
0)0C'a(-4:3U)C
-'-4
01C-1'C:3'-I0C
(I)0)00)
C)>01-i •'-Ia)>(014
C)-4 0)
01DCC -'-4
CC--4 (114:1.1(0
A59

1-Th
"I. -3
j.
0-e,
-o..-4 (0•-i
'0U) -.-i
O'OLD
'0
•LiQiroLi Q
Qcfl•cr0--C
0.z
U)
woLi
U•1
-
.,-4 Li
.0(0...--oCr00ow-C--4 0 -4J 0'(0,-I <
Li ¼0--1 '0 c'-i-I (0 '-4CEOroxO 0
••'0- (0o EOC.0
-4
S
.3
'J
).- -I.)- -C -I_p.
2
C
'-I
0 a?
c
S
C
O
;L. .)
U
.
A60

0Q)0 r4 1-4>i'- 1
04-'040
4).):: Ii4)4)4•)E.c U)
4-'
o
04-i..-4
U) 04•rj .0 4)
0014
4: 4)0U)Q).-4 4)U) 144JU)
.-UV U)U)WW•rI '0 r1
4)4)401
4)4)0U
4) r4141-44)
I0O1-4 r41-4i 4.14)
04-i 4)4.)04J
4-1 WQ044
1-4 .04) . ,-4 .4.1
4)0.. ;U) 9-iO0 0140414 U) Ii
4JQVJ) 0
4) r 4)14>4)4)
El .r4 .Q a::
U)
0
.4:ElU)
0"-44-)4)144)0140.. •.-4144)04::
0•1-) -I
Wcf)
a)
0J"-4 0
014.1
41)
(Tj
- '-4 0..U)
"-4 41)
(N
4-,
z
0
.4:
U)ElU)
Elz
0
Elz
a::
U)'C
1:0'01:0
000'.'-I
>11-i(0
4)
(N(N
- tO >iO' q
-i'0 .-4c'o0 4)r- W4i '0 c
U) -,-4 U)(U
'-0'4) -'-40> in-
E•.-4 4)r-I0 U) U) r4 0
U).: 4) c:o4) 0Jr44)E .C140..>i(U 4-1 4) 4- E .Q .-''0140 oi
a10 '0E0
14: 0Ui114-44)U)0.4JE
'-4ri4) b'14W
W WN1-4 .ri .-i-.-44-3
-.m-iw >aiuN4)cO 00)
'0
r-4•434_)4JI-I
.Q U >1 01 .-i 4-) v-I
.Q; -4) W0u.-s.r
.U4)9-i0)4) 14W
0(/) 140V4 ri .4.1
U)
(U ri '0 >i
.1'0U) v-4VOr-I V 1-I'OV4) 14-ri 4) 0 4U0O'-4 4: (U14 e---1 4) 4)rI) OE.C14 -
C.) (41 El (1) .-4) )C
U). 41) • a)144.1 • in O4) U) 4)U)
1Y1 •rl4)-'0 '0 14 14 r414 4) -'-I 4) 4.1 14 >4)'0 U) 4.1 r-I41) r4 4.) 4)U) >0 14V i,41) •.-4 14 4 0 4)C'oo-i .. )U)
'0.-' 14 .-4) 141 r4 U)
4.) r4 4) 4.)t:: u.cr4 4.1 (4104)0..c: 4Oe.-4 E
14I 0)1-i (414.14) 4)'0 '0v-I U)
0 4)U) -'-('0
4) 4) v-I 41)1-1 > •'-(41 r1 E 0.c: 4) (U .rjU) 4)4-14-'
-Ii .c: wQ)r4 E 14
4.114 0 04)
>. Qr4 4-4 '41144)44)04
4-)IC .1::1:141-44)4-)
.i 41) 4) .c:'04-4-J 0
'-41: 1-14)0-rI 0'.c 04)
a) 1(414.1 4)
.1: (0 1:>iU) > oc4) .,-IrIt.ö>. 144i1-4 Q4(U
1 --U)I-i 4)41)
0141414
0 i4-'
1: 1:0
0 1:4-)0 4.)
r4 r- U)4)4.1(0
14 E tT'r-I; c0 O'-(-44
4) 4) 'O•'-s1: U),-I 01
1:4)1:0(4114 E -rI .1: U
(i W.C'O04)01:
14(04)14.1:4)14-) Eu
0 4.irIE•.-( 0(0'-'>4) 4)10lOU) 1.44).1:4)1: 14W.0 Ori•Q 4.1 . r lQrl
.rI 3 14>1 U)41o 1: 0'-14-)•'-( 0 0..; -
0 41) 001 10 > 41)
4) •rI 4.) 144) U)4-) (04).1: 4) 4) .1:.4.))r-4 144.1
4)0.0>1 140
140-1-) • 4) 014)1: (0.1:014)W4i4)1:
01: 1: 10 U) .rI4)4) (04.1.4.101010) -i-I (0WEU) '-4'OOU) 4)1:04)1:14
-'-I4::
i i -s-' -.-10> r441) -ii U) ; U)4.14.14.1.,-4
o 1:'o U)
4)1414)4)O 1:>i.4.1 .r4Oj
E>WU) >14 14>r v-I 0) -rI
4.1 U) 4.)
(04) 10W U) 14100 4)100r(4) Di014-) > E14 (41 r4 >1011:4-' 1:0
011404)4)4)014)
0.14-)'--' E.1:1:4)01:E-4-'-4 U) 0 0
A61

4:
4:
0
0a)00
CO
a)
'-.4a).0
C-)
-'-4
z
0)
ID
014
0
00
-'-41-i(01400.14001JCa)
-'-I
.-1(0
-'-400
-'-4
0)
(U0
U)
>,C(U04
0U
0).0
(cip
U)
1Ja)
>14-'.'-4'-4(UC0'-4
4-)(UC
'4-10
>1Ii4-'C
C1;-,
z
a)'-4.0'U0
-'-4I-'0401'U
'l-1-'-I
>1C'U01
0C)
C-'-4V'-.40
(U
1-4
hi
0
0
'1-4
0U)
E
a)'-4 -'-4'00)
1-) U)1-4
C a)-v-I
'--4
osO
>4 •01-4
CC
41
(U ..o'-4
a)
a)a) 1401(1)14
>1
-'-4 4. 40 0.0
:3 4-4 4) I, -'-4 1.104.14) CC))
a;
0 0-rI V a; ID.1-i
3V 0Pi(0
000)(U-'-4
0144-4
0404001
0 C 'a .'-* a)0
'0 0-tI 'U Z4-4
4)4014001
U01 41*-i'D.'01
0000 00'U
(014 '0 '00:34)0.0 -'1
U)
0z 01041014'0
0 4.14)014 O'i-i a) C
'4-4
-.1 0 4.' :34-4
14W-1 (000
p -i.).v-(1)40()U) CO a)i
C(3
001144)10-'-4 .0.0 -i-'r-'O4-' -J 4-' 4-' '0 0 V -'-I
- :3 -'-1 :3 '0 4-ia;
) 0 0 U) 0 '.4 '4-4In'Ua;'-4
(0' O t01 - - - -
'-4 U)
OwOh
0.0.1 4.
'Ua-SO1-44)0'In>1w041
(U'-4-OwP41.4
0)1))
4-'hi
ha;U)
Ow.014(U04
a;Ii
U)
0
00'.4004
•r4 E0
W()U)IUa03.0
Oi'-100
a)o 14Q
Oh-'-4 :
'o o'-4 U
00)0)0.01))
'-4COC0
U)4.1 E104.40)0r4li U)
r-4 0.(ci
(Jo10
U)0Ja)
14.-4 0 4.1
CO
-'-4 a)OOZ
(4-I014-40
0C
•' 0) 0>1,-I.,-'4J 10 4.1
(0 (0
..-4 C a).4.11041
(1 C*
400)
140)C)) s.0
u,t 4a) 10.00(4.4
• '-4 CO
-03
.0 a,-C-)
'a C'-f 00
.,-4 14IOU) a)
a, (ci
1-4 .00)0
10411.1(3
I1-4 4)
1(014
(04-11.103
•, -.-( 0U) U)
'Do1400)
01 1.) 4-114-40)
0.0 '-
(_) )U)
•0C(0
C0-41-iC-)
•0014.C. U)
4.4-C
140)
1400)14U7 -,-I
00)a)
-'-400'-40C)
0.0.OE4-10
0)0)14.0 0
'0h-I0
00 4.)C '-4
.. I-I Z
>14 1.1
0-v-i
0)•;,'
Ow ii40.0 0)
-.-4 (A
oj-'-4
144.$ (44
C00
(0
0 0 E
.0
A62

dP dO
o C CrOC
.1..-4 4a-f .-I ,-.4
I-I
(4-4
(a0a)
(a,.. ff1-'U
(a4ia)
.•-i () 4.)
0
1Q)
(a,0)01
'U.4-f
U)U) a)
.4-fa)
(aU)f '-4OW041401:1 0)0)ow
'a,
-rI (a,Wa)
- I__I
4-JO
OW4-104
-
(4-4(4-4 4-14.100 0 0a ) •. a) 1.4
f1 (f1U) ia,44J 0)4-JO)
000) 00)1-41.4>14>0)0)0)0)0)1404 1.4041.4
0
4-4zU)
0
4-4
r-I(a,0(13
a)13)
cc0'
a-f a-I
a)4-4
Ca0'
1-4I-f Ca
Ca0
--
a)(I,
- r-I
a)4.1 Ca1.-c -4
(.1
o o Ca4-i
4.1
Ca-'-4
U)
41
C-s
U)
13)
'lLI1 (Ii
0)C', Ca-) C P
1.-I
4-iO0bO
a)
Ca CU a-S
' p-aCl)Ca
0a,
-4
C,
4-4
CU
a-' '-I
C-)
'-4Ca0
1.;:!
..•a) ::1.40 rl
rIff1
04t4.4 0.)
'4.40)
4.40)4JQ 0U)'-) .•-$
o0
0) 4-IEcTj4.J a.',Q .c:
4-'
z o ..c0 d4
U) a)..4.,-4 • 4.1
U) I-
1.-f ..-. 0)
1.4 •.-i
4-4 'rI ') 014
4.1
U)OWc
4- 'U)•.. )-( 0
a) c7d0
l4rI a)> '4- ' U)
r4 00r4 (a,1z cj '.-(>..-4:ac:, E0
_.4 1.1
CaCa CaOC)<4.1 >1
1-i
0Za) •t>1
r4 4-a0 OO0 0 (44 0 .4.)
(I) a) U)U) ( a)a) (a, 4.) 4.) 0
.4-f>,0>1
(4.4 O4J.-4 1-4Wfa,
0) tI'> a)4-) -r4>1
c U) --4 4-)0 -'-4 'a, .-4
c' (a4- (f1 1.40
•rI 0 -U 0) U)U) 0 1-1 4.) .-4
-a-s W,-4M-4:1IJ1 tI_f 1.400 (a 14(U 'U00
a, >-,
0)0) -
WWtPQ)
-4J0U)W14
04 0 --I ff1 (a,14.'fi U 0)
.r4J >104 0)
0)'014 (a
0 14 .a- 0) 0 '0
..4 0 > .0 0
4z4 0 0)Ca, 4-4Q)-4r-41.-i 040 íaa) • 0)04fa WCO4J U) 41.*o ía '0 •co:10'O W'0C' 0
a-iO >14:1.t00:10) ca->1 14 0 0I ) "I
Ca>i
0) .0a) W'O tT'W'04-i O)r4 r..l:L1 .
-4 0-'-4 040a04o owwal-U $-iaW
>iW a-4 4-41-i
ía o'a 0(a4-41.-i 00
0 :1 0' -'-I
04O Ih4JWE 00 0)0
-I (a '-4 04 s::
'0(a 0
.4.J4i 4-
ff1
W0o
4-1 4.) 0)-I.) 4J
--4U)
0)00)0.0 . .-.4 .0 04
4-)4J'a, a)'-4 >
'-4 a) :1 'rI-414 04-)
'.-1 >(a-
O•( a)0)4-) 4-,
(a,1.4 .4
0)'0
0)4-f
(aa)U) >1 u .-4O)'-4 4-f.tz004- 04-i a)
'--4
4.)'O'0 0)ff10) Ca14-c-c-4U)O'
-'-4 >1'-4 0).
'0 i.Q 1.4 £0)04 :1(a1.4 r40)04:1'O r-' EW-,-4 0WfaU)0ía -'-I
>44J,-4Q) ,-1(n_ (4-4 :W(U 00
-'-4.4.). 4-)
U) 4-40)0 tP(a
W't) i- c o..U) • .-4 (a, .a-(aM-I W'O 1.4
- 0 0) 0040 4-4 (H >1
A63

(I,
a
0Iii
ElU)
0z0x
U)ElU,
ElzI-I
0Elz
z11
U)
.-40
o::0
-'-4U)>
0.00'4-.>10
U) -.-4
00•.-4 01U)In
04-1U)0
'a
• ,-4 4-)>4.1
Q4
-4c: U)
0l'j01
4-la) Eo.c 04J0
,-I '-40 i4.1010a) (UU),-4 4.)
• 1••4 4U)4 a)
• 1-4 -I .1-)
Ei Q'.4
a)4J
- '-4 .4-' a)> .4.1U) C
00U)
ai w.crl 4.1 .4.j'-4 (U
(U 4)U)
a)4.JI-i U -'-4
000C
4-1 1.10.c U)
04-)•1'•4 4.1
C.0 (U0Q.
w0.CO'4.)wc'4i,-4 0)c I-iU) O•'
>1C(U (IjC
I-I
In.Q
U)
0 U) 0.) U)4-14-) EU) rII-i (04)10W4J 0 U)
4-) 1-4U)4.J,-4CIn(U
U)0 1-a).,-.> U)r-441-i U) (Ui-Ia) 14JU) 0 -i-I 0
4.3 . .-4 (6 4.14-4'a 00
tTI'4-1 a) C U)o o • .- E
'U 04-U)E U
U) U):: cp 'a U) .0,-ic •.-i(U (jV 1-4"O>.C .-U)o i
O'a 0'a o.-i-.-
-. Oi U) 0 C(N(64i(aU4a)0s .,-443 1-i >1 -- ( (04.) l
.0 E r44-) U)._4
>1 O'C4JC U) U)
1-i a) . rI 4-) .
1-4 0 r4 (0W14 EU) D4-4
'a.Q C.cC 0 .-' U) O'10
>: U)
1OI W'aWa) >CC4J CC(0
..-i 40.-4 .r4'-I
4-)C 0U)0U)a
r4 (0'a4J .0
1C0 a-'a) 4) -4C 'aW.0
• ' 4 >1 0 4W01-4 ..4.r44 4-)U)C •-'-4
0 rI a'04 C
4.i •.-4U) 0CC
U) C 'a i-i r4 'aU) 004-' a)
0Ea)(UU)1 a) o.'a C U)
oa" .-4a).01-'
in C 04U) (0 a)0 OW
C
C.0 U)004-a 1.4
04-iC1-i a) a-'E
U)1-i
U) 0>1041-i .4.) i-I
1-IC'0 U) (00a)>W
-4Jn1 U)
0.0 •1a) 4.1(0
U) .1.1,-1 0
WE00 4.)
4J:(6 W'a.CU)0W4) ECU)
.-I C>14-1(0 4-lWU,>1 .0
0 04-)
4.1,-I a'0 C
U).C44(6 0 -.-1
a) InC1 4.) -i-I -.-4n
'-H.0 Wr-4
U) 0')-' (1)(U •.-4 w
0.1.0
-4-)0-' U)
CC 1-ia) -'-4 >4 a)
: 1-4.1::o (04.1
.-. 1-i U)
a 0'U)a a)--
-40 a).-''- '-4-4 C '-4
(UC
r44-J (6 1-i
U) . ,.4 a)4-)4)_a
o 01 U) :: a)4 a) (6 •'-1 'a
(OQ)
- '-4 (64.11.,
00("4>
(6'-4-i
04.4
4-,(4 U)-40
E
'4-.OC
•r4U)
040-I
1-I'aa)4.1w0(6a)04
1-i.4.1W
.0 .-44.1w
C0
'00
C
nj_a
4.4004.1
'4-1
0'0U,rU
(6U,.rJU)
'-4 C4Jp-I -i-I U)a) C.
0(6(004W E
r-le-4'Ø'-''-4 C
.4.1Co Ui
U)c' 1--1(0
'- 0
U) 0-iosi C.-4 . .-I -I- C 4.)
a)16.'a 1-i(0 1-i.4-)4.1 . ,-I (4)
01-ICr4 'aInC
.4.1 -I
>4 a) a).c1.44-)
'a i tJ-ICW0(0.C'a 1-I
El>iWa) EV.C'a 0 C
4-I--. 0 C
1-4N4.i a)a)W E.-40'l 4.14J,-4 1: (I)0 '-0 a)
4J- 0 •ri
'-. 0 a)
nCCa0-' 0 0
-. U-i0
-10Ci--' 4-(0 UUa'a a)C a --4 (4-I1.-4 '04-i
a -.- a)
a)U)>1UWOC nl-.-4a) 0'-'.0 0
Wa1
C4J'H(0 0
a)
-U) C'a ::4.,a) a)C U)4.)
-'-4 --' 4-'(0
(64.104
a)
u ,-i a(6 c
0a)11) -'-1 .0(64-14-)
00)
a) .rlV
44 (4)4-' a) (U
'0 WU)C.r4 U)
WI)).1:: -'-4
'-4(6 C'-'
- '-4 (6a)
04.11-44-)C
.-' U)'a o.U) Q4)
-'-4'-400.14.104 '0(6 -'-4
'010a)U)
WE.1-I U)
Wa)ElU)
A64

0
4-,-'-4(I)
010(TI
.tPdP
• v-4 •
-'-4 04.14.)
01-I0411
4-44.)014
4-414i4'a4)4)
In>1a4.1a .r.4'-I>
.rI-I-)
'-44)
E 4-iO0 01-4
4-41-44)141
4.14-)-'-I 4)4-4_c: InWE
144) 4).0
0c
'.1 4-) '.4U)
1.10)4.) i4-J
01.,.V '4-i-Wa)i.c c:
04-' 0).0
'I) 0'O0) (0,-Ir4 ,-4 i
(Ti
U 'a4).
4)1414- 14 .(TIWo.c: tr-.-OE-i0>
-'.4 4)4).4-'. .c:lao) 01Wc:1.4 4)4)14 4) >1.4-) 4).0 C)c:> •'.
._4W -'-Iwo
4)04o
- :4_.1144)4)010.400 E c:
• '-l•-I 0 14>4-) OW(Ti--I .4-)
WV 04).0 4) Cl,
II-4. U)
-'-4'-'-4 4)
'a >0 0
.4-)4)E 01'O
-4 1w.c: 0
.0 -.-4(Ti'-44.)
U) .4.i 44.4lain4)4)E ti)
c:4-J
OW4)1.14-)>-.4 (TI4-)Q.'00U '.4 Q
4-1 4)4)0'
140'O
0
1-4 c:c:(Ti 04)
'a .-14)4.) c:
(I, tP-4 4)c:4)U)0 1-1 -'-4 U)•-4 U 1 'a4.1> (114•.-1 U 0 4)
(Ti-.4 0:1 .1.)
0 .-' (1) 1-i
4)- Wa)laU]
4J 0U) U) 4)-I*: 1.Q U
•-( (TI(fl4J0 (ii1-i '0(UI.'00
WOO
OU)wUI(04)
4.14.)(0(1)
0>4)-1 4.1 ..
04,-i 4-)U
r-'-I (TiU) (4 4)'4-1O.4J.0'-4 c:4J 01
a) c:E-.-i
'0 c: 4i
4)4)4)4)>4.11-1
-04)4)0' 4-) 4-)
U) Io-c: •.-e0
c:'a4-i4)0
,-I .4.)4) -'.4 14
O4J 4)a' o.o,-44.)E
-44-1 .L'O4-) 4)
a,CdP 'a.-4t1) c:
a' -'.0
4.400'(1) U)
• .-4 $-i -
4)w c .J-.1 (1) -4.0> U)Tj 4)4)4) c:,-414 14 4) --4
a) X>
4)000.c ' '4Jco'
'-4
c:0) 0 U) •.-4
(00 4).s: 1-4'(0.0 W'
0 -ii a'U)r-I -I
r-IC)(TI
>1(4)>1v 4)4.) 4) r4 U'.rI 41) .4.)>4,
(00)4.) >4-io 4)4)4)15(0
'a0
00)4)0•,-4 C) 4.) 4.)4c:4)u)•.1 r4
(ow--1 (0
4)O'I-i 4)'.l0 0). 4)10>4-lu)
4)'4-4 4-10 0
( -rl
(U0) 10
4) (4)'U 01(014 a)oc:.Q0-'- 11)04)4) 4).4-4 0' 14C4
4)4.) (4)444.) E 10
(04-)'O-a) (4) c:
(P4)4)40U) 0'> Qi•,ia' . '-) C
Q ..-4 4) 4.)
W >1' E'-1
a)c: C)
U)
O.-4
4) 4.)3 (fl4
4) -i-I
0) .0'4
In
.5-4 0o r44.14.)
4) .'.4(flW(5 0 ri
4-, (P01o C.)4) 44vo
4-)
40 4) -'.1
4) .5-4 .4,4.1.4.)
0100(1)0144) 0''a
(A4)4-11.40
IW4.) 'aU)-'-) 4)o'.'0 (1)4.1,-i c:v 40
014) 04X144)
4Ø4J 1.4
-v c4,4)0)(fl.0 a)-iE I-i4.)04)4)C W.Q0(1)04)4-)11)440
a)'4-4 '4-40) (4)4-i
4) 4)
0V
(04.) -
.- a)1-1 U) U)oa
-404)-U 'a•rI 4)'HC4404)0 • '-4 4)
U)U)win.0 i
E>iO 4).000'
In'OW4)014)
'04)4)
,-104JWX1411)
5-C)to
4) Ca''0 s0'-lVV -C
Ii) (UCa) C0-4 4) 4)
-'-4 C IT)'01.44)440) P- 4)(no >4)4) >iW
'-I
A65

-øti_I
'-4Wa).0(1)
'U
(U.4'-40
0.1'O004
.4-)00
>1
(U,0k
4-)
0(1)
-'04r1(U0
4-)
'0.-i
004-1 r1
4-)
(U4i
4.).1.1(1)
(U a)
0 (U4.1(1) .,-I(U'ti
0 04
1ir1 Q)
0U)
a)U)>Q)0
• rl 4.)V
(U4i04xW(UrI
.0(U
'-4
hi>
a)
4J40
WEU)'UWWE-4000
0.4-i'00
U)E0
4-I>1'WU)
E.c: •.-i
U)H'-4
> a)>iW.'4r14.1'0 0
0.L: c001(0a)(I).4i
00L4J
>1'-4
Ca)ri>
r44.)-'-4
U)U)WOU)Q4'UQ)
• '-I OU)a)
I-i.4)
U)
OW.00(0 .-4
1.-I
04
(1)41Ø)
W (U U)E.0 a)a)
0 iC 4-i
-.1-Io WV
C
0E04
(U
a)
a) o:
(U r1
U)4J a)
>1- ri U)r4'0 'U
VW
-'-4 040.CXC
a) .'-1
'4 >1(U '-4
4.14-io:4(U
'0C
U)04Wa)U)V(UCa) .riI_I0CU)r1 i
>i4-4.)r4'0
r4 (U4.)0
(U
C>
0 ri--44.14.) -rI.-4 4-iWa)
-'-4 04
010
00
'0
VU)
CC
(U r1
E
01
Eci01
(Ti C '-i
OW- 'Ti
.0 -.-1 0
C
c r1
0 04U)U) ..-i
..- (U U)N4 E
r1 04-4-.04
1-4(1)001-r-I r1
(U04)0
'4-I >1(U04-4-I
ri iU)>C4.) .r4 (U,-14J E
(U U)A1-i I-i . •.
a)> (U.0 OrIC41 a),-, 4.)
(U Va)4J4- a)
1.4 OE
(U 1-4
: >i0'04-i
01
C4-4 0r1 0 (1) C.)4ia)U) 4-I 1-i '-4
04-I (Ur-11.4WW (U
(U4.) ICUJO -
-'-4 C r-I4-i If
4.) coU) C (Ua'
00 '-4E CI
0..oWC N040Vm(U r4 (U
.C4-) U)1.4 (U (0'Oa) OIXI 0
04 •-'-I,-1 • 1-4
4-) .0O (U
i 0.1
>iU)4-i'O a) 1.-i1.-i EQ W 04-) 1..i 1-44.14-IU) .r-4 0 rI
V 4Q1Q(UCV(U0 4.)rlW1-(U 0
1-4 IVW.rl Ca).-'
Wa)01.-WE 01.0 C U)(U04-) (I)W(U W(001
>1.c: a)
(U (U .0 i_i E -'-4CC '-'a)44-i 'O .0
Wa)I-rI (1)4-i
C 4.) ) el (U 0•ri (U ) c 1-4 c
.C'UEi(U 4-i1.4 EC--i)-iri I 0 V •r44-1.-I rlCW
U)4.) a),'04-I W • r-4 Q44J
1.4 a) i -r4 a) 0•.-I1-44J::i 4.)
w ..-1 010014-i'0 0 t 1.404-i C 0 0(U-rIG) r11VO4W 1-Co >i(U4- (U
'00 0-'
a) Or-I U)W.4çr4.) 'V
0,-I4i(U 1.-I 1-i (U
V .Cri.0C 011-i 0(U(U . '-404 4-i
>,(U ,-_OQ
a)W>a) crC1-4,Q(U'-IV 0
.ri ,C(U-ri4-L-rl::$4-) U)'0O4-0104 -'-4OCOO (1)(U 4JWQ4
:1W'OVO 1-i4i 01
. • .-4 .o (U 0E-I'0'04-I 1.4 '0
Wu)
.C(U.1-i
>iU)f-lw4.)CcW(U'004CEWO040U)VCa)rI >
4.14-iU)0W(U4.)
>1Or-I.4-il-_i'(U
U)Oel rI
4.)CmOC
•1-4 1.4 IWU)C4J 1.-ia) CU)4) ..-4 4-)x 4.)a) (U
4-I040
U) 0rI i.04.11.4 P-I
:11.4 a)
4-1 0 -.-i
O I (U
\
(1)a)
(U4.l
0
Wa) 0
C0.Q4.l
(U
0.11.4 U)
:i >1(U 4.1
0404-I
1-I
f-I (U
a)OJr-r-I
.0COO)
0
0
-1
4.)U)
01
:1
0
V
C
0
A66

00\
'-.4en
0
III
>
a
0-1
4-)U)(a'-4
a)-C4-I
0'
-'-4
'0
'0a)0"1a)E
0
'0a)
-'.4
01
U(a
Ca)a)-Q
U)
-C
>1
(aDiE0UU,
.Ca)
>1
(aC0
-'-I4-)a)4-'UU)
'0
a)
4-'
4-10
4-)U)0E
U)
a)
a)Ua)s-I
4-)Ca)E4-)s-I(a01(i)W4.;
a)
IZU)a)
m
'4-'0
r--'--S
aDONO
-'-44J4JCuWa)In(s)a)110'
aDa, a'5.4 ,.-4
S.-)0)a)i.10)11CO
0. a)
'-4Wa,
-SC'aD0\s-I
0a"0'-4
I-1
o-4.5-4U s-I
00)-'.4
os..0
U
CO
Eu-)
-'-4
0-a,
'-4a,U•'.40000
0\
'-.4UC
A67
a)4-)(a
-'-4
140
01Ia
U)
(a
'4-4'4-1
0
U--I
a)U)(aa)
a)-C.4J
00'-4
s-ia)
0-'-I 4-)
-Ca)4J
U)>10(i)-4 E
04-)Dl..-,
a)a)-C
4-)0
.4-) 4)
oil)Qa)("4-)
U) '-Ia)
0(a'44
• .-i Ca)U)
Wa)
(jQ..Wa)
Di
0i>1
C
0000
0
U)
(aa)>1
0'-4
4-)U)(a.-4 'S
c
a)0.0 -'.4.4-) 4-)
(a
C..-, .0
VU
Wa)
r1
U
a)CD"a))-'
.0.-'
(a
0>1
0oil)
Ea))-'-COE-'4-4
'-4
a)
-'-4a)Ua)5-4
U)4)Ca)
-Ii
5-4
Dia)'0
01(i)C4Jr4 CWa)•.-. E4J4)5-lu)Wa)
'DC
(amC
010-P-I
r 4.)4-Ia)a))-'
5-4W(a -'-I
-a)
a)4-)--I
0)0
.4-)WU)-CoE.4
'-IIt,
C
C
0en
a)toa,
a)a)
ci)
Ina)
C0.)
a,
C-'-4Ua,s-Ia)
0
'-4a,U0
I-'
144OC
0-t'4 U
.-4 I.)a,
IOU)U
a) aD0) 0'a) .-15-4 S.-,
0)4-'5.411
0
0 oa)z

01
0'-I0
4-i
a)
4i
.'-i
U)
a)'0-'1
0
0
aD0
..a)>'
4-iOC.)
(00
'-Ico
4.)>
oc:>1 •'I
.rl'0(0
z .14J
00)0 0Q4
'-4(U
..
(0(0
>1>1c:a)(0>
-'-404-i4-)
4..)IU)0(0_-1 -
Q.la)
014-)
r1 01
0 '-4-'-1 )-i
-'-l'OU)o0.10)
01
i-lU)
>1o-1
00)4.lI-'-4 0r-4 .rl14-)
4.J -riOW:D -i-i
00140
04(0
U)
(U0)>1
14.10
0
a)'-IC-)>1U
a)'4-i-'-4i-I
4)C.):3'001-404
4.)U:3V01-i0.1
a)
0C.-)
'U
01'OV
(0'00
0 • U)wU)U)0)
'OWc:0) . -i-I
• ,-1 4.) (1)4-I-'1 •QU]U)
a) E
r1 (00)'04-i
4.)(0 U)
(U-I'4-I (00E0)U) .-. a)(U U)C) 4.)
C.)
•'-' '0 0—. 0
Q1 4J a)0)'-4 0)000)4-1>1>iI.i4-I 0000)o a)
0) 4-I4-I a) 01'-1r1 4 r4- 0 -i-s II EV4J
4.) .,-4C)
0 I-iV'0 0)00 >4
0 c4
0 0)
0) >1(0-.-i014-I 4)
(U- '-I Uoww
0)0) >4-1> ø.,(04-i.:
C/)I-'
F'
0u-Lr 0
0
0.0
cCo
.1 I Ir'l
cnrr
z0
F'
F'. F'u Z
I-'CID
aD
Fl F'aD
OH
4p-E1
0 ni
A68

. I
I-s.--
..
cI,
•c. -
'1%
'-4
ii
r ?%
'I
I...rl
'4Cd
.1
)
)
J
4
)
)
'II-I
-I
-IN
.-, •1
.4Cd
Cd
Cd
0f-I
I-Ip4
11
Cdp.000'440
Ca
z
'Cd
1J
1-I
•rl
0.
Cd.c:
I.'
0
S-I
I
0
.44
0
-)
Cd-c
r-.--
Cd4, CdCd Cd4-J U)
.0 Cd Cd
Cd
() ,1JJ
CdCd t44 i-( C))
L0 +4rII Q.
141 *Jr4 Iit44 Cd
d fwu
CdI cd 14•r Cd
-4b uI' 1.4 Cd
14P.
"SIougo
o ot-'Cd c)('4U Ci
Cd i-io
Cd S 0-4-.4)01' 0
144Cd
o OU#1(.4
1.. c'1
(tO
0 f 0.0 0
Cd rt (I Cd
0-4)
)-..-I r4C
Cd Cd
Cd U 4-. 1P..-4 4.4 l 0 4)
014 Cdo ci (t-d:
(.) . Wd)
'Cd
1414 0ri41 0 i-I 0
44
0.-I r4o cC'mcl 0+4
14)4.)
Cdo U U
ila
C.4.1-4'rICd Cd,-44-i
1411) 0.
Cd 0 U) 0.0
Cd Cd
A70

-CL. j
._2.-
r'-
a-.-.
.-. -
H1)
El
El
FI
-
-cC
E
C-E0
-1J
C--
A71

0
I-I0
.1
0
-10
10.rc10'0
4)
0
4)(5-4.
0r-1(5U
#4
5?'
(I?
014
14 ç..
4J
CC)"
.44 c)C)•150
0
14W
ClCl
0)0
C)140 P.
4J4.JCl.-1 (0
oWI--i"
44
(5
•0'-I
0
"-40(0
100
14
P.
4.)
140
'44
0
C
F.
9>-i #4-4
1-4(5
0(5
0)0
I
zi
t-p
V'-4(5
(5P.E0
C)
'I.'0
U
z
11
iJO
0•- E-4
1 Iik
'-4 >o
ii) ) 0
.L)I—I I)
,-i
oE- 144-) 0
o•. Ii 4)
O)#4a
.0 Wp-i #4
4) 4)V i- #1 .c1-4 .-4 4)0I) O)
044114 1 •.-4 Co Ol.
4.1 .0) li-I
•14 4)10 0 .1 4415 0
i' I
'I
-'.44)(54)
4'
0#4
4' 4-)
1-i
U
0) p4
CS
14(5
(5
00 (51403
in 0 10
'-I
A72

0'-4Li
0
0-4i-i
Ca,-•1
C)
--4Ca
--4
-1
I-
0
Il-a
C'J+
s.00\N.
N-
0-4
0'
r4-4
O'OC)
c- -at r-
,4c-4
-I
0
-4'-4
'-CIl-a
0'
-4
-- j-c-I
1-zr
-zr .-a
N-
-4'-4
i-a'-4-a
Cr
a)
04-i
0a)U)0
o -p
Ca II
Li 0D ',-4
i-i -z, CO
a) ta-I
E
C)
CaiJ
i-i
CO
--4
0
a)
U)
I-i
CflO)
i-i
a)
(1)0
a"
U)
Co
CO .-4
a-'
CO
r4- LicaoLiE-i0
Co
Co
C')
C)
C'
a) -4—4 C
i-i a)
U,
--4 a)U)
-I
C)-4
14
-ø-4
CO a)>
i-a
0
14
--4 -4
Ca
Ca Co
i-a
0
i-a Co
0
0 0"-4
-c
4-a
014
otl
a)
(1) Caa) a)
>Ca a)
Q) I-C
a) (4_Co
II I
A73

975 95 10
00982 000393 2-710-0506 0103 4610-216 0352 6-250434 0-71! 778
0831 I•15 9-241-24 164 10-64i6g 2-17 1202VIS 2-73 13362-70 333 1468
325 3 •94 1599
332
4-57 17-28
440 5-23 1855
501 5-89 1981
563
6-57 2 106
6-6
7-26
22-3169! 796
23-54867 24-77
823 9.39 25-99
8-91 10-12 27-20
9.59 10-85 28-4!
10z8
''.59 2962
1098
1234 3081
11-69 13-09 3 2-0!12-40 1385 3320
P •5
p I O03932 001003 007174 0207
5 0412
6 0-6767 09898
9 1•73
10 z-i6
II z6o
12 307
'3 3•5714 4•07
99
001570'OzOI01150-297
05540872124I209
2-563-05
3.574_I I466
15 460 523i6 514 58117 570 6-41i8 6-26 7-0119 6-84 763
20 743 8z621 803 89022 864 9•5423 926 102024 9-89 io86
6. CEll-SQUARE DISTRIBUTION
PERCENTAGE POINTS OF THE 2-DISTRIBUTION
5 2-5 I 05 0-I
384 5-02 6-63
788
10-83
599 7-38 9-21 io-6o 1381
781 935 1V34 1284 16-27
949 1P14 1328
1486
1847
1P07 1509 16-75 20-52
1259 1445 i6-8z 22461407 i6-oi 18-48
zo-z8
243 2
15-51 1753 20-09 2 1-95 z6iz
16-92 19-02 2167
23-59 27-88
1831 20-48 2321 25-19 2959
1968 21-92 24-73 2676 3126
21-03 23-34 2622 2830 32-9!2236 24-74 2769 2982 3453
2368 26-12 29-14 31-32 3612
25-00 27-49 3058 3280 3770
26-3 0 2885 32-00 34-27 39-25
27-59 3019 3341 - 3572 4079
28-87 3P53 3ç81 3716 42-31
3 0_I 4 3285 3619 3858 4382
31-41
34•! 7 3757 400O 45313 2-67 3 5 48 3893 4P40 46803392 3618 4029 4280 48273517 3808 4P64 4418 49733642 39-36 42:8 45-56 5118
25 10-52 11-52 13-12 1461 34-38 3765 4065 4431 4693 526z26 zi-i6 1220 1384 1538 3556 3889 41-92 45-64 4829 540527 11-81 ii88 14.57 16-15 3674 4011 43_Ic 4696 4964 554828 12-46 13-56 15-3! 16-93 37-92 4134 44-46 4828 5099 568929 13-12 14-26 i6-o 17-7! 39-09 42-56 45-72 4959 5234 5830
30 1379 1495 16-79 1849 4026 4377 4698 5089 5367 597040 20-71 22-16 24-43 26-51 i-8i 55-76 63-69 66-77 734050 27-99 29-71 3236 3476 63-17 6750 71-42 7615 7949 86-666o 3553 3748 4048 4319 7440 7908 83-30 88-38 9195 9961
70 4328 4544 4876 5P74 85-53 9053 95-02 100-4 104-2 112-38o 5117 5354 57_IS 60-39 9658 101-9 io6-6 112-3 116-3 !24890 5920 61-75 6563 69-13 1076 1131 ii8-i 1241 1281 1372
100 67-33 70-06 74-22 7793 ii8- 1243 129-6 135-8 140-2 1494
The function tabulated is x defined by the equation =
2vaF(v)f xe'dx. If x is a
variable distributed as x' with ' degrees of freedom. P/zoo is the probability that x x . For v-<Ioo,
linear interpolation in v is adequate.
Kruskal-Wallis test difference between cultural groupsas relates to capital structures of multinationals,H = 13.43 - significant at the 0.025 level.
A74

Probabilities(or Areas Under xt Distribution Curve'
.90 I .70 I .50 I .30 I .20
Values of x2 for Selected Probabilities
Example.d.f. (Number of degreesof freedom) = 5,the tail above x2 = 9.236
represents 0.10 or 10%of the area under thecurve.
se Given x2 Values)
10 I .05 I .02 J .01
d.f Values off
1 .016 .148 .4S5 1.074 1.642 2.706 3.841 5.412 6.635
2 .211 .713 1.386 2.408 3.219 4.605 5.991 7.824 9.210
3 .584 1.424 2.366 3.665 4.642 6.251 7.815 9.837 11.3454 1.064 2.195 3.357 4.878 5.989 17.779 9.488 11.668 13.277
5 1.6 10 3.000 4.35 1 6.064 7.289 9.236 11.070 13.388 15.086
6 2.204 3.828 5.348 7.231 8.558 10.645 12.592 15.033 16.812
7 2.833 4.671 6.346 8.383 9.803 12.017 14.067 16.622 18.4758 3.490 5.527 7.344 9.524 11.030 13.362 15.507 18.168 20.090
9 4.168 6.393 8.343 10.656 12.242 14.684 16.919 19.679 21.666
10 4.865 7.267 9.342 11.781 13.442 15.987 18.307 21.161 23.209
11 5.578 8.148 10.341 12.899 14.631 17.275 19.675 22.618 24.725
12 6.304 9.034 11.340 14.011 15.812 18.549 21.026 24.054 26.217
13 7.042 9.926 12.340 15.119 16.985 19.812 22.362 25.472 27.688
14 7.790 10.821 13.339 16.222 18.151 21.064 23.685 26.873 29.141
15 8.547 11.721 14.339 17.322 19.311 22.307 24.996 28.259 30.578
16 9.312 12.624 15.338 18.418 20.465 23.542 26.296 29.633 32.000
17 10.085 13.531 16.338 19.511 21.615 24.769 27.587 30.995 33.409
18 10.865 14.440 17.338 20.601 22.760 25.989 28.869 33.346 34.805
19 11.651 15.352 18.338 21.689 23.900 27.204 30.144 33.687 36.191
20 12.443 16.266 19.337 22.775 25.038 28.412 31.410 35.020 37.566
21 13.240 17.182 20.337 23.858 26.171 29.615 32.671 36.343 38.93222 14.041 18.101 21.337 24.939 27.301 30.813 33.924 37.659 40.28923 14.848 19.021 22.337 26.018 28.429 32.007 35.172 38.968 41.63824 15.659 19.943 23.337 27.096 29.553 33.196 36.415 40.270 42.98025 16.473 20.867 24.337 28.172 30.675 34.382 37.652 41.566 44.314
26 17.292 21.792 25.336 29.246 31.795 35.563 38.885 42.856 45.64227 18.114 22.719 26.336 30.319 32.912 36.741 40.113 44.140 46.96328 18.939 23.647 27.336 31.391 34.027 37.916 41.337 45.419 48.27829 19.768 24.577 28.336 32.461 35.139 39.087 42.557 46.693 49.58830 20.599 25.508 29.336 33.530 36.250 40.256 43.773 47.9621 50.892
Source From Stephen P Shao, Statistics for Business and Economics. 3rd ed. (Columbus. Ohio:Charles E Merrill 19761 p 790
A75

Note to Chi Square Distribution:
A chi square goodness-of fit test was applied to compare the sample for normality inthe distribution of the debt proportions. Thus, a significance test of the proportionswas used to determine whether the observed cases in the sample corresponded to anexpected distribution. The value of quantities of the sampling distribution [Sum(Observed Theoretical) / Theoreticall was calculated from the actual frequencies foreach cell. In comparing the observed data to the expected frequencies of thetheoretical model, the D/ E sample appeared to be representative of the populationeven at the 0.01 level, meeting the 0.05 criteria. This could not be said about R&D orgrowth.
There remained doubt however about the normality of the D/ E sample population Intesting the difference betqeen the observed sample mean m and the hypothesisedpopulation mean p, for sampling sizes of n = 10 or more, as is the case in the study (n =87), the means of the different DIE samples have an approximately Normaldistribution. But with the population distribution highly skewed, a Normalsampling distribution of the mean cannot be expected with n not being greater than100
On this basis, it would not have been appropriate to base the statistical analysis onthe analysis of variance (ANOVA), nor alternatively, the analysis of the co-variance (ANOCOVA), effectively an interactive analysis of the debt ratios, growthand R&D. When these sort of tests were run on an experimental basis, this provedinadequate and not in line with the aims of the study as set out (chapter I). In anyevent, this sort of measurement clearly would have been outside the quantitativescope of this study. The study, in compliance with the objectives as defined,specifically tests the D/ E ratios and cultural influences on international capitalstructure. Therefore, any results from additional experiments could only have addedto the qualitative interpretation. This is not the case and not necessary.
A76
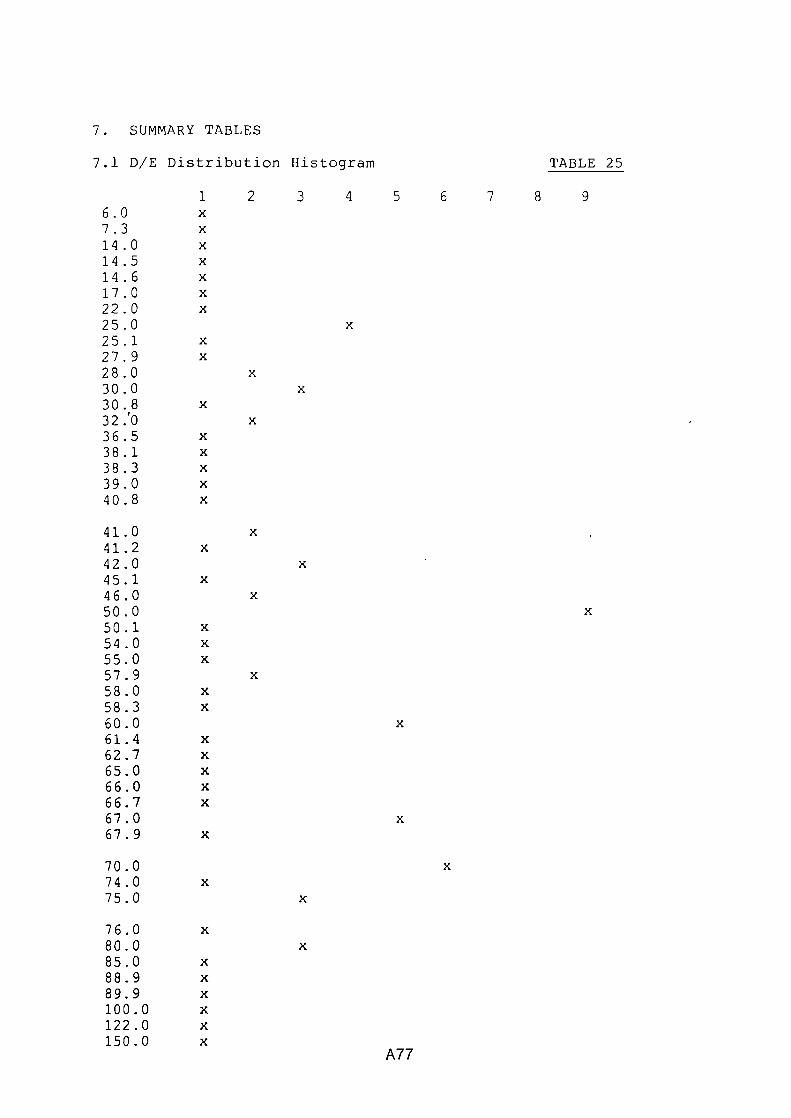
7. SUMMARY TABLES
7.1 D/E Distribution Histogram
1 2 3 46.0 x7.3 x14.0 x14.5 x14.6 x17.0 x22.0 x25.0 x25.1 x279 x28.0 x30.0 x30.8 x32.'O x36.5 x38.1 x38.3 x39.0 x40.8 x
41.0 x41.2 x42.0 x45.1 x46.0 x50.050.1 x54.0 x55.0 x57.9 x58.0 x58.3 x60.0
x61.4 x62.7 x65.0 x66.0 x66.7 x67.0
x67.9 x
70.074.0 x75.0 x
76.0 x80.0 x85.0 x88.9 x89.9 x100.0 x122.0 x150.0 x
x
x
TABLE 25
5
6
7 8 9
A77

<10 20 30 40 45 50 55 60 65 70 80 >90
2 4 9 10 7 3 11 6 7 9 11 9
A78

7.2 Growth Distribution Histogram TABLE 26
..........2.... 3.... 4.... 5.... 6
(20.2 ........x(13.3 ........x0.7 ........x0.0 ........0.8 ........0.9 ........3 .5 ........4.8 ........49 ........5.0 ..............x5 .2 ........7.0 ........7 .5 ..............x8.0 ....................9.0. ...................x9.1 ........9.5 ........10.0 .............................x
10.9 .........x11.0 .........x12.5 .........x12.9 ........x13.5 ........x13.8 ........ X
14.0 ........x14.5 ........15.0 .............................x17.0 ..............x17.5 ................... X
18.0 ........ X
18.3 .........x18.6 ........x20.0 ............................. X
21.3 .........X
21.5 .........x21.9 .........X
22.0 .........X
25.0 ............................. X
27.0 ........28.0 .........x29.5 ........30.0 .................................. X
31.0 .........x33.0 .........x34.0 .........x34.4 .........x35.0 ..............x36.0 ........x40.0 ..............x45.0 ........x50.0 .........x54.0 .............. X
68.7 .........x70.0 .........x
A79

>5.0.9
>10.0 14
>15.0 13
>20.0 13>25.0 ..............9>30.0 ..............8>35.0 ..................10>40.0 .........3>45.0 .........2>50.0 .........1<49.9 .........5
A80

7.3 R&D Distribution Histogram TABLE 27
2.... 3 .....4 ...........6 .....7 8
0.0 ............... K
0.15 .....x0.3 .....x0.4 .....x05 .......... K
0.7 .......... K
0.9 .....x1.0 ..........x1.2 .....x1.5..'..2.0 .......................... X
2.3 .....x2.9 .....x3.0 ............... K
3.3 .....x3.5 ..........x3.8 .....x4.0 ............... X
5.0 .......................... X
5.3 .....x5.4 .....x5.8 .......... K
5.9 .......... X
6.0 .......... K
8.0 ..................... K
8.8 .....x9.0 .....x10.0 ........................................... K
11.0 .....x11.5 .......... X
12.0 ............... X
12.5 .....x13.0 .......... X
14.0 .....x15.0 .......... K
15.6 .....x16.0 .....x17.0 .....x20.6 ..... K
25.0 ............... X
25.4 .....x30.0 .......... K
35.0 .....x35.6 ..... K
40.0 .....x48.0 .....x48.3 .....x75.0 .....x
A81

>2.0.15
>4.0. 14
>6.0. 14
>8.0.2
>10.0 ..........610.0 .....................8
>12.0 .....3
>14.0 ..........6>16.0 ..... 4>18.0 .....2
>30.0 ..........5>40.0 .....4<39.0 ..... 4
A82

TABLE 28
GRTH
17.017.09.8
22.120.719.641.817.716.0
R&D
12.58.7
11.76.3
10.79.2
21.416.56.4
R&D
21.46.3
10.79.2
10.7116.512.58.76.4
11.7
PL
66.459.459.851.552.8354 544.242 . 345.084.2
TABLE 29
GRTH
41.822 . 120.719.619.3517.717.017.016.09.8
7.4.2 Son-ed by Growth
Means (X)
07 Near East04 Japan05 Indian Peninsula06 Mid East
TOTAL08 Meditteranean Europe01 USA02 UK09 Africa03 Asia Pacific
R&D
21.416.512.511.710.7110.79.28.76.46.3
pJ-
66.454.544.284.252 . 8359.851.542.345.059.4
7.4.3 Sorted by R&D
Means (X)
07 Near East08 Meditteranean Europe01 USA03 Asia Pacific
TOTAL05 Indian Peninsula06 Mid East02 UK09 Africa04 Japan
TABLE 30
GRTH
41.817.717.09.8
19.3520.719.617.016.022.1
7.4 Geographical Classifications
7.4.1 Consolidated
Means (X) pf
01 USA
44.202 UK
42.303 Asia Pacific
84.204 Japan
59.405 Indian Peninsula
59.806 Mid East
51.507 Near East
66.408 Meditteranean Europe
54.509 Africa
45.0
TOTAL
52.83
10.71
19.35
A83

0307050408
06090102
7.4.4 Sorted by D/E TABLE 31
Means (X)
D/E
R&D
RTH
Asia PacificNear EastIndian PeninsulaJapanMeditteranean EuropeTOTALMid EastAfricaUSAUK
84.266.459.859.454.552.8351.545.044.242.3
11.721.410.76.3
16.510.719.26.4
12.58.7
9.841.820.722.117.719.3519.616.017.017.0
A84

69.359.855.254.552.8345.042.4
8.510.712.216.510.716.49.9
TABLE 35
17. 120.725.217 .719.3516.016.8
7.5 Cultural Classifications
7.5.1 Consolidated
TABLE 32
01 N. America and Anglo02 Pacific Asia03 Indian Peninsula04 Mid & Near East05 Med & S. Europe06 African
TOTAL
7.5.2 Sorted by rowth
04 Mid & Near East03 Indian Peninsula
TOTAL05 Med & S. Europe02 Pacific Asia01 N. America and Anglo06 African
7.5.3 Sorted by R&D
05 Med & S. Europe04 Mid & Near East
TOTAL03 Indian Peninsula01 N. America and Anglo02 Pacific Asia06 African
42.469.359.855.254.545.052.83
55.259.852.8354.569.342.445.0
54.555.252.8359.842.469.345.0
9.98.5
10.712.216.56.4
10.71
12.210.710.7116.58.59.96.4
16.512.210.7110.79.98.56.4
16.817.120.725.217.716.019.35
ThBLE 33
25.220.719.3517.717 . 116.816.0
TABLE 34
17.725.219.3520.716.817.116.0
7.5.4 Sorted by D/E
02 Pacific Asia03 Indian Peninsula04 Mid & Near East05 Med & S. Europe
TOTAL06 African01 N. America and Anglo
A85

70.070.070.070.070.070.0
67. 967.067.067.067.067.0
66.766.065 . 062 . 761.4
60.060.060.060.060.0
58.358.057. 957.955.054.0
13.08.0
10.013.012.010.0
48.030.025.030.040.04.0
9.08.0
12.50.152.3
12.010.010.011.53.5
10.05.3
35 . 61.5
11.55.4
15.010.08.0
15.030.035.0
21.315.040.070.030.05.0
30.00.0
30.00.9
34.4
20.020.025.017.018.0
18.69.54.97.5
25.050.0
030505050507
020307070709
0905030807
0506060608
020201040601
031111181703
191502111113
1817171902
0711040206
011611071511
030206040406010608
0203050804
110518020206081307
0419171101
2.02.0
10.00.7
15.65.01.0
16.010.0
0.73.06.03.50.4
10.017.520.027.017.030.00.8
28.030.0
10.910.025.03.5
12 . 9
150.0122.0100.089.988.985.080.080.080.0
76.075.075.075.074.0
TABLE 36Descending DJ F
Pt. Tn AtmajaLaura Ashley PLCKhurma Trading Est. LtdMarubeni CorpMitsubishi CorpHamlaan LtdAvon Products Co.Reserve Services LtdMegabyte Espana S.A.
Lonrho PLCLanka LloydS. R. Textiles LtdArtesia Foods LtdPentel ,Co.Deagu Financial and
Investment Co. - RoyalChemical Industry
Allied Ghee md. LtdS+J Associates LtdRoomi Enterprises LtdSine Enterprises LtdFouman Chimie S.A.
Noble Raredon PLCYong Lee Rubber Co.Kurtas A.S.Kutas A.S.Sunal A.S.Sawa - Pema Holdings
Musa LtdShaheen Cotton Mills LtdJerzina Group of Co.sCyprus AirwaysBufalo A.S.
S+S AssociatesEst. Fouad-Saccal S.A.Lashko Co. LtdPlastic Co. A.M. ZaghloulA. Marougas
Waverly Cameron PLCMarks & Spencer PLCH. J. Heinz Co.NEC CorpFalcon Gulf - Alam GroupThe Coca Cola Co.
A86

50.0510.1050.1050.050.0)
50.050.0510.0
46.045.142.0)42.0
41.241.10
41.0410.8
39.038.338.136.532.032.0
30.830.030.030.0
28.028.027.9
25.125.025.025.025.0
22.017.014 . 614.514.07.3
6.0
20)0.9
15 0)2050)
5.0)2036
8.0)3.00.52.95.95.94.103.3
10.55.10
48.35.8
25.417.035.0
0.10
20.61.05.85.0
25.00.08.8
0.08.0
15.03.0
11.0
10.00.31.26.0
12.014.0
25.0
0)71
171 55.10
25 109.10
20 10
5..28.10
10 0)15 0)210.212..521.922.1021.568.7
33.1018.3
31.054.014.5410.0)
9.109.0
13..535.054.0210.0
34.1023.513.3
9.145.0)25.108.0
17.5
7/54.8
13.811.014.0
15.0
190)4
0)2101117/
11171110)7/
04171Os0809031111
1810
110706010203
02081101
101407
0606131812
181515020702
02
Evergreen Marine Ccrp 03Risa1l Group 01Sinh Air Conditirur 05Ad-Gustoor LtdAxos EO'd Co.EarizLarLa A.S.
Circular Distributors Lt 03e1a Ltd 03
Mekan Investments Lt 03M::acsa Ca. Ltd 03
Al-Gasaihoi Group 0)6Wegal S.APlatignurt EEC 02Prcctor & Gamble Co. ClBritish Petroleum 02Id PLG 02Rothman's Int'l Inc. 02Husein Sugar Mills Ltd 05Kuwait Investment Autnoriry
- Kuwait Invsrt Office 06Reuters PLC 02
Guiness PLC 02Hitachi Ltd 04Davy Corp. 02Zavet Internaticnal Lod 09Lematic Overseas Ltd 06Rernalux Paints Co. 06
Rolls Royce PLC 02The Boots Co. 02
Grand Metropolitan PLC 02Zavet - Boy & Abotsi Ltd 09
The Walt Disney Co. 01Economic Insurance Co. Ltd 08Intertan Inc.-Tandy 01
Shahin Construction Co. 06Ribhi Darwazah & Sons Co. 06Cosmos S.A. 08Sawa Enterprises Ltd 09Star Paper md. Ltd 09
Al-Taher Ltd 06BPB Industries 02EEC Group PLC 02Lucas Industries PLC 02Digital Equipment Co. 01Mitsui Co. 04Singh Ranbij - Dhiman &
Sons Ltd 05
A87

DETAIL APPENDIX A
(Heinz)
A88
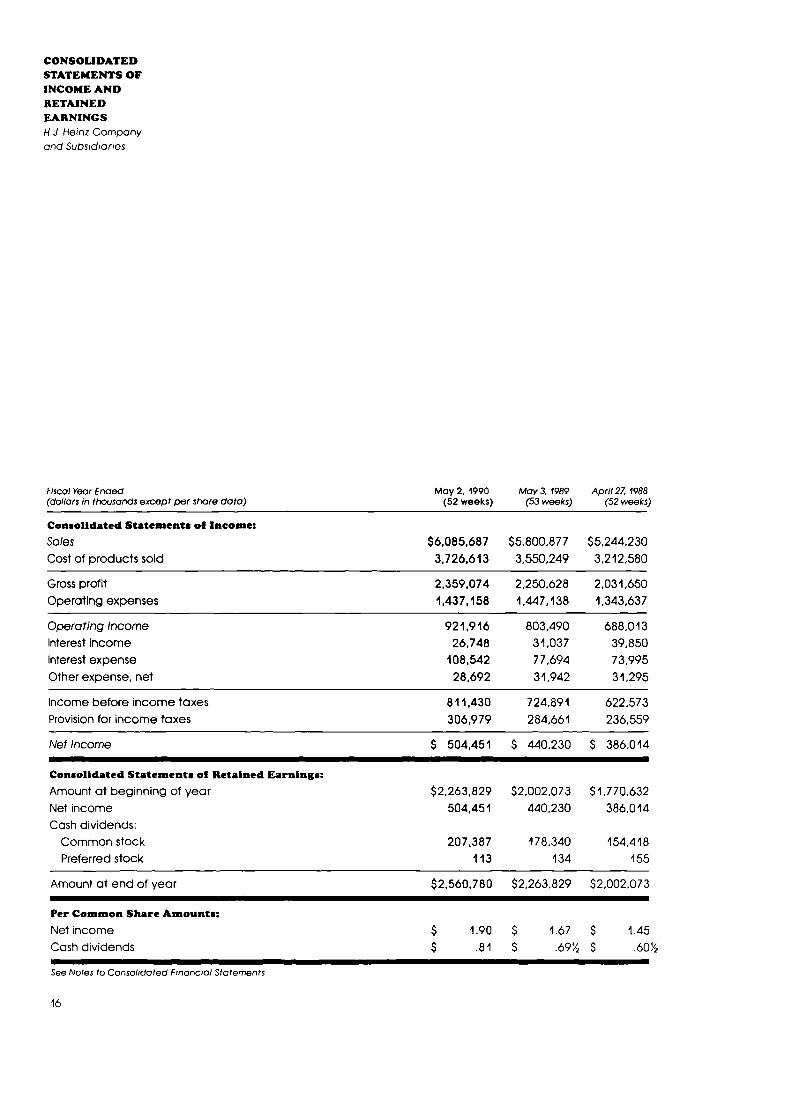
CONSOLIDATEDSTATEMENTS OFINCOME ANDRETAINEDEARNINGSH. J Heinz Company
and Subsidiaries
May 2. 1990 May 3. 1989 April 2Z 1988
(52 weeks) (53 weeks) (52 weeks)Fiscal Year Ended(dollars in thousands except per shore doto)
Consolidated Statements of Income:Sales
Cost of products sold
Gross profit
Operating expenses
Operating Income
Interest income
Interest expense
Other expense, net
Income before income taxes
Provision for income taxes
Net Income
$6,085,687
3,726,613
2,359,074
1,437,158
921,916
26,748
108,542
28,692
811,430
306,979
$ 504,451
$5,800,877
3,550,249
2.250.628
1,447,138
803,4903 1.037
77,694
31.942
724.891
284.661
$ 440,230
$5,244,230
3.2 12.580
2,031,650
1,343.637
688.01339.850
73.995
31,295
622.573
236.559
$ 386.014
Consolidated Statements of Retained Earnings:Amount at beginning of year $2,263,829 $2,002,073 $1,770,632Net income 504,451 440,230 386.0 14Cash dividends:
Common stock 207,387 178,340 154.418
Preferred stock 113 134 155
Amount at end of year $2,560,780 $2,263,829 $2,002,073
Per Common Share Amounts:Net income $ 1.90 $ 1.67 $ 1.45Cash dividends $ .81 $ .69Y2 $ .60Y
See Notes to Consolidated Financial Statements
16

DEfAIL APPENDIX B
(M&S)
A89

BALANCE SHEETSAlit MARCH lO
Notes Tnc Group The Company
itO 1989
I,N 198
(in Liii
Fixed assets
Tangible assets:
Land and buildings
Fixtures, fittings and equipment
Assets in the couisc of construction
Invest menu
Net assets of financial activities
2,0931 1,947 . 7 i,ns• 1,841'l
140'3 320'4 2925 276'7
31'3 15'8 is•7 15•3
12 l,445•5 2,283'9 2,271'I 2.133'l
13 - - 433•4 407'S
14 79'S 71'6 - -
2,545'3 2.355'S 2,710'S 2,540'6
Current assetS
Stocks 15 374'3 364'4 2U1 261'4
Debtors 16 254'7 192'6 4I3 443'Lc
Investments 17 l9• 13'9 It'I 13
Cashatbankandi:band 18 257 882 334 254
97 , 3 659'l 961'S 744'l•
Current liablUties
Creditors: amounu Iatiingdue within one year 19 912'S 743'l 7512 615'9
N.t current (Iiablltties)Iassets (excluding financial activities) (S'2) (84 '01 210'3 1282
Total au.ta less current liabilities 2,540'I 2,271'S 2,920'S 2,668'R
Creditors: amounts falling due alter more than one year 20 355'2 3437 2900 295'O
ProvIsIons for liabilities and charges 21 43 5. 1 - -
Netassits 2,I8O l,922'7 2630$ 2,373'b
Capital and res.rvsi,
CaIkdupsharecxital 22 615'O 669'6 75'0 669
Sharepremium.count 23 50'O 34'7 500 34'7
flevaluationrcscie 23 45S'O 456'S 479'4 479'4
ProfItandlossacrount 23 99l'6 7578 I,426'4 l,190'l
Sharehold.r,'lund 1,174'6 l,918'ó 2,30S 2,3738
Minority interesti 6'O 41 - -
Total capItal .mpiny.d 2,1S0' 6 I .9227 2,630 S 2,3738
A1ipris nt ('y tIm lI,, 1(1
14 1Ay I'J')(I
1 lmn I rI ItyImr( (1 IAlfl.'1AN
K ( ) arm, I 'NA N( l I lIlt t:i 11

DEI'AIL APPENDIX C
(Heinz)
A90

640,788 507.475
701,645
291,940
993,585
138,246
2.013,700
616.703
285.998
902.701
127.281
1.7 75. 186
38,690
498.833
1,958,016
2,495,539
927,787
1,567,752
40.394
440.832
1.702.880
2.184. 106
8 18.083
1.366,023
CONSOLIDATEDBALANCE SHEETSH.J. Heinz Company
and Subsidiaries
Assets (dollars in thousorids)
May 2. 1990 May 3. 1989
Current Assets:
Cash and cash equivalents
$ 125,817 S 102.605
Short-term investments, at cost which approximates market
115,264 135.124
Receivables (net of allowances of $8,564 and $9,660)
Inventories:
Finished goods and work-in-process
Packaging material and ingredients
Prepaid expenses and other current assets
Total current assets
Property1 Plant and Equipment:
Land
Buildings and leasehold improvements
Equipment, furniture and other
Less accumulated depreciation
Total property, plant and equipment, net
Other Noncurrent Assets:
Investments, advances and other assets 258.166 255,221
Goodwill (net of amortization of $51,694 and $38,413) 430,888 390.016
Other intangibles (net of amortization of $36,279 and $33,998) 216.945 215.361
Total other noncurrent assets 905,999 860,598
Total assets $4,487,451 $4,001,807
See Notes to Consofdc ted Financial Statements
18
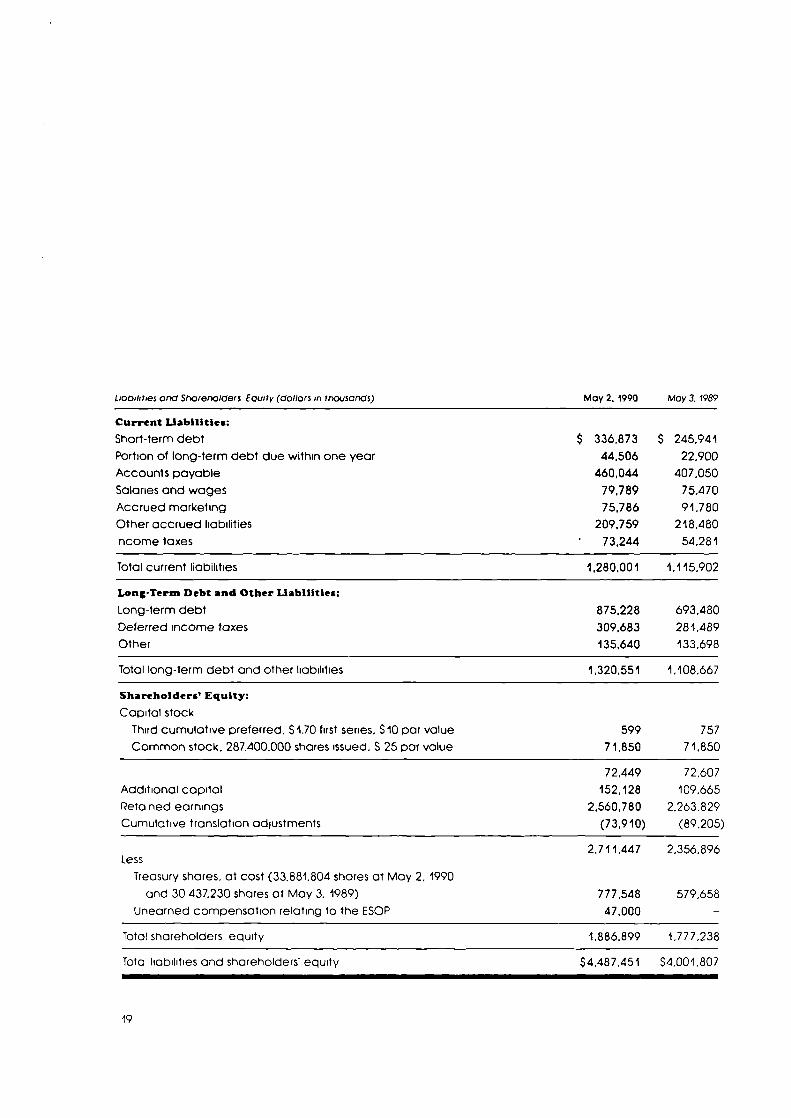
Moy 2. 1990 May 3. 1989
$ 336,87344,506
46004479,78975,786
209,75973,244
1,280.001
875,228309,683135,640
$ 245.94122.900
407.05075.47091.780
218,48054.281
1.115.902
693.48028 1.489133.698
1,320,551 1.108.667
Long•Term Debt and Other liabilities:
Long-term debtDeterred income taxesOther
Total long-term debt and other liabilities
Shareholders' Equity:
Capital stockThird cumulative preferred. S 1.70 first series, 510 par valueCommon stock. 287.400.000 shares issued. S 25 par value
Additional capitalPeta ned earningsCumulative translation adjustments
L:oDsl:taes and Shoret,oders EQUI?y (dollotS in thcusOn(jS)
Current liabilities:
Short-term debtPortion of long-term debt due within one yearAccounts payableSalaries and wagesAccrued marketingOther accrued liabilitiesncome taxes
Total current liabilities
599
757
71,850
7 1.850
72,449
72,607
152. 128
109.665
2.560,780
2.263.829
(73,910)
(89.205)
2.711,447
2.356.896Less
Treasury shares, at cost (33.881.804 shares at May 2, 1990and 30 437.230 shares at May 3. 1989) 777,548 579.658
Unearned compensation relating to the ESOP 47,000 -
Total shareholders equity 1,886.899 1,777.238
Tota liabilities and shareholders' equity $4,487,451 S4.001.807
19
DEfAIL APPENDIX D
(Platignum)
A91

1-latignum plc and its Subsidiaries
Group Profit and Loss Accountfor the year ended 31St March, 1990
5
6
B
9
9
le 1990
£000
22.576
(16,220)
6.356
5.535)
2
823
563)
260
260
( 11)
249
120)
129
2)
127
0.1 2p
Turnover
Cost of Sales
Gross Profit
Administrative expenses
Other operating income
Operating profit/(loss)
interest payable and similar charges
Profit/(loss) before taxation
Exceptional Items
Profit/(loss) on ordinary activities before taxation
Tax on profitl(Ioss) on ordinary activities
Profit/(loss) on ordinary activities after taxation
Extraordinary items
Profit/(Ioss) for the financial year
Dividends
Profit retained/(Accumulated loss)
Earnings/(loss) per ordinary share
1989(14 months)
£000
28.293
(20.885)
7,408
7.807)
132
267)
598)
865)
2,072)
2,937)
191)
3.128)
(1.791)
( 4.919)
(3)
(4.922)
( 2.24p)
The accounting policies on page five and notes on pages ten to sixteen form part of these financial statements.
SIX

DETAIL APPENDIX E
(Platignum)
A92

DETAIL AFPENDIX F
(DEQ
*93


DETAIL APPENDIX G
(Avon)
A94

4.584
5.231
3,509
7.215
45
8.094
12.491
7.105)
(10.880)
989
1.611
4.432
4,889
616)
(1.203)
( 40)
( 37)
3.776
3.649
10.19 1
10.19 1
112
112
448 448
6.975)
(7.102)
3 776
3.649
Platignum plc and its Subsidiaries
Group Balance Sheetas at 31st March, 1990
1990
1989
£000
£000
Fixed assets
Intangible assets
Tangible assets
Current assets
Stocks
Debtors
ash at bank and in hand
Creditors: amounts falling due within one year
Total assets less current liabilities
61
43
3.382
3.235
3.443
3.278
Creditors: amounts falling due after more than one year
Provisions for liabilities and charges
Capital and reserves
Called up share capital
Share premium accoui
rRevaluation reserve
Profit and loss account
The' anc ai s:a:er-en:s .',ere acc r .ec c :r Bc'c c' 27:r Ju 1990
S S Core" ac acei =
T"e accc: ro cc c es :'- oa;e .e -c ces ceces -ee- cart :'-ese ' '-ac al s;aerenS.
seven
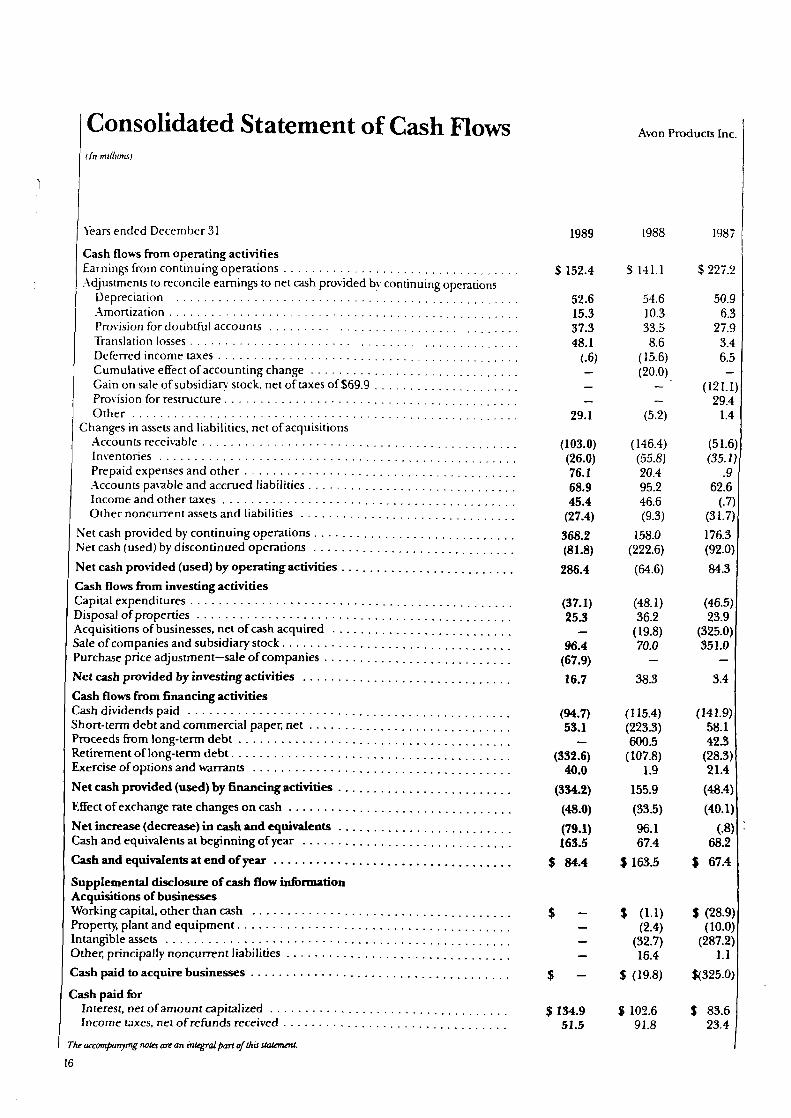
1989 1988
1987
$ 152.4 S 141.1
$ 227.2
52.6
54.6
50.9
15.3
10.3
6.3
37.3
33.5
27.9
48.1
8.6
3.4
(.6)
(15.6)
6.5(20.0)
(121.1)29.4
29.1
(5.2)
1.4
(103.0)(26.0)76.168.945.4
(27.4)
368.2(81.8)
286.4
(146.4)(55.8)20.495.246.6(9.3)
158.0(222.6)
(64.6)
(51.6)(35.1)
.962.6
(.7)(31.7)
176.3(92.0)
84.3
(37.1) (48.1) (46.5)
25.3 36.2 23.9
- (19.8) (325.0)
964 70.0 351.0
(67.9) - -
16.7 38.3 3.4
(94.7)53.1
(332.6)40.0
(334.2)(48.0)
(79.1)163.5
$ 84.4
(115.4)(223.3)600.5
(107.8)1.9
155.9
(33.5)
96.167.4
$ 163.5
(141.9)58.142.3
(28.3)21.4
(48.4)
(4.1)
(.8)68.2
$ 67.4
$ -
$ -
$ 134.951.5
$ (1.1) $ (28.9)
(2.4) (10.0)
(32.7) (287.2)
16.4 1.1
$ (19.8) $(325.0)
$ 102.6 $ 83.691.8 23.4
Consolidated Statement of Cash Flows(In mzllwns;
Years ended December31
Cash flows from operating activitiesEarningsfrom continuing operations ..................................Adjustments to reconcile earnings to net cash provided b y continuing operations
DepreciationAmortization..................................................Provisionfor doubtful accounts .................................Translationlosses ............................................Deferredincome taxes ...........................................Cumulative effect of accounting change ..............................Gain on sale of subsidiary stock, net of taxes of $69.9 .....................Provisionfor restructure ..........................................Other.......................................................
Changes in assets and liabilities, net of acquisitionsAccountsreceivable .............................................Inventories...................................................Prepaidexpenses and other .......................................Accounts pa y able and accrued liabilities ..............................Incomeand other taxes ..........................................Other noncurrent assets and liabilities ...............................
Net cash provided by continuing operations .............................Net cash (used) by discontinued operations .............................
Net cash provided (used) by operating activities .........................
Cash flows from investing activitiesCapitalexpenditures ..............................................Disposalof properties .............................................Acquisitions of businesses, net of cash acquired ..........................Saleof companies and subsidiary stock .................................Purchase price adjustment-sale of companies ...........................
Net cash provided by investing activities ..............................Cash flows from financing activitiesCashdividends paid ..............................................Short-term debt and commercial paper, net .............................Proceedsfrom long-term debt .......................................Retirementof long-term debt........................................Exerciseof options and warrants .....................................
Net cash provided (used) by financing activities .........................Effectof exchange rate changes on cash ................................
Net increase (decrease) in cash and equivalents .........................Cash and equivalents at beginning of year ..............................
Cashand equivalents at end of year ..................................
Supplemental disclosure of cash flow in.thnnationAcquisitions of businessesWorkingcapital, other than cash .....................................Property, plant and equipment .......................................Intangibleassets .................................................Other, prindpally noncurrent liabilities ................................Cashpaid to acquire businesses .....................................
Cash paid forInterest, net of amount capitalized ..................................Income taxes, net of refunds received ................................
The accompanys7g no its are an iniegral pan of thu slalemenL
16
Avon Products Inc.

DEFAIL APPENDIX H
(P&G)
A95

$ 2,035 $ 1,669
350 466
1,690 1,365
445 523
897 633
5,417 4,656
3,588 3,698
706 447
1,258 1,335
1,000 1,000
346510
44(963)
6,581
7,518
$18,487
16252(63
(1,00C5,587
6,21
$ 16,35]
Consolidated Balance Sheet
The Procter & Gamble Company And Subsidianes
June 30 (Millions of Dollars)
AssetsCurrent Assets
Cash and cash equivalentsAccounts receivable, less allowance for doubtful accounts of $29 in
1990 and $24 in 1989InventoriesPrepaid expenses and other current assets
1990 1989
$ 1,407 $ 1,587
2,647 2,090
2,865 2,337
725 564
7,644 6,578Property, Plant, and Equipment 7,436 6,793Goodwill and Other Intangible Assets 2,594 2,305Other Assets 813 675
Total $18,487 $16,551
Liabilities and Shareholders' EquityCurrent Liabilities
Accounts payable - tradeAccounts payable - otherAccrued liabilitiesTaxes payableDebt due within one year
Long-Term DebtOther LiabilitiesDeferred Income TaxesShareholders' Equity
Convertible Class A preferred stockCommon stock - shares outstanding:* 1990-346,294,159;
1989-323,980,8 16Additional paid-in capitalCurrency translation adjustmentsReserve for employee stock ownership plan debt retirementRetained earnings
Total
Adjusted for two-for-one stock split effective October 20, 1989
See accompanying Notes To Consolidated Financial Statements.
24

DETAIL APPENDIX I
(Coke)
A96

1990 1989
S1,429,555 $1,096,020
62,569 85,671
1,492,124 1,181,691
913,54138,199
982,313716,601
4,142,778
768,33552,093
789,077812,304
3,603,500
666,847569,057788,718128,119321,977
2,474,718
695,195524,931710,297140,520354,881
2,425,824
Consolidated Balance Sheets(Dollars in thousands except share data)
December 3L
Assets
CurrentCash and cash equivalentsMarketable securities, at cost (approximates market)
Trade accounts receivable, less allowances of $29,510in 1990 and $14,347 in 1989
Finance subsidiary— receivablesInventoriesPrepaid expenses and other assets
Total Current Assets
Investments and Other AssetsInvestments
Coca-Cola Enterprises Inc.Coca-Cola Amatil LimitedOther, principally bottling companies
Finance subsidiary— receivablesLong-term receivables and other assets
Property, Plant and EquipmentLand 147,057 146,482Buildings and improvements 1,059,969 9S0,2S1Machinery and equipment 2,204,188 1.890,960Containers 374,526 307,012
3,785,740 3,294,705Less allowances for depreciation 1,400,175 1.273,486
2,385,565 2,021,219
Goodwill and Other Intangible Assets 275,126 231,993
$9,278,187 $8,282,536

$1,576,426 $1,386,516
161,4321,742,179
97,272719,182
4,296,491
535,861
332,060
264,611
184,6911,234,617
12,858839,248
3,657,930
548,708
294,358
296,055
75,000 300,000
420,244512,703
6,447,576(67,760)
4,031
7,391,794
418,910437,324
5,618,312(45,892)(7,206)
6,721,448
TIlE COCA-COLA (ON PA NT AND SU ISI Dl All IS
December 31, 1990 1989
Liabilities and Shareholders' Equity
Current
Accounts payable and accrued expensesLoans and notes payable
Finance subsidiaryOther
Current maturities of long-term debtAccrued taxes
Total Current Liabilities
Long-Term Debt
Other Liabilities
Deferred Income Taxes
Shareholders' Equity
Preferred stock, $1 par value—Authorized: 100,000,000 shares; Issued: 3,000 shares of Cumulative MoneyMarket Preferred Stock in 1990 and 1989; Outstanding: 750 shares in 1990;3,000 shares in 1989, stated at aggregate liquidation preference
Common stock, 5.50 par value—Authorized: 1,400,000,000 shares; Issued: 840,487,486 sharesin 1990; 837,819,578 shares in 1989
Capital surplusReinvested earningsUnearned compensation related to outstanding restricted stockForeign currency translation adjustment
Less treasury stock, at cost (172,248,315 common shares in 1990;163,789,772 common shares in 1989) 3,542,630 3,235,963
3,849,164 3,485,485
$9,278,187 $8,282,536
See Notes to Consolidated Financial Statements.