Corporate Leverage, the Cost of Capital,and the Financial Crisis in Latin America
31
www.depeco.econo.unlp.edu.ar Departamento de Economía Facultad de Ciencias Económicas Universidad Nacional de La Plata Serie Documentos de Trabajo Corporate Leverage, the Cost of Capital, and the Financial Crisis in Latin America Ricardo Bebczuk y Arturo J. Galindo Documento de Trabajo Nro. 85 Mayo 2011 ISSN 1853-3930
Transcript of Corporate Leverage, the Cost of Capital,and the Financial Crisis in Latin America
www.depeco.econo.unlp.edu.ar
Departamento de Economía
Facultad de Ciencias Económicas
Universidad Nacional de La Plata
Serie Documentos de Trabajo
Corporate Leverage, the Cost of Capital, and the Financial Crisis in Latin America
Ricardo Bebczuk y Arturo J. Galindo
Documento de Trabajo Nro. 85
Mayo 2011
ISSN 1853-3930
Corporate Leverage, the Cost of Capital, and
the Financial Crisis in Latin America
Ricardo Bebczuk
Arturo J. Galindo1
Marzo 2011
Abstract
Using a quarterly dataset of 185 listed firms in six Latin American countries
between 1993 and 2009 we find that leverage is positively related to tangibility,
firm size and the market to book ratio, and negatively related to profitability. The
average cost of debt is negatively related with size, tangibility, firm growth, the
leverage ratio, and the ratio of long- to short-term debt and positively to
profitability. We find that the recent international crisis did not have a significant
impact on the set of firms in our sample, but affected the way in which leverage
and the interest to debt ratio relate to firm fundamentals. In particular we find
that the links between leverage, tangibility and profitability were strengthened,
and that financial constraints were not increased during the crisis.The evidence is
consistent with a flight-to-quality phenomenon in favor of big, listed firms.
Key words: Corporate leverage, cost of debt, financial crisis, Latin America.
JEL codes: F3, G01, G3, O54
1 Bebczuk: Department of Economics, Universidad Nacional de La Plata. Galindo: Research Department, Inter-
American Development Bank. This document reflects the views of the authors and not of the institutions for whom
they work or their Board of Directors. The authors thank Mauricio Pinzón, Máximo Sangiácomo and Emmanuel
Vázquez for superb research assistance. Contact information: Bebczuk: [email protected]; Galindo:
1. Introduction
A direct consequence of the recent subprime crisis has been a pronounced deleveraging
process of the corporate sector. For instance, U.S. non-financial corporate debt, which had been
growing at an average annual rate of 8.8% over 2004-2008, fell by 1% in the first semester of
2009. In Latin America, bank credit granted to the non-financial private sector virtually
stagnated in 2009 after growing at annual rates of between 20% and 30% during 2007-2008.
While the causes of this phenomenon have been thoroughly studied, its corporate-level
implications for Latin America are yet to be adequately explored. The present study aims to
provide a first assessment of how the liabilities side of corporate balance sheets was hit by the
recent crisis.
Specifically, we seek to establish whether the recent macroeconomic developments have
any explanatory power on the variation in financial debt and its cost over and beyond the
standard microeconomic factors identified by the capital structure literature. We apply this
framework to a panel of 194 listed firms from Argentina, Brazil, Chile, Colombia, Mexico and
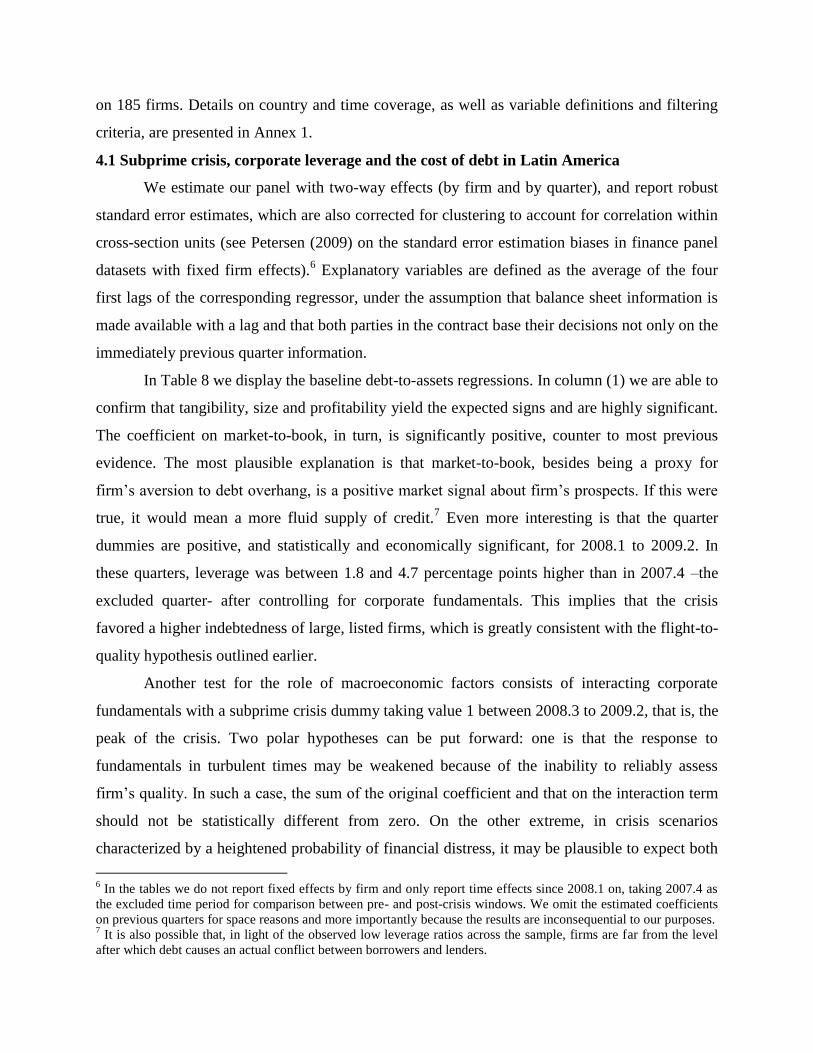
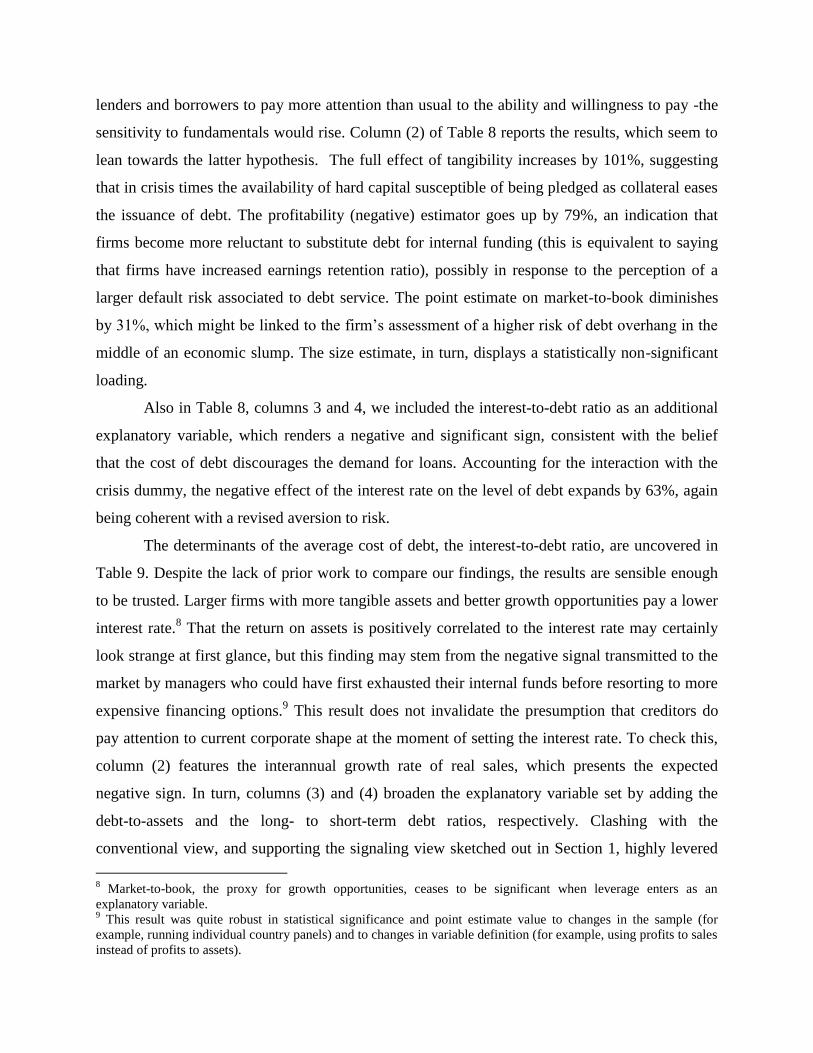
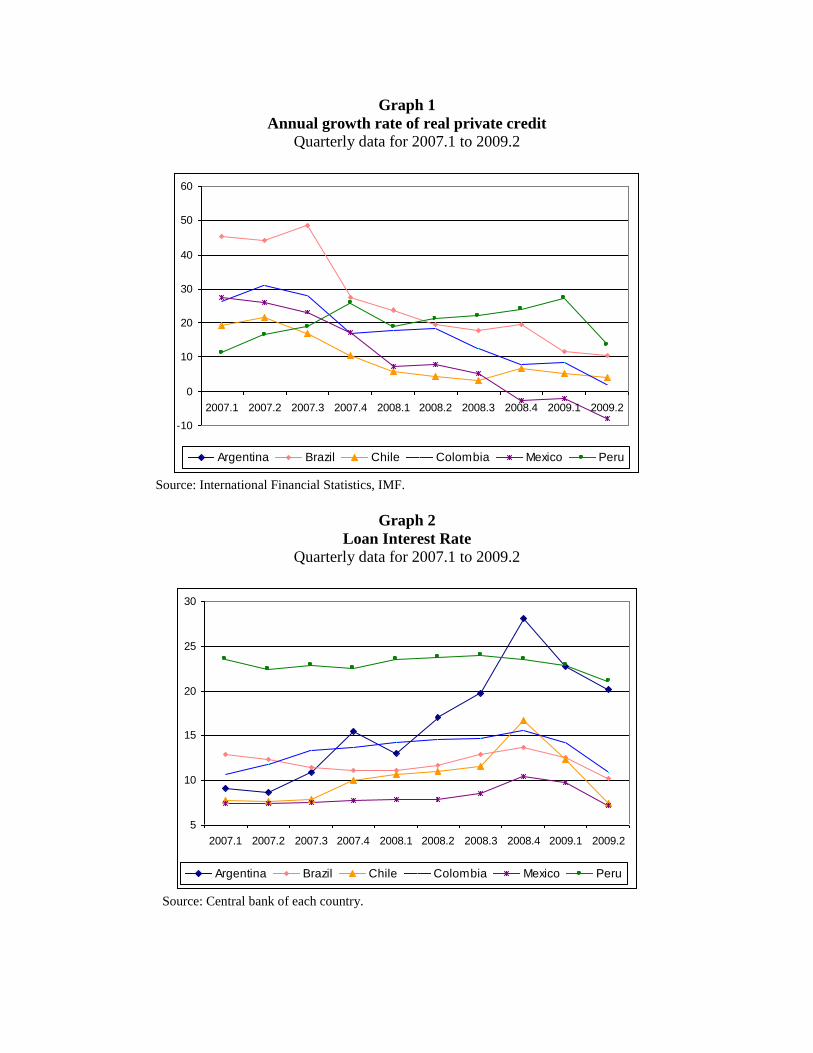
Peru using quarterly data spanning 1993.1 to 2009.2. To put our work into its macroeconomic
context, Graphs 1 and 2 show the real growth rate of private credit and the loan interest rate in
the six countries studied with quarterly data spanning the period 2007.1 to 2009.2. They visibly
demonstrate that, with the possible exception of Peru, financial conditions began to deteriorate in
mid-2007 with a peak in the last quarter of 2008 and an incipient stabilization taking place since
early 2009. Credit growth took a larger toll early during this interval and interest rates escalated
especially over 2008. However, it should be noted that the apparent outcome of the subprime
crisis, as far as the volume and cost of credit is concerned, was somewhat mild and short-lived
compared to past crises in the region. For instance, credit growth lost pace but didnot go into
negative figures with the exception of Mexico. Whether these features are picked up by our
corporate dataset, and to what extent they obey to changes in micro fundamentals, is our driving
research question.
Along with the treatment of a fresh and unexplored event, our paper brings about several
innovations. In the first place, we make use of quarterly data frequency in a multi-country panel
regression approach, which departs from the annual, country-specific data typically found in the
literature. But more importantly, we move a step further by examining the dynamics and
determinants of the cost of debt, thus adding the price dimension to the quantity analysis around
which capital structure research revolves. Although neglected by prior studies, one may want to
know whether changes in the perceived willingness and ability to pay translate into changes in
the cost of debt or merely its availability. As the cost of debt constitutes a key transmission
channel from macroeconomic shocks to the corporate sector, with a direct bearing on firms’
growth and probability of default, a better understanding of its drivers should be welcome. In this
sense, one would like to check whether the explanatory variables behind the leverage ratio also
predict movements in the ratio of financial expenses to debt (the average interest rate charged on
the firm’s debt). In a related vein, the question arises as to whether the sensitivity of both the
leverage and the interest rate to corporate fundamentals changed during the recent crisis.
An appealing feature of the subprime crisis for research purposes is that it stands as a
purely exogenous shock on the corporate sector, and even more so for Latin America – after all,
the crisis had its origin in the U.S. housing sector. In inquiring about the influence of financing
factors on real investments, it is extremely difficult to disentangle supply and demand forces. For
instance, a given observed contraction in real assets may be forced by the withdrawal of lending
flows by their suppliers or to a voluntary corporate decision to stay aside from the credit market
after the reevaluation of expected cash flows in the midst of an economic downturn. Even an
exogenous credit supply shock like the one taking place since 2007-2008 may have reshaped the
demand for funds in response to a widespread wave of pessimism. Notwithstanding, we can
exploit the fact that the pre-crisis debt maturity structure is independent of the largely unforeseen
subsequent tightening of credit conditions. In such circumstances, firms with an ex-ante large
portion of short-term debt relative to long-term debt, unable to roll-over their credit lines, should
have been forced to reduce real assets by a larger amount (or to pay a higher interest rate) than
otherwise similar firms but less exposed to short-term debt. Using a matching estimator, we
should be able to identify the effect of the credit supply shock on corporate investment.
The rest of the paper is structured as follows. In Section 2 we briefly review the literature
to set the ground for the description of major country trends of the variables under study (Section
3) and for the discussion of the econometric findings (Section 4). In Section 4 we also develop
the analysis linking corporate debt and real assets around the crisis. Conclusions and policy
prescriptions emanating from the analysis close.
2. Literature review
The way in which firms set their leverage policies has been a core corporate and policy
issue ever since the celebrated Modigliani-Miller (MM) theorem established the backbones of
modern finance (see Miller and Modigliani, 1958). The canonical MM theorem contends that the
blend of debt and equity is irrelevant for the maximization of corporate wealth. However, this
result directly follows from the naïve model assumptions, i.e., there exist no taxes, transaction
costs, or informational frictions. Under this setting, it is only natural that all financing sources
have an identical cost for the manager, making the analysis of debt choices trivial. The very
Modigliani and Miller (1961) subsequently lifted the first and second assumption by putting
forward the so-called “tradeoff theory”, according to which an interior solution comes up from
weighting the benefit of a higher debt volume and the associated tax deductibility of interest
payments against the cost of paying a higher interest rate -which discounts the expected legal and
accounting bankruptcy expenses.2
The sharpest insights into the determinants of capital structure, though, have been
provided by the asymmetric information approach to corporate finance. We can group these
theories according to the form of asymmetry breaking the irrelevance between debt and equity.
The adverse selection-based model advanced by Myers and Majluf (1984), popularly known as
the pecking order model, states that there is a financial hierarchy comprising, in descending order
of preference, own funding, secured debt, unsecured debt, and outside equity. Own funds, or
retained earnings, are the least expensive source of finance, since by definition they are free from
the usual insider/outsider disputes. At the other extreme, what turns equity into the most
expensive source is that the market, in its inability to distinguish across observationally similar
issuers, undervalues high-return projects in favor of low quality projects.3,4 On the other hand,
moral hazard-based models stress that firms with good investment opportunities may find it
2 Miller (1977) revisits the tax argument by introducing the personal tax rate into the picture. In brief, his point is
that corporations may be able to circumvent the tax burden on interest payments, but creditors will not. And since
the latter, in the pursuit of their desired net return, will charge a gross interest rate inclusive of these taxes, the
ultimate tax advantage or disadvantage for the borrower will rely on the wedge between the corporate and the
personal tax rate on interest. In particular, unless the former exceeds the latter there will be no net tax benefit of
debt. 3 Secured debt has a lower cost than equity because the informational premium on good projects is lessened, in a
debt contract, when the project promises partial payments in case of default (by posting collateral or by committing
positive project’s cash flows) 4 A pecking order can be generated in a simpler way by focusing on intermediation costs and regardless of
informational aspects. Self-finance bears no intermediation costs, an thus they lie at the bottom of the financing cost
ladder, whereas debt (especially, bank debt) typically has lower issuance costs than equity.
beneficial avoiding a heavy reliance on debt and the prospective conflicts of interest between
shareholders and creditors (see Myers (1977)). In particular, the larger the leverage, the more
likely it is for the firm to pass up profitable projects (the debt overhang model) and to lean
towards riskier endeavors (the asset substitution model). Counter to this prescription, the agency
problem between managers and shareholders, another manifestation of moral hazard, calls for a
substitution of dividends for new debt as a way of disciplining opportunistic managers in control
of free cash flows (see Jensen (1986)).
This collection of theories has direct testable predictions that have been exploited in a
flourishing empirical literature. Rajan and Zingales (1995) is a leading contribution in the
literature, as their model managed to isolate a small number of explanatory variables that have
proven to be quite robust in successive applications to different cross-section and time samples
across the world. Frank and Goyal (2007, 2008) confirm the robustness of Rajan and Zingales’
specification. For developing countries, applied work in this area includes, among others, Booth
et al. (2001), Mitton (2006) and, in relation to some Latin American countries, Galindo and
Schiantarelli (2003).
Four candidate variables are usually posited as key explanatory variables in determining
firm’s financial behavior: (a) Firm size: Larger firms tend to be more diversified, older and more
reputable, all of which amounts to diminishing the risk of default and the corresponding costs. In
addition, these firms typically have better and more transparent accounting systems, an asset in
the face of informational frictions vis-à-vis the creditors. As a result, theory and empirics concur
in a positive link with leverage; (b) Profitability: On one hand, profitable firms are expected to
be less leveraged as they are able to replace external finance with their own resources, in line
with the pecking order theory. But on the other hand, well-performing firms face lower expected
bankruptcy costs and enjoy larger tax shields, reducing the cost of debt. All in all, the theoretical
prediction is ambiguous, although accumulated empirical estimations support the negative nexus
between leverage and profitability; (c) Market-to-book asset ratio: Firms with valuable growth
opportunities are likely to steer clear of excessive debt so as to defuse beforehand a potential
misalignment of interests with their creditors that might cause debt overhang and asset
substitution. Along the same lines, growing firms are less prone to suffer from the agency
problems caused by free cash flows, and thus the need for debt is less pressing. This all comes
down to the negative relationship between leverage and the market-to-book ratio that has been
uncovered in numerous studies; and (d) Tangibility: The ratio of fixed to total assets is a proxy
for the availability of collateral. Since in the presence of adverse selection the posting of
collateral reduces the cost of debt for lower risk firms, more tangibility is associated with more
leverage. Furthermore, hard capital makes it easier to value and monitor borrower activities, with
a positive impact on bankruptcy costs and the mitigation of agency problems.
As commented earlier, despite appearing as a natural extension of the above research
program, we have no knowledge of scholarly work on the role of corporate fundamentals on the
cost of debt (see, however, Binsbergen, Graham and Yang (2009) for an estimation of the
marginal cost curve for U.S. firms).5 While the amount of debt is decided by the firm -
conditioned to the lenders’ disposition to meet such demand-, it is the suppliers of capital who
unilaterally set the interest rate, based on overall interest rate conditions, the degree of market
competition and, last but not least, the expected probability of repayment. The latter should be
certainly responsive to some of the very fundamentals explaining leverage. In particular, larger
and more profitable firms with more tangible assets and growth opportunities should in principle
be expected to be offered more benign loan terms.
However, it is well known that, under asymmetric information, signaling plays a major
role in financing transactions (see Bebczuk (2003), Chapter 3). This implies that some common
wisdom in corporate finance may be challenged when it comes to explaining the cost of debt. For
example, a larger leverage ratio may increase repayment risk and thus the required interest rate
on the firm. Nonetheless, an initial high leverage signals new lenders that the firm has been rated
as trustworthy by previous creditors. Under this alternative hypothesis, more levered firms may
be charged lower interest rates. A similar argument applies to the term structure of debt: while
longer term debt should normally be associated to a higher interest rate, the ability of the firm to
obtain long-term finance signals its good stand in the investors’ eyes.
Invoking this signaling approach, profitability may no longer entail lower interest rates.
According to the pecking order theory, self-finance is by far the least onerous source of funding,
as it minimizes intermediation costs and the informational premium. Whenever a profitable firm,
able to rely on own funds, asks for credit, it conveys the negative signal that it is undertaking
5 One must be aware that the ratio of financial expenses to financial debt measures the average interest rate.
Although it is still legitimate to look for the connection between this average and business fundamentals, the
presence of long-term financial contracts delays the immediate transmission from the new credit landscape to the
corporate cost of debt (and actually its volume as well). Regrettably, measures of the marginal cost of debt for our
panel dataset, and especially during a crisis period, are not readily available.
risky projects and is trying to share such risk with poorly informed outside investors. Aware of
this, the market may require a higher, rather than smaller, return on debt. Whether the
conventional or the signaling-based interpretation prevails must be settled by econometric
means, as done afterwards.
3. Data
In this section we aim to describe the most salient features of the dataset and the behavior
of the series around the recent subprime crisis, as a prelude to the estimation of leverage and
interest rate functions building on the theoretical body succinctly summarized in the previous
section. For the time being, the discussion will focus on the discernible patterns over 2007.1
through 2009.2. We will take 2007.1 as a reference, pre-crisis point for comparison with the full-
fledged crisis quarters, particularly 2008.3 through 2009.2. Our main source of data is the Latin
American module of Economatica, a data service that gathers balance sheet and income
statement information for listed firms in several countries. After some data cleaning described in
Annex 1, we ended up with a panel of 185 firms.
Table 1 contains the aggregate, country-level debt-to-assets ratio, equal to the sum of
financial debt over the whole sample of firms in a given country to the sum of total assets for the
same group of firms. The data reflects the somewhat surprising fact that the leverage ratio was
largely unaffected by the crisis and on the whole has indeed increased. In fact, the simple six-
country average has climbed from 22.8% to 26.1% between 2007.1 and 2009.2. One immediate
rationale for the absence of a declining trend is that long-term debt contracts cannot be called off
on short notice. However, this claim falls short of explaining the actual buildup of debt and of
the observation that both long-term (from 16.9% to 18.2%) and short-term debt (from 5.9% to
7.9%) have gone up during the crisis, as can be seen again in Table 1 –short-term debt is the
natural candidate for early cancellation. Along the same lines, it might be the case that the focus
on the debt to assets ratio blurs the fact that debt may be shrinking but at a lower speed than
assets. Once again, actual figures discredit this hypothesis: from Table 2, the stock of debt in fact
grew by 47.4% on average for the six countries against an increase of 28.1% in assets.
Turning to the cost side, the implicit annual interest rate (interest expenses to financial
debt, calculated over the full sample of firms in each country) follows, on average for the six
countries, an upward path that starts at 12.2% in 2007.1 to a maximum of 15.5% in 2009.1,
which begins receding in 2009.2 (14.4%) (Table 3). A quick reading of this preliminary evidence
leads to think that the cost of debt has been more sensitive to the reigning market uncertainty, yet
without hinting any dramatic effect on firms.
A first inspection of the fundamentals behind debt and its cost is provided by Tables 4
through 7. Apparently, the return on assets (Table 4) moderately plummeted in Argentina,
Colombia and Mexico since 2008, losing about 2-3 percentage points but still remaining in
healthy levels. Brazilian, Chilean and Peruvian firms fared much better throughout the crisis.
Real sales and asset tangibility averages (see Tables 5 and 6) seem to have been unaltered for the
most part, while market-to-book, according to Table 7, took a negative turn across the board,
dropping by 27% between 2007.4 and 2009.1. Still, it stayed above 1 in all countries and showed
signs of recovery in 2009.2 (average of 1.35 from 1.19 in 2009.1). Overall, these indicators
suggest that the crisis did not modify the fundamentals landscape of the firms in the region in
any profound way.
All in all, this exploratory evidence lends support to the hypothesis that the crisis did not strike
the corporate sector –or, strictly speaking, the subset of listed corporations- as hard as commonly
thought. Neither fundamentals nor the level and cost of debt worsened to a serious extent. Even
more, leverage indeed increased during the crisis, which is consistent with the combined effect of
a still positive aggregate credit growth and a flight to quality by the financial system into safer
assets, as those represented by the loans to the elite of listed firms.
4. Econometric findings
We devote this section to the discussion of our core empirical results, concerning the
determinants of the quantity and price of debt (Section 4.1), and the extent to which the crisis
tightened the credit constraints faced by large firms in Latin America (Section 4.2). Although our
main interest lies on the events surrounding the subprime crisis, we will take a longer-term
perspective in running our regressions, so as to be able to pinpoint whether this particular
episode had a statistically differential effect on corporate indebtedness decisions. As a result,
subject to basic information availability and quality constraints, our quarterly dataset goes back
to 1993.1 for Argentina, Brazil, Chile and Mexico, and to 2002.1 for Colombia and Peru, and
end in all cases in 2009.2. The usable sample amounts to a maximum of over 8,800 observations
on 185 firms. Details on country and time coverage, as well as variable definitions and filtering
criteria, are presented in Annex 1.
4.1 Subprime crisis, corporate leverage and the cost of debt in Latin America
We estimate our panel with two-way effects (by firm and by quarter), and report robust
standard error estimates, which are also corrected for clustering to account for correlation within
cross-section units (see Petersen (2009) on the standard error estimation biases in finance panel
datasets with fixed firm effects).6 Explanatory variables are defined as the average of the four
first lags of the corresponding regressor, under the assumption that balance sheet information is
made available with a lag and that both parties in the contract base their decisions not only on the
immediately previous quarter information.
In Table 8 we display the baseline debt-to-assets regressions. In column (1) we are able to
confirm that tangibility, size and profitability yield the expected signs and are highly significant.
The coefficient on market-to-book, in turn, is significantly positive, counter to most previous
evidence. The most plausible explanation is that market-to-book, besides being a proxy for
firm’s aversion to debt overhang, is a positive market signal about firm’s prospects. If this were
true, it would mean a more fluid supply of credit.7 Even more interesting is that the quarter
dummies are positive, and statistically and economically significant, for 2008.1 to 2009.2. In
these quarters, leverage was between 1.8 and 4.7 percentage points higher than in 2007.4 –the
excluded quarter- after controlling for corporate fundamentals. This implies that the crisis
favored a higher indebtedness of large, listed firms, which is greatly consistent with the flight-to-
quality hypothesis outlined earlier.
Another test for the role of macroeconomic factors consists of interacting corporate
fundamentals with a subprime crisis dummy taking value 1 between 2008.3 to 2009.2, that is, the
peak of the crisis. Two polar hypotheses can be put forward: one is that the response to
fundamentals in turbulent times may be weakened because of the inability to reliably assess
firm’s quality. In such a case, the sum of the original coefficient and that on the interaction term
should not be statistically different from zero. On the other extreme, in crisis scenarios
characterized by a heightened probability of financial distress, it may be plausible to expect both
6 In the tables we do not report fixed effects by firm and only report time effects since 2008.1 on, taking 2007.4 as
the excluded time period for comparison between pre- and post-crisis windows. We omit the estimated coefficients
on previous quarters for space reasons and more importantly because the results are inconsequential to our purposes. 7 It is also possible that, in light of the observed low leverage ratios across the sample, firms are far from the level
after which debt causes an actual conflict between borrowers and lenders.
lenders and borrowers to pay more attention than usual to the ability and willingness to pay -the
sensitivity to fundamentals would rise. Column (2) of Table 8 reports the results, which seem to
lean towards the latter hypothesis. The full effect of tangibility increases by 101%, suggesting
that in crisis times the availability of hard capital susceptible of being pledged as collateral eases
the issuance of debt. The profitability (negative) estimator goes up by 79%, an indication that
firms become more reluctant to substitute debt for internal funding (this is equivalent to saying
that firms have increased earnings retention ratio), possibly in response to the perception of a
larger default risk associated to debt service. The point estimate on market-to-book diminishes
by 31%, which might be linked to the firm’s assessment of a higher risk of debt overhang in the
middle of an economic slump. The size estimate, in turn, displays a statistically non-significant
loading.
Also in Table 8, columns 3 and 4, we included the interest-to-debt ratio as an additional
explanatory variable, which renders a negative and significant sign, consistent with the belief
that the cost of debt discourages the demand for loans. Accounting for the interaction with the
crisis dummy, the negative effect of the interest rate on the level of debt expands by 63%, again
being coherent with a revised aversion to risk.
The determinants of the average cost of debt, the interest-to-debt ratio, are uncovered in
Table 9. Despite the lack of prior work to compare our findings, the results are sensible enough
to be trusted. Larger firms with more tangible assets and better growth opportunities pay a lower
interest rate.8 That the return on assets is positively correlated to the interest rate may certainly
look strange at first glance, but this finding may stem from the negative signal transmitted to the
market by managers who could have first exhausted their internal funds before resorting to more
expensive financing options.9 This result does not invalidate the presumption that creditors do
pay attention to current corporate shape at the moment of setting the interest rate. To check this,
column (2) features the interannual growth rate of real sales, which presents the expected
negative sign. In turn, columns (3) and (4) broaden the explanatory variable set by adding the
debt-to-assets and the long- to short-term debt ratios, respectively. Clashing with the
conventional view, and supporting the signaling view sketched out in Section 1, highly levered
8 Market-to-book, the proxy for growth opportunities, ceases to be significant when leverage enters as an
explanatory variable. 9 This result was quite robust in statistical significance and point estimate value to changes in the sample (for
example, running individual country panels) and to changes in variable definition (for example, using profits to sales
instead of profits to assets).
firms with more long-term debt seem to pay a lower interest rate, as seen in column (5), which
comprises the full controlling set.10
Quarterly dummies attest, based on column (1) estimates, to
an increase of between 1.8 and 3 percentage points from 2008.3 to 2009.2. This corporate- level
effect fits comfortably within the evidence produced so far: as revealed in Section 3 via country-
level firm-weighted averages, the crisis saw a simultaneous increase of credit granted and
interest rates charged on these corporate clients.
Table 10 reproduces the estimations from column (1) and (5) in Table 9, but this time
incorporating the interactions between fundamentals and the financial crisis dummy. In this case,
the only significant (at 5% or less) estimated coefficient is that on ROA, which grows by 126%.
Our reading is that the negative signal about hoarding (or distributing) profits gets exacerbated in
this certainly distressing macroeconomic scenario.
4.2 Subprime crisis and fixed assets investment in Latin America
The preceding analysis raises the question as to whether Latin America has ultimately
endured any real side -not just financial- blow from the US subprime crisis. We pursue two
approaches in tackling this issue. For one, we try to disentangle the negative credit supply shock
from the credit demand contraction likely to accompany the crisis. Second, we perform standard
econometric experiments to test for the presence of financial constraints. Our results are fully
consistent with a mild overall crisis effect on this set of firms.
4.2.1 Credit supply or demand?
As the observed volumes of credit are the realization of individually unobservable
supply and demand decisions, one may wonder whether the subprime crisis actually represented
an exogenous, supply-driven credit crunch, as commonly believed. The answer is not simple,
because corporate performance may have been hampered by either deteriorated fundamentals (an
endogenous outcome with effect on both the supply and the demand for credit) or by a sudden
shortage in the supply of credit independent of corporate fundamentals. It goes without saying
that the origin of the crisis is completely exogenous to Latin America and its firms, but still it is
10
The ratio of long- to short-term debt is non-significant when added to the initial four-variable right-hand side, but
turns out significant after controlling for leverage and real sales growth.
not trivial to what degree the transmission to the real economy ran through an endogenous,
fundamentals-based or an exogenous channel.
An ingenious way of distinguishing both stories has recently been developed by Almeida,
Campello, Laranjeira and Weisbenner (2009). They take observationally similar firms on the eve
of the crisis, except for the ratio of long- to short-term debt, and then test the hypothesis that
firms with relatively more long-term debt should have been more insulated against the crisis in
terms of fixed asset accumulation, in the sense that their loans were less susceptible of being
called off. Given the ex ante similarity across treated (high long- to short-term debt) and non-
treated (low long- to short-term debt) firms, any significant difference in the growth rate of real
fixed assets after the crisis would imply that a negative credit supply shock has been at play. This
also requires of course that the “treatment” is exogenous, a realistic assumption in view that the
crisis was largely unanticipated and hence did not affect the pre-crisis ratio. To implement this
approach, we use propensity score matching.11
In a nutshell, this non-parametric technique searches for firms with similar features in
crucial observable aspects (in our case, we restrict this set to size, tangibility, market-to-book,
and return on assets in the pre-crisis 2003-2007 period). Then, we take the long- to short-term
debt in 2007.4 (before the full-blown crisis was in motion), and form two groups of firms: High
(in the upper 30% of all firms) and Low (below the upper 30%). Results are reported in Table 11,
where we also replicated the analysis for the interest rate paid for by these corporate borrowers
(the hypothesis is that the larger the ratio of long-term debt, the less sensitive the average interest
rate should have been to the crisis, all else equal). The table indisputably reveals no significant
difference in the growth rate of real fixed assets (and neither in the interest rate) between these
two groups in the aftermath of the crisis. This conclusion is robust to changes in the matching
method, the cut-off ratio (other than 30%, we tried with 20%, 40% and 50%), the set of
observable variables, and the crisis time window. This provides additional evidence on a soft
impact of the crisis on Latin America.
4.2.2 Subprime crisis and credit constraints in Latin America
11
See Bebczuk and Battiston (2009) for an explanation of this methodology and an application to the effects of
remittances on different household outcomes in Latin America.
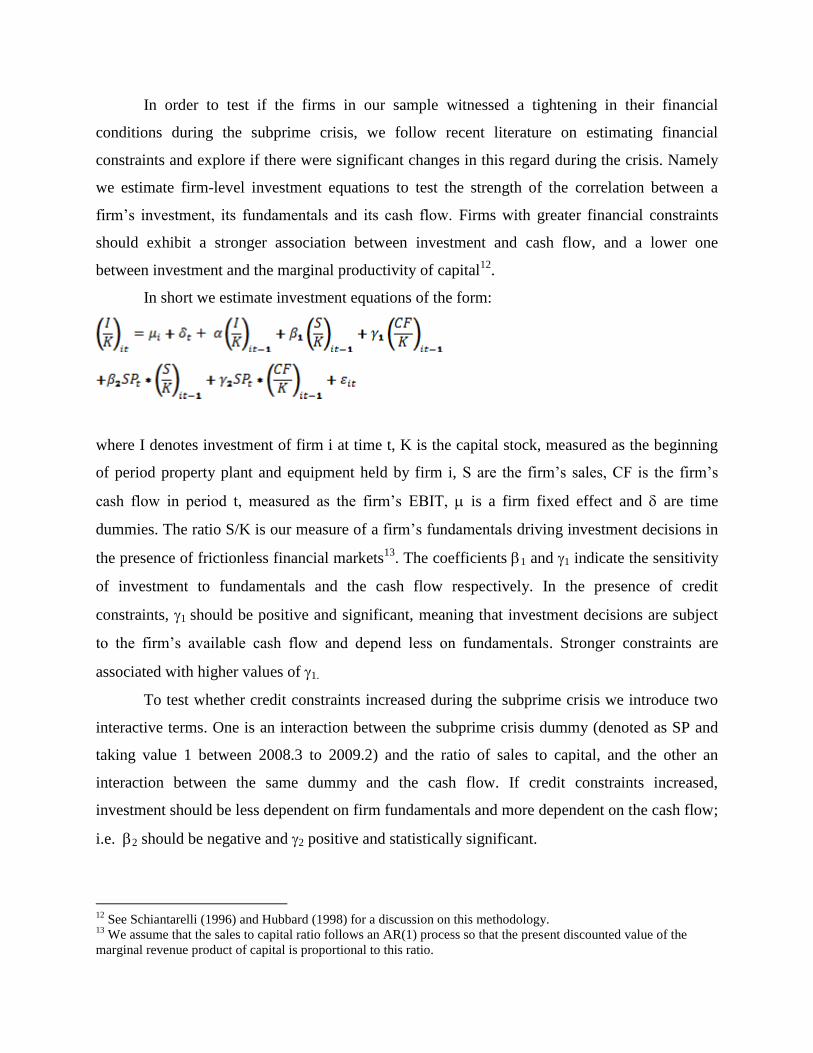
In order to test if the firms in our sample witnessed a tightening in their financial
conditions during the subprime crisis, we follow recent literature on estimating financial
constraints and explore if there were significant changes in this regard during the crisis. Namely
we estimate firm-level investment equations to test the strength of the correlation between a
firm’s investment, its fundamentals and its cash flow. Firms with greater financial constraints
should exhibit a stronger association between investment and cash flow, and a lower one
between investment and the marginal productivity of capital12
.
In short we estimate investment equations of the form:
where I denotes investment of firm i at time t, K is the capital stock, measured as the beginning
of period property plant and equipment held by firm i, S are the firm’s sales, CF is the firm’s
cash flow in period t, measured as the firm’s EBIT, is a firm fixed effect and are time
dummies. The ratio S/K is our measure of a firm’s fundamentals driving investment decisions in
the presence of frictionless financial markets13
. The coefficients 1 and 1 indicate the sensitivity
of investment to fundamentals and the cash flow respectively. In the presence of credit
constraints, 1 should be positive and significant, meaning that investment decisions are subject
to the firm’s available cash flow and depend less on fundamentals. Stronger constraints are
associated with higher values of 1.
To test whether credit constraints increased during the subprime crisis we introduce two
interactive terms. One is an interaction between the subprime crisis dummy (denoted as SP and
taking value 1 between 2008.3 to 2009.2) and the ratio of sales to capital, and the other an
interaction between the same dummy and the cash flow. If credit constraints increased,
investment should be less dependent on firm fundamentals and more dependent on the cash flow;
i.e. 2 should be negative and 2 positive and statistically significant.
12
See Schiantarelli (1996) and Hubbard (1998) for a discussion on this methodology. 13
We assume that the sales to capital ratio follows an AR(1) process so that the present discounted value of the
marginal revenue product of capital is proportional to this ratio.
Table 12 reports results of estimating investment equations using two methodologies. The
first four columns report results using and standard fixed effect estimator and excluding lags of
the dependent variable. Columns (5) to (8) re-estimate the investment equations including lags of
the dependent variable to incorporate possible adjustment costs in the investment process. This
last set of regressions is estimated using GMM methods to account for possible endogeneity and
serial correlation induced by including a dependent variable in the specification14
.
The results in all specifications confirm the findings in this paper. We find some evidence
of financial constraints in the sample studied (1 -the coefficient relating investment and cash
flow- is positive and significant throughout specifications) but we reject the hypothesis that such
credit constraints changed during the subprime crisis: 2and2 are always non-significant. Large
firms in Latin America did not experience any tightening of their financial restriction during the
crisis.
5. Conclusions
The recent international financial crisis led to a strong contraction of corporate credit in
advanced economies. While during the midst of the crisis there was evidence of a contraction of
capital flows to emerging economies and a rise in the cost of credit to these countries, up to now
little analysis had been made on the impact of the crisis on emerging markets’ firms. This paper
fills such gap.
The evidence presented in this paper suggests that the crisis did not have a significant
impact on Latin American corporations. In fact we find that if anything, during the crisis period,
corporate leverage increased for the large, listed firms of our sample after controlling for micro
fundamentals. This is consistent with the view that during the crisis capital was reallocated from
smaller and riskier firms to larger ones. Our econometric evidence confirms this. We show that
leverage in large firms in Latin American countries depends positively on the firm’s size and its
tangibility, and negatively with respect to profitability, as predicted by asymmetric information
approach to corporate finance. In sharp contrast with studies for other countries, we find that
firm leverage is positively related to the market-to-book ratio. We interpret this as a consequence
of positive signaling (counterbalancing the debt overhang effect). When exploring how the
relationship between leverage and fundamentals was affected by the crisis, we find that in many
14
See Arellano and Bond (1991) for a discussion.
dimensions risk aversion goes up during the crisis. Among other results we find that the positive
link between leverage and tangibility, a variable usually associated with collateral availability
and willingness and ability to repay debts, is strengthened, as well as the negative relationships
with ROA, an indication of greater corporate reluctance to substitute debt for internal funding.
With respect to the average cost of debt, we find that larger firms in Latin America with
more tangible assets pay lower interest rates. We also find a positive correlation between ROA
and interest payments, which we interpret as evidence of the negative signaling impact
transmitted to markets when firms do not follow the theoretically expected pecking order. With
respect to the crisis affecting the relationship between fundamentals and the cost of debt, we
encounter strong evidence that the crisis increased the positive correlation with the ROA, leading
us to the conclusion that macroeconomic distress exacerbates the negative signals about hoarding
profits.
In addition to the above we study, based on matching methods, if firms with similar
fundamentals except for the ratio of long- to short-term debt were affected differently by the
crisis regarding their investment decisions and the average interest rate they had to pay on their
debt. We do not find any significant evidence suggesting this type of crisis impact coming from
the sudden hardening of international credit supply flows.
In a related vein, we also explored if credit constraints faced by Latin American firms
increased during the crisis. Following the standard methodology in this field, we estimated
investment equations and found that the relationship between investment, investment
fundamentals, and cash flow, did not change during the crisis.
In short, our study suggests that the crisis did not have significant consequences for large
firms in Latin American countries on either the financial or the real front. Our take is that the
crisis increased the risk aversion of credit suppliers, shifting financing flows towards firms with
stronger fundamentals and less opacity, at a time in which informational asymmetries became
more prevalent. While our study is limited to the largest firms in the countries, we cannot explore
the very likely hypothesis that credit was also shifted from smaller and medium sized enterprises
to the larger ones –in the face of the sluggish to negative aggregate credit growth during the
crisis, this outcome would not be shocking. In that sense our results are not suggesting that the
crisis did not have a real impact on Latin American economies. What we can only conclude is
that the largest corporations were mostly unaffected.
References
Almeida H., M. Campello, B. Laranjeira, and S. Weisbenner (2009), “Corporate Debt Maturity
and the Real Effects of the 2007 Credit Crisis”, NBER Working Paper No. 14990, May.
Arellano, M. and S. Bond. (1991). “Some tests of specification for panel data: Monte Carlo
evidence and an application to employment equations”. The Review of Economic Studies 58:
277-97.
Baker M., R. Ruback, and J. Wurgler (2008), “Behavioral Corporate Finance: A Survey”, en E.
Eckbo (ed.), Handbook in Corporate Finance: Empirical Corporate Finance, Elsevier.
Barberis N. and R. Thaler (2003), “A Survey of Behavioral Finance”, en Constantinides G., M.
Harris y R. Stulz, Handbook of the Economics of Finance, Elsevier.
Bebczuk R. (2003), Asymmetric Information in Financial Markets: Introduction and
Applications, Cambridge University Press, UK.
Bebczuk R. and L. Garegnani (2007), “Autofinanciamiento y crecimiento”, Ensayos
Económicos, No. 47, Central Bank of Argentina.
Bebczuk R. and D. Battiston (2009), “Life-Cycle Deficits and Remitances in Latin America”,
mimeo, World Bank.
Binsbergen J., J. Graham and J. Yang (2009), “The Cost of Debt”, mimeo, Duke University.
Campello M, J. Graham y C. Harvey (2009), “The Real Effects of Financial Constraints:
Evidence from a Financial Crisis”, mimeo, April.
Djankov S., C. McLeish y A. Shleifer (2007), “Private Credit in 129 Countries”, Journal of
Financial Economics.
Elsas R. and D. Florysiak (2008), “Empirical Capital Structure Research: New Ideas, Recent
Evidence, and Methodological Issues”, Discussion Paper No. 2008-10, Munich School of
Management, July.
Fazzari S., G. Hubbard y B. Petersen (1988), “Financing Constraints and Corporate Investment”,
Brookings Papers on Economic Activity, Vol. 1, 141-195.
Frank M. and V. Goyal (2007), “Capital Structure Decisions: Which Factors are Reliably
Important?”, mimeo.
Galindo A. and F. Schiantarelli, eds. (2003), Credit Constraints and Investment in Latin
America, Latin American Research Network, Inter-American Development Bank.
Geneakoplos J. (2009), “The Leverage Cycle”, mimeo, April. Presented at the Bank of Korea
International Conference.
Graham J. and C. Harvey (2001), “The theory and practice of corporate finance: Evidence from
the field”, Journal of Financial Economics, Vol.61.
Hubbard G. (1998), “Capital-market imperfections and investments”, Journal of Economic
Literature, Vol. 36, 193-225.
Jensen M. (1986), “Agency Costs of Free Cash Flow, Corporate Finance and Takeovers”,
American Economic Review, Vol. 76, No. 2, 323-329.
Kadapakkam P., P.C. Kumar y L. Riddick (1998), “The impact of cash flows and firm size on
investment: the international evidence”, Journal of Banking and Finance, Vol. 22, 293-320.
Korajczyk R. and A. Levy (2001), “Capital Structure Choice: Macroeconomic Conditions and
Financial Constraints”, Working Paper No. 279, Kellogg Graduate School of Management,
August.
Lemmon M. and M. Roberts (2009), “The Response of Corporate Financing and Investment to
Changes in the Supply of Credit”, Hong Kong University of Science and Technology.
Forthcoming Journal of Financial Economics.
Lemmon M., M. Roberts, and J. Zender (2006), “Back to the Beginning: Persistence and the
Cross-Section of Corporate Capital Structure”, mimeo, December.
Levy A. and C. Hennessy (2007), “Why does capital structure choice vary with macroeconomic
conditions”, Journal of Monetary Economics, Vol. 54, 1545-1564.
Mitton T. (2006), “Why Have Debt Ratios Increased for Firms in Emerging Markets?”, mimeo,
July.
Petersen M. (2009), “Estimating Standard Errors in Finance Panel Data Sets: Comparing
Approaches”, Review of Financial Studies, Vol. 22, Issue 1, 435-480.
Schiantarelli, F. (1996) “Financial Constraints and Investment: Methodological Issues and
International Evidence”. Oxford Review of Economic Policy. 12(2):70-89.
Welch I. (2007), “Common Flaws in Empirical Capital Structure Research”, mimeo.
Windmeijer, F. (2005). “A finite sample correction for the variance of linear efficient two-step
GMM estimators”. Journal of Econometrics 126: 25-51.
Annex 1
Variable definitions and sample coverage
All balance sheet information comes from Economatica.
Debt to assets = Financial debt (loans and bonds) to total assets.
ROA = Return on Assets = Earnings before interest and taxes to total assets
Ln(Sales) = Natural logarithm of total sales
Tangibility = Fixed assets to total assets
Market to book = Total assets minus net worth plus market capitalization to total assets
Cost of debt = Annual gross interest expenses to financial debt. Gross interest expenses is the
sum over the current quarter and the three previous quarters. Financial debt is the average over
the four previous quarters (the implicit assumption is that interest is paid on lagged debt)
Loan interest rate = Average of loan interest rates reported to and published by national central
banks.
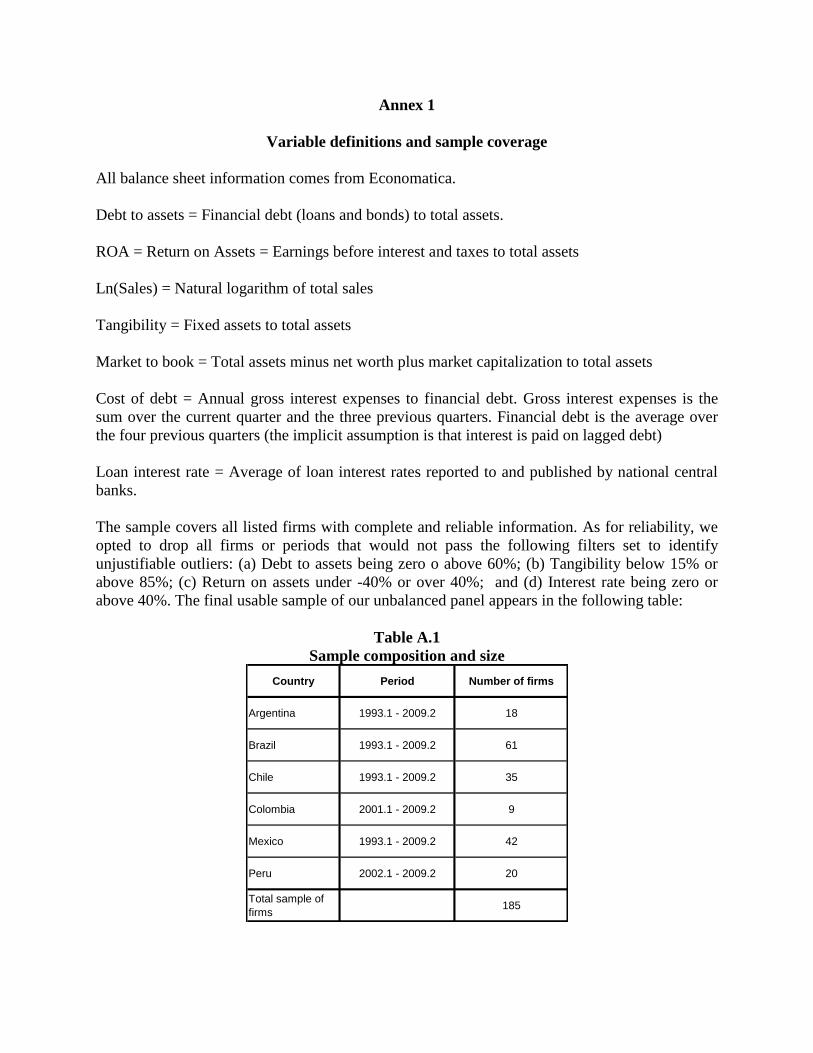
The sample covers all listed firms with complete and reliable information. As for reliability, we
opted to drop all firms or periods that would not pass the following filters set to identify
unjustifiable outliers: (a) Debt to assets being zero o above 60%; (b) Tangibility below 15% or
above 85%; (c) Return on assets under -40% or over 40%; and (d) Interest rate being zero or
above 40%. The final usable sample of our unbalanced panel appears in the following table:
Table A.1
Sample composition and size
Country Period Number of firms
Argentina 1993.1 - 2009.2 18
Brazil 1993.1 - 2009.2 61
Chile 1993.1 - 2009.2 35
Colombia 2001.1 - 2009.2 9
Mexico 1993.1 - 2009.2 42
Peru 2002.1 - 2009.2 20
Total sample of
firms185
Graph 1
Annual growth rate of real private credit
Quarterly data for 2007.1 to 2009.2
-10
0
10
20
30
40
50
60
2007.1 2007.2 2007.3 2007.4 2008.1 2008.2 2008.3 2008.4 2009.1 2009.2
Argentina Brazil Chile Colombia Mexico Peru
Source: International Financial Statistics, IMF.
Graph 2
Loan Interest Rate
Quarterly data for 2007.1 to 2009.2
5
10
15
20
25
30
2007.1 2007.2 2007.3 2007.4 2008.1 2008.2 2008.3 2008.4 2009.1 2009.2
Argentina Brazil Chile Colombia Mexico Peru
Source: Central bank of each country.
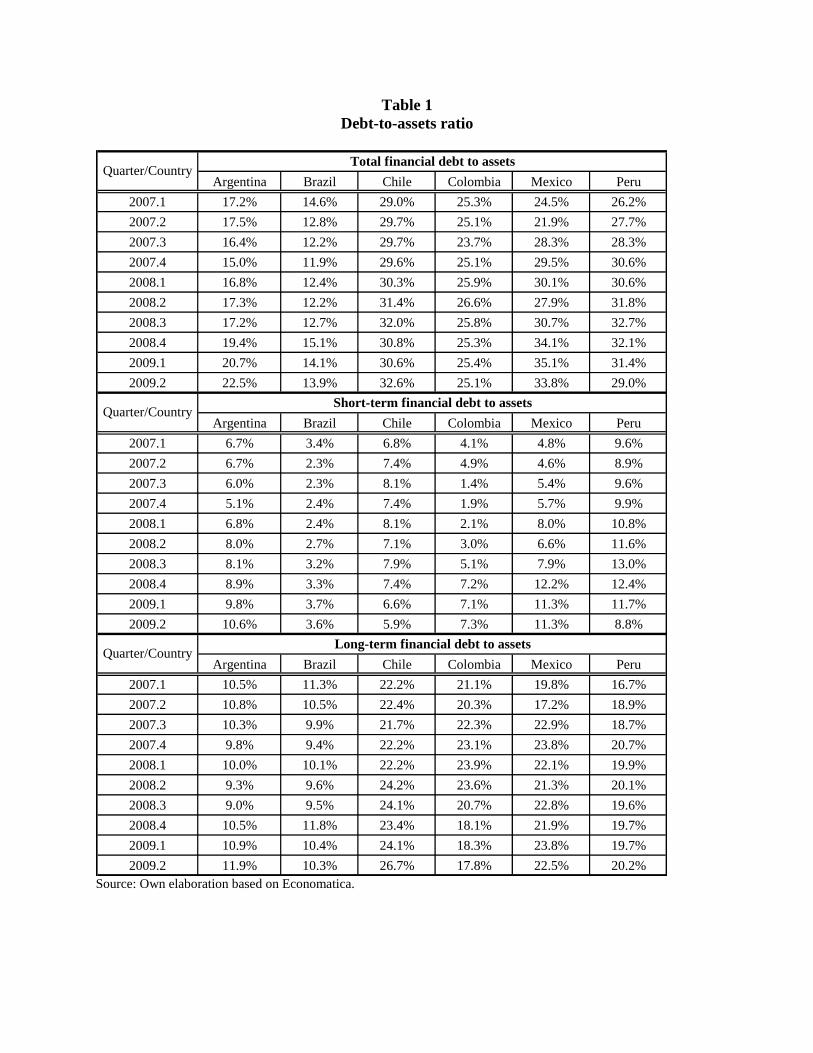
Table 1
Debt-to-assets ratio
Argentina Brazil Chile Colombia Mexico Peru
2007.1 17.2% 14.6% 29.0% 25.3% 24.5% 26.2%
2007.2 17.5% 12.8% 29.7% 25.1% 21.9% 27.7%
2007.3 16.4% 12.2% 29.7% 23.7% 28.3% 28.3%
2007.4 15.0% 11.9% 29.6% 25.1% 29.5% 30.6%
2008.1 16.8% 12.4% 30.3% 25.9% 30.1% 30.6%
2008.2 17.3% 12.2% 31.4% 26.6% 27.9% 31.8%
2008.3 17.2% 12.7% 32.0% 25.8% 30.7% 32.7%
2008.4 19.4% 15.1% 30.8% 25.3% 34.1% 32.1%
2009.1 20.7% 14.1% 30.6% 25.4% 35.1% 31.4%
2009.2 22.5% 13.9% 32.6% 25.1% 33.8% 29.0%
Argentina Brazil Chile Colombia Mexico Peru
2007.1 6.7% 3.4% 6.8% 4.1% 4.8% 9.6%
2007.2 6.7% 2.3% 7.4% 4.9% 4.6% 8.9%
2007.3 6.0% 2.3% 8.1% 1.4% 5.4% 9.6%
2007.4 5.1% 2.4% 7.4% 1.9% 5.7% 9.9%
2008.1 6.8% 2.4% 8.1% 2.1% 8.0% 10.8%
2008.2 8.0% 2.7% 7.1% 3.0% 6.6% 11.6%
2008.3 8.1% 3.2% 7.9% 5.1% 7.9% 13.0%
2008.4 8.9% 3.3% 7.4% 7.2% 12.2% 12.4%
2009.1 9.8% 3.7% 6.6% 7.1% 11.3% 11.7%
2009.2 10.6% 3.6% 5.9% 7.3% 11.3% 8.8%
Argentina Brazil Chile Colombia Mexico Peru
2007.1 10.5% 11.3% 22.2% 21.1% 19.8% 16.7%
2007.2 10.8% 10.5% 22.4% 20.3% 17.2% 18.9%
2007.3 10.3% 9.9% 21.7% 22.3% 22.9% 18.7%
2007.4 9.8% 9.4% 22.2% 23.1% 23.8% 20.7%
2008.1 10.0% 10.1% 22.2% 23.9% 22.1% 19.9%
2008.2 9.3% 9.6% 24.2% 23.6% 21.3% 20.1%
2008.3 9.0% 9.5% 24.1% 20.7% 22.8% 19.6%
2008.4 10.5% 11.8% 23.4% 18.1% 21.9% 19.7%
2009.1 10.9% 10.4% 24.1% 18.3% 23.8% 19.7%
2009.2 11.9% 10.3% 26.7% 17.8% 22.5% 20.2%
Long-term financial debt to assets
Quarter/Country
Quarter/Country
Quarter/Country
Total financial debt to assets
Short-term financial debt to assets
Source: Own elaboration based on Economatica.
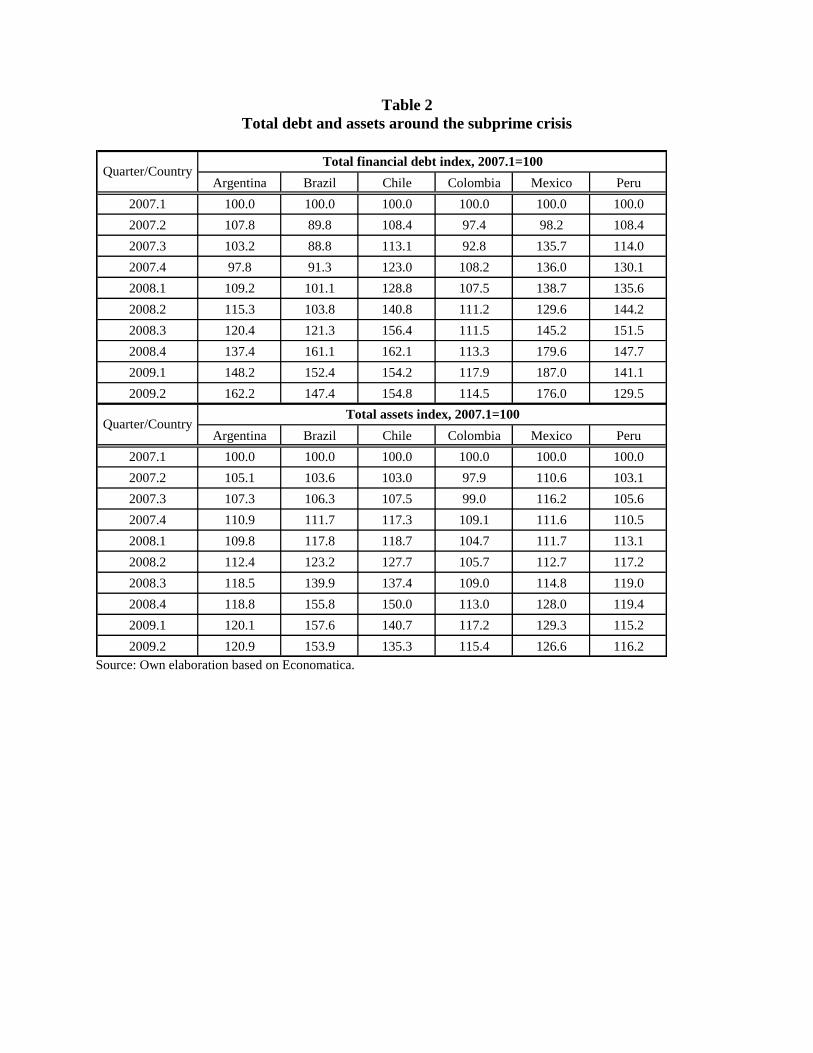
Table 2
Total debt and assets around the subprime crisis
Argentina Brazil Chile Colombia Mexico Peru
2007.1 100.0 100.0 100.0 100.0 100.0 100.0
2007.2 107.8 89.8 108.4 97.4 98.2 108.4
2007.3 103.2 88.8 113.1 92.8 135.7 114.0
2007.4 97.8 91.3 123.0 108.2 136.0 130.1
2008.1 109.2 101.1 128.8 107.5 138.7 135.6
2008.2 115.3 103.8 140.8 111.2 129.6 144.2
2008.3 120.4 121.3 156.4 111.5 145.2 151.5
2008.4 137.4 161.1 162.1 113.3 179.6 147.7
2009.1 148.2 152.4 154.2 117.9 187.0 141.1
2009.2 162.2 147.4 154.8 114.5 176.0 129.5
Argentina Brazil Chile Colombia Mexico Peru
2007.1 100.0 100.0 100.0 100.0 100.0 100.0
2007.2 105.1 103.6 103.0 97.9 110.6 103.1
2007.3 107.3 106.3 107.5 99.0 116.2 105.6
2007.4 110.9 111.7 117.3 109.1 111.6 110.5
2008.1 109.8 117.8 118.7 104.7 111.7 113.1
2008.2 112.4 123.2 127.7 105.7 112.7 117.2
2008.3 118.5 139.9 137.4 109.0 114.8 119.0
2008.4 118.8 155.8 150.0 113.0 128.0 119.4
2009.1 120.1 157.6 140.7 117.2 129.3 115.2
2009.2 120.9 153.9 135.3 115.4 126.6 116.2
Quarter/CountryTotal financial debt index, 2007.1=100
Quarter/CountryTotal assets index, 2007.1=100
Source: Own elaboration based on Economatica.
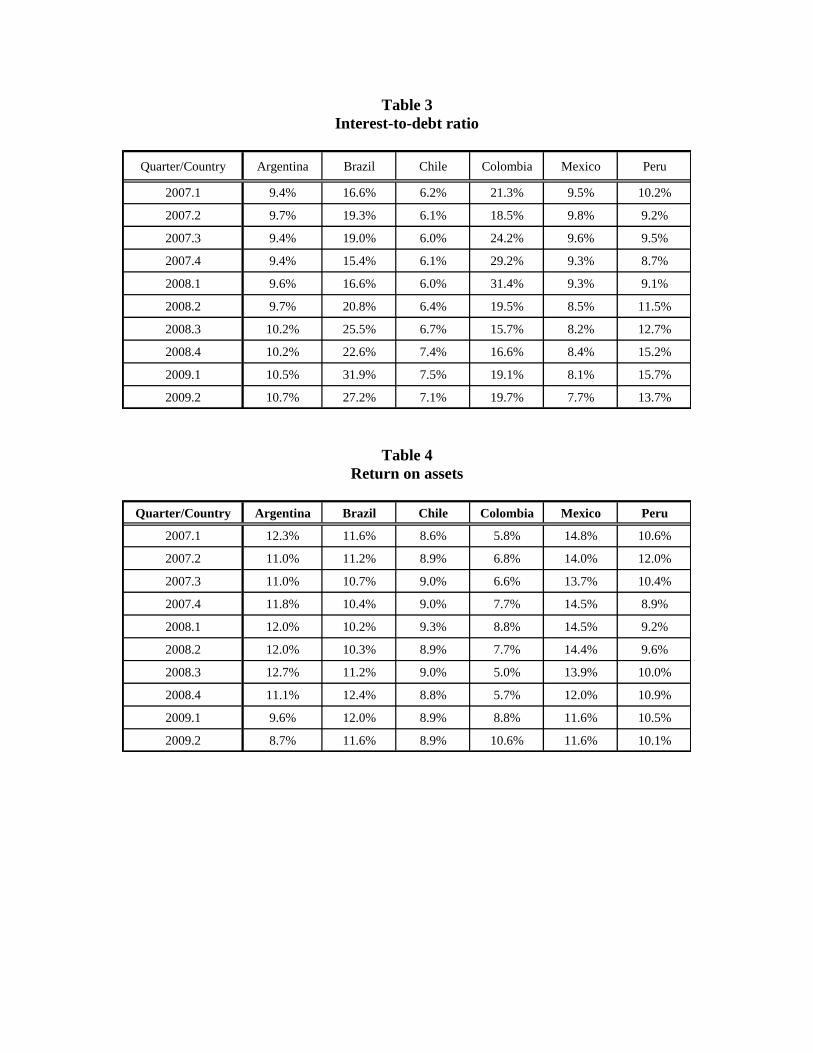
Table 3
Interest-to-debt ratio
Quarter/Country Argentina Brazil Chile Colombia Mexico Peru
2007.1 9.4% 16.6% 6.2% 21.3% 9.5% 10.2%
2007.2 9.7% 19.3% 6.1% 18.5% 9.8% 9.2%
2007.3 9.4% 19.0% 6.0% 24.2% 9.6% 9.5%
2007.4 9.4% 15.4% 6.1% 29.2% 9.3% 8.7%
2008.1 9.6% 16.6% 6.0% 31.4% 9.3% 9.1%
2008.2 9.7% 20.8% 6.4% 19.5% 8.5% 11.5%
2008.3 10.2% 25.5% 6.7% 15.7% 8.2% 12.7%
2008.4 10.2% 22.6% 7.4% 16.6% 8.4% 15.2%
2009.1 10.5% 31.9% 7.5% 19.1% 8.1% 15.7%
2009.2 10.7% 27.2% 7.1% 19.7% 7.7% 13.7%
Table 4
Return on assets
Quarter/Country Argentina Brazil Chile Colombia Mexico Peru
2007.1 12.3% 11.6% 8.6% 5.8% 14.8% 10.6%
2007.2 11.0% 11.2% 8.9% 6.8% 14.0% 12.0%
2007.3 11.0% 10.7% 9.0% 6.6% 13.7% 10.4%
2007.4 11.8% 10.4% 9.0% 7.7% 14.5% 8.9%
2008.1 12.0% 10.2% 9.3% 8.8% 14.5% 9.2%
2008.2 12.0% 10.3% 8.9% 7.7% 14.4% 9.6%
2008.3 12.7% 11.2% 9.0% 5.0% 13.9% 10.0%
2008.4 11.1% 12.4% 8.8% 5.7% 12.0% 10.9%
2009.1 9.6% 12.0% 8.9% 8.8% 11.6% 10.5%
2009.2 8.7% 11.6% 8.9% 10.6% 11.6% 10.1%
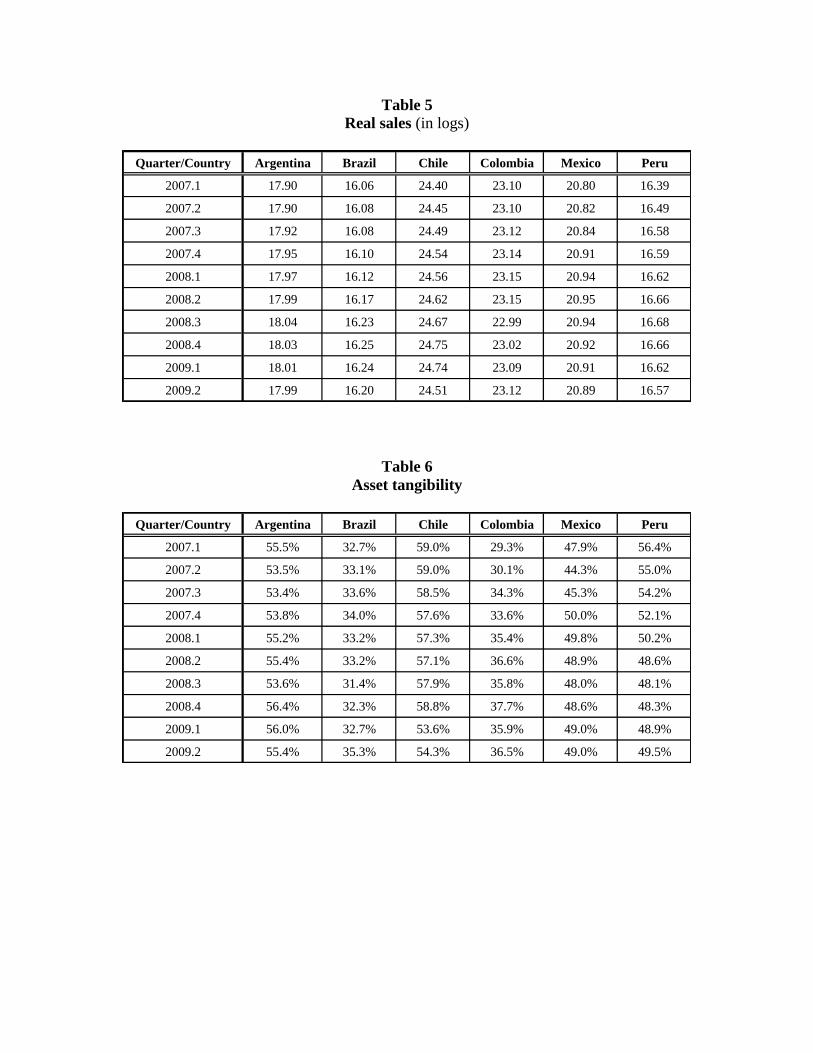
Table 5
Real sales (in logs)
Quarter/Country Argentina Brazil Chile Colombia Mexico Peru
2007.1 17.90 16.06 24.40 23.10 20.80 16.39
2007.2 17.90 16.08 24.45 23.10 20.82 16.49
2007.3 17.92 16.08 24.49 23.12 20.84 16.58
2007.4 17.95 16.10 24.54 23.14 20.91 16.59
2008.1 17.97 16.12 24.56 23.15 20.94 16.62
2008.2 17.99 16.17 24.62 23.15 20.95 16.66
2008.3 18.04 16.23 24.67 22.99 20.94 16.68
2008.4 18.03 16.25 24.75 23.02 20.92 16.66
2009.1 18.01 16.24 24.74 23.09 20.91 16.62
2009.2 17.99 16.20 24.51 23.12 20.89 16.57
Table 6
Asset tangibility
Quarter/Country Argentina Brazil Chile Colombia Mexico Peru
2007.1 55.5% 32.7% 59.0% 29.3% 47.9% 56.4%
2007.2 53.5% 33.1% 59.0% 30.1% 44.3% 55.0%
2007.3 53.4% 33.6% 58.5% 34.3% 45.3% 54.2%
2007.4 53.8% 34.0% 57.6% 33.6% 50.0% 52.1%
2008.1 55.2% 33.2% 57.3% 35.4% 49.8% 50.2%
2008.2 55.4% 33.2% 57.1% 36.6% 48.9% 48.6%
2008.3 53.6% 31.4% 57.9% 35.8% 48.0% 48.1%
2008.4 56.4% 32.3% 58.8% 37.7% 48.6% 48.3%
2009.1 56.0% 32.7% 53.6% 35.9% 49.0% 48.9%
2009.2 55.4% 35.3% 54.3% 36.5% 49.0% 49.5%
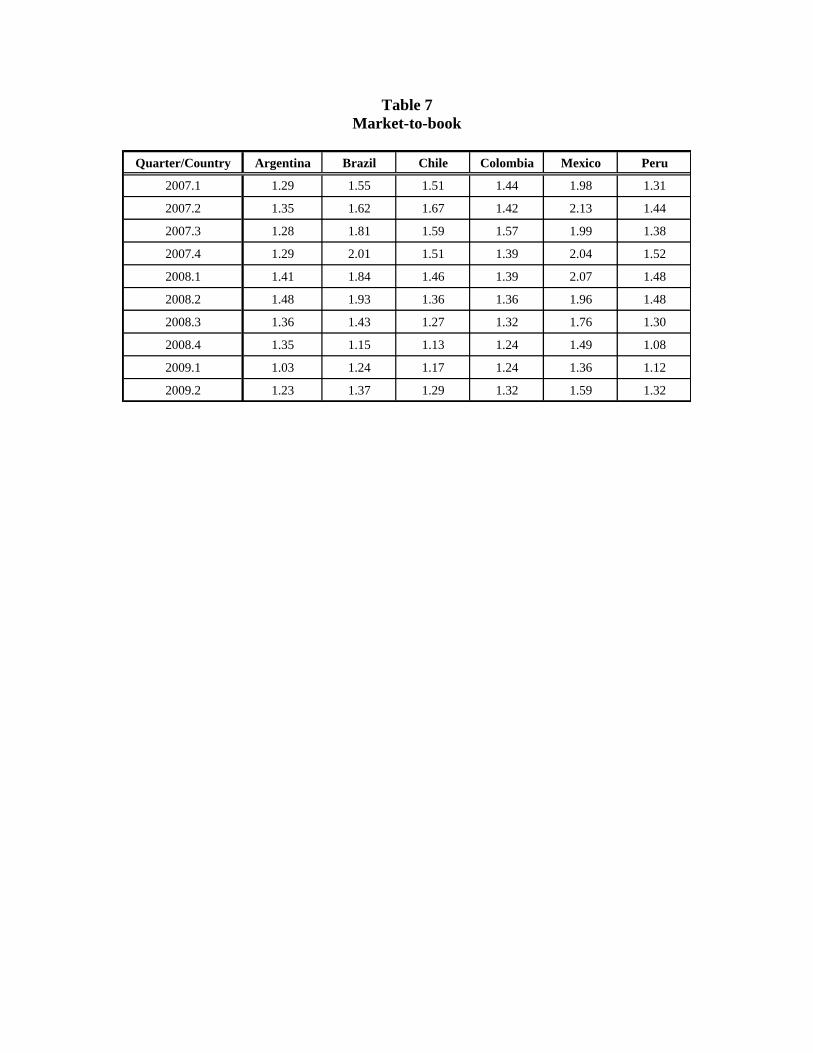
Table 7
Market-to-book
Quarter/Country Argentina Brazil Chile Colombia Mexico Peru
2007.1 1.29 1.55 1.51 1.44 1.98 1.31
2007.2 1.35 1.62 1.67 1.42 2.13 1.44
2007.3 1.28 1.81 1.59 1.57 1.99 1.38
2007.4 1.29 2.01 1.51 1.39 2.04 1.52
2008.1 1.41 1.84 1.46 1.39 2.07 1.48
2008.2 1.48 1.93 1.36 1.36 1.96 1.48
2008.3 1.36 1.43 1.27 1.32 1.76 1.30
2008.4 1.35 1.15 1.13 1.24 1.49 1.08
2009.1 1.03 1.24 1.17 1.24 1.36 1.12
2009.2 1.23 1.37 1.29 1.32 1.59 1.32
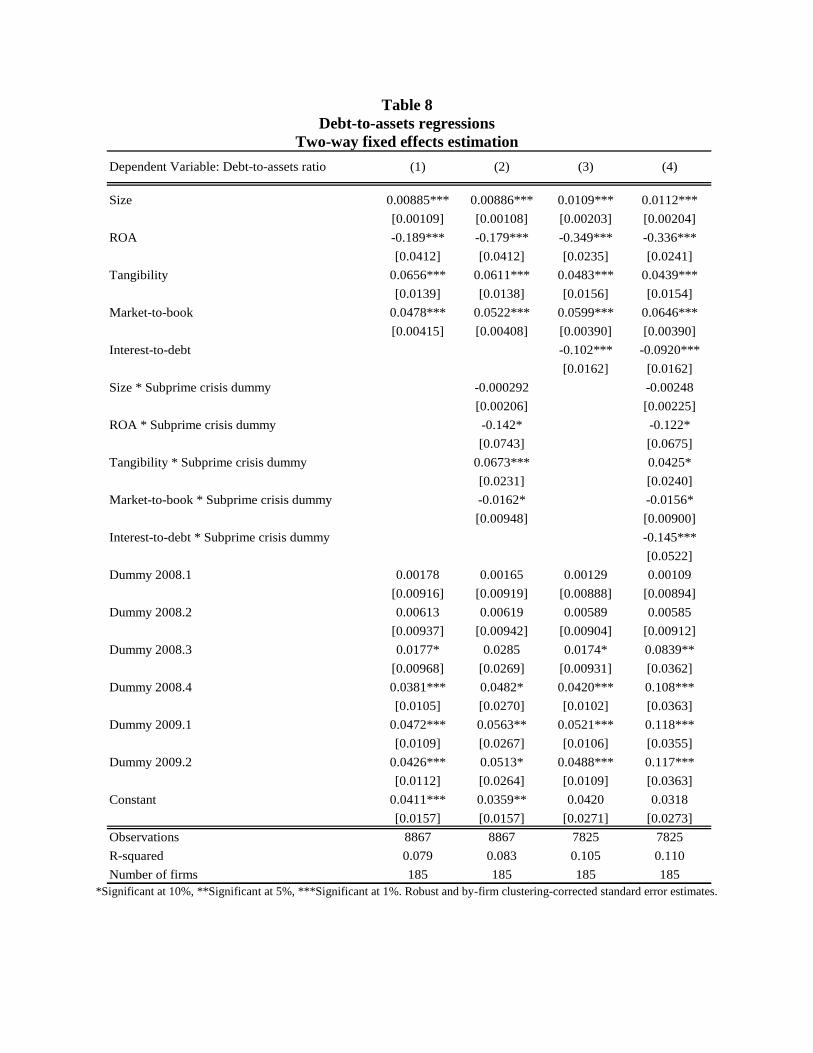
Table 8
Debt-to-assets regressions
Two-way fixed effects estimation
Size 0.00885*** 0.00886*** 0.0109*** 0.0112***
[0.00109] [0.00108] [0.00203] [0.00204]
ROA -0.189*** -0.179*** -0.349*** -0.336***
[0.0412] [0.0412] [0.0235] [0.0241]
Tangibility 0.0656*** 0.0611*** 0.0483*** 0.0439***
[0.0139] [0.0138] [0.0156] [0.0154]
Market-to-book 0.0478*** 0.0522*** 0.0599*** 0.0646***
[0.00415] [0.00408] [0.00390] [0.00390]
Interest-to-debt -0.102*** -0.0920***
[0.0162] [0.0162]
Size * Subprime crisis dummy -0.000292 -0.00248
[0.00206] [0.00225]
ROA * Subprime crisis dummy -0.142* -0.122*
[0.0743] [0.0675]
Tangibility * Subprime crisis dummy 0.0673*** 0.0425*
[0.0231] [0.0240]
Market-to-book * Subprime crisis dummy -0.0162* -0.0156*
[0.00948] [0.00900]
Interest-to-debt * Subprime crisis dummy -0.145***
[0.0522]
Dummy 2008.1 0.00178 0.00165 0.00129 0.00109
[0.00916] [0.00919] [0.00888] [0.00894]
Dummy 2008.2 0.00613 0.00619 0.00589 0.00585
[0.00937] [0.00942] [0.00904] [0.00912]
Dummy 2008.3 0.0177* 0.0285 0.0174* 0.0839**
[0.00968] [0.0269] [0.00931] [0.0362]
Dummy 2008.4 0.0381*** 0.0482* 0.0420*** 0.108***
[0.0105] [0.0270] [0.0102] [0.0363]
Dummy 2009.1 0.0472*** 0.0563** 0.0521*** 0.118***
[0.0109] [0.0267] [0.0106] [0.0355]
Dummy 2009.2 0.0426*** 0.0513* 0.0488*** 0.117***
[0.0112] [0.0264] [0.0109] [0.0363]
Constant 0.0411*** 0.0359** 0.0420 0.0318
[0.0157] [0.0157] [0.0271] [0.0273]
Observations 8867 8867 7825 7825
R-squared 0.079 0.083 0.105 0.110
Number of firms 185 185 185 185
(4)Dependent Variable: Debt-to-assets ratio (1) (2) (3)
*Significant at 10%, **Significant at 5%, ***Significant at 1%. Robust and by-firm clustering-corrected standard error estimates.
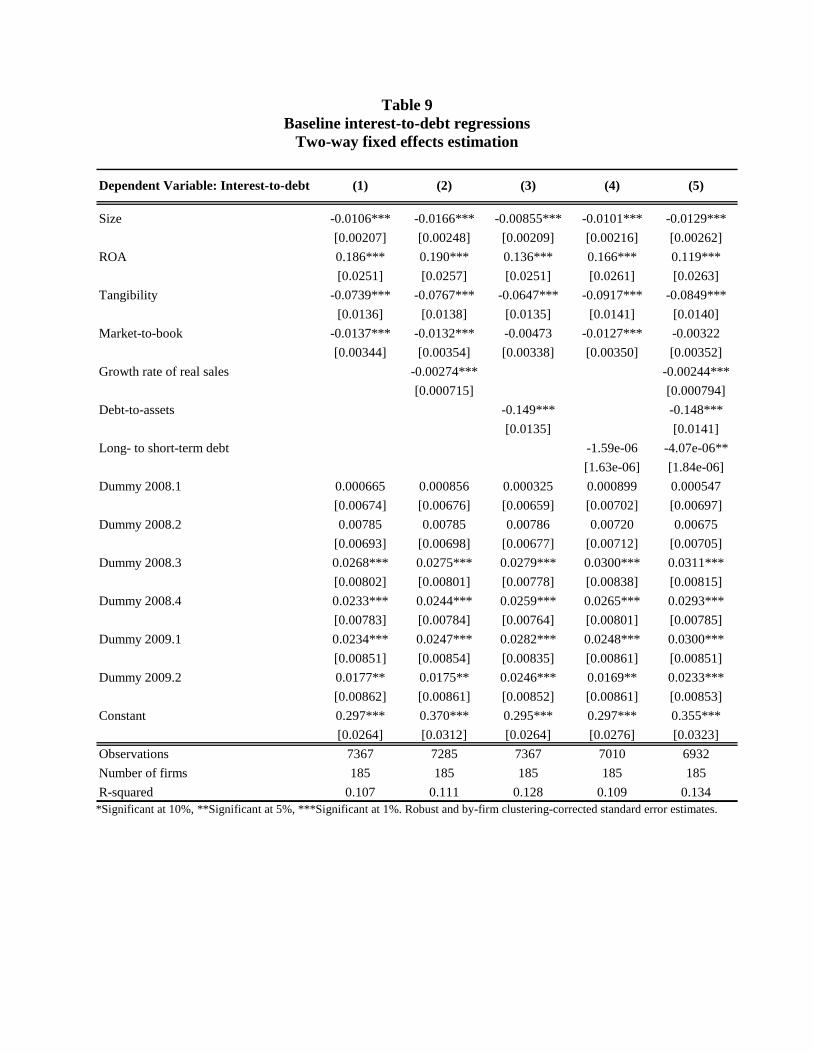
Table 9
Baseline interest-to-debt regressions
Two-way fixed effects estimation
Size -0.0106*** -0.0166*** -0.00855*** -0.0101*** -0.0129***
[0.00207] [0.00248] [0.00209] [0.00216] [0.00262]
ROA 0.186*** 0.190*** 0.136*** 0.166*** 0.119***
[0.0251] [0.0257] [0.0251] [0.0261] [0.0263]
Tangibility -0.0739*** -0.0767*** -0.0647*** -0.0917*** -0.0849***
[0.0136] [0.0138] [0.0135] [0.0141] [0.0140]
Market-to-book -0.0137*** -0.0132*** -0.00473 -0.0127*** -0.00322
[0.00344] [0.00354] [0.00338] [0.00350] [0.00352]
Growth rate of real sales -0.00274*** -0.00244***
[0.000715] [0.000794]
Debt-to-assets -0.149*** -0.148***
[0.0135] [0.0141]
Long- to short-term debt -1.59e-06 -4.07e-06**
[1.63e-06] [1.84e-06]
Dummy 2008.1 0.000665 0.000856 0.000325 0.000899 0.000547
[0.00674] [0.00676] [0.00659] [0.00702] [0.00697]
Dummy 2008.2 0.00785 0.00785 0.00786 0.00720 0.00675
[0.00693] [0.00698] [0.00677] [0.00712] [0.00705]
Dummy 2008.3 0.0268*** 0.0275*** 0.0279*** 0.0300*** 0.0311***
[0.00802] [0.00801] [0.00778] [0.00838] [0.00815]
Dummy 2008.4 0.0233*** 0.0244*** 0.0259*** 0.0265*** 0.0293***
[0.00783] [0.00784] [0.00764] [0.00801] [0.00785]
Dummy 2009.1 0.0234*** 0.0247*** 0.0282*** 0.0248*** 0.0300***
[0.00851] [0.00854] [0.00835] [0.00861] [0.00851]
Dummy 2009.2 0.0177** 0.0175** 0.0246*** 0.0169** 0.0233***
[0.00862] [0.00861] [0.00852] [0.00861] [0.00853]
Constant 0.297*** 0.370*** 0.295*** 0.297*** 0.355***
[0.0264] [0.0312] [0.0264] [0.0276] [0.0323]
Observations 7367 7285 7367 7010 6932
Number of firms 185 185 185 185 185
R-squared 0.107 0.111 0.128 0.109 0.134
(4) (5)Dependent Variable: Interest-to-debt (1) (2) (3)
*Significant at 10%, **Significant at 5%, ***Significant at 1%. Robust and by-firm clustering-corrected standard error estimates.

Table 10
Baseline interest-to-debt regressions
Two-way fixed effects estimation
Size -0.0106*** -0.0129***
[0.00207] [0.00265]
ROA 0.176*** 0.108***
[0.0257] [0.0269]
Tangibility -0.0727*** -0.0849***
[0.0136] [0.0139]
Market-to-book -0.0129*** -0.00211
[0.00350] [0.00356]
Growth rate of real sales -0.00245***
[0.000799]
Debt-to-assets -0.151***
[0.0142]
Long- to short-term debt -5.79e-06***
[2.15e-06]
Dependent Variable: Interest-to-debt (1) (2)
*Significant at 10%, **Significant at 5%, ***Significant at 1%. Robust and by-firm clustering-corrected
standard error estimates.

Table 10 (continued)
Baseline interest-to-debt regressions
Two-way fixed effects estimation
Size * Subprime crisis dummy -0.000268 -0.000954
[0.00159] [0.00176]
ROA * Subprime crisis dummy 0.0962* 0.137**
[0.0566] [0.0590]
Tangibility * Subprime crisis dummy -0.00145 -0.000800
[0.0242] [0.0231]
Market-to-book * Subprime crisis dummy -0.0106 -0.0120
[0.00738] [0.00742]
Growth rate of real sales * Subprime crisis dummy 0.0124
[0.0114]
Debt-to-assets * Subprime crisis dummy 0.0272
[0.0351]
Long- to short-term debt * Subprime crisis dummy 8.26e-06*
[4.52e-06]
Dummy 2008.1 0.000665 0.000856
[0.00674] [0.00676]
Dummy 2008.2 0.00785 0.00785
[0.00693] [0.00698]
Dummy 2008.3 0.0268*** 0.0275***
[0.00802] [0.00801]
Dummy 2008.4 0.0233*** 0.0244***
[0.00783] [0.00784]
Dummy 2009.1 0.0234*** 0.0247***
[0.00851] [0.00854]
Dummy 2009.2 0.0177** 0.0175**
[0.00862] [0.00861]
Constant 0.297*** 0.370***
[0.0264] [0.0312]
Observations 7367 7285
Number of firms 185 185
R-squared 0.107 0.111
Dependent Variable: Interest-to-debt (1) (2)
*Significant at 10%, **Significant at 5%, ***Significant at 1%. Robust and by-firm clustering-corrected
standard error estimates.

Table 11
Propensity Score Matching Results (*)
Variable of interest Matching MethodTreatment
Group
Control
Group
Absolute
Difference (in
percentage points)
t-statistics p-value
Average pre-crisis long- to
short-term debt2.93 1.09
K-nearest neighbor 8.94% 8.19% 0.75% 0.32 0.75
Kernel 8.94% 12.09% -3.16% 0.25 0.80
Radius 8.94% 11.60% -2.67% 0.21 0.83
K-nearest neighbor 14.48% 13.09% 1.38% 1.14 0.26
Kernel 14.48% 13.80% 0.68% 0.62 0.53
Radius 14.48% 13.94% 0.54% 0.50 0.62
After-crisis growth rate of
real fixed assets
After-crisis interest rate
(Financial expenses to debt)
(*) Pre-crisis period: 2003.1-2007.4, Crisis period: 2008.3-2009.2. High pre-crisis long- to short-term debt firms
defined as those in the upper 30%.
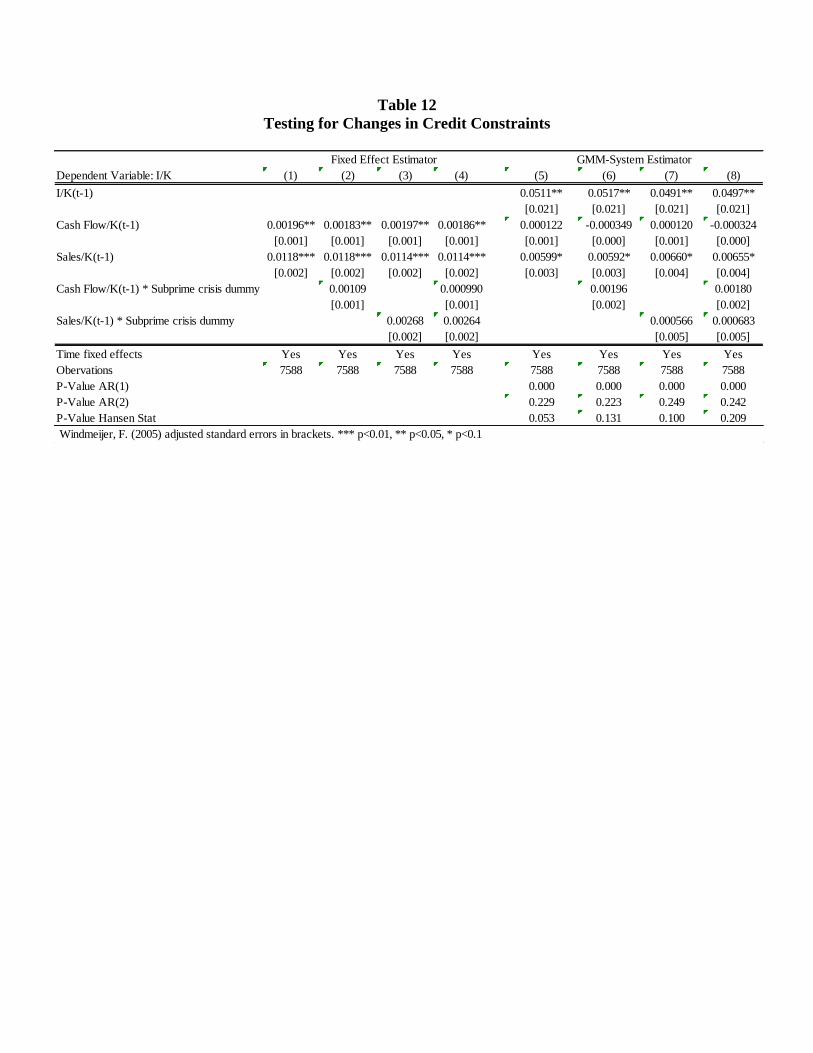
Table 12
Testing for Changes in Credit Constraints
Fixed Effect Estimator GMM-System Estimator
Dependent Variable: I/K (1) (2) (3) (4) (5) (6) (7) (8)
I/K(t-1) 0.0511** 0.0517** 0.0491** 0.0497**
[0.021] [0.021] [0.021] [0.021]
Cash Flow/K(t-1) 0.00196** 0.00183** 0.00197** 0.00186** 0.000122 -0.000349 0.000120 -0.000324
[0.001] [0.001] [0.001] [0.001] [0.001] [0.000] [0.001] [0.000]
Sales/K(t-1) 0.0118*** 0.0118*** 0.0114*** 0.0114*** 0.00599* 0.00592* 0.00660* 0.00655*
[0.002] [0.002] [0.002] [0.002] [0.003] [0.003] [0.004] [0.004]
Cash Flow/K(t-1) * Subprime crisis dummy 0.00109 0.000990 0.00196 0.00180
[0.001] [0.001] [0.002] [0.002]
Sales/K(t-1) * Subprime crisis dummy 0.00268 0.00264 0.000566 0.000683
[0.002] [0.002] [0.005] [0.005]
Time fixed effects Yes Yes Yes Yes Yes Yes Yes Yes
Obervations 7588 7588 7588 7588 7588 7588 7588 7588
P-Value AR(1) 0.000 0.000 0.000 0.000
P-Value AR(2) 0.229 0.223 0.249 0.242
P-Value Hansen Stat 0.053 0.131 0.100 0.209
Windmeijer, F. (2005) adjusted standard errors in brackets. *** p<0.01, ** p<0.05, * p<0.1