Leverage and stock returns in emerging markets - CORE
110
Leverage and stock returns in emerging markets: the case of South Africa Cephas Forichi Student number: 511591 A research report submitted to the Faculty of Commerce, Law and Management, University of the Witwatersrand, in partial fulfilment of the requirements for the degree of Master of Management in Finance and Investments. Supervisor: Prof. Kalu Ojah Johannesburg, 2014 brought to you by CORE View metadata, citation and similar papers at core.ac.uk provided by Wits Institutional Repository on DSPACE
-
Upload
khangminh22 -
Category
Documents
-
view
1 -
download
0
Transcript of Leverage and stock returns in emerging markets - CORE

Leverage and stock returns in emerging
markets: the case of South Africa
Cephas Forichi
Student number: 511591
A research report submitted to the Faculty of Commerce, Law and Management,
University of the Witwatersrand, in partial fulfilment of the requirements for the
degree of Master of Management in Finance and Investments.
Supervisor: Prof. Kalu Ojah
Johannesburg, 2014
brought to you by COREView metadata, citation and similar papers at core.ac.uk
provided by Wits Institutional Repository on DSPACE

ii
DECLARATION
I, Cephas Forichi declare that the research work reported in this dissertation is my
own, except where otherwise indicated and acknowledged. It is submitted for the
degree of Master of Management in Finance and Investment in the University of the
Witwatersrand, Johannesburg. This thesis has not, either in whole or in part, been
submitted for a degree or diploma to any other universities.
Signature of candidate Date: 03 July 2014

iii
ABSTRACT
This study models leverage-cum-stock returns in emerging markets using South
African data. The topic on leverage-cum-stock returns has received much attention
from researchers with both empirical and theoretical findings showing mixed results.
This study shows that there is a positive relationship between leverage and stock
returns. Beta is not the only priceable risk borne by investors, there is a reward also
for bearing leverage. High leverage levels entails high asset base, which is an
indicator of future growth opportunities. Firms with high asset base, take a gamble by
investing heavily in risky but highly rewarding investments. Risky appetite investors
are then rewarded with high stock prices leading to high stock returns. It is important
to note that highly levered firms are risky. There are costs associated with debt
financing, for instance, contractual debt servicing commitments and high chances of
default risk. Investors should be compensated for bearing this risk by higher stock
prices. Debt-related characteristics are also incorporated in the study to fully model
leverage-cum-stock returns. These variables are change in size measured by market
capitalization, age of a firm and interest rates. Stock returns are negatively related to
age of a firm and interest rates whilst positively related to change in size.

iv
ACKNOWLEDGMENTS
I would like to acknowledge my Supervisor; Professor Kalu Ojah, a professor in
Finance, for his guidance and assistance in carrying out this study. I also need to
extend my gratitude to Professor Leon Brumme from McGregor-BFA for assisting
and advising me with data extraction; Lerato Mogane from Johannesburg Stock
Exchange for providing me with listing dates of companies.
I thank my family for taking me this far. I am grateful to my mother, father, and
brothers for all the support. I dedicate this research (thesis) to my mother for her love
towards me. Above all, I thank God for the gift of life.

v
TABLE OF CONTENTS
Declaration ii
Abstract iii
Acknowledgements iv
Table of contents v
List of tables ix
1 INTRODUCTION 10
1.1 Background 10
1.2 Problem statement 10
1.3 Research questions 13
1.4 Objectives of the study 13
1.5 Ways of achieving the objective of the study 14
1.6 Weaknesses of the study 14
1.7 Outline of the study 15
2 LITERATURE REVIEW 16

vi
2.1 Background 16
2.2 The capital structure 16
2.3 Leverage 19
2.4 Short-term and long-term debt 22
2.5 January effect 23
2.6 Private and public debt 24
2.7 Firm size and stock returns 25
2.8 Credit ratings and default probabilities 25
2.9 Age 26
2.10 Interest rates 26
3 DATA AND METHODOLOGY 28
3.1 Data description 28
3.2 Methodology 32
3.2.1 Regression tests 34
3.2.1.1 Pooled least squares 34
3.2.1.2 The fixed effects and random effects models 34
3.2.1.3 GMM regression 36
3.2.2 Diagnostic tests 36
3.2.2.1 Hausman test 36

vii
3.2.2.2 Modified Wald test for heteroskedasticity 37
3.2.2.3 Pesaran CD test 37
3.2.2.4 Driscoll and Kraay regression 38
3.2.2.5 Lagram-Multiplier test for autocorrelation 38
3.2.2.6 Allenaro-Bond test and Sargan test 39
3.2.2.7 Prais-Winston test 39
4 RESULTS AND DISCUSSION 41
4.1 Descriptive statistics 41
4.2 Correlation coefficient matrix 42
4.3 Regression results 43
4.3.1 Leverage factor 47
4.3.2 Size 48
4.3.3 Interest rates 49
4.3.4 Age 49
4.4 Diagnostic tests and robust checks 50
4.4.1 Modified Wald test results for heteroskedasticity 50
4.4.2 GMM results 50
4.4.3 Driscoll and Kraay regression results 52
4.4.4 Results for Wooldridge test for autocorrelation 52
viii
4.4.5 Results for Allenaro-Bond test and Sargan test 52
4.4.5 Prais-Winston autocorrelation corrected results 54
5 CONCLUSION 56
REFERENCES 59
APPENDIX 64

ix
LIST OF TABLES
Table 2.1: Descriptive statistics (Literature review) 21
Table 2.2: Industrial regression results (Literature review) 22
Table 3.1: Summary of data 29
Table 4.1: Descriptive statistics 42
Table 4.2: Correlation coefficients matrix 43
Table 4.3: Hausman test 44
Table 4.4: Regression results 45
Panel A: Fixed effects model 45
Panel B: Random effects model 46
Panel C: Pooled least squares 47
Table 4.5: modified Wald test 50
Table 4.6: GMM results 51
Table 4.7: Allenaro-Bond Test and Sargan Test 53
Table 4.8: Prais-Winston test 54
Appendix 64
10
CHAPTER 1
1. INTRODUCTION
1.1 Background
Leverage is having funds other than that of owners in the capital structure of a firm.
This poses risk to the firm if it fails to meet its financial debt servicing obligations
and in times of financial distress. There are many measures of leverage therefore;
leverage is defined by the objective of the analysis (Rajan and Zingales, 1995). For
the purpose of this study, leverage factor is taken as a measure of leverage (i.e., the
proportion of equity-holders‟ claim in times of liquidation) whilst other studies use
debt to equity ratio as leverage measure.
Leverage factor is given by the ratio between total assets and equity. Adding total
liabilities and equity gives total assets of a firm. A higher leverage factor entails more
debt in the capital structure. Higher asset base and growth opportunities are attributes
that investors seek to see in leveraged firms. Thus, leverage factor is an appropriate
measure of leverage when making investment decisions. Therefore, the perceived risk
of a firm due to leverage can cause movements in stock returns.
Stock returns are gains or losses from share price movements over a period of time;
these include other financial pay-outs such as dividends. Share prices are influenced
by investors‟ decisions, for instance, the perceived risk in levered firms. Highly
leveraged firms are riskier than low levered firms during times of financial distress.
This affects the investing strategies of firms which in turn causes movements in stock
returns.
1.2 Problem Statement
This study is on the effect of leverage on stock returns in emerging markets, with
South Africa‟s Johannesburg Stock Exchange (JSE) as the focal point. Most of the

11
studies on leverage-cum-stock returns have been on developed markets such as US
and UK (e.g., Bhandari, 1988; Gomes and Schmid, 2010; Muradoglu and Sivaprasad,
2011 and others). Earlier studies on leveraged stock returns on JSE were not robust.
Only debt to equity and debt to cash flow formed the most part of the discussion as
leverage representation. The larger part of the research has been on the Capital Asset
Pricing Model (CAPM), beta and firm factors tested in conjunction with the CAPM
(Bradfield, Barr and Affleck-Graves, 1988; Page and Palmer, 1991; Page, 1996; Van
Rensburg, 1998; Van Rensburg and Robertson, 2003 and others).
An important lesson on return and risk is that there is a reward for bearing risk. In
CAPM, beta captures non-diversifiable (systematic) risk which is a proxy or the
degree of reward to equity holders for bearing risk. This shows that beta drives stock
returns. Leverage as non-systematic and asset specific risk can be diversified at a zero
cost hence cannot drive stock returns. This can be explained by the following model:
Ri = α + βRm + ε (1.1)
Ri = return of firm i
α = intercept of the relationship between firm return and market return.
β = systematic (non-diversifiable) risk
Rm = market return
ε = non-systematic risk
The conclusion that can be derived from CAPM is that equity holders are not
rewarded for bearing diversifiable non-systematic risk. This implies that stock returns
cannot be driven by leverage. Nevertheless, “Proposition II” by Modigliani and
Miller (1958) shows that an increase in debt increases equity risk causing investors to

12
demand a higher required rate of return1. This implies that there is a risk premium for
having leverage in the capital structure. Thus, it is not only systematic risk that carries
a reward; non-systematic risk too can be rewarded. This study therefore addresses the
anomaly of relying only on beta as a measure of priceable risk that drives stock
returns. Fama and French (1992), among others, show that stock returns are not only
driven by beta.
There are contradicting findings both empirically and theoretically on whether
movements in stock returns are caused by changes in leverage. For instance, Penman
(2007) notes that leverage expressed both in market-value and book-value does not
influence stock returns. The book-value leverage non-effect on stock returns
documented by Penman (2007) is supported by Gomes and Schmid (2010). Whilst
researchers such as Bhandari (1988), Fama and French (1992), and Gomes and
Schmid (2010) show that it is the market-value of leverage that is positively related to
stock returns not the book-value.
Increases in leverage negatively affect cash flows attributable to equity holders of a
firm; this causes equity holders to request a higher rate of return (e.g., Gomes and
Schmid, 2010). It therefore, entails that leverage and stock returns should be
correlated. According to Modigliani and Miller (1958), an increase in debt level
1 Modigliani and Miller (1958) Proposition II, “the expected rate of return or yield, i, on the stock of
any company j belonging to the kth class is a
linear function of leverage as follows:
= pk + (Pk - r) DJ/Sj.
That is, the expected yield of a share of stock is equal to the appropriate capitalization rate pk for a
pure equity stream in the class, plus a premium related to financial risk equal to the debt-to-equity ratio
times the spread between pk and r”.

13
increases the cost of capital for equity financed firms, whose owners, in turn, demand
a higher required rate of return for being owners of such levered firms.
The inconclusive result about the effects of leverage on stock returns is another
motivation for this study. The empirical findings by researchers such as Yang et al.
(2010), Johnson et al. (2011), Muradoglu and Sivaprasad (2011) and others show a
negative relationship between leverage and stock returns whilst Bhandari (1988), Van
Rensburg and Robertson (2003), Gomes and Schmid (2010) show a positive
relationship. Is there new information on leverage that can be incorporated into the
investigation? This is one of the questions to be addressed by this study.
1.3 Research Questions
This study attempts to answer the following research questions:
Does the capital structure of a firm have influence on stock returns?
Does non-systematic risk of leverage have a priceable?
Is it short-term or long-term debt that is significant in explaining stock
returns?
Should the focus be on debt only, what about issues such as firm‟s age which
is correlated with debt?
1.4 Objectives of the Study
The study aims to make an empirical contribution on whether or not stock returns can
be explained by the firm‟s indebtedness, with focus on one emerging market, South
Africa. The use of debt in financing the firm‟s activities is of importance in
explaining stock returns and complex investment decisions (e.g., Gomes and Schmid,
2010). Thus, understanding the leverage position of firms helps investors to make an
informed bet on their investment (savings) decisions.

14
The study also aims to assess the effect of categorizing debt into short and long-term
on stock returns. Researchers such as Gwatidzo and Ojah (2009) show that the
greatest percentage of debt in a sample of African countries they studied is made up
of short-term debts as opposed to long-term debts. This study therefore, will consider
disaggregation of debt into short and long-term debts.
Moreover, the importance of the study is to link other concepts related to debt in
assessing leveraged stock returns. For instance, it is difficult to talk of debt without
incorporating interest rate. There is a negative relationship between interest rate and
stock returns (Fama and Schwert, 1977 and Muradoglu and Sivaprasad, 2011).
Another debt related concept is firm age, the relationship between debt and age is
inseparable (Gwatidzo and Ojah, 2009 and Gomes and Schmid, 2010).
1.5 Ways of Achieving the Objectives of the Study
The analysis uses a panel data of all firms listed on the JSE that has balanced data for
the period 2001 to 2010. The data are obtained from McGregor-BFA database and I-
Net Bridge. The analysis aims to investigate leverage-cum-stock returns relationship
at firm level. However, dividing firms into panel samples of different economic
sectors, for instance: mining, banking etc. helps to assess whether or not the effect of
leverage on stock returns is sector driven. The statistical analysis is based on standard
econometric models, such as Generalized Least Squares (GLS), Generalized Method
of Moments (GMM), and others.
1.6 Weaknesses of the Study
The study is not free of problems; some of the limitations include failure to include
all possible relevant variables in the proposed model. For instance, it is important to
investigate the effect of credit ratings, public and private debt on stock returns but
due to problems of getting data, some of these are excluded from this study. The
other problem is that firms do not have same financial year end and these year ends

15
do not coincide with the calendar year end. To overcome this some variables are
lagged.
The problem of multicollinearity affects the model since many of the explanatory
variables are highly correlated with one another. To overcome this problem, some of
the explanatory variables are to be transformed and some will not enter in the analysis
at the same time. Thus, these anomalies might influence the results of the study. The
study does not include delisted stocks but only incorporates stocks with complete data
for the period under study. This might lead to a problem of survival bias, the bias of
not including inactive stocks (Haugen and Baker, 1996) and in this case might mean
the bias of not including delisted stocks.
1.7 Outline of the Study
The remainder of the study is structured as follows: chapter 2 reviews in detail
literature on the subject matter, both traditional theories and empirical findings. The
methodology of the study is presented in chapter 3; this section discusses the
proposed analytical models which are appropriate variants of a regression model. It
also discusses data sources and how the data are incorporated to fit the models.
Results are presented in chapter 4, followed by an interpretation of these results and
an examination of how well documented results answer the research questions.
Chapter 5 is the conclusion section which closes the study with recommendations
drawn from the results.

16
CHAPTER 2
2. LITERATURE REVIEW
2.1 Background
The effect of leverage on stock returns is a study that has received much attention
from financial researchers recently (e.g., Bhandari, 1988; Datta et al, 2000; Jandik
and Makhija, 2005; and Gomes and Schmid, 2010; and many others). The literature
on leveraged stock returns, both theoretical and empirical findings, has shown mixed
results.
2.2 The Capital Structure
The composition of the capital structure of a firm can determine how risk, the
business is. Higher debt levels as compared to equity financing has a problem in itself
during financial distress and times where the business fails to meet its financial
obligations. This poses risk to the firm and there is trade-off between risk and return
on investment. Penman (2007) shows that it does not matter whether book or market
values of equity are used to calculate the leverage ratio; they have no effect in
influencing the value of equity. The value of equity is made up of the value of net
operating assets and the value of net financial obligation. The net financial obligation
does not change with the new issue of debt as the net financial expense will be equal
to the required cost of net debt (Penman, 2007). Therefore, debt financing does not
add value to the value of equity since expected borrowing costs are equal to the cost
of debt. Thus, leverage does not influence stock returns, Penman argues.
According to Penman (2007), equity value is given by subtracting the value of the net
financial obligations ( ) from the value of net operating assets ( ). This
means that the capital structure of a firm plays a role in valuing equity, although debt
financing does not add value to equity financing. This might mean also that debt has

17
no influence on stock returns. Penman (2007) comes up with a number of equations
in trying to explain that it is not debt issuance that increases the value of equity.
Using the residual earnings model for valuing equity, the value of equity is made up
of residual operating income (ReOI) and residual net financial expense (ReNFE).
a) ReOI which is generated from net operating assets (NOA) and is also referred
to as the economic profit. ReOI is given by the following formula:
ReOIt = Operating income (after tax) – Required income on NOA (2.1)
= OIt – ( F – 1) NOAt-1
Where
F = 1 plus the cost of capital for operating activities
Residual operating income is used to calculate the value of operations or the firm
( ) in the following relationship:
= NOA0 + + + ….. + + (2.2)
Where:
CVT = the continuing value which is the expected residual income after the
valuation horizon.
The continuing value depends on growth of residual operating income thus giving
different continuing values.
b) Residual net financial expense (ReNFE) generated by net financial obligations
(NFO) is obtained by the following relationship:
ReNFE = Net financial expense – Required cost of net debt (2.3)
= NFEt – ( D – 1) NFOt-1
Where:
D = 1 plus cost of capital for net debt

18
Using residual net financial expense, we can determine the value of the net financial
obligation ( ), as follows:
= NFO + Present value of expected residual net financial expense (2.4)
= NFO + + + ….. +
If the NFO is measured at market value, ReNFE will be equal to zero; that is, the net
financial expense will be equal to the required cost of net debt (e.g., Casey, 2001 and
Penman, 2007). The book value of the net financial obligations is also the value of
net financial obligations. Therefore, debt financing does not add value to the value of
equity since expected borrowing costs are equal to the cost of debt. This might mean
that changes in leverage do not have an effect in influencing stock returns
movements.
From the study by Modigliani and Miller (1958), their “Proposition II” shows that the
cost of equity is affected by changing the firm‟s capital structure. The increase in debt
increases equity risk, which in turn leads investor to increase the required rate of
return on equity. Thus, there is a positive relationship between stock returns and debt
increases (e.g., Modigliani and Miller, 1958 and Gomes and Schmid, 2010).
Modigliani and Miller (1958) note that leverage does not change the weighted
average cost of capital, there is a trade-off between cost of debt and cost of equity.
Muradoglu and Sivaprasad (2011) claim that highly leveraged firms pass the risk of
leverage to equity holders meaning that the equity required rate of return will be
higher. Thus, there is a positive relationship between stock returns and debt increases.
The use of debt in the firm‟s activities is of importance in explaining stock returns
and complex investment decisions (e.g., Gomes and Schmid, 2010). Gomes and
Schmid (2010) find that if leverage is used to offset changes in equity, debt financing
can increase the firm‟s asset base during the growth phase. This lowers business risk
19
of the firm which in turn entice investors to invest in the firm, hence reinforcing the
notion that stock returns increase with leverage.
The positive influence of capital structure changes on stock returns were noted by
Jandik and Makhija (2005). They show that firms with an increasing debt level in the
capital structure, mostly underperforms those with a decreasing debt level by almost
60%. They also note that for firms under takeover threat, total leverage positively
affects their long term stock returns.
2.3 Leverage
Leverage financing is risky and according to Bhandari (1998), it is an approximation
of common equity risk if there is no clear measure of risk that is the beta of the firm.
Bhandari (1988) shows that if beta is an inadequate measure of risk, the debt to equity
ratio will be a better proxy for risk. There are many measures of leverage, this study
uses leverage factor whilst Jain (1982), Bhandari (1988) and Casey (2001) use debt to
equity as a measure of leverage. Others use total debt as a measure of leverage. Casey
(2001) claims that if the debt to equity ratio is in the range of 0:0.5; the return on
equity does not respond to changes in the capital structure. This implies that there is a
certain level of leverage that does not causes changes in stock returns. The work by
Jain (1982) shows an existence of a weak relationship between debt to equity ratio
and abnormal stock returns.
Given the notion high risk high returns, it follows that a positive relationship exists
between stock returns and leverage (i.e. debt to equity). However, Yang et al. (2010)
show that leverage is negatively related to stock returns. They show that if the stock
prices are high, firms use the market timing theory when making capital structure
decisions instead of the pecking order theory. Firms can raise more funds from share
issuance when stock prices are high giving a negative relationship between leverage
and stock returns.
20
Highly positive correlation exists between debt to equity ratio and probability of
bankruptcy (e.g., Bhandari, 1988). Firms prefer low levels of leverage as avoidance
of bankruptcy and to continue enjoying extended credit lines (e.g., Muradoglu and
Sivaprasad, 2011). An increase in the leverage ratio increases the probability of
bankruptcy which increases the risk of default by the firm. Bankruptcy is when the
future cash flows generated by assets of a firm are less than the value of the current
debts of the firm (e.g., Casey, 2001).
In situations where the tax rate is high, debt financing act as a tax shield since interest
expense is tax deductable. Firms can be caught up in a paradox of increasing debt
financing to enjoy tax benefits at the expense of increasing the risk profile of the firm.
Johnson et al. (2011) note that debt magnifies systematic risk exposures hence
pushing up expected equity returns. Thus firms are caught up in a dilemma of
determining the optimal capital structure. George and Hwang (2009) show that the
optimal capital structure depends on expected bankruptcy costs.
Muradoglu and Sivaprasad (2011) show that abnormal stock returns fall with firm
gearing, upon using UK firms‟ cross-sectional data, with the exception of the utilities
sector due to regulation which shield them from financial distress. Leverage and
stock returns relationship is enhanced by industrial characteristics, thus leveraged
stock returns effect is not a one-size-fit-all for all industries. Muradoglu and
Sivaprasad (2011) separated leverage (i.e. gearing) into firm and industry leverage as
estimators of stock returns to see which is more significant. Their results are
presented in Table 2.1 which shows the descriptive statistics. Table 2.2 shows the
regression results of firm leverage and industrial leverage on stock returns as
illustrated below. Muradoglu and Sivaprasad (2011) find that stock returns decrease
with firm leverage but increase with industry leverage, more so industrial leverage
has more explanatory power. It makes sense if one particularly views industry
leverage as a proxy for target (optimal) leverage or capital structure for firms in the
industry.

21
Table 2.1 Descriptive Statistics (Literature Review)
Source: Adopted from Muradoglu and Sivaprasad (2011).

22
Table 2.2 Industrial Regression Results (Literature Review)
Source: Adopted from Muradoglu and Sivaprasad (2011).
2.4 Short Term and Long Term Debt
An important investigation is the classification of debt into short and long-term, for
fuller explanation of stock returns movements. Datta et al. (2000) note that short term
debt reduces borrowing costs, thus debt maturity is of relevance in explaining stock
price performance. This is in agreement with the work by Gwatidzo and Ojah (2009)
on capital structure composition of companies in five African countries. They show
that short-term debt forms the highest percentage of debt in African companies. Long
and short-term debt are not priced the same if insider information is superior to
23
publicly available information (Datta et al. (2000). The differential pricing means that
one source of debt can have more influence in explaining stock returns than the other.
Fama and French (1989) show that stock returns are commonly tracked by bond
maturity. Also Casey (2001) claims that as the debt maturity increases, the expected
dividends to be received during the life span of the debt decreases due to the
probability of insolvency. There is a negative relationship between maturity and stock
returns; also high quality firms tend to issue short term debt as compared to low
quality firms (Datta et al., 2000). Guedes and Opler (1996) show that high growth
firms rely on short-term debt.
What also lead most firms to use short term debt as compared to long term debt is
that it is cheaper to access. Bonds usually make the bulk of long term debt and there
is a positive relationship between a bond‟s yield and its maturity. Thus, the yield to
maturity of a bond increases with an increase in bond maturity. As the life of bond
lengthens, the risk of default increases which in turn increases the return to be asked
by investors. Researchers such as Fama and French (1989); Fama and French (1993),
show that bond returns cause variations in stock returns, taking into account default
spread and term spread on a bond. The presence of debt in the form of bonds in the
firm‟s books might explain movements in the stock returns.
2.5 January Effect
If the analysis of the influence of leverage on stock returns is carried out on a
monthly period, the positive effect of leverage on stock returns is mostly noticed in
January (e.g., Bhandari 1988); this is because of the January effect. The selling of
stocks by portfolio managers during the year peaks in January and this is known as
the January effect. Portfolio managers will be shading off underperforming stocks
from end of the previous year and acquiring those that have good prospects: taking
advantage of the tax concession.

24
Moreover, Jordan and Miller (2009) note that the January effect is not important
because it is not an industry wide phenomenon since it mainly affect small capitalized
stocks. The findings by Fama and French (1992) also show that the January effect is
weak except for small stocks due to the absorption of returns by strong seasonal risk
factors (see also Roll, 1983 and Keim, 1983).
2.6 Private and Public Debt
It is important to analyse the debt composition into different categories such as
private and public debt. Datta et al. (2000) show that private debt has more
controlling powers on firm‟s activities than an arm‟s length debt. An arm‟s length
debt requires less monitoring than short term debt, indicating lower prospects of the
firm (e.g., Datta et al., 2000) and this might have an influence on stock returns. Using
data of US firms for the period 1971-1994, Datta et al. (2000) show a negative
relationship between the long-run stock returns and the maturity of public debt.
The source of debt should be factored in when examining leveraged stock returns.
Banks usually monitor loans issued to companies. The controlling effect might mean
that those granted the loans are financially sound and secured, hence investors want
to be associated with those companies, driving stock returns up. Information
asymmetry is a problem when deciding whether o use private or public debt (Ojah
and Pillay, 2009). Private debt is more effective than public debt due to the
controlling effect by private lenders (Ojah and Pillay, 2009). Thus, the effect of
private and public debt on stock returns might not be the same.
James (1987), Lummer and McConnell (1989) and Billett et al. (1995) claim that
stock returns are positively affected by additional bank debt with an insignificant
influence when public debt is introduced (e.g., James, 1987). Jandik and Makhija
(2005) claim that bank loans lead to a low adverse effect on stock returns than non-
bank debt. Thus, firms with bank debt perform better than those with non-bank debt

25
due to stricter monitoring by banks than other lenders. However, analyzing debt
sources is constrained the non-availability of data.
2.7 Firm Size and Stock Returns
The relationship between size and stock returns is not new (e.g., Fama and French,
1992; Van Rensburg, 1998; Van Rensburg and Robertson, 2003 and Muradoglu and
Sivaprasad, 2011). There is a positive correlation between size and debt. Gomes and
Schmid (2010) show also a positive relationship between size and leverage although
they took the sales figure and asset base as a proxy to size. Whilst Ojah and Manrique
(2005) document a positive relationship between size and private bank loans on
Spanish companies.
Larger firms can access debt easier than small firms. Thus, larger firms tend to have
high debt levels. The positive correlation between debt and size is due to the fact that
larger firms can diversify with low probability of default. The casualty between debt
and size can be manipulated and one might assume that debt have also an influence
on stock returns.
2.8 Credit Rating and Default Probabilities
Credit rating agencies have a strong influence on the cost of funding of rated firms. If
financial markets are in the semi-strong form of the efficient market hypothesis,
credit rating changes do not have an influence on stock prices (e.g., Kraussl, 2005).
Most of the information used for rating is publicly available information, although
new information can also be revealed (e.g., Kraussl, 2005). However, Kraussl (2005)
argues that because of problems of asymmetric information in emerging markets, the
effect of credit rating is strongly felt.
Credit rating agencies aid financial market volatility by worsening or enhancing
performance through downgrading or upgrading. These changes in credit ratings
might influence movements in the stock returns. Default probabilities are used to

26
determine credit ratings. Thus, default probabilities will be used in place of credit
ratings as they are easy to determine.
Dichev (1998) documents that default probabilities have an inverse relationship with
stock returns. The argument forwarded being that default probabilities decrease the
cost of equity capital which supports the negative relationship notion. However,
Chava and Purnanandam (2010) show that a positive relationship exist between stock
returns and default probabilities. This is in contrast to the negative relationship
findings by many earlier using stock return data prior to the 1980s (Chava and
Purnanandam, 2010). In this study financial distress was taken as a proxy of default
probability.
2.9 Age
Age is an indispensable phenomenon of leverage. Mature firm can easily access loans
because they are safer due to a long built reputation and they are less risky as
compared to young and growing firms. The debt-age relationship is also supported by
Gwatidzo and Ojah (2009). Datta et al. (2000) shows that firms tend to rely on debt
issuance as they grow old. Nevertheless, infant firms with lack of funds pin their
hopes on borrowed funds. Thus, infant firms tend to be highly levered, although it
might be a problem for them to access debt funds. Ojah and Manrique (2005)
document a negative relationship between privately non-bank debt and firm age.
Therefore, it is important to incorporate age in any model that takes debt as an
explanatory variable.
2.10 Interest Rates
The inverse relationship between interest rates and bond prices overlaps to stock
returns. As interest rates fall bond prices increase, with investors and portfolio
managers shifting their holdings in bonds to stocks. Interest rates are used to discount
firms‟ present and future stock prices (cash flows). As interest rates increases, the net
27
present value of stock prices falls giving a negative relationship between interest rates
and stock returns.
Bond returns and stock returns are highly correlated. Fama and French (1989) show
that variables that explain movements in bond returns and stock returns are the same.
Christe (1982) also note that the value of the firm is not independent from interest
rates. Thus interest rate and bond maturity can be used to predict movements on stock
returns. Regressing stock returns on the term structure, Fama and French (1993) show
that term structure explains variation in stock returns.
Using US monthly Treasury bill rate as the inflation rate, Fama and Schwert (1977)
show that there is a negative relationship which is not unitary, between stock returns
and the Treasury bill rate (inflation). The work of Ely and Robinson (1992)
consolidate the findings by Fama and Schwert (1977), they show a negative
relationship between stock returns and expected inflation. However, Gallagher and
Taylor (2002) note the existence of inflation and stock returns puzzle.
The findings by Muradoglu and Sivaprasad (2011) also show a negative relationship
between interest rate and stock returns. The inseparable marriage between debt and
interest rate support the argument that debt has an influence on stock returns. This
study however, tries to fill the gap on the on-going debate, whether leverage has an
effect on stock returns. Moreover, if leverage has an influence on stock returns, is the
effect negative or positive.

28
CHAPTER 3
3. DATA AND METHODOLOGY
3.1 Data Description
The study was carried out using time series panel data of stocks listed on JSE. Panel
data is superior and efficient to use than cross-sectional data (Greene, 2007; and
Gwatidzo and Ojah, 2009). The study examines the effects of leverage on stock
returns. Listed stocks on JSE with complete data for the period 2001- 2010 are
considered for the study, these accounts for 115 stocks (firms). Although listed stocks
might account for a small portion of the national corporate turnover, they are
important to the financial and academia community (Rajan and Zingales, 1995).
Listed stocks offer information superiority since it is difficult to access information of
unlisted stocks.
Stocks with missing information and extreme values are excluded from the study.
Gold mining stocks were excluded from the study because the model used to
calculate financial distress does not incorporate depleting asset and gold was taken as
a depleting asset. The financial information was for the year-end of each stock. The
stocks used in the analysis might not cover all sectors of JSE because information
availability was a basis for selection.
The following data are taken from I-Net Bridge: market capitalization (size), total
debt, short and long-term debt. Short-term debt for stocks in the banking sector was
found by subtracting long-term debt from total debt. Long-term debt except for the
banking sector was calculated by subtracting short-term debt from total debt.
Debt to equity ratio, financial distress data, stock prices, dividend yield, price to cash
flow and leverage factor are obtained from McGregor-BFA database. The financial
information is from year-end standardized financial statements for each stock. JSE
provided stocks listing dates that are used to calculate age of stocks. Yearly average

29
interest rates (Treasury bill rates) are accessed from International Monetary Fund‟s
(IMF) International Financial Statistics (IFS) database. The following table (3.1)
gives a summary of data to be used in the analysis.
Table 3.1 Summary of data
Firm-specific characteristics
Stock prices (Closing yearly figures)
Size (Number of shares outstanding multiplied by end of year closing share price)
Total debt (Total liability at year-end)
Short-term debt (Total current liabilities at year-end)
Long-term debt (Total liabilities greater than one year at year-end)
Debt to equity ratio (Total debt divided by total equity at year-end)
Leverage ratio (Total assets divided by total equity at year-end)
Financial distress (The probability of default score at year-end)
Price to cash flow (Year-end share price divided by cash flow per share)
Dividend yield (Dividends paid divided by the share price)
Age (Number of years from the date of listing to the year-end analysis date)
Macro-characteristics
Interest rates (Average yearly Treasury bill rates)
Source: Author

30
Most stocks have different year-end which also do not coincide with the calendar
year, some of the data are to be lagged. A maximum of 10 months lagging period is
used; this is for stocks that report their financial statements in February.
The value of the stock is derived on how the stock price has performed between
periods (i.e. the holding period returns). Stock prices can increase or decrease from
their initial period. Negative and positive stock returns occur if stock prices fall and
increase from their initial levels respectively. Stock returns are calculated from share
prices using the following capital gains formula.
Capital gains =
Where P1 = stock price in the current year
P0 = stock price in the previous year
Dividend yield is not added to capital gains to get total stock returns because in this
study dividend yield is taken as a factor that drives stock returns.
Size, total debt, short and long-term debt does not enter in the model as level values
but are transformed into first difference of their natural logarithms. This reduces the
effect of dealing with large numbers which distort the results. Taking for instance
size, it becomes easier to analyse large and small capitalized stocks together.
Standardizing data through data transformation has the advantage of removing
endogeneity between explanatory variables. Debt to equity ratio might be highly
correlated to the three different debt levels. The debt to equity ratio is obtained by
adding total long-term loan capital to total current liabilities, all divided by total
owners‟ interest. Moreover, total debt, short and long-term debt does not enter into
the model at the same time.
Interest rates used in the analysis are the yearly South African Treasury Bill rates,
starting from 2001. Age is given by the difference between the year of listing and the

31
period of study and level values are used for the study. The dividend yield is
calculated using the following relationship:
Dividend Yield = ((Ordinary Dividend / Number of Ordinary Shares in Issue at Year
End) / (Share Price at Company Financial Year End / 100)) *100
Financial distress measures the probability of financial distress. It is similar to the Z-
score (i.e. probability of default) model of Altman (1968)2. Higher negative values of
financial distress show higher chances of financial failure whereas positive values
indicate financial soundness. Financial distress (k) was calculated using the following
model developed by McGregor BFA:
k = 0.01662a + 0.0111b + 0.0529c + 0.086d + 0.0174e + 0.01071f - 0.0688811
Where:
a = total profit outside financing / total assets x 100%.
b = profit before interest and tax / average total assets x 100%.
c = (total current assets + listed investments) / total current liabilities.
d = profit after tax / average total assets at book value x 100%.
e = cash flow profit after tax / inflation-adjusted total assets at market value. 2 Altman (1968) Z-score:
Z = 0.012X1 + 0.014X2 + 0.033X3 + 0.006X4 +0.999X5
Where:
X1 = working capital/total assets,
X2 = retained earnings/total assets,
X3 = earnings before interest and taxes/total assets,
X4 = market value equity/book value of total liabilities,
X5 = sales/total assets, and
Z = overall index.

32
f = total inventory / inflation-adjusted total assets x 100%.
Price to cash flow ratio gives the future expectation of the firm‟s financial soundness.
Investors put their money in businesses that are financially healthy and sound. The
price to cash flow is given by the following relationship:
Price/cash flow = (Share Price at Company Financial Year End / 100) / ((Profit after
Taxation - Total Profits Extraordinary Nature + Items Not Representing Cash flow) /
Number of Ordinary Shares in Issue at Year End)
The leverage factor, the measure of leverage for this study can be seen as the equity
multiplier (i.e. total assets divided by equity). A higher leverage factor entails that a
firm has more debt in the capital structure. The leverage factor was calculated using
the following relationship:
Leverage Factor = (Profit after Taxation / Total Owners Interest) / ((Profit before
Interest and Tax (EBIT) - Total Profits Extraordinary Nature - Taxation) / Total
Assets)
3.2 Methodology
The study used econometric models to analyse the panel data. Some of the variables
in the model are transformed, thus, standardizing them and removing the problems of
endogeneity. The models are designed such that highly correlated explanatory
variables will not enter in one model. Highly correlated explanatory variables give
problems of multicollinearity hence giving biased estimates (Koop, 2006).
Correlation coefficient matrix will be run to check variables that are highly
correlated. The following models are used to answer the research questions:
REit=α+β1DEit+β2TDit+β3LRit+β4IRt+β5FSit+β6Ait+β7FDit+β8PCit+β8DYit+ωit (3.2)
REit=α+β1DEit+β2LDit+β3LRit+β4IRt+β5FSit+β6Ait+β7FDit+β8PCit+β9DYit+ωit (3.3)

33
REit=α+β1DEit+β2SDit+β3LRit+β4IRt+β5FSit+β6Ait+β7FDit+β8PCit+β9DYit+ωit (3.4)
Where:
REit = Stock returns of firm i in time t
α = Intercept of the model
β = Co-efficient of the explanatory variables
DEit = Debt to equity ratio of firm i in time t
TDit = First difference natural logarithm of total debt of firm i in time t
LDit = First difference natural logarithm of long-term debt of firm i in time t
SDit = First difference natural logarithm of short-term debt of firm i in time t
LRit = Leverage ratio of firm i in time t
IRt = Interest rates (Treasury bill rates) at year-end in time t
FSit = First difference natural logarithm of firm size of firm i in time t
Ait = Age of firm i in time t
FDit = Financial distress of firm i in time t
PCit = Price to cash flow of firm i in time t
DYit = Dividend yield of firm i in time t
ωit = error term
The three different types of debt will not enter into the model at once; hence three
models are developed to cater for this. The problem of multicollinearity between the
three types of debt is reduced by carrying out this exercise.
34
3.2.1 Regression Tests
Robust tests are conducted in an attempt to investigate the effects of leverage on
stock returns. This is to see how results changes with different tests. The following
regression tests are carried out in this study.
3.2.1.1 Pooled Least Squares
A pooled least squares regression is run to check the general relationship between
stock returns and the explanatory variables of the study. This serves as a primer to see
whether further robust tests were to be applied, only after the model and explanatory
variables proved significant. The pooled least squares regression assumes exogeneity
among explanatory variables and constant variance (homogeneity) in the error terms
(Greene, 2007). It also assumes that heterogeneity in the model have been averaged
out, giving unbiased estimates.
3.2.1.2 The Fixed Effects (FE) and Random Effects (RE) Model
The fixed effects regression model is used to ascertain which variables are significant
in explaining stock returns. The choice to use the FE model depends on the
assumptions about the error term. One of the assumptions is that an endogenous
relationship should exist between the error term and the explanatory variables for FE
to be used (Gwatidzo and Ojah, 2009). Another assumption is that there is no
correlation between the error terms.
Greene (2007) says that the FE model can be used if there are unobserved variables
that are correlated to the explanatory variables. These unobserved variables should be
stable over time. If unobserved variables are not included in the model, they lead to
biased results. The disadvantage of FE model is its elimination of time-variant
elements in the model (Deloof, 2003). An FE model should then be specified as
follows:

35
REit = βiXit + ci + ωit; where ci = αzi (3.5)
Where:
REit = Stock returns of firm i in time t
Xit = K explanatory variables of firm i in time t
zi = Unobserved variables correlated with the explanatory variables of firm i
α = Constant
βi = Co-efficient of the explanatory variables
ωit = error term
A regression will also be run using the RE model. As with FE model, the choice to
RE model depends on the assumptions made about the error term. If the assumption
is that error term is not correlated the explanatory variables, then a regression using
RE model is suitable. However, Gwatidzo and Ojah (2009) suggest that RE model is
suitable for sample regression that does not fully represent the population. Greene
(2007) says that if the unobserved variables are uncorrelated to the explanatory
variables, RE model gives unbiased results. Hence random heterogeneity elements
(i.e. group-specified variables) should be incorporated in the model. The RE model
can be specified as follows:
REit = α + βiXit + ui + ωit (3.6)
Where:
REit = Stock returns of firm i in time t
Xit = K explanatory variables of firm i in time t
ui = Group-specified random variables (similar to ωit) of firm i

36
α = Constant
βi = Co-efficient of the explanatory variables
ωit = error term
3.2.1.3 Generalized Method of Moments (GMM)
GMM is a statistical model of regression that uses moment equations to estimate
parameters. GMM involves data generation and it gives robust estimates although
using generated data with variations (Greene, 2007). Due to law of large numbers,
estimates produced by sample moment equations converge to population estimates.
The Stata computer statistical package has the command „gen‟ used to generate
variables. GMM‟s data-generating process includes time dummies in the regression
model. Thus, it tests which years in a series are significant. The importance of
including time dummies is to show which years are significant in explaining the
relationship between the dependent and the explanatory variables. Certain years can
be more instrumental in driving a relationship than others. It is also a robust measure
that checks variables that are consistently significant over time. The hypothesis is to
test which coefficients of the explanatory and years are significant.
3.2.2 Diagnostic Tests
These are rigorous and robust test that are carried out to remove problems associated
with panel time series data. Some of the problems of panel time series data include
cross-company dependence, non-stationary of the error term, serial correlation and
others. These problems violate the assumptions of regression models hence robust
test are performed to overcome these problems.
3.2.2.1 Hausman Test
The Hausman test is carried out to ascertain which model is suitable between FE and
RE. Most researchers use the Hausman test to check whether the effects are random

37
or fixed (Garcia-Teruel and Martinez-Solano, 2007). The Hausman test, test whether
there is correlation between the error term and the explanatory variables. The null
hypothesis is that the difference in coefficients is non-systematic. If there is an
endogenous relationship between the error term and explanatory variables then FE
model gives unbiased estimates. The RE model gives unbiased estimates if the error
term and the explanatory variables are unrelated.
3.2.2.2 Modified Wald Test for Heteroskedasticity
Non-stationarity of the error term gives problems of heteroskedasticity, hence
statistical inferences becomes unreliable. Heteroskedasticity means that the variance
of the error term is not constant overtime (Koop, 2006). This is a problem in time
series analysis. The presence of heteroskedasticity makes the regression estimates
(coefficients and standard errors) to be biased.
≠ for all i, (3.7)
A Modified Wald test for testing heteroskedasticity is used in all the three regression
models using the best model (FE and RE) as predicted by the Hausman test. The null
hypothesis is that there is homoskedasticity in the error term. The presence of
heteroskedasticity can be controlled by using the robust option during regression in
Stata computer package. Greene (2007) shows that heteroskedasticity can be tested
using White‟s General test or the Breusch–Pagan/Godfrey Lagrange-Multiplier test
when ordinary least squares (OLS) is used.
3.2.2.3 Pesaran CD Test
Pasaran CD test is a test for cross-company dependence. Stock returns for a firm can
be influenced by activities of other firms within the industry or outside. Take for
instance, a bank that have loaned huge funds to another company, the bad
performance of the loaned company‟s stock can indirectly affect the bank. This is

38
known as cross-company dependence. It is usually prone to time series panel
stretching more than 20-years. However, Pesaran (2004) argues that the test can be
run when time is short but as long as the number of data points is large.
The Pesaran CD test is used to test whether there is cross-company among the error
terms of different stocks. Contemporaneous correlation (cross-company dependence)
lead to biasness in regression estimates. The null hypothesis is that there is no
correlation between the error terms. If contemporaneous correlation exists, it needs to
be corrected by running Driscoll and Kraay regression.
3.2.2.4 Driscoll and Kraay Regression
Driscoll and Kraay regression is run using the best model predicted by the Hausman
test (i.e., between FE model and RE model). Driscoll and Kraay regression correct
the problem of contemporaneous correlation in time series panel data. Thus, the
statistical estimates will be only corrected from cross-company dependence, hence
other problems of panel time series data might still be present.
3.2.2.5 Lagram-Multiplier Test for Autocorrelation
The Lagram-Multiplier test is used to test panel first order autocorrelation. The
Lagram-Multiplier test uses Wooldridge test of autocorrelation in panel data.
Autocorrelation happens when the dependent variable can be explained by its lags
(i.e., stock returns for year-2001 can be explained by stock returns for year-2000).
Autocorrelation is a problem to time series panel stretching more than 20-years.
Autocorrelation is an estimation nuisance that causes standard errors and regression
estimates to be inefficient and biased. Estimation nuisance is viewed as an old-
fashioned view, whilst the modern view, models autocorrelation into the regression
model used for estimation. This is illustrated with the following simple model:
Yit = βXit+ρY1-it+vit where-1< ρ<1 (3.8)

39
The above model is a first order autoregressive (AR1) model.
Autocorrelation can be overcome by differencing the model. Variables then enter the
model as changes (i.e., subtracting the preceding year t value from the succeeding
year t value).
3.2.2.6 Allenaro-Bond Test and Sargan Test
An Allenaro-Bond test is used to test for autocorrelation in the differenced models.
REit=α+β1D.DEit+β2D.TDit+β3D.LRit+β4D.IRt+β5D.FSit+β6D.Ait+β7D.FDit+β8D.PCit+
β8D.DYit+β9REit-1+β10REit-2+ωit (3.9)
REit=α+β1D.DEit+β2D.LDit+β3D.LRit+β4D.IRt+β5D.FSit+β6D.Ait+β7D.FDit+β8D.PCit+
β8D.DYit+β9REit-1+β10REit-2+ωit (3.10)
REit=α+β1D.DEit+β2D.SDit+β3D.LRit+β4D.IRt+β5D.FSit+β6D.Ait+β7D.FDit+β8D.PCit+
β8D.DYit+β9REit-1+β10REit-2+ωit (3.11)
Where D. = differenced variable.
The null hypothesis is that autocorrelation in first difference disturbances is zero.
The Sargan test is run in conjunction with the Allenaro-Bond test. It tests for validity
of instruments (over-identifying restrictions) in the differenced model used by the
Allenaro-Bond test. The null hypothesis is that the over-identifying restrictions are
valid. Over and under-identification of explanatory variables in a regression model
can lead biasness in statistical inferences.
3.2.2.7 Prais-Winston Estimation
The Prais-Winston estimation is a regression that is run on time series panel data that
exhibit autocorrelation. Prais-Winston estimation is a correction of autocorrelation in
models that have autocorrelation. The estimates and standard errors obtained by this
40
regression model are free from problems of autocorrelations hence they are BLUE
(i.e., best linear unbiased estimator).
The Prais-Winston estimation has an option to use the Cochrane-Orcutt first order
autoregressive (AR1) regression model that gives iterated regression estimates. The
Cochrane-Orcutt option is seen as a way of introducing robustness in the Prais-
Winston estimation.
Different regression models will be run including the FE and GMM models to give a
thorough analysis. Robustness will be enhanced by employing robust checks to detect
and correct endogeneity problems such as heteroskedasticity, autocorrelation and
cross-company dependence. All these tests and checks are conducted to given
unbiased estimates.
41
CHAPTER 4
4. RESULTS AND DISCUSSION
This section reports empirical findings of the study, which investigates the
relationship between stock returns and leverage in South African. Numerous robust
tests have been carried out to provide answers to questions of the study.
4.1 Descriptive Statistics
Variables with zero values are reported as having missing observations. Price to cash
flow values that are extremely large are automatically excluded by the system (Stata
computer package), hence resulting in 1150 usable firm data. Price to cash flow,
leverage factor, and age, show the most variability. The mean stock returns for the
panel is 23.11% and the minimum and maximum values for price to cash flow ratio
are -421.05 and 917.97 respectively.
Age of firms varies from the minimum of 1-year to a maximum of 50-years. The
mean age for firms in the analysis is approximately 30-years. There are some stocks
that do not pay dividends. The minimum dividend yield is zero and a maximum of
78.43%, whilst the mean dividend is almost 4%. Table 4.1 gives a summary of the
descriptive statistics of the variables used in the study. The statistical package used
shortened the naming of some variables.

42
Table 4.1 Descriptive Statistics
shorttermd~t 1150 .1243318 .3995021 -2.750676 3.524657longtermdebt 1150 1.09e+08 2.56e+09 -23.07558 8.59e+10 totaldebt 1150 .1385394 .2898266 -3.153972 3.43374financiald~s 1150 1.041874 2.618216 -31.8433 43.5899 age 1150 29.71739 18.06918 1 50dividendyi~d 1150 3.541104 4.191605 0 78.43interestra~s 1150 8.7475 1.668769 6.42 11.1625 pricecashf~w 1147 10.24527 51.56808 -421.05 917.97leveragefa~r 1149 2.599038 21.57253 -345.8 391.15 debtequity 1149 2.630796 8.101076 -72.88 153.23 size 1150 .1728235 .4526177 -1.983136 2.394199stockreturns 1150 .2310848 .4573402 -.873065 3.729885 Variable Obs Mean Std. Dev. Min Max
Source: Author
4.2 Correlation Coefficient Matrix
The correlation coefficient matrix shows how variables are correlated. Size is highly
correlated with stock returns, about 74.88% of correlation coefficient between them.
Whilst the relationship between stock returns and leverage factor is zero, the highest
correlation of about 67% among explanatory variables is between total and short-term
debts. Highly correlated explanatory variables will not be incorporated into the same
model as doing so will give rise to problems of multicollinearity. Multicollinearity
gives regression estimates that are biased (Koop, 2006). The following variables are
negatively correlated to stock returns: debt to equity ratio, interest rates, dividend
yield and age. Table 4.2 gives a summary of correlation coefficients of variables.

43
Table 4.2 Correlation Coefficient Matrix
shorttermd~t 0.1267 0.1607 0.0580 -0.0975 0.0268 0.0568 -0.1289 -0.0902 -0.0251 0.6681 0.1869 1.0000longtermdebt 0.0295 0.0262 -0.0042 0.0007 -0.0039 0.0133 -0.0263 0.0308 -0.0110 0.2962 1.0000 totaldebt 0.1783 0.2631 0.0265 -0.0922 0.0351 0.0352 -0.1056 -0.1009 0.0868 1.0000financiald~s 0.1085 0.0782 -0.0879 0.0140 -0.0175 0.0398 0.0040 -0.0931 1.0000 age -0.0790 -0.0558 -0.0003 -0.0160 -0.0538 -0.0773 0.0620 1.0000dividendyi~d -0.1109 -0.1041 -0.0256 0.0351 0.0984 0.0965 1.0000interestra~s -0.2531 -0.2455 0.0342 0.0349 -0.0074 1.0000pricecashf~w 0.0147 0.0442 -0.0034 -0.0294 1.0000leveragefa~r 0.0000 -0.0687 0.3179 1.0000 debtequity -0.0231 0.0014 1.0000 size 0.7488 1.0000stockreturns 1.0000 stockr~s size debteq~y levera~r pricec~w intere~s divide~d age financ~s totald~t longte~t shortt~t
Source: Author
4.3 Regression Results
The Hausman test is carried out to ascertain which model is suitable between FE and
RE. It tests whether there is correlation between the error term and the explanatory
variables. If there is an endogenous relationship between the error term and
explanatory variables then FE model gives unbiased estimates. The RE model gives
unbiased estimates if the error term and the explanatory variables are unrelated.
The Hausman test results are presented in Table 4.3. The test suggests that FE model
is superior to RE model. FE model is the best for this study since Prob>chi2 is
significantly less than 5% in all three models. This shows that an endogenous
relationship exist between the error term and the independent variables.

44
Table 4.3 Hausman Test
(V_b-V_B is not positive definite) Prob>chi2 = 0.0000 = 48.92 chi2(9) = (b-B)'[(V_b-V_B)^(-1)](b-B)
Test: Ho: difference in coefficients not systematic
B = inconsistent under Ha, efficient under Ho; obtained from xtreg b = consistent under Ho and Ha; obtained from xtreg totaldebt -.0241697 -.0234903 -.0006795 .0092293financiald~s .0100939 .0083225 .0017714 .0015142 age -.0205236 -.0009932 -.0195303 .0036134dividendyi~d -.0013474 -.0031103 .0017629 .0011798interestra~s -.0410579 -.0209701 -.0200878 .0034596pricecashf~w -.0001075 -.0001272 .0000197 .0001102leveragefa~r .0013615 .0013271 .0000344 .0001473 debtequity -.0022683 -.0021187 -.0001495 .0006296 size .6916829 .738807 -.047124 .0072236 fixed random Difference S.E. (b) (B) (b-B) sqrt(diag(V_b-V_B)) Coefficients
As noted earlier, the choice of RE or FE model depends on the assumption made
about the relationship between the error term and the independent variables. The
common estimates are estimated using the FE model as shown by the Hausman test.
However, other statistical models are also used such as, pooled least squares and RE
model, as most studies do.
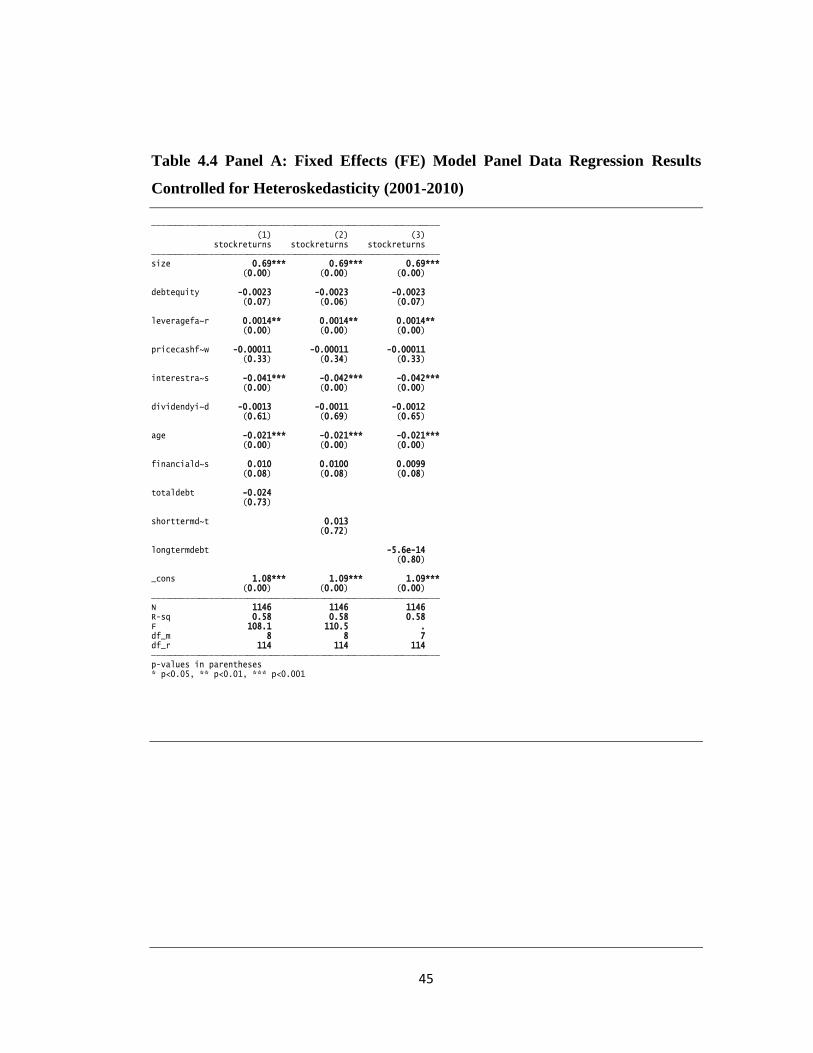
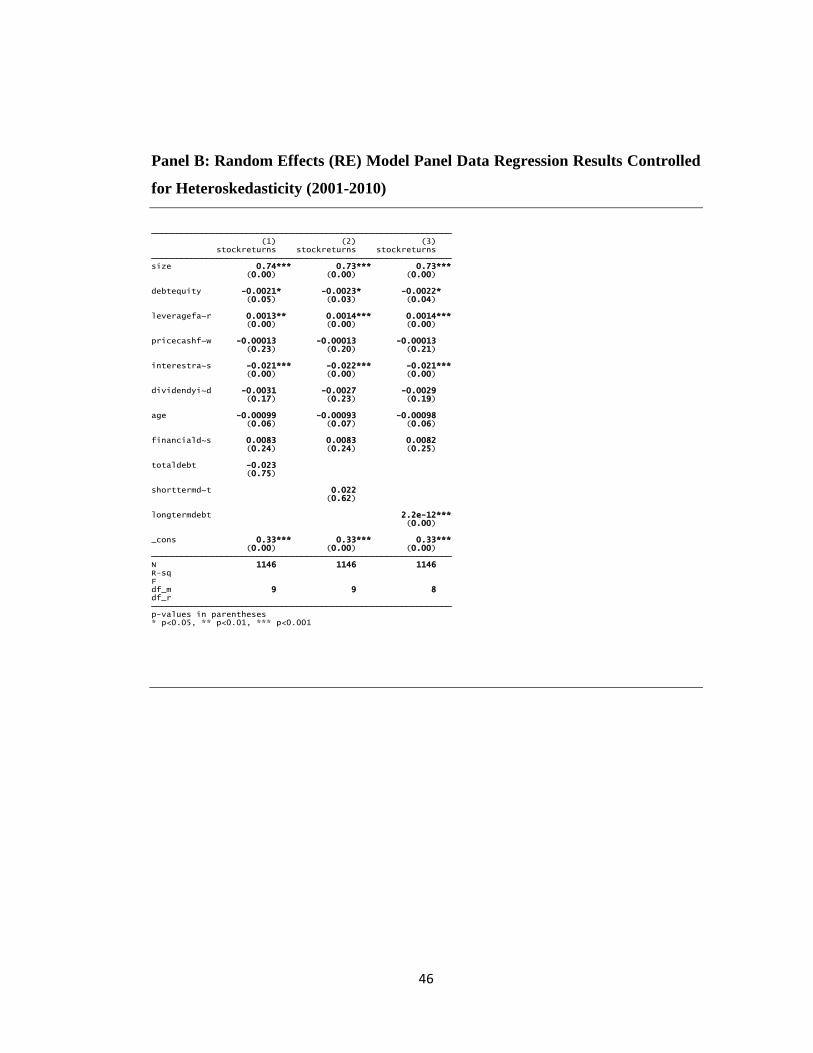
The pooled least squares regression results serve as a primer to indicate the general
relationship between stock returns and the explanatory variables. The regression
results are presented in Table 4.4. Panel A and B of Table 4.4 present the results of
FE and RE models with control for heteroskedasticity, whilst panel C presents pooled
regression results. For each model, a separate model is estimated for total debt, short-
term and long-term debts.
45
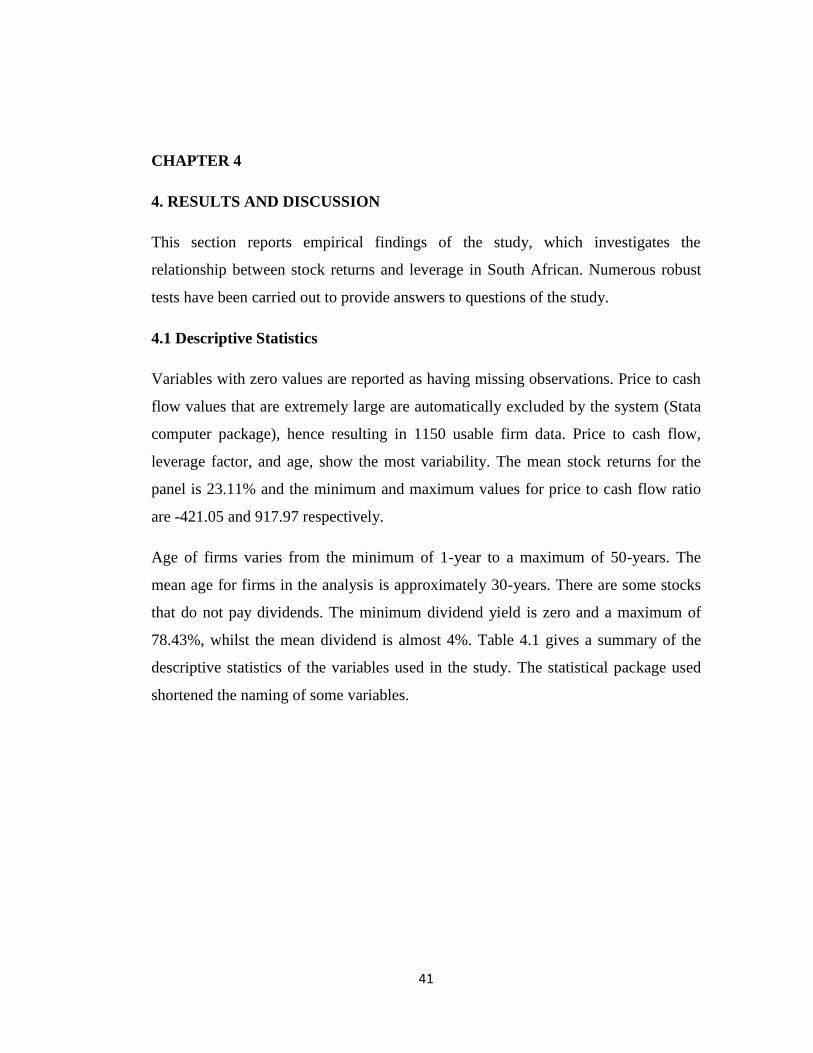
Table 4.4 Panel A: Fixed Effects (FE) Model Panel Data Regression Results
Controlled for Heteroskedasticity (2001-2010)
* p<0.05, ** p<0.01, *** p<0.001p-values in parentheses df_r 114 114 114 df_m 8 8 7 F 108.1 110.5 . R-sq 0.58 0.58 0.58 N 1146 1146 1146 (0.00) (0.00) (0.00) _cons 1.08*** 1.09*** 1.09***
(0.80) longtermdebt -5.6e-14
(0.72) shorttermd~t 0.013
(0.73) totaldebt -0.024
(0.08) (0.08) (0.08) financiald~s 0.010 0.0100 0.0099
(0.00) (0.00) (0.00) age -0.021*** -0.021*** -0.021***
(0.61) (0.69) (0.65) dividendyi~d -0.0013 -0.0011 -0.0012
(0.00) (0.00) (0.00) interestra~s -0.041*** -0.042*** -0.042***
(0.33) (0.34) (0.33) pricecashf~w -0.00011 -0.00011 -0.00011
(0.00) (0.00) (0.00) leveragefa~r 0.0014** 0.0014** 0.0014**
(0.07) (0.06) (0.07) debtequity -0.0023 -0.0023 -0.0023
(0.00) (0.00) (0.00) size 0.69*** 0.69*** 0.69*** stockreturns stockreturns stockreturns (1) (2) (3)
46
Panel B: Random Effects (RE) Model Panel Data Regression Results Controlled
for Heteroskedasticity (2001-2010)
* p<0.05, ** p<0.01, *** p<0.001p-values in parentheses df_r df_m 9 9 8 F R-sq N 1146 1146 1146 (0.00) (0.00) (0.00) _cons 0.33*** 0.33*** 0.33***
(0.00) longtermdebt 2.2e-12***
(0.62) shorttermd~t 0.022
(0.75) totaldebt -0.023
(0.24) (0.24) (0.25) financiald~s 0.0083 0.0083 0.0082
(0.06) (0.07) (0.06) age -0.00099 -0.00093 -0.00098
(0.17) (0.23) (0.19) dividendyi~d -0.0031 -0.0027 -0.0029
(0.00) (0.00) (0.00) interestra~s -0.021*** -0.022*** -0.021***
(0.23) (0.20) (0.21) pricecashf~w -0.00013 -0.00013 -0.00013
(0.00) (0.00) (0.00) leveragefa~r 0.0013** 0.0014*** 0.0014***
(0.05) (0.03) (0.04) debtequity -0.0021* -0.0023* -0.0022*
(0.00) (0.00) (0.00) size 0.74*** 0.73*** 0.73*** stockreturns stockreturns stockreturns (1) (2) (3)
47
Panel C: Pooled Least Squares Panel Data Regression Results (2001-2010)
* p<0.05, ** p<0.01, *** p<0.001p-values in parentheses df_r 1136 1136 1136 df_m 9 9 8 F 62.6 59.5 . R-sq 0.58 0.58 0.58 N 1146 1146 1146 (0.00) (0.00) (0.00) _cons 0.33*** 0.33*** 0.33***
(0.00) longtermdebt 2.2e-12***
(0.62) shorttermd~t 0.022
(0.75) totaldebt -0.023
(0.24) (0.24) (0.25) financiald~s 0.0083 0.0083 0.0082
(0.06) (0.07) (0.06) age -0.00099 -0.00093 -0.00098
(0.17) (0.23) (0.19) dividendyi~d -0.0031 -0.0027 -0.0029
(0.00) (0.00) (0.00) interestra~s -0.021*** -0.022*** -0.021***
(0.23) (0.20) (0.21) pricecashf~w -0.00013 -0.00013 -0.00013
(0.00) (0.00) (0.00) leveragefa~r 0.0013** 0.0014*** 0.0014***
(0.05) (0.03) (0.04) debtequity -0.0021* -0.0023* -0.0022*
(0.00) (0.00) (0.00) size 0.74*** 0.73*** 0.73*** stockreturns stockreturns stockreturns (1) (2) (3)
4.3.1 Leverage Factor
There is a positive relationship between stock returns and leverage. Leverage is
significant at the 1% level of significance, controlled for heteroskedasticity in all
regression models. High leverage factor entails high asset base, which is an indicator
of future growth opportunities (Ojah and Manrique, 2005). The empirical findings
conform to findings by Gomes and Schmid (2010). However, this contradicts
findings by Van Rensburg (1998) and Van Rensburg and Robertson (2003) also on

48
South Africa, who postulate a negative relationship between the two. Possible reasons
for contradictions with Van Rensburg (1998) and Van Rensburg and Robertson
(2003) can be attributed to the difference in data used in modelling and the difference
in time periods covered by the empirical findings. Van Rensburg (1998) and Van
Rensburg and Robertson (2003) use cross-sectional regression with no diagnostic
tests as opposed to this study which uses time-series panel regression with different
diagnostic tests, which might be a spring for contradictions.
If leverage is used to offset changes in equity, debt financing can increase the firm‟s
asset base during the growth phase. This lowers business risk of the firm which in
turn entice investors to invest in the firm, hence reinforcing the notion that stock
returns increase with leverage. Firms with high asset base take huge risks and high
stock prices will be a reward leading also to high stock returns.
Debt financing invites external control of firm assets from debt providers. Debt
issuers are interested in getting their investment back, hence monitoring of asset
enforce management to work effectively and efficiently. This can enhance
shareholder wealth creation. Moreover, shareholders are interested in firms that are
secured and monitoring might leads to secured investments. This might explain the
positive relationship between leverage and stock returns.
When stock prices are high, it implies that the required rate of returns on stocks is
low. Firms wishing to raise additional finance might face difficulties as investors will
not be willing take up such investments. This means that firms will not have a choice
but to use debt financing. This might explain the positive relationship between stock
returns and leverage.
4.3.2 Size
There is a positive relationship between change in size and stock returns. Change in
size is significant at 1% level of significant in all three regression models. This is

49
robust to all regression specifications (i.e. pooled, RE and FE models). Growing firms
show a positive change in size, thus investors are more inclined with growing firms.
An increase in firm size does not only mean an increase in the number of equity
holders but due to an increase in stock prices, implying that stock returns increase
with change in size. This is parallel to results by Van Rensburg and Robertson
(2003) and others as they used logged size instead of changes in size.
4.3.3 Interest Rates
There is a negative relationship between interest rates and stock returns. Interest rates
are significant at 1% level in all three models and for all regression specifications
(i.e., pooled, RE and FE models). The results confirm the findings by Fama and
Schwert (1977), Muradoglu and Sivaprasad (2011) and others.
The inverse relationship between stock returns and interest rates is an indirect
extension of bond prices and interest rates relationship. As interest rates fall bond
prices increase, with investors and portfolio managers shifting their holdings in bonds
to stocks. Interest rates are used to discount firms‟ future debt services (cash flows).
As interest rates increases, the present value of debt contracts fall. Higher interest
rates increase obligatory commitments of firms, reducing future expected cash-flows
and stock returns.
4.3.4 Age
Age is negatively related to stock returns implying that young firms have higher stock
returns as compared to older (mature) firms. Young firms are eager to grow hence
take more growth-oriented (risky) investments than older (more established) firms.
Moreover, young firms have room for growth as they are usually at early stage of
their life cycle as opposed to older firms who have reached their peak.
The age stock returns inverse relationship can be manipulated to the inverse
relationship between stock returns and leverage. Implying that highly levered firms
50
are young and rely mainly on debt financing as equity investors will be reluctant to
invest in these risky young firms. Age is statistically significant at the 1% level in all
the three models of the FE model even when heteroskedasticity has been controlled.
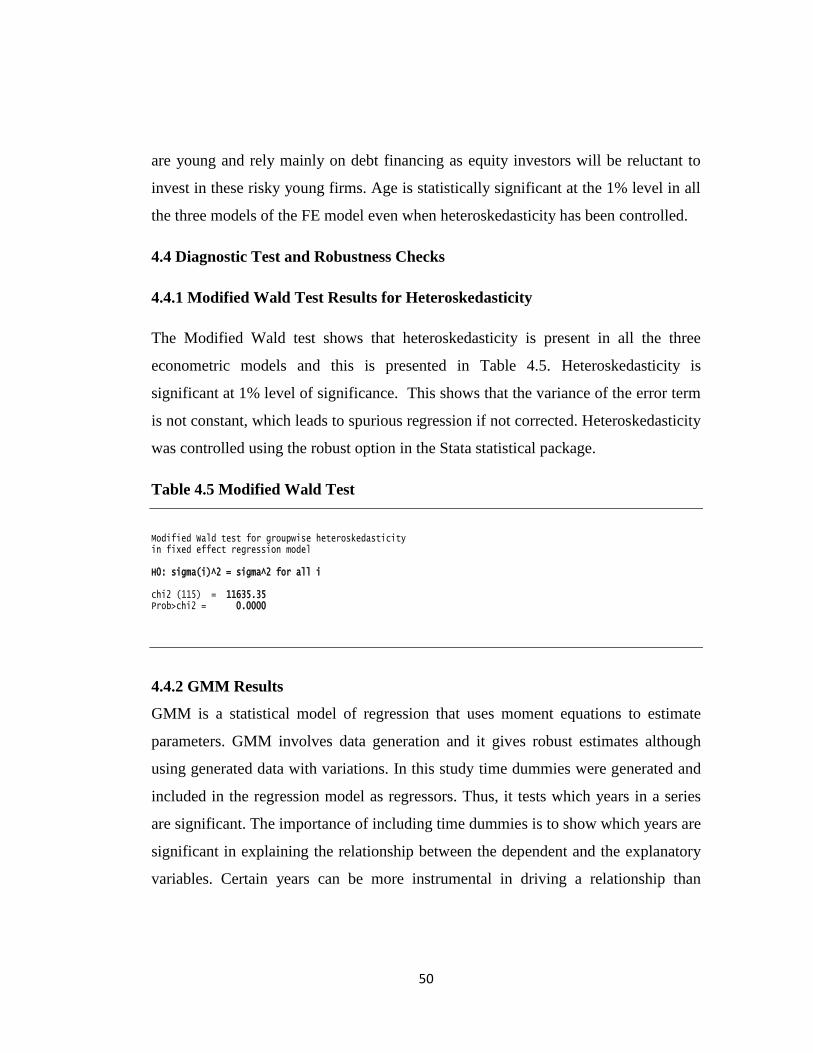
4.4 Diagnostic Test and Robustness Checks
4.4.1 Modified Wald Test Results for Heteroskedasticity
The Modified Wald test shows that heteroskedasticity is present in all the three
econometric models and this is presented in Table 4.5. Heteroskedasticity is
significant at 1% level of significance. This shows that the variance of the error term
is not constant, which leads to spurious regression if not corrected. Heteroskedasticity
was controlled using the robust option in the Stata statistical package.
Table 4.5 Modified Wald Test
Prob>chi2 = 0.0000chi2 (115) = 11635.35
H0: sigma(i)^2 = sigma^2 for all i
in fixed effect regression modelModified Wald test for groupwise heteroskedasticity
4.4.2 GMM Results
GMM is a statistical model of regression that uses moment equations to estimate
parameters. GMM involves data generation and it gives robust estimates although
using generated data with variations. In this study time dummies were generated and
included in the regression model as regressors. Thus, it tests which years in a series
are significant. The importance of including time dummies is to show which years are
significant in explaining the relationship between the dependent and the explanatory
variables. Certain years can be more instrumental in driving a relationship than

51
others. It is also a robust measure that checks variables that are consistently
significant over time.
The findings of GMM show that lagged stock returns (i.e., one period), size, interest
rates, and financial distress are the only variables that are significant at 10% level.
2004, 2006 and 2008 are the only time dummies that significant at 10% level. Thus,
the relationship in the models holds in years 2004, 2006 and 2008. The GMM results
are presented in Table 4.6.
Table 4.6 GMM Results
* p<0.10, ** p<0.05, *** p<0.01t statistics in parentheses Observations 1032 1032 1032 (1.40) (1.40) (1.96) Constant 0.948 0.794 1.332**
(-0.58) Long-Term Debt -1.98e-10
(1.50) Short-Term Debt 0.420
(-1.25) (-1.46) (-1.68) year==2008 -0.232 -0.249 -0.306*
(-0.41) (-0.54) (-0.65) year==2007 -0.0563 -0.0670 -0.0650
(-1.81) (-1.78) (-1.62) year==2006 -0.218* -0.192* -0.229
(-0.51) (-0.25) (-0.31) year==2005 -0.0460 -0.0198 -0.0231
(1.80) (1.83) (2.26) year==2004 0.211* 0.189* 0.290**
(1.28) (0.81) (1.53) year==2003 0.130 0.0780 0.152
(-0.17) (-0.27) (0.53) year==2002 -0.0209 -0.0313 0.0447
(1.10) Total Debt 0.541
(1.33) (1.35) (1.65) Financial Dist~s 0.0640 0.0660 0.0692*
(-0.47) (-0.41) (-0.70) Age -0.00341 -0.00252 -0.00485
(0.95) (0.93) (-0.01) Dividend Yield 0.0229 0.0248 -0.000161
(-1.68) (-1.62) (-2.04) Interest Rates -0.0818* -0.0692 -0.105**
(-0.88) (-0.85) (-1.17) Price / Cash F~w -0.0127 -0.0109 -0.00866
(-1.05) (-0.85) (-1.27) Leverage Factor -0.0117 -0.00939 -0.0151
(-0.30) (-0.22) (-0.32) Debt / Equity -0.00761 -0.00533 -0.00706
(1.79) (2.18) (0.81) Size 0.593* 0.591** 0.304
(0.71) (1.01) (1.93) L.Stock Returns 0.0941 0.115 0.229* A B C Dynamic Panel results

52
4.4.3 Driscoll and Kraay Regression Results
Driscoll and Kraay regression was carried out to address the problem of cross-
company dependence in panel data after the Pesaran CD test showed the presence of
cross-company dependence. Cross-company dependence means that stock returns for
a firm can be influenced by activities of other firms within or outside the industry.
The supplier-client relationship plays a role in influencing stock returns of firms.
Presence of cross-company dependence leads to biasness in statistical estimates. The
findings of Driscoll and Kraay regression show that size, leverage and interest rates
are significant at 1% level whilst age is significant at 5% level.
4.4.4 Results for Wooldridge Test for Autocorrelation
The Wooldridge test shows that first order correlation is present in the panel data at
5% level of significant in all three models. This implies that stock returns are also
driven by at least one year past stock returns (i.e., past lags of stock returns). The
presence of autocorrelation shows that the series has a long memory. Reporting
regression results without correcting autocorrelation gives wrong inferences.
Autocorrelation can be reduced by transforming variables and lags of variables can
also be taken as explanatory variables.
4.4.5 Results for Allenaro-Bond Test and Sargan Test
The presence of first order autocorrelation was detected by the Wooldridge test as
seen before. To correct autocorrelation in the panel, the explanatory variables in the
three models were differenced and two lags of stock returns were also incorporated
using the Allenaro-Bond test. In all the three models, the Allenaro-Bond test shows
that first lag of stock returns, size, debt to equity ratio, interest rates, age and financial
distress are significant at 1% level whilst leverage is significant at 5% level. The
significance of first lagged stock returns conforms to the GMM findings on the same
variable. Thus, last period stock returns influence current stock returns. Allenaro-
Bond test also shows that if the models are differenced and include the first and
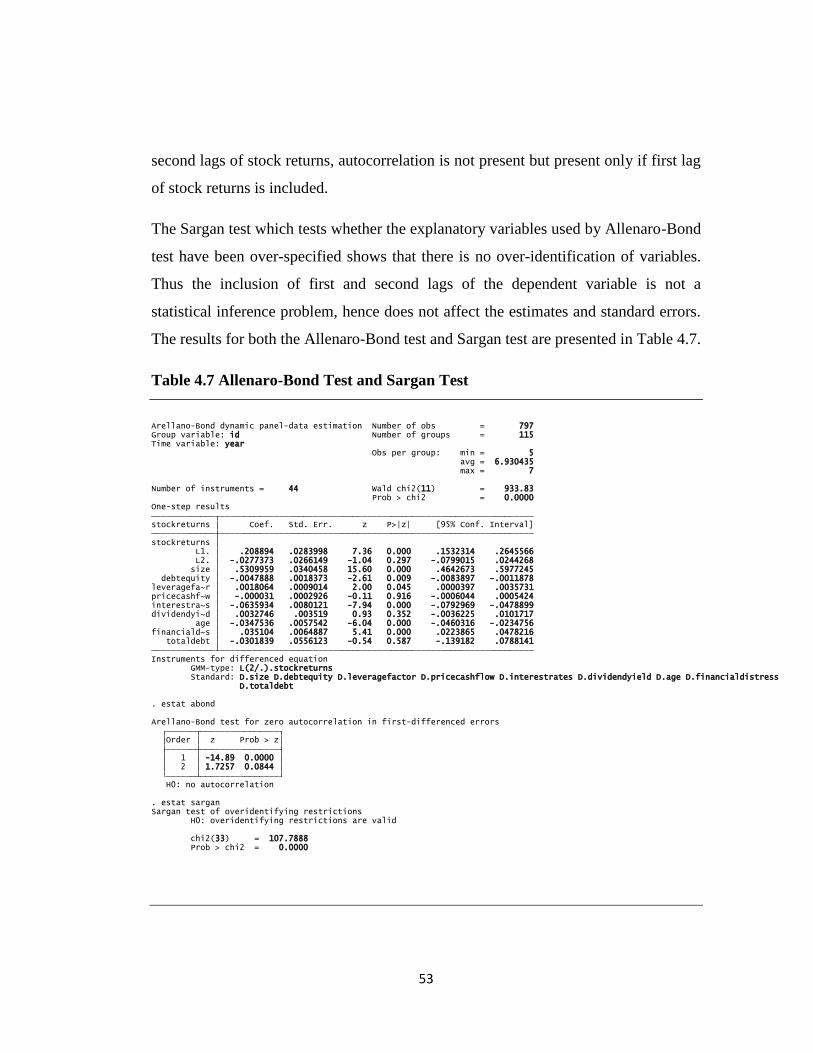
53
second lags of stock returns, autocorrelation is not present but present only if first lag
of stock returns is included.
The Sargan test which tests whether the explanatory variables used by Allenaro-Bond
test have been over-specified shows that there is no over-identification of variables.
Thus the inclusion of first and second lags of the dependent variable is not a
statistical inference problem, hence does not affect the estimates and standard errors.
The results for both the Allenaro-Bond test and Sargan test are presented in Table 4.7.
Table 4.7 Allenaro-Bond Test and Sargan Test
Prob > chi2 = 0.0000 chi2(33) = 107.7888
H0: overidentifying restrictions are validSargan test of overidentifying restrictions. estat sargan
H0: no autocorrelation 2 1.7257 0.0844 1 -14.89 0.0000 Order z Prob > z Arellano-Bond test for zero autocorrelation in first-differenced errors
. estat abond
D.totaldebt Standard: D.size D.debtequity D.leveragefactor D.pricecashflow D.interestrates D.dividendyield D.age D.financialdistress GMM-type: L(2/.).stockreturnsInstruments for differenced equation totaldebt -.0301839 .0556123 -0.54 0.587 -.139182 .0788141financiald~s .035104 .0064887 5.41 0.000 .0223865 .0478216 age -.0347536 .0057542 -6.04 0.000 -.0460316 -.0234756dividendyi~d .0032746 .003519 0.93 0.352 -.0036225 .0101717interestra~s -.0635934 .0080121 -7.94 0.000 -.0792969 -.0478899pricecashf~w -.000031 .0002926 -0.11 0.916 -.0006044 .0005424leveragefa~r .0018064 .0009014 2.00 0.045 .0000397 .0035731 debtequity -.0047888 .0018373 -2.61 0.009 -.0083897 -.0011878 size .5309959 .0340458 15.60 0.000 .4642673 .5977245 L2. -.0277373 .0266149 -1.04 0.297 -.0799015 .0244268 L1. .208894 .0283998 7.36 0.000 .1532314 .2645566stockreturns stockreturns Coef. Std. Err. z P>|z| [95% Conf. Interval] One-step results Prob > chi2 = 0.0000Number of instruments = 44 Wald chi2(11) = 933.83
max = 7 avg = 6.930435 Obs per group: min = 5Time variable: yearGroup variable: id Number of groups = 115Arellano-Bond dynamic panel-data estimation Number of obs = 797

54
4.4.6 Prais-Winston’s Autocorrelation Corrected Results
The results of Prais-Winston regression are autocorrelation corrected. Size, interest
rates and financial stress are significant at 1% level whilst debt to equity ratio,
leverage factor, and age are significant at 5% level of using Prais-Winston regression.
Even when autocorrelation has been eliminated, leverage is a driver of stock returns.
Table 4.9 shows autocorrelation corrected results.
Table 4.8 Prais-Winston Test
Durbin-Watson statistic (transformed) 1.776141Durbin-Watson statistic (original) 1.851656 rho -.0234304 _cons .29652 .0547768 5.41 0.000 .1890316 .4040084 totaldebt -.0398732 .0359311 -1.11 0.267 -.1103807 .0306343financiald~s .0122398 .0040973 2.99 0.003 .0041996 .0202799 age -.0010473 .0005213 -2.01 0.045 -.0020703 -.0000243dividendyi~d -.0036105 .0022541 -1.60 0.110 -.0080337 .0008128interestra~s -.0173565 .0056697 -3.06 0.002 -.0284821 -.0062309pricecashf~w -.0001582 .0001988 -0.80 0.426 -.0005484 .000232leveragefa~r .0013925 .0005908 2.36 0.019 .0002331 .0025519 debtequity -.0031109 .0012294 -2.53 0.012 -.0055232 -.0006985 size .7731187 .0234945 32.91 0.000 .7270154 .8192219 stockreturns Coef. Std. Err. t P>|t| [95% Conf. Interval]
Total 221.674884 1026 .216057392 Root MSE = .30219 Adj R-squared = 0.5773 Residual 92.8741745 1017 .091321705 R-squared = 0.5810 Model 128.80071 9 14.31119 Prob > F = 0.0000 F( 9, 1017) = 156.71 Source SS df MS Number of obs = 1027
Cochrane-Orcutt AR(1) regression -- iterated estimates
Iteration 13: rho = -0.0234Iteration 12: rho = -0.0234Iteration 11: rho = -0.0234Iteration 10: rho = -0.0234Iteration 9: rho = -0.0234Iteration 8: rho = -0.0234Iteration 7: rho = -0.0233Iteration 6: rho = -0.0232Iteration 5: rho = -0.0228Iteration 4: rho = -0.0218Iteration 3: rho = -0.0194Iteration 2: rho = -0.0135Iteration 1: rho = 0.0012Iteration 0: rho = 0.0000
(note: computations for rho restarted at each gap)Number of gaps in sample: 118 (gap count includes panel changes)

55
The chapter presented the results of the study followed by a discussion of the
findings. Even after robust tests and checks were done, leverage remained significant
in most of the models and tests. Thus, changes in leverage influence changes in stock
returns positively. High levels of leverage are associated with high asset base of firms
which can act as a barometer for growth opportunities.

56
CHAPTER 5
5. CONCLUSION
Using JSE market data this study investigates the influence of leverage on stock
returns. It uses sample data of 115 companies from McGregor-BFA and I-Net Bridge
databases for the period 2001-2010, resulting in 1150 usable firm data. In an attempt
to fill the gap of inconclusive findings on leverage-cum-stock returns effect, the study
uses robust tests and checks.
The following firm-specific characteristics and macro-characteristics are regressed on
stock returns: leverage factor, change in firm size (i.e., change in market
capitalization), change in total, short-term and long-term debts, debt to equity ratio,
financial distress measure, price to cash flow ratio, dividend yield, age and interest
rates. However, the study found that cross-company dependence is present in the
panel, hence might have also influenced stock returns.
The regression methodology used is different from cross-sectional regression used by
most previous studies (Fama and MacBeth, 1973; Van Rensburg, 1998; Van
Rensburg and Robertson, 2003 and others). The empirical findings are in contrast to
those by Van Rensburg (1998) and Van Rensburg and Robertson (2003), both of
which also focused on South Africa. They use some of the variables in this study on
South Africa to model stock returns. Possible reasons for contradictions with Van
Rensburg (1998) and Van Rensburg and Robertson (2003) can be attributed to the
difference in data used in modelling and the difference in time periods covered by the
empirical findings. Van Rensburg (1998) and Van Rensburg and Robertson (2003)
use cross-sectional regression with no diagnostic tests as opposed to this study which
uses time-series panel regression with different diagnostic tests, which might be a
spring for contradictions.

57
The study succeeded in modelling stock returns that can be backed empirically. It
concludes that there is a positive relationship between leverage and stock returns,
implying that leverage is priceable. The finding conform with findings by Bhandari
(1988), Gomes and Schmid (2010), and others. Debt financing leads to an increase in
firm‟s asset base during the growth phase. This lowers business risk of the firm which
in turn entice investors to invest in the firm, hence reinforcing the notion that stock
returns increase with leverage.
Change in size is a major driver of stock returns as it is significant in all regression
models of the study. The positive relationship between change in size and stock
returns is driven by growth. Growth increases present future cash flows. It is
interesting that change in size is highly correlated with stock returns. The correlation
coefficient between change in size and stock returns is about 70%.
It is important to incorporate other leverage or debt related variables such as age,
interest rates and so on when modelling leverage-cum-stock returns. Age and interest
rates are negatively related to stock returns. Younger firms are eager to grow hence
take more growth-oriented investments. Interest rates are used to discount firms‟
future debt services. An inverse relationship exists between interest rates and present
value of debt contracts.
The research questions of the study have been addressed significantly. Leverage is a
priceable phenomenon that should be incorporated when determining the required
rates of return on equity. Debt characteristics are important in modelling leverage-
cum-stock returns. However, it does not matter whether debt is grouped into different
categories (i.e., short-term or long-term debt) to influence investment decisions made
by investors.
Finally, the study did not incorporate other debt related variables (i.e., credit ratings,
private and public debt and others) that can catalyse the relationship between leverage
and stock returns. The question to be posed then is that if these debt-related attributes

58
are included in models of this study, would it change the perception that higher
leverage entails increased asset base and growth of firms? Therefore, the study
recommends further empirical investigations to be carried out to resolve the
inconclusive and mixed results of the debate on leveraged stock returns.

59
REFERENCES
Altman, E. (1968). Financial Ratios, Discriminant Analysis and the Prediction of
Corporate Bankruptcy. Journal of Finance, 18, pp 589-609.
Bhandari, C. L. (1988). Debt/Equity Ratio and Expected Common Stock Returns:
Empirical Evidence. The Journal of Finance, 43, pp 507-528.
Billett, T. M., Flannery, J. M. and Garfinkel, A. J. (1995). The Effect of Lender
Identity on a Borrowing Firm's Equity Return. The Journal of Finance, 50, pp 699-
718.
Bradfield, D. J., Barr, G. D. and Affleck-Graves, J. F. (1988). Asset pricing in small
markets-The South African case. South Africa Journal of Business Management, 19,
pp 11-21.
Casey, C. (2001). Corporate valuation, capital structure and risk management: A
stochastic DCF approach. European Journal of Operational Research, 135, pp 311-
325.
Chava, S. and Purnanandam, A. (2010). Is Default Risk Negatively Related to Stock
Returns?. The Review of Financial Studies, 23, pp 2523-2559.
Christie, A. A. (1982). The Stochastic Behavior of Common Stock Variances: Value,
Leverage and Interest Rate Effects. Journal of Financial Economics, 10, pp 407-432.
Datta, S., Iskandar-Datta, M. and Raman, K. (2000). Debt structure Adjustments and
Long-Run stock Price Performance. Journal of Financial Intermediation, 9, pp 427-
453.
Deloof, M. (2003). Does working capital management affect profitability of Belgian
firms? Journal of Business, Finance and Accounting, 30, pp 583-587.

60
Dichev, I. (1998). Is the Risk of Bankruptcy a Systematic Risk? The Journal of
Finance, 53, pp 1131–1148.
Ely, P. D. and Robinson, J. K. (1992). Stock Returns and Inflation: Further Tests of
the Role of the Central Bank. Journal of Macroeconomics, 14, pp 525-543.
Fama, F. E. and French, R. K. (1989). Business Conditions and Expected Returns on
Stocks and Bonds. Journal of Financial Economics, 25, pp 23-49.
Fama, F. E. and French, R. K. (1992).The Cross-Section of Expected Stock Returns.
The Journal of Finance, 47, pp 427-465.
Fama, E. and French, K. (1993). Common risk factors in the returns on stocks and
bonds. The Journal of Finance, 50, pp 1-56.
Fama, E. and MacBeth, J. (1973). Risk, return and equilibrium: Empirical tests.
Journal of Political Economy, 81, pp 607-636.
Fama, F. E. and Schwert, W. G. (1977). Asset Returns and Inflation. The Journal of
Financial Economics, 5, pp 115-146.
F:\PS602 - Testing and Correcting for Autocorrelation in the residuals using
Stata.mht
Gallagher, A. L. and Taylor, P. M. (2002). The stock return–inflation puzzle
revisited. Economics Letters, 75, pp 147–156.
Garcia-Teruel, J. P. and Martinez-Solano, P. (2007). Effects of working capital
management on SME profitability. International Journal of Managerial Finance, 3,
pp 164-177.
George, J. T. and Hwang, C. (2009). A resolution of the distress risk and leverage
puzzles in the cross section of stock returns. Journal of Financial Economics, 96, pp
56–79.

61
Gomes, F. J. and Schmid, L. (2010). Leveraged Returns. The Journal of Finance, 65,
pp 467-494.
Greene, H. W. (2007). Econometric Analysis. Pearson Prentice Hall. New Jersey.
Guedes, J. and Opler, T. (1996). The determinants of the maturity of corporate debt
issues. The Journal of Finance, 51, pp 1809–1833.
Gwatidzo, T. and Ojah, K. (2009). Corporate Capital Structure Determinants:
Evidence from Five African Countries. The African Finance Journal, 11, pp 1-23.
Haugen, A. R. and Baker, L. N. (1996). Commonality in the determinants of expected
stock returns. Journal of Financial Economics, 41, pp 401-439.
http://dss.princeton.edu/training/Panel101.pdf
James, C. (1987). Some evidence on the uniqueness of bank loans. Journal of
Financial Economics, 19, pp 217-235.
Jain, C. P. (1982). Cross-section association between abnormal returns and firm
specific variables. Journal of Accounting and Economics, 4, pp 205-228.
Jandik, T. and Makhija, K. A. (2005). Debt, debt structure and corporate performance
after unsuccessful takeover: evidence from targets that remain independent. Journal
of Corporate Finance, 11, pp 882-914.
Johnson, T. C., Chebonenko, T., Cunha, I., D‟Almeida, F. and Spencer, X. (2011).
Endogenous leverage and expected stock returns. Finance Research Letters,
doi:10.1016/j.frl.2010.12.003
Jordan, D. B. and Miller, W. T. (2009). Fundamentals of Investments, Valuation and
Management. McGraw-Hill/Irwin. New York.

62
Keim, B. D. (1983). Size-related Anomalies and Stock Return Seasonality. Further
Empirical Evidence. Journal of Financial Economics, 12, pp 13-32.
Koop, G. (2006). Analysis of Financial Data. John Wiley and Sons. New Jersey.
Kraussl, R. (2005). Do credit agencies add to the dynamics of emerging markets
crises?. The Journal of Financial Stability, 1, pp 355-385.
Lummer, S. and McConnell, J. (1989). Further evidence on the bank lending process
and the capital market response to bank loan agreements. Journal of Financial
Economics, 25, pp 99-122.
Modigliani, F. and Miller, M. H. (1958). The cost of capital, corporation finance and
the theory of investment. American Economic Review, 48(3), pp 261-297.
Muradoglu, G. Y. and Sivaprasad, S. (2011). Capital Structure and Abnormal
Returns. International Business Review, doi:10.1016/j.ibusrev.2011.03.007
Ojah, K. and Manrique, J. (2005). Determinants of corporate debt structure in a
privately dominated debt market: a study of the Spanish capital market. Applied
Financial Economics, pp 455-468.
Ojah, K. and Pillay, K. (2009). Debt markets and corporate debt structure in an
emerging market: The South African example. Economic Modelling, pp 1215-1227.
Page, M. J. (1996). Further evidence of firm size and earnings anomalies on the
Johannesburg Stock Exchange. De Ratione, 10, pp 22-44.
Page, M. J. and Palmer, F. (1991). The relationship between excess returns firm size
and earnings anomalies on the Johannesburg Stock Exchange. South Africa Journal
of Business Management, 22, pp 63-73.
Penman, H. S. (2007). Financial Statement Analysis and Security Valuation.
McGraw-Hill/Irwin. New York.
63
Rajan, R. and Zingales, L. (2005). What do we know about the capital structure?
Some evidence from international data. Journal of Finance, pp 1421-1460.
Roll, R. (1983). The turn of year effect and the return premia of small firms. The
Journal of Portfolio Management, 9, pp 1-23.
Van Rensburg, P. (1998). Unifying the factor analytic and prespecified variable
approaches to APT factor identification on the Johannesburg Stock Exchange. The
South African Journal of Accounting Research, 12, pp 15-45.
Van Rensburg, P. and Robertson, M. (2003). Style variables and the cross-section of
JSE returns. Investment Analysts Journal, 57 pp 7-15.
Yang, C., Lee, C., Gu, Y. and Lee, Y. (2010). Co-determination of capital structure
and stock returns: A LISREL approach and empirical test of Taiwan stock markets.
The Quarterly Review of Economics and Finance, 50, pp 222-233.
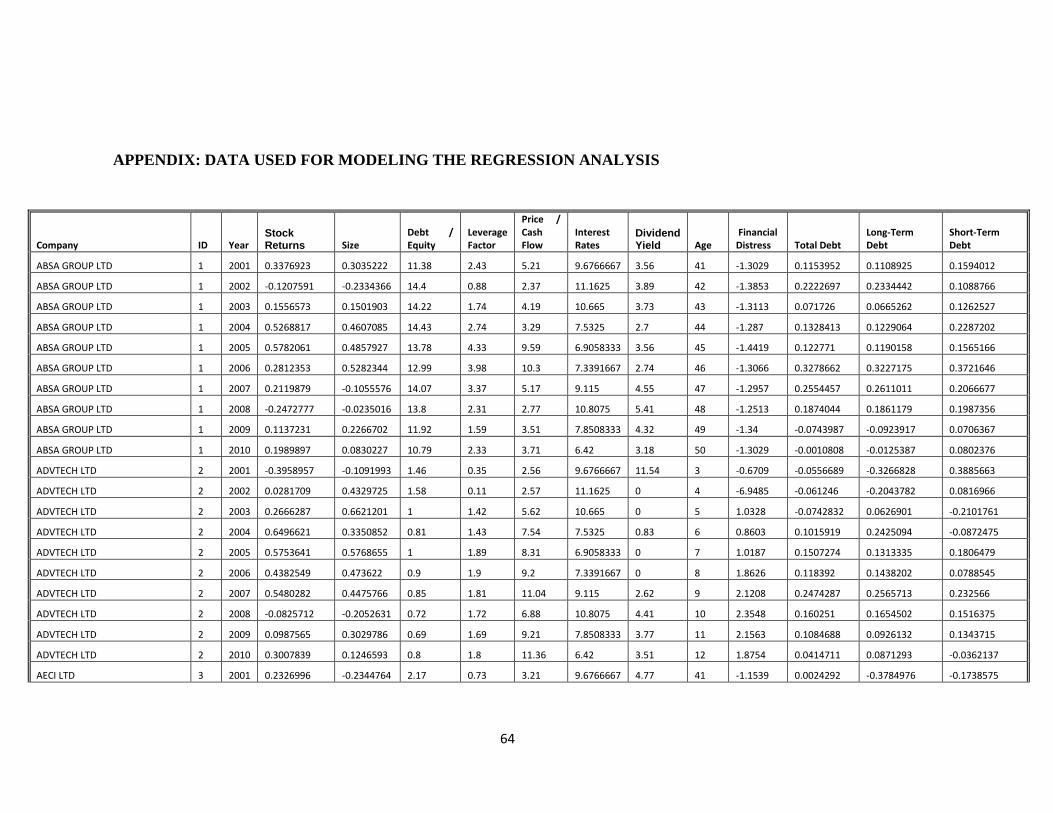
64
APPENDIX: DATA USED FOR MODELING THE REGRESSION ANALYSIS
Company ID Year Stock Returns Size
Debt / Equity
Leverage Factor
Price / Cash Flow
Interest Rates
Dividend Yield Age
Financial Distress Total Debt
Long-Term Debt
Short-Term Debt
ABSA GROUP LTD 1 2001 0.3376923 0.3035222 11.38 2.43 5.21 9.6766667 3.56 41 -1.3029 0.1153952 0.1108925 0.1594012
ABSA GROUP LTD 1 2002 -0.1207591 -0.2334366 14.4 0.88 2.37 11.1625 3.89 42 -1.3853 0.2222697 0.2334442 0.1088766
ABSA GROUP LTD 1 2003 0.1556573 0.1501903 14.22 1.74 4.19 10.665 3.73 43 -1.3113 0.071726 0.0665262 0.1262527
ABSA GROUP LTD 1 2004 0.5268817 0.4607085 14.43 2.74 3.29 7.5325 2.7 44 -1.287 0.1328413 0.1229064 0.2287202
ABSA GROUP LTD 1 2005 0.5782061 0.4857927 13.78 4.33 9.59 6.9058333 3.56 45 -1.4419 0.122771 0.1190158 0.1565166
ABSA GROUP LTD 1 2006 0.2812353 0.5282344 12.99 3.98 10.3 7.3391667 2.74 46 -1.3066 0.3278662 0.3227175 0.3721646
ABSA GROUP LTD 1 2007 0.2119879 -0.1055576 14.07 3.37 5.17 9.115 4.55 47 -1.2957 0.2554457 0.2611011 0.2066677
ABSA GROUP LTD 1 2008 -0.2472777 -0.0235016 13.8 2.31 2.77 10.8075 5.41 48 -1.2513 0.1874044 0.1861179 0.1987356
ABSA GROUP LTD 1 2009 0.1137231 0.2266702 11.92 1.59 3.51 7.8508333 4.32 49 -1.34 -0.0743987 -0.0923917 0.0706367
ABSA GROUP LTD 1 2010 0.1989897 0.0830227 10.79 2.33 3.71 6.42 3.18 50 -1.3029 -0.0010808 -0.0125387 0.0802376
ADVTECH LTD 2 2001 -0.3958957 -0.1091993 1.46 0.35 2.56 9.6766667 11.54 3 -0.6709 -0.0556689 -0.3266828 0.3885663
ADVTECH LTD 2 2002 0.0281709 0.4329725 1.58 0.11 2.57 11.1625 0 4 -6.9485 -0.061246 -0.2043782 0.0816966
ADVTECH LTD 2 2003 0.2666287 0.6621201 1 1.42 5.62 10.665 0 5 1.0328 -0.0742832 0.0626901 -0.2101761
ADVTECH LTD 2 2004 0.6496621 0.3350852 0.81 1.43 7.54 7.5325 0.83 6 0.8603 0.1015919 0.2425094 -0.0872475
ADVTECH LTD 2 2005 0.5753641 0.5768655 1 1.89 8.31 6.9058333 0 7 1.0187 0.1507274 0.1313335 0.1806479
ADVTECH LTD 2 2006 0.4382549 0.473622 0.9 1.9 9.2 7.3391667 0 8 1.8626 0.118392 0.1438202 0.0788545
ADVTECH LTD 2 2007 0.5480282 0.4475766 0.85 1.81 11.04 9.115 2.62 9 2.1208 0.2474287 0.2565713 0.232566
ADVTECH LTD 2 2008 -0.0825712 -0.2052631 0.72 1.72 6.88 10.8075 4.41 10 2.3548 0.160251 0.1654502 0.1516375
ADVTECH LTD 2 2009 0.0987565 0.3029786 0.69 1.69 9.21 7.8508333 3.77 11 2.1563 0.1084688 0.0926132 0.1343715
ADVTECH LTD 2 2010 0.3007839 0.1246593 0.8 1.8 11.36 6.42 3.51 12 1.8754 0.0414711 0.0871293 -0.0362137
AECI LTD 3 2001 0.2326996 -0.2344764 2.17 0.73 3.21 9.6766667 4.77 41 -1.1539 0.0024292 -0.3784976 -0.1738575

65
AECI LTD 3 2002 0.3491672 0.4013814 2.17 1.31 3.65 11.1625 3.73 42 0.563 -0.0637674 -0.098936 -0.098936
AECI LTD 3 2003 0.1815272 0.4294855 3.03 1.95 5.16 10.665 3.35 43 0.5047 -0.0659851 0.4067414 0.4067414
AECI LTD 3 2004 0.3095975 0.148405 2.37 2.06 4.95 7.5325 3.13 44 0.5734 -0.0023402 -0.4188561 -0.4188561
AECI LTD 3 2005 0.3625887 0.3120901 2.37 2.42 6.12 6.9058333 2.79 45 1.0508 0.1348883 0.3427839 0.3427839
AECI LTD 3 2006 0.2676209 0.2568051 1.72 2.45 4.6 7.3391667 2.71 46 1.6833 0.2102184 0.2064097 0.2064097
AECI LTD 3 2007 0.3632164 0.1462614 1.68 1.79 8.09 9.115 2.7 47 0.7017 0.0581551 0.0760483 0.0760483
AECI LTD 3 2008 -0.2276606 -0.4376222 2.79 1.17 3.36 10.8075 4.53 48 0.7077 0.3125239 0.3096014 0.3096014
AECI LTD 3 2009 -0.1506337 0.1660897 2.23 2.61 4.61 7.8508333 2.73 49 0.3556 -0.1080827 -0.2998653 -0.2998653
AECI LTD 3 2010 0.3185384 0.2888848 1.92 2.4 5.59 6.42 1.6 50 0.7037 0.0344311 0.0680921 0.0680921
AFGRI LTD 4 2001 -0.2278234 0.3763356 1.59 2.05 6.18 9.6766667 4.14 4 0.5181 0.1141678 -0.45438 0.7821646
AFGRI LTD 4 2002 0.1070648 -0.1828799 0.88 1.61 6.64 11.1625 5.03 5 0.7897 -0.23956 0.1310576 -0.5757207
AFGRI LTD 4 2003 -0.0755827 -0.1094687 1.84 1.25 2.91 10.665 6.69 6 0.9503 0.3415461 -0.0387269 0.683803
AFGRI LTD 4 2004 0.2762534 0.4216262 1.2 1.43 5.44 7.5325 6.34 7 0.8743 -0.2110192 0.0295293 -0.3977737
AFGRI LTD 4 2005 -0.1816948 -0.2779469 1.79 0.79 6.68 6.9058333 3.42 8 1.0515 0.2743633 0.0237224 0.4673885
AFGRI LTD 4 2006 0.1895012 0.3176744 1.38 0.9 10.6 7.3391667 1.32 9 0.6317 0.5246459 0.2498318 0.6627345
AFGRI LTD 4 2007 0.0396393 0.0155042 2.92 1.89 5.9 9.115 4.02 10 0.2614 0.140731 0.1132329 0.151731
AFGRI LTD 4 2008 -0.1496764 0.0451204 3.74 1.53 5.31 10.8075 5.45 11 -0.2691 0.2531906 0.0722318 0.3161208
AFGRI LTD 4 2009 -0.1256262 -0.2182067 3.85 1.76 2.45 7.8508333 6.02 12 -0.0274 0.0708491 0.0715652 0.0706288
AFGRI LTD 4 2010 0.2617584 0.2251456 3.01 2.08 2.77 6.42 5.43 13 -0.1267 -0.1455163 0.0898391 -0.2307098
AFRICAN BANK INVESTMENTS LTD 5 2001 -0.2047244 -0.0103582 1.55 1.57 6.23 9.6766667 2.87 5 0.8392 -0.0758583 -0.037841 -0.0987014
AFRICAN BANK INVESTMENTS LTD 5 2002 -0.2277228 -0.4285118 1.96 1.71 4.86 11.1625 5.31 6 0.2393 0.2698565 -0.0292075 0.41837
AFRICAN BANK INVESTMENTS LTD 5 2003 0.1185897 0.3227734 2.08 1.79 4.85 10.665 5.93 7 0.6252 -0.0822507 -0.5358285 0.052601
AFRICAN BANK INVESTMENTS LTD 5 2004 0.7679083 0.542118 2.49 2.04 7.01 7.5325 5.03 8 0.7667 0.1297273 -0.2625958 0.1986286
AFRICAN BANK INVESTMENTS LTD 5 2005 0.5640194 0.5290933 2.4 1.59 8.39 6.9058333 4.98 9 1.0357 -0.0095473 0.1409556 -0.0323142
AFRICAN BANK INVESTMENTS LTD 5 2006 0.4124352 0.0458639 3.17 3.04 9.05 7.3391667 6.99 10 0.8534 0.10439 0.4423223 0.0358314

66
AFRICAN BANK INVESTMENTS LTD 5 2007 0.1581071 0.3459493 4.39 3.72 6.7 9.115 6.82 11 0.9908 0.3710899 -0.1475645 0.4665324
AFRICAN BANK INVESTMENTS LTD 5 2008 -0.1631296 0.2631402 3.36 2.29 4.18 10.8075 8.17 12 0.7035 0.7139897 1.4467903 0.5576324
AFRICAN BANK INVESTMENTS LTD 5 2009 0.0495836 0.1575463 4.22 2.49 4.58 7.8508333 6.21 13 0.5324 0.1765966 -1.3804754 0.4054465
AFRICAN BANK INVESTMENTS LTD 5 2010 0.2051929 0.1955441 4.64 2.77 5.18 6.42 4.77 14 0.061 0.1638208 0.1925084 0.1622299
AFRICAN OXYGEN LTD 6 2001 -0.0298013 0.0012874 0.82 1.44 6.1 9.6766667 4 41 1.0274 0.0324248 0.1920501 -0.2577434
AFRICAN OXYGEN LTD 6 2002 0.1322526 0.1022185 0.93 1.51 5.86 11.1625 4.31 42 1.0723 0.1361756 0.127024 0.1567494
AFRICAN OXYGEN LTD 6 2003 0.1650339 0.2435045 0.8 1.35 5.8 10.665 4.23 43 1.4173 0.1046519 0.1425753 0.0151504
AFRICAN OXYGEN LTD 6 2004 0.2639069 0.1864538 0.63 1.37 6.02 7.5325 2.55 44 0.119 0.0717554 0.0620824 0.0956868
AFRICAN OXYGEN LTD 6 2005 0.2256909 0.1831803 0.88 6.28 11.47 6.9058333 3.1 45 3.7978 -0.5170729 -0.5022518 -0.5540753
AFRICAN OXYGEN LTD 6 2006 0.2509395 0.2359369 0.89 3.11 14.03 7.3391667 1.59 46 2.5177 0.1892893 0.1560984 0.2696224
AFRICAN OXYGEN LTD 6 2007 0.0997997 0.0878867 0.85 1.55 12.65 9.115 2.32 47 0.7661 0.2498525 0.2282435 0.2975904
AFRICAN OXYGEN LTD 6 2008 -0.2003035 -0.2838603 0.92 1.6 10.11 10.8075 5.86 48 0.6664 0.1786334 0.2010192 0.1291164
AFRICAN OXYGEN LTD 6 2009 -0.2402277 -0.0973742 0.77 1.04 11.11 7.8508333 2 49 0.2788 -0.0329522 0.0848181 -0.370679
AFRICAN OXYGEN LTD 6 2010 0.0834166 -0.1686867 0.67 0.41 9.86 6.42 1.84 50 0.1282 -0.0917408 -0.1003751 -0.0611255
ALLIED ELECTRONICS CORPORATION LTD 7 2001 0.1951952 0.1387281 1.12 2.95 3.25 9.6766667 3.83 41 1.9064 0.1765002 0.109364 0.284905
ALLIED ELECTRONICS CORPORATION LTD 7 2002 0.0113065 -0.1200268 1.16 2.85 2.85 11.1625 4.23 42 1.1125 0.1251806 0.1835881 0.0319844
ALLIED ELECTRONICS CORPORATION LTD 7 2003 0.1142857 0.0819884 0.94 2.43 2.45 10.665 3.91 43 1.7918 -0.1794831 -0.226911 -0.1027552
ALLIED ELECTRONICS CORPORATION LTD 7 2004 0.4124861 0.3150053 0.78 1.69 4.15 7.5325 3.13 44 0.942 -0.016036 -0.0153172 -0.01713
ALLIED ELECTRONICS CORPORATION LTD 7 2005 0.4901342 0.3557713 1.16 2.09 4.65 6.9058333 2.68 45 0.893 0.0649247 0.0240976 0.1240832
ALLIED ELECTRONICS CORPORATION LTD 7 2006 0.4872881 0.5075549 1.26 2.39 7.33 7.3391667 2.21 46 1.2023 0.1310581 0.0375008 0.2471639
ALLIED ELECTRONICS CORPORATION LTD 7 2007 0.6274929 0.5557605 1.17 2.25 3.04 9.115 2.43 47 1.899 0.115589 0.1725057 0.0478856
ALLIED ELECTRONICS CORPORATION LTD 7 2008 -0.2310722 -0.0813728 1.86 2.79 6.82 10.8075 6.95 48 1.6012 0.2388869 0.1656235 0.3245506
67
ALLIED ELECTRONICS CORPORATION LTD 7 2009 -0.2936824 -0.6518681 2.19 2.83 3.66 7.8508333 4.32 49 1.0256 0.1855661 0.1136243 0.2578588
ALLIED ELECTRONICS CORPORATION LTD 7 2010 0.0705077 0.309087 1.91 2.38 5.31 6.42 3.4 50 0.6904 -0.0793463 -0.0216786 -0.1364481
ALLIED TECHNOLOGIES LTD 8 2001 0.3036827 0.5228235 1.35 1.49 7.74 9.6766667 3.59 41 1.4504 0.0799807 -0.038026 0.1897642
ALLIED TECHNOLOGIES LTD 8 2002 -0.0343329 -0.1413417 1.23 1.3 7.76 11.1625 4.17 42 1.3648 -0.011535 0.1602216 -0.1806076
ALLIED TECHNOLOGIES LTD 8 2003 0.1183618 0.0351116 0.7 3.4 5.88 10.665 4.01 43 3.6874 0.2212156 0.4462506 -0.1277288
ALLIED TECHNOLOGIES LTD 8 2004 0.393159 0.4252694 0.62 1.6 9.21 7.5325 3.09 44 1.5919 0.0684967 0.1133824 -0.031468
ALLIED TECHNOLOGIES LTD 8 2005 0.2894281 0.2221112 1.62 2.61 9.44 6.9058333 3.48 45 1.1331 -0.0048987 -0.3270707 0.5017347
ALLIED TECHNOLOGIES LTD 8 2006 0.2367832 0.1717525 1.16 2.58 12.55 7.3391667 3.31 46 1.6762 0.1544057 0.2340878 0.063682
ALLIED TECHNOLOGIES LTD 8 2007 0.197428 0.2447548 1.04 1.95 11.01 9.115 3.53 47 1.7923 -0.0326623 0.0492179 -0.144486
ALLIED TECHNOLOGIES LTD 8 2008 -0.2333989 -0.2719392 1.5 2.52 8.22 10.8075 5.41 48 1.3245 0.2577932 0.1195359 0.4353763
ALLIED TECHNOLOGIES LTD 8 2009 0.1998816 0.0111091 2.57 3.19 5.38 7.8508333 4.34 49 1.4219 0.2288693 0.0428515 0.3996829
ALLIED TECHNOLOGIES LTD 8 2010 0.093899 0.4864826 3.93 4.93 8.05 6.42 5.16 50 1.2077 0.0223433 0.2474541 -0.1932053
AMALGAMATED APPLIANCE HOLDINGS LTD 9 2001 -0.3820225 -0.5046063 1.78 1.75 5.28 9.6766667 3.85 4 2.9524 0.2346786 0.1259513 0.3095007
AMALGAMATED APPLIANCE HOLDINGS LTD 9 2002 0.3818182 -0.021471 1.46 2.08 3.4 11.1625 2.38 5 2.2547 0.028886 0.1465274 -0.0527113
AMALGAMATED APPLIANCE HOLDINGS LTD 9 2003 0.8552632 0.6122732 1.53 2.04 4.17 10.665 1.42 6 2.4758 0.1857593 0.1731597 0.1953049
AMALGAMATED APPLIANCE HOLDINGS LTD 9 2004 1.5319149 1.0452244 1.78 2.01 6.93 7.5325 1.92 7 2.0816 0.3031874 0.2674555 0.3291472
AMALGAMATED APPLIANCE HOLDINGS LTD 9 2005 0.442577 0.4911076 1.18 2.96 11.37 6.9058333 3.33 8 2.4069 0.0385676 0.2724349 -0.1667383
AMALGAMATED APPLIANCE HOLDINGS LTD 9 2006 0.0776699 0.0100503 1 2.21 9.31 7.3391667 0 9 2.2249 0.1681448 0.2267274 0.0999345
AMALGAMATED APPLIANCE HOLDINGS LTD 9 2007 -0.1675676 -0.1120024 0.69 1.02 6.92 9.115 3.75 10 1.4649 -0.0663514 0.0574545 -0.2448896
AMALGAMATED APPLIANCE HOLDINGS LTD 9 2008 -0.6493506 -0.9435504 0.65 3
-2,684.53 10.8075 0 11 0.2989 -0.1236382 -0.1418804 -0.093746
AMALGAMATED APPLIANCE HOLDINGS LTD 9 2009 -0.1234568 -0.3715636 0.44 1.66 -3.58 7.8508333 0 12 -0.7742 -0.3845389 -0.1582063 -0.9059393
AMALGAMATED APPLIANCE HOLDINGS LTD 9 2010 0.2676056 0.3123747 0.43 1.37 4.98 6.42 3.95 13 1.2561 0.0675143 0.0342548 0.1723532
ANGLO AMERICAN PLC 10 2001 0.3252465 0.4821624 1.12 2.89 6.07 9.6766667 2.05 41 -0.6463 0.272513 0.2691957 0.2817165

68
ANGLO AMERICAN PLC 10 2002 0.2892568 -0.4140173 1.2 3.45 6.35 11.1625 4.48 42 0.8556 -0.0435898 0.0430259 -0.3305431
ANGLO AMERICAN PLC 10 2003 -0.2090287 0.1678453 1.29 4.88 9.89 10.665 2.82 43 0.6834 0.0302202 -0.0014915 0.1480365
ANGLO AMERICAN PLC 10 2004 0.134244 -0.0569355 1.21 3.94 7.74 7.5325 2.85 44 0.7628 0.0143253 0.0401243 -0.08015
ANGLO AMERICAN PLC 10 2005 0.1479917 0.4704831 1.44 2.09 8.41 6.9058333 2.28 45 0.6034 0.1043986 0.1170524 0.05359
ANGLO AMERICAN PLC 10 2006 0.6944963 0.4716931 0.82 1.79 7.65 7.3391667 1.73 46 0.6646 -0.0107416 -0.033343 0.0778517
ANGLO AMERICAN PLC 10 2007 0.3709562 0.0699423 1.02 2.5 10.3 9.115 1.94 47 -0.0878 -0.0523582 -0.1264259 0.1825457
ANGLO AMERICAN PLC 10 2008 -0.0718305 -0.6609129 2.68 2.61 2.65 10.8075 4.64 48 0.9078 0.3928936 0.3467763 0.5086583
ANGLO AMERICAN PLC 10 2009 -0.4060016 0.4149212 1.48 2.95 9.16 7.8508333 0 49 0.2998 -0.0956619 0.1238976 -0.9365575
ANGLO AMERICAN PLC 10 2010 0.2935072 0.0710089 0.93 2.22 7.81 6.42 0.53 50 1.0347 0.0713179 0.0767779 0.0340129
ARGENT INDUSTRIAL LTD 11 2001 0.2807018 0.0739036 0.65 0.22 16.86 9.6766667 8.13 6 1.1718 0.0776208 0.0493382 0.1513397
ARGENT INDUSTRIAL LTD 11 2002 0.4657534 0.4227276 0.63 1.08 4.84 11.1625 4.55 7 1.7015 0.286983 0.0826737 0.6639077
ARGENT INDUSTRIAL LTD 11 2003 0.4626168 0.8319129 0.73 1.46 6.59 10.665 5.17 8 1.9326 0.4265917 0.3453191 0.5292734
ARGENT INDUSTRIAL LTD 11 2004 0.7476038 0.3634392 0.7 1.68 8.96 7.5325 2.1 9 1.935 0.0308452 0.2810385 -0.3661331
ARGENT INDUSTRIAL LTD 11 2005 1.0146252 1.1453385 0.67 1.45 8.12 6.9058333 2.1 10 2.3909 0.3739884 0.3762256 0.3690453
ARGENT INDUSTRIAL LTD 11 2006 0.2822142 0.454343 0.69 1.53 7.2 7.3391667 1.79 11 1.9626 0.3157346 0.360797 0.2079155
ARGENT INDUSTRIAL LTD 11 2007 0.3680113 0.208504 0.79 1.39 2.81 9.115 1.71 12 2.1467 0.2733058 0.2462293 0.3400488
ARGENT INDUSTRIAL LTD 11 2008 -0.3217796 0.108842 1.23 1.82 2.95 10.8075 4.47 13 1.9014 0.3400331 0.365535 0.277347
ARGENT INDUSTRIAL LTD 11 2009 -0.3699466 -0.6884905 0.96 1.43 2.37 7.8508333 0.98 14 1.1207 0.0732955 0.1525956 -0.1650101
ARGENT INDUSTRIAL LTD 11 2010 0.0811138 0.0234761 0.62 0.86 1.44 6.42 0.43 15 0.2811 -0.0039704 -0.0731691 0.2079046
ASPEN PHARMACARE HOLDINGS LTD 12 2001 -0.0118846 0.0366983 4.16 4.1 12.75 9.6766667 1.43 10 2.1227 0.2828387 0.2610104 0.2945794
ASPEN PHARMACARE HOLDINGS LTD 12 2002 0.2216495 0.230496 22.62 16.68 9.01 11.1625 1.61 11 2.419 0.3541947 0.7164548 0.0916506
ASPEN PHARMACARE HOLDINGS LTD 12 2003 0.2123769 0.0478926 -15.92 -12.47 9.81 10.665 1.64 12 2.2187 0.148696 0.3122613 -0.0443541
ASPEN PHARMACARE HOLDINGS LTD 12 2004 0.5881671 0.4522174 3.37 3.66 13.07 7.5325 0 13 2.4646 0.2597576 0.2711529 0.2434517
ASPEN PHARMACARE HOLDINGS LTD 12 2005 0.9320672 0.574267 2.59 3.06 14.26 6.9058333 0 14 2.3642 0.373025 0.1189132 0.6548708
ASPEN PHARMACARE HOLDINGS LTD 12 2006 0.394707 0.5571508 3.88 4.36 12.65 7.3391667 1.81 15 2.7442 0.3651718 0.4664134 0.270368

69
ASPEN PHARMACARE HOLDINGS LTD 12 2007 -0.0184332 0.021815 2.81 3.3 9.11 9.115 0 16 1.3654 0.5976356 0.2493032 0.8629055
ASPEN PHARMACARE HOLDINGS LTD 12 2008 -0.026512 -0.1468979 6.97 5.72 6.86 10.8075 0 17 0.5898 0.350926 0.2641447 0.3963564
ASPEN PHARMACARE HOLDINGS LTD 12 2009 0.547234 0.4634353 10.22 13.09 8.35 7.8508333 0.76 18 1.3159 0.1655607 0.8491597 -0.48951
ASPEN PHARMACARE HOLDINGS LTD 12 2010 0.5115512 0.507087 -9.54 -7.12 9.07 6.42 0.8 19 1.5842 0.4653978 0.5339425 0.3231819
ASSORE LTD 13 2001 0.2339374 0.4307829 3.46 4.62 5.36 9.6766667 0.76 41 1.0644 0.2434331 0.228161 0.2684221
ASSORE LTD 13 2002 0.6568758 0.4855078 0.79 2.96 4.92 11.1625 1 42 3.3571 0.2474305 0.4717939 -0.2690173
ASSORE LTD 13 2003 0.260274 0.2200619 0.88 1.01 6.26 10.665 0.79 43 0.9405 0.0671401 0.0541796 0.1095447
ASSORE LTD 13 2004 -0.1643223 -0.2355661 1.03 1.92 5.15 7.5325 0.88 44 1.0751 0.1783202 0.1477692 0.2697729
ASSORE LTD 13 2005 0.8263198 0.5506471 0.7 1.93 4 6.9058333 1.33 45 2.2938 0.2355014 0.2978622 0.0354945
ASSORE LTD 13 2006 0.1332216 0.0779615 0.72 2.35 6.11 7.3391667 1.48 46 1.3544 0.1883093 0.2275139 0.0299788
ASSORE LTD 13 2007 1.1397412 0.8109302 1.31 2.63 12.36 9.115 0.8 47 2.0018 0.3089467 0.2393771 0.5712187
ASSORE LTD 13 2008 1.1408086 1.0861773 5.42 6.78 5.85 10.8075 2.58 48 4.1964 0.6367119 0.2758976 1.3146845
ASSORE LTD 13 2009 -0.1536599 -0.5227902 0.43 1.51 2.65 7.8508333 2.84 49 3.5962 0.0971139 0.4372639 -0.5174243
ASSORE LTD 13 2010 0.4595213 0.363641 0.48 1.54 6.75 6.42 1.8 50 1.4726 0.1020445 0.1790938 -0.1668601
ASTRAPAK LTD 14 2001 0.2833333 -0.3991289 2.84 2.07 3.27 9.6766667 3.87 3 0.6032 0.0159264 -0.0849488 0.1423164
ASTRAPAK LTD 14 2002 0.2034632 0.3480368 1.95 1.96 3.18 11.1625 3.04 4 0.9542 0.1182657 0.2219414 -0.0120695
ASTRAPAK LTD 14 2003 0.6798561 0.4307725 2.79 1.71 2.97 10.665 1.6 5 0.6818 0.5709288 0.5507471 0.5987793
ASTRAPAK LTD 14 2004 0.7237687 0.5596158 1.79 1.96 4.5 7.5325 1.17 6 1.0065 0.0301419 0.1071661 -0.0840049
ASTRAPAK LTD 14 2005 0.4534161 0.6309751 1.42 2 6.15 6.9058333 1.68 7 1.1843 0.1541133 0.155612 0.1516639
ASTRAPAK LTD 14 2006 0.1273504 0.2829868 1.24 1.74 6.46 7.3391667 2.21 8 0.6394 0.2466575 0.2482208 0.2440922
ASTRAPAK LTD 14 2007 0 -0.0749357 1.09 1.56 7.02 9.115 7.93 9 0.7576 0.2274543 0.1975862 0.2747064
ASTRAPAK LTD 14 2008 -0.4427597 -0.3348139 1.47 1.46 4.52 10.8075 2.07 10 0.4782 0.1328254 0.1445514 0.114707
ASTRAPAK LTD 14 2009 0.1210884 -0.3054756 1.28 1.09 3.13 7.8508333 0 11 0.1723 8.534E-05 0.0251396 -0.0405191
ASTRAPAK LTD 14 2010 0.211165 0.5138769 0.99 1.26 4.39 6.42 2.69 12 0.7209 -0.0238012 0.0608108 -0.1838266
AVENG LTD 15 2001 0.1561562 0.170561 3.9 3.21 5.01 9.6766667 2.88 1 0.6824 0.3352608 -0.121144 0.7327073

70
AVENG LTD 15 2002 0.0714286 0.2319819 3.28 3.43 4.94 11.1625 2.7 2 0.1894 0.3488223 0.2671187 0.3923477
AVENG LTD 15 2003 0.0848485 0.0951941 2.79 2.16 3.77 10.665 3.37 3 0.2045 0.0192012 0.1477157 -0.0518748
AVENG LTD 15 2004 -0.0536313 -0.1731556 2.93 -1.78 5.18 7.5325 1.17 4 -0.5307 -0.0999949 -0.1471764 -0.0722343
AVENG LTD 15 2005 0.6257379 0.5120599 3.1 1.66 12.81 6.9058333 1.28 5 -0.2711 0.1880261 0.3641868 0.0724311
AVENG LTD 15 2006 0.8264343 0.5520686 2.97 3.08 8.2 7.3391667 1.13 6 -0.0819 0.1113787 0.095614 0.1231756
AVENG LTD 15 2007 1.0047714 0.845414 0.91 11.41 12.98 9.115 1.4 7 5.2036 0.7087164 1.0729896 0.3166282
AVENG LTD 15 2008 0.0581119 0.1633084 1.5 2.4 7.6 10.8075 4.58 8 0.8812 0.1163526 -0.1501733 0.4296275
AVENG LTD 15 2009 -0.3492034 -0.528438 1.37 2.32 4.33 7.8508333 3.63 9 0.583 0.0273028 0.0009362 0.049959
AVENG LTD 15 2010 0.109159 -0.0067348 1.16 2.25 4.55 6.42 3.35 10 0.5118 0.0484988 0.1249521 -0.0204411
BASIL READ HOLDINGS LTD 16 2001 -0.7087379 0.583585 -40.42 -57.43 -1.83 9.6766667 0 41 -0.4679 -0.1093456 0.219786 -0.200761
BASIL READ HOLDINGS LTD 16 2002 1.5166667 0.6109091 11.44 24.43 3.79 11.1625 0 42 -0.7962 0.2908868 0.2221869 0.3132953
BASIL READ HOLDINGS LTD 16 2003 -0.0596026 -0.1811794 9.53 100.89 2.98 10.665 0 43 0.3678 -0.3170088 -0.2176217 -0.3501108
BASIL READ HOLDINGS LTD 16 2004 -0.028169 -0.3586338 -15.75 -6.78 -0.74 7.5325 78.43 44 -2.9659 -0.6085678 -1.4417811 -0.4253147
BASIL READ HOLDINGS LTD 16 2005 0.2608696 1.2076683 19.2 12.57 2.98 6.9058333 0 45 -0.0014 0.2912211 0.5161328 0.2582143
BASIL READ HOLDINGS LTD 16 2006 3.7298851 1.5558046 3.13 3.93 12.22 7.3391667 0 46 0.4872 0.8881937 1.8327511 0.584576
BASIL READ HOLDINGS LTD 16 2007 2.09113 1.0293799 3.68 3.96 13.9 9.115 0.91 47 0.5387 0.7459656 0.8007238 0.7127483
BASIL READ HOLDINGS LTD 16 2008 -0.0255503 -0.670487 2.74 3.13 3.35 10.8075 3.39 48 0.5939 0.6184344 0.7093094 0.5562406
BASIL READ HOLDINGS LTD 16 2009 -0.4191206 0.2307428 3.67 3.67 3.42 7.8508333 4.47 49 0.0911 0.4085568 0.2915901 0.4869429
BASIL READ HOLDINGS LTD 16 2010 -0.125 -0.0619738 3.14 3.44 2.87 6.42 3.44 50 -0.0692 0.0135766 -0.0002331 0.0218751
BELL EQUIPMENT LTD 17 2001 0.1011561 0.1887516 0.75 2.91 8.05 9.6766667 1.06 6 2.6184 0.2622979 0.2761769 0.2418053
BELL EQUIPMENT LTD 17 2002 0.1286089 0.0197986 0.89 0.51 5.22 11.1625 1.05 7 2.5827 0.1185568 0.0224273 0.2475433
BELL EQUIPMENT LTD 17 2003 -0.1616279 -0.2022688 0.99 0.32 5.22 10.665 1.92 8 1.6576 0.0477041 0.0074644 0.0939219
BELL EQUIPMENT LTD 17 2004 -0.0027739 -0.2294365 1.28 -1.55 40.67 7.5325 0 9 1.5629 0.1388348 0.0278627 0.2481726
BELL EQUIPMENT LTD 17 2005 0.1404729 0.4323087 1.36 -0.83 26.66 6.9058333 0 10 1.2878 0.0286177 0.0481576 0.011051
BELL EQUIPMENT LTD 17 2006 0.8085366 1.0073744 1.23 1.93 5.33 7.3391667 0 11 2.932 0.2118875 0.3338862 0.085378
BELL EQUIPMENT LTD 17 2007 1.7653405 0.7132916 1.16 1.89 7.41 9.115 0.47 12 2.9568 0.3505199 0.3715632 0.3252313
71
BELL EQUIPMENT LTD 17 2008 -0.1750792 -1.2965593 1.28 1.48 1.41 10.8075 2.76 13 2.7963 0.2958093 0.2223164 0.3793671
BELL EQUIPMENT LTD 17 2009 -0.7162282 -0.4115798 1.23 4.12 149.65 7.8508333 0 14 0.1787 -0.3333754 -0.1916451 -0.5077942
BELL EQUIPMENT LTD 17 2010 0.05625 0.0527716 1.02 0.82 3.08 6.42 0 15 1.1175 -0.1004624 -0.065889 -0.1525212
BHP BILLITON PLC 18 2001 0.4058533 1.3887856 1.67 1.29 2.64 9.6766667 2.04 3 0.746 1.2856785 1.1361356 1.8139025
BHP BILLITON PLC 18 2002 0.3797341 0.3263508 1.45 2.07 3.44 11.1625 3 4 0.2696 0.2987331 0.2524164 0.4077136
BHP BILLITON PLC 18 2003 -0.1756044 -0.2762719 1.48 2.06 3.15 10.665 3.13 5 0.2736 -0.3533179 -0.2741473 -0.5510936
BHP BILLITON PLC 18 2004 0.3318633 0.3054133 1.35 1.84 3.62 7.5325 2.63 6 0.8049 -0.0948298 0.0087152 -0.4708854
BHP BILLITON PLC 18 2005 0.4561258 0.4325379 2.74 3.48 3.83 6.9058333 1.69 7 1.4325 0.3686648 0.3223595 0.559295
BHP BILLITON PLC 18 2006 0.4314952 0.4679358 3.38 4.55 4.11 7.3391667 1.85 8 1.4548 0.1604041 0.1884561 0.0503844
BHP BILLITON PLC 18 2007 0.4997617 0.3023785 1.59 2.35 3.57 9.115 1.65 9 1.7743 0.1678449 0.1743799 0.1398929
BHP BILLITON PLC 18 2008 0.2002436 0.3952736 1.94 2.7 3.59 10.8075 3.01 10 2.7111 0.3823614 0.3313007 0.5784455
BHP BILLITON PLC 18 2009 -0.1288002 -0.5256371 2.19 1.98 2.88 7.8508333 3.11 11 0.8134 0.0227208 0.1072922 -0.3338882
BHP BILLITON PLC 18 2010 0.1829417 0.1372861 1.11 1.56 1.96 6.42 2.45 12 1.7479 0.1075572 0.113095 0.0777765
BRAIT SE 19 2001 -0.27091 -0.6662108 1.91 1.7 6.25 9.6766667 5.76 41 -0.4434 0.1305485 0.1677049 0.0677646
BRAIT SE 19 2002 -0.2626263 -0.2549021 1.39 0.34 4.06 11.1625 7.06 42 -0.5174 -0.200976 -0.3173331 -0.0227175
BRAIT SE 19 2003 -0.3385519 -0.2797782 0.77 5.22 13.93 10.665 0 43 -1.303 -0.7178976 -1.1905207 -0.3135344
BRAIT SE 19 2004 0.1449704 0.0723494 0.49 2.01 9.81 7.5325 4.35 44 -0.1543 -0.5076933 -0.6735136 -0.42693
BRAIT SE 19 2005 0.9366925 0.4694774 0.76 4.19 10.42 6.9058333 6.15 45 2.043 0.357196 0.5781603 0.2447271
BRAIT SE 19 2006 0.5263509 0.7735962 0.41 -345.8 138.37 7.3391667 4.99 46 2.1945 0.4803563 0.0056738 0.6848567
BRAIT SE 19 2007 0.2355769 0.3539977 0.41 3.35 9.66 9.115 5.12 47 1.8084 0.2345222 0.3214068 0.2064994
BRAIT SE 19 2008 -0.3395826 -0.3178118 0.27 9.76 29.06 10.8075 15 48 2.0716 0.0365308 -0.4425548 0.1587436
BRAIT SE 19 2009 -0.1772898 -0.7049816 0.24 5.32 5.54 7.8508333 8.53 49 1.1233 0.0110568 -0.0277908 0.0181635
BRAIT SE 19 2010 0.4355469 0.651829 0.26 51.57 19 6.42 6.78 50 1.0131 -0.0866342 -0.1183646 -0.0810663
BRIMSTONE INVESTMENT CORPORATION 20 2001 -0.4067797 -0.7827593 0.48 0.33 1.78 9.6766667 0 2 0.9417 0.1718228 -0.0271571 1.1376955
BRIMSTONE INVESTMENT CORPORATION 20 2002 0.2571429 0.5947071 0.51 0.59 4.87 11.1625 0 3 0.944 0.1625624 0.1564133 0.1796613
72
BRIMSTONE INVESTMENT CORPORATION 20 2003 0.7272727 0.47693 1.27 5.15 11.74 10.665 2.92 4 0.3403 0.2130756 -0.3261178 0.9764717
BRIMSTONE INVESTMENT CORPORATION 20 2004 0.5789474 0.0072702 1.33 2.12 6.04 7.5325 5.16 5 -0.589 0.0700039 0.7594989 -1.2835769
BRIMSTONE INVESTMENT CORPORATION 20 2005 0.9083333 1.5522182 0.81 1.76 5.48 6.9058333 2.63 6 1.6152 0.928745 1.0250581 0.0547388
BRIMSTONE INVESTMENT CORPORATION 20 2006 1.6681223 0.66458 0.11 43.34 74.22 7.3391667 1.66 7 6.9892 1.1399948 1.1333557 1.2358859
BRIMSTONE INVESTMENT CORPORATION 20 2007 0.3322422 0.1817395 0.15 -98.72 -47.62 9.115 1.85 8 2.9309 0.3809141 0.3863692 0.3028603
BRIMSTONE INVESTMENT CORPORATION 20 2008 -0.3108108 -0.6450376 0.15 12.01 3.89 10.8075 7.11 9 -0.4371 -0.0678002 -0.0605164 -0.1833091
BRIMSTONE INVESTMENT CORPORATION 20 2009 0.0588235 0.7146401 0.45 4.56 9.01 7.8508333 2.96 10 0.3973 0.3933441 0.3524472 0.9098105
BRIMSTONE INVESTMENT CORPORATION 20 2010 0.6111111 -0.020444 0.67 0.96 3.9 6.42 2.4 11 0.8174 -0.4378921 -0.4660124 -0.2004995
BUILDMAX LTD 21 2001 0.75 -0.3101549 1.35 0.56 1.08 9.6766667 0 4 -1.8621 -0.0778873 -0.0845556 -0.0729043
BUILDMAX LTD 21 2002 0.2857143 0.3101549 0.22 121.74 5.89 11.1625 0 5 27.359 -0.3858619 0.2673319 -1.5402326
BUILDMAX LTD 21 2003 -0.1111111 -0.0689929 0.22 0.62 2.37 10.665 0 6 10.5758 0.0239168 0.0090762 0.0884972
BUILDMAX LTD 21 2004 1.0625 -0.3364722 0.29 1.27 -0.78 7.5325 0 7 -4.182 -0.1359264 -0.1935216 0.074422
BUILDMAX LTD 21 2005 3.6969697 1.6094379 0.4 0.54 2.47 6.9058333 0.73 8 -5.7514 0.1312089 0.0632564 0.321999
BUILDMAX LTD 21 2006 -0.1548387 1.3083328 0.43 1.42 9.58 7.3391667 1.22 9 -31.8433 0.1078253 0.091766 0.1464242
BUILDMAX LTD 21 2007 1.2671756 -0.3451585 0.44 1.58 5.42 9.115 0 10 4.9365 0.1967806 0.1863624 0.2207316
BUILDMAX LTD 21 2008 -0.6127946 0.9478486 0.41 1.35 19.32 10.8075 0 11 2.636 0.0990581 0.1167991 0.057768
BUILDMAX LTD 21 2009 -0.3391304 1.7982823 1.59 1.72 2.78 7.8508333 0 12 0.7612 3.4337401 3.3932276 3.5246567
BUILDMAX LTD 21 2010 -0.6973684 -0.1440394 3.21 -31.12 1.32 6.42 0 13 -5.3115 -0.3823083 -0.6307101 -0.0022681
CARGO CARRIERS LTD 22 2001 -0.0947368 -0.1706255 0.99 -0.48 0.65 9.6766667 2 41 -0.5857 0.0095442 -21.099552 -0.1151719
CARGO CARRIERS LTD 22 2002 0.9534884 0.1508229 0.84 1.02 0.75 11.1625 4.17 42 -0.0067 -0.0085977 -0.4208192 -0.1362234
CARGO CARRIERS LTD 22 2003 0.5892857 0.9162907 0.92 0.46 1.91 10.665 1.97 43 -0.278 0.0773562 0.0267596 0.1074667
CARGO CARRIERS LTD 22 2004 0.494382 0.2468601 0.9 1.52 2 7.5325 3 44 0.2103 0.0983608 -0.0329828 0.1686809
CARGO CARRIERS LTD 22 2005 0.358396 0.3327555 0.65 1.76 2.51 6.9058333 2.33 45 0.3445 -0.0208945 0.7214505 -0.3383992
CARGO CARRIERS LTD 22 2006 0.7453875 0.5020919 0.49 1.22 3.46 7.3391667 3.2 46 0.8682 0.2549556 1.0201519 -0.0420984

73
CARGO CARRIERS LTD 22 2007 0.4016913 0.4773777 0.6 0.99 4.77 9.115 1.16 47 0.5482 0.2394749 -0.4247369 0.2975743
CARGO CARRIERS LTD 22 2008 -0.2926094 -0.0774807 0.49 0.32 4.85 10.8075 2.16 48 0.6418 0.1051836 -0.4743581 -0.0382457
CARGO CARRIERS LTD 22 2009 -0.1950959 -0.4682597 0.55 0.16 3.94 7.8508333 2.27 49 0.0013 0.0606674 -0.968144 0.0942307
CARGO CARRIERS LTD 22 2010 0.1629139 0.1244882 0.49 0.48 2.47 6.42 3.2 50 0.2716 0.0048539 -1.0595285 -0.0562958
CASHBUILD LTD 23 2001 -0.0895522 -0.4643056 2.78 2.74 1.49 9.6766667 6.23 41 2.9919 0.0581305 -20.05678 0.023787
CASHBUILD LTD 23 2002 1.2704918 0.6681063 3.46 4.47 2.62 11.1625 3.89 42 2.9819 0.2550456 -0.3123694 0.3062521
CASHBUILD LTD 23 2003 1.7039711 1.1936177 2.66 3.79 5.51 10.665 3.13 43 2.8896 0.1345051 1.0541616 0.0673027
CASHBUILD LTD 23 2004 0.61749 0.4070661 2.45 3.23 6.13 7.5325 2.31 44 2.3107 0.195212 -0.1546756 0.1612817
CASHBUILD LTD 23 2005 0.5798597 0.6961489 2.87 3.87 8.66 6.9058333 2.44 45 2.69 0.2768782 -0.0718228 0.2873688
CASHBUILD LTD 23 2006 0.1954023 0.040822 2.39 3.24 10.19 7.3391667 2.37 46 2.5521 0.1530046 0.0931777 0.0912495
CASHBUILD LTD 23 2007 0.3105332 0.4382549 1.93 3.03 9.45 9.115 3.22 47 2.7285 0.1429306 -0.0185053 0.0646735
CASHBUILD LTD 23 2008 -0.170085 -0.2509458 2.5 3.31 4.82 10.8075 4.4 48 2.4913 0.4397841 -0.026438 0.5404226
CASHBUILD LTD 23 2009 0.336749 0.2826945 1.95 2.86 6.12 7.8508333 3.28 49 2.1695 0.0697743 -0.1365461 -0.0237319
CASHBUILD LTD 23 2010 0.1569217 0.1588717 1.67 2.47 6.62 6.42 2.45 50 1.5994 0.0815108 -0.2308553 0.0080455
CAXTON & CTP PUBLISHERS & PRINTERS LTD 24 2001 -0.1768802 -0.0853697 0.21 1.25 5.34 9.6766667 3.67 41 1.4051 0.1334087 -23.075579 0.0209917
CAXTON & CTP PUBLISHERS & PRINTERS LTD 24 2002 -0.1184433 -0.0651393 0.27 1.43 5.61 11.1625 3.45 42 1.3475 0.0868181 -0.7041557 0.1226897
CAXTON & CTP PUBLISHERS & PRINTERS LTD 24 2003 0.2130518 0.3498939 0.33 1.26 6.81 10.665 0 43 1.4492 0.0988421 -0.0681038 0.2030442
CAXTON & CTP PUBLISHERS & PRINTERS LTD 24 2004 0.375 0.3117181 0.35 1.32 8.42 7.5325 3.61 44 1.3743 0.0796124 -0.0611592 0.1186365
CAXTON & CTP PUBLISHERS & PRINTERS LTD 24 2005 0.3843498 0.2675952 0.32 1.54 8.99 6.9058333 2.51 45 1.647 0.0901178 0.5285829 -0.0185876
CAXTON & CTP PUBLISHERS & PRINTERS LTD 24 2006 0.2776392 0.3519376 0.33 1.41 10.31 7.3391667 2.82 46 1.5669 0.2419948 0.6699372 0.2921029
CAXTON & CTP PUBLISHERS & PRINTERS LTD 24 2007 0.1171113 0.2007395 0.27 1.36 11.34 9.115 2.81 47 1.7087 0.1103771 -0.3966219 -0.0878568
CAXTON & CTP PUBLISHERS & PRINTERS LTD 24 2008 -0.2842167 -0.4434041 0.28 1.34 6.22 10.8075 4.33 48 1.7095 0.0329001 -1.6470236 0.0486257
CAXTON & CTP PUBLISHERS & PRINTERS LTD 24 2009 -0.0203417 0.0180185 0.16 2.22 7.23 7.8508333 2.67 49 1.9419 0.1334737 1.923573 -0.3170103

74
CAXTON & CTP PUBLISHERS & PRINTERS LTD 24 2010 0.1943522 0.1498045 0.21 0.84 7.25 6.42 2.68 50 0.7669 0.0746133 -1.777399 0.3596902
CERAMIC INDUSTRIES LTD 25 2001 0.4348324 0.4480247 0.34 1.34 7.33 9.6766667 1.31 41 2.5347 0.2815536 0.283875 0.2748119
CERAMIC INDUSTRIES LTD 25 2002 0.4204432 0.2876821 0.49 1.46 9.15 11.1625 1.36 42 2.197 0.3702345 0.2975697 0.5562773
CERAMIC INDUSTRIES LTD 25 2003 -0.0896697 -0.1495317 0.44 1.32 6.5 10.665 1.95 43 2.0171 0.1536756 0.2245108 -0.0270486
CERAMIC INDUSTRIES LTD 25 2004 0.0864598 -0.0834407 0.39 1.23 5.63 7.5325 1.48 44 1.8907 0.0950831 0.1550319 -0.1021003
CERAMIC INDUSTRIES LTD 25 2005 0.5436976 0.5731168 0.47 1.61 6.78 6.9058333 1.8 45 2.1879 0.19874 0.2083167 0.1620276
CERAMIC INDUSTRIES LTD 25 2006 0.2552702 0.1604571 0.34 1.37 7.39 7.3391667 1.88 46 2.0703 0.1447386 0.142901 0.1519159
CERAMIC INDUSTRIES LTD 25 2007 0.2346729 0.4401655 0.34 1.36 9.51 9.115 2.17 47 2.0142 0.1755856 0.1649026 0.2160718
CERAMIC INDUSTRIES LTD 25 2008 -0.475291 -0.9660301 0.25 1.28 4.77 10.8075 3.67 48 1.6357 0.0724897 0.1395224 -0.223394
CERAMIC INDUSTRIES LTD 25 2009 -0.0383745 0.2360224 0.14 0.72 5.38 7.8508333 1.81 49 1.0348 -0.0280974 0.0413191 -0.5089406
CERAMIC INDUSTRIES LTD 25 2010 0.4094173 0.4054651 0.16 1.17 6.3 6.42 2.14 50 1.7688 0.1201993 0.099532 0.2927489
CITY LODGE HOTELS LTD 26 2001 0.1147327 0.1251631 0.84 1.26 3.85 9.6766667 7.18 8 0.645 0.0974524 0.1092295 -0.0266357
CITY LODGE HOTELS LTD 26 2002 0.497076 0.7508448 0.38 1.13 5.98 11.1625 4.64 9 1.3915 0.1036703 0.0992862 0.1518533
CITY LODGE HOTELS LTD 26 2003 0.5515625 0.4102636 0.41 1.11 6.32 10.665 4.47 10 2.0385 0.1093069 0.1039814 0.164614
CITY LODGE HOTELS LTD 26 2004 0.4063444 0.3459588 0.39 1.3 8.15 7.5325 4.77 11 2.1432 0.0924155 0.1064725 -0.0614879
CITY LODGE HOTELS LTD 26 2005 0.3551736 0.3780168 0.34 1.3 10.78 6.9058333 4.67 12 2.5301 0.0584011 0.0712959 -0.1096527
CITY LODGE HOTELS LTD 26 2006 0.4229855 0.2711208 0.32 1.26 12 7.3391667 3.58 13 2.7966 0.0797672 0.0884496 -0.0532563
CITY LODGE HOTELS LTD 26 2007 0.4413294 0.4928934 0.29 1.27 16.21 9.115 3.57 14 3.1212 0.1051175 0.099907 0.1871883
CITY LODGE HOTELS LTD 26 2008 -0.0718794 -0.1308535 0.3 1.28 12.09 10.8075 5.15 15 3.4454 0.1446518 0.1453059 0.1347348
CITY LODGE HOTELS LTD 26 2009 0.0041638 -0.0109182 0.64 1.21 9.21 7.8508333 4.51 16 2.0437 0.2213771 0.1722003 0.7703409
CITY LODGE HOTELS LTD 26 2010 0.0758811 0.1094086 0.77 1.59 8.77 6.42 4.04 17 1.8055 0.2369854 0.2525112 0.0964164
CLICKS GROUP LTD 27 2001 -0.2281335 -0.2431694 1.12 1.91 10.11 9.6766667 3.1 5 2.7229 0.1040642 0.1528307 0.0317019
CLICKS GROUP LTD 27 2002 -0.2149533 -0.3134045 1.37 1.82 4.94 11.1625 3.43 6 2.1663 0.1736234 0.0569001 0.3337856
CLICKS GROUP LTD 27 2003 -0.0297619 0.1715693 1.71 1.06 5.32 10.665 3.31 7 2.264 0.3475399 0.3542348 0.3394779
CLICKS GROUP LTD 27 2004 0.1993865 0.1216504 1.59 1.63 6.23 7.5325 3.68 8 1.82 -0.0568929 -0.1492365 0.0447672
CLICKS GROUP LTD 27 2005 0.0537084 0.0364375 1.69 2.06 8.53 6.9058333 3.41 9 2.6514 0.0135007 -0.0338445 0.0586696

75
CLICKS GROUP LTD 27 2006 0.223301 0.288143 1.99 2.51 8.11 7.3391667 0.61 10 2.0618 0.1743394 0.2350759 0.1156084
CLICKS GROUP LTD 27 2007 0.4642857 0.3310847 3.58 4.57 9.52 9.115 3.23 11 1.4321 0.0818282 -0.1896403 0.3001912
CLICKS GROUP LTD 27 2008 -0.0331978 -0.0195502 3.86 4.31 7.92 10.8075 3.49 12 1.4107 -0.1244056 -0.0985032 -0.1410478
CLICKS GROUP LTD 27 2009 0.3503854 0.2018163 5.62 6.09 8.76 7.8508333 3.07 13 1.5306 0.1538504 -0.076445 0.280484
CLICKS GROUP LTD 27 2010 0.8323819 0.549511 5.78 7.14 12.9 6.42 2.44 14 1.8439 -0.0110693 0.0188982 -0.02514
COMAIR LTD 28 2001 -0.3013699 -0.4547362 0.94 1.89 7.63 9.6766667 6.4 2 0.9494 0.2661669 0.3344709 0.0876983
COMAIR LTD 28 2002 -0.4575163 -0.7884574 0.96 0.49 8.53 11.1625 2.15 3 -0.2823 0.0154468 0.0017127 0.0550192
COMAIR LTD 28 2003 0.060241 0.1823216 1.04 -1.78 4.29 10.665 2.35 4 -0.7258 -0.0953346 -0.4211374 0.4813542
COMAIR LTD 28 2004 0.0227273 -0.1690763 2.39 -5.22 1.33 7.5325 1.33 5 -1.8924 -0.0829226 0.0299338 -0.2290397
COMAIR LTD 28 2005 0.7 0.5212969 1.89 2.57 4.08 6.9058333 3.87 6 0.5677 0.1936861 0.2054798 0.1760417
COMAIR LTD 28 2006 0.1568627 0.203654 2.07 2.67 4.65 7.3391667 3.04 7 -0.9353 0.2788183 0.3257019 0.203149
COMAIR LTD 28 2007 0.8870057 0.8578188 1.85 3.32 9.55 9.115 2.45 8 -0.8945 0.0769338 0.0534815 0.1159441
COMAIR LTD 28 2008 -0.3562874 -0.5802216 1.86 2.42 5.87 10.8075 0 9 -0.9676 0.2315485 0.2027524 0.2762982
COMAIR LTD 28 2009 -0.0651163 -0.1129256 2.02 1.55 3.23 7.8508333 1.67 10 -0.9515 0.164762 0.0901711 0.2670211
COMAIR LTD 28 2010 0.1741294 0.1267517 1.6 1.47 3.39 6.42 1.96 11 -0.8617 0.17328 0.0475512 0.3115567
COMBINED MOTOR HOLDINGS LTD 29 2001 0.5057471 0.2093502 2.11 2.75 4.13 9.6766667 4.34 41 2.2189 0.3022841 0.2474934 0.3296133
COMBINED MOTOR HOLDINGS LTD 29 2002 -0.0305344 0.2275781 2.33 2.73 4.27 11.1625 5.81 42 1.819 0.1772015 0.1739021 0.178777
COMBINED MOTOR HOLDINGS LTD 29 2003 0.0748032 -0.0269075 2.37 2.58 3.68 10.665 4.64 43 2.2214 0.3073461 0.2739612 0.3228655
COMBINED MOTOR HOLDINGS LTD 29 2004 0.8241758 0.5293468 2.27 2.68 4.89 7.5325 2.76 44 2.1399 0.1715579 0.2166058 0.1504346
COMBINED MOTOR HOLDINGS LTD 29 2005 1.2128514 0.7745043 2.66 3.36 6.57 6.9058333 2.38 45 2.4415 0.2744043 0.2568986 0.2827795
COMBINED MOTOR HOLDINGS LTD 29 2006 0.6896552 0.9675494 5.26 5.59 12.56 7.3391667 2.92 46 3.0445 0.3577726 0.0634515 0.4714682
COMBINED MOTOR HOLDINGS LTD 29 2007 -0.0628357 0.0335622 36.03 30.28 10.29 9.115 4.56 47 3.5929 0.3200528 0.5263661 0.245373
COMBINED MOTOR HOLDINGS LTD 29 2008 -0.5633238 -0.556193 6.54 5.61 9.01 10.8075 7 48 2.7113 -0.055145 0.0370325 -0.096136
COMBINED MOTOR HOLDINGS LTD 29 2009 -0.1824147 -1.0253145 5.32 1.55 14.47 7.8508333 0.76 49 1.7615 -0.1373891 -0.0689754 -0.1716149
76
COMBINED MOTOR HOLDINGS LTD 29 2010 0.752809 0.7832102 4.16 3.72 5.61 6.42 2.56 50 2.0046 0.0346624 0.0656568 0.017948
COMPU CLEARING OUTSOURCING LTD 30 2001 -0.1449275 -0.0272103 0.1 1.1 4.74 9.6766667 1.92 2 2.6645 -0.0229678 -0.0129619 -0.1148776
COMPU CLEARING OUTSOURCING LTD 30 2002 0.0932203 0.0500434 0.2 1.22 6.45 11.1625 2.14 3 2.6765 0.0557837 0.0858153 -0.2934634
COMPU CLEARING OUTSOURCING LTD 30 2003 0.1162791 0.0770391 0.3 1.3 6.71 10.665 3.64 4 2.5516 0.0780337 0.0257683 0.6200531
COMPU CLEARING OUTSOURCING LTD 30 2004 0.0347222 -0.0377621 0.49 1.46 5.72 7.5325 4.6 5 2.0191 0.1760557 0.1163879 0.5487942
COMPU CLEARING OUTSOURCING LTD 30 2005 0.6442953 0.4996073 0.27 1.18 10.13 6.9058333 4 6 2.47 -0.1339445 -0.0239334 -1.0219339
COMPU CLEARING OUTSOURCING LTD 30 2006 0.0979592 0.0299056 0.26 1.31 9.79 7.3391667 3.86 7 2.7888 0.1746732 0.1777211 0.1318614
COMPU CLEARING OUTSOURCING LTD 30 2007 0.0483271 0.2045014 0.27 1.32 11.16 9.115 10.46 8 3.0277 -0.0315848 -0.0285342 -0.0764932
COMPU CLEARING OUTSOURCING LTD 30 2008 -0.1453901 -0.1863299 0.43 1.49 6.41 10.8075 12.5 9 3.3785 0.1473687 0.138924 0.2667551
COMPU CLEARING OUTSOURCING LTD 30 2009 0.0414938 0.0515661 0.44 1.44 10.84 7.8508333 8.77 10 2.1234 0.0263256 0.0280315 0.0034081
COMPU CLEARING OUTSOURCING LTD 30 2010 0.0876494 0.0326673 0.33 1.33 10.38 6.42 5.36 11 2.274 -0.0536088 -0.0745025 0.194206
CONTROL INSTRUMENTS GROUP 31 2001 -0.3684211 -0.7118393 1.27 2.96 10.1 9.6766667 1.04 41 -0.2139 -0.1182676 -0.1964436 -0.0130759
CONTROL INSTRUMENTS GROUP 31 2002 -0.0416667 0.5940563 1.21 1.04 3.18 11.1625 1.47 42 0.9396 0.0483669 0.0404931 0.0579515
CONTROL INSTRUMENTS GROUP 31 2003 0.4782609 0.3072014 1.43 1.94 2.84 10.665 1.45 43 1.4122 0.0531464 0.1511176 -0.0794785
CONTROL INSTRUMENTS GROUP 31 2004 0.9705882 0.5620429 1.39 1.57 3.99 7.5325 1.09 44 1.1303 0.1270057 0.1362407 0.1128064
CONTROL INSTRUMENTS GROUP 31 2005 1.0646766 0.6374952 1.69 1.97 9.7 6.9058333 1.25 45 1.2651 0.6240216 0.8247093 0.199771
CONTROL INSTRUMENTS GROUP 31 2006 0.2746988 0.3782495 3.34 1.25 10.3 7.3391667 0.84 46 1.9207 0.8544049 0.7693816 1.0670001
CONTROL INSTRUMENTS GROUP 31 2007 -0.0056711 -1.0827792 0.92 93.9 7.34 9.115 19.05 47 3.5701 -0.2502473 -0.1769159 -0.4296192
CONTROL INSTRUMENTS GROUP 31 2008 -0.769962 -1.1741198 1.17 5.13 7.61 10.8075 0 48 -4.7231 -0.2077831 -0.2350916 -0.1356002
CONTROL INSTRUMENTS GROUP 31 2009 -0.6280992 0.4367177 1.4 -25.76 1.74 7.8508333 0 49 -3.4891 -0.1151018 -0.3528187 0.3116042
CONTROL INSTRUMENTS GROUP 31 2010 0.6 0.1282897 1.45 1.29 2.51 6.42 7.41 50 -2.4087 0.092733 0.1088818 0.0714356
CROOKES BROTHERS LTD 32 2001 0.1996904 0.0562808 0.12 1.34 3.22 9.6766667 6.97 41 0.9868 0.0723448 0.0932783 -0.1738721
CROOKES BROTHERS LTD 32 2002 0.48 0.5353969 0.13 1.15 4.09 11.1625 6.48 42 0.9641 0.0675273 0.0883262 -0.2654739
77
CROOKES BROTHERS LTD 32 2003 0.1987794 0.1774554 0.14 1.14 3.42 10.665 5.95 43 1.4362 0.1048852 0.1046611 0.109178
CROOKES BROTHERS LTD 32 2004 0.3236364 0.3889653 0.18 1.26 7.35 7.5325 5.17 44 0.8199 0.0774892 0.0187247 0.8149632
CROOKES BROTHERS LTD 32 2005 -0.0873626 -0.1755437 0.22 0.92 11.61 6.9058333 1.67 45 0.1457 0.0306587 -0.0146945 0.3543171
CROOKES BROTHERS LTD 32 2006 1.0668272 0.7011603 0.21 1.16 8.16 7.3391667 3 46 1.0828 0.0441349 0.1044745 -0.4189496
CROOKES BROTHERS LTD 32 2007 0.1782697 0.304817 0.19 1.13 11.37 9.115 2.98 47 1.0847 0.0503832 0.0606703 -0.0594374
CROOKES BROTHERS LTD 32 2008 0.0981459 0.0978281 0.21 1.25 10.52 10.8075 3.15 48 1.359 0.1216168 0.0986784 0.3505077
CROOKES BROTHERS LTD 32 2009 0.0695633 0.0343629 0.33 1.83 8.84 7.8508333 3.11 49 1.762 0.2619225 0.1637577 0.8631696
CROOKES BROTHERS LTD 32 2010 -0.1216586 -0.0218982 0.34 8.07 68.89 6.42 1.56 50 0.6927 0.0172342 0.0364417 -0.0715541
CULLINAN HOLDINGS LTD 33 2001 0 -0.2936312 9.13 -169.79 1.36 9.6766667 0 41 -3.0451 -0.25078 -0.853963 -0.123869
CULLINAN HOLDINGS LTD 33 2002 1.6 1.653792 3.78 5.54 5.82 11.1625 0 42 -0.2435 -0.7368964 -0.2285036 -0.8371477
CULLINAN HOLDINGS LTD 33 2003 1.0769231 0.4403486 3.24 4.07 8.59 10.665 2.5 43 0.2269 0.1464158 0.2652343 0.112464
CULLINAN HOLDINGS LTD 33 2004 0.6666667 0.4742827 2.67 3.53 10.93 7.5325 1.67 44 0.0178 0.2202393 -0.1925986 0.3194176
CULLINAN HOLDINGS LTD 33 2005 0.1555556 -0.100214 10.51 10.91 10.39 6.9058333 2.04 45 -0.6681 -0.0062072 0.3309288 -0.0831598
CULLINAN HOLDINGS LTD 33 2006 -0.1538462 -0.0223559 11.03 10.59 9.66 7.3391667 2.08 46 -2.1384 0.2971098 0.565998 0.2069339
CULLINAN HOLDINGS LTD 33 2007 0.4545455 0.3903132 7.73 8.16 11.93 9.115 1.56 47 1.7972 0.1892869 0.3024114 0.1401616
CULLINAN HOLDINGS LTD 33 2008 -0.34375 -0.6778797 7.65 -26.55 47.98 10.8075 2.5 48 0.1768 0.0985304 0.0071095 0.1388351
CULLINAN HOLDINGS LTD 33 2009 0.047619 0.3101549 4.6 -52.04 20.53 7.8508333 0 49 0.2739 -0.1355917 0.1066154 -0.2556044
CULLINAN HOLDINGS LTD 33 2010 0.5 0.2876821 2.86 4.93 10.18 6.42 0 50 0.4139 0.0618968 -0.035305 0.11535
DATACENTRIX HOLDINGS LTD 34 2001 -0.4313725 -0.7838363 3.63 4.23 8.35 9.6766667 0 2 0.3718 0.187559 -0.0245906 0.339497
DATACENTRIX HOLDINGS LTD 34 2002 0.2183908 0.1480661 1.58 4.48 5.5 11.1625 0 3 0.6273 0.3720709 0.5268864 0.2668554
DATACENTRIX HOLDINGS LTD 34 2003 0.4150943 0.4236127 1.43 2.22 4.98 10.665 0 4 0.9537 0.1995289 0.2931419 0.1205793
DATACENTRIX HOLDINGS LTD 34 2004 0.4466667 0.4088434 1.03 1.97 9.24 7.5325 0 5 0.9 -0.0110427 0.131834 -0.1632472
DATACENTRIX HOLDINGS LTD 34 2005 0.3041475 0.456063 0.93 1.89 9.81 6.9058333 3.4 6 1.3211 0.1604588 0.2949482 -0.0352531
DATACENTRIX HOLDINGS LTD 34 2006 0.0918728 -0.2207746 1.75 2.87 8.34 7.3391667 5.37 7 1.0144 0.2590751 0.1348539 0.4419606
DATACENTRIX HOLDINGS LTD 34 2007 0.5048544 0.4355933 1.24 2.25 7.96 9.115 5.05 8 1.7202 0.0141978 0.0148909 0.0133214
DATACENTRIX HOLDINGS LTD 34 2008 -0.2322581 0.078413 1.28 2.16 7.01 10.8075 4.64 9 1.9706 0.1767748 0.1420238 0.2190928
78
DATACENTRIX HOLDINGS LTD 34 2009 0.0420168 -0.3930426 0.99 1.94 4.6 7.8508333 6.33 10 2.0896 0.1183014 0.2132173 -0.0057509
DATACENTRIX HOLDINGS LTD 34 2010 0.1801075 0.5753641 0.76 1.68 8.1 6.42 5.61 11 1.364 -0.0240145 0.0697315 -0.1787407
DELTA EMD LTD 35 2001 0.4223969 0.3715636 0.85 2.54 13.42 9.6766667 2.45 41 2.6642 0.3173573 0.3212475 0.3117205
DELTA EMD LTD 35 2002 0.1461786 -0.1173294 0.61 1.32 7.49 11.1625 3.65 42 2.5045 0.0818825 0.191782 -0.1033935
DELTA EMD LTD 35 2003 -0.1518377 -0.2491469 0.69 2.21 9.55 10.665 5.08 43 1.6213 0.1189688 0.1156935 0.1253435
DELTA EMD LTD 35 2004 -0.1510774 -0.1075281 0.62 0.7 7.41 7.5325 4.65 44 1.0602 -0.0210234 -0.0368039 0.0088528
DELTA EMD LTD 35 2005 0.083682 -0.0539053 0.96 29.68 22.79 6.9058333 3.38 45 7.5399 0.2729436 0.589431 -0.8948942
DELTA EMD LTD 35 2006 -0.3958816 -0.3901976 0.16 1.49 -21.28 7.3391667 0 46 -0.5141 -0.6331541 -0.6186982 -0.759721
DELTA EMD LTD 35 2007 -0.320409 -0.4519851 0.33 9.93 5.33 9.115 0 47 -1.6871 -0.10512 -0.1429075 0.1939612
DELTA EMD LTD 35 2008 -0.3510972 -0.4418328 0.33 1.04 2.63 10.8075 18.47 48 1.3184 -0.02928 -0.1048945 0.3687207
DELTA EMD LTD 35 2009 -0.0995169 0.1053605 0.27 2.66 4.52 7.8508333 0 49 2.5843 -0.1668732 -0.1820922 -0.10565
DELTA EMD LTD 35 2010 0.333691 -0.0618754 0.18 -1.53 -6.91 6.42 6.8 50 2.3625 -0.1979569 -0.1279778 -0.5274392
DIGICORE HOLDINGS LTD 36 2001 0.1724138 0.6931472 0.55 1.39 2.19 9.6766667 0 2 3.3456 0.2320133 0.3500302 0.0241952
DIGICORE HOLDINGS LTD 36 2002 -0.2058824 -0.6131045 0.38 0.79 3.74 11.1625 0 3 1.8264 0.0647738 0.1458717 -0.1279521
DIGICORE HOLDINGS LTD 36 2003 0.1481481 -0.0392207 0.29 0.96 2.03 10.665 4.26 4 2.2185 0.0217099 0.1640632 -0.5186039
DIGICORE HOLDINGS LTD 36 2004 1.6451613 0.8945651 0.53 1.26 3.91 7.5325 1.94 5 2.4266 0.1006754 0.031524 0.408764
DIGICORE HOLDINGS LTD 36 2005 1.2317073 0.7026551 1 1.72 8.4 6.9058333 2.27 6 3.0512 0.3663516 0.1991185 0.8176174
DIGICORE HOLDINGS LTD 36 2006 0.8306011 0.6862743 0.8 1.96 7.87 7.3391667 2.38 7 3.7192 0.1920697 0.2129591 0.1490411
DIGICORE HOLDINGS LTD 36 2007 1.1134328 0.9313492 1.36 2.34 13.54 9.115 1.34 8 3.7114 0.3523492 0.1163686 0.7218916
DIGICORE HOLDINGS LTD 36 2008 -0.0466102 -0.0267614 0.67 1.64 8.76 10.8075 4.32 9 4.3259 0.3600867 0.6390876 -0.1076138
DIGICORE HOLDINGS LTD 36 2009 -0.4681481 -0.6127297 0.42 1.46 7.41 7.8508333 3.23 10 2.1505 -0.0095048 0.1083577 -0.3753456
DIGICORE HOLDINGS LTD 36 2010 -0.1086351 -0.1984275 0.58 1.57 8.3 6.42 2 11 1.2263 0.0609811 -0.013951 0.3131593
DISTELL GROUP LTD 37 2001 -0.0701559 0.1588784 0.97 0.43 3.84 9.6766667 5.2 41 -0.6371 0.6475225 0.6476629 0.6471433
DISTELL GROUP LTD 37 2002 0.5341317 0.6148153 1.05 1.2 7.12 11.1625 4.83 42 0.9893 0.0890342 -0.0349615 0.3628981
DISTELL GROUP LTD 37 2003 0.0327869 -0.117783 1.01 1.2 4.95 10.665 4.92 43 1.3216 0.0638213 0.0040832 0.1638787
DISTELL GROUP LTD 37 2004 0.3817082 0.2271085 0.89 1.19 6.01 7.5325 3.88 44 1.4038 0.0346822 0.1911237 -0.26903

79
DISTELL GROUP LTD 37 2005 0.500547 0.5550755 0.79 1.39 8 6.9058333 3.84 45 1.6242 0.0297207 -0.0496454 0.2011242
DISTELL GROUP LTD 37 2006 0.382428 0.4136505 0.71 1.41 10.55 7.3391667 3.52 46 1.7298 0.0900774 0.1347625 -0.0011029
DISTELL GROUP LTD 37 2007 0.4881329 0.3321639 0.55 1.44 10.52 9.115 3.16 47 2.1947 0.1001641 0.0994957 0.1016225
DISTELL GROUP LTD 37 2008 -0.1220982 -0.1597088 0.47 1.49 8.72 10.8075 4.63 48 2.3556 0.0724821 0.1232102 -0.0479169
DISTELL GROUP LTD 37 2009 0.1867178 0.1819299 0.6 1.45 8.68 7.8508333 4.06 49 2.0793 0.1493875 0.1634561 0.11205
DISTELL GROUP LTD 37 2010 0.1678857 0.1781077 0.6 1.41 11.01 6.42 3.38 50 1.8471 0.0892487 0.0721974 0.1342602
DISTRIBUTION & WAREHOUSING NETWORK LTD 38 2001 -0.2 -0.0904893 1.38 1.24 3.12 9.6766667 0 5 1.6211 0.169238 0.0272395 0.1401294
DISTRIBUTION & WAREHOUSING NETWORK LTD 38 2002 -0.1458333 -0.0689929 1.26 1.44 4.38 11.1625 0 6 1.215 0.039512 0.0186092 0.057821
DISTRIBUTION & WAREHOUSING NETWORK LTD 38 2003 1.2439024 0.326586 1.75 2.11 3.77 10.665 0 7 1.5081 0.0112646 -0.0748886 0.0797632
DISTRIBUTION & WAREHOUSING NETWORK LTD 38 2004 2.1086957 0.8471636 1.89 2.49 7.53 7.5325 0 8 8.6292 0.2437026 0.2757761 0.2194269
DISTRIBUTION & WAREHOUSING NETWORK LTD 38 2005 1.1468531 0.9162907 2.89 3.22 9.68 6.9058333 0 9 3.9873 0.5383847 0.607578 0.4809956
DISTRIBUTION & WAREHOUSING NETWORK LTD 38 2006 0.5260586 0.3813383 3.48 3.98 10.35 7.3391667 0 10 2.3188 0.5137674 0.3389832 0.6462732
DISTRIBUTION & WAREHOUSING NETWORK LTD 38 2007 0.8964781 0.7889378 5.72 5.31 14.14 9.115 1.43 11 1.6709 0.5744691 0.6714358 0.5060151
DISTRIBUTION & WAREHOUSING NETWORK LTD 38 2008 -0.2768711 -0.3115827 4.05 3.7 8.06 10.8075 4.45 12 1.3153 0.2850302 -0.0116196 0.4646836
DISTRIBUTION & WAREHOUSING NETWORK LTD 38 2009 -0.4536965 -0.6174544 3.12 1.21 6.66 7.8508333 4.86 13 0.5998 -0.1438172 0.0622422 -0.2591817
DISTRIBUTION & WAREHOUSING NETWORK LTD 38 2010 0.1125356 0.3598972 1.31 1.47 11.88 6.42 0 14 0.8555 0.0426206 0.4745171 -0.3954478
DORBYL LTD 39 2001 -0.3116414 -0.3689148 1.38 0.44 4.16 9.6766667 7.57 41 0.4775 -0.0453182 -0.0910575 0.0210284
DORBYL LTD 39 2002 0.1470588 0.027951 1.43 1.47 3.4 11.1625 4.68 42 0.3977 -0.009333 0.055356 -0.1054706
DORBYL LTD 39 2003 -0.1881868 -0.1007346 1.15 3.41 3.2 10.665 3.7 43 1.5373 -0.3876352 -0.3360284 -0.4768136
DORBYL LTD 39 2004 0.2171461 0.1286183 0.69 1.6 4.7 7.5325 3.54 44 0.8743 -0.1826038 -0.1627823 -0.2204356
DORBYL LTD 39 2005 0.1853568 0.4834266 0.53 1.3 4.91 6.9058333 5.88 45 0.8891 -0.0201665 0.0665725 -0.2161934
DORBYL LTD 39 2006 -0.4753714 -0.7624671 0.52 -17.7 -19.72 7.3391667 1.41 46 -1.8811 -0.3325792 -0.3730706 -0.2341525
DORBYL LTD 39 2007 -0.0707899 0.0965109 0.44 5.55 16.29 9.115 0.98 47 0.2292 -0.0622584 0.01566 -0.2653825

80
DORBYL LTD 39 2008 -0.3913392 -0.6286087 0.5 2.05 1.49 10.8075 0 48 -0.5645 -0.0812383 -0.1636671 0.1320427
DORBYL LTD 39 2009 -0.4716733 -0.8266786 0.77 4.1 1.88 7.8508333 0 49 -1.3394 -0.2888946 -0.4152152 -0.0536067
DORBYL LTD 39 2010 -0.0199501 0.1082136 1.03 2.64 -3.8 6.42 0 50 -0.5619 -0.3918937 -0.4728097 -0.2776445
ELB GROUP LTD 40 2001 0.3265306 0.4560788 4.32 7.87 3.4 9.6766667 5.75 41 0.2087 0.3268704 0.1383758 0.3840125
ELB GROUP LTD 40 2002 -0.2397436 -0.6890491 1.25 279.84 5.52 11.1625 13.64 42 0.9146 -1.4495666 -0.4193366 -2.1081442
ELB GROUP LTD 40 2003 -0.3591906 -0.1302857 1.7 -3.88 5.85 10.665 6.52 43 -0.2054 0.0353771 -0.3762404 0.4335113
ELB GROUP LTD 40 2004 0.3 0.1306562 1.45 0.4 9.68 7.5325 6.98 44 0.6666 -0.1060155 -0.1007819 -0.1094053
ELB GROUP LTD 40 2005 -0.0668016 -0.1436624 1.67 2.13 5.4 6.9058333 1.69 45 0.4861 0.0876649 0.100929 0.0789412
ELB GROUP LTD 40 2006 0.5921909 0.6122994 2.4 0.17 6.07 7.3391667 1.58 46 0.7028 0.234414 0.0106927 0.3595477
ELB GROUP LTD 40 2007 1.2302452 0.8914458 1.85 2.33 9.26 9.115 1.54 47 1.3375 0.0514667 0.202876 -0.0283233
ELB GROUP LTD 40 2008 -0.111179 0.1218603 2.18 2.43 4.22 10.8075 7.11 48 1.7686 0.4257684 0.3603058 0.4625429
ELB GROUP LTD 40 2009 -0.4405498 -0.9023262 1.88 2 1.56 7.8508333 2.5 49 1.2163 0.0325223 0.1043608 -0.0080405
ELB GROUP LTD 40 2010 0.514742 0.5276327 1.82 3.25 4.09 6.42 2.44 50 0.7459 0.0904799 0.1179413 0.073713
EOH HOLDINGS LTD 41 2001 -0.4656085 -0.6660083 2.33 3.11 3.46 9.6766667 0 2 1.9825 0.2886156 -0.1198561 0.7107593
EOH HOLDINGS LTD 41 2002 0.1485149 0.3141153 5.57 6.27 3.95 11.1625 3.8 3 1.2391 0.371902 0.3354465 0.396043
EOH HOLDINGS LTD 41 2003 0.4224138 0.3488181 2.31 3.25 4.66 10.665 3.57 4 1.5323 0.0551257 0.2947128 -0.1359372
EOH HOLDINGS LTD 41 2004 0.8121212 0.5204569 2.88 3.76 5.62 7.5325 2.38 5 1.0874 0.5932117 0.5824704 0.6037143
EOH HOLDINGS LTD 41 2005 0.4682274 0.4843401 60.64 62.75 6.11 6.9058333 2.4 6 0.5192 0.1450947 -1.4685286 0.7187595
EOH HOLDINGS LTD 41 2006 0.3940774 0.6124379 2.95 3.87 7.99 7.3391667 2.09 7 1.3375 0.2680997 1.3830955 0.0164109
EOH HOLDINGS LTD 41 2007 0.3627451 0.4504522 2.84 3.76 10.26 9.115 2.13 8 1.2432 0.3405837 0.4568503 0.2866519
EOH HOLDINGS LTD 41 2008 -0.0923261 -0.1671926 2.59 3.47 7.24 10.8075 3.91 9 1.1027 0.2244256 0.241625 0.2156289
EOH HOLDINGS LTD 41 2009 -0.0647292 -0.1297288 11.43 11.81 5.59 7.8508333 3.02 10 0.5049 0.4343737 -0.2022918 0.6527182
EOH HOLDINGS LTD 41 2010 0.7175141 0.6189159 16.33 16.85 6.75 6.42 2.01 11 0.4975 0.5917206 1.4196537 0.2577238
EVRAZ HIGHVELD STEEL AND VANADIUM LTD 42 2001 -0.267374 0.1702475 1.44 -14.73 1.6 9.6766667 1.88 41 -1.1807 -0.119844 -0.2252048 0.0839254
EVRAZ HIGHVELD STEEL AND VANADIUM LTD 42 2002 0.2360608 0.0816389 1.03 0.58 7.3 11.1625 3.46 42 0.6978 -0.2116988 -0.1638874 -0.296443
81
EVRAZ HIGHVELD STEEL AND VANADIUM LTD 42 2003 -0.1095489 -0.1230705 0.87 1.12 6.52 10.665 5.88 43 0.0569 -0.0197064 -0.0453797 0.0271908
EVRAZ HIGHVELD STEEL AND VANADIUM LTD 42 2004 0.6861842 1.1498531 1.04 1.6 3.33 7.5325 2.92 44 2.61 0.1659941 0.2736012 -0.0573347
EVRAZ HIGHVELD STEEL AND VANADIUM LTD 42 2005 1.4365977 0.5750633 2.57 3.51 6.27 6.9058333 21.23 45 6.1967 0.04458 -0.4371042 0.7060268
EVRAZ HIGHVELD STEEL AND VANADIUM LTD 42 2006 0.2144115 -0.0836645 1.71 2.52 4.27 7.3391667 13.85 46 2.9286 0.1585743 0.3553298 -0.0278053
EVRAZ HIGHVELD STEEL AND VANADIUM LTD 42 2007 0.2534283 0.3708274 0.31 1.78 6.83 9.115 3.06 47 4.8281 0.0748268 0.5190669 -0.9511975
EVRAZ HIGHVELD STEEL AND VANADIUM LTD 42 2008 0.3407322 -0.568661 0.69 1.66 2.12 10.8075 21.88 48 5.8754 0.0805425 -0.1358326 0.7590534
EVRAZ HIGHVELD STEEL AND VANADIUM LTD 42 2009 -0.4815222 0.0077834 0.48 1.04 10.49 7.8508333 0 49 0.7806 -0.0860409 0.055668 -0.457778
EVRAZ HIGHVELD STEEL AND VANADIUM LTD 42 2010 0.1809927 0.2583365 0.63 2.58 157.59 6.42 0 50 -0.9122 -0.2000809 -0.235368 -0.0884034
FAMOUS BRANDS LTD 43 2001 -0.2587413 -0.3355545 1.52 2.14 3.14 9.6766667 13.54 6 1.9754 2.816E-05 0.0038841 -0.0050918
FAMOUS BRANDS LTD 43 2002 0.1415094 0.0187146 1.35 1.95 3.91 11.1625 8.9 7 1.3231 0.0949337 0.1319512 0.0433261
FAMOUS BRANDS LTD 43 2003 0.4214876 0.3321172 1.61 1.76 4.45 10.665 2.5 8 1.5997 0.0885122 0.0523997 0.1389114
FAMOUS BRANDS LTD 43 2004 1.5697674 0.9401431 -3.92 -2.53 6.37 7.5325 1.69 9 0.8189 0.3539589 0.1776958 0.5495251
FAMOUS BRANDS LTD 43 2005 0.7895928 0.9588507 -27.22 -19.62 9.53 6.9058333 2.15 10 1.9968 0.271252 0.2427203 0.2968437
FAMOUS BRANDS LTD 43 2006 0.5385588 0.5379358 8.93 8.15 11.81 7.3391667 1.22 11 2.3868 0.4290221 0.4208352 0.4361148
FAMOUS BRANDS LTD 43 2007 0.4387839 0.2628567 5.18 5.18 12.43 9.115 3.15 12 1.8656 0.314074 0.2896563 0.3346011
FAMOUS BRANDS LTD 43 2008 -0.1364934 0.0967545 153.23 115.99 8.61 10.8075 4.6 13 2.5181 0.1154963 0.4255835 -0.2395013
FAMOUS BRANDS LTD 43 2009 0.1990741 -0.0962343 -7.82 -4.45 9.1 7.8508333 3.9 14 2.5717 0.0788655 -0.0085432 0.204429
FAMOUS BRANDS LTD 43 2010 0.8047435 0.5566005 -9.93 -7.25 10.3 6.42 3.05 15 3.7353 0.1023618 0.2263008 -0.0845158
FIRSTRAND LTD 44 2001 0.066313 0.2070142 13.54 4.46 10.08 9.6766667 3.19 12 -0.7693 0.1755373 0.1649244 0.1981866
FIRSTRAND LTD 44 2002 -0.1007463 -0.1182187 16.8 5.74 8.61 11.1625 3.87 13 -0.8024 0.3488143 0.4538545 0.084237
FIRSTRAND LTD 44 2003 0.0567082 0.0014461 15.36 3.55 5.93 10.665 3.92 14 -0.8658 0.0492829 0.0490833 0.049889
FIRSTRAND LTD 44 2004 0.3835079 0.244272 13.88 5.23 10.04 7.5325 3.45 15 -0.8953 0.0615046 0.0471991 0.103711
FIRSTRAND LTD 44 2005 0.4134342 0.3007846 11.92 7.26 6.78 6.9058333 2.99 16 -0.8217 0.0891526 0.0516604 0.1894951
FIRSTRAND LTD 44 2006 0.2476573 0.1970119 13.77 20.07 -11.53 7.3391667 2.97 17 -0.9856 0.2293872 0.2017828 0.2952131
82
FIRSTRAND LTD 44 2007 0.25 0.3741004 14.34 4.8 7.35 9.115 3.91 18 -0.9626 0.2108035 0.2352214 0.1528968
FIRSTRAND LTD 44 2008 -0.3270386 -0.5298108 14.64 4.84 4.73 10.8075 5.12 19 -1.0584 0.1065697 0.1413442 0.0150524
FIRSTRAND LTD 44 2009 -0.0459184 0.0555897 14.58 1.93 1.46 7.8508333 3.05 20 -1.0408 -0.015517 -0.0099492 -0.0312971
FIRSTRAND LTD 44 2010 0.315508 0.2503657 13.8 4.8 5.13 6.42 3.41 21 -1.0072 0.0499484 0.2651589 -1.1143595
GRINDROD LTD 45 2001 0.7674419 0.3748567 1.77 4.48 1.6 9.6766667 4.49 41 0.5263 0.1724009 0.0928444 0.3468933
GRINDROD LTD 45 2002 0.5789474 0.2668001 2.83 -3.33 4.05 11.1625 4.86 42 0.4877 -0.0027904 -0.0922679 0.1503603
GRINDROD LTD 45 2003 0.2833333 0.5478344 2.82 1.33 6.02 10.665 3.7 43 0.8393 0.082419 0.0650544 0.1081993
GRINDROD LTD 45 2004 2.0844156 1.14399 2.79 2.78 6.09 7.5325 2.33 44 2.1091 0.221941 0.2529212 0.1751446
GRINDROD LTD 45 2005 1.0905263 0.4939836 2.11 3.27 7.4 6.9058333 3.53 45 2.3027 0.634873 0.5535802 0.7505376
GRINDROD LTD 45 2006 0.346425 0.2167896 2.04 3.67 7.61 7.3391667 3.85 46 1.67 0.3733654 0.3844306 0.3589111
GRINDROD LTD 45 2007 0.6207928 0.4197366 2.56 3.79 9.37 9.115 2.96 47 1.2223 0.2999828 0.2811795 0.3243297
GRINDROD LTD 45 2008 -0.0383018 -0.4183536 1.36 2.31 2.31 10.8075 7.32 48 1.8843 0.3367672 0.5016296 0.0791341
GRINDROD LTD 45 2009 -0.268714 0.1181671 1.47 1.97 6.13 7.8508333 5.51 49 0.3274 -0.1162482 -0.0877955 -0.1736674
GRINDROD LTD 45 2010 0.0538058 0.0671766 1.68 1.94 6.83 6.42 3.01 50 0.0852 0.1193531 0.0779272 0.201388
GROUP FIVE LTD 46 2001 0.2996255 0.3717992 3.34 3.3 2.32 9.6766667 5.56 41 0.0625 0.0219453 -0.1647846 0.0925945
GROUP FIVE LTD 46 2002 0.3256484 0.0148151 5.08 35.44 3.62 11.1625 4.11 42 0.4454 0.3245671 0.186724 0.3664591
GROUP FIVE LTD 46 2003 0.4434783 0.4248832 3.66 4.03 2.2 10.665 3.83 43 0.0976 -0.0824096 0.1469024 -0.1566428
GROUP FIVE LTD 46 2004 0.6385542 0.7411018 3.76 3.2 3.66 7.5325 2.9 44 0.1942 0.1072984 0.1747743 0.0806985
GROUP FIVE LTD 46 2005 0.5450368 0.383334 3.87 5.38 10.8 6.9058333 2.33 45 -0.0443 0.1908222 0.1292444 0.2151952
GROUP FIVE LTD 46 2006 0.8756692 0.6526556 9.48 9.92 12.14 7.3391667 1.23 46 -0.1417 0.5099044 -0.197634 0.6857568
GROUP FIVE LTD 46 2007 0.7725975 0.9203088 9.03 8.32 16.48 9.115 1.31 47 -0.0808 0.3556017 1.3409477 0.050321
GROUP FIVE LTD 46 2008 -0.1628198 -0.0722053 8.44 8.85 8.42 10.8075 2.96 48 -0.0573 0.3060748 0.2255163 0.3492223
GROUP FIVE LTD 46 2009 -0.2556102 -0.1746915 6.37 5.92 3.35 7.8508333 3.38 49 -0.1199 0.1239152 0.0785797 0.1459814
GROUP FIVE LTD 46 2010 0.0218203 0.0010162 4.35 3.96 3.11 6.42 3.72 50 -0.5239 -0.0387439 0.0394389 -0.0777624
HOSKEN CONSOLIDATED INVESTMENTS LTD 47 2001 -0.4429224 -0.6176963 0.15 -200.31 2.74 9.6766667 0 41 -0.244 -0.0312035 -0.0491097 0.4145431
HOSKEN CONSOLIDATED INVESTMENTS LTD 47 2002 -0.4125683 -0.6513485 0.49 4.96 2.4 11.1625 0 42 -2.5663 -0.0644875 -0.1700742 1.0323461
83
HOSKEN CONSOLIDATED INVESTMENTS LTD 47 2003 0.5674419 -0.6986855 0.91 33.76 0.61 10.665 0 43 -4.9598 -1.0951365 -1.1794024 -0.7008308
HOSKEN CONSOLIDATED INVESTMENTS LTD 47 2004 1.1691395 0.014558 1.85 2.18 6.555 7.5325 4.32 44 -0.7882 0.6698871 0.1378742 1.597769
HOSKEN CONSOLIDATED INVESTMENTS LTD 47 2005 3.0437757 2.1733402 1.08 3.89 12.5 6.9058333 0 45 1.9228 0.1115773 0.4524339 -0.3186334
HOSKEN CONSOLIDATED INVESTMENTS LTD 47 2006 0.5064276 0.362149 0.67 0.57 33.69 7.3391667 0 46 -0.299 1.4379062 1.5805117 1.1020533
HOSKEN CONSOLIDATED INVESTMENTS LTD 47 2007 0.6195823 0.4194995 1.14 1.88 7.74 9.115 0.63 47 0.0433 0.3390062 0.2584438 0.5480131
HOSKEN CONSOLIDATED INVESTMENTS LTD 47 2008 -0.1428175 0.2707878 1.4 2.23 3.97 10.8075 1.5 48 1.1637 0.0552765 -0.1673178 0.4259004
HOSKEN CONSOLIDATED INVESTMENTS LTD 47 2009 -0.1646716 -0.64914 1.25 1.21 1.92 7.8508333 0 49 1.1489 0.0929432 0.3773123 -0.4322983
HOSKEN CONSOLIDATED INVESTMENTS LTD 47 2010 0.5019365 0.6473011 1.03 1.25 5.07 6.42 0.9 50 0.431 0.0390024 0.0321599 0.0578576
HOWDEN AFRICA HOLDINGS 48 2001 -0.1836735 -0.2657032 1.03 -0.27 2.31 9.6766667 13.04 5 1.2739 -0.0209367 -0.1282957 0.1037485
HOWDEN AFRICA HOLDINGS 48 2002 -0.175 0.1726127 1.29 0.38 1.88 11.1625 0 6 1.4364 0.1788842 0.0549604 0.292708
HOWDEN AFRICA HOLDINGS 48 2003 0.530303 0.603916 1.89 0.73 2.83 10.665 2 7 1.6222 0.0180566 0.0922117 -0.0467699
HOWDEN AFRICA HOLDINGS 48 2004 0.6633663 0.3829923 1.8 0.84 8.81 7.5325 4.09 8 1.4842 0.0167669 -0.2256975 0.2005516
HOWDEN AFRICA HOLDINGS 48 2005 1.4404762 0.8007778 1.36 1.48 10.44 6.9058333 2.04 9 0.5967 0.2544498 0.5616667 0.0059296
HOWDEN AFRICA HOLDINGS 48 2006 0.1731707 -0.2029408 -14.93 -11.73 11.16 7.3391667 0.98 10 0.3123 -0.0457851 -0.5091717 0.2875044
HOWDEN AFRICA HOLDINGS 48 2007 0.4740125 0.9650809 79.88 69.02 9.33 9.115 0 11 1.3925 0.0399669 -0.3188868 0.1753613
HOWDEN AFRICA HOLDINGS 48 2008 0.4598025 -0.3364722 -17.49 -14.62 7.01 10.8075 3.16 12 1.3438 0.3271402 0.7180118 0.1759772
HOWDEN AFRICA HOLDINGS 48 2009 -0.2541063 0.2363888 6.06 6.4 6.32 7.8508333 2.84 13 2.0699 0.3420166 0.6040145 0.1782306
HOWDEN AFRICA HOLDINGS 48 2010 0.4119171 0.1282543 5.33 5.86 7.82 6.42 2.85 14 1.172 -0.0065644 0.0790034 -0.0780357
HUDACO INDUSTRIES LTD 49 2001 0.0269687 0.461996 1 1.85 4.45 9.6766667 4.87 41 1.4059 0.1632809 0.0573169 0.3288974
HUDACO INDUSTRIES LTD 49 2002 0.5367647 0.4707458 1.17 1.93 5.37 11.1625 1.86 42 1.3755 0.0725437 0.0914238 0.046175
HUDACO INDUSTRIES LTD 49 2003 0.2611073 0.2968701 0.97 1.45 4.21 10.665 5.08 43 1.6085 0.0525044 0.1301513 -0.0700566
HUDACO INDUSTRIES LTD 49 2004 0.4102981 0.3728655 0.84 1.33 6.3 7.5325 3.82 44 1.5072 0.0832706 0.1110615 0.0328366
HUDACO INDUSTRIES LTD 49 2005 0.4481168 0.2023942 0.79 1.72 7.5 6.9058333 3.18 45 1.9269 0.1175803 0.1234106 0.1064835
HUDACO INDUSTRIES LTD 49 2006 0.2802548 0.3117949 0.79 1.86 9.91 7.3391667 2.49 46 1.908 0.2280402 0.1375932 0.3816139
84
HUDACO INDUSTRIES LTD 49 2007 0.6658375 0.5570887 4.04 2.92 9.79 9.115 2.32 47 0.5463 1.1070121 1.4376539 0.2170908
HUDACO INDUSTRIES LTD 49 2008 -0.1153559 -0.4675158 3.51 2.61 4.93 10.8075 5.04 48 0.8733 0.0567948 0.0622109 0.0287248
HUDACO INDUSTRIES LTD 49 2009 -0.2173301 0.2290549 2.69 1.85 7.06 7.8508333 5.83 49 0.4673 -0.0390852 0.0360249 -0.568589
HUDACO INDUSTRIES LTD 49 2010 0.2945723 0.2619643 3.29 2.16 9.81 6.42 4.22 50 0.2734 0.031747 -0.0008024 0.300986
HYPROP INVESTMENTS LTD 50 2001 0.3004808 0.4005405 2.38 0.03 162.73 9.6766667 12.63 41 -1.3804 0.7440717 0.7513838 0.6810971
HYPROP INVESTMENTS LTD 50 2002 -0.0462107 0.1447745 1.63 0.86 12.43 11.1625 11.06 42 -0.4307 0.4640422 0.5197215 -0.2510556
HYPROP INVESTMENTS LTD 50 2003 0.1715116 0.4973745 2.58 2.78 35.85 10.665 9.56 43 -0.3733 0.9207425 0.9307688 0.7046727
HYPROP INVESTMENTS LTD 50 2004 0.2572374 0.5063376 1.32 7.12 38.87 7.5325 7.66 44 2.0585 0.2980014 0.2993254 0.2654461
HYPROP INVESTMENTS LTD 50 2005 0.6039474 0.7455468 1.02 6.85 51.34 6.9058333 5.52 45 1.8605 0.4862496 0.486925 0.4692068
HYPROP INVESTMENTS LTD 50 2006 0.3753076 0.2613701 0.68 5.1 42.95 7.3391667 5.43 46 1.5872 0.2443327 0.2485602 0.1302167
HYPROP INVESTMENTS LTD 50 2007 0.348643 0.2963 0.62 0.57 62.36 9.115 5.44 47 1.297 0.2840133 0.2847457 0.2627949
HYPROP INVESTMENTS LTD 50 2008 -0.1483857 -0.0689929 0.7 0.16 43.23 10.8075 6.9 48 -0.0546 -0.0995845 -0.1050596 0.0487746
HYPROP INVESTMENTS LTD 50 2009 0.0695923 0.0877056 0.72 0.31 32.91 7.8508333 6.96 49 0.1412 0.1302421 0.1301246 0.133189
HYPROP INVESTMENTS LTD 50 2010 0.2483613 0.2176761 0.63 0.44 41.86 6.42 5.98 50 0.1289 0.0582963 0.0549757 0.1380317
ILIAD AFRICA LTD 51 2001 0.328125 0.5276977 1.9 2.04 2.62 9.6766667 5.79 3 2.3993 0.1101348 0.2290476 0.0412473
ILIAD AFRICA LTD 51 2002 0.8235294 0.6388908 1.68 2.28 3.68 11.1625 3.57 4 2.619 0.2601965 0.3172782 0.2221147
ILIAD AFRICA LTD 51 2003 1.2451613 1.5540981 1.3 2.05 9.36 10.665 2.18 5 2.9626 0.8528786 1.0112404 0.7249945
ILIAD AFRICA LTD 51 2004 0.9137931 0.641384 1.29 2.17 9.3 7.5325 1.86 6 2.775 0.3046932 0.2975771 0.3112764
ILIAD AFRICA LTD 51 2005 0.5630631 0.1245248 1.75 2.48 9.96 6.9058333 2.11 7 2.4743 0.1473717 -0.0072976 0.2710609
ILIAD AFRICA LTD 51 2006 0.1805956 0.1413018 3.08 3.96 9.14 7.3391667 2.46 8 2.2699 0.2103885 0.0962108 0.2827557
ILIAD AFRICA LTD 51 2007 0.4190399 0.0767684 2.72 3.41 8.95 9.115 2.64 9 2.237 0.1436818 0.2474665 0.0784803
ILIAD AFRICA LTD 51 2008 -0.4724771 -0.8178845 3.5 3.52 3.08 10.8075 7.41 10 2.0144 0.0756616 0.0478059 0.0942626
ILIAD AFRICA LTD 51 2009 -0.1858696 0.3485797 1.89 1.66 12.52 7.8508333 5.31 11 0.6242 -0.1694843 0.0224061 -0.3179969
ILIAD AFRICA LTD 51 2010 0.0747664 0.1599646 2.44 2.01 14.81 6.42 1.74 12 0.2171 0.4904387 0.4830264 0.4971877
ILLOVO SUGAR LTD 52 2001 0.2174721 -0.177995 1.44 1.64 2.82 9.6766667 4.76 9 1.0742 0.06674 0.0115915 0.1359822
ILLOVO SUGAR LTD 52 2002 0.2259542 0.588774 1.29 1.57 2.92 11.1625 7.04 10 1.4231 0.1397619 0.1610639 0.1140291
85
ILLOVO SUGAR LTD 52 2003 -0.0784558 -0.1794711 1.52 -0.4 2.67 10.665 8.63 11 1.0166 0.0105742 -0.1177033 0.1493742
ILLOVO SUGAR LTD 52 2004 0.0418919 0.179246 1.35 0 2.23 7.5325 5.16 12 0.4669 -0.1398658 -0.0904058 -0.1890668
ILLOVO SUGAR LTD 52 2005 0.1712062 -0.001712 1.14 0.43 4.46 6.9058333 2.62 13 -0.1145 -0.1785485 -0.1332162 -0.2282276
ILLOVO SUGAR LTD 52 2006 0.9280177 0.7261844 1.17 1.31 5.11 7.3391667 3.66 14 0.7837 0.0549843 0.052762 0.0575321
ILLOVO SUGAR LTD 52 2007 0.2573234 0.1604079 1.07 1.77 5.93 9.115 3.49 15 1.1324 0.1639786 0.2040916 0.1160353
ILLOVO SUGAR LTD 52 2008 0.1886706 0.4475224 1.21 1.74 8.27 10.8075 4.18 16 0.8157 0.3114194 0.4529461 0.1008301
ILLOVO SUGAR LTD 52 2009 0.11299 -0.0365322 1.3 1.85 6.93 7.8508333 3.02 17 0.7867 0.181573 0.1031603 0.3072871
ILLOVO SUGAR LTD 52 2010 -0.0082873 0.3125985 0.44 1.18 11.6 6.42 2.72 18 1.0488 0.0784443 0.3425938 -0.4975295
IMPALA PLATINUM HOLDINGS LTD 53 2001 0.2985817 0.4739656 6.87 8.1 6.07 9.6766667 6.76 41 3.6426 0.2931596 0.3124134 0.2541676
IMPALA PLATINUM HOLDINGS LTD 53 2002 0.3872389 0.3519607 2.05 3.34 9.27 11.1625 6.79 42 2.8252 0.2323089 0.1402497 0.4006851
IMPALA PLATINUM HOLDINGS LTD 53 2003 -0.0994475 -0.2478695 2.35 2.6 7.81 10.665 4.57 43 1.6041 0.0965193 0.3175468 -0.4101616
IMPALA PLATINUM HOLDINGS LTD 53 2004 -0.0156442 0.0548244 2.08 2.37 9.83 7.5325 4.38 44 1.685 0.0456085 0.0646614 -0.020529
IMPALA PLATINUM HOLDINGS LTD 53 2005 0.2291991 0.2207894 0.98 3.26 7.93 6.9058333 2.47 45 3.0024 0.2008527 0.2391673 0.0482794
IMPALA PLATINUM HOLDINGS LTD 53 2006 0.9236912 0.7996003 2.45 3.71 14.04 7.3391667 2.14 46 2.167 0.1129096 0.0353202 0.3961001
IMPALA PLATINUM HOLDINGS LTD 53 2007 0.4510411 0.4048524 0.93 1.9 16.26 9.115 4.11 47 2.1804 0.7419034 0.8307793 0.4076619
IMPALA PLATINUM HOLDINGS LTD 53 2008 0.0779256 0.3595698 0.94 2.53 13.57 10.8075 10.93 48 3.5934 0.2218104 0.2652424 -0.0103244
IMPALA PLATINUM HOLDINGS LTD 53 2009 -0.2945612 -0.6034815 0.47 1.4 12.09 7.8508333 1.58 49 1.2525 -0.0749431 -0.0183618 -0.5179097
IMPALA PLATINUM HOLDINGS LTD 53 2010 0.1838161 0.0555313 0.54 1.47 16.8 6.42 1.67 50 0.9901 0.0824772 0.0782518 0.1243079
IMPERIAL HOLDINGS LTD 54 2001 0.067609 0.2308209 1.32 1.64 7.25 9.6766667 1.77 11 0.9503 0.1227023 0.1461966 0.092336
IMPERIAL HOLDINGS LTD 54 2002 -0.174988 -0.2398776 1.62 2.6 4.59 11.1625 0 12 0.672 0.1657345 0.2216833 0.086252
IMPERIAL HOLDINGS LTD 54 2003 0.0815932 -0.0515801 1.54 1.71 4.2 10.665 3.96 13 0.676 0.0970263 0.0628904 0.1467904
IMPERIAL HOLDINGS LTD 54 2004 0.3634251 0.238779 1.6 1.68 4.84 7.5325 0 14 0.6674 0.0728415 0.1127638 0.0142153
IMPERIAL HOLDINGS LTD 54 2005 0.4759407 0.43579 2.1 3.61 6.26 6.9058333 0 15 0.9937 0.218916 -0.0314489 0.5128561

86
IMPERIAL HOLDINGS LTD 54 2006 0.3071866 0.3445673 2.54 2.81 6.19 7.3391667 0 16 0.7739 0.2570813 0.3957504 0.1141856
IMPERIAL HOLDINGS LTD 54 2007 -0.0311247 0.0810972 2.4 2.79 6.16 9.115 5.22 17 0.7 0.192787 0.1514887 0.2396659
IMPERIAL HOLDINGS LTD 54 2008 -0.5628113 -1.0715651 3 -1.01 1.28 10.8075 4.11 18 0.4346 -0.1851467 -0.0894893 -0.300596
IMPERIAL HOLDINGS LTD 54 2009 0.0523023 0.1000383 2.26 2.54 4.11 7.8508333 2.26 19 0.0214 -0.1784686 -0.1440865 -0.2265309
IMPERIAL HOLDINGS LTD 54 2010 0.5609087 0.3805638 1.96 2.62 6.53 6.42 2.75 20 0.5097 -0.0071932 -0.0914871 0.1041376
INTERTRADING LTD 55 2001 -0.5 -1.446919 3.34 4.88 5 9.6766667 6 2 0.5706 0.6864965 0.3229087 0.8700242
INTERTRADING LTD 55 2002 0.3043478 0.4054651 2.68 4.2 2.37 11.1625 0 3 2.2091 0.2969154 0.3964366 0.2560786
INTERTRADING LTD 55 2003 -0.1833333 -0.1240526 1.56 1.68 3.03 10.665 4 4 0.3637 0.0357756 0.6613237 -0.4462829
INTERTRADING LTD 55 2004 0 -0.0582689 0.43 0.54 -3.47 7.5325 2.17 5 -0.8534 -0.9628433 -0.7317953 -1.3878018
INTERTRADING LTD 55 2005 0.0612245 0 0.3 -0.44 -4.08 6.9058333 2.04 6 0.2019 -0.0520867 0.0607693 -0.4183175
INTERTRADING LTD 55 2006 -0.0384615 0 1.68 3.17 -3.13 7.3391667 0 7 -1.743 0.4624708 -0.1970302 1.5615056
INTERTRADING LTD 55 2007 -0.14 -0.040822 2.46 -21.02 0.82 9.115 0 8 -5.5767 -0.0521543 -0.2771081 0.082241
INTERTRADING LTD 55 2008 -0.1162791 -0.4054651 1.24 5.26 10.82 10.8075 12.12 9 0.1788 -0.2741127 0.0966769 -0.5274173
INTERTRADING LTD 55 2009 -0.1315789 -0.0645385 0.84 1.04 6.935 7.8508333 17.14 10 0.6538 -0.2538573 -0.0116996 -0.5481605
INTERTRADING LTD 55 2010 0.0606061 0.3364722 0.12 16.59 3.05 6.42 72.7 11 -1.4379 -0.4856127 -0.0944033 -1.9200926
INVESTEC LTD 56 2001 -0.179545 -0.2740978 51.24 5.46 12.94 9.6766667 5.09 41 -1.5163 0.178306 0.1040737 1.3212472
INVESTEC LTD 56 2002 -0.3517415 -0.2847429 54.61 18.26 8.81 11.1625 7.48 42 -1.5549 0.4270525 0.3659094 0.8485639
INVESTEC LTD 56 2003 -0.2877342 -0.3268188 35.55 -6.3 1.89 10.665 5.2 43 -1.5781 -0.4352465 -0.4930349 -0.1680464
INVESTEC LTD 56 2004 0.3186104 0.3960325 25.74 4.6 7.58 7.5325 3.84 44 -1.2252 -0.1394252 -0.2097238 0.0976718
INVESTEC LTD 56 2005 0.5796011 0.3969779 18.65 3.88 7.21 6.9058333 3.2 45 -1.2378 0.1648715 0.084442 0.3669855
INVESTEC LTD 56 2006 0.6154396 0.5865824 14.44 5.9 10.82 7.3391667 3 46 -1.0416 0.2050763 0.0821273 0.4304448
INVESTEC LTD 56 2007 0.2576696 0.4259173 14.64 4.84 16.52 9.115 5.2 47 -1.0901 0.3177807 0.3380473 0.2856947
INVESTEC LTD 56 2008 -0.3909933 -0.3583608 15.7 3.74 3.53 10.8075 7.86 48 -1.1619 0.4484937 0.7179513 -0.2498819
INVESTEC LTD 56 2009 -0.0878105 -0.3314258 13.61 1.83 1.68 7.8508333 3.12 49 -1.0025 -0.074684 -0.2960157 0.540171
INVESTEC LTD 56 2010 0.2159595 0.5483696 14.76 2.03 3.95 6.42 3.19 50 -1.0439 0.4544293 0.1822328 0.8568698
INVICTA HOLDINGS 57 2001 0.1771654 0.0521991 1.1 1.74 3.31 9.6766667 7.31 12 3.5828 0 0 0
87
INVICTA HOLDINGS 57 2002 0.3545151 -0.0520436 1.34 1.62 2.52 11.1625 5.74 13 3.3105 0.1672848 0.0508427 0.2774007
INVICTA HOLDINGS 57 2003 0.5777778 0.5795291 1.19 1.74 2.65 10.665 6.76 14 3.5543 0.1852963 0.2561577 0.1212889
INVICTA HOLDINGS 57 2004 0.6885759 0.2934768 1.23 1.91 3.43 7.5325 5.5 15 2.8773 -0.0141518 -0.0099441 -0.0182344
INVICTA HOLDINGS 57 2005 0.4643188 0.6329622 1.16 2.05 5.34 6.9058333 5.05 16 2.8947 -0.008986 0.0219327 -0.0400583
INVICTA HOLDINGS 57 2006 0.2329114 0.3004759 3.89 3.71 7.86 7.3391667 2.55 17 1.2876 0.904794 1.2899155 0.2373354
INVICTA HOLDINGS 57 2007 0.4686858 0.396483 3.24 2.62 9.35 9.115 3.96 18 1.4771 0.1915652 0.1088918 0.4031677
INVICTA HOLDINGS 57 2008 -0.1066061 -0.0736005 5.19 3.74 5.79 10.8075 6.26 19 1.1173 0.5830672 0.6462395 0.4272354
INVICTA HOLDINGS 57 2009 -0.127543 -0.2365618 4.8 2.77 3.16 7.8508333 5.36 20 1.3738 0.139474 0.1268202 0.1735238
INVICTA HOLDINGS 57 2010 0.4152466 0.3642958 3.56 2.08 4.06 6.42 3.66 21 0.8031 -0.0146915 0.0898249 -0.3566638
ITALTILE LTD 58 2001 0.0886076 0.0273659 0.65 1.71 10.71 9.6766667 1.58 41 1.9413 0.2992517 0.2657694 0.3586497
ITALTILE LTD 58 2002 0.2093023 0.2177778 0.73 1.9 7.73 11.1625 1.56 42 2.3564 0.3676148 0.3541082 0.3900826
ITALTILE LTD 58 2003 0.375 0.2854239 0.49 1.37 7.62 10.665 1.81 43 2.3365 0.1218804 0.2641844 -0.165612
ITALTILE LTD 58 2004 0.3846154 0.2559807 0.54 1.46 8.46 7.5325 1.19 44 2.507 0.1809465 0.1489052 0.2571519
ITALTILE LTD 58 2005 0.6868687 0.5400415 0.68 1.77 11.08 6.9058333 1.57 45 2.5474 0.2405302 0.2451516 0.2300369
ITALTILE LTD 58 2006 0.3592814 0.3455804 0.51 1.47 12.9 7.3391667 2.07 46 2.5876 0.1474353 0.1811088 0.0658454
ITALTILE LTD 58 2007 0.3061674 0.4130621 0.45 1.44 17.28 9.115 2.64 47 2.5838 0.1833692 0.2016916 0.1347326
ITALTILE LTD 58 2008 -0.46543 -0.6093191 0.4 1.24 7.07 10.8075 3.93 48 2.2877 0.1529746 0.2607932 -0.221744
ITALTILE LTD 58 2009 -0.0378549 -0.1791719 0.48 1.28 6.58 7.8508333 2.93 49 1.6575 0.2110034 0.2782033 -0.1588236
ITALTILE LTD 58 2010 0.2393443 0.4336932 0.44 1.31 10.1 6.42 2.45 50 1.7009 0.0639211 0.0772917 -0.0333364
JASCO ELECTRONICS HOLDINGS LTD 59 2001 -0.64 -1.6471782 34.23 391.15 3.58 9.6766667 0 41 -8.8545 -0.3915399 -2.7688944 0.0769506
JASCO ELECTRONICS HOLDINGS LTD 59 2002 1.9166667 0.9503604 6.9 4.12 2.05 11.1625 2.98 42 -1.5073 -0.2093088 1.0260444 -0.3072981
JASCO ELECTRONICS HOLDINGS LTD 59 2003 0.1904762 0.9315582 2.58 2.06 2.66 10.665 6.45 43 15.3282 -0.1682122 0.7248159 -0.4031533
JASCO ELECTRONICS HOLDINGS LTD 59 2004 -0.128 -0.3715616 2.27 0.91 5.83 7.5325 0 44 -24.8069 -0.2380242 -0.2301973 -0.2415539
JASCO ELECTRONICS HOLDINGS LTD 59 2005 1.0275229 1.0264891 1.13 1.69 7.82 6.9058333 2.7 45 5.8976 -0.0788536 0.4360641 -0.443366
JASCO ELECTRONICS HOLDINGS LTD 59 2006 0.2081448 0.0991572 1.32 2.07 6.03 7.3391667 3.67 46 3.4224 0.4135317 0.3525918 0.4761391

88
JASCO ELECTRONICS HOLDINGS LTD 59 2007 0.329588 0.1702454 1.34 2.19 4.85 9.115 3.56 47 2.611 0.308308 0.3016019 0.3147425
JASCO ELECTRONICS HOLDINGS LTD 59 2008 -0.2507042 0.2915212 1.52 2.26 4.56 10.8075 9.3 48 2.0703 0.251164 0.1893155 0.3067586
JASCO ELECTRONICS HOLDINGS LTD 59 2009 -0.3533835 -0.4256945 1.23 1.31 3 7.8508333 5.65 49 0.6205 0.7621321 1.1230537 0.3026223
JASCO ELECTRONICS HOLDINGS LTD 59 2010 -0.1918605 -0.2071432 1.26 0.98 3.39 6.42 0 50 0.291 0.1536649 0.2705446 -0.1190701
JD GROUP LTD 60 2001 -0.16287 -0.1737779 1.08 0.91 7.89 9.6766667 3.62 41 0.5931 0.252232 0.2185485 0.3733869
JD GROUP LTD 60 2002 -0.48558 -0.8818298 0.97 1.28 5.86 11.1625 2.7 42 0.5226 -0.0818523 -0.0874825 -0.0633248
JD GROUP LTD 60 2003 0.441069 1.027055 1.01 1.35 7.78 10.665 2.62 43 0.893 0.4957681 0.337997 0.8841136
JD GROUP LTD 60 2004 0.725554 0.3754566 0.85 1.39 6.52 7.5325 3.54 44 1.2244 0.1036174 0.1784677 -0.05463
JD GROUP LTD 60 2005 0.434801 0.5257987 0.67 1.43 8.62 6.9058333 4.59 45 1.7656 0.0907538 0.1447614 -0.0507305
JD GROUP LTD 60 2006 0.128469 -0.091216 0.77 1.63 6.77 7.3391667 5.18 46 1.7684 0.1571242 0.14932 0.1793479
JD GROUP LTD 60 2007 -0.02758 0.056669 0.59 1.38 5.11 9.115 5.94 47 1.5397 -0.0271387 -0.0336656 -0.0090534
JD GROUP LTD 60 2008 -0.55887 -0.8938967 0.82 1 3.54 10.8075 4.15 48 0.8877 -0.13095 -0.2994042 0.2227481
JD GROUP LTD 60 2009 0.201699 0.3447436 0.85 1.2 4.38 7.8508333 0.83 49 0.3947 0.0124657 0.0928089 -0.1335314
JD GROUP LTD 60 2010 0.1698637 0.0260177 0.96 1.3 4.14 6.42 2.59 50 0.8538 0.0325785 0.0012426 0.0935002
KAGISO MEDIA LTD 61 2001 0.0823529 0.2318016 0.64 1.35 7.73 9.6766667 0 11 1.0035 -0.2473965 -0.4593324 0.2362402
KAGISO MEDIA LTD 61 2002 0.0108696 -0.0947929 0.69 1.85 5.5 11.1625 6.35 12 2.2743 0.1308269 0.1044737 0.1722069
KAGISO MEDIA LTD 61 2003 0.4910394 0.4531501 1.33 2.33 6.17 10.665 7.08 13 2.51 -0.0200795 -0.053641 0.0288065
KAGISO MEDIA LTD 61 2004 0.9759615 0.6116236 2.98 3.9 9.95 7.5325 6.81 14 2.1344 0.2593756 0.1049939 0.4416725
KAGISO MEDIA LTD 61 2005 0.4501217 0.4339385 1.93 2.83 10.82 6.9058333 6.62 15 4.7497 0.8770132 1.3442671 -0.0257982
KAGISO MEDIA LTD 61 2006 0.0578859 -0.0799914 1.3 2.29 9.01 7.3391667 5.31 16 4.7058 0.1244049 0.1218306 0.1344549
KAGISO MEDIA LTD 61 2007 0.185567 0.3662155 1.25 2.18 11.81 9.115 3.68 17 4.1257 0.1205254 0.0456155 0.3673804
KAGISO MEDIA LTD 61 2008 -0.2381271 -0.1429916 1.13 2.11 6.51 10.8075 4.92 18 4.3198 0.068041 0.0542748 0.1057672
KAGISO MEDIA LTD 61 2009 0.118525 0.0188003 1.21 2.11 6.96 7.8508333 4.14 19 3.8048 0.1632142 0.175347 0.1300671
KAGISO MEDIA LTD 61 2010 0.1978022 0.1452818 0.7 1.79 7.56 6.42 4.15 20 3.2723 -0.0023075 0.055818 -0.185338
LONDON FINANCE & INVESTMENT GROUP PLC 62 2001 0.0647668 0.159203 0.21 4.13 -421.05 9.6766667 3.12 41 0.3985 0.1683636 0.1780203 0.122736
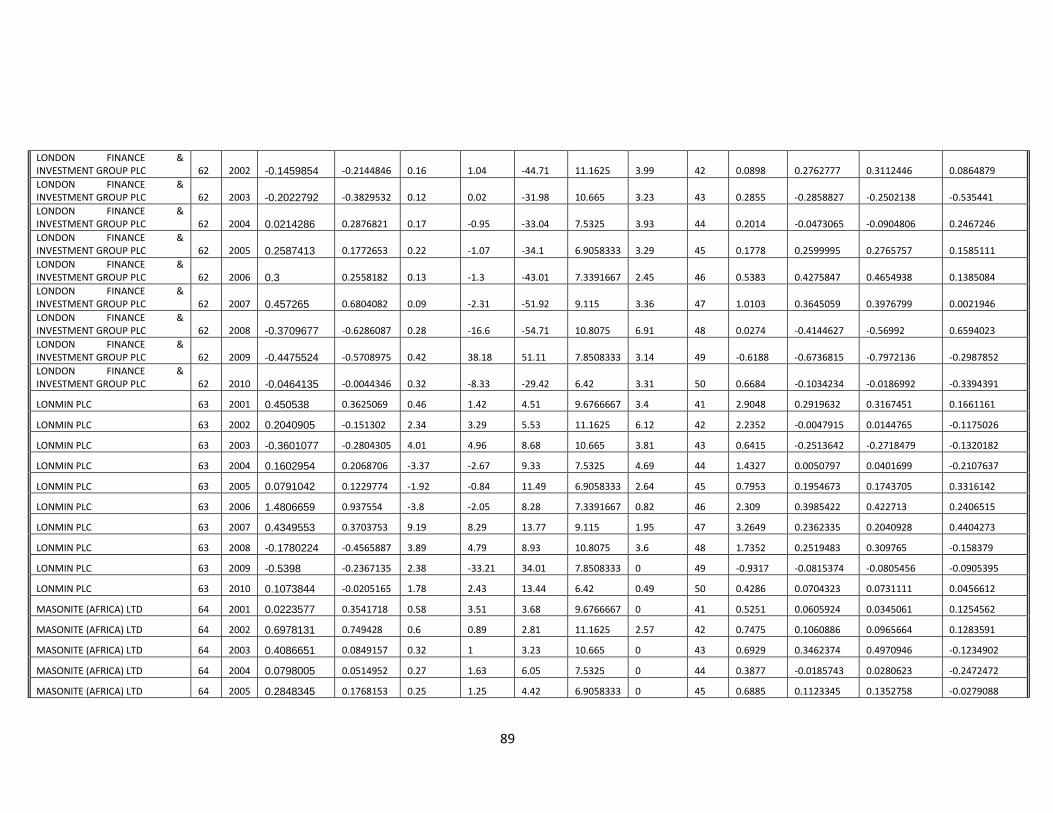
89
LONDON FINANCE & INVESTMENT GROUP PLC 62 2002 -0.1459854 -0.2144846 0.16 1.04 -44.71 11.1625 3.99 42 0.0898 0.2762777 0.3112446 0.0864879
LONDON FINANCE & INVESTMENT GROUP PLC 62 2003 -0.2022792 -0.3829532 0.12 0.02 -31.98 10.665 3.23 43 0.2855 -0.2858827 -0.2502138 -0.535441
LONDON FINANCE & INVESTMENT GROUP PLC 62 2004 0.0214286 0.2876821 0.17 -0.95 -33.04 7.5325 3.93 44 0.2014 -0.0473065 -0.0904806 0.2467246
LONDON FINANCE & INVESTMENT GROUP PLC 62 2005 0.2587413 0.1772653 0.22 -1.07 -34.1 6.9058333 3.29 45 0.1778 0.2599995 0.2765757 0.1585111
LONDON FINANCE & INVESTMENT GROUP PLC 62 2006 0.3 0.2558182 0.13 -1.3 -43.01 7.3391667 2.45 46 0.5383 0.4275847 0.4654938 0.1385084
LONDON FINANCE & INVESTMENT GROUP PLC 62 2007 0.457265 0.6804082 0.09 -2.31 -51.92 9.115 3.36 47 1.0103 0.3645059 0.3976799 0.0021946
LONDON FINANCE & INVESTMENT GROUP PLC 62 2008 -0.3709677 -0.6286087 0.28 -16.6 -54.71 10.8075 6.91 48 0.0274 -0.4144627 -0.56992 0.6594023
LONDON FINANCE & INVESTMENT GROUP PLC 62 2009 -0.4475524 -0.5708975 0.42 38.18 51.11 7.8508333 3.14 49 -0.6188 -0.6736815 -0.7972136 -0.2987852
LONDON FINANCE & INVESTMENT GROUP PLC 62 2010 -0.0464135 -0.0044346 0.32 -8.33 -29.42 6.42 3.31 50 0.6684 -0.1034234 -0.0186992 -0.3394391
LONMIN PLC 63 2001 0.450538 0.3625069 0.46 1.42 4.51 9.6766667 3.4 41 2.9048 0.2919632 0.3167451 0.1661161
LONMIN PLC 63 2002 0.2040905 -0.151302 2.34 3.29 5.53 11.1625 6.12 42 2.2352 -0.0047915 0.0144765 -0.1175026
LONMIN PLC 63 2003 -0.3601077 -0.2804305 4.01 4.96 8.68 10.665 3.81 43 0.6415 -0.2513642 -0.2718479 -0.1320182
LONMIN PLC 63 2004 0.1602954 0.2068706 -3.37 -2.67 9.33 7.5325 4.69 44 1.4327 0.0050797 0.0401699 -0.2107637
LONMIN PLC 63 2005 0.0791042 0.1229774 -1.92 -0.84 11.49 6.9058333 2.64 45 0.7953 0.1954673 0.1743705 0.3316142
LONMIN PLC 63 2006 1.4806659 0.937554 -3.8 -2.05 8.28 7.3391667 0.82 46 2.309 0.3985422 0.422713 0.2406515
LONMIN PLC 63 2007 0.4349553 0.3703753 9.19 8.29 13.77 9.115 1.95 47 3.2649 0.2362335 0.2040928 0.4404273
LONMIN PLC 63 2008 -0.1780224 -0.4565887 3.89 4.79 8.93 10.8075 3.6 48 1.7352 0.2519483 0.309765 -0.158379
LONMIN PLC 63 2009 -0.5398 -0.2367135 2.38 -33.21 34.01 7.8508333 0 49 -0.9317 -0.0815374 -0.0805456 -0.0905395
LONMIN PLC 63 2010 0.1073844 -0.0205165 1.78 2.43 13.44 6.42 0.49 50 0.4286 0.0704323 0.0731111 0.0456612
MASONITE (AFRICA) LTD 64 2001 0.0223577 0.3541718 0.58 3.51 3.68 9.6766667 0 41 0.5251 0.0605924 0.0345061 0.1254562
MASONITE (AFRICA) LTD 64 2002 0.6978131 0.749428 0.6 0.89 2.81 11.1625 2.57 42 0.7475 0.1060886 0.0965664 0.1283591
MASONITE (AFRICA) LTD 64 2003 0.4086651 0.0849157 0.32 1 3.23 10.665 0 43 0.6929 0.3462374 0.4970946 -0.1234902
MASONITE (AFRICA) LTD 64 2004 0.0798005 0.0514952 0.27 1.63 6.05 7.5325 0 44 0.3877 -0.0185743 0.0280623 -0.2472472
MASONITE (AFRICA) LTD 64 2005 0.2848345 0.1768153 0.25 1.25 4.42 6.9058333 0 45 0.6885 0.1123345 0.1352758 -0.0279088
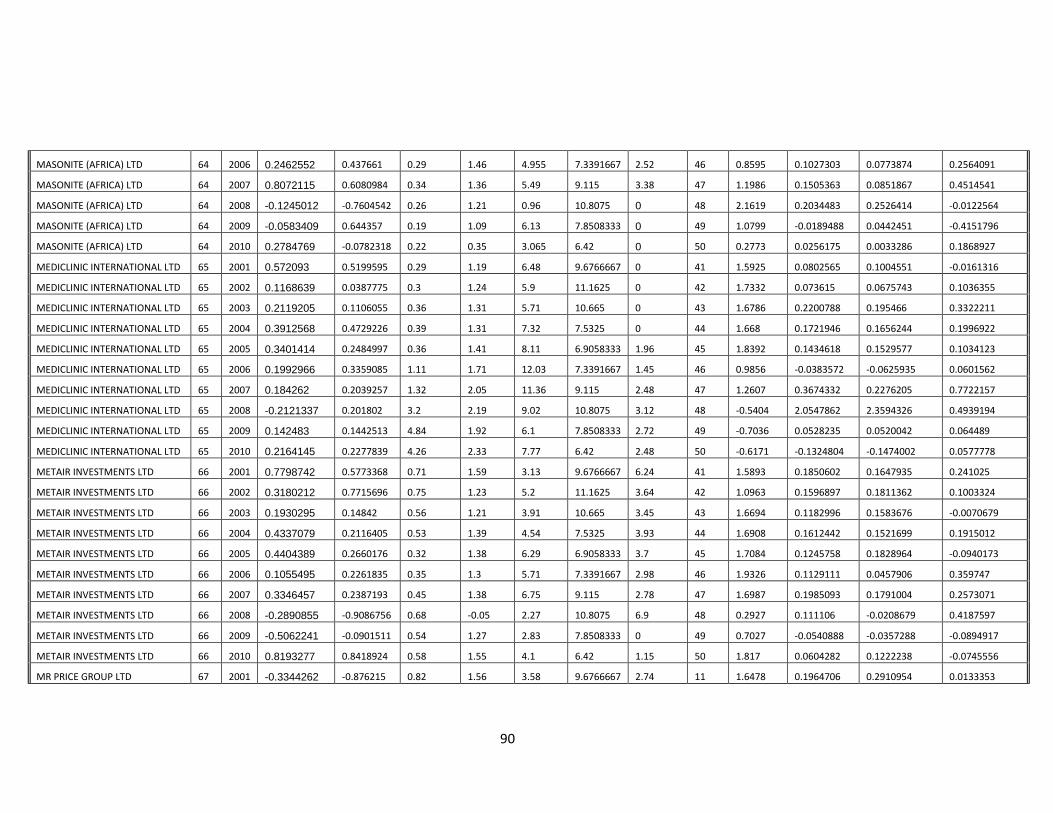
90
MASONITE (AFRICA) LTD 64 2006 0.2462552 0.437661 0.29 1.46 4.955 7.3391667 2.52 46 0.8595 0.1027303 0.0773874 0.2564091
MASONITE (AFRICA) LTD 64 2007 0.8072115 0.6080984 0.34 1.36 5.49 9.115 3.38 47 1.1986 0.1505363 0.0851867 0.4514541
MASONITE (AFRICA) LTD 64 2008 -0.1245012 -0.7604542 0.26 1.21 0.96 10.8075 0 48 2.1619 0.2034483 0.2526414 -0.0122564
MASONITE (AFRICA) LTD 64 2009 -0.0583409 0.644357 0.19 1.09 6.13 7.8508333 0 49 1.0799 -0.0189488 0.0442451 -0.4151796
MASONITE (AFRICA) LTD 64 2010 0.2784769 -0.0782318 0.22 0.35 3.065 6.42 0 50 0.2773 0.0256175 0.0033286 0.1868927
MEDICLINIC INTERNATIONAL LTD 65 2001 0.572093 0.5199595 0.29 1.19 6.48 9.6766667 0 41 1.5925 0.0802565 0.1004551 -0.0161316
MEDICLINIC INTERNATIONAL LTD 65 2002 0.1168639 0.0387775 0.3 1.24 5.9 11.1625 0 42 1.7332 0.073615 0.0675743 0.1036355
MEDICLINIC INTERNATIONAL LTD 65 2003 0.2119205 0.1106055 0.36 1.31 5.71 10.665 0 43 1.6786 0.2200788 0.195466 0.3322211
MEDICLINIC INTERNATIONAL LTD 65 2004 0.3912568 0.4729226 0.39 1.31 7.32 7.5325 0 44 1.668 0.1721946 0.1656244 0.1996922
MEDICLINIC INTERNATIONAL LTD 65 2005 0.3401414 0.2484997 0.36 1.41 8.11 6.9058333 1.96 45 1.8392 0.1434618 0.1529577 0.1034123
MEDICLINIC INTERNATIONAL LTD 65 2006 0.1992966 0.3359085 1.11 1.71 12.03 7.3391667 1.45 46 0.9856 -0.0383572 -0.0625935 0.0601562
MEDICLINIC INTERNATIONAL LTD 65 2007 0.184262 0.2039257 1.32 2.05 11.36 9.115 2.48 47 1.2607 0.3674332 0.2276205 0.7722157
MEDICLINIC INTERNATIONAL LTD 65 2008 -0.2121337 0.201802 3.2 2.19 9.02 10.8075 3.12 48 -0.5404 2.0547862 2.3594326 0.4939194
MEDICLINIC INTERNATIONAL LTD 65 2009 0.142483 0.1442513 4.84 1.92 6.1 7.8508333 2.72 49 -0.7036 0.0528235 0.0520042 0.064489
MEDICLINIC INTERNATIONAL LTD 65 2010 0.2164145 0.2277839 4.26 2.33 7.77 6.42 2.48 50 -0.6171 -0.1324804 -0.1474002 0.0577778
METAIR INVESTMENTS LTD 66 2001 0.7798742 0.5773368 0.71 1.59 3.13 9.6766667 6.24 41 1.5893 0.1850602 0.1647935 0.241025
METAIR INVESTMENTS LTD 66 2002 0.3180212 0.7715696 0.75 1.23 5.2 11.1625 3.64 42 1.0963 0.1596897 0.1811362 0.1003324
METAIR INVESTMENTS LTD 66 2003 0.1930295 0.14842 0.56 1.21 3.91 10.665 3.45 43 1.6694 0.1182996 0.1583676 -0.0070679
METAIR INVESTMENTS LTD 66 2004 0.4337079 0.2116405 0.53 1.39 4.54 7.5325 3.93 44 1.6908 0.1612442 0.1521699 0.1915012
METAIR INVESTMENTS LTD 66 2005 0.4404389 0.2660176 0.32 1.38 6.29 6.9058333 3.7 45 1.7084 0.1245758 0.1828964 -0.0940173
METAIR INVESTMENTS LTD 66 2006 0.1055495 0.2261835 0.35 1.3 5.71 7.3391667 2.98 46 1.9326 0.1129111 0.0457906 0.359747
METAIR INVESTMENTS LTD 66 2007 0.3346457 0.2387193 0.45 1.38 6.75 9.115 2.78 47 1.6987 0.1985093 0.1791004 0.2573071
METAIR INVESTMENTS LTD 66 2008 -0.2890855 -0.9086756 0.68 -0.05 2.27 10.8075 6.9 48 0.2927 0.111106 -0.0208679 0.4187597
METAIR INVESTMENTS LTD 66 2009 -0.5062241 -0.0901511 0.54 1.27 2.83 7.8508333 0 49 0.7027 -0.0540888 -0.0357288 -0.0894917
METAIR INVESTMENTS LTD 66 2010 0.8193277 0.8418924 0.58 1.55 4.1 6.42 1.15 50 1.817 0.0604282 0.1222238 -0.0745556
MR PRICE GROUP LTD 67 2001 -0.3344262 -0.876215 0.82 1.56 3.58 9.6766667 2.74 11 1.6478 0.1964706 0.2910954 0.0133353
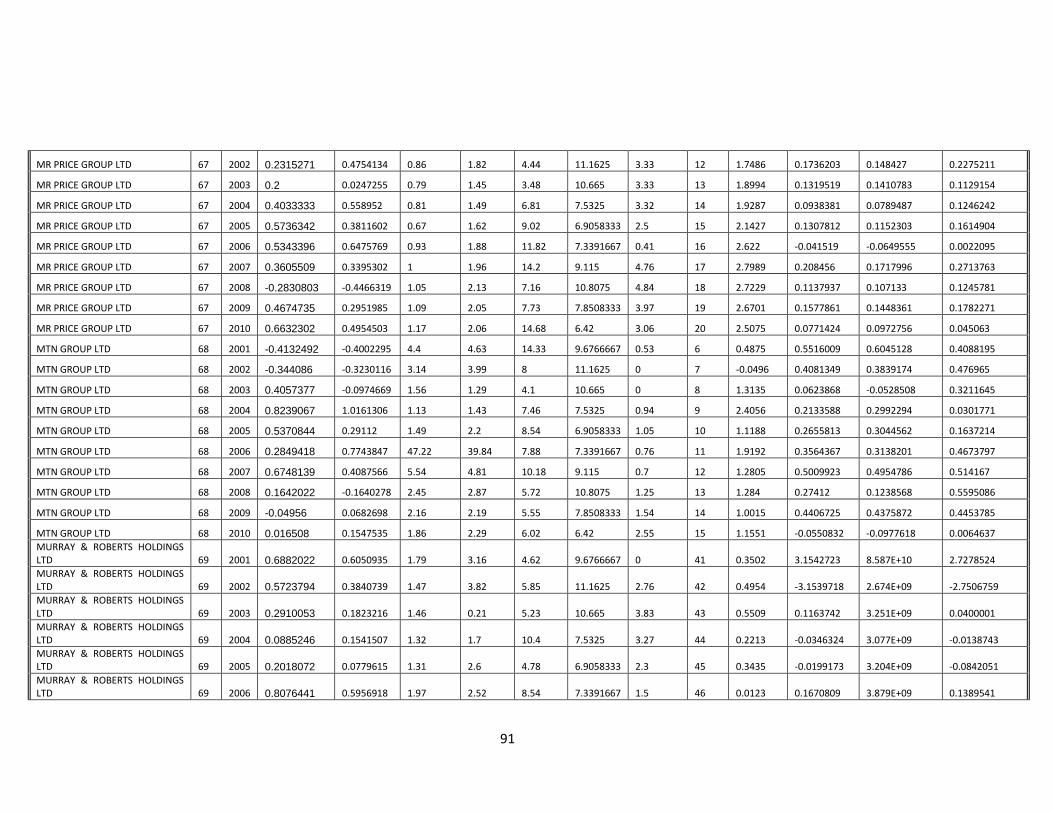
91
MR PRICE GROUP LTD 67 2002 0.2315271 0.4754134 0.86 1.82 4.44 11.1625 3.33 12 1.7486 0.1736203 0.148427 0.2275211
MR PRICE GROUP LTD 67 2003 0.2 0.0247255 0.79 1.45 3.48 10.665 3.33 13 1.8994 0.1319519 0.1410783 0.1129154
MR PRICE GROUP LTD 67 2004 0.4033333 0.558952 0.81 1.49 6.81 7.5325 3.32 14 1.9287 0.0938381 0.0789487 0.1246242
MR PRICE GROUP LTD 67 2005 0.5736342 0.3811602 0.67 1.62 9.02 6.9058333 2.5 15 2.1427 0.1307812 0.1152303 0.1614904
MR PRICE GROUP LTD 67 2006 0.5343396 0.6475769 0.93 1.88 11.82 7.3391667 0.41 16 2.622 -0.041519 -0.0649555 0.0022095
MR PRICE GROUP LTD 67 2007 0.3605509 0.3395302 1 1.96 14.2 9.115 4.76 17 2.7989 0.208456 0.1717996 0.2713763
MR PRICE GROUP LTD 67 2008 -0.2830803 -0.4466319 1.05 2.13 7.16 10.8075 4.84 18 2.7229 0.1137937 0.107133 0.1245781
MR PRICE GROUP LTD 67 2009 0.4674735 0.2951985 1.09 2.05 7.73 7.8508333 3.97 19 2.6701 0.1577861 0.1448361 0.1782271
MR PRICE GROUP LTD 67 2010 0.6632302 0.4954503 1.17 2.06 14.68 6.42 3.06 20 2.5075 0.0771424 0.0972756 0.045063
MTN GROUP LTD 68 2001 -0.4132492 -0.4002295 4.4 4.63 14.33 9.6766667 0.53 6 0.4875 0.5516009 0.6045128 0.4088195
MTN GROUP LTD 68 2002 -0.344086 -0.3230116 3.14 3.99 8 11.1625 0 7 -0.0496 0.4081349 0.3839174 0.476965
MTN GROUP LTD 68 2003 0.4057377 -0.0974669 1.56 1.29 4.1 10.665 0 8 1.3135 0.0623868 -0.0528508 0.3211645
MTN GROUP LTD 68 2004 0.8239067 1.0161306 1.13 1.43 7.46 7.5325 0.94 9 2.4056 0.2133588 0.2992294 0.0301771
MTN GROUP LTD 68 2005 0.5370844 0.29112 1.49 2.2 8.54 6.9058333 1.05 10 1.1188 0.2655813 0.3044562 0.1637214
MTN GROUP LTD 68 2006 0.2849418 0.7743847 47.22 39.84 7.88 7.3391667 0.76 11 1.9192 0.3564367 0.3138201 0.4673797
MTN GROUP LTD 68 2007 0.6748139 0.4087566 5.54 4.81 10.18 9.115 0.7 12 1.2805 0.5009923 0.4954786 0.514167
MTN GROUP LTD 68 2008 0.1642022 -0.1640278 2.45 2.87 5.72 10.8075 1.25 13 1.284 0.27412 0.1238568 0.5595086
MTN GROUP LTD 68 2009 -0.04956 0.0682698 2.16 2.19 5.55 7.8508333 1.54 14 1.0015 0.4406725 0.4375872 0.4453785
MTN GROUP LTD 68 2010 0.016508 0.1547535 1.86 2.29 6.02 6.42 2.55 15 1.1551 -0.0550832 -0.0977618 0.0064637
MURRAY & ROBERTS HOLDINGS LTD 69 2001 0.6882022 0.6050935 1.79 3.16 4.62 9.6766667 0 41 0.3502 3.1542723 8.587E+10 2.7278524
MURRAY & ROBERTS HOLDINGS LTD 69 2002 0.5723794 0.3840739 1.47 3.82 5.85 11.1625 2.76 42 0.4954 -3.1539718 2.674E+09 -2.7506759
MURRAY & ROBERTS HOLDINGS LTD 69 2003 0.2910053 0.1823216 1.46 0.21 5.23 10.665 3.83 43 0.5509 0.1163742 3.251E+09 0.0400001
MURRAY & ROBERTS HOLDINGS LTD 69 2004 0.0885246 0.1541507 1.32 1.7 10.4 7.5325 3.27 44 0.2213 -0.0346324 3.077E+09 -0.0138743
MURRAY & ROBERTS HOLDINGS LTD 69 2005 0.2018072 0.0779615 1.31 2.6 4.78 6.9058333 2.3 45 0.3435 -0.0199173 3.204E+09 -0.0842051
MURRAY & ROBERTS HOLDINGS LTD 69 2006 0.8076441 0.5956918 1.97 2.52 8.54 7.3391667 1.5 46 0.0123 0.1670809 3.879E+09 0.1389541

92
MURRAY & ROBERTS HOLDINGS LTD 69 2007 1.4980936 0.9241339 2.05 1.84 12.55 9.115 1.14 47 0.277 0.3588596 4.024E+09 0.6440294
MURRAY & ROBERTS HOLDINGS LTD 69 2008 0.139309 0.3069101 2.49 3.43 9.78 10.8075 4.08 48 0.7674 0.227669 4.696E+09 0.2727866
MURRAY & ROBERTS HOLDINGS LTD 69 2009 -0.407015 -0.5537702 2.45 3.21 4.56 7.8508333 4.69 49 0.603 0.4936182 6.419E+09 0.5853677
MURRAY & ROBERTS HOLDINGS LTD 69 2010 -0.1521873 -0.2536028 1.72 2.43 6.26 6.42 2.61 50 0.0546 0.079995 7.285E+09 0.0587206
MUSTEK LTD 70 2001 -0.4447368 -0.4834266 1.86 1.01 2.1 9.6766667 0 4 1.3798 0.0544384 0.0544384 0.1122246
MUSTEK LTD 70 2002 0.7677725 0.5720946 1.99 1.27 2.25 11.1625 0 5 1.7666 0.0516272 0.0516272 0.1008914
MUSTEK LTD 70 2003 0.5120643 0.4342341 1.85 1.41 2.33 10.665 6.87 6 1.1395 0.4908687 0.4908687 0.0205419
MUSTEK LTD 70 2004 0.4166667 0.4077878 1.85 0.55 3.23 7.5325 5.26 7 0.9451 0.2357644 0.2357644 0.0586488
MUSTEK LTD 70 2005 0.2465582 0.3274683 2.16 1.78 5.93 6.9058333 6.19 8 1.3762 0.0093597 0.0093597 0.018311
MUSTEK LTD 70 2006 0.0150602 -0.0473407 2.63 1.12 5.86 7.3391667 6.54 9 1.3891 0.09493 0.09493 0.2405721
MUSTEK LTD 70 2007 -0.1127596 0.0166013 3.16 1.42 6.94 9.115 8.22 10 1.392 -0.2063849 -0.2063849 0.3203598
MUSTEK LTD 70 2008 -0.5641026 -1.1291754 2.96 1.98 2.3 10.8075 10 11 1.4268 0.1673203 0.1673203 -0.169573
MUSTEK LTD 70 2009 -0.4578005 -0.5389965 2.4 1.04 0.59 7.8508333 4 12 0.9658 0.0559238 0.0559238 0.1255977
MUSTEK LTD 70 2010 0.6462264 0.8495951 1.87 1.68 4.55 6.42 2.4 13 0.7208 0.0274774 0.0274774 -0.2197934
NAMPAK LTD 71 2001 -0.1790079 -0.2121592 1.32 1.34 5.23 9.6766667 4.52 41 0.3925 0.082921 0.073829 0.0981168
NAMPAK LTD 71 2002 0.147986 0.4488499 2.16 2.07 6.12 11.1625 4.28 42 0.3402 0.46448 0.2648275 0.7259514
NAMPAK LTD 71 2003 -0.0366133 -0.0850417 1.57 0.86 4.05 10.665 5.36 43 0.9117 -0.1992395 -0.0902246 -0.3269865
NAMPAK LTD 71 2004 0.114806 0.1381401 1.32 2.05 6.76 7.5325 5.34 44 0.9607 0.01358 0.086225 -0.091126
NAMPAK LTD 71 2005 0.1115057 0.1199359 1.14 1.93 6.81 6.9058333 4.96 45 0.9184 -0.0526482 -0.0011343 -0.139601
NAMPAK LTD 71 2006 0.1552716 0.1540746 1.35 2.32 5.99 7.3391667 0 46 0.9238 0.178152 0.1436069 0.2377745
NAMPAK LTD 71 2007 0.1974558 0.1747015 1.27 1.73 6.33 9.115 5.35 47 0.9172 0.0513644 -0.0192367 0.1577501
NAMPAK LTD 71 2008 -0.3020785 -0.4289058 1.69 1.79 4.69 10.8075 7.53 48 0.1986 0.2213694 0.2571038 0.1698753
NAMPAK LTD 71 2009 -0.0258107 0.1944318 1.87 -0.02 5.8 7.8508333 2.77 49 -0.0309 -0.1140386 -0.0940557 -0.1448935
NAMPAK LTD 71 2010 0.2547554 0.111412 1.52 1.8 4.89 6.42 3.61 50 0.5467 -0.0746611 0.0080857 -0.2215778
NASPERS LTD –N 72 2001 -0.5878759 -1.09051 1.8 -12.66 -172.68 9.6766667 1.22 6 1.1082 0.4605477 0.6256755 0.0799585
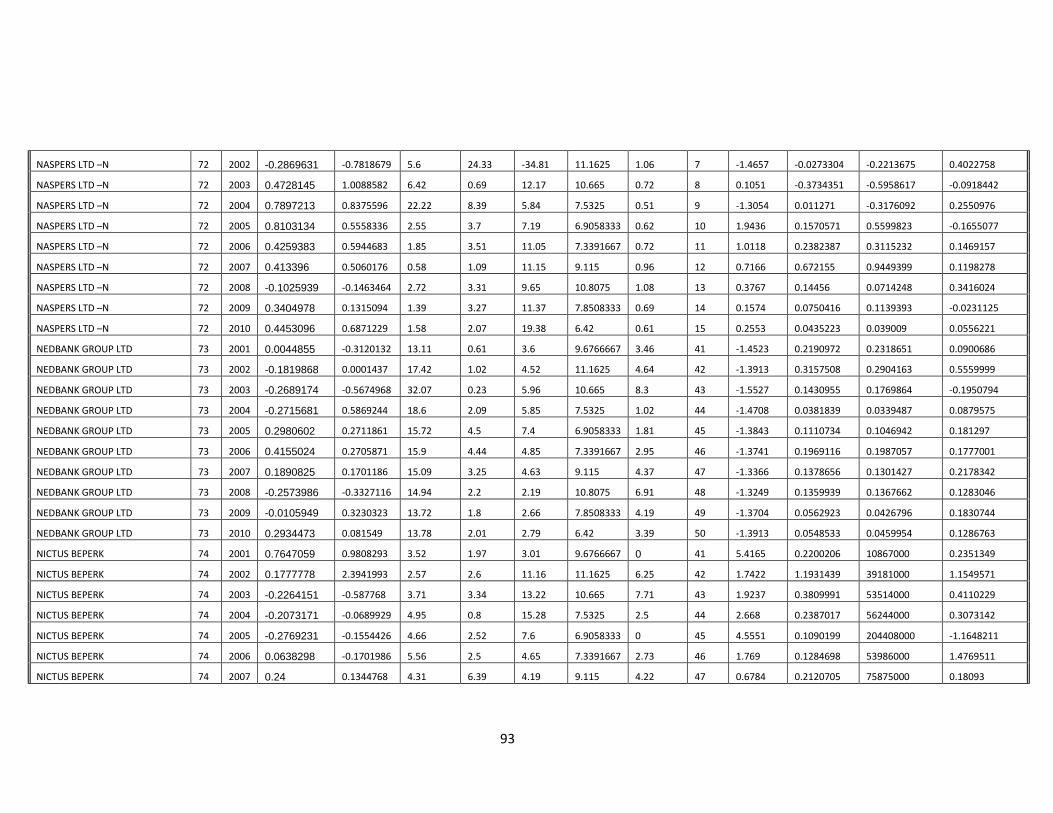
93
NASPERS LTD –N 72 2002 -0.2869631 -0.7818679 5.6 24.33 -34.81 11.1625 1.06 7 -1.4657 -0.0273304 -0.2213675 0.4022758
NASPERS LTD –N 72 2003 0.4728145 1.0088582 6.42 0.69 12.17 10.665 0.72 8 0.1051 -0.3734351 -0.5958617 -0.0918442
NASPERS LTD –N 72 2004 0.7897213 0.8375596 22.22 8.39 5.84 7.5325 0.51 9 -1.3054 0.011271 -0.3176092 0.2550976
NASPERS LTD –N 72 2005 0.8103134 0.5558336 2.55 3.7 7.19 6.9058333 0.62 10 1.9436 0.1570571 0.5599823 -0.1655077
NASPERS LTD –N 72 2006 0.4259383 0.5944683 1.85 3.51 11.05 7.3391667 0.72 11 1.0118 0.2382387 0.3115232 0.1469157
NASPERS LTD –N 72 2007 0.413396 0.5060176 0.58 1.09 11.15 9.115 0.96 12 0.7166 0.672155 0.9449399 0.1198278
NASPERS LTD –N 72 2008 -0.1025939 -0.1463464 2.72 3.31 9.65 10.8075 1.08 13 0.3767 0.14456 0.0714248 0.3416024
NASPERS LTD –N 72 2009 0.3404978 0.1315094 1.39 3.27 11.37 7.8508333 0.69 14 0.1574 0.0750416 0.1139393 -0.0231125
NASPERS LTD –N 72 2010 0.4453096 0.6871229 1.58 2.07 19.38 6.42 0.61 15 0.2553 0.0435223 0.039009 0.0556221
NEDBANK GROUP LTD 73 2001 0.0044855 -0.3120132 13.11 0.61 3.6 9.6766667 3.46 41 -1.4523 0.2190972 0.2318651 0.0900686
NEDBANK GROUP LTD 73 2002 -0.1819868 0.0001437 17.42 1.02 4.52 11.1625 4.64 42 -1.3913 0.3157508 0.2904163 0.5559999
NEDBANK GROUP LTD 73 2003 -0.2689174 -0.5674968 32.07 0.23 5.96 10.665 8.3 43 -1.5527 0.1430955 0.1769864 -0.1950794
NEDBANK GROUP LTD 73 2004 -0.2715681 0.5869244 18.6 2.09 5.85 7.5325 1.02 44 -1.4708 0.0381839 0.0339487 0.0879575
NEDBANK GROUP LTD 73 2005 0.2980602 0.2711861 15.72 4.5 7.4 6.9058333 1.81 45 -1.3843 0.1110734 0.1046942 0.181297
NEDBANK GROUP LTD 73 2006 0.4155024 0.2705871 15.9 4.44 4.85 7.3391667 2.95 46 -1.3741 0.1969116 0.1987057 0.1777001
NEDBANK GROUP LTD 73 2007 0.1890825 0.1701186 15.09 3.25 4.63 9.115 4.37 47 -1.3366 0.1378656 0.1301427 0.2178342
NEDBANK GROUP LTD 73 2008 -0.2573986 -0.3327116 14.94 2.2 2.19 10.8075 6.91 48 -1.3249 0.1359939 0.1367662 0.1283046
NEDBANK GROUP LTD 73 2009 -0.0105949 0.3230323 13.72 1.8 2.66 7.8508333 4.19 49 -1.3704 0.0562923 0.0426796 0.1830744
NEDBANK GROUP LTD 73 2010 0.2934473 0.081549 13.78 2.01 2.79 6.42 3.39 50 -1.3913 0.0548533 0.0459954 0.1286763
NICTUS BEPERK 74 2001 0.7647059 0.9808293 3.52 1.97 3.01 9.6766667 0 41 5.4165 0.2200206 10867000 0.2351349
NICTUS BEPERK 74 2002 0.1777778 2.3941993 2.57 2.6 11.16 11.1625 6.25 42 1.7422 1.1931439 39181000 1.1549571
NICTUS BEPERK 74 2003 -0.2264151 -0.587768 3.71 3.34 13.22 10.665 7.71 43 1.9237 0.3809991 53514000 0.4110229
NICTUS BEPERK 74 2004 -0.2073171 -0.0689929 4.95 0.8 15.28 7.5325 2.5 44 2.668 0.2387017 56244000 0.3073142
NICTUS BEPERK 74 2005 -0.2769231 -0.1554426 4.66 2.52 7.6 6.9058333 0 45 4.5551 0.1090199 204408000 -1.1648211
NICTUS BEPERK 74 2006 0.0638298 -0.1701986 5.56 2.5 4.65 7.3391667 2.73 46 1.769 0.1284698 53986000 1.4769511
NICTUS BEPERK 74 2007 0.24 0.1344768 4.31 6.39 4.19 9.115 4.22 47 0.6784 0.2120705 75875000 0.18093
94
NICTUS BEPERK 74 2008 0.2580645 0.0831833 5.02 4 3.73 10.8075 3.79 48 0.5691 0.1932601 81105000 0.2240219
NICTUS BEPERK 74 2009 0.1282051 0.4033586 6.86 5.16 3.27 7.8508333 6.78 49 1.1332 0.3246329 93289000 0.3617827
NICTUS BEPERK 74 2010 0.0113636 -0.0945526 7.75 6.17 2.81 6.42 5.36 50 1.0826 0.2581516 106221000 0.2795752
NORTHAM PLATINUM LTD 75 2001 0.4674923 0.672266 0.92 1.91 4.21 9.6766667 13.86 41 2.1708 -0.2316678 -0.1358566 -1.2376083
NORTHAM PLATINUM LTD 75 2002 0.2552743 0.0893476 1.14 2.16 6.11 11.1625 12.76 42 1.7321 0.0654985 0.0515344 0.2991896
NORTHAM PLATINUM LTD 75 2003 -0.2851541 -0.3001123 0.76 1.85 7.4 10.665 9.09 43 0.8286 -0.0929384 -0.1470114 0.4837083
NORTHAM PLATINUM LTD 75 2004 -0.2601881 -0.3235221 0.94 1.76 5.33 7.5325 11.86 44 0.7997 0.0374082 0.0390261 0.0245557
NORTHAM PLATINUM LTD 75 2005 0.3389831 0.3494794 0.99 2.57 9.84 6.9058333 3.68 45 0.5403 0.0307304 0.0069245 0.2032094
NORTHAM PLATINUM LTD 75 2006 1.7436709 1.1073514 1.53 2.56 9 7.3391667 5.46 46 -3.5065 0.1998678 0.2020213 0.1855902
NORTHAM PLATINUM LTD 75 2007 0.466263 0.406713 2.19 3.19 9.27 9.115 13.11 47 5.8708 0.1976813 0.1551388 0.4433115
NORTHAM PLATINUM LTD 75 2008 0.0066863 0.1944003 1.08 2.07 9.53 10.8075 16.02 48 5.2197 0.2115689 0.1860787 0.3303491
NORTHAM PLATINUM LTD 75 2009 -0.3701895 -0.4017139 0.63 1.57 13.64 7.8508333 1.62 49 1.7877 0.8194616 0.9734114 -0.4605874
NORTHAM PLATINUM LTD 75 2010 0.455335 0.4185467 0.91 1.89 18.39 6.42 0.88 50 1.3083 0.0762764 0.0605563 0.3261504
NU-WORLD HOLDINGS LTD 76 2001 -0.2729885 -0.3483067 0.53 1.22 5.31 9.6766667 2.54 41 1.5267 -0.0391559 -0.0026644 -0.1083871
NU-WORLD HOLDINGS LTD 76 2002 0.0583004 0.0896122 0.51 1.16 5.08 11.1625 2.63 42 1.4575 0.1185622 0.1358234 0.0831112
NU-WORLD HOLDINGS LTD 76 2003 0.1409897 0.1459539 0.45 1.31 4.96 10.665 2.13 43 1.6107 0.1179464 0.1589735 0.0254859
NU-WORLD HOLDINGS LTD 76 2004 0.9484452 0.5937133 0.61 1.66 7.82 7.5325 2.04 44 1.6269 0.2319792 0.1426318 0.4192696
NU-WORLD HOLDINGS LTD 76 2005 0.2473751 0.305396 0.5 1.52 9.29 6.9058333 2.99 45 1.5818 0.0664863 0.1357153 -0.0739222
NU-WORLD HOLDINGS LTD 76 2006 0.0946128 0.0476604 0.46 1.75 7.78 7.3391667 0 46 1.6811 0.1399676 0.127785 0.1668912
NU-WORLD HOLDINGS LTD 76 2007 -0.0049216 0.0327898 0.26 2.18 13.74 9.115 4.59 47 1.6955 -0.0380728 0.1141129 -0.4785157
NU-WORLD HOLDINGS LTD 76 2008 -0.4890263 -0.6306268 0.39 1.43 7.81 10.8075 3.93 48 0.952 0.0034927 -0.0298107 0.1242935
NU-WORLD HOLDINGS LTD 76 2009 -0.1016334 -0.2775876 0.37 1.27 10.98 7.8508333 1.93 49 0.7448 0.0078782 0.0106207 -0.0013925
NU-WORLD HOLDINGS LTD 76 2010 0.4659933 0.5877425 0.45 1.37 9.395 6.42 3.05 50 1.5593 0.1576927 0.1208932 0.273583
OCEANA GROUP LTD 77 2001 0.5146832 0.4412524 1.07 2.26 6.51 9.6766667 3.96 41 1.5404 0.2277244 0.2698241 0.1879581
OCEANA GROUP LTD 77 2002 0.4928571 0.4052558 0.91 2.18 7.27 11.1625 4.69 42 1.9081 0.1780837 0.3443147 -0.0178807
OCEANA GROUP LTD 77 2003 0.0027341 0.0656576 0.8 1.48 6.43 10.665 4.5 43 1.7396 0.1141049 0.1710415 0.0276557

95
OCEANA GROUP LTD 77 2004 0.0756646 -0.0291346 0.87 1.67 7.32 7.5325 5.13 44 1.3526 0.1089757 0.0627461 0.1800918
OCEANA GROUP LTD 77 2005 -0.0925222 -0.0163801 0.75 1.41 7.09 6.9058333 4.76 45 0.9093 0.0038562 0.062564 -0.0879581
OCEANA GROUP LTD 77 2006 0.1096369 -0.0607128 0.77 1.76 8 7.3391667 4.48 46 1.069 -0.0985891 -0.1021089 -0.0926809
OCEANA GROUP LTD 77 2007 0.2271869 0.3532291 0.83 1.89 7.66 9.115 5.3 47 1.5418 0.1200872 0.1122374 0.1330657
OCEANA GROUP LTD 77 2008 0.0317949 0.0823954 0.74 1.8 5.94 10.8075 6.92 48 2.0871 0.0383541 0.1221604 -0.1160077
OCEANA GROUP LTD 77 2009 0.2808151 0.2276956 0.67 1.67 6.29 7.8508333 5.94 49 2.5471 0.1062239 0.1333859 0.0473561
OCEANA GROUP LTD 77 2010 0.2270081 0.2015381 0.66 1.53 7.06 6.42 5.4 50 2.3669 0.077646 0.1202572 -0.0260544
OCTODEC INVESTMENTS LTD 78 2001 0.0350195 0.1921442 4.85 0.03 686.59 9.6766667 19.58 10 -1.2526 0.2011066 0.3412609 -0.7004325
OCTODEC INVESTMENTS LTD 78 2002 -0.0601504 -0.117783 8.97 1.3 22.16 11.1625 17.19 11 -1.2136 0.6986838 0.7346928 0.1705666
OCTODEC INVESTMENTS LTD 78 2003 0.376 0.4192584 4.8 0.3 428.3 10.665 10 12 -0.4351 0.0995281 0.0907884 0.2575316
OCTODEC INVESTMENTS LTD 78 2004 0.4476744 0.4376531 2.85 0.21 -284.89 7.5325 9.23 13 -0.1005 0.1388388 0.132937 0.2323072
OCTODEC INVESTMENTS LTD 78 2005 0.5281124 0.550831 1.39 0.47 3,103.67 6.9058333 7.33 14 1.4047 0.4548009 0.4642457 0.3004194
OCTODEC INVESTMENTS LTD 78 2006 0.4875164 0.3448405 0.98 0.14 97.59 7.3391667 6.58 15 0.7439 0.3089147 0.3174054 0.1447178
OCTODEC INVESTMENTS LTD 78 2007 0.5618375 0.539096 0.86 0.02 917.97 9.115 5.74 16 0.4051 0.239321 0.2372241 0.2825829
OCTODEC INVESTMENTS LTD 78 2008 -0.1623303 -0.1331469 0.91 0.18 77.01 10.8075 8.88 17 -0.2798 0.1055744 0.104854 0.119995
OCTODEC INVESTMENTS LTD 78 2009 -0.1114112 -0.2027826 1.02 0.2 56.24 7.8508333 9.62 18 -0.9996 0.0240918 -0.0127361 0.5654542
OCTODEC INVESTMENTS LTD 78 2010 0.2180851 0.3072567 1.03 0 99.97 6.42 7.6 19 -0.4855 0.1307004 0.1025566 0.4001555
PARACON HOLDINGS LTD 79 2001 -0.4565217 -1.1101906 0.52 1.47 4.71 9.6766667 0 2 2.0464 -0.1311886 -0.0613521 -0.2535882
PARACON HOLDINGS LTD 79 2002 -0.2133333 -0.0135469 0.39 1.13 5 11.1625 4.46 3 0.6039 -0.1927514 0.0025611 -0.7311999
PARACON HOLDINGS LTD 79 2003 -0.2033898 0.0255956 0.28 1.13 9.87 10.665 0 4 0.8983 0.1623061 0.221365 -0.1182081
PARACON HOLDINGS LTD 79 2004 0.5319149 0.4985033 0.37 1.41 12.19 7.5325 0 5 1.2959 0.0363575 -0.0111568 0.2690612
PARACON HOLDINGS LTD 79 2005 0.3333333 0.3432153 0.66 1.66 12.04 6.9058333 0 6 2.2607 0.1321767 0.0418239 0.4459549
PARACON HOLDINGS LTD 79 2006 0.59375 0.4227631 0.98 1.98 14.45 7.3391667 0 7 2.4871 0.1347243 0.0203056 0.4031668
PARACON HOLDINGS LTD 79 2007 0.6013072 0.5697729 1.03 2.07 17.64 9.115 3.85 8 3.0108 0.1078558 0.1322743 0.0586569
PARACON HOLDINGS LTD 79 2008 -0.2653061 -0.809435 1.67 2.67 8.38 10.8075 6.67 9 -0.4952 -0.1043192 -0.2659897 0.1672871
PARACON HOLDINGS LTD 79 2009 -0.2277778 0.1133287 1.44 2.44 8.73 7.8508333 5.62 10 2.8967 -0.0250608 0.0141866 -0.0808438
96
PARACON HOLDINGS LTD 79 2010 0.2374101 -0.0291076 1.24 2.24 10.28 6.42 5.41 11 2.6364 0.1009958 0.1230847 0.0671372
PEREGRINE HOLDINGS LTD 80 2001 -0.5561224 -1.0291343 0.75 2.15 6.09 9.6766667 4.15 3 2.5229 0.247065 0.2193437 0.4584133
PEREGRINE HOLDINGS LTD 80 2002 -0.0957854 -0.1527651 1.22 3.14 6.94 11.1625 0 4 1.3742 0.2883588 -0.2840709 1.6630692
PEREGRINE HOLDINGS LTD 80 2003 -0.2457627 -0.0863496 5.8 4.39 2 10.665 0 5 0.0421 0.7138673 1.0456956 0.2349694
PEREGRINE HOLDINGS LTD 80 2004 0.3370787 0.2408088 6.76 5.21 4.82 7.5325 1.56 6 -0.0039 0.2825789 0.322387 0.1900872
PEREGRINE HOLDINGS LTD 80 2005 0.9789916 0.1134897 9.41 79.78 44.54 6.9058333 1.88 7 -0.1517 0.4980733 0.3209829 0.836678
PEREGRINE HOLDINGS LTD 80 2006 0.8683652 1.142224 13.12 18.93 9.04 7.3391667 2.43 8 -0.26 0.7992915 0.4930257 1.1294016
PEREGRINE HOLDINGS LTD 80 2007 1.0125 0.489957 13.3 14.47 11.76 9.115 2.25 9 -0.6113 0.575485 0.2363996 0.7789427
PEREGRINE HOLDINGS LTD 80 2008 -0.3162055 0.099838 7.99 7.33 10.94 10.8075 6.75 10 -0.4956 0.1153068 0.2272963 0.0597478
PEREGRINE HOLDINGS LTD 80 2009 -0.3559042 -0.9571127 26 5.22 1.1 7.8508333 1.17 11 -0.6417 -0.3108254 0.0162449 -0.544821
PEREGRINE HOLDINGS LTD 80 2010 0.4769231 0.7255965 15.88 14.1 5.5 6.42 2.68 12 -0.4242 0.1549322 0.1618246 0.1483745
PICK `N PAY STORES LTD 81 2001 0.0071813 0.1270935 2.37 3.12 12.16 9.6766667 4.12 41 1.3316 0.1541463 0.6306088 -0.0711188
PICK `N PAY STORES LTD 81 2002 0.1078431 -0.2098624 7.67 11.3 8.01 11.1625 4.15 42 1.2917 0.1104703 -0.2312848 0.2869112
PICK `N PAY STORES LTD 81 2003 0.1343524 0.2063049 63.14 43.14 8.22 10.665 4.03 43 1.3548 0.0659333 -0.344395 0.1913526
PICK `N PAY STORES LTD 81 2004 0.3496454 0.3461783 47.38 45.58 10.41 7.5325 3.59 44 1.1718 0.1338552 -0.119782 0.184598
PICK `N PAY STORES LTD 81 2005 0.3368366 0.2774825 1,268.77 1,068.66 10.68 6.9058333 3.48 45 1.4574 0.0561257 -0.0368189 0.0712218
PICK `N PAY STORES LTD 81 2006 0.1926101 0.2713151 -11.52 -9.89 14.63 7.3391667 3.55 46 1.4978 0.0720834 0.2157803 0.0480251
PICK `N PAY STORES LTD 81 2007 0.1611734 0.0811084 -13.35 -10.74 11.76 9.115 3.68 47 1.7706 0.1659851 0.1458282 0.1696088
PICK `N PAY STORES LTD 81 2008 -0.1453307 -0.0179518 -18.62 -16.83 9.5 10.8075 4.27 48 2.107 0.1810818 0.538087 0.101803
PICK `N PAY STORES LTD 81 2009 0.1790103 0 -72.88 -69.33 8.77 7.8508333 4.18 49 1.9618 0.1539149 0.1827591 0.1458404
PICK `N PAY STORES LTD 81 2010 0.2371831 0.212654 35.74 39.64 10.34 6.42 3.55 50 2.0136 0.0580495 0.191033 0.0166479
PINNACLE TECHNOLOGY HOLDINGS LTD 82 2001 -0.625 -1.2315838 1.67 0.44 1.25 9.6766667 0 1 6.9647 -0.1757974 0.0114806 -0.3193958
PINNACLE TECHNOLOGY HOLDINGS LTD 82 2002 1 0.696774 2.04 2.13 2.27 11.1625 0 2 -1.7481 0.3093202 0.1459264 0.4370955
PINNACLE TECHNOLOGY HOLDINGS LTD 82 2003 0.5 0.5596158 1.22 1.07 1.62 10.665 0 3 -1.3191 -0.1140334 0.1494055 -0.3417811
PINNACLE TECHNOLOGY HOLDINGS LTD 82 2004 0.8888889 0.4082404 1.37 2.62 2.5 7.5325 3 4 -1.1446 0.1921966 0.1129024 0.2730284

97
PINNACLE TECHNOLOGY HOLDINGS LTD 82 2005 1.9705882 1.5159665 1.92 2.81 3.81 6.9058333 2.63 5 -2.5235 0.3727765 0.17344 0.5298292
PINNACLE TECHNOLOGY HOLDINGS LTD 82 2006 1.3762376 0.89788 4.69 6.06 10.07 7.3391667 2.19 6 8.8346 0.7385312 0.4068756 0.9090966
PINNACLE TECHNOLOGY HOLDINGS LTD 82 2007 0.7833333 0.6309457 3.14 4.09 11.11 9.115 2.06 7 6.5417 0.1264308 0.3468644 0.0229185
PINNACLE TECHNOLOGY HOLDINGS LTD 82 2008 -0.1471963 -0.0037814 3.2 4.07 6.6 10.8075 6.59 8 2.6383 0.3273009 0.2424257 0.3711832
PINNACLE TECHNOLOGY HOLDINGS LTD 82 2009 -0.339726 -0.4329831 1.71 2.03 2.39 7.8508333 4.01 9 1.7865 0.1143313 0.3463452 -0.0209935
PINNACLE TECHNOLOGY HOLDINGS LTD 82 2010 0.9004149 0.6059442 1.56 2.94 5.09 6.42 2.34 10 1.7005 0.2234456 0.2464797 0.2070043
PREMIUM PROPERTIES LTD 83 2001 0.5765766 0.6746851 9.02 7.32 33.9 9.6766667 16.97 6 -1.4922 0.1353312 0.1182393 0.3363019
PREMIUM PROPERTIES LTD 83 2002 -0.0342857 0.1389515 7.95 1.26 14.16 11.1625 15.71 7 -1.1543 0.0524464 0.050894 0.0686955
PREMIUM PROPERTIES LTD 83 2003 0.3905325 0 5.48 -0.38 45.54 10.665 9.29 8 -0.7459 0.1453971 0.1419618 0.1803585
PREMIUM PROPERTIES LTD 83 2004 0.587234 0.5194371 3.5 -0.63 25.43 7.5325 9.25 9 -0.2704 0.2141067 0.2375639 -0.0563464
PREMIUM PROPERTIES LTD 83 2005 0.6541555 0.527104 1.93 -0.66 23.81 6.9058333 6.89 10 0.6131 0.2501975 0.2343974 0.4408034
PREMIUM PROPERTIES LTD 83 2006 0.471637 0.6668299 1.13 0.1 -1,038.24 7.3391667 6.12 11 1.2748 0.3888453 0.4118672 0.096109
PREMIUM PROPERTIES LTD 83 2007 0.4581498 0.2876821 0.98 0.32 152.01 9.115 5.39 12 0.815 0.3667642 0.3799953 0.1448356
PREMIUM PROPERTIES LTD 83 2008 -0.1359517 0.1843945 1.08 0.01 899.68 10.8075 8.59 13 0.0721 0.2925191 0.2871956 0.3881667
PREMIUM PROPERTIES LTD 83 2009 0.0148601 -0.1681369 0.97 0.07 152.46 7.8508333 8.17 14 -0.1625 0.1107205 0.0566112 0.7526315
PREMIUM PROPERTIES LTD 83 2010 0.290267 0.1877839 0.98 0.01 511.36 6.42 7.61 15 -0.26 0.1560977 0.0965301 0.5566831
PRETORIA PORTLAND CEMENT COMPANY LTD 84 2001 0.1754386 0.1954487 0.6 1.75 6.61 9.6766667 6.3 41 1.6168 0.1418142 0.1155482 0.3381069
PRETORIA PORTLAND CEMENT COMPANY LTD 84 2002 0.0434193 0.3015235 0.75 2.75 7.04 11.1625 5.26 42 1.9472 0.2369777 0.2174233 0.3589116
PRETORIA PORTLAND CEMENT COMPANY LTD 84 2003 0.390117 0.375094 1 1.84 8.27 10.665 5.05 43 1.908 -0.0644701 -0.094883 0.0960626
PRETORIA PORTLAND CEMENT COMPANY LTD 84 2004 0.5734331 0.4668058 1.58 2.89 10.45 7.5325 3.23 44 2.5523 0.025312 0.0521403 -0.1146332
PRETORIA PORTLAND CEMENT COMPANY LTD 84 2005 0.5243757 0.4750309 1.49 2.35 13.51 6.9058333 3.59 45 3.2827 -0.0971626 -0.1973582 0.3352665
PRETORIA PORTLAND CEMENT COMPANY LTD 84 2006 0.4641186 0.1785343 2.2 3.06 14.61 7.3391667 3.62 46 3.3204 0.2986168 0.0326587 0.8740714
98
PRETORIA PORTLAND CEMENT COMPANY LTD 84 2007 0.2192328 0.3177569 2.84 3.67 15.61 9.115 4.62 47 3.2001 0.1141156 0.0461978 0.2042287
PRETORIA PORTLAND CEMENT COMPANY LTD 84 2008 -0.255189 -0.4250063 3.25 3.85 8.7 10.8075 7.18 48 3.2303 -0.0739504 -0.189862 0.0519771
PRETORIA PORTLAND CEMENT COMPANY LTD 84 2009 -0.0862423 0.0813956 3.67 2.88 6.96 7.8508333 5.76 49 2.0264 0.2495239 0.6548793 -0.4067647
PRETORIA PORTLAND CEMENT COMPANY LTD 84 2010 0.0394864 -0.0793334 3.42 3.43 8.05 6.42 5.01 50 1.5539 0.0491256 0.0384927 0.0781403
PUTPROP LTD 85 2001 0.1706485 0.1823216 0.09 1.28 5.29 9.6766667 10.53 41 1.5063 0.0573323 0.0521674 0.1160458
PUTPROP LTD 85 2002 0.1428571 0.1797931 0.1 1.08 6.74 11.1625 25 42 1.7578 -0.0774493 -0.0121059 -1.4384866
PUTPROP LTD 85 2003 0.0765306 -0.0387145 0.12 0.73 4.38 10.665 12.5 43 1.5514 -0.0146836 -0.0319198 0.5639026
PUTPROP LTD 85 2004 0.0876777 0.2125614 0.11 1.11 7.56 7.5325 11 44 2.0105 0.0009066 0.0123183 -0.3415969
PUTPROP LTD 85 2005 0.2984749 0.354545 0.06 1.06 8.03 6.9058333 8.62 45 4.0634 0.1825453 0.1996457 -0.7873607
PUTPROP LTD 85 2006 -0.0268456 -0.1973594 0.06 1.06 13.62 7.3391667 7.98 46 2.4981 0.0464923 0.0379504 0.6461805
PUTPROP LTD 85 2007 -0.1241379 -0.04652 0.13 2.01 14.31 9.115 8.24 47 1.5734 0.1287201 0.0597461 1.6337109
PUTPROP LTD 85 2008 -0.226378 -0.3364722 0.05 1.05 5.56 10.8075 9.02 48 2.7781 0.0796062 0.1501068 -1.5091261
PUTPROP LTD 85 2009 0.1984733 0.2876821 0.04 1.04 6.22 7.8508333 6.53 49 2.2719 0.1386257 0.1475281 -0.5787787
PUTPROP LTD 85 2010 0.1231423 0.14842 0.03 1.03 6.83 6.42 3.77 50 2.0926 0.1512071 0.1506702 0.2128084
RAINBOW CHICKEN LTD 86 2001 0.991453 0.6820973 0.37 1 2.39 9.6766667 1.23 12 -0.3175 -0.0041409 0.1221293 -0.3052014
RAINBOW CHICKEN LTD 86 2002 0.1802575 0.4797235 0.53 1.5 3.52 11.1625 5.31 13 -1.8825 0.0052673 -0.0514563 0.1565333
RAINBOW CHICKEN LTD 86 2003 0.4363636 0.1365496 0.62 1.48 2.57 10.665 4.95 14 5.3097 0.2591673 0.2023076 0.383991
RAINBOW CHICKEN LTD 86 2004 0.4556962 0.5420515 0.42 1.57 3.8 7.5325 4.07 15 2.6665 0.1069591 0.2301474 -0.198128
RAINBOW CHICKEN LTD 86 2005 0.3373913 0.1984512 0.66 1.7 5.19 6.9058333 4.25 16 1.6972 0.072911 -0.0620178 0.4011385
RAINBOW CHICKEN LTD 86 2006 0.36671 0.3930943 0.8 1.96 5.55 7.3391667 4.32 17 2.1957 0.2212696 0.1742126 0.3065617
RAINBOW CHICKEN LTD 86 2007 0.510942 0.5705324 0.68 1.64 6.47 9.115 3.6 18 2.2011 0.1275735 0.19153 0.0087128
RAINBOW CHICKEN LTD 86 2008 -0.0579345 -0.1029152 0.64 1.62 5.67 10.8075 4.35 19 2.0334 0.2386963 0.2354363 0.2453048
RAINBOW CHICKEN LTD 86 2009 0.0360963 0.0611151 0.68 5.47 15.38 7.8508333 4.49 20 0.9813 0.0914989 0.0619273 0.1486147
RAINBOW CHICKEN LTD 86 2010 0.0232258 0.0329678 0.62 1.16 4.69 6.42 4.55 21 1.1362 0.0607782 0.1002588 -0.0166298
REUNERT LTD 87 2001 0.5533981 0.2739093 1.87 2.79 9.27 9.6766667 4.72 41 1.3614 0.2115197 -0.017566 0.3608005
99
REUNERT LTD 87 2002 0.20875 0.2309653 2.83 3.72 8.19 11.1625 5.97 42 0.816 0.1492986 -0.0524718 0.2431705
REUNERT LTD 87 2003 -0.0703206 -0.0763304 2.61 1.92 3.83 10.665 5.5 43 0.9436 0.1218432 0.1814632 0.096914
REUNERT LTD 87 2004 0.5 0.4129878 4.31 4.77 8.57 7.5325 4.27 44 1.025 -0.1975993 -0.4485675 -0.1052009
REUNERT LTD 87 2005 0.4998146 0.4297343 3.36 3.77 9.14 6.9058333 4.22 45 1.5568 0.3088584 0.6996933 0.1487453
REUNERT LTD 87 2006 0.7060569 0.4866284 3.81 4.98 15.17 7.3391667 0.75 46 1.4379 0.3562815 0.2109835 0.4263558
REUNERT LTD 87 2007 0.0940443 -0.0126882 1.53 1.16 9.44 9.115 4.39 47 0.9436 -0.1716971 0.4395162 -0.6253
REUNERT LTD 87 2008 -0.2817219 -0.1492759 1.4 2.41 8.51 10.8075 6.29 48 1.8888 0.4889048 0.5247197 0.442058
REUNERT LTD 87 2009 -0.1384842 -0.0249247 1.14 2.42 7.86 7.8508333 4.35 49 1.4791 -0.002854 0.0588837 -0.0936735
REUNERT LTD 87 2010 0.2688356 0.1051844 1.03 1.59 7.76 6.42 4.28 50 1.1431 0.0292043 0.0761216 -0.0501393
REX TRUEFORM CLOTHING COMPANY LTD 88 2001 -0.4578755 -0.9146895 0.17 1.19 5.2 9.6766667 4.17 41 1.092 -0.0303835 -0.006479 -0.1583422
REX TRUEFORM CLOTHING COMPANY LTD 88 2002 0.0709459 0.3646431 0.19 1.7 6.35 11.1625 3.13 42 1.2622 0.0121439 0.010649 0.0207393
REX TRUEFORM CLOTHING COMPANY LTD 88 2003 0.2176656 -0.0571584 0.28 0.79 2.68 10.665 5.13 43 1.5979 0.1138882 0.0521929 0.4082654
REX TRUEFORM CLOTHING COMPANY LTD 88 2004 0.1243523 0.2759216 0.22 0.5 3.04 7.5325 4.4 44 0.9806 -0.0580042 -0.0293487 -0.1818529
REX TRUEFORM CLOTHING COMPANY LTD 88 2005 0.3709677 0.2657032 0.32 -2.83 3.4 6.9058333 3.47 45 1.9349 -0.2089981 -0.2035355 -0.2348961
REX TRUEFORM CLOTHING COMPANY LTD 88 2006 0.1882353 0.1541507 0.28 1.26 3.18 7.3391667 3.52 46 1.6056 0.049268 0.0879752 -0.1615357
REX TRUEFORM CLOTHING COMPANY LTD 88 2007 0.1471004 0.1378493 0.29 0.97 3.285 9.115 2.66 47 1.7348 0.0843996 0.0764454 0.1322065
REX TRUEFORM CLOTHING COMPANY LTD 88 2008 0.0776819 -0.1209817 0.31 1.42 2.96 10.8075 3.5 48 2.753 0.1972688 0.1771722 0.3072917
REX TRUEFORM CLOTHING COMPANY LTD 88 2009 0.0629291 0.2608061 0.24 1.06 3.39 7.8508333 4.67 49 1.9321 0.1060364 0.1193639 0.0346913
REX TRUEFORM CLOTHING COMPANY LTD 88 2010 0.0699677 0.0471155 0.28 1.19 0 6.42 3.64 50 1.9646 0.1121123 0.118119 0.0778791
RMB HOLDINGS LTD 89 2001 0.080855 0.4871494 0.42 1.44 46.03 9.6766667 3.23 8 -0.0405 0.057413 -0.1227822 1.7174124
RMB HOLDINGS LTD 89 2002 -0.1023216 -0.1562534 0.37 1.82 25.18 11.1625 4.34 9 3.1379 0.1612545 0.1639939 0.1499393
RMB HOLDINGS LTD 89 2003 0.045977 -0.0158364 0.4 1.29 13.96 10.665 4.21 10 1.2201 -0.0243598 0.1164783 -1.0161686
RMB HOLDINGS LTD 89 2004 0.5082418 0.4163602 0.48 1.86 22.4 7.5325 3.56 11 1.4546 0.1436868 0.1265089 0.3424459

100
RMB HOLDINGS LTD 89 2005 0.4274438 0.320422 0.45 2.72 26.48 6.9058333 3.37 12 2.1887 0.1830631 0.196855 0.02702
RMB HOLDINGS LTD 89 2006 0.1875798 0.1044537 0.38 2.13 26.57 7.3391667 3.4 13 1.0818 0.1898841 0.2517052 -1.3531054
RMB HOLDINGS LTD 89 2007 0.232808 0.2854529 0.39 2.21 28.05 9.115 4.78 14 1.1905 0.2105339 0.2047643 0.5128702
RMB HOLDINGS LTD 89 2008 -0.2832655 -0.4299512 0.3 1.35 12.88 10.8075 5.51 15 1.797 0.2211186 0.2268958 -0.081678
RMB HOLDINGS LTD 89 2009 -0.0113498 0.1103423 0.26 0.82 8 7.8508333 3.34 16 0.3641 0.0116672 0.0125409 -0.0434851
RMB HOLDINGS LTD 89 2010 0.3743337 0.2855534 0.29 1.44 25.14 6.42 3.22 17 0.4725 0.0876818 0.0826129 0.3715636
SABMILLER PLC 90 2001 0.1923077 0.049739 1.28 0.86 8.2 9.6766667 2.67 41 0.2133 0.0625854 0.1707562 -0.1508229
SABMILLER PLC 90 2002 0.2723454 0.4851553 1.88 1.12 9.2 11.1625 4.09 42 1.1125 0.4481348 0.451709 0.439792
SABMILLER PLC 90 2003 -0.2716229 -0.0582167 10.05 13.43 7.36 10.665 2.86 43 0.4767 0.1770461 -0.3920228 0.8796277
SABMILLER PLC 90 2004 0.4535896 0.3960259 12.55 14.76 9.9 7.5325 2.37 44 0.2479 -0.0730877 0.4010682 -0.5828886
SABMILLER PLC 90 2005 0.3332502 0.3536953 4.48 6.43 11.42 6.9058333 2.13 45 1.2214 0.0593635 -0.0469717 0.2228848
SABMILLER PLC 90 2006 0.2439663 0.3676011 -6.52 -4.58 13.38 7.3391667 2.03 46 0.5864 0.5074535 0.6413253 0.2935148
SABMILLER PLC 90 2007 0.3322304 0.2265895 -8.63 -6.42 12.41 9.115 1.9 47 0.7786 0.2551048 0.2650503 0.2358924
SABMILLER PLC 90 2008 -0.0485437 0.1087467 -17.35 -12.32 9.84 10.8075 3.09 48 0.7188 0.3715994 4.10E-01 0.2925268
SABMILLER PLC 90 2009 0.0310275 -0.1754445 2.85 3.14 5.5 7.8508333 2.09 49 0.4428 0.2988427 4.05E-01 0.0151551
SABMILLER PLC 90 2010 0.2633063 0.4606747 2.51 2.19 11.25 6.42 2.21 50 -0.1192 -0.1496693 -1.46E-01 -0.1624032
SABVEST LTD 91 2001 -0.0960452 0.4318234 0.26 -4.68 4.63 9.6766667 0 41 -2.0313 -0.0954546 0.031386 -0.4808661
SABVEST LTD 91 2002 0.1375 0.0688586 0.1 -16.84 -54.33 11.1625 0 42 -0.5631 -0.1232232 0.0071564 -0.9210564
SABVEST LTD 91 2003 0.2967033 -0.0023692 0.07 -6.89 6.67 10.665 0 43 0.0839 -0.0998415 -0.0605936 -0.610236
SABVEST LTD 91 2004 -0.1016949 0.1204839 0.08 0.08 71.93 7.5325 1.36 44 0.2524 0.1246441 0.1176265 0.2388647
SABVEST LTD 91 2005 0.4528302 0.3429448 0.06 0.91 45.51 6.9058333 0.97 45 0.8342 0.1712062 0.1894443 -0.1602261
SABVEST LTD 91 2006 0.6136364 0.6606167 0.07 1.57 19.09 7.3391667 1.33 46 2.8361 0.4719603 0.4701143 0.5112785
SABVEST LTD 91 2007 0.6861167 0.3887444 0.06 1.44 33.86 9.115 1.47 47 0.2698 0.1595702 0.167397 -0.0195084
SABVEST LTD 91 2008 -0.048926 -0.1997618 0.1 -0.9 4.32 10.8075 1.93 48 -1.7383 0.116503 0.0746587 0.8249649
SABVEST LTD 91 2009 -0.1756587 -0.193184 0.05 1.65 9.52 7.8508333 2.33 49 0.3572 0.0347943 0.0838536 -0.8747406
SABVEST LTD 91 2010 -0.0821918 0.0394708 0.16 11.35 0 6.42 2.39 50 0.0731 0.2245255 0.2298909 0.0422057
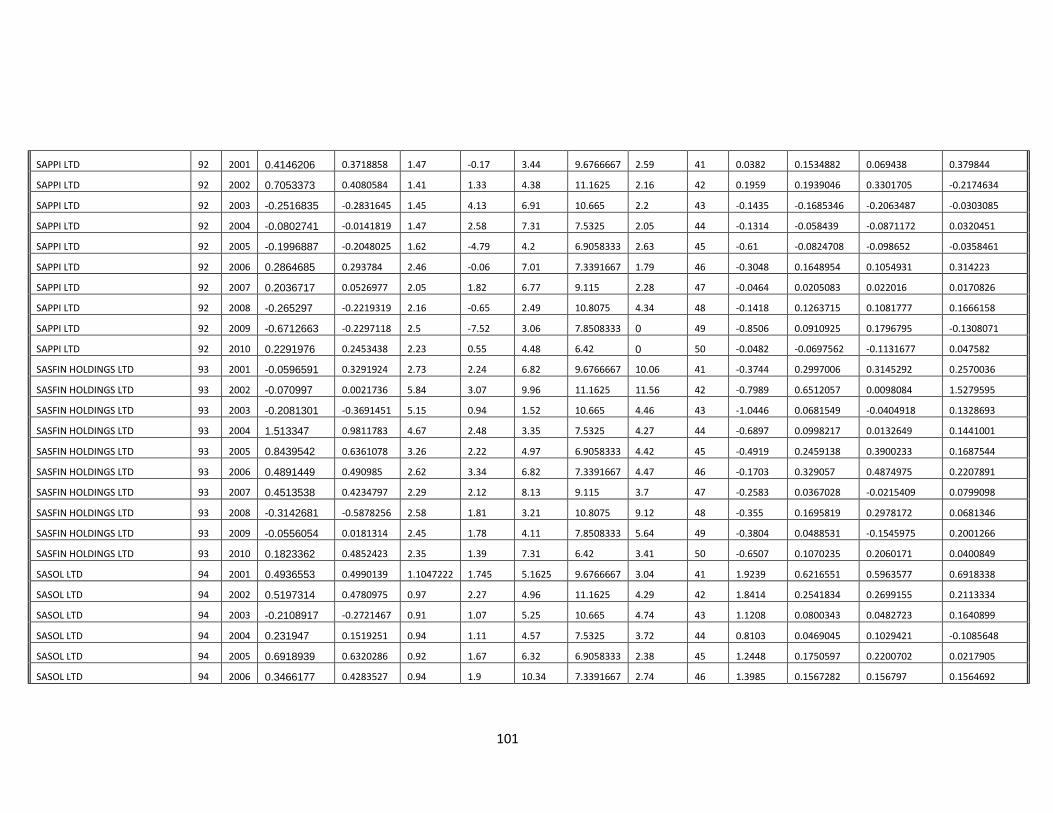
101
SAPPI LTD 92 2001 0.4146206 0.3718858 1.47 -0.17 3.44 9.6766667 2.59 41 0.0382 0.1534882 0.069438 0.379844
SAPPI LTD 92 2002 0.7053373 0.4080584 1.41 1.33 4.38 11.1625 2.16 42 0.1959 0.1939046 0.3301705 -0.2174634
SAPPI LTD 92 2003 -0.2516835 -0.2831645 1.45 4.13 6.91 10.665 2.2 43 -0.1435 -0.1685346 -0.2063487 -0.0303085
SAPPI LTD 92 2004 -0.0802741 -0.0141819 1.47 2.58 7.31 7.5325 2.05 44 -0.1314 -0.058439 -0.0871172 0.0320451
SAPPI LTD 92 2005 -0.1996887 -0.2048025 1.62 -4.79 4.2 6.9058333 2.63 45 -0.61 -0.0824708 -0.098652 -0.0358461
SAPPI LTD 92 2006 0.2864685 0.293784 2.46 -0.06 7.01 7.3391667 1.79 46 -0.3048 0.1648954 0.1054931 0.314223
SAPPI LTD 92 2007 0.2036717 0.0526977 2.05 1.82 6.77 9.115 2.28 47 -0.0464 0.0205083 0.022016 0.0170826
SAPPI LTD 92 2008 -0.265297 -0.2219319 2.16 -0.65 2.49 10.8075 4.34 48 -0.1418 0.1263715 0.1081777 0.1666158
SAPPI LTD 92 2009 -0.6712663 -0.2297118 2.5 -7.52 3.06 7.8508333 0 49 -0.8506 0.0910925 0.1796795 -0.1308071
SAPPI LTD 92 2010 0.2291976 0.2453438 2.23 0.55 4.48 6.42 0 50 -0.0482 -0.0697562 -0.1131677 0.047582
SASFIN HOLDINGS LTD 93 2001 -0.0596591 0.3291924 2.73 2.24 6.82 9.6766667 10.06 41 -0.3744 0.2997006 0.3145292 0.2570036
SASFIN HOLDINGS LTD 93 2002 -0.070997 0.0021736 5.84 3.07 9.96 11.1625 11.56 42 -0.7989 0.6512057 0.0098084 1.5279595
SASFIN HOLDINGS LTD 93 2003 -0.2081301 -0.3691451 5.15 0.94 1.52 10.665 4.46 43 -1.0446 0.0681549 -0.0404918 0.1328693
SASFIN HOLDINGS LTD 93 2004 1.513347 0.9811783 4.67 2.48 3.35 7.5325 4.27 44 -0.6897 0.0998217 0.0132649 0.1441001
SASFIN HOLDINGS LTD 93 2005 0.8439542 0.6361078 3.26 2.22 4.97 6.9058333 4.42 45 -0.4919 0.2459138 0.3900233 0.1687544
SASFIN HOLDINGS LTD 93 2006 0.4891449 0.490985 2.62 3.34 6.82 7.3391667 4.47 46 -0.1703 0.329057 0.4874975 0.2207891
SASFIN HOLDINGS LTD 93 2007 0.4513538 0.4234797 2.29 2.12 8.13 9.115 3.7 47 -0.2583 0.0367028 -0.0215409 0.0799098
SASFIN HOLDINGS LTD 93 2008 -0.3142681 -0.5878256 2.58 1.81 3.21 10.8075 9.12 48 -0.355 0.1695819 0.2978172 0.0681346
SASFIN HOLDINGS LTD 93 2009 -0.0556054 0.0181314 2.45 1.78 4.11 7.8508333 5.64 49 -0.3804 0.0488531 -0.1545975 0.2001266
SASFIN HOLDINGS LTD 93 2010 0.1823362 0.4852423 2.35 1.39 7.31 6.42 3.41 50 -0.6507 0.1070235 0.2060171 0.0400849
SASOL LTD 94 2001 0.4936553 0.4990139 1.1047222 1.745 5.1625 9.6766667 3.04 41 1.9239 0.6216551 0.5963577 0.6918338
SASOL LTD 94 2002 0.5197314 0.4780975 0.97 2.27 4.96 11.1625 4.29 42 1.8414 0.2541834 0.2699155 0.2113334
SASOL LTD 94 2003 -0.2108917 -0.2721467 0.91 1.07 5.25 10.665 4.74 43 1.1208 0.0800343 0.0482723 0.1640899
SASOL LTD 94 2004 0.231947 0.1519251 0.94 1.11 4.57 7.5325 3.72 44 0.8103 0.0469045 0.1029421 -0.1085648
SASOL LTD 94 2005 0.6918939 0.6320286 0.92 1.67 6.32 6.9058333 2.38 45 1.2448 0.1750597 0.2200702 0.0217905
SASOL LTD 94 2006 0.3466177 0.4283527 0.94 1.9 10.34 7.3391667 2.74 46 1.3985 0.1567282 0.156797 0.1564692
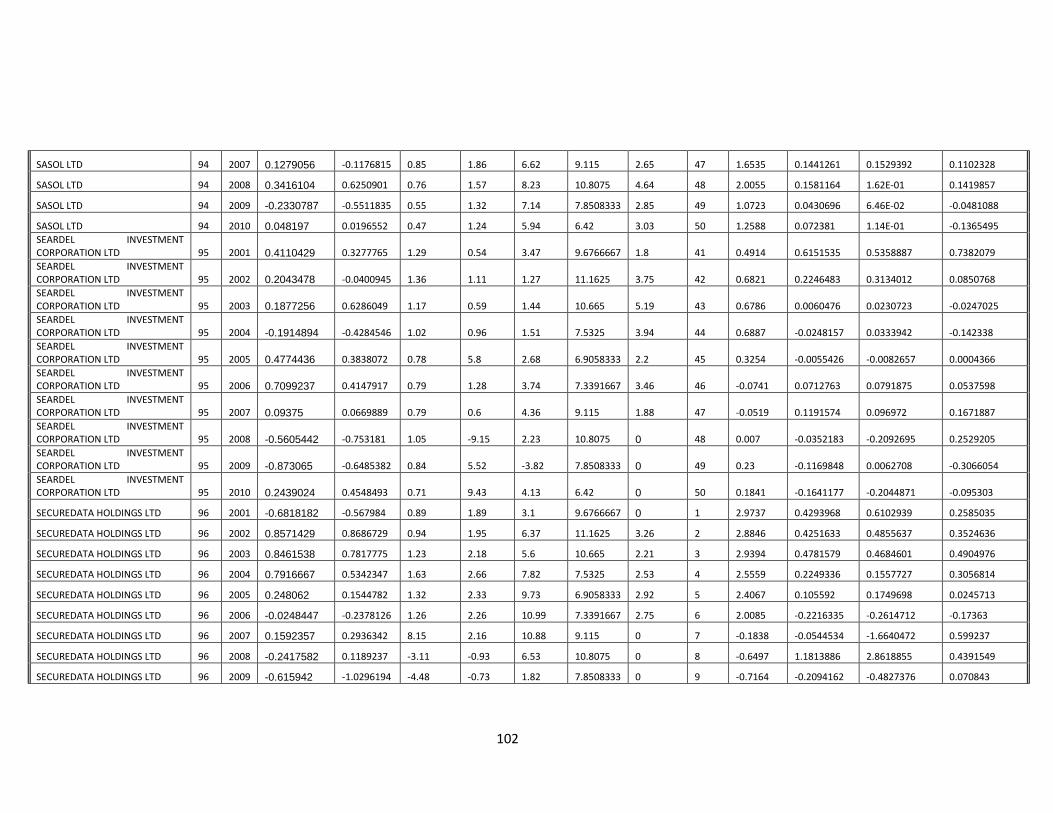
102
SASOL LTD 94 2007 0.1279056 -0.1176815 0.85 1.86 6.62 9.115 2.65 47 1.6535 0.1441261 0.1529392 0.1102328
SASOL LTD 94 2008 0.3416104 0.6250901 0.76 1.57 8.23 10.8075 4.64 48 2.0055 0.1581164 1.62E-01 0.1419857
SASOL LTD 94 2009 -0.2330787 -0.5511835 0.55 1.32 7.14 7.8508333 2.85 49 1.0723 0.0430696 6.46E-02 -0.0481088
SASOL LTD 94 2010 0.048197 0.0196552 0.47 1.24 5.94 6.42 3.03 50 1.2588 0.072381 1.14E-01 -0.1365495
SEARDEL INVESTMENT CORPORATION LTD 95 2001 0.4110429 0.3277765 1.29 0.54 3.47 9.6766667 1.8 41 0.4914 0.6151535 0.5358887 0.7382079
SEARDEL INVESTMENT CORPORATION LTD 95 2002 0.2043478 -0.0400945 1.36 1.11 1.27 11.1625 3.75 42 0.6821 0.2246483 0.3134012 0.0850768
SEARDEL INVESTMENT CORPORATION LTD 95 2003 0.1877256 0.6286049 1.17 0.59 1.44 10.665 5.19 43 0.6786 0.0060476 0.0230723 -0.0247025
SEARDEL INVESTMENT CORPORATION LTD 95 2004 -0.1914894 -0.4284546 1.02 0.96 1.51 7.5325 3.94 44 0.6887 -0.0248157 0.0333942 -0.142338
SEARDEL INVESTMENT CORPORATION LTD 95 2005 0.4774436 0.3838072 0.78 5.8 2.68 6.9058333 2.2 45 0.3254 -0.0055426 -0.0082657 0.0004366
SEARDEL INVESTMENT CORPORATION LTD 95 2006 0.7099237 0.4147917 0.79 1.28 3.74 7.3391667 3.46 46 -0.0741 0.0712763 0.0791875 0.0537598
SEARDEL INVESTMENT CORPORATION LTD 95 2007 0.09375 0.0669889 0.79 0.6 4.36 9.115 1.88 47 -0.0519 0.1191574 0.096972 0.1671887
SEARDEL INVESTMENT CORPORATION LTD 95 2008 -0.5605442 -0.753181 1.05 -9.15 2.23 10.8075 0 48 0.007 -0.0352183 -0.2092695 0.2529205
SEARDEL INVESTMENT CORPORATION LTD 95 2009 -0.873065 -0.6485382 0.84 5.52 -3.82 7.8508333 0 49 0.23 -0.1169848 0.0062708 -0.3066054
SEARDEL INVESTMENT CORPORATION LTD 95 2010 0.2439024 0.4548493 0.71 9.43 4.13 6.42 0 50 0.1841 -0.1641177 -0.2044871 -0.095303
SECUREDATA HOLDINGS LTD 96 2001 -0.6818182 -0.567984 0.89 1.89 3.1 9.6766667 0 1 2.9737 0.4293968 0.6102939 0.2585035
SECUREDATA HOLDINGS LTD 96 2002 0.8571429 0.8686729 0.94 1.95 6.37 11.1625 3.26 2 2.8846 0.4251633 0.4855637 0.3524636
SECUREDATA HOLDINGS LTD 96 2003 0.8461538 0.7817775 1.23 2.18 5.6 10.665 2.21 3 2.9394 0.4781579 0.4684601 0.4904976
SECUREDATA HOLDINGS LTD 96 2004 0.7916667 0.5342347 1.63 2.66 7.82 7.5325 2.53 4 2.5559 0.2249336 0.1557727 0.3056814
SECUREDATA HOLDINGS LTD 96 2005 0.248062 0.1544782 1.32 2.33 9.73 6.9058333 2.92 5 2.4067 0.105592 0.1749698 0.0245713
SECUREDATA HOLDINGS LTD 96 2006 -0.0248447 -0.2378126 1.26 2.26 10.99 7.3391667 2.75 6 2.0085 -0.2216335 -0.2614712 -0.17363
SECUREDATA HOLDINGS LTD 96 2007 0.1592357 0.2936342 8.15 2.16 10.88 9.115 0 7 -0.1838 -0.0544534 -1.6640472 0.599237
SECUREDATA HOLDINGS LTD 96 2008 -0.2417582 0.1189237 -3.11 -0.93 6.53 10.8075 0 8 -0.6497 1.1813886 2.8618855 0.4391549
SECUREDATA HOLDINGS LTD 96 2009 -0.615942 -1.0296194 -4.48 -0.73 1.82 7.8508333 0 9 -0.7164 -0.2094162 -0.4827376 0.070843

103
SECUREDATA HOLDINGS LTD 96 2010 0.6792453 0.5479006 -10.96 -4.9 3.71 6.42 4.76 10 -0.2302 0.1861335 -0.0891038 0.3576409
SENTULA MINING LTD 97 2001 0.7727273 0.7537718 0.35 0.79 1.16 9.6766667 5.23 8 0.2764 -0.0201962 0.032939 -0.260341
SENTULA MINING LTD 97 2002 0.1794872 0.1542601 0.53 1.33 1.22 11.1625 4.25 9 0.1182 0.181554 0.1671523 0.2538742
SENTULA MINING LTD 97 2003 0.5 0.2090918 1 1.65 0.88 10.665 3.75 10 0.2733 0.405998 0.2713407 0.8797016
SENTULA MINING LTD 97 2004 1 0.7301885 1.19 0.91 0.86 7.5325 3.13 11 0.293 0.204687 0.1185819 0.4002168
SENTULA MINING LTD 97 2005 1.9057971 1.1526803 1.13 1.59 2.27 6.9058333 1.58 12 0.6766 0.257683 0.2891828 0.1923925
SENTULA MINING LTD 97 2006 1.2094763 1.0185696 1.01 1.57 4.63 7.3391667 1.06 13 1.0244 0.2270802 0.2634851 0.1429704
SENTULA MINING LTD 97 2007 1.3126411 1.0082014 1.47 2.02 9.13 9.115 0.92 14 0.8983 0.8296589 0.5494208 1.2995784
SENTULA MINING LTD 97 2008 -0.3333333 0.2070078 1.63 0.94 23.95 10.8075 1.76 15 0.1153 0.6728656 1.0446425 -0.0653059
SENTULA MINING LTD 97 2009 -0.7364568 -1.8368278 1.59 1.34 1.04 7.8508333 0 16 0.3183 0.1250967 0.0412264 0.3742733
SENTULA MINING LTD 97 2010 -0.2638889 0.9539548 0.88 3.18 7.38 6.42 0 17 0.3939 0.0230566 0.0239182 0.0208812
SHOPRITE HOLDINGS LTD 98 2001 -0.0960452 -0.1467156 3.14 2.49 5.95 9.6766667 3.25 41 3.1418 0.1642078 0.068649 0.2066418
SHOPRITE HOLDINGS LTD 98 2002 0.0953125 0.2374936 3.36 3.68 7.78 11.1625 3.59 42 1.9888 0.0252023 -0.0278075 0.0463682
SHOPRITE HOLDINGS LTD 98 2003 -0.0142653 -0.190507 3.12 2.67 4.85 10.665 3.26 43 1.803 0.0892561 0.1193799 0.0774211
SHOPRITE HOLDINGS LTD 98 2004 0.4616498 0.382787 3.12 3.33 7.41 7.5325 2.79 44 1.5904 0.1289399 0.1157114 0.1341983
SHOPRITE HOLDINGS LTD 98 2005 0.5049505 0.4436676 3.92 4.37 10.02 6.9058333 2.71 45 1.8061 0.0607772 0.154279 0.0214106
SHOPRITE HOLDINGS LTD 98 2006 0.5592105 0.5502891 2.93 4.49 16.03 7.3391667 2.85 46 0.6675 0.1590398 0.3183413 0.0781784
SHOPRITE HOLDINGS LTD 98 2007 0.3953586 0.3198955 3 3.93 15.72 9.115 2.35 47 1.7634 0.1799312 0.1481201 0.1976797
SHOPRITE HOLDINGS LTD 98 2008 0.2954339 0.1902026 2.82 3.75 13.67 10.8075 2.92 48 1.8838 0.2300057 0.2689296 0.2081665
SHOPRITE HOLDINGS LTD 98 2009 0.3230626 0.3312857 3.26 4.02 14 7.8508333 3.07 49 2.0535 0.1203445 0.0202892 0.1739487
SHOPRITE HOLDINGS LTD 98 2010 0.5134086 0.4096986 2.92 3.57 15.58 6.42 2.28 50 2.1338 0.0532341 0.1459835 0.0038311
SOVEREIGN FOOD INVESTMENTS 99 2001 1.2096774 0.7884574 0.65 0.57 1.68 9.6766667 0 6 1.2056 -0.0212397 -0.0457041 0.0839778
SOVEREIGN FOOD INVESTMENTS 99 2002 0.2408759 0.3746934 1 1.96 3.6 11.1625 8.33 7 1.0155 0.3088376 0.2762522 0.4304225
SOVEREIGN FOOD INVESTMENTS 99 2003 -0.1117647 0.1291517 1.06 -10.37 -8.93 10.665 0 8 0.7905 0.0654074 0.0305136 0.1774204
SOVEREIGN FOOD INVESTMENTS 99 2004 0.7748344 -0.1823559 1.03 0.83 2.38 7.5325 0 9 0.4227 0.0684584 0.1089434 -0.063125
SOVEREIGN FOOD INVESTMENTS 99 2005 2.011194 1.5428817 0.8 1.68 4 6.9058333 0 10 1.7628 0.214135 0.2340926 0.1400033

104
SOVEREIGN FOOD INVESTMENTS 99 2006 0.3655514 0.5149821 0.72 1.45 3.58 7.3391667 0 11 1.5999 0.4049833 0.4328977 0.2881852
SOVEREIGN FOOD INVESTMENTS 99 2007 0.4274047 0.1835124 0.67 1.86 6.1 9.115 2.86 12 1.4731 0.1520214 0.1844225 -0.0083944
SOVEREIGN FOOD INVESTMENTS 99 2008 -0.4564526 0.0158232 1.11 1.41 2.89 10.8075 0 13 0.219 0.5262654 0.4444883 0.8829235
SOVEREIGN FOOD INVESTMENTS 99 2009 -0.0549708 -1.0306102 1.87 -0.28 10.56 7.8508333 0 14 -0.8063 0.3044581 0.2861401 0.3663997
SOVEREIGN FOOD INVESTMENTS 99 2010 -0.1856436 1.0045518 1.15 0.37 8.04 6.42 0 15 -0.4592 0.0117807 0.0442635 -0.1016863
SPANJAARD LTD 100 2001 0.1296296 0.0594234 3.08 2.69 4.69 9.6766667 1.36 41 0.6487 -0.0317655 0.1635458 -0.1298016
SPANJAARD LTD 100 2002 -0.2295082 -0.3958957 1.83 2.86 3.81 11.1625 2.67 42 1.1558 0.0160278 0.2109707 -0.1174571
SPANJAARD LTD 100 2003 -0.1489362 0.0281709 2.19 0.4 4.09 10.665 0.79 43 0.1458 -0.0091055 -0.1358185 0.0825217
SPANJAARD LTD 100 2004 0.275 -0.3177595 1.03 6.02 3.71 7.5325 4.26 44 2.111 0.0063825 0.3109364 -0.2559465
SPANJAARD LTD 100 2005 0.377451 0.5843882 1.12 1.7 9.99 6.9058333 2.33 45 0.2389 0.0425565 0.0237898 0.0635746
SPANJAARD LTD 100 2006 0.0427046 0.244197 1.04 2.74 15.81 7.3391667 0.73 46 -0.2359 -0.0331334 0.0288449 -0.105919
SPANJAARD LTD 100 2007 0.1877133 -0.1823216 0.47 1 5.82 9.115 1.54 47 -0.0045 0.473921 0.714973 0.0546818
SPANJAARD LTD 100 2008 -0.1235632 0.6190568 0.42 1.4 4.545 10.8075 8.5 48 1.0429 0.2070349 0.221646 0.1705925
SPANJAARD LTD 100 2009 0.1606557 -0.1490356 0.8 1.63 3.27 7.8508333 18.42 49 1.0282 0.1903715 -0.034551 0.6060437
SPANJAARD LTD 100 2010 0.059322 0.3053816 0.61 1.33 6.49 6.42 4.17 50 0.4015 -0.0406029 0.0888754 -0.2468851
SPUR CORPORATION LTD 101 2001 0.0044444 0.0606356 0.95 1.57 4.62 9.6766667 0 1 2.5483 0.1118164 0.2903013 -0.1547482
SPUR CORPORATION LTD 101 2002 0.2389381 0.2285038 0.63 1.91 6.74 11.1625 0 2 2.9845 0.3712608 0.4578823 0.1860249
SPUR CORPORATION LTD 101 2003 0.2607143 0.2054804 0.5 1.12 6.16 10.665 2.94 3 2.2792 0.0340533 0.1312391 -0.2540549
SPUR CORPORATION LTD 101 2004 0.4560907 0.410574 0.54 1.31 7.91 7.5325 0 4 2.7643 0.1990514 0.1765238 0.2763014
SPUR CORPORATION LTD 101 2005 0.3326848 0.2038745 0.82 1.93 10.11 6.9058333 2.36 5 4.4892 0.0104374 -0.0317344 0.136845
SPUR CORPORATION LTD 101 2006 0.2905109 0.2444533 0.61 1.61 10.59 7.3391667 0 6 3.984 1.1875512 1.4016454 0.1141615
SPUR CORPORATION LTD 101 2007 0.2466063 0.4539516 0.65 1.63 13.28 9.115 5.04 7 4.4103 0.1135331 0.0804651 0.3948963
SPUR CORPORATION LTD 101 2008 -0.3511797 -0.6435502 0.65 1.4 5.92 10.8075 7.18 8 2.6451 0.1013845 0.1048294 0.0758898
SPUR CORPORATION LTD 101 2009 0.2531469 0.3036824 0.53 1.32 7.46 7.8508333 5.23 9 2.8777 -0.0138054 0.007305 -0.1883916
SPUR CORPORATION LTD 101 2010 0.4017857 0.3732042 0.66 1.51 7.84 6.42 4 10 -0.1465 -0.019329 -0.0459673 0.1958164
STANDARD BANK GROUP LTD 102 2001 0.1830041 0.0346569 10.63 11.23 -8.85 9.6766667 2.92 41 -0.9523 0.3298888 0.3970849 0.1846894
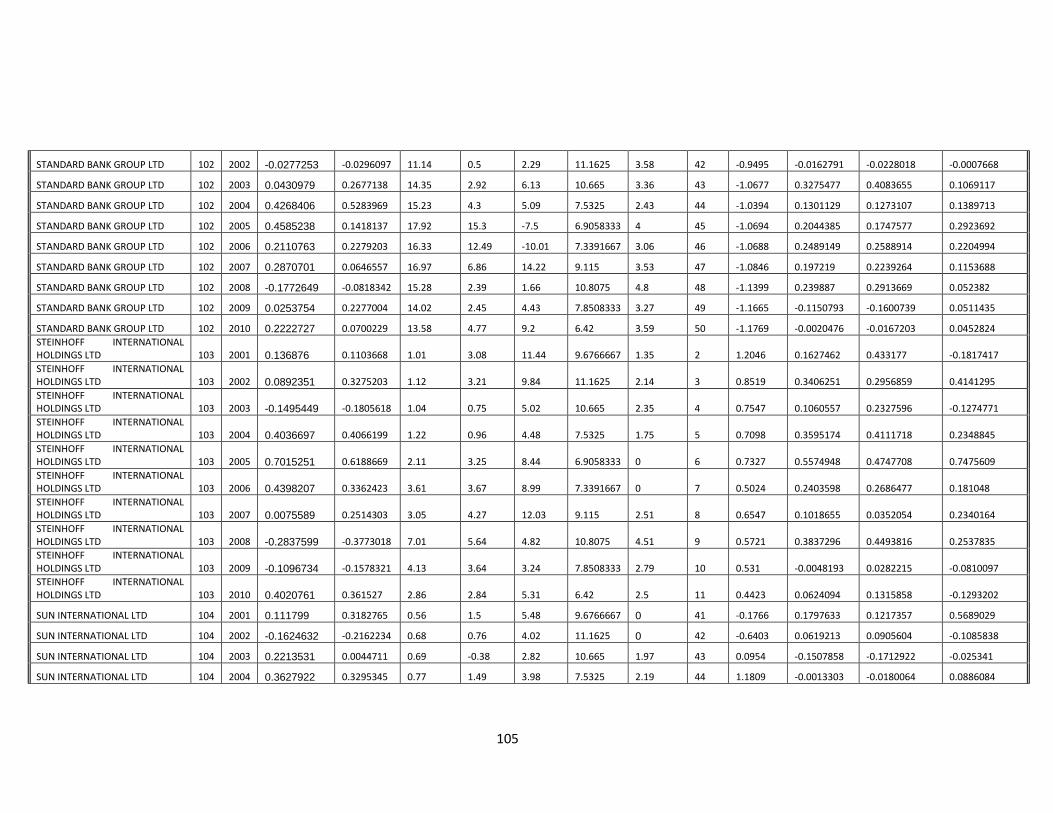
105
STANDARD BANK GROUP LTD 102 2002 -0.0277253 -0.0296097 11.14 0.5 2.29 11.1625 3.58 42 -0.9495 -0.0162791 -0.0228018 -0.0007668
STANDARD BANK GROUP LTD 102 2003 0.0430979 0.2677138 14.35 2.92 6.13 10.665 3.36 43 -1.0677 0.3275477 0.4083655 0.1069117
STANDARD BANK GROUP LTD 102 2004 0.4268406 0.5283969 15.23 4.3 5.09 7.5325 2.43 44 -1.0394 0.1301129 0.1273107 0.1389713
STANDARD BANK GROUP LTD 102 2005 0.4585238 0.1418137 17.92 15.3 -7.5 6.9058333 4 45 -1.0694 0.2044385 0.1747577 0.2923692
STANDARD BANK GROUP LTD 102 2006 0.2110763 0.2279203 16.33 12.49 -10.01 7.3391667 3.06 46 -1.0688 0.2489149 0.2588914 0.2204994
STANDARD BANK GROUP LTD 102 2007 0.2870701 0.0646557 16.97 6.86 14.22 9.115 3.53 47 -1.0846 0.197219 0.2239264 0.1153688
STANDARD BANK GROUP LTD 102 2008 -0.1772649 -0.0818342 15.28 2.39 1.66 10.8075 4.8 48 -1.1399 0.239887 0.2913669 0.052382
STANDARD BANK GROUP LTD 102 2009 0.0253754 0.2277004 14.02 2.45 4.43 7.8508333 3.27 49 -1.1665 -0.1150793 -0.1600739 0.0511435
STANDARD BANK GROUP LTD 102 2010 0.2222727 0.0700229 13.58 4.77 9.2 6.42 3.59 50 -1.1769 -0.0020476 -0.0167203 0.0452824
STEINHOFF INTERNATIONAL HOLDINGS LTD 103 2001 0.136876 0.1103668 1.01 3.08 11.44 9.6766667 1.35 2 1.2046 0.1627462 0.433177 -0.1817417
STEINHOFF INTERNATIONAL HOLDINGS LTD 103 2002 0.0892351 0.3275203 1.12 3.21 9.84 11.1625 2.14 3 0.8519 0.3406251 0.2956859 0.4141295
STEINHOFF INTERNATIONAL HOLDINGS LTD 103 2003 -0.1495449 -0.1805618 1.04 0.75 5.02 10.665 2.35 4 0.7547 0.1060557 0.2327596 -0.1274771
STEINHOFF INTERNATIONAL HOLDINGS LTD 103 2004 0.4036697 0.4066199 1.22 0.96 4.48 7.5325 1.75 5 0.7098 0.3595174 0.4111718 0.2348845
STEINHOFF INTERNATIONAL HOLDINGS LTD 103 2005 0.7015251 0.6188669 2.11 3.25 8.44 6.9058333 0 6 0.7327 0.5574948 0.4747708 0.7475609
STEINHOFF INTERNATIONAL HOLDINGS LTD 103 2006 0.4398207 0.3362423 3.61 3.67 8.99 7.3391667 0 7 0.5024 0.2403598 0.2686477 0.181048
STEINHOFF INTERNATIONAL HOLDINGS LTD 103 2007 0.0075589 0.2514303 3.05 4.27 12.03 9.115 2.51 8 0.6547 0.1018655 0.0352054 0.2340164
STEINHOFF INTERNATIONAL HOLDINGS LTD 103 2008 -0.2837599 -0.3773018 7.01 5.64 4.82 10.8075 4.51 9 0.5721 0.3837296 0.4493816 0.2537835
STEINHOFF INTERNATIONAL HOLDINGS LTD 103 2009 -0.1096734 -0.1578321 4.13 3.64 3.24 7.8508333 2.79 10 0.531 -0.0048193 0.0282215 -0.0810097
STEINHOFF INTERNATIONAL HOLDINGS LTD 103 2010 0.4020761 0.361527 2.86 2.84 5.31 6.42 2.5 11 0.4423 0.0624094 0.1315858 -0.1293202
SUN INTERNATIONAL LTD 104 2001 0.111799 0.3182765 0.56 1.5 5.48 9.6766667 0 41 -0.1766 0.1797633 0.1217357 0.5689029
SUN INTERNATIONAL LTD 104 2002 -0.1624632 -0.2162234 0.68 0.76 4.02 11.1625 0 42 -0.6403 0.0619213 0.0905604 -0.1085838
SUN INTERNATIONAL LTD 104 2003 0.2213531 0.0044711 0.69 -0.38 2.82 10.665 1.97 43 0.0954 -0.1507858 -0.1712922 -0.025341
SUN INTERNATIONAL LTD 104 2004 0.3627922 0.3295345 0.77 1.49 3.98 7.5325 2.19 44 1.1809 -0.0013303 -0.0180064 0.0886084
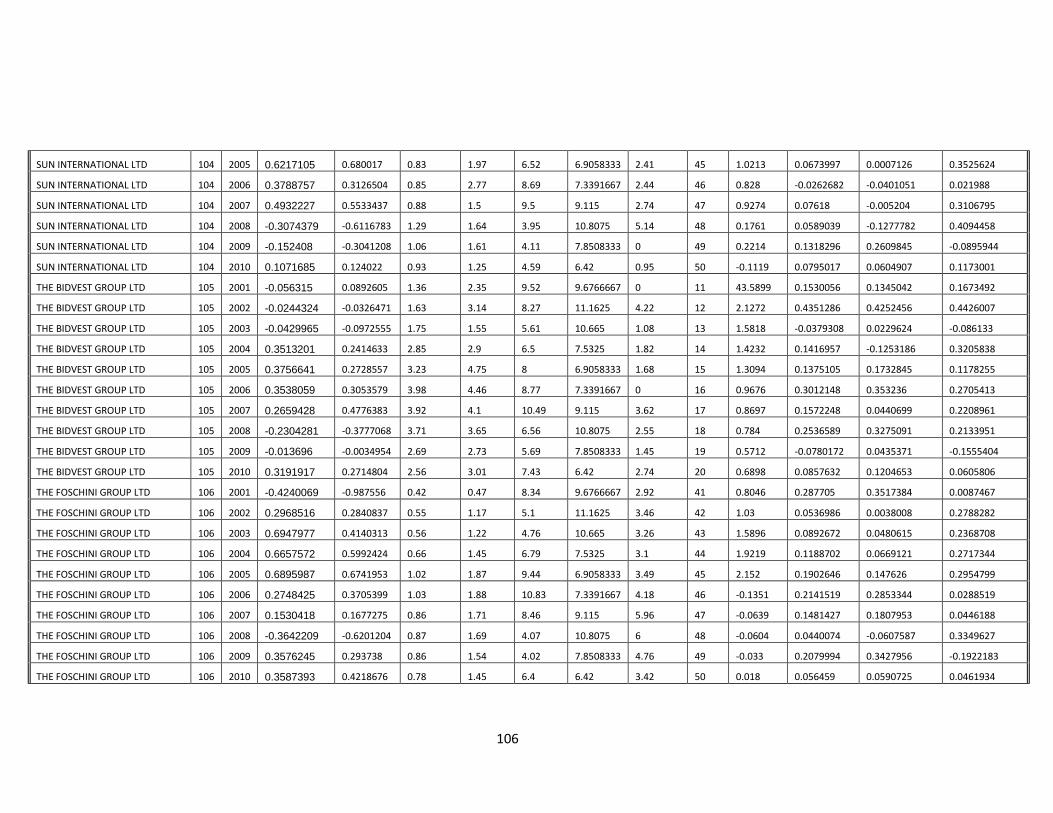
106
SUN INTERNATIONAL LTD 104 2005 0.6217105 0.680017 0.83 1.97 6.52 6.9058333 2.41 45 1.0213 0.0673997 0.0007126 0.3525624
SUN INTERNATIONAL LTD 104 2006 0.3788757 0.3126504 0.85 2.77 8.69 7.3391667 2.44 46 0.828 -0.0262682 -0.0401051 0.021988
SUN INTERNATIONAL LTD 104 2007 0.4932227 0.5533437 0.88 1.5 9.5 9.115 2.74 47 0.9274 0.07618 -0.005204 0.3106795
SUN INTERNATIONAL LTD 104 2008 -0.3074379 -0.6116783 1.29 1.64 3.95 10.8075 5.14 48 0.1761 0.0589039 -0.1277782 0.4094458
SUN INTERNATIONAL LTD 104 2009 -0.152408 -0.3041208 1.06 1.61 4.11 7.8508333 0 49 0.2214 0.1318296 0.2609845 -0.0895944
SUN INTERNATIONAL LTD 104 2010 0.1071685 0.124022 0.93 1.25 4.59 6.42 0.95 50 -0.1119 0.0795017 0.0604907 0.1173001
THE BIDVEST GROUP LTD 105 2001 -0.056315 0.0892605 1.36 2.35 9.52 9.6766667 0 11 43.5899 0.1530056 0.1345042 0.1673492
THE BIDVEST GROUP LTD 105 2002 -0.0244324 -0.0326471 1.63 3.14 8.27 11.1625 4.22 12 2.1272 0.4351286 0.4252456 0.4426007
THE BIDVEST GROUP LTD 105 2003 -0.0429965 -0.0972555 1.75 1.55 5.61 10.665 1.08 13 1.5818 -0.0379308 0.0229624 -0.086133
THE BIDVEST GROUP LTD 105 2004 0.3513201 0.2414633 2.85 2.9 6.5 7.5325 1.82 14 1.4232 0.1416957 -0.1253186 0.3205838
THE BIDVEST GROUP LTD 105 2005 0.3756641 0.2728557 3.23 4.75 8 6.9058333 1.68 15 1.3094 0.1375105 0.1732845 0.1178255
THE BIDVEST GROUP LTD 105 2006 0.3538059 0.3053579 3.98 4.46 8.77 7.3391667 0 16 0.9676 0.3012148 0.353236 0.2705413
THE BIDVEST GROUP LTD 105 2007 0.2659428 0.4776383 3.92 4.1 10.49 9.115 3.62 17 0.8697 0.1572248 0.0440699 0.2208961
THE BIDVEST GROUP LTD 105 2008 -0.2304281 -0.3777068 3.71 3.65 6.56 10.8075 2.55 18 0.784 0.2536589 0.3275091 0.2133951
THE BIDVEST GROUP LTD 105 2009 -0.013696 -0.0034954 2.69 2.73 5.69 7.8508333 1.45 19 0.5712 -0.0780172 0.0435371 -0.1555404
THE BIDVEST GROUP LTD 105 2010 0.3191917 0.2714804 2.56 3.01 7.43 6.42 2.74 20 0.6898 0.0857632 0.1204653 0.0605806
THE FOSCHINI GROUP LTD 106 2001 -0.4240069 -0.987556 0.42 0.47 8.34 9.6766667 2.92 41 0.8046 0.287705 0.3517384 0.0087467
THE FOSCHINI GROUP LTD 106 2002 0.2968516 0.2840837 0.55 1.17 5.1 11.1625 3.46 42 1.03 0.0536986 0.0038008 0.2788282
THE FOSCHINI GROUP LTD 106 2003 0.6947977 0.4140313 0.56 1.22 4.76 10.665 3.26 43 1.5896 0.0892672 0.0480615 0.2368708
THE FOSCHINI GROUP LTD 106 2004 0.6657572 0.5992424 0.66 1.45 6.79 7.5325 3.1 44 1.9219 0.1188702 0.0669121 0.2717344
THE FOSCHINI GROUP LTD 106 2005 0.6895987 0.6741953 1.02 1.87 9.44 6.9058333 3.49 45 2.152 0.1902646 0.147626 0.2954799
THE FOSCHINI GROUP LTD 106 2006 0.2748425 0.3705399 1.03 1.88 10.83 7.3391667 4.18 46 -0.1351 0.2141519 0.2853344 0.0288519
THE FOSCHINI GROUP LTD 106 2007 0.1530418 0.1677275 0.86 1.71 8.46 9.115 5.96 47 -0.0639 0.1481427 0.1807953 0.0446188
THE FOSCHINI GROUP LTD 106 2008 -0.3642209 -0.6201204 0.87 1.69 4.07 10.8075 6 48 -0.0604 0.0440074 -0.0607587 0.3349627
THE FOSCHINI GROUP LTD 106 2009 0.3576245 0.293738 0.86 1.54 4.02 7.8508333 4.76 49 -0.033 0.2079994 0.3427956 -0.1922183
THE FOSCHINI GROUP LTD 106 2010 0.3587393 0.4218676 0.78 1.45 6.4 6.42 3.42 50 0.018 0.056459 0.0590725 0.0461934

107
TRANS HEX GROUP LTD 107 2001 0.6120577 0.3973974 1.97 3.06 3.75 9.6766667 3.12 41 2.0633 0.2639465 0.2711807 0.2173591
TRANS HEX GROUP LTD 107 2002 0.5211382 0.2920671 2.27 3.17 2.39 11.1625 2.78 42 2.5362 0.3382579 0.3766613 0.0384689
TRANS HEX GROUP LTD 107 2003 0.172635 0.1437741 1.85 2.28 3.99 10.665 2.43 43 1.9511 0.1916272 0.1285327 0.6410087
TRANS HEX GROUP LTD 107 2004 0.0350957 0.5045433 1.18 1.33 10.41 7.5325 3.76 44 1.5433 0.0273908 0.0439773 -0.0701737
TRANS HEX GROUP LTD 107 2005 -0.2593571 -0.4353042 1.36 2.03 19.8 6.9058333 2.71 45 0.7026 0.0653487 0.0453694 0.1815633
TRANS HEX GROUP LTD 107 2006 -0.2919144 -0.3680674 1.03 1.88 4.82 7.3391667 1.24 46 -0.9277 -0.1669705 -0.1803421 -0.0972437
TRANS HEX GROUP LTD 107 2007 0.1309824 0.1896215 1.02 2 6.26 9.115 2 47 0.3691 0.1119057 0.0817264 0.2505709
TRANS HEX GROUP LTD 107 2008 -0.4038604 -0.1581628 0.92 1.61 4.62 10.8075 1.57 48 0.0455 0.0280364 0.0434393 -0.0398103
TRANS HEX GROUP LTD 107 2009 -0.6625156 -1.9831364 -3.61 -15.91 0.51 7.8508333 0 49 -10.9004 -0.4263457 -0.7216357 0.3503688
TRANS HEX GROUP LTD 107 2010 0.3062731 0.8873772 -5.87 -3.82 3.67 6.42 0 50 -7.139 0.0237617 0.0079155 0.0481787
TRANSPACO LTD 108 2001 -0.3875 -0.375744 0.85 1.66 3.62 9.6766667 0 41 -0.4209 0.0695028 -0.011534 0.1872385
TRANSPACO LTD 108 2002 0.1020408 -0.3262157 1.11 1.63 2.16 11.1625 0 42 0.7278 -0.0328212 0.0618742 -0.1728789
TRANSPACO LTD 108 2003 1.5092593 1.1202068 1.65 1.63 2.86 10.665 3.75 43 1.2076 0.0795382 0.1186444 0.0108729
TRANSPACO LTD 108 2004 0.5756458 0.5217031 1.76 2.13 4.93 7.5325 3.27 44 1.3244 0.1148302 0.1498016 0.0465943
TRANSPACO LTD 108 2005 0.2903981 0.5338796 0.94 1.48 3.82 6.9058333 3.91 45 1.1156 0.35563 0.4315301 0.1788543
TRANSPACO LTD 108 2006 -0.0980036 -0.5276905 0.78 1.53 5.06 7.3391667 3.23 46 -0.1865 -0.0861622 -0.1479474 0.0609692
TRANSPACO LTD 108 2007 0.5211268 0.7708321 0.78 1.55 3.27 9.115 3.36 47 0.7362 0.4623336 0.2035895 0.8607142
TRANSPACO LTD 108 2008 -0.25 -0.1651944 0.86 1.28 2.1 10.8075 5.49 48 0.6627 0.1271932 0.1933244 0.0480695
TRANSPACO LTD 108 2009 0.1446208 0 0.94 1.35 4.235 7.8508333 5.85 49 1.2208 -0.0070011 0.1119168 -0.184312
TRANSPACO LTD 108 2010 0.6286595 0.3980396 1.38 -1.48 6.37 6.42 5.12 50 1.4956 0.0597925 0.0866085 0.0116228
TRENCOR LTD 109 2001 0.7063712 1.1592369 1.94 2.66 1.39 9.6766667 0 41 -0.446 0.6482588 0.693314 0.3723722
TRENCOR LTD 109 2002 0.3928571 -0.1635011 2.65 12.93 -24.41 11.1625 0 42 -1.3872 -0.1487673 -0.1603732 -0.0688383
TRENCOR LTD 109 2003 0.0571096 0.1687021 2.5 28.82 16.65 10.665 0 43 -0.9796 -0.208988 -0.1995957 -0.2730976
TRENCOR LTD 109 2004 0.3318633 0.355005 2.91 0.31 3.53 7.5325 0 44 -0.7794 0.0858761 0.0409011 0.3570306
TRENCOR LTD 109 2005 0.6365894 0.3798126 2.2 2.92 2.53 6.9058333 1.05 45 -0.0748 0.1497596 0.2008706 -0.1659657
TRENCOR LTD 109 2006 0.3085483 0.3910391 2.29 2.55 4.96 7.3391667 1.64 46 -0.3961 0.2214427 0.2204681 0.2286746
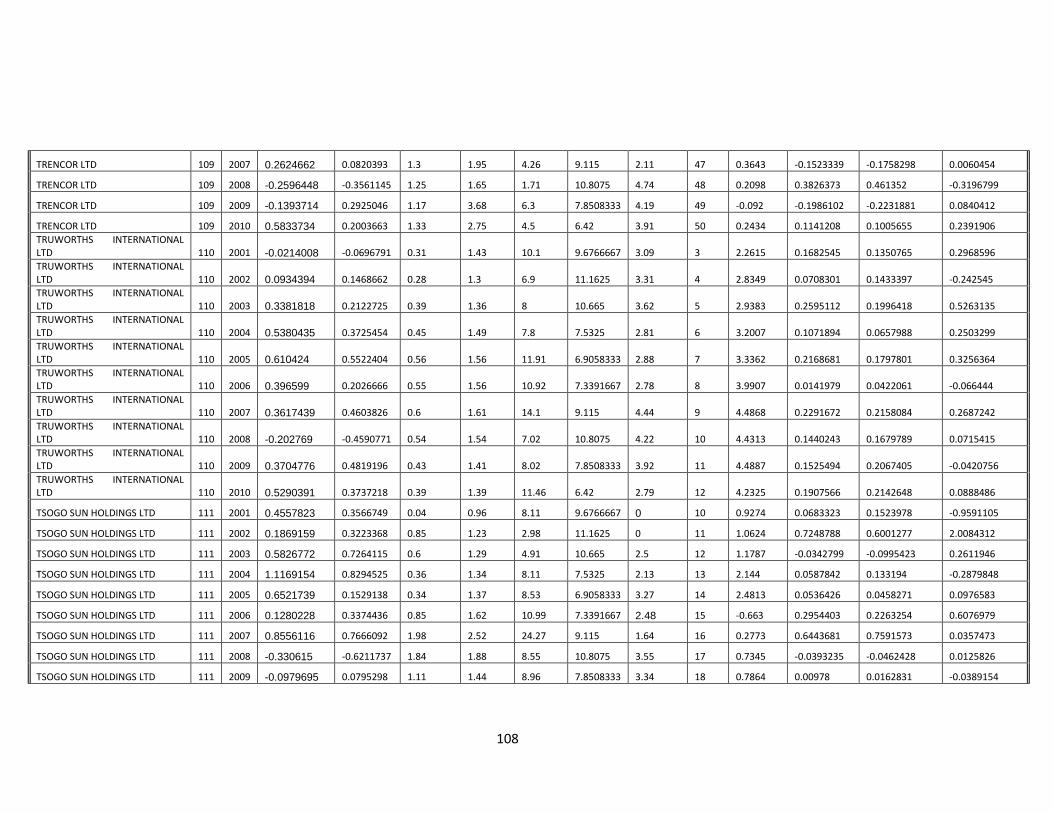
108
TRENCOR LTD 109 2007 0.2624662 0.0820393 1.3 1.95 4.26 9.115 2.11 47 0.3643 -0.1523339 -0.1758298 0.0060454
TRENCOR LTD 109 2008 -0.2596448 -0.3561145 1.25 1.65 1.71 10.8075 4.74 48 0.2098 0.3826373 0.461352 -0.3196799
TRENCOR LTD 109 2009 -0.1393714 0.2925046 1.17 3.68 6.3 7.8508333 4.19 49 -0.092 -0.1986102 -0.2231881 0.0840412
TRENCOR LTD 109 2010 0.5833734 0.2003663 1.33 2.75 4.5 6.42 3.91 50 0.2434 0.1141208 0.1005655 0.2391906
TRUWORTHS INTERNATIONAL LTD 110 2001 -0.0214008 -0.0696791 0.31 1.43 10.1 9.6766667 3.09 3 2.2615 0.1682545 0.1350765 0.2968596
TRUWORTHS INTERNATIONAL LTD 110 2002 0.0934394 0.1468662 0.28 1.3 6.9 11.1625 3.31 4 2.8349 0.0708301 0.1433397 -0.242545
TRUWORTHS INTERNATIONAL LTD 110 2003 0.3381818 0.2122725 0.39 1.36 8 10.665 3.62 5 2.9383 0.2595112 0.1996418 0.5263135
TRUWORTHS INTERNATIONAL LTD 110 2004 0.5380435 0.3725454 0.45 1.49 7.8 7.5325 2.81 6 3.2007 0.1071894 0.0657988 0.2503299
TRUWORTHS INTERNATIONAL LTD 110 2005 0.610424 0.5522404 0.56 1.56 11.91 6.9058333 2.88 7 3.3362 0.2168681 0.1797801 0.3256364
TRUWORTHS INTERNATIONAL LTD 110 2006 0.396599 0.2026666 0.55 1.56 10.92 7.3391667 2.78 8 3.9907 0.0141979 0.0422061 -0.066444
TRUWORTHS INTERNATIONAL LTD 110 2007 0.3617439 0.4603826 0.6 1.61 14.1 9.115 4.44 9 4.4868 0.2291672 0.2158084 0.2687242
TRUWORTHS INTERNATIONAL LTD 110 2008 -0.202769 -0.4590771 0.54 1.54 7.02 10.8075 4.22 10 4.4313 0.1440243 0.1679789 0.0715415
TRUWORTHS INTERNATIONAL LTD 110 2009 0.3704776 0.4819196 0.43 1.41 8.02 7.8508333 3.92 11 4.4887 0.1525494 0.2067405 -0.0420756
TRUWORTHS INTERNATIONAL LTD 110 2010 0.5290391 0.3737218 0.39 1.39 11.46 6.42 2.79 12 4.2325 0.1907566 0.2142648 0.0888486
TSOGO SUN HOLDINGS LTD 111 2001 0.4557823 0.3566749 0.04 0.96 8.11 9.6766667 0 10 0.9274 0.0683323 0.1523978 -0.9591105
TSOGO SUN HOLDINGS LTD 111 2002 0.1869159 0.3223368 0.85 1.23 2.98 11.1625 0 11 1.0624 0.7248788 0.6001277 2.0084312
TSOGO SUN HOLDINGS LTD 111 2003 0.5826772 0.7264115 0.6 1.29 4.91 10.665 2.5 12 1.1787 -0.0342799 -0.0995423 0.2611946
TSOGO SUN HOLDINGS LTD 111 2004 1.1169154 0.8294525 0.36 1.34 8.11 7.5325 2.13 13 2.144 0.0587842 0.133194 -0.2879848
TSOGO SUN HOLDINGS LTD 111 2005 0.6521739 0.1529138 0.34 1.37 8.53 6.9058333 3.27 14 2.4813 0.0536426 0.0458271 0.0976583
TSOGO SUN HOLDINGS LTD 111 2006 0.1280228 0.3374436 0.85 1.62 10.99 7.3391667 2.48 15 -0.663 0.2954403 0.2263254 0.6076979
TSOGO SUN HOLDINGS LTD 111 2007 0.8556116 0.7666092 1.98 2.52 24.27 9.115 1.64 16 0.2773 0.6443681 0.7591573 0.0357473
TSOGO SUN HOLDINGS LTD 111 2008 -0.330615 -0.6211737 1.84 1.88 8.55 10.8075 3.55 17 0.7345 -0.0393235 -0.0462428 0.0125826
TSOGO SUN HOLDINGS LTD 111 2009 -0.0979695 0.0795298 1.11 1.44 8.96 7.8508333 3.34 18 0.7864 0.00978 0.0162831 -0.0389154
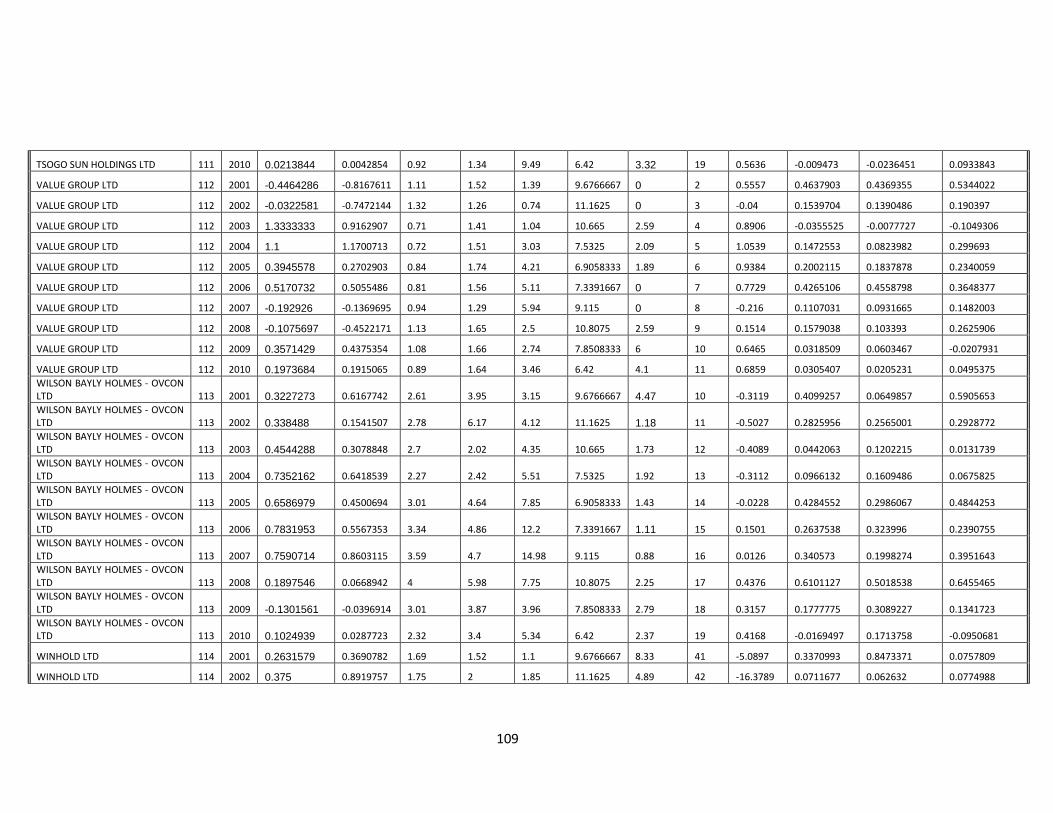
109
TSOGO SUN HOLDINGS LTD 111 2010 0.0213844 0.0042854 0.92 1.34 9.49 6.42 3.32 19 0.5636 -0.009473 -0.0236451 0.0933843
VALUE GROUP LTD 112 2001 -0.4464286 -0.8167611 1.11 1.52 1.39 9.6766667 0 2 0.5557 0.4637903 0.4369355 0.5344022
VALUE GROUP LTD 112 2002 -0.0322581 -0.7472144 1.32 1.26 0.74 11.1625 0 3 -0.04 0.1539704 0.1390486 0.190397
VALUE GROUP LTD 112 2003 1.3333333 0.9162907 0.71 1.41 1.04 10.665 2.59 4 0.8906 -0.0355525 -0.0077727 -0.1049306
VALUE GROUP LTD 112 2004 1.1 1.1700713 0.72 1.51 3.03 7.5325 2.09 5 1.0539 0.1472553 0.0823982 0.299693
VALUE GROUP LTD 112 2005 0.3945578 0.2702903 0.84 1.74 4.21 6.9058333 1.89 6 0.9384 0.2002115 0.1837878 0.2340059
VALUE GROUP LTD 112 2006 0.5170732 0.5055486 0.81 1.56 5.11 7.3391667 0 7 0.7729 0.4265106 0.4558798 0.3648377
VALUE GROUP LTD 112 2007 -0.192926 -0.1369695 0.94 1.29 5.94 9.115 0 8 -0.216 0.1107031 0.0931665 0.1482003
VALUE GROUP LTD 112 2008 -0.1075697 -0.4522171 1.13 1.65 2.5 10.8075 2.59 9 0.1514 0.1579038 0.103393 0.2625906
VALUE GROUP LTD 112 2009 0.3571429 0.4375354 1.08 1.66 2.74 7.8508333 6 10 0.6465 0.0318509 0.0603467 -0.0207931
VALUE GROUP LTD 112 2010 0.1973684 0.1915065 0.89 1.64 3.46 6.42 4.1 11 0.6859 0.0305407 0.0205231 0.0495375
WILSON BAYLY HOLMES - OVCON LTD 113 2001 0.3227273 0.6167742 2.61 3.95 3.15 9.6766667 4.47 10 -0.3119 0.4099257 0.0649857 0.5905653
WILSON BAYLY HOLMES - OVCON LTD 113 2002 0.338488 0.1541507 2.78 6.17 4.12 11.1625 1.18 11 -0.5027 0.2825956 0.2565001 0.2928772
WILSON BAYLY HOLMES - OVCON LTD 113 2003 0.4544288 0.3078848 2.7 2.02 4.35 10.665 1.73 12 -0.4089 0.0442063 0.1202215 0.0131739
WILSON BAYLY HOLMES - OVCON LTD 113 2004 0.7352162 0.6418539 2.27 2.42 5.51 7.5325 1.92 13 -0.3112 0.0966132 0.1609486 0.0675825
WILSON BAYLY HOLMES - OVCON LTD 113 2005 0.6586979 0.4500694 3.01 4.64 7.85 6.9058333 1.43 14 -0.0228 0.4284552 0.2986067 0.4844253
WILSON BAYLY HOLMES - OVCON LTD 113 2006 0.7831953 0.5567353 3.34 4.86 12.2 7.3391667 1.11 15 0.1501 0.2637538 0.323996 0.2390755
WILSON BAYLY HOLMES - OVCON LTD 113 2007 0.7590714 0.8603115 3.59 4.7 14.98 9.115 0.88 16 0.0126 0.340573 0.1998274 0.3951643
WILSON BAYLY HOLMES - OVCON LTD 113 2008 0.1897546 0.0668942 4 5.98 7.75 10.8075 2.25 17 0.4376 0.6101127 0.5018538 0.6455465
WILSON BAYLY HOLMES - OVCON LTD 113 2009 -0.1301561 -0.0396914 3.01 3.87 3.96 7.8508333 2.79 18 0.3157 0.1777775 0.3089227 0.1341723
WILSON BAYLY HOLMES - OVCON LTD 113 2010 0.1024939 0.0287723 2.32 3.4 5.34 6.42 2.37 19 0.4168 -0.0169497 0.1713758 -0.0950681
WINHOLD LTD 114 2001 0.2631579 0.3690782 1.69 1.52 1.1 9.6766667 8.33 41 -5.0897 0.3370993 0.8473371 0.0757809
WINHOLD LTD 114 2002 0.375 0.8919757 1.75 2 1.85 11.1625 4.89 42 -16.3789 0.0711677 0.062632 0.0774988
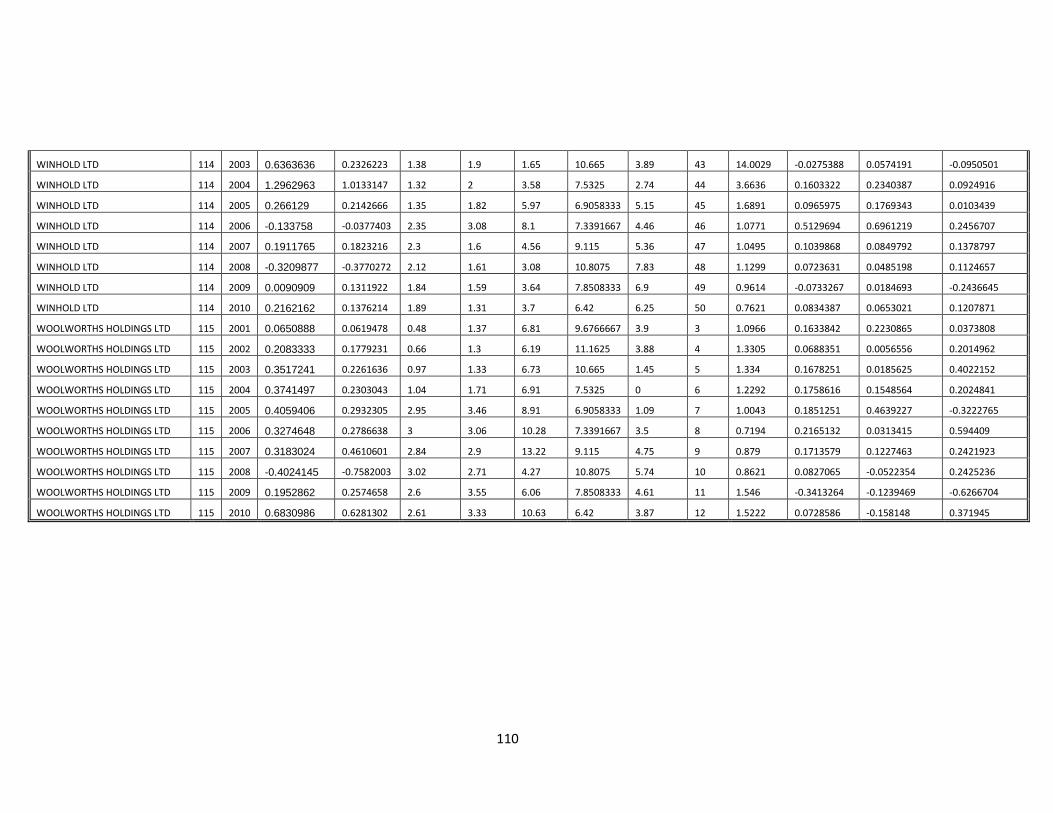
110
WINHOLD LTD 114 2003 0.6363636 0.2326223 1.38 1.9 1.65 10.665 3.89 43 14.0029 -0.0275388 0.0574191 -0.0950501
WINHOLD LTD 114 2004 1.2962963 1.0133147 1.32 2 3.58 7.5325 2.74 44 3.6636 0.1603322 0.2340387 0.0924916
WINHOLD LTD 114 2005 0.266129 0.2142666 1.35 1.82 5.97 6.9058333 5.15 45 1.6891 0.0965975 0.1769343 0.0103439
WINHOLD LTD 114 2006 -0.133758 -0.0377403 2.35 3.08 8.1 7.3391667 4.46 46 1.0771 0.5129694 0.6961219 0.2456707
WINHOLD LTD 114 2007 0.1911765 0.1823216 2.3 1.6 4.56 9.115 5.36 47 1.0495 0.1039868 0.0849792 0.1378797
WINHOLD LTD 114 2008 -0.3209877 -0.3770272 2.12 1.61 3.08 10.8075 7.83 48 1.1299 0.0723631 0.0485198 0.1124657
WINHOLD LTD 114 2009 0.0090909 0.1311922 1.84 1.59 3.64 7.8508333 6.9 49 0.9614 -0.0733267 0.0184693 -0.2436645
WINHOLD LTD 114 2010 0.2162162 0.1376214 1.89 1.31 3.7 6.42 6.25 50 0.7621 0.0834387 0.0653021 0.1207871
WOOLWORTHS HOLDINGS LTD 115 2001 0.0650888 0.0619478 0.48 1.37 6.81 9.6766667 3.9 3 1.0966 0.1633842 0.2230865 0.0373808
WOOLWORTHS HOLDINGS LTD 115 2002 0.2083333 0.1779231 0.66 1.3 6.19 11.1625 3.88 4 1.3305 0.0688351 0.0056556 0.2014962
WOOLWORTHS HOLDINGS LTD 115 2003 0.3517241 0.2261636 0.97 1.33 6.73 10.665 1.45 5 1.334 0.1678251 0.0185625 0.4022152
WOOLWORTHS HOLDINGS LTD 115 2004 0.3741497 0.2303043 1.04 1.71 6.91 7.5325 0 6 1.2292 0.1758616 0.1548564 0.2024841
WOOLWORTHS HOLDINGS LTD 115 2005 0.4059406 0.2932305 2.95 3.46 8.91 6.9058333 1.09 7 1.0043 0.1851251 0.4639227 -0.3222765
WOOLWORTHS HOLDINGS LTD 115 2006 0.3274648 0.2786638 3 3.06 10.28 7.3391667 3.5 8 0.7194 0.2165132 0.0313415 0.594409
WOOLWORTHS HOLDINGS LTD 115 2007 0.3183024 0.4610601 2.84 2.9 13.22 9.115 4.75 9 0.879 0.1713579 0.1227463 0.2421923
WOOLWORTHS HOLDINGS LTD 115 2008 -0.4024145 -0.7582003 3.02 2.71 4.27 10.8075 5.74 10 0.8621 0.0827065 -0.0522354 0.2425236
WOOLWORTHS HOLDINGS LTD 115 2009 0.1952862 0.2574658 2.6 3.55 6.06 7.8508333 4.61 11 1.546 -0.3413264 -0.1239469 -0.6266704
WOOLWORTHS HOLDINGS LTD 115 2010 0.6830986 0.6281302 2.61 3.33 10.63 6.42 3.87 12 1.5222 0.0728586 -0.158148 0.371945