Leverage Analysis - Lucknow University
22
Leverage Analysis By: Dr. Vijay Shankar Pandey Assistant Professor IMS-New Campus University of Lucknow, Lucknow
-
Upload
khangminh22 -
Category
Documents
-
view
6 -
download
0
Transcript of Leverage Analysis - Lucknow University
Leverage Analysis
By:
Dr. Vijay Shankar Pandey
Assistant Professor
IMS-New Campus
University of Lucknow, Lucknow
Leverage have different meaning in different subjects such as;
In Mechanics leverage means a instrument that helps us in
lifting heavy objects, which may not be otherwise possible.
In financial management, the firm’s ability to use fixed cost
funds to magnify the return of its owners.
The term leverage, in general, refers to a relationship between
two interrelated variables. With reference to a business firm,
these variables may be costs, output, sales revenue, EBIT,
Earnings Per share (EPS) etc.
The leverage may be defined as the % change in one variable
divided by the % change in some other variable or variables.
The leverage analysis thus, reflects as to how responsiveness is
the dependent variable to a change in the independent variables.
Leverage Analysis: An Introduction
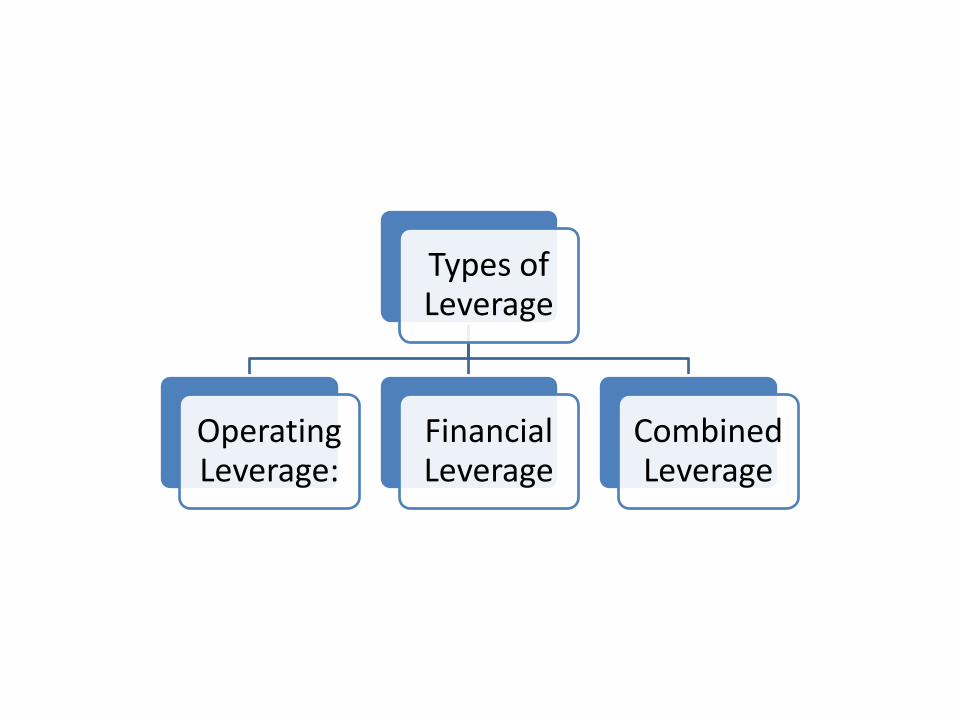
Types of Leverage
Operating Leverage:
Financial Leverage
Combined Leverage
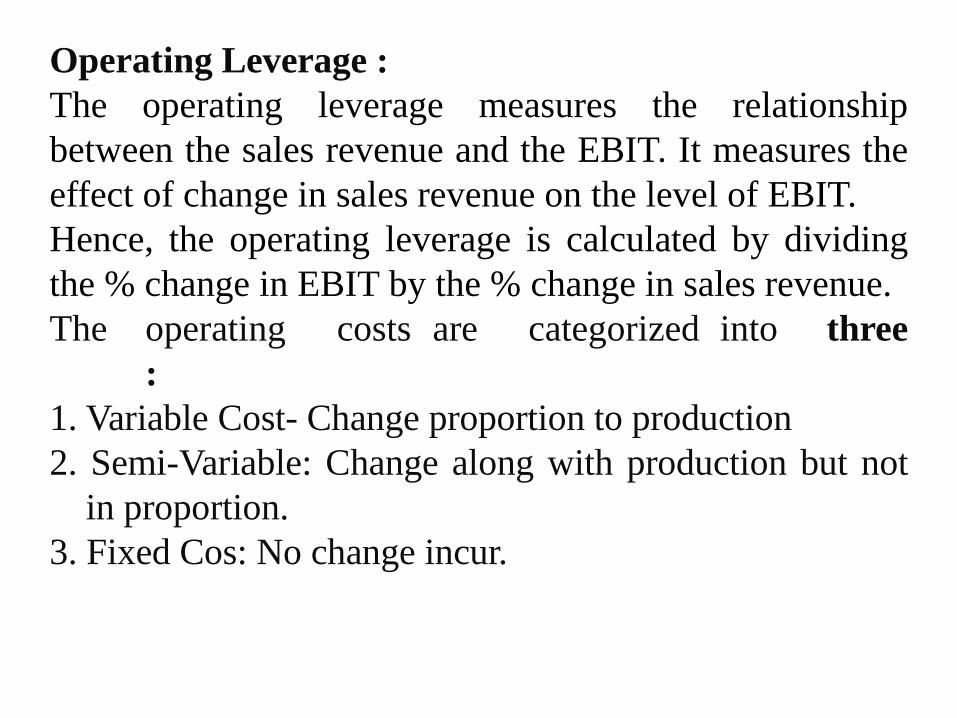
Operating Leverage :
The operating leverage measures the relationship
between the sales revenue and the EBIT. It measures the
effect of change in sales revenue on the level of EBIT.
Hence, the operating leverage is calculated by dividing
the % change in EBIT by the % change in sales revenue.
The operating costs are categorized into three
:
1. Variable Cost- Change proportion to production
2. Semi-Variable: Change along with production but not
in proportion.
3. Fixed Cos: No change incur.
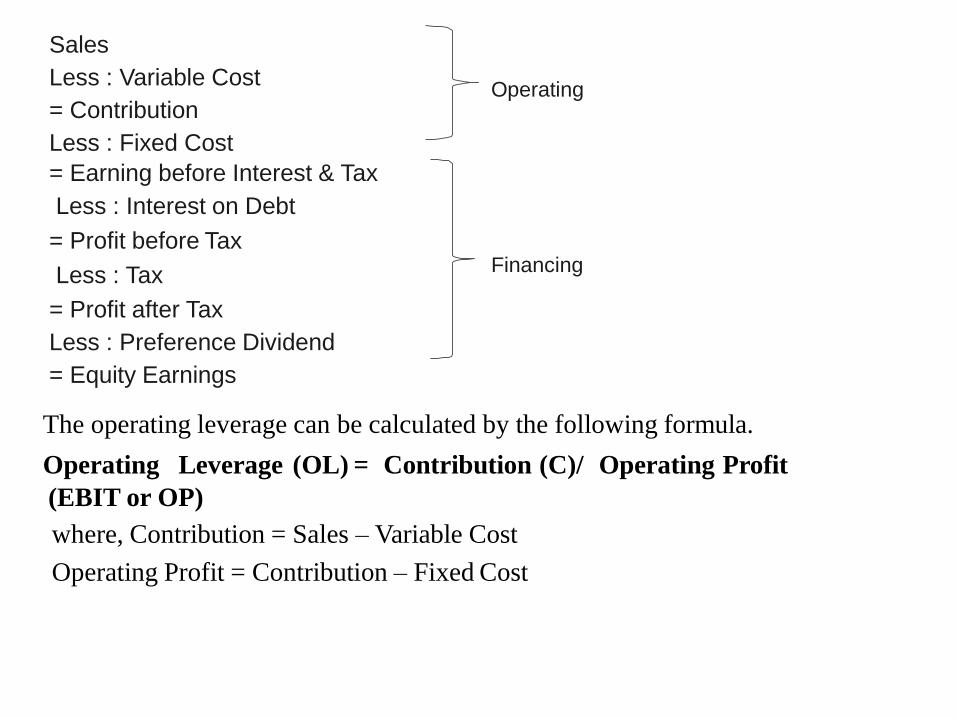
The operating leverage can be calculated by the following formula.
Operating Leverage (OL) = Contribution (C)/ Operating Profit
(EBIT or OP)
where, Contribution = Sales – Variable Cost
Operating Profit = Contribution – Fixed Cost
Sales
Less : Variable Cost
= Contribution
Less : Fixed Cost
= Earning before Interest & Tax
Less : Interest on Debt
= Profit before Tax
Less : Tax
= Profit after Tax
Less : Preference Dividend
= Equity Earnings
Operating
Financing
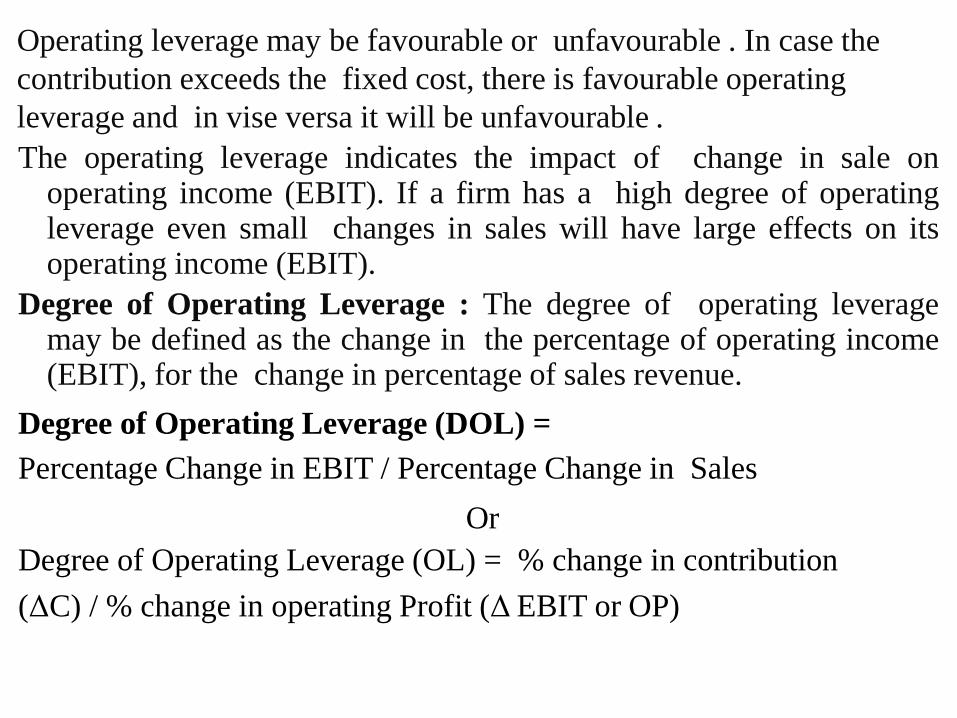
Operating leverage may be favourable or unfavourable . In case the
contribution exceeds the fixed cost, there is favourable operating
leverage and in vise versa it will be unfavourable .
The operating leverage indicates the impact of change in sale on operating income (EBIT). If a firm has a high degree of operating leverage even small changes in sales will have large effects on its operating income (EBIT).
Degree of Operating Leverage : The degree of operating leverage may be defined as the change in the percentage of operating income (EBIT), for the change in percentage of sales revenue.
Degree of Operating Leverage (DOL) =
Percentage Change in EBIT / Percentage Change in Sales
Or
Degree of Operating Leverage (OL) = % change in contribution
(ΔC) / % change in operating Profit (Δ EBIT or OP)
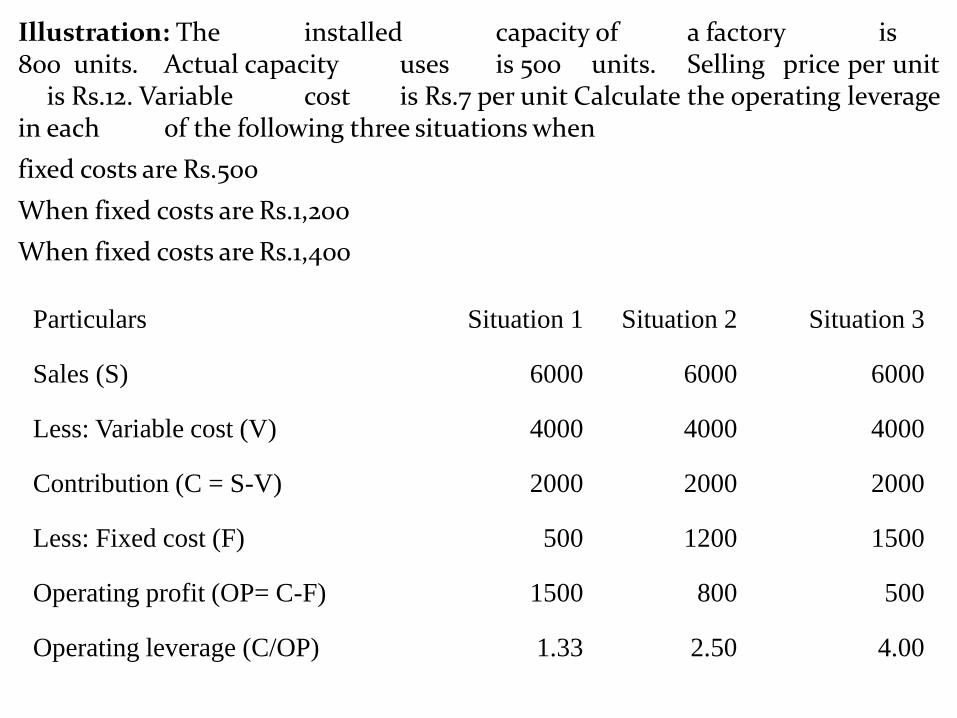
Illustration: The installed capacity of a factory is 800 units. Actual capacity uses is 500 units. Selling price per unit is Rs.12. Variable cost is Rs.7 per unit Calculate the operating leverage in each of the following three situations when
fixed costs are Rs.500
When fixed costs are Rs.1,200
When fixed costs are Rs.1,400
Particulars Situation 1 Situation 2 Situation 3
Sales (S) 6000 6000 6000
Less: Variable cost (V) 4000 4000 4000
Contribution (C = S-V) 2000 2000 2000
Less: Fixed cost (F) 500 1200 1500
Operating profit (OP= C-F) 1500 800 500
Operating leverage (C/OP) 1.33 2.50 4.00
We conclude that the degree of operating leverage increases with every increase in share of fixed cost in the total cost structure of the firm. It shows for e.g., in situation 3 that if sales increase by one percent, the profit would increase by 4%. This can be verified by placing suitable figure in situation 3 suppose sales is Rs.12,000 i.e., 100% increase than the operating profit will be Rs.2,500 which is increased by 400%.
Financial Leverage : Using various component of capital in composite called capital structure. The use of fixed charges, sources of funds such as debt and preference share capital along with the equity share capital in capital structure is called financial leverage. It is also known as trading on equity. According to Lawrence, financial leverage is the ability of the firm to use fixed financial charges to magnify the effects of changes in EBIT on the firm’s earnings per share. The fixed charges do not vary with firm’s EBIT. They must be paid regardless of the amount of EBIT.
The Financial leverage can be calculated by the following formula.
Financial Leverage =
EBIT or Operating Profit / EBT or taxable income
Degree of Financial Leverage (DFL) =
Percentage Change in EPS / Percentage Change in EBIT
A financial leverage may be favourable or unfavourable. Favourable leverage occurs when the firm earns more on the assets purchased with the funds, than the fixed cost of their use and vice versa. High degree of financial leverage leads to high financial risk. The financial risk refers to the risk of the firm not being able to cover its fixed financial charges.
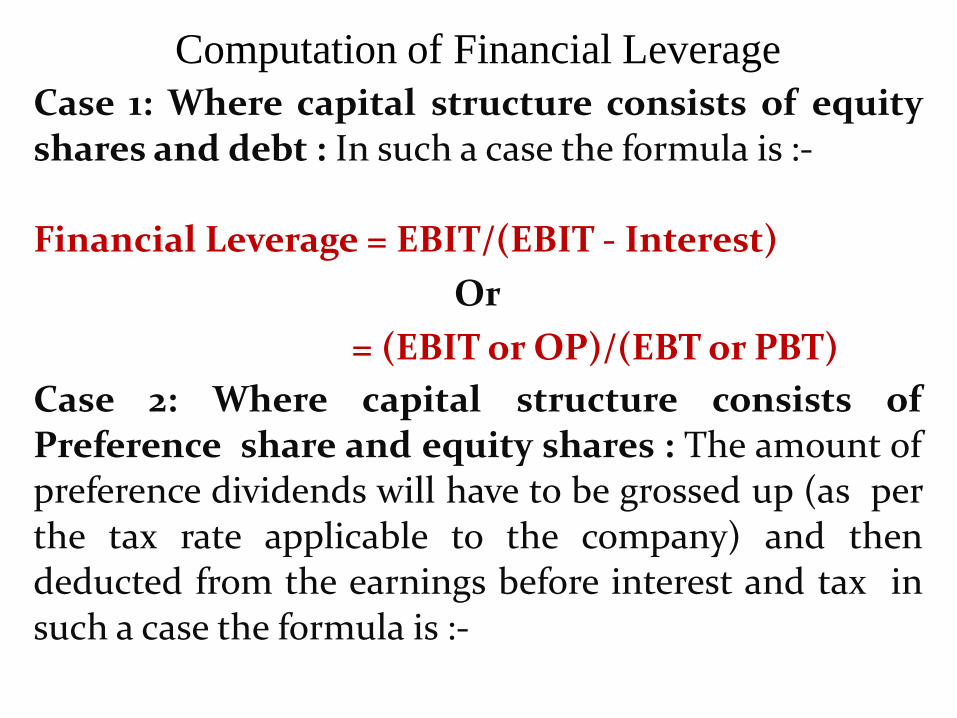
Computation of Financial Leverage
Case 1: Where capital structure consists of equity shares and debt : In such a case the formula is :- Financial Leverage = EBIT/(EBIT - Interest)
Or
= (EBIT or OP)/(EBT or PBT)
Case 2: Where capital structure consists of Preference share and equity shares : The amount of preference dividends will have to be grossed up (as per the tax rate applicable to the company) and then deducted from the earnings before interest and tax in such a case the formula is :-
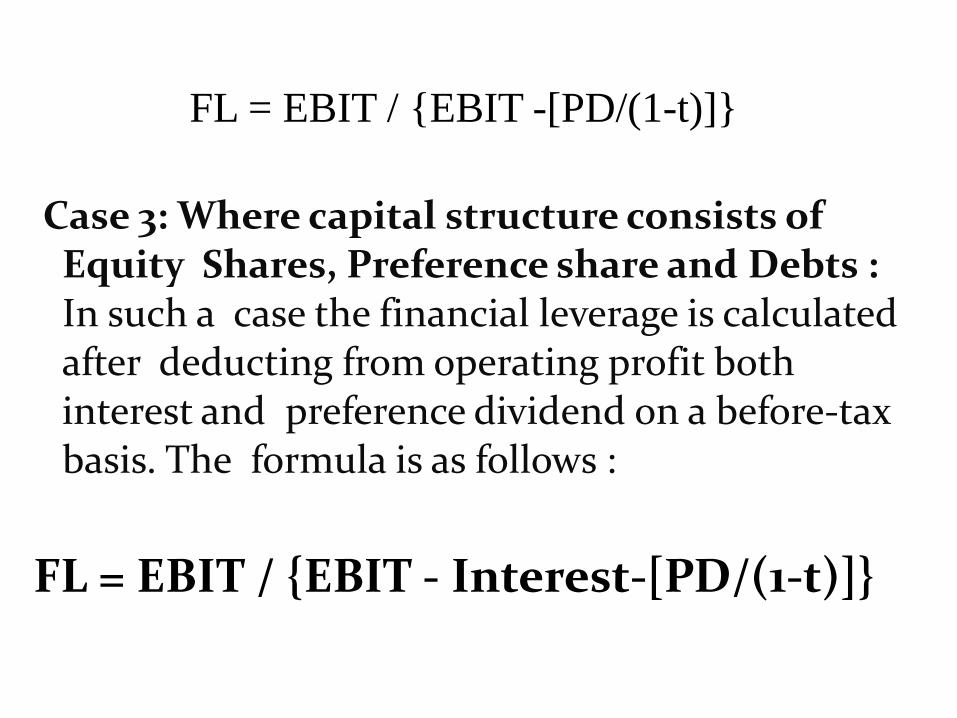
FL = EBIT / {EBIT -[PD/(1-t)]}
Case 3: Where capital structure consists of Equity Shares, Preference share and Debts : In such a case the financial leverage is calculated after deducting from operating profit both interest and preference dividend on a before-tax basis. The formula is as follows :
FL = EBIT / {EBIT - Interest-[PD/(1-t)]}
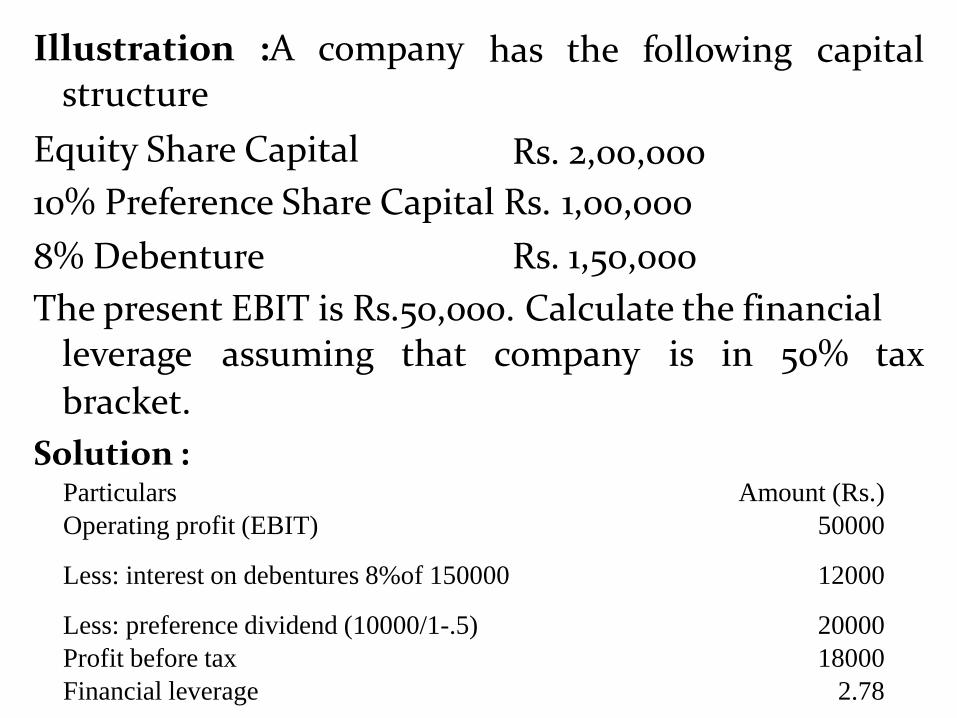
Illustration :A company structure
Equity Share Capital
has the following capital
Rs. 2,00,000
10% Preference Share Capital Rs. 1,00,000
8% Debenture Rs. 1,50,000
The present EBIT is Rs.50,000. Calculate the financial leverage assuming that company is in 50% tax
bracket.
Solution : Particulars Amount (Rs.)
Operating profit (EBIT) 50000
Less: interest on debentures 8%of 150000 12000
Less: preference dividend (10000/1-.5) 20000
Profit before tax 18000
Financial leverage 2.78
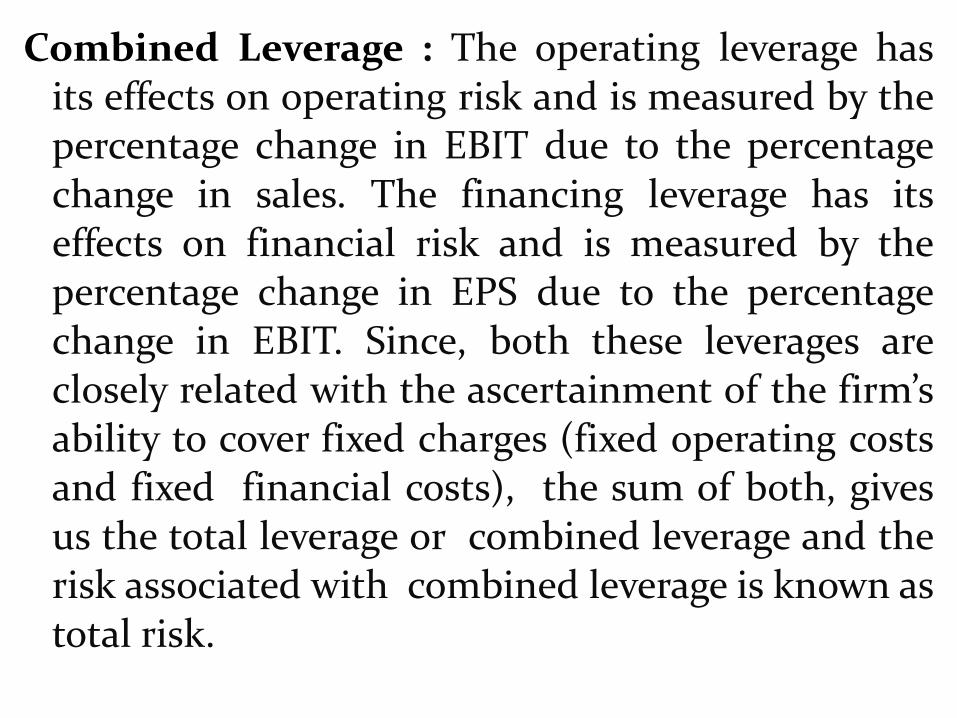
Combined Leverage : The operating leverage has its effects on operating risk and is measured by the percentage change in EBIT due to the percentage change in sales. The financing leverage has its effects on financial risk and is measured by the percentage change in EPS due to the percentage change in EBIT. Since, both these leverages are closely related with the ascertainment of the firm’s ability to cover fixed charges (fixed operating costs and fixed financial costs), the sum of both, gives us the total leverage or combined leverage and the risk associated with combined leverage is known as total risk.
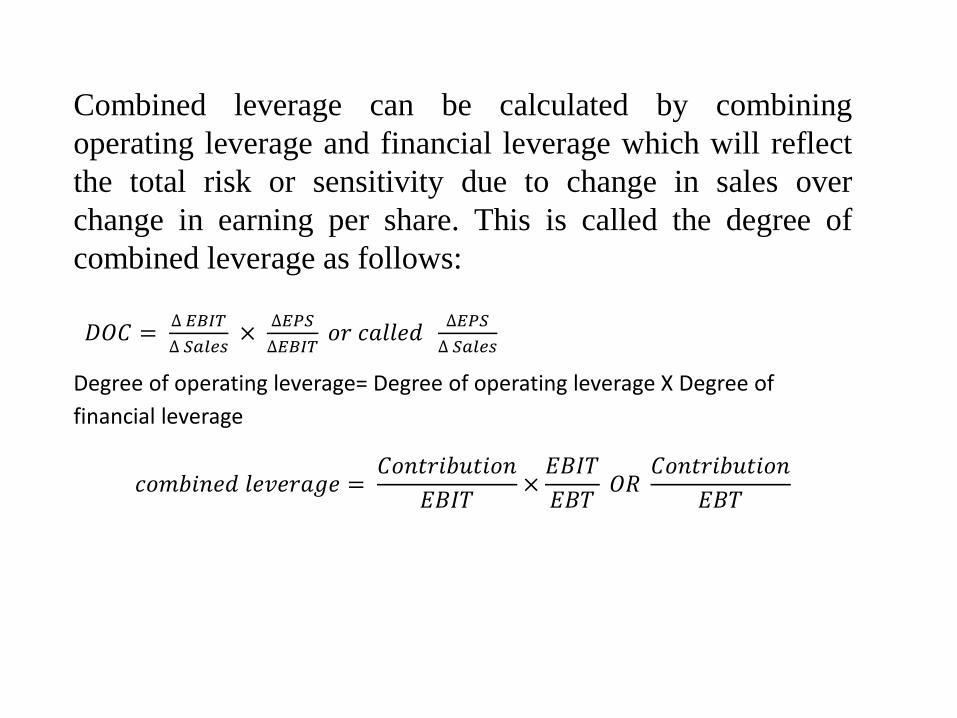
Combined leverage can be calculated by combining
operating leverage and financial leverage which will reflect
the total risk or sensitivity due to change in sales over
change in earning per share. This is called the degree of
combined leverage as follows:
𝐷𝑂𝐶 = ∆ 𝐸𝐵𝐼𝑇
∆ 𝑆𝑎𝑙𝑒𝑠 ×
∆𝐸𝑃𝑆
∆𝐸𝐵𝐼𝑇 𝑜𝑟 𝑐𝑎𝑙𝑙𝑒𝑑
∆𝐸𝑃𝑆
∆ 𝑆𝑎𝑙𝑒𝑠
Degree of operating leverage= Degree of operating leverage X Degree of
financial leverage
𝑐𝑜𝑚𝑏𝑖𝑛𝑒𝑑 𝑙𝑒𝑣𝑒𝑟𝑎𝑔𝑒 = 𝐶𝑜𝑛𝑡𝑟𝑖𝑏𝑢𝑡𝑖𝑜𝑛
𝐸𝐵𝐼𝑇×
𝐸𝐵𝐼𝑇
𝐸𝐵𝑇 𝑂𝑅
𝐶𝑜𝑛𝑡𝑟𝑖𝑏𝑢𝑡𝑖𝑜𝑛
𝐸𝐵𝑇
EBIT- EPS Analysis
EBIT – EPS analysis is an important tool used to optimize the
capital structure for highest earnings for shareholders
It helps in understanding the sensitivity of EPS at given
level of Earning before Interest & Tax under different sources
of financing
It helps in analyzing how capital structure decision is
important to raise the value of firm
An optimal financing structure minimizes the cost of capital
and maximizes the earnings
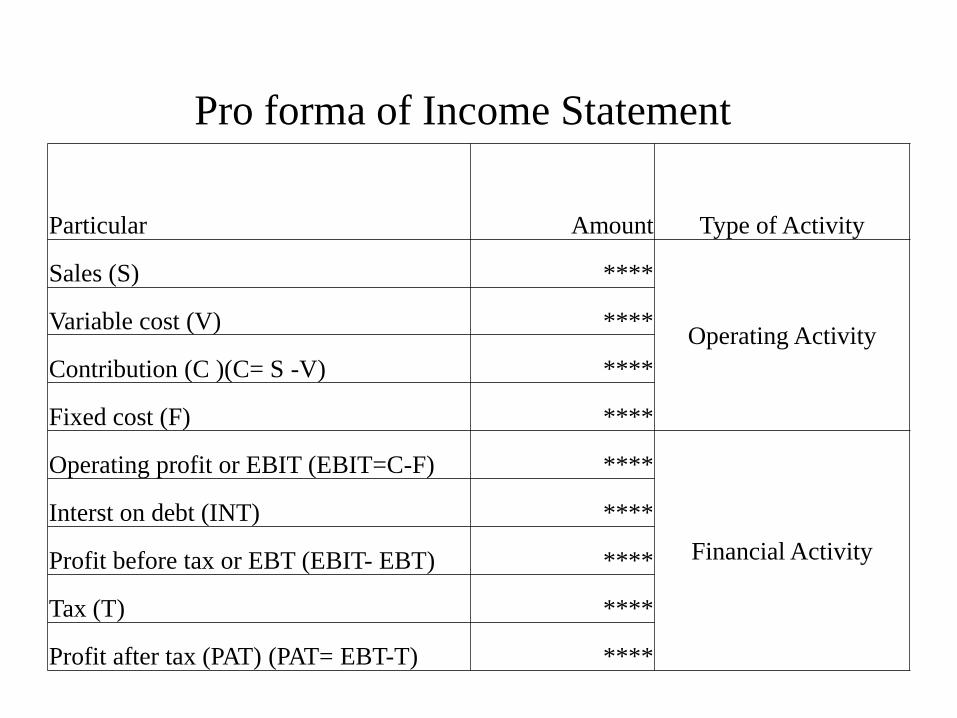
Pro forma of Income Statement
Particular Amount Type of Activity
Sales (S) ****
Operating Activity Variable cost (V) ****
Contribution (C )(C= S -V) ****
Fixed cost (F) ****
Operating profit or EBIT (EBIT=C-F) ****
Financial Activity
Interst on debt (INT) ****
Profit before tax or EBT (EBIT- EBT) ****
Tax (T) ****
Profit after tax (PAT) (PAT= EBT-T) ****
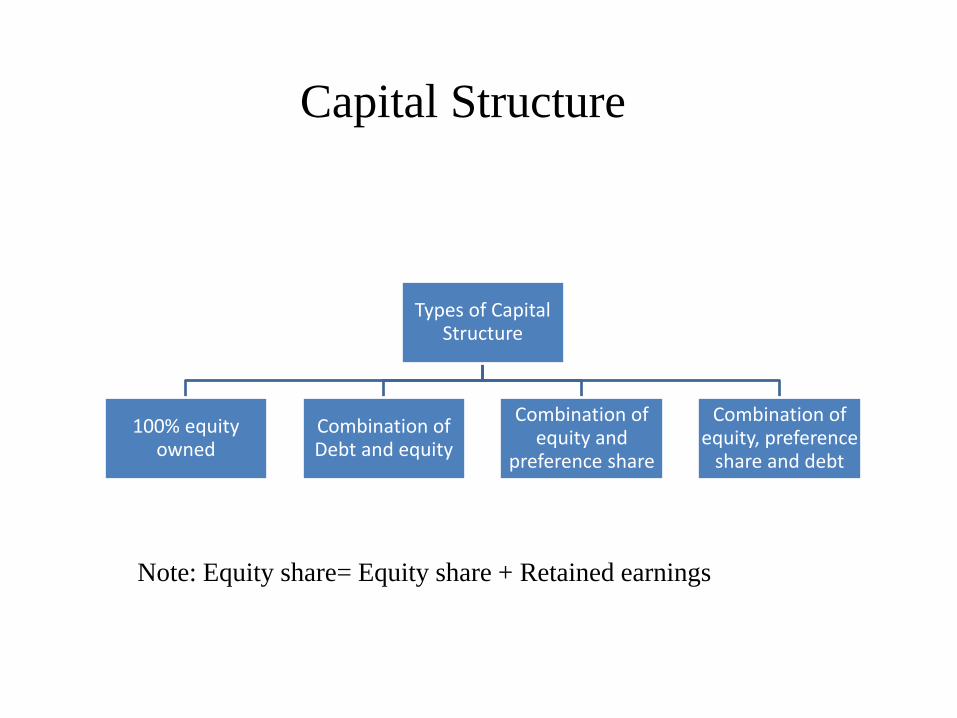
Capital Structure
Types of Capital Structure
100% equity owned
Combination of Debt and equity
Combination of equity and
preference share
Combination of equity, preference
share and debt
Note: Equity share= Equity share + Retained earnings
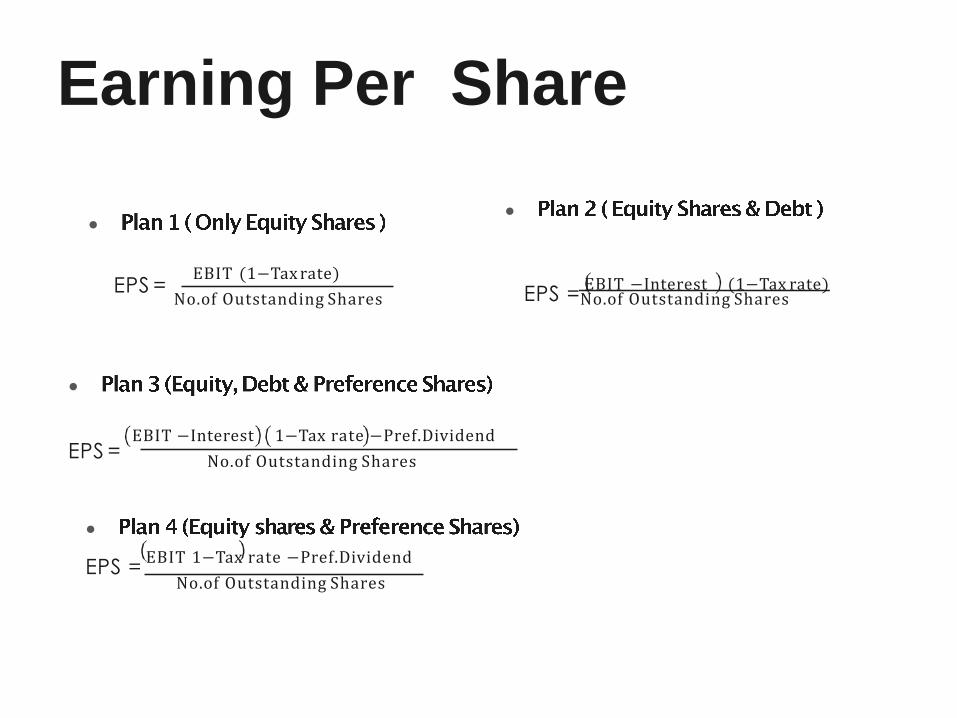
Earning Per Share
●
EPS = EBIT (1−Tax rate)
No.of Outstanding Shares
●
EPS = EBIT −Interest (1−Tax rate) No.of Outstanding Shares
●
EPS = EBIT −Interest 1−Tax rate −Pref.Dividend
No.of Outstanding Shares
●
EPS = EBIT 1−Tax rate −Pref.Dividend
No.of Outstanding Shares
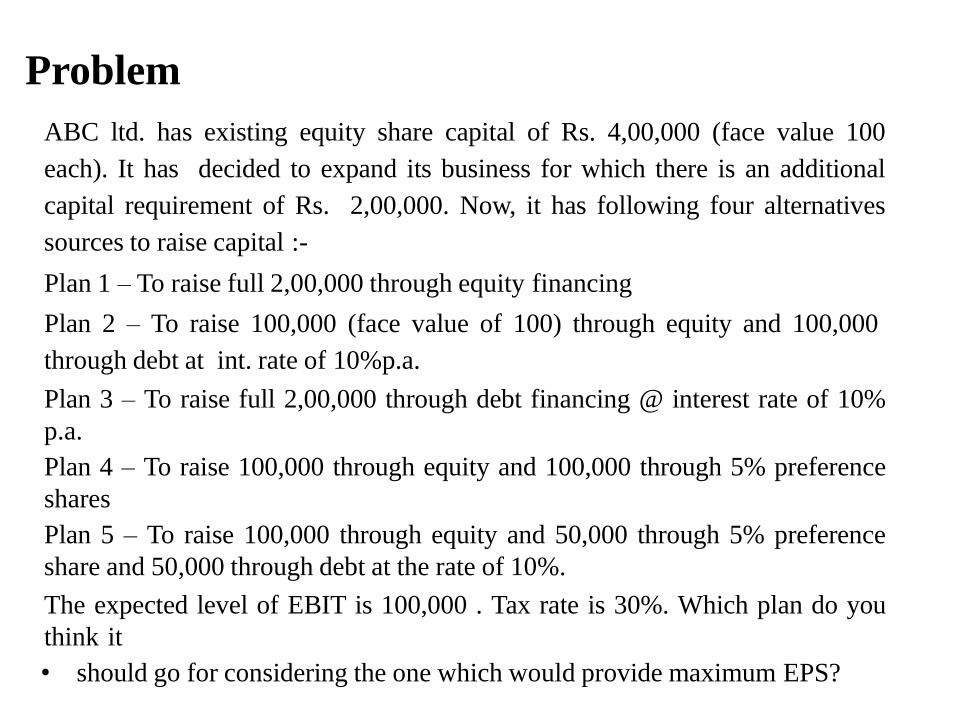
Problem
ABC ltd. has existing equity share capital of Rs. 4,00,000 (face value 100
each). It has decided to expand its business for which there is an additional
capital requirement of Rs. 2,00,000. Now, it has following four alternatives
sources to raise capital :-
Plan 1 – To raise full 2,00,000 through equity financing
Plan 2 – To raise 100,000 (face value of 100) through equity and 100,000
through debt at int. rate of 10%p.a.
Plan 3 – To raise full 2,00,000 through debt financing @ interest rate of 10%
p.a.
Plan 4 – To raise 100,000 through equity and 100,000 through 5% preference
shares
Plan 5 – To raise 100,000 through equity and 50,000 through 5% preference
share and 50,000 through debt at the rate of 10%.
The expected level of EBIT is 100,000 . Tax rate is 30%. Which plan do you
think it
• should go for considering the one which would provide maximum EPS?
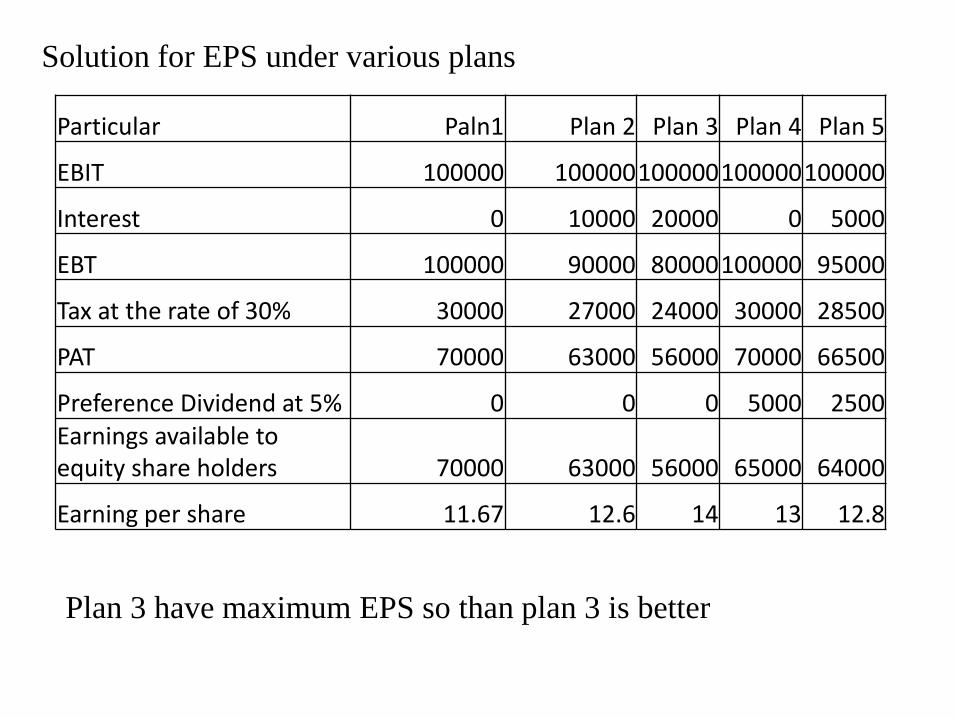
Particular Paln1 Plan 2 Plan 3 Plan 4 Plan 5
EBIT 100000 100000 100000 100000 100000
Interest 0 10000 20000 0 5000
EBT 100000 90000 80000 100000 95000
Tax at the rate of 30% 30000 27000 24000 30000 28500
PAT 70000 63000 56000 70000 66500
Preference Dividend at 5% 0 0 0 5000 2500
Earnings available to equity share holders 70000 63000 56000 65000 64000
Earning per share 11.67 12.6 14 13 12.8
Solution for EPS under various plans
Plan 3 have maximum EPS so than plan 3 is better
References: Financial Management: Principles and Applications, by Keown, J. and
Martin, John D., Published by Pearson, 13th edition, Copyright ©
2018.
Financial management, by I.M. Pandey, Vikas Publication..
Financial management, by M.Y. Khan and P.K. Jain, TMH.
Financial management, theory and practice, by Prasanna Chandra,
TMH.
Financial management and policy, by J.C. Vanhorne, PTH