impact of financial leverage on profitability in case of ongc ltd
44
Volume: II, Issue: I ISSN: 2581-5830 GAP GYAN - An International Peer-Reviewed Open Access Journal of Social Sciences SPECIAL ISSUE ON KNOWLEDGE SOCIETY AND HIGHER EDUCATION MARCH - 2019 https://www.gapjournals.org/ 170 IMPACT OF FINANCIAL LEVERAGE ON PROFITABILITY IN CASE OF ONGC LTD CA Haresh Kothari Former Director & Professor, and Head-Centre of Excellence for GST Symbiosis University of Applied Sciences, Indore Abstract Financial Management basically deals with raising of financial resources and its proper allocation in order to maximize shareholders wealth. For a successful running of an organization fixed and current assets play a crucial role as organization generally invests in these options. A firm's working capital consists of its investments in short-term assets like cash and bank balance, inventories, receivable and short term investments. Therefore, the working capital management mainly refers to the management of all these individual current assets. In this research paper an attempt has been made to study the components of financial leverage and the possible implications of financial leverage on profitability of ONGC Limited. The paper also attempts to analyse the correlation between liquidity, profitability and return on investments of ONGC. The study is based on secondary data collected from annual reports of ONGC for the period 2013-14 to 2017-18. In this paper there is an application of correlation and regression analysis to identify the significant impact of financial leverage on the profitability. Financial leverage is essential as it might have a direct impact on profitability and liquidity. Keywords : Financial Leverage, Liquidity, ONGC, Profitability INTRODUCTION Financial leverage is a measure of how much firms use equity and debt to finance its assets. A company can finance its investments by debt and equity. The company may also use preference capital. The rate of interest on debt is fixed irrespective of the company’s rate of return on assets. The financial leverage employed by a company is intended to earn more on the fixed charges funds than their costs. As debt increases, financial leverage increases. It has been seen in different studies that financial leverage has effect on corporate performance of quoted pharmaceutical companies in Nigeria. The primary motive of a company in using financial leverage is to magnify the shareholders’ return under favourable economic conditions. The role of financial leverage in magnifying the return of the shareholders’ is based on the assumptions that the fixed-charges funds (such as the loan from financial institutions and other sources or debentures) can be obtained at a cost lower than the firm’s rate of return on net assets (RONA or ROI). Damouri, et al (2013) states that leverage ratios contribute in measuring the risk of using equity costs. They adds that there are various measures known for the capital structure among which the most important are book value based measures, market value based measures and semi- market value based measures (adjusted market value). Financial leverage affects profit after tax or earnings per share. The combined effect of two leverages can be quite significant for the earnings available to ordinary shareholders (Pandey, 2010). OBJECTIVES OF THE STUDY To study relationship between financial leverage and Profitability of the ONGC Ltd. To study relationship between liquidity and profitability of the ONGC Ltd.
-
Upload
khangminh22 -
Category
Documents
-
view
5 -
download
0
Transcript of impact of financial leverage on profitability in case of ongc ltd

Volume: II, Issue: I ISSN: 2581-5830
GAP GYAN - An International Peer-Reviewed Open Access Journal of Social Sciences
SPECIAL ISSUE ON KNOWLEDGE SOCIETY AND HIGHER EDUCATION MARCH - 2019
https://www.gapjournals.org/
170
IMPACT OF FINANCIAL LEVERAGE ON PROFITABILITY IN CASE OF ONGC LTD
CA Haresh Kothari Former Director & Professor, and Head-Centre of Excellence for GST
Symbiosis University of Applied Sciences, Indore
Abstract Financial Management basically deals with raising of financial resources and its proper allocation in order to maximize shareholders wealth. For a successful running of an organization fixed and current assets play a crucial role as organization generally invests in these options. A firm's working capital consists of its investments in short-term assets like cash and bank balance, inventories, receivable and short term investments. Therefore, the working capital management mainly refers to the management of all these individual current assets. In this research paper an attempt has been made to study the components of financial leverage and the possible implications of financial leverage on profitability of ONGC Limited. The paper also attempts to analyse the correlation between liquidity, profitability and return on investments of ONGC. The study is based on secondary data collected from annual reports of ONGC for the period 2013-14 to 2017-18. In this paper there is an application of correlation and regression analysis to identify the significant impact of financial leverage on the profitability. Financial leverage is essential as it might have a direct impact on profitability and liquidity.
Keywords : Financial Leverage, Liquidity, ONGC, Profitability INTRODUCTION Financial leverage is a measure of how much firms use equity and debt to finance its assets. A company can finance its investments by debt and equity. The company may also use preference capital. The rate of interest on debt is fixed irrespective of the company’s rate of return on assets. The financial leverage employed by a company is intended to earn more on the fixed charges funds than their costs. As debt increases, financial leverage increases. It has been seen in different studies that financial leverage has effect on corporate performance of quoted pharmaceutical companies in Nigeria. The primary motive of a company in using financial leverage is to magnify the shareholders’ return under favourable economic conditions. The role of financial leverage in magnifying the return of the shareholders’ is based on the assumptions that the fixed-charges funds (such as the loan from financial institutions and other sources or debentures) can be obtained at a cost lower than the firm’s rate of return on net assets (RONA or ROI). Damouri, et al (2013) states that leverage ratios contribute in measuring the risk of using equity costs. They adds that there are various measures known for the capital structure among which the most important are book value based measures, market value based measures and semi- market value based measures (adjusted market value). Financial leverage affects profit after tax or earnings per share. The combined effect of two leverages can be quite significant for the earnings available to ordinary shareholders (Pandey, 2010). OBJECTIVES OF THE STUDY
To study relationship between financial leverage and Profitability of the ONGC Ltd. To study relationship between liquidity and profitability of the ONGC Ltd.

Volume: II, Issue: I ISSN: 2581-5830
GAP GYAN - An International Peer-Reviewed Open Access Journal of Social Sciences
SPECIAL ISSUE ON KNOWLEDGE SOCIETY AND HIGHER EDUCATION MARCH - 2019
https://www.gapjournals.org/
171
LITERATURE REVIEW Akhtar, et al (2012) examines the relationship between financial leverage and financial performance, evidence from fuel and energy sector of Pakistan. The result shows that there is a general perception that a relationship exists between the financial leverage and the performance of the companies’ i.e most of the financial performance indicators have positive relationship with debt to equity ratio while the gearing ratio indicates negative relationships with the leverage indicators. The result adds that gearing ratio may differ from that of debt to equity ratio while debt equity ratio takes into account the long term debt. Rehman (2013) studies the relationship between financial leverage and financial performance in listed sugar companies of Pakistan. The results shows positive relationship of debt equity ratio with return on asset and sales growth, and negative relationship of debt equity ratio with earning per share, net profit margin and return on equity. This negative relationship between debt equity ratio and earnings per share (EPS) support the fact that as debt increases, the interest payment will also rises, so EPS will decrease. Akinmulegun (2012) examines the effect of financial leverage on selected indicators of corporate performance in Nigeria. This shows that financial leverage significantly affects corporate performance in Nigeria. Rajin (2012) investigates the influence of financial leverage on shareholders return and market capitalization, evidence of telecommunication sector companies in India. He find out that the nature of relationship and the state of influence of the financial leverage on shareholder’s return and market capitalization individually indicates positive relationship between financial leverage and shareholder return but negative relationship between financial leverage and market capitalization. Ujah and Brusa (2013) suggested that financial leverage and cash flow impact the degrees to which firms manage their earnings. Obradovich and Gill (2013) indicates that larger board size negatively impacts the value of American firms and CEO duality, audit committee, financial leverage, firm size, return on assets and insider holdings positively impact the value of American firms. Pandey (2010) says that the variance and covariance and therefore beta depend on three fundamental factors such as; the nature of business, the operating leverage and financial leverage. Nasrollah et al (2013) studies effect of financial leverage and investment diversification on income- increasing earning management. The results show that financial leverage coefficient is meaningful at level of 95% of confidence, consequently, it can be concluded that financial leverage has an influence on income-increasing earnings management. Enuju and Soocheong (2005) examine the effect of financial leverage on profitability and risk of Restaurant firms. They find that financial leverage does not influence the restaurant firms’ profitability. It is noteworthy that the sign of financial leverage is positive meaning that more leveraged firms had more profits on average even though it was not statistically significant. Nazir and Saita (2013) studies financial leverage and agency cost, an empirical evidence of Pakistan. The study found out that general and admin expense ratio to sales ratio is negatively related to all four leverage ratios. Taani (2012) investigates impact of working capital management policy and financial leverage on financial performance. The study shows that firm’s working capital management policy, financial leverage and firm size have significant relation to net income and also no significant impact on return on equity (ROE) and return on Assets (ROA).

Volume: II, Issue: I ISSN: 2581-5830
GAP GYAN - An International Peer-Reviewed Open Access Journal of Social Sciences
SPECIAL ISSUE ON KNOWLEDGE SOCIETY AND HIGHER EDUCATION MARCH - 2019
https://www.gapjournals.org/
172
Akbarian (2013) examines the investigation effect of financial leverage and environment risk on performance firms of listed companies in Tehran stock exchange. The result shows that there is a negative relation between financial leverage and cash flow per share. It also indicates that financial leverage, market risk and economic risk with return of equity have positive significant relationship. Gleason, et al (2000) in their study of European countries, found a significant negative relationship between the financial leverage and return on assets and profit margin. Deesomsak (2004) in Malaysia also found a negative relationship between financial leverage and net profit margin. Huang and Song (2004) studies on Chinese companies found a negative relationship between long-term debt and return on assets, as well as between all the liability and return of assets. Berger and Bonaccorsi (2006) evidence that neither high level of financial leverage nor small capital of the company, are associated with higher efficiency of company’s financial performance. Rao et al. (2007) also confirmed the negative relationship between leverage and financial performance result. Jelinek (2007) examines the effect of financial leverage and free cash flow and firm growth on earnings management. The results indicate that firm experiencing an increase in financial leverage during a five year period gradually compared to those which had high leverage degree in the same period has performed less earnings management. Alcock, et al (2013) examines the role of financial leverage in the performance of private equity real Estate funds. The results indicates that funds overall are unable to deliver significant positive out performance on the basis of managerial skill that is unrelated to the exposure to the variation in the underlying market return. It also reveals that the impact of transaction costs, fees and other market frictions that are especially prevalent in the direct real estate investment industry, given the relatively low level of liquidity of the underlying assets. It further shows that excess fund return were approximately proportional to the excess market return, implying that these fund offers their investors effective exposure to the performance of the underlying property markets. RESEARCH METHODOLOGY SAMPLE SIZE For this study, researcher has selected ONGC Ltd to study the relationship between financial leverage and profitability, and liquidity and profitability. SOURCES OF DATA Secondary sources of data have been used for this study. Annual reports of ONGC Ltd have been analysed. RESEARCH PERIOD Last 5 years’ (2013-14 to 2017-18) annual reports of ONGC Ltd have been collected. DATA ANALYSIS TECHNIQUES Correlation matrix techniques has been used to study the relation between financial leverage and profitability, and liquidity and profitability of ONGC Ltd

Volume: II, Issue: I ISSN: 2581-5830
GAP GYAN - An International Peer-Reviewed Open Access Journal of Social Sciences
SPECIAL ISSUE ON KNOWLEDGE SOCIETY AND HIGHER EDUCATION MARCH - 2019
https://www.gapjournals.org/
173
DATA ANALYSIS CTS ACR DTR ITR WCTR CASR CATAR QR CR ROI DERCTS 1.000 -0.060 0.080 -0.200 0.920 -0.200 -0.240 -0.420 -0.270 -0.270 0.050ACR -0.060 1.000 -0.360 -0.100 0.000 -0.620 -0.680 0.550 0.390 -0.500 0.340DTR 0.080 -0.360 1.000 0.590 0.010 0.620 0.490 -0.390 -0.510 -0.070 0.520ITR -0.200 -0.100 0.590 1.000 -0.260 0.510 0.360 -0.280 -0.350 0.100 0.880WCTR 0.920 0.000 0.010 -0.260 1.000 -0.410 -0.380 -0.260 -0.300 -0.180 0.420CASR -0.200 -0.620 0.620 0.510 -0.410 1.000 0.910 -0.520 -0.540 0.290 0.110CATAR -0.240 -0.680 0.490 0.360 -0.380 0.910 1.000 -0.560 -0.560 0.550 0.410QR -0.420 0.550 -0.390 -0.280 -0.260 -0.520 -0.560 1.000 0.440 -0.410 0.550CR -0.270 0.390 -0.510 -0.350 -0.300 -0.540 -0.560 0.440 1.000 -0.290 0.870ROI -0.270 -0.500 -0.070 0.100 -0.180 0.290 0.550 -0.410 -0.290 1.000 0.780DER 0.050 0.340 0.520 0.880 0.420 0.110 0.410 0.550 0.870 0.780 1.000
FINDINGS The analysis shows that there is a negative correlation between Return on Investment (ROI) on one hand and measures of Working Capital Management (WCM) like Current Ratio (-.290), Quick Ratio (-0.4105), Working capital turnover ratio (- 0.175), Debtors Turnover Ratio (-0.074), Absolute Cash Ratio (-0.500) and Cash to sales ratio (-0.273). This shows that with the increase in Current ratio, Quick ratio, Working capital turnover ratio, Debtors turnover ratio, Absolute cash ratio and Cash to sales ratio there is a negative impact i.e. there is a decrease in profitability and vice versa. Current Asset to Total assets Ratio (0.549), Current assets to sales ratio (0.285) and Inventory Turnover ratio (0.100) shows a positive relation with Return on Investment (ROI). This shows that with increase in CATAR, CASR and ITR there is an increase in profitability and vice versa. Through Correlation matrix table it is observed that there is a very high degree of correlation between CATAR and CASR (0.9118) and between WCTR and CTS (0.923). This high degree of correlation indicates that there is an existence of multiple correlation i.e. the existence of high correlation between the independent variables. Debt Equity ratio (DER) has high degree of correlation with Return on Investment (ROI). REGRESSION DEBT EQUITY RATIO AND RETURN ON INVESTMENT
Regression StatisticsMultiple R 0.78499 R Square 0.6162 Adjusted R Square 0.56823 Standard Error 3.8091 Observations 10 ANOVA df SS MS F
Significance F Regression 1 186.36 186.36 12.8443 0.00715 Residual 8 116.074 14.5092Total 9 302.434
Coefficients Standard Error
t Stat P-value Lower 95% Upper 95% Intercept 33.0407 4.87457 6.77819 0.00014 21.8 44.2815X Variable 1 -19.4 5.41302 -3.5839 0.00715 -31.882 -6.9172

Volume: II, Issue: I ISSN: 2581-5830
GAP GYAN - An International Peer-Reviewed Open Access Journal of Social Sciences
SPECIAL ISSUE ON KNOWLEDGE SOCIETY AND HIGHER EDUCATION MARCH - 2019
https://www.gapjournals.org/
174
INTERPRETATION Multiple R = 0.784, which indicates that there is linear relationship between Debt equity ratio vs return on investment. From the ANOVA table, it can be seen that p-value 0.007 which is less than specified α of 0.05. So null hypothesis is rejected and it concluded that there is impact of debt equity ratio on return on investment. CONCLUSION The study of correlation reveals both positive and negative coefficients. Out of nine ratios relating to working capital management selected during the period under study, in case of Current Ratio (-.290), Quick Ratio (-0.4105), Working capital turnover ratio (-0.175), Debtors Turnover Ratio (-0.074), Absolute Cash Ratio (-0.500) and Cash to sales ratio (-0.273) shows a negative association with the selected profitability ratio (ROI) and the remaining ratios Current Asset to Total assets Ratio (0.549), Current assets to sales ratio (0.285) and Inventory Turnover ratio (0.100) have a positive relation with profitability (ROI). The research paper shows that the debt equity ratio of the company has an impact on profitability. When there is an increase in debt equity ratio the profitability of the company decreases and vice versa. REFERENCES
Akbarian, S (2013). The investigation effect of financial leverage and Environment Risk on Performance firms of listed companies in tehran Stock Exchange 8(3): 249 - 255. Akhtar, S; Javed, B; Maryam, A and Sadia, H (2012). Relationship between financial leverage and financial performance: Eviden ce from fuel and energy sector of Pakistan European Journal of Business and Management 4(11): 7 - 17. Akinmulegun, S.O (2012). The effect of financial leverage on corporate performance of some selected companies in Nigeria Canadian Social Science 8(1): 85 - 91. Alocock, J; Baum, A; Colley, N and Steiner, E (2013). The role of financial leverage in the performance of private equity real estate funds The Journal of portfolio management: 99 - 110. Berger, A and Bonaccorsi, P.E (2006). Capital Structure and firm performance: A new approach to testing agency theory and an application to the banking industry Journal of Banking and Finance (30): 1065 - 1102. Damouri, D; Khanagha, J.B and Kaffash, M (2013). The relationship between changes in the financial leverage and the values of the Tehran listed firms. Deloof, M (2003). Does working Capital Management affect Profitability of Belgian firms? Journal of Business Finance and Accountancy 30(3) and (4). Ekwe, M.C and Duru, A.N (2012). Liquidity Management and Corporate profitability in Nigeria ESUT Journal of Accountancy 3(1): 22 - 28. Emekekwue, P.E (2008). Corporate Financial Management. 5th Revised ed; Kinshasha: African Bureau of Educational Sciences. Enekwe, C.I (2012). Financial ratio Analysis as a planning tool for corporate profitability: A study of selected qu oted pharmaceutical companies in Nigeria Unpublished M.Sc dissertation Department of Accountancy ESUT Enugu. Enuju, Y and Soocheong, J (2005). The effect of financial leverage on profitability and Risk of Restaurant firms Journal of Hospitality Financial Management 13(1): 1 - 18. Ezeamama, M.C (2010). Fundamentals of Financial Management: A practical guide. Enugu: Ema press Ltd. Falope, O and Ajilore, O.T (2009). Working Capital management and corporate profitability: Evidence from panel data analysis of selected quoted firms in Nigeria Research Journal of Business Management 3(3): 73 - 84. Houang, G and Song, F.S (2006). The Determinants of Capital structure: Evidence from China China Economic Review 14: 14 -36.

Volume: II, Issue: I ISSN: 2581-5830
GAP GYAN - An International Peer-Reviewed Open Access Journal of Social Sciences
SPECIAL ISSUE ON KNOWLEDGE SOCIETY AND HIGHER EDUCATION MARCH - 2019
https://www.gapjournals.org/
175
Jelinek, K (2007). The effect of leverage increases on earnings management Journal of Business and Economic Studies 13: 24 - 46. Karaduman, H.A ; Akbas, H.E; Caliskan, A.O and Durers (2011). The relationship between working capital management and profitability: Evidence from an emerging market International Research Journal of Finance and Economics 62: 61 - 67. Koutsoyianis, A (2003). Theory of Econometrics. 2nd ed; London: Palmgrave Publishers. Lazaridis, I and Tryfonidis, D (2006). Relationship between working capital management and profitability of listed companies in the Athens Stock Exchange Journal of Financial Management and Analysis 19(5): 26 - 35. Nasrollah, T, Mohammad, A.O and Seyed, H.S.E (2013). Effect of financial leverage and investment diversification on income -increasing Earnings management Middle-East Journal of Scientific Research 16(6): 836 - 844. Nazir, M.S and Saita, H.K (2013). Financial leverage and Agency Cost: An Empirical evidence of Pakistan International Journal of Innovative and Applied Finance 19: 1 - 16. Obradovich, J and Gill, A (2013). The impact of Corporate Governance and financial leverage on the value of American firms’ Faculty Publications and Presentations. Paper 25. Onwumere, J.U.J (2009). Business and Economic Research Methods. 2nd ed; Enugu: Vougasen Limited. Pandey, I.M (2010). Financial Management. 10th ed; New Delhi: Vikas publishing House PVT Ltd. Rajin, S (2012). Impact of Financial Leverage on Shareholders returns and market Capitalization: Empirical evidence of telecommunication sector Companies India International Journal of Reasearch in IT, Management and Engineering 2(12). Rehman, S.S (2013). Relationship between financial leverage and financial performance: Empir ical Evidence of listed sugar companies of Pakistan Global Journal of management and Business Research finance 13(8): 33 - 40. Shin, H and Soenen, L (2000). Liquidity management on profitability is there room for Both? AFP Exchange 20(2): 46 - 49. Singh, J.P and Pandey, S (2008). Impact of working Capital management in the profitability of Hindalco industries Limited The IUP Journal of financial Economics 6(4): 62 - 72. Taani, K (2012). Impact of working capital management policy and financial leverage on financial performance: Evidence from Amman Stock Exchange listed companies International Journal of management sciences and Business Research 1 (8): 10 - 17. Ugwuanyi, W (2004). Introduction to financial Analysis and Project Evaluation. Lagos: Johnken and willy Publications Nig. Ltd. Ujah, U and Brusa, O. (2012). The effect of financial leverage and cash flow volatility on Earnings management Texas A & M International University.

Volume: II, Issue: I ISSN: 2581-5830
GAP GYAN - An International Peer-Reviewed Open Access Journal of Social Sciences
SPECIAL ISSUE ON KNOWLEDGE SOCIETY AND HIGHER EDUCATION MARCH - 2019
https://www.gapjournals.org/
176
GST IN INDIA: POST IMPLEMENTATION ANALYSIS AND FINDINGS
CA Haresh Kothari Former Director & Professor, and Head-Centre of Excellence for GST
Symbiosis University of Applied Sciences, Indore
Abstract The Goods and Services Tax (GST) was implemented in India for the first time on 1st July 2017. In the last one and half years, the industry has faced many experiences, challenges, problems, obstacles, and hurdles with respect to getting ready for GST, pricing, transition of credits, IT systems, operational issues on getting refunds, and filing of returns etc. The Government and GST Council on the other hand have tried their best to ease the GST processes over a period of time by rationalizing GST rates, providing clarifications on various issues, simplifying the return filing process and providing relaxation on operational aspects etc. Studies and surveys were conducted to judge the experience of industry on GST implementation so far; to present findings; the industry’s expectations going forward; current opportunities & challenges faced by the industry, government, tax professionals, general public; and what can be reasonably expect in terms of changes over the next one year or so till GST takes its final shape. Majority feel that GST would have a positive impact on the Indian economy, due to the availability of full credits on procurements, and requirement of matching of sale & purchase data for claiming credits. Economic survey has found a large increase in number of indirect tax payers, and that too majority of them voluntarily. Industry, tax payers, tax professionals and the general public expects further rationalization of GST rates and simplification of compliances.
Keywords : GST, Experiences, Implementation, Analysis, Findings, INTRODUCTION The year 2017 will be remembered forever in Indian history as the year that has seen the implementation of the biggest and most important economic reform since independence - The Goods and Services Tax (GST). This tax reform required more than a decade of exhaustive debate and discussion before it was finally implemented with effect from 1 July 2017. It subsumed majority of indirect taxes at the Central and State levels. It had a great support and welcome from industry, tax professionals and the public at large, with a few exceptions such as textile sector and small businesses at few places. Popularized as the ‘One Nation-One Tax-One Market’, the GST brought with it expectations of free-flowing input tax credits, resulting in general reduction in the prices of goods and services as well as barrier free movement of goods across India. In light of the government’s commitment to promote ‘Ease of Doing Business’, the public was expecting the tax regime to be significantly simplified, with few tax rates applicable across all goods and services, as has been seen in other countries.

Volume: II, Issue: I ISSN: 2581-5830
GAP GYAN - An International Peer-Reviewed Open Access Journal of Social Sciences
SPECIAL ISSUE ON KNOWLEDGE SOCIETY AND HIGHER EDUCATION MARCH - 2019
https://www.gapjournals.org/
177
End user and the industry both were hopeful about the complete repair of the previous indirect tax regime and were excited to make the move to the GST law. Implementation of the GST throughout the country was smoother than what was expected. Industry supported it, tax professionals were excited, consumers were confident that it would lead to reduction in prices, and the government was expecting increase in revenue collections. As the journey of GST moved ahead, there was an increasing realization of its far-reaching impact. The government and GST Council adopted a refreshed and speedy approach in addressing challenges faced by the industry and tax professionals. The authorities were fast in addressing public concerns by issuing a series of notifications, clarifications, press releases and FAQs, to resolve varieties of issues. Its extensive use of social media, especially on Twitter, was something new. Further, the government has launched various web-based mobile applications to assist spreading of information on a real-time basis. Moreover, several working groups have been formed to work on sector-specific issues. In addition, the GST Council has convened numerous meetings to address industry’s concerns, and has resolved issues to a large extent. While there is apparently a gap between expectations and actual delivery in terms of simplification, ease of doing business and overall reduction in prices, the government’s report after one year of implementation of the GST shows an overall positive impact with respect to macro-economic growth and simplification of processes and digitalization. LITERATURE REVIEW Moid Sana, (2018) studied challenges in implementing GST and impact of GST on insurance industry, and concluded that the GST regime is likely to throw up interesting opportunities and challenges for insurers. Insurers need to consider GST as a business transformation lever to strengthen their present business processes, identify opportunities and have a first mover advantage. Pratima BJ and Srigowri MP, (2017) studied post GST implementation issues and challenges that arose, and concluded with remedies, and proposed a model to overcome the same. Sharma Bharti et al., (2018) studied benefits, shortcomings, government policies on GST and have done SWOT analysis of GST, and conclude that if GST is properly implemented with tax exemption for certain goods like agricultural commodities, it will result in increasing revenue at the Centre as the tax collection system becomes more transparent, making tax evasion problem vanish and leading to economic growth. Verma S. and Banerjee S., (2018) studied issues and challenges arising and faced by government and businesses after implementation of GST in India. They concluded that government is trying to overcome various issues and challenges that appeared, and it is important to take a leaf from global economies that have implemented GST before India, and who overcame the teething troubles to experience the advantages of having a unified tax system. PricewaterhouseCoopers (PwC) in their report “365 days of GST: a historic journey” has studied post GST implementation initial challenges, the experiences, emerging challenges, and the road ahead. They concluded with key policy suggestions and opined that the government needs to stabilize the system, remove uncertainty, facilitate compliance by easing processes and expand the tax base to make the GST a real success for government, businesses, tax professionals and the public at large. KPMG in their report “Analysis and findings from GST Survey 2018-19” published in January 2018, conducted a survey, studied industry’s experience on GST implementation so far, and presented their findings & industry’s expectations going forward. They conclude that a significant majority feel GST would have a positive impact on the Indian economy, especially with availability of full input tax credits on procurements and requirement of matching of sale and purchase data for claiming credits, and a large increase in number of indirect tax payers, majority being voluntary. Deloitte in their “Post GST implementation review” published in December 2017, conducted a survey, and studied certain common challenges that organizations faced post GST implementation. Ernst & Young (EY) in their “EY Tax Alert” published in July 2018, studied recommendations on reduction in tax rates, exemption of certain goods and services, amendments to the GST law, and approval of the new return formats.

Volume: II, Issue: I ISSN: 2581-5830
GAP GYAN - An International Peer-Reviewed Open Access Journal of Social Sciences
SPECIAL ISSUE ON KNOWLEDGE SOCIETY AND HIGHER EDUCATION MARCH - 2019
https://www.gapjournals.org/
178
FICCI in their “FICCI Survey on One Year of GST” published on 6th July 2018, conducted a survey of enterprises, seeking their views on impact of this major reform, besides gauging insights and views on some of the key issues and challenges that were or are being faced by enterprises post implementation of GST. They concluded that most respondents are happy with the implementation of this reform, with 76% respondents stating that GST has a positive impact on their businesses. Furthermore, the survey reveals that the government has been fairly responsive to suggestions and queries of the industry. RESEARCH GAP Much studies and research work has not been done for post GST implementation analysis and findings, after completion of one year of implementation of GST in India. Hence the researcher has done the same. RESEARCH METHODOLOGY
4.1 - RESEARCH DESIGN / TECHNIQUE The researcher has used exploratory research technique based on past literature from respective authentic sources like scholarly research papers, journals, surveys & reports, various websites, web-pages, newspapers, T.V. channels, and tax professionals etc. 4.2 - RESEARCH OBJECTIVES The objectives of the present study are:
1. To study the initial challenges after implementation of GST in India 2. To study the experience of government, industry, tax professionals and public after implementation of GST in India 3. To study the emerging challenges which are already being witnessed 4. To study the areas on which the government needs to focus to further improve ease of doing business for Indian industry 5. To identify problem areas and to suggest key policy related decisions to solve prevalent problems
4.3 - SOURCES OF DATA The study focuses on secondary data collected from various sources like scholarly research papers, journals, surveys & reports, websites, web pages, newspapers, T.V. channels, representatives of businesses, professional tax consultants etc. 4.4 - RESEARCH PERIOD GST was implemented on 1st July 2017. For the purpose of this study, post implementation period of one year from 1st July 2017 to 30th June 2018 has been taken. POST GST IMPLEMETATION ANALYSIS AND FINDINGS This focuses on challenges faced initially, the experiences of industry and others, challenges emerging, and the road ahead. 5.1 – CHALLENGES FACED INITIALLY After implementation of GST the industry, tax payers, and tax professionals have faced various initial challenges, right from new and unique concepts, customization of IT systems to meet new requirements, supply-chain reengineering, complex documentation and high tax rates for certain goods and services to complex or unclear treatment of many common transactions. Some of the initial challenges and teething problems faced by industry, tax payers, and tax consultants are explained below, which are fully or partially cured as of now.
1. Challenges related to technology: a. Functioning of the online compliance portal GSTN: The government had difficulty in fixing the bugs ever since 1st July 2017. b. Performance related issues on the portal: Government had acted to look into the teething problems and provide immediate solutions. However, there were still issues such as the slow response rate and fixing of errors that remained unaddressed.

Volume: II, Issue: I ISSN: 2581-5830
GAP GYAN - An International Peer-Reviewed Open Access Journal of Social Sciences
SPECIAL ISSUE ON KNOWLEDGE SOCIETY AND HIGHER EDUCATION MARCH - 2019
https://www.gapjournals.org/
179
c. E-Way bill: The E-Way bill system was not functioning when introduced in Feb 2018. Due to frequent break downs, government decided to postpone it for few months. As on today the E-Way bill system is fully functional across India. d. Automation: Automation of compliance and procedures is most important for successful functioning of GST, but was still work-in-progress.
2. Complex nature of tax structure: a. The GST rate structure that was initially implemented had many tax rates for goods and services, without a roadmap for eventual unification of GST rates. The multiple rate structure not only complicates the taxation system, but also leads to unnecessary disputes pertaining to classification. b. The GST law prescribed levy of a “Compensation Cess” on specific categories of goods including motor vehicles, tobacco and aerated drinks. Though it is named as a ‘Cess’ (which is generally calculated on the tax element), actually it is calculated on the base value of goods. c. On select categories of goods and services, the Government had decided to fix the GST rates on the basis of their value and the special features of the product or service under consideration rather than on the basis of classification under their tariffs – a harmonized system of nomenclature (commonly known as the HSN description). d. In many cases, the government had chosen to levy the tax on the basis of the status of the buyer instead of the product, and this has resulted in a great deal of complexity. e. Around 50 products remained in the 28% tax bracket and were classified as ‘luxury or sin goods’. However, it is debatable whether products such as ACs, refrigerators and cameras still merit classification as luxury goods and warrant a higher GST rate. f. Another feature of the GST regime, which adds to its complexity, is the applicability of the GST on related party transactions, even without a consideration.
3. Taxability on advances for supply of goods and procurements from unregistered dealers: a. The Government proposes to levy the GST on advances received for supply of goods. Although the tax payable is available as a credit, tracking such transactions and the need to make adjustments every time there is a subsequent payment, cancellation or amendment has led to significant procedural and compliance-related issues. b. Reverse charge taxability on purchases from unregistered vendors was aimed to keep a check on the unregulated sector. In these circumstances, additional compliance-related challenges have made large businesses reluctant to make purchases from small and unregistered vendors. Although both the above provisions had been postponed once or twice, regular postponement of tax provisions creates an environment of doubt among the taxpayers and corporate houses which are looking for investing in new ventures.
5.2 - THE EXPERIENCES OF INDUSTRY AND OTHERS In spite of some teething problems in managing compliance related requirements, implementation of GST is seen in positive direction. With the progresses in its journey, it is clear that GST is not only a tax reform, but a complete renovation of the entire business scenario. Business and people has seen GST as an important change and vital for businesses to be competitive in the market. The government has been positive in bridging the gap between the expectations of businesses and actual implementation of the GST. There are still some gaps which are required to be filled on an urgent basis to increase domestic and foreign investors’ confidence in the taxation system of India. A period of one year for implementation of such a huge transformational change is not adequate to put in place a perfect tax system. Keeping this in mind, I have discussed below some key indicators to reflect on the experience of the first year of the GST in India.

Volume: II, Issue: I ISSN: 2581-5830
GAP GYAN - An International Peer-Reviewed Open Access Journal of Social Sciences
SPECIAL ISSUE ON KNOWLEDGE SOCIETY AND HIGHER EDUCATION MARCH - 2019
https://www.gapjournals.org/
180
1. Government’s Responsiveness: Government has been appreciated for taking sufficient actions to respond to the industry’s requests such as changes in rates and giving clarity on rules and processes. However, the industry feels that earlier training of GST officials could have been better, especially on a need of the helpdesk being more effective in resolving queries / concerns. Further, a majority feel that the time given to assessees to implement GST related changes has not been sufficient and the notifications / circulars on changes should be issued well in advance. 2. Compliances: The industry faced major issues in meeting compliances, with the GSTN portal not functioning and deadlines being extended at the last minute. Everyone feel that the GSTN portal would have been made more effective, by making the return filing utilities available much earlier rather than closer to the deadline and the error report being generated instantly in a clear manner. Almost everyone were unanimous on the increase in burden caused by the GST compliances, with multiple returns to be filed state wise at a transaction level and matching sales and purchase data for the purpose of claiming credit. 3. Pricing: One of the focus areas for the government and industry was pricing under GST. GST rates and tax credits on procurements were the key drivers for influencing the pricing decision. However, majority feel that pricing has primarily been neutral on account of GST and has not witnessed an increase as was expected.
4. Exports: Exporters of goods and services believed that benefits provided to them under GST were not adequate. The refunds on exports not processed till date, lead to blockage of working capital. Withdrawal of exemptions on procurement for export purposes had further increased the pressure on working capital. 5. Macro-economic impacts:
a. Impact on GDP growth: The industry and government hoped that the GST would be instrumental in reducing economic distortion and give the necessary boost to India’s economic growth. The Economic Survey predicted that the GDP is likely to be between 6.5% and 6.75% in 2017-18, compared to a GDP of 7.1% in 2016-17. According to the latest numbers, growth picked up significantly in the quarter January-March 2018 of FY 2017-18. Reports from financial institutions indicated that the decrease in the GDP is likely to be temporary and will grow to around 7-7.5% in 2018-19. b. Impact on Consumer Price Index (CPI): There was no clear evidence that the GST has reduced inflation. It is too early to draw any clear conclusion regarding the impact of the GST on inflation in the country. c. Impact on revenue collections and fiscal deficit: The government had expected a significant increase in revenue collections with smooth rollout of the GST by following an extensive implementation plan. However, instead there was a decrease after steady collections during the first two or three months of its implementation.
6. Rates Rationalization: GST rates applicable to various goods and services have been rationalized many times. Moreover, various exemptions have been granted for goods and services, for example, legal services provided to the government etc. Industry is hopeful that the government will further rationalize the rates on some more mass consumption products. This will lead to a reduction in their prices and increase the demand for such products.

Volume: II, Issue: I ISSN: 2581-5830
GAP GYAN - An International Peer-Reviewed Open Access Journal of Social Sciences
SPECIAL ISSUE ON KNOWLEDGE SOCIETY AND HIGHER EDUCATION MARCH - 2019
https://www.gapjournals.org/
181
7. Supply-Chain Re-engineering: GST has brought many changes, and businesses have used this opportunity to create value across their procurement, manufacturing, distribution and logistics functions. With the implementation of GST, supply chain costs and efficiencies not only involve tax optimization strategies, but the value proposition is visible, specifically in the areas of procurement, manufacturing, distribution and logistics. 8. Landscape of IT: Implementation of the GST has paved the way to a simpler Indirect Tax structure and a uniform IT landscape in India. The government has undertaken multiple rounds of test and pilot runs to mitigate the risk of IT portals collapsing. Businesses have also been working hard to prepare themselves with continuous upgrades in ERP systems to align these with GST reporting and other compliance related requirements. Other features are software solution providers, technology service providers, ERP vendors and consultants, Application Service Providers (ASPs) and GST Suvidha Providers (GSPs). 9. E-Way Bill: The E-Way Bill system under the GST regime replaces Way Bills (commonly known as entry or exit permits) that were required under the erstwhile VAT regime for movement of goods in many states. The Way Bill system under the VAT regime, which varied from state to state in terms of its format, requirements and procedures has now been replaced with a single pan-India electronically generated E-Way Bill. The main objective of the introduction of the E-Way Bill system is to curb leakage of revenue. 10. Advance Rulings: The GST is a new law. It is at its nascent stage and is seeing significant issues relating to taxability, its procedural aspects and applicable rates of tax on goods and services. Acknowledging the need for suitable clarifications, the Government has been proactively addressing several procedural and legal aspects through official circulars, media sources such as tweets and sector-specific guidelines. However, there are still many critical aspects on which clarity is needed to avoid possible litigation at a later stage. 11. Credit on Transition: The GST is a new law. It is at its nascent stage and is seeing significant issues relating to taxability, its procedural aspects and applicable rates of tax on goods and services. Acknowledging the need for suitable clarifications, the Government has been proactively addressing several procedural and legal aspects through official circulars, media sources such as tweets and sector-specific guidelines. However, there are still many critical aspects on which clarity is needed to avoid possible litigation at a later stage. 12. Other measures for facilitation: In addition to rationalizing tax rates on most goods and services, and easing compliance-related requirements, the GST Council has taken several other measures to facilitate smooth transition to the GST regime. These include deferment of some of the provisions that put an additional tax- and compliance-related burden on industry. 13. Clarity on various aspects: The Government has been proactive in issuing various clarifications (either on a suo-moto basis or on the basis of representations made by trade bodies) to clear up doubts.
5.3 - CHALLENGES EMERGING GST law is evolving day by day with the government issuing notifications and clarifications from time to time. It is imperative for the government to adopt a structured approach in policy-related related issues, while industry needs to keep pace with the changes. Initial structural issues are gradually getting resolved with industry players learning with the passage of time. As a natural progression in the life of a tax law, in coming months and years, several policy-level, jurisdictional, interpretational and operational issues are likely to emerge, some of which (discussed below in this section) are already being witnessed. 1. Matching for Input Tax Credit (ITC): At the time the GST was introduced, the Government also rolled out a matching concept for claiming input tax credit, which formed the backbone of online tax compliance.

Volume: II, Issue: I ISSN: 2581-5830
GAP GYAN - An International Peer-Reviewed Open Access Journal of Social Sciences
SPECIAL ISSUE ON KNOWLEDGE SOCIETY AND HIGHER EDUCATION MARCH - 2019
https://www.gapjournals.org/
182
This concept is unique to India, compared to other countries that have implemented the GST. However, due to IT-related glitches, the facility of online matching has never taken off since GST was implemented. Consequently, in November 2017, the Government decided to defer its requirement of the matching concept till necessary technological upgrades were carried out to cater to such a huge flow of information. 2. Past period payments – no provision for availing credits: To pave the way for the new taxation system, the Central Government and state governments have issued directives to their tax departments to conclude pending tax investigations and disputes quickly. This has naturally led to a surge in the number of pending matters before the various forums, especially at the Appellate level. Moreover, GST laws do not provide specific transitional provisions on several relevant aspects. 3. GST Refunds: Enabling ease of doing business through uniform tax laws across India with simpler compliance-related processes and rapid processing of tax refunds have been the key drivers behind implementation of the GST in India. However, because of technical glitches on the GSTN portal, many exporters were unable to file for refund of Input Tax. As a result, there was a backlog of a huge amount of funds in the initial months. It is necessary to process tax refund claims quickly to facilitate trade under the GST regime. The Government has undertaken several initiatives to expedite this process. 4. Measures for Anti-Profiteering: The Government has taken a bold decision to reduce tax rates (from 28% to 18%) on a large number of products with the hope that this measure will increase demand from the public, enhance consumers’ confidence in the Government’s trade-friendly policies and ultimately give that much-needed boost to the Indian economy. However, these measures require industry to consider reducing prices and passing on the net benefits arising from implementation of the GST to end consumers to keep inflation under control. However, despite sound international experience, implementation of these regulations has been facing significant challenges in India. 5. Enquiry for credit availed and credits appearing in GSTR 2A: A vital part of the GST model is linking of buyers’ and sellers’ invoices to determine their tax liability and seamlessly facilitate flow of input tax credit through value chains. While the idea was well-intended, conducting such an elaborate activity on a month-on-month basis was proving to be a gargantuan task for taxpayers. 6. Centralized V/S Decentralized - Accounting requirements: Under the erstwhile regime, service providers and manufacturers could adopt a centralized accounting approach, whereas traders were required to maintain decentralized accounts, since they needed to be registered separately under the laws of the states from which they operated. The GST, being a tax administered at the state level, posed significant challenges to service providers and manufacturers from the perspective of both accounting and taxation.
5.4 - THE ROAD AHEAD The GST journey has been nothing short of a rollercoaster ride. As the most critical tax reform India has witnessed since Independence, it has been the hot topic of discussion in the country. Despite initial teething problems, implementation of the GST regime will undoubtedly be the catalyst for the Government to achieve its stated agenda of improving ease of doing business in India. Its aim is to simplify GST-related compliance requirements and return formats, and rationalize the tax rate structures of a wide range of products and services. This is in line with its pro-business mindset. In realizing this goal, the Central and state governments are putting into practice their learning from the international GST experience. As a further step, the Government should also focus on simplifying processes and removing the ambiguity around widely debated tax-related issues to enable a painless experience for India Inc. At

Volume: II, Issue: I ISSN: 2581-5830
GAP GYAN - An International Peer-Reviewed Open Access Journal of Social Sciences
SPECIAL ISSUE ON KNOWLEDGE SOCIETY AND HIGHER EDUCATION MARCH - 2019
https://www.gapjournals.org/
183
the same time, businesses should quickly adapt their operations to the new dynamics and support the Government in making the GST a success. Following are some areas on which the Government needs to focus to further improve ease of doing business for Indian industry. 1. Tax base expansion: The key idea behind implementation of the GST was to levy a single tax on all goods and services, resulting in free-flowing credit in the country. However, at present, certain items such as petroleum products (including petrol, diesel, ATF and natural gas), alcohol and immoveable property are outside the GST net. It is expected that there may be an intense debate about expansion of the GST base by bringing Real Estate and Petroleum within its scope in 2018-19. 2. Tax rates cut: Currently, there are four rate brackets—5%, 12%, 18% and 28%. The standard rate, under which the majority of the goods and services fall, is 18%, while ‘luxury’ or ‘sin’ goods and services are levied 28% GST. Another item on the Government’s priority list for the coming year should be further pruning of these rates. These options can, however, only be truly explored once GST collections stabilize. 3. Ease of doing business through simplification of compliance requirements: The Government has already taken an initiative in this direction with its proposal of consolidating all periodical returns (whether operational or not) into a single return. The government machinery is already working on the new format and the IT-related changes required. 4. Tax administration: Digitalization of the Indian economy has been one of the main goals of this Government and it plays a vital role in all of its endeavours. Implementation of the GST was in line with this goal. The GST Law provides for online filing of registrations, returns, refunds and all other compliance related applications. Therefore, it is imperative that there should be a sound digital backbone to the GST. This is where the GSTN comes in. As widely propagated, the GSTN is a world- class system, which is capable of maintaining a substantial amount of data, including invoices and the range-wise details of all taxpayers who use it to apply for GST registration in order to make payments and file returns. 5. Changes in Legislations: Like any critical reform, the GST Law also suffers from certain ambiguities and loopholes that have come to light only after its practical implementation. Certain provisions of the GST seem to unintentionally contradict its objectives. These are likely to see amendments in the near future. Furthermore, one of the key objectives of the GST was to ensure a seamless flow of input tax credits. However, so far, the Government has only partially achieved this objective. Certain provisions of the GST also create unnecessary roadblocks for taxpayers’ working capital. 6. GST Public Forum: The Government may consider launching an India GST forum to facilitate public involvement and transparency. It could benefit by setting up an open forum to provide a supervised and regulated discussion platform on which industry and GST authorities can meet to discuss how implementation of the legislation can be improved in practice.
SUGGESTIONS AND CONCLUSION
6.1 - POLICY RELATED KEY SUGGESTIONS The GST Law is fast evolving. However, in view of its far-reaching impact, the Government needs to adopt a structured approach to target problem areas and take policy related decisions to solve prevalent problems. These are discussed below: 1. Alignment with Global Practices: The GST has been adopted by most countries, but India’s tax structure is a complex one, with multiple taxes and rates. In certain cases, rates applicable for the same products

Volume: II, Issue: I ISSN: 2581-5830
GAP GYAN - An International Peer-Reviewed Open Access Journal of Social Sciences
SPECIAL ISSUE ON KNOWLEDGE SOCIETY AND HIGHER EDUCATION MARCH - 2019
https://www.gapjournals.org/
184
vary on the basis of the status of the buyer or the mode of purchase. This is a feature that is distinctive in Indian law and is a digression from global practices. In order to be competitive in the global market, it is therefore imperative that India presents itself as a structured tax economy, with clear and transparent laws that facilitate ease of doing business in the country. 2. Flexibility in GSTN: The GSTN is indispensable in India’s GST journey, but there is little flexibility offered to users. For instance, there is no option to set off the excess tax paid by an entity under one registration in relation to another registration in a different state, even if it has the same PAN. The network does not allow filing of returns for a subsequent period till the returns for the previous ones are filed along with the penalty. Resolution of these issues and several such concerns, and implementation of a simple and easy-to-use online GST portal is therefore imperative for the success of the GST in India. 3. Tax disputes minimization: The dispute-resolution system has not been well accepted in India. Under the erstwhile regime, several such schemes were introduced, but industry has been rigid in its resistance to adopt such measures for various reasons. Therefore, the Government should seriously look at business-friendly measures to resolve long-pending litigation in the country. In addition, the Government needs to also focus on strengthening the Advance Ruling process to avoid unnecessary litigation. Furthermore, while the Government has been fairly quick in issuing FAQs and responding through its twitter handle, there is no legal sanctity in such means of communication. Additionally, in order to facilitate timely settlement, it should be mandated that closure of disputes under the GST is undertaken in a time-bound manner. 4. Focus on administration: Another important policy on which the Government should focus is structuring of the Tax administration. The process of issuance of notifications needs to be streamlined to give businesses adequate time to implement the changes required. Issuance of unnecessary notices should be discouraged, and a reasonable amount of time should be given to taxpayers to respond to these. In addition, measures should be taken to ensure consistency in the approach followed by tax officers across jurisdictions.
6.2 - CONCLUSION Implementation of the GST is truly a remarkable achievement for the government, businesses and tax professionals. Although it is at its early days still, the GST started on a positive note and the benefits for all stakeholders are evident. It is now time for the Government to stabilize the system, remove uncertainty, facilitate compliance by easing processes and expand the tax base to make the GST a real success for all. CONTRIBUTION OF THE STUDY The analysis and findings of this research study will be useful to following persons for their better understanding of GST and for taking informed decisions.
1. Industry people including big, medium and small businesses. 2. Government and government agencies 3. Policy makers 4. Tax professionals 5. General public at large
LIMITATIONS OF THE STUDY The present study has covered experiences of a period of one year only, from 1st July 2017 to 30th June 2018, after implementation of GST in India. As the time progress, new experiences and findings may be available.

Volume: II, Issue: I ISSN: 2581-5830
GAP GYAN - An International Peer-Reviewed Open Access Journal of Social Sciences
SPECIAL ISSUE ON KNOWLEDGE SOCIETY AND HIGHER EDUCATION MARCH - 2019
https://www.gapjournals.org/
185
SCOPE FOR FURTHER RESEARCH Further research can be done by considering experiences after 1st July 2018, and further analysis can be done for new findings. Further research may also be done by taking primary data. REFERENCES:
Moid Sana, (2018), Challenges and Opportunities in Implementation of GST Bill for Insurance Sector in India, Advances in Economics and Business 6(4), Pg 256-268 Pratima BJ and Srigowri MP, (2017), Post GST emerging challenges and issues, IRACST – International Journal of Commerce, Business and Management (IJCBM), Vol. 6, Issue 6, Pg. 64-69 Sharma Bharti et al., (2018), GST in India: Concept and SWOT Analysis, IAETSD Journal For Advanced Research in Applied Sciences, Vol. 5, Issue 2, Pg. 489-497 Verma S. and Banerjee S., (2018), Issues Arises after Implementation of GST in India, Global Journal of Human-Social Science (E), Vol. 18, Issue 1, Pg 07-10 https://www.pwc.in/assets/pdfs/india-services/indirect-tax/365-days-of-the-gst-a-historic-journey/a-historic-journey.pdf https://home.kpmg/content/dam/kpmg/in/pdf/2018/02/Budget18-India%20GST-survey.pdf https://www2.deloitte.com/content/dam/Deloitte/in/Documents/tax/tax-2016/in-tax-deloitte-post-gst-implementation-review-noexp.pdf http://ficci.in/spdocument/22999/One-Year-of-GST-Survey-Report-ficci.pdf https://www.ey.com/Publication/vwLUAssets/rationalization_rates/%24FILE/rationalization_rates.pdf http://www.idtc.icai.org/ http://www.gstcouncil.gov.in https://www.gst.gov.in/ https://cbec-gst.gov.in/

Volume: II, Issue: I ISSN: 2581-5830
GAP GYAN - An International Peer-Reviewed Open Access Journal of Social Sciences
SPECIAL ISSUE ON KNOWLEDGE SOCIETY AND HIGHER EDUCATION MARCH - 2019
https://www.gapjournals.org/
186
AN ANALYSIS OF WORKING CAPITAL MANAGEMENT OF SELECTED STEEL AND CEMENT COMPANIES OF INDIA
HASMUKH CHAUDHARY
PH.D. SCHOLAR GUJARAT UNIVERSITY
Abstract Since, working capital is an important factor for any company. It plays a role as a life book in financial matter. This paper attempts to study the trends of working capital positions of the five selected companies belongs to cement Industry and five selected companies belongs to steel Industry. To conduct analysis, ratio analysis technique used as accounting technique and different statistical tools and techniques are used like, Average (Mean X ), Variance, and ANOVA (single factor). The paper attempts to find out the significant relation in Financial Leverage between the selected Cement companies and Steel companies.
Keywords : Working Capital, Capital Structure, Financial Leverage. INTRODUCTION
“Working Capital is the Life-Blood and Controlling Nerve Center of a business” The working capital management precisely refers to management of current assets. A firm’s working capital consists of its investment in current assets, which include short-term assets such as: Cash and bank balance, Inventories, Receivables (including debtors and bills), Marketable securities. Working capital is commonly defined as the difference between current assets and current liabilities. The word working capital comprises of two words ‘working’ and ‘capital’. In trade and industry, the word ‘working’ with reference to capital means circulation of capital from one form to another during day-to-day operations of the business whereas the word ‘capital’ refers to the monetary values of all the assets (tangible and intangible) of the business. The Management Of Working Capital Is Important For Several Reasons: For one thing, the current assets of a typical manufacturing firm account for half of its total assets. For a distribution company, they account for even more. Working capital requires continuous day to day supervision. Working capital has the effect on company's risk, return and share prices, There is an inevitable relationship between sales growth and the level of current assets. The target sales level can be achieved only if supported by adequate working capital Inefficient working capital management may lead to insolvency of the firm if it is not in a position to meet its liabilities and commitments.

Volume: II, Issue: I ISSN: 2581-5830
GAP GYAN - An International Peer-Reviewed Open Access Journal of Social Sciences
SPECIAL ISSUE ON KNOWLEDGE SOCIETY AND HIGHER EDUCATION MARCH - 2019
https://www.gapjournals.org/
187
LITERATURE REVIEW N’togwa Ng’habi Bundala (2014) conducted a study on “Does capital structure influence working capital intensity and growth opportunity of a firm “.The core objective of his study is to examine the effect of capital structure on working capital intensity and growth opportunity of Tanzanian listed companies .Descriptive study has been used by taking a sample of 10 listed companies listed on Dar Es Salam Stock Exchange .Using multiple regression model his study resulted that listed company of Tanzania are unleveraged and growing fast and are illiquidity. He also found significant relation between capital structure, working capital intensity and growth opportunity. Jane Wanjiku Muiruri, Dr.Nemwel Boisre (2014) did a research over the topic “Determinants of capital structure decisions of listed insurance companies in Kenya”.A survey of insurance company in nakuru town. Sample consists of 6 listed insurance company in which 50 branch managers and unit manager targeted. Purposive sampling techniques used to select 50 responses among the branch and unit manager.Primary data collected using questionnaire .For data analysis purpose descriptive and inferential statistics was used. Based on their conclusion they found that profitability was the main determinants of capital structure .Also Positive Relationship Found between Profit and Size of Firm. Syed Atif Ali,Dr.Shahid Azia &Amir Razi (2012) done a analytical study on “Impact of capital structure on the profitability of petroleum sector in Pakistan “For this purpose sample of 12 petroleum companies was randomly selected for the period of 2001-2010.Regression analysis was conducted. Their study shows the overall capital structure found to be significant but the individual analysis of every company has no significance because every company has their own capital structure as well as it also shows the positive impact of capital structure on profitability of the petroleum sector .Only two companies oil and gas development and Pakistan petroleum has the significant relation between the capital structure and the profitability. RESEARCH OBJECTIVE 1. To study the trends of working capital positions of the selected companies in cement Industry. 2. To study the trends of working capital positions of the selected companies in steel Industry. SAMPLE SIZE For this research study, researcher has taken 2 Industries and 5 companies from each industry. Total 10 companies has been analysed for this research study
CEMENT 1. Ambuja Cements Limited 2. JK Lakshmi Cement Ltd 3. Birla Corporation Limited 4. UltraTech Cement Limited 5. ACC Limited
STEEL 1. Steel Authority of India Limited 2. Tata Steel Limited 3. JSW Steel Ltd 4. Jindal Steel and Power Limited 5. VISA Steel Limited

Volume: II, Issue: I ISSN: 2581-5830
GAP GYAN - An International Peer-Reviewed Open Access Journal of Social Sciences
SPECIAL ISSUE ON KNOWLEDGE SOCIETY AND HIGHER EDUCATION MARCH - 2019
https://www.gapjournals.org/
188
TIME PERIOD The present study covers the period of ten years spanning from the year 2007-08 to 2016-17. The period of ten years is sufficient to infer the results. Moreover many of the companies were incorporated before this period and the complete data of five years is available, so researcher has selected this period of time. DATA ANALYSIS METHOD For the purpose of financial performance analysis of selected Indian companies of Steel and Cement sector, following accounting and statistical tools and techniques are used. Accounting Technique: 1. Ratio analysis Statistical technique: 1. Average (Mean X ) 2. Variance 3. ANOVA: single factor RESEARCH HYPOTHESIS Below mentioned hypothesis has been tasted in this research study NULL HYPOTHESIS 1. H0 : There is no significant relation in Financial Leverage between the selected Cement companies 2. H0 : There is no significant relation in Financial Leverage between the selected Steel companies 3. H0 : There is no significant relation in Financial Leverage between the selected Cement and Steel companies ALTERNATIVE HYPOTHESIS 1. H1 : There is significant relation in Financial Leverage between the selected Cement companies 2. H1 : There is significant relation in Financial Leverage between the selected Steel companies 3. H1 : There is significant relation in Financial Leverage between the selected Cement and Steel companies DATA ANALYSIS
FINANCIAL LEVERAGE Table 1 - Financial Leverage of Cement Companies Financial Leverage COMPANY 2007-08 2008-09 2009-10 2010-11 2011-12 2012-13 2013-14 2014-15 2015-16 2016-17 Ambuja Cements Limited 1.38 1.37 1.41 1.42 1.41 1.37 1.38 1.37 1.67 1.72 JK Lakshmi Cement Ltd 2.20 2.34 2.43 2.37 2.50 2.80 3.12 3.45 3.71 3.53 Birla Corporation Limited 1.58 1.70 1.81 1.81 1.85 1.92 1.90 1.90 2.93 2.59 UltraTech Cement Limited 2.14 1.81 2.03 1.94 1.94 1.87 2.00 1.94 1.73 2.17 ACC Limited 1.76 1.71 1.76 1.69 1.62 1.55 1.54 1.52 1.55 1.59

Volume: II, Issue: I ISSN: 2581-5830
GAP GYAN - An International Peer-Reviewed Open Access Journal of Social Sciences
SPECIAL ISSUE ON KNOWLEDGE SOCIETY AND HIGHER EDUCATION MARCH - 2019
https://www.gapjournals.org/
189
Graph 1 - Financial Leverage of Cement Companies Table 2 - Financial Leverage of Steel Companies Financial Leverage COMPANY 2007-08 2008-09 2009-10 2010-11 2011-12 2012-13 2013-14 2014-15 2015-16 2016-17 Steel Authority of India Limited 1.97 2.09 2.08 1.95 2.08 2.17 2.29 2.52 2.91 3.12 Tata Steel Limited 4.39 4.81 3.65 3.25 4.03 4.01 4.73 5.31 4.58 3.45 JSW Steel Ltd 4.40 3.85 2.79 3.24 3.38 3.67 3.85 3.94 3.89 3.29 Jindal Steel and Power Limited 2.74 2.41 2.55 2.49 2.73 3.33 3.66 4.15 3.02 2.94 VISA Steel Limited 7.21 7.16 8.23 14.39 15.57 54.56 35.85 18.98 17.44 24.55
1.38
1.37
1.41
1.42
1.41
1.37
1.38
1.37 1.
67 1.72
2.20 2.
34 2.43
2.37 2.
50 2.80
3.12
3.45 3.
71
3.53
1.58 1.
70 1.81
1.81
1.85 1.92
1.90
1.90
2.93
2.59
2.14
1.81 2.
03
1.94
1.94
1.87 2.
00
1.94
1.73
2.17
1.76
1.71 1.76
1.69
1.62
1.55
1.54
1.52
1.55
1.59
0.00
0.50
1.00
1.50
2.00
2.50
3.00
3.50
4.00
2007-08 2008-09 2009-10 2010-11 2011-12 2012-13 2013-14 2014-15 2015-16 2016-17
Financial Leverage - CEMENT
Ambuja Cements Limited JK Lakshmi Cement Ltd Birla Corporation Limited
UltraTech Cement Limited ACC Limited

Volume: II, Issue: I ISSN: 2581-5830
GAP GYAN - An International Peer-Reviewed Open Access Journal of Social Sciences
SPECIAL ISSUE ON KNOWLEDGE SOCIETY AND HIGHER EDUCATION MARCH - 2019
https://www.gapjournals.org/
190
Graph 2 - Financial Leverage of Steel Companies
Table 3 - Average of Financial Leverage of Cement Companies Average of Financial Leverage - CEMENT
Ambuja Cements Limited 1.45 JK Lakshmi Cement Ltd 2.85 Birla Corporation Limited 2.00 UltraTech Cement Limited 1.96 ACC Limited 1.63
1.97
2.09
2.08
1.95
2.08
2.17
2.29
2.52
2.91
3.124.39
4.81
3.65
3.25 4.03
4.01 4.73 5.31
4.58
3.454.40
3.85
2.79
3.24
3.38
3.67
3.85
3.94
3.89
3.29
2.74
2.41
2.55
2.49
2.73 3.33
3.66
4.15
3.02
2.94
7.21
7.16 8.23
14.3
9
15.5
7
54.5
6
35.8
5
18.9
8
17.4
4
24.5
5
0.00
10.00
20.00
30.00
40.00
50.00
60.00
2007-08 2008-09 2009-10 2010-11 2011-12 2012-13 2013-14 2014-15 2015-16 2016-17
Financial Leverage - STEEL
Steel Authority of India Limited Tata Steel Limited JSW Steel Ltd
Jindal Steel and Power Limited VISA Steel Limited

SPECI
0.0
0.5
1.0
1.5
2.0
2.5
3.0
Volume:
GAP GY
IAL ISSUE
1.4
00
50
00
50
00
50
00
Ambuja CLimi
II, Issue: I YAN - An In
Open
E ON KNO
Graph 3 - A
Table 4 - AAverage of Steel AuthoTata Steel LJSW Steel LJindal SteelVISA Steel
45
Cements ited
JK La
Average
nternationan Access Jou
OWLEDGEMARC
Average of Fin
Average of Fif Financial Levority of India Limited Ltd l and Power LLimited
2.85
akshmi CementLtd
of Financ
al Peer-Revurnal of Soc
E SOCIETYCH - 2019
nancial Levera
nancial Leververage - STEELimited
Limited
2.00
t Birla CorporLimited
cial Levera
iewed cial Sciences
Y AND HI9
age of Cement
rage of Steel CEL 2.34.23.63.020.
ation d
UltraTeLi
age - CEME
s
GHER ED
t Companies
Companies
32 2
63 00 .39
1.96
ech Cement imited
ENT
ISSN
DUCATION
1.63
ACC Limited
N: 2581-583
N 191
0https://www.gapjournals.org/
1

SPECI
Average of FCOMPANY CEMENT CoSTEEL Co.
Volume:
GAP GY
IAL ISSUE
Financial Leve2007-08 . 1.81 4.14
0.00
5.00
10.00
15.00
20.00
25.00
o
1.81
414
0.00
2.00
4.00
6.00
8.00
10.00
12.00
14.00
16.00
2007
II, Issue: I YAN - An In
Open
E ON KNO
Graph 4 - A
Taberage 2008-09 211.79 14.06 3
Grap
2.32
Steel Authorityof India Limited
Avera
1.79
4.14
4.06
-08 2008-09 2
Avera
nternationan Access Jou
OWLEDGEMARC
Average of Fi
ble 5 - Average
2009-10 201111.89 1.83.86 5.0
ph 5 - Averag
4.22
y d
Tata Steel Limited
age of Fina
1.89
1.85
3.86 5
06
2009-10 2010-
age of FCEME
al Peer-Revurnal of Soc
E SOCIETYCH - 2019
inancial Lever
e of Financial
10- 2011-12 5 1.86 6 5.56
e of Financial
3.63
JSW Steel
ancial Lev
1.86
190
5.06 5.56
11 2011-12 20
FinancENT Co. S
iewed cial Sciences
Y AND HI9
rage of Steel C
l Leverage by
2012-13 1.90 13.55
l Leverage by
3.0
l Ltd Jindal StPower L
verage - ST
1.90
1.99
13.5
5
10.0
8
012-13 2013-1
ial LevTEEL Co.
s
GHER ED
Companies
year
2013-14 20151.99 2.10.08 6.
y year
00
2
eel and Limited
VISLim
TEEL
2.04 232
6.98
4 2014-15 20
verage
ISSN
DUCATION
014-5 201516 .04 2.32.98 6.37
20.39
A Steel mited
2.32
2.32
6.37 7.
47
15-16 2016-17
N: 2581-583
N 192
5- 2016-17 2.32 7.47
7
0https://www.gapjournals.org/
2

Volume: II, Issue: I ISSN: 2581-5830
GAP GYAN - An International Peer-Reviewed Open Access Journal of Social Sciences
SPECIAL ISSUE ON KNOWLEDGE SOCIETY AND HIGHER EDUCATION MARCH - 2019
https://www.gapjournals.org/
193
Table 6 - Average of Financial Leverage by companies Average of Financial Leverage CEMENT
Ambuja Cements Limited 1.45 JK Lakshmi Cement Ltd 2.85 Birla Corporation Limited 2.00 UltraTech Cement Limited 1.96 ACC Limited 1.63 STEEL
Steel Authority of India Limited 2.32 Tata Steel Limited 4.22 JSW Steel Ltd 3.63 Jindal Steel and Power Limited 3.00 VISA Steel Limited 20.39
Graph 6 - Average of Financial Leverage by companies ANALYSIS Financial leverage indicates how much a business is dependent on the debt that it has issued. Financial Leverage primarily tells us how the company is using debt as a part of its financing strategy and its dependency on borrowings. The financial leverage ratios measure the overall debt load of a company and compare it with the assets or equity. This shows how much of the company assets belong to the shareholders rather than creditors. From the financial leverage analysis tables it can be concluded that from selected cement companies JK Lakshmi Cement Ltd stood
1.452.85 2.00 1.96 1.63 2.32
4.22 3.63 3.00
20.39
0.00
5.00
10.00
15.00
20.00
25.00
Am
buja
Cem
ents
Lim
ited
JK L
aksh
mi C
emen
t Lt
d
Birl
a C
orpo
ratio
n Li
mite
d
Ultr
aTec
h C
emen
t Li
mite
d
AC
C L
imite
d
Ste
el A
utho
rity
of In
dia
Lim
ited
Tat
a S
teel
Lim
ited
JSW
Ste
el L
td
Jind
al S
teel
and
Pow
er
Lim
ited
VIS
A S
teel
Lim
ited
CEMENT STEEL
Average of Financial Leverage

Volume: II, Issue: I ISSN: 2581-5830
GAP GYAN - An International Peer-Reviewed Open Access Journal of Social Sciences
SPECIAL ISSUE ON KNOWLEDGE SOCIETY AND HIGHER EDUCATION MARCH - 2019
https://www.gapjournals.org/
194
number one position while Ambuja Cements Limited stood at last position which indicates that JK Lakshmi Cement Ltd is less dependent on the debt that it has issued compare to all selected cement companies. From the selected steel companies, VISA Steel Limited number one position where as Steel Authority of India Limited stood at last position which indicates VISA Steel Limited is less dependent on the debt that it has issued compare to all selected steel companies. Cement companies are less dependent on the debt that it has issued than steel companies taken under study. Anova: Single Factor SUMMARY Groups Count Sum Average VarianceAmbuja Cements Limited 10 14.5 1.45 0.017155556JK Lakshmi Cement Ltd 10 28.45 2.845 0.316561111Birla Corporation Limited 10 19.99 1.999 0.177832222UltraTech Cement Limited 10 19.57 1.957 0.018623333ACC Limited 10 16.29 1.629 0.008721111ANOVA Source of Variation SS df MS F P-value F crit Between Groups 11.53136 4 2.88284 26.7477794 2.15E-11 2.578739 Within Groups 4.85004 45 0.107778667Total 16.3814 49
INTERPRETATION H0 = There is no significant relation in Financial Leverage between the selected Cement companies H1 = There is significant relation in Financial Leverage between the selected Cement companies From above table for 4 and 45 degree of freedom. Fcal is 26.74 and Ftab is 2.57. Thus, Fcal>Ftab and p-value is less than specified α of 0.05. So, null hypothesis is rejected it is concluded that there is significant relation in Financial Leverage between the selected Cement companies Anova: Single FactorSUMMARY Groups Count Sum Average VarianceSteel Authority of India Limited 10 23.18 2.318 0.164328889 Tata Steel Limited 10 42.21 4.221 0.432632222 JSW Steel Ltd 10 36.3 3.63 0.210088889 Jindal Steel and Power Limited 10 30.02 3.002 0.313573333 VISA Steel Limited 10 203.94 20.394 221.1599822 ANOVA Source of Variation SS df MS F P-value F crit Between Groups 2359.7226 4 589.93065 13.26995328 3.21E-07 2.578739Within Groups 2000.52545 45 44.45612111Total 4360.24805 49

Volume: II, Issue: I ISSN: 2581-5830
GAP GYAN - An International Peer-Reviewed Open Access Journal of Social Sciences
SPECIAL ISSUE ON KNOWLEDGE SOCIETY AND HIGHER EDUCATION MARCH - 2019
https://www.gapjournals.org/
195
INTERPRETATION H0 = There is no significant relation in Financial Leverage between the selected Steel companies H1 = There is significant relation in Financial Leverage between the selected Steel companies From above table for 4 and 45 degree of freedom. Fcal is 13.26 and Ftab is 2.57. Thus, Fcal>Ftab and p-value is less than specified α of 0.05. So, null hypothesis is rejected it is concluded that there is significant relation in Financial Leverage between the selected Steel companies Anova: Single Factor SUMMARY Groups Count Sum Average VarianceCEMENT Co. 10 19.76 1.976 0.03830044STEEL Co. 10 67.13 6.713 9.40115933ANOVA Source of Variation SS df MS F P-value F crit Between Groups 112.195845 1 112.195845 23.7716665 0.00012 4.41387Within Groups 84.955138 18 4.71972989Total 197.150983 19
INTERPRETATION H0 = There is no significant relation in Financial Leverage between the selected Cement and Steel companies H1 = There is significant relation in Financial Leverage between the selected Cement and Steel companies From above table for 1 and 18 degree of freedom. Fcal is 23.77 and Ftab is 4.41. Thus, Fcal>Ftab and p-value is less than specified α of 0.05. So, null hypothesis is rejected it is concluded that there is significant relation in Financial Leverage between the selected Cement and Steel companies FINDINGS AND CONCLUSION The financial leverage ratios measure the overall debt load of a company and compare it with the assets or equity. This shows how much of the company assets belong to the shareholders rather than creditors. From the financial leverage analysis tables it can be concluded that from selected cement companies JK Lakshmi Cement Ltd stood number one position while Ambuja Cements Limited stood at last position which indicates that JK Lakshmi Cement Ltd is less dependent on the debt that it has issued compare to all selected cement companies. From the selected steel companies, VISA Steel Limited number one position where as Steel Authority of India Limited stood at last position which indicates VISA Steel Limited is less dependent on the debt that it has issued compare to all selected steel companies. Cement companies are less dependent on the debt that it has issued than steel companies taken under study. REFERENCES
Ashim Gupta (2016 ) “Capital structure Practices: Industry Wise Analysis of Companies”. The International Journal Of Business & Management (ISSN 2321–8916), Vol 4 Issue 2,14-20. Chandrashekharan C.V (2012) “determinants of capital structure in the nigerian listed firms.” International journal of advanced research in mgt and social sciences .vol.1.no.2 ISSN:2278-109-133 Jane Wanjiku Muiruri, Dr.Nemwel Boisre(2014) did a research over the topic “Determinants of capital structure decisions of listed insurance companies in Kenya”. International journal of scientific Engineering and research, ISSN (ONLINE) :2347-3878.vol.3.78-85 Rakesh Krishnan, Neethu Mohandas (2013) “A study on the factors influencing the leverage of Indian companies”.” Journal of Commerce & Accounting Research Volume 2 Issue 1 January 2013,30-33.

Volume: II, Issue: I ISSN: 2581-5830
GAP GYAN - An International Peer-Reviewed Open Access Journal of Social Sciences
SPECIAL ISSUE ON KNOWLEDGE SOCIETY AND HIGHER EDUCATION MARCH - 2019
https://www.gapjournals.org/
196
Rosy Dhingra, Dr.Kapil Dev (2016) “Determinants of capital structure –A study of oil industry in India”.. International journal of scientific Engineering and research, Vol.1.Issue- 1, 35-42. S.Ravethy, Dr.Santhi (2016) c “Impact of capital structure on profitability of manufacturing companies in India” .international journal of advance engineering technology, E-ISSN 0976-3945, Vol. VII/Issue I,24-28 Sukhdevsingh,Rajni luthra (2013) “ A comparative study of trends in corporate capital structure pattern of refinery and metal industry. “Asia pacific journal of marketing & mgt revenue vol.2.(6) 11-20.

Volume: II, Issue: I ISSN: 2581-5830
GAP GYAN - An International Peer-Reviewed Open Access Journal of Social Sciences
SPECIAL ISSUE ON KNOWLEDGE SOCIETY AND HIGHER EDUCATION MARCH - 2019
https://www.gapjournals.org/
197
USE OF CLOUD COMPUTING AND ACCOUNTING: BUSSINESS PRESPECTIVE
Author PROF. (DR.) GURUDUTTA P. JAPEE
S.D SCHOOL OF COMMERCE, GUJARAT UNIVERSITY, NAVRANGPURA,
AHMEDABAD
Co- Author ANKIT JOSHI
RESEARCH SCHOLAR S.D. SCHOOL OF COMMERCE AHMEDABAD
GUJARAT UNIVERSITY
Abstract Now a day’s business houses started adopting and currently are using cloud computing and accounting Because of growth possibilities or potential of cloud computing and accounting as a world scenario. Business houses developed their own big data centers, private cloud or hybrid cloud as a support for their processes within the shared virtual and configurable resource. Cloud computing and accounting technology process and store a series of sensitive and confidential data (financial statements, financial reports, A.O.A and M.O.A) of a business houses. Cloud accounting and computing technology adoption provides a rigorous analysis of data and application security. In this paper which is based on a descriptive analysis of existing literature and specialized practice in this field. We wish to synthesize the potential of cloud accounting and computing in the development of business houses.
INTRODUCTION Business houses are formed for the purpose of profit making and thus they are carried out some economical activity. Increase profit on a continuous scale and now a day’s cost cutting is also important for survival in a cut through competition. Cloud computing provides numerous benefits to a business house which are the key factors for the development of business house. Usage of Cloud accounting and computing provides a major impact on Accounting Information Systems within organizations. The software as a services approach has a significant and direct impact on the company's financial and accounting processes. Cloud accounting and computing significantly impacts the business strategies of companies, the way companies do business and define the hardware, software and communication infrastructures, risk management and cost management. Cloud computing technology provides various business models for solving business problems to business just like Software-as-a-Service (SaaS), Infrastructure-as-a-Service (IaaS), Platform-as-a-Service (PaaS), Business Process-as-a-Service (BPaaS), and data base as a service. Automatic Documents Entry, Mobile Customer Service, and Mobile Accounting Service are all those features are provided in this service. Multiple implications of cloud computing and accounting on today’s business process, which we briefly describe in this research regarding on how these technologies can be used in Accounting Information Systems (AIS) in order to improve the accuracy, completeness, and timeless of accounting information.

Volume: II, Issue: I ISSN: 2581-5830
GAP GYAN - An International Peer-Reviewed Open Access Journal of Social Sciences
SPECIAL ISSUE ON KNOWLEDGE SOCIETY AND HIGHER EDUCATION MARCH - 2019
https://www.gapjournals.org/
198
CLOUD COMPUTING AND ACCOUNTING DEFINITION A common definition is given in a NIST report; "Cloud computing is a model for enabling ubiquitous, convenient, on demand network access to a shared pool of configurable computing resources (e.g., networks, servers, storage, applications, and services) that can be rapidly provisioned and released with minimal management effort or service provider interaction". Cloud accounting is a terminology in which all the economic transaction like recording, classifying, summarizing, analyzing and presenting with the integration of cloud computing technology with the configurable resource and virtual resource. Characteristics of Cloud Computing& accounting
On-demand self-service: all the resource is or data are stored in cloud by client itself and access by client itself here there is no requirement of permission of any third party. It is on demanded services of client. Broad network access: in this platform unlimited data is to be stored and network which access configurable resource is from broad network. Resource pooling: in cloud computing and accounting unlimited data is to be stored and resource are pooled at a large scale basis and access from anywhere with network access. Rapid elasticity: it is a more elastic and provides more flexibility in terms of billing, quality and resource allocation to the client. Measured service: service of cloud service provider is measured in terms of scale which is decided in terms of agreement.
REVIEW OF LITERATURE Gupta et al. (2013) study suggested that there are various solutions which cloud computing services provides as features to a business entity and also all those factors which is a key in for adopting cloud computing services these are ease of use, security, cost reduction, reliability and sharing and collaboration. Cloud computing and accounting services refer to either or a combination of the following. IT Infrastructure as a service (IaaS) Infrastructure service provider, provide physical storage space, processing capabilities, virtual CPUs and database services to client. Platform as a service (PaaS) A package of software and product development tools for development, testing, deployment, hosting and application maintenance hosted on the provider's infrastructure. Cloud service provider (Software developers) can create applications on the provider's platform through the Internet. Software as a service (SaaS) The end-user (business houses) pays the software provider a cloud billing (subscription fee) for the service and the software is hosted openly from the software providers' servers and is access by the business through the Internet Irshad et al. (2017) study reveals to understand the level of awareness and adoption of cloud computing and accounting by the academic staff in Sri Lankan universities. This study is conducted for the purpose of investigating the level of awareness of cloud accounting and computing technology and to what extent this technology is use by academic staff in Sri Lankan universities, and the reasons for adoption and non-adoption. One-third of the sample respondents are aware about the cloud computing and accounting technology. The level of adoption by academic staff in Sri Lankan universities is limited to several applications, only up to Google Apps Engine and Drop box. Cost and time saving were stated as the reasons for adoption and the lack of benefits and security concerns were stated as the most important drivers for non-adoption by academic staff in Sri Lankan universities. 78.4% of the respondents are aware of cloud computing, but only 14% respondent confirmed they have deeply knowledgeable about cloud computing and accounting.

Volume: II, Issue: I ISSN: 2581-5830
GAP GYAN - An International Peer-Reviewed Open Access Journal of Social Sciences
SPECIAL ISSUE ON KNOWLEDGE SOCIETY AND HIGHER EDUCATION MARCH - 2019
https://www.gapjournals.org/
199
Bagish (2014) Cloud accounting and computing is a latest technology and new trends. Cloud computing and accounting technology through software applications are running as a service over the internet on scalable infrastructure. Universities can take advantage of cloud computing and accounting technology through software application model to provide students and teachers with free or low cost tools. This paper aim to investigate the awareness of cloud computing and accounting among student and how often they use cloud computing and accounting technology. This study also aims to find out the student's opinion of using cloud computing collaboration application and the university administrator support to integrate and familiar to the student about cloud computing and accounting technology. Therefore the finding recommends that education and sensitization on cloud computing in order to increase awareness and knowledge about this cloud computing and accounting technology and its prospects to the student. Implication that are attached with cloud accounting and computing
Big Data storing: in cloud computing technology data storing features are available as you want. Data are stored on virtual platform and it is to be stored as rent space from cloud services provider and pay only that use from anywhere with configurable resource (internet). Business houses stored data through rent space on cloud from service provider Big data Manage& control: cloud service provider maintains data which is provided by client and it is depends on space that was rented by client. Cloud services provider maintains big that which is very difficult to manage by institution because lack of resource. Manage E-content: today’s online business houses are hub of E- content and management of all the resource are very difficult. It is very difficult to maintain E- content in proper management and useful for people when they required so that problems are solve by cloud computing service through cloud services provider. Management of E- content are provided by cloud agent in very cheap cost. Safe from uncertainties: many a time’s possibility is there that data will be cruse and corrupt by virus and other uncertainties (fire at place). There are many problems associated with Data and due to this data is destroyed. All the resource is destroyed from uncertainties then cloud services provide backup service to their client according to their requirement. Cloud services provide safe service of data from uncertainties Back up service: cloud computing service provides back of data that was stored in cloud and according to their requirement without any extra cost of their resource. It provides numerous benefits like safety from circumstances. Automatic update: cloud services provider is also provide automatic update to their client according to available resource. Low cost: cloud services are provides all those services with low cost because pay what you use and big things that save from costly infrastructure that is necessary for data services and all those above services. Safe security of data from contingencies means cloud accounting and computing provides safe security of data to users. Real time information means provide real time information to various stakeholder. Flexibility means that flexibility in terms of contract, quality and payment etc. Pay according to their use means pay what you consume Physical existence is not important means physical important of accountant is not important from anywhere he perform respective task. Speed up transaction means that transaction is speeded by using new trends that is cloud accounting. Save energy means accountant with less effort work will perform by using it. Save time means it reduces times in comparison to old traditional accounting. Easy for auditing purpose by using cloud computing and accounting technology. No hidden charges by cloud services provider. Capital expenditure converted into revenue expenditure. Back up service to the client whenever needed.

Volume: II, Issue: I ISSN: 2581-5830
GAP GYAN - An International Peer-Reviewed Open Access Journal of Social Sciences
SPECIAL ISSUE ON KNOWLEDGE SOCIETY AND HIGHER EDUCATION MARCH - 2019
https://www.gapjournals.org/
200
Risk associated with cloud accounting and computing Data migration by service provider: in many case it is seen that service provider are very selfish and they use data of client for money making and take undue advantage from data handling because ultimate handling in the hand of service provider because data is to be stored on remote server which is controlled in the hand of service provider Highly costly for big data: in most of the case cloud service provider are charge according to the use of resource or stored capacity and it is quite difficult to big data handling institution because big data require huge space and capacity so charge is very in terms of total amount because it is rented capacity and huge resource are applicable. It is very costly in comparison to that option about build infrastructure is less costly. Leakage of sensitive data: many times it is seen that cloud service provider are leak information or data which is very important and very sensitive for his personal interest and its loss the trust ship between client and cloud provider. Lack of legal provision: in this field contract of cloud computing between cloud service provider and client are not regulated by any controlled authority and it is quite difficult when dispute arise, so in this field strict rules and regulation are to be implement by govt. Poor quality service: Some of the cloud service providers are very cheap and they do not provide service according to standard. It provides poor quality of service to their client and not to solve any problems regarding it. So problems arise between cloud service provider and client. Internet access is necessary Confidentiality is not maintain Service is depended on service provider Additional cost or hidden charge It requires knowledge of computer science Illegal outsourcing
CONCLUSION: Study conclude that there are numerous benefits that are associated with cloud accounting and computing to business world, by using cloud accounting and computing business is achieving new highest in modern arena. By adopting cloud computing and accounting, provides real time information to its various stakeholder like easy access of financial statement and report with internet access from anywhere to shareholder and management, customer satisfaction and problems solution of their customer on time with cloud computing and accounting. Data which is stored on cloud is safely stored on it and uncertainties cannot affect data and also back up service of data are available to client. REFERENCING T. Mell, "The NIST Definition of Cloud Computing," National Institute of Standards and Technology, Information Technology Laboratory, 2009 Gupta, P., Seetharaman, A., Raj, JR., 2013. The Usage and Adoption of Cloud Computing by Small and Medium Businesses, International Journal of Information Management, No.33, and pp. 861-874. Irshad, M. B. M., Md. Gapar Md. Johar., 2017. The Study on Awareness and Adoption of Cloud Computing by Academics in Sri Lankan Universities, International Journal of Advanced Research in Computer Science and Software Engineering, Volume 7, Issue 5, pp.6-10 Bagish, Samah Sadeq Ahmed., 2014. Student's Awareness of Cloud Computing: Case Study Faculty of Engineering at Aden University, Yemen, IJEDR, Volume 2, Issue 1,pp. 1122-1129

Volume: II, Issue: I ISSN: 2581-5830
GAP GYAN - An International Peer-Reviewed Open Access Journal of Social Sciences
SPECIAL ISSUE ON KNOWLEDGE SOCIETY AND HIGHER EDUCATION MARCH - 2019
https://www.gapjournals.org/
201
A REVIEW OF LAND REFORMS IN INDIA
Dr. Satyajeet S Deshpande (Associate Professor, Economics, New L J Commerce College, Ahmedabad)
[email protected] 09925831823
Abstract
The levels of living in rural areas to a large extent depend upon the success of agricultural sector. Performance of
agricultural sector in turn depends on the success of technological and institutional reforms. Two of the major
reasons for rural poverty were unequal distribution of land and exploitation of poor landless tillers by the rich
landlords. Given the institutional constrains, even the implementation of technological reforms were not expected to
succeed in increasing agricultural productivity, farm incomes and standards of living of the rural poor. Uneconomic
size of the land and lack of incentive for increasing land productivity due to absence of ownership were the main
bottlenecks which would not allow the technological reforms to succeed. Unless the land-reforms were implemented
successfully, the technological reforms were going to be of little use. In this context, the current paper strives to
review the land-reforms implemented in India. It tries to assess the scope, measures and limitations of the land
reforms. The main objective of the paper is to find out the reasons for the failure of the institutional reforms in
bringing about the redistribution of land in favour of the landless tillers and increasing the agricultural productivity.
Keywords : Land Reforms, Institutional Reforms, Rural Poverty, Agricultural Productivity INTRODUCTION One of the major reasons for poverty in rural areas is low agricultural productivity. Agricultural productivity mainly depends on two factors, technological and institutional. The technological factors include use of chemical fertilizers, high yielding variety of seeds, modern equipments and irrigation facilities. The institutional reforms include the redistribution of land ownership in favour of cultivating class and removing the exploitation of the poor landless farmers. Just as poor technology and lack of quality inputs is responsible for poor agricultural productivity, institutional factors such as the existence of feudal relations, small size of farms, sub-division and fragmentation, insecurity of tenancy rights, high rents also act as disincentives to the farmers to increase the production. Of late, the economists and experts believe that land reforms and technological changes are not mutually exclusive. They are actually complementary to each other for the success of agricultural production and productivity. OBJECTIVES: The main objective of this paper is to list down the institutional limitations responsible for low agricultural productivity and rural poverty, review the measures carried out under the land reforms and finally evaluate them in the context of their aims.

Volume: II, Issue: I ISSN: 2581-5830
GAP GYAN - An International Peer-Reviewed Open Access Journal of Social Sciences
SPECIAL ISSUE ON KNOWLEDGE SOCIETY AND HIGHER EDUCATION MARCH - 2019
https://www.gapjournals.org/
202
1. Institutional Factors Responsible for Rural Poverty: a. Existence of intermediaries: Zamindari system was introduced by Lord Cornwallis in 1793 in Bengal and then it gradually spread in the various parts of the country in different forms. The East India Company appointed few selected people with the responsibility of collecting the land revenue and submit it to the company. These revenue collectors were raised to the status of landowners. Thus a class of intermediaries was born. These intermediaries used to rent their lands to the actual tillers and charged exorbitant amounts of rent from them. b. High rents: The actual tillers used to put in a lot of hard-work to produce the crop. However, a large part of this output had to be sacrificed to the landlords or zamindars in the form of rent. At times, they had to give up 50% to 75% of their produce as rent. This gradually discouraged farmers from producing more output as a large part of their additional output would be going to the land-owners due to high rents. c. Insecurity of tenure: The actual tillers who were the tenants had no security of tenure. They were evicted on minor pretexts of several kinds. The actual cultivators did not know for how long they would be allowed to cultivate on the land they were currently cultivating resulting in to great insecurity and stress. d. No ownership rights: The biggest factor responsible for low agricultural productivity and efficiency in rural areas was absence of land ownership for the actual tillers. Majority of the cultivators were tenants and did not have ownership rights on the lands on which they were farming. As a consequence, there was no incentive to make efforts towards the improvement in the quality of land.
2. Scope of Land Reforms: In the context of the above-mentioned institutional issues and bottlenecks, the government decided to introduce land reforms with the following objectives. i) Abolition of intermediaries ii) Tenancy reforms like regulation of rent, security of tenure to the tenants and conferment of ownership on them iii) Ceiling and floors on land holdings iv) Consolidation of holdings and prevention of sub-division and fragmentation of land v) Organization of cooperative farming In a broader sense, land reforms were aimed at reducing rural poverty in the following ways: i. Redistribution of land towards the landless by taking away the surplus lands from the large land holders ii. Providing security of the tenure and ownership rights to the tenants iii. Regulation of rent payable by tenants to the landlords iv. Protection of the interests of tribals and preventing non-tribals from encroaching the tribal lands v. Promotion of the consolidation of the land holdings to improve the size of operational holdings for increasing the productivity vi. Development of public lands thereby providing better access to rural poor to obtain fuel-wood and fodder vii. Providing access to women to land and other productive assets viii. Providing rural poor with sites to enable them construct residential houses.
3. Measures: 1. Abolition of Intermediaries: Concrete measures towards abolition of intermediaries started since 1948. Legislation was enacted in almost all the states. Due to the conferment of rights, about 30 lakh tenants and share-croppers acquired ownership rights over a total cultivated area of 62 lakh acres throughout the country. 2. Regulation of rent: The legislation for abolition of intermediaries was aimed at providing land to the tiller but it did not put an end to the problem of tenancy. Some leasing was bound to remain. Even with the limit of ceiling, it may not be possible for a family to cultivate the entire land and so some sub-letting is unavoidable. As the tenancy was going to continue, some measures for minimizing the evils of tenancy

Volume: II, Issue: I ISSN: 2581-5830
GAP GYAN - An International Peer-Reviewed Open Access Journal of Social Sciences
SPECIAL ISSUE ON KNOWLEDGE SOCIETY AND HIGHER EDUCATION MARCH - 2019
https://www.gapjournals.org/
203
were inevitable. The rates of rents prevalent were one half of the produce or more. These rents were excessive by any standard of social justice. Consequently, the first and second plan recommended that rents should not exceed one fourth or one fifth of the gross produce. Despite some variations, various states have passed necessary legislation regulating rents. 3. Security of tenure: The personal interest of a cultivator in land with rights of temporary tenancy is very less. Tenants therefore take much less care in preparing land, investing capital in the form of wells or tube-wells and putting up permanent fence. The fear of loss of tenancy right discourages all initiatives to make improvements on land, reclaim waste land or make long term schemes for improving soil fertility. Thus for ensuring social justice as well as for maximum agricultural production, it was necessary to enact a law providing security of the tenure. Hence the owners have been given the right to resume a limited area subject to a minimum area is left with the tenant. The ultimate purpose of this legislation is to confer the rights of permanent occupancy or ownership to the actual tillers. 4. Ceiling on land holdings: Land reforms in India are based on the belief that all lands belonging to the landlords beyond a certain limit would be taken away by the state and allotted to the landless tillers. Legislation for ceiling on existing holdings and unit of application has been enacted in two phases. During the first phase which lasted up to 1972, ceiling legislation largely treated land holder as the unit of application. However, after 1972, it was decided to have family as the basis of holding. Further the ceiling limit was also reduced to bring about a more equitable distribution of this scarce asset.
6. Appraisal of Land Reforms: The land reforms in India were started with a lot of enthusiasm and aggression. However, soon the enthusiasm subsided and there were some serious limitations in the implementation. According to Professor, M L Dantwala, “by and large the land reforms in India are in the right direction and yet due to the lack of implementation, the actual results are far from satisfactory.” As far as the land ceiling act was concerned, a very large number of loopholes were left in the ceiling legislation. Consequently, evasion was possible even within the legal provisions. Hence, there was a very little surplus that could be acquired after the imposition of the ceiling. Secondly, the law provided a number of exemptions for sugarcane farms, orchards, mango groves, grazing lands, lands for charitable and religious trusts, cattle breeding farms etc. All these provisions of exemption were used by the vested interests to evade ceiling on holdings. Similarly, owing to the weak position of the tenants, the law regulating rents is observed more in its breach than in its compliance. When there is pressure on land and the social and economic position of tenants in the village is weak, it becomes difficult for them to seek the protection of law. Moreover, resort to legal processes is costly and generally beyond the means of tenants. Thus, in many ways, despite the legislation, the scales are weighed in favour of the continuance of existing terms and conditions. The principal reasons for poor implementation of land reforms were lack of political will, absence of pressure from below because the poor peasants and agricultural workers are passive, unorganized and inarticulate, lukewarm and often apathetic attitude of the bureaucracy, absence of up-to-date land records and legal hurdles in the way of implementation of land reforms. REFERENCES:
1. Agrawal P K (2000), Issues in Land Reforms, RGICS, working papers 2. Appu P S (1996), Land Reforms in India, A survey of Policy Legislation and implementation 3. Datt Ruddar and Sundharam K P M, (2010), S Chand 4. Ministry of Rural Development, Annual Report, (2001-12) 5. Planning commission: Report of the taskforce on agrarian relations (1978) 6. Sindhu P S, Land Reforms,(2005) welfare and economic growth 7. Venkatasubbiah, (2000) Indian Economy Since Independence

Volume: II, Issue: I ISSN: 2581-5830
GAP GYAN - An International Peer-Reviewed Open Access Journal of Social Sciences
SPECIAL ISSUE ON KNOWLEDGE SOCIETY AND HIGHER EDUCATION MARCH - 2019
https://www.gapjournals.org/
204
SOCIAL PERFORMANCE AND FINANCIAL PERFORMANCE RELATIONSHIP OF COMPANIES: INVESTIGATING THE CAUSAL LINK
Dr. Amena Habbibullah Saiyed
Visiting faculty, S. D. School of Commerce, Gujarat University [email protected]
Abstract The study examines causal association between the social performance, financial performance +and size of select 37 Nifty companies for the period 2010-11 to 2014-15 employing Toda Yamamoto Granger Causality approach. The results of the study found financial performance (ROE) to Granger cause size (Log of total assets), association between CFP - CSP and CSP - Size were not found to be significant. Keywords : Social performance, financial performance, size, granger causality and Toda Yamomoto test INTRODUCTION The number of studies undertaken on the social and financial performance relationship of companies which is regarded as the most questioned area of CSR (Angelidis et. al., 2008) is overwhelming and the number is still growing as researchers are trying to traverse the unexplored territories of this area by employing different research models, different variable measurement techniques, data analysis methods and more in their quest to add to the already existing literature on the subject. But the review of the existing literature on corporate social performance and financial performance relationship has revealed that number of studies exploring the causal link between social performance variables and financial performance variables is very scant and whatever little work that is done in this regard suffers from poor research design, inappropriate statistical method and inadequacies in data which makes the findings of those studies less valuable (Bird et al., 2006). The present study examines the causal association between the social performance and financial performance of the select Indian companies to determine if social performance precedes financial performance or if financial performance precedes social performance employing Toda Yamamoto test as to the best of my knowledge this test has not been employed in the previous studies to assess the causal association between social performance and financial performance relationship. Hence the study makes a unique contribution to the existing literature on social and financial performance relationship. Webb (2005) found a positive causal relationship between capital structure (leverage) and certain CSR measures and a lower cost of debt financing for firms with strong levels of CSR. The study employed agency theory on a panel data set of over 3000 firms studied during the period from 1993-2000. Nelling and Webb (2006) found little evidence of causality between financial and social performance that focus on stakeholder management. The results of their study also indicated that strong stock market performance results leads to greater firm investment for employee relations, but CSR activities do not influence financial performance. Makni et. al. (2009) investigated the causal link between CSP and CP of 179 Canadian public firms employing CSP measures of Canadian Social Investment Database for years 2004 and 2005 using Granger causality approach. The study found no significant relationship between composite measure of a firm’s CSP and CFP, except for market returns. Goss and Roberts (2007) investigated the strategic use of CSR investments by firms with companies investing more in CSR when they are challenged with environmental, social and governance concerns using Granger causality to determine the

Volume: II, Issue: I ISSN: 2581-5830
GAP GYAN - An International Peer-Reviewed Open Access Journal of Social Sciences
SPECIAL ISSUE ON KNOWLEDGE SOCIETY AND HIGHER EDUCATION MARCH - 2019
https://www.gapjournals.org/
205
temporal sequencing of these investments. Tyagi (2012) employed pair-wise Granger Causality tests on a panel of 215 firms listed on S&P ESG 500 India index from 2005 to 2010 to examine the direction of causality of variables. The study found significant association between social and financial performance variables. DATA The dataset of the study comprised of financial and social performance data of select 37 Nifty companies. Social performance data for the study was collected using content analysis technique by constructing a dichotomous index which was divided into seven sections each representing a social performance dimension viz. Business Ethics, Transparency and Disclosure (BET&D), Community Relations (CR), Customer and Product related Performance (C&P), Employee Relations (EMP), Environmental Performance (ENV), Responsible Procurement (RP) and Human Rights (HR). The index was constructed after a detailed study of the indices of Ameer and Othman (2012); Ahmad, N., Sulaiman, N. And Siswantoro, D. (2003); Clarkson, M.B.E. (1991), Clarkson, M.B.E. (1995), Hackston, D., and Milne, M.J. (1996); Hopkins (1997), Deloitte RESPECT Index Edition (2014); KLD ESG scores and Business Responsibility Report framework given by SEBI in particular. The data was collected from annual reports, sustainability reports, business responsibility report and other company publications for the period 2010-11 to 2014-15. A composite score of the social performance of the company was calculated by aggregating the social performance score from different dimensions. Return on Equity (ROE) was taken as proxy for financial performance whereas log of total assets as proxy for size. METHODOLOGY A Granger – Causality test is performed to give results that can be used to draw conclusions that if events in the past can cause events in the future, or predict movements in the future (Gujarati, 2003). In other words in case of two time series variables x and y, x is said to granger-cause y if y can be better predicted using the histories of both x and y than it can be using the history of y alone (Giles, 2011). But the findings of Granger causality technique to be valid it is necessary that the variables are non-stationary and co-integrated (Engel and Granger, 1987). To overcome the shortcomings of this technique Toda and Yamamoto (1995) and Dolado and Lutkepohl (1996) introduced a Modified Wald Test Statistic (MWALD) based on augmented VAR modelling (Shakya, 2015). Toda and Yamamoto granger causality test is valid irrespective of whether a series is I(0), I(1) or I(2), non-cointegrated or cointegrated of any uninformed order (Wolde-Rufael, 2005). The study employed Toda Yamamoto (1995) approach which allows non stationary variables in a standard Granger causality test to examine the causal relationship between financial performance, social performance and size. The Toda Yamamoto test examines the following equations: ROEit = α1i + ∑K β1i,p ROEi,t-p + ∑K γ1i,p CSPi,t-p + ∑K δ1i,p LTAi,t-p + 1i,t (1) CSPit = α1i + ∑K β2i,p ROEi,t-p + ∑K γ2i,p CSPi,t-p + ∑K δ2i,p LTAi,t-p + 2i,t (2) LTAit = α1i + ∑K β3i,p ROEi,t-p + ∑K γ3i,p CSPi,t-p + ∑K δ3i,p LTAi,t-p + 3i,t (3) Where K is the number of lags that adequately models the dynamic interaction between the financial performance (ROE) , social performance (CSP) and size (Log of Total Assets) of each company i (i= 1,...,N) at time t (t = 1,....,T). The method involves a Modified Wald statistics for testing the significance of a vector autoregressive VAR model by introducing m additional lags which are the maximum order of integration of the variables. RESULTS
Descriptive Statistics The financial performance values of the companies for the period under study show a moderately decreasing trend while the social performance values indicate an increasing trend, the volatility in the social performance values is more than the financial performance variables while the deviations in the value of the total assets of the companies is negligible.
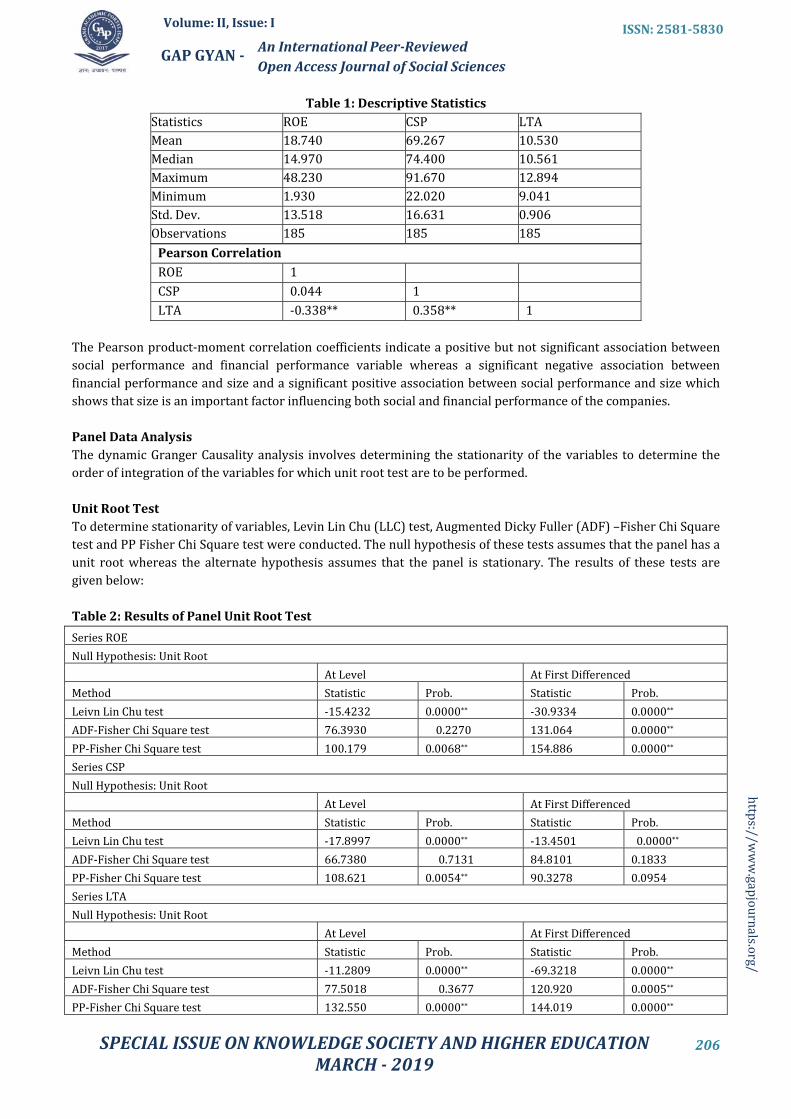
Volume: II, Issue: I ISSN: 2581-5830
GAP GYAN - An International Peer-Reviewed Open Access Journal of Social Sciences
SPECIAL ISSUE ON KNOWLEDGE SOCIETY AND HIGHER EDUCATION MARCH - 2019
https://www.gapjournals.org/
206
Table 1: Descriptive Statistics Statistics ROE CSP LTAMean 18.740 69.267 10.530Median 14.970 74.400 10.561Maximum 48.230 91.670 12.894Minimum 1.930 22.020 9.041Std. Dev. 13.518 16.631 0.906Observations 185 185 185Pearson Correlation ROE 1 CSP 0.044 1 LTA -0.338** 0.358** 1 The Pearson product-moment correlation coefficients indicate a positive but not significant association between social performance and financial performance variable whereas a significant negative association between financial performance and size and a significant positive association between social performance and size which shows that size is an important factor influencing both social and financial performance of the companies.
Panel Data Analysis The dynamic Granger Causality analysis involves determining the stationarity of the variables to determine the order of integration of the variables for which unit root test are to be performed. Unit Root Test To determine stationarity of variables, Levin Lin Chu (LLC) test, Augmented Dicky Fuller (ADF) –Fisher Chi Square test and PP Fisher Chi Square test were conducted. The null hypothesis of these tests assumes that the panel has a unit root whereas the alternate hypothesis assumes that the panel is stationary. The results of these tests are given below: Table 2: Results of Panel Unit Root Test Series ROE Null Hypothesis: Unit Root At Level At First Differenced Method Statistic Prob. Statistic Prob.Leivn Lin Chu test -15.4232 0.0000** -30.9334 0.0000**ADF-Fisher Chi Square test 76.3930 0.2270 131.064 0.0000**PP-Fisher Chi Square test 100.179 0.0068** 154.886 0.0000**Series CSP Null Hypothesis: Unit Root At Level At First Differenced Method Statistic Prob. Statistic Prob.Leivn Lin Chu test -17.8997 0.0000** -13.4501 0.0000** ADF-Fisher Chi Square test 66.7380 0.7131 84.8101 0.1833PP-Fisher Chi Square test 108.621 0.0054** 90.3278 0.0954Series LTA Null Hypothesis: Unit Root At Level At First Differenced Method Statistic Prob. Statistic Prob.Leivn Lin Chu test -11.2809 0.0000** -69.3218 0.0000**ADF-Fisher Chi Square test 77.5018 0.3677 120.920 0.0005**PP-Fisher Chi Square test 132.550 0.0000** 144.019 0.0000**

Volume: II, Issue: I ISSN: 2581-5830
GAP GYAN - An International Peer-Reviewed Open Access Journal of Social Sciences
SPECIAL ISSUE ON KNOWLEDGE SOCIETY AND HIGHER EDUCATION MARCH - 2019
https://www.gapjournals.org/
207
*indicate significance at 1% level The results of the unit root tests indicate that at level some variables are stationary while others have a unit root whereas at first differenced all the variables are stationary. Cointegration Test The results of the above tests indicate that the variables are stationary at first differenced i.e. financial performance, social performance and size are I(1). Based on the tests results, a test of cointegration of the variables can be undertaken.
Table 3: Results of Unrestricted Cointegration Rank Test (Trace) Hypothesized No. of CE(s) Eigenvalue TraceStatistic 0.05Critical Value Prob.** None * 0.503629 36.03867 29.79707 0.0084 At most 1 0.237111 10.12271 15.49471 0.2714 At most 2 0.002940 0.108952 3.841466 0.7413 None * 0.503629 36.03867 29.79707 0.0084 Trace test indicates 1 cointegrating eqn(s) at the 0.05 level * denotes rejection of the hypothesis at the 0.05 level **MacKinnon-Haug-Michelis (1999) p-values
Table 4: Results of Unrestricted Cointegration Rank Test (Maximum Eigenvalue) Hypothesized No. of CE(s) Eigenvalue Max-EigenStatistic 0.05Critical Value Prob.** None * 0.503629 36.03867 29.79707 0.0084 At most 1 0.237111 10.12271 15.49471 0.2714 At most 2 0.002940 0.108952 3.841466 0.7413 None * 0.503629 36.03867 29.79707 0.0084 Max-eigenvalue test indicates 1 cointegrating eqn(s) at the 0.05 level * denotes rejection of the hypothesis at the 0.05 level **MacKinnon-Haug-Michelis (1999) p-values Results of the Trace test and Maximum Eigenvalue test indicate one cointegrating equation at 0.05 level indicating long run association between the variables.
Table 5: VAR Lag Order Selection Criteria Endogenous variables: ROE CSP LTA Exogenous variables: C Lag Log L LR FPE AIC SC HQ 0 -330.6604 NA 13658.33 18.03570 18.16631 18.08174 1 -138.3421 343.0542 0.680800 8.126600 8.649060 8.310792 2 -104.4066 55.03058 0.178877 6.778734 7.693039* 7.101069 3 -88.90464 22.62444* 0.129375* 6.427278* 7.733428 6.887757* 4 -82.32726 8.532819 0.155424 6.558230 8.256225 7.156853 * indicates lag order selected by the criterion Table 5 Indicates the maximum lag length to be used in a standard VAR model may differ depending on the criteria used. Sequential modified LR test statistic (each test at 5% level), Final prediction error, Akaike information criterion and Hannan-Quinn information criterion indicated maximum leg length as three. Four out of six criteria given in the table indicate three lags. Hence K=3 was decided as the maximum lag.

Volume: II, Issue: I ISSN: 2581-5830
GAP GYAN - An International Peer-Reviewed Open Access Journal of Social Sciences
SPECIAL ISSUE ON KNOWLEDGE SOCIETY AND HIGHER EDUCATION MARCH - 2019
https://www.gapjournals.org/
208
Table 6: Results of Trivariate Granger causality test using Toda Yamamoto Framework Dependent Variable: ROE Excluded Chi-sq df Prob.CSP 5.378017 3 0.1461 LTA 6.142998 3 0.1049 All 10.33175 6 0.1114 Dependent Variable: CSP Excluded Chi-sq df Prob.ROE 5.024237 3 0.1700 LTA 2.644151 3 0.4498 All 7.172115 6 0.3052 Dependent Variable: LTA Excluded Chi-sq df Prob.ROE 12.12952 3 0.0070 CSP 4.073523 3 0.2536 All 15.35549 6 0.0177 The results of the Trivariate Granger causality test using Toda Yamamoto Framework show that CSP does not granger causes ROE as the Wald statistic is not significant hence the null hypothesis of non causality cannot be rejected. Similarly for the other relationships the null hypothesis is not significant indicating non causality between the given variables except for the Wald statistic for ROE is significant at 1percent level for LTA indicating ROE granger causes LTA.
CONCLUSION In the present study, Toda Yamamoto approach to Granger causality was applied to the research variables to examine if there exist any causal association between the variables. The study found that ROE the proxy for financial performance granger causes Log of Total Assets, the proxy for size while no causal association was found between ROE and CSP and CSP and LTA. REFERENCES:
1. Ahmad, N., Sulaiman, N. And Siswantoro, D. (2003). Corporate Social Responsibility Disclosure in Malaysia: An Analysis of Annual Reports of KLSE Listed Companies. IIUM Journal of Economics and Management 11(1)
2. Ameer, R., & Othman, R. (2012). Sustainability Practices and Corporate Financial Performance: A Study Based on the Top Global Corporations. Journal of Business Ethics, 108(1), 61-79 3. Angelidis J., Massetti B. and Magee-Egan P. (2008). Does Corporate Social Responsibility Orientation Vary by Position in the Organizational Hierarchy? Review of Business Spring, 23-32 4. Bird, R., Casavecchia, L. & Reggiani, F. (2006). Corporate Social Responsibility and Corporate Performance:
Where to Begin? Retrieved 29 September 2009, <http://www.efmaefm.org/EFMAMEETINGS/EFMA%20ANNUAL%20MEETINGS/2007Vienna/Papers/0366.pdf> 5. Clarkson, M.B.E. (1991). Defining, evaluating, and managing corporate social performance: The stakeholder management model. In: L.E. Preston (Ed.), Research in corporate social performance and policy, volume 12. JAI Press, Greenwich (CT), pp. 331-358. 6. Clarkson, M.B.E. (1995). A stakeholder framework for analysing and evaluating corporate social performance. In: Academy of Management Review 20(1) pp. 92-117. 7. Engle, R.F. and Granger,C.W.J. (1987), “Co-integration and error-correction: representation, estimation, and testing”. Econometrica, 55: 251-276.

Volume: II, Issue: I ISSN: 2581-5830
GAP GYAN - An International Peer-Reviewed Open Access Journal of Social Sciences
SPECIAL ISSUE ON KNOWLEDGE SOCIETY AND HIGHER EDUCATION MARCH - 2019
https://www.gapjournals.org/
209
8. Giles, D. E. (2011) Testing for Granger Causality. Accessed from < http://davegiles.blogspot.in/2011/04/testing-for-granger-causality.html> on March 23, 2018. 9. Gujarati, D. N, (2003). Basic Econometrics. 4th (Ed.) United States Military Academy, West Point. 10. Hackston, D., and Milne. M. J. (1996). Some Determinants of Social and Environmental Disclosures in New Zealand Companies. Accounting, Auditing & Accountability Journal 9, no. 1: 77-108.
11. Hopkins, M. (1997). Defining indicators to assess socially responsible enterprises. Futures 29(7), pp. 581-603. 12. Toda, H. Y. and T. Yamamoto (1995). "Statistical inference in vector autoregressions with possibly integrated processes." Journal of econometrics 66 (1): 225-250. 13. Shakya, S. (2015). The Toda–Yamamoto Approach to Granger Causality Test. Accessed from <http://shishirshakya.blogspot.in/2015/06/the-todayamamoto-approach-to-granger.html> on March 23, 2018. 14. Shakya, S. (2015). The Toda–Yamamoto Approach to Granger Causality Test. Accessed from <http://shishirshakya.blogspot.in/2015/06/the-todayamamoto-approach-to-granger.html> on March 23, 2018. 15. Wolde-Rufael, Y. (2005). "Energy demand and economic growth: the African experience." Journal of Policy Modeling 27 (8): 891-903.

Volume: II, Issue: I ISSN: 2581-5830
GAP GYAN - An International Peer-Reviewed Open Access Journal of Social Sciences
SPECIAL ISSUE ON KNOWLEDGE SOCIETY AND HIGHER EDUCATION MARCH - 2019
https://www.gapjournals.org/
210
AUSTRALIAN TOURISM: SUSTAINING GROWTH THROUGH INVESTMENTS
Dr. Satyajeet S Deshpande (Associate Professor, Economics, New L J Commerce College, Ahmedabad)
[email protected] 09925831823
Abstract
The Australian tourism has not only grown rapidly in the past but is expected to grow at a higher rate in future. The
current paper reviews the way Australian authorities have prepared to sustain this growth by making huge
investments in tourism related infrastructure. The paper explains the consequences of investment (and lack of it) on
the growth of tourism in the country using simple demand and supply diagrams. The paper also suggests some of the
measures which can be used to promote Australian tourism. The first section of the paper reviews the current position
of Australian Tourism. The second section gives an account of the strategy of Australian government for promoting
tourism in the country. The third section diagrammatically provides the demand and supply analysis of the sector in
the country where as the last section provides some suggestions for further improving the performance of tourism in
Australia.
Keywords : Australia, Tourism, Investment, Tourism- Infrastructure A REVIEW OF AUSTRALIAN TOURISM: The performance of tourism sector has continued to remain excellent in Australian economy. This can be concluded on the basis of the increased demand for various tourism-related services in the last six years (2011-12 to 2016-17). The nights spent in hotels, motels and serviced apartments went up by 21%, the inbound passengers on airlines increased by 36%, passengers on domestic airlines went up by 7.8% whereas the overall tourism spend in Australia went up by 29%. Interestingly the demand for tourism in Australia is expected to increase even further in the coming years. A strong demand from international visitors is likely to bolster the Australian tourism. Tourism Forecasts (TRA, 2017) suggests that tourism expenditure will continue to grow at a rate of 6.3% per annum to reach $224.8 billion (nominal terms) by 2026–27. The growth in visitors is expected to create 44% more demand for seats on airlines, 45% more demand for hotels, motels and serviced apartments along with huge increase in international students in Australian universities by 2026-27. Consequently, a strong level of investment in Australia’s tourism industry will be important into the future to ensure that supply can keep pace with growth in demand, and to cater to the increased expectations of consumers. AUSTRALIA’S TOURISM STRATEGY: In order to satisfy this expected increase in demand for tourism in Australia, there were 204 tourism related projects in which investment valuing $ 37.8 billion was in pipeline during 2016-17. Out of this, $ 17 billion worth of investment was in Arts, Recreation and Business Services, $10.1 billion in Aviation Infrastructure projects and $10.8 billion in Accommodation Projects.

Volume: II, Issue: I ISSN: 2581-5830
GAP GYAN - An International Peer-Reviewed Open Access Journal of Social Sciences
SPECIAL ISSUE ON KNOWLEDGE SOCIETY AND HIGHER EDUCATION MARCH - 2019
https://www.gapjournals.org/
211
The total investment of $ 37.8 billion was spread across 204 projects out of which 19 projects were related to airport infrastructure, 83 were related to arts, recreation and business services and 102 were related to accommodation projects. Maximum number of these tourism-infrastructure projects and investments were in states of New South Wales, Queensland and Victoria as these states attract more tourists in Australia compared to other states. All the investment in tourism and related sectors is an attempt to ensure that the supply keeps pace with growing demand in the times to come. If supply of accommodation, aviation and recreation etc fails to match with the rapidly growing demand, all these facilities are likely to become very expensive. The mismatch between demand and supply and the consequent rise in price of these facilities may divert the international tourists to other destinations. Further, tourism being a highly luxurious activity would have a high price elasticity of demand. This will reduce the demand for Australian tourism considerably especially in the presence of numerous other substitutes and alternative destinations around. Failure to invest right amount of money at the right time often leads to problems like inflation and unemployment. However, a long-term tourism policy of the Australian government with big-time investment in tourism-related infrastructure and aggressive marketing is likely to keep the Australian tourism sector buoyant in the times to come. All this investment in tourism infrastructure is also likely to push Australia’s Production Possibility Curve (PPC) to the right making it a tourism-driven growth for the country. Increasing investments in tourism industry is a prudent economic policy to the Australian economy. This is because the future investment prospects for the tourism industry in Australia are also promising, driven by predicted strong demand from international visitors. Tourism Forecasts (TRA, 2017) suggests that tourism expenditure will continue to grow at a rate of 6.3% per annum to reach $224.8 billion by 2026–27. The growth in visitors is expected to create demand for: More than 29 million inbound available seats on airlines – 44% more than in 2016–17 More than 174 million nights in hotels, motels and serviced apartments – 45% more than in 2016–17 More than 933,000 short-term places for international students in Australia’s educational institutions. Consequently, a strong level of investment in Australia’s tourism industry will be important into the future to ensure supply can keep pace with growth in demand, and to cater to the increased expectations of consumers.
1. Analysis of Australian Tourism Industry through Demand and Supply Diagram:
Diagram-1
D
D
P
P-
S
PriPrice
Quantity
S
D
D
E 1
E

Volume: II, Issue: I ISSN: 2581-5830
GAP GYAN - An International Peer-Reviewed Open Access Journal of Social Sciences
SPECIAL ISSUE ON KNOWLEDGE SOCIETY AND HIGHER EDUCATION MARCH - 2019
https://www.gapjournals.org/
212
In the above diagram, DD is the original demand curve for infrastructure (like accommodation, recreation, airlines and restaurants) in Australia whereas SS is the original supply curve for the same. The initial equilibrium is established at point E. Over the last few years, due to an enormous growth in Australia’s tourism, the demand for infrastructure has increased tremendously. This has shifted the demand curve to D1D1from left to right. If Australia does-not simultaneously increase the investment in infrastructure, the supply curve will remain unchanged at SS. This will result into new equilibrium at E1 where the new demand curve D1 intersects the original supply curve S. This results into increase in price of infrastructure. Costly accommodation, flights and recreation may reduce the demand for Australian tourism adversely affecting the tourism industry. Hence, investment in tourism infrastructure is absolutely necessary for sustaining high growth in tourism. Diagram-2
The diagram above helps in understanding the importance of investment in infrastructure for the transportation industry in Australia. When investment is made in developing additional tourism infrastructure, the original supply curve of infrastructure, SS, will shift rightwards to S1S1. The new equilibrium will be E1 where the new demand-curve (D1D1) and new supply curve (S1S1) intersect each other. A simultaneous increase in demand and supply of infrastructure helps in keeping the price of infrastructure constant, at the same level P. This will help in attracting the tourists from across the world to Australia. Despite having many positive short-term effects on employment and income, tourism industry in Australia might have some serious long-term negative effects. There are many examples of tourism having impacted negatively on the physical environment. Over-development along coastal strips (such as the Gold Coast in Queensland) has created ecological problems for many of Australia's beautiful beaches. Plants and shrubs have been removed from rainforests to make room for walking trails. Recreational activities such as four-wheel driving have destroyed sand dunes and vegetation, and bottom-trawling in the Great Barrier Reef has had adverse effects on biodiversity. Visitors have dumped non-biodegradable rubbish into previously unspoilt ecosystems, the construction of sea walls and marinas for the benefit of humans has disrupted natural erosion processes of marine and estuarine environments, and the growing presence of humans in remote areas lacking infrastructure has caused significant
S 1
E 1 E
D
D 1
P
S
Quantity
S
D
D 1
S 1

Volume: II, Issue: I ISSN: 2581-5830
GAP GYAN - An International Peer-Reviewed Open Access Journal of Social Sciences
SPECIAL ISSUE ON KNOWLEDGE SOCIETY AND HIGHER EDUCATION MARCH - 2019
https://www.gapjournals.org/
213
waste management problems. These are just a few of the negative effects that increased human traffic caused by tourism has had on Australia's natural environment. Hence the direction of investment in tourism-infrastructure should be more towards promoting eco-tourism, the tourism which entertains and satisfies the tourists along with minimum impact on ecological balance, leading to sustainable development. 2. Measures to Promote Australian Tourism One of the best methods of promoting Australian tourism across the world is high impact, effective and well-coordinated international tourism marketing campaign. Various media like television, social platforms and sports events can be used for promoting tourism in Australia. Australian authorities can look in to the opportunities of sports-tourism. With some of the most reputed sports-events taking place down-under can provide with immense opportunities to promote tourism. Packages which allow the visitors to blend watching sports with site-seeing can generate huge revenues. Australian open tennis tournament, various cricket tournaments including Ashes series, rugby matches etc are a few such sports events. Besides mere leisure trips, the tourism sector should target business events as well. Major points of marketing Australian tourism have been nature and wildlife, aquatic life, coasts & beaches and food & vine. New attractions like organization of grand and extravagant (Brazilian-Styled) cultural festivals can help attracting more tourists. The authorities will also have to expand the tourism infrastructure by investing sufficiently in it. The aviation capacity must be increased and accommodation facilities should be expanded on continuous basis. Improvement in visa arrangements to make Australia’s visitor-visas easier, quicker and competitive can also go a long way in attracting more tourists. There will also be a need to develop a skilled tourism workforce to serve the visitors satisfactorily. The fast growing economies like China and India wherein the growth of outbound tourists has increased incredibly should be targeted with greater focus. Thus making Australia a desirable tourist destination for more people will require not just one, but numerous efforts on multiple fronts.
REFERENCES: 1. Australian Tourism Statistics, 2018 2. Tourism Forecasts (TRA 2017) 3. Tourism Research Autralia, Tourism Investment Monitor-2017