
Impact of financial leverage on the profitability of real estate ...
63
1 Impact of financial leverage on the profitability of real estate companies A quantitative study from Swedish Stock Exchange BACHELOR DEGREE PROJECT THESIS WITHIN: Business Administration NUMBER OF CREDITS: 15 credits PROGRAMME OF STUDY: International Management, International Marketing AUTHORs: Vladyslav Deboi, Harbi Kurmakhadov, Meng Li JÖNKÖPING May 2021
-
Upload
khangminh22 -
Category
Documents
-
view
3 -
download
0
Transcript of Impact of financial leverage on the profitability of real estate ...
1
Impact of financial leverage on the
profitability of real estate companies
A quantitative study from Swedish Stock Exchange
BACHELOR DEGREE PROJECT
THESIS WITHIN: Business Administration
NUMBER OF CREDITS: 15 credits
PROGRAMME OF STUDY: International Management,
International Marketing
AUTHORs: Vladyslav Deboi, Harbi Kurmakhadov, Meng Li
JÖNKÖPING May 2021
2
Bachelor Thesis in Business Administration
Title: Impact of financial leverage on the profitability of real estate companies: A quantitative
study from Swedish Stock Exchange
Authors: Vladyslav Deboi, Harbi Kurmakhadov, Meng Li
Tutor: Ulf Linnman
Date: 2021-05-24
Key terms: Financial leverage, Profitability, Capital structure, Real-estate industry, ROA
Abstract
Prudent usage of financial leverage by managers can significantly impact business operations
and a corporate’s performance. Thus, the determination and the understanding of the influence
of financial leverage on the profitability of a corporation are intrinsic and indispensable for not
only maximising the value of a firm but also improving its financial performance. This study
adopted a quantitative research method, in which the theories were tested by multiple regression
analysis in line with the positivism paradigm and deductive measure. Moreover, ontology
belongs to the objectivist perspective, in which the authors viewed reality as a mechanism from
the outside and focused only on observable and measurable facts. The authors investigated the
capital structure and profitability of the 18 largest listed real estate companies in Sweden from
2016 to 2020. Leverage essentially consists of total liability to assets, short-term liability to
assets and long-term liability to assets. Profitability is defined as the rate of return on assets
(ROA), which represents the company's degree of profitability relative to total assets from an
overall business perspective widely used for financial analysts. In order to accomplish the
trustworthy study in the regression model, control variables were also introduced that comprised
company size, liquidity and solvency. The result of this paper reveals that financial leverage is
irrelevant for determining ROA in the real estate industry in Sweden.
_____________________ _____________________ _____________________
Meng Li Vladyslav Deboi Harbi Kurmakhadov
ross
图章
ross
图章

3
Table of Contents
1. INTRODUCTION................................................................................................................ 5
1.1 PROBLEM BACKGROUND.................................................................................................... 5
1.2 PROBLEM DISCUSSION ....................................................................................................... 8
1.3 RESEARCH QUESTION ...................................................................................................... 10
1.4 PURPOSE .......................................................................................................................... 10
1.5 PERSPECTIVE OF THE STUDY ........................................................................................... 10
1.6 DELIMITATIONS ............................................................................................................... 11
1.7 DEFINITIONS .................................................................................................................... 12
2. FRAME OF REFERENCE ............................................................................................... 15
2.1 LITERATURE REVIEW ....................................................................................................... 15
2.2 MODIGLIANI AND MILLER ............................................................................................... 19
2.3 THE STATEMENTS MADE ON CAPITAL STRUCTURE ........................................................... 20
2.4 TRADE-OFF THEORY ....................................................................................................... 20
2.5 PECKING-ORDER THEORY ............................................................................................... 21
2.6 HYPOTHESIS .................................................................................................................... 22
3. METHODOLOGY ............................................................................................................ 26
3.1 RESEARCH THEORY ......................................................................................................... 26
3.2 EPISTEMOLOGY ............................................................................................................... 26
3.3 ONTOLOGY ...................................................................................................................... 26
3.4 RESEARCH STRATEGY ..................................................................................................... 27
4. METHOD ........................................................................................................................... 28
4.1 SAMPLING METHOD ......................................................................................................... 28
4.2 DATA COLLECTION .......................................................................................................... 28
4.3 MULTIPLE REGRESSION ANALYSIS ................................................................................... 29
4.4 DATA ANALYSIS .............................................................................................................. 30
4.5 MULTICOLLINEARITY ...................................................................................................... 31
4.6 HOMOSCEDASTICITY ....................................................................................................... 31
4.7 SPURIOUS CORRELATION AND NON-STATIONARITY ........................................................ 32
4.8 VALIDITY AND RELIABILITY ............................................................................................ 33
5. EMPIRICAL FINDINGS & ANALYSIS ........................................................................ 35
5.1 MULTICOLLINEARITY ...................................................................................................... 35
5.2 DESCRIPTIVE STATISTICS ................................................................................................. 36
5.3 HETEROSCEDASTICITY .................................................................................................... 37
5.4 MODEL SUMMARY .......................................................................................................... 37
5.5 STATIONARITY ................................................................................................................ 38
5.6 COEFFICIENTS ................................................................................................................. 39
5.7 CONTROL VARIABLES ...................................................................................................... 43
6. CONCLUSION .................................................................................................................. 45

4
6.1 SUMMARY OF THE FINDINGS ........................................................................................... 45
6.2 THEORETICAL AND PRACTICAL CONTRIBUTION ............................................................... 47
6.3 SOCIAL AND ETHICAL CONSIDERATIONS ......................................................................... 47
6.4 LIMITATION ..................................................................................................................... 48
6.5 SUGGESTIONS FOR FUTURE RESEARCH............................................................................ 48
7. REFERENCE ..................................................................................................................... 50
8. APPENDIX ......................................................................................................................... 59
5
1. Introduction
1.1 Problem background
In retrospect, it can be observed that profitability has always been an indispensable and intrinsic
aspect that gauges and determines a firm’s performance as keeping the profitability at an
adequate level is imperative for a company’s long-term success and survivability. Ergo, a
plethora of researchers illuminated below have been minutely scrutinising and avidly
discerning the core drivers behind profitability.
McGahan and Porter (1997, p. 29-30) made a deduction that the firm-specific effect, which
indicates the slow gradual changes in the industry structure, is less persistent in comparison
with the industry effects. Another researcher scrutinised the impact of financial leverage on
industry profitability, and he concluded that companies, which had a low degree of financial
leverage, received systematically higher returns (Baker, 1973., p. 503). Additionally, two
researchers Dewenter and Malatesta (2001) endeavoured to analyse the dichotomy between
state-owned and privately-owned corporations in the form of labour intensity, leverage and
profitability. The researchers discerned that privately-owned companies have in general a
relatively lower degree of leverage and higher profitability in comparison with the state-owned
companies, which is in line and aggrandise the credibility of the results found by Baker (1973)
(Dewenter & Malatesta, 2001., p. 321-322). However, they emphasised the fact that
governmentally owned companies do not have the possibility of issuing stocks and therefore
have a reliance on borrowed capital provided internally generated funds are not adequate
(Dewenter & Malatesta, 2001, p. 321)
The findings emphasised above implies that profitability can differ depending on the factors
i.e., firm’s characteristics, privately or publicly owned, and industry. Ergo, it is imperative to
consider these aspects in the conduct of the research to increase the probability of fully
comprehending generated outcomes.
Moreover, it is possible that earlier empirical outcomes differ, due to the various ways of
measuring profitability. The choice of a profitability measure varies throughout previous
studies, and a measure that has been common in previous research is Return on Assets or
abbreviated ROA, which is an indicator that reveals how profitable a company is relative to its
6
total assets (Le & Phan, 2017; Simerly & Li, 2000; Gill et al., 2009; Barton & Gordon, 1988;
Ahmed Sheikh & Wang, 2013, Nguyen et al., 2019). Additionally, another measure that can
be seen in previous research is Return on Equity or abbreviated ROE, which is an indicator that
reveals how profitable a firm is relative to its total equity (Le & Phan, 2017; Chaklader &
Chawla, 2016; Abor, 2005). Albeit, as it was aforementioned that both ROE and ROA are the
most frequently utilised measures, it can be also observed that such measure as EBIT to Total
Assets is also used in a research conducted by Margaritis & Psillaki (2010). The three measures
mentioned above are not superior to each other, and the choice of a measure depends on the
stakeholders that intend to utilise the data as well as the perspective of the research (Margaritis
& Psillaki, 2010). Additionally, it is emphasised by the authors that ROA also indicates how
effectively and efficiently assets are managed to generate revenue. Thus, the measure is mostly
suitable for all stakeholders and managers of the firm. Alternatively, ROE reveals and indicates
how effectively and efficiently the management of the organisation is utilising shareholders’
invested capital or shareholders’ equity to generate revenue, and therefore is more suitable and
of utter interest to investors.
A plethora of factors exist that explains the achievement of maximal profitability. The
imperative and frequently debated factor for maximising profitability is the choice of capital
structure. Brealey et al (2013, p. 427) asserted that the core resource of a company is the cash
flow generated by its assets, which can be categorised as safe cash-flow-stream that goes to
debtholders and risky cash-flow-stream that goes to stockholders, and this financing mix of
equity and liability in a company is called capital structure. In the process of measuring a capital
structure, leverage is often utilised in studies as the aspect explains the extent to which
companies have a reliance on debt in financing their business (DeMarzo & Berk, 2013, p. 39).
As it was aforementioned, leverage has been frequently utilised in previous studies and many
researchers have scrutinised and examined how profitability is dependent on capital structure
(Nunes et al., 2009; Khan, 2012; Kester, 1986; Avci, 2016; Margaritis & Psillaki, 2010; Abor,
2005, Nguyen et al., 2019). Different conclusions were made, where Margaritis & Psillaki
(2010), Abor (2005) and Avci (2016) discerned that a positive relationship exists between
profitability and leverage, and it implies that companies with a higher degree of debt are more
profitable. Contrarily, the researchers Nunes et al. (2009), Khan (2012) and Kester (1986)
found and made a conclusion that financial leverage and profitability have a negative
relationship, which implies that companies with a low degree of leverage are more profitable.
7
However, a significant aspect to shed light upon is that the relationships mentioned above do
not claim causality, which explains that it is arduous to assert that leverage influences
profitability, and vice versa. The phenomenon is called reversed causality and it is imperative
to consider as both profitability and leverage possibly impacts each other over the years.
In this day and age, several theories on the optimisation of companies’ capital structure exist.
Modigliani and Miller (1958) presented and illuminated a proposition, which stated the
irrelevance of capital structure. The theory established by the authors implied that the choice
of capital structure does not influence a company’s cost of capital in a perfect market. However,
the theory was revised by the researchers a few years later, which included the statement that
the degree of leverage was relevant (Modigliani and Miller, 1963). The theory vividly
conveyed the fact that a company can increase its profitability and value in a form of a tax
shield begot by financial leverage, indicating that companies should imply a high degree of
debt in their capital structure to maximise the firm’s value.
Another prominent and intrinsic theory in the field related to the capital structure is the
Pecking-order theory established by Myers and Majluf (1984) that states that companies prefer
internal financing to fund business operations. However, external financing is required in cases,
and companies firstly issue the safest security viz. debt, and equity will be issued as a last resort
(Myers, 1984, p. 581).
In contrast to the Pecking-order theory, the Trade-off theory illuminated the statement that
companies can attain an optimal degree of leverage, in which tax shields’ benefits are offset by
expenses from financial distress (Myers, 1984; Kraus & Litzenberger). Thus, a deduction can
be made based on the theory that firms should balance the capital structure and swap debt for
equity and vice versa to reach the maximisation of the value of the company (Myers, 1984, p.
577).
The theories aforementioned are central and crucial in the sphere of capital structure and imply
that a certain correlation and relationship is expected between profitability and financial
leverage. The irrelevance of financial leverage in the cost of capital illuminated by Modigliani
and Miller in 1958 would indicate that a certain relationship is not expected. The revision of
the theory established by the authors in 1963 and the Trade-off theory presented by Myers in
1984 do state that a higher degree of debt is preferable to increase a firm’s value, which begets
8
an expectation of a positive relationship between profitability and financial leverage. Last but
not least, the Pecking-order theory presented by Myers and Majluf in 1984 suggests internal
financing, which leads to a relatively low degree of financial leverage and indicates a negative
relationship between profitability and leverage.
This paper will scrutinise and investigate the real estate industry in Sweden that has seen a
gradual growth in the past year. The relevance of capital structure in the real estate industry is
relatively unknown as well as its relationship with profitability. Moreover, as it was already
presented above, the findings on the relationship between profitability and financial leverage
vary depending on the context of research. Ergo, it gives the basis for the choice of discerning
how profitability is related to financial leverage in the real estate industry in Sweden, which is
a relatively unexplored industry on the mentioned topic.
1.2 Problem Discussion
In the section “the problem background”, it is illuminated the imperativeness of capital
structure and its debated relationship with profitability as well as established theories that shed
light upon the relation between the two variables in order to provide relevant theoretical
background. The following section has an aim to examine further the previous study on the
relationship between profitability and leverage as well as to link the problem background to
the real estate industry in Sweden.
As it was mentioned above, earlier studies have generated different results on the relationship
between profitability and financial leverage. No relationship between the two variables for
companies listed in the Johannesburg Stock Exchange in South Africa was found by two
researchers Mashavave and Tsaurai (2015, p. 85). Another study conducted by
Moahammadzadeh et al. (2013, p. 576) found a negative relationship between financial
leverage and profitability for pharmaceutical companies listed in Iran. Additionally, previously
mentioned researcher Abor (2005, p. 443) found a positive relationship between the two
variables by scrutinising listed companies on the Ghana Stock Exchange. Moreover, Grycova
and Stekla (2015, p. 39-40) came to the conclusion that there is a negative relationship between
the variables in the agricultural industry. Last but not least, two researchers Yazdanfar and
Ohman (2015, p. 113) examined and analysed Swedish SMEs (Small and Medium-sized
Enterprises) and made a deduction that a negative relationship exists between both short-
term/long-term debts and profitability.
9
The following study has an aim to investigate the real estate industry in Sweden. Palm (2016)
refers to a definition of real estate as a property consisting of land and the facilities on it as well
as its natural resources i.e., minerals, water, crops. The intrinsic factor to emphasise is the
imperativeness of the real estate industry in countries’ economy as the collapse and formation
of real estate bubbles have a significant influence on political and economic trajectories
(Edvinsson et al., 2020). With the benefit of hindsight, it can be concluded that the bursting of
the real estate bubble in Japan in the early 1990s begot a long-term economic stagnation, and
one of the major causes of the Great Recession was the collapse of real estate prices (Edvinsson
et al., 2020).
In retrospect, the recent financial crisis of 2008 can be taken as an instance that vividly conveys
the detrimental and atrocious impact caused by the burst of the real estate bubble, which is
elaborately explained and analysed in the book “The 2008 Global Financial Crisis in Retrospect”
written by Aliber and Zoega (2019). The authors emphasised in the book that the global
financial crisis led to the most severe decline in employment, production and in world trade
since the Great Depression. The catalysator that ignited the financial calamity was uncontrolled
lending of capital by financial institutions to individuals and companies that took significant
financial leverage but were not solvent enough (Aliber and Zoega, 2019).
Swedish real estate industry has been growing and flourishing especially since the 1960s
(Edvinsson et al., 2020). According to the data provided by analysts at CEIC, the Swedish real
estate industry saw a growth of an average of 7,4% during the period of March 1987 –
December 2020, which is also estimated and supported by Edvinsson et al. (2020) (CEIC,
2021). The capital structure in the real estate industry can be characterised by relatively high
capital intensity and due to the significant amount of tangible assets in the form of real estate,
it can be seen as a relatively high book value of assets in relation to the revenue earned by the
company. The nature of the capital structure of the companies operating in the real estate
industry is an interesting area to analyse and investigate as it may augment the existing
knowledge and theories related to capital structure. Additionally, our endeavours to find
research that analyses the relationship between financial leverage and profitability of Swedish
real estate companies were to no avail, which begets an assumption that the area is
unexamined.
In light of the above, the problem background and the problem discussion have built the
foundation for the underlying research question of the study.
10
1.3 Research Question
The authors’ goal is to fill the research gap conveyed in the previous sections. Thus, this study
will investigate how financial leverage is related to profitability for real estate companies in
Sweden. The research question that will be explored throughout the thesis is:
Is there a relationship between profitability and financial leverage of real estate companies on
the Swedish market?
1.4 Purpose
The aim of the following study is to analyse and explore the relationship between financial
leverage and profitability of publicly owned Swedish real estate companies. Total debt is the
core variable for leverage in order to answer the research question and fulfil the purpose.
Additionally, the study has a sub-purpose, which is to scrutinise the relationship between short-
term and long-term debt with profitability. It is believed that the research will contribute to the
existing literature and the results will be of utter interest as well as beneficial not only to
managers working in the real estate industry that have to be cognisant of maximising the impact
of the degree of financial leverage on profitability, but also to investors that can have a benefit
of understanding whether a company’s management is utilising its leveraged capital prudently.
1.5 Perspective of the Study
Moreover, the goal of the study is to present the results that would be helpful and beneficial for
managers operating in the real estate industry to determine the degree of financial leverage in
the capital structure of real estate companies. Due to the fact that it is aimed towards managers,
Return on Assets (ROA) is suitable for taking as a profitability measure. It is also stated by
Penman (2013, p. 371) that ROA is of interest to managers as it accounts for the return on total
capital.
It was also aforementioned that the study is also beneficial for investors as public Swedish real
estate companies are scrutinised. Although ROE would be a more suitable measure as it gauges
the return on shareholders’ equity and reveals how efficient the management is utilising the
company’s capital to generate profit, ROA is also helpful and of interest to investors as it
measures a company’s efficiency to allocate its assets (DeMarzo and Berk, 2013, p. 42). Thus,
11
it can be asserted that investors can also use the findings of this research as ROA is often
utilised and can be put into comparison with other industries to give useful implications.
1.6 Delimitations
This section of the research aims to provide a narrower scope on the purpose and research
question of the study. Moreover, another vital goal of the delimitation is to provide specified
and relevant outcomes that will beget a more graspable, comprehensive and focused conclusion.
As it was written in the problem background section, profitability can differ depending on the
factors i.e., firm’s characteristics, privately or publicly owned, and industry. Thus, it is
important to take these aspects into consideration in the conduct of the research to increase the
probability of fully comprehending generated outcomes.
- The first limitation to shed light upon is that the research will focus only on publicly
owned real estate companies listed on OMX STOCKHOLM REAL ESTATE GI
(abbreviated as SX35GI). The research was narrowed down to the index as it measures
how share prices develop and also takes into account all share dividends that companies
pay. The return index thus provides a clearer picture of the total return (Nasdaq, 2021).
- Corporations included in the research will be limited companies that are listed on the
Stockholm Large Cap in order to reduce the risk of the results and scrutinises being
afflicted by potential outliers from differing characteristics that these companies may
possess.
- The research will explore and analyse companies within the timeframe of 2016-2020
except for a company named Nyfosa as it was established in 2018 and does not show the
results for the period of 2016-2018.
Based on the delimitation aforementioned, eighteen conglomerates in the real estate industry
were identified that share the same characteristics. In the commencement of writing this
research paper, it was assumed to utilise the annual reports of these companies to find the
relationship between financial leverage and profitability. However, the number of observations
that amounted to 88 was insufficient, which would beget unreliable results and errors in the
research. Thus, a conclusion was made by the authors of this paper to discern the relationship
between the variables by retrieving the secondary data from quarterly reports, which
consequently limited and increased the number of observations to 348 and reduced the
probability of committing the error in the research.
12
1.7 Definitions
Financial leverage
Financial leverage is a financial term that refers to how much debt is utilised by a company to
finance its assets, due to the lack of cash flows for short-term debts or a need for more capital
to finance investment (Myers, 1984).
Capital structure
Gangeni (2006) stated that the capital structure attempts to explain the mix of securities and
financing sources used by corporations to finance real investment. Also, the author highlighted
that internal finance sources i.e., retained earnings and stock issuance as well external finance
sources i.e., loans and bonds can be utilised by a firm to finance the investments required to
maintain its business operations and enhance its survivability on the market (Gangeni, 2006).
Net income
According to McCamish (2021), the term net income is the amount of money that’s left after
taxes and certain deductions are made from gross income. It is also known as net profit, the
bottom line, and net earnings.
EBITDA
McCamish (2021) stated that earnings before interest, tax, depreciation, and amortisation
(EBITDA) is a measure of a company's operating performance. In practice, it is utilised to
evaluate a firm’s performance without factoring in financing decisions or tax environments.
McCamish (2021) acronym EBITDA by the following components: “Earnings” - stands for the
income; “Before” - excludes the following items from the metric: “Interest”, which depends on
the financing structure of a company; “Taxes”, which are set by the geographic location of a
company; “depreciation and amortisation” based on past investments.
Return on Assets (ROA)
Return on assets (ROA) is a financial ratio that can help to analyse the profitability of a
company. ROA measures how much profit the relative total assets generate for the business.
The calculation and tracking of ROA allow investors, analysts, and managers to analyse if the
company provides a good return on assets. Additionally, return on assets is a comparison metric
that can be used to examine the past performance of a company (McCamish, 2021).
13
Return on Equity (ROE)
It is mentioned by Fridson & Alvarez (2011) that return on equity or abbreviated ROE is a
measure of a company’s financial performance that is calculated by dividing net income
illustrated in the income statement by shareholders’ equity that can be found on the balance
sheet. ROE is conceived as a measure of the profitability of a company in relation to
stockholders’ equity (Fridson & Alvarez, 2011).
Variance Inflation Factors (VIF)
The variance inflation factor (VIF) is a method of detecting the severity of multicollinearity by
looking at the extent to which a given explanatory variable can be explained by all the other
explanatory variables in the equation (Studenmund, 2016, p. 234). In the application of
Statistics VIF, if the value is greater than 10 there is multicollinearity (Pallant, 2016).
Market capitalisation
The aggregate dollar market value of a company's outstanding shares of stock is referred to as
market capitalisation (Fridson & Alvarez, 2011). The authors emphasise that it is determined
by multiplying the current market price of one share by the total number of a company's
outstanding shares (Fridson & Alvarez, 2011)
Long-term debt
According to Porter & Norton (2015), long-term debt is an obligation that will not be paid or
otherwise satisfied within the next year or the operating cycle, whichever is longer, is classified
as a long-term liability, or long-term debt. Additionally, the author emphasises that notes
payable and bonds payable, both promises to pay money in the future, are two common forms
of long-term debt.
Short-term debt
Short-term debt/liability or current liability is an obligation, which comprises such aspects as
accounts payable, wages payable, income taxes payable that will be satisfied within the next
operating cycle or within one year if the cycle is shorter than one year (Porter & Norton, 2015).
Short-term debt + Long-term debt = Total Debt
The addition of long-term and short-term debt is equal to total debt, which is the whole debt
that a company possesses.
14
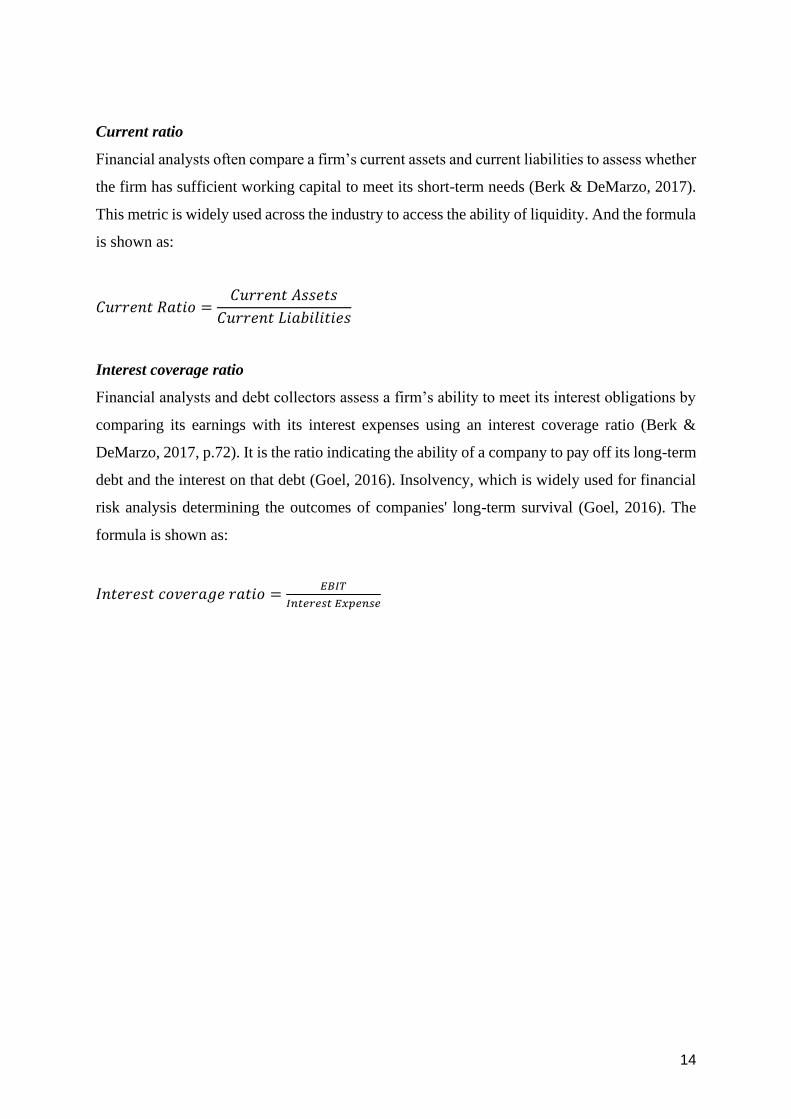
Current ratio
Financial analysts often compare a firm’s current assets and current liabilities to assess whether
the firm has sufficient working capital to meet its short-term needs (Berk & DeMarzo, 2017).
This metric is widely used across the industry to access the ability of liquidity. And the formula
is shown as:
𝐶𝑢𝑟𝑟𝑒𝑛𝑡 𝑅𝑎𝑡𝑖𝑜 =𝐶𝑢𝑟𝑟𝑒𝑛𝑡 𝐴𝑠𝑠𝑒𝑡𝑠
𝐶𝑢𝑟𝑟𝑒𝑛𝑡 𝐿𝑖𝑎𝑏𝑖𝑙𝑖𝑡𝑖𝑒𝑠
Interest coverage ratio
Financial analysts and debt collectors assess a firm’s ability to meet its interest obligations by
comparing its earnings with its interest expenses using an interest coverage ratio (Berk &
DeMarzo, 2017, p.72). It is the ratio indicating the ability of a company to pay off its long-term
debt and the interest on that debt (Goel, 2016). Insolvency, which is widely used for financial
risk analysis determining the outcomes of companies' long-term survival (Goel, 2016). The
formula is shown as:
𝐼𝑛𝑡𝑒𝑟𝑒𝑠𝑡 𝑐𝑜𝑣𝑒𝑟𝑎𝑔𝑒 𝑟𝑎𝑡𝑖𝑜 =𝐸𝐵𝐼𝑇
𝐼𝑛𝑡𝑒𝑟𝑒𝑠𝑡 𝐸𝑥𝑝𝑒𝑛𝑠𝑒
15
2. Frame of reference
This section takes a deep look at the previously published research as well as theories to be
utilised in the empirical studies of this paper. The frame of reference structure has two main
parts. In the first part, the authors of this paper read the conducted studies finding both positive,
negative and absence of correlation and relationship between profitability and financial
leverage. Additionally, the aspects such as the date of publication, industry, country
classification in the world's economies, and theories applied are considered to draw up the full
picture of the investigated topic. In the second section, the most common theories applied in
the previous studies i.e., Modigliani and Miller, Trade-off theory and Pecking-order theory are
presented, described and discussed. Finally, the formulation of the hypotheses to be tested is
presented for answering the research question.
2.1 Literature review
A number of papers are published on the subject of financial leverage and its impact on
profitability. Sundry and numerous ways exist for the measurement of profitability, and the
choice depends on the group at which the research is targeting. Thus, the choice of the measure
utilised in this research is selected based on relevant previous studies.
In Kujaca and Pygman’s (1988) article “Financial leverage in real estate investing”, it was
mentioned that the use of leverage permits broader diversification of a fund’s real estate
portfolio, and the diversified investment minimises the risk of large losses. Moreover, in the
studies made by Margaritis & Psillaki (2010), in which French textiles and chemicals
manufacturing firms were investigated, it was found a positive relationship between capital
structure and firms’ financial performance. To identify the relation the regression model was
applied, and the result showed that the influence on profitability appears to be more powerful
for firms with higher leverage. The same positive result was in the research conducted by Avci
(2016), who examined Turkish manufacturing firms from 2003 through 2015. The author shed
light upon the fact that the industry defines the composition of capital structure that influences
the relationship. Thus, based on his observations, consulting companies are less capital
intensive compared to manufacturing firms that require heavy investments in long-term assets.
Similar results were obtained by Abor (2015) who found a positive relationship between
leverage and profitability retrieving the data from Ghana Stock Exchange companies. In his
16
research, he found that both the short-term debt and total debt reveal a positive relationship
with profitability in comparison to long-term debt that reveals a negative relationship with
profitability (Abor, 2005, p. 443). Thus, the results showed that the short-term debt serves as
the primary financing way in the given case. Another research made by Gill et al. (2011)
analysed how leverage impacts profitability considering the sample of 272 U.S. companies
from 2005 to 2007 as well as the regression model that was applied in the research. It showed
that the debt to total assets has a positive relationship with profitability in the manufacturing
companies. In Sarda studies (2016), a linear regression model was utilised to measure the
relationship between leverage and companies’ profitability. A sample of 32 large private
manufacturing companies performing in Ethiopia from 2006 to 2010 was utilised and a positive
relationship appeared to exist between debt and profitability. In the analysis made by Akhtar
(2012), the relationship between financial leverage and financial performance was observed in
Pakistan within the energy and fuel field. The author presented a positive association between
financial performance and financial leverage of the firm, and thus proved that the companies
with higher profitability can improve their performance by utilising high levels of financial
leverage. Moreover, this study has a plethora of evidence which states that the internal
stakeholders are able to strengthen their financial position on the energy and fuel market due
to external funds such as financial leverages. The imperative aspect for the company's future
flourishing is the willingness to make strategic decisions related to the choice of capital
structure. In another research, the author Al-Taani (2013) investigated the relationship between
capital structure and firm's performance including in sample 45 Jordanian manufacturing firms
available on Amman Stock Exchange from 2005 to 2009. The variables utilised in the study
were the following: return on assets, profit margin, total debt to equity, total assets to short
term debt ratios, and long-term debt to total assets (Al-Taani, 2013). The dependent variable
represented by return on assets and profit margin as indicators for financial execution, and
independent variables such as long-term debt to short term debt to total assets represented for
capital structure. Consequently, Al Taani’s (2013) study found that no significant relation
among Short Term Debt to Total Assets and Return on Assets, Total Debt to Equity and Return
on Assets, Short Term Debt to Total Assets and Profit Margin, long term debt to total assets
and Profit Margin, and Total Debt to Equity and Profit Margin. Based on Asif (2011) statement,
the growth and earning from leverage are significant. Looking from the market perspective,
companies that tend to use loans increase their market value. Moreover, the wealth of the
shareholders is maximised when the firm is able to employ more debt (Memon, Fozia & Bhutto,
2012).
17
In contrast to the findings above, multiple authors Kester (1986), Friend and Lang (1988, p.
275, 277) and Nunes et al. (2009) concluded a negative relationship between leverage and
profitability. Looking from Jarrow (2012) perspective, the capital structure that consists largely
of loans has the danger of default and the less worthy of its capital. Authors Titman & Wassels
(1988) stated that firms that utilise the firm's earnings generate more profit compared to others
that rely on outside capital. The price of a company's stock defines its performance, and when
the stock price is high, instead of relying on outside capital companies may choose to issue
equity to cope with the leverages. In the research made by Wald (1999) the drawn-up result
was that the debt to assets ratio has a significant negative relation with the firm profitability.
The findings were based on the capital structure of firms in such countries as France, Germany,
the United Kingdom and the United States taking into consideration firm size, growth and
firm’s riskiness as explanatory variables (Wald, 1999). In addition, Mandelker & Rhee (1984)
made it clear in their study that in most business sectors, the companies with high profits have
the lowest leverage ratio. In fact, the greatest returns are experienced by a company's
stockholders when such events as a stock repurchase or debt for equity exchange occurs rather
than issuing stocks. Although Nguyen et al. (2019) that analysed the real estate industry in
Vietnam found a negative relationship between the dependent variable ROA and financial
leverage, it has been shown to be insignificant. It was reported by Amsaveni (2009), after the
examination of the relationship between leverage and growth utilising a dataset of 20 years,
about the existence of a negative relation. The reasons stated are either the unrecognized growth
opportunities by the capital market or the inability to overcome the leverage overhang. When
analysing the relationship of these variables in Malaysia companies, Ting et al. (2011) selected
the data from 1997 to 2008 and utilised a panel data analysis to build a regression model which
helped them to conclude that the total debt and tangible assets had a positive relationship, but
the profitability was influenced negatively. Looking at the long-term debt it was found the
negative influence on profitability and tangible assets, and the short-term showed significant
negative effects. Additionally, Jordanian public companies from the Amman stock market
investigated by Soumadi and Hayajneh (2015) with the time frame of 5 years (2001-2006), and
multiple regression models applied in the research showed that both leverage and capital
structure had a negative impact on companies’ execution and financial performance. The
imperative aspect to shed the light upon was that the financial leverage is the same between the
low-growth and high growth companies for the Jordanian companies. In the research by
Vijeyaratnam and Anandasayanan (2015), in which the manufacturing companies in Sri Lanka
18
analysed between 2008 to 2012 years, the concluded result stated that the non-debt tax shield
had an imperative negative impact on the profitability of these companies. Another interesting
finding was in the research made by Yinusa & Rodnonova (2018) in which he selected up to
115 Nigerian companies in the period of 1998 to 2016 and studied the relationship between
profitability and leverages. It was concluded in the research that the companies’ performance
was negatively related to leverages. The proof is found in Dalbor and Upneja (2002) reports
that enhanced firm quality and growth opportunities were related negatively to long-term debt
usage.
Looking at the profitability, Chaklader & Chawla (2016, p. 271), which made an investigation
of the determinants of capital structure where ROE was utilised as one of the core independent
variables, made a deduction that more profitable companies would use internal funds and issue
debt to benefit from the tax shields, the authors’ motivation to utilise ROE as the measurement
of profitability was unclear in their research. Another researcher Le & Phan (2017) that
scrutinised the impact of capital structure on profitability had ROE as the core element for
analysing. However, unlike the study priorly mentioned, the authors included other variables
that convey profitability i.e., ROA and Tobin’s Q. The target group in this research, which are
managers of the real estate industry, paved the way for the choice of ROA as the core
measurement of profitability as this ratio is ubiquitously and frequently utilised by managers
and stakeholders and is an adequate measure that reflects return controlled by management
(Bettis, 1981, p. 384). Furthermore, another author Simerly & Li (2000, p. 40) asserted that
ROA is as intrinsic as ROE, due to the fact that the latter measure ignores that influence begot
by certain types of resource investment. Thus, the researchers concluded that ROI (Return on
Investment) and ROA are more appropriate measurements of profitability for capturing a
company's contribution to the more general investment of resources. Finally, asserting that
ROA is superior to ROE would be misleading as the choice of the ratio depends on the type of
research conducted and the target group. In the case of this study, it was decided to utilise the
ROA as the core measurement of profitability due to the arguments aforementioned.
The following theories, which also have been mentioned in most previous studies are central
for the area of capital structure:
• The revised theorem of Modigliani and Miller (1963).
19
• The Trade-off theory (Myers, 1984) does in general advocate higher debt levels for
increasing firm value, which leads to a positive relationship between leverage and
profitability,
• The pecking-order theory (Myers & Majluf, 1984) suggests internal financing, leading
to relatively lower debt levels and a negative relationship between leverage and
profitability”.
In the light of the above mentioned, a plethora of sources has been reviewed and analysed to
provide solid information to be used in the further discussion part of this paper. The review
vividly shows how such factors as time frame, countries’ economy and financial systems,
industry, methods and applied theories impact the result of the studies. The proof is retrieved
from McGahan and Porter (1997, p. 29) who said that the drivers of profitability may vary
depending on the industry as well as in the composition of capital structure”. Due to this reason,
researchers have not reached a consensus. In Sweden, which is the research focus in this study,
there is a limited number of studies related to our topic. However, the research conducted by
Kokko (1990) emphasised that the number of real estate and financial companies grew fast as
businesses were financed by borrowed funds. By scrutinising and utilising the data retrieved,
it allowed us to formulate precise hypotheses, and write the proper analysis that fills the found
gaps and provide tremendous value to the existing research.
2.2 Modigliani and Miller
Modigliani and Miller presented its prominent paper in 1958 where the researchers shed light
upon the choice of capital structure and the way of implying it on the businesses (Modigliani
& Miller, 1958). Modigliani and Miller gave compelling arguments for the irrelevance of the
company's capital structure based on a few assumptions. However, five years later, the authors
revised, altered the theorem and presented it in the article named “Corporate Income Taxes
and the Cost of Capital: A Correction”, where they concluded that capital structure is relevant
(Modigliani & Miller, 1963). It can be thought that the theorem is obsolete, however, the
theorem of Modigliani and Miller has been at the core in the field related to capital structure
and is still taught at educational institutions in this day and age. Due to the intrinsic role the
theorem has been having in the discussions of capital structure, the authors of the following
paper concluded to include the theorem as a core theorem for the theoretical framework.
20
2.3 The statements made on capital structure
Two prominent researchers Modigliani & Miller (1958, p. 268) made a statement that a
company’s capital structure has no relevance with its total value. However, the statement was
based on the assumption that companies operate in a perfect market, which means that
companies operate in a market where there are no taxes and where the cost of capital is equal
amidst companies in the same class, bonds give a constant return etc. (Modigliani & Miller,
1958, p. 266-268, 273-274). Albeit the theorem aforementioned is unrealistic, it is intrinsic to
understand what degree of capital leverage would be most optimal for a company.
After strong criticism towards the theorem due to the exclusion of taxes in the research, the
authors revised their theorem in 1963. Modigliani & Miller (1963) emphasised and confessed
that the negligence of taxes in their research was a mistake as the tax shield accompanying debt
had relevance with the firm's value. The authors continued with the statements that arbitrage is
not just a function of an expected net-tax return, but also of the degree of leverage and tax rate
(Modigliani & Miller, 1963, p. 434). Consequently, the researchers concluded that a company
can increase its value by maximising its financial leverage and as a result utilise the benefits
begot by tax shields (Modigliani & Miller, 1963, p. 434).
The theorem is at the core of this study, which indicated that a positive relationship between
profitability and financial leverage is expected.
2.4 Trade-Off Theory
On the contrary, opposed to Modigliani and Miller’s theorems related to capital structure and
their statements on the relevance of financial leverage on company performance, two
researchers Kraus & Litzenberger (1973) introduced the trade-off theory, which states that
companies can attain and maximise their value by having an optimal capital structure. In lieu
of having companies unlimitedly rising levels of leverage to maximise company value, the
trade-off theory asserts that companies have a particular capital structure to strive for reaching
the point of having the highest possible and maximum company value. Consequently, it begets
a form of balancing where companies deliberately should increase the level of debt or decrease
it to reach the optimum (Myers, 1984, p. 577). The balance of capital structure emphasised
above stem from the profit gained from tax shields and the expenses of potential financial
21
distress and bankruptcy, where the optimum is met when the benefits of tax shields are
counterbalanced by the expenses related to debt (Myers, 1984).
Kraus & Litzenberger (1973, p. 911) endorsed the proposition made by Modigliani & Miller
(1958) that capital structure is irrelevant under the assumption of the perfect market. The
authors asserted that bankruptcies, taxes and other imperative aspects in the imperfect market
do have an impact on the capital structure and its effect on company value. Moreover, the
researchers stated that the benefit of tax shields stems from the tax-deductibility of interest
expenses, where financial leverage causes a decrease in a company’s income tax liability and
an increase in after-tax profit. Ergo, the implication of the trade-off theory established by Myers
(1984) asserts that an increase in a company’s financial debt is beneficial but to a certain level
or limit. The excess in the financial leverage that exceeds the limit beget costs that erode the
benefits (Myers, 1984).
The theory indicates that the level of financial leverage has initially a positive relationship with
profitability, however, the relationship becomes negative after costs of financial distress and
benefits from tax shields reach a point of break-even. Thus, it can be asserted that the traditional
approach of the theory established by Myers (1984) has a concave relationship with
profitability than linear.
2.5 Pecking-Order Theory
Myers and Majluf (1984) established a fundament for the pecking-order theory that shed upon
a different view on capital structure in comparison with the trade-off theory. The theory
established by the researchers endeavours to illuminate how companies choose their capital
structure. One of the core ideas proposed by Myers and Majluf (1984) was that the fact that
managers have access to insider information that is not available to stakeholders can affect the
managerial decision-making in what project to undertake and how it should be financed. As it
is asserted by the authors, issuing stocks to generate more equity to finance the business
operations can be perceived as a negative sign and news for shareholders, thus managers may
relinquish a positive NPV (Net Present Value) opportunity to shy away from giving inadequate
and potentially unpleasant signals to shareholders (Myers & Majluf, 1984, p. 188).
The researchers mentioned above concluded that if investments possibilities occur over time,
then shareholders will conceive the financial slack as valuable as the company can benefit from
22
these opportunities. However, if the company does not have availability to low-risk debt or an
adequate amount of internal funds, then it might be reasonable for a company to omit projects
to shy away from issuing risky securities, albeit they have a positive net present value (Myers
& Majluf, 1984).
Myers (1984, p. 581) drew the dichotomy between the trade-off theory and pecking-order
theory and asserted that in lieu of endeavouring to balance and find the optimal degree of
financial leverage, the company will follow a particular financing pecking order. The pecking
order states that companies will primarily utilise internally generated funds when financing is
needed. The theory also states that if the requirement of external funding is inevitable, then
companies will initially issue debt; the second option will be the issuance of mixed hybrid
securities, and the last option will be the issuance of additional equity (Myers, 1984, p. 581).
2.6 Hypothesis
Short-term debt and profitability
By scrutinising the literature aforementioned, it can be observed that earlier empirical results
and conclusions came to various outcomes on the relationship between profitability and short-
term debt as such authors as Khan (2012), Zeitun & Tian (2007), Yazdanfar & Öhman (2015)
found a negative relationship between the variables whereas Gill et al. (2011) and Abor (2005)
came to the deduction that there is a positive relationship between profitability and short-term
debt. However, it is imperative to emphasise that the authors priorly mentioned who found a
positive relationship between the variables utilised Return on Equity as a measurement of
profitability, which might impact the conclusion the researchers made. Albeit it can be seen
different results on the relationship between profitability and short-term debt, it can be asserted
that a relationship exists, and this begets the following hypothesis:
H0: No relationship exists between short-term debt and profitability
HA: A relationship exists between short-term debt and profitability
Long-term debt and profitability
In retrospect, it can be concluded that earlier empirical results made by Abor (2005), Yazdanfar
& Öhman (2015) indicated a negative relationship between profitability and long-term debt
whereas Gill et al. (2011) that analysed the firms in the manufacturing sector found a significant
positive relationship between the variables.

23
The real estate industry can be observed to have a high degree of long-term debt and it is of
utter interest to analyse and see the impact of long-term debt and its significance in relation to
profitability. Thus, the following hypothesis was established:
H0: No relationship exists between long-term debt and profitability
HA: A relationship exists between long-term debt and profitability
Total debt and profitability
There is a significant number of research and theories in regard to total debt. As it was observed,
in the research by Margaritis and Psillaki (2010, p. 628) authors found that total debt to assets
has a positive and significant relationship with profitability and efficiency. The same result
about the positive relationships was found in the study by Gill et al. (2011) and Abor (2005).
In comparison to these findings, both researchers' Khan (2012) and Nunes (2009) found a
negative relationship between total debt and profitability. Since the research proved to show
the discrepancy in results as well as variation of theories to forecast the relationship between
total debt and profitability, it becomes necessary to enquire about the relation existence and
compare findings to the theories utilised previously. From the previously mentioned theories,
the Modigliani and Miller (1963) and the Trade-off theory established by Myers (1984) are
true when a positive relationship exists while the Pecking-order theory is false by supporting
the negative relationship (Myers & Majluf, 1984)
H0: No relationship between total debt and profitability
HA: A relationship between total debt and profitability
Size
Multiple researchers found a negative correlation between size and profitability (Yazdanfar &
Öhman, 2015; Goddard et al., 2005). On the other hand, some studies found the opposing
relationship when size is positively related to profitability (Chadha & Sharma, 2015; Simerly
& Li, 2000). There are previous studies in which size was calculated in a variety of ways. In
this study, market capitalisation takes the place since it captures the potential value to be created
in real estate companies. Based on the relationship shown in the results from studies before, it
is assumed that some form of relationship between size and profitability exists. Thus, the
following hypothesis should be considered:
24
H0: No relationship between size and profitability
HA: A relationship between size and profitability
Liquidity and profitability
Financial analysts and creditors examine a firm's current assets and current liabilities to
estimate where the firm has sufficient working capital to meet its short-term need (Berk &
DeMarzo, 2017). Liquidity has been selected as one of the control variables by many previous
researchers. Andersson & Minnema (2018) selected the current ratio for the control variables,
Goddard et al. (2005), found the positive relationship between liquidity and profitability, and
Samo & Murad (2019) also indicates that there is a positive relationship between liquidity and
profitability in their research. Previous research elaborates various relationships between
liquidity and profitability. Hence, this research adopted the same notion, and the following
hypothesis is established:
H0: No relationship exists between liquidity and profitability
HA: A relationship exists between liquidity and profitability
Solvency and profitability
Solvency denotes the ability of a company to pay off its long-term debt and the interest on that
debt (Goel, 2016). It also indicates tremendous importance for financial risk analysis, which
determines the outcomes of companies' long-term survival (Goel, 2016). The financial ratio
used in this research is the interest coverage ratio. It is commonly used to discover how
efficiently a company can pay interest on outstanding debt, considering that all real-estate
companies have high leverage.
Solvency has not been widely used in previous research to profitability. However, Hapsari et
al. (2016) drew the conclusion in their research that solvency has no significant influence on
profitability. Another study from Sucipto & Chasanah (2019) also states that the solvency ratio
measured by the interest coverage ratio has no effect on profitability. Thus, the following
hypothesis is established:
H0: No relationship exists between solvency and profitability
HA: A relationship exists between solvency and profitability
25
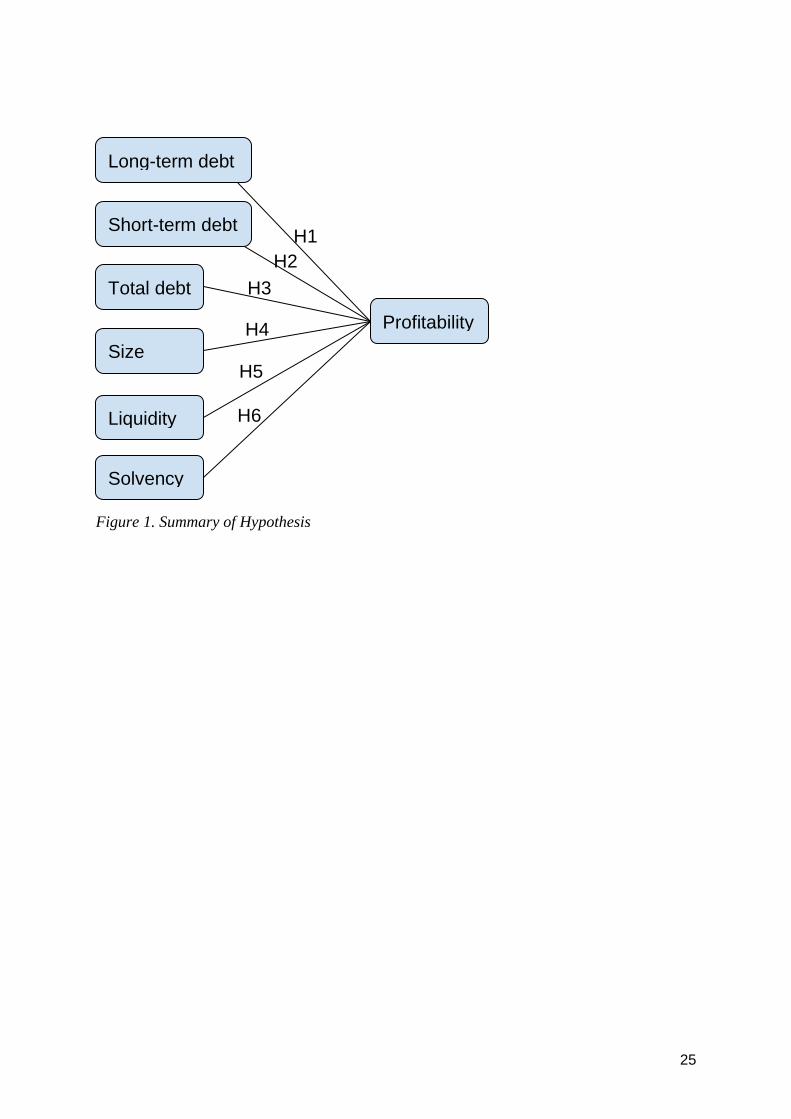
Figure 1. Summary of Hypothesis
Long-term debt
Short-term debt
Total debt
Size
Liquidity
Solvency
Profitability
H1
H2
H3
H4
H5
H6
26
3. Methodology
3.1 Research theory
The deductive theory is defined by Bryman and Bell (2015) as representing the most common
view of the nature of the relationship between theory and research. In general, the process of
deduction is very linear, and can be summarised in six steps-theory, hypothesis, data collection,
findings, a hypothesis confirmed or rejected and revision of theory (Bryman & Bell, 2015,
p.11). Another approach to the research theory is called inductive, which is the process of
induction involving drawing generalisable inferences out of observations (Bryman & Bell,
2015, p.12). Oppositely, induction is the reversed process whereas deduction, from
observations to theory (Bryman & Bell, 2015). The characteristics of this study are suitable to
deductive measure, which the essential emphasis in our thesis is to examine the applicable
hypothesis between profitability and capital structure for real-estate companies in the Swedish
market based on existing theories, not endeavour to generate new theory. Hence, the six steps
method as mentioned above in deduction is indicated for this thesis.
3.2 Epistemology
It was lucidly demonstrated by Van de Ven (2007) that the definition of any frame of research
is a philosophy of science that acquaints a scholar’s approach to the essence of the phenomenon
examined (ontology) and methods for understanding it (epistemology). In another expression,
an epistemological issue is regarded as acceptable knowledge in a discipline (Bryman & Bell,
2015). This research paradigm belongs to positivism, which is an epistemological stance that
advocates the application of the methods to study social reality in natural sciences (Bryman &
Bell, 2015, p. 15). The study purpose is to discover the relationship between capital structure
and profitability rely on empirical findings and theoretical framework. In line with the
positivism paradigm, the authors maintained an objective, and value-free approach throughout
the whole research paper, which the authors will not try to discover the reason in depth from
an interpretive perspective.
3.3 Ontology
The question of social ontology is regarded with the nature of social entities, which the
orientation is whether social entities can and should be viewed as objective entities that have a
27
reality external to social actors or be considered as social constructions built up from the
perceptions and actions of social actors (Bryman & Bell, 2015, p. 20). These positions are
referred to respectively as objectivism and constructionism (Bryman & Bell, 2015, p. 20).
Objectivism refers to the ontological view that implies that social phenomena are beyond our
reach or influence for people as external facts (Bryman & Bell, 2015, p. 21). An alternative
ontological position, constructionism, implies social phenomena and categories are not only
produced through social interaction but also that they are in a constant state of revision (Bryman
& Bell, 2015, p. 22). This study involved an objectivist perspective, in which the author views
reality as a mechanism from outside and focusing only on observable and measurable facts.
3.4 Research Strategy
Quantitative and qualitative research both refer to the useful methods of business
research. The distinction between quantitative and qualitative are majorly different in their
distinctive cluster of research strategies (Bryman & Bell, 2015). Quantitative research can be
construed as the research strategy that emphasises quantification in the collection and analysis
of data, which orientation of the research belongs to deductive, testing of theory, positivism
and objectivism (Bryman & Bell, 2015, p. 27). By contrast, qualitative research was a research
strategy that usually emphasizes words rather than quantification in the collection and analysis
of data, which correspondingly are inductive, generation of theory, interpretivism and
constructionism (Bryman & Bell, 2015, p. 27).
Hence, according to Bryman and Bell (2015), the chosen approaches are adequate and suitable
for conducting a quantitative study, in which the theories would be tested by regression analysis
in quantitative research in line with the positivism paradigm. The authors of this research
maintained an objective and value-free approach throughout the whole paper to demonstrate
the impact between leverage and profitability for public real-estate companies in Sweden.

28
4. Method
4.1 Sampling method
Non-probability sampling refers to the non-random selection of cases for a study (Bryman &
Bell, 2013). Based on the characteristics and application conditions of our research objects, a
type of non-probability sampling called judgemental sampling is selected as an appropriate
sampling method that fulfils the purposive sampling function in this study. Judgemental
sampling refers to the measure in convenience sampling that the population are chosen by the
researcher`s criteria (Malhotra, et al., 2017). The researchers exercised the expertise to choose
the certain companies to be included in the sample because we believe the similar
characteristics of the public companies are representative of the population in study purpose
without potential interference from outliers. Thus, sorted companies by market capitalisation,
and select companies with a market capitalisation in large and exclude companies that have
just gone public or will be privatised.
Determining the sample size is a crucial measure for a regression model, that is, with small
samples examination might obtain results not generalised with other samples (Pallant, 2016).
Ergo, we implemented the notion from Tabachnick & Fidell (as cited in Pallant, 2016) that
intaking independent variables attended to the minimal requirement of N > 50 + 8M, where M
indicates a number of the independent variables and N represents a number of the observations.
4.2 Data collection
The data utilised in this research paper is secondary data that is already being collected for
specific purposes (Malhotra, et al., p. 111). We practice the advantages of secondary data in
terms of relatively inexpensive and quickly obtained. The population for this study is real-estate
public companies floated in OMX Stockholm Real Estate GI and corresponding data were
collected directly on the official website of each company. Researchers of this study have
selected 5 years interim reports and financial ratios for purposely selected companies in the
REAL ESTATE index of X35GI, for our study sampling, in which 18 companies (see below
as figure 4) in the entire index that fulfil the criteria of large capitalisation. All require sufficient
debt capacity and considerable turnover to eliminate the risk of misleading results. The span of
this study started from 2015 to 2020, meanwhile in total 348 observations have been collected
29
to meet the study purposes since the continuous five-year data can avoid temporary effects and
improve reliability.
However, a few data were missing in the original report. The researchers utilised the solution
of interpolation, which accordingly the missing variable was theoretically substituted by proxy
variables due to the proportionality of regression analysis relationships between changes
among variables, rather than the absolute level of the variables (Studenmund, 2016, p. 346).
Moreover, the potential error and inaccuracy of secondary data also have been considered. The
data used in the research is public external secondary data that the audit company has notarised.
Therefore, it provides a significant degree of accuracy and credibility for the present study.
When collected data, the entry process is applied directly to the Excel table created from the
website and then imported into the SPSS analysis software. To improve the overall operability,
the researchers also conducted manual screening to ensure that the correct data was collected
for the target population.
4.3 Multiple regression analysis
Regression analysis is utilised by econometricians to make quantitative estimates of economic
relationships that previously have been completely theoretical (Studenmund, 2016, p. 5).
Multiple regression or multivariate regression is a class of measures to discover the correlation
among one continuous dependent variable and two or more independent variables or predictors
(Anderson, 2014). Researchers applied the most common analysis in regression named
standard multiple regression, in which all independent variables are entered into the model
simultaneously (Pallant, 2016). The experimental process refers to the 6-steps regression
analysis method, including reviewing the literature and develop the theoretical model, specify
the model, hypothesise the expected signs of the coefficients, collect the data, estimate and
evaluate the equation and document the results (Studenmund, 2016, p. 66). Equally important,
the regression model requires a sound theoretical foundation and conceptual reasons.
Whereupon researchers formulated theoretical frameworks by consulting peer-reviewed
literature and existing economic models, in which the corresponding financial indicators were
implemented representatively as variables and participated in the regression model.
The variables in this study are categorised into variables of interest and control variables. A
control variable is not the object of interest in the study. It is rather the regressors included to
30
hold constant factors, which possibly affect interest variables suffering from omitted variable
bias if neglected (Stock & Watson 2020). Standardised Coefficients used in the regression
indicates the means that these values for each of the different variables have been converted to
the same scale, the unstandardised coefficient values listed as Beta (B) is the major appliance
in this study, which elaborate the degree of correlation in the ranges between -1 and 1. R=.10-
0.29 is small correlation, R= .30-.49 medium correlation, R=.50-1.0 is large correlation (Pallant,
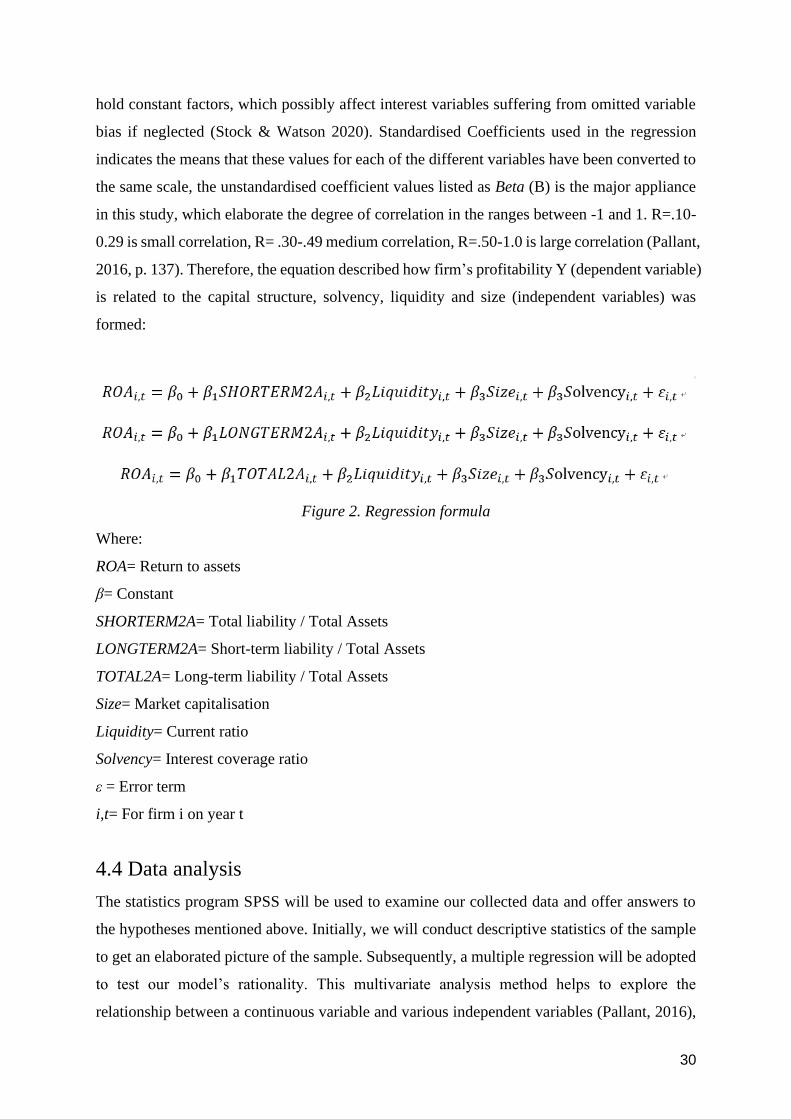
2016, p. 137). Therefore, the equation described how firm’s profitability Y (dependent variable)
is related to the capital structure, solvency, liquidity and size (independent variables) was
formed:
Figure 2. Regression formula
Where:
ROA= Return to assets
β= Constant
SHORTERM2A= Total liability / Total Assets
LONGTERM2A= Short-term liability / Total Assets
TOTAL2A= Long-term liability / Total Assets
Size= Market capitalisation
Liquidity= Current ratio
Solvency= Interest coverage ratio
ε = Error term
i,t= For firm i on year t
4.4 Data analysis
The statistics program SPSS will be used to examine our collected data and offer answers to
the hypotheses mentioned above. Initially, we will conduct descriptive statistics of the sample
to get an elaborated picture of the sample. Subsequently, a multiple regression will be adopted
to test our model’s rationality. This multivariate analysis method helps to explore the
relationship between a continuous variable and various independent variables (Pallant, 2016),
31
meaning that we could separately identify the correlation between our independent variables
and dependent variables as well as the direction of each correlation. According to Pallant
(2016), Cronbach’s Alpha needs to be above 0.7. Before examining the actual results of the
Multiple regression, the assumptions of multicollinearity, normality and homoscedasticity need
to be met (Pallant, 2016). Thereafter, the most commonly used measure called R² or “goodness
of fit” applied to the regression model. it can be explored how much of the variance in the
dependent variables is explained by the regression model by checking the R² (Pallant, 2016).
The higher R², the closer the estimated regression equation fits the sample data, which R² line
in the interval 0R²1 (Studenmund, 2016). The R² close to one shows an excellent fit overall.
The Standard Coefficients give evidence on which variable makes the strongest contribution
to explaining the dependent variable (Pallant, 2016), in this case, profitability. Lastly, possible
correlations and their significance as seen in the ANOVA will help to answer each hypothesis
individually.
4.5 Multicollinearity
Multicollinearity refers to the correlation among the independent variables, which makes it
difficult to make inferences about the individual regression coefficients and their individual
effects on the dependent variable (Lind et al., 2006, p. 439). Therefore, it is very essential to
check collinearity and also it is the first step the author of this study diagnoses after data
collection.
Researchers applied the Collinearity Diagnostics and Coefficients to test collinearity in SPSS.
The general rule is if the correlation between two independent variables is between −0.70 and
0.70, it is possible to use both of the independent variables (Lind et al., 2006, p. 440). In the
application of Statistics VIF, if the value is greater than 10 there is multicollinearity. Another
way is to observe the condition index in the collinearity diagnostics table. When the data is
greater than 15 could indicate a problem of collinearity and greater than 30 is a strong sign
(Hair, et al. 2013). After the two methods of diagnosis, the research could exclude the influence
of collinearity since the data is proved less than the reference value.
4.6 Homoscedasticity
The definition of heteroskedasticity and homoscedasticity indicates the error term ε is
homoscedastic if the variance of the conditional distribution of ε given X is constant otherwise
32
the error term is heteroskedastic, viz. if the distribution at each scatter point in the regression
model is almost the same, it is called homoscedasticity, and if the scatter point distribution of
each X is different, it is called heteroscedasticity (Stock & Watson, 2020, p. 188). The
occurrence of heteroscedasticity will cause problems for the regression model; thus, it needs to
be tested and eliminated. The practical implication of the heteroskedasticity diagnosis is
whether one should use heteroskedasticity-robust or homoskedasticity-only standard errors and
a large number of software programs report homoskedasticity only standard errors as their
default setting (Stock & Watson, 2020, p. 188).
The researchers could implement the diagnosis through the observation from the PP-plot from
SPSS, see Figure 2. Since the research`s model appears to approximate homoskedasticity, no
additional setting needed to be carried out in the software. Just in case, the reachers applied a
double check by running the Breusch–Pagan test for squared residual values as a dependent
variable in the regression equation since the variance of the conditional distribution of ε given
X is constant, the independent variable does not affect the residual value (Studenmund, A.
2016). Test the overall significance with a chi-square test. If the significance in ANOVA shows
P>0.05, then it is homoscedasticity.
4.7 Spurious Correlation and Non-stationarity
One problem with time series data is that if the independent variable has the same underlying
trend as the dependent variable, then the independent variable becomes apparently more
significant (Studenmund, 2016, p.376-377). Studenmund defined such a problem as spurious
correlation (2016), the strong relationship between two or more variables through undetected
underlying relationship, hence the regression is likely untrustworthy and overstated. One of the
typical problems is nonstationary, which refers to the series having one or more basic properties
that do change over time (Studenmund, 2016). As the previous chapter illuminated,
heteroskedasticity is one of nonstationary. The major consequence of nonstationary for
regression analysis inflates R² and the t-scores of the nonstationary independent variables,
which in turn leads to incorrect model specification (Studenmund, 2016, p. 378).
In this study, the data was collected in a seasonal interim report in which all companies
followed the approximate same timetable according to the accounting criterion. In the design
phase of the experiment, such a test was conducted by the experimenters and the measure for
33
delimitation called random walk will be applied by researchers if the nonstationary appears,
which allow the next period’s value to equal this period’s value plus a stochastic error term
(Studenmund, 2016, p. 378). By applying the extension functionality of stationarity in SPSS,
the authors implement the augmented Dickey-Fuller Test which examines the hypothesis if the
variable has a unit root, viz. The null hypothesis of the test is that the time series can be
represented by a unit root, that it is not stationary (Studenmund, 2016, p. 378; Brownlee, 2020).
Thus, If the p-value > 0.05 in the t-test indicates to reject the null hypothesis (H0), the data has
a unit root and is non-stationary and vice versa (Brownlee, 2020).
4.8 Validity and Reliability
Validity incorporates internal validity, external validity, and ecological validity (Bryman &
Bell, 2015). In the case of this research paper, the core focus was on external validity and
ecological validity. The external validity is concerned with the notion of generalisation, which
is the question of whether the results of a study can be generalised beyond the specific research
context (Bryman & Bell, 2015, p. 43). The authors of this paper have already reviewed some
previous literature that to some extent share a similar topic and research problem but in a
different country or region. It was expected that our results could also fit in another country’s
context, meaning that the results should partially align with some of the previous literature.
Ecological validity concentrates more on practical considerations, in which the social scientific
findings are applicable to people’s everyday life (Bryman & Bell, 2015). One of the research
purposes is grounded in a very practical way, in which authors of this study want research
findings to guide management to better evaluate a company’s profitability to invest smartly.
Reliability makes mention of the consistency when measuring a concept, including stability,
internal reliability, and inter-observer consistency (Bryman & Bell, 2015). The notion of
stability also refers to test-retest reliability, in which the test-retest ability of a scale mainly
involves administering it to the same items on two different occasions and calculating the
correlation between the two scores obtained (Pallant, 2016). Preliminarily, it is focused on
collecting 5 years of data from the official websites. The higher test-retest correlation suggests
a more reliable scale, which employed this test-retest reliability in our research through
collecting 5 years more data from these same companies to check if the two different scales
have highly correlated results.
34
Another aspect for assessing reliability is internal consistency (also called internal reliability).
This concerns the degree to which the items that make up the scale are all measuring the same
underlying attribute (Pallant, 2016, p. 6). By checking the internal consistency, it can assist to
identify how strong the items hang together. It was determined to use the concept of financial
leverage as one of our independent variables and it incorporates short-term debt, long-term
debt and total debt. There are several ways to examine the internal consistency, one adopted
way in this study applying Cronbach’s coefficient alpha as the most common method for this.
A reliability test was run in SPSS to see the Cronbach’s alpha of the three items, which ideally
expected a minimum level of 0.7 Cronbach alpha values. If the reliability test result fulfilled
the expectation, it could be combined into an index as the financial leverage for one of our
independent variables.
The authors of this study also engaged in a triangulation strategy to reassure research’s validity
and reliability, which entails adopting more than one method or source of data in the study of
a social phenomenon (Bryman & Bell, 2015). What was done for this triangulation mainly
focused on multi-sources of data and it was always double-checked. As mentioned above,
researchers of this paper utilised secondary data which was published on digital platforms and
gathered through different websites, including annual reports, interim reports, and calculated
financial ratios for triangulation. Additionally, if the data of the same companies on different
platforms, a recheck of the data will perform whether the numbers remain the same among
different platforms. In addition, since the units of the numbers in the reports of each company
are different to display and calculate the number, units were unified and carefully conducted
into account by manual screening.
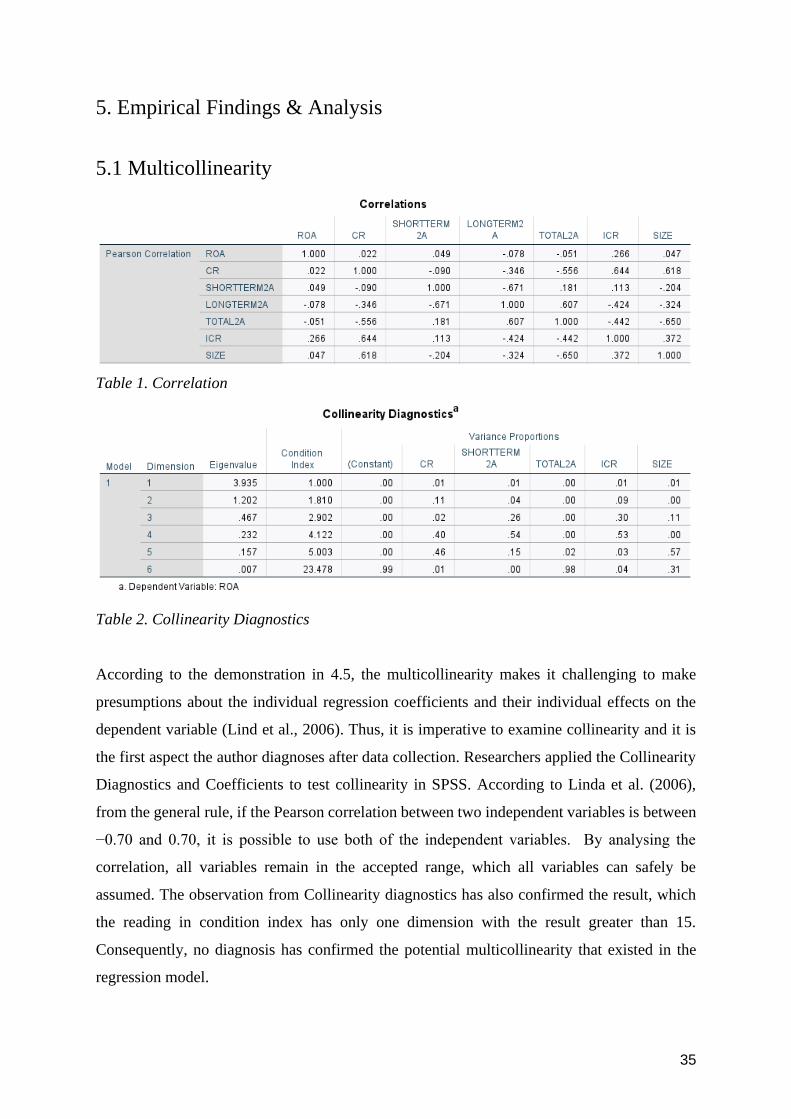
35
5. Empirical Findings & Analysis
5.1 Multicollinearity
Table 1. Correlation
Table 2. Collinearity Diagnostics
According to the demonstration in 4.5, the multicollinearity makes it challenging to make
presumptions about the individual regression coefficients and their individual effects on the
dependent variable (Lind et al., 2006). Thus, it is imperative to examine collinearity and it is
the first aspect the author diagnoses after data collection. Researchers applied the Collinearity
Diagnostics and Coefficients to test collinearity in SPSS. According to Linda et al. (2006),
from the general rule, if the Pearson correlation between two independent variables is between
−0.70 and 0.70, it is possible to use both of the independent variables. By analysing the
correlation, all variables remain in the accepted range, which all variables can safely be
assumed. The observation from Collinearity diagnostics has also confirmed the result, which
the reading in condition index has only one dimension with the result greater than 15.
Consequently, no diagnosis has confirmed the potential multicollinearity that existed in the
regression model.
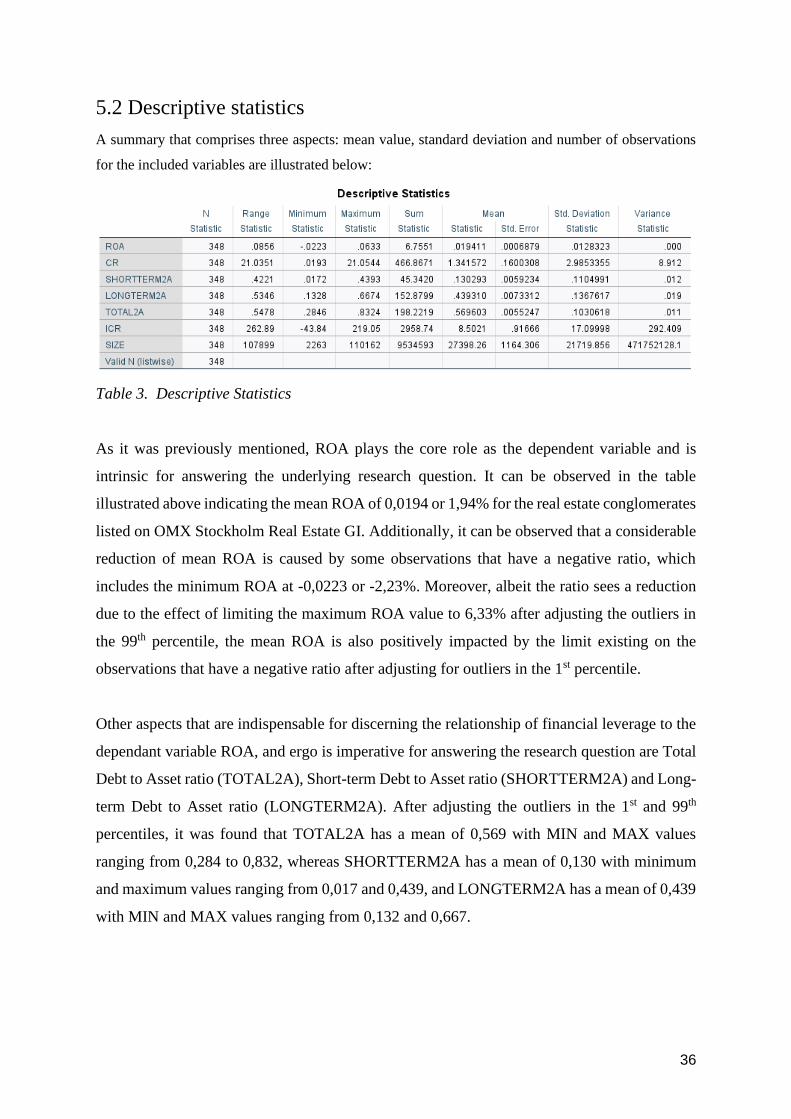
36
5.2 Descriptive statistics
A summary that comprises three aspects: mean value, standard deviation and number of observations
for the included variables are illustrated below:
Table 3. Descriptive Statistics
As it was previously mentioned, ROA plays the core role as the dependent variable and is
intrinsic for answering the underlying research question. It can be observed in the table
illustrated above indicating the mean ROA of 0,0194 or 1,94% for the real estate conglomerates
listed on OMX Stockholm Real Estate GI. Additionally, it can be observed that a considerable
reduction of mean ROA is caused by some observations that have a negative ratio, which
includes the minimum ROA at -0,0223 or -2,23%. Moreover, albeit the ratio sees a reduction
due to the effect of limiting the maximum ROA value to 6,33% after adjusting the outliers in
the 99th percentile, the mean ROA is also positively impacted by the limit existing on the
observations that have a negative ratio after adjusting for outliers in the 1st percentile.
Other aspects that are indispensable for discerning the relationship of financial leverage to the
dependant variable ROA, and ergo is imperative for answering the research question are Total
Debt to Asset ratio (TOTAL2A), Short-term Debt to Asset ratio (SHORTTERM2A) and Long-
term Debt to Asset ratio (LONGTERM2A). After adjusting the outliers in the 1st and 99th
percentiles, it was found that TOTAL2A has a mean of 0,569 with MIN and MAX values
ranging from 0,284 to 0,832, whereas SHORTTERM2A has a mean of 0,130 with minimum
and maximum values ranging from 0,017 and 0,439, and LONGTERM2A has a mean of 0,439
with MIN and MAX values ranging from 0,132 and 0,667.
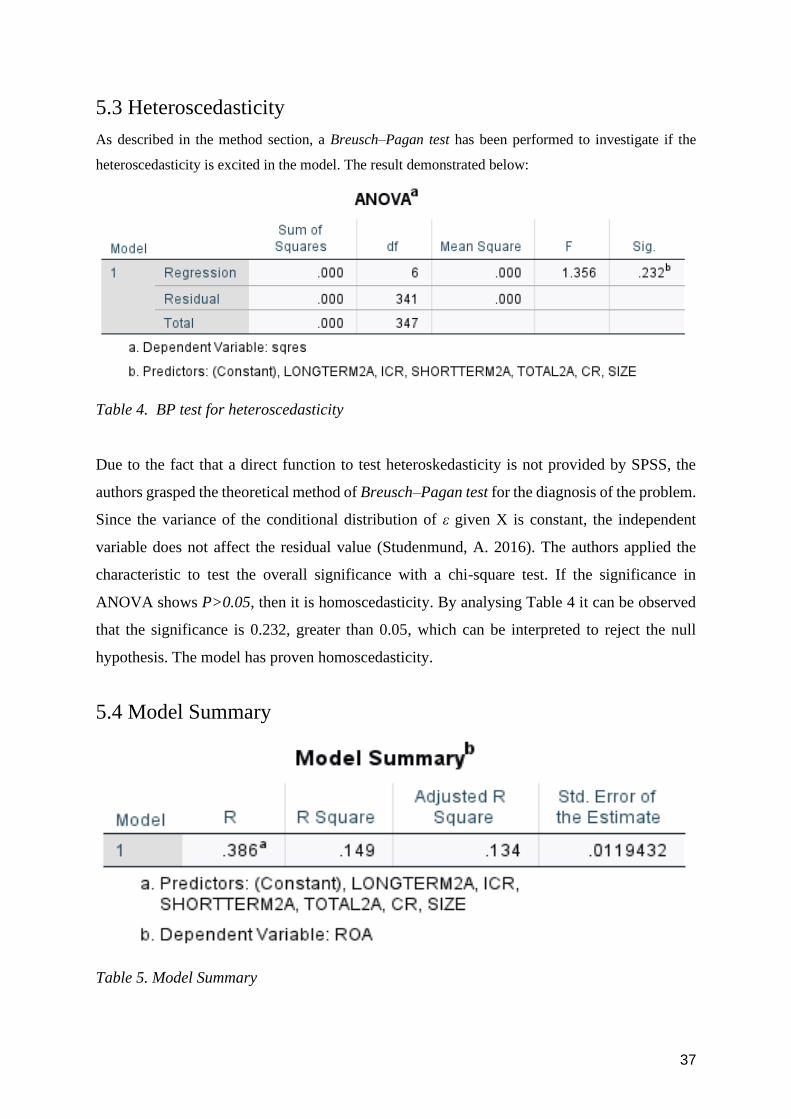
37
5.3 Heteroscedasticity
As described in the method section, a Breusch–Pagan test has been performed to investigate if the
heteroscedasticity is excited in the model. The result demonstrated below:
Table 4. BP test for heteroscedasticity
Due to the fact that a direct function to test heteroskedasticity is not provided by SPSS, the
authors grasped the theoretical method of Breusch–Pagan test for the diagnosis of the problem.
Since the variance of the conditional distribution of ε given X is constant, the independent
variable does not affect the residual value (Studenmund, A. 2016). The authors applied the
characteristic to test the overall significance with a chi-square test. If the significance in
ANOVA shows P>0.05, then it is homoscedasticity. By analysing Table 4 it can be observed
that the significance is 0.232, greater than 0.05, which can be interpreted to reject the null
hypothesis. The model has proven homoscedasticity.
5.4 Model Summary
Table 5. Model Summary
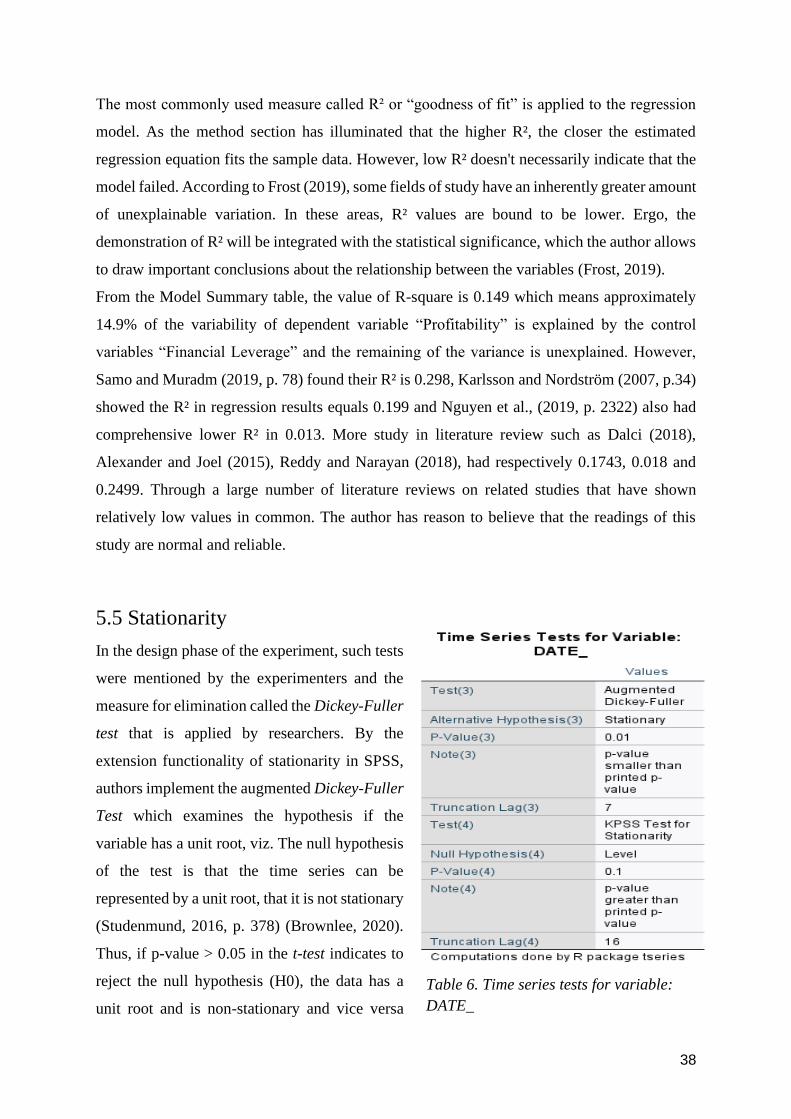
38
The most commonly used measure called R² or “goodness of fit” is applied to the regression
model. As the method section has illuminated that the higher R², the closer the estimated
regression equation fits the sample data. However, low R² doesn't necessarily indicate that the
model failed. According to Frost (2019), some fields of study have an inherently greater amount
of unexplainable variation. In these areas, R² values are bound to be lower. Ergo, the
demonstration of R² will be integrated with the statistical significance, which the author allows
to draw important conclusions about the relationship between the variables (Frost, 2019).
From the Model Summary table, the value of R-square is 0.149 which means approximately
14.9% of the variability of dependent variable “Profitability” is explained by the control
variables “Financial Leverage” and the remaining of the variance is unexplained. However,
Samo and Muradm (2019, p. 78) found their R² is 0.298, Karlsson and Nordström (2007, p.34)
showed the R² in regression results equals 0.199 and Nguyen et al., (2019, p. 2322) also had
comprehensive lower R² in 0.013. More study in literature review such as Dalci (2018),
Alexander and Joel (2015), Reddy and Narayan (2018), had respectively 0.1743, 0.018 and
0.2499. Through a large number of literature reviews on related studies that have shown
relatively low values in common. The author has reason to believe that the readings of this
study are normal and reliable.
5.5 Stationarity
In the design phase of the experiment, such tests
were mentioned by the experimenters and the
measure for elimination called the Dickey-Fuller
test that is applied by researchers. By the
extension functionality of stationarity in SPSS,
authors implement the augmented Dickey-Fuller
Test which examines the hypothesis if the
variable has a unit root, viz. The null hypothesis
of the test is that the time series can be
represented by a unit root, that it is not stationary
(Studenmund, 2016, p. 378) (Brownlee, 2020).
Thus, if p-value > 0.05 in the t-test indicates to
reject the null hypothesis (H0), the data has a
unit root and is non-stationary and vice versa
Table 6. Time series tests for variable:
DATE_
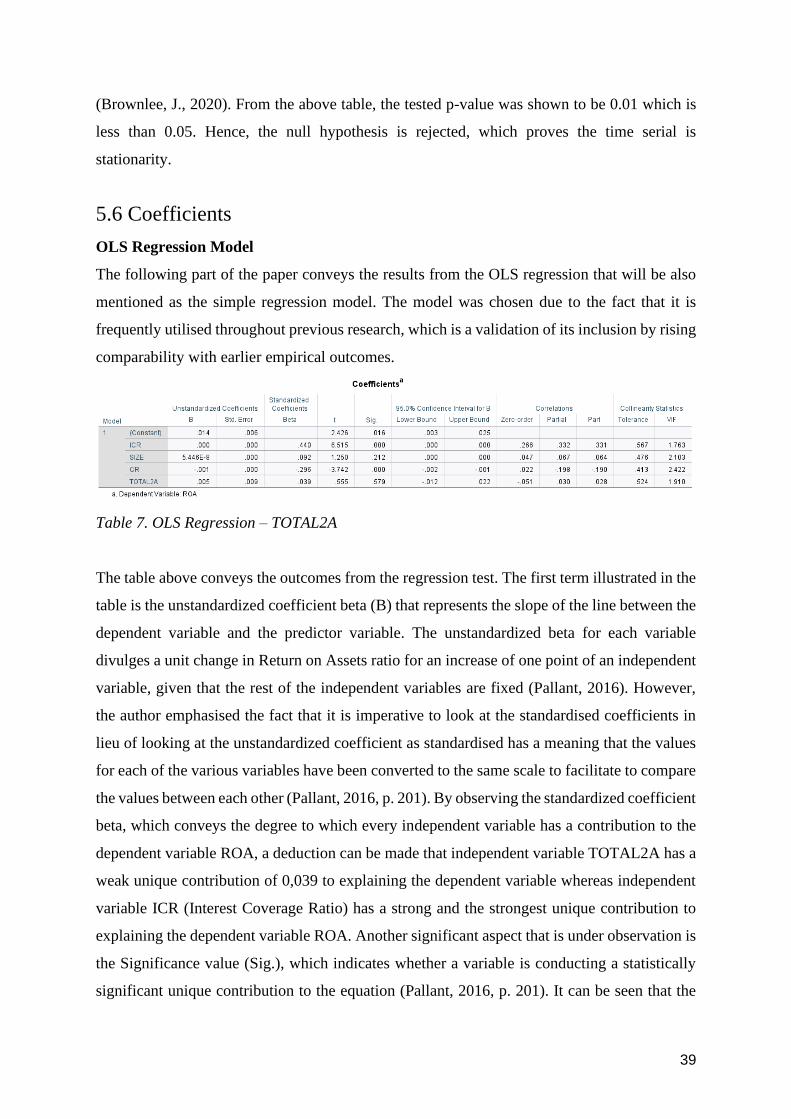
39
(Brownlee, J., 2020). From the above table, the tested p-value was shown to be 0.01 which is
less than 0.05. Hence, the null hypothesis is rejected, which proves the time serial is
stationarity.
5.6 Coefficients
OLS Regression Model
The following part of the paper conveys the results from the OLS regression that will be also
mentioned as the simple regression model. The model was chosen due to the fact that it is
frequently utilised throughout previous research, which is a validation of its inclusion by rising
comparability with earlier empirical outcomes.
Table 7. OLS Regression – TOTAL2A
The table above conveys the outcomes from the regression test. The first term illustrated in the
table is the unstandardized coefficient beta (B) that represents the slope of the line between the
dependent variable and the predictor variable. The unstandardized beta for each variable
divulges a unit change in Return on Assets ratio for an increase of one point of an independent
variable, given that the rest of the independent variables are fixed (Pallant, 2016). However,
the author emphasised the fact that it is imperative to look at the standardised coefficients in
lieu of looking at the unstandardized coefficient as standardised has a meaning that the values
for each of the various variables have been converted to the same scale to facilitate to compare
the values between each other (Pallant, 2016, p. 201). By observing the standardized coefficient
beta, which conveys the degree to which every independent variable has a contribution to the
dependent variable ROA, a deduction can be made that independent variable TOTAL2A has a
weak unique contribution of 0,039 to explaining the dependent variable whereas independent
variable ICR (Interest Coverage Ratio) has a strong and the strongest unique contribution to
explaining the dependent variable ROA. Another significant aspect that is under observation is
the Significance value (Sig.), which indicates whether a variable is conducting a statistically
significant unique contribution to the equation (Pallant, 2016, p. 201). It can be seen that the
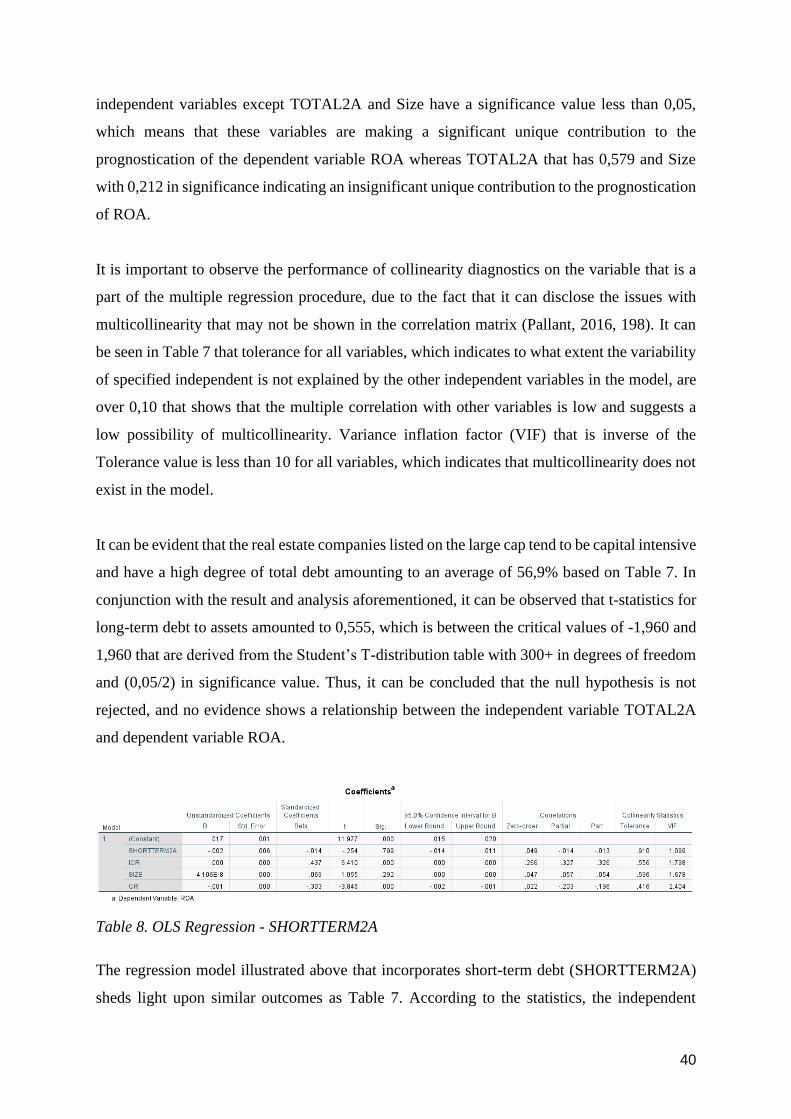
40
independent variables except TOTAL2A and Size have a significance value less than 0,05,
which means that these variables are making a significant unique contribution to the
prognostication of the dependent variable ROA whereas TOTAL2A that has 0,579 and Size
with 0,212 in significance indicating an insignificant unique contribution to the prognostication
of ROA.
It is important to observe the performance of collinearity diagnostics on the variable that is a
part of the multiple regression procedure, due to the fact that it can disclose the issues with
multicollinearity that may not be shown in the correlation matrix (Pallant, 2016, 198). It can
be seen in Table 7 that tolerance for all variables, which indicates to what extent the variability
of specified independent is not explained by the other independent variables in the model, are
over 0,10 that shows that the multiple correlation with other variables is low and suggests a
low possibility of multicollinearity. Variance inflation factor (VIF) that is inverse of the
Tolerance value is less than 10 for all variables, which indicates that multicollinearity does not
exist in the model.
It can be evident that the real estate companies listed on the large cap tend to be capital intensive
and have a high degree of total debt amounting to an average of 56,9% based on Table 7. In
conjunction with the result and analysis aforementioned, it can be observed that t-statistics for
long-term debt to assets amounted to 0,555, which is between the critical values of -1,960 and
1,960 that are derived from the Student’s T-distribution table with 300+ in degrees of freedom
and (0,05/2) in significance value. Thus, it can be concluded that the null hypothesis is not
rejected, and no evidence shows a relationship between the independent variable TOTAL2A
and dependent variable ROA.
Table 8. OLS Regression - SHORTTERM2A
The regression model illustrated above that incorporates short-term debt (SHORTTERM2A)
sheds light upon similar outcomes as Table 7. According to the statistics, the independent
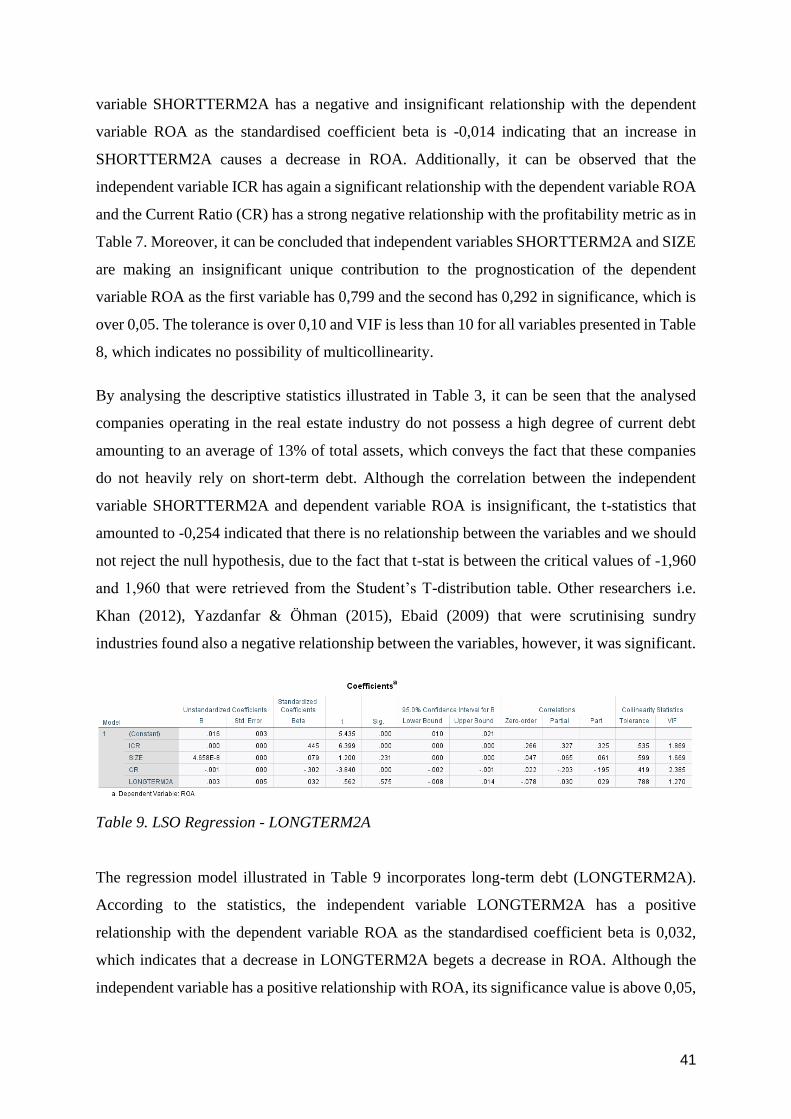
41
variable SHORTTERM2A has a negative and insignificant relationship with the dependent
variable ROA as the standardised coefficient beta is -0,014 indicating that an increase in
SHORTTERM2A causes a decrease in ROA. Additionally, it can be observed that the
independent variable ICR has again a significant relationship with the dependent variable ROA
and the Current Ratio (CR) has a strong negative relationship with the profitability metric as in
Table 7. Moreover, it can be concluded that independent variables SHORTTERM2A and SIZE
are making an insignificant unique contribution to the prognostication of the dependent
variable ROA as the first variable has 0,799 and the second has 0,292 in significance, which is
over 0,05. The tolerance is over 0,10 and VIF is less than 10 for all variables presented in Table
8, which indicates no possibility of multicollinearity.
By analysing the descriptive statistics illustrated in Table 3, it can be seen that the analysed
companies operating in the real estate industry do not possess a high degree of current debt
amounting to an average of 13% of total assets, which conveys the fact that these companies
do not heavily rely on short-term debt. Although the correlation between the independent
variable SHORTTERM2A and dependent variable ROA is insignificant, the t-statistics that
amounted to -0,254 indicated that there is no relationship between the variables and we should
not reject the null hypothesis, due to the fact that t-stat is between the critical values of -1,960
and 1,960 that were retrieved from the Student’s T-distribution table. Other researchers i.e.
Khan (2012), Yazdanfar & Öhman (2015), Ebaid (2009) that were scrutinising sundry
industries found also a negative relationship between the variables, however, it was significant.
Table 9. LSO Regression - LONGTERM2A
The regression model illustrated in Table 9 incorporates long-term debt (LONGTERM2A).
According to the statistics, the independent variable LONGTERM2A has a positive
relationship with the dependent variable ROA as the standardised coefficient beta is 0,032,
which indicates that a decrease in LONGTERM2A begets a decrease in ROA. Although the
independent variable has a positive relationship with ROA, its significance value is above 0,05,
42
which indicates that it is making an insignificant unique contribution to the prognostication of
the dependent variable ROA. Moreover, it can be observed that the independent variables CR,
SIZE and ICR have the same values as Tables 7 and 8 illustrated above. The tolerance is over
0,10 and VIF is less than 10 for LONGTERM2A indicating no possibility of multicollinearity.
It can be observed by analysing Table 3, which illustrates the descriptive statistics that the
companies operating in the real estate industry have a high degree of long-term debt amounting
to the average of 44 per cent of total assets. However, albeit it might be evident that an
insignificant positive relationship exists between independent variable LONGTERM2A and
dependent variable ROA as the standardised coefficient beta amounted to 0,032, it can be
concluded that the variables possess an insignificant relationship between each other and the
null hypothesis should not be rejected, due to the fact that t-statistics amounted to 0,562 and is
between the critical values of -1,960 and 1,960, which are derived from the Student’s T-
distribution table with 300+ in degrees of freedom and (0,05/2) in significance value.
The result found by the authors of this paper is not in line with the findings illustrated in the
research conducted by Abor (2005), Avci (2016), Yazdanfar and Öhman (2015), which found
a significant negative relationship between the variables and with the findings shown by the
researchers Gill et al. (2011) that found a positive relationship between LONGTERM2A and
profitability. However, the findings are in line with the research conducted by Nguyen et al.
(2019), which analysed the relationship between financial leverage and profitability of real
estate companies located in Vietnam and found a relationship between the variables where a
1% increase in financial leverage begot a 0,011% in ROA that is insignificant and aggrandises
the result found in our paper. Moreover, the results of this paper are in line with the findings
made by Al-Taani (2013), which investigated the relationship between capital structure and
firm's performance including in sample 45 Jordanian manufacturing firms available on Amman
Stock Exchange from 2005 to 2009 and found insignificant relationship between the variables.
Since the statistical tests do not show a significant relationship between the variables when
applying the OLS Regression Model, it can be argued that long-term debt is of no relevance
for generating profits for the analysed large-cap companies operating in the real estate industry,
which could be in line with the capital structure irrelevance theorem presented by Modigliani
and Miller (1958). Additionally, it could be asserted that long-term debt might be of relevance
for companies in the process of decision-making, however, it is assessed as an insufficient
source of financing for maximising profits.
43
It was vividly explained previously in the research paper that profitability can differ depending
on the factors i.e., firm’s characteristics, privately or publicly owned, and industry. It can be
observed that research aforementioned i.e., Yazdanfar and Öhman (2015), Khan (2012) saw
differing results, due to the fact that one group analysed human-intensive companies i.e.,
consulting companies that have an insignificant degree of debt in their capital structure whereas
another group of researchers i.e., Avci (2016), Margaritis & Psillaki (2010), Gill et al. (2011)
analysed capital intensive companies such as companies operating in the manufacturing
industry that has on average a high degree of debt. Albeit it can be assumed that the results of
this research paper should be similar to the results shown by the prior group, owing to the fact
that the real estate industry has on average a high degree of debt and is capital intensive as it
can be observed in the case of manufacturing firms, the results are different as real estate
industry has dissimilar nature of the business operation and the procedure of recording its
profits on the income statement (Andersson & Landberg, 2005). The industry includes and
records changes in the value of the property as income, which is impacted by external factors
i.e., interest rate, inflation rate etc., and is not under the company’s control (Andersson &
Landberg, 2005).
Ergo, in light of the above mentioned, all endeavours to find a relationship between the
independent variables i.e., LONGTERM2A, SHORTTERM2A, TOTAL2A and dependent
variables ROA were to no avail and a deduction can be made that ROA is of no relevance in
determining the impact of capital structure on profitability in the real estate industry.
5.7 Control variables
The selection of variables is partly based on previous research in the literature review of a
similar study and selected by the authors of this paper in industry relevance. This part links
with economic theory to interpret the meaning behind the numbers.
Size
The result of multiple regression in size is shown insignificant and the null hypothesis cannot
be rejected. For each variable tested in Sig, this elaborates whether the variable is making a
statistically significant unique contribution to the equation (Pallant, 2016, p.202). If the Sig.
value is less than .05 the variable is making a significant unique contribution to the prediction
of the dependent variable or reduce to conclude the significance to the dependent variable
44
(Pallant, 2016, p.201). By reading tables of 7,8,9, the significant values are relatively 0.21 for
total-debt to asset, 0.231 for long-debt to asset and 0.292 for total-debt to asset, which is all
insignificant on a 5% significance level. Thus, it was no possibility of statistically confirming
that there is any relationship between the firm's size and profitability.
The reason for the insignificance is unknown by precise reason. However, the authors of this
study assume that it may be caused by a limitation in quantity of sampling or the choice of
variables to measure the size of the company. Simerly and Li (2000) had a relatively abundant
population for their research which consisted of 700 large U.S firms from different industries,
successfully indicating the positive correlation to profitability. Another suspected reason in this
study is the market capitalisation, which takes the place due to the fact that it captures the
potential value to be created in real estate companies. Some previous reach conducts the
employee number to represent the size as a regressor.
Liquidity
Unlike size, the liquidity results convey the outcomes from the unstandardized coefficient beta
(B) demonstrate the weak negative correlation in relatively -.302 for long-term debt to asset,
-.303 for short-term debt to asset, and -.296 for total-debt to the asset. ALL Sig. readings remain
at 0.00 which prove significant in all tests on the 5% significance level. Liquidity has been
selected as one of the control variables by many previous researchers. Goddard et al. (2005),
found a positive relationship between liquidity and profitability, and Samo and Murad (2019)
indicate that there is a positive relationship between liquidity and profitability in their research
as well. Unlike previous research, it can be evident that the real estate companies listed on the
large-cap have averaged a negative 30% weak correlation in their liquidity to profitability,
while working capital to meet its short-term need has weak negative impacts. Thus, the null
hypothesis cannot be rejected. However, alternative hypotheses cannot be approved either,
because the weak correlation is shown as the result that the authors of this study cannot
conclude any decisive relation.
Solvency
Solvency denotes the ability of a company to pay off its long-term debt and the interest on that
debt (Goel, 2016). The results convey similar outcomes as liquidity from the unstandardized
coefficient beta (B) demonstrate the significant medium correlation in relatively .440 for long-
term debt to asset, .437 for short-term debt to asset, and .445 for total-debt to asset. Ergo, the
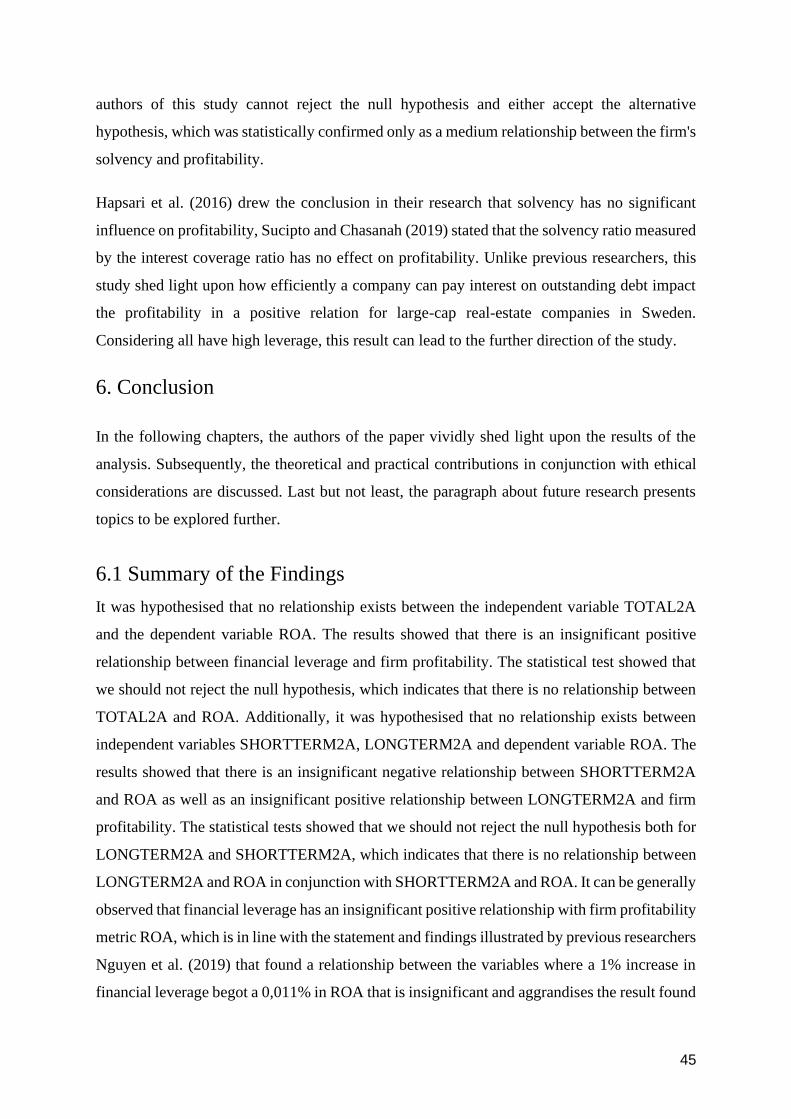
45
authors of this study cannot reject the null hypothesis and either accept the alternative
hypothesis, which was statistically confirmed only as a medium relationship between the firm's
solvency and profitability.
Hapsari et al. (2016) drew the conclusion in their research that solvency has no significant
influence on profitability, Sucipto and Chasanah (2019) stated that the solvency ratio measured
by the interest coverage ratio has no effect on profitability. Unlike previous researchers, this
study shed light upon how efficiently a company can pay interest on outstanding debt impact
the profitability in a positive relation for large-cap real-estate companies in Sweden.
Considering all have high leverage, this result can lead to the further direction of the study.
6. Conclusion
In the following chapters, the authors of the paper vividly shed light upon the results of the
analysis. Subsequently, the theoretical and practical contributions in conjunction with ethical
considerations are discussed. Last but not least, the paragraph about future research presents
topics to be explored further.
6.1 Summary of the Findings
It was hypothesised that no relationship exists between the independent variable TOTAL2A
and the dependent variable ROA. The results showed that there is an insignificant positive
relationship between financial leverage and firm profitability. The statistical test showed that
we should not reject the null hypothesis, which indicates that there is no relationship between
TOTAL2A and ROA. Additionally, it was hypothesised that no relationship exists between
independent variables SHORTTERM2A, LONGTERM2A and dependent variable ROA. The
results showed that there is an insignificant negative relationship between SHORTTERM2A
and ROA as well as an insignificant positive relationship between LONGTERM2A and firm
profitability. The statistical tests showed that we should not reject the null hypothesis both for
LONGTERM2A and SHORTTERM2A, which indicates that there is no relationship between
LONGTERM2A and ROA in conjunction with SHORTTERM2A and ROA. It can be generally
observed that financial leverage has an insignificant positive relationship with firm profitability
metric ROA, which is in line with the statement and findings illustrated by previous researchers
Nguyen et al. (2019) that found a relationship between the variables where a 1% increase in
financial leverage begot a 0,011% in ROA that is insignificant and aggrandises the result found
46
in our paper. However, other researchers such as Avci (2016) that scrutinised the relationship
between financial leverage and profitability in the manufacturing industry found a significant
negative relationship whereas Gill et al. (2011) that analysed the same industry in another
country found a significant positive relationship between the variables. The reason for the
contradiction between different findings can depend on the ratios that are utilised in the
research as well as other intrinsic aspects i.e., firms’ characteristics, industry, ownership. In the
case of the following research paper, it can be observed that the nature of the business operation
and the procedure of recording its profits on the income statement in the real estate industry is
different from other industries, which consequently beget the statement that ROA is of no
relevance in determining the impact of capital structure on profitability in the real estate
industry.
It was hypothesised that there is no relation between size and profitability. However, the results
showed that they are insignificant and not able to statistically confirm that there is any
relationship between the firm's size and profitability. The authors of this study suspect it may
be caused by a limitation in quantity of sampling or the choice of variables to measure the size
of the company. Simerly and Li (2000) had a relatively abundant population for their research
which consisted of 700 large U.S firms from different industries, successfully indicating the
positive correlation to profitability. Another suspected reason in this study is the market
capitalisation, which takes the place due to the fact that it captures the potential value to be
created in real estate companies. Some previous reach conducts the employee number to
represent the size as a regressor. Additionally, liquidity was hypothesised to have no relation
to profitability. Unlike size, the liquidity results convey the outcomes demonstrate the
significant weak negative correlation of all tests on the 5% significance level. Goddard et al.
(2005), found a positive relationship between liquidity and profitability, and Samo & Murad
(2019) also indicates that there is a positive relationship between liquidity and profitability in
their research. Unlike previous research, it can be evident that the real estate companies listed
on the large cap have a weak correlation in their liquidity to profitability, while working capital
to meet its short-term need has weak negative impacts. Thus, the null hypothesis cannot be
rejected. However, alternative hypotheses cannot be approved either, because the weak
correlation is shown as the result that the authors of this study cannot conclude any decisive
relation. Similar results convey solvency, the outcomes as liquidity demonstrate the significant
medium correlation. Ergo, the authors of this study cannot reject the null hypothesis and either
accept the alternative hypothesis, which was statistically confirmed only as a medium

47
relationship between the firm's solvency and profitability. Hapsari et al. (2016) drew the
conclusion in their research that solvency has no significant influence on profitability. Sucipto
& Chasanah (2019) stated that the solvency ratio measured by the interest coverage ratio has
no effect on profitability. Unlike previous researchers, this study shed light upon how
efficiently a company can pay interest on outstanding debt impact the profitability in a positive
relation for large-cap real-estate companies in Sweden. Considering all have high leverage, this
result can lead to a further direction of study.
6.2 Theoretical and practical contribution
The authors of this study aimed to generalise whether leverage impacts the profitability of real
estate companies in Sweden confiding the set boundaries. This research serves to be useful
since it fills the existing scientific gap providing the analysis of such a heavily capital-intensive
industry as real estate. Despite its scale, a limited number of studies concentrated, especially,
on the financial aspects including the leverage utilisation and its impact on profitability. The
current research provides an overview of the capital structure and profitability of companies
contributing to more studies to be conducted in the future that will consider the most up-to-
date data, solid hints, insights and relative conclusions. It is imperative to emphasise that the
research is supposed to be well readable and helpful for concerned managers who are aiming
to see the full picture of the chosen debt level that influences the final result. Proper
management and prospects tend to be detected by the existence of growth opportunities that
reveal a good signal to the bond market hence influencing the speed at which firms adjust their
leverage. By being able to make proper decisions concerning profitability, maximization
indeed guarantees a sound market standing that stimulates investors to join and invest in
companies. Thereafter, it is necessary to keep the debt finance at the optimal level ensuring
adequate utilization of the firm's assets.
6.3 Social and Ethical Considerations
The authors of this paper are assured that their study does not serve to be the subject of any
ethical dilemmas. The secondary data gathered for this study is publicly accessible and any
form of sensitive information is absent. Moreover, questionnaires or similar collection methods
that gather personal information, views, opinions were not utilised. As to the social dilemmas,
maximisation of profitability, which is the main objective of the research, is beneficial for firms,
however, firms that are driven only by this goal may put aside environmental and societal
48
factors as well as the social effect within organisations. For instance, managers decide to avoid
debt utilisation in the upcoming project, and the quality issuing source seems to be an adequate
and applicable financial alternative. However, stakeholders are experiencing more pressure,
stress, which is socially inadequate and consequently leads to a higher rate of sick leave. Ergo,
it is hard for employees to be effective and concentrated in such an unbalanced environment
which directly leads to the inability of generating and increasing revenue counteracting the core
set aim.
6.4 Limitation
Due to the limitation of the length of the research, our data collection only covers a period of
5 years. Professionals will study for a longer time when completing the same type of work.
More data provides relative larger sample size, which may have a positive impact on the model.
In addition, some data is somewhat difficult in the collection phase, which data is missing in
the interim report, and the researchers use the average estimation method to complete the data.
It is a well-known fact that COVID-19 has wreaked havoc in many industries, and it is
imperative to mention that the results of the following research could potentially be afflicted
by the situation of COVID-19 as not only the coronavirus has impacted the returns generated
in the real estate industry, but also other factors i.e., interest expense, changes in the property
value etc.
Another limitation that was identified refers to the lack of previous studies in the research area.
The literature review served to be useful for identification of the scope of works, however if
there were more solid and relevant information about Swedish real estate market it would
definitely strengthen authors’ position. To minimize the limitation gap authors avidly
scrutinized available researches from other countries considering the specification and
differences of Sweden in such sectors as politics, economics and technologies.
6.5 Suggestions for Future Research
The limitation in this paper turned out to be the recommendation for further studies, and it will
be to collect data of all real estate firms from both Swedish Stock Exchange and private, and
not sampling only publicly owned. Another crucial aspect would be to increase the period of
the study by at least 10 years, since currently, the observation included 5 years, from 2016 to
49
2020. In retrospect, there are permanent fluctuations in the economy, politics, and society that
influence the outcome. Being capable of seeing the most crisis years as well as the most
flourishing years and comparing them with each other will provide more clarity to the results.
Finally, future studies similar to the conducted one are recommended, however, implementing
other analytical tools, theories or methods. For instance, the utilization of the dynamic panel
data regression can reveal fascinating relationships between short and long-term leverage. Thus,
the carried-out studies will provide the ability to compare how the results either differ or end
up with similar effects identifying the contributing factors and causes. The recommendation to
real estate companies would be to invest in an analysis that statistically shows the proper
balance of leverage to be utilized to convert them into profitability.
Last but not least, the authors of this research paper would give a recommendation to scrutinise
the relationship between financial leverage and profitability by utilising different profitability
measures that are not impacted by external factors i.e., change in the property value. It would
be of utter interest to observe the cash inflow beget by financial leverage, in lieu of the impact
on the profit as profitability is easily manipulated.
50
7. Reference
1. Abor, J. (2005). The effect of capital structure on profitability: an empirical analysis
of listed firms in Ghana. The Journal of Risk Finance International Journal of Law
and Management Journal or Property Investment, 6 (5), pp. 438-445
2. Ahmed Sheikh, N., & Wang, Z. (2013). The impact of capital structure on
performance. International Journal of Commerce and Management, 23 (4), pp. 354-
368.
3. Akhtar, S., Maryam, J.B., & Sadia, H. (2012). Relationship between Financial
Leverage and Financial Performance: Evidence from Fuel and Energy Sector of
Pakistan. European Journal of Business and Management, 4 (11), 1- 12.
4. Al-Taani, K. (2013). The Relationship between Capital Structure and Firm
Performance: Evidence from Jordan. Journal of Finance and Accounting, 1 (3), 41-
45.
5. Anderson, D. (2014). Statistics for business and economics (3. ed.). Cengage
Learning.
6. Andersson, A., & Minnema, J. (2018). The relationship between leverage and
profitability: A quantitative study of consulting firms in Sweden [Unpublished
Master’s thesis]. Umeå University
7. Andersson, F. and Landberg, R., 2005. Real Estate Appraisal. [online] Hj.diva-
portal.org. Available at: <https://hj.diva-
portal.org/smash/get/diva2:3912/FULLTEXT01.pdf> [Accessed 1 May 2021].
8. Avci, E. (2016). Capital structure and firm performance. An application on
manufacturing industry. Marmara University Journal Of Economic &
Administrative Sciences, 1, pp. 15- 30.
9. Baker, S. H. (1973)., Risk, Leverage and Profitability: An Industry Analysis. The
Review of Economics and Statistics, 55 (4), pp. 503-507. [Accessed 4 April 2021]
51
10. Barton, S. L. & Gordon, P. J. (1988). Corporate Strategy and Capital Structure.
Strategic Management Journal, 9 (6), pp. 623-632.
11. Berk, J., & DeMarzo, P. (2017). Corporate finance (4. ed., Global ed.). Pearson.
12. Bettis, R. A. (1981). Performance Differences in Related and Unrelated Diversified
Firms. Strategic Management Journal, 2 (4), pp. 379-393.
13. Brealey, R., Myers S.C., & Allen, F. (2013). Principles of Corporate Finance. 11th
edition. New York: McGraw-Hill Education.
14. Brownlee, J. (2020, August 14). How to Check if Time Series Data is Stationary with
Python. Machine Learning Mastery. https://machinelearningmastery.com/time-
series-data-stationary-
python/#:%7E:text=Augmented%20Dickey%2DFuller%20test,or%20fail%20to%20
be%20reject.&text=Null%20Hypothesis%20(H0)%3A%20If,meaning%20it%20is%
20non%2Dstationary.
15. Bryman, E., & Bell, E. (2013). Business Research Method. 3 rd edition. New York:
Oxford University Press.
16. CEIC (2021). Sweden Real Estate Price Index: 1 or 2 Dwelling Buildings: PL:
Greater Malmo | Economic Indicators. [online] Available at:
<https://www.ceicdata.com/en/sweden/real-estate-price-index-1981100/real-estate-
price-index-1-or-2-dwelling-buildings-pl-greater-malmo> [Accessed 12 May 2021].
17. Chadha, S., & Sharma, A. K. (2015). Capital Structure and Firm Performance:
Empirical Evidence from India. Vision: The Journal of Business Perspective, 19 (4),
295-302.
18. Chaklader, B. & Chawla, D. (2016). A Study of Determinants of Capital Structure
through Panel Data Analysis of Firms Listed in NSE CNX 500. Vision: The Journal
of Business Perspective, 20 (4), pp. 267-277.
19. Dalbor, M. C., & Upneja, A. (2002). Factors affecting the long-term debt decision of
restaurant firms. Journal of Hospitality & Tourism Research, 26(4), 422-432

52
20. Dalci, I. (2018). Impact of financial leverage on profitability of listed manufacturing
firms in China. Pacific Accounting Review, 30(4), 410–432.
https://doi.org/10.1108/PAR-01-2018-0008
21. DeMarzo, P. & Berk, J. (2013). Corporate Finance. 3rd edition. Boston: Pearson
Education.
22. Dewenter, K. L. & Malatesta, P. H. (2001)., State-Owned and Privately Owned
Firms: An Empirical Analysis of Profitability, Leverage, and Labor Intensity. The
American Economic Review, 91 (1), pp. 320-334. [Accessed 4 March 2021]
23. Edvinsson, R., Eriksson, K. and Ingman, G., 2020. A real estate price index for
Stockholm, Sweden 1818–2018: putting the last decades housing price boom in a
historical perspective. [online] Www-tandfonline-com.proxy.library.ju.se. Available
at: <https://www-tandfonline-
com.proxy.library.ju.se/doi/full/10.1080/03585522.2020.175961?scroll=top&needA
ccess=true> [Accessed 9 March 2021].
24. Friend, I. & Lang, L. H. P. (1988). An Empirical Test of the Impact of Managerial
SelfInterest on Corporate Capital Structure. The Journal of Finance, 43 (2), 271-281.
25. Frost, J. (2019). Regression analysis: an intuitive guide for using and interpreting
linear models. Statistics By Jim Publishing.
26. Gangeni, C. (2006), the Relationship between Capital Structure and the Financial
Performance of the Firm. Master Thesis: University of Pretoria, South Africa
27. Gill, A. Biger, N., Pai, C., & Bhutani, S. (2009). The Determinants of Capital
Structure in the Service Industry: Evidence from the United States. The Open
Business Journal, 2 (1), pp. 48-53.
28. Gill, A., Biger, N. and Mathur, N., 2011. The effects of capital structure on
profitability: Evidence from United States. [online] https://www.researchgate.net/.
Available at:
<https://www.researchgate.net/publication/281004540_The_effects_of_capital_struc
ture_on_profitability_Evidence_from_United_States> [Accessed 15 April 2021].
53
29. Goddard, J., Tavakoli, M. & Wilson, J. O. S. (2005). Determinants of profitability in
European manufacturing and services: evidence from a dynamic panel model.
Applied Financial Economics, 15 (18), 1269-1282.
30. Goel, S. (2016). Financial ratios (First edition.). Business Expert Press
31. Grycova M., & Stekla J., (2015). The relationship between Capital structure and
Profitability of the limited liability companies, Acta Universitatis Bohemiae
Meridionalis, 18 (2), pp. 32-41.
32. Hair, J. F., Black, W. C., Babin, B. J., & Anderson, R. E. (2013). Multivariate data
analysis: Advanced diagnostics for multiple regression [Online supplement].
Retrieved from
http://www.mvstats.com/Downloads/Supplements/Advanced_Regression_Diagnosti
cs.pdf
33. Hapsari, A., Putri, N., & Arofah, T. (2016). The Influence of Profitability, Solvency,
and Auditor’s Opinion to Audit Report Lag at Coal Mining Companies. Binus
Business Review, 7(2), 197–201. https://doi.org/10.21512/bbr.v7i2.1685
35. Jarrow, Robert. (2012). A Leverage Ratio Rule for Capital Adequacy. Journal of
Banking & Finance. 37. 10.2139/ssrn.2084202.
36. Karlsson, S., & Nordström, L. (2007). The Swedish Real Estate Market and
Macroeconomic Factors [Bachelor’s thesis, Jönköping University]. Networked
Digital Library of Theses & Dissertations.
37. Kester, W. C. (1986). Capital and Ownership Structure: A Comparison of United
States and Japanese Manufacturing Corporations. Financial Management, 15 (1), pp.
5-16.
38. Khan, A. G. (2012). The relationship of capital structure decisions with firm
performance: A study of the engineering sector of Pakistan. International Journal of
Accounting and Financial Reporting ISSN, 2 (1), pp. 2162-3082.
39. Kokko, A. (1999). Asienkrisen: många likheter med den svenska krisen. Ekonomisk
Debatt 27(2), 81-92

54
40. Kraus, A. & Litzenberger, R. H. (1973). A State-Preference Model of Optimal
Financial Leverage. The Journal of Finance, 28 (4), pp. 911-922.
41. Kujaca, J. and Pygman, J., (1988). Shibboleth Authentication Request. [online]
Proquest.com. Available at:
<https://www.proquest.com/docview/219171526/fulltextPDF/DEBA346EA24344C
DPQ/1?accountid=11754> [Accessed 10 April 2021].
42. Le, T.. & Phan, T.. (2017). Capital structure and firm performance: Empirical
evidence from a small transition country. Research in International Business and
Finance, 42, pp. 710-726.
43. liber, R. and Zoega, G., (2019). The 2008 Global Financial Crisis in Retrospect. 1st
ed.
44. Lind, D. A., Marchal, W. G., & Wathen, S. A. (2006). Basic statistics for business &
economics. Boston: McGraw-Hill/Irwin.
45. Malhotra, N. K., Nunan, D., & Birks, D. (2017). Marketing research: An applied
approach.
46. Mandelker, G. & Rhee, S. (1984). The impact of the degree of operating and
financial leverage on systematic risk of common stock. Journal of financial and
Quantitative Analysis, 30, 45-57.
47. Margaritis, D. & Psillaki, M. (2010). Capital structure, equity ownership and firm
performance. Journal of Banking & Finance, 34 (3), pp. 621-632.
48. Mashavave, F. & Tsaurai, K. (2015). Capital Structure and Profitability: A case of
JSE listed companies. Risk governance & control: financial markets & institutions, 5
(1), pp. 81- 93.
49. McCamish, B., (2021). EBITDA | Formula & Meaning | InvestingAnswers. [online]
Investinganswers.com. Available at:
<https://investinganswers.com/dictionary/e/earnings-interest-tax-depreciation-and-
amortizatio> [Accessed 20 May 2021].
55
50. McCamish, B., (2021). Net Income | Example, Formula & Meaning |
InvestingAnswers. [online] Investinganswers.com. Available at:
<https://investinganswers.com/dictionary/n/net-income> [Accessed 19 May 2021].
51. McCamish, B., (2021). Return on Assets | ROA | Formula & Meaning |
InvestingAnswers. [online] Investinganswers.com. Available at:
<https://investinganswers.com/dictionary/r/return-assets-roa> [Accessed 20 May
2021].
52. McGahan, A. M. & Porter, M. E. (1997)., How Much Does Industry Matter, Really?.
Strategic Management Journal, 18, pp. 15-30. [Accessed 9 April 2021]
53. Memon, Fozia & Bhutto, Niaz & Abbas, Ghulam. (2012). Capital Structure and
Firm Performance: A Case of Textile Sector of Pakistan. Asian Journal of Business
and Management Sciences. 1. 9-15.
54. Modigliani, F. & Miller, M. H. (1958). The Cost of Capital, Corporation Finance and
the Theory of Investment. The American Economic Review, 48 (3), pp. 261-297.
55. Modigliani, F. & Miller, M. H. (1963). Corporate Income Taxes and the Cost of
Capital: A Correction. The American Economic Review, 53 (3), pp. 433-443.
56. Mohammadzadeh, M., Rahimi, F., Rahimi, F., Aarabi, S., & Salamzadeh, J. (2013).
The effect of capital structure on the profitability of pharmaceutical companies in the
case of Iran. Iranian journal of pharmaceutical research, 12 (3), pp. 573-577.
57. Myers, S. C. & Majluf, N. S. (1984). Corporate financing and investment decisions
when firms have information that investors do not have. Journal of Financial
Economics, 13 (2), pp. 187-221.
58. Myers, S. C. (1984). The Capital Structure Puzzle. The Journal of Finance, 39 (3),
pp. 575- 592.
59. Nasdaq Stockholm. (2021). VAD ÄR AKTIEINDEX?. [online] Available at:
<http://www.nasdaqomxnordic.com/utbildning/aktier/vadaraktieindex?languageId=3
> [Accessed 10 March 2021].
56
60. Nguyen, V., Nguyen, T., Tran, T., & Nghiem, T. (2019). The impact of financial
leverage on the profitability of real estate companies: A study from the Vietnam
stock exchange. Management Science Letters, 9(13), 2315–2326.
https://doi.org/10.5267/j.msl.2019.7.023
61. Nunes, P. J. M., Serrasqueiro, Z. M. & Sequeira, T. N. (2009). Profitability in
Portuguese service industries: a panel data approach. The Service Industries Journal,
29 (5), pp. 693-707.
62. Pallant, J. (2016). SPSS survival manual: A step by step guide to data analysis using
SPSS. New York: McGraw-Hill.
63. Palm, P. (2016). Measuring customer satisfaction: A study of the swedish real estate
industry. Property Management, 34(4), pp. 316-331.
doi:http://dx.doi.org.proxy.library.ju.se/10.1108/PM-08-2015-0041 [Accessed 17
March 2021]
64. Penman, S. H. (2013). Financial Statement Analysis and Security Valuation. 5th
edition.
65. R. Amsaveni (2009). Impact of leverage on profitability of primary aluminum
industry in India. Indian Finance Journal, 20, 35-55
66. Reddy, Y. V., & Parab Narayan.(2018). "The Impact of Liquidity and Leverage on
Profitability: Evidence from India." IUP Journal of Accounting Research & Audit
Practices 17(1):58-77 (http://proxy.library.ju.se/login?url=https://www-proquest-
com.proxy.library.ju.se/scholarly-journals/impact-liquidity-leverage-on-
profitability/docview/2003278144/se-2?accountid=11754).
67. Samo, A., & Murad, H. (2019). Impact of liquidity and financial leverage on firm’s
profitability – an empirical analysis of the textile industry of Pakistan. Research
Journal of Textile and Apparel, 23(4), 291–305. https://doi.org/10.1108/RJTA-09-
2018-0055
68. Sarda, Tariku. (2016). The Effect of Capital Structure on Firms’ Profitability
(Evidenced from Ethiopian). Sciprints. 10.20944/preprints201607.0013.v1.

57
69. Simerly, R. L. & Li, M. (2000). Environmental Dynamism, Capital Structure and
Performance: A Theoretical Integration and an Empirical Test. Strategic
Management Journal, 21 (1), pp. 31-49.
70. Soumadi, M. M., & Hayajneh, O. S. (2012). CAPITAL STRUCTURE AND
CORPORATE PERFORMANCE EMPIRICAL STUDY ON THE PUBLIC
JORDANIAN SHAREHOLDINGS FIRMS LISTED IN THE AMMAN STOCK
MARKET. European Scientific Journal, ESJ, 8(22).
https://doi.org/10.19044/esj.2012.v8n22p%p
71. Stock, J., & Watson, M. (2020). Introduction to econometrics (4. rev. ed., Global
ed.). Pearson Education.
72. Studenmund, A. (2016). Using econometrics : a practical guide (7. ed.). Pearson.
73. Sucipto, A., & Chasanah, N. (2019). Liquidity Ratio, Profitability, And Solvency On
Stock Returns With Capital Structure As An Intervening Variable (Study On Food
And Beverage Sub Sector Listed In Indonesia Stock Exchange (Idx) Period 2013-
2017). Ekspektoran (Online), 3(1), 52–. https://doi.org/10.25139/ekt.v3i1.1476
74. Ting, Irene & Lean, Hooi Hooi. (2011). Capital Structure of Government Linked
Companies in Malaysia. Asian Academy of Management Journal of Accounting and
Finance. 7.
75. Titman S. & Wessles, R. (1988). The determinants of capital structure choice.
Journal of Finance, 43, 1-19.
76. Van de Ven, A. (2007). Engaged scholarship : a guide for organizational and social
research. Oxford University Press.
77. Vijeyaratnam, H. and Anandasayanan, S., 2015. 189-193. [online]
http://www.iiste.org/. Available at:
<https://papers.ssrn.com/sol3/papers.cfm?abstract_id=2850513> [Accessed 18 April
2021].
78. Wald, J. K. (1999). How firm characteristics affect capital structure: an international
comparison. Journal of Finance Research, 22, 161-187.

58
79. Yazdanfar, D. & Ohman, P. (2015). Debt financing and firm performance: an
empirical study based on Swedish data. The Journal of Risk Finance, 16 (1), pp.
102-118.
80. Yinusa, Olumuyiwa & Rodnonova, Jule. (2018). Capital structure in emerging
markets: evidence from Nigeria by Yinusa Olumuyiwa Ganiyu, Ismail Adelopo,
Yulia Rodionova, Olawale Luqman Samuel in the European Journal of Applied
Economics, impact factor 0.20.. 15. 74-90. 10.5937/EJAE15-17631.
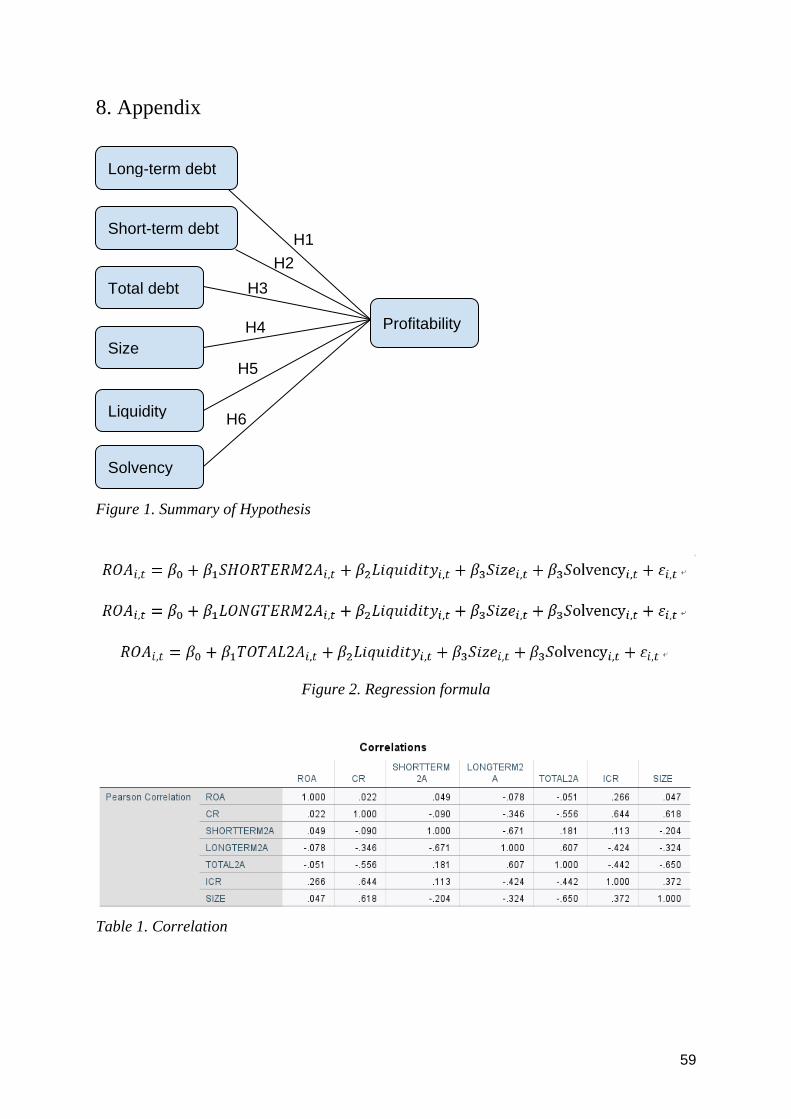
59
8. Appendix
Figure 1. Summary of Hypothesis
Figure 2. Regression formula
Table 1. Correlation
Long-term debt
Short-term debt
Total debt
Size
Liquidity
Solvency
Profitability
H1
H2
H3
H4
H5
H6
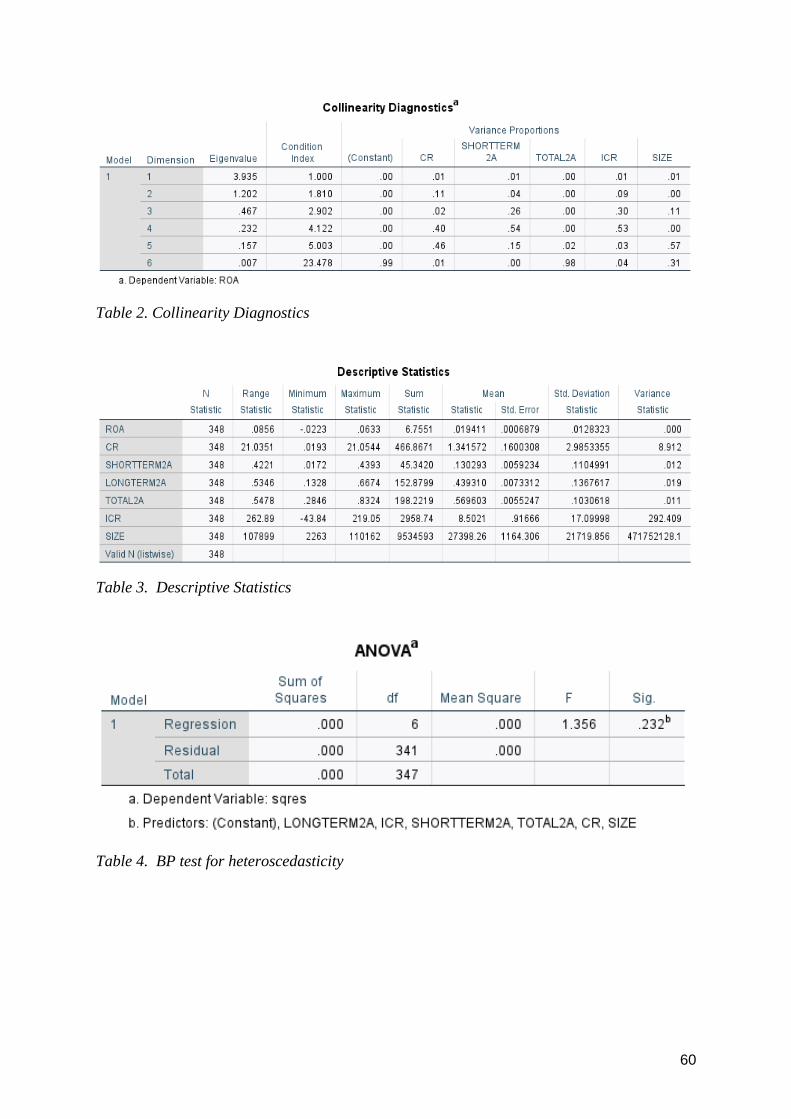
60
Table 2. Collinearity Diagnostics
Table 3. Descriptive Statistics
Table 4. BP test for heteroscedasticity
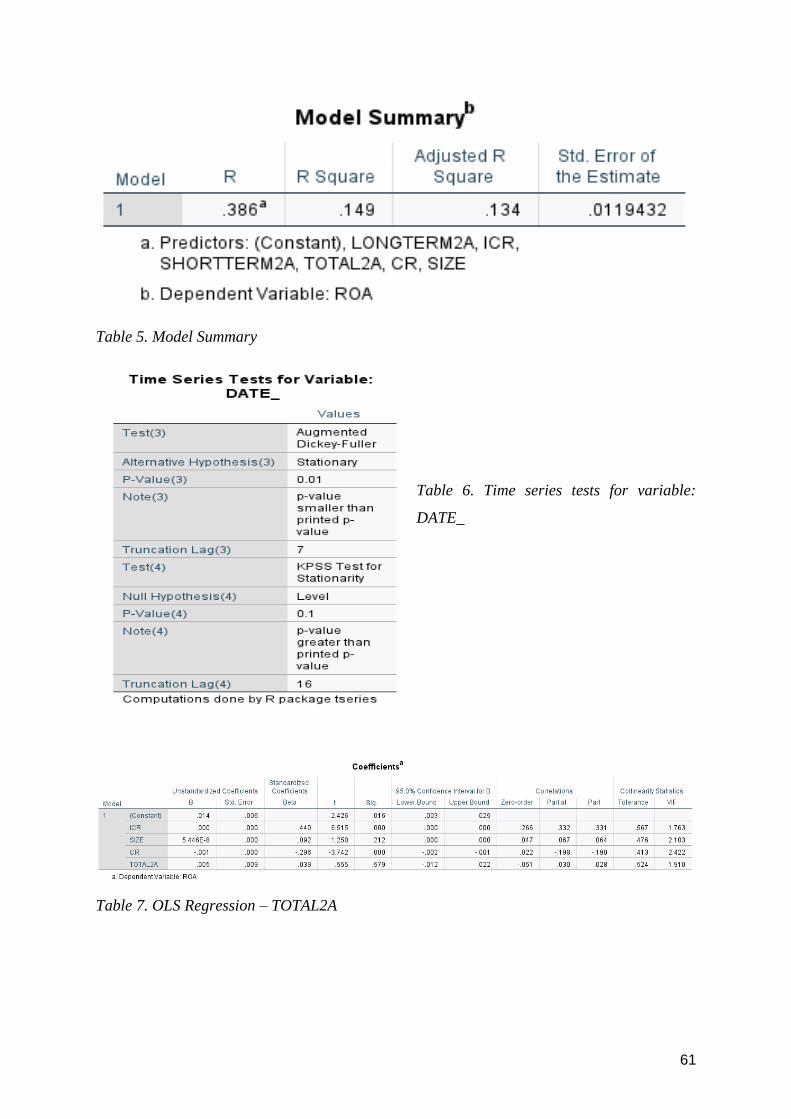
61
Table 5. Model Summary
Table 6. Time series tests for variable:
DATE_
Table 7. OLS Regression – TOTAL2A
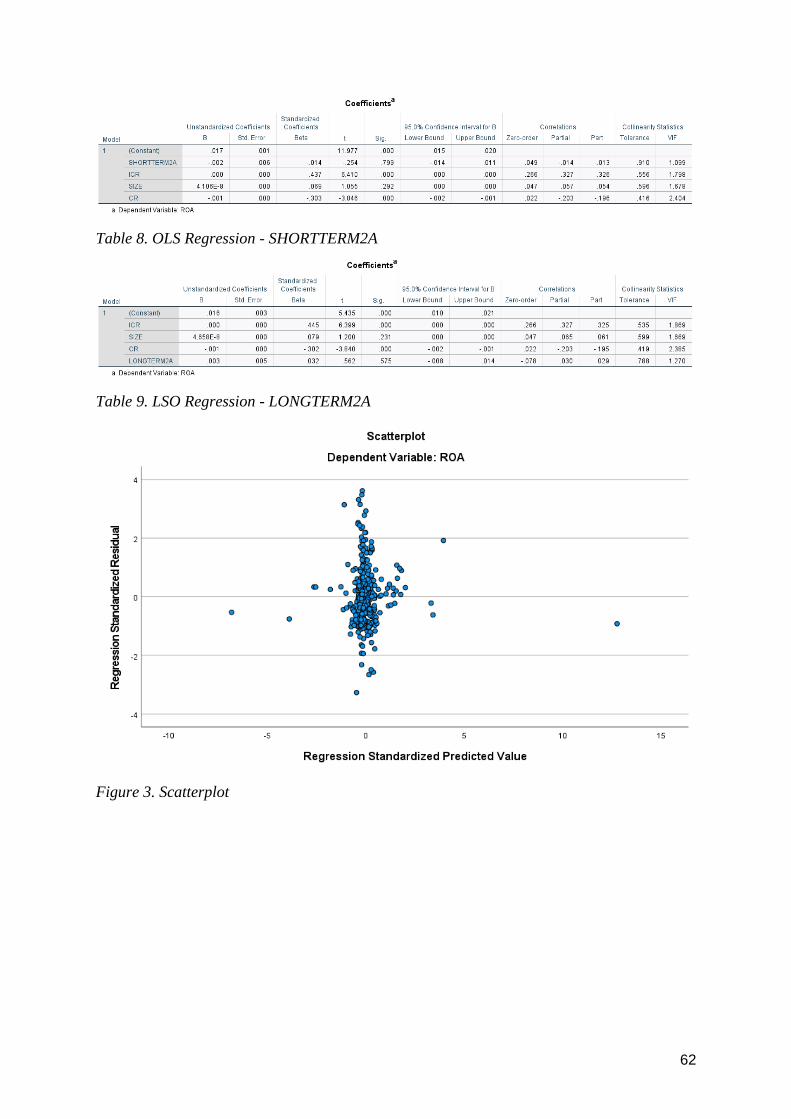
62
Table 8. OLS Regression - SHORTTERM2A
Table 9. LSO Regression - LONGTERM2A
Figure 3. Scatterplot

63
Figure 4. Real Estate Companies