Annual Report 2014-15 - ONGC
371
-
Upload
khangminh22 -
Category
Documents
-
view
0 -
download
0
Transcript of Annual Report 2014-15 - ONGC


ONGC’s quest for energy goes deeper than set ting new
benchmarks in deep-water drilling in the Krishna Godavari
Basin or finding new frontiers of energy. Global decline in
crude prices notwithstanding, we have taken significant
investment decisions diligently and aggressively, reversing
the production trend in of fshore.
And now we are venturing into deeper of fshore plays in our
quest for energy security. It is this journey that has placed
us among Fortune “World’s Most Admired Companies” rdand ranked us 3 in the E&P industry globally on the Plat ts
Top 250 Rankings 2014.
It is this spirit of going beyond boundaries that is depicted
on the cover of this Annual Report. (L-R) Geo-scientists
acquiring exploratory data from fields in dif ficult terrains; A
typical sub-sea production system installed on deep
seabed; ONGC's downstream subsidiary Mangalore
Refinery and Petrochemicals Ltd (MRPL); ONGC Videsh
operations at Sakhalin, Russia.

Chairman’s Message

Dear Shareholder,
If I were to sum up the last one year in the global oil
and gas business, ‘interesting’ will be an
understatement despite the largely familiar nature of
events and the manner in which they unfolded in the
then prevailing scenario over the course of time,
changing and redefining, to a large extent, not just
some of our firmly-held beliefs on markets but also
challenging many established players to vastly alter
their strategies for the future. Oil prices tumbled, not
without precedent but certainly beyond anticipation,
and the market reality we inhabit presently is
anything but similar to the one we were in a lit tle
more than a year ago.
It is in this context of surrounding volatility, that I, on
behalf of the Board of Directors of Oil & Natural Gas
Corporation Ltd, the country’s most valued Public
Sector enterprise, and over 33,000 commit ted
ONGCians, present to you ONGC’s Annual Report
for the financial year 2014-15; highlighting the
Company’s per formance in operational and
financial metrics through the period.
Globally, it has been an uneasy and turbulent year
for many in the industry and our performance as the
country’s flagship energy explorer assumes even
more significance in times like these, in view of our
enduring commitment to the aspirations of this
country and the trust placed in us through the years
by our many shareholders. I believe value resides in
the ways a company chooses to grow, it is
manifested through the consistency and reliability
with which a company delivers on its myriad
commitments – financial, social or environmental. In
FY’2014-15, we put a check on all of those fronts.
Notwithstanding the increasingly challenging
business environment, it marked another year of
solid performance from ONGC and reaf firmed the
Company’s proven capabilities in sustainable value
creation. Beyond impressive operational and
financial numbers, what must hearten ONGC’s
many shareholders further is that the resilience of
our business is also underpinned by a strong focus
on Safety and an environmentally-aware approach,
making our model not only robust but equally
adaptable to the emergent needs in this evolving
landscape.
Coming to specifics of our performance, at ONGC,
a strong exploratory performance has always
featured high among the company’s priorities.
We remain steadfast in our commitment to
organic growth through steady and continuous
enhancement of our already substantial reserve
position. FY’2014-15 was a strong step in that
direction. We made 22 oil and gas discoveries in the
last financial year. On 2P basis, we made cumulative
reserve accretion of 61.05 Million Metric Tonnes of
Oil Equivalent (MMtoe). With a Reser ve
Replacement Ratio (RRR) for the year at 1.38 we
have also ensured a stronger pipeline of future
hydrocarbon supplies.
However, the biggest positive, most undoubtedly,
from last year comes from the arena of production
as we reversed the trend of declining indigenous
crude oil output. Our standalone domestic crude
output was 22.26 MMT compared to 22.25 in the
previous fiscal (FY’14). The increase is marginal, yet
it shows the rich possibilities of a focused
operational approach and ef fective deployment of
technology in a port folio that is predominantly
mature. The results of our technology-intensive
schemes, geared to improve ONGC’s recovery
rates, are the most outstanding in the prolific
Mumbai Of fshore fields, the mainstay of ONGC’s
domestic port folio, where production shot up by
4.3 percent on a year-on-year basis. In fact,
supplies unlocked through these schemes
accounted for over 34 percent of our domestic
Dinesh K SarrafChairman & Managing Director

supplies in FY’14-15. There is potential for more and
promising projects like Mumbai High North Phase-
III and Mumbai High South Phase-III form part of our
plans to realize additional volumes from our legacy
assets. However, our gas output for the year dipped
as a result of which total standalone domestic
supplies of crude oil and gas from ONGC-operated
fields declined to 44.28 MMtoe from 45.53 MMtoe
a year ago.
Beyond our commitment to maximizing output from
the producing assets, we are also actively focused
on monetizing fresh reserves through several
meaningful development projects which upon
execution has the potential to add meaningful
material volumes to our current production profile.
Six major field development projects worth over
` 24,000 Crore were approved by the Board of
ONGC during the past one year, of which the
development of Daman and Nagyalanka are the
more significant ones. Marginal fields otherwise
deemed commercially unviable for their pocket-
sized reserves and issues with accessibility have
been developed through a clustered approach and
they combined to contribute a healthy 13.8 percent
of the company’s standalone domestic crude oil
output.
Overall, ONGC remained the largest producer of oil
and natural gas within the country, contributing over
69 percent and 70 percent to country’s production
of oil and gas respectively. The total output of ONGC
group (including ONGC Videsh and ONGC’s share
in PSC-JVs) stood at 58.34 MMtoe (59.2 MMtoe in
FY’14).
Financially as well, FY’2014-15 was an encouraging
year for ONGC considering the widespread
pessimism around the earnings outlook in the
sector due to the depressed oil prices. The oil price
slump did dent our earnings but we still managed to
register annual revenue of ` 830,935 million. Our
combined group revenue for the fiscal was
` 1,660,668 million. Standalone Profit-Af ter-Tax was
` 177,330 million (down 19.7 percent) while the
Group PAT was ` 183,335 million (down 30.8
percent).Staying on the earnings front, we realized
a higher value for our produced barrel ($44.87/bbl)
of crude compared to the previous year
($40.97/bbl) largely on account of our lower
contribution towards sharing of under-recoveries of
OMCs which at ` 362,996 million was significantly
lower than our subsidy burden of FY’14 (` 563,842
million). The Government’s progressive stance on
key policy matters related to the oil and gas sector
has played a key part in this regard.
ONGC has consistently been among the top
dividend payers in the country and FY’15 was no
dif ferent. What’s more significant is that even in a year
where businesses were severely impacted by
diminished cashflows ONGC’s overall dividend pay-
out ratio (with dividend tax) was higher (55 percent)
than that in the preceding fiscal (43 percent). Total
dividend pay-out to shareholders was 81,277 million.
This amply illustrates the strength and flexibility of
ONGC’s balance sheet; it also contrasts ONGC’s
enduring conviction in the strength of its highly valued
long-term relationship with its shareholders with the
short-term cyclicality of the markets.
Our international E&P operations, too, is on a
stronger footing relative to last year. ONGC Videsh,
over the last few years, has aggressively expanded
the scope and presence of our operations on the
global map with a view to creating a more balanced
and diversified port folio, a necessary hedge
against the characteristic volatility of our functional
environment. We grew our exploration position
during the year, having secured blocks in Myanmar,
Bangladesh and New Zealand, which crucially
marks our first entry into the Asia-Pacific region.
Also, our production, in spite of our interrupted
supplies in South Sudan and Syria, registered an
uptick as we pumped output to 8.87 MMtoe in FY’15
from 8.36 MMtoe in FY’14. This marks the second
consecutive year of growth for our overseas
business in terms of production performance.
Today, ONGC Videsh is present in 17 countries
across 36 projects of which 13 are producing
proper ties. Success of our forays in the
international arena is central to realizing ONGC’s
long-term growth plans. Management, accordingly,
has invested significant resources towards further
expansion of our global business in a manner that
new properties not only play to our growing
strengths but also bring in desired level of exposure
to new plays and technologies. A stronger ONGC
Videsh, eventually, will greatly augment the

country’s energy security.
All the while, we remain commit ted to our vision of
evolving into an integrated energy major of
international repute. In that respect, progress and
per formance of our domestic value-chain
integration ventures have provided us with much-
needed assurance regarding our exposure in that
business domain. It was a major year for our
downstream subsidiary, MRPL. All units under the
15 MMTPA refinery’s Phase-II expansion plan have
been commissioned. Having achieved its highest
ever throughput of 14.65 MMT in FY’15, the
management, buoyed by an improved market
outlook and a facilitating policy regime, is actively
considering the expansion of its retail footprint.
ONGC Tripura Power Company Ltd (OTPC), our
venture in the Power segment, is a fine example of
ONGC’s successful diversification into non-E&P
business as well as its promotion of energy within
the framework of sustainability. The 726.6 MW
combined cycle power plant is not only the biggest
energy project in the country’s North-eastern
region in terms of investment, it is also one of largest
UNFCCC-registered CDM projects in the world
earning an estimated annual CER of 1.6 million.
Our strong endorsement of a sustainable approach
to doing business in the energy industry stems from
our understanding that businesses exist to create
value that is meaningful and relevant across the
broad spectrum of its community of stakeholders.
Energy is essential to motoring not just the global
economic engine but equally important for the
improvement of the human condition. Right now,
there are countless global citizens and fellow
countrymen who are beref t of the bare minimum
necessities of life. And every form of energy, be it
fossil fuels, renewables or alternative, has its own
unique role to play in alleviating this reality. It is not
merely about the kind of fuels we use but also so
much more about how we find, produce and
consume those fuels that is largely going to
determine how sustainability influences overall
business decisions. At ONGC, we are continuously
trying to improve our per formance on this
parameter by reducing the energy intensity of our
operations and by bringing in an element of
reusability in our resource consumption patterns.
This, along with our Corporate Social Responsibility
(CSR) initiatives, designed to positively integrate
our business with communities and the social
environment around our operational areas, lend a
healthy dimension to the ONGC model.
ONGC’s sustained performance and contribution in
the energy arena continue to be acknowledged in
the industry. We are rated highly among our
corporate peers in such respected listings such as
Plat ts 250 Global Energy Rankings, Forbes Global
2000 and For tune’s World’s Most Admired
Companies.
I firmly believe that strong relationships at every
level remain at the core of a company’s success in
the long run. From that perspective, our relationship
with the Government, particularly the Ministry of
Petroleum & Natural Gas, our most significant
stakeholder, has been marked with great
understanding and fulfilment. It is a partnership
spurred by the urgency to achieve the common
goal of greater energy independence for the
country, and the support and consideration
extended by it to the organization through all the
many event ful years of ONGC’s existence has been
nothing less than outstanding.
Stability in the energy industry is a chimera, an
overused concept that seldom encounters real-
world translation. But you are looking at a company
that can look ahead to the future with as much
confidence as it can look back upon its more than
50 years of rich legacy, and with the potential to
deliver even more value for the investment you have
commit ted it through the years. ONGC continues to
be a worthy exemplar of consistency in a world
where change is the most abiding norm. In the same
vein, you have remained steady with your support
for this company. We sincerely acknowledge the
confidence and trust you have placed in us, right
along the journey, equally through periods of
growth and turmoil. You, our valued shareholder,
are the cornerstone of our motivation for greater
success.
Dinesh Kumar Sarraf
Chairman & Managing Director

Leading from the front: Hon'ble MoS (I/C), Petroleum & Natural Gas Shri Dharmendra Pradhan during his review visit of the Mumbai Of fshore operations.

VISIONTo be the global leader in integrated energy business through sustainable growth, knowledge excellence and exemplary governance practices.
MISSION
World Class• Dedicated to excellence by leveraging competitive advantages in R&D
and technology with involved people.
• Imbibe high standards of business ethics and organizational values.
• Abiding commitment to safety, health and environment to enrich quality of community life.
• Foster a culture of trust, openness and mutual concern to make working a stimulating and challenging experience for our people.
• Strive for customer delight through quality products and services.
Integrated In Energy Business
• Focus on domestic and international oil and gas exploration and production business opportunities.
• Provide value linkages in other sectors of energy business.
• Create growth opportunities and maximize shareholder value.
Dominant Indian Leadership
• Retain dominant position in Indian petroleum sector and enhance India's energy availability.
Carbon Neutrality
• ONGC will continually strive to reduce CO emissions across its activity 2
chain with the objective of achieving carbon neutrality.

Contents
Board of Directors 14
Notice 23
Performance at a Glance 34
Board's Report 48
Annexure to Board's Report 80
Comments of C&AG 113
Management Discussion & Analysis 118
Report
Corporate Governance Report 143
Auditors Certificate on Corporate 172
Governance

Contents
Business Responsibility Report 174
Secretarial Audit Report 197
Independent Auditors’ Report on Standalone
Financial Statements 202
Standalone Financial Statement 208
Statement Pursuant to Section 129 (AOC-1) 264
Group Performance at a Glance 266
Auditors’ Report on Consolidated Financial
Statement 272
Consolidated Financial Statement 283

ONGC places utmost importance to safety at work place. Fire and safety drills are held regularly to enable our people to be prepared to face any eventuality.

Notice
Board of Directors
Performance at a Glance


Financial Highlights FY'15
13
661,549
761,291825,714 834,697 823,488
FY'11 FY'12 FY'13 FY'14 FY'15
SALES INCOME (` MILLION)
CAGR: 5.64%
NET PROFIT (` MILLION)
CAGR: (-) 1.61%
189,240
251,229
209,257220,948
177,330
FY'11 FY'12 FY'13 FY'14 FY'15
CONTRIBUTION TO EXCHEQUER (` MILLION)
CAGR: 7.29%
317,759
382,873408,806 405,750 421,074
FY'11 FY'12 FY'13 FY'14 FY'15
74,861
83,416 81,277 81,277 81,277
FY'11 FY'12 FY'13 FY'14 FY'15
DIVIDEND ( MILLION)`
NET WORTH (` MILLION)
967,084
1,117,8411,229,674
1,356,3111,436,229
FY'11 FY'12 FY'13 FY'14 FY'15
CAPEX (` MILLION)
282,755 292,466 295,079324,695
299,975
FY'11 FY'12 FY'13 FY'14 FY'15
CAGR: 10.39%
Financial Highlights FY’15

V P MahawarV P MahawarDirector (Onshore)
A K DwivediA K DwivediDirector (Exploration)
T K SenguptaDirector (Of fshore)
V P MahawarDirector (Onshore)
A K DwivediDirector (Exploration)
T K SenguptaDirector (Of fshore)
K N MurthyIndependent Director
BOARD OF DIRECTORS
stAs on 1 August, 2015
D K SarrafChairman &
Managing Director
U P SinghGovt. Nominee
Director
Atreyee DasGovt. Nominee
Director
Atreyee DasGovt. Nominee
DirectorShashi ShankerDirector (T&FS)Shashi ShankerDirector (T&FS) D D Misra
Director (HR)

Annual Report 2014-15
Brief Profiles of the Board of Directors
16
Chairman and Managing Director
Brief Profiles of the Board of Directors As on 01.08.2015
Functional Directors
Shri Shashi Shanker, Director (T&FS) joined ONGC Board on 01.12.2012. He holds a B.Tech
degree in Petroleum Engineering from Indian School of Mines, Dhanbad and MBA with
specialization in Financial Management from IGNOU.
He undertook General Management Training from IIM, Lucknow and Leadership Development
Programme at ISB, Hyderabad under "Shangsaptak" programme. He has more than 32 years of
experience in Oil Industry and having wide exposure in diverse E&P activities both in on land &
of fshore operations, R&D activities and spearheading the deep/ultradeep water drilling campaign
of ONGC.
Shri D. K. Sarraf, 57, is the Chairman & Managing Director of Oil and
Natural Gas Corporation Ltd (ONGC), India's one of the most valuable public
sector enterprises and one of the most premier E&P companies in the world.
He is also the Chairman of ONGC Videsh Limited, Mangalore Refinery and
Petrochemicals Ltd and other ONGC Group companies ONGC Petro-
additions Ltd, ONGC Mangalore Petrochemicals Ltd, Mangalore SEZ Ltd and
ONGC Tripura Power Company Ltd.
Shri Sarraf graduated in Commerce from the prestigious Shri Ram College
of Commerce, Delhi University and holds a post graduate degree in
Commerce from the same University. He is an Associate member of the
Institute of Cost Accountants of India and the Institute of Company
Secretaries of India.
He has experience of over three decades in the oil and gas industry, having
started his oil and gas career in India's second largest upstream oil
company – Oil India Limited and worked there till 1991 where he inculcated
the experience in various facets of E&P at oil field level. He joined ONGC in 1991 and handled various key
assignments at corporate of fices. He was elevated to the post of Director (Finance) in ONGC Videsh in February,
2005 where he served till December, 2007. During this period, ONGC Videsh made significant acquisitions in Syria,
Brazil, Colombia, Venezuela, Cuba, Egypt and Myanmar. In December 2007, took over as Director (Finance), ONGC.
In September 2011, Shri Sarraf went back to ONGC Videsh assuming the charge of its Managing Director. In March
2014, he took over as Chairman & Managing Director of ONGC.
In recognition of his excellence in financial management and various other outstanding contributions, he has
been conferred with several accolades including the Best CFO Award in Oil & Gas sector in India by CNBC in
2009 and 2011. He has been conferred Distinguished Fellowship 2015 by the Institute of Directors (IOD) for
practicing highest standards of corporate governance while steering the boards of ONGC, a Maharatna firm and
its group companies.

Brief Profiles of the Board of Directors
17
Shri Tapas Kumar Sengupta, Director (Of fshore) joined ONGC Board on 01.02.2014.
He holds a first-class B.Tech degree in Chemical Engineering from Jadavpur University,
Calcut ta, and a Diploma in Management from Indira Gandhi National Open University.
Prior to becoming Director(Of fshore), he was Chief of Well Services looking af ter
operations, technological needs apart from manpower and material support for all
Onshore and Of fshore assets in respect of Well Services and Deepwater projects of
Eastern Coast of India
Shri Sengupta is one of the select club of production engineers who has a balanced
exposure to both onshore and of fshore oilfields operation. His onshore experience
port folio comprises of Well Services in Gujarat and Assam for 11 long years and 4 years in
Sudan as part of ONGC Videsh.
Of his 18 years in Of fshore fields of f Mumbai, he served for 12 years in Mumbai High in
Well Services, successfully handling a number of production-enhancement
assignments. Shri Sengupta was also instrumental in improving performances of
ONGC’s Of fshore sick well inventory. He was the recipient of the CMD award for Best
Production Engineer in 1996 & Best Professional Engineer in 2001 for the same.
Shri Desh Deepak Misra, Director (Human Resource) joined ONGC Board on 01.08.2014. He
holds a Master's Degree in Public Administration (MPA) from University of Lucknow. Prior to his
appointment as Director (HR), ONGC he was Head Corporate Administration at ONGC
Dehradun.
Starting his career as Graduate Trainee, Shri Misra has lef t his imprint in diverse assignments
given to him in three decades with the company. Despite holding high pressure assignments,
Shri Misra has always found time to nurture his other interests, particularly his passion for
wildlife photography. His maiden Cof fee Table photo book "The Karjat diaries" profiling bio-
diversity of Western Ghats was launched in January-2014 at Petrotech.
Shri Ajay Kumar Dwivedi, Director (Exploration) 16.03.2015. A post-graduate from Kanpur University, Shri Dwivedi has a distinguished career of more than 34 years in ONGC, holding key exploration-related assignments at dif ferent work centers starting from Mumbai, moving to Dehradun in North, to Chennai in South, then Jorhat in the east, Vadodara in the west and as Basin Manager MBA Basin, Kolkata, before finally taking over Western Of fshore as Basin Manager. Shri Dwivedi has managed ONGC’s prime exploration port folios in Western Of fshore-Kutch-Saurashtra, Mumbai Of fshore and Kerala-Konkan Basin.
His keen analytical acumen coupled with a people-centric approach has been his forte. His strength has been to encourage Multi-Disciplinary team working in various capacities across the organization. As a core team member of joint project team on organizational change program, Shri Dwivedi was involved with redesign of structure, systems and business processes aligned to Asset based model and their implementation in two pilot projects. With his rich academic lineage, Shri Dwivedi has authored a number of technical papers. Shri Dwivedi has undergone various development programs, including those at Indian School of Business, Hyderabad and University of Alberta School of Business, Alberta, Canada. He is af filiated to SPG - India, AEG – India and SPE and presently holds the of fice of President, SPG-India.
joined ONGC Board on

Annual Report 2014-15
Brief Profiles of the Board of Directors
18
Smt Atreyee Das is the Govt Nominee Director of your Company and joined the Board on 14.05.2015 and is Director General, Project Planning & Analysis Cell of Ministry of Petroleum & Natural Gas. She belongs to 1989 batch of Indian Audit and Accounts Service under the Comptroller and Auditor General of India. She has more than 24 years of experience in the field of public auditing and conducted several performance audits, financial audits and compliance audits. Before taking charge of Director General, Petroleum Planning and Analysis Cell, Ministry of Petroleum and Natural Gas, New Delhi since September 2014 she held various important positions viz. Director General, Of fice of the Director General of Commercial Audit and ex-of ficio Member Audit Board-IV, New Delhi from May 2013 to September 2014, Principal Director (State Receipt Audit) and Central Region in the O/o The Comptroller and Auditor General of India, New Delhi from April 2010 to June 2013, Accountant General (Commercial, Works and Receipt Audit), Orissa from September 2006 to April 2010, Principal Director of Audit, East Coast Railway, Bhubaneswar from April 2006 to September 2006, on deputation to the United Nations from September 2004 to December 2005, Director of Audit, Northern Railway from March 2002 to September 2004 etc.
Shri U. P. Singh, Additional Secretary (Exploration), Ministry of Petroleum & Natural Gas is the Govt Nominee Director of your Company and joined the Board on 16.10.2014. Shri Singh is B.Tech (Mechanical Engineering) and M.Tech in Industrial & Management Engineering from IIT, Kanpur. He belongs to 1985 batch of IAS (Odisha Cadre).
During his rich and varied experience as an IAS of ficer, he has held various administrative positions in the areas of Revenue, Social Justice & Empowerment, District Administration, Transport, Commercial Taxes, Water Resources, Industries, Steel, Energy and Agriculture & Cooperation, etc. in the State Government and in the Ministries of Ocean Development, Parliamentary Af fairs, Surface Transport and Finance in the Central Government. Prior to joining as Joint Secretary, Ministry of Petroleum & Natural Gas, he was Joint Secretary, Ministry of Steel and earlier to that he was Principal Secretary, Agriculture Department in the State Government of Odisha. He has been on the Board of Steel Authority of India Ltd. as a Government nominee.
Government Nominee Directors
Shri V. P. Mahawar has taken over as Director (Onshore), ONGC on 01.08. 2015. Shri Mahawar is a Graduate in Mechanical Engineering from Pandit Ravi Shankar Shukla University, Raipur.
He joined ONGC as Driller in the year 1982. He is the first sub-sea engineer of ONGC. He was awarded as CMD’s Young Executive of the year in 1987 and CMD’s Manager of the year award in the year 1999. He has 33 years of oil field experience in various capacities across entire spectrum of ONGC. He pioneered in establishment of Well Control School at Institute of Drilling Technology (IDT), Dehradun, which has been imparting training to ONGCians and oil personnel from Indian as well as foreign oil companies, in understanding the well control techniques & equipment leading to upward change in drilling fraternity’s skill & knowledge. Shri Mahawar is a veteran of numerous Blow-out control jobs and an expert in handling the complicated well control problems. He has authored and developed “Well Control Manual for Of fshore Operations” as part of the team to develop OISD Standard 174 for Well Control Practices.

Brief Profiles of the Board of Directors
19
Shri S Ravi, an Independent Director of your Company, had joined the ONGC Board on 29.11. 2013 on 19.09.2014 He is a Fellow Member of the Institute of Chartered Accountants of India and holds a Master’s Degree in Commerce. He is a Senior Partner of Ravi Rajan & Co. Chartered Accountants having vast experience in the profession. He has handled various assignments in the field of Restructuring & Rehabilitation of companies, Takeover, Mergers & Acquisitions and Business and Brand valuation. He has specialised in the fields of Accounting & Audit, Financial & Management Consulting, Business Valuations, Mergers & Acquisitions and Business Advisory Services.
and ceased to be a director
Shri P. Uma Shankar, an Independent Director of your Company, had joined the ONGC Board on 29.11. 2013 and ceased to be a director on 19.09.2014. He holds a Masters Degree of Science in Mathematics from IIT, Madras and M.Sc in Social Policy and Planning in Developing Countries from London School of Economics. Belonging to IAS of 1976 batch (UP Cadre), He has 33 years of leadership experience in Government spanning revenue, law and order, development work, rural infrastructure, finance, housing & urban development, industries, municipal af fairs and relief. He has during his long and distinguished career served both in the Central and State Government.
Directors whose term ceased since last Annual General Meeting
Shri K. Narasimha Murthy, aged 57 years, an Independent Director of your Company. He has a brilliant academic record, get ting ranks in both CA & ICWA courses. He entered the Profession of Cost & Management Accountancy in 1983. He is associated with the development of Cost & Management Information Systems for more than 150 Companies covering more than 45 Industries. In addition, he is closely associated with turning around of many large Corporates, focusing on systems improvement with Cost Reduction approach.
He is closely involved with several National level Financial Institutions and is on the Board of various companies.
Independent Directors
Special InviteeShri Narendra Kumar Verma is the Managing Director of ONGC Videsh Ltd, the wholly owned subsidiary of your company. He has more than 32 years of experience. He holds a Master Degree in Applied Geology, an M. Tech degree in Petroleum Exploration and MBA in Finance. He has also completed One Year Global Manager's Program at IIM Kolkata. Recipient of many national awards and international commendations, the crowning moment of his technical career came with the prestigious 'National Mineral Award', the highest recognition by the Government of India in the field of geosciences, mining and allied areas, that was conferred upon him for his outstanding contribution to Petroleum Exploration in Mumbai Of fshore, ONGC. Shri Verma has demonstrated remarkable competence in challenging roles in the domain of 'Exploration' and technological research, ranging from management of overseas exploration and Business Development; Management of exploration activities in Frontier Basin, Mumbai Of fshore and Assam-Arakan Basin; and Head of Interpretation Group at the prestigious Geodata Processing and Interpretation Centre (GEOPIC) of ONGC.

Annual Report 2014-15
Brief Profiles of the Board of Directors
20
Shri Aloke Kumar Banerjee, Former Director (Finance) of ONGC superannuated from the services of ONGC on 30.04.2015. A member of Institute of Chartered Accountants of India, Institute of Cost Accountants of India and Institute of Company Secretaries of India, he had 33 years of diversified experience in Financial Management and Strategic Planning in upstream Oil & Gas Industry with specialization in Corporate Accounts, Corporate Budget, Cost Management, Risk Analysis & Financial Planning, Procurement & Contracts, Performance Benchmarking & Evaluation, Audit, Corporate Governance, Insurance, etc. He had introduced & implemented Financial Benchmarking Concept and Zero-base Budgeting in ONGC.
Shri Om Prakash Bhatt, an Independent Director of your Company, had joined the ONGC Board on 14.12. 2011 on 13.12.2014. He started his career as a probationary of ficer with SBI in 1972. During his career span of 36 years with SBI, he has held several important assignments in India and abroad including stints at the Bank's London and Washington of fices. Under the leadership of Shri Bhatt, SBI steadily improved its global ranking in the list of Fortune 500 companies. Shri Bhatt made rapid strides arresting falling market share, rapid branch expansion with the bank opening 11,000th branch under him, the first Indian bank and only the second in the world to do so, and entering a number of new businesses.
and ceased to be a director
Prof. Samir Kumar Barua, an Independent Director of your Company, had joined the ONGC Board on 14.12.2011 on 13.12.2014. He holds a Master’s degree in Industrial Engineering and Operations Research and holds a Doctorate degree in Management. He joined the faculty of Indian Institute of Management, Ahmedabad in 1980. His specific areas of interest include Capital Market, International Finance, Operations Research, Decision Support System and Corporate Financial Management. He is a visiting professor to academic institutions in USA, Netherlands, Singapore & Cyprus. He has authored a number of books and case studies in Management. He is a consultant to many public and private organizations in the manufacturing, banking, and financial services sectors. He has handled various assignments as advisor to Reserve Bank of India, FICCI and the Bombay and National Stock Exchanges.
and ceased to be a director
Shri R. K. Singh, an Independent Director of your Company, had joined the ONGC Board on 23.05.2014 on 19.09.2014. He has done his graduation in Mechanical Engineering from Banaras Hindu University, India. He has 38 years of experience including 35 years in Oil Industry. He had associated with Bharat Petroleum Corporation of India for 36 years and held Board level Position of Director (Refineries) and Chairman & Managing Director for over 7 years. As Chairman & Managing Director of BPCL, he stewarded BPCL group companies to new heights and making BPCL a global organization. He held various positions and made significant contribution in the growth aspiration of BPCL and served as a working group member of Technology Transfer of LPG Equipment to India.
and ceased to be a director

Brief Profiles of the Board of Directors
21
Chief Vigilance Officer
Dr Akhilesh Kumar Ambasht, an Indian Forest Service of ficer of cadre AGMUT - 1987, is the
Chief Vigilance Of ficer of ONGC. Dr Ambasht holds a Master's degree in Botany from the
Gorakhpur University and was awarded a Ph.D. in Botany (Ecology) from Banaras Hindu
University.Prior to joining ONGC, Dr Ambasht has held important assignments such as CVO of Delhi Jal
Board, Member Secretary, Delhi Pollution Control Commit tee and Assessor & Collector of
Municipal Corporation of Delhi. He has a wide ranging experience in various assignments of
Ministry of Human Resources and various departments of Government of Goa. Dr Ambasht is
also M.Sc. in Forestry and has an in-depth knowledge of forestry. He has published around 14
Research papers in various National & International journals.
Shri Ashok Varma, Former Director (Onshore) superannuated from the services of ONGC on 31.07.2015. Shri Ashok Varma is a graduate in Petroleum Engineering from Indian School of Mines, Dhanbad and joined ONGC in 1978 as Assistant Engineer at Assam. During his early years at ONGC, he was actively engaged in design and engineering of of fshore plat forms in western Of fshore. Subsequently, he served in Western Onshore at Ankleshwar where he extensively worked on water injections leading to initiation of pressure maintenance in Gandhar field. He steered the Imperial Energy in Russia, a subsidiary of the ONGC Videsh Limited, as the Chief Executive Of ficer and was instrumental in acquiring 20% participating interest in Sakhalin-1 project in Russia by ONGC Videsh in 2001. He also headed ONGC’s Assam operations as Asset Manager from 2008 to 2009.
Dr Subhash C. Khuntia, earlier Special Secretary & Financial Advisor, Ministry of Petroleum
& Natural Gas, Govt of India, was a Government Nominee Director of ONGC and ceased to
be a Director on 26.06.2015. He holds Masters Degree in Physics, Economics, Sociology
and Doctorate in Art Economics from St. Stephen’s College, Delhi University. Belonging to
1981 batch of IAS (Karnataka cadre), He has handled various key assignments including
District administration, Land revenue management, Rural development in the Karnataka
State Government as well as in the Ministries of Agriculture, Finance and Human Resource
Development in the Central Government. He is presently Secretary, School Education and
Literacy, Ministry of Human Resource Development, Government of India.

Annual Report 2014-15
Reference Information
22
Registered OfficeTower II, Jeevan Bharati Building124, Indira Chowk, New Delhi - 110 001
Statutory Auditors
M/s Varma & Varma, ChennaiM/s Khandelwal Jain & Co., MumbaiM/s Lodha & Co, KolkataM/s Mehra Goel & Co., New DelhiM/s G D Apte & Co. Mumbai
Secretarial AuditorM/s P P Agarwal & Co.New Delhi
Subsidiaries
ONGC Videsh Ltd.Mangalore Refinery and Petrochemicals Ltd.
Registrar & Share Transfer Agent
M/s Karvy Computershare Private Ltd. Karvy Selenium, Tower B, Plot 31-32, GachibowliFinancial District, Nanakramguda, Hyderabad-500 032
BankersState Bank of India
Website : www.ongcindia.comemail: [email protected]
Company SecretaryN.K. Sinha (upto 30.06.2015)V N Murthy (from 01.07.2015)
Corporate OfficeTel Bhavan, Dehradun - 248 003Uttarakhand
Cost Auditors
Listed at
Bombay Stock Exchange Ltd.National Stock Exchange of India Ltd.
M/s Rao Murthy & Associates, BangaloreM/s. R Nanabhoy & Co. Mumbai M/s. R J Goel & Co., DelhiM/s Shome & Banerjee, Kolkata M/s Rohit & Associates, MumbaiM/s Dhananjay V. Joshi & Associates, Pune
Depositories
National Securities Depository Ltd.Central Depository Services (India) Ltd.
Reference Information
CIN : L74899DL1993GOI054155

Notice
23
ndNotice is hereby given that the 22 Annual General
Meeting of the Members of OIL AND NATURAL GAS
CORPORATION LIMITED will be held on Tuesday, the th15 September, 2015 at 10:00 hrs. at NDMC Indoor
Stadium, Talkatora Garden, New Delhi, to transact the
following business:
ORDINARY BUSINESS:
1. To receive, consider and adopt the Audited Financial
Statements including Consolidated Financial
Statements of the Company for the financial year ended ston 31 March, 2015, together with the Board's Report,
the Report of Auditors’ thereon and Comments of the
Comptroller & Auditor General of India, in terms of
Section 143(6) of the Companies Act, 2013.
2. To confirm the payment of two interim dividends and
declare final dividend on equity shares for the year
2014-15.
3. To appoint a Director in place of Shri Shashi Shanker
(DIN-06447938) who retires by rotation and being
eligible, of fers himself for re-appointment.
4. To authorise Board of Directors of the Company to fix the
remuneration of the Joint Statutory Auditors of the
Company for the Financial Year 2015-16, in terms of the
provisions of Section 139(5) read with Section 142 of
the Companies Act, 2013 and to pass the following
resolution, with or without modification(s), as Ordinary
Resolution:
“RESOLVED THAT the Board of Directors of the
Company be and are hereby authorised to decide and
fix the remuneration of the Joint Statutory Auditors of
the Company for the Financial Year 2015-16, as may be
deemed fit by the Board”.
SPECIAL BUSINESS:
ITEM No. 5
To consider and if thought fit, to pass with or without
modification(s), the following resolution as an
Ordinary Resolution:
“RESOLVED THAT Shri U. P. Singh (DIN- 00354985)
who was appointed as an Additional Director (Govt.
Director) under Section 161 of the Companies Act, th2013, effective 16 October, 2014 and holds office
ndupto the 22 Annual General meeting and the
Company having received a notice in writing, under
Section 160 of the Companies Act, 2013, from a
member proposing his candidature for the office of
director, be and is hereby appointed as a Director of
the Company, liable to retire by rotation.”
ITEM No. 6
To consider and if thought fit, to pass with or without
modification(s), the following resolution as an
Ordinary Resolution:
“RESOLVED THAT Shri Ajay Kumar Dwivedi (DIN-
07048874) who was appointed as an Additional
Director and designated as Director (Exploration)
under Section 161 of the Companies Act, 2013, theffective 16 March, 2015 and holds office upto the
nd22 Annual General meeting and the Company
having received a notice in writing, under
Section 160 of the Companies Act, 2013, from
Shri A. K. Dwivedi proposing his candidature for the
office of director, be and is hereby appointed as a
Director of the Company, liable to retire by
rotation.”
ITEM No. 7
To consider and if thought fit, to pass with or without
modification(s), the following resolution as an
Ordinary Resolution:
“RESOLVED THAT Smt. Atreyee Das (DIN-
07194189)who was appointed as an Additional
Director (Govt. Director) under Section 161 of the thCompanies Act, 2013, effective 14 May, 2015 and
ndholds office upto the 22 Annual General meeting
and the Company having received a notice in
writing, under Section 160 of the Companies Act,
2013, from a member proposing her candidature for
the office of director, be and is hereby appointed as
a Director of the Company, liable to retire by
rotation.”
NOTICE
OIL AND NATURAL GAS CORPORATION LIMITED CIN: L74899DL1993GOI054155
Reg. office: JEEVAN BHARATI, 124 INDIRA CHOWK, NEW DELHI- 110001Website: www.ongcindia.com email: [email protected] Tel: 011-23301277/1299

Annual Report 2014-15
Notice
24
ITEM No. 8
To consider and if thought fit, to pass with or without
modification(s), the following resolution as an
Ordinary Resolution:
“RESOLVED THAT Shri V. P. Mahawar(DIN-
07208090) who has been appointed as an Additional
Director by the Board of Directors and designated
as Director (Onshore) under Section 161 of the stCompanies Act, 2013, effective 1 August, 2015 and
ndholds office upto the 22 Annual General meeting
and the Company having received a notice in
writing, under Section 160 of the Companies Act,
2013, from Shri V. P. Mahawar proposing his
candidature for the office of director, be and is
hereby appointed as a Director of the Company,
liable to retire by rotation.”
ITEM No. 9
To consider and if thought fit, to pass, with or without
modifications, the following resolution as an
Ordinary Resolution:
“RESOLVED THAT pursuant to the provisions of
Section 148 and other applicable provisions of the
Companies Act, 2013 and rule 14(a)(ii) of the
Companies (Audit and Auditors) Rules, 2014
(including any statutory modification(s) or re-
enactment thereof, for the time being in force), the
aggregate remuneration of `19.50 lakhs plus
applicable taxes and out of pocket expenses
payable to the six Joint Cost Auditors appointed by
the Board of Directors of the Company, to conduct
the audit of the cost records of the various units of
the Company for the financial year endingst31 March, 2016, be and is hereby ratified.”
Regd. Office:Jeevan Bharti BuildingTower II, 124 Indira Chowk,New Delhi - 110 001
st1 August, 2015(V N Murthy)
Company Secretary
By Order of the Board of Directors

Notice
25
NOTES:
1. A MEMBER ENTITLED TO ATTEND AND VOTE AT
THE MEETING IS ENTITLED TO APPOINT A
PROXY TO ATTEND AND VOTE INSTEAD OF
HIMSELF AND THE PROXY NEED NOT BE A
MEMBER OF THE COMPANY. THE PROXY FORM
DULY COMPLETED MUST BE DEPOSITED AT THE
REGISTERED OFFICE OF THE COMPANY NOT
LESS THAN FORTY-EIGHT HOURS (48 HRS.)
BEFORE THE COMMENCEMENT OF THE
MEETING. BLANK PROXY FORM IS ATTACHED. A
PERSON CAN ACT AS A PROXY ON BEHALF OF
MEMBERS NOT EXCEEDING 50(FIFT Y)
MEMBERS AND HOLDING IN AGGREGATE NOT
MORE THAN TEN PERCENT OF THE TOTAL
SHARE CAPITAL OF THE COMPANY. PROXIES
SUBMITTED ON BEHALF OF L IMITED
COMPANIES, SOCIETIES ETC MUST BE
SUPPORTED BY APPROPRIATE RESOLUTION/
AUTHORITY, AS APPLICABLE.
2. Relevant Explanatory Statement pursuant to Section
102(2) of the Companies Act, 2013, in respect of
Special Business, as set out above is annexed hereto.
3. Brief profile of the Directors seeking appointment/re-
appointment as mandated under Clause 49 of the
Listing Agreement with the Stock Exchanges is
annexed hereto and forms part of the Notice. The
directors have furnished consent/declaration for their
appointment /re-appointment as required under the
Companies Act, 2013 and the Rules thereunder.
4. The Register of Members and Share Transfer Books of
the Company will remain closed from Wednesday, th the 9 September, 2015 to Tuesday, the
th 15 September, 2015 (both days inclusive).
5. The Board had recommended a final Dividend of 0.50
per equity share of `5/- each fully paid up, at its
meeting held on 28th May, 2015. The dividend, if
approved by the Members at the said Annual General
Meeting, will be paid within a period of 30 days from
the date of declaration, to the members whose
names appear on the Register of Members of the
Company af ter giving effect to all valid share
transfers in physical form lodged with the
Company on or before Tuesday, the 8th
September, 2015 and the respective Beneficial
Owners as at the close of business hours on
Tuesday, the 8th September, 2015, as per details
thereof to be furnished by the depositories.
6. The Register of Directors and Key Managerial
Personnel and their shareholding maintained under
Section 170 of the Companies Act, 2013 & the Register
of Contracts or arrangements in which the Directors
are interested, maintained under Section 189 of the
Companies Act, 2013 will be available for inspection
by the members at the AGM venue.
7. Relevant documents referred to in the accompanying
notice are open for inspection by the members at the
Registered of fice of the Company on all working days
i.e Monday to Friday between 10.30 a.m. to 12.30 p.m.
upto the date of Annual General Meeting.
8. Share transfer documents and all correspondence
relating thereto, should be addressed to the Registrar
and Transfer Agent of the Company – M/s. Karvy
Computershare Private Ltd. (Karvy), Karvy Selenium
Tower B, Plot 31-32, Gachibowli Financial District,
Nanakramguda, Hyderabad – 500 032, Phone Nos.
040 - 6716 2222, Fax No. 040 - 2300 1153; e-mail :
[email protected]. Karvy is also the depository
inter face of the Company with both NSDL and CDSL.
However, keeping in view the convenience of the
Shareholders, documents relating to shares will
continue to be accepted at Karvy Computershare rdPrivate Ltd. 305, 3 Floor, New Delhi House, 27,
Barakhamba Road, Connaught Place, New Delhi-
110001, Phone Nos. 011-41036370 (tele-fax) &
43528522; e-mail: [email protected] and at the thRegistered Of fice of the Company at 8 Floor, Jeevan
Bharati, Tower-II, 124, Indira Chowk, New Delhi-
110001, Phone No.011-23301277/23301299;
e-mail: [email protected] .
9. The Company has designated an exclusive e-mail ID
called [email protected] for redressal of
shareholders’/investors’ complaints/grievances. In
case you have any queries/complaints or grievances,
then please write to us at the above e-mail address.
10. Members holding shares in electronic form may
please note that the bank account details and 9-digit
MICR Code of their Bankers, as noted in the records of
their depository, shall be used for the purpose of
remit tance of dividend through Electronic Clearing
Service (ECS), or for printing on dividend warrants,
wherever applicable. Members are, therefore,
requested to update their bank account particulars,
change of address and other details with their
respective Depository Participants for shares held in
demat mode and to the Registrar and Share Transfer

Annual Report 2014-15
Notice
26
Agent for shares held in physical form.
11. Reserve Bank of India (RBI) is providing ECS/NECS
facility for payment of dividend in select cities.
Members holding shares in physical form are advised
to submit particulars of their bank account, viz., names
and address of the branch of the bank, 9 digit MICR
code of the branch, type of account and account thnumber latest by 8 September, 2015 to M/s Karvy
Computershare Private Ltd.
12. Pursuant to Section 124(5) and 125(c ) of the
Companies Act, 2013, the Company has transferred
the unpaid/unclaimed amount of final dividend thdeclared on 19 September, 2007 for the financial year
nd2006-07 and interim dividend declared on 22
December, 2007 for the financial year 2007-08, to the
Investor Education and Protection Fund of the Central
Government. The unpaid/unclaimed amount of thFinal Dividend declared on 19 September, 2008
thand Interim Dividend declared on 19 December,
2008 will be transferred to the Investor Education
and Protection Fund (IEPF) of the Central th thGovernment by 18 October, 2015 and 18 January,
2016 respectively. Members who have not
encashed their dividend warrants pertaining to the
said years may approach the Company or its
Registrar & Share Transfer Agent for obtaining
payment there of.
13. In order to avoid the incidence of fraudulent
encashment of dividend warrants, the Members
holding shares in physical form are requested to
provide their Bank Account Number, Name and
Address of the Bank/Branch to the Company or Karvy
to enable them to incorporate the same in the dividend
warrant.
14. Members who have not encashed their dividend
warrants within its validity period may write to the
Company at its Registered Of fice or M/s Karvy
Computershare Private Limited, Registrar & Share
Transfer Agent of the Company, for revalidating the
warrants or payment in lieu of such warrants in the form
of demand draf t.
15. The Annual Report 2014-15 is being sent by
electronic mode to those members whose email
addresses are registered with the Company/
Depositories/RTA, unless any member has
requested for a physical copy of the same. For
members, who have not registered their email
addresses, physical copies are being sent by the
permitted mode.
16. In compliance with the provisions of section 108 of the
Act, the Rules there under and Clause 35B of the listing
agreement, the Members are provided with the facility
to cast their vote electronically, through the e-voting
services provided by M/s Karvy Computershare
Private Ltd.(KCPL), on all resolutions set forth in this
Notice. The instruction for e-voting are annexed to the ndnotice. The notice of 22 Annual General Meeting
along with the proxy Form and at tendance slip is
being sent by electronic mode to those members
whose email addresses are registered with the
Company/Depositories/RTA, unless any member has
requested for a physical copy of the same. For
members, who have not registered their email
addresses, physical copies are being sent by the
permit ted mode. The facility for voting through ballot
paper, will also be made available at the AGM and the
members at tending the AGM who have not cast their
vote by remote e-voting shall be able to exercise their
right at the AGM through ballot papers. Members who
have cast their vote by remote e-voting prior to the
AGM, may at tend the AGM but shall not be entitled to
cast their vote again.
17. In terms of Section 72 of the Companies Act, 2013,
nomination facilit y is available to individual
shareholders. Members holding shares in physical
form may nominate a person in respect of all the
shares held by them whether singly or jointly.
Members who hold shares in individual name are
advised to avail of the nomination facility by filing Form
No. 2B in their own interest. Blank form can be
obtained from Karvy on request. Members holding
shares in dematerialised form may contact their
respective DPs for registration of nomination.
18. Members holding physical shares in multiple folios in
identical names are requested to send their share
certificates to Company’s Registrar and Share
Transfer Agent, M/s Karvy Computershare Private Ltd.
for consolidation.
19. Pursuant to Section 139(5) read with Section 142 of the
Companies Act, 2013, the Auditors of a Government
Company are appointed or re-appointed by the
Comptroller and Auditor General (C&AG) of India and
their remuneration is to be fixed by the Company in the
Annual General Meeting. The members may authorise
the Board to fix up an appropriate remuneration of
Auditors for the year 2015-16 af ter taking into

Notice
27
consideration the increase in volume of work and
prevailing inflation etc.
20. Members are requested:
i) to bring their copies of Annual Report and
Attendance Slip duly completed and signed at the
meeting.
ii) to quote their Folio/DP & Client identification No. in
all correspondence.
iii) Not to bring brief case, bags, eatables, cell phone
etc. as they are prohibited inside the meeting hall
for security reasons.
iv) to notify immediately any change of their address
and bank particulars to the Company or its Share
Transfer Agent, in case shares are held in physical
form.
AND
In case their shares are held in dematerialised
form, information should be passed on directly to
their respective Depository Participants and not to
the Company/Share Transfer Agent, without any
delay.
v) to note that no gif t will be distributed at the
meeting.
EXPLANATORY STATEMENT PURSUANT TO SECTION
102 OF THE COMPANIES ACT, 2013
Item No.5
APPOINTMENT OF SHRI U. P. SINGH
Shri U. P. Singh was appointed as an Additional Director th(Govt. Director) on the Board of ONGC ef fective 16
October, 2014. In terms of Section 161 of the Companies ndAct, 2013, he holds of fice upto the 22 Annual General
meeting of the Company. The Company has received a
notice in writing from a member pursuant to the provisions
of Section 160 of the Companies Act, 2013, signifying
intention to propose Shri U. P. Singh as candidate for the
of fice of Director. Shri U. P. Singh, if appointed, will be liable
to retire by rotation under Section 152 of the Companies
Act, 2013 and in terms of provisions under the Articles of
Association of the Company.
thBorn on 10 October, 1962, Shri U. P. Singh an IAS Of ficer of
1985 Batch, Odisha Cadre, is a B.Tech. (Mechanical
Engineering) and M.Tech in Industrial & Management
Engineering from IIT, Kanpur. Shri Singh has held important
positions in Government of Odisha as well as Government
of India. In the State Government of Odisha, he has worked
in Departments of Land Revenue, Social Justice &
Empowerment, Energy, Transpor t, Finance, Water
Resources, Industries and Agriculture & Cooperation. In the
Central Government, he has worked as PS to Minister of
Parliamentary Af fairs and Tourism, Director in Department
of Financial Services, Ministry of Finance and Joint
Secretary, Ministry of Steel. He has also been on the
Boards of Allahabad Bank, United Bank of India, Steel
Authority of India Ltd and KIOCL as Government Nominee
Director. He is presently the Additional Secretary (Expl.) in
the Ministry of Petroleum & Natural Gas.
Shri U. P. Singh is also acting as the CMD of Oil India Ltd.
He holds NIL equity shares in ONGC.
Except Shri U. P. Singh, none of the Directors, Key Managerial
Personnel and their relatives is interested or concerned in
the resolution.
The Board of Directors considers that in view of the
background and experience of Shri U. P. Singh, it would be
in the interest of the Company to appoint him as a Director of
the Company. The Board recommends the resolution for
your approval.
Item No.6
APPOINTMENT OF SHRI A. K. DWIVEDI
Shri A. K. Dwivedi was appointed as an Additional Director
and designated as Director (Exploration) on the Board of thONGC ef fective 16 March, 2015. In terms of Section 161 of
ndthe Companies Act, 2013, he holds of fice upto the 22
Annual General meeting of the Company. The Company
has received a notice in writing from him pursuant to the
provisions of Section 160 of the Companies Act, 2013,
signifying his intention as candidate for the of fice of
Director. Shri A. K. Dwivedi, if appointed, will be liable to
retire by rotation under Section 152 of the Companies Act,
2013 and in terms of provisions under the Articles of
Association of the Company.
thBorn on 9 July 1959, Mr. A. K. Dwivedi holds a post-
graduate degree from Kanpur University. Mr. Dwivedi has
34 years of experience in ONGC. He joined ONGC Board on
16.03.2015 at a crucial juncture when the business
environment is not only challenging but also demanding in
respect of exploration. Prior to becoming Director
(Exploration), he was holding key exploration-related
assignments at dif ferent work centers starting from
Mumbai, moving to Dehradun in North, to Chennai in South,
then Jorhat in the east, Vadodara in the west and as Basin
Manager MBA Basin, Kolkata, before finally taking over

Annual Report 2014-15
Notice
28
Western Of fshore as Basin Manager. Mr. Dwivedi has
played pivotal roles in the Management Commit tees of
various NELP blocks.
Mr. Dwivedi has authored a number of technical papers. Mr.
Dwivedi was Head of the steering commit tee for project on
sequence-stratigraphy and petroleum systems in all the
sedimentary basins of India in association with Dr. Octavian
Cataneanu, an expert in sequence stratigraphy. A strong
believer in continuous development, Mr. Dwivedi has
undergone various development programs, including those
at Indian School of Business, Hyderabad and University of
Alberta School of Business, Alberta, Canada. He is af filiated
to SPG - India, AEG – India and SPE and presently holds the
of fice of President, SPG-India.
Shri A. K. Dwivedi holds Directorship on the Board of
ONGC Petro-additions Ltd. He holds 820 equity shares of
`5 each in ONGC.
Except Shri A. K. Dwivedi, none of the Directors, Key
Managerial Personnel and their relatives is interested or
concerned in the resolution.
The Board of Directors considers that in view of the
background and experience of Shri A. K. Dwivedi, it would
be in the interest of the Company to appoint him as a
Director of the Company. The Board recommends the
resolution for your approval.
Item No.7
APPOINTMENT OF SMT. ATREYEE DAS
Smt. Atreyee Das was appointed as an Additional Director th(Govt Director) on the Board of ONGC ef fective 14 May,
2015. In terms of Section 161 of the Companies Act, 2013, ndshe holds of fice upto the 22 Annual General meeting of the
Company. The Company has received a notice in writing
from a member pursuant to the provisions of Section 160 of
the Companies Act, 2013, signifying intention to propose
Smt. Atreyee Das as candidate for the of fice of Director.
Smt. Atreyee Das, if appointed, will be liable to retire by
rotation under Section 152 of the Companies Act, 2013 and
in terms of provisions under the Articles of Association of the
Company.
thBorn on 13 June, 1965 Smt. Atreyee Das belongs to the
1989 batch of Indian Audit and Accounts Service under the
Comptroller and Auditor General of India. She has more
than 24 years of experience in the field of public auditing and
has conducted several performance audits, financial audits
and compliance audits. She was on secondment to the
United Nations as an internal auditor and worked in the
United Nations peacekeeping Mission in Ethiopia and
Eritrea. She had also been an external auditor to UNEP and
FAO and was recently nominated as an external auditor for
the new spell of UN audits assigned to the CAG of India.
Before taking charge of Director General, Petroleum
Planning and Analysis Cell, Ministry of Petroleum and
Natural Gas, New Delhi since September, 2014, she held
various important positions such as - Director General,
Of fice of the Director General of Commercial Audit and ex-
of ficio Member Audit Board-IV, New Delhi from May, 2013 to
September, 2014, Principal Director ( State Receipt Audit )
and Central Region in the O/o The Comptroller and Auditor
General of India, New Delhi from April, 2010 to June, 2013,
Accountant General (Commercial, Works and Receipt
Audit), Orissa from September, 2006 to April, 2010, Principal
Director of Audit, East Coast Railway, Bhubaneswar from
April, 2006 to September, 2006, on deputation to the United
Nations from September, 2004 to December, 2005, Director
of Audit, Northern Railway from March, 2002 to September,
2004 etc.
Smt. Atreyee Das does not hold any directorship.
She holds Nil equity shares in ONGC.
Except Smt. Atreyee Das, none of the Directors, Key
Managerial Personnel and their relatives is interested or
concerned in the resolution.
The Board of Directors considers that in view of the
background and experience of Smt. Atreyee Das, it would
be in the interest of the Company to appoint her as a Director
of the Company. The Board recommends the resolution for
your approval.
Item No.8
APPOINTMENT OF SHRI V. P. MAHAWAR
Shri V. P. Mahawar has been appointed as an Additional
Director by the Board of Directors and designated as
Director (Onshore) on the Board of ONGC ef fectivest1 August, 2015.In terms of Section 161 of the Companies
ndAct, 2013, he holds of fice upto the 22 Annual General
meeting of the Company. The Company has received a
notice in writing from him pursuant to the provisions of
Section 160 of the Companies Act, 2013, signifying his
intention as candidate for the of fice of Director. Shri V. P.
Mahawar, if appointed, will be liable to retire by rotation
under Section 152 of the Companies Act, 2013 and in terms
of provisions under the Articles of Association of the
Company.

Notice
29
thBorn on 8 February 1958, Mr. V. P. Mahawar is a Graduate in
Mechanical Engg. from Pandit Ravi Shankar Shukla
University, Raipur. He joined ONGC as Driller in the year
1982. He is the first sub-sea engineer of ONGC. He was
awarded as CMD’s Young Executive of the year in 1987 and
CMD’s Manager of the year award in the year 1999. He has
33 years of oil field experience in various capacities across
entire spectrum of ONGC.
He pioneered in establishment of Well Control School at
Institute of Drilling Technology (IDT), Dehradun, which has
been imparting training to ONGCians and oil personnel
from Indian as well as foreign oil companies, in
understanding the well control techniques & equipment
leading to upward change in drilling fraternity’s skill &
knowledge.
A veteran of numerous Blow-out control jobs and an expert
in handling the complicated well control problems, he has
successfully controlled more than 33 Blow-outs and
liquidated more than 100 well control complications of
Drilling, Well Services and producing wells successfully in
Onshore & Of fshore fields of ONGC, OVL & other operators
in India with enviable track record of safety. Mr. Mahawar
was the major force and face of the Crisis Management
Team (CMT) of ONGC making ONGC self-reliant in dealing
with well control situations.
He has to his credit more than 25 Nos. of papers presented
in international conferences. He developed “Well Control
Manual for Of fshore Operations” and part of the team to
develop OISD Standard 174 for Well Control Practices.
Shri V. P. Mahawar does not hold any other Directorship
He holds 1272 equity shares of 5 each in ONGC.
Except Shri V. P. Mahawar, none of the Directors, Key
Managerial Personnel and their relatives is interested or
concerned in the resolution.
The Board of Directors considers that in view of the
background and experience of Shri V. P. Mahawar, it would
be in the interest of the Company to appoint him as a
Director of the Company. The Board recommends the
resolution for your approval.
Item No.9
RATIFICATION OF REMUNERATION OF COST
AUDITORS FOR THE FINANCIAL YEAR 2015-16
The Board of Directors of the Company on the
recommendations of the Audit & Ethics Commit tee have
approved appointment of the following Cost Auditors of
ONGC for the year 2015-16 at a remuneration of 3.25 Lakh
(Rupees Three Lakh twenty five thousand only) per Cost
Auditor plus applicable service tax and out-of-pocket
expense, as per entitlement:
1. M/s Rao Murthy & Associates, Bangalore
2. M/s R. Nanabhoy & Co., Mumbai
3. M/s R J Goel & Co., Delhi
4. M/s Shome & Banerjee, Kolkata
5. M/s Rohit & Associates, Mumbai
6. M/s Dhananjay V. Joshi & Associates, Pune
None of the Directors, Key Managerial Personnel and their
relatives is interested or concerned in the resolution.
The Board of Directors recommends the resolution for your
approval.
Regd. Office:Jeevan Bharti BuildingTower II, 124 Indira Chowk, New Delhi - 110 001
st1 August, 2015
(V N Murthy)Company Secretary
By Order of the Board of Directors

Annual Report 2014-15
Instructions for e-voting
30
The instructions for e-voting are as under:
a) Details of the process and manner of e-voting along
with the User ID and Password are being sent to the
members along with the notice:
- By email to those members whose email ID is
registered with the Company / Depository
Participants.
- By post to those members whose email ID is not
registered with the Company / Depository
Participant.
b) The instructions and other information relating to e-
voting are as under:
i. Launch internet browser by typing the URL:
ht tps://evoting.karvy.com.
ii. Enter the login credentials (i.e. User ID and
Password mentioned in the notice). However, if
you are already registered with Karvy for e-voting,
you can use your existing User ID and password
for logging in.
iii. Af ter entering these details appropriately, Click on
“LOGIN”.
iv. You will now reach password change Menu
wherein you are required to mandatorily change
your password. The new password shall comprise
of minimum 8 characters with at least one upper
case (A-Z), one lower case (a-z), one numeric
value (0-9) and a special character (@,#,$, etc.).
The system will prompt you to change your
password and update your contact details like
mobile number, email ID, etc. on first login. You
may also enter a secret question and answer of
your choice to retrieve your password in case you
forget it. It is strongly recommended that you do
not share your password with any other person
and that you take utmost care to keep your
password confidential.
v. You need to login again with the new password.
vi. On successful login, the system will prompt you to
select the “EVENT” i.e. Oil and Natural Gas
Corporation Limited.
vii. On the voting page, enter the number of shares
(which represents the number of votes as on the
Cut Of f date) under “FOR / AGAINST / ABSTAIN”
or alternatively, you may partially enter any
number of votes in “FOR” and partially in
“AGAINST” such that the total number of votes cast
“FOR / AGAINST” taken together should not
exceed your total shareholding as on cut of f date.
In case you do not wish to cast your vote you may
choose the option “ABSTAIN” and the shares held
will not be counted under either head.
viii. Voting has to be done for each item of the Notice
separately. In case you do not cast your vote on
any specific item it will be treated as abstained.
ix. Members holding multiple demat accounts / folios
shall choose the voting process separately for
each demat account / folio.
x. You may then cast your vote by selecting an
appropriate option and click on “Submit”.
xi. A confirmation box will be displayed. Click “OK” to
confirm else “CANCEL” to modify. Once you
confirm, you will not be allowed to modify your
vote. During the voting period, members can login
any number of times till they have voted on the
Resolution(s).
xii. Corporate / Institutional members are required to
send scanned certified true copy (PDF Format) of
the Board Resolution/Authority Let ter, etc.
together with at tested specimen signature(s) of
the duly authorized representative(s), to the
Scrutinizer at email ID: an_kukreja@redif fmail.com
with a copy marked to [email protected].
INSTRUCTIONS FOR E-VOTING
E-voting Particulars
EVEN (E-Voting Event Number) PASSWORD / PIN
End of e-voting
User ID
The e-voting facility will be available during the following voting period
Commencement of e-voting
thFrom 09.00 a.m (IST) on 12 September, 2015 thUpto 05.00 p.m (IST) on 14 September, 2015

Instructions for e-voting
31
Relevant Information for e-voting:
l
l
lAny person who acquires shares of the Company and becomes a shareholders of the company af ter dispatch of the Notice of AGM and holds shares as of the cut-off date i.e may obtain the login ID and password by sending a request at [email protected]. If you are already registered with KCPL for e-voting then you can use your existing user ID and password.
lIn case of any queries, you may refer the Frequently Asked Questions (FAQs) for members and e-voting User Manual available at the “download” section of https://evoting.karvy.com or call Karvy Computershare Private Limited on 1800 345 4001 (toll free).
lA Member may participate in the AGM even af ter exercising his right to vote through remote e-voting but shall not be allowed to vote again at the AGM.
The e-voting period commences on 12.09.2015 (9.00 a.m. IST) and ends on 14.09.2015 (5.00 p.m. IST). During this period, Members of the Company, holding shares either in physical form or in dematerialized form, as on 08.09.2015, may cast their vote electronically. The e-voting module shall be disabled by KCPL for voting thereaf ter. Once the vote on a resolution is cast by the Member, he shall not be allowed to change it subsequently.
The voting rights of Members shall be in proportion to their shares of the paid up equity share capital of the Company as on 08.09.2015.
08.09.2015.
lThe facility for voting through ballot paper, will also be made available at the AGM and the members at tending the AGM who have not cast their vote by remote e-voting shall be able to exercise their right at the AGM through ballot papers.
lShri A. N. Kukreja of M/s A. N.Kukreja & Co., Practicing Company Secretary (Membership No. FCS 1070), has been appointed as the Scrutinizer to scrutinize the voting and remote e-voting process in a fair and transparent manner.
lThe Scrutinizer shall immediately af ter the conclusion of voting at the AGM count the votes cast at the AGM and thereaf ter, unblock the votes cast through remote e-voting in the presence of at least two witnesses not in the employment of the Company. The Scrutinizer shall submit a consolidated Scrutinizer Report of the total votes cast in favour of or against, if any, not later than three working days from the conclusion of the AGM to the Chairman of the Company. The Chairman or any other person authorised by the Chairman shall declare the result of the voting forthwith.
lThe results declared along with the Scrutinizer’s Report shall be placed on the Company’s website www.ongcindia.com and on the website of KCPL immediately af ter the result is declared by the Chairman or any other person authorised by the Chairman and the same shall be communicated to the BSE Limited and National Stock Exchange of India Limited, where the shares of the Company are listed.
Quality assurance is the promise ONGC strictly adheres to everywhere: in the infrastructure it builds and operates, in the services it renders and the human resources it relies on.

Annual Report 2014-15
Green Initiative in Corporate Governance
32
Dear Shareholder,
As you are aware, your company being a responsible Corporate Citizen is implementing various Green initiatives with a view to reduce the carbon foot print. During last few years, your company has undertaken various initiatives to reduce the number of printed copies of Annual Reports and we sincerely thank you for your support and cooperation in this regard.
In furtherance of company’s resolve to Go Green, we urge you
(i) to register your email id with your Depository Participant
(ii) furnish your e-mail id to M/s Karvy Computershare Pvt Ltd (R&T Agent of the Company) at their address indicatedin Reference page or email at [email protected].
Please ensure that you have indicated your Folio No. / DP & client ID No as well as your consent to receive future communications from ONGC including Annual Reports etc through email at your registered email address.
This year also, emails are being sent to those shareholders, who have registered their E-mail ID providing them with a link(URL) to the website of ONGC and Karvy for downloading of the Annual Report for 2014-15.
For the benefit of other stakeholders the copy of Annual Report may be downloaded from Company's websitei.e. www.ongcindia.com.
Let us join together to save the environment.
Green Initiative in Corporate Governance
V. N. MurthyCompany Secretary
While we care for the planet, we also nurture the seeds of prosperity through innovation and technology.

33
Brief Resume and other Information in respect ofndDirector seeking re-election at the 22 AGM
Our endeavours for a sustainable future go along with the technological steps we take for the energy security of the nation.
Brief Resume and other Information in respect of Director nd
seeking re-election at the 22 AGM
Shri Shashi Shanker 02.03.1961
54 years
01.12.2012
Name Date of Birth
& Age (as on
01/08/2015)
Date ofAppointment
Qualifications No. ofSharesheld
Experience inSpecific FunctionalAreas
Directorship held inother Publiccompanies
Chairmanship/ Membership of Commit tees across all Public companies
3712 NIL NILB Tech in
Petroleum
Engineering from
Indian School of
Mines, Dhanbad
and MBA with
specialization in
Financial
Management from
IGNOU. He
under took
Management
Development
programme from
IIM, Lucknow and
Leadership
Development
Programme at
ISB, Hyderabad.
32 years of
experience in Oil
Industry and
having wide
exposure in
diverse E&P
activi ties both in
onland &
of fshore
operations, R&D
activi ties and
spearheading
the deep/ultra-
deep water
drilling
campaign of
ONGC.

Annual Report 2014-15
Performance at a Glance
34
2013-142014-15 2012-13 2011-12 2010-11
Performance at a Glance(` in million unless otherwise stated)
PHYSICAL Quantity Sold (Other than Trading)
- Crude Oil (MMT) 24.11 23.61 23.69 23.09 22.94 3- Natural Gas (MMM ) 17,983 19,633 20,160 20,202 20,288
- LPG (000'Tonnes) 1,090 1,073 1,005 1,033 1,057 - Naptha/ARN (000'Tonnes) 1,124 1,379 1,520 1,557 1,600 - Ethane/Propane (000'Tonnes) 337 428 425 461 387 - Superior Kerosene Oil (000'Tonnes) 74 85 106 79 118
Quantity Sold (Trading) - Superior Kerosene Oil (000'KL) - - - - - - HSD (000'KL) - - - - 3 - Motor Spirit (000'KL) 1 1 1 1 1
FINANCIAL Revenue from Operations 830,935 842,028 833,090 768,871 686,488 Other Non Operating Income 53,665 67,132 54,367 44,529 34,069 Total Revenues 884,600 909,160 887,457 813,400 720,557 Statutory Levies 230,993 229,607 223,615 169,902 142,368 Operating Expenses 168,175 167,583 173,925 139,812 142,379 Exploration Costs writ ten of f # 105,225 78,357 100,431 93,334 82,490 Purchases 44 32 31 25 138 Profit Before Interest, Depreciation & Tax (PBIDT) 380,163 433,582 389,455 410,327 353,182 Depreciation, Depletion, Amortisation and Impairment 114,583 109,259 83,736 74,959 76,767 Profit Before Interest & Tax (PBIT) 265,580 324,323 305,720 335,368 276,415 Interest Payments 28 4 276 348 251 Profit before Tax and Exceptional Items 265,552 324,319 305,443 335,020 276,164 Exceptional items - - - 31,405 - Profit before Tax 265,552 324,319 305,443 366,425 276,164 Corporate Tax 88,223 103,371 96,186 115,196 86,924 Net Profit (PAT) 177,330 220,948 209,257 251,229 189,240 Dividend 81,277 81,277 81,277 83,416 74,861 Tax on Dividend 16,256 13,807 13,012 13,286 12,156 Share Capital 42,778 42,778 42,778 42,777 42,777 \Reserve & Surplus 1,403,232 1,324,472 1,201,755 1,086,790 932,267 Net Worth (Equity) 1,436,229 1,356,311 1,229,674 1,117,841 967,084 Borrowings 13,930 - - - - Working Capital 105,681 104,061 124,714 97,739 65,392 Capital Employed 1,144,994 1,094,412 1,017,636 908,848 796,972 Internal Resources Generation 218,699 327,545 217,402 352,088 311,191 Plan Expenditure 299,975 324,695 295,079 292,466 282,755 Contribution to Exchequer 421,074 405,750 408,806 382,874 317,759 Expenditure on Employees 86,299 104,051 103,302 67,960 67,282 Number of Employees 33,185 33,911 32,923 32,909 33,273
FINANCIAL PERFORMANCE RATIOS PBIDT to Turnover (%) 45.8 51.5 46.7 53.4 51.4 PBDT to Turnover (%) 45.7 51.5 46.7 53.3 51.4 Profit Margin(%)- incl. exceptional item 21.3 26.2 25.1 32.7 27.6 Contribution to Exchequer to Turnover (%) 50.7 48.2 49.1 49.8 46.3 ROCE(PBIDT to Capital Employed) (%) 33.2 39.6 38.3 45.1 44.3 Net Profit to Equity (%)- incl. exceptional item 12.3 16.3 17.0 22.5 19.6
BALANCE SHEET RATIOS Current Ratio 1.55:1 1.55:1 1.72:1 1.41:1 1.34:1 Debt Equity Ratio 0.0096:1 - - - - Debtors Turnover Ratio(Days) 48 33 30 30 21
PER SHARE DATA Earning Per Share (`) 21 25.83 24.46 29.36 22.12 Dividend (%) 190 190 190 195 175 Book Value Per Share( ) 168 159 144 131 113 `
In view of the Notification no. S.O 447(E) dated 28.02.2011, issued by Ministry of Corporate Af fairs, the Balance sheet of the Company is mandatorily required to be prepared in Revised Schedule VI st stw.e.f 1 April 2011 onwards (Schedule III af ter implementation of Companies Act., 2013 w.e.f. 1 April, 2014). Accordingly, the figures of FY 2014-15 are given as per the requirement of Schedule III ,
FY 2013-14, 2012-13, 2011-12 and FY 2010-11 are given as per the requirement of Revised Schedule VI and earlier years figures are as per Old Schedule VI.
# Exploration Costs writ ten of f towards Survey & Dry Wells have been regrouped from Depreciation, Depletion and Amor tization and shown as a separate i tem

Performance at a Glance
35
2007-082008-092009-10 2006-07 2005-06(` in million unless otherwise stated)
PHYSICAL
Quantity Sold (Other than Trading)
- Crude Oil (MMT) 22.33 22.88 24.08 24.42 22.45 3- Natural Gas (MMM ) 20,598 20,534 20,432 20,306 20,500
- LPG (000'Tonnes) 1,108 1,029 1,037 1,033 1,084
- Naptha/ARN (000'Tonnes) 1,598 1,545 1,442 1,442 1,578
- Ethane/Propane (000'Tonnes) 533 497 520 548 535
- Superior Kerosene Oil (000'Tonnes) 166 153 168 156 176
Quantity Sold (Trading)
- Superior Kerosene Oil (000'KL) - 441 308 563 432
- HSD (000'KL) 4 1,742 1,539 1,394 874
- Motor Spirit (000'KL) 1 273 232 121 110
FINANCIAL
Income from Operations (Turnover) 619,832 650,494 615,426 590,575 494,397
Statutory Levies 121,841 118,013 129,768 122,516 99,738
Operating Expenses 126,297 123,812 106,823 102,016 76,762
Exchange Loss/(Gain) (4,033) 3,819 (1,070) 177 (172)
Purchases (Trading) 139 85,166 65,115 59,401 34,338
Profit Before Interest, Depreciation & Tax (PBIDT) 375,588 319,684 314,790 306,465 283,731
Recouped Costs 146,588 120,849 97,979 94,994 84,573
Operating Income (PBIT) 229,000 198,835 216,811 211,471 199,158
Interest(Net) (20,839) (40,314) (35,535) (20,480) (12,808)
Profit before Tax and Extraordinary Items 249,839 239,149 252,346 231,951 211,966
Extraordinary Items - 658 - 4,751 6,405
Profit before Tax 249,839 239,807 252,346 236,702 218,371
Corporate Tax 82,163 78,544 85,330 80,273 74,063
Net Profit (PAT) 167,676 161,263 167,016 156,429 144,308
Dividend 70,583 68,444 68,444 66,305 64,167
Tax on Dividend 11,616 11,632 11,632 10,125 9,000
Share Capital 21,389 21,389 21,389 21,389 14,259
Net Worth 864,413 780,848 699,435 614,099 535,934
Borrowings 50 267 369 696 1,069
Working Capital 342,714 334,949 322,248 304,021 265,664
Capital Employed 738,014 640,583 604,844 540,744 493,763
Internal Resources Generation 228,068 172,449 185,158 242,253 142,847
Plan Expenditure 235,591 218,201 176,510 133,050 114,210
Contribution to Exchequer 280,983 280,496 300,200 286,596 234,086
Expenditure on Employees 57,191 47,396 60,484 48,833 30,147
Number of Employees 32,826 33,035 32,996 33,810 34,722
FINANCIAL PERFORMANCE RATIOS
PBIDT to Turnover (%) 60.6 49.1 51.2 51.9 57.4
PBDT to Turnover (%) 64.0 55.3 56.9 55.4 60.0
Profit Margin(%) 27.1 24.8 27.1 26.5 29.2
Contribution to Exchequer to Turnover (%) 45.3 43.1 48.8 48.5 47.3
ROCE(PBIDT to Capital Employed) (%) 50.9 49.9 52.0 56.7 57.5
Net Profit to Equity (%) 19.4 20.7 23.9 25.5 26.9
BALANCE SHEET RATIOS
Current Ratio 2.38:1 2.26:1 2.47:1 2.77:1 3.08:1
Debt Equity Ratio 0.00006:1 0.0003:1 0.001:1 0.001:1 0.002:1
Debtors Turnover Ratio(Days) 19 23 26 17 27
PER SHARE DATA
Earning Per Share (`)- before extraordinary items(Restated)** 19.60 18.80 19.52 17.92 16.37
Earning Per Share ( )- af ter extraordinary items(Restated)** 19.60 18.85 19.52 18.29 16.87
Dividend (%) 330 320 320 310* 450
Book Value Per Share( )(Restated)** 101 91 82 72 63
`
`
** Post Bonus & Split

Annual Report 2014-15
Statement of Income & Retained Earnings
36
2013-142014-15 2012-13 2011-12 2010-11
Statement of Income and Retained Earnings
(` in million)
REVENUES
Sales
Crude Oil (Including Condensate) 536,638 525,734 533,269 507,873 448,645
Natural Gas (incl. Gas Marketing Margin) 187,381 183,291 165,400 141,397 127,544
Liquified Petroleum Gas (LPG)-Domestic Market 34,380 30,145 31,484 23,711 18,369
Eathane/Propane (C2-C3) 10,064 14,837 13,440 12,741 8,796
Naphtha 50,835 75,743 76,804 72,167 56,342
Kerosene (SKO) 2,771 2,779 3,686 1,520 679
HSD 312 522 170 100 -
LSHS (Low sulpher heavy stock)/RCO (Residual Crude oil) 705 1,295 1,063 1,250 473
Aviation Turbine Fuel 286 220 318 436 527
Others 58 87 38 62 3
Sub- Total 823,428 834,653 825,671 761,257 661,378
Sale of Traded Products 60 44.42 43 34 171
Other Operating Income 7,447 7,331 7,375 7,580 24,939
Revenue from Operations 830,935 842,028 833,090 768,871 686,488
Other Non Operating Income 53,665 67,132 54,367 44,529 34069
Total Revenues 884,600 909,160 887,457 813,400 720,557
EXPENSES
Royalty 116,079 114,890 108,094 97,745 71,373
Cess 102,535 99,734 99,971 57,831 56,963
Motor Spirit Cess - 3 -
Natural Calamity Contingent Duty 1,123 1,097 1,101 1,097 1,114
Excise Duty 2,206 3,076 3,093 3,599 3,228
Sales Tax 2,586 3,123 3,834 3,339 3,113
Service Tax 290 439 353 236 227
Education cess 91 2,348 3,111 1,871 1,828
Octroi and Port Trust Charges 6,083 4,897 4,057 4,184 4,522
Sub-total 230,993 229,607 223,615 169,902 142,368
Operating Expensess 163,654 165,833 153,839 134,110 136058
Exchange Loss 241 1,021 922 3,613 -
Purchases 44 32 31 25 138
(Accretion) / Decretion in stock (1,674) 1,043 (230) (913) (129)
Exploration Costs writ ten of f#
- Survey Costs 19,146 15,912 15,668 12,409 16,675
- Exploratory well Costs 86,078 62,445 84,763 80,925 65,815
Depreciation, Depletion, Amortisation and Impairment 114,583 109,259 83,736 74,959 76,767
Provisions and Write-of fs 2,116 2,189 18,863 3,097 6,114
Prior Period Expenses (Net) 3,839 (2,502) 531 (95) 336
Total Expenses 619,020 584,837 581,737 478,032 444,142
Operating Income Before Interest &Tax 265,580 324,323 305,720 335,368 276,415
Interest Payments 28 4 276 348 251
Profit before Tax and Exceptional Items 265,552 324,319 305,443 335,020 276,164
Exceptional items - - - 31,405 -
Profit before Tax 265,552 324,319 305,443 366,425 276,164
Corporate Tax (Net) 88,223 103,371 96,186 115,196 86,924
Profit af ter Tax 177,330 220,948 209,257 251,229 189,240
Dividend 81,278 81,277 81,277 83,416 74,861
Tax on Dividend 16,256 13,807 13,012 13,286 12,156
Retained Earnings For The Year 79,796 125,864 114,968 154,527 102,223
In view of the Notification no. S.O 447(E) dated 28.02.2011, issued by Ministry of Corporate Af fairs, the Balance sheet of the Company is mandatorily required to be prepared in Revised Schedule VI st stw.e.f 1 April 2011 onwards (Schedule III af ter implementation of Companies Act., 2013 w.e.f. 1 April, 2014). Accordingly, the figures of FY 2014-15 are given as per the requirement of Schedule III ,
FY 2013-14, 2012-13, 2011-12 and FY 2010-11 are given as per the requirement of Revised Schedule VI and earlier years figures are as per Old Schedule VI.
# Exploration Costs writ ten of f towards Survey & Dry Wells have been regrouped from Depreciation, Depletion and Amor tization and shown as a separate i tem

Statement of Income & Retained Earnings
37
(` in million) 2009-10 2008-09 2007-08 2006-07 2005-06
REVENUES
Sales
Crude Oil 445,053 391,718 386,805 372,090 317,357
Natural Gas 73,797 75,528 71,780 72,113 66,701
LPG 21,924 22,752 20,168 14,866 16,293
Naphtha/Aromatic Rich Naphtha 47,137 48,406 43,849 37,907 35,679
Ethane/Propane 10,249 9,890 9,291 9,095 7,401
Superior Kerosene Oil 3,256 16,701 10,775 15,754 10,605
HSD 156 61,910 48,621 42,037 23,403
Motor Spirit 27 11,062 9,159 4,530 3,797
Others 463 1,526 925 634 617
Price Revision Arrears - - - 11 156
Sub Total 602,062 639,493 601,373 569,037 482,009
Pipeline Revenue 1,078 2,329 1,522 82 15
Other Receipts 15,512 7,861 11,390 21,653 10,257
Accretion / (Decretion) in stock 1,180 811 1,141 (197) 2,116
Total Income from Operations 619,832 650,494 615,426 590,575 494,397
COST & EXPENSES
Operating, Selling & General
(a) Royalty 54,832 44,934 60,707 53,428 46,181
(b) Cess/ Excise Duty 56,752 59,174 61,106 62,024 44,302
(c) Natural Calamity Contingent Duty 1,062 1,081 1,127 1,149 1,081
(d) Sales Tax 2,990 6,910 772 1,380 5,727
(e).Education Cess * 1,719 1,784 1,861 1,303
(f) Octroi & Port Trust Charges 4,486 4,130 4,195 3,232 2,447
Sub-total (a to f) 121,841 118,013 129,768 122,516 99,738
Pipeline Operations (Excluding Depreciation) 7,975 6,963 7,318 6,460 5,907
Other Operational Costs 118,322 116,849 99,505 95,556 70,855
Exchange Loss (4,033) 3,819 (1,070) 177 (172)
Purchases 139 85,166 65,115 59,401 34,338
Recouped Costs
(a) Depletion 45,302 42,148 36,776 33,849 29,702
(b) Depreciation 12,312 14,491 14,060 16,249 23,759
(c) Amortisation 89,407 67,320 47,580 43,167 31,437
(d) Impairment (433) (3,110) (437) 1,729 (325)
Sub-Total (a to d) 146,588 120,849 97,979 94,994 84,573
Total Cost & Expenses 390,832 451,659 398,615 379,104 295,239
Operating Income Before Interest &Tax 229,000 198,835 216,811 211,471 199,158
Interest
-Payments 686 1,190 590 215 470
-Receipts 21,525 41,504 36,125 20,695 13,278
-Net (20,839) (40,314) (35,535) (20,480) (12,808)
Profit before Tax and Extraordinary Items 249,839 239,149 252,346 231,951 211,966
Extraordinary Items - 658 - 4,751 6,405
Profit before Tax 249,839 239,807 252,346 236,702 218,371
Corporate Tax ( Net) 82,163 78,544 85,330 80,273 74,063
Net Profit 167,676 161,263 167,016 156,429 144,308
Dividend 70,583 68,444 68,444 66,305 64,167
Tax on Dividend 11,616 11,632 11,632 10,125 9,000
Retained Earnings For The Year 85,477 81,187 86,940 79,999 71,141
* Upto 2005-06, education cess is included in respective heads of levies.

Annual Report 2014-15
Statement of Financial Position
38
As atMarch 31
2015
As atMarch 31
2014
As atMarch 31
2013
As atMarch 31
2012
As atMarch 31
2011
Statement of Financial Position
(` in million)
RESOURCES
A. Own
1. Net Worth
(a) Equity
i) Share Capital 42,778 42,778 42,778 42,777 42,777
ii) Reserves & Surplus 1,403,232 1,324,472 1,201,755 1,086,790 932,267
Sub-Total (a) 1,446,010 1,367,250 1,244,532 1,129,567 975,044
(b) Less: Deferred Revenue Expenditure 9,781 10,939 14,859 11,726 7,960
Net Worth (a)-(b) 1,436,229 1,356,311 1,229,674 1,117,841 967,084
B. Deferred Tax Liability 177,332 165,787 128,880 111,979 99,504
TOTAL RESOURCES ( A+ B ) 1,613,560 1,522,098 1,358,553 1,229,820 1,066,588
DISPOSITION OF RESOURCES
A. Non-current assets
1) Block Capital
a). Fixed Assets (Net) 314,907 302,792 274,835 216,801 186,395
b). Producing Properties (Net) 667,110 657,833 524,407 463,768 435,757
Total Block Capital 982,018 960,625 799,242 680,569 622,152
2) Long-term loans and advances (excl. capital advances) 193,177 181,718 221,454 254,482 239,392
3) Deposit under Site Restoration Fund Scheme 125,444 113,102 101,331 91,826 81,155
4) Other non-current assets (excl. DRE) 4,397 3,956 4,011 2,983 2,941
Subtotal (A) 1,305,036 1,259,401 1,126,037 1,029,860 945,640
B. Non-current Liabilities
1) Long-term provisions:
a) Provision for Abandonment 227,138 228,022 177,052 176,477 175,608
b) Other Long Term provisions 27,296 29,178 44,823 36,654 32,627
2) Other Non-current liabilities 11,289 11,850 11,242 5,620 5,825
Subtotal (B) 265,723 269,050 233,116 218,751 214,060
C. Net Non Current Assets (A)-(B) 1,039,313 990,351 892,921 811,109 731,580
D. Working Capital
a) Current Assets
i) Inventories 59,635 58,825 57,044 51,654 41,190
ii) Trade receivables 135,783 81,657 68,637 61,948 39,947
iii) Cash and Cash Equivalents 27,601 107,989 132,186 201,246 144,811
iv) Short-term loans and advances 69,477 43,670 37,021 31,237 26,734
v) Other current assets (excl. DRE) 4,921 2,718 4,565 8,633 4,276
Subtotal (a) 297,416 294,859 299,453 354,718 256,958
b) Current liabilities
i) Short-term borrowings 13,930 - - 45,000 -
ii) Trade payables 54,891 63,725 53,410 52,612 52,253
iii) Other current liabilities 102,938 119,262 112,227 136,941 130,055
iv) Short-term provisions 19,976 7,811 9,102 22,426 9,258
Subtotal (b) 191,735 190,798 174,739 256,979 191,566
Working Capital (D )= (a)-(b) 105,681 104,061 124,714 97,739 65,392
E. CAPITAL EMPLOYED (C+D) 1,144,994 1,094,412 1,017,636 908,848 796,972
F. Investments
i) Current investments - - - 8,519 1
ii) Non-current investments 181,243 172,043 91,731 43,644 51,827
G. Capital work-in-progress (incl. capital advances) 128,437 116,516 144,429 182,997 140,316
H. Exploratory/Development Wells in Progress 158,885 139,128 104,759 85,812 77,472
TOTAL DISPOSITION (E+F+G+H) 1,613,560 1,522,098 1,358,553 1,229,820 1,066,588
In view of the Notification no. S.O 447(E) dated 28.02.2011, issued by Ministry of Corporate Af fairs, the Balance sheet of the Company is mandatorily required to be prepared in Revised Schedule VI st stw.e.f 1 April 2011 onwards (Schedule III af ter implementation of Companies Act., 2013 w.e.f. 1 April, 2014). Accordingly, the figures of FY 2014-15 are given as per the requirement of Schedule III ,
FY 2013-14, 2012-13, 2011-12 and FY 2010-11 are given as per the requirement of Revised Schedule VI and earlier years figures are as per Old Schedule VI.

Statement of Financial Position
39
RESOURCES
A. Own
1. Net Worth
(a) Equity
i) Share Capital 21,389 21,389 21,389 21,389 14,259
ii Reserves & Surplus 851,437 765,965 684,785 597,851 525,338
Sub-Total 872,826 787,354 706,174 619,240 539,597
(b) Less : Def fered Revenue Expenditure 8,413 6,506 6,739 5,141 3,663
Net Worth 864,413 780,848 699,435 614,099 535,934
2. Long Term Liabilities
Deferred Tax Liability
Total Own Funds ( 1 + 2 )
B. Outside
Unsecured Loans
a) Indian Loans - - - 202 404
b) Foreign Loans 50 267 369 494 665
Total Outside Resources 50 267 369 696 1,069
TOTAL RESOURCES ( A+ B ) 953,645 859,138 773,512 680,022 600,554
DISPOSITION OF RESOURCES
A. Block Capital
1. Fixed Assets 156,485 104,144 105,180 88,391 78,422
2. Producing Properties (Net) 402,822 361,580 301,874 295,685 275,833
less: Liability for Abandonment Cost 164,007 160,090 124,458 147,353 126,156
Total Block Capital 395,300 305,634 282,596 236,723 228,099
B. Working Capital
a) Current Assets
i) Inventories 46,786 40,607 34,806 30,338 30,385
ii) Debtors (Net of Provision) 30,586 40,838 43,604 27,594 37,043
iii) Cash & Bank Balances 108,279 121,405 160,143 136,704 42,792
iv)Deposit with Bank Under Site RestorationFund Scheme # 74,031 69,557 64,033 56,103 45,336
v) Loans & Advances and Others 278,031 273,593 195,745 193,214 216,059
Sub-Total 537,713 546,000 498,331 443,953 371,615
Less :
(b) Current Liabilities and Provisions andShort Term Loans
(excl. Abandonment & Impairment)* 194,999 211,051 176,083 139,932 105,951
Working Capital 342,714 334,949 322,248 304,021 265,664
C.CAPITAL EMPLOYED 738,014 640,583 604,844 540,744 493,763
D. INVESTMENTS 57,720 50,903 58,995 57,021 48,885
E. CAPITAL WORKS IN PROGRESS 102,414 116,965 70,745 48,251 28,303
F. EXPLORATORY/DEVELOPMENT WELLS IN PROGRESS 55,497 50,687 38,928 34,006 29,603
TOTAL DISPOSITION (C+D+E+F) 953,645 859,138 773,512 680,022 600,554
89,182 78,023 73,708 65,227 63,551
953,595 858,871 773,143 679,326 599,485
As atMarch 31
2010
As atMarch 31
2009
As atMarch 31
2008
As atMarch 31
2007
As atMarch 31
2006
* For the Year 2002-03 Abondonement are included in Current Liabilities.
From the Year 2003-04, Liability for Abandonment has been deducted from Producing Properties.
# Excluded for Current Ratio.

Annual Report 2014-15
Depreciation and Contribution to Exchequer
40
DETAILS OF DEPRECIATION ALLOCATED TO:
Survey 589 448 567 756 1,052 1,181 1,555 1,029 863 722 575 760 712
Exploratory Drilling 3,284 2,506 1,335 4,844 5,415 4,842 3,005 2,151 1,672 1,885 1,503 1,517 1,590
Development 36,774 66,628 62,584 52,782 41,734 34,098 24,426 21,924 14,251 13,605 10,623 9,322 9,587
Profit & Loss Account 14,367 20,518 14,620 13,395 19,993 12,201 14,434 13,984 16,094 22,226 5,435 6,056 7,594
Others 298 162 114 16 156 105 136 70 48 89 106 25 55
Total 55,311 90,262 79,220 71,793 68,350 52,427 43,556 39,158 32,928 38,527 18,242 17,680 19,538
CONTRIBUTION TO EXCHEQUER
CENTRAL
1. Excise Duty 2,207 3,076 3,093 3,599 3,228 2,214 3,386 2,887 2,768 2,707 3,445 4,375 4,915
2. OID Cess 102,550 99,740 99,993 57,852 57,005 54,545 55,799 58,216 59,260 41,595 43,056 41,939 42,093
3. Natural Calamity Contingent Duty 1,123 1,097 1,101 1,098 1,115 1,062 1,082 1,127 1,149 1,081 1,138 1,117 98
4. Royalty 35,870 41,965 39,407 36,144 36,519 32,190 31,394 30,631 27,920 23,056 21,811 16,202 17,380
5. Education Cess * 91 2,349 3,112 1,872 1,830 1,719 1,784 1,863 1,303
6. Corporate Tax
a) On ONGC's Account 76,152 67,646 79,285 102,722 76,628 71,203 79,770 80,720 78,403 64,025 69,817 43,516 58,850
b) For Foreign Contractors 25 36 11 73 27 7 277 32 34 3 23 20 24
7. Dividend 56,029 56,153 56,268 60,372 55,502 52,330 50,744 50,744 49,159 47,573 42,287 27,364 35,981
8. Tax on Dividend 16,256 13,807 13,012 13,286 12,156 11,616 11,632 11,632 10,125 8,999 7,763 4,385 2,375
9. Customs Duties 77 87 75 96 44 125 354 815 1,441 888 2,423 4,114 1,432
10. Mumbai Port Trust Charges 984 884 923 855 891 793 657 742 691 710 2,999 364 345
Sub Total 291,363 286,840 296,280 277,969 244,945 227,803 236,879 239,409 232,253 190,637 194,762 143,396 163,493
STATE
1. Sales Tax/VAT 43,765 41,344 40,144 39,393 33,711 26,355 26,258 26,899 25,998 18,263 14,581 11,060 12,561
2. Royalty 80,194 72,971 68,699 61,648 34,890 22,649 13,551 30,078 25,513 23,126 16,103 12,249 12,623
3. Octroi Duties etc. 5,751 4,592 3,683 3,863 4,213 4,176 3,808 3,814 2,832 2,060 2,671 1,877 2,339
4. Motor Spirit -CESS - 3 - - -
Sub Total 129,710 118,910 112,526 104,904 72,814 53,180 43,617 60,791 54,343 43,449 33,355 25,186 27,523
Grand Total 421,074 405,750 408,806 382,873 317,759 280,983 280,496 300,200 286,596 234,086 228,117 168,582 191,016
* Upto 2005-06, education cess is included in respective heads of levies.
2013-142014-15 2012-13 2011-12 2010-11
Depreciation and Contribution to Exchequer
(` in million)

Depreciation and Contribution to Exchequer
41
2005-062009-10 2008-09 2007-08 2006-07
1,181 1,555 1,029 863 722
4,842 3,005 2,151 1,672 1,885
34,098 24,426 21,924 14,251 13,605
12,201 14,434 13,984 16,094 22,226
105 136 70 48 89
52,427 43,556 39,158 32,928 38,527
2,214 3,386 2,887 2,768 2,707
54,545 55,799 58,216 59,260 41,595
1,062 1,082 1,127 1,149 1,081
32,190 31,394 30,631 27,920 23,056
1,719 1,784 1,863 1,303
71,203 79,770 80,720 78,403 64,025
7 277 32 34 3
52,330 50,744 50,744 49,159 47,573
11,616 11,632 11,632 10,125 8,999
125 354 815 1,441 888
793 657 742 691 710
227,803 236,879 239,409 232,253 190,637
26,355 26,258 26,899 25,998 18,263
22,649 13,551 30,078 25,513 23,126
4,176 3,808 3,814 2,832 2,060
53,180 43,617 60,791 54,343 43,449
280,983 280,496 300,200 286,596 234,086
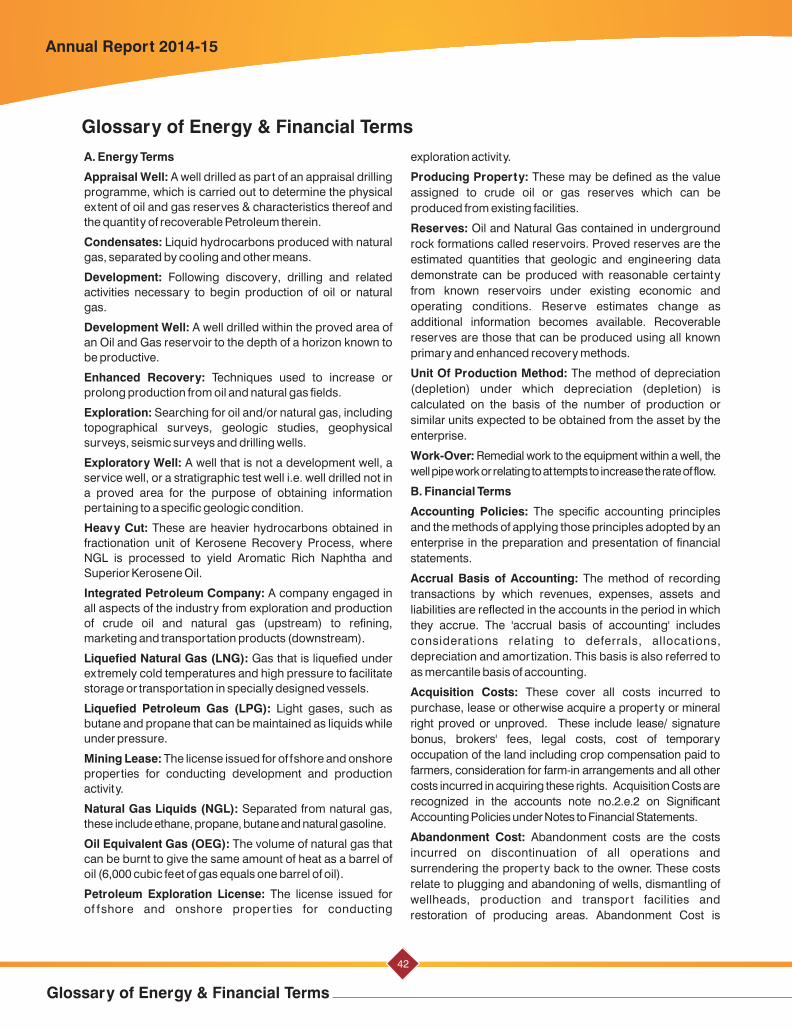
Annual Report 2014-15
Glossary of Energy & Financial Terms
42
Glossary of Energy & Financial Terms
A. Energy Terms
Appraisal Well: A well drilled as part of an appraisal drilling
programme, which is carried out to determine the physical
extent of oil and gas reserves & characteristics thereof and
the quantity of recoverable Petroleum therein.
Condensates: Liquid hydrocarbons produced with natural
gas, separated by cooling and other means.
Development: Following discovery, drilling and related
activities necessary to begin production of oil or natural
gas.
Development Well: A well drilled within the proved area of
an Oil and Gas reservoir to the depth of a horizon known to
be productive.
Enhanced Recovery: Techniques used to increase or
prolong production from oil and natural gas fields.
Exploration: Searching for oil and/or natural gas, including
topographical surveys, geologic studies, geophysical
surveys, seismic surveys and drilling wells.
Exploratory Well: A well that is not a development well, a
service well, or a stratigraphic test well i.e. well drilled not in
a proved area for the purpose of obtaining information
pertaining to a specific geologic condition.
Heavy Cut: These are heavier hydrocarbons obtained in
fractionation unit of Kerosene Recovery Process, where
NGL is processed to yield Aromatic Rich Naphtha and
Superior Kerosene Oil.
Integrated Petroleum Company: A company engaged in
all aspects of the industry from exploration and production
of crude oil and natural gas (upstream) to refining,
marketing and transportation products (downstream).
Liquefied Natural Gas (LNG): Gas that is liquefied under
extremely cold temperatures and high pressure to facilitate
storage or transportation in specially designed vessels.
Liquefied Petroleum Gas (LPG): Light gases, such as
butane and propane that can be maintained as liquids while
under pressure.
Mining Lease: The license issued for of fshore and onshore
properties for conducting development and production
activity.
Natural Gas Liquids (NGL): Separated from natural gas,
these include ethane, propane, butane and natural gasoline.
Oil Equivalent Gas (OEG): The volume of natural gas that
can be burnt to give the same amount of heat as a barrel of
oil (6,000 cubic feet of gas equals one barrel of oil).
Petroleum Exploration License: The license issued for
of fshore and onshore proper ties for conducting
exploration activity.
Producing Property: These may be defined as the value
assigned to crude oil or gas reserves which can be
produced from existing facilities.
Reserves: Oil and Natural Gas contained in underground
rock formations called reservoirs. Proved reserves are the
estimated quantities that geologic and engineering data
demonstrate can be produced with reasonable certainty
from known reservoirs under existing economic and
operating conditions. Reserve estimates change as
additional information becomes available. Recoverable
reserves are those that can be produced using all known
primary and enhanced recovery methods.
Unit Of Production Method: The method of depreciation
(depletion) under which depreciation (depletion) is
calculated on the basis of the number of production or
similar units expected to be obtained from the asset by the
enterprise.
Work-Over: Remedial work to the equipment within a well, the
well pipe work or relating to attempts to increase the rate of flow.
B. Financial Terms
Accounting Policies: The specific accounting principles
and the methods of applying those principles adopted by an
enterprise in the preparation and presentation of financial
statements.
Accrual Basis of Accounting: The method of recording
transactions by which revenues, expenses, assets and
liabilities are reflected in the accounts in the period in which
they accrue. The 'accrual basis of accounting' includes
considerations relating to deferrals, allocations,
depreciation and amortization. This basis is also referred to
as mercantile basis of accounting.
Acquisition Costs: These cover all costs incurred to
purchase, lease or otherwise acquire a property or mineral
right proved or unproved. These include lease/ signature
bonus, brokers' fees, legal costs, cost of temporary
occupation of the land including crop compensation paid to
farmers, consideration for farm-in arrangements and all other
costs incurred in acquiring these rights. Acquisition Costs are
recognized in the accounts note no.2.e.2 on Significant
Accounting Policies under Notes to Financial Statements.
Abandonment Cost: Abandonment costs are the costs
incurred on discontinuation of all operations and
surrendering the property back to the owner. These costs
relate to plugging and abandoning of wells, dismantling of
wellheads, production and transpor t facilities and
restoration of producing areas. Abandonment Cost is

Glossary of Energy & Financial Terms
43
recognized in the accounts note no.2.i on Significant
Accounting Policies under Notes to Financial Statements.
Absorption Costing: A method whereby the cost is
determined so as to include the appropriate share of both
variable and fixed costs.
Balance Sheet: A statement of the financial position of an
enterprise as at a given date, which exhibits its assets,
liabilities, capital, reserves and other account balances at
their respective book values.
Book Value: The amount at which an item appears in the
books of account or financial statements. It does not refer to
any particular basis on which the amount is determined e.g.
cost, replacement value etc.
Capital Commitment: Future liabilit y for capital
expenditure in respect of which contracts have been made.
Capital Employed: The finances deployed by an enterprise
in its net fixed assets, investments and working capital.
Capital employed in an operation may, however, exclude
investments made outside that operation.
Capital Reserve: A reserve of a corporate enterprise which
is not available for distribution as dividend.
Contingent Asset: An asset the existence, ownership or
value of which may be known or determined only on the
occurrence or non-occurrence of one or more uncertain
future events.
Contingent Liability: An obligation relating to an existing
condition or situation which may arise in future depending
on the occurrence or non-occurrence of one or more
uncertain future events.
Current Asset: An asset shall be classified as current when
it satisfies any of the following criteria:
(a) it is expected to be realized in, or is intended for sale or
consumption in, the company's normal operating
cycle;
(b) it is held primarily for the purpose of being traded,
(c) it is expected to be realized within twelve months af ter
the reporting date, or
(d) it is cash or cash equivalent unless it is restricted from
being exchanged or used to set tle a liability for at least
twelve months af ter the reporting date.
Current Liability: A liability shall be classified as current
when it satisfies any of the following criteria:
(a) it is expected to be set tled in the company's normal
operating cycle;
(b) it is held primarily for the purpose of being traded,
(c) it is due to be set tled within twelve months af ter the
reporting date, or
(d) the company does not have an unconditional right to
defer set tlement of the liability for at least twelve
months af ter the reporting date.
Cess: It is a levy imposed under The Oil Industry (Development) Act, 1974 on Crude oil acknowledged & received in the refinery and payable to the Central Government.
Development Costs: Costs incurred in preparing proved reserves for production i.e. costs incurred to obtain access to prove reserves and to provide facilities for extracting, treating, gathering and storing oil and gas.
Diminishing Balance Method: It is a method under which the periodic charge for depreciation of an asset is computed by applying a fixed percentage to its historical cost or substituted amount less accumulated depreciation (net book value). This is also referred to as written down value method.
Dividend: A distribution to shareholders out of profits or reserves available for this purpose.
Earnings Per Share: The earnings in monetary terms at tributable to each equity share, based on net profit for the period, before taking into account prior period items, ex traordinary items and adjustments resulting from changes in accounting policies but af ter deducting tax appropriate thereto and preference dividends, divided by the number of equity shares issued and ranking for dividends in respect of that period.
Expenditure: Incurring a liability, disbursement of cash or transfer of property for the purpose of obtaining assets, goods and services.
Expense: A cost relating to the operations of an accounting period or to the revenue earned during the period or the benefits of which do not extend beyond that period.
Extraordinary Item: Gain or loss which arises from events or transactions that are distinct from ordinary activities of the enterprise and which are both material and expected not to recur frequently or regularly. This would also include material adjustments necessitated by circumstances, which, though related to previous periods, are determined in the current period.
Exploration Costs: Costs incurred in exploring property. Exploration involves identifying areas that may warrant examination and examining specific areas, including drilling exploratory wells.
Exploration Costs writ ten off: It refers to the Survey expenditure and Dry wells expensed in the accounts in line with note no.2.e.3 and 2.e.4.1 on Significant Accounting Policies under Notes to Financial Statements.
First In, First Out (FIFO): Computation of the cost of items sold or consumed during a period as though they were sold or consumed in order of their acquisition.

Annual Report 2014-15
Glossary of Energy & Financial Terms
44
Fixed Assets: Assets held for the purpose of providing or producing goods or services and that is not held for resale in the normal course of business
Fixed Cost: The cost of production which, by its very
nature, remains relatively unaf fected in a defined period of
time by variations in the volume of production.
Fundamental Accounting Assumptions: Basic
accounting assumption which underline the preparation
and presentation of financial statements. They are going
concern, consistency and accrual. Usually, they are not
specifically stated because their acceptance and use are
assumed. Disclosure is necessary if they are not followed.
Inventory: Tangible property held for sale in the ordinary
course of business, or in the process of production for such
sale, or for consumption in the production of goods or
services for sale, including maintenance supplies and
consumables other than machinery spares.
Investment: Expenditure on assets held to earn interest,
income, profit or other benefits.
Materiality: An accounting concept according to which all
relatively important and relevant items, i.e., items the
knowledge of which might influence the decisions of the
user of the financial statements are disclosed in the
financial statements.
Net Assets: The excess of the book value of assets of an
enterprise over its liabilities. This is also referred to as net
worth or shareholders' funds.
Net Profit: The excess of revenue over expenses during a
particular accounting period. When the result of this
computation is negative, it is referred to as net loss. The net
profit may be shown before or af ter tax.
Net Realisable Value: The actual/ estimated selling price
of an asset in the ordinary course of the business less cost
of completion and cost necessarily to be incurred in order
to make the sale.
Non Current Asset: All assets other than Current assets
are classified as Non Current asset.
Non Current Liability: All liabilities other than Current
liabilities are classified as non-current liability.
Net Present Value: NPV is the present (discounted) value
of future cash inflows minus the present value of the cash
out flows.
Obsolescence: Diminution in the value of an asset by
reason of its becoming out-of-date or less useful due to
technological changes, improvement in production
methods, change in market demand for the product or
service output of the asset, or legal or other restrictions.
Operating Cycle: An Operating cycle is the time between
the acquisition of assets for processing and their realization
in cash or Cash equivalents.
Prior Period Item: A material charge or credit which arises
in the current period as a result of errors or omissions in the
preparation of the financial statements of one or more prior
periods.
Provision: An amount writ ten of f or retained by way of
providing for depreciation or diminution in value of assets or
retained by way of providing for any known liability the
amount of which cannot be determined with substantial
accuracy.
Provisions for Doubtful Debts: A provision made for debts
considered doubt ful of recovery.
Participating Interest: The share expressed as a
percentage in the rights and obligations of each par ty to a
Production Sharing Contract (PSC).
Production Costs: Costs incurred in lif ting the oil and gas
to the surface and in gathering, treating and storing the oil
and gas.
Royalty: It is a levy imposed under The Petroleum and
Natural Gas Rules, 1959 payable to the respective State or
Central Government granting the lease (Central
Government in case of of fshore) on crude oil and natural
gas.
Recouped Cost: It refers to Depreciation, Depletion,
Impairment and Amortization charged in accounts. These
are non-cash costs.
a) Depreciation: A measure of the wearing out,
consumption or other loss of value of a depreciable
asset arising from use, ef flux of time or obsolescence
through technology and market changes. It is provided
for and allocated as mentioned in note no. 2.n.1 to 2.n.4
on Significant Accounting Policies under Notes to
Financial Statements.
b) Depletion: A measure of exhaustion of a wasting asset
(Producing Properties) represented by periodic write
of f of cost. It is computed with reference to the
amortization base by taking the related capital cost
incurred divided by hydrocarbon reserves and
multiplied by production.
c) Impairment: An impairment loss is the amount by
which the carrying amount of an asset exceeds its
recoverable amount. Impairment Loss is recognized in
the accounts as per note no. 2.n.7 on Significant

Glossary of Energy & Financial Terms
45
Accounting Policies under Notes to Financial
Statements.
d) Amortization: It refers to the amount amortized in
respect of Intangible Assets in line with note no.2.n.6 on
Significant Accounting Policies under Notes to
Financial Statements.
Statement of Profit and Loss: A financial statement
which presents the revenues and expenses of an
enterprise for an accounting period and shown the
excess of revenues over expenses (or vice versa). It is
also known as Statement of Profit and Loss.
Straight Line Method: The method under which the
periodic charge for depreciation is computed by
dividing the depreciable amount of a depreciable asset
by the estimated number of years of its useful life.
Trade Receivable: A Receivable is classified as "Trade
Receivable" if it is in respect of amount due for goods
sold or services rendered in the normal course of
business.
Trade Payable: A payable is classified as "trade
payable" if it is in respect of amount due on account of
goods purchased or services received in normal
course of business.
Useful life: Life which is either (i) the period over which
a depreciable asset is expected to be used by the
enterprise; or (ii) the number of production or similar
units expected to be obtained from the use of the asset
by the enterprise.
Wasting Asset: Natural resource which is subject to
depletion through the process of extraction or use e.g.
mines, quarries.
Working Capital: The funds available for conducting
day-to-day operations of an enterprise. Also it is
represented by the excess of current assets over
current liabilities including short-term loans.
Work in Process: Work in Process includes all materials
which have undergone manufacturing or processing
operations, but upon which further operations are
necessary before the product is ready for sale.
Secretary MoPNG Shri Kapil Dev Tripathi interacting with ONGC CMD and Directors during his recent visit to ONGC corporate of fice.

ONGC produces 1.2 million barrels of oil equivalent per day

Board's Report
Annexures to Board’s Report
Comments of C&AG

Board's Report
48
Board's Report
Dear Shareholders,
It gives me great pleasure to present, on behalf of the Board ndof Directors of your Company, the 22 Annual Report on the
business and operations of Oil And Natural Gas Corporation
Ltd. (ONGC) and its Audited Statements of Accounts for the
year ended March 31, 2015, together with the Auditors’
Report and Comments on the Accounts by the Comptroller
and Auditor General (CAG) of India.
Your Company along with its group companies has
registered yet another year of sustained performance.
Exploration and production of crude oil and gas, our core
business, set various milestones during the year. Besides
that performance in the areas where ONGC has engaged
substantially also witnessed success with positive
contributions.
ONGC has steadfastly focussed on organic growth through
its exploratory endeavours and build a healthy reserve
profile for the future. During FY’15, the Company registered
Reserve Replacement Ratio (RRR) of 1.38 (with 2P
reserves) with 22 oil and gas discoveries in various basins of
the country. This has been possible because of extensive
exploration in known basins as well as frontier plays.
Domestic crude oil and natural gas production of ONGC
along with its share in the domestic joint ventures (PSC-JVs)
during FY’15 has been 49.46 million metric tonnes of oil and
oil equivalent gas (MMtoe) which is about 2.7% lower than
FY’14 production (50.84 MMtoe). On standalone basis
crude oil production from ONGC operated fields has been
22.26 million metric tonnes (MMT) against production of
22.25 MMT during FY’14. This goes to the credit of your
Company that production decline could be arrested due to
prudent reservoir management practices adopted in the
matured fields and bringing new fields on stream.
Major Highlights: FY’2014-15
Salient highlights with respect to performance of your
Company during FY’2014-15 are as below:
• 22 oil & gas discoveries in domestic acreages with
accretion of 61.05 MMToe of 2P reserves.
• RRR (2P) for FY’2014-15 was 1.38; in excess of
One consecutively for 9 years.

Board's Report
49
• Despite natural decline in matured fields, crude oil
production from domestic fields maintained at 25.94
MMT. Major upside in production was registered from the
Western of fshore fields with incremental oil gain of 4.3%.
• New and marginal fields contributed about 12.3% of
crude oil (2.74 MMT out of 22.26 MMT from domestic
operated fields) and 15.2% of natural gas production
(3.35 BCM out of 22.02 BCM from domestic operated
fields). 34.5% of crude oil production was contributed by
the IOR/EOR and redevelopment schemes.
• The gross revenue from operations during FY’2014-15
has been 830,935 million; 1.3% lower than FY’14.
• `362,996 million contribution towards sharing the under-
recoveries of OMCs during FY’2014-15 impacting
ONGC’s Profit Before Tax (PBT) by 309,596 million and
Profit Af ter Tax (PAT) by `204,370 million. Despite this
Net Profit has been `177,330 million; 19.7% lower than
the profit during previous year FY’2013-14.
• Hon’ble Prime Minister Mr. Narendra Modi dedicated the
2nd unit of OTPC Power Plant at Palatana, Tripura, to the
Nation on December 1, 2014. The 726.6 MW gas-based
power plant of ONGC Tripura Power Company is the
biggest project in North East part of India in terms of
investment in E&P, gas and power transmission. It is also
credited as the largest Clean Development Mechanism
(CDM) projects of the world.
• Your Company decided to invest `249,000 million in five
major projects in Western Of fshore for sustaining crude
oil and gas production.
• HRD process plat form of ONGC was installed
successfully on January 15, 2015 using the state-of-the-
ar t Float-Over technology. This is the first such
endeavour in the history of ONGC, where installation of
an add-on plat form with the existing operational plat form
has been completed successfully.
• The operationalization of FPSO at Cluster-7 project on
February 26, 2015 resulted in doubling the crude oil
production from around 7,500 barrels per day (bpd) to
around 15,000 bpd.
• ONGC Videsh Ltd. (100% subsidiary of your Company)
registered 8.87 Mmtoe of O+OEG production during
FY’2014-15 against 8.36 Mmtoe during FY’2013-14.
Production upside primarily came from BC-10 field in Brazil,
blocks in Myanmar and the Sakhalin project in Russia.
• Despite higher production, ONGC Videsh’s Revenue
during FY’2014-15 has been down by 14% due to lower
oil prices globally. PAT has been down by 57% due to
lower oil prices, exchange losses, higher financing cost
and higher depletion charges.
• During the year ONGC Videsh made a maiden venture in
New Zealand with exploratory acreages.
• MRPL commissioned all the units under Phase-III
refinery expansion project during the year and
registered the highest-ever thru-put of 14.65 MMT.
• Turnover of MRPL for the year was down by 17% due to
lower products’ prices and it registered a net loss of
`11,700 million against Net profit of `6,010 million in
FY’2013-14 due to exchange and inventory losses.
Besides excellence in core operational activities your
Company positioned itself as a valuable corporate citizen
through its mapped defined actions towards inclusive
growth of the Society/Community and green initiatives as
per the commitment and our performance was globally rdrecognized. ONGC was ranked at 183 position among
2000 top global companies in Forbes Global 2000 list
published in May’2015. In the global oil and gas operation
industry, ONGC has moved up three places to occupy the th18 position. ONGC has been ranked as the Top energy
company in India, in the coveted Platt’s Top 250 Global
Energy Company Rankings 2014. ONGC improved upon its stglobal ranking by a notch to be positioned 21 among the
global energy majors. ONGC has also maintained its rdposition as the 3 largest Exploration and Production (E&P)
company in the world. In the latest Newsweek Green
Rankings, the world’s most recognized assessment of
corporate environmental performance, ONGC has made a
quantum leap to be ranked 217 globally (it was positioned th386 in 2012 Green rankings). The company now stands
third amongst only seven Indian companies named in the
prestigious list.
Performance 2014-15
Exploration
During the year 2014-15, ONGC has made 22 Oil and gas
discoveries in domestic acreages (operated by ONGC). Out
of 22, 10 discoveries are in Of fshore and 12 in Onshore; 10
discoveries were made in the new prospects whereas 12
were new pool discoveries. 7 discoveries were made in
NELP blocks and 15 in nomination blocks.
Two discoveries (Rudrasagar-184 & Gandhar-699) during
Discoveries
Offshore: 10; Onshore: 12
New Prospects: 10; New Pool: 12
NELP Blocks: 7; Nomination blocks: 15

Annual Report 2014-15
Board's Report
50
2014-15 in nomination blocks have already been put on
production and ef forts are on for bringing the other
discoveries on production as early as possible. 7
discoveries in NELP blocks (5 Onland, 2 Of fshore) are
governed by the PSC guidelines and appraisal/
Details of the discoveries in NELP blocks (since
inception till 01.04.2015)
Out of the 114 NELP blocks awarded to/ acquired by ONGC
as operator, currently ONGC is operating in 49 blocks,
balance 65 blocks have been relinquished. Exploration/
appraisal programme is underway in all the active blocks. A
total of 47 discoveries as on date (16 in deep-water, 13 in
shallow water and 18 in onland) have been made by ONGC
in 22 of these NELP blocks (6 deep-water, 6 shallow water &
10 onland). Commencement of production from these
discoveries is governed by stipulations laid down in the
respective PSCs and is to be taken up af ter successful
completion of appraisal programme followed by
submission of DOC and approval of Field Development
development activities will be taken up keeping in view the
timelines of the respective blocks. In addition to these
discoveries, exploratory wells conclusively tested and
proved to be hydrocarbon bearing will help in field growth
of existing fields. Details of the discoveries are as under:
Plan. ONGC has put three NELP Blocks on Commercial
Production:
a. NELP Block CB-ONN-2004/1 (Karannagar)
Onshore NELP Block CB-ONN-2004/1 (Karannagar)
located in Ahmedabad was put on commercial
production on 24.03.2015 within 24 hours of get ting
the Mining Lease. This NELP block was awarded to
consortium of ONGC and GSPC in VI round of NELP
bidding in 2007. ONGC is the operator of block with
60% participatory interest.
b. NELP block CB-ONN-2004/2 (Vadatal)
Vadatal-1 in the NELP block CB-ONN-2004/2 (Vadatal)
was put on production on March 26, 2015. The NELP
Sr. Well No. Basin/Sub-basin
1 Tukbai-3A (TK-3A) AAFB-Cachar Gas New Prospect
2 Rupal-2* Oil New Prospect
3 Vadatal-10 (VDAH)* Oil New Prospect
4 Vadatal-11* Oil New Prospect
5 Thirunagari / Thirunagari-1* Cauvery(On) Gas New Prospect
6 South Pasarlapudi-1 KG(On) Oil & Gas New Prospect
7 YS-9-1 (Shif t) KG(SW) Gas New Prospect
8 GD-11 / GD-11-1 KG(DW) Gas New Prospect
9 GKS092NAA-1* Kutch Gas New Prospect
10 GKS091NDA-1* Gas New Prospect
11 C-1-7 Mumbai Oil & Gas New Pool
12 C-1-8 Oil & Gas New Pool
13 Rudrasagar / Rudrasagar-184 Oil New Pool
14 Khoraghat-35 Gas & Cond. New Pool
15 Khoraghat-37 Gas New Pool
16 Gandhar-699 Cambay Oil New Pool
17 Madanam / Madanam-6* Cauvery Onshore Oil & Gas New Pool
18 Damoh / Damoh-4 Vindhyan Gas New Pool
19 GS-29-10 (AJ) KG (SW) Oil & Gas New Pool
20 G-1-NE-1 KG (SW) Oil & Gas New Pool
21 G-1-NE-2 KG (SW) Gas & Cond. New Pool
22 WO-5 / WO-5-11 Mumbai Of fshore Oil & Gas New Pool
Type of Hydro-carbon Type of discovery
Cambay
Of fshore
Of fshore
A&AA (Assam)
* In NELP blocks

Board's Report
51
block CB-ONN-2004/2 was awarded to a consortium of
ONGC and GSPC in VI round of NELP bidding in 2007.
ONGC is the operator of the block (PI: 55%) with
partner GSPC (PI: 45 %.).
c. NELP block CB-ONN-2002/1 (West Patan)
West Patan #3 well in the NELP block CB-ONN-2002/1
(West Patan) was put on commercial production on
31.03.15 on the same day of get ting the Mining Lease
from the Govt. of Gujarat. The block CB-ONN-2002/1,
covering 135 sq. km and falls in the northern part of the
Cambay Basin and is located west of Patan town in
North Gujarat.
Reserve accretion & Reserve Replacement Ratio (RRR)
Continuing exploration in challenging and frontier areas,
your company has accreted 215.65 million metric tonnes of
oil equivalent (MMtoe) of In-place volume of hydrocarbon in
Statement of Reserve Recognition Accounting (RRA)
Reserve Recognition Accounting is a voluntary disclosure
towards recognizing income at the point of discovery of
reserves and seeks to demonstrate the intrinsic strength of
an organization engaged in exploration and production of
hydrocarbons with reference to its future earning capacity
in terms of current prices for income as well as expenditure.
This information is based on the estimated net proved
reserves (developed and undeveloped) as determined by
the Reserves Estimates Commit tee of the Company.
As per FASB-69 on disclosure about Oil and Gas producing
activities, publicly traded enterprises that have significant
Oil and Gas producing activities, are to disclose with
complete set of annual financial statements, the following
supplemental information:
the domestic basins (operated by ONGC). As on
01.04.2015, in-place hydrocarbon volume of ONGC as a
group stands at 9,283.84 MMtoe; up 4.2% from FY’2013-14
figure of 8,912.81 MMtoe. The ultimate reserves (3P)
accretion in domestic area (ONGC operated) during
FY’2014-15 has been 70.98 MMtoe and 2P reserve
accretion has been 61.06 MMtoe. Total reserve accretion
during 2014-15 in domestic basins including ONGC’s share
in PSC JVs stands at 60.03 MMtoe. Voluntary disclosures in
respect of Oil & Gas Reserves, conforming to SPE
classification 1994 and US Financial Accounting
Standards Board (FASB-69) have been made by your
Company.
The following table gives the details of reserve accretion
(2P) for the last 5 years in domestic basins as well as from
the overseas assets:
a) Proved Oil and Gas reserve quantities
b) Capitalized costs relating to Oil and Gas
producing activities
c) Cost incurred for property acquisition, exploration
and development activities
d) Results of operations for Oil and Gas producing
activities
e) A standardized measure of discounted future net
cash flows relating to proved Oil and Gas reserve
quantities
Your Company has disclosed information in respect of
(a) to (d) above in the Annual Financial Statements.
Your Company has also made voluntary disclosure on
standardized measure of discounted future net cash flows
2010-11 63.09 0.29 63.38 54.2 117.58
2011-12 58.67 1.43 60.1 -0.06 60.04
2012-13 67.59 4.23 71.82 10.09 81.91
2013-14 56.26 4.29 60.55 213.24 273.79
2014-15 61.06 -1.03 60.03 20.03 80.06
Ultimate Reserve (2P) accretion O+OEG
Year DomesticAssets
(1) (2)
ONGC's share inDomestic JVs
Total DomesticReserve
(3)=(1)+(2)
Total
(5)=(3)+(4)
ONGC VIDESH'sShare in
Foreign Asset(4)
(in MMToe)
Note: Reserve accretion reported in terms of 2P reserves

Annual Report 2014-15
Board's Report
52
relating to proved oil and gas reserve at Annexure-‘A’ to this
report as statement of Reserve Recognition Accounting
(RRA).
Oil & Gas production
During FY ’15, your Company retained its position as the
largest producer of oil and gas in the country and
contributed 69 per cent of oil and 70 per cent of natural gas
production of the country from its domestic operations. On
standalone basis, in FY’15 ONGC’s domestic crude oil
production registered 22.26 MMt against 22.25 MMt in
FY’14, reversing the production decline in domestic fields.
The major contribution came from Western Offshore, which
produced 4.3 per cent more than the production during last year.
Details of crude oil and natural gas production from
domestic basins along with that of Value Added Products
(VAP) are as below:
Production QtyUnit Sales QtyValue
(` in million)
FY'15 FY'14 FY'15 FY'14 FY'15 FY'14
Direct
Crude Oil (MMT) 25.94 25.99 24.11 23.61 536,638 525,734
Natural Gas (BCM) 23.52 24.85 17.98 19.63 187,381 183,291
Ethane/Propane 000 MT 339 430 337 428 10,064 14,837
LPG 000 MT 1,095 1,067 1,090 1,073 34,380 30,145
Naphtha 000 MT 1,155 1,358 1,124 1,379 50,835 75,743
SKO 000 MT 72 84 74 85 2,771 2,779
Others 1,359 2,124
Sub Total 823,428 834,653
Trading
Motor Spirit 000 KL 0.53 0.54 38 41
HSD 000 KL 0.39 0.05 22 3
Sub Total 60 44
Total 823,488 834,697

Board's Report
53
ONGC71%
JV12%
OVL17%
Crude Oil Share (MMT)
FY'15
Natural Gas Share (BCM) FY’15
OVL12%
JV6%
ONGC82%
Out of the total production of 31.47 MMT of crude oil, 70.8 per cent production came from ONGC operated domestic fields, 17.5 per cent from the overseas assets and balance 11.7 per cent from domestic joint ventures. As far as natural gas production is concerned, majority of production (82 per cent) came from ONGC operated domestic fields, 12.4 per cent from overseas assets and 5.6 per cent from domestic joint ventures.
Production from overseas assets
ONGC Videsh, has thir teen (13) producing assets in ten
countries – Venezuela (1), Brazil (1), Colombia (1), Sudan
(1), South Sudan (2), Syria (1), Vietnam (1), Mayanmar (2),
Russia (2) and Azerbaijan (1).
Total production from these overseas assets during
FY’15 has been 8.87 MMtoe of O+OEG (Crude oil: 5.53
MMT & Gas: 3.34 BCM).
Ajerbaijan has contributed 12% as compared to around
0.1% last year. Resumption of operations in South Sudan &
Sudan has also contributed to this year’s increased volume
contributing 13.2% this year as compared to 8.2% last year.
Russia & Vietnam continued to be the biggest contributor to
overseas production volume with 29.4% and 23%
respectively.
Unconventional sources of energy
ONGC plans to continue its endeavor for exploration and
development of Unconventional & other resources like
Shale Gas, CBM, etc. ONGC has prioritized suitable actions
for exploration and exploitation of Non-Conventional and
Alternate Sources of energy which has the potential to
change the energy business landscape in the country as it
is happening in the other parts of the world. The initiatives
by ONGC in these areas are summarized below;
a. Shale Gas
ONGC has the distinction of establishing the first flow of thshale gas in the country on 25 January, 2011 from
RNSG#1 well (R&D Pilot Project, Durgapur).
ONGC has chalked out plan of drilling of pilot shale gas
and oil wells in most of the identified blocks in
Cambay,Krishna-Godavari,Cauvery and Assam
&Assam-Arakan Basins. During October, 2013
Oil & Gas production of ONGC Group, including PSC-JVs and from overseas Assets for FY’15 has been 58.33 MMtoe (against 59.21 MMtoe during FY’14).
Oil (MMT) Gas (BCM) 0+OEG (MMToe)
ONGC JV OVL
70
60
50
40
30
20
10
0
22.26 22.02
44.28
3.681.5
5.18 5.533.34
8.87
31.47
27.04
58.33
(Crude Oil figure Including Gas Condensate)
Total
Sudan & S. Sudan
13.2%
Syria0.0%
Colombia 7.3%
Venezuela10.8%
Brazil2.8%
Azerbaijan 12.0%Mynamar
1.50%
Vietnam23.0%
Russia29.4%

Annual Report 2014-15
Board's Report
54
Government of India brought out shale gas policy
which allows National Oil Companies viz. ONGC and
OIL to initiate shale gas and oil assessment activities in
their allocated nomination blocks in phased manner. As
per the new Policy, 50 nomination PML blocks have
been identified in four Basins - 28 PMLs in Cambay, 3
PMLs in A&AA, 10 PMLs in Krishna-Godavari and 9
PMLs in Cauvery basins for Shale Gas assessment
within three year period of Phase-I. A total of 57
pilot/assessment wells are to be drilled by April, 2017
During 2014-15, ONGC has drilled five exploratory
wells for shale gas exploration (4 dual and 1 exclusive)
in Cambay, Cauvery, Krishna-Godavari and Assam-
Arakan Basins and samples have been collected for
assessment of Shale Gas potential. Most of the studies
in wells drilled last year have been completed and the
integration/ assessment exercise is in progress. Based
on the review of data collected in wells JMSGA and
GNSGA, prospective intervals have been identified in
Cambay Shale which are planned to be hydro-
fractured shortly. Presently, 2 Shale gas wells (GNSGB
& GNSGC, Cambay Basin) and 1conventional well with
dual objective (WPGAA,KG Basin) are under drilling.
b. Coal Bed Methane (CBM)
Of the total thir ty-three CBM Blocks awarded by GOI to
various operators through four rounds of bidding and
nomination, ONGC was awarded nine CBM blocks.
Due to poor CBM potential, concluded on the basis of
the data generated in the exploratory activities, five
Blocks viz. Satpura (Madhya Pradesh), Wardha
(Maharashtra), Barmer-Sanchor (Rajasthan), North
Karanpura (West) and South Karanpura (Jharkhand)
have been relinquished.
Currently, ONGC is operating four CBM Blocks i.e.,
Jharia, Bokaro, North Karanpura (Jharkhand) and
Raniganj (West Bengal),FDP of which has been
approved. Nearly 400 wells and 2000 hydro-fracturing
jobs have to be carried out in the coming 4-5 years as
per timelines of the CBM Contract. In view of the
mammoth and time bound task, ONGC is in the
process of farming out its participative interest (PI) to
experienced CBM players through formation of JV.
Farm out Agreement (FoA) for North Karanpura Block
has been signed on October 7, 2014 with M/s Prabha
Energy Pvt. Ltd (PEPL) with assignment of 25% PI from
ONGC’s share. Documents have been submit ted to
DGH for Government’s approval of PI assignment.
Joint Venture for farming out in Bokaro Block is being
negotiated. Further, of fers for formation of Joint
Venture for Jharia and Raniganj blocks are being
invited.
Sale of incidentally CBM gas from existing wells at
Parbatpur of Jharia block is continuing and as on
April 1, 2015 cumulative gas supply has been
13,875,102 SCM.
c. Underground Coal Gasification (UCG)
ONGC with GIPCL selected Vastan Mine block site in
Gujarat as an R&D project to establish UCG technology.
All the ground work and inputs for construction and
implementation of UCG Pilot Project at Vastan, has
been completed and further development is awaiting
award of Mining Lease by Ministry of Coal (MoC), GoI.
Further, a number of sites have been jointly identified
by ONGC & Neyveli Lignite Corporation Limited (NLC)
for studying their suitability to UCG. These are
Tadkeshwar in Gujarat and Hodu-Sindhari & East Kurla
in Rajasthan. One more site was jointly identified by
ONGC & GMDC viz. Surkha in Bhavnagar district,
Gujarat. The data of all the fields have already been
analyzed for evaluating the suitability of these sites for
UCG. All the sites have been found suitable for UCG
exploration.
Oil & Gas Projects
In recent years your Company took up 15 projects for
development of 39 new/marginal oil and gas fields with
an investment of `386,024 million. Out of these 15
projects, 11 projects have already been completed.
Production from development of G-1 & GS-15 fields has
already commenced. Rest three projects, Development
of WO-16 Cluster, C-26 Cluster and B-127 Cluster, are
under implementation and are expected to be completed
in FY’17. Further, Improved Oil Recovery (IOR),
Enhanced Oil Recovery (EOR) and redevelopment
projects were also taken up by your Company for prudent
reservoir management and arresting decline from
matured fields. 21 of 26 such projects have so far been
completed. Two projects i.e., “Heera & South Heera
Redevelopment Project” and “Development of Western
Periphery of Mumbai High South” project is likely to be
completed by Mid FY’16 and the remaining three
projects i.e., “Redevelopment of Mumbai High North
Phase-III”, “Redevelopment of Mumbai High South
Phase-III” and “Additional development of Vasai East” will
be completed by the year 2017-18.
Details about the projects completed during the year
2014-15, new projects taken up are given as below:


Annual Report 2014-15
Board's Report
56
1. Financial ResultsDespite volatile markets and sharing under-recoveries of 362,996 million during the year 2014-15, your Company has earned a Profit Af ter Tax (PAT) of 177,330 million, down 19.74% over FY 2013-14 (`220,948 million). During 2014-15, your Company registered Gross revenue of 830,935 million, down 1.32 % over 2013-14 (`842,028 million).
lGross Revenue : ` 830,935 million
Profit After Tax : 177,330 million
Contribution to Exchequer : 421,074 million
Return on Capital Employed : 33.2 %
Debt-Equity Ratio : 0.0096 :1
Earnings Per Share ( ) : 20.73
Book Value Per Share ( ) : 168
l `
l `
l
l
l `
l `
Highlights
Oil and Gas projects approved by ONGC Board during FY'2014-15
Sl. Name of Projects Approved Cost(`million)
1 MHN Redevelopment Phase-III 58,133 6.997 MMT of Oil and 5.253 BCM of gasby the year 2029-30
2 MHS Redevelopment Phase-III 60,688 7.547 MMT of oil and 3.864 BCM of gasby the year 2029-30
3 Additional Development of Vasai 24,768 1.827 MMT of Oil and 1.971 BCM of gasby the year 2029-30
4 Integrated Development of Daman 60,861 5.01 MMm3 of condensate and 27.67BCM of gas by the year 2024-25
5 Enhanced Recovery from Basseinfield through Integrated of Mukta, Bassein & Panna
6 Pipeline replacement Project-IV 28,999
Total 279,648
Incremental Oil & Gas gainNo
46,199 19.36 BCM of gas 1.97Development Mm3 of condensational, 0.183 mmt of oil
till 2027-28

Board's Report
57
The decrease in Profit during FY 14 -15 as compared to FY 13-14 is mainly due to higher exploratory wells writ ten of f and reduction in quantity sold as well as lower price realization of value added products.
Pursuant to first proviso to sub-section (3) of Section 129 read with Rule 5 of Companies (Accounts) Rules, 2014, a separate statement containing the salient features of the financial statement of its subsidiaries, associate company and joint venture in Form AOC-1 forms part of the Financial Statements.
2. Dividend
Your Company paid interim dividend of 9.00 per share (180 per cent) in two phases(`5.00 and `4.00). The Board of Directors has recommended a final dividend of ` 0.50 per share(10 per cent) making the aggregate dividend at 9.50 per share (190 per cent) for FY 14-15 i.e. same as compared to dividend for the year 2013-14. The total dividend will be `81,278 million, besides `16,256 million as tax on dividend amounting to 55% of PAT.
3. Management Discussion and Analysis Report
As per the terms of Clause 49VIIID of the Listing Agreement with the Stock Exchanges, the Management Discussion and Analysis Report (MDAR) has been included and forms part of the Annual Report of the Company.
4. Financial Accounting
The Financial Statements have been prepared in accordance with the Generally Accepted Accounting Principles (GAAP) and in compliance with all applicable Accounting Standards and Successful Ef forts Method of accounting as per the Revised Guidance Note on Accounting for Oil & Gas Producing Activities issued by The Institute of Char tered
Accountants of India (ICAI) ef fective from 01.04.2013 and provisions of the Companies Act, 2013. Further, as per Ministry of Corporate Af fairs (MCA) notification, the financial statements have been prepared under the Schedule III format of the Companies Act, 2013.
Loans, Guarantees or Investments
ONGC is engaged in Exploration & Production business which is covered under the exemption provided under Section 186(11) of the Companies Act, 2013. Accordingly, the details of loans given, investment made or guarantee or security given by the company to subsidiaries and associates is not required to be reported.
Related Party Transaction
Particulars of contracts or arrangements with related parties referred to in Section 188 of the Companies Act, 2013 in the form AOC-2 form part of Board’s Report and placed at Annexure-B.
5. Subsidiaries
I ONGC Videsh Limited (ONGC Videsh)
ONGC Videsh, the wholly-owned subsidiary of your Company for E&P activities outside India, has participation in 36 projects in 17 countries viz., Azerbaijan, Bangladesh, Brazil, Colombia, Iran, Iraq, Kazakhstan, Libya, Mozambique, Myanmar, New Zealand, Russia, South Sudan,
Sudan, Syria, Venezuela and Vietnam. Out of 36 projects, 13 are producing, 4 are discovered/ under development, 17 are exploratory and remaining 2 are pipeline projects.
ONGC Videsh is currently producing about 167 thousand barrels of oil and oil equivalent gas per day and has total oil
stand gas (2P) reserves of about 612 MMtoe as on 31 March
(` in million)
Particulars 2014-15 2013-14
Revenue from operations 830,935 842,028
Other Income 53,666 67,132
Total Revenues 884,601 909,160
Profit Before Interest, Depreciation & Tax (PBIDT) 380,163 433,582
Profit Before Tax (PBT) 265,552 324,319
Profit Af ter Tax (PAT) 177,330 220,948
APPROPRIATION
Interim Dividend 77,000 79,138
Proposed Final Dividend 4,278 2,139
Tax on Dividend 16,256 13,807
Transfer to General Reserve 79,796 125,864
TOTAL 177,330 220,948

Annual Report 2014-15
Board's Report
58
2015. During FY’15, there is an increase in oil and gas production by 6.19% (Oil 0.86% and Gas 16.37%) as compared to previous fiscal year. The incremental production is primarily due to bet ter management of fields and addition in the port folio.
ONGC Videsh’s share in production of oil and oil equivalent gas (O+OEG), together with its wholly-owned subsidiaries, ONGC Nile Ganga B.V., ONGC Amazon Alaknanda Limited, Imperial Energy Limited and Carabobo One AB, was 8.874 MMtoe during FY’15 as compared to 8.357 MMtoe during FY’ 14. The oil production increased from 5.486 MMT during FY’14 to 5.533 MMT during FY’15 (0.86% higher) primarily due to increased share of additional 12% PI in Block BC-10, Brazil.
During FY’15, the company has earned profit af ter tax of` 19,042 million, a decrease of 57% as compared to FY’14. Despite higher production during FY’15, the decrease in profit is mainly due tolower oil prices, higher financing cost including exchange loss, higher depletion charge, and impairment provision in one of the assets.
(A) Significant Acquisitions, Alliances and Operations highlights of ONGC Videshduring FY’15 are as follows:
a) Block PEP 57090, New Zealand: ONGC Videsh was awarded an exploration permit PEP 57090 in the Taranaki of fshore basin by Government of New Zealand
thon 9 December, 2014. ONGC Videsh has now started operations in Pacific Region.
b) During FY’15, ONGC Videsh has signed the following MoUs:
th(i) MoU with ROSNEFT was executed on 24 May, 2014 for cooperation in subsurface surveys, exploration and appraisal activities and hydrocarbon production in Russia’s of fshore Arctic.
(ii) MoU with TPAO (the Turkish Petroleum thCompany) was executed on 18 June 2014 for
working together for E&P activities in Turkey, joint participation in bidding for opportunities including exploration bid rounds in third countries and pursuit of hydrocarbon opportunities related research and development activities.
(iii) MoU with YPF S.A. Argentina was executed onst 1 September, 2014 for working to explore
possibility of cooperation in the areas of Unconventional and Conventional Hydrocarbon Assets in Argentina, E&P activities in India and in third countries, research & development activities and human resources development.
(iv) LoI with Petro Vietnam was executed onth15 September, 2014, for expansion of exploration
activities by ONGC Videsh in Vietnam by considering participation in 2-3 additional blocks subject to technical and commercial viability and requisite approvals.
(v) MoU with Pemex-Exploracion Y Produccion
th(PEP) was executed on 25 September, 2014, for cooperation in the hydrocarbon sector in the fields of technology, human resources, research & development.
(vi) MoU with Mubadala Petroleum, UAE was t hexecuted on 29 September, 2014, for
collaboration in potential upstream oil & gas exploration, development and producing projects and LNG opportunities.
th(vii) HoA with PVEP was executed on 28 October, 2014, for mutual cooperation and participation in Blocks 102/10 & 106/10 of PVEP and Block 128 of ONGC Videsh in of fshore Vietnam subject to due diligence and negotiations on the terms of participation.
(c) Operations
i. In Sakhalin-1 Project, the topside of “Berkut”-world’s biggest of fshore platform in Arkutun-Dagi field, was successfully floated over from South Korea to Russia
thand installed on 20 June, 2014 with production thcommencing from 5 January, 2015.
ii. Gas Export Pipeline Remediation project in Block BC-10, Brazil was successfully commissioned on
st1 November, 2014 leading to gas export about 0.27 MMSCMD.
iii. In A-1/A3 Project, Myanmar, plateau gas production rate of 14.2 MMSCMD was achieved
ndon 2 December, 2014.
iv. Oil production from Petro Carabobo, Venezuela, thcrossed 16,000 BOPD on 16 March, 2015 with
average oil production of 9,775 BOPD during FY’15 as compared to 3,293 BOPD during FY’14.
v. First crude oil cargo of 1.2 million barrel of Petro thCarabobowas lif ted by RIL on 25 May, 2014 from
Venezuela.
vi. The ongoing geo-political situation in Syria including EU sanctions and the resulting restrictions on contractors continue adversely af fecting Syrian operations since December, 2011.
vii. The operations in South Sudan projects are temporarily under shutdown af ter internal conflicts and adverse security situation in the country since
nd22 December, 2013. The operations in South Sudan shall resume once security situation improves.
Direct Subsidiaries of ONGC Videsh
i. ONGC Nile Ganga B.V. (ONGBV)
ONGBV, a subsidiary of ONGC Videsh, is engaged in E&P activities in Sudan, South Sudan, Syria, Venezuela, Brazil and Myanmar. ONGBV holds 25 per cent

An aerial view of Berkut plat form under construction at Arkutun Dagi, Sakhalin. ONGC Videsh is currently present in 17 countries across 5 continents with a balanced port folio of 36 Hydrocarbon properties, with cumulative investment of over USD 23 billion.

Annual Report 2014-15
Board's Report
60
Participating Interest (PI) in Greater Nile Oil Project (GNOP), Sudan with its share of oil production of about 0.705 MMT during 2014-15. ONGBV also holds 25 per cent PI in Greater Pioneer Operating Company (GPOC), South Sudan. Due to adverse geo-political conditions, ONGC Videsh could not produce in GPOC, South Sudan during FY’15.
ONGBV holds 16.66 per cent to 18.75 per cent PI in four Production Sharing Contracts in Al Furat Project (AFPC), Syria. Due to force majeure condition in Syria, there was no production in AFPC project during FY’15. ONGBV holds 40 per cent PI in San Cristobal Project in Venezuela through its wholly owned subsidiary ONGC Nile Ganga (San Cristobal) BV with its share of oil production of about 0.645 MMT during FY’ 15. ONGBV holds 27 per cent PI in BC-10 Project in Brazil through its wholly owned subsidiary ONGC Campos Ltd. with its share of oil and gas production of about 0.854 MMtoe during FY’ 15. It also holds 25 percent PI in Block BM-SEAL-4 located in deep-water of fshore, Brazil through its wholly owned subsidiary ONGC Campos Ltd. ONGBV also holds 8.347 per cent PI in South East Asia Gas Pipeline Co. Ltd., (SEAGP) for Pipeline project, Myanmar through its wholly owned subsidiary ONGC Caspian E&P B.V.
ii. ONGC Narmada Limited (ONL)
ONL has been retained for acquisition of future E&P projects in Nigeria.
iii ONGC Amazon Alaknanda Limited (OAAL)
OAAL, a wholly-owned subsidiary of ONGC Videsh, holds stake in E&P projects in Colombia, through Mansarovar Energy Colombia Limited (MECL), a 50:50 joint venture company with Sinopec of China. During FY’ 15, ONGC Videsh’s share of oil production in MECL was about 0.626 MMT.
iv. Imperial Energy Limited
Imperial Energy Limited, a wholly-owned subsidiar y of ONGC Videsh incorporated in Cyprus, has its main activities in
the Tomsk region of Western Siberia, Russia. During FY’ 15, Imperial Energy’s oil and gas production was about 0.289 MMToe.
v. Carabobo One AB
Carabobo One AB, a subsidiary of ONGC Videsh incorporated in Sweden, indirectly holds 11 per cent PI in Carabobo-1 Project, Venezuela. During FY’ 15, Carabobo’s oil production was about 0.066 MMT.
vi. ONGC (BTC) Limited :
ONGC (BTC) Limited holding 2.36 per cent interest in the Baku-Tbilisi-Ceyhan Pipeline (“BTC”) owns and operates 1,768 km oil pipeline running through
Azerbaijan, Georgia and Turkey. The pipeline mainly carries crude from the ACG fields from Azerbaijan to the Mediterranean Sea.
vii. Beas Rovuma Energy Mozambique Limited:
Beas Rovuma Energy Mozambique Limited was incorporated in British Vergin Islands (BVI) and holding 6% PI in Rovuma Area 1, Mozambique.
viii.ONGC Videsh Atlantic Inc.:
ONGC Videsh Atlantic Inc. is incorporated in Texas, United States of America, to work in co-ordination with Anadarko (Operator of Rovuma Area 1, Mozambique) and to establish G&G centre etc.
ix. ONGC Videsh Rovuma Limited:
ONGC Videsh Rovuma Limited was incorporated in Mauritius for structuring of 10% PI in ONGC Videsh’s Rovuma Area 1, Mozambique.
II Mangalore Refinery and Petrochemicals Limited (MRPL)
Your Company continues to hold 71.62 per cent equity stake in MRPL, a Schedule ‘A’ Mini Ratna, which is a single location 15 MMTPA Refinery on the West coast.
Performance Highlights FY 2014-15
MRPL achieved the highest-ever thru’put of 14.65 MMT in FY 14-15 against 14.55 MMT in FY 13-14 .
MRPL exported 4.98 MMT of products against 6.72 MMT in the previous year. The exports were low compared to the previous year due to the commissioning of Delayed Coker Unit and increased domestic sale of Kerosene and HSD .
Crude sourcing (Receipts): 14.35 MMT; Iran (34.83 per cent), Saudi Arabia (19.67 per cent), ADNOC (12.12 per cent), Kuwait (15.12 per cent), Basrah Light (0.8 percent) Mumbai High (5.03 per cent), Ravva and KG basin (3.50 per cent) Sonangol (3.81 percent) Spot (5.12 per cent).
Marketing and Retail Operations
MRPL continues to expand its market spread in the direct sales segment of petroleum products in the state of Karnataka and its adjoining states. MRPL has significant market share and direct customer relations for products such as Bitumen, Fuel Oil, Sulphur, Diesel, Petcoke and Mixed Xylene in its refinery zone. The total sales volume of direct marketing products during the FY 2014-15 was 820 TMT with a sales value of ` 22,970 million compared to volume of 507 TMT and sales value of 25,890 million in the previous FY 2013-14.
Phase III - Brownfield expansion Project
All the units of MRPL’s Phase III up-gradation and expansion project have been commissioned . The Polypropylene unit was inaugurated by Hon'ble Minister (I/C) P&NG on 05-04-2015.
Imperial Energy

Board's Report
61
Acquisition of controlling stake in OMPL
MRPL has increased its stake in OMPL to 51 % by subscribing to the right issue made by OMPL Subsequently OMPL has become subsidiary of MRPL and a Government company under Companies Act, 2013.
6. Annual Report of Subsidiaries and ConsolidatedFinancial Statement
In accordance with Section 134 of the Companies Act, 2013 and the Accounting Standard (AS)–21 on “Consolidated Financial Statements” read with AS-23 on “Accounting for Investments in Associates” and AS-27 on “Financial Reporting of Interests in Joint Ventures”, audited Consolidated Financial Statements
stfor the year ended 31 March, 2015 of the Company and its subsidiaries form part of the Annual Report.
Full Annual Report of subsidiaries of ONGC will be made available to any shareholder, if he/she desires, which is also available on Company’s website. Further, Annual Reports of MRPL and ONGC Videsh arealso available on website www.mrpl.co.in and www.ongcvidesh.com respectively.
7. Joint Ventures/ Associates
i. ONGC Petro-additions Limited (OPaL)
ONGC Petro-additions Limited (OPaL), has been promoted by your company asa Joint Venture (JV) Company, with envisaged equity stake of 26% along with GAIL (15.5%). GSPC also has a token presence in OPaL.
The balance equity of 58.5% is to be tied up with Strategic Partners/ FIs / IPO.
OPaL is a mega petrochemical project at Dahej SEZ for utilizing in-house production of C2-C3 and Naphtha from various units of ONGC.
Present status
• Overall Cumulative progress is 95 %. st• Total cumulative expenditure as on 31 March 2015 is
213,110 million. Approved project cost is 270,110 million.
• Debt closure has been at tained for approved project cost of ` 270,110 million with the execution of Rupee Term Loan agreement.
• Phase-wise commissioning of the complex has commenced with stabilized operations envisaged in Q3 2015-16.
ii. ONGC Tripura Power Company Ltd (OTPC)Your Company has promoted OTPC with an envisaged stake of 50% along with Govt. of Tripura (0.5%) and IL&FS Energy Development Co. Ltd.
(IEDCL-an IL&FS subsidiary) (26%); the balance 23.5% has been tied up with India Infrastructure Fund–II acting through IDFC alternatives Limited.
OTPC has set up a 726.6 MW (2 X 363.3 MW) gas based
Combined Cycle Power Plant (CCCP) at Palatana, Tripura. The basic objective of the project is to monetize idle gas assets of ONGC in land-locked Tripura state and to boost exploratory ef forts in the region.
Present Status
• OTPC’s first unit (Unit-1) was dedicated to the Nation by stthe Hon’ble President of India on 21 June, 2013 and its
thcommercial operation was achieved on 4 January 2014 in presence of representatives of beneficiary states. The second unit was dedicated to nation by
stHon’ble Prime Minister of India on 1 December, 2014 and its commercial operation was achieved on
th24 March, 2015.
The Plant has been granted provisional tarif f by Central Electricity Regulatory Commission (CERC). The Ministry of Power has allocated more than 86% of power from the project (two units) to the NER beneficiary states while 98 MW is allocated to OTPC for merchant sales. The OTPC has signed a gas sale and purchase agreement (GSPA) with ONGC for supplying Daily contracted Quantity of 2.65 MMSCMD of gas.
• The 663 KM long 400 KV double circuit transmission network Palatana-Bongaigaon transmission has been commissioned up to Bongaigaon by North-East Transmission Company Limited (NETCL), a joint venture of Power Grid Corporation, OTPC and Governments of the Nor th-Eastern states. This development is helping in evacuating power from both Unit-1and Unit-2.
st• The total expenditure incurred on the project till 31 March, 2015 is `37511 million against the total estimated cost of 40,470million.
iii. ONGC Mangalore Petrochemicals Limited (OMPL)
Your company has promoted OMPL which has set up Aromatic Complex with an annual capacity 914 KTPA of Para-xylene and 283 KPTA of Benzene in Mangalore Special Economic Zone as value chain integration
project of ONGC. The total project cost is about `68,750 million and commenced commercial
stoperation from 1 October, 2014. 2,59,618 MT ofPara-xylene and 61,788 MT of Benzene, have since been exported in the financial year, as the production is being ramped up. Af ter successful commissioning of OMPL in October, 2014, MRPL has increased its equity from 3% to 51.002% in February, 2015 with balance 48.998% held by ONGC and thus OMPL has become a subsidiary of MRPL.
iv. Dahej SEZ Ltd (DSL)
Your company as Lead Promoter has developed a multi-product SEZ at Dahej in coastal Gujarat .Your Company is set ting up C2-C3 Extraction Plant on its own and value-chain integration project
– OPaL through JV route in this SEZ Area. Your

Annual Report 2014-15
Board's Report
62
company has 23% equity in the project with GIDC having 26% and balance 51% is proposed to be tied up through IPO / Strategic / Financial Investor.
Present status:
• SEZ is already operational and units in SEZ have clocked export of `19,740 million in FY 2013-14 and `21,050 million in FY 2014-15.
v. Mangalore Special Economic Zone Limited (MSEZ)
With an envisaged equity stake of 26% along with KIADB (23%), IL&FS (50%), OMPL (0.96%) and KCCI (0.04%), ONGC has set up MSEZ to serve as site for deve lopment o f necessar y
infrastructure to facilitate and locate ONGC/MRPL’s Aromatic complex being promoted by ONGC.
Present Status:
Commercial Operation Date (COD) has been declared ston 1 April, 2015.
vi. Petronet MHB Limited (PMHBL)
• PMHBL is a JV company wherein your company has an equity stake of 28.7% along with HPCL (28.7%) and PIL (7.9%) with balance 34.57per cent of equity being held by
leading banks.
• PMHBL owns and operates a multi–product pipeline to transport MRPL’s products to the hinterland of Karnataka.
• In FY’15 PMHBL pipeline has achieved a throughput of 3.141MMT against total throughput of 3.073 MMT last year. As per audited results for the year 2014-15, the turnover and PAT of PMHBL are `1,071 million and` 341million respectively.
vii. ONGC TERI Biotech Limited (OTBL)
ONGC TERI Biotech Limited ( O T B L ) w h i c h w a s
thincorporated on 26 March, 2007 is a Joint-venture Company o f ONGC in
association with The Energy Research Institute (TERI), with shareholding of 49.98% & 48.02%, respectively. Through the ef forts of joint research of ONGC & TERI over the years, OTBL is of fering below mentioned technologies and providing various Biotechnical Solutions to Oil and Gas Industry, both in India and abroad:
OilzapperTechnology(Bioremediation)- used to eliminate & tackle Oil Spills, Oily Sludge, and hazardous hydro carbon waste;
Paraffin Degrading Bacteria (PDB)- used to prevent Paraf fin Deposition in Oil well Tubing;
Wax Deposition Prevention (WDP)- used to prevent Paraf fin Deposition in surface and sub-surface flow lines;
Microbial Enhanced Oil Recovery (MeOR)- used for Enhanced Oil Recovery by mobilizing crude oil
trapped in pores of Oil Reservoirs.
During 2014-15 the turnover of OTBL was 180.0 Million with Profit af ter Tax of 45.1 Million as against turnover of `141.0 Mil l ion and Profi t af ter Ta x of ` 44.8 Million in the previous year.
viii. Petronet LNG Limited (PLL)
ONGC has 12.5 per cent equity stake in PLL, identical to stakes held by other Oil PSU co-promoters viz., IOCL, GAIL and BPCL. Dahej LNG terminal of PLL having a capacity of 10 MMTPA is currently meeting nearly 20 per cent of
the total gas demand of the country. Dahej LNG Terminal is being further expanded from 10 MMTPA to 15 MMTPA. The construction activities continue as planned and the project is expected to be completed by end 2016.
A new LNG terminal of capacity 5 MMTPA has been set up at Kochi and has already been dedicated to the Nation.
The Company is also planning to set up an LNG terminal of capacity 5 MMTPA at Gangavaram, Andhra Pradesh. The turnover of PLL during 2014-15 is` 395,010 million and net profit is 8,825 million.
ix. Pawan Hans Limited (PHL)
ONGC has 49 per cent equity stake in PHL (previously known as Pawan Hans Helicopters Limited). Balance 51 per cent e q u i t y i s h e l d b y t h e
Government of India. PHL is one of Asia’s largest helicopter operators having a well-balanced operational fleet of 46 helicopters. It provides helicopter support for ONGC’s of fshore operations. PHL was successful in providing all the 12 Dauphin N and N3 helicopters fully compliant with AS-4 as per the new contract with ONGC.
8. Other New Projects/ Business initiatives
C2-C3-C4 Extraction Plant
• Your company has set up a C2, C3 and C4 Extraction Plant at Dahej having a capacity to process 5.0 MMTPA Rich Liquefied Natural Gas (LNG) from M/s Petronet LNG Limited (PLL) as feed stock, for extraction of C2, C3 & C4 products.
• The plant will be commissioned shortly.
• These extracted C2, C3 and C4 products would be feed stock for ONGCs promoted Joint Venture OPaL in the same SEZ at Dahej. They would form 40 % feed stock for upcoming OPaL Project.
• However till the star ting operations and stabil ization of OPaL, ONGC shall be producing LPG by blending C3 & C4 in the requisite ratio and would be sold to Oil Marketing Companies.

Board's Report
63
9. Alliances & Partnerships for Business Growth
a. MoU between ONGC, BPCL, Mitsui and NMPT
ONGC along its consortium partners BPCL and Japanese conglomerate Mitsui signed a MoU with the New Mangalore Port trust (NMPT) on
t h 18 March, 2013. The MoU documents Port’s No-Objection to carry out feasibility studies and intention to ex tend all cooperation to the consortium in this regard. The consortium has carried out the pre-feasibility study of the project and found that terminal is technically feasible and the same had been presented to NMPT. Based on the report, NMPT has conveyed its no objection to the consor tium, for carrying out detailed feasibility studies for the identified locations, subject to adherence to navigational safety requirements. Commercial prefeasibility study is being carried out.
b. MoU for setting up a Special Purpose Vehicle (SPV) for implementing Renewable Energy projects
Your company is likely to be a lead partner in a Joint Venture Company being set up through Special Purpose Vehicle (SPV) for implementing large scale grid-connected solar, wind and other renewable energy (including hybrid) power projects.
An MOU for creating such a JVC was signed on th25 February, 2014 between the Ministry of New
& Renewable Energy and Ministry of Petroleum & Natural Gas, Govt of India.
This JVC shall be for grid connected renewable energy and would be led by ONGC as the lead partner with likely 26% equity and other Oil upstream companies like OIL and GAIL along with EIL, IREDA and SECI as par tners, equity percentage of each one of them to be decided later. Feasibility study for formation of SPV has been done by EIL and report has been submit ted to MoPNG.
10. Information Technology
Considering the need to ensure implementation of cut ting edge technology in all areas of operations and to ensure data integrity and security, ONGC has deployed state-of-the–art IT tools and technologies. In a knowledge-driven and technology-intensive industry such as oil & gas E&P, information technology establishes the vital synergy across the company’s many locations and varied workforce, essentially serving as its operations’ lifeline. Many of the IT achievements of the Company are regarded as benchmarks in the industry in terms of implementation of widespread systems integration and process automation.
Highlights for the year 2014-15
• Consequent to allotment of transponder on GSAT 10 satellite in lieu of INSAT 3E by Department of Space, Govt. of India, Satcom stations were successfully migrated to GSAT 10 satellite using in-house capabilities. On the directive from M o P & N G , a m e e t i n g w a s h e l d w i t h representatives of Indian Space Research Organisation (ISRO) on 05.09.2014 to work-out the use of space applications in E&P sector. ISRO has constituted a five member team which will interact with ONGC team to work-out the use of space applications in E&P sector.
• ISO/IEC 20000: 2011 accreditation for IT Services has been extended to all locations covering entire ONGC, af ter successful external audit during
th th8 -12 September, 2014.
• Crisis Management Plan (CMP) for Countering Cyber At tacks and Cyber Terrorism prepared based on CERT-In template and got validated from security expert of CMC and submit ted to EC for approval. CMP Incident Management team was constituted at corporate level, which will meet weekly or in case of requirement, to oversee resolution of incidents and discuss mitigation plans for upcoming / known threats & which are communicated by NCIIPC, CERT-in etc.
• Infocom has developed “O Drive” facility for ONGCians. With “O Drive” facility, documents can be stored in a centralized server which can be accessed from anywhere. This ef fort is alternative option to the usage of USB drives and thus contributes for Information security
• Developed a complete pipeline information system In-house and rolled out at Mehsana& Rajahmundry Assets. The system feature includes facility to view other geographical information such as nearby locations of hospitals, schools fire stations etc., facility to measure distance between any two points, liquid flow direction animation etc. Distinctive colours adopted for dif ferent type of lines. The facility can be accessed from anywhere on ONGC Intranet with user login authentication.
• Participated in the CERT-in simulated cyber-at tacks based Cyber Security Drill on 23.12.2014, along with 47 other organizations, to assess ONGC preparedness to withstand the possible cyber-at tacks. The Cyber Security Drill was completed successfully and Cyber Security Crisis Management Team was able to detect and analyze the incidents and inform CERT-in within given time.
• A portal for Public Grievances was developed in-house to facilitate public to launch their complaints

Annual Report 2014-15
Board's Report
64
online. This web-based Grievance redressal initiative of ONGC reinforces focus on Digital India project which aims to leverage technology to maintain the Citizen-Government Inter face with the highest integrit y. Through this por tal, citizen/vendor/employee/former-employee can register their grievances relating to any operational wing of ONGC, through an online/single window system. Facility available for monitoring the complaint status by the complainer.
• A portal for JRM (Joint Review Meeting) of Technology and Field services was developed in-house to cater to the complete JRM requirements for conducting the meeting smoothly. JRM members can upload the presentations, tour program details, ATR for previous meetings etc. Notifications/ messages can be generated through this portal and be sent as SMS as well as mail to the members.
11. Health, Safety and Environment(HSE)
Safety, Occupational health and protection of environment in and around its workingareas are prime concerns of ONGC. ONGC has implemented globally recognized QHSE Management System conforming to requirements of QHSE Certifications ISO 9001 ISO 14001 and ISO 18001(OHSAS) at ONGC facilities and certified by reputed certification agencies at all its operational units. During the year 2014-15, 412 Nos. of ins ta l la t ions o f ONGC wer e aud i ted fo r certification/surveillance audit. Corporate guidelines on incident reporting, investigation and monitoring of recommendations was developed and implemented for maintaining uniformity throughout the organization in line with international practice.
A few highlights of HSE during 2014-15 are:
• Regular QHSE internal audits
• Fire safety measures including regular fire andearthquake mock drills
• Training on HSE related topics
• Environmental analysis
• PME of employees and Health Awarenessprograms
• Water and electricity conservation Noise andpollution reduction measures
• Material Safety Data Sheets(MSDS)
• Personal protective Equipment’s(PPE)
• Solid waste management and Developing E-waste disposal procedure
• Identification and implementation of EnvironmentManagement Programmes (EMP).
• Occupation Health & Safety(OHS) programs asper need of the unit
• Energy conservation awareness through displayand communication
• Accident near miss and Governance Risk Compliance (GRC) reporting.
• Mines Vocational Training for Petty ContractualWorkers
ONGC is now an Accredited Environment Impact Assessment (EIA) Consultant organization by Ministry of Environment & Forest (MoEF) in Oil and Gas Exploration Development and Production in Of fshore/Onshore areas and Petroleum refining industry.
Approval by DSIR
ONGC Institutes have received the renewal of recognition of In-house R&D unit by Department of Scientific and Industrial Research (DSIR) for a period of five years (valid till
st31 March, 2018) on 26.03.2013. This will enable ONGC Institutes to continue claiming weighted deduction in Income Tax (200%) against the expenditure towards R&D activities.
Patenting R&D Work
1. One Patent proposal of IRS, Ahmedabad on “Process and composition for cleaning scale deposits of ef fluent dispatch lines” has been submit ted to Centralized Patent Cell, KDMIPE in March, 2015.
2. Patent application has been made by CEWELL for patenting the innovative technique for TOC estimation. The TOC estimated by this technique in first shale gas well matches very well with TOC data obtained through laboratory study on cutting samples. This validates the new technique developed by CEWELL and its applicability in Indian basins.
12. Carbon Management & Sustainability Development
ONGC being one of the premier energy majors of the world and the highest profit earning PSU of India realises its responsibilities in ensuring sustained development through protection of the ecological system. It therefore strives to position itself as a leading organisation in sustainable management and is aiming to achieve sustainable development through a holistic approach to carbon management. ONGC believes that focused Carbon Management ef forts are an ideal route to cover the elements of our business specific sustainable development issues across the environmental dimensions. A critical area of environmental sustainability is mitigation of global greenhouse gas from operations. It isan organizational objective for us to progressively reduce our carbon footprint by working towards reduction in both direct and indirect energy consumption.
Sustainable development requires contribution of all the societal players and with increasingly dominant role of modern day corporates; they can contribute significantly towards sustainable development. ONGC has created a small group called “Carbon

Board's Report
65
Management & Sustainability Group” with a mandate for developing CDM projects, Sustainability reporting, Carbon & Water Management and focussed R&D in the area of low carbon. The following ef forts undertaken by ONGC illustrate its commitment to Sustainable Development:
Project status:
1. Clean Development Mechanism (CDM):
ONGC commenced its CDM journey in 2006. Till date, ONGC has registered 12 CDM projects with UNFCCC. 2 new CDM projects validated and 2 already registered projects successfully verified for issuance of CERs.
Validation of New CDM projects
1. Gas Flare Recovery at GGS Chariali, Assam
2. Energy Savings by replacement of MOL pump atNeelam&Heera Asset
Verification & Issuance of Registered CDM projects
1. Gas Flaring Reduction at Uran Plant
2. 51 MW wind power project of ONGC at Surajbari
2. Carbon and Water Foot printing:
Carbon Foot printing:
GHG Accounting & GHG mitigation projects
Comprehensive company-wide GHG accounting had been completed for the base year 2010-11 and it is found that ONGC has 8,234,853 and 281,178 tons of CO2 emissions under Scope 1 – Direct Emissions and Scope 2 – Energy Indirect Emissions respectively. Based on the study, 11 focus areas and projects have been identified. It is proposed to undertake the feasibility study of eleven identified GHG mitigation projects.
Global Methane Initiative (GMI):
The Global Methane Initiative (GMI) is an action-oriented initiative from United State Environmental Protection Agency (USEPA) to reduce global fugitive methane emissions to enhance economic growth, promote energy securit y, improve the environment, and reduce greenhouse gases emission. The Global Methane Initiative facilitates cooperative mitigation activities that result in bringing more gas to markets through Identification, Quantification, and Reduction (IQR) path.
ONGC entered into a MoU with the USEPA in August 2007, to undertake Methane to Market (now GMI) projects in ONGC and over the years since its joining into the program, ONGC has formed a dedicated team and has procured methane emission detection and measurement equipment in order to undertake Fugitive Emission detection and quantification at its operating facilities and has reduced approx. 14 MMSCM over the years. This is equivalent to reductions of over 2 lakhs tCO e emitting into atmosphere.2
Fugitive emission Identification & Quantification (IQ) jobs have been completed as per Performance Contract (PC) targets. Assam Asset, Ankleshwar Asset &Hazira plant were mapped
for fugitive emissions. The reports have been submitted to respective work centres to take corrective actions.
Water Foot printing:
Sustainable water management:
Every business depends and impacts on water resources. The future of business depends on the sustainability of water resources, which are increasingly under pressure. With freshwater supplies tightening due to overuse and more extreme weather pat terns, business is coming under more pressure to measure and cut water use. ONGC is concerned towards the risks and benefits of water management and exploring new techniques to cut consumption. ONGC’s Sustainable Water Management policy is based on philosophy of 4 “R” i.e. Reduce, Reuse, Recycle & Replenish. CM&SG is entrusted with the responsibility of steering SWM projects across ONGC. CM&SG is working on following projects in this area:
Water footprint study in Ahmedabad Asset and IPSHEM, Goa:
For the first time an in-house footprint study has been done without engaging any external agency. The project was completed ahead of schedule.
Setting up sea water desalination plant at Uran:
LOA for techno-commercial and environmental feasibility study for proposed 20 MLD sea water desalination plant has been placed on M/s MECON India.
Setting up desalination plants at ONGC work centres located near coastal areas and at MRPL:
It is proposed to set up desalination plants at ONGC work centres located near coastal areas (Hazira Plant, Ankleshwar Asset, Cauvery Asset-Karaikal, Rajahmundry Asset & Eastern Of fshore Asset-Kakinada) and at MRPL as a SWM measure, in order to mitigate future sustainability risk due to declining fresh water availability. It is proposed to initially conduct techno-commercial and environmental feasibility study and based on the af firmative outcome of the feasibility report, implementation of set ting up desalination plant at the respective work centre may be undertaken.
Rain water Harvesting:
Rain Water Harvesting (RWH) projects are implemented/ being implemented at dif ferent work centres of ONGC under the umbrella of Sustainable Water Management. The harvested water is being used for beneficial use like gardening, toilet flushing, etc and also for recharging of ground water aquifers. The RWH projects have been taken up at Ahmedabad Asset, Tripura Asset, WOB Vadodara and IPSHEM Goa.
Sewage Treatment Plant (STP) at Mehsana Asset:
Administrative approval accorded for set ting up three STP’s (each of capacity 100 KLD) at ONGC Nagar, Mehsana. Finalization of scope of work and tendering process is being taken up by Mehsana Asset.

Annual Report 2014-15
Board's Report
66
Produced Water Management at Mehsana Asset:
CM&SG and Mehsana Asset have jointly undertaken produced water management in a holistic manner through a Multi-disciplinary Team (MDT) under sustainable water management umbrella in line with EC decision.
Integrated Watershed/Check dam Management at Mehsana:
ONGC as a responsible corporate wants to expand its activities in sustainable water management beyond its operational boundaries. As a first step Mehsana Asset has been chosen as it is one of the worst af fected regions as far as water scarcity is concerned. The project will be a CSR project in association with CM&SG, Mehsana Asset and local concerned authorities. The project is at present exists as a concept and implementation roadmap is being worked out.
SD through focussed R&D and collaborations
ONGC is commit ted towards reduction of greenhouse gases (GHG) emissions and is actively pursuing various R&D projects towards CO2 capture and sequestration in following ways:
• Sequestration by Algal biomass
• Conversion into useful products
ONGC has signed NDA (Non-Disclosure Agreement) with following Finnish agencies
• Ripasso Energy, Sweden in the field of Solar CSP-STtechnology,
• Chempolis, Finland in the area of 3G bio refinery.
• Cleen, Finland in the area of CCSP, EFEU and BESTprogram
• VTT, Finland in the area of water management
At present, however, CM&SG has been pursuing the CCSP programme with CLEEN for the CO2 capture and reformation programme at Hazira plant.
Setting up of 3G Bio-refinery
ONGC is planning to setup a 3G bio-refinery (first of its kind in India) to meet the government mandate of E95 (blending of 5% ethanol to gasoline). To this ef fect, ONGC had signed NDA &MoU with Chempolis, Finland. This endeavor would create a new business dimension for ONGC. Chempolis had conducted feasibility study for the state of Punjab and the same is under consideration.
Carbon Capture & Sequestration
ONGC has also collaborated with CLEEN, Finland in the area of carbon capture and joined its program named Carbon Capture & Storage Program (CCSP). This program works on sharing knowledge among consortium members and working on the specific goals. Consortium agreement has been signed for ONGC specific work package at Hazira.
Solar power CSP-ST technology
Ripasso Energy has specific and unique expertise in the Concentrated Solar Power (CSP) technology. CSP technology is based on “Stirling Engine technology”, a unit
has a typical power output of 30 KW. An inherited modular design ideally suited for volume electricity production with an outstanding conversion ef ficiency of 32%, provides a number of benefits compared to other solar thermal technologies. CM&SG is in talk with Rippaso Energy for establishing a 3MW pilot solar power project at Gamnewala, Jaisalmer. The project proposal is under consideration.
Pilot project on CO sequestration through microalgae2
at Hazira plant
Algae have recently received a lot of at tention as a new biomass source for the production of renewable energy. Some of the main characteristics which set algae apart from other biomass sources are that algae have a high biomass yield per unit of light and area, can have a high oil or starch content, do not require agricultural land, fresh water is not essential and nutrients can be supplied by wastewater and CO by combustion gas. 2
The pilot project was set up at Hazira plant with an aim to sequester CO from vent gas (released during sweeting 2
process of sour gas) with the microalgae and convert into value added products. The results are encouraging which shows that 50% of the CO from the SRU vent could be 2
absorbed by the absorption medium in the absorption column at a pressure of 0.5 Bar. The carbonated medium, when transferred to the raceway pond, inoculated with microalgal strain, showed appreciable algal growth(18 g/m2/day), which was harvested. The harvested biomass was tested at BITS Pilani, Goa Campus for the potential of bio-methane generation. It was found that the biomass have good potential of bio-methane generation. (336 Litre/ when fed with 0.5 KgVS /m3/day).
Waste to Fuel project (under Swach Bharat Abhiyan)
MoP&NG has desired to take a project on waste to fuel at Puri, Odisha under Swachh Bharat Abhiyan (SBA) as a part of Corporate Social Responsibility. The project being of specialized nature and involving technical expertise is being steered by CM&SG. Following steps were taken:
• MDT has been formulated to take project forward
• Meeting with Puri administration had been concluded.
• Draf t EoI has been put up for approval before floatingfor identifying technology and prospective bidders.
Disclosing sustainability performance- Sustainability Reporting
Sustainability repor ting, the practice of measuring, disclosing, and being accountable to internal and external stakeholders for organizational performance towards the goal of sustainable development is being increasingly adopted by organizations. Sustainability Reporting is also believed to lead to improved sustainable development outcomes as it allows organizations to measure, track, and improve their performance on specific issues along the three bottom lines.
Published third party assured A+ sustainability report for ONGC group of companies including ONGC Videsh and

Board's Report
67
MRPL (GRI-G3.0 complaint with Oil and gas sector supplement and BRR).
Capacity building & knowledge Dissemination
CM&SG has three tier knowledge dissemination approaches on carbon, water management and sustainable development.
• Annual Training Program at ONGC Academy
• Programs at Petrotech
• Awareness programs at dif ferent work-centers
Total seven awareness programs were conducted by CM&SG at CFB Silchar, RFB Jodhpur, Western Of fshore Basin Mumbai, MBA Basin Kolkata, Cauvery Asset Karaikal, WOB Vadodara and Cauvery & KG-PG Basin. Total 240 executives participated in the program.
rdA two day 3 CM&SG meet was conducted at Goa in January, 2015 for an in depth interaction of CM&SG and SD of ficers from all ONGC work centers to strategize the pursuit of SD activities in ONGC.
A two day seminar on “Innovation for Sustainability Dividend” was conducted by CM&SG in association with Petrotech Society at Delhi during November, 2014. The seminar was at tended by representatives across Indian oil & gas industries, institutes working in the sustainability and representatives from ONGC.
rdSD brochure was published during 3 CM&SG meet. The brochure would be a communication tool to communicate ONGC’s triple bottom line performance (economic, social and environmental) and sustainability practices. This brochure highlights the considerable work done in the sustainability space, SD initiatives and performance.
rd Film on Sustainability was unveiled during 3 CM&SG meet by Governor of Goa in the presence of Director-I/c-CM&SG.This small film highlights the journey of ONGC in the pursuit of sustainable development.
Stake holder engagement meet
Two stakeholders engagement meets were organized to map and prioritise the key sustainability issues of ONGC. The first meet was meant for internal stakeholders who had prioritized the set of issues which would impact the business sustainability of ONGC. The second meet was for the external stakeholders who had prioritized the issues whose impacts on ONGC would impact their business sustainability. The outcome of the two reports, upon juxtaposition, has generated the key materiality issues of ONGC to work upon. This is the first time such an exercise was undertaken.
Other Initatives:
Corporate Waste Management Policy: Your company approved Corporate Waste Management Policy and the same will be reviewed af ter every three years.
• Trading policy on monetizing of CER shas been approved and will be operational shortly.
• Carbon Neutrality: ONGC has taken a conscious decision to reduce its carbon footprint as a part of its sustainable development programme. As a first step towards this mission, CM&SG has undertaken a maiden initiative to render the carbon footprints of three major areas neutralised for 2013-14. The areas are :
vAir travel of all ONGC employees including to and fro local surface transportation to airport.
vConsumption of electricity, paper, LPG and fuel for local transportation from IPE Campus, IDT, IEOT, IRS and IPSHEM
vFlaring and electricity consumption of Uran Plant.
Carbon neutrality is essentially a concept of having a net zero GHG footprint of an activity. The entire process involved a detailed GHG accounting of the activity and of fset ting the footprint. The total footprint of the activities is 1,37, 345 tons of CO equivalent and 2
has been of fset by retiring an equivalent quantity of carbon credits issued against the registered CDM projects of ONGC.
13. Business Responsibility Report – 2014-15
Securities & Exchange Board of India has introduced Clause 55 to the Listing Agreement with the Stock Exchanges, which states that Listed entities shall submit, as part of their Annual Report, Business Responsibility Report, describing the initiatives taken by them from an environmental, social and governance perspective. Accordingly, the third Business Responsibility Report – 2014-15 has been drawn up and forms part of the Annual Report for 2014-15.
14. Internal Control System
Your Company has a well-established and ef ficient internal control system and procedure. The Company has a well-defined delegation of financial powers to its various executives through the Book of Delegated Powers (BDP). The Integrated BDP is updated from time-to-time in line with the needs of the organisation as well as to bring further delegation. BDP has been revised during FY 14-15 and the same has been made ef fective from 01.01.2015. The Company has in-house Internal Audit Department commensurate with its size of operations. Audit observations are periodically reviewed by the Audit &Ethics Committee of the Board and necessary directions are issued whenever required.
15. R&D EFFORTS THROUGH ONGC ENERGY CENTRE TRUST(OECT)
Your company has taken steps to evaluate various forms of energy to fulfil the country’s growing energy needs. Towards this end, your company has established an ONGC Energy Centre Trust (OECT), which is mandated to undertake or assist in programs / projects of fundamental and applied research for improving and developing commercially viable energy

Annual Report 2014-15
Board's Report
68
mediums and sources beyond hydrocarbons, especially in clean and/or renewable energy options. ONGC Energy Centre (OEC) has been set-up under the aegis of the OEC Trust to work on various clean energy options.
Your company through ONGC Energy Centre has been implementing several Research Projects on new and alternative sources of energy. These Projects are in advanced stages of implementation, in collaboration with various national and international academic, research and industrial organizations. The projects where your company is currently engaged in are:
a) Hydrogen Generation through Thermo-chemicalProcesses
b) Exploration for Uranium
c) Bioconversion of lignite to Methane
d) Bioconversion of Oil to Methane
e) Kinetic Hydro Power
f) Geothermal Energy
g) Solar Thermal Project
These apart, during 2014-15, ONGC Energy Centrehas also evaluated many new options to expand the research and technology development activities and also to focus on optimum utilization of resources available with ONGC. These ef forts have been described in detail in the Annexure Con Energy Conservation.
Further, a Board Level Committee on Research & Development has been constituted. The first meeting of the Committee was held on 27.05.2015 and the terms of reference of the Committee have been approved.
16. Human Resources
Your Company values its Human Resources the most. To keep their morale high, your company extends several welfare benefits to the employees and their families by way of comprehensive medical care, education, housing and social security.
17. Employee Welfare
Your Company continues to extend welfare benefits to the employees and their dependants by way of comprehensive medical care, education, housing, and social security. Your Company continues to align company policies with changing economy and business environment.
Employee Welfare Trusts –
Your Company has established the following major Trusts for welfare of employees:-
Employees Contributory Provident Fund(ECPF) Trust, manages Provident Fund accounts of employees of your Company.
The Post Retirement Benefit Scheme (PRBS) Trust of
your Company manages the pension fund of employees of your company which has been converted into a Defined Contribution Scheme as per DPE guidelines.In the converted Defined Contribution Scheme, the corpus in the individual employee account shall include employer/ employee contributions and interest thereon. The benefits under the Scheme are dependent on corpus in the individual employee account and accordingly, would be market determined which depends on interest rate, annuity price etc.
The Composite Social Security Scheme(CSSS) formulated by your company provides an assured ex-gratia payment in the event of unfortunate death or permanent disability of an employee in service. In case of Separation other than Death/Permanent total disability, employees own contribution alongwith interest is refunded.
Gratuity Fund Trust exists for payment of gratuity as per the provisions of the Gratuity Act.
Your Company has a Sahayog Trust for its Sahayog Yojana to provide ex-gratia financial grant for sustenance, medical assistance, treatment, rehabilitation, education, marriage of female dependent and alleviation of any hardship or distress to secure the Welfare of the workforce and their kin, who do not have adequate means of support. The beneficiaries under this scheme includes casual, contingent, daily rated, part time, adhoc, contract appointees, tenure based employees, apprentices and trainees employed by your Company besides regular and past employees. Under the scheme an amount of ` 5770 million were disbursed by the Trust during the year.
Extension of Benefits under the Asha Kiran Scheme to retired employees:-
The Asha Kiran Scheme was introduced to meet the emergency needs of the ex-employees retired prior to 01.01.2007, who are passing through distressful situation. The scheme was launched as per DPE guidelines by creating a corpus of 1.5% of PBT. During the year, under this scheme financial assistance of `1780 million was provided to 14698 ex-employee.
Persons with Disabilities
ONGC believes in af fording equal opportunities to physically challenged people. As on 31.03.2015, there were 156 permanent employees with disabilities (0.5%) on the rolls of ONGC.
Implementation of Govt. Directives for Priority Section
Your Company complies with the Government directives for Priority Section of the society. The percentage of Scheduled Castes(SC) and Scheduled

ONGC has signed a Memorandum of Collaboration with the Indian Institutes of Technology (IITs) to worktowards a collective R&D programme for developing indigenous technologies to enhance exploration & exploitation of hydrocarbons and alternate sources of energy in the gracious presence of Hon'ble Minister of Human Resources Smt. Smriti Irani and Hon'ble MoS (I/C), Petroleum & Natural Gas Shri Dharmendra Pradhan.
ONGC has entered into an MoU with Super Wave Technology Pvt. Ltd. ( SWTPL) for doing research on alternate technology for hydraulic fracturing. The MoU was signed in the gracious presence of Hon'ble Prime Minister of India Shri Narendra Modi and Hon'ble MoS (I/C), Petroleum & Natural Gas Shri Dharmendra Pradhan.


Board's Report
71
competitive advantage. Towards that end, during the year, your Company conducted Business Games to hone the business acumen of its executives. Business Game has proved to be very popular initiative and tests the ability of the executives through business quizzes, business simulations and case-study presentations. During the year 2014-15, a total of 144 teams and 576 executives participated in the event. Fun Team Games (FTG) were organized for E0 and staf f level employees to inculcate MDT(Multi-disciplinary Team) concept and spirit of camaraderie and belongingness to the organization, which was very well received by the participants. A total of 75 Teams and 300 employees participated in FTG during the year 2014-15. The winners of Business Games and Fun Team Games were felicitated by the CMD on Republic Day Celebrations. Your Company also conducted the Assessment Development Centre (ADC) for 192 DGM level executives (0.81% of executives) and provided them developmental inputs. Your Company has partnered with global HR consulting firms to create a pool of accredited mentors in the organization. These mentors will support organization’s ef fort to hone young minds to successfully respond to the emerging business needs of your Company. As part of this Initiative, in the year 2014-15, 36 mentorship workshops were conducted. Also, 123 mentors have be en awarded Basic and Advanced level Accreditations for mentoring.
Training
Your Company at taches utmost importance to the development of its human resource.Your Company has branded the spectrum of its training activities as ‘EXPONENT - a comprehensive Programme, which is nurturing the energy leaders of tomorrow. The growth of an ONGCian to an Exponent of energy business is facilitated by ONGC Academy, Regional Training Institutes and other specialised in-house training Institutes and world class training providers in India and abroad.
During the year , a total of 20084 Executives and 4729 non-executives were imparted appropriate training, spanning 176644 executive mandays (Number of executive mandays per executive per year: 7.49) and 16119 non-executive mandays (Number of non-executive mandays per executive per year: 1.69) during 2014-15 at all Work centres.
In order to absorb new and emerging technological advancements pertaining to oil and gas exploration and production, 85 programmes, including 26 foreign facult y programmes per taining to functional disciplines, were organized with the best of faculties from India and abroad during the year.
To nurture the talent with the objectives to prepare future leaders of the organisation for taking up higher
roles and address key organisational challenges, 338 executives of E7, E6 and E5 level were exposed to Leadership Development Program (LDP), Advanced Management Pr ogram (AMP) and Senior Management Program (SMP) respectively, the tailor made Management Programmes with overseas learning component through tie-ups with leading B-schools of the country.
23. Women Empowerment
Women employees constituted over 6 percent of your Company’s workforce. During the year, programmes on women empowerment and development, including programmes on gender sensitization were organized. Your Company actively supported and nominated its lady employees for programmes organized by reputed agencies.
Your company scrupulously complies with The Sexual Harassment of Women at Workplace (Prevention, Prohibition and Redressal) Act 2013. Reported cases of Sexual harassment are inquired into by Complaint Commit tee constituted separately for all the work-centres, for taking disciplinary action against the delinquent employees.
24. Work-Life Balance:-
Your Company continued in its endeavors to ensure work-life balance of its employees. The townships at many work-centers were provided facilities like gymnasiums, music rooms, etc. Outbound programmes with families were also organized at various work-centers. Plays on the importance of ‘Work-Life Balance’ were staged to create awareness amongst the employees. In addition, cultural programmes involving employees and their families were also conducted. MahilaSamitis and Resident Welfare Associations (RWAs) were involved in the organization of these cultural programs. Your Company has a adventure wing named ONGC Himalayan Association which organizes adventure programmes like mountaineering, trekking, white water raf ting, snow skiing, desert Safari, Aero sports etc. which adds towards morale, engagement, team spirit, camaraderie, stress management and spirit to explore unknown among the employees.
25. Sports
Your Company continued its large scale support for development of sports in the country in the form of job of fers & scholarships to deserving sportspersons. Sponsorships to various spor ts associations / federations / sports bodies to organise sports events as well as develop infra-structure were also extended.
Your Company ex tended suppor t in 23 game disciplines to 170 players on regular rolls and 167 players on scholarship. The support has enabled many sportspersons to bring home laurels for the

Annual Report 2014-15
Board's Report
72
nation and the organisation. Some of the key achievements during the year are given below:
Your Company was conferred the prestigious Rashtriya Khel Protsahan Puruskar by Hon’ble President of India Mr. Pranab Mukherjee at a glit tering ceremony in Rashtrapati Bhavan on the occasion of National Sports
thDay on Friday 29 August , 2014. CMD Mr. D.K.Sarraf received the honour from the President.
Two ONGCians were conferred with the prestigious “Arjuna Award” for the year 2014; Ms. Heena Sidhu in Shooting and Mr. V. Diju in Badminton. The total number of National Awardees in the organization stands at 24 (KhelRatna – 1, Padma Shri – 2 & Arjuna – 21)
In Commonwealth Games 2014 held at Glasgow (UK) a total of 20 ONGC athletes had participated in this 12 day long mega event and bagged 6 medals (1 Gold, 3 Silver & 2 Bronze) which is a pretty healthy success rate
In Asian Games 2014 held at Incheon (Korea) a total of 40 ONGC athletes had participated and bagged 13 medals (4 Gold, 1 Silver & 8 Bronze).
Mr.Sourav Kothari won the Gold Medal at the Asian Billiards Championship.
Your Company was awarded the prestigious FICCI Certificate of Excellence for the “Award for long time contribution to Indian Football” for the year 2014 [this is the first time in the history that an organisation has been awarded successive FICCI Awards].
Mr. Pankaj Advani of ONGCwon 12th world title incue sports. In the year 2014-15 he won WorldBilliards title in time & point format, 6 red worldsnooker championship and World team Billiards Championship.
Ms. Rashmi Kumari of ONGC won the singles title of World Cup (women) in carom.
26. CORPORATE SOCIAL RESPONSIBILITY (CSR)
Your company is fully engaged in ensuring equitable and sustainable growth of society in and around the area of its operations besides complying with government directives to discharge its social responsibility as a leading Indian corporate. CSR activities are essentially guided by project based approach in line with the provisions of Companies Act, 2013 promulgated by Ministry of Corporate Af fairs and Companies (CSR Policy) Rules and the guidelines on CSR& Sustainability issued by Department of Public Enterprise, Government of India. Seeking to herald an inclusive business paradigm, ONGC has CSR interventions that are based on social, environmental, and economic considerations and are well-integrated into the decision-making structures and processes of the organization.
Pursuant to enactment of Companies Act 2013 and Companies (CSR Policy) Rules 2014 by Ministry of
Corporate Af fairs and Guidelines on CSR and Sustainability by Department of Public Enterprise, the CSR Policy has been approved by the Board of Directors. The same is uploaded on the Company’s website.
Further, in line with the approval of the Board, ONGC has set up and registered ONGC Foundation under the Societies Registration Act, for carrying out CSR activities. Necessary steps are on hand to recruit manpower for making ONGC Foundation an ef fective tool for implementation of CSR policy of ONGC.
Pursuant to Rule 9 of Companies (Corporate Social Responsibility Policy) Rules, 2014 the Annual Report on CSR activities is annexed herewith as Annexure 'C'.
CSR ACTIVITIES UNDERTAKEN BY ONGC BASED ON ITEMS LISTED IN SCHEDULE VII OF THE COMPANIES ACT, 2013
o Eradicating hunger, pover ty and malnutrition, promoting preventive health care and sanitation and including contribution to Swachch Bharat Kosh set up by Central Government for promotion of sanitation, making available safe drinking water:
o Promoting education, including special education and employment enhancing vocation skills. Especially among children, women, elderly, and the dif ferently abled and livelihood enhancement projects.
o Promoting gender equality, empowering women, set ting up homes and hostels for women and orphans; set ting up old age homes, day care centres and such other facilities for senior citizens and measures for reducing inequalities faced by socially and economically backward groups.
o Ensuring environmental sustainability, ecological balance, protection of flora and fauna, animal welfare, agro forestry, conservation of natural resources and maintaining quality of soil, air and water including contribution to clean Ganga fund set up by the central government for rejuvenation of river Ganges.
o Protection of national heritage, alt and culture including restoration of buildings and sites of historical importance and works of art; set ting up public libraries; promotion and development of traditional and handicraf ts
o Measures for the benefit of armed forces veterans, war widows and their dependents.
o Training to promote rural sports, nationally recognised sports, Paralympics sports and Olympic sports.
o Contribution to the Prime Minister's National Relief Fund or any other fund set up by the Central Government for socio-economic development and relief and welfare of the Scheduled Caste& the Scheduled Tribes, other backward classes, minorities and women.
o Contributions or funds provided to technology

Board's Report
73
incubators located within academic institutions which are approved by the Central Government.
o Rural development projects.
o Slum area development.
In the last 7 years, your company has contributed`18,807 Million towards its well-structured and well-focussedCSR activities.
Out of the CSR Budget of `6,606.12 million, ONGC spent an amount of `4,952.29 million in FY 2014-15. This translates to overall utilization of 74.97% of the CSR Budget.
Reason for non-utilization of full CSR budget:
• Major Initiatives undertaken were mostly in transition phase so the allocated earmarked budget could not be spent.
• Some of the flagship projects undertaken were of long gestation period with budget spread over 3-5 years thus resulting in lesser utilisation of earmarked budget for the financial year 2014-15.
Some of the landmark CSR initiatives under implementation during the year 2014-15 by your Company include:
(a) Healthcare:
(i) Varisthajana Swasthya Sewa Abhiyan: ONGC and Help-Age India Initiative
To provide basic medical facilities to elderly in terms of medical consultancy, medicine distribution, basic diagnostic test, special health camp and palliative care at their doorstep. A total of 20 Mobile Medicare Units (MMUs) are engaged for taking basic healthcare to the doorsteps of the elderly in nine states, 17 Districts, 35 blocks and 131 Gram Panchayat and 240 villages of India .A total of 11,86,020 beneficiaries were treated for chronic illness such as Hypertension, Diabetes, Osteoarthritis, Dyspepsia& Skin problems etc.
(ii) Community Hospital in Lakhimpur- Kheri, Uttar Pradesh:
The project is unique in terms of using the PPP model in CSR with full Capex of `45 million contribution by ONGC and Opex borne by the Operating Partner. This 26 bedded Community Hospital would cater to Primary and Secondary Health Service Requirements from BPL, Economically Backward Class families. Healthcare services are being provided at 50% less cost than the existing CGHS rates.
(iii) Aids and Appliances to person with disability:
This is a Pan India CSR project undertaken in association with Ar tificial Limbs Manufacturing Corporation of India (ALIMCO) and Bhagwan Mahaveer Viklang Sahayata Samiti (BMVSS), Jaipur commonly known as Jaipur Foot benefit ting 45,495 Person with Disabilities. Beneficiaries were provided
Or thopedic, Hearing and V isually Aids and Appliances. The total financial implication of the project was `262 million covering 39 ONGC operational areas and 61 Backward Districts in Phase-I of the project which concluded in the financial year 2014-15.
(iv) Government General Hospital (GGH), Kakinada:
ONGC has given financial assistance of `19 million to construct a separate building for blood bank and to equip the hospital with additional equipment for blood bank, general surgery and general medicine departments. This will immensely benefit people of East Godavari District where ONGC has a substantial operational presence
(v) ONGC Mission Ujala:
The project envisages eye screening of 50,000 children in Government Schools in NCR under National Blindness Control Programme of Govt. of India in collaboration with reputed NGO PRAANI. Spectacles to 3,000 children detected with refractive errors along with medicines were provided under this project.
(b) Education & Vocational courses:
i. ONGC-GICEIT Computer Education Program:
Through this project, employment- related free computer education is being imparted to economically underprivileged Youth. The project is implemented in association with Bhartiya Vidhya Bhawan’s Gandhi Institute of Computer Education and Information Technology, (GICEIT) at five work centres of ONGC located at Mehsana, Dehradun, Nazira, Karaikal and Rajahmundry. More than 8295 students have received computer training through these centers in the financial year 2014-15.
ii. ONGC-The Akshaya Patra Foundation:
A centralized fully automated mechanized kitchen is being set up to provide mid-day meals to school going children (enrolled in Govt. schools) in the District of Surat. This kitchen was inaugurated by the Hon’ble
thChief Minister of Gujarat Smt Anandiben Patel on 15 Feburary, 2015. This kitchen has capacity to feed
st2,00,000 children per day. The enrolment as on 31 March, 2015 is 1,90,840.
iii. Community School at Sitapur, Uttar Pradesh:
The project is unique in terms of using the PPP model in CSR with full Capex of `27 million contribution by ONGC and Opex borne by the Operating Partner-Shanti Devi Memorial Charitable Trust.
iv. ONGC Super 30
“ONGC Super 30” is a residential Coaching Programme for IIT aspirants based at Sivasagar Assam. The total cost of the project is 6.70 million. The

Caring for the planet and society forms an
essential tenet of ONGC's Corporate Social
Responsibility (CSR) initiatives
Swachh Vidhyalaya: ONGC has taken up the initiative to provide
sanitation facilities to over 2500 schools across India
Mission Ujala: ONGC has been providing financial support to make a
difference in lives of visually challenged people
In pursuit of a greener environment, ONGC has taken up " Project Cover
Green" to plant mangroves along the cost of Gujarat and Maharashtra to
prevent soil erosion

ONGC has installed 51 MW wind energy farm at Bhuj in Gujarat
and 102 MW wind farm project in Rajasthan

Annual Report 2014-15
Board's Report
76
initiative was conceived to cater to underprivileged and below poverty line students who are unable to get proper coaching to qualify engineering exams due to lack of resources and funds.
(c) Projects for Physically and Mentally challenged
i. ONGC Centre for vocational rehabilitation for the dif ferently abled:
A financial support of 13 million has been provided to Tamana School of Hope, Vasant Vihar, New Delhi for set ting up of Autism Centre and provide vocational training for the mentally challenged young adults and children working for their economic rehabilitation by teaching relevant vocational skills to them.
ii. ONGC –Cheshire Home Project for Physically and Mentally Challenged:
A project on health rehabilitation and allied services for economically disadvantage children with disabilities living in slums area of Mumbai undertaken with Cheshire Homes (India) Mumbai with financial assistance from ONGC. Children with Disabilities were identified from areas of Hanuman Nagar, Damu Nagar and Shivaji Nagar covering 3 slum communities and provided with rehabilitation treatment and aids with an objective to help them lead a normal life.
(d) Environment Sustainability:
i. Eastern Swamp Deer Conservation Project (Phase II) :
The phase II of the project includes capture of Eastern Swamp Deer from the source i.e Kaziranga National Park and translocate them to Manas National park. This is a research based project to conserve and increase the viable population of Eastern Swamp Deer in their natural habitat at Manas National Park. The total cost of the project is 8.9 million.
ii. Harit Moksha: Green Cremation System
This is a unique CSR initiative of ONGC undertaken with MokshdaParyavaranEvam Van SurakshaSamiti (MPEVSS) to reduce wood consumption during traditional cremations through Mokshda Green Cremation Systems (MGCS). The project includes installing 30 units of green cremation system in 8 cities of 7 dif ferent states with a budget of `92 million . The project helped in saving approximately 13,700 tonnes of wood & reduced 26,500 tonnes of GHG emissions till date.
(e) Development of Backward Districts:
The sustainable development project is being implemented in Jaisalmer, a backward district in Rajasthan. Project involves setting up of 49 Wind Turbine Generators (WTG) each of capacity of 2.1 MW with total capacity of 102.9 MW in association with M/S Suzlon Energy Ltd. ONGC contribution towards the project is` 5620 million. 22 nos. of WTG have been installed.
(f) Women Empowerment:
ONGC as a leading organization and among the founder member of Women in Public Sector (WIPS) established way back in 1990 under the aegis of SCOPE has a lways spearheaded women empowerment Initiatives. Women Development Forum (WDF) an internal wing of ONGC women Employees was also formed in line with WIPS to encourage women employee to explore their potential to the fullest.
The basic aims and objectives of WIPS are:
• To promote the growth and development of Women in Public Sector.
• To assist the Public Undertakings in optimising the full potential in Women employees.
• To play a catalytic role in improving the status of Women in and around PSEs
Women in Public Sector (WIPS) presented ONGC with the Best Enterprise Award for Women Empowerment consecutively for 3 years till 2014. In the year 2015 ONGC was awarded the second prize for the same category.
(g) Other CSR Initiatives:
i) Hortoki Water Supply Scheme: The project aims to create a sustainable source of safe drinking water to the people of Hortoki Village, Kolasib District, Mizoram. A massive 1.7 Lakhs litre water tank was constructed as part of the project to supply more than 40 lpcd of water till 2043. ONGC has extended support of 9 million for the project. More than 450 households of Hartoki village are benefited through this project
ii) Rajeev Gandhi International Sports Complex, Dehradun: ONGC in association with Govt. of Ut tarakhand is working towards building a Cricket stadium-cum-sports complex with a capacity of 30,000 people extendable to additional seats in future, car parking, a spor ts academy, a club house or Gymnasium, restaurant and other auxiliary facilities. ONGC has extended financial support of `500 million towards the project. The project is expected to be completed in two years.
iii) Dashrath Stadium at Agartala: The project aims to create an Indoor sports complex in association with DDO Directorate of Youth Af fairs. ONGC has extended support of 243 million for the project.
iv) IIIT, Agartala: ONGC has extended support of `30 million for set ting up a new IIIT Campus in Agartala.
In addition to above major CSR initiatives undertaken in 2014-15, ONGC has partnered with many NGO and other non- profit organization in implementing several other CSR initiative across our country. All work centres of ONGC have designated CSR of fice to take care of the local needs.
As a testimony to our CSR efforts, your company has

Board's Report
77
won many laurels such as:
1. Golden Peacock Award 2014 for CSR during 9th International Conference on Corporate SocialResponsibility-2014
2. ABP News Global CSR Excellence & Leadership Award for Best Overall CSR practices
th3. 4 Annual Greentech CSR Platinum Award 2014in petroleum exploration sector
4. Madan Mohan Malviya Golden Award for outstandingcontribution in the field of Education
5. P L Roy CSR Award on ‘International Day of OldePersons’ for support to the elderly through its CSRinitiative ‘Varishthajana Swasthya Sewa Abhiyan’
27. ACCOLADES
Consistent with the trend in preceding years, yourCompany, its various operating units and its seniormanagement have been recipients of various awardsand recognitions. Details of such accolades are placedat Annexure – ‘D’.
28. DIRECTORS’ RESPONSIBILITY STATEMENT
Pursuant to the requirement under Section 134(3)(c) of the Companies Act, 2013, with respect to Directors’ Responsibility Statement, it is hereby confirmed that:
(i) In the preparation of the annual accounts, the applicable accounting standards have been followed and there are no material departures from the same;
(ii) The Directors have selected such accounting policies and applied them consistently and made judgements and estimates that are reasonable and prudent, so as to give a true and fair view of the state of af fairs of the
st Company as at 31 March, 2015 and of the profit of the Company for the year ended on that date;
(iii) The Directors have taken proper and suf ficient care for the maintenance of adequate accounting records in accordance with the provisions of the Companies Act, 2013, for safeguarding the assets of the Company and for preventing and detecting fraud and other irregularities;
(iv) The Directors have prepared the annual accounts of the Company on a ‘going concern’ basis;
(v) The Directors have laid down internal financial controls which are being followed by the company and that such internal financial controls are adequate and are operating ef fectively; and
(vi) The Directors have devised proper systems to ensure compliance with the provisions of all applicable laws and that such systems are adequate and operating.
29. CORPORATE GOVERNANCE
Your Company has taken structured initiatives towards Corporate Governance and its practices are valued by various stakeholders. The practices emanate from the need to position multi-layered checks and balances at various levels to ensure transparency of its operations
in the decision making process.
In terms of Clause 49 of the Listing Agreement, a report on Corporate Governance for the year ended March
st31 March, 2015, supported by a certificate from the Company’s Statutory Auditors confirming compliance of conditions, forms part of this Report.
ONGC has implemented the mandatory Guidelines of Department of Public Enterprises (DPE), Government of India, on Corporate Governance to the maximum extent possible.
In terms of section 204(1) of the Companies Act, 2013, the Company has engaged M/s P P Agrawal & Co., Company Secretaries in whole-time practice as Secretarial Auditors for conducting Secretarial Compliance Audit for the
st financial year ended 31 March, 2015. Their report forms part of this Annual Report.
With regard to the observations of Secretarial Auditors as contained in their report, it is submit ted that ONGC being a Government company, all directors on the Board of the company are appointed by Government of India. The matter relating to appointment of requisite numbers of Independent Directors has already been taken up with the Government.
The Company has formulated and uploaded the following policies/codes on its website in line with the Companies Act, 2013 and Listing Agreement:
(a) Code of Conduct for Board Members and Senior Management Personnel
(b) Related Party Transactions ‐ Policy & Procedures, 2014
(c) Material Subsidiary Policy
(d) The Code of Internal Procedures and Conduct for prohibition of insider trading in dealing with the securities of ONGC
In line with global practices, your Company has made available all information, required by investors, on the Company’s corporate website www.ongcindia.com
Apart from the mandatory measures required to be implemented as a part of Corporate Governance, ONGC has gone the extra mile in this regard for the benefit of its stakeholders:
i. Whistle Blower Policy / Vigil Mechanism: A total of 35 Protected Disclosures till 31.03.2015 have been processed through the Whistle Blower mechanism of ONGC which was implemented from December 01, 2009. The policy ensures that a genuine Whistle Blower is granted due protection from any victimization. The Policy is applicable to all employees of the Company and has been uploaded on the intranet of the Company.
In addition, the Company has a full-fledged Vigilance Department, which is headed by Chief Vigilance Of ficer who holds the rank of a Functional Director of

Annual Report 2014-15
Board's Report
78
the Company. With a view to maintain his independence, the CVO reports to the Chief Vigilance Commissioner of the Government of India.
ii. Enterprise-wide Risk Management (ERM) framework:
In line with the requirements of Clause 49 VI of the Listing Agreement, your Company has developed and rolled out a comprehensive Enterprise-wide Risk Management (ERM) Policy throughout the organization. The Audit & Ethics Commit tee periodically reviews the risk assessment and minimization process in ONGC.
The Risk Management policy of your Company is as follows:
“ONGC shall identify the possible risks associated with its business and commits itself to put in place a Risk Management Framework to address the risk involved on an ongoing basis to ensure achievement of the business objective without any interruptions.
ONGC shall optimize the risks involved by managing their exposure and bringing them in line with the acceptable risk appetite of the Company”
The Board of Directors have constituted a Board Level Risk Management Commit tee in terms of Clause 49 of the Listing Agreement. The first meeting of the Commit tee was held on 19.03.2015 wherein the risk appetite and present risk profile, development of risk register to comply with clause 49 of the listing agreement and Companies Act, 2013, Risk Management Policy in ONGC, Risk Repor ting structure, Risk Management / mitigation process, Governance Risk Management & Compliance (GRC) module roll-out through SAP, Review of risk register and identification of new & emerging risks, categorization and quantification of risks and role of internal audit in ERM etc were reviewed.
iii. Meeting of Independent Directors: No Meeting of Independent Directors was held during 2014-15.
iv. Cer tificate of Independence by Independent Directors: The Independent Directors have submit ted declaration that they meet the criteria of Independence as per section 149(6) of the Companies Act, 2013.
30. STATUTORY DISCLOSURES
Your Directors have made necessary disclosures, as required under various provisions of the Act and Clause 49 of the Listing Agreement.
Extract of Annual Return
As per requirement of section 92(3) of the Companies Act, 2013, the extract of the annual return in form MGT-9 is placed at Annexure-E.
Particulars of Employees
ONGC being a Government Company, the provisions of section 197(12) of the Companies Act, 2013 and
relevant Rules shall not apply in view of the Gazette notification dated 05.06.15 issued by Government of India, Ministry of Corporate Af fairs.
The terms and conditions of the appointment of Functional Directors is decided by the Government of India. The salary and terms and conditions of the appointment of Chief Financial Of ficer (CFO) and Company Secretary, KMPs of ONGC, is in line with the parameters prescribed by the Government of India. Performance Related Pay of Functional Directors and other employees including CFO & Company Secretary (KMPs) is in line with the guidelines of Department of Public Enterprises, Government of India.
31. ENERGY CONSERVATION
The information required under Section 134(m)of the Companies Act, 2013, read with the Companies (Disclosure of Particulars in the Report of Board of Directors) Rules, 1988, is annexed as Annexure – ‘F’.
32. AUDIT AND ETHICS COMMITTEE
In compliance with section 177(8) of the Companies Act, 2013, the details regarding Audit & Ethics Commit tee is provided under Corporate Governance report which forms part of this Annual Report. There has been no instance where the recommendations of the Audit & Ethics Commit tee have not been accepted by the Board of Directors.
33. AUDITORS
The Statutory Auditors of your Company are appointed by the Comptroller & Auditor General of India (C&AG). M/s Mehra Goel & Co, New Delhi, M/s G D Apte & Co, Mumbai, M/s Lodha and Co, Kolkata, M/s Varma & Varma, Chennai and M/s Khandelwal Jain and Co, Mumbai Chartered Accountants were appointed as joint Statutory Auditors for the financial year2014-15. The Statutory Auditors have been paid a remuneration of `25.01 million (previous year `22.92 million) towards audit fee and certification of Corporate Governance Report.The above fees are exclusive of applicable service ta x and reimbursement of reasonable travelling and out of pocket expenses actually incurred.
34. Auditors’ Report on the Accounts
The Comments of Comptroller & Auditor General of India (C&AG) form part of this Report and are at tached as per Annexure-‘G’. There is no qualification in the Auditors Report and there are no supplementary comments by C&AG under section 143(6)(b) of the Companies Act, 2013 on the Financial Statements of the Company. Notes to the Accounts referred to in the Auditors Report are self-explanatory and therefore do not call for any further comments. You would be pleased to know that your Company has received Nil comments from C&AG and Statutory Auditors for the year 2014-15. This is the ninth year in a row that the

Board's Report
79
organization has received Nil comments.
35. COST AUDIT
Six firms of Cost Accountants were appointed as Cost Auditors for auditing the cost accounts of your Company
stfor the year ended 31 March, 2015 by the Board of Directors. The Cost Audit Report for the year 2013-2014 has been filed under XBRL mode on 25.09.2014 which was well within the due date of filing (i.e.30.09.2014).
36. DIRECTORS
POLICY ON DIRECTORS’ APPOINTMENT ETC.
ONGC being a Government Company, the provisions of section 134(3)(e) of the Companies Act, 2013 shall not apply in view of the Gazette notification dated 05.06.15 issued by Government of India, Ministry of Corporate Af fairs.
PERFORMANCE EVALUATION
ONGC being a Government Company, the provisions of section 134(3)(p) of the Companies Act, 2013 shall not apply in view of the Gazette notification dated 05.06.15 issued by Government of India, Ministry of Corporate Af fairs.
APPOINTMENTS / CESSATION ETCstSince the 21 Annual General Meeting held on
19.09.2014, Shri P Uma Shankar, Shri S. Ravi and Shri R.K. Singh (Independent Directors) vacated their of fice on 19.09.2014 (FN) in terms of Section 161 of the Companies Act, 2013. The tenure of Prof. Samir Kumar Barua and Shri Om Prakash Bhatt (Independent Directors) concluded on 13.12.2014.
On being appointed as Managing Director of ONGC Videsh Ltd, Shri N K Verma relinquished the charge of Director (Exploration), ONGC on 27.08.2014. Shri U.P. Singh, Additional Secretary (Exploration), Ministry of Petroleum & Natural Gas, joined the Board as Government nominee Director on 16.10.2014 in place of Shri Aramane Giridhar. Shri A.K. Diwivedi took over as Director (Exploration) on 16.03.2015.Shri A. K. Banerjee, relinquished the charge of the post of Director (Finance) on attaining the age of retirement on 30.04.2015. Ms. Atreyee Das was appointed as Government Nominee Director on 14.05.2015.
On being appointed as Secretary, Department of School Education and Literacy, Dr. S.C. Khuntia, Special Secratary, MoP&NG and Government nominee resigned from the Directorship of ONGC on 26.06.2015. Shri Ashok Varma, Director (Onshore) relinquished the charge of Director (Onshore) on 31.07.2015 on at taining the age of superannuation and Shri V P Mahawar, who has been appointed as Director
(Onshore) by Ministry of Petroleum & Natural Gas, Government of India, took over charge on 01.08.2015.
The Board places on record its deep appreciation for the excellent contributions made by Shri P. Uma Shankar, Shri S. Ravi, Shri R.K. Singh, Prof. Samir Kumar Barua, Shri Om Prakash Bhatt, Shri N. K. Verma, Shri Aramane Giridhar, Shri A. K. Banerjee, Dr. S.C. Khuntia and Shri Ashok Varma during their tenure.
The strength of the Board of Directors of ONGC as onst1 August, 2015 is 9, comprising 6 Executive Directors
(Functional Directors including CMD) and 3 Non-Executive Directors i.e. two Government nominees and one Independent Director. Ministry of Petroleum & Natural Gas has been requested to appoint requisite number of independent Directors to comply with the provisions of Companies Act, 2013 and Listing Agreement. A total of 13 meetings of the Board of Directors of ONGC were held during the financial year 2014-15.
Details of other Key Managerial Personnel as per Rule 8 (5) (iii) of The Companies (Accounts) Rules, 2014:-
Shri A. K. Srinivasan was appointed as Chief Financial Of ficer w.e.f.06.05.2015 and as Key Managerial Personnel w.e.f. 28.05.2015.
Shri N. K. Sinha, Company Secretary superannuated on 30.06.2015 on at taining the age of retirement. ShriV. N. Murthy took over as Company Secretary on 01.07.2015.
37. Acknowledgement
Your Directors are highly grateful for all the help, guidance and support received from the Ministry of Petroleum and Natural Gas, Ministry of Finance, DPE, MCA, MEA, and other agencies in Central and State Governments. Your Directors acknowledge the constructive suggestions received from Statutory Auditors and Comptroller & Auditor General of India and are grateful for their continued support and cooperation.
Your Directors thank all share-owners, business partners and members of the ONGC Family for their faith, trust and confidence reposed in ONGC.
Your Directors wish to place on record their sincere appreciation for the unstinting ef forts and dedicated contributions put in by the ONGCians at all levels, to ensure that the Company continues to grow and excel.
Place : New DelhistDate : 1 August, 2015
For and on behalf of the Board of Directors
(Dinesh Kumar Sarraf)Chairman & Managing Director

Annual Report 2014-15
Annexure A
80
Annexure AStatement of Reserve Recognition Accounting
REVENUES
OIL 8,113,662.86 7,734,063.16 4,114,068.01 3,910,315.59
GAS 2,981,806.99 2,873,072.70 1,683,557.09 1,542,824.81
Total Revenues 11,095,469.85 10,607,135.86 5,797,625.10 5,453,140.40
COSTS
Operating, Selling & General 5,833,860.17 5,939,970.51 3,019,204.07 3,005,596.27
Corporate Tax 1,284,320.22 1,096,766.14 733,915.96 629,125.12
Sub Total 7,118,180.39 7,036,736.65 3,753,120.03 3,634,721.39
Evaluated Cost of Acquisition of
Assets and Development
a) Assets 300,740.03 276,898.40 132,843.03 115,933.69
b) Development * 898,516.03 831,831.75 340,752.48 255,798.00
Sub Total 1,199,256.06 1,108,730.15 473,595.51 371,731.69
Total Cost 8,317,436.45 8,145,466.80 4,226,715.54 4,006,453.08
Net future earnings from Proved
Reserves
2,778,033.40 2,461,669.06 1,570,909.56 1,446,687.32
Standardised measure of Discounted Future Net Cash Flows relating to Proved Oil and Gas Reserve quantities as on st31 March, 2015.
Particulars Gross Value as at Present value (Discounted at 10%) as at
st31 March, 2015 st31 March, 2014 st31 March, 2015 st31 March, 2014
Notes
1) The Revenues on account of crude oil & gas have been worked out on the basis of average price (net of profit Petroleum) for the year 2014-15. The average price for crude oil is net of Subsidy Discount.
2) Expenditure on Development, Acquisition of capital assets, Abandonment costs and Operating Expenditure have been considered at current costs i.e as on on 31.03.2015. Taxes and Levies have been considered at prevailing rates as on 31.03.2015.
3) The reserves have been estimated by ONGC's Reserve Estimates Commit tee following the standard international reservoir engineering practices.
4) Only Proved Reserves of ONGC share have been considered. Probable or Possible reserves have not been considered.
5) Both revenues and costs have been discounted to present value using 10% discounting factor. The Net future earnings, therefore, represent the net expected future cash inflows from production of recoverable reserves of crude oil and gas.
6) However, neither the estimated net reserves nor the related present value should be taken as a forecast of future cash flows or value of these reserves because (a) future estimated production schedules used in the valuation process are subject to change, (b) up-gradation of Probable and Possible reserves would significantly af fect the gross and net present value of the expected future cash inflows, (c) future crude oil and natural gas prices are subject to change and (d) future expenditure on production (operating), development, acquisition cost of capital assets, abandonment costs and rates of taxes and levies, which may be at variance from those assumed herein.
(` in million)
* Includes Abandonment Cost

Annexure B (AOC-2)
81
(Pur
suan
t to
clau
se (h
) of s
ub-s
ecti
on (3
)of s
ecti
on 1
34 o
f the
Act
and
Rul
e 8(
2) o
f the
Com
pani
es (A
ccou
nts)
Rul
es, 2
014)
Form
fo
r di
sclo
sure
of
pa
rtic
ular
s of
co
ntra
cts/
arra
ngem
ents
en
tere
d in
to
by
the
com
pany
w
ith
rela
ted
part
ies
refe
rred
to
in
su
b-se
ctio
n (1
) of
se
ctio
n 18
8 of
th
e C
ompa
nies
A
ct, 2
013
incl
udin
g ce
rtai
n ar
ms
leng
th tr
ansa
ctio
ns u
nder
thir
d pr
ovis
o th
eret
o
For
m N
o. A
OC
-2
1O
NG
C T
ripur
a P
ower
Co.
Lim
ited
Join
t ven
ture
Ent
itie
sS
ale
of G
asfo
r FY
14-
15A
s pe
r G
as p
rice
fixe
d by
gov
t 3
,247
.91
2O
NG
C T
eri B
iote
ch L
imit
edJo
int v
entu
re E
ntiti
esH
iring
of
Bio
rem
idai
l ser
ves
for
FY 1
4-15
Tend
er b
asis
244
.72
3D
ahej
SEZ
Ltd
Join
t ven
ture
Ent
ities
Leas
e re
nt
for
FY 1
4-15
Mar
ket r
ate
8.6
0
4D
ahej
SEZ
Ltd
Leas
e la
ndfo
r FY
14-
15M
arke
t rat
e 1
0.44
5M
anga
lore
SEZ
Lim
ited
Join
t ven
ture
Ent
ities
Trav
el e
xp o
f O
NG
C e
mpl
yee
for
FY 1
4-15
Act
ual
0.3
9
6O
NG
C T
ripur
a P
ower
Co.
Lim
ited
Join
t ven
ture
Ent
ities
Trav
el e
xp o
f O
NG
C e
mpl
yee
for
FY 1
4-15
Act
ual
0.1
7
7O
NG
C P
etro
-add
itio
ns L
imit
edJo
int v
entu
re E
ntiti
esM
anpo
wer
dep
utat
ion/
othe
rM
isc.
ser
vice
s pr
ovid
ed to
OP
aLfo
r FY
14-
15A
ctua
l 1
25.9
4
8O
NG
C T
eri B
iote
ch L
imit
edJo
int v
entu
re E
ntiti
esLa
b te
stin
g fa
cilit
y pr
ovid
ed to
OTB
Lfo
r FY
14-
15M
arke
t rat
e 0
.15
9P
etro
net L
NG
Lim
ited
Join
t ven
ture
Ent
ities
ON
GC
nom
inat
ed d
irec
tor
Sit
ting
Fee
for
FY 1
4-15
Act
ual
0.0
5
10O
NG
C M
anga
lore
Pet
roch
emic
als
Lim
ited
Man
pow
er d
eput
atio
n to
OM
PL
for
FY 1
4-15
Act
ual
6.4
4
11O
NG
C T
ripur
a P
ower
Co.
Lim
ited
Join
t ven
ture
Ent
ities
Adv
ance
& A
dmin
ista
tive
supo
rtfo
r C
OD
of
uni
t-2
for
FY 1
4-15
Act
ual
125
.82
12P
etro
net L
NG
Lim
ited
Join
t ven
ture
Ent
ities
Div
iden
d In
com
efo
r FY
14-
15A
ctua
l 1
87.5
0
13O
NG
C P
etro
-add
itio
ns L
imit
edJo
int v
entu
re E
ntiti
esFr
esh
adva
ce a
nd R
ight
sha
re to
OP
aLfo
r FY
14-
15 7
,505
.52
14O
NG
C T
ripur
a P
ower
Co.
Lim
ited
Join
t ven
ture
Ent
ities
Fres
h ad
vanc
e an
d R
ight
sha
reto
OTP
Cfo
r FY
14-
15 4
,645
.36
15O
NG
C P
etro
-add
itio
ns L
imit
edJo
int v
entu
re E
ntiti
esR
efun
d of
old
adv
ance
of
equi
tysh
are
by O
PaL
for
FY 1
4-15
6,7
09.2
4
16O
NG
C T
ripur
a P
ower
Co.
Lim
ited
Join
t ven
ture
Ent
ities
Ref
und
of o
ld a
dvan
ce o
f eq
uity
shar
e by
OTP
Cfo
r FY
14-
15 2
,925
.10
17M
RP
LS
ubsi
diar
yS
ale
of c
rude
oil
for
FY 1
4-15
Cru
de o
il at
mar
ket r
ate
38,
486.
88
18M
RP
LS
ubsi
diar
yLe
ase
of O
ffic
e sp
ace
atM
umba
ifo
r FY
14-
15M
arke
t rat
e 4
.60
Join
t ven
ture
Ent
ities
Sub
sidi
ary
(a)
Nam
e (s
) of
the
rela
ted
part
y an
d na
ture
of r
elat
ions
hip
(a)
Nam
e (s
) of
the
rela
ted
part
y an
d na
ture
of r
elat
ions
hip
(b)
Nat
ure
of
cont
ract
s/ar
rang
emen
ts/
tran
sact
ions
(b)
Nat
ure
of
cont
ract
s/ar
rang
emen
ts/
tran
sact
ions
(c)
Dur
atio
n of
the
cont
ract
s/ar
rang
emen
ts/
tran
sact
ions
(c)
Dur
atio
n of
the
cont
ract
s/ar
rang
emen
ts/
tran
sact
ions
Nam
e
Nam
e
2. D
etai
ls o
f m
ater
ial c
ontr
acts
or
arra
ngem
ent
or t
rans
acti
ons
at a
rm’s
leng
th b
asis
SI.
no.
SI.
no.
Sal
ient
ter
ms
Sal
ient
ter
ms
Tran
sact
ion
valu
e(R
s. in
mill
ion)
Tran
sact
ion
valu
e(R
s. in
mill
ion)
(e)
Dat
e (s
)of
app
rova
lby
the
B
oard
, if
any:
(e)
Dat
e (s
)of
app
rova
lby
the
B
oard
,if
any
:
(f)
Am
ount
pa
idas
adv
ance
s,if
any
(f)
Am
ount
pa
idas
adv
ance
s,if
any
(g)
Am
ount
paid
as
adva
nces
,if
any:
Rel
atio
nshi
p
Rel
atio
nshi
p
(d)
Sal
ient
ter
ms
of t
he c
ontr
acts
or
(d)
Sal
ient
term
s of
the
cont
ract
s or
arra
ngem
ents
or
tran
sact
ion
incl
udin
gth
e va
lue
, if
any
(h)
Dat
e on
whi
ch th
e sp
ecia
l res
olut
ion
was
pa
ssed
in g
ener
al
me
etin
g as
req
uire
d un
der
first
pro
viso
to
sect
ion
188
NIL
Annexure - B

Annual Report 2014-15
Annexure B (AOC-2)
82
19M
RP
LS
ubsi
diar
yM
anpo
wer
dep
utai
onfo
r FY
14-
15A
s pe
r ac
tual
14.
65
20M
RP
LS
ubsi
diar
yP
urch
ase
of r
etai
l pro
duct
for
OV
Lfo
r FY
14-
15de
aler
mar
ket r
ate
44.
11
21M
RP
LS
ubsi
diar
yP
urch
ase
of P
OL
for
inte
rnal
use
for
FY 1
4-15
mar
ket r
ate
9.4
1
22M
RP
LS
ubsi
diar
yIn
tere
st In
com
efo
r FY
14-
15 4
,763
.57
23 P
awan
Han
s Lt
d (P
HL)
Ass
ocia
tes
Hiri
ng o
f he
licop
ter
serv
ices
for
FY 1
4-15
564
.89
24 P
awan
Han
s Lt
d (P
HL)
Ass
ocia
tes
Hiri
ng o
f M
aint
enan
ce s
ervi
ces
from
PH
L fo
r ow
n he
licop
ter
for
FY 1
4-15
6.6
3
25 P
awan
Han
s Lt
d (P
HL)
Ass
ocia
tes
Ded
uctio
n of
Ld
on h
iring
cont
ract
for
FY 1
4-15
actu
al 4
.69
26 P
awan
Han
s Lt
d (P
HL)
Ass
ocia
tes
Div
iden
d in
com
efo
r FY
14-
15ac
tual
37.
80
27 P
awan
Han
s Lt
d (P
HL)
Ass
ocia
tes
Inte
rest
inco
me
for
FY 1
4-15
actu
al 6
4.51
28O
NG
C P
etro
-add
itio
ns L
imit
edJo
int v
entu
re E
ntit
ies
Par
ents
und
erta
king
toB
ank
on b
ehal
f of
JV
Efo
r FY
14-
15ac
tual
73,
926.
47
29O
NG
C T
ripur
a P
ower
Co.
Lim
ited
Join
t ven
ture
Ent
itie
sP
aren
ts u
nder
taki
ng to
Ban
k on
beh
alf
of J
VE
for
FY 1
4-15
actu
al 1
5,02
9.32
30O
NG
C M
anga
lore
Pet
roch
emic
als
Lim
ited
of
JVE
31O
NG
C V
ides
h Lt
dG
uara
ntee
s fo
r fin
anci
al
oblig
atio
n in
fav
our
of N
atio
nal o
il05
.03.
2007
com
pany
of
Liby
a
32O
NG
C V
ides
h Lt
dG
uara
ntee
s fo
r fin
anci
alob
ligat
ion
in f
avou
r of
IDB
ITr
uste
eshi
p se
rvic
es L
imit
ed
33O
NG
C V
ides
h Lt
dG
uara
ntee
s fo
r fin
anci
alob
ligat
ion
in f
avou
r of
Hes
sC
orpo
ratio
n fo
r A
zeri
and
Chi
raf
Fiel
ds
34O
NG
C V
ides
h Lt
dG
uara
ntee
s fo
r fin
anci
alob
ligat
ion
in f
avou
r of
Ana
dark
o m
illio
n)
35O
NG
C V
ides
h Lt
dG
uara
ntee
s fo
r fin
anci
alob
ligat
ion
in fa
vor
of P
etro
bang
la 2
7.03
.201
4 (
120
2.69
mill
ion)
36O
NG
C V
ides
h Lt
dG
uara
ntee
s fo
r fin
anci
alob
ligat
ion
in fa
vour
of P
etro
bang
la 2
7.03
.201
4(
2029
.54
mill
ion)
Mee
ting
37O
NG
C V
ides
h Lt
dG
uara
ntee
s fo
r fin
anci
alob
ligat
ion
in f
avou
r of
Cit
ivic
Nom
inee
s Lt
d (M
ozam
biq)
m
illio
n)
Join
t ven
ture
Ent
itie
sP
aren
ts u
nder
taki
ng to
for
FY 1
4-15
actu
al 2
5,08
0.00
B
ank
on b
ehal
f
rdS
ubsi
diar
yef
fect
ive
from
G
uara
ntee
am
ount
1,5
66.0
0 16
3 B
oard
(`
3821
.04
mee
ting
mill
ion)
nd
Sub
sidi
ary
effe
ctiv
e fr
omG
uara
ntee
am
ount
3
,773
.58
182
Boa
rd
31.1
2.20
09(`
400
0.00
Mee
ting
mill
ion)
th
Sub
sidi
ary
effe
ctiv
e fr
om
Gua
rant
ee a
mou
nt
50,
770.
6323
7B
oard
27.0
3.20
13(`
507
70.6
3M
eetin
g m
illio
n)
thS
ubsi
diar
yef
fect
ive
from
G
uara
ntee
am
ount
1
11,3
74.8
6 24
9 B
oard
08
.02.
2014
(` 1
1137
4.86
Mee
ting th
S
ubsi
diar
yef
fect
ive
from
Gua
rant
ee a
mou
nt 1
,202
.69
254
`B
oard
M
eetin
g th
Sub
sidi
ary
effe
ctiv
e fr
omG
uara
ntee
am
ount
2
,029
.54
254
`B
oard
th
S
ubsi
diar
yef
fect
ive
from
Gua
rant
ee a
mou
nt
47,
300.
55
249
Boa
rd15
.07.
2014
(` 4
7300
.55
Mee
ting
(a)
Nam
e (s
) of
the
rela
ted
part
y an
d na
ture
of r
elat
ions
hip
(b)
Nat
ure
of
cont
ract
s/ar
rang
emen
ts/
tran
sact
ions
(c)
Dur
atio
n of
the
cont
ract
s/ar
rang
emen
ts/
tran
sact
ions
Nam
e
SI.
no.
Sal
ient
ter
ms
Tran
sact
ion
valu
e(R
s. in
mill
ion)
(e)
Dat
e (s
)of
app
rova
lby
the
B
oard
, if
any:
(f)
Am
ount
pa
idas
adv
ance
s,if
any
Rel
atio
nshi
p
(d)
Sal
ient
ter
ms
of t
he c
ontr
acts
or
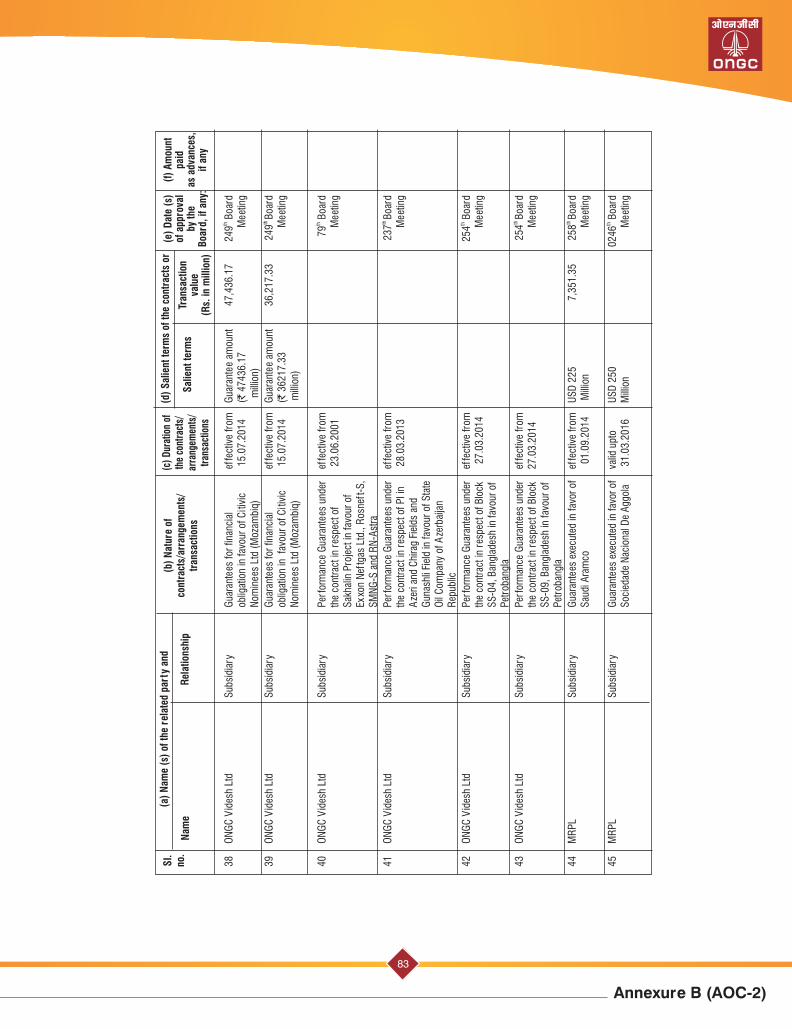
Annexure B (AOC-2)
83
38O
NG
C V
ides
h Lt
dG
uara
ntee
s fo
r fin
anci
alob
ligat
ion
in f
avou
r of
Cit
ivic
Nom
inee
s Lt
d (M
ozam
biq)
mill
ion)
39O
NG
C V
ides
h Lt
dG
uara
ntee
s fo
r fin
anci
alob
ligat
ion
in
of
Cit
ivic
Nom
inee
s Lt
d (M
ozam
biq)
40O
NG
C V
ides
h Lt
dP
erfo
rman
ce G
uara
ntee
s un
der
the
cont
ract
in r
espe
ct o
fS
akha
lin P
roje
ct in
fav
our
ofEx
xon
Nef
tgas
Ltd
., R
osne
ft-S
,S
MN
G-S
and
RN
-Ast
ra
41O
NG
C V
ides
h Lt
dP
erfo
rman
ce G
uara
ntee
s un
der
the
cont
ract
in r
espe
ct o
f P
I in
Aze
ri an
d C
hira
g Fi
elds
and
Gun
ashl
i Fie
ld in
fav
our
of S
tate
Oil
Com
pany
of
Aze
rbai
jan
Rep
ublic
42O
NG
C V
ides
h Lt
dP
erfo
rman
ce G
uara
ntee
s un
der
the
cont
ract
in r
espe
ct o
f B
lock
SS
-04,
Ban
glad
esh
in f
avou
r of
Pet
roba
ngla
43O
NG
C V
ides
h Lt
dP
erfo
rman
ce G
uara
ntee
s un
der
the
cont
ract
in r
espe
ct o
f B
lock
SS
-09,
Ban
glad
esh
in f
avou
r of
Pet
roba
ngla
44M
RP
LG
uara
ntee
s ex
ecut
ed in
fav
or o
fS
audi
Ara
mco
01.
09.2
014
Mill
ion
45M
RP
LG
uara
ntee
s ex
ecut
ed in
fav
or o
fS
ocie
dade
Nac
iona
l De
Agg
ola
31.
03.2
016
Mill
ion
thS
ubsi
diar
yef
fect
ive
from
Gua
rant
ee a
mou
nt 4
7,43
6.17
24
9 B
oard
15.
07.2
014
(` 4
7436
.17
Mee
ting
th
Sub
sidi
ary
effe
ctiv
e fr
omG
uara
ntee
am
ount
36,
217.
3324
9B
oard
fav
our
15.
07.2
014
(` 3
6217
.33
Mee
ting
mill
ion)
thS
ubsi
diar
yef
fect
ive
from
79 B
oard
2
3.06
.200
1 M
eetin
g
th
Sub
sidi
ary
effe
ctiv
e fr
om23
7B
oard
2
8.03
.201
3 M
eetin
g
thS
ubsi
diar
yef
fect
ive
from
254
Boa
rd
27.
03.2
014
Mee
ting
th
Sub
sidi
ary
effe
ctiv
e fr
om25
4B
oard
27
.03.
2014
Mee
ting
th
Sub
sidi
ary
effe
ctiv
e fr
omU
SD
225
7,3
51.3
5 25
8B
oard
M
eetin
g
thS
ubsi
diar
yva
lid u
pto
US
D 2
50
0246
Boa
rdM
eetin
g
(a)
Nam
e (s
) of
the
rel
ated
par
ty a
nd(b
) N
atur
e of
co
ntra
cts/
arra
ngem
ents
/tr
ansa
ctio
ns
(c)
Dur
atio
n of
the
cont
ract
s/ar
rang
emen
ts/
tran
sact
ions
Nam
e
SI.
no.
Sal
ient
ter
ms
Tran
sact
ion
valu
e(R
s. in
mill
ion)
(e)
Dat
e (s
)of
app
rova
lby
the
B
oard
, if
any:
(f)
Am
ount
pa
idas
adv
ance
s,if
any
Rel
atio
nshi
p
(d)
Sal
ient
ter
ms
of t
he c
ontr
acts
or

Annual Report 2014-15
Annexure C
84
ONGC conducts its business as a responsible corporate citizen and believes in holistic approach towards all issues pertaining
to People, Planet and Profit for a sustainable development and better future. ONGC is commit ted to achieve inclusive growth of
the marginalized and deprived sections of the society through its various CSR initiatives across the country.
ONGC has devised its Corporate Social Responsibility (CSR) and Sustainability Policy in consonance with the CSR Policy
framework enshrined in Section 135 of the Companies Act, 2013 (Act), Companies (CSR Policy) Rules, 2014 (Rules) notified by
Ministry of Corporate Af fairs, Government of India and Guidelines on Corporate Social Responsibility and Sustainability for
Central Public Sector Enterprises issued by Department of Public Enterprises, Government of India (DPE Guidelines, 2014) stwhich are ef fective from 1 April 2014.
This policy applies to all CSR projects and programmes undertaken by ONGC as per interpretation of activities listed in
Schedule-VII of the Act, within the geographical limits of India, particularly towards the benefits of marginalized, disadvantaged,
poor and deprived sections of the society and the environment.
As per the policy, projects and programmes are identified and budgets allocated for them through a process that includes
identification of suitable implementation agencies, need assessment (where ever required) and clear roadmap of desired
outcomes. The CSR projects, programmes and initiatives to be undertaken, must fall within the purview of the Schedule – VII of
the Act (as modified from time to time).
The CSR projects entail Need Based Assessment or Baseline survey to determine the feasibility of the project. The objectives in
identifiying sectors and geographies are quite specific and tangible. A detailed project report of the identified project is devised
with determining of time lines with clear identification of the goals. The annual budget is to be allocated for activities in all focused
areas ensuring adherence to Schedule VII of the Act.
The project approach mandates clearly identifying the beneficiaries. Post approval, agreements are being signed with the
implementing agency prior to implementation of the project. During the implementation phase, the project is periodically
reviewed and monitored. Evaluation & Assessment, preferably both concurrent and final (wherever possible, by a competent
third party) are carried out to ensure the project achieves the desired goals.
The focus areas and budget allocation for CSR projects, programmes and activities are made by the Commit tee on CSR and
Sustainable Development in the beginning of every financial year.
20% of the total budget are allocated in each of the five sectors as detailed below:
• Promoting health care including preventative health care and sanitation and making available safe drinking water.
• Promoting education including special education and employment enhancing vocation skills especially among children,
women, elderly and the dif ferently abled and livelihood enhancement projects
• Ensuring environmental sustainability, ecological balance, protections of flora and fauna, animal welfare, agro forestry,
conservation of natural resources and maintaining quality of soil, air and water
• Rural development projects
• Miscellaneous - Setting up homes and hostels for women and orphans; set ting up old age homes, day care centres and
other such facilities for senior citizens; Protection of national heritage, art and culture including restoration of buildings and
sites of historical importance and works of art; set ting up public libraries; promotion and development of traditional arts and
handicraf ts; Training to promote rural sports, regionally recognised sports, Paralympics sports and Olympic sports; Other
areas mentioned in Schedule - VII
The links to ONGC CSR and SD activities and a host of policies directed towards the betterment of disadvantaged, vulnerable
and marginalised sections of stakeholders have been hosted on ONGC website www.ongcindia.com.
Report on CSR ActivitiesAnnexure - C

Annexure C
85
The ONGC CSR commit tee presently comprises Shri D. K. Sarraf, CMD, ONGC and Shri D. D. Misra, Director (HR), ONGC, under
the chairmanship of Shri K. N. Murthy, Independent Director.
However, as per the approved CSR policy two more members i.e. Director (Finance), ONGC and an additional Independent
Director will be members of the Commit tee. Presently these two posts are vacant.
ONGC’s average net profit under Section 135 of the Act in the last three financial years was 33,030 crore wherein the profit of
the company as per Section 198 was 34,716.61 crore, 31,935.27 crore and 32,440.25 crore in financial years 2011-12, 2012-
13 and 2013-14 respectively.
The CSR expenditure for FY 2014-15 was pegged at `660.61crore, 2% of the average profits (u/s 135) for the last three years.
However, ONGC registered an expenditure of `495.23 crore during FY 2014-15. The reasons for under-spending have been
detailed in the Board’s report. The major CSR initiatives taken up during the financial year 2014-15 have also been detailed in the
Board’s report. The manner in which the amount was spent during 2014-15 is detailed in the Enclosure.
Responsibility Statement
This is to certify that the implementation and monitoring of the CSR Policy in respect of all projects/programs covered
under CSR initiatives for the year 2014-15, is in compliance with CSR objectives and Policy of the company
Sd/-
(D. K. Sarraf)
CMD
Member, CSR Committee
Sd/-
(K. N. Murthy)
Independent Director
Chairman, CSR Committee

Annual Report 2014-15
Annexure C
86
1H
ealt
h ca
re13
2.12
35,7
7,58
,278
35,7
7,58
,278
35,7
7,58
,278
Init
iativ
es f
or p
hysi
cally
and
m
enta
lly c
halle
nged
2Ed
ucat
ion
incl
udin
g V
ocat
iona
l co
urse
s
Entr
epre
neur
ship
(se
lf he
lp a
nd
livel
iho
od)
Wom
en's
em
pow
erm
ent a
nd
girl
child
dev
elop
men
t
3En
viro
nmen
t and
eco
logi
cal
cons
erva
tion
Wat
er m
anag
emen
t inc
ludi
ng
grou
nd w
ater
rec
harg
e
4In
fras
truc
tura
l sup
port
nea
r O
NG
C o
pera
tiona
l are
a
5P
rom
otio
n of
art
isan
s, c
raft
smen
, m
usic
ians
Pro
mot
ing
spor
ts a
nd s
port
s pe
rson
s
Pro
tect
ion
of h
erit
age
site
s1,
57,0
0,00
01,
57,0
0,00
01,
57,0
0,00
0
Sup
port
for
cul
tura
l/spo
rts
even
ts, e
tc.
Tota
l
660.
614,
95,2
2,87
,841
4,95
,22,
87,8
414,
95,2
2,87
,841
3,36
,72,
170
3,36
,72,
170
3,36
,72,
170
132.
1246
,07,
70,2
5046
,07,
70,2
5046
,07,
70,2
50
1,38
,56,
873
1,38
,56,
873
1,38
,56,
873
83,2
3,96
683
,23,
966
83,2
3,96
6
132.
122,
87,4
1,84
,398
2,87
,41,
84,3
982,
87,4
1,84
,398
1,22
,53,
307
1,22
,53,
307
1,22
,53,
307
132.
1293
,86,
76,9
4993
,86,
76,9
4993
,86,
76,9
49
132.
122,
08,8
0,46
32,
08,8
0,46
32,
08,8
0,46
3
1,22
,10,
264
1,22
,10,
264
1,22
,10,
264
20,4
0,00
,923
20,4
0,00
,923
20,4
0,00
,923
CS
R P
roje
ct/
Act
ivit
y
Amou
nt o
utla
y (b
udge
t) p
roje
ct
or p
rogr
am w
ise
in `
Cro
resa
Amou
nt s
pent
on
the
proj
ect o
r pr
ogra
m
Sub
Hea
ds
(1)
Dir
ect e
xpen
ditu
re
on p
roje
cts
or p
rogr
ams
(2)
Ove
rhea
dsAm
ount
in `
Cum
ulat
ive
expe
nditu
re u
pto
th
e re
port
ing
peri
od
Amou
nt in
`
Amou
nt s
pent
: D
irec
t or
thro
ugh
Impl
emen
ting
agen
cy
Amou
nt in
`
SI.
No.
Sec
tor
in w
hich
the
P
roje
ct is
cov
ered
Pro
ject
or
Pro
gram
1. L
ocal
are
a or
oth
er2.
Spe
cify
the
Sta
te
and
Dis
tric
t w
here
pr
ojec
t or
pro
gram
w
as u
nder
take
n
En
clo
su
re t
o A
nn
exu
re -
C
Var
ious
pro
gram
s/pr
ojec
ts h
ave
been
tak
en
up
as
CS
R
init
iativ
e du
ring
Fina
ncia
l ye
ar
2014
-15
on P
AN
Ind
ia B
asis
in
and
arou
nd
ON
GC
’s o
pera
tiona
l ar
eas
and
in b
ack
war
d di
stric
ts o
f var
ious
sta
tes
Annexure - C

Annexure D (Awards)
87
Annexure - DONGC: Awards & Recognitions 2014-15
Corporate Awards
1) ONGC moves three places up on Forbes Global 2000 list (2015) among oil & gas industry
Forbes, a leading international business journal, has rdranked ONGC at 183 among 2000 top global
companies in its latest list published in May, 2015. In the global oil and gas operation industry, ONGC has
thmoved up three places to 18 .
2) ONGC is the top energy company in India as per Platts 250 rankings
ONGC has been ranked as the Top Energy Company in India, in the coveted Plat t’s Top 250 Global Energy Company Rankings 2014 (November, 2014). ONGC has been ranked at 21st place among the global energy majors and 3rd among Exploration & Production Company (E&P).
3) ONGC among world’s greenest companies
thONGC has been ranked 217 in the Newsweek Green Rankings 2014; the world’s most recognized assessments of corporate environmental performance. ONGC made a quantum jump from previous ranking of 386 (Green ranking 2012). The company now stands third amongst only seven Indian companies named in the prestigious list
4) ONGC climbs up to second position on the BT-500 India’s Most Valuable Companies List
ONGC has been placed at the number 2 position in the BT -500 India's Most Valuable Companies list, 2014. ONGC has gained two places over the last year's rankings to take up its highest ever position on the BT 500 list since these rankings were institutionalized in 1992.
5) ONGC bags Dun & Bradstreet Corporate Excellence Award - 2014
ONGC received the prestigious Dun & Bradstreet Corporate Excellence Award, for excellence in the Oil and Gas Production sector. In all there were 46 sectors which were recognized for their excellence and these were chosen among the top 500 companies of India, by the primary yardstick of their contribution to India’s GDP.
6) ONGC Academy conferred with Golden Peacock National Training Award – 2014
ONGC Academy was adjudged the Winner of Golden Peacock National Training Award 2014, by the Institute
rdof Directors. The award was presented on 23 May, 2014. The award was conferred in recognition of the
excellent training practices at each and every level, right from entry level for equipping fresh graduates with the requisite skillsets to leadership development programmes for creating leaders of tomorrow.
7) ONGC ranked among top Indian brands
thONGC has been placed 14 among the best Indian brands in the recent Economic Times- Interbrand ‘Best Indian Brands’ study, 2014. To its credit, ONGC has maintained its position as a top Indian brand despite the company not being in retail business. Most of the other brands listed above ONGC have a direct consumer connection.
8) ONGC awarded the “Most Valuable PSU” by India Today
ONGC was recognized as the “Most Valuable PSU” in the Maharatna category in the India Today Group-MDRA Survey of India’s best PSUs, 2014. It was the first ever survey conducted by the India Today Group, in association with Marketing and Development Research Associates (MDRA).
9) ONGC receives highest sports award ‘Rashtriya Khel Protsahan Puraskar’
President of India presented Rashtriya Khel Protsahan Puraskar to ONGC in the Rashtrapati Bhavan on the
thoccasion of National Sports day on 29 August, 2014. ONGC received the award in the category of ‘Employment of Sports persons and sports welfare measures’.
10) ONGC adjudged Exploration & Production Company of the year – PetroFed Awards
ONGC was adjudged as Exploration & Production – Company of the year at the PetroFed Oil & Gas Industry
thAwards 2013, organized on 8 September, 2014.
11) ONGC received Governance Now PSE Awards 2014
ONGC was conferred awards in two categories- ‘Best Strategic Performance’ and ‘Innovation in Business’ at the Governance Now PSU Awards 2014 in the Maharatna category. ONGC's fully owned subsidiary Mangalore Refinery and Petrochemicals Ltd (MRPL) was also recognized for best ‘Grow th and Competencies’ in the Mini Ratna Class I category.
12) KDMIPE receives two Global Sustainability Awards
KDMIPE secured two major Energy and Environment Foundation Awards during the 5th World Renewable Energy Technology Congress and Expo 2014, organized by Energy and Environment Foundation. The Institute got ‘Global Sustainability Award 2014-

Annual Report 2014-15
Annexure D (Awards)
88
Awards, Recognitions and Accreditions
Hon'ble President of India Shri Pranab Mukherjee presenting the 'Rashtriya Khel Protsahan Puruskar' to ONGC
ONGC CMD Shri D K Sarraf along with ONGC Board of Directors receiving the 'Exploration & ProductionCompany of the year' at the PetroFed Oil & Gas Industry Awards - 2013

Annexure D (Awards)
89
Awards, Recognitions and Accreditions
ONGC bags India's Pride Award for excellence in the Oil and Gas sector; Director (Of fshore)Shri T K Sengupta receiving the Award from Hon'ble Finance Minister Shri Arun Jaitley
ONGC bagged 'Exploration & Production - Company of the year' and Project Management (` 500-2000 crore) at the PetroFed Oil & Gas Industry Awards - 2014. The awards were presented by the Hon’ble Minister of
State (I/C), Petroleum & Natural Gas, Shri Dharmendra Pradhan and Secretary, MoPNG Shri K. D. Tripathi was the Guest of Honour at the award ceremony.

Annual Report 2014-15
Annexure D (Awards)
90
GOLD’, for outstanding achievements in Rainwater Harvesting and Sustainability Management; it also secured ‘Global Sustainability Award 2014 - SILVER’ for outstanding achievements in Management of Energy Ef ficiency and Sustainability.
13) ONGC safety practices recognized at OISD Awards
ONGC secured five awards at the Oil Industry Safety Directory (OISD) Awards ceremony for 2012-13, held at
rdDelhi on 3 December, 2014.
• ONGC’s Tripura Asset bagged the award for ‘BestOnshore Asset’;
• ONGC’s Uran Plant bagged the award for ‘BestProcessing plant’.
• ONGC was also awarded as Best Organisation forits near-miss reporting in the category ‘Exploration& Production Operations’.
• ONGCian Mr. Mangaldas Nikkaram Bhatti wasrecognized for significant contribution towardssafety in individual capacity.
14) O N G C c o n f e r r e d u p o n ‘ O u t s t a n d i n g Accomplishment’ awards at CII-ITC Sustainability Awards
ONGC was bestowed with ‘Outstanding Achievement’ awards under Corporate Excellence at CII-ITC
thSustainability Awards 2014 on 19 December, 2014.
15) World Marketing Congress honors ONGC with ‘Master Brand Award’
The World Marketing Congress has conferred the prestigious Master Brand award to ONGC on
th14 November, 2014. The title of Master Brand is conferred upon those brands that appeal to a large set of consumers while constantly keeping in mind a consumer centric approach.
16) ONGC receives Golden Peacock Award for excellence in CSR
ONGC received the prestigious ‘Golden Peacock Award for Corporate Social Responsibility’ for 2014. ONGC has been declared as the Winner in the Oil & Gas Category.
Individual Awards/Accolades
1) Shri K S Jamestin, ex- Director HR felicitated with ‘Lifetime Achievement Award for Excellence in HR
Mr. K S Jamestin, ex- Director (HR) received the ‘Lifetime Achievement Award for Excellence in HR’ at the Lokmat - HR Leadership Awards, 2014 held in
thMumbai on 28 June, 2014.
2) Shri K S Jamestin, ex- Director HR conferred with ‘Unitop Award’ by IIMM, Mumbai
The Mumbai Chapter of the Indian Institute of Materials Management (IIMM) conferred upon Mr K S Jamestin, ex-Director (HR) the prestigious Unitop Award for Enduring Contribution to Excellence in Supply
thManagement at a function in Mumbai on 28 July, 2014. The Award was conferred in absentia at a function which was graced by top procurement professionals of diverse industries.
3) ONGCian decorated by Prime Minister as National Brand Ambassador
K Kanagaraj of ONGC Cauvery Asset has been honoured as National Brand Ambassador of Vocational Training by Hon’ble Prime Minister NarendraModi.The ONGCian received this honour at a national function organised by Directorate General of Employment & Training (DGE&T) under Ministry of Labour and
thEmployment, Government of India on 16 October, 2014 at New Delhi.
4) ONGCian honored at Prime Minister’s TA Day Parade
Mr. R.S. Meena, SE (Civil), posted in Mehsana, has been awarded Territorial Army (TA) Medal at Prime Minister’s TA Day Parade 2014.
5) National Honours for ONGC Fire Services personnel
The President of India has awarded Fire Service Medal for Meritorious Service to three personnel of ONGC Fire Service - Mr Amitabh Singh, DGM (FS), B&S Asset, Mr S C Gaur, Fire Of ficer Mehsana Asset andMr Kailash Mishra, Chief Fireman, Mehsana Asset, on
th26 January, 2015.

Annexure E (MGT-9)
91
Form No. MGT-9EXTRACT OF ANNUAL RETURN
as on the financial year ended on 31st March, 2015(Pursuant to Section 92 (3) of the Companies Act, 2013 and Rule 12 (1) of the
Companies (Management and Administration) Rules, 2014
I. REGISTRATION AND OTHER DETAILS:
i) CIN:- L74899DL1993GOI054155rdii) Registration Date: 23 Day of June, 1993
iii) Name of the Company: Oil and Natural Gas Corporation Limited
iv) Category/Sub-Category of the Company: Government Company
v) Address of the Registered office and contact details: Jeevan Bharati Building Tower-II, New Delhi-110001.Ph: 23310156, Fax: 23316413
vi) Whether listed company Yes/No: Yes
vii) Name, Address and Contact details of Registrar and Transfer Agent,ifany: M/s Karvy Computershare Pvt. Ltd.
Karvy Selenium Tower B, Plot 31-32, Gachibowli, Financial District, Nanakramguda, Hyderabad-500 032 Ph: 040-67161562 M: +91 040-9177401094 Fax: 040 - 23001153 [email protected], karvy computershare.com
II. PRINCIPAL BUSINESS ACTIVITIES OF THE COMPANY
III. PARTICULARS OF HOLDING, SUBSIDIARY AND ASSOCIATES COMPANIES
SI. No.
SI.
No.
Name and Description of
main products / services
NAME AND ADDRESS OF
THE COMPANY
CIN /GLN HOLDING/SUBSIDIARY/ASSOCIATE
% ofSharesHeld
ApplicableSection
NIC Code of the Product /
service
% total turnover of the
company
1 Crude Oil 27090000 65.17%
2 Natural Gas 27112100 22.75%
1. ONGC Videsh Limited4th Floor, Kailash Building, 26, Kasturba Gandhi Marg,New Delhi-110001 U74899DL1965GOI004343 Subsidiary 100 2(87)
2. Mangalore Refinery and Petrochemicals LimitedKuthethoor P. O., Via Katipalla, Mangalore-575030 L85110KA1988GOI008959 Subsidiary 71.63 2(87)
3. ONGC Mangalore Petrochemicals LimitedMangalore Special Economic Zone Permude,Mangalore – 574 509 U40107KA2006PLC041258 Subsidiary 48.99 2(87)
4 ONGC Petro additions Ltd. 1st floor, Omkara Building, Sai Chowkri, Manjalpur,Vadodara-390011 U23209GJ2006PLC060282 Joint Venture 49.36 2(6)
5 ONGC Tripura Power Co. Ltd. ONGC Tripura Asset, Badarghat Complex, Agar tala,Tripura- 799014 U40101TR2004PLC007544 Joint Venture 49.52 2(6)
6 Mangalore SEZ Limited No. 16, Pranava Park, 3rd Floor, Infantry Road,Bangalore-560001 U45209KA2006PLC038590 Joint Venture 26 2(6)
7 Petronet MHB LimitedNo. 332, Darus Salam Building, First Floor, Queen’sRoad, Banglore-560052 U8511OKA1998PLC024020 Joint Venture 28.77 2(6)
Annexure - E

Annual Report 2014-15
Annexure E (MGT-9)
92
SI.
No.
NAME AND ADDRESS OF
THE COMPANY
Category of
ShareholdersNo. of Shares held at the
beginning of the year%Changeduringthe year
Demat DematPhysical Physical Total Total% of TotalShares
% of TotalShares
No. of Shares held at
the end of the year
CIN /GLN HOLDING /SUBSIDIARY/ASSOCIATE
% ofSharesHeld
ApplicableSection
8 Dahej SEZ Limited (DSL)Block No.14, 3rd Floor, Udyog Bhavan, Sector-11Gandhinagar- 382017, Gujrat U45209GJ2004PLC044779 Joint Venture 50 2(6)
9 ONGC TERI Biotech Ltd TERI Complex,Darbari Seth Block, IHC Complex,Lodhi Road, New Delhi – 110003 U74120DL2007PLC161117 Joint Venture 49.98 2(6)
10 Petronet LNG Limited World Trade Centre, 1st Floor, Babar Road,BarakhambaLane, New Delhi-110001 L74899DL1998PLC093073 Joint Venture 12.50 2(6)
11 Pawanhans LimitedSafdarjung Airpor t, New Delhi-110003 U62200DL1985GOI022233 Associate 49 2(6)
IV. SHARE HOLDING PATTERN (Equity Share Capital Break up as percentage of Total Equity)
i) Category-wise Share Holding
A. Promoters
(1) Indian
a) Individual/ HUF 0 0 0 0.00 0 0 0 0.00 0.00
b) Central Gov t. 5897760333 0 5897760333 68.94 5897760333 0 5897760333 68.94 0.00
c) State Gov t(s) 0 0 0 0.00 0 0 0 0.00 0.00
d) Bodies Corp. 0 0 0 0.00 0 0 0 0.00 0.00
e) Banks/FI 0 0 0 0.00 0 0 0 0.00 0.00
f) Any Other… 0 0 0 0.00 0 0 0 0.00 0.00
Sub-total
(A)(1):-
(2) Foreign
a) NRIs-Individuals 0 0 0 0.00 0 0 0 0.00 0.00
b) Other-Individuals 0 0 0 0.00 0 0 0 0.00 0.00
c) Bodies Corp. 0 0 0 0.00 0 0 0 0.00 0.00
d) Banks/FI 0 0 0 0.00 0 0 0 0.00 0.00
e) Any Other… 0 0 0 0.00 0 0 0 0.00 0.00
Sub-total(A)(2):-
5897760333 0 5897760333 68.94 5897760333 0 5897760333 68.94 0.00
0 0 0 0.00 0 0 0 0.00 0.00

Annexure E (MGT-9)
93
Category of
ShareholdersNo. of Shares held at the
beginning of the year%Changeduringthe year
Demat DematPhysical Physical Total Total% of TotalShares
% of TotalShares
No. of Shares held at
the end of the year
TotalShareholding ofPromoter (A)=A)(1)+(A)(2) 5897760333 0 5897760333 68.94 5897760333 0 5897760333 68.94 0.00
B. PublicShareholding
1. Institutions
a) Mutual Funds 109506969 6300 109513269 1.28 78851027 6300 78857327 0.92 0.36
b) Banks/FI 118893301 60 118893361 1.39 102832805 60 102832865 1.20 0.19
c) Central Gov t 0 0 0 0.00 0 0 0 0.00 0.00
d) State Gov t(s) 0 0 0 0.00 0 0 0 0.00 0.00
e) VentureCapital Funds
f) InsuranceCompanies
g) FIIs 569897010 0 569897010 6.66 614286761 0 614286761 7.18 0.52
h) Foreign VentureCapital Funds 0 0 0 0.00 0 0 0 0.00 0.00
i) Others (specify) 0 0 0 0.00 0 0 0 0.00 0.00
Sub-total(B)(1):-
0 0 0 0.00 0 0 0 0.00 0.00
700903533 5700 700909233 8.19 709625175 5700 709630875 8.29 0.1
1499200813 12060 1499212873 17.52 1505595768 12060 1505607828 17.59 0.07

Annual Report 2014-15
Annexure E (MGT-9)
94
Category of
ShareholdersNo. of Shares held at the
beginning of the year%Changeduringthe year
Demat DematPhysical Physical Total Total% of TotalShares
% of TotalShares
No. of Shares held at
the end of the year
2. Non-Institutions
a) Bodies Corp. 1012048619 9889 1012058508 11.83 995168127 9889 995178016 11.63 0.2i) Indianii) Overseas
b) Individualsi) Individual 121392038 6538805 127930843 1.49 131937061 6154696 138091757 1.61 0.12Shareholdersholding nominalshare capitaluptoRs. 1 lakhii) Individual 4950075 0 4950075 0.06 6009935 0 6009935 0.07 0.01shareholdersholding nominalshare capitalin excess ofRs. 1 lakh
c)Others(specify)
NON RESIDENT 3139708 38594 3178302 0.04 4065652 38594 4104246 0.05 0.01INDIANS
CLEARING 6692525 0 6692525 0.08 3153654 0 3153654 0.04 0.04MEMBERS
TRUSTS 3705165 0 3705165 0.04 5581811 0 5581811 0.07 0.03
FOREIGN 1396 0 1396 0.00 2540 0 2540 0.00 0.00NATIONALS
Sub-total 1151929626 6587288 1158516914 13.54 1145918780 6203179 1152121959 13.47 0.07(B)(2):-
Total Public 2651130439 6599348 2657729787 31.06 2651514548 6215239 2657729787 31.06 0.00Shareholding(B)=(B)(1)+(B)(2)
C. Shares 0 0 0 0.00 0 0 0 0.00 0.00held byCustodian forGDRs & ADRs
Grand Total 8548890772 6599348 8555490120 100.00 8549274881 6215239 8555490120 100.00 0.00(A+B+C)

Annexure E (MGT-9)
95
ii) Shareholding of Promoters
SINo.
No. of Shares
% of totalSharesof theCompany
% of totalSharesof the Company
% ofSharesPledged/encumberd to totalshares
% change in shareholdingduring the year
% ofSharesPledged/encumberd to totalshares
No. ofShares
Shareholder'sname
Shareholding at the beginning ofthe year
Shareholding at the end of the year
1 President of India 5897760333 68.94% --- 5897760333 68.94% -- NIL
Total 5897760333 68.94% --- 5897760333 68.94% -- NIL
iii) Change in Promoters' Shareholding (please specify, if there is no change)
iv) Shareholding Pattern of top ten Shareholders (other than Directors, Promoters and Holders of GDRs and ADRs):(*)
SINo.
SINo.
% of totalSharesof the Company
% of totalSharesof the Company
% of totalSharesof the Company
% of totalSharesof the Company
No. ofShares
No. ofSharesFor each of the top 10
shareholders
No. ofShares
No. ofShares
Shareholding at the beginningof the year
Shareholding at the beginningof the year
Cumulative Shareholdingduring the year
Cumulative Shareholdingduring the year
Date wise Increase/Decrease in Promoters Share holding during the year specifying the reasons for increase/decrease (e.g. allotment/ transfer/ bonus/ sweat equity etc):
At the end of the year
*There is no Change is Promoter's Shareholding.
* Details are placed at Appendix
At the beginning of the year
At the beginning of the year
Date wise Increase/Decrease in Shareholding during the year specifying the reasons for increase/decrease (e.g. allotment/transfer/bonus/sweat equity etc):
At the End of the year (or on the date of separation, if separated during the year)

Annual Report 2014-15
Annexure E (MGT-9)
96
v) Shareholding of Directors and key Managerial Personnel :
SINo.
1. % of totalSharesof the Company
% of totalSharesof the Company
No. ofShares
Shri Dinesh Kumar Sarraf No. ofShares
Shareholding at the beginningof the year
Cumulative Shareholdingduring the year
(A) At the beginning of the year 3192 0.000037 ---- ----
(B) Date wise Increase/Decrease in Share holdingduring the year specifying the reasons forincrease/decrease (e.g. allotment/transfer/bonus/sweat equity etc):
(C) At the End of the year ---- ---- 3192 0.000037
2. Shri Aloke Kumar Banerjee
(A) 3172 0.000037 ---- ----
(B) ---- ---- NIL NIL
(C) ---- ---- 3172 0.000037
3. Shri Shashi Shankar
(A) 3712 0.000043 ---- ----
(B) ---- ---- NIL NIL
(C) ---- ---- 3712 0.000043
4. Shri Narendra Kumar Verma
(A) NIL NIL ---- ----
(B) ---- ---- NIL NIL
(C) ---- ---- NIL NIL
5. Shri Tapas Kumar Sengupta
(A) 3672 0.000043 ---- ----
(B) ---- ---- NIL NIL
(C) ---- ---- 3672 0.000043
6. Shri Jamestin Kizhakkekut tu Scaria
(A) 3600 0.000043 ---- ----
(B) ---- ---- NIL NIL
(C) ---- ---- 3600 0.000043
7. Shri Ashok Varma
(A) NIL NIL ---- ----
(B) ---- ---- NIL NIL
(C) ---- ---- NIL NIL
8. Shri Desh Deepak Misra
(A) 1700 0.000020 ---- ----
(B) ---- ---- NIL NIL
(C) ---- ---- 1700 0.000020
9. Shri Ajay Kumar Dwivedi
(A) 820 0.000010 ---- ----
(B) ---- ---- NIL NIL
(C) ---- ---- 820 0.000010
10. Shri Naresh Kumar Sinha
(A) NIL NIL ---- ----
(B) ---- ---- NIL NIL
(C) ---- ---- NIL NIL
---- ---- NIL NIL

Annexure E (MGT-9)
97
v) INDEBTEDNESS
vi) REMUNERATION OF DIRECTORS AND KEY MANAGERIAL PERSONNEL
Indebtedness of the Company including interest outstanding/accrued but not due for payment
A. Remuneration to Managing Director, Whole-time Director and / or Manager :
Secured Loans excluding deposits
Unsecured Loans Deposits Totalindebtedness
Indebtedness at the beginning ofthe financial yeari) Principal Amountii) Interest due but not paidiii) Interest accrued but not due NIL NIL NIL NIL
Total (i+ii+iii) NIL NIL NIL NIL
Change in Indebtedness during the financial year• Additions• Reduction NIL NIL NIL NIL
Net Change NIL NIL NIL NIL
Indebtedness at the end of the financial yeari) Principal Amountii) Interest due but not paidiii) Interest accrued but not due NIL NIL NIL NIL
Total (i+ii+iii) NIL NIL NIL NIL
Particulars of Remuneration
Shri DineshKumarSarraf
C&MD DIR. (FIN) DIR. (HR) DIR. (HR)DIR.(EXPL.)
DIR.(EXPL.)
DIR (T&FS) DIR (OFFSHORE)
DIR (ONSHORE)
Shri A.K.Banerjee
Shri K.S.Jamestin
Shri N.K.Verma
ShriShashishanker
Shri T.K.Sengupta
Shri AshokVarma
Shri D.D.Misra
Shri A.K.Dwivedi
TotalAmount
Name of MD/WTD / Manager
Gross salary
(a) Salary as perprovisions containedin section 17(1) of theIncome-tax Act, 1961 36,96,218 31,33,439 50,50,838 12,73,469 31,29,204 39,31,970 27,65,590 27,72,267 8,55,858 2,66,08,853
(b) Value of perquisi tesu/s 17(2) Income-taxAct, 1961 2,53,225 6,88,093 6,32,011 61,230 6,56,520 7,20,826 1,86,436 4,01,274 44,418 36,44,033
(c) Profi ts in lieu ofsalary under section17(3) Income-tax Act,1961 - - - - - - - - -
Stock Option - - - - - - - - -
Sweat Equity - - - - - - - - -
Commission - - - - - - - - -
- As % of profi t - - - - - - - - -
- Others, specify.. - - - - - - - - -
Others, please specify - - - - - - - - -
Others-Provision forPRP, gratuity ,leaveencashment under AS-15,Contribution to CSSS,PF,EPS , reimbursement ofemployer paid taxes,reimbursements notincluded under 17(2) 22,01,659 19,08,949 6,50,280 14,07,070 17,28,754 18,33,980 13,02,055 11,56,847 97,689 1,22,87,282
Total (A) 61,51,102 57,30,482 63,33,129 27,41,770 55,14,478 64,86,776 42,54,080 43,30,388 9,97,965 4,25,40,168
Ceiling as per the Act Not applicable as section 197 of Companies Act, 2013 shall not apply to Government Companies.
(Figures in `)

Annual Report 2014-15
Annexure E (MGT-9)
98
B. Remuneration to other directors:
C. REMUNERATION TO KEY MANAGERIAL PERSONNEL OTHER THAN MD/MANAGER/WTD
Particulars of Remuneration
Particulars of Remuneration
SI.No.
SI.No.
Shri ArunRamananthan
ProfDeepakNayyar
Prof.S.K. Barua
Shri O.P.Bhat t
Shri. K.N.Murthy
Shri P. UmaShankar
Shri S. Ravi Shri R.K.Singh
TotalAmount
Name of Directors
Key Managerial Personnel
CEOCompanySecretary
CFO Total
1. Independent Directors• Fee for at tending board 1,80,000 1,20,000 7,20,000 6,60,000 10,20,000 4,80,000 5,20,000 1,00,0000 38,00,000commit tee meetings
• Commission NIL NIL
• Others, please specify
Total (1) 38,00,000
2 Other Non-Executive Directors
• Fee for at tending boardcommit tee meetings
• Commission
• Others, please specify
Total (2) NIL
Total (B)=(1+2)
Total ManagerialRemuneration
Overall Ceiling as per the Act
NIL NIL NIL NIL NIL NIL NIL
NIL NIL NIL NIL NIL NIL NIL NIL NIL
38,00,000
1 Gross salary
(a) Salary as per provisions contained in Section 17(1) of the Income-tax Act, 1961 - 37,18,365 - 37,18,365
(b) Value of perquisi tes u/s 17(2) Income-tax Act, 1961 - 2,34,258 - 2,34,258
(c) Profi ts in lieu of salary under Section 17(3) Income-tax Act, 1961 - - - -
2 Stock Option - - - -
3 Sweat Equity - - - -
4 Commission
- As % of profi t - - - -
- Others, specify.. - - - -
5 Others-Provision for PRP, Provisions under AS-15,Contribution to CSSS,PF,EPS,reimbursement of employer paid taxes, reimbursements not included under 17(2) - - 10,44391
Total - -
10,44,391
49,97,014 49,97,014
(Figures in `)
(Figures in `)

Annexure E (MGT-9)
99
vii) PENALTIES / PUNISHMENT / COMPOUNDING OF OFFENCES:
Details of Penalty/Punishment/
Compounding feeimposed
Authority (RD/NCLT/NCLT/COURT)
Deposits
A. COMPANY
Penalty
Punishment NIL NIL NIL NIL
Compounding
B. DIRECTORS
Penalty
Punishment
Compounding
C. OTHEROFFICERS INDEFAULT
Penalty
Punishment
Compounding
NIL
NIL NIL NIL NIL NIL
NIL NIL NIL NIL NIL
Type Section of theCompanies Act
Brief Description
Shri Dharmendra Pradhan, Hon’ble Minister of State (I/C), Petroleum & Natural Gas (center) and Shri Kapil Dev Tripathi, Secretary - MoPNG (lef t) with ONGC board of Directors on-board drilling vessel 'Chikyu' commissioned as part of the National Gas Hydrates Programme (NGHP). 'Chikyu' is an advanced scientific vessel specifically designed for Gas Hydrate core handling, analysis and various onboard laboratory studies for gas hydrate characterization.

Annual Report 2014-15
Annexure E (MGT-9)
100
APPENDIX
(iv) Shareholding Pattern of top ten Shareholders (other than Directors, Promoters and Holders of GDRs and ADRs):
SI.
No.
LIFE INSURANCE CORPORATION OF INDIA No. of
shares
No. of
shares
% of total
share of the
company
% of total
share of the
company
Shareholding at the
beginning of the year
Cumulative Shareholding
during the year
(A) At the beginning of the year 666,702,623 7.79 ---- ---(B) Date wise Increase/Decrease in Shareholding during the year specifying the reasons for increase/decrease(e.g. allotment/transfer/bonus/sweat equity etc):
Date Reason
6/13/2014 Sold 495000 ---- ---- 666,207,623 7.79
6/20/2014 Sold 866 ---- ---- 666,206,757 7.79
7/25/2014 Sold 1112070 ---- ---- 665,094,687 7.77
8/1/2014 Sold 20599 ---- ---- 665,074,088 7.77
8/8/2014 Sold 1001006 ---- ---- 664,073,082 7.76
8/15/2014 Sold 1443291 ---- ---- 662,629,791 7.75
8/22/2014 Sold 3787067 ---- ---- 658,842,724 7.70
12/19/2014 Purchase 73250 ---- ---- 658,915,974 7.70
1/9/2015 Purchase 3044791 ---- ---- 661,960,765 7.74
1/16/2015 Purchase 853123 ---- ---- 662,813,888 7.75
3/13/2015 Purchase 4855314 ---- ---- 667,669,202 7.80
3/20/2015 Purchase 3135077 ---- ---- 670,804,279 7.84
3/27/2015 Purchase 4542218 ---- ---- 675,346,497 7.90
(C) At the End of the year (or on the date of separation,if separated during the year) ---- ---- 677,182,291 7.92
1.
SI.
No.
INDIAN OIL CORPORATION LIMITED No. of
shares
No. of
shares
% of total
share of the
company
% of total
share of the
company
Shareholding at the
beginning of the year
Cumulative Shareholding
during the year
(A) At the beginning of the year 657,923,428 7.70 ---- ----
(B) Date wise Increase/Decrease in Shareholding during theyear specifying the reasons for increase/decrease(e.g. allotment/transfer/bonus/sweat equity etc): ---- ---- NIL NIL
(C) At the End of the year (or on the date of separation,if separated during the year) ---- ---- 657,923,428 7.70
2.

Annexure E (MGT-9)
101
SI.
No.
GAIL INDIA LIMITED No. of
shares
No. of
shares
% of total
share of the
company
% of total
share of the
company
Shareholding at the
beginning of the year
Cumulative Shareholding
during the year
(A) At the beginning of the year 205,601,068 2.40 ---- ----
(B) Date wise Increase/Decrease in Shareholding during theyear specifying the reasons for increase/decrease (e.g. allotment/transfer/bonus/sweat equity etc): ---- ---- NIL NIL
(C) At the End of the year (or on the date of separation,if separated during the year) ---- ---- 205,601,068 2.40
3.
SI.
No.
FRANKLIN TEMPLETON INVESTMENT FUNDS No. of
shares
No. of
shares
% of total
share of the
company
% of total
share of the
company
Shareholding at the
beginning of the year
Cumulative Shareholding
during the year
(A) At the beginning of the year 76,805,580 0.90 ---- ----
(B) Date wise Increase/Decrease in Shareholding during theyear specifying the reasons for increase/decrease(e.g. allotment/transfer/bonus/sweat equity etc):
Date Reason
4/4/2014 Sold 197000 ---- ---- 76,608,580 0.90
4/11/2014 Sold 253000 ---- ---- 76,355,580 0.90
6/6/2014 Sold 2090157 ---- ---- 74,265,423 0.87
6/13/2014 Sold 359843 ---- ---- 73,905,580 0.86
6/30/2014 Sold 644200 ---- ---- 73,261,380 0.86
7/4/2014 Sold 815739 ---- ---- 72,445,641 0.85
7/11/2014 Sold 888061 ---- ---- 71,557,580 0.84
2/13/2015 Purchase 1036800 ---- ---- 72,594,380 0.85
2/20/2015 Purchase 262300 ---- ---- 72,856,680 0.85
2/27/2015 Purchase 336900 ---- ---- 73,193,580 0.86
(C) At the End of the year (or on the date of separation, ifseparated during the year) ---- ---- 73,193,580 0.86
4.

Annual Report 2014-15
Annexure E (MGT-9)
102
SI.
No.
ICICI PRUDENTIAL LIFE INSURANCE COMPANY
LTD.
No. of
shares
No. of
shares
% of total
share of the
company
% of total
share of the
company
Shareholding at the
beginning of the year
Cumulative Shareholding
during the year
(A) At the beginning of the year 46,964,274 0.55 ---- ----
(B) Date wise Increase/Decrease in Shareholding during theyear specifying the reasons for increase/decrease(e.g. allotment/transfer/bonus/sweat equity etc):
Date Reason
4/4/2014 Sold 186200 ---- ---- 46,778,074 0.55
4/11/2014 Purchase 40421 ---- ---- 46,818,495 0.55
4/18/2014 Purchase 11874 ---- ---- 46,830,369 0.55
4/25/2014 Purchase 15780 ---- ---- 46,846,149 0.55
5/2/2014 Sold 159380 ---- ---- 46,686,769 0.55
5/9/2014 Sold 1235873 ---- ---- 45,450,896 0.53
5/16/2014 Purchase 55373 ---- ---- 45,506,269 0.53
5/23/2014 Purchase 13344 ---- ---- 45,519,613 0.53
5/30/2014 Sold 714896 ---- ---- 44,804,717 0.52
6/6/2014 Sold 1951949 ---- ---- 42,852,768 0.50
6/13/2014 Sold 3916721 ---- ---- 38,936,047 0.46
6/20/2014 Sold 1099281 ---- ---- 37,836,766 0.44
6/30/2014 Sold 2535650 ---- ---- 35301116 0.41
7/4/2014 Sold 433800 ---- ---- 34,867,316 0.41
7/11/2014 Sold 15574 ---- ---- 34,851,742 0.41
7/18/2014 Sold 1353353 ---- ---- 33,498,389 0.40
7/25/2014 Sold 429799 ---- ---- 33,068,590 0.39
8/1/2014 Sold 237342 ---- ---- 32,831,248 0.38
8/8/2014 Purchase 48753 ---- ---- 32,880,001 0.38
8/15/2014 Purchase 18242 ---- ---- 32,898,243 0.38
8/22/2014 Sold 85285 ---- ---- 32,812,958 0.38
8/29/2014 Sold 760633 ---- ---- 32,052,325 0.37
9/5/2014 Sold 226485 ---- ---- 31,825,840 0.37
9/12/2014 Sold 54324 ---- ---- 31,771,516 0.37
9/19/2014 Sold 197032 ---- ---- 31,574,484 0.37
9/30/2014 Purchase 88390 ---- ---- 31,662,874 0.37
10/3/2014 Sold 8732 ---- ---- 31,654,142 0.37
10/10/2014 Sold 56001 ---- ---- 31,598,141 0.37
10/17/2014 Sold 118361 ---- ---- 31,479,780 0.37
10/24/2014 Sold 287748 ---- ---- 31,192,032 0.36
10/31/2014 Purchase 14823 ---- ---- 31,206,855 0.36
11/7/2014 Sold 23168 ---- ---- 31,183,687 0.36
11/14/2014 Sold 84674 ---- ---- 31,099,013 0.36
11/21/2014 Purchase 3716 ---- ---- 31,102,729 0.36
11/28/2014 Sold 130467 ---- ---- 30,972,262 0.36
5.

Annexure E (MGT-9)
103
12/5/2014 Purchase 137862 ---- ---- 31,110,124 0.36
12/12/2014 Sold 45107 ---- ---- 31,065,017 0.36
12/19/2014 Purchase 780925 ---- ---- 31,845,942 0.37
12/31/2014 Purchase 1440839 ---- ---- 33,286,781 0.39
1/2/2015 Purchase 171606 ---- ---- 33,458,387 0.39
1/9/2015 Purchase 369845 ---- ---- 33,828,232 0.40
1/16/2015 Purchase 896166 ---- ---- 34,724,398 0.41
1/23/2015 Purchase 140874 ---- ---- 34,865,272 0.41
1/30/2015 Purchase 204617 ---- ---- 35,069,889 0.41
2/6/2015 Purchase 1234044 ---- ---- 36,303,933 0.42
2/13/2015 Purchase 270101 ---- ---- 36,574,034 0.43
2/20/2015 Sold 16585 ---- ---- 36,557,449 0.43
2/27/2015 Sold 52986 ---- ---- 36,504,463 0.43
3/6/2015 Purchase 301071 ---- ---- 36,805,534 0.43
3/13/2015 Sold 126721 ---- ---- 36,678,813 0.43
3/20/2015 Sold 200150 ---- ---- 36,478,663 0.43
3/27/2015 Purchase 415630 ---- ---- 36,894,293 0.43
(C) At the End of the year (or on the date of separation, if separated during the year) ---- ---- 37,140,388 0.43
SI.
No.
VANGUARD EMERGING MARKETS STOCK
INDEX FUND, ASERIE
No. of
shares
No. of
shares
% of total
share of the
company
% of total
share of the
company
Shareholding at the
beginning of the year
Cumulative Shareholding
during the year
(A) At the beginning of the year 36,013,384 0.42 ---- ----
(B) Date wise Increase/Decrease in Shareholding during theyear specifying the reasons for increase/decrease(e.g. allotment/transfer/bonus/sweat equity etc):
Date Reason
4/4/2014 Purchase 202120 ---- ---- 36,215,504 0.42
4/11/2014 Purchase 247597 ---- ---- 36,463,101 0.43
4/18/2014 Purchase 35371 ---- ---- 36,498,472 0.43
5/23/2014 Purchase 90954 ---- ---- 36,589,426 0.43
5/30/2014 Purchase 611072 ---- ---- 37,200,498 0.43
7/11/2014 Purchase 176855 ---- ---- 37,377,353 0.44
7/25/2014 Purchase 202120 ---- ---- 37,579,473 0.44
8/1/2014 Purchase 323392 ---- ---- 37,902,865 0.44
8/22/2014 Purchase 412427 ---- ---- 38,315,292 0.45
9/12/2014 Purchase 141484 ---- ---- 38,456,776 0.45
9/30/2014 Sold 765215 ---- ---- 37,691,561 0.44
11/28/2014 Purchase 141484 ---- ---- 37,833,045 0.44
12/5/2014 Purchase 126325 ---- ---- 37,959,370 0.44
1/9/2015 Sold 207173 ---- ---- 37,752,197 0.44
1/16/2015 Sold 90954 ---- ---- 37,661,243 0.44
1/23/2015 Sold 85901 ---- ---- 37,575,342 0.44
2/6/2015 Sold 25265 ---- ---- 37,550,077 0.44
2/13/2015 Sold 101060 ---- ---- 37,449,017 0.44
(C) At the End of the year (or on the date of separation,if separated during the year ---- ---- 37,374,692 0.44
6.

Annual Report 2014-15
Annexure E (MGT-9)
104
SI.
No.
SI.
No.
LIC OF INDIA MARKET PLUS 1 GROWTH FUND
HSBC GLOBAL INVESTMENT FUNDS
ACCOUNT HSBC GIF MAURITU
No. ofshares
No. of
shares
No. of
shares
No. of
shares
% of totalshare of thecompany
% of totalshare of thecompany
% of totalshare of thecompany
% of totalshare of thecompany
Shareholding at the
beginning of the year
Shareholding at the
beginning of the year
Cumulative Shareholding
during the year
Cumulative Shareholding
during the year
(A) At the beginning of the year 27,723,200 0.32 ---- ----(B) Date wise Increase/Decrease in Shareholding during theyear specifying the reasons for increase/decrease(e.g. allotment/transfer/bonus/sweat equity etc):Date Reason4/25/2014 Sold 621009 ---- ---- 27,102,191 0.325/9/2014 Sold 594971 ---- ---- 26,507,220 0.316/13/2014 Sold 77197 ---- ---- 26,430,023 0.316/20/2014 Sold 100000 ---- ---- 26,330,023 0.316/30/2014 Sold 1284376 ---- ---- 25,045,647 0.307/4/2014 Sold 712206 ---- ---- 24,333,441 0.287/11/2014 Sold 553002 ---- ---- 23,780,439 0.287/25/2014 Sold 75215 ---- ---- 23,705,224 0.288/1/2014 Sold 487500 ---- ---- 23,217,724 0.278/8/2014 Sold 462256 ---- ---- 22,755,468 0.278/15/2014 Sold 667770 ---- ---- 22,087,698 0.268/22/2014 Sold 455000 ---- ---- 21,632,698 0.258/29/2014 Sold 933671 ---- ---- 20,699,027 0.24(C) At the End of the year (or on the date of separation,if separated during the year) ---- ---- 20,699,027 0.24
(A) At the beginning of the year 26,352,684 0.31 ---- ----
(B) Date wise Increase/Decrease in Shareholding during theyear specifying the reasons for increase/decrease(e.g. allotment/transfer/bonus/sweat equity etc):
Date Reason
5/9/2014 Sold616714 ---- ---- 25,735,970 0.30
5/16/2014 Sold162349 ---- ---- 25,573,621 0.30
5/23/2014 Sold58382 ---- ---- 25,515,239 0.30
6/13/2014 Sold343273 ---- ---- 25,171,966 0.30
6/20/2014 Sold1159875 ---- ---- 24,012,091 0.28
8/15/2014 Sold476696 ---- ---- 23,535,395 0.28
8/22/2014 Sold396604 ---- ---- 23,138,791 0.27
8/29/2014 Sold621015 ---- ---- 22,517,776 0.26
9/5/2014 Sold348361 ---- ---- 22,169,415 0.26
9/12/2014 Sold328691 ---- ---- 21,840,724 0.26
10/10/2014 Sold500000 ---- ---- 21,340,724 0.25
10/17/2014 Sold196737 ---- ---- 21,143,987 0.25
10/24/2014 Sold263157 ---- ---- 20,880,830 0.24
(C) At the End of the year (or on the date of separation,if separated during the year) ---- ---- 20,880,830 0.24
7.
8.

Annexure E (MGT-9)
105
SI.
No.
CPSE ETF No. of
shares
No. of
shares
% of totalshare of thecompany
% of totalshare of thecompany
Shareholding at the
beginning of the year
Cumulative Shareholding
during the year
(A) At the beginning of the year 24,786,189 0.29 ---- ----
(B) Date wise Increase/Decrease in Shareholding during theyear specifying the reasons for increase/decrease(e.g. allotment/ transfer/bonus/sweat equity etc):
Date Reason
4/4/2014 Purchase 51120 ---- ---- 24,837,309 0.30
4/11/2014 Sold 7642755 ---- ---- 17,194,554 0.20
4/18/2014 Sold 1238365 ---- ---- 15,956,189 0.19
4/25/2014 Sold 1198370 ---- ---- 14,757,819 0.17
5/2/2014 Sold 649254 ---- ---- 14,108,565 0.16
5/9/2014 Sold 345594 ---- ---- 13,762,971 0.16
5/16/2014 Purchase 155525 ---- ---- 13,918,496 0.16
5/23/2014 Purchase 204952 ---- ---- 14,123,448 0.17
5/30/2014 Purchase 225896 ---- ---- 14,349,344 0.17
6/6/2014 Purchase 104720 ---- ---- 14,454,064 0.17
6/13/2014 Sold 40392 ---- ---- 14,413,672 0.17
6/20/2014 Purchase 17952 ---- ---- 14,431,624 0.17
6/30/2014 Purchase 31416 ---- ---- 14,463,040 0.17
7/4/2014 Purchase 23936 ---- ---- 14,486,976 0.17
7/11/2014 Sold 7480 ---- ---- 14,479,496 0.17
7/18/2014 Purchase 14541 ---- ---- 14,494,037 0.17
7/25/2014 Purchase 19435 ---- ---- 14,513,472 0.17
8/1/2014 Purchase 13455 ---- ---- 14,526,927 0.17
8/8/2014 Purchase 4485 ---- ---- 14,531,412 0.17
8/15/2014 Sold 1495 ---- ---- 14,529,917 0.17
8/22/2014 Purchase 312715 ---- ---- 14,842,632 0.17
8/29/2014 Sold 36600 ---- ---- 14,806,032 0.17
9/5/2014 Sold 18220 ---- ---- 14,787,812 0.17
9/12/2014 Sold 79508 ---- ---- 14,708,304 0.17
9/19/2014 Sold 47399 ---- ---- 14,660,905 0.17
9/30/2014 Purchase 65747 ---- ---- 14,726,652 0.17
10/3/2014 Sold 6116 ---- ---- 14,720,536 0.17
10/10/2014 Sold 1529 ---- ---- 14,719,007 0.17
10/17/2014 Purchase 62689 ---- ---- 14,781,696 0.17
10/24/2014 Purchase 51986 ---- ---- 14,833,682 0.17
10/31/2014 Sold 29051 ---- ---- 14,804,631 0.17
11/7/2014 Purchase 82566 ---- ---- 14,887,197 0.17
11/14/2014 Purchase 752054 ---- ---- 15,639,251 0.17
11/21/2014 Sold 695702 ---- ---- 14,943,549 0.17
11/28/2014 Sold 52899 ---- ---- 14,890,650 0.17
12/5/2014 Sold 33663 ---- ---- 14,856,987 0.17
12/12/2014 Sold 24045 ---- ---- 14,832,942 0.17
12/19/2014 Sold 33663 ---- ---- 14,799,279 0.17
12/31/2014 Purchase 150333 ---- ---- 14,949,612 0.17
9.

Annual Report 2014-15
Annexure E (MGT-9)
106
SI.
No.
CPSE ETF No. of
shares
No. of
shares
% of totalshare of thecompany
% of totalshare of thecompany
Shareholding at the
beginning of the year
Cumulative Shareholding
during the year
1/2/2015 Sold 59459 ---- ---- 14,890,153 0.17
1/9/2015 Purchase 80350 ---- ---- 14,970,503 0.17
1/16/2015 Sold 44996 ---- ---- 14,925,507 0.17
1/23/2015 Sold 35354 ---- ---- 14,890,153 0.17
1/30/2015 Sold 73922 ---- ---- 14,816,231 0.17
2/6/2015 Sold 33747 ---- ---- 14,782,484 0.17
2/13/2015 Sold 3214 ---- ---- 14,779,270 0.17
2/20/2015 Purchase 906764 ---- ---- 15,686,034 0.18
2/27/2015 Sold 15309 ---- ---- 15,670,725 0.18
3/6/2015 Sold 32584 ---- ---- 15,638,141 0.18
3/13/2015 Purchase 223221 ---- ---- 15,861,362 0.19
3/20/2015 Purchase 13738 ---- ---- 15,875,100 0.19
3/27/2015 Purchase 104040 ---- ---- 15,979,140 0.19
(C) At the End of the year (or on the date of separation, if separated during the year) ---- ---- 15,975,672 0.19
9.
SI.
No.
LIC OF INDIA MARKET PLUS 1 GROWTH FUND No. ofshares
No. of
shares
% of totalshare of thecompany
% of totalshare of thecompany
Shareholding at the
beginning of the year
Cumulative Shareholding
during the year
(A) At the beginning of the year 24,040,209 0.28 ---- ----
(B) Date wise Increase/Decrease in Shareholding during theyear specifying the reasons for increase/decrease(e.g. allotment/transfer/bonus/sweat equity etc):
Date Reason
4/25/2014 Sold247975 ---- ---- 23,792,234 0.28
5/9/2014 Sold271362 ---- ---- 23,520,872 0.27
6/30/2014 Sold916104 ---- ---- 22,604,768 0.26
7/4/2014 Sold610286 ---- ---- 21,994,482 0.26
7/11/2014 Sold200000 ---- ---- 21,794,482 0.25
7/25/2014 Sold400000 ---- ---- 21,394,482 0.25
8/1/2014 Sold198311 ---- ---- 21,196,171 0.25
8/8/2014 Sold297374 ---- ---- 20,898,797 0.24
8/15/2014 Sold350000 ---- ---- 20,548,797 0.24
8/22/2014 Sold685000 ---- ---- 19,863,797 0.23
8/29/2014 Sold475000 ---- ---- 19,388,797 0.23
(C) At the End of the year (or on the date of separation, if separated during the year) ---- ---- 19,388,797 0.23
10.

Annexure F (Energy Conservation)
107
Annexure - F
A. ENERGY CONSERVATION
The following measures were taken towards energy conservation during 2014-15
lDuring the year LED Retrofit tube lights (20W)-1800 nos. were replaced in place of conventional 36W/40W Tubes having power consumption of approx. 50W including choke.
l25 KW Roof top Solar Plant was installed at KDMIPE which is feeding power to Streetlights of KDMIPE.
lFor renovation works at various labs/ of fices of KDMIPE, 120 nos. LED (36/ 40W) were replaced in place of 2x40W Tube fit ting having power consumption of approx. 100W including choke.
l308 Nos. of 2X40W Tube fit tings having power consumption of 100 Watt were replaced by LED Fit tings (36 W) in GEOPIC.
lAs a Green initiative, 15KW solar photo-voltaic power plant was installed at GEOPIC roof top.
lDuring renovation of IRS canteen all the light fit tings 12x40W tube light fit tings (12 no.) have been replaced with 43W LED light fit tings (9 no.)
lUranPlant : The measures taken during 2014-15 include 125 KWp Solar Power Plant at Roof Top of Raw Water Reservoir and 50 KWp Solar Power Plant at Roof Top of New APU Substation.
lHazia Plant - Movement detector lighting circuits have been installed in unmanned sub-stations.
l6 AC-VFD rigs have been introduced in Onshore Assets.
lAnkleshwar Asset installed and commissioned 2 nos. of hired gas compressors, one each in Gandhar & Ankleshwar fields to reduce gas flaring and monetize the same.
lHPSV lamps in street lighting were replaced by Energy saver LED lamps in IDT.
Impact of measures for reduction of energy consumption and consequent impact on the cost of production of goods
The energy conservation measures taken as above have resulted in significant saving. Further, the above measures have resulted in reduction of significant quantity of fuel consumption (HSD, Natural Gas and electricity).
B. RESEARCH AND DEVELOPMENT
Specific areas in which R&D was carried out
lUpdation of tectonic map of India.
lBasin architecture and Mesozoic sedimentation inwestern of fshore basins.
lAnalysis of the various elements of Petroleumsystem(s) of the study in KG and Mahanadi areaswith respect to hydrocarbon charging.
lDelineation of shallow pay sands in a pilot area of Ankaleshwar field, Cambay Basin.
lEvaluation of its hydrocarbon prospectivity in Chenab-Beas Sector of Himalayan Foothills in analogy with Upper Indus Petroliferous basin.
lPlate Tectonic reconstruction of Gondwana deposits of India.
lStrontium-Neodymium (Sr-Nd) isotopic and geochemical characterization of basaltic basement in Western Of fshore Basin.
lEvaluation of low resistivity pay sand GS-12 of Gandhar field.
lAssessment of Gas Hydrate potential in Andaman of fshore area.
lBasin Centered Gas prospectivity in Warsan Low in Mehsana Area, North Cambay Basin.
lSof tware development using CUDA-GPU Technology
lSof tware development for data access from OpenWorks database to other platforms over the network
lSof tware development for interactive Spectral Decomposition in Petrel to improve the understanding of anomalous zones quickly by generating the spectral at tributes on the fly from the seismic data.
lDevelopment of sof tware for improving the frequency bandwidth to induct the MPI parallel processing techniques using high performance cluster systems for compute intensive seismic processing methods.
lDevelopment of sof tware for transforming angle gathers to of fset gathers as an OMEGA plugin
lInterpretation of Passive Seismic data to absorb this fast emerging Technology to generate 3-D velocity structure of the sub-sur face for hydrocarbon exploration using data from micro-earthquakes.
lAnisotropic Pre-stack Depth Migration (PSDM) using seismic 3D data pertaining to prospect, B173-A, of Neelam-Heera Asset, Mumbai Of fshore, Using OMEGA and Geodepth Sof twares
lApplication of Geostatical inversion-technique for removal of coal ef fect. Structural Engineering
lLife extension and recertification of the of fshore jacket platforms in western of fshore, which have outlived their design lives, through a collaborative project with DNV GL.
lRisk based inspection planning for of fshore structures in western of fshore
Material Selection Corrosion Control
lSuitable material of construction for tubular and flow line of deep water development
Geotechnical Studies
lApplication of Field vane shear Test in of fshore geotechnics
Gas Hydrate Studies
ØStudies on the feasibility of gas production from gas hydrate bearing reservoirs using molecular substitution technique
IRS, has completed a number of R&D Projects in FY(14-15) on Field development based on Reservoir simulation studies, Performance monitoring, EOR processes – Lab design and simulation, Reservoir characterization, productivity enhancement projects and basic laboratory data generation for various fields of ONGC.
ØFeasibility Study on introduction of Nano based Non-damaging Drilling Fluid technology in ONGC for increasing Well Productivity and reduction in drilling cost.
ØProper mud design for drilling in shale sections (long exposure period) in Cambay, KG and Cauvery basins ensuring well stabilit y- (Head COD-Shale gas, Vadodara).
ØDesign of Mud system for the wells of Daman development Project (C-24 Addl. Dev. & B 12 fields) - B&S Asset, Mumbai.
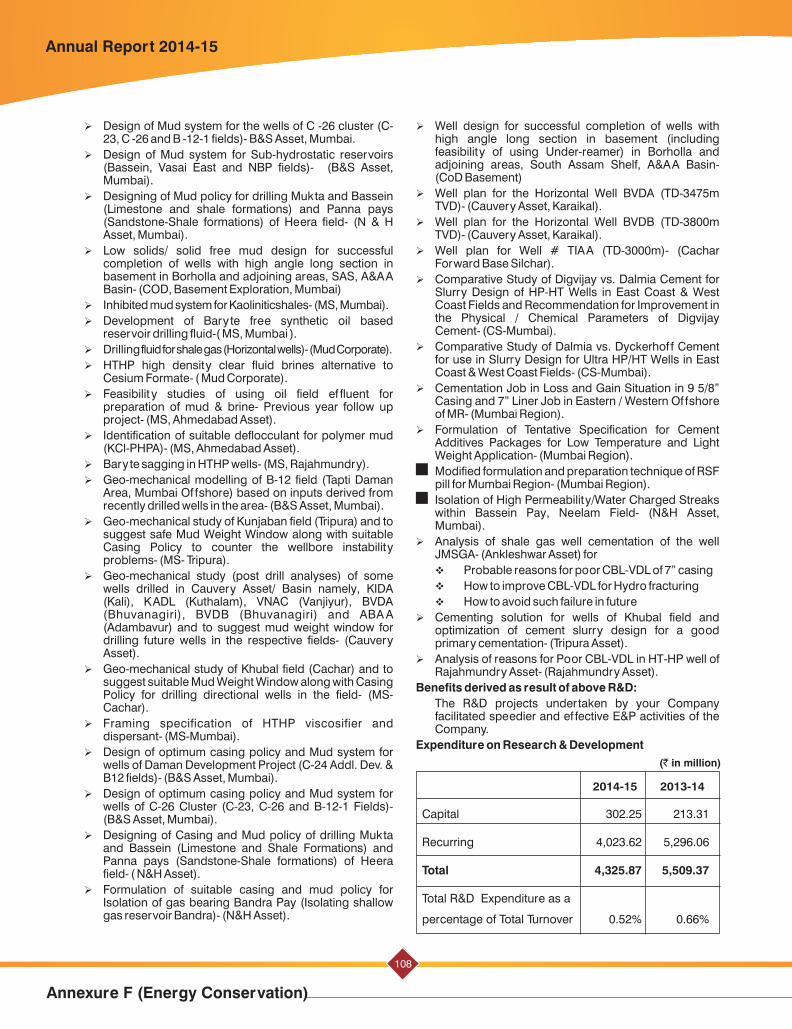
Annual Report 2014-15
Annexure F (Energy Conservation)
108
ØDesign of Mud system for the wells of C -26 cluster (C-23, C -26 and B -12-1 fields)- B&S Asset, Mumbai.
ØDesign of Mud system for Sub-hydrostatic reservoirs (Bassein, Vasai East and NBP fields)- (B&S Asset, Mumbai).
ØDesigning of Mud policy for drilling Mukta and Bassein (Limestone and shale formations) and Panna pays (Sandstone-Shale formations) of Heera field- (N & H Asset, Mumbai).
ØLow solids/ solid free mud design for successful completion of wells with high angle long section in basement in Borholla and adjoining areas, SAS, A&AA Basin- (COD, Basement Exploration, Mumbai)
ØInhibited mud system for Kaoliniticshales- (MS, Mumbai).
ØDevelopment of Baryte free synthetic oil based reservoir drilling fluid-( MS, Mumbai ).
ØDrilling fluid for shale gas (Horizontal wells)- (Mud Corporate).
ØHTHP high density clear fluid brines alternative to Cesium Formate- ( Mud Corporate).
ØFeasibilit y studies of using oil field ef fluent for preparation of mud & brine- Previous year follow up project- (MS, Ahmedabad Asset).
ØIdentification of suitable deflocculant for polymer mud (KCl-PHPA)- (MS, Ahmedabad Asset).
ØBaryte sagging in HTHP wells- (MS, Rajahmundry).
ØGeo-mechanical modelling of B-12 field (Tapti Daman Area, Mumbai Of fshore) based on inputs derived from recently drilled wells in the area- (B&S Asset, Mumbai).
ØGeo-mechanical study of Kunjaban field (Tripura) and to suggest safe Mud Weight Window along with suitable Casing Policy to counter the wellbore instability problems- (MS- Tripura).
ØGeo-mechanical study (post drill analyses) of some wells drilled in Cauvery Asset/ Basin namely, KIDA (Kali), KADL (Kuthalam), VNAC (Vanjiyur), BVDA (Bhuvanagiri), BVDB (Bhuvanagiri) and ABA A (Adambavur) and to suggest mud weight window for drilling future wells in the respective fields- (Cauvery Asset).
ØGeo-mechanical study of Khubal field (Cachar) and to suggest suitable Mud Weight Window along with Casing Policy for drilling directional wells in the field- (MS-Cachar).
ØFraming specification of HTHP viscosifier and dispersant- (MS-Mumbai).
ØDesign of optimum casing policy and Mud system for wells of Daman Development Project (C-24 Addl. Dev. & B12 fields)- (B&S Asset, Mumbai).
ØDesign of optimum casing policy and Mud system for wells of C-26 Cluster (C-23, C-26 and B-12-1 Fields)- (B&S Asset, Mumbai).
ØDesigning of Casing and Mud policy of drilling Mukta and Bassein (Limestone and Shale Formations) and Panna pays (Sandstone-Shale formations) of Heera field- ( N&H Asset).
ØFormulation of suitable casing and mud policy for Isolation of gas bearing Bandra Pay (Isolating shallow gas reservoir Bandra)- (N&H Asset).
ØWell design for successful completion of wells with high angle long section in basement (including feasibility of using Under-reamer) in Borholla and adjoining areas, South Assam Shelf, A&AA Basin- (CoD Basement)
ØWell plan for the Horizontal Well BVDA (TD-3475m TVD)- (Cauvery Asset, Karaikal).
ØWell plan for the Horizontal Well BVDB (TD-3800m TVD)- (Cauvery Asset, Karaikal).
ØWell plan for Well # TIAA (TD-3000m)- (Cachar Forward Base Silchar).
ØComparative Study of Digvijay vs. Dalmia Cement for Slurry Design of HP-HT Wells in East Coast & West Coast Fields and Recommendation for Improvement in the Physical / Chemical Parameters of Digvijay Cement- (CS-Mumbai).
ØComparative Study of Dalmia vs. Dyckerhof f Cement for use in Slurry Design for Ultra HP/HT Wells in East Coast & West Coast Fields- (CS-Mumbai).
ØCementation Job in Loss and Gain Situation in 9 5/8” Casing and 7” Liner Job in Eastern / Western Of fshore of MR- (Mumbai Region).
ØFormulation of Tentative Specification for Cement Additives Packages for Low Temperature and Light Weight Application- (Mumbai Region).
Modified formulation and preparation technique of RSF pill for Mumbai Region- (Mumbai Region).
Isolation of High Permeability/Water Charged Streaks within Bassein Pay, Neelam Field- (N&H Asset, Mumbai).
ØAnalysis of shale gas well cementation of the well JMSGA- (Ankleshwar Asset) for
vProbable reasons for poor CBL-VDL of 7” casing
vHow to improve CBL-VDL for Hydro fracturing
vHow to avoid such failure in future
ØCementing solution for wells of Khubal field and optimization of cement slurry design for a good primary cementation- (Tripura Asset).
ØAnalysis of reasons for Poor CBL-VDL in HT-HP well of Rajahmundry Asset- (Rajahmundry Asset).
Benefits derived as result of above R&D:
The R&D projects undertaken by your Company facilitated speedier and ef fective E&P activities of the Company.
Expenditure on Research & Development
2013-142014-15
Capital 302.25 213.31
Recurring 4,023.62 5,296.06
Total 4,325.87 5,509.37
Total R&D Expenditure as a
percentage of Total Turnover 0.52% 0.66%
(` in million)

Annexure F (Energy Conservation)
109
C. Technology absorption and adaptation
lViscoelastic foam acid system (VFA), VSDA & DPRS has been implemented in Mumbai of fshore wells resulting in appreciable oil gain.
lFor the first time Rigless WSO Job followed by cement squeeze by CTU was carried out in Ahmedabad Asset.
lTwo Bottom hole samples of Nagayalanka field, a HPHT reservoir for Joint Venture (Cairn Energy-ONGC consortium) from well NL-1zST at a depth of 4045.2m WL (Raghavpuram sand) and 3995.2m WL (Golapalli sand) were collected by Schlumberger for PVT studies. Both the samples were tested successfully under HPHT conditions.
lAcquired PIPENET vision sof tware (1.7), Spray sprinkler module from M/s. Sunrise System, U.K to check the fire water adequacy.
lIEOT acquired State of the Art Sof tware SAFETI/Phast-6.7 from DNV for Quantitative Risk Assessment.
lMehsana Asset has developed an in-house pipeline information system on google maps. The system provides all information related to various pipelines of the Asset, their routes, types, sizes, distances, etc. The facility is available from anywhere through intranet with user login authentication.
l6 Nos of AC-VFD state of art drilling rigs have been introduced in Assam Asset (3 Nos), Ankleshwar Asset (1 Nos), Rajahmundry Asset (1 Nos) and Cauvery Asset (1). These rigs have a capacity of drilling upto 6100 m and have state of the art electronics systems. These rigs have been procured from M/s BHEL.
lAnkleshwar Asset has inducted 2 nos. of new logging units for cased hole and production logging services on
th20 October, 2014. The units have been sourced from M/s Weatherford Llc, and are equipped with state of art tools for all types of well and reservoir related jobs.
lRajahmundry Asset has acquired a sophisticated new open hole logging unit armed with most updated features and specifications. The new unit is also supplemented with high-tech imaging tools like STAR (Simultaneous Acoustic and Resistivity Tool), ECBIL (Ex tended Circumferential Bore Hole Imaging Log) and Segmented Bond Tool (SBT), thus enhancing the in-house capability by huge proportions. The hi-tech STAR tool provides better reservoir description, fracture detections, borehole break-outs and other geological applications.
lIn a breakthrough technology application, hydro-fracturing was successfully carried out in two HP-HT wells of the Rajahmundry Asset. The wells MSAC ( BHT-165.5 Deg C) & MSDB ( BHT-157 Deg C) of Malleshwaram fields were fractured by WSS, Ahmedabad through in-house developed technology in December, 2014. The technology for HPHT is patented and is available at a significant premium in the market. Therefore this path breaking success has opened a new vista for unlocking the potential from tight & HPHT
reservoirs through in-house fracturing in a cost ef fective way.
lTripura Asset has used new technology application of under balanced perforation using Tubing Conveyed Perforation (TCP) guns in wells BRM#25 (Baramura field) and AD#38 (Agartala Dome field) with very encouraging results.
lTripura Asset has acquired state of art well activation and testing equipment to augment well activation/ testing capabilities. Asset has acquired one 200 ksc high pressure compressor for well activations and two nos. of high pressure horizontal 3 phase test separators with state of art instrumentation for well testing operations.
lIn Cauvery Asset, Gas Corrosion Inhibitor (GCI) dosing system has been installed at the Gas Collecting System (GCS), Kovilkallapal. The system is a first of its kind at
rdCauvery Asset and was commissioned on 3 October, 2014. The system will help to improve the gas evacuation system to transport gas in a safe manner.
lBWA (Broadband Wireless Access): BWA project based on IEEE 802.16d standard, comprises of 7 base stations and its associated 227 remote locations at Ahmedabad, Anklehwar, Gandhar, Cambay, Mehsana, Vadodara and Neelam Process complex. A ‘Pilot Test’ was carried out at Gandhar before rollout of the Project. 127 nos of towers (height- 10M, 20M, 30M, 40M and 60M) were erected in Western onshore under the Project. The system is operational at Western Onshore locations successfully with 99% availability.
lEnterprise Wide SCADA (Supervisory Control and Data Acquisition) System: The project created a single plat form for monitoring the operations of ONGC’s Drilling and Production facilities and covered 247 onshore production facilities, 11 of fshore process complexes, 157 un-manned well plat forms, 9 of fshore and 64 onshore drilling rigs, 2 Process plants and 1 mini-refinery. Detailed engineering & project execution on a turnkey basis has been carried out by engaging M/s ABB Limited, Bengaluru as an EPC Contractor. The system helps in taking tactical decisions at field level, operational decisions at Base of fice and Strategic decisions at the Corporate Of fice level. Data from SCADA system can be directly inter faced to other corporate databases and ERP systems.
lIBM Messaging platform: The IBM Lotus messaging platform has been deployed in ONGC with mail servers based at Delhi and Mumbai. Introduction of O drive, an authenticated cloud based storage facility was also rolled out on IBM Lotus MySpace which provides users a facility to store files & documents that can be accessed from anywhere. Myspace is also being used to share files with other users, form communities and collaborate.
lField implemented IDT developed Micro bubble system successfully at well no. HSD #8H (South Heera Field) of Mumbai Region.

Annual Report 2014-15
Annexure F (Energy Conservation)
110
D Information regarding Imported Technology for last five years
S.No. Technology Imported Year of Import
A TECHNOLOGY
(i) • Continuous Flow Isotope Ratio Mass Spectrometer (CF-IRMS)
• COREVAL-30
• SKUA sof tware from M/s Paradigm.
• Fugro Jason Work Bench Sof tware
• SATA-II disks based SAN storage systems
• PERISCOPE
(ii) • 3D Visualisation Centre.
• The Fluid Eval.
• Induction of CRAM sof tware from M/s Paradigm.
• Induction of Geo-science core system and seismic interpretation module of petrelsof tware from M/s Geoquest Systems B.V.
• Induction of MATLAB Sof tware from M/s Designtech Systems Ltd.
• Petrel sof tware for Processing of seismic data from M/s Geoquest Systems B.V.
• Multi-Component Seismic Survey - 3D – 3C
• Tuf fTRAC- a new generation wire line-conveyed tractor, used for carrying out perforations.
• Ultra HPHT TCP-DST- To test wells in very High temperature & Pressure conditionshaving temperatures beyond 450 °F.
• RF Safe perforating System.
(iii) • Sm-Nd Dating facility to date hard rocks like Igneous and metamorphic.It also helpful in ascertaining the provenance age in sedimentary rocks.and correlation of reservoirlithologies.
(iv) • Radial 3D Saturn Probe-used for pressure measurements, downhole fluid analysisand fluid sampling in extremely low mobility reservoir sections.
• Radial Cutter Torch (RCT) used to retrieve the 3 ½” tubing which is clamped with ESPcable in 9 5/8” casing. The thermal Generator System initiates the RCT tool and directsthe molten plasma for cut ting the pipe.
• Multi sample Porosimeter-Permeameter KEYPHI-used for measurement of petrophysicalparameters at variable confining pressure.
• UV-Vis Spectrophotometer Lambda-35 (PerkinElmer) is useful in the genetic correlation,depositional environment and maturity of crude oils and source sequences.
• Thermo Fisher Nicolet iS5 FT-IR Spectrophotometer used for the study of structuralgroup analysis of complex hydrocarbon mixtures, genetic correlation of crude oils &bitumen and oil shale &kerogen analysis.
• The e-Permit system to Work (PTW): of fers the distinct advantage of a standardizedPTW template across the organization and ensures faster permit access to the end user.
• Air Hammer Drilling-used for the first time in ONGC in well Jabera-3, Vindhyan Basin.The technology is based on the under balanced drilling and has an option forchange-over to conventional mud system to meet the operational, safety and testingrequirements.
(v) • Broadband seismic technology have been used in Mumbai High Field identification 2014-15of porosity sweet spots in carbonate reservoirs and thin bed identification within theclastic reservoirs and also the broadband data is expected to help in Basement imagingfor prospectivity within locales of intense fracture development.
• Micros Seismics surveys are performed to monitor hydraulic fracturing. Initiative hasbeen taken with in-house ef forts for acquiring data. Feasibility study for monitoring theprogress of hydrofracturing using Microseismics is under progress in Cambay Basin.
2010-11
2011-12
2012-13
2013-14

Annexure F (Energy Conservation)
111
• Drill bit Seismicstechnique uses the vibrations produced by a drill bit while drilling as a downhole seismic energy source.The seismic data has been acquired around a well in Gandhararea of Cambay Basin using 3C sensors and drill bit as a source.
• Advance NGS system:Itallows simultaneous display and management of dif ferent spectrafor desired presentation and ef fective management of data file. It has latest digital signalprocessor (Orion) and MCA (Multi Channel Analyser) which will improve the dataacquisition, analysis process and enrich the interpretation capabilities.
• New Modules in MOVE suite(Geomechanical Modeling(GM),Fracture Modeling(FM) andStress Analysis tools have been added in MOVE suite: GM creates 3D restoration modelsand af fords advanced structural systems analysis capabilities. Data generated will beused in fracture modeling and generation of discrete fracture networks (DFN) whereas FM generates non deterministic 3D Discrete Fracture Network (DFN) models that allows the characterization of fracture networks and generates direct outputs for reservoir simulation.The stress analysis tool uses graphical method for analyzing fault and fracture systemsunder a user defined 3D stress state. The tool computes stress at tributes for Slip Tendency,Dilation Tendency, Fracture Stability and Slip Stability of planes.
• 2D long-of fset seismic data reprocessing tool using TGS sof tware: This tool will Improvethe image by using linear transform (SMELT) module and proprietorysof tware CLARI-FI.This tool has helped in understanding the Basin architecture , Sedimentation Historyand in identif ying prospective locales for Mesozoic exploration of Kutch andKerala-Konkan Basin.
• Scale-Out NAS 378 TB storage, 40 TB SAN storage and 10G OM3 Fibre based direct Workstation connectivity through IPV6 ready CORE Switch.
• Server vir tualization through Rack server & associated Sof tware and induction of WorkStations and Thin Clients.
• Network connectivity has been upgraded from existing 1G to 10G on Fiber Net work.
• Gas Sweeting Facilities at Offshore
B193 Process Platform commissioned in November, 2014 under Development of B193 Cluster fields having high H2S gas concentrations. It is for the first time that sour gas processing & sweetening facilities have been installed and being operated at Of fshore installation.
• Float over method installation: HRD process plat form has been installed in January, 2015 byusing state-of-the-art “Float-Over Technology” resulting in saving of of fshore constructiontime for installation. Earlier the successful installation of B-193 AP Deck of B&S Asset, inDecember, 2012 using the Float Over method was the first endeavor of ONGC in this direction
• Floating Production, Storage and Offloading (FPSO):
FPSO (Armada Sterling-II) a floating oil production system successfully commissioned inMarch, 2015 in western of fshore to produce oil and gas from Cluster-7 fields. It is to mentionthat ONGC has earlier for the first time has deployed FPSO in April, 2013 to produce oil fromNBP field of Western of fshore
• WiMax based point to multipoint broadband communication system: The systems havebeen deployed in Western Onshore & Western Of fshore assets & work centers to providevoice & data connectivity to remote installations. Technology is adapted to suit organizationalrequirements, but not acquired by ONGC
The WiMax technology is also overtaken by a new technology LTE (Long Term Evolution)which is planned to be deployed in other regions.
• Enterprise wide SCADA (Supervisory Control & Data Acquisition) system: The systemhave been deployed across the organisation to provide real time production & drillingfield parameters to operators, managers & top management. Technology is adapted tosuit organizational requirements but not acquired by ONGC
C-If not fully absorbed- areas where this has not taken place, reason thereof, and future plans of action.
Yes
Not applicable
B-Has the technology been fully absorbed?

Annual Report 2014-15
Annexure F (Energy Conservation)
112
Envir onment Pr otect ion and Conser vat ion, Technological Conservation, Renewable Energy Developments, Foreign Exchange Conservations
The measures taken by ONGC with regard to development and utilisation of alternate sources of energy have been brought out in the Board Report under the heading “Unconventional sources of energy” and “Carbon Management & Sustainability Development”. Apart from the above, measures taken for environmental protection are outlined below:
Conservation of water: To prevent further depletion and to sustain ground water table, KDMIPE dug six wells to collect the discharge water at dif ferent locations of campus.
Recycling of waste: KDMIPE also operates a six-pit Vermi-compost plant where dry leaves and kitchen waste are recycled. As a result,KDMIPE Campus is free from burning of waste papers by recycling the same.
Ringal plantation: To sustain fragile ecosystem of Himalayas, ringal plantation in Upper Himalayan Region is
being carried out as an initiative under National Action Plan on Climate Change launched by the Prime Minister. So far, 10.75 lakhs Ringal plantation in 430 ha of Upper Himalayan region has been done resulting in 1.97 million tonnes of CO fixation per annum. 2
Mangrove plantation: For protection and stabilization of shoreline close to ONGC Assets mangrove plantation is being carried out. So far, 19.95 lakhs mangrove plants have been planted in Gandhar Area and 1.5 lakhs near Hazira Plant. To spread awareness on significance of Mangroves plantation, protection and its continued cultivation programmes were arranged among children and local communities in these areas.
Bio-Remediation: To prevent the contamination of soil ONGC entered into a rate contract with ONGC’s joint venture company OTBL for Bio- remediation of oily sludge/ oil contaminated waste. In the financial year 2014-15 about 69,152 MT of oily sludge/ oil contaminated waste has been bio-remediated across various assets of ONGC
E. Information on Foreign Exchange Earnings and Outgo(` in millions)
2014-15 2013-14
Foreign Exchange Earnings 50,227.99 74,889.84
Foreign Exchange Outgo 175,420.96 1,83,728.63
Signing of MoU for Co-operation in the field of Oil & Gas between India and Mozambique

Comments of C&AG
113
COMMENTS OF THE COMPTROLLER AND AUDITOR GENERAL OF INDIA UNDER SECTION 143(6)(b) OF THE COMPANIES ACT, 2013 ON THE FINANCIAL STATEMENTS OF OIL AND NATURAL GAS CORPORATION LIMITED FOR THE YEAR ENDED 31 MARCH 2015
Annexure - G
The preparation of financial statements of Oil and Natural Gas Corporation Limited for the year ended 31 March 2015 in
accordance with the financial reporting framework prescribed under the Companies Act, 2013 is the responsibility of the
management of the company. The statutory auditor appointed by the Comptroller and Auditor General of India under Section 139
(5) of the Act is responsible for expressing opinion on the financial statements under section 143 of the Act based on independent
audit in accordance with the standards on auditing prescribed under section 143(10) of the Act. This is stated to have been done
by them vide their Audit Report dated 28 May, 2015.
I, on the behalf of the Comptroller and Auditor General of India, have conducted a supplementary audit under section 143(6)(a) of
the Act of the financial statements of Oil and Natural Gas Corporation Limited for the year ended 31 March 2015. This
supplementary audit has been carried out independently without access to the working papers of the statutory auditors and is
limited primarily to enquiries of the statutory auditors and company personnel and a selective examination of some of the
accounting records. On the basis of my audit nothing significant has come to my knowledge which would give rise to any
comment upon or supplement to statutory auditors' report.
For and on behalf of theComptroller & Auditor General of India
Sd/-Parama Sen
Principal Director of Commercial Audit
& ex-officio Member, Audit Board - II, Mumbai
Place : Mumbai
Date : 10 July, 2015

Annual Report 2014-15
Comments of C&AG
114
COMMENTS OF THE COMPTROLLER AND AUDITOR GENERAL OF INDIA UNDER SECTION 143(6)(b) READ WITH SECTION 129(4) OF THE COMPANIES ACT, 2013 ON THE CONSOLIDATED FINANCIAL STATEMENTS OF OIL AND NATURAL GAS CORPORATION LIMITED FOR THE YEAR ENDED31 MARCH 2015
The preparation of consolidated financial statements of Oil and Natural Gas Corporation Limited for the year ended 31 March
2015 in accordance with the financial reporting framework prescribed under the Companies Act, 2013 is the responsibility of the
management of the company. The statutory auditor appointed by the Comptroller and Auditor General of India under Section 139 (5)
read with section 129(4) of the Act is responsible for expressing opinion on the financial statements under section 143 read with
section 129(4) of the Act based on independent audit in accordance with the standards on auditing prescribed under section
143(10) of the Act. This is stated to have been done by them vide their Audit Report dated 28 May, 2015.
I, on the behalf of the Comptroller and Auditor General of India, have conducted a supplementary, audit under section 143(6)(a) read
with section 129(4) of the Act of the consolidated financial statements of Oil and Natural Gas Corporation Limited for the year
ended 31 March, 2015. We conducted a supplementary audit of the financial statements of subsidiaries and Joint Venture Entities
(As per Annexure – I), but did not conduct supplementary audit of the Financial Statement of subsidiaries, Joint Ventures and
Associates (As per Annexure – II) for the year ended on that date. This supplementary audit has been carried out independently
without access to the working papers of the statutory auditors and is limited primarily to enquiries of the statutory auditors and
company personnel and a selective examination of some of the accounting records.
On the basis of my audit nothing significant has come to my knowledge which would give rise to any comment upon or supplement
to statutory auditors’ report.
For and on behalf of theComptroller & Auditor General of India
Sd/-Parama Sen
Principal Director of Commercial Audit
& ex-officio Member, Audit Board - II, Mumbai
Place : Mumbai
Date : 10 July, 2015

Comments of C&AG
115
Audit not conducted
A Subsidiaries
1. ONGC Nile Ganga B.V.
2. ONGC Campos Ltda.
3. ONGC Nile Ganga (Cyprus) Ltd.
4. ONGC Nile Ganga (San Cristobal) B.V.
5. ONGC Satpayev E&P B.V.
6. ONGC Caspian E&P B.V.
7. ONGC Amazon Alaknanda Limited
8. ONGC Narmada Limited
9. ONGC (BTC) Limited
10. Carabobo One AB
11. Petro Carabobo Ganga B.V.
12. Imperial Energy Limited
13. Imperial Energy Tomsk Limited
14. Imperial Energy (Cyprus) Limited
15. Imperial Energy Nord Limited
16. Biancus Holdings Limited
17. Redclif fe Holdings Limited
18. Imperial Frac Services (Cyprus) Limited
19. San Agio Investments Limited
20. LLC Sibinternef t
21. LLC Alliancenef tegaz
22. LLC Nord Imperial
23. LLC Rus Imperial Group
24. LLC Imperial Frac Services
25. Beas Rovuma Energy Mozambique Ltd.
26. ONGC Videsh Rovuma Ltd.
27. ONGC Videsh Atlantic Inc.
B Joint Venture Entities
1. Dahej SEZ Limited
2. Petronet LNG Limited
3. Mangalore SEZ Ltd
4. ONGC Tripura Power Company Ltd.
5. ONGC Teri Biotech Ltd.
6. Shell MRPL Aviation Fuels & Services Limited
7. Mangalam Retail Services Ltd
8. ONGC Mit tal Energy Limited
9. PetroleraIndovenezolana S.A.
10. South East Asia Gas Pipeline Company Ltd.
11. Tamba B.V.
12. Himalaya Energy (Syria) B.V.
13. Petro Carabobo S.A.
14. Carabobo Ingenieria Construcciones S.A.
C Associates
1. Pawan Hans Limited.
Audit conducted
A Subsidiaries
1. ONGC Videsh Limited (OVL)
2. Mangalore Refinery and Petrochemicals Limited (MRPL)
3. ONGC Mangalore Petrochemicals Limited (OMPL)(MRPL – 51% & ONGC – 49%)
B Joint Venture Entities
1. Petronet MHB Limited (PMHBL)
2. ONGC Petro Additions Limited (OPaL)
Annexure – I Annexure – II

ONGC's B193 plat form being installed by float-over technology. The landscape of of fshore installation technology has changed dynamically over the past decade driving project excellence. The float-over technology has greatly decreased installation time of mammoth of fshore structures, resulting in quicker production.

Management Discussion & Analysis Report
Corporate Governance Report
Auditors Certificate On Corporate Governance

Annual Report 2014-15
Management Discussion and Analysis Report
118
and rejig fiscal positions in economies with fuel subsidies. However, in an environment of low oil prices, it must be noted the at tendant pickup in the demand cycle which is expected to boost the domestic growth cycle will be dependent on the degree of pass-through that respective governments allow to reach consumers.
The exchange rate volatility, on the other hand, to a large extent, reflects the changing broader sentiment in the market related to the growth prospects of individual economies. Here, the appreciation of the US dollar over the last one year, particularly, relative to that of the currencies of other advanced economies reflect the strengthening confidence around the medium-term prospects of a stable growth pattern taking root in the US. Also, the strengthening of the US currency implies that most countries experienced a somewhat smaller decline in oil prices relative to the headline US dollar figure.
As for the emerging market and developing economies, the group, on the evidence of activities in 2014 and the early part of 2015, has moved into a period of marked deceleration as slower growth in its major countries exer ted significant downward pressures on the buoyancy and expectations of markets, at least for the medium term. Powerhouse China, especially, following on its commitment to a more demand-led growth as opposed to their historical tendency for an investment-intense regime, has markedly scaled down their sizeable infrastructure programmes. Russia was hit by wild currency fluctuations and the imposition of economic sanctions by the western world. Brazil found itself in the grip of unusually weak economic activity. So, India’s improved economic performance in 2014, largely a result of the reformist and market-oriented approach of its new government, was a much needed shot in the arm for the group of emerging economies engulfed as they mostly are by tell-tale signals of an overall slowdown.
Management Discussion and Analysis Report
1. Global Economy
The global economic landscape in 2014 continued to portray a picture of cautious optimism, occasionally disturbed by bouts of uncertainty and conservatism. Growth did not pick up in a manner that justified the gradual and definite progress made by advanced economies in 2013 which was assumed to have provided a strong foundation for a pickup in the momentum of economic recovery globally. Legacies of both the financial and euro area crises are still a matter of substantial concern for many countries as they at tempt to put in place a more robust and resilient economic framework with an eye on a sustainable and more predictable growth outlook.
In 2014, in what is reflective of the emergence of further dissimilarities in the growth trajectories among the major economies, whereas the recovery pat tern of the US looked stronger than expected the same in other major regions of the world was underwhelming for the most part with some having even flir ted with a slip back into a recessionary spiral at times, such as Japan. As per the World Economic Outlook 2015, aging, together with a slowdown in total productivity, has played a part in dampening the prospects of a faster turnaround in the developed group of countries.
Moreover, two other significant trends weighed in majorly on the global growth cycle: the spectacular decline of crude prices and large exchange rate movements. The slide in oil prices has been the net result of variety of forces: weaker-than-expected global activity; weaker demand for oil, given activity and, most impor tantly, greater supply. This development while weighing down heavily on oil-export dependent economies will prove to be immensely beneficial to large scale oil importers like India by easing inflationary pressures as well as reducing sovereign trade deficits. Moreover, it also provides some much needed fiscal space to rethink

Management Discussion and Analysis Report
119
Overall, in numbers, global growth in 2014 was a modest 3.4 per cent, reflecting a pickup in growth in advanced economies relative to the previous year and a slowdown in emerging market and developing economies. The block clocked a below-par growth of 4.6 per cent, marking 2014 as the third consecutive year that the group had to set tle for a sub-5 per cent growth. In comparison, the advanced economies grew at an annualised 1.8 per cent, a marked upswing from last year’s performance (1.4 per cent in 2013). Despite the slowdown, due to the sheer volume of their trade and business, the emerging market and developing economies still accounted for three-fourths of global growth in 2014.
Growth in the United States was stronger than expected, averaging about 4 per cent annualized in the last three quarters of 2014. Consumption—the main engine of growth - has benefit ted from steady job creation and income growth, lower oil prices, and improved consumer confidence. The country continues to be the cornerstone of economic resurgence among the group of developed economies having sustained an impressive trend of positive growth over the last few years in the af termath of the debilitating economic meltdown of 2008. For the world economy at large, the solidity and health of the US economy is, arguably, the best possible buf fer in the face of any potential turmoil or volatility in the markets.
Globally, in terms of future outlook, global growth is projected to increase slightly from 3.4 per cent in 2014 to 3.5 per cent in 2015 and then to pick up further in 2016 to an annual rate of 3.8 per cent. The increase in growth in 2015 will be driven by a rebound in advanced economies, supported by the decline in oil prices, with the United States playing the most important role. The growth rate in the country is projected to nudge above 3 per cent in the current year as well as in 2016, with domestic demand supported by lower oil prices, more moderate fiscal adjustment, and continued support from an accommodative monetary policy stance.
In the Euro area, although lower oil prices, lower interest rates and euro depreciation are expected to provide a boost to its economic recovery, growth will continue to be moderated by the lingering ef fects of the block’s financial crisis with few of the countries yet to emerge clearly out of the woods. Specifically, growth is expected to increase from 0.9 per cent in 2014 to 1.5 per cent this year and 1.6 per cent in 2016.
In emerging markets, in contrast, growth is projected to decline in 2015 - for the fif th year in a row. A variety of factors explain this decline: sharp downward revisions to growth for oil exporters, especially countries facing dif ficult initial conditions in addition to the oil price
shock (for example, Russia and Venezuela); a slowdown in China that reflects, as identified earlier, a move toward a more sustainable pat tern of growth that is less reliant on investment; and a continued weakening of the outlook for Latin America resulting from a sof tening of other commodity prices. For China, growth is expected to decline to 6.8 per cent this year and 6.3 per cent in 2016.
Indian Economy
Among the group of major emerging economies, the economic growth trajectory that India charted in 2014 provided ground for necessary cheer and optimism, in the regional as well as the global arena. In 2014, India’s GDP grew at a rate of 7.2 per cent, a promising turnaround from the slackening economic fortunes of the preceding two years epitomised by a year-on-year dip in the country’s growth numbers. This pickup in growth is largely at tributable to recent policy reforms, a consequent pickup in investment, and lower oil prices. Particularly, the slide in global crude prices has had a positive impact on the country’s inflationary tendencies. Consumer price inflation fell from 8.3% in March 2014 to 5.1% in January’2015. It is estimated to average 6.5% in fiscal 2015 – down from 9.5% for fiscal 2014 – before heading even lower to 5.8% in fiscal 2016.
In terms of trade, the numbers, though, still do not present an outright flat tering picture. The country recorded US$310.5 billion worth of exports in FY15, down 1.2% from US$314.4 billion last year and 7.5% below the government’s target of US$340 billion. Exports had grown by 4.7% in FY14. Despite depreciation in rupee from 60.5/$ in FY14 to 61.1/$ in FY15, exports suf fered amidst weak global growth. However, the outlook for the Indian economy is one of sustained growth and that augurs well for the pickup in

Annual Report 2014-15
Management Discussion and Analysis Report
120
activity across all facets of the economy. As per the latest World Economic Outlook (April 2015), GDP growth in the country for 2015 and 2016 is projected to edge over 7.5 per cent on an annualised basis.
2. Global Energy Snapshot
Primary Energy Consumption
Total primary energy consumption in 2014 has been 12,928 MMtoe; consumption increased by just 0.9% in 2014, a marked deceleration over 2013 (+2.0%) and well below the 10-yearaverage of 2.1%. Growth in 2014 slowed for every fuel other than renewable, which was also the only fuel to grow at an above-averagerate. Growth was significantly below the 10-yearaverage for Asia Pacific, Europe & Eurasia, and South & Central America. Consumption increased for all fuels, reaching record levels for every fuel type except nuclear power; production increased for all fuels except coal. For oil and natural gas, global consumption growth was weaker than production. Oil remained the world’s leading fuel, with 32.6% of global energy consumption, but lost market share for the fif teenth consecutive year. Although emerging economies continued to dominate the growth in global energy consumption, growth in these countries (+2.4%) was well below its 10-year average of 4.2%.
OECD consumption experienced a larger than average decline (-0.9%). Energy consumption in the EU (1,611.4 MMtoe) fell to its lowest level since 1985.A second consecutive year of robust US growth (+1.2%) was more than of fset by declines in energy consumption in the EU (-3.9%) and Japan (-3.0%). The fall in EU energy consumption was the second-largest percentage decline on record (exceeded only in the af termath of the financial crisis in 2009).Non-OECD economies (+2.4%) contributed to the growth in energy consumption as OECD economies consumption fell by 0.9%, which was a larger fall than the recent historical average. China (+2.6%) and India (+7.1%) recorded the largest national increments to global energy consumption. Chinese growth (+2.6%) was the slowest since 1998, yet China still recorded the world’s largest increment (74 MMtoe) in primary energy consumption for the fourteenth consecutive year. Chinese growth slowed (+2.6%); below 10 year average of 4.2%. India's energy demand grew at robust 7.1%. US consumption increased (+1.2%) for the second straight year.
Crude oil: Demand & Supply
Global demand for liquids, around 91-92 million barrels per day, was stable enough not to invite any concern. The Nor th American unconventional

Management Discussion and Analysis Report
121
systemic upheaval unless something dramatic happened.
Most importantly the slackening demand in China will tell on the overall global demand growth; demand for oil in China is projected to grow at just over 300,000 bpd, a substantial drop from a demand of close to 1 mbpd in 2010.
Crude oil prices
The steady rise in prices that followed the much fevered speculation of ‘Peak Oil’ in the mid-2000s and which was accompanied, all along, by enthusiastic declarations in the industry embracing “$100 as the new normal” endured a spectacular reversal in fortunes in 2014. At its worst, the prices plunge by almost 60 per cent from their mid-June highs of 2014. However, before the dramatic rout of crude oil, which pret ty much was the story of the year in global energy circles, oil prices had hovered comfortably over and around the $100 per barrel mark over the last two preceding years. In the process, it had brought into the energy markets a semblance of stability, a much desired but mostly elusive condition for energy operators worldwide. The stable high-price environment, which now, in hindsight, almost looks like a myth that had to be eventually ruptured, incentivized risk-taking and allowed for more ambition in the oil and gas setup, particularly in the upstream
revolution that saw crude supplies in the once heavily-import dependent US skyrocket from around 4.5 million barrels per day (mbpd) in 2008 to over 9 mbpd by the end of 2014 was anything but new. Geopolitical tensions, as in earlier years, continued to simmer in the landscape (Syria, Yemen, South Sudan) with occasional heightening of intensity (IS in Iraq, the Ukraine crisis). And the world was nowhere close to slipping back into recessionary times as the advanced economies, particularly the US, seemed to be doing a good job of stripping away the strains from the dif ficult post-2008 period.
And yet with everything remaining largely static on the surface the picture has undergone such a radical shif t. It was just the fundamentals at work at the end of the day with a ‘lit tle’ help from the OPEC. Global supply growth had, for the past few years, consistently outrun demand growth, by almost 550,000 bpd.
With high oil prices the outlook for supply growth was unmistakably buoyant, at least in the mid-term, with even more players staking their resources, man and capital, into tapping more and more oil, be it on land unconventional or deepwater reserves. The threat from geopolitics, because of its ever-existent nature, was more a routine than abrupt and so the market response, too, to it was calibrated as per past experiences. It, thus, was unlikely to cause a sustained

Annual Report 2014-15
Management Discussion and Analysis Report
122
space where operators placed their bets on more aggressive exploratory ef for ts and challenging development projects.
But stability is a rare currency in the industry where companies are continuously engaged in risk-reward roulet te, and the steep fall in prices is not entirely exceptional in an industry which has experienced quite a few volatile price cycles before this recent disruptive event. That being said, the fall is significant not just for its extremity but also for the fact that it signals and, essentially, reinforces the deeply complex nature of energy markets worldwide and how a wide variety of forces influence the fundamentals on the ground.
The anemic rise in demand for energy was the first catalyst for the current episode of drop in global crude oil prices. And then was the decision of OPEC. In their November 2014 meeting OPEC decided not to cut down their supplies even as prices began to slide. This, ef fectively, served as the decisive move that signaled the free fall of prices with no immediate cutbacks in production in sight. Although prices have recovered somewhat from their worrying lows of January 2015, the fundamentals are still weak (high global crude inventories; no significant drop in US output; global economy far from picking up speed; the possibility of Iran returning to the markets in the event of a successful negotiation over its nuclear program with the group of western countries) and chances of further sof tening cannot yet be ruled out. Here, the potential return of Iran to the table is of importance considering the country with the resultant impact of further aggravating the supply glut and bearing down on crude prices.
Fall in crude oil prices and the industry
The fall in crude prices, over the last one year, has had far reaching ramifications within the oil and gas industry globally, especially in the upstream space. And the foremost concern in this respect is how are low prices going to exert brakes, if any, on global liquids output. However, as yet, there are no reported tangible output cuts in any major producing area that can be directly linked to this fall in prices and most of the recent recovery in prices is actually tied to higher refinery runs, maintenance-linked outages, spikes in geopolitical tensions and the occasional reaction to declining rig counts.
The US shale industry was expected to be the hardest hit in this downturn due to the cost-intensive nature of its operations. And any negative impact in shale output would immediately reflect in US numbers. But US crude production increased by 1.2 mbpd to 8.7 mbpd in 2014, the largest volume rise since 1900, the date the US Energy Information Administration started keeping records. Even going forward, output in the country is projected to grow healthily through 2015
and 2016 and breach the 9 mbpd mark. Although there will be some deceleration in the momentum as producers idle some rigs and cap less profitable or the ‘marginal’ wells, there will be gains made from increased drilling ef ficiency, cost-cut ting measures and greater productivity through targeting the ‘sweet spots’. In fact, as per research from energy consultancy Wood Mackenzie, even at $50 per barrel of Brent, only 190,000 b/d of oil production is cash negative, representing a mere 0.2% of global supply.
Talking about US unconventional sector, there has been a widespread view that at around US$85 or US$90 a barrel, extracting “tight” oil from shale would no longer be economical. But an IHS analysis based on individual well data finds that 80% of new tight-oil production in 2015 would be economic between $50 and $69 a barrel. And companies will continue to improve technology and drive down costs.
Although there is no immediate danger to major current production streams, the viability of future projects has been seriously dented by this slump in crude prices. Global oil and gas exploration projects worth more than US$150 billion are likely to be put on hold in 2015 as plunging oil prices render them uneconomic, data shows, potentially curbing supplies by the end of the decade. It is worth bearing in mind that even with oil at US$120 a barrel, the economics of some projects around the world were in doubt as development costs soared in recent years. Some of the projects that are likely to face the axe or deferral are Canadian oil sands, high capex LNG projects such as Shell’s project in British Columbia, Statoil's Johan Castberg field in the Barents Sea and Chevron's North Sea Rosebank project. In the deepwater arena, the volume at risk of cancellation/delay at a Brent crude price <$60/bbl varies among IOCs depending on the geographic distribution of a company’s deepwater port folio. Statoil has the highest volume at risk (~87% of unsanctioned new source deepwater production with a breakeven at or above US$60/bbl) due to the port folio dominance of high-cost, high government-take projects in Norway.
The international players, particularly the majors, have long prided in their ability to generate healthy returns; however, even in a high oil price environment of the preceding years, increasing costs of upstream field services and project development had severely eroded the profitability of most of these industry behemoths (from a high of over 30 per cent in 2008 to just over 10 per cent in 2013) resulting in a strong backlash from the community of investors who demanded stronger returns from companies with a shif t in focus to ‘value’ over ‘volume’ growth. This trend which already was a talking point of the industry in 2013 and forced some of the leading companies to trim

Management Discussion and Analysis Report
123
their expenditure plans for 2014 assumed even greater salience in the face of the onslaught to global crude oil prices. The returns of global majors in 2014 were, inevitably, worse than that in the previous year. And the response from companies to this was predictable: budget cuts.
The price drop in combination with the budget cuts announced by the major oil and gas companies will bear down heavily on worldwide exploration spending. Globally, exploration spending is projected to fall from a 2014 peak of close to US$100 billion to around the US$70 billion mark in 2015. Regardless of the level of cuts, budgets are likely to be revisited constantly through the year. But until crude prices rise suf ficiently to occasion any upward revision to budgets, companies are likely to defer high cost drilling in frontier and emerging basins in favour of lower-cost, lower-risk options. The slackening of activity will also force down capital costs in the industry; upstream capital costs are expected to decline globally by approximately 12% on average between 2014 and 2016 of fshore and 7% onshore. The role of E&P companies and how they approach the low-price environment be it through capex adjustments, reallocation of resources, and strategy will be critical in determining what the global oil market could look like in the next two years.
Although the primary events that played out in the oil and gas industry in 2014 and the first few months of 2015 can be interpreted as a matter of triumph of market fundamentals over geopolitical influences in determining market trends, it is hard to imagine global oil markets beref t of any geopolitical undertones given the inherently strategic moorings of the industry and how deeply ‘oil and gas’ af fects the economic fortunes of a fair share of countries on the global map.
Gas Business: Production & Consumption
Globally, natural gas accounted for 23.7% (same as in 2013)of primary energy consumption. World natural gas consumption grew by just0.4%, well below the 10-year average of 2.4%.Growth was below average in both the OECD and emerging economies, with consumption in the EU (-11.6%) experiencing its largest volumetric and percentage declines. The Europe & Eurasia region (-4.8%) had the five largest volumetric declines in the world in Germany (-14.9%),
Italy (-11.6%), the Ukraine (-15.7%), France (-16.3%) and the UK (-9.2%).The US (+2.9%), China (+8.6%), Saudi Arabia (8.2%) and Iran (+6.8%) recorded the largest growth increments. India recorded gas consumption decline of 1.5%.
Global natural gas production grew by 1.6%, below its 10-year average of 2.5%. Growth was below average in all regions except North America (6.1%), Middle East (3.5%) and Asia Pacific (3.7%). EU production fell sharply (-9.8%) to its lowest level since 1971. The US (+6.1%) recorded the world’s largest increase, accounting for 77% of net global growth. The largest volumetric declines were seen in Russia (-4.3%) and the Netherlands (-18.7%). India registered production decline of 5.9%.
(Reference: BP Statistical Review of World Energy 2015)
Global natural gas trade registered a rare contraction in 2014, falling by 3.4%. Pipeline shipments declined by 6.2%, the largest decline on record, driven by falls in net pipeline exports from Russia (-11.6%) and the Netherlands(-14.1%). The UK (-28.2%), Germany (-10.1%) and the Ukraine (-29.9%) all reduced their net pipeline imports markedly.
Exxon Mobil slashed its capital budget by $4.5 billion; BP is set on trimming its spends by as much as $2 billion; Royal Dutch Shell has commit ted to slash investment by $15bn (£9.9bn) over the next three years.

Annual Report 2014-15
Management Discussion and Analysis Report
124
Coming to Russia, the country’s continuing tensions with Ukraine related to the disputed gas contract between Russia’s Gazprom and Ukraine’s Naf togaz Ukrainy, in the af termath of Crimean crisis, has its ef fect on pipeline gas trade from Russia. This has potential to disrupt Russian gas supplies to continental Europe. A major break in supplies, in the event of Ukraine’s refusal to allow transit of Russian gas through its mainland, will not only have damaging repercussions in an energy-deficient Europe but it also carries serious implications for the sovereign revenues of a heavily-export dependent Russia. However, the chances of that happening are remote considering strategic nature of the Russian pipeline supplies, and the involvement of European mediators in the discussions between Russia and Ukraine is a testament to that. The episode, however, did raise some uncomfor table questions regarding the worrying degree of inter-dependence between Europe and Russia in an environment of geopolitical volatility and tensions arising out of Western sanctions on Russia.
Next, Russia’s historic gas deal with China was another reason that the country remained in the churn of global energy news. Af ter years of negotiations, Russia and China finalized huge multi-billion dollar long-term gas
supply deals, which when implemented, will see Russia transport record amounts of gas to Chinese markets each year. Both the deals together are valued at close to $800 billion over a 30 year period. The deals come close on the heels of mounting tensions between Russia and the West and that invariably gives them a geopolitical undertone as many interpret the move as part of Russia’s larger plan to shif t its economic focus to Asia.
During 2014, global LNG trade registered an increase of 2.4%. Higher imports by China (+10.8%), Mexico (+19.55), UK (+20.1%) and India (+6.1%) were partly of fset by declines in US (-38.4%), Canada (-45.1%), France (-18.4%), South Korea (-5.7%) and Italy (-17.7%).
Natural gas prices
Natural gas must compete with more competitively priced oil, and oil-indexed contracts imply lower realized prices and lower returns as LNG contract prices are set to follow oil prices down. Though Average LNG price in Japan during 2014 increased by one per cent over 2013; it dipped significantly in the fourth quarter of CY2014. LNG prices in Japan fell 17 per cent in December 2014 from a year earlier, the biggest drop since 2009, to $13.68/mmBtu, World Bank data show. LNG price is expected to fall further as Credit Suisse reports average import prices into the world's top buyer (Japan) are forecast to fall to about $11 per mmBtu next year, down from an estimated $16.33 in 2014 and $16.17 in 2013, if Brent crude averages around $75 a barrel. Overall in Asia, as per Bloomberg Finance, LNG costs in Asia will this year average below $10 per mmBtu for the first time in four years. Lower import prices must bode well for importers like India but here they have to compete with much cheaper coal.
Prior to the sharp fall in global crude oil prices, the liquefied natural gas (LNG) industry faced two major challenges: volume, that is lack of strong market demand and spiraling costs (capital cost of a green

Management Discussion and Analysis Report
125
field liquefaction project has increased by up to four or five times, from between $350 and $600 per metric ton to anywhere between $1,200 and $2,000). Now the industry faces a fresh challenge: Value.
The impact of low oil prices will hit hard the two main protagonists of LNG development - the IOCs and the NOCs of exporting countries. As both groups retrench, LNG development is likely to suf fer collateral damage. As per Moody's the low LNG prices will result in the cancellation of the vast majority of the nearly 30 liquefaction projects currently proposed in the US, 18 in western Canada, and four in eastern Canada. However, projects already under construction will continue as planned, which will lead to excess liquefaction capacity over the rest of this decade.
3. Indian Oil & Gas Industry
Crude Oil & Natural Gas production
Crude oil production in FY’2014-15 was slightly more than the previous year at 37.81 million metric tonnes (MMT) compared to 37.78 MMT of the previous financial year. Despite natural decline of the matured fields, from which the majority of the output accrues, that ONGC and Oil India Limited (OIL) operate; production from Western Of fshore (ONGC) registered a growth of 7.5% whereas the Pvt Companies/PSC
Joint Ventures saw an increase in output by 0.8% (against 3.7% during the previous year).
Natural Gas output in FY’2014-15 was 33.58 billion cubic metres (BCM), a 5% decrease from FY’2013-14 output of 35.39 BCM. Output of ONGC and PSC-JVs declined by 5% and 7% respectively, compared to the previous fiscal. Whereas OIL production increased by about 4%. The significant fall in annual gas output from the East Coast field operated by a private consortium contributed to the short fall in cumulative gas output of the country.
Consumption of Petroleum Products
Domestic petroleum products consumption picked up significantly by 4.2 per cent y-o-y during 2014-15 (165 MMT), as against meager growth of 0.6% per cent y-o-y growth achieved in 2013-14 (158 MMT).Four major products i.e., HSD (42.1% of total consumption), Motors Spirit (11.6%), LPG (10.9%), Petroleum Coke (8.7%) and ATF (3.4%) accounted for 76per cent of total petroleum products consumption. These five products accounted for 7.9per cent increase in consumption. On the other side, Naphtha, SKO, Bitumen and other products recorded decline in consumption by3.9%. Consumption of Petroleum Coke increased mainly due to increase in its use in
ONGC OIL PSC-JVs
25.98 25.95
3.47 3.478.33 8.39
FY'14 FY'15
Crude oil (MMT)37.78 37.81

Annual Report 2014-15
Management Discussion and Analysis Report
126
cement industry and power generation. Motor Sprit (MS) consumption increased due to higher consumption by the passenger vehicles which registered a substantial growth in sales (3.9%) during the year. Lower petrol prices also had an ef fect on consumption. LPG consumption had a positive growth of 9.4% due to increase in number of customers from 166 million in 2014 to 182 million in 2015.
Import and Export
Total crude oil import for FY 2014-15 was 189.43 MMT almost same as the imports during FY 2013-14 (189.24 MMT; increase of 0.1%). However, import of petroleum products (20.28 MMT) increased by 21 per cent on y-o-y basis, mainly on account of increase in import of LPG (26%), MS (58%), HSD (35%),Bitumen (80%), and other products like - Aviation gas, Pet Coke (33%), etc. Petroleum products export declined for the first time in last 15 years; registering a decline of 6.2per cent mainly on account of decline in export of Naphtha, Fuel oil, Bitumen, etc.
With total import (crude and petroleum products) combined with total products export of 63.66 MMT translates to net import volume of 146 MMT for FY 2014-15. Net import bill for crude oil during FY 2014-15 was `6,873.50 billion (US$ 112.75 billion) against `8,648.75 billion (US$ 142.96 billion) during FY 2013-14 – a decrease of 20.5 per cent in terms of the Indian Rupee and decrease of 21.13 per cent in dollar value mainly on account of lower crude oil prices in the international market.
Crude oil Price: Indian Basket
Crude oil price of the Indian basket averaged US$ 84.16 per barrel (`5,143 per barrel) during FY 2014-15 compared to US$ 105.70 per barrel (`6,380 per barrel) in the previous fiscal (FY 2013-14); a decrease of 20.4 per cent in dollar terms (19.3 per cent in Rupee term). Slide in oil prices started from August 2014 and recorded lowest average of US$ 46.59 per barrel during January 2015. Subsequently, it climbed up to
average US$ 55.18 per barrel during last month (March) of the fiscal 2014-15.
The registered decrease has been mainly due to lower crude oil prices in the global market due to comfortable crude oil supply scenario and other geopolitical and economic development, as detailed earlier in the report.
Diesel deregulation
The Government’s move to decontrol diesel prices, like MS (Petrol)with ef fect from October 18, 2014, midnight, was one of the salient highlights of the last year in terms of its overall impact on the finances of the state oil companies and the government’s fiscal balances. It also reaf firmed the reformist disposition that the government has embraced in dealing with matters of national economic significance and fuel subsidies, most certainly, featured high among the concerns that the government identified for focused intervention. From FY’2010-11 to FY’2014-15, under-recoveries in diesel amounted to `2,817.31 billion, accounting for more than half of the total under-recoveries (`5,458.54 billion) during those five years. From the point of view of oil companies, money saved by way of reduced outgo on subsidies could be put to use in funding programmes that cater to strengthening the country’s domestic supplies, thereby reducing our increasing reliance on costly imports. A direct impact of this move will be on the government’s fiscal deficit situation, profitability of domestic upstream players and cash flows of oil marketing companies on account of reduction of under-recoveries.
Under recoveries on sensitive products
Complete deregulation of the fuel, ef fectively linking diesel to market price movements, marks a desirable completion of a process that started of f with its phased deregulation or periodic revisions in early 2013. It must be noted that the period of staggered price corrections had already primed the customers for a more market-based system and when the dramatic slide in global oil prices set in, the market conditions were the most

Management Discussion and Analysis Report
127
opportune for the government to remove the element of state of control from diesel prices. In doing so, the government has relayed the right signals to all stakeholders and potential investors about the intent and direction of reforms in the domestic oil and gas sphere.
The real test, however, many say, of the decision will be in a period of higher oil prices given as the move was achieved in a time of exceptionally low global crude prices. But in view of the continued commitment of policymakers to the earlier move to deregulate petrol prices and the results that have followed thereof, there are suf ficient reasons to believe that the current move to free prices of diesel will remain untouched through changes in the market environment.
Under-recovery on sensitive fuel (HSD, SKO & LPG) for the fiscal FY’2014-15 has been `723.14 billion; 48.3% lower than the fiscal FY’2013-14 (`1,398.70 billion). Under-recovery declined for consecutive two years mainly on account of lower prices of Indian crude oil basket. Also, it can be construed as the result of the Government’s decision to deregulate diesel prices.
Out of total under-recovery of `723.14 billion in FY’2014-15, the upstream companies shared `428.23 billion (59.2 percent) compared to `670.21 billion (47.9 percent) during FY’2013-14. The Government’s contribution has been `273.08 billion (37.8 percent) against `707.72 billion (50.6 percent during FY’2013-14); while Oil Marketing Companies (OMCs) contribution was 21.83 billion (3.0 percent) compared to 20.77 billion (1.5 percent of the total in FY’2013-14).
Your Company shared `363 billion towards the reported under-recoveries of OMCs in FY’2014-15 as per Government of India (GoI) instructions – a decrease of 36 percent over its share in FY’2013-14 (`563.84 billion). This translates to 50.2 percent of the total under-recoveries and 84.8 percent of the share for upstream companies.
The average gross price for ONGC’s crude oil during FY’2014-15 has been US$ 85.28/bbl compared to US$
106.72 in FY’2013-14, drop of 20.1per cent. However, as per the Government instructions pertaining to the subsidy-sharing mechanism, ONGC of fered an ef fective discount of US$ 40.4/bbl (US$ 65.75/bbl in FY’2013-14) to OMCs on the sale of crude oil. During the fourth quarter of FY’2014-15, ONGC did not have to bear any discount. Net realized price for every barrel of crude sold in FY’2014-15 for ONGC has been US$ 44.87/bbl, an increase of 9.5per cent compared to FY’2013-14 (US$ 40.97/bbl).
Gas Price Revision
The Government, af ter extensive discussions in policy making circles and consultations with the various agencies and stakeholders of the domestic energy setup, implemented the much-awaited decision to hike natural gas prices within the country on October 19, 2014. As per the decision, domestic gas prices were increased from the then existing US $4.2 per mmBtu to US $5.61 per mmBtu on net calorific value (NCV), or roughly 33 per cent, ef fective November 1, 2014 with subsequent revisions every six months. Needless to say, the increase in gas price has come as a huge relief to the upstream players of the country, particularly your Company ONGC. Natural gas was losing its market share in India due to expensive LNG imports
The modified gas pricing formula
P = (V *P + V *P + V *P + V *P )/ gas HH HH AC AC NBP NBP R R
(V + V + V + V )HH AC NBP R
Where, Pgas, PHH, PAC, PNBP and PR are the proposed price of domestic gas, annual average of daily Henry Hub, annual average of daily NBP (UK), (annual average of monthly Alberta hub) and Russia respective.
and,
VHH, VAC, VNBP and VR are is the volume of gas consumed in USA & Mexico, Canada, EU * FSU excluding Russia and Russia
The price and volume data used for calculation of applicable price shall be the trailing four quarter data with one quarter lag.

Annual Report 2014-15
Management Discussion and Analysis Report
128
and lack of domestic supply.
The latest round of revision to the gas prices, which were implemented on April 01, 2015, saw a reduction in domestic gas prices from US $5.61 per mmBtu to $5.17 per mmBtu on NCV basis for the period between April 1 and September 30, 2015 which essentially reflects the significant drops in global crude oil and LNG prices.
Reform measures: Introduction of more open-market elements
The reform measures like decision to decontrol diesel prices, gas price revision, rationalization of under-recoveries is a strong indication of the government’s drive to introduce more open-market elements into the domestic hydrocarbon business, and gives a timely fillip to investors’ sentiment which had weakened in recent times as a result of ongoing uncertainty around key policy decisions. The revision of gas prices, in particular, is expected to incentivize production from new gas reserves, the development costs of which have steadily increased over the years given that most of the promising finds of recent times, as is the trend world over, have been in dif ficult-to-produce areas.
What this price revision has also helped achieving is the transition from the existing multiple pricing regimes in gas to a uniform price structure as the revised gas price would be applicable to all gas produced from nomination fields given to ONGC and OIL India, NELP blocks, such Pre-NELP blocks where PSC provides for Government approval of gas prices and CBM blocks. However, production from logistically or operationally challenging terrains such as deep or ultra-deepwater and High Pressure High temperature zones will be accorded a special pricing regime owing to its special circumstances, the premium to which is currently under determination. Clarity on premium for producing from dif ficult areas will help incentivizing greater participation from
international players which in turn will facilitate introduction of advanced technologies in the sector.
The increased gas prices will, though, make power plants and fertilizer units more expensive. Every dollar increase in gas price will lead to a 1,370 per tonne rise in urea production cost and a 45 paise per unit increase in electricity tarif f (for just the 7% of the nation's power generation capacity based on gas). Also, there would be a minimum `2.81 per kg increase in CNG price and `1.89 per standard cubic metre hike in piped cooking gas (Source: Business Today; October 18, 2014). Despite these cost implications, it is a worthwhile move in view of the overall development of the energy infrastructure of the country, and one that is inherently essential to the creation of a competitive, remunerative and at tractive domestic gas market.
4. Operational Performance
FY’15 saw yet again the improved performance in bringing the planned and anticipated oil & gas volume on the surface. Oil & Gas production of ONGC Group, including PSC-JVs and from overseas Assets for FY’15 has been 58.33MMtoe (against 59.21 MMtoe during FY’14). The major upside came from the Western Of fshore fields which registered a growth of 7.5%. Overseas assets also registered a growth of 6% in production.
Out of the total crude oil production of 31.47 MMT, 71 percent production came from the ONGC operated domestic fields, 17 percent from the overseas assets and balance 12 percent from domestic joint ventures. As far as natural gas production is concerned majority of production (82per cent) came from ONGC operated domestic fields and of the remaining, 12per cent came from overseas assets and 6 percent from domestic joint ventures.
Oil and gas production profile from domestic as well as overseas assets during last five years are as given below:
Oil and gas production FY’15 FY’14 FY’13 FY’12 FY’11
Crude Oil Production (MMT) 31.47 31.49 30.47 33.13 34.04
ONGC 22.26 22.25 22.56 23.71 24.42
ONGC’s share in JV 3.68 3.75 3.57 3.21 2.86
ONGC Videsh 5.53 5.49 4.34 6.21 6.76
Natural Gas Production (BCM) 26.86 27.72 28.25 28.05 28.01
ONGC 22.02 23.29 23.55 23.32 23.09
ONGC’s share in JV 1.50 1.56 1.78 2.19 2.23
ONGC Videsh 3.34 2.87 2.92 2.54 2.69

Management Discussion and Analysis Report
129
Proved Reserves (MMTOE) FY’15 FY’14 FY’13 FY’12 FY’11
Estimated Net Proved O+OEG Reserves 936.44 961.91 968.81 963.86 961.27
ONGC 711.24 724.13 741.00 737.36 723.56
JV share 22.56 30.65 31.39 33.12 34.80
ONGC Videsh 202.34 207.13 196.42 193.38 202.91
Proved reserves
During the year, your Company made 22 oil and gas discoveries in domestic fields (operated by ONGC). Out of 22, 10 discoveries are in Of fshore area and 12 in Onshore area. Ten discoveries were made in the new prospects whereas 12 were new pool
discoveries. Seven discoveries were made in NELP blocks and fif teen in the nomination blocks. Out of the discoveries made this year, 7 discoveries are oil bearing, 9 discoveries are gas bearing and 6 discoveries are both oil & gas bearing. Position of proved reserves of your company is as below:
5. Financial performance: ONGC (Standalone)
(` Million)
Particulars FY’15 FY’14 % Increase/ (Decrease)
Revenue:
Crude Oil 536,638 525,734 2.07
Natural Gas 187,381 183,291 2.23
Value Added Products 99,469 125,672 (20.85)
Other Operating revenue 7,447 7,331 1.58
Total Revenue from Operations: 830,935 842,028 (1.32)
Other Income 53,666 67,132 (20.06)
EBIDTA 380,163 433,582 (12.32)
PBT 265,552 324,319 (18.12)
PAT 177,330 220,948 (19.74)
EPS 20.73 25.83 (19.74)
Dividend per share 9.5 9.5 -
Net Worth 1,436,229 1,356,311 5.89
% Return on net worth 12.35 16.29 (3.94)
Capital Employed 1,144,994 1,094,412 4.62
% Return on capital employed 33.20 39.62 (6.42)
Capital Expenditure 299,975 3,24,695 (7.61)

Annual Report 2014-15
Management Discussion and Analysis Report
130
6. Peer Review
Continuing its dominant position since all those long years, this year too, your Company has been the
largest producer of oil and gas in the country (from its domestic operations) contributing 69 per cent of oil and 70 per cent of natural gas production.
ONGC Group
Particulars FY’15 FY’14 % Increase/ (Decrease)
Revenue:
Crude Oil 662,844 654,029 1.35
Natural Gas 204,306 194,594 4.99
Value Added Products 775,317 920,783 (15.80)
Other Operating revenue 18,201 12,645 43.94
Total Revenue from Operations: 1,660,668 1,782,051 (6.81)
Other Income 59,644 68,899 (13.43)
EBIDTA 482,658 566,434 (14.79)
PBT 273,704 394,134 (30.56)
PAT 183,335 265,065 (30.83)
EPS 21.43 30.98 (30.83)
Net Worth 1,794,742 1,710,555 4.92
% Return on net worth 10.22 15.50 (5.28)
Capital Employed 1,781,914 1,447,991 23.06
% Return on capital employed 27.09 39.12 (12.03)
Your Company’s financial performance compared to performance of Oil India Limited (OIL) in FY’15 is as below:
(` million) ONGC OIL
Revenue 8,30,935 110,200
Profit Af ter Tax (PAT) 1,77,330 25,100
Networth 1,436,229 214,980
ONGC’s finding cost has been US$ 7.0/boe (3 years’ rolling average up to FY’14) and lif ting cost (including royalty) US$ 8.6/boe (3 years’ rolling average up to
2014) has been well competitive with respect to the global peers.
India: Natural Gas production

Management Discussion and Analysis Report
131
7. Opportunities & Threats
‘The more the things change, the more they remain the same’. It would be dif ficult to come up with a more pertinent expression to describe the flux and churn that characterised the energy industry, especially the oil and gas sector, in the last one year. Technology created new avenues of opportunities and with those oppor tunities came a new wave of optimism, adventure and aggressive activity in the business that lent well to a strengthening bullish sentiment on the future outlook for E&P operators globally.
Challenging projects were approved and undertaken premised upon the high and stable oil prices; NOCs moved ambitiously into the international arena, once the preserve of the global oil majors, to cater to the ever-growing demand for energy back home even as the established players moved further into more dif ficult terrains in a bid to retain their relevance as well as lock in their future avenues of cash and growth. And the supplies just kept growing, but demand didn’t move in tandem.
And then the prices tanked in the backdrop of a global economic recovery that was largely inconsistent and not so confident. Suddenly, projects began to look suspect and the enthusiastic projections about the steady growth of supplies hung in the balance. Cost-cuts and budget or port folio rationalisation became more common in practice as operators scrambled to either keep businesses afloat or protect their margins while simultaneously contending with mounting debts, irate shareholders and the threats of losing market share. A grim landscape but a situation not unfamiliar for the oil and gas sector.
Even in this scenario, there are opportunities to be tapped into and the companies that do manage to balance their risk mitigation templates with an acceptable degree of growth-oriented approach will stand to benefit the most once the tide turns. Some are already doing that – be it through ef ficient technology deployment or capital investment. IHS Energy expects
a 25-30% gain in the average ef ficiency of onshore upstream capital investment in 2015 versus 2014 and a gain of 45% when comparing 4Q2015 to 4Q2014. Eventually, the criticality of the sector does not allow it to remain passive for long, and it is those companies which are adaptive and clued in to changing context that can potentially be at the forefront of the next cycle of high growth.
As per BP Energy Outlook 2035 (published in January 2015), global energy demand is projected to expand by 37 per cent between 2013 and 2035. The energy mix will undergo changes during this period: renewables (including biofuels) are expected to grow from its current share of 3 per cent to 8 per cent globally while the contribution from nuclear and hydro sources remains largely static in this time frame.
Although its cumulative share in the basket comes down, fossil fuels continue to be the dominant source of energy with a share of 81 per cent in 2035. Essentially, the oil and gas industry, irrespective of the many extraneous challenges it faces and the sharply cyclical nature of its markets, will remain fundamental to the pace of global economic and social growth. Global liquids demand (oil, biofuels, and other liquids) is projected to rise by around 19 mbpd, to reach 111 mbpd by 2035 whereas demand for natural gas, the fastest among the fossil fuels (1.9 percent), fuelled largely by global transition to cleaner energy sources, reaches 4,900bcfpd in 2035.
Vir tually, all of this growth in energy demand is slated to come from non-OECD countries (96 percent) and with China (as mentioned earlier) markedly decelerating from its turbo-charged growth trajectory of the past decade the focus shif ts to India in terms of not just picking up the slack but also providing the next big boost to global energy consumption. The IEA’s Medium Term Oil Market Report (2015) tips India, currently the fourth largest energy consumer in the world, to upstage Japan as the world’s third largest oil consumer by an expanding economy and a robust

Annual Report 2014-15
Management Discussion and Analysis Report
132
demand driven by factories and the automobile sector.
Overall, India’s energy production rises by 117% to 2035 while consumption grows by 128%.This projected supply deficit then has the potential to further compound the stress for an economy that is already hugely reliant on costly imports. Herein lies the enormous opportunity for all the stakeholders in the energy sector in India. The task is huge for Indian companies particularly for your company, ONGC, the flagship energy company in this highly strategic and nationally critical sector.
What has really aided the growth of the sector and motivated oil and gas operators across the globe to persist in the pursuit of all current and emergent opportunities is the technology evolution in the industry over the past few years as companies have consistently extended the boundaries of frontier exploration and successfully realized volumes from resources that were hitherto deemed commercially unviable or geologically dif ficult. The unconventional blitz in North America is a fit ting testament to the possibilities that have been unlocked through the technological breakthroughs of the past years. Although the present low oil price regime, with companies having executed an average of 30 per cent capex cuts, makes riskier upstream projects and aggressive exploratory targets less viable, the companies that continue to judiciously invest in upgrading their technological base and improving their ef ficiencies in technology application will remain better positioned than others to weather the ongoing downturn in prices.
It must not be forgotten that, despite the oil price blip of the last one year or so, the industry has generally witnessed strong returns from frontier exploration (@13%), from mature fields (@16%) and from emerging basins (@15%). So, once the prices recover, the push for projects that bring new oil into the market will return with renewed vigour and confidence. Till such time when prices stage a reliable turnaround, the “Value over Volume” approach, a trend which had already found takers among big oil companies even in the high oil price scenario of 2013, is expected to intensify in the upstream space as companies keenly commit to maximizing production and returns from existing reserves and producing streams in lieu of expending resources to pursue volume potential in frontier areas. The threats of high breakeven costs are further compounded in the present scenario as many of these new oil projects (~3.5 mbpd) need break-even of US$ 60-80/bbl. Companies, in the current situation, are most likely to defer high-cost drilling in favour of lower-cost, lower-risk options.
Notwithstanding the exploratory budget cuts, the industry will also experience an average 33 percent cost exploration cost as a result of weakening exploration activity and tapering demand for drilling
services. Lower exploration costs will help reduce breakeven prices and improve full-cycle economics by up to US$5/boe. Some of the best improvements will be in deepwater plays. Although just half of the cost deflation gains are expected to be enjoyed in 2015, the full benefits will filter through to E&P players in 2016. For example, seismic acquisition costs are down by 50 per cent making seismic acquisition a low-cost option to continue progressing on frontier acreage. Also, E&P companies are likely to persist with their activity in basins with running room where geology is bet ter understood and infrastructure is in place, which both reduce cycle times. The time is right for STRONG EXPLORERS to capitalise and “do more with less”, increasing their drilling in high-impact plays. Also, unique factors in certain regions will act as local props to exploration - commitments in Angola's Kwanza Basin, lease expiries in deepwater Gulf of Mexico (GoM), strong gas prices in the Netherlands. What this period of relatively lean exploration also of fers is the opportunity for geoscientists and geologists perform more rigorous analysis of data and thereby improve the qualit y of the prospect pipeline. The 2010/2011drilling moratorium in GoM had a similar ef fect and arguably led to a stronger prospect inventory and healthier results in the past two years.
A common refrain among upstream players over the last decade has been the diminishing frequency of big-sized finds and how that has further jeopardized the prospects and optimism around the sector in a situation where cashflows are further squeezed. But it does not necessarily mean smaller fields become complete non-starters as IHS-CERA says it is not uncommon to see long production life for small fields – close to 20% of fields in the size range of 20 to 500 Mmboe have been producing for over 50 years. Steady evolution of technology and its ef fective deployment has resulted in extending field life cycles. IHS estimates that potentially upwards of 140 bboe remains in existing, low-quality oil fields, based on a high-level assessment. And existing reserves are being continually revised upwards as new API tools and techniques become mainstream and are integrated in current models. Right there, that’s a substantial opportunity for oil and gas companies. Your Company’s time-bound and technology-intensive IOR/EOR schemes and clustered approach to development of marginal fields are a proof of the additional value that can be commercially unlocked from existing producing pools or standing reserves.
However, for financially stretched companies, these are undeniably dif ficult times to negotiate. As mentioned earlier, many of them will intensify their search for partners to sustain the business or even shore up their viability. Even companies with strong balance sheets will be more open to partially farm-

Management Discussion and Analysis Report
133
down their equity to stretch their budgets further. On the other side of the negotiating table, companies seeking farm-in opportunities will be selective - most will be looking to plug gaps in their port folio, or bolster existing positions.
At a more macro level, the ongoing depression in global crude prices have ushered in a context where countries, governments and regimes have been forced to reassess their stance on how they want to exploit or want to incentivize the exploitation of their energy resources. To that extent, it would be fair to say that the threat of resource nationalism which had loomed worryingly on the fortunes and expansion plans of E&P companies globally has receded in recent times af ter this most recent onslaught on prices. Companies will want to rationalize their expenses and planned investment, which means it is not merely the size of the resource base, although that will remain a major factor, that will determine where companies choose to make their commitments. With growing abhorrence for fiscal and policy instability in corporate boardrooms, terms of fered in licensing rounds may need to be adjusted to increase attractiveness in a world where the worth and returns of every dollar spent comes under ever increasing scrutiny.
Though good hydrocarbon assets have been located in East Coast Africa and Latin America, clarity on key issues of energy policies, fiscal and regulatory regimes are yet to evolve. More delays on these fronts could result in money being directed to more stable and remunerative regimes. And countries are responding to this threat: Myanmar and Suriname negotiate each PSC af ter the conclusion of the bid round, and changes are already under discussion in Myanmar for contracts awarded following the 2013 round. Tanzania may sof ten its PSC terms for the next round. In Mexico, PSC terms put forward for shallow water exploration have been met with disappointment by the industry, put ting pressure on the authorities to sweeten them. Iran, soon expected to become a full-fledged participant in the oil markets af ter a long hiatus once the nuclear negotiations reach an agreeable resolution, is busy draf ting a modified petroleum contract with improved commercial terms in a bid to revitalize their flagging oil industry.
Particularly, for Africa, which presented itself as an emerging hotspot in global energy circles, the threat posed by the oil price slide to its aspirations as a future hub of new supplies is very real. Delays are likely in many of its capital-intensive deepwater projects and LNG supply projects that were expected to be sanctioned in 2015. Here, too, operators have chosen to defer FID decision to take full advantage of falling costs. For countries in the region such as Mozambique or Tanzania, it then becomes undeniably imperative to
use the current downturn to bring in greater clarity and transparency to their fiscal and policy frameworks to retain investor interest through the turmoil.
Coming to LNG, opportunities in the sector have definitely been weighed down by the implications of low oil prices regime as majority of current term contracts are oil-linked. IHS expects prices to drop considerably in 2015versus last year. For example, Japan’s weighted average import price for 2015 is projected to be below $10/mmBtu, as opposed to nearly $16/mmBtu in 2014. Spot LNG prices have already plummeted. Even before oil prices began to fall last year, the LNG industry faced significant challenges with significant supply overhang (owing to sub-optimal demand) and serious project cost escalations that threatened the viability of many greenfield LNG projects that require substantial capital investment and strong returns. But an upside of low prices is that the industry could bring in new customers and that, to a degree, should of fset the threat posed by coal as a feed fuel for electricity generation or industrial purposes, particularly in Southeast Asia where the rise in demand for power generation is likely to be the most intense. However, despite the realities of the current ecosystem that the sector has to contend with, the long-term outlook of LNG remains robust considering the abundance of gas resources and the its proposition of LNG as a cleaner energy source. Also the breakeven costs for most greenfield projects are in tandem with projected oil prices in the longer term. So, although companies will be disinclined to invest in new projects in the current cycle, developers who take steps to minimize costs and stay invested in promising projects will reap the benefits when prices trend north.
Globally, the surge in the activity related to unconventional hydrocarbons has been stymied to an extent by the steep fall in prices. Nonetheless, leading explorers continue to add unconventionals to their port folio while keeping their conventional reserves steady, largely because the returns from the particular resource base is quite compelling, particularly with liquids-rich plays as their returns of ten exceed that from conventional exploration. In fact, the US shale or tight oil sector which was expected to be hardest hit due to the low prices has discovered greater ef ficiencies in drilling and withdrawn from non-core areas in a manner that has made unconventional supply growth possible even as rig counts have declined to record lows. Although the pace of growth has slowed, and supplies are projected to start contracting in the lat ter half of 2015, it is far from the grim picture that many in the industry had foretold at the time when prices started declining. This resilience has, in turn, allowed countries such as Argentina and China, despite dissimilar geologies and regulatory

Annual Report 2014-15
Management Discussion and Analysis Report
134
regimes, to remain enthusiastic about unconventional hydrocarbons and invest capital and resources to put in place the necessary infrastructure and policies conducive to the shale industry.
Having said so, fossil fuels are expected to face good threat from renewable in medium to long term. Renewables percentage in total energy supply continues to rise growing at the rate of 6.4 percent per annum thereby registering a share of 7 percent by 2035 as compared to around 2 per cent today. Nuclear energy will keep growing @ 1.9% per annum and hydro-electric growing @ 1.8% per annum. All these taken together (39%) will be responsible for much larger contributor of growth during 2025-35 periods as compared to those from liquid or natural gas. As in longer run, this higher percentage of renewable, owing to continued greener push, of fers a good threat to fossil fuel based industries like that of ours.
Talking specifically for India, huge potential still lies with Indian oil and gas explorers and producers. With more than 28 billion tonnes of prognosticated reserves, Indian sedimentary basins have good potential. However, with 12% areas still unexplored and 22% areas which are poorly explored, huge pools of prognosticated resources are waiting to be converted into in-place volume. In India, only 7 basins are producing (out of 26) and exploration is yet to be initiated in 11 basins. This provides a huge opportunity for all explorers, like your Company, to convert these remaining basins into a producible proposition.
On production front, so far our recovery factor has been quite low (around 30% or so on average) as compared to matured fields of similar vintage having recovery factor around 45% plus. This of fers a huge opportunity as a lot of oil is still lef t in those reservoirs. As mentioned already, ONGC is increasingly pursuing the agenda of improving recovery factor through technology and capital intensive interventions, and aims to increase recovery factor to 40% by 2020. In FY’15, over 34 percent of the Company’s domestic crude oil production was accounted for the incremental oil ex tracted through its IOR/EOR schemes. But considering the increasing costs of the marginal barrel of oil, innovation and technological improvements are a must for continued viability of such endeavours.
8. Risks and Concerns
The oil and gas industry, owing to its fundamental importance to the global economy and world af fairs at large, is influenced by a wide variety of factors and players which together through their resultant tension determine the direction and position the market assumes during a given period. The spectacular drop in oil prices which was the headliner theme of 2014’s panorama of the energy industry was the end-result of
an interplay between many such determinants. Geopolitics, despite its characteristic presence in the scene through the worrying episodes of unremit ting disturbance in places like Libya, Iraq and Ukraine, was outweighed in significance in terms of its influence on the markets by the growth indices of the global economy and, more importantly, the fundamentals of energy demand and supply.
This volatility and pronounced cyclicality makes ‘oil and gas’ one of the less easy places to do business in. Add to this, the sheer spread of operations and the variety and complexity of regimes and geologies that companies have to deal with on a regular basis to make their businesses tick further add to the weight of the challenge. Inevitably so, such multitude of risks and possible ramifications for any given event make it imperative for oil and gas players to continuously assess the new and developing strains of their immediate and wider ecosystem. Subsequent to what we saw in 2014 and what we have seen so far in 2015, there are some primary concern areas that are expected to remain relevant in the near or even medium term for oil and gas operators as they negotiate af fairs in what can only be mildly said to be an ‘infirm’ climate.
Crude prices, given its wide-rangingand deep impact, will be at the top of every company’s agenda. Price forecasts and supply-demand trends form a routine part of the industry’s analysis of the current state of af fairs and its outlook going forward but those, with their strong bias towards the status quo, can only provide you with so much information with so much certainty and the current downward spiral is one such strong example. But they are important nonetheless, more so in uncertain times like now.
- The International Energy Agency (IEA) in its May 2015 Oil Market Report projected a strengthening of global demand growth from 0.7 mbpd in 2014 to 1.1 mbpd in 2015. Despite the pick-up in demand, global supplies continue to be on a strong footing with a y-o-y growth of 3.2 mbpd in April 2015 as slowing US tight oil output growth is of fset by higher OPEC output. Projected demand and supplies for 2015 are 93.6 mbpd and 95.7 mbpd respectively. As such, the recent rally(April and May 2015) in crude prices cannot be expected to be sustained through the rest of the year.
- US Energy Information Administration forecasts Brent crude oil prices will average US$61/bbl in 2015 and US$67/bbl in 2016.West Texas Intermediate (WTI) prices in both 2015 and 2016 are expected to average $5/bbl less than the Brent price.
- Energy Consultancy IHS Energy has presented an outlook for Brent at an average of US$58.92/bbl in

Management Discussion and Analysis Report
135
2015 and US$65.50/bbl in 2016. The firm expects robust global demand growth of 1.3 mbpd in 2015 and 1.1 mbpd in 2016 but a combination of high grading of drilling sites and cost reductions in US unconventional sector and greater OPEC output will continue to keep the market oversupplied through 2016.
With tighter operating margins, companies will face it increasingly dif ficult to generate the kind of returns that have big E&P firms the darlings of the community of investors. Not just this, companies that do not enjoy the luxury of healthy cash reserves or are already highly leveraged will find even the management of day-to-day operations a challenging proposition. The prevalent circumstances, thus, in a way, are priming the market for an environment that would be ripe for strong M&A activity, although companies will want plunge in only af ter prices are deemed to have set tled down and execution of rigorous por t folio assessments.
For producing countries, the degree of dependence on oil revenues, the availability (and liquidity) of financial reserves and/or access to external financing will help to determine their economic and political resilience.
Another concern is how the oil field service providers steer their activities in this oil price regime. They are feeling the heat. As outlined by one study, Oilfield contractors will have to lower prices by as much as 20 percent to help keep their cash-strapped customers working.
Not surprisingly, for your Company too, the last one year has not been all easy going amid the surrounding uncertainty and volatility that has gripped the markets despite a lot of positive sentiment in the domestic environment arising out of the government’s progressive stance on reforms and policy making. Financing of new projects, particularly in matured field areas to boost recovery rates and in new & marginal fields and also in deep-water areas to realize fresh volumes, has certainly come under a squeeze in the present market reality. Of course, being an NOC with a national mandate for securing energy needs of the country, we are fully seized of the significance of our sustained performance in situations of any stripe. And ONGC’s performance in the last concluded fiscal does more than at test its strong fundamentals and operational excellence.
Globally, monetization of reserves has become a huge concern area with merely 30 per cent of recent finds being deemed commercial. This is largely a result of newer finds being made in more logistically and geologically dif ficult areas and the lack of availability of high-quality data for many of the promising finds which make their development highly prone to
operational surprises, as risk operators would rather not want to run right now. Complicating matters further are the myriad polit ical inter ventions and accompanying policy instability that impede the evolution of a stable operating environment, a pre-requisite for sustaining the confidence and interest among E&P players in host countries. So, not only is there a need for advances in technologies related to seismic data acquisition and reservoir modelling to develop a greater understanding of the reserves that await monetization but also a more transparent, stable and economically incentivizing regime to make development of the new reserves commercially more viable, particularly for the deep-water, ultra-deep-water, basement plays and HP/HT reservoirs and subtle traps.
Particularly for India, where more than two-thirds of its sedimentary basins remain largely under-explored, a facilitating fiscal and policy framework, be it in the form of relaxed financial terms or a more pragmatic land-acquisition policy, will go a long way in allaying the concerns around hydrocarbon prospectivity and associated commerciality of finds among all current and potential players in the upstream oil and gas landscape. Moreover, the country’s recent finds which are mostly medium-sized at best and the fact that its foray into unconventional hydrocarbons, be it CBM or Shale, is still very much at an incipient stage further accentuate such a requirement.
Coming to the domestic production situation, till such time when a ‘breakthrough, game-changing find’ is made, ef fective brown-field management is the only reasonable way to sustain supplies at present levels as a major portion of your Company’s output is at tributable to mature fields. Arresting declines from these legacy assets through cost-intensive operational schemes is a challenge, more so in a low oil price scenario. Continued investments in these programs will warrant greater clarity on issues such as the subsidy sharing mechanism as further erosion of our profit margins could significantly compromise future exploratory and development pursuits. Also, the existing technological gaps in the areas of work-over operations, non-flowing wells, deep water drilling etc. do poses some risks for improving upon production volumes.
Operational safety is a fundamental concern in the oil and gas sector given the degree of risks that the companies are routinely exposed to and the potentially worrying ramifications of any untoward event as tellingly borne out by the Deepwater Horizon disaster in the Gulf of Mexico. Many of these risks – be it spillage, rupture, blowout of wells, ear thquake, tsunami or terrorist activities etc. - are being mitigated right from design stage; however probability of emergency situations cannot be totally eliminated.

Annual Report 2014-15
Management Discussion and Analysis Report
136
However, ONGC has implemented improved OISD Standards to improve contingency combat capabilities. ONGC of fshore assets have been rated under ‘acceptable risk’ by international underwriters, enabling a lower-than-peer insurance premium for these assets.
One of the more important highlights of the latest BP Statistical Review of World Energy (2015) was that carbon emissions in 2014 grew the slowest (0.5%) since the 1990s. Perhaps, it was China’s slowing growth or its choosing to be a more consumption-oriented than investment-intensive economy which meant less energy consumption, or the developed economies achieving greater ef ficiencies in energy consumption and generation that contributed to this slowdown in emissions, but, going forward, it is a trend that can be expected to become increasingly common as sustainabilit y and cleaner energy become mainstream concerns of businesses globally than mere academic concerns.
Globally, the ‘big crew change’ has become a priority concern among the best of companies. In USA, for example, as per US Depar tment of Labour estimates, 50% of the oil and gas industry’s workforce will be eligible for retirement within the next five to ten years. In India as well, oil and gas companies need to deal with this impending crisis of talent assignificant retirements are expected in the sector by 2020, not only are companies staring at a loss of significant capital of experience and expertise with these exits, the fact that they also have to replenish from a talent pool that is already quite lean and scarce further compounds a situation that is already quite alarming for them. The resultant knowledge gaps between new employees and experienced industry leaders may af fect the ef ficiency, ef ficacy and deliverability for the company. ONGC has also been witnessing a large number of retirements over the last few years. Though it is very dif ficult to replace such a huge pool of experience, your Company has taken it as a challenge and has been taking all-out ef forts to address the situation through redeployment of its manpower and also through induction of sizeable number of young executives to take care of the future.
Some small yet significant concerns do exist because of less evacuation of gas by GAIL, in particular from Eastern of fshore and Rajahmundry Asset and also in Gujarat. The gas sales are also getting af fected by lack of customers in isolated fields in Assam and at other onshore locations. Increasing availability of cheaper alternatives has led to replacement of naphtha and other liquid fuels. Naphtha has already been rendered surplus in various regions and overall in the country. Your company has been putting in ef forts to tie-up with consumers for sustained sale of various liquid
products.
9. Outlook
a. Exploration acreage & mining Lease
Your Company holds the largest exploration acreage in India as an operator. Despite deregulation and increasing private par ticipation, your company holds54% of PELs and 81% of ML (Reference: DGH, Hydrocarbon E&P Activities Report 2013-14). So far, your Company has established7,644MMtoE of In-place volume of hydrocarbon in domestic basins.
As on 01.04.2015, ONGC is holding a total of 338 PMLs with total area of 56,335 Km2. ONGC added 1,671.60 Km2 areas to PML. ONGC has 10 nomination PELs with approximate area of 37,818 Km2.As the validity of these 10 PELs is going to expire soon, ONGC has accelerated exploratory ef forts in these blocks with focus on drilling of maximum identified potential prospects before the PEL expiry so that the maximum PML conversion can be achieved.
b. Exploration
During the year 2014-15, ONGC has made 22 Oil and gas discoveries in domestic fields (operated by ONGC). Out of 22, 10 discoveries are in Of fshore and 12 in Onshore; 10 discoveries were made in the new prospects whereas 12 were new pool discoveries. 7 discoveries were made in NELP blocks and 15 in nomination blocks. Two discoveries (Rudrasagar-184 & Gandhar-699) of Nomination blocks have already been put on production and ef forts are on for bringing the other discoveries on production as early as possible. Seven discoveries in NELP blocks (5 on-land, 2 of fshore) are governed by the PSC guidelines and appraisal/development activities will be taken up keeping in view the timelines of the respective blocks. In addition to these discoveries, exploratory wells conclusively tested and proved to be hydrocarbon bearing will help in field growth of existing fields.
c. NELP Blocks
Your company was awarded 114 NELP blocks as operator (including KG-DWN-98/2, KG-ONN-2003/1 & VN-ONN-2003/1) and at present (as on 1st June 2015) is operating in 41 blocks. In addition ONGC had participative interest (PI) in 10 NELP blocks, where it is not operator. Out of these 10 blocks 3 blocks have been surrendered; as such it has PI in 7 active blocks.
A total of 53 discoveries (21 in deep-water, 10 in shallow water and 22 in on-land) has been made in 22 of these NELP blocks (6 deep-water, 6 shallow water & 10 on-land) as on 1st June 2015. Commencement of production from these discoveries is governed by stipulations laid down in the respective PSCs and is to be taken up af ter successful completion of appraisal programme followed by submission of DOC and approval of Field Development Plan.


Annual Report 2014-15
Management Discussion and Analysis Report
138
revamping and infrastructure projects for replacing the old infrastructure and creation of new facilities for
st smooth operations. As of 31 March’ 2015, your company is pursuing 17 such infrastructure project; 10 in onshore at an investment of 64,070 million and 7 in of fshore with an investment of 92,520million.
g. Unconventional Source of Energy
ONGC plans to continue its endeavour for exploration and development of Unconventional & other resources like Shale Gas, CBM, HP/HT, Fractured Basement plays etc. Your Company has prioritized suitable actions for exploration and exploitation of Non-conventional and Alternate sources of energy which has the potential to change the energy business landscape in the country, as it is happening in the other parts of the world. The initiatives by ONGC in these areas are summarized below
h. Exploration of Shale Plays
Your company has the distinction of establishing the first flow of shale gas in the country on 25thJanuary, 2011.Government of India during October, 2013 brought out shale gas policy which allows National Oil Companies Viz. ONGC and OIL to initiate the shale gas and oil exploration activities in their allocated nomination blocks in phased manner. Shale Gas exploration was initiated in 2013-14 keeping in view the YTF (Yet-to-Find) hydrocarbons envisaged from Shale Gas play. As per the new Policy, 50 nomination PML blocks have been identified in four Basins, including 28 PMLs in Cambay Basin, 3 PMLs in A&AA, 10 PMLs in KG and 9 PMLs in Cauvery basins for Shale Gas assessment within three year period of Phase-I. A total of 57 pilot/assessment wells are to be drilled by April 2017.
Up to FY’15, ONGC has taken up drilling of 14 wells for shale gas assessment in Cambay, KG, Cauvery and Assam & Assam-Arakan Basins. Out of which drilling of 8 wells were taken up during FY’15. In FY’16, ONGC has plans to drill 19 wells including 11 exclusive Shale Gas wells and 8 wells with dual objectives. Based on the results of planned exploration campaign, drilling of more wells mainly horizontal wells, multi-stage hydro-fracturing will be required to establish the production potential of envisaged shale reservoirs and their commerciality by unlocking unconventional shale gas and oil reserves in dif ferent basins.
i. Coal Bed Methane
Of the total thir ty-three CBM Blocks awarded by GOI to various operators through four rounds of bidding and nomination, Your Company was awarded nine CBM blocks. Due to poor potential, concluded on the basis of the data generated in the exploratory activities, five Blocks viz. Satpura (Madhya Pradesh), Wardha (Maharashtra), Barmer-Sanchor (Rajasthan), North Karanpura (West) and South Karanpura (Jharkhand)
have been relinquished.
Currently, your company is operating in four CBM Blocks i.e.,Jharia, Bokaro, Nor th Karanpura (Jharkhand) and Raniganj (West Bengal),FDP of which has been approved. Nearly 400 wells and 2,000 hydro-fracturing jobs are required to be carried out in the coming 4-5 years as per timelines of the CBM Contract.
In view of the mammoth and time bound task, ONGC is in the process of farming out its Participative Interest to experienced CBM players through formation of JV. Farm out Agreement (FoA) was signed for North Karanpura Block on 7th October 2014. Documents have been submit ted to DGH for Government’s approval of PI assignment. Farm out of Bokaro Block is under negotiation. Formation of joint ventures for the blocks Jharia and Raniganj are under process.
j. Underground Coal Gasification
Your company in collaboration with GIPCL selected Vastan Mine block site in Gujarat as an R&D project to establish UCG technology. All the ground work and inputs for construction and implementation of UCG Pilot Project at Vastan, has been completed and further development is awaiting award of Mining Lease from MoC, GoI.
Further, a number of sites have been jointly identified by ONGC &Neyveli Lignite Corporation Limited (NLC) for studying their suitability to UCG. These are Tadkeshwar in Gujarat and Hodu-Sindhari& East Kurla in Rajasthan. One more site was jointly identified by ONGC & GMDC viz. Surkha in Bhavnagar district, Gujarat. The data of all the fields have already been analysed for evaluating the suitability of these sites for UCG. All the sites have been found suitable for UCG exploration.
k. Alternate sources of energy
Your Company is also pursuing green energy options. Though your Company is already generating wind power of 51 MW, another 102 MW wind farm at Rajasthan is likely to be commissioned by Sept-2015. ONGC Energy Centre (OEC), a trust set up by your Company, has contemplated a Geothermal Pilot Project in association with technology partner M/s. Talboom, Belgium in Cambay Basin, which has a high geothermal gradient. Thir teen Parametric wells in Suket-Jhalawar area of Rajasthan & three wells in Kaikalur area of Tamil Nadu taken up during FY’15 for Uranium exploration. OEC is also pursuing the Thermo-Chemical Reactor project for Hydrogen Generation; a collaborative projects with IIT-D & ICT, Mumbai. Three of these reactors are under installation. It is pertinent to mention that US Patent & Trademark Of fice has issued a Patent to ONGC Energy Centre (OEC) & Institute of Chemical Technology (ICT), Mumbai for the innovative research work on

Management Discussion and Analysis Report
139
“Hydrogen Production Method by Multi-step Copper-Chlorine Thermochemical Cycle
l. Other Exploration Initiative
Results of recent exploration activities clearly show that even well explored basins have provided unexpected positive surprises. Among these are HP-HT/Deeper plays and Basement Plays. Structured initiatives taken by your Company in this regard are as below.
HP-HT, Tight& Deeper plays
Your company has prioritized HP-HT, Tight&Deeper plays in KG onland & shallow water of fshore, Good potential has already been established in Bhuvnagiri, Malleswaram, Periyakudi, Kot talanka, Bantimulli South, Yanamshallow of fshore,GS-OSN-2004 and G-4-6. All these fields are expected to have large growth components to be established and vast potential area remains unexplored. Our long term plans envisage establishment of 500-740 MMT of in-place volume of hydrocarbons from such reservoirs, with cumulative production of 70-90 MMT(O+OEG). About 180 MMT of In-place hydrocarbon volume has already been established. Processesfor monetizing these established volumes are under finalization. Services of M/S Blade Energy Partners, USA have been hired to study the six discovered HP-HT/Tight Reservoir Fields.
During the year 2014-15, 4 wells were drilled to probe HP/HT play including 1 well each in KG and Cauvery onland basins and 2 wells in KG shallow water. During 2015-16, 4 wells have been planned for drilling for HP/HT playin KG and Cauvery Basins.
Basement Exploration
Basement rocks are known for hydrocarbon accumulation for many years. Concerted ef forts for Basement exploration, a frontier exploration play has been taken up by your Company as a major initiative. Established hydrocarbon potential in Basement in Western Of fshore (Archean Basement, Deccan Basalt) and Borholla-Champang fields are well known basement producers. Commercial presence of hydrocarbons has been established in prospects like - Padra, Karjan, Halisa, Chadra and Mansa in Cambay basin. Hydrocarbon occurrences in basement in Mattur, Pundi, Vadatheru and Pondichery Of fshore, and recent commercial discoveries around Mandam and Portonova Highs have rejuvenated exploration thrusts on Basement exploration. A collaborative research project with University of New South Wales (UNSW), Australia has also been carried out for Heera field. One location was released in Heera Field to test the technology showcased by UNSW. During 2014-15, thir teen wells were drilled for Basement exploration in Western Of fshore basin, Cauvery and A&AA basins. Out of these, five wells proved to be hydrocarbon bearing including BH-69 & BH-72 in Western Of fshore.
ONGC is focusing towards drawing an ef fective and successful Basement exploration strategy through special studies and modelling. Further Exploratory inputs for Basement exploration have been identified in prospective blocks/acreages of Western of fshore, Western Onshore, A & AA and Cauvery Basins. Accordingly, drilling of 12 wells has been planned during 2015-16.
Un-appraised Areas:
A concerted ef fort for resource appraisal of the un-appraised areas of Indian Sedimentary Basins has been under taken by DGH. ONGC is earnestly collaborating with DGH in identification and prioritization of the areas. ONGC would be involved in 2D seismic data acquisition in Un-appraised areas in onshore sectors of dif ferent sedimentary basins of India except in North east region.
10. Internal Control Systems
Energy business, particularly oil & gas, has always been a very dynamic business, not just because of its fundamental economic and strategic significance to the nations of the world but also because of the high-risk nature of the business. The business is challenged by uncertainties, geological surprises, volatile markets and number of external factors like–geo-political uncertainties, fiscal & regulatory regime, etc.
In such scenario, where the uncertainties are the rule, it becomes imperative to have a balanced port folio. Keeping these in view, your Company adopted the vision to grow as an integrated global energy company. Exploration and production of oil and gas remains the core business of your Company; however, keeping in view the business imperatives, ONGC has meaningfully integrated itself in the hydrocarbon value chain. Now the port folio of your Company (including overseas assets) is large, diversified and assuring.
To manage this large port folio, your Company has institutionalized robust internal control systems to continuously monitor critical businesses, functions and operations; particularly field operations.
The top management of your Company monitors and reviews the various activities on continuous basis. A set of standardised procedures and guidelines have been issued for all the facets of activities to ensure that best practices are adopted even up to ground level. Performance of every business unit is monitored by the respective directorates for suitable corrective measures, if any, in time.
Your Company has a dedicated Per formance Management and Benchmarking Group (PMBG) which monitors the performance of each business unit against the Key Performance Indicators (KPIs) defined in the Performance Contracts between the top management and the Key Executives. These performance contracts are aligned to the goals and objectives of the organization.
As part of its push for systemic transformation and

Annual Report 2014-15
Shri Narendra Modi, Prime Minister of India at the
control room of OTPC
Hon’ble
Shri Narendra Modi, Hon’ble Prime Minister of India, dedicates the Unit II of ONGC Tripura Power Company to the Nation
Saffron is the colourof energy
and India needs a saf fron revolution.
Narendra ModiPrime Minister of India

Shri Dharmendra Pradhan, Minister of State (I/C) MoPNG at control room of a rig in Mumbai Of fshoreHon’ble
Shri Dharmendra Pradhan, Minister of State (I/C)
MoPNG at ONGC site in Geleki, Assam
Hon’ble "Pleasantly surprised to find a good number of youngsters including lady of ficers posted at Of fshore" - Shri Dharmendra Pradhan,
Hon’ble MoS (I/C), MoPNG during his visit to MHN Process Complex

Annual Report 2014-15
Management Discussion and Analysis Report
142
strengthening of control systems, your Company has placed adequate emphasis on institutionalization of tools, practices and systems that facilitate greater operational ef ficiencies and workplace productivity. Revamping of ‘Material Management Manual’ was carried out during the year to ensure procurement of quality materials and services and identification of world-class vendors. ‘Book of Delegated Powers’ (BDP) was revamped and implemented w.e.f
st1 January, 2015, with the objective to empower working level of ficers and enhancement of delegation to put commensurate accountability on all decision makers. At the same time, Rig Bar Charts for planning and allocating resources for drilling operations was also introduced.
Your Company also introduced E-Grievance handling mechanism for quick redressal of grievances of the various stake-holders.
Occupational health, safety and environmental protection are the adopted motto of your Company. Achieving highest standards in these areas remains a priority objective for your Company. Internal and external audits have been institutionalised and are conducted on a continuous basis to ensure compliance tovarious industr y norms and benchmarks.
Your Company has dedicated Internal Audit (IA) group which carries out audits in-house. At the same time, based on requirement, specialized agencies are engaged to carry out audit in the identified areas. Statutory auditors are appointed by Comptroller and Auditor General (CAG) of India for fixed tenures. Audits and Ethics commit tee of the Board oversees the functioning of Internal Audit and control systems.
Third party safety audits are conducted regularly for of fshore and onshore installations by established national and international HSE agencies such as Oil Industry Safety Directorate ("OISD"), an organization under the control of the MoPNG, which issues safety guidelines. Further, subject to the safety regulations prescribed by the Directorate General of Mines and Safety (DGMS), each work center has teams dedicated to HSE, which execute the safety guidelines prescribed by OISD as well as DGMS. HSE teams are also responsible for obtaining necessary licenses and clearances from the State Pollution Control Boards.
All transactions in the company are carried out on SAP R/3 ERP based business portal. Proper and adequate system of internal control exists to ensure that all aspects are safeguarded and protected against loss from unauthorized use or disposition and that each transaction is authorized, recorded and reported. The system further ensures that financial and other records are fact-based and reliable for preparing the financial statements.
11. Human Resource Development
Your organization has always valued its most important human resource and due to sincere ef forts only a vast pool of experienced and talented scientists, engineers and professionals today passionately take care of the energy needs of the country. ‘Strengthen staf fing and capabilities’ has been the focus area all long the pursuits towards structured Human Resource Development. This is a critical issue keeping in view crew change in next few years. The basic principle revolves around grooming younger generations as future ‘energy leaders’. Talent replenishment and bridging competency gap become crucial aspect for human resource development. Fur ther, your Company believes that continuous development of its human resource fosters engagement. There are multifaceted ef forts for grooming technical talent and develop managerial competence. Structured training programmes have been developed to impart required skills to the people in identified critical areas. Besides training, work association with industry leaders in the challenging areas of business is yet another at tempt to improve capabilities. Your Company also took structured initiatives to provide a desirable work-life balance to the employees as well as improving the living and working conditions. The endeavours of your Company, towards Human Resource development, are well recognized in the industry. ONGC is in the list of “Most At tractive Employer” in India as per the Randstad survey 2015.
12. Corporate Governance
The initiatives taken by your Company are detailed in the Corporate Governance report, a part of the Annual report.
13. Corporate Social Responsibility (CSR)
Initiatives taken by your Company towards CSR are detailed in Board's Report.
14. Cautionary Statement
Statements in the Management Discussion and Analysis and Board's Repor t describing the Company’s strengths, strategies, projections and estimates, are forward-looking statements and progressive within the meaning of applicable laws and regulations. Actual results may vary from those expressed or implied, depending upon economic conditions, Government Policies and other incidental factors. Readers are cautioned not to place undue reliance on the forward looking statements.

Corporate Governance Report
143
1.0 Philosophy on code of Governance
Corporate governance is the system by which
companies are directed and managed. It influences
how the objectives of the company are set and
achieved, how risk is monitored and assessed, and
how performance is optimised. Good corporate
governance structures encourage companies to
create value (through enterpreneurism, innovation,
development and exploration) and provide
accountability and control systems commensurate
with the risks involved.
Ef fective Corporate Governance ensures that long
term strategic objectives and plans are established
and that the proper management and Management
structure are in place to achieve those objectives,
while at the same time making sure that the structure
functions to maintain the Corporation’s integrity,
reputation and accountabilit y to its relevant
constituencies.
At ONGC, Corporate Governance is the basis for our
decision-making and control processes and
comprises responsible, value-based management
and monitoring focused on long term success, goal
oriented and ef ficient cooperation between our
Managing and Vir tual Boards, respect for the interest
of our shareholders and employees, transparency
and responsibility in all our decisions and an
appropriate risk management system.
The main objectives that drive Corporate Governance
in ONGC are:
• A sound system of internal control to mitigate risks
associated with achievement of business objectives,
both short term and long term.
Compliance of laws, rules & regulations.
Ensuring corporate success and economic growth.
Minimization of wastages, corruption, risks and
mismanagement.
Adherence to ethical standards for ef fective
management and distribution of wealth and discharge
of social responsibility for sustainable development of
all stakeholders, (shareholders, customers,
employees and society at large)
Maintains investor’s confidence, as a result of which,
company can raise capital ef ficiently and ef fectively.
1.1
•
•
•
•
•
•
•
•
•
Clearly defined standards against which performance
of responsibilities are measured
Accuracy and transparency in disclosures regarding
operations, performance, risk and financial status
A clear delineation of shareholders’ rights
Timely and balanced disclosure of all material
information to all the Stakeholders.
1.2 Further, ONGC has ensured compliance with the
objectives of the principles of Corporate
Governance stated in clause 49, as brought out
below:
A. The Rights of Shareholders
(i) The Company has taken all the necessary steps to
ensure the Rights of Shareholders and seek approval
of the shareholders as and when required as per the
provisions of the Companies Act, 2013 or other
legislations. ONGC issues timely press releases
regarding the important events. ONGC sends notices
through email to all shareholders who have opted for
the same and to all others physically by post. It has
provided the facility of e-voting for all shareholders.
Further, with a view to ensure better participation, it
has taken a poll of the shareholders who at tend the
meeting either in person or through prox y.
Independent Scrutinizer is appointed to oversee the
entire process.
The notice of the Annual General Meeting explains
exhaustively the procedures governing the AGM,
voting procedures. These are again explained during
the AGM. Suf ficient opportunity is provided to the
shareholders who at tend the meeting to raise queries
to the Board of Directors who at tend the AGM. All their
queries are answered to their satisfaction. The voting
on the resolutions is carried out as per the Companies
Act, 2013.
The election of the Board members is routed through
the General Meeting, where shareholders have a right
to participate. However, the power of nomination of the
directors on the Board of ONGC, being a Government
Company, is with the Government of India.
All shareholders, irrespective of their category, are free
to exercise their voting and ownership rights at the
AGM and all other forums where their presence is
required.
Corporate Governance Report

Annual Report 2014-15
Corporate Governance Report
144
ONGC has a Board level Stakeholders’ Relationship
Commit tee which meets periodically to redress the
grievances of shareholders. The shareholders have
the facility of directly approaching the Company as
well as the Registrar & Share Transfer Agent (RTA) to
address their queries/grievances, which are
addressed within 7 days.
Interests of the minority shareholders are protected
and there have been no instances of abusive action by
controlling shareholders. The Company has an
ef fective shareholders’ redressal system.
(ii) ONGC issues timely press releases regarding
important developments. The Annual Report of the
Company is very exhaustive and provides every
conceivable information on the functioning of the
Company. The website of the company is updated
continuously to keep the stakeholders apprised of
various developments etc.
The capital structure of ONGC comprises only equity
shares which do not provide any disproportionate
degree of control to any of the owners. All the equity
shareholders are treated equitably, irrespective of their
location or quantum of their shareholding.
In line with the SEBI (Prohibition of Insider Trading)
Regulations, 2015, ONGC has put in place a Code of
Internal Procedures and Conduct in dealing with the
securities of ONGC.The code is applicable to all the
Insiders of ONGC.
The process of conduct of General meetings of the
shareholders of ONGC ensures equitable treatment to
all shareholders.
Simple and inexpensive procedures are adopted to
cast their vote electronically as well as through poll.
B. Role of stakeholders
ONGC recognizes the rights of its stakeholders and its
responsibility towards fullfilling their aspirations. The
Business Responsibility Report of ONGC brings out in
detail the steps being taken by ONGC in this regard.
ONGC, being a listed Public Sector Enterprise,
conducts and governs itself with Ethics, Transparency
and Accountability as per the law of land and ensures
compliance of all the policies, rules, regulations etc
mandated by the of India. Ef fective
Redressal mechanism is available to ever y
stakeholder of the Company, should there be any
violation of rights.
Government
The Company encourages its employees to
participate in every sphere of its activity and has
schemes/ policies with rewards encouraging
employees to take part in the various aspects of the
functioning of ONGC.
ONGC is covered by RTI Act, 2005 and it provides all
information to all citizens of India as per the aforesaid
Act.
ONGC has implemented a Whistle Blower Mechanism
which gives opportunity to its employees to raise any
concerns of ethics or an illegal/immoral activities
occurring in an organisation to the Audit Commit tee.
The vendors have the facility of approaching
Independent External Monitors to redress their
grievance. The company has a Vigilance Department
which is headed by an of ficer on deputation from the
Government of India in the rank of Joint Secretary or
above.
C Disclosure and Transparency
The Company ensures timely and complete
dissemination of information on all matters which
require to be made public. The website of the company
and the Annual Report of the company contain
exhaustive information regarding every aspect of the
functioning, financial health, ownership and
governance of ONGC.
All disclosures by Company are strictly in accordance
with the formats prescribed by the concerned
regulatory authority in respect of accounting, financial
and non-financial matters.
ONGC disseminates information through press
releases, on its website, to the Stock Exchanges etc.
Access to all these modes is free for all users.
The Company maintains records of the proceedings of
all meetings (Board / Commit tees/ General meetings,
etc.).
The company follows the accounting standards in
let ter and spirit. The annual audit is conducted by Joint
Statutory auditors appointed by the C&AG. ONGC is
further subject to supplementary audit by C&AG.
Internal Audit Department reports to the Audit & Ethics
Commit tee, apart from periodical oversight by the
Government of India and Parliamentary Commit tees.

Corporate Governance Report
145
D Responsibilities of the Board
(i) Disclosure of Information
Members of the Board and Key Managerial Personnel
disclose to the board whether they, directly, indirectly
or on behalf of third parties, have a material interest in
any transaction or matter directly af fecting the
company.
It is the endeavor of the Board of Directors and the top
management of ONGC to ensure that the stakeholders
are kept aware of all important developments, while
ensuring confidentiality of relevant information
(ii) Key functions of the Board
The Company has an exhaustive Book of Delegated
Powers (BDP) and other manuals like Material
Management, Works manual etc, which spell out the
processes and defines the level (Board / Executive
Commit tee / Functional Director / Key Executive) at
which any decision is to be made and are reviewed
from time to time to ensure that they are updated and
meet the needs of the organization. The company has
13 commit tees of the Board which deliberate upon
various important matters and advise the Board on the
course of action to be taken.
The company’s governance practices are ef fectively
monitored and reviewed regularly.
The HR policies of ONGC ensure timely selection and
placement of various executives and personnel as per
needs of the organization and ensures smooth
succession. ONGC being a Government Company,
follows the remuneration policy approved by the
Government of India.
Appointment of directors on the Board of ONGC and
the remuneration of functional directors is decided by
the Government of India.
The Board members as well as Key Managerial
Personnel are required to declare their interest in all
contracts and their shareholdings etc. which is noted
by the Board. The Company ensures that all related
party transactions are brought to the notice / approval
of the Audit Commit tee / Board.
ONGC has implemented SAP system of accounting
which ensures total integrity and transparency of every
transaction which is subject to independent audit by
Joint Statutory Auditors appointed by C&AG. The
company has ef fective internal control systems which
conform to the laws of the land.
The process of disclosure of information to the public
and issue of press releases etc. is well defined.
Board evaluation is within the domain of the
Government.
(iii) Other responsibilities
The Board of Directors take strategic decisions which
help the management in steering the company in its
operations and meeting the expectations of the
stakeholders.
ONGC has structured policies and exhaustive manual
and procedures in place which ensure that the
operations of the company are congruent to its
objectives.
The Agenda Items, circulated in advance to the
members of the Board, are exhaustive in nature and
detailed presentations are made during the course of
discussion. The Board is assisted by 13 Commit tees to
enable better management of full Board’s time, in
depth scrutiny and focused at tention. The
Independent Directors are provided with every
conceivable information to ensure that the interests of
the minority shareholders are protected. Further, to
strengthen the corporate governance, a dedicated
portal has been set up for exclusive use of Directors,
where notice/agenda/Presentation/other documents
related to each and every Board/Board Level
Commit tee meeting are uploaded to enable the
Directors to access those information.
ONGC has a Board approved training policy for
directors, details of which have been brought out
elsewhere in this report.
ONGC has only one class of equity shareholders at
present and the Board treats them all fairly and with
equity.
The Board of Directors ensure that highest degree of
ethics are adopted while taking every decision and
being a PSU, ONGC takes into account the interest of
diverse stakeholders.
Every proposal is examined in detail before a decision
is taken.
The Commit tees of the Board, excluded, deliberate
upon major proposals before being sent to the Board.
This ensures absence of conflict of interest.
The project proposals are first deliberated in detail by
the Project Appraisal Commit tee and then approved

Annual Report 2014-15
Corporate Governance Report
146
by the Board af ter taking into account the
assumptions, cost-benefit, sensitivity and viability
analysis as well as appraisal of the project by an
independent Financial Institution thereby minimizing
any risk.
The Board regularly monitors the Action Taken Report
on its decisions. Further, detailed presentation on the
implementation of projects which have been approved
is made before the Project Monitoring Commit tee on a
periodic basis. Risk areas are outlined and mitigation
processes are put in place.
The terms of reference, quorum, periodicity of meeting
etc are clearly defined for each of these Commit tees
and approved by the Board.
The job description of each Functional Director
including CMD is clearly defined. ONGC signs an MOU
with the administrative Ministr y defining key
parameters of operational, physical and financial
performance. The performance of the Functional
Directors and the company is measured on the basis of
achievement of MOU targets.
The Independent Directors are free to seek any
information and have the authority to seek third party
independent assessment of any proposal / agenda
item for which ONGC makes necessary arrangements.
1.3 Corporate Governance Recognitions
ONGC’s Corporate Governance practices have
secured many accolades, some of which are:
• ‘ICSI National Award for Excellence in Corporate
Governance for 2014’- Certificate of Recognition by the
Institute of Company Secretaries of India. This is the
fif th year in a row that ONGC has bagged this
award.
• ‘Best Corporate Governance Award-2012’ by the
Indian Chamber of Commerce;
• ‘Golden Peacock Global Award’ for Corporate
Governance U.K. in the years 2005, 2007, 2008, 2009
and 2013
In compliance with the disclosure requirement of
clause 49 of the revised listing agreement executed
with the stock exchanges as well as the Guidelines on
Corporate Governance for Public Sector Enterprises,
issued by the Department of Public Enterprises (DPE),
the detailed Corporate Governance report of ONGC is
as follows:
Government
2. BOARD OF DIRECTORS
2.1 COMPOSITION
The Company is managed by a Board of Directors,
which formulates strategies, policies and reviews its
performance periodically. The Chairman & Managing
Director (CMD) and Six Whole-Time Directors viz.
Director (Technology & Field Services), Director
(Of fshore), Director (Onshore), Director (Exploration),
Director (Finance) and Director (Human Resource),
manage the business of the Company under the
overall supervision, control and guidance of the Board.
The Board of Directors has a combination of Executive st(Functional) and Non-Executive Directors. As on 31
March, 2015, the Board of Directors had 9 members,
comprising of 6 Functional Directors (including the
Chairman & Managing Director) and 3 Non-Executive
Directors (comprising 2 part-time of ficial nominee
Directors and 1 par t-time non-of ficial Director)
nominated by the Government of India. To share the
global experience and business strategies, Managing
Director, ONGC Videsh Limited (OVL) is a permanent
invitee to the meetings of the Board.
st thExcept for the period from 1 April, 2014 to 30 April, rd th2014 and 23 May, 2014 to 18 June, 2014, the
composition of the Board of Directors of the Company
during the year 2014-15 did not comply with the
provisions of Clause 49 of the Listing Agreement i.e.,
the Board of Directors did not comprise of the required
number of Independent Directors as per the terms of
the above mentioned Listing Agreement. The
vacancies caused due to retirement/vacation of the
independent Directors have also not been filled up
within the time period specified in terms of listing
agreement. ONGC has been taking up with the
Ministry of Petroleum & Natural Gas, of
India for appointing requisite number of Independent
Directors on the Board of ONGC. No separate meeting
of Independent Directors was held during 2014-15.
2.2 Board/ Committee Meetings and Procedures
(A) Institutionalised decision making process
The Company has defined guidelines for the meetings
of the Board of Directors and Commit tees. These

Corporate Governance Report
147
guidelines seek to institutionalise the decision making
process at meetings of Board/ Commit tees, in an
informed and ef ficient manner. Company’s guidelines
relating to Board Meetings are applicable to
Commit tee Meetings as far as practicable.
(B) Scheduling and selection of Agenda items for
Board / Committee Meetings
(i) A tentative schedule of the Board Meetings to be held
during the ensuing financial year is drawn up and af ter
seeking convenience of the Directors and af ter
approval of the Board, the same is circulated among all
the Directors. This helps the management in ensuring
that the various agenda items are kept ready in
advance and facilitates the Directors to plan their
schedule for participation in Board/ Commit tee
meetings well in advance. The meetings of the
Commit tees of the Board are held prior to the Board
Meeting af ter seeking convenience of members.
(ii) The meetings are convened by giving appropriate
advance notice af ter obtaining approval of the
Chairman of the Board/ Commit tee. To address
specific urgent needs, meetings are also called at a
shorter notice. In case of any exigency, resolutions are
passed by circulation.
(iii) Detailed agenda containing management reports and
other explanatory statements are circulated in
advance in the agenda format amongst members for
facilitating meaningful, informed and focused
deliberations and decisions at meetings. Document or
agenda of confidential nature, are tabled with the prior
approval of CMD. Sensitive subject matters are
discussed at the meeting without circulation of writ ten
material. In special and exceptional circumstances,
additional or supplemental item(s) on the agenda are
permit ted.
(iv) The agenda papers are prepared by concerned
of ficials, sponsored by the concerned functional
Directors and approved by the CMD. Duly approved
agenda papers are circulated amongst members of
the Board/ Commit tee by the Company Secretary
both physically and through email.
(v) The meetings of the Board/ Commit tees are generally
held at the Company’s Registered Of fice at New Delhi.
(vi) Presentations are made to the Board/ Commit tee
covering Finance, Production, Operations, major
Business Segments, Human Resources, Marketing,
Joint Venture operations, whenever required.
(vii) The members of the Board/ Commit tee have complete
access to all information of the Company and are also
free to recommend inclusion of any matter in the
agenda for discussion. Senior of ficials are called to
provide additional inputs to the items being discussed
by the Board/Commit tee, as and when required.
(viii)Each Commit tee has the authority to engage outside
experts, advisers and counsels to the extent it
considers appropriate to assist the Commit tee in its
work.
Safety Snapshots
ONGC is in the hydrocarbon business, therefore,
safety is paramount for continued operations. To
apprise the Board regarding various safety measures
being taken and to seek their guidance on
implementation of these measures, periodic
presentations are made to the Board of Directors in the
form of Safety Snapshots that include all major
incidences related to safety.
Industry Updates & Presentation
With a view to keep the members of the Board apprised
with latest developments in the Industry, Industry
updates are tabled and presentations on the subjects
relevant to E&P business are made periodically to the
Board. This also ensures that the Directors are
constantly in touch with the problems being faced by
the Industry in general and ONGC in particular in its
operations.
(C) Recording minutes of proceedings at the Board
Meeting
Minutes of the proceedings of each Board/Commit tee
meeting are recorded with all necessary details. Draf t
minutes are circulated amongst all members of the
Board/ Commit tee for their appreciation and
comments that are incorporated in the minutes, which
are finally approved by the Chairman of the Board/
Commit tee. Thereaf ter, these minutes are confirmed
in the subsequent Board/ Commit tee Meeting.
Minutes of the meetings of the Commit tees are also
noted by the Board/ Commit tee in its next meeting.
The finalized minutes are entered in the respective
Minutes Books.

Annual Report 2014-15
Corporate Governance Report
148
(D) Follow-up mechanism
The guidelines/ decisions of the Board/ Commit tee
meetings provide for an ef fective post-meeting follow-
up, review and reporting process for action taken on
decisions/instructions/directions of the Board and
Commit tee. As per the Board’s decision, the Company
Secretary intimates ‘Action Points’ arising from
deliberation during the meeting to the concerned
Functional Directors who in turn provide updates to be
apprised to the Board on areas of their responsibility in
the next meeting. Functional Directors provide follow-
up Action Taken Report (ATR) once in a quarter.
(E) Compliance
Functional Directors are responsible toward ensuring
adherence to all applicable provisions of law, rules and
guidelines. A Quarterly Compliance Report (collected
from all work centres) confirming adherence to all
applicable laws, rules, guidelines and internal
instructions/manuals, including Corporate Governance,
is reviewed by the Audit & Ethics Commit tee and the
Board.
(F) Training and Evaluation of non-executive Board
members
(a) In line with Clause 3.7 of the Guidelines on Corporate
Governance for Central Public Sector Enterprises,
2010, issued by Government of India, Ministry of
Heavy Industries and Public Enterprises, Department
of Public Enterprises and requirement of Listing
Agreement with regard to Training of Directors, the
company has three tier Training policy for non-
executive Directors:
• Induction Training
• External Training
• Board Presentation
Non-executive Board members are eminent
personalities having wide experience in the field of
business, education, industry, commerce and
administration. Their presence on the Board is
advantageous and fruit ful in taking business
decisions. The policy of directors and the
details of familiarization/training programmes during
2014-15 can be viewed at ht tp://www.ongcindia.com/
wps/wcm/connect/ongcindia/Home/investors/
policies/directors-training
(b) Policy on Performance Evaluation of Directors
ONGC being a Government Company, the provisions
of Section 134(3)(e) and (p), 149(6)(a) and (c), 152(5)
and 178(2), (3) and (4) of the Companies Act, 2013 with
regard to appointment, Performance Evaluation etc.
have been exempted by Government of India, Ministry
of Corporate Af fairs vide Gazette notification dated
05.06.15.
2.3 BOARD MEETINGS
st stDuring 1 April, 2014 to 31 March, 2015, Thirteen th th thBoard meetings were held on 24 April, 29 May, 27
th th th thJune, 30 July, 13 & 28 August, 19 September, th th th16 October, 14 November, 12 December, 2014, st th th21 January, 14 February and 20 March, 2015.
The minimum and maximum interval between any two
Board meetings was 13 days and 39 days respectively.
The details of number of Board Meetings at tended by
Directors, at tendance at the last Annual General
Meeting, Number of other Directorship/Commit tee
Membership in various companies held by them
during the year 2014-15 are tabulated below:-
training

Corporate Governance Report
149
a) Executive Directors
Shri Dinesh Kumar Sarraf, (Chairman & Managing
Also held Additional
Shri A. K. Banerjee, Director (Finance)
Shri Shashi Shanker , Director (T&FS)
Shri T. K. Sengupta, Director (Of fshore)
Shri Ashok Varma, Director (Onshore) (from 19.06.2014)
Shri D. D. Misra, Director (HR)(from 01.08.2014)
Shri K.S. Jamestin, Director (HR)(upto 31.07.2014)
Shri N.K. Verma Director (Exploration) (upto 26.08.2014)
Shri A.K.Dwivedi, Director (Exploration) (from 16.03.2015)
(i) Part-time Official Directors- Government Nominees
Shri Aramane GiridharJS(E) MoP&NG, Government Director (upto 15.10.2014) 01 No Nil Nil Nil
Shri U.P. Singh JS(E) MoP&NG, Government Director(from 16.10.2014)
Dr. Subhash C. KhuntiaSpecial Secretary, MoP&NG as Government Director(from 01.05.2014)
13 Yes 08 Nil 03
Director) Charge of (i) Director (Onshore) upto18.06.2014 (ii) Director (Exploration) from 27.08.2014 till 15.03.2015
13 Yes 05 Nil 02
12 Yes 01 Nil 01
13 Yes 02 Nil 01
11 Yes 01 Nil Nil
09 Yes Nil Nil 01
04 NA 06 Nil 02
05 NA 01 Nil Nil
01 NA Nil Nil Nil
05 NA Nil Nil 02
11 No 03 Nil Nil
Names & Designation Upto 31.03.2015
No. of
Director-ships in
other
companies #
No. of Committee
memberships
across all
companies *
Whether
attended
last AGM
held on
19.09.2014
No. of Board
meetings
attended
out of 13
meetings
heldChairman Member
Attendance:

Annual Report 2014-15
Corporate Governance Report
150
Notes:
(i) The Company being a PSU, all Directors are appointed/ nominated by the President of India;
(ii) Directors are not per se related to each other;
(iii) Directors do not have any pecuniary relationships or transactions with the Company;
(iv) The Directorships/Commit tee Memberships are based on the latest disclosure received;
(v) None of the Director is a Member of more than 10 Commit tees or Chairman of more than 5 Commit tees, across all the companies in which he is a Director.
3 STRATEGY MEET
A Strategy Meet is organised each year at which all members of the Board and senior of ficials of the Ministry of Petroleum & Natural Gas participate. Intense discussion and deliberation takes place covering areas of concerns and growth for ONGC.
4. CONCLAVE
To benefit from cumulative knowledge and experience of seniors of ONGC, an assembly of the past and present members of the Board of the Company is organized each year to focus on action plan for Perspective Plans and future growth strategies.
5. KEY EXECUTIVES’ MEET (VICHAR VISHLESHAN)
Key Executives are managers placed just below the
Directors of the Board and run day- to-day operations
of the Company under the direction and supervision of
the Directors. While Key Executives, jointly or severally
meet CMD and functional directors as when required,
an annual meet of all Key Executives with CMD &
Directors is held to discuss issues of Management and
operations implementation strategies of Strategic
Plans are also discussed to find solutions for them. thThe 13 Key Executive Meet was held on
20- 21.12.2014 at Alibaug, Maharashtra. The theme of ththe 13 Meet blended contextual issues with futuristic
ones-“Nex t ‘Big’ interventions for harnessing
potentials”. The way forward: “Plan, Projectize,
Perform”.
6. CHANGE AGENTS’ MEET
To connect with Gen-next ONGCians, billed as
'Change Agents' and engaging and preparing them for
future challenges and for realization of Perspective
Plan - 2030, the Change Agent Meet is organized. No
meet was held in 2014-15.
7. RESUME OF DIRECTORS PROPOSED TO BE RE-
APPOINTED
ndThe notice of the 22 Annual General Meeting shall
Contain the brief resume of Directors retiring by
rotation and Addit ional Directors seeking
appointment including nature of their experience in
specific functional areas, names of companies in
which they hold directorship and membership/
# Does not include Directorships of Foreign Companies, Section 8 Companies and Private Limited Companies.
*Chairmanship/Membership of the Audit Commit tee and Stakeholders’ Relationship Commit tee of Public Limited Companies (including ONGC).
(ii) Part-time Non official Independent Directors
Prof. Deepak Nayyar 0(upto 19.06.2014)
Shri Arun Ramanathan 0(upto 19.06.2014)
Prof. S.K. Barua (upto 13.12.2014) 09 Yes 04 01 05
Shri O.P. Bhatt (upto 13.12.2014) 07 Yes 04 Nil 09
Shri K.N. Murthy 11 Yes 09 05 03
Shri P. Umashankar (upto 19.09.2014) 06 No 02 Nil 02
Shri S. Ravi (upto 19.09.2014) 06 No 07 05 05
Shri R.K. Singh 0(from 23.05.2014 to 19.09.2014)
2 NA 02 01 05
2 NA 06 04 04
5 No Nil Nil Nil

Corporate Governance Report
151
chairmanship of Board/ Commit tee
8. BOARD COMMITTEES
The Company has the following Commit tees of the
Board:
8.1 AUDIT & ETHICS COMMITTEE (The Committee
was earlier named as Audit, Ethics and Financial
Management Committee upto 13.11.2014)
The terms of reference of the Audit & Ethics
Commit tee are in accordance with Section 177 of the
Companies Act, 2013, guidelines set out in Clause
49(III) of the Listing Agreement and the Guidelines on
Corporate Governance for Central Public Sector
Enterprises issued by the Department of Public
Enterprises in May, 2010.
Composition
Shri Arun Ramanathan, an Independent Director was
the chairman of the commit tee upto 19.06.2014.
Thereaf ter, the Commit tee has been headed by Shri
K.N. Murthy w.e.f. 03.11.2014. Prof. S.K. Barua, Shri
O.P. Bhatt, Shri S. Ravi, Shri P. Umashankar , Shri U.P.
Singh and Shri Shashi Shanker were/are the other
members of the Commit tee. The composition of the
Audit & Ethics Commit tee was not in compliance with
Clause 49(III)(A) of the Listing Agreement from
14.12.2014.
All members of the Commit tee have requisite financial
and management experience and have held or hold
senior positions in other reputed organizations.
Director (Finance) and Chief Internal Audit are
permanent invitees. Representatives of Statutory
Auditors and Cost Auditors are invited to participate in
the meetings whenever required. Functional
Directors, Executives of Finance and other
departments are invited, if required.
Company Secretary acts as the Secretary to the
Commit tee.
The role of the audit commit tee has been modified
during the year in line with the Companies Act, 2013
and amended Listing Agreement and shall include the
following:
1. Oversight of the company’s financial reporting
process and the disclosure of its financial information
to ensure that the financial statement is correct,
suf ficient and credible.
2. Recommendation for appointment, remuneration and
terms of appointment of auditors of the company;
3. Approval of payment to statutory auditors for any
other services rendered by the statutory auditors.
4. Reviewing, with the management and examination of
the annual financial statements and auditor’s report
thereon before submission to the Board for approval,
with particular reference to:
a. Matters required to be included in the Director’s
Responsibility Statement to be included in the Board’s
report in terms of clause (c) of sub- section 3 of
Section 134 of the Companies Act, 2013
b. Changes, if any, in accounting policies and practices
and reasons for the same
c. Major accounting entries involving estimates based
on the exercise of judgment by management
d. Significant adjustments made in the financial
statements arising out of audit findings
e. Compliance with listing and other legal requirements
relating to financial statements
f. Disclosure of any related party transactions
g. Qualifications in the draf t audit report.
5. Reviewing, with the management, the quarterly
financial statements before submission to the Board
for approval.
6. Reviewing, with the management, the statement of
uses / application of funds raised through an issue
(public issue, rights issue, preferential issue, etc.), the
statement of funds utilized for purposes other than
those stated in the of fer document/prospectus/notice
and the report submit ted by the monitoring agency
monitoring the utilization of proceeds of a public or
rights issue, and making appropriate recommendations
to the Board to take up steps in this matter.
7. Review and monitor the auditor’s independence and
performance, and ef fectiveness of audit process.
8. Approval or any subsequent modification of
transactions of the company with related parties;
9. Scrutiny of inter-corporate loans and investments;
10. Valuation of undertaking or assets of the company,
wherever it is necessary.
11. Evaluation of internal financial controls and risk
management systems.
12. Reviewing, with the management, performance of
statutory and internal auditors, and adequacy of the
internal control systems;
13. Reviewing the adequacy of internal audit function, if
any, including the structure of the internal audit
department, staf fing and seniority of the of ficial

Annual Report 2014-15
Corporate Governance Report
152
Attendance:
Members No. of Meetings held during the tenure No. of Meetings Attended
Shri K. N. Murthy 13 13
Shri Arun Ramanathan (upto 19.06.2014) 05 05
Shri O. P. Bhatt (upto 13.12.2014) 11 09
Prof. S. K. Barua (upto 13.12.2014) 11 09
Shri P. Umashankar (upto 19.09.2014) 07 07
Shri S. Ravi (upto 19.09.2014) 07 07
Shri U.P. Singh (from 21.01.2015) 02 02
Shri Shashi Shanker 01 01
Shri D. K. Sarraf
Permanent Invitees:
Shri A. K. Banerjee, Director (Finance) 13 12
Shri Pradeep Prasad, Chief I.A. 13 13
Shri A.K. Srinivasan,ED-CCF 12 10
01 01
heading the depar tment, repor ting structure
coverage and frequency of internal audit;
14. Discussion with internal auditors on any significant
findings and follow up there on.
15. Reviewing the findings of any internal investigations
by the internal auditors into matters where there is
suspected fraud or irregularity or a failure of internal
control systems of a material nature and reporting the
matter to the Board.
16. Discussion with statutory auditors before the Audit
Commences, about the nature and scope of audit as
well as post-audit discussion to ascertain any area of
concern. The Audit Commit tee may call for the
comments of the auditors about internal control
systems, the scope of audit, including the
observations of the auditors and review of financial
statement before their submission to the Board and
may also discuss any related issues with the internal
and statutory auditors and the management of the
company.
17. To look into the reasons for substantial defaults in the
payment to the depositors, debenture holder
shareholders (in case of non-payment of declared
dividends) and creditors;
18. To oversee & review the functioning of the Vigil mechanism including whistle Blower Mechanism and
if any of the members of the commit tee have a conflict of interest in a given case, they should recuse themselves and the others on the commit tee would deal with the matter on hand.
19. Approval of appointment of CFO (i.e., the Whole- time Finance Director or any other person heading the finance function or discharging that function) af ter assessing the qualifications, experience and background, etc. of the candidate;
20. To review the Audit paras referred to A&EC by the internal Audit / Board and / Government of India and to provide its suggestions / guidance / comments on the issues referred to it.
21. The Audit Commit tee shall review the financial statements, in particular, the investments made by the unlisted subsidiary company.
Audit & Ethics Committee Meetings
st stDuring 1 April, 2014 to 31 March, 2015, thirteen meetings of Audit & Ethics Commit tee were held on
th th th th th th th7 & 24 April, 19 & 29 May, 13 & 27 June, 13 th th thAugust, 19 September, 14 & 26 November,
th th th5 December, 2014,14 February and 19 March, 2015.
The details of meetings at tended by the members and their tenure as member of the above Commit tee is reflected in the table below:-

Corporate Governance Report
153
personnel and other employees involving a balance between fixed and incentive pay reflecting short and long-term performance objectives appropriate to the working of the company and its goals.
II. Shall lay down the evaluation criteria for performance evaluation of Independent Directors.
III. Identif y persons who are qualified to become directors and who may be appointed in senior management in accordance with the criteria laid down, and recommend to the Board their appointment and removal,
IV. Carry out evaluation of every director’s performance.
V. Formulate the criteria for determining qualifications, positive at tributes and independence of a director.
VI. Deciding the Annual Bonus / Variable Pay Pool and Policy for its distribution across the Executives and Non Unionised Supervisors, within the prescribed limits and as per the guidelines issued in this regard by the Government of India.
VII. Consideration of any other item which may be delegated in this regard by the Board of Directors.
VIII. Any other role assigned for the Commit tee due to changes/modification in the Companies Act, 2013,SEBI & DPE Guidelines.
The details of meeting at tended by the members and their tenure as member of the above Commit tee is reflected in the table below:-
8.2 NOMINATION AND REMUNERATION COMMITTEE
ONGC, being a Public Sector Undertaking, the appointment, tenure and remuneration of directors are decided by the Government of India. As per the DPE Guidelines, a Remuneration Commit tee was constituted to decide the annual bonus/variable pay pool and policy for its distribution within the prescribed limits. However, as per Clause 49(IV) of the revised listing Agreement and Section 178 of the Companies Act, 2013, the Company has renamed the Commit tee as Nomination and Remuneration Commit tee w.e.f. 03.11.2014. The composition of the commit tee was not in compliance with clause 49(IV)(A) of the Listing Agreement from 14.12.2014.
Prof. S.K. Barua, an Independent Director was the Chairman of the Commit tee upto13.12.2014. Thereaf ter, the Commit tee has been headed by Shri K.N. Murthy w.e.f. 21.01.2015. Prof. Deepak Nayyar, Shri Arun Ramanathan, Shri P. Umashankar, Shri O.P. Bhatt ,Shri U.P. Singh and Shri D.K. Sarraf were/are the other members of the Commit tee.
Director (HR) and Director (Finance) are the permanent Invitees. Director (HR) is the convener of the Commit tee.
One meeting of the above Commit tee was held on th12 December, 2014.
Role of the Committee
I. Recommend to the Board a policy, relating to the remuneration for the directors, key managerial
Members No. of Meetings held during the tenure No. of Meetings Attended
Shri K.N.Murthy 01 01
Prof. Deepak Nayyar (upto 19.06.2014) N.A N.A
Shri Arun Ramanathan (upto 19.06.2014) N.A N.A
Prof. S.K. Barua (upto 13.12.2014) 01 01
Shri O.P. Bhatt (upto 13.12.2014) 01 01
Permanent Invitees:
Shri A. K. Banerjee,
Director (Finance)-upto 30.04.2015 01 01
Shri D.D. Misra, Director (HR) 01 01
8.2.1 DIRECTORS’ REMUNERATION
ONGC being a Government Company, terms and conditions of appointment and remuneration of Whole-time
Functional Directors are determined by the Government through administrative ministry, the Ministry of Petroleum &
Natural Gas. The Non-executive (part-time non-of ficial) or Independent Directors are paid sit ting fees @ ` 20,000/-
for each Board/ Commit tee meeting at tended by them.

Annual Report 2014-15
Corporate Governance Report
154
8.2.2 STOCK OPTIONS
The Company has not issued any Stock Options to its Directors/ Employees.
8.2.3 EQUITY SHARES HELD BY DIRECTORS
Except as stated hereunder, none of the Directors, hold any Equity Shares in the Company as per the declarations made by them to the Company in their own names:
(a) Executive Directors ( in Million)`
* Superannuation
** Resignation
*** Includes provision for per formance related pay for FY 14-15 (disclosed under amount payable in note no. 39.3.2 of Standalone Financial statements).
Note:
1. Performance related pay of Functional Directors (including CMD) is paid as per DPE norms.
2. Notice period of 3 months or salary in lieu thereof is required for severance of service.
(b) Non-Executive Directors (Part-time non-official)
Non-Executive non-of ficial Directors were paid sit ting fee@ ` 20,000/- for at tending each meeting of the Board/ Commit tees thereof. Details of sit ting fees
st stpaid during the period of 1 April, 2014 to 31 March, 2015 under review is as follows:
st stRemuneration of Directors during 1 April 2014 to 31 March, 2015 was as follows:
S.No including
DA & perksand ***
Gratuity on Retire-
ment
1. Shri D.K.Sarraf 2.10 1.09 0.88 1.29 0.28 0.52 6.15 30.09.2017
2. Shri K. S. Jamestin(upto 31.07.2014)*
3. Shri A. K. Banerjee* 1.93 1.65 0.49 0.88 0.25 0.53 5.73 30.04.2015
4. Shri Shashi Shanker 1.74 1.52 0.78 0.80 0.23 0.44 5.51 30.11.2017
5. Shri T.K.Sengupta 1.82 1.73 0.48 1.73 0.24 0.49 6.49 31.12.2017
6. Shri N. K. Verma**(upto 26.08.2014)
7. Shri Ashok Varma 1.66 0.88 0.51 0.72 0.20 0.29 4.25 31.07.2015
8. Shri D.D.Misra(from 01.08.2014)
9. Shri A.K. Dwivedi(from 16.03.2015)
Names Salary Other Leave Perform- Contrib- Provision Grand Termbenefits Enca- ance ution to for Leave, Total
shment Incentives PF & Gratuity other & PRBS Funds as per
AS- 15
0.66 1.12 4.16 0.31 0.09 - 6.33 31.07.2014
0.76 0.47 0.15 0.81 0.10 0.45 2.74 26.08.2014
1.19 0.98 0.59 1.12 0.16 0.29 4.33 31.07.2018
0.16 0.14 0.64 0.04 - 0.02 1.00 31.07.2019
Names Sitting fees (`In Million)
Shri Arun Ramanathan 0.18
Prof Deepak Nayyar 0.12
Prof. S.K.Barua 0.72
Shri O.P. Bhatt 0.66
Shri K. N. Murthy 1.02
Shri P. Uma Shankar 0.48
Shri S. Ravi 0.52
Shri R. K. Singh 0.10
Total 3.80
Name of Directors No. Of Shares held
Shri D. K. Sarraf, Chairman & Managing Director
Shri K. S. Jamestin, Director (HR) (upto 31.07.2014)
Shri A. K. Banerjee, Director (Finance)
Shri T. K. Sengupta, Director (Of fshore)
Shri Shashi Shanker, Director (T&FS)
Shri D.D. Misra, Director (from 01.08.2014)
Prof. Deepak Nayyar(upto 19.06.2014)
Shri R. K. Singh (upto 19.09.2014)
Shri A K Dwivedi, Director (Exploration) (from 16.03.2015)
3,192
3,600
3,172
3,672
3,712
(HR) 1700
200
78
820

Corporate Governance Report
155
8.3 STAKEHOLDERS’ RELATIONSHIP COMMITTEE
Stakeholders Relationship Committee specifically looks into redressal of complaints/ grievances of Shareholders and Investors, pertaining to transfer/ transmission of shares, non-receipt of annual reports, dividend payments, issue of duplicate share certificates and other miscellaneous complaints. The Committee oversees and reviews performance of the Registrar and Transfer Agent and recommends measures for overall improvement in the quality of investor services. The Commit tee also monitors implementation and compliance of Company’s Code of Conduct for Prevention of Insider Trading in ONGC’s securities.
Shri K. N. Murthy, an Independent Director is the Chairman of the Commit tee. Other Members of the Commit tee were/are Shri Deepak Nayyar, Shri Arun Ramanathan, Prof. S.K. Barua, Shri O.P. Bhatt,Shri S. Ravi, Director (Finance) and Director (HR). The Company Secretary acts as a Convener of the Commit tee.
During the year 2014-15, Three meetings were th thheld on 26 June, 19 September, 2014 and
th19 March, 2015.
The details of meetings at tended by the members and their tenure as member of the above Commit tee is reflected in the table below:-
8.3.1 COMPLIANCE OFFICER
Shri N. K. Sinha, Company Secretary and
Compliance Of ficer superannuated on 30.06.2015
on at taining the age retirement. Shri V. N. Murthy
took over as Company Secretory and designated
as Compliance Of ficer of the Company with ef fect
from 01.07.2015, who is primarily responsible to
ensure Compliance with applicable statutory
requirements. He is the inter face between the
management and the regulatory authorities on
governance matters.
8.3.2 REDRESSAL OF INVESTORS’ GRIEVANCE
The Company addresses all complaints,
suggestions and grievances of the investors
expeditiously and usually resolves them within 7
days except in case of dispute over facts or other
legal constraints.
Except for the complaints pertaining to ‘ONGC
Of fer for Sale - 2004’ by Government of India, the
Company received 30 shareholders’ complaints
from Stock Exchanges/ SEBI which inter-alia
includes non-receipt of dividend/ annual report,
issue of Bonus Shares amongst others. The
complaints were duly at tended to and the
Company/ RTA have furnished necessary
documents / information to the shareholders. As far
as the Investors’ Grievances on “ONGC Of fer for
Sale-2004” is concerned, considerable progress
has been made by constant interaction with SEBI,
Department of Disinvestment and MCS.
No request for share transfer is pending beyond 30
days except those that are disputed or sub-judice.
All requests for de-materialization of shares are
l i kew ise p r ocessed and con f i rma t i on
communicated to investors and Depository
Participants within 10 working days.
The total number of complaints/ queries/
correspondence received and replied/ at tended to
the satisfaction of the shareholders was 2256. The
number of complaints pending as on 31.03.2015
are 101 out of which 97 complaints are related to
Of fer for Sale- 2004.
Attendance:-
Members No. of Meetings held Meetings during the tenure attended
Shri K. N. Murthy 03 03
Shri O.P. Bhatt 02 02(upto 13.12.2014)
Prof. Deepak Nayyar N.A N.A(upto 19.06.2014)
Shri Arun Ramanathan N.A. N.A.(upto 19.06.2014)
Prof. S. K. Barua - -(from 03.11.2014 to 13.12.2014)
Shri S. Ravi 01 01(upto 19.09.2014)
Shri A. K. Banerjee, 01 01(from 21.01.2015)
Shri D. D. Misra, 01 01(from 21.01.2015)
Permanent Invitees (upto 20.01.2015)
Shri K.S. Jamestin 01 01(upto 31.07.2014)
Shri D.D. Misra 01 00(from 01.08.2014)
Shri A.K. Banerjee 02 02

Annual Report 2014-15
Corporate Governance Report
156
of ficials, headed by Director (Finance) have been assigned the responsibility of up-keep of the said link and to serve as a plat form for the shareholders to express their opinions, views, suggestions, to understand the influencing factors in their investment decision-making process. Besides, this, the team is also instrumental in maintaining close liaison and to share information through periodic meets including tele-conferencing in India and abroad, regular interactions with investment bankers, research analysts and institutional investors. The Company is commit ted to take such additional steps as may be necessary to fulfil the expectations of the stakeholders.
8.4 H U M A N R E S O U R C E M A N A G E M E N T COMMITTEE
The terms of reference include consideration of all issues/ areas concerning Human Resource
8.3.4 INVESTOR RELATIONS CELL
In line with global practices, the Company is commit ted towards maintaining, the highest standards of Corporate Governance, reinforcing the relationship between the Company and its Shareholders. ‘Investor Service Center’ with information frequently required by investors and analysis is available on the Company’s corporate website www.ongcindia.com. This website provides updates on financial statements, investor-related events and presentations, annual reports, dividend information and shareholding pattern along with media releases, company overview and report on Corporate Governance etc. Existing and potential investors are able to interact with the Company through this link for their queries and for seeking information.
A Core Team comprising of senior, experienced
Sl. No. Nature of Complaint Contact Office Action to be taken
8.3.3 SETTLEMENT OF GRIEVANCES
Investors may register their complaints in the manner stated below:
Complaint regarding allocation of Shares, Refund order under Of fe r fo r Sa le , 2004 by Government of India
MCS Limited, F-65, Okhla Industrial Area, Phase-I, Delhi- 110020. Phone Nos.: 011-41406149, 51-52 Fax Nos.: 011-41709881.e-mail: [email protected]
Application giving details of Application No, No. of shares applied, No. of Shares allot ted, DP ID, Client ID, Nature of complaint, Applicant Name(s) and complete postal address.
1
Dividend from financial years 2007-08 (final) to 2014-15
nd(2 interim)and all mat ters pertaining to Bonus Shares and shares held in Physical mode;
For Physical Shares-
Change of address, status, Bank a c c o u n t , m a n d a t e , E C S mandate etc.
Karvy Computershare Private Limited,
Karvy Selenium Tower B, Plot 31-32, Gachibowli Financial District, Nanakramguda, Hyderabad-500 032
Phone No.040- 67162222
Fax No: 040- 23001153
Toll Free No. 1800-345-4001
e-mail: [email protected]
Letter on plain paper stating the nature of
complaint, Folio/DPID/Client ID No; lodging
of original shares and other documents/
instruments as the case may be.
Members are requested to apply for
renewal or issue of duplicate dividend
warrants for the Final Dividend 2007-08 and thInterim Dividend 2008-09 before 18
thOctober, 2015 and 18 January, 2016
respectively as the same will be transferred
by the Company to the Investor Education &
Protection Fund (IEPF) set up by
Government of India and no claim will lie
against IEPF or the Company.
2
For Dematted Shares-
Change of address, status, Bank a c c o u n t , m a n d a t e , E C S mandate etc.
C o n c e r n e d D e p o s i t o r y Par ticipant (DP) where the Shareholder is maintaining his/her account
As per instructions of DP3
Al l compla in ts except o f Sl. no.1 & 3.
Company Secretary
Oil and Natural Gas Corporation L t d . , 1 2 4 , I n d i r a C h o w k , New Delhi-110001
Phone: 011-23301299 & 23301257
e-mail: [email protected]
On plain paper stating nature of complaint, folio/DPID/Client ID No., Name and address.
4

Corporate Governance Report
157
Planning & Management, HR policies and initiatives and Promotions for the post of Group General Manager (GGM) and Executive Director (ED) and appeals of of ficers in terms of CDA Rules of ONGC.
Prof. S. K. Barua, an Independent Director was the Chairman of the commit tee upto 13.12.2014. Thereaf ter, the commit tee has been headed by Shri K. N. Murthy w.e.f 21.01.2015
Shri A.Giridhar, Prof. Deepak Nayyar, Shri P. Umashankar, Shri S. Ravi, Shri O.P. Bhat t, Shri U.P. Singh , CMD and all Functional Directors were/are the members of the Commit tee. Director (HR) is the Member-Convener of the Commit tee.
st stDuring 1 April, 2014 to 31 March, 2015, six th thmeetings were held on 28 April, 28 May,
th th th29 July, 26 November, 12 December , 2014 and th19 March,2015.
The details of meetings at tended by the members and their tenure as member of the above commit tee is reflected in the table below:
8.5 PROJECT APPRAISAL COMMITTEE
The Project Appraisal Commit tee examines and makes recommendations to the Board on projects/ capital investment exceeding 2500 million. Proposals upto `2500 million are appraised in-house, while the proposals exceeding 2500 million are first appraised by Financial Institutions and thereaf ter considered by the Project Appraisal Commit tee which recommends the proposal to the Board with its views. The Project Appraisal Commit tee also monitors IOR/ EOR Schemes. It also reviews the activities and operating performance of OVL and MRPL.
Shri O.P. Bhatt, Independent Director was the Chairman of this Commit tee upto 13.12.2014. Thereaf ter, the Commit tee has been headed by Shri K.N. Murthy w.e.f. 21.01.2015. Prof. S.K. Barua, Shri A. Giridhar, Shri Arun Ramanathan, Shri P. Umashankar, Shri S. Ravi, Shri U.P. Singh , Shri T.K. Sengupta, Shri A.K. Banerjee & Concerned Functional Director were/are the members of the Commit tee. Director (Of fshore) is the Member-Convener of the Commit tee.
st stDuring 1 April, 2014 to 31 March, 2015, ten th thmeetings were held on: 28 May, 26 June,
th th th th30 July, 13 & 28 August, 19 September, th th th13 November, 2014, 20 January, 13 February
thand 19 March, 2015.
The details of meetings at tended by the members and their tenure as member of the above Commit tee is reflected in the table below:-
`
`
*These Directors at tended the meetings as member concerning the Projects of their responsibilities.
Members No. of Meetings No. of held during Meetings the tenure at tended
Shri O. P. Bhat t (upto 13.12.2014) 07 05
Shri A. Giridhar, (upto 15.10.2014) 06 00
Shri Arun Ramanathan (upto 19.06.2014) 01 00
Prof. S. K. Barua (upto 13.12.2014) 07 06
Shri K. N. Mur thy 10 08
Shri A. K. Banerjee 10 10
Shri T. K. Sengupta 10 10
*Shri Shashi Shanker 02 01
Shri K.S. Jamestin (upto 31.07.2014) 03 03
*Shri D.K. Sarraf 01 01as Director (Onshore)
Shri P. Umashankar 05 05(upto 19.09.2014)
Shri S. Ravi (upto 19.09.2014) 05 05
Shri U.P. Singh (from 03.11.2014) 04 01
*Shri Ashok Varma 04 04(from 19.06.2014)
*Shri A. K. Dwivedi 01 01(from 16.03.2015)
Members No. of Meetings No. of
Prof. S. K. Barua 0(upto 13.12.2014)
Shri A. Giridhar, 0Nominee
(upto 15.10.2014)
Prof. Deepak Nayyar 0(upto 19.06.2014)
Shri K. N. Murthy 0(from 03.11.2014)
Shri D. K. Sarraf, CMD 06 06
Shri K. S. Jamestin 0(upto 31.07.2014)
Shri A. K. Banerjee 06 06
Shri T. K. Sengupta 06 05
Shri Shashi Shanker 0
Shri N. K. Verma 0(upto 26.08.2014)
Shri O.P. Bhatt 0(upto 13.12.2014)
Shri P. Umashankar 0(upto 19.09.2014)
Shri S. Ravi 0(upto 19.09.2014)
Shri Ashok Varma 0(from 19.06.2014)
Shri U.P. Singh 0(from 03.11.2014)
Shri D.D. Misra 0(from 01.08.2014)
Shri A. K. Dwivedi 0(from 16.03.2015)
held during Meetings the tenure attended
5 05
3 02Government
2 02
3 03
3 03
5 05
3 03
2 02
3 03
3 03
4 04
3 01
3 03
1 01

Annual Report 2014-15
Corporate Governance Report
158
8.6 H E A LT H S A F E T Y & E N V I R O N M E N T
COMMITTEE(HSE)
The terms of reference includes review of policy,
processes and systems on Safety, Health,
Environment and Ecology aspects.
Shri P. Umashankar, an Independent Director was
the Chairman of the Commit tee upto 19.09.2014.
Thereaf ter, the Commit tee has been headed by
Shri O.P. Bhatt upto 13.12.2014. Shri A. Giridhar,
Prof. Deepak Nayyar, Prof. S.K.Barua, Shri U.P.
Singh ,CMD and all functional Directors were/ are
members of the Commit tee. Director (T&FS) acts as
a Member-Convener.
st stDuring 1 April, 2014 to 31 March, 2015, tht wo meetings were held on 19 May &
th29 July, 2014.
The details of meetings at tended by the members
and their tenure as member of the above Commit tee
is reflected in the table below:-
8.7 FINANACIAL MANAGEMENT COMMITTEE
Role of the Commit tee includes examining the mat ters per taining to Budget, Delegation of Powers (Empowerment), Commercial Issues, Forex and Treasury Management, Investments, Risk Management, Capital Structure, Issue of Securities, Short and Long Term Loans.
Prof. S.K.Barua, an Independent Director was the Chairman of the Commit tee w.e.f 03.11.2014. Thereaf ter, the Commit tee has been headed by Shri K.N, Murthy from 21.01.2015. Shri O.P. Bhatt, CMD, Director (Finance) and Concerned Functional Director were/are the other members of the Commit tee. Company Secretary is the Convener.
st stDuring 1 April, 2014 to 31 March, 2015, thr e e me etings of the Commit te e were
th thheld on 14 November, 12 December, 2014 and th20 January, 2015
The details of meetings at tended by the members and their tenure as member of the above Commit tee is reflected in the table below:-
(The Audit, Ethics and Financial Management
Committee were demerged into Audit & Ethics
Committee and Financial Management Committee w.e.f
03.11.2014)
8.8 COMMITTEE ON DISPUTE RESOLUTION
The Commit tee has been constituted to review the
disputes bet ween ONGC and its vendors/
contractors for suitable redressal.
Shri S.Ravi, an Independent Director, was Chairman
of the Commit tee upto 19.09.2014.Thereaf ter, the
Commit tee has been headed by Shri K.N. Murthy
w.e.f . 03.11.2014.Shri Arun Ramanathan,
Shri O.P. Bhat t, Prof. S.K. Barua, Director
(Finance), Director (Onshore), Director (T&FS),
Shri U. P. Singh and Concerned Functional Director
were/ are the other members. Director (T&FS) is the
Members No. of Meetings No. of
Shri A. Giridhar 02 00
Prof. Deepak Nayyar 0(upto 19.06.2014)
Prof. S. K. Barua 0(upto 13.12.2014)
Shri O. P. Bhatt 0(upto 13.12.2014)
Shri K. S. Jamestin 0(upto 31.07.2014)
Shri A. K. Banerjee 02 01
Shri Shashi Shanker 0
Shri N. K. Verma 0(upto 26.08.2014)
Shri P. Uma Shankar 0(upto 19.09.2014)
Shri D. K. Sarraf 02 02
Shri T. K. Sengupta 02 02
Shri Ashok Varma 0(from 19.06.2014)
Shri U.P. Singh (from 03.11.2014)
Shri K. Murthy
held during Meetings the tenure attended
1 01
2 02
2 00
2 00
2 02
2 02
2 02
1 01
Af ter 03.11.2014 no meetingof the commit tee was held.
N.(from 03.11.2014)
Members No. of Meetings No. of
Prof. S. K. Barua
(upto 13.12.2014) 02 02
Shri O. P. Bhatt
(upto 13.12.2014) 02 02
Shri K. N. Murthy 03 03
Shri A. K. Banerjee 03 03
Shri D. K. Sarraf
(from 21.01.2015) - -
held during Meetings
the tenure attended

Corporate Governance Report
159
terms of Section 135 of the Companies Act, 2013 it is
necessary to constitute a Corporate Social
Responsibility Commit tee to oversee the CSR
activities. Accordingly, a Corporate Social
Responsibilit y and Sustainable Development
Commit tee was constituted by the Board of thDirectors in its 246 meeting held on 12.08.2013.
Prof. Deepak Nayyar, an Independent Director was
the Chairman of the Commit tee upto 19.06.2014.
Thereaf ter, the Commit tee has been headed by
Prof. S. K. Barua w.e.f. 03.11.2014. CMD, Director
(Finance), Director (HR) were/are the other
members the Commit tee. Chief CSR act as
Convener of the Commit tee.
The Terms of Reference of the Commit tee were
approved by the Board on 29.04.2015. The CSR
policy was approved by the Board on 28.05.2015
and is uploaded on the website of ONGC.
st stDuring 1 April, 2014 to 31 March, 2015, four th thmeetings were held on 19 June, 11 December,
th th2014 , 20 January and 19 March, 2015.
The details of meetings at tended by the members
and their tenure as member of the above Commit tee
is reflected in the table below:-
Member-Convener of the Commit tee.
st stDuring 1 April, 2014 to 31 March, 2015, five thmeetings of the commit tee were held on 24 April,
th th th th29 May, 26 June, 28 August, and 13 November,
2014.
The details of meetings at tended by the
members and their tenure as member of
the above Commit tee is reflected in the
table below:-
*Attended the meetings as member concerning the Projects of
their responsibilities.
8.9 Corpora te Soc ia l Respons ib i l i t y and
Sustainability Development
ONGC implements various measures in the area of
Corporate Social Responsibility across India.
Depar tment of Public Enterprise has issued
guidelines on implementation of CSR activities by
Public Sector Under takings, which require
formation of a CSR & SD Commit tee. Further, in
Members No. of Meetings No. of
Shri K. N. Murthy 05 04
Shri Arun Ramanathan
(upto 19.06.2014) 02 02
Shri O. P. Bhatt
(upto 13.12.2014) 05 05
Shri N.K. Verma
(upto 26.08.2014) 02 02
Shri A. K. Banerjee 05 04
Shri Shashi Shanker 05 04
Shri S. Ravi
(upto 19.09.2014) 04 04
Shri D. K. Sarraf as
Director (Onshore)* 01 01
Shri T.K. Sengupta 03 03
Shri Ashok Varma
(from 19.06.2014) 03 03
Shri U.P. Singh
(from 03.11.2014
upto 13.11.2014) 01 00
Prof. S.K. Barua 01 01
held during Meetings
the tenure attended
Members No. of Meetings No. of
Shri K. S. Jamestin 01 01
Shri A. K. Banerjee 04 04
Prof. Deepak Nayyar 01 01
Prof. S. K. Barua 0
(upto 13.12.2014)
Shri N.K. Verma 01 00
Shri D. K. Sarraf 04 03
Shri K.N. Murthy 0
(from 03.11.2014)
Shri D.D. Misra 0
(from 01.08.2014)
held during Meetings
the tenure attended
2 01
3 03
3 03

Annual Report 2014-15
Corporate Governance Report
160
8.10 Committee of Directors for Issue of Duplicate
share Certificates
In compliance of Rule 6(2)(a) of the Companies
(Share Capital and Debentures ) Rules, 2014 and
General Circular No. 19/ 2014 dated 12.06.2014 of
Ministry of Corporate af fairs, Government of India, ththe Board of Directors in its 264 Meeting held on
12.12.2014 have constituted a Committee of
Directors for issue of Duplicate Share
Certificates comprising of Director (Finance),
Director (T&FS) and Director (HR)
Company Secretary acts as Secretary to the
Commit tee of Directors.
The role of the Commit tee shall be to approve the
issue of Duplicate Share Certificates and any other
matter incidental thereto.
th stDuring 12 December, 2014 to 31 March, 2015 , thOne meeting was held on 6 January, 2015
The details of meetings at tended by the members
and their tenure as member of the above Commit tee
is reflected in the table below:-
4. Define, the risk appetite for the Company, advice
business units/support functions on risk initiatives.
5. Review and approve changes in the risk appetite of
the company.
6. Suggest improvements to risk management
techniques and lif t management awareness.
7. Provide quarterly updates to Board through the
A&EC on the current risk management procedures
and status of key risks.
8. Monitor emerging issues and best practices.
9. Monitor Business Risk Reporting.
10. Ensure communication of Policies and standards to
successive levels of Management.
11. Consideration of any other item which may be
delegated in this regard by the Board of Directors.
12. Any other role assigned for the Commit tee due to
changes/modification in the Companies Act, 2013,
Listing Agreement, SEBI & DPE Guidelines.
The details of meetings at tended by the members
and their tenure as member of the above Commit tee
is reflected in the table below:-Members No. of Meetings No. of
Shri A.K. Banerjee 01 01
Shri Shashi Shanker 01 01
Shri D.D Misra 01 01
held during Meetings
the tenure attended
8.11 Risk Management Committee
In compliance of SEBI Circular dated 17.04.14 on
Corporate Governance, the Board of Directors of the th thCompany in its 264 Meeting held on 12 December,
2014 constituted a Board Level 'Risk Management
Commit tee' comprising of Director (Finance),
Director (T&FS), Director (Of fshore), Director
(Onshore), Director (HR) , Director (Exploration) and
Shri K. N. Murthy, Independent Director
Director (Finance) is the Chairman of the Commit tee
and Chief Risk Of ficer (CRO) is the convener.
The role of the Commit tee includes the following:
1. Ensure compliance with Risk Management Policy.
2. Review adequacy and ef fectiveness of Business
Risk Management .
3. Review the organization wide risk port folio and
consider it against the risk appetite.
Members No. of Meetings No. of
Shri A.K. Banerjee 01 01
Shri Shashi Shanker
Shri T.K. Sengupta 01 01
Shri Ashok Varma 01 01
Shri D.D. Misra 01 01
Shri K.N. Murthy 01 01
Shri A. K. Dwivedi 01 01
Shri D. K. Sarraf 0
held during Meetings
the tenure attended
N.A. N.A.
1 -

Corporate Governance Report
161
8.12 Research and Development Committee
thThe Board of Directors of the company in its 265 stMeeting held on 21 January, 2015 have constituted
a 'Research and Development Commit tee'
comprising of Shri K.N. Murthy, Independent
Director, Director (Finance), Director (T&FS),
Director (Of fshore), Director (Onshore), Director
(HR) and Director (Exploration).
Director (T&FS) is the convener and the Company
Secretary acts as the secretary to the commit tee.
The Terms of Reference of the Research &
Development Commit tee shall broadly be to
oversee the operations and functioning of the
various R&D activities being carried out in the
various Institutes of ONGC. It shall also include
reviewing the parameters with regard to HR, Capex
and Opex of the R&D activities. The final Terms of
Reference shall be finalised by the Commit tee.
No meeting of the R&D Commit tee was held during
2014-15.
8.13 Project Monitoring Committee
thThe Board of Directors of the company in its 265 stMeeting held on 21 January, 2015 have constituted
a ‘Project Monitoring Committee’ comprising of
Shri K.N. Murthy, Chairman. Shri U.P. Singh, Director
(Finance), Director (Of f shore), Concerned
Functional Director are other members of the
commit tee.
Director (Of fshore) is the convener of the
commit tee.
Role of Project Monitoring Committee
The role of the Commit tee shall inter – alia include
the following:
During Project Implementation:
1. The Functional Directors shall ensure that the
various projects of value more than `100 Crore
(capex) being implemented under their domain are
placed before the PMC on a periodical basis for
monitoring and review.
2. The PMC shall look into the reasons for cost over-run
(capex & opex) and time over-run of the project and
would advise how to reduce over run of cost & time.
3. It will have the power to order investigation into
abnormal delays in implementation of a project
4. The observations and recommendations of the
Commit tee on the various projects shall be placed
before the Board for review / information.
5. To recommend closure of the project af ter its
completion / on declaration of its unviability or
otherwise.
6. To suggest mechanisms for improvisation in project
implementation/ management
7. Any other related issues as may be suggested by the
PMC for ef fective and focussed monitoring of the
projects.
Post Project Implementation:
1. The Functional Directors shall put up the status
including capex, opex, production achieved,
vaiability analysis etc. of each completed project of
value more than 100 Crore within 6 months of
actual date of completion of a project.
2. Further, performance of every completed project
needs to be reviewed at least once in two years.
3. Review to cover functional parameters anticipated at
the time of project implementation vis-à-vis actual
performance.
4. To suggest measures for improvement, if required.
5. Reporting to Board on lessons learnt.
The details of meetings at tended by the members
and their tenure as member of the above Commit tee
is reflected in the table below:-
Only one meeting of the Commit tee was held on th19 March, 2015.
`
Members No. of Meetings No. of
Shri K.N. Murthy 01 01
Shri U.P. Singh 01 01
Shri A.K. Banerjee 01 01
Shri T.K. Sengupta 01 01
Shri Ashok Varma* 01 01
*Attended the meeting as member concerning the
Projects of his responsibility
held during Meetings
the tenure attended

Annual Report 2014-15
Corporate Governance Report
162
8.14 OTHER FUNCTIONAL COMMITTEES
Apart from the above, the Board, from time to time,
constitutes Functional Commit tees with specific
terms of reference as it may deem fit. Meetings of
such Commit tees are held as and when the need
arises. Time schedule for holding the meetings of
such Commit tees is finalized in consultation with
Commit tee members.
9.0 CODE OF CONDUCT FOR MEMBERS OF THE
BOARD AND SENIOR MANAGEMENT
The Company is commit ted towards conducting
business in accordance with the highest standards
of business ethics and complying with applicable
laws, rules and regulations. The existing code of
Conduct has been revised in line with the provisions
of the Companies Act, 2013, SEBI Guidelines and
Listing Agreement and approved by the Board of thDirectors of the Company in its 268 meeting held
on 29.04.2015 A copy of the Code has been placed
on the Company’s website www.ongcindia.com.
All members of the Board and Senior Management
i.e. ‘Key Executives’ have confirmed compliance
with the Code of Conduct for the year under review.
A declaration signed by Chairman & Managing
Director is given below:
Code of Conduct – Compliance affirmation
(Pursuant to Clause 49 of the Listing Agreement)
“I hereby confirm that the Company has obtained
from the members of the Board and senior
management (Key Executives), af firmation that they
have complied with the Code of Conduct for
Directors and senior management in respect of the
financial year 2014-15”
Sd/-
(Dinesh Kumar Sarraf)
Chairman & Managing Director
New Delhith9 June, 2015
10.0 WHISTLE BLOWER POLICY
In terms of revised Clause 49 of the Listing
Agreement, the company shall establish a vigil
mechanism for directors and employees to report
concerns about unethical behaviour, actual or
suspected fraud or violation of the company’s code
of conduct or ethics policy. Accordingly ONGC has thimplemented the Whistle Blower Policy on 30
November, 2009, which is in line with the Listing
Agreement.
ONGC has provided ample oppor tunities to
encourage the employees to become whistle
blowers (employees who voluntarily and
confidentially want to bring the unethical practices,
actual or suspected fraudulent transactions in the
organization to the notice of the competent authority
for the greater interest of the organization and the
Nation). It has also ensured a very robust
mechanism within the same framework to protect
them (whistle blowers) from any kind of harm. It is
hereby af firmed that no personnel has been denied
access to the Audit Commit tee.
The Company has a Vigilance Department which is
headed by an of ficer on deputation from the
Government of India in the rank of Joint Secretary or
above.
10.1 ONGC’ CODE ON INSIDER TRADING
In pursuance of the Securities and Exchange Board
of India (Prohibition of Insider Trading) Regulations,
2015, the Board has approved the "The Code of
Internal Procedures and Conduct in dealing with the thSecurities of ONGC” in its 268 Board meeting held
on 29.04.2015. The objective of the Code is to
prevent purchase and/ or sale of shares of the
Company by an Insider on the basis of unpublished
price sensitive information. Under this Code,
Insiders (Directors, Advisors, Key Executives,
Designated Employees and other concerned
persons) are prohibited to deal in the Company’s
shares/derivatives of the Company during the
closure of Trading Window and other specified
period(s). To deal in securities, beyond specified
limit, permission of Compliance Of ficer is required.
All Directors/ Advisors/ Of ficers/ designated
employees are also required to disclose related
information periodically as defined in the Code.
10.2 CEO/ CFO CERTIFICATION
In terms of Clause 49 of the Listing Agreement, the
certification by the CEO and CFO on the financial
statement and internal controls relating to financial
reporting for the year 2014-15 was submit ted to the thBoard in its meeting held on 28 May, 2015.
10.3 FINANCE MANUAL
ONGC’s Finance Manual is a compendium based on
existing practices and systems, comprehensively
covering various finance activities such as
accounting, budgeting, costing, pre-audit and
treasury management. This manual provides the
users with existing practices, processes, finance

Corporate Governance Report
163
policies & procedures, and guides Finance of ficers
while ensuring consistency and uniformity across
locations in terms of processes and methodologies.
This manual also helps new incumbents' and
Finance of ficers to enlighten them as well as outside
agencies such as Statutory Auditors, Government
Auditors associated with ONGC.
11.0 SUBSIDIARY MONITORING FRAMEWORK
The Company has two direct subsidiary companies,
Mangalore Refinery and Petrochemicals Ltd. (MRPL)
and ONGC Videsh Ltd. (unlisted, non-material). The
list of subsidiaries of MRPL and OVL is given in the
consolidated accounts of ONGC, which forms part
of the Annual Report.
All subsidiaries of the Company are Board managed
with their Boards having the rights and obligations
to manage such companies in the best interest of
their stakeholders. CMD, ONGC is the Chairman of
MRPL and OVL.
In terms of Clause 49.V(B) to (G) of the Listing
Agreement and DPE guidelines, performance of the
listed and unlisted subsidiary companies is
reviewed by the Audit and Ethics Commit tee and the
Board of ONGC as under:
a) Financial Statements of the listed and unlisted
subsidiary companies, are reviewed by the Audit
and Ethics Commit tee;
b) Minutes of the meetings of the Board of Directors are
placed before the Company’s Board, periodically;
c) A statement of all significant transactions and
arrangements entered into by the Subsidiary
Company are also reviewed by the Company.
The Company does not have any material unlisted
subsidiary company in terms of the clause 49 of the
Listing Agreement.
12. ANNUAL GENERAL MEETINGS
Location, date and time of the AGMs held during the preceding 3 years are as under:
Year Location Date Time (IST)
2011-12 Siri Fort Auditorium, Khel Gaon, August Kranti Marg, New Delhi- 110049 24.09.2012 10.00 a.m
2012-13 NDMC Indoor Stadium, Talkatora Garden, New Delhi-110001 25.09.2013 10.00 a.m
2013-14 NDMC Indoor Stadium, Talkatora Garden, New Delhi-110001 19.09.2014 10.00 a.m
There was no special resolution passed by the Company at the last Three Annual General Meetings. No special
resolution is proposed to be passed in the ensuing AGM. Further, no resolution requiring Postal Ballot is proposed at
the ensuing AGM.
13. DISCLOSURE
13.1 MATERIAL CONTRACTS/ RELATED PARTY TRANSACTIONS
The Company has not entered into any material financial or commercial transactions with the Directors or the Management or their relatives or the companies and firms, etc., in which they are either directly or through their relatives interested as Directors and/or Partners except with certain PSUs, where the Directors are Directors without the required shareholdings. The Company has obtained declarations from all concerned in this regard, which were noted by the Board. A comprehensive policy on Related Party Transaction
th(RPT) has been approved by the Board in its 264 meeting held on 12.12.2014. The Policy is in line with the Listing Agreement and Companies Act, 2013. The Policy as above has been uploaded on the website of ONGC.
The details of transactions with related parties are
disclosed in Note No. 39 of the Notes to Financial st
Statements for the year ended 31 March, 2015.
Being a State Enterprise, no disclosure has been
made in respect of the transactions with State
Enterprises, including subsidiary companies, in line
with Accounting Standard-18 on Related Party
Transactions.
13.2 COMPLIANCES
The Company has complied with applicable rules
(except as otherwise stated in this report) and the
requirement of regulatory authorities on capital
market and no penalties or strictures were imposed
on the Company during last three years.
All returns/ reports were filed within stipulated time
with stock exchanges/ other authorities.

Annual Report 2014-15
Corporate Governance Report
164
14. MEANS OF COMMUNICATION
• Quar terly/ Annual Results: The Company
regularly intimates un-audited as well as audited
financial results to the Stock Exchanges,
immediately af ter these are approved. These
financial results are normally published in the
leading English and vernacular dailies having wide
circulation across the country. The results are also
displayed on the website of the Company
www.ongcindia.com. The results are not sent
individually to the shareholders
• News Release, Presentation etc.: The of ficial
news releases, detailed presentations made to
media, institutional investors, financial analysts etc.
are displayed on the Company’s website
www.ongcindia.com
• W e b s i t e : T h e C o m p a n y ’ s w e b s i t e
www.ongcindia.com contains separate dedicated
section ‘Investor Relations’ where the information
for shareholders is available. Full Annual Report,
Shareholding Pattern and Corporate Governance
Report etc. are also available on the web-site in a
user-friendly manner
• Annual Report: Annual Report containing inter-
alia, Audited Accounts, Consolidated Financial
Statements, Board's Repor t, Management
Discussion and Analysis (MD&A) Repor t, Business
Responsibility Report, Corporate Governance
Report, Auditors’ Report, including Information for
the Shareholders and other important information is
circulated to the members and others entitled
thereto
15. SHAREHOLDERS’ INFORMATION
15.1 ANNUAL GENERAL MEETING
thDate Tuesday, 15 September, 2015.
Time 10:00 Hrs.
Venue NDMC Indoor Stadium, Talkatora Garden,
New Delhi – 110001.
Adoption of Quarterly Results
for the Quarter ending meeting of the Board
th30 , 2015 (with limited
review by Statutory Auditors) 2015
th30 , 2015 (with thlimited review by Statutory 12
Auditors)
st31 , 2015 (with limited
review by Statutory Auditors) February, 2016
st31 , 2016 (audited) Saturday,
May, 2016
These dates are tentative and subject to change and the last
date for submission of the unaudited quarterly and year to
date financial results to the stock exchange is within forty-
five days of end of each quarter (except the last quarter).
The last date for submission of the financial results of the last
quarter is within sixty days from the end of the financial year.
Tentative date of the
June Thursday, th13 August,
September Thursday,
November, 2015
December Thursday,th11
Marchth28
15.3 BOOK CLOSURE PERIOD
The Book Closure period is from Wednesday, the th th9 September, 2015 to Tuesday, the 15 September,
2015 (both days inclusive) for the payment of Final Dividend.
15.4 DIVIDEND PAYMENT DATEthFinal Dividend would be paid on or af ter 15
September, 2015.
15.5 LISTING ON STOCK EXCHANGES:
The equity shares of the Company are part of the Sensex and S&P CNX Nif ty Index and are listed on the following Stock Exchanges:
15.2 FINANCIAL CALENDER
Name & Telephone/Fax/E-mail ID/Website
Bombay Stock Exchange (BSE) P.J. Towers, Dalal Street, FortMumbai-400001
National Stock Exchange of India Ltd. (NSE)Exchange Plaza,C-1, G Block, Bandra-Kurla Complex, Bandra(E), Mumbai-400051
Trading Address ID Symbol
Telephone:022-22721233/4 500312 Fax: 022-22721919 ONGC E-mail:[email protected]:www.bseindia.com
Telephone: 022-26598100 ONGC-8114Fax: 022-26598120E-mail: [email protected]: www.nseindia.com

Corporate Governance Report
165
15.6 LISTING FEES
Annual listing fees for the year 2014-15, as
applicable, have been paid to the above Stock
Exchanges.
15.7 DEMAT ISIN NUMBERS IN NSDL & CDSL
(Stock Code): INE213A01029
Custody Fee of NSDL and CDSL has been paid for
the Financial Year 2014-15
15.8 STOCK MARKET INFORMATION
The stock price performance of ONGC scrip during st stthe period 1 April, 2014 to 31 March, 2015 in
comparison to BSE is plot ted below:
16. SHARE TRANSFER SYSTEM
Karvy Computershare Private Ltd. (Karvy) is the Registrar and Share Transfer Agent (RTA) for physical shares. Karvy is also the depository inter face of the Company with both National Securities Depository Ltd. (NSDL) and Central Depository Services (India) Ltd. (CDSL)
The transfer of shares received in physical form is overseen by an Of ficers Commit tee (constituted by the Board of Directors) which usually meets once in a fortnight to ratify the shares received for transfer, transmission, re-materialization and dematerialization etc. The shares for transfer received in physical form
are transferred expeditiously, provided the documents are complete and the share transfer is not under any dispute. The Minutes of the aforesaid Commit tee are placed before the Stakeholders’ Relationship Commit tee. A summary of transfer/ transmission of securities so approved by the aforesaid Commit tee are placed at Board Meetings. The share certificates duly endorsed are sent to the shareholders by RTA. Confirmation in respect to the requests for dematerialization of shares is sent to the respective depositories i.e. NSDL and CDSL, expeditiously.
With a view to further expedite the process of transfer and transmission of shares in physical mode, the
15.8.1 MARKET PRICE DATA: HIGH, LOW DURING EACH MONTH IN LAST FINANCIAL YEAR
Source: Web-sites of BSE and NSE
Month Bombay Stock Exchange National Stock Exchange
High ( ) Low (`) Volume High ( ) Low ( ) Volume
April‘2014 332.00 313.70 4039126 332.45 313.55 89919232
May’2014 424.80 322.90 11074136 425.00 322.65 120130347
June’2014 472.00 378.40 23520602 471.85 378.25 204380766
July’2014 429.95 391.00 10237691 430.00 390.55 117991632
August’2014 440.35 384.75 11904455 440.50 384.15 102209527
September’2014 458.95 395.25 8939581 457.95 395.10 92487706
October’2014 432.00 389.05 7553006 429.00 388.65 86517359
November’2014 412.40 375.00 6252608 412.50 375.00 77911364
December’2014 380.05 329.65 9376747 382.00 329.10 98547362
January’2015 357.80 328.60 8780525 358.00 328.10 94258715
February’2015 373.70 313.00 9214585 373.80 312.65 88976033
March’2015 329.80 301.00 12064376 329.60 298.80 93556140
` ` `

Annual Report 2014-15
Corporate Governance Report
166
Board of Directors have authorised the Share Transfer Agent to process the transfer / transmission. The details of the transfers etc are placed before the Commit tee of Of ficers for ratification.
Pursuant to the Clause 47(C) of the Listing Agreement, certificates on half yearly basis confirming due compliance of share transfer formalities by the Company, certificate for timely dematerialization of the shares as per SEBI (Depositories and Participants) Regulations, 1996 are sent to the stock exchanges.
In addition, as a part of the capital integrity audit, a Reconciliation of Share Capital Audit confirming that the total issued capital of the Company is in agreement with the total number of shares in physical form and the total number of dematerialized shares held with NSDL and CDSL, is placed before the Board on a quarterly basis. A copy of the Audit Report is submit ted to the stock exchanges.
The total number of transfer deeds processed and shares transferred during the last three years are as under:
Years No. of transfer deeds No. of shares
transferred
2014-15 724 21508
2013-14 1,722 23,884
2012-13 1,178 24,633
processed
17. S H A R E H O L D I N G PAT T E R N A S O N
st31 MARCH, 2015
held
812,463,740 9.49
6,142,86,761 7.18
Category No. of Shares Percentage of
Shareholding
President of India 5,897,760,333 68.94
Banks, Financial
Institutions and
Insurance Companies
Foreign Institutional
Investors
Mutual Funds & UTI 78,857,327 0.92
NRIs 4,106,786 0.05
Bodies Corporate: 995,178,016 11.63
Employees 5,344,068 0.06
Public 147,493,089 1.73
Total 8,555,490,120 100.00
st17.1 TOP 10 SHAREHOLDERS AS ON 31 MARCH, 2015
S. No Name No. of Shares held % of total Shareholding
1 PRESIDENT OF INDIA . 5,897,760,333 68.94
2 LIFE INSURANCE CORPORATION OF INDIA 677,182,291 7.92
3 INDIAN OIL CORPORATION LIMITED 657,923,428 7.69
4 GAIL (INDIA) LIMITED 205,601,068 2.40
5 FRANKLIN TEMPLETON INVESTMENT FUNDS 73,193,580 0.86
6 VANGUARD EMERGING MARKETS STOCK INDEX FUND, ASERIE
7 ICICI PRUDENTIAL LIFE INSURANCE COMPANY LTD 37,140,388 0.43
8 GOVERNMENT PENSION FUND GLOBAL 24,757,906 0.29
9 COPTHALL MAURITIUS INVESTMENT LIMITED 21,720,748 0.25
10 HSBC GLOBAL INVESTMENT FUNDS A/C HSBC GIF MAURITIU
37,374,692 0.44
20,880,830 0.24

Corporate Governance Report
167
st17.2 Distribution of Shareholding by Size as on 31 March, 2015
Category Number ofShareholders Shareholders of Shares Shareholding
1-500 485,451 90.14 57,403,915 0.67
501-1000 25,227 4.68 18,564,513 0.22
1001-2000 12,562 2.33 18,306,706 0.21
2001-3000 5,737 1.07 14,339,610 0.17
3001-4000 5,164 0.96 18,372,360 0.21
4001-5000 1,599 0.30 7,150,940 0.08
5001-10000 1,327 0.25 8,853,349 0.10
10001 and above 1,475 0.27 8,412,498,727 98.33
Total 538,542 100.00 8,555,490,120 100.00
% of Total number % of
st 17.3 Geographical Distribution of Shareholders as on 31 March, 2015
S. No City Shareholders Shareholding
Nos % age No of shares %age of Shareholding
1 MUMBAI 138,960 25.80 2,320,473,230 27.12
2 NEW DELHI 55,763 10.35 6,118,835,672 71.52
3 CHENNAI 20,570 3.82 19,396,306 0.23
4 CALCUTTA 27,953 5.19 11,302,760 0.13
5 AHMEDABAD 31,169 5.79 10,737,393 0.13
6 VADODARA 16,597 3.08 7,015,940 0.08
7 DEHRADUN 5,174 0.96 5,206,056 0.06
8 BANGALORE 24,293 4.51 5,032,499 0.06
9 JORHAT 3,936 0.73 3,954,366 0.05
10 OTHERS 214,127 39.76 53,535,898 0.63
TOTAL 538,542 100.00 8,555,490,120 100.00

Annual Report 2014-15
Corporate Governance Report
168
17.4 History of Paid-up Equity Share Capital (Face value of 5 each)
Year No. of Shares Cumulative Details
1993-94 10 10 Initial Subscription to the Memorandum Of Association on rd23 June, 1993.
st1993-94 34,28,53,716 34,28,53,726 Issued to the President of India on 1 February, 1994 on
transfer of Undertaking of Oil and Natural Gas Commission in
terms of Oil and Natural Gas Commission (Transfer of
Undertaking and Repeal) Act, 1993.
1994-95 66,39,300 34,94,93,026 Issued to the Employees at a premium of `260 per Share
(includes 600 shares issued in 1995-96).
1995-96 107,64,40,966 142,59,33,992 Issue of Bonus Shares in ratio of 3.08: 1 on 24.04.1995 by
Capitalization of General Reserve.
2006-07 (-)18,972 142,59,15,020 Forfeiture of Shares on 12.04.2006.
71,29,57,510 213,88,72,530 Issue of Bonus Shares in ratio of 1:2 on 08.11.2006 by
Capitalization of General Reserve.
2010-11 - 8,555,490,120 Each equity Share of ONGC was split from the face value of
into two equity shares of the face value of 5 each.
Bonus Shares were issued in the ratio of 1:1 by Capitalization of
Reserves to the shareholders as on 09.02.2011 (Record Date).
2011-12 - 8,555,490,120 President of India (PoI) acting through Ministry of Petroleum &
Natural Gas, Government of India on 05.03.2012 has sold
420,416,170 number of equity shares (4.91% shares) in ONGC
through the of fer for sale through Stock Exchange Mechanism.
2012-13 - 8,555,490,120 -
2013-14 - 8,555,490,120 President of India (PoI) acting through Ministry of Petroleum &
Natural Gas, of India on 27.03.2014 has sold
24,786,189 number of equity shares (0.29% shares) in ONGC
through Of f Market Transaction to Central Public Sector
Enterprises Exchange Traded Fund.
2014-15 - 8,555,490,120
`10 `
Government

Corporate Governance Report
169
18. CORPORATE BENEFITS
DIVIDEND HISTORY
Years Rate (%) Per Share( ) Amount (`in million)
2008-09
• Interim 180 18 38,499.66
• Final 140 14 29,944.22
2009-10
• Interim 180 18 38,499.66
• Final 150 15 32,083.09
2010-11
• Interim 320 32 68,443.92
• Final 15 0.75 6,416.62
2011-12
• First Interim 125 6.25 53,471.84
• Second Interim 30 1.50 12,833.23
• Final 40 2.00 17,110.98
2012-13
• First Interim 100 5.00 42,777.45
• Second Interim 80 4.00 34,221.96
• Final (Proposed) 10 0.50 4,277.75
2013-14
• First Interim 100 5.00 42,777.45
• Second Interim 85 4.25 36,360.83
• Final 5 0.25 2138.87
2014-15
• First Interim 100 5.0 42,777.45
• Second Interim 80 4.0 34221.96
• Final (Proposed) 10 0.5 4,277.75
`
19. TRANSFER OF UNPAID/ UNCLAIMED DIVIDEND
AMOUNT TO INVESTOR EDUCATION &
PROTECTION FUND (IEPF)
During the year under report, an amount of
`11,661,126.00 and 13,803,858.00 pertaining to
unpaid dividend for the financial year 2006-07 (Final)
and 2007-08 (Interim) respectively was transferred
to the Investor Education & Protection Fund (IEPF)
set up by the Central Government. This is in
accordance with the Sections 124 and 125 of the
Companies Act, 2013 requiring transfer of dividend
remaining unclaimed and unpaid for a period of 7
years from the due date to the IEPF.
`
The unpaid/unclaimed amount of Final Dividend thdeclared on 19 September, 2008 for the financial
thyear 2007-08 and interim dividend declared on 19
December, 2008 for the financial year 2008-09 will be
transferred to the Investor Education and Protection thFund (IEPF) of the Central Government by 18
thOctober, 2015 and 18 January, 2016 respectively.
Members who have not encashed their dividend
warrants pertaining to the said years may approach
the Company or its Registrar & Share Transfer Agent
for obtaining payment thereof.
Given below are the proposed dates for transfer of
the unclaimed dividend to IEPF by the Company:-

Annual Report 2014-15
Corporate Governance Report
170
20. DEMATERIALIZATION OF SHARES AND
LIQUIDITY
S. Shares % of
1. PHYSICAL 11,838 6,215,239 0.07
2. NSDL 394,005 1,760,461,822 20.58
3. CDSL 132,699 6,788,813,059 79.35
Total 538,542 8,555,490,120 100.00
Description No. of
No. Share Holders Equity
The shares of the Company are in compulsory
dematerialized segment and are available for trading in
depository system of both National Securities Depository
Limited and Central Depository Services (India) Limited.
21. OUTSTANDING GDRs/ ADRs / WARRANTS OR CONVERTIBLE INSTRUMENTS
No GDRs/ ADRs/ Warrants or Convertible Instruments have been issued by the Company during the year.
22. ASSETS/ BASINS/ PLANTS/ INSTITUTES/CODs
A. ASSETS
1. Mumbai High Asset, Mumbai
2. Neelam & Heera Asset, Mumbai
3. Bassein & Satellite Asset, Mumbai
4. Ahmedabad Asset, Ahmedabad
5. Ankleshwar Asset, Ankleshwar
6. Mehsana Asset, Mehsana
7. Rajahmundry Asset, Rajahmundry
8. Karaikal Asset, Karaikal
9. Assam Asset, Nazira
10. Tripura Asset, Agartala
11. Eastern Of fshore Asset, Kakinada, Andhra Pradesh
B. BASINS
1. Western Of fshore Basin, Mumbai
2. Western Onshore Basin, Vadodara
3. KG-PG Basin, Chennai
4. Cauvery Basin, Chennai
5. Assam & Assam-Arakan Basin, Jorhat
6. MBA Basin and CBM Development Project, Kolkata/Bokaro
7. Frontier Basin, Dehradun
C. PLANTS
1. Uran Plant, Uran
2. Hazira Plant, Hazira
3. C C C Plant, Dahej, Gujarat2 3 4
D. INSTITUTES
1. Keshava Deva Malaviya Institute of Petroleum
Exploration (KDMIPE), Dehradun
2. Institute of Drilling Technology (IDT), Dehradun
3. Institute of Reservoir Studies, (IRS) Ahmedabad
4. Institute of Oil & Gas Production Technology (IOGPT)
Navi Mumbai
5. Institute of Engineering & Ocean Technology (IEOT)
Navi Mumbai
6. Geo- data Processing & Interpretation Center
(GEOPIC), Dehradun
7. ONGC Academy, Dehradun
8. Institute of Petroleum Safety, Health & Environment
Management (IPSHEM),Goa
9. Institute of Biotechnology & Geotectonics Studies
(INBIGS), Jorhat
10. School of Maintenance Practices (SMP), Vadodara
11. Centre for Excellence in Well Logging (CEWL),
Vadodara
12. Regional Training Institutes (RTIs) Navi Mumbai,
Chennai, Sivasagar & Vadodara
13. ONGC Energy Centre
E. Centres of Deliveries
1. CBM, New Delhi
2. Shale Gas, Vadodara
3. Deep water, Mumbai
4. High Temperature/ High Pressure, Chennai
23. INVESTOR SERVICES AND ADDRESSES FOR
SHAREHOLDERS’ CORRESPONDENCE.
These have been given at 8.3.3 and 8.3.4 above
24. RISK MANAGEMENT
The Risk Management Policy has been rolled out
across the organization in all Assets, Basins, Plants,
Institutes and of fices.
Details are given under Risk Management Commit tee.
25. COMPLIANCE CERTIFICATE OF THE AUDITORS
Certificate from the Auditors of the Company, confirming compliance with the conditions of Corporate Governance as stipulated under Clause 49 of the Listing Agreement, is annexed to this Report. The Certificate has also been forwarded to the stock exchanges where the securities of the Company are
Financial Year Date of to IEPF*
2007-08- Final 19.09.2008 18.10.2015
2008-09-Interim 19.12.2008 18.01.2016
*Indicative dates, actual dates may vary.
Proposed DateDeclaration for transfer

Corporate Governance Report
171
listed. ONGC has implemented most of the non-mandatory requirements.
26. A D O P T I O N O F N O N - M A N D A T O R Y REQUIREMENTS OF CLAUSE - 49
Beside the mandatory requirement of Clause 49 of the Listing Agreement, the following non-mandatory requirements have been implemented and reflected elsewhere in this report:-
• As far as Audit Qualifications are concerned, the Company is in the regime nil qualifications.
• The Internal Auditor reports directly to the Audit Commit tee.
27. GUIDELINES ON CORPORATE GOVERNANCE BY DPE
In May, 2010, the Department of Public Enterprises has issued Guidelines on Corporate Governance for Central Public Sector Enterprises which are now mandatory in nature.
No Presidential Directives have been issued during st stthe period 1 April, 2014 to 31 March, 2015. ONGC is
complying with these guidelines to the extent possible
No items of expenditure have been debited in books of accounts, which are not for the purpose of business. No expenses, which are personal in nature, have been
incurred for the Board of Directors and top management.
The General Administrative expenses were 5.32% of total expenses during 2014-15 as against 6.57% during the previous year.
28. SECRETARIAL AUDIT REPORT
Secretarial Audit Report confirming compliance to the applicable provisions of Companies Act, 2013, Revised Listing Agreement, SEBI guidelines, DPE Guidelines and all other related rules and regulations relating to capital market, though not mandatory, obtained from a practicing Company Secretary, was noted by the Board and forms part of the Board's Report.
29. FEE TO STATUTORY AUDITORS
The fee paid/ payable to the Statutory Auditors for the year was `25.01 million (previous year `22.92 million) including 1.12 million (previous year 1.01 million) as fee for certification of Corporate Governance Report, `5.06 million (previous year `5.06 million) for limited review report and `3.66 million (previous year `3.14 million) for other certification including certification under Section 33(2AB) of Income Tax Act for R&D Institutes plus reasonable travelling and out of pocket expenses actually incurred / reimbursable.
The exploration field party personnel stay in remote locations for months away from their family, exploring energy for India. Team-
spirit is what keeps them going and motivated to take on any challenge that comes their way.

Annual Report 2014-15
Auditors Certificate on Corporate Governance
172
Auditors’ Certificate on Compliance of Conditions of Corporate Governance
To
The Members
Oil And Natural Gas Corporation Limited
1. We have examined the compliance of conditions of Corporate Governance by Oil And Natural Gas Corporation stLimited (“the company”)for the year ended 31 March, 2015, as stipulated in Clause 49 of the Listing Agreement entered
into by the Company with the Stock Exchanges.
2. The Compliance of conditions of Corporate Governance is the responsibility of the management. Our examination was carried out in accordance with the Guidance Note on Certification of Corporate Governance issued by The Institute of Chartered Accountants of India and was limited to a review of the procedures and implementation thereof, adopted by the Company, for ensuring the compliance of the conditions of Corporate Governance (as stipulated in Clause 49 of the Listing Agreement). It is neither an audit nor an expression of an opinion on financial statements of the Company.
3. In our opinion and to the best of our information and according to the explanations given to us, subject to the following
i. as stated in item no 2.1, 8.1, and 8.2 of Corporate Governance Report,the company has not complied with the conditions of clause 49 with regard to minimum number of independent directors in the composition of Board of Directors, Audit & Ethics Committee and Nomination and Remuneration Committee for the period as mentioned therein,
ii. as stated in item no 2.1, the vacancies caused due to resignation or retirement of the Independent Directors have not been filled within the time period as specified in terms of the Listing Agreement,
iii. as stated in item no 2.1, during the year no separate meeting of the independent director was held,
we certify that the Company, has complied with the conditions of Corporate Governance as stipulated in Clause 49 of the Listing Agreement.
4. We further state that such compliance is neither an assurance as to the future viability of the Company nor the ef ficiency or ef fectiveness with which the management has conducted the af fairs of the Company.
M/s G. D. Apte & Co.Chartered AccountantsOf fice No. 1, 2 & 3, Rahimtoola
thHouse, 7 Homji Street, FortMumbai – 400 001
M/s Mehra Goel & Co.Chartered Accountants505, Chiranjiv Tower43, Nehru Place,New Delhi – 110 019
M/s Varma & VarmaChartered AccountantsSreela Terrace, Level – 4Unit – D, No. 105 First Main RoadGandhi Nagar, AdayarChennai – 600 020
M/s Khandelwal Jain & Co.Chartered Accountants12-B, Baldota Bhawan,
th5 Floor, 117, MK RoadChurchgate, Mumbai – 400 020
M/s Lodha & Co. Chartered Accountants14, Government Place East,Kolkata – 700069
For G. D. Apte & Co.Chartered AccountantsFirm Reg. No: 100515W
(C. M. Dixit)Partner (M. No. 017532)
For Khandelwal Jain & Co.Chartered AccountantsFirm Reg. No: 105049W
(Akash Shinghal)Partner (M. No. 103490)
For Lodha & Co.Chartered AccountantsFirm Reg. No: 301051E
(H. K. Verma) Partner (M. No. 055104)
stDate : 1 July, 2015Place : New Delhi
For Mehra Goel & Co.Chartered AccountantsFirm Reg. No: 000517N
For Varma & VarmaChartered AccountantsFirm Reg. No: 004532S
(R. K. Mehra)Partner (M. No. 006102)
P. R. Prasanna VarmaPartner (M. No. 025854)

Business Responsibility Report
Secretarial Audit Report

Annual Report 2014-15
Business Responsibility Report
174
Business Responsibility Report 2014 -15
7. Sector(s) that the Company is engaged in
(industrial activity code-wise):
ONGC is a global Energy Company meaningfully
integrated in the entire energy value-chain. Its core
business is Exploration and Production of oil and gas;
however, its business spread include related areas
like - processing of crude oil & natural gas; oil field
services, transportation of the oil and natural gas,
production of value added products like – LPG,
Naphtha, Superior Kerosene Oil,ATF, C2-C3,
Refining, Petrochemicals, Power, unconventional
and alternate sources of energy. It is present in
downstream business through its subsidiary refinery
MRPL and in the petrochemical business through
Joint Ventures such as ONGC Petro additions Ltd
(OPaL) and In the non-conventional sources, it is
aggressively pursuing opportunities such as- Shale
and gas hydrates, CBM (Coal Bed Methane) UCG
(Underground Coal Gasification). It has ventured into
electric power generation through 726MW gas based
power project at Tripura (ONGC Tripura Power
Company Ltd.) and wind power electricity generation
through installing a 51 MW wind power project at
Bhuj, Gujarat. It is also pursuing opportunities in
alternate energy which has potential to change the
landscape of alternate energy business in the country.
8. List three key products/services that the Company manufactures/provides (as in balance sheet)
The three key products of the company are: (i) Crude Oil (ii) Natural Gas& (iii) Liquefied Petroleum Gas.
9. Total number of locations where business activity is undertaken by the Company
i. Number of International Locations (Provide details of major 5)
ONGC’s overseas operations are managed by its fully owned subsidiary, ONGCVidesh Limited (OVL), which operates in 17 countries with 36 hydrocarbon assets. ONGC, principally, focuses on domestic operations which have a pan-India spread.
The major five international locations as per oil & gas production are – Russia, Colombia, Brazil, Vietnam, Venezuela.
The major five international locations as per oil & gas reserves are – Mozambique, Russia, Venezuela, Myanmar and Vietnam.
ii. Number of National locations:
ONGC has business activities pan India, spread across the length and breadth of the country, both onshore and of fshore. The major locations are detailed as below:
Section A: General Information about the Company
1. Corporate Identity Number (CIN) of the Company : L74899DL1993GOI054155
2. Name of the Company : Oil and Natural Gas Corporation Limited
3. Registered address : Jeevan Bharti Building, Tower-II 124, Indira Chowk,New Delhi, India-110001
4. Website : www.ongcindia.com
5. E-mail id : [email protected]
6. Financial Year reported : 2014-15
a) Offshore Locations (Oil & Gas producing including JV) :
Mumbai High Asset -(Mumbai High, Cluster 7, WO-16, B Series, BHE/BH-35, B-127, Western Periphery)
ONGC WESTERN OFFSHORE EASTERN OFFSHORE
JV
Bassein & Satellite Asset(South Bassein, NB Prasad-D1, B193, B-22, B-55, Vasai (East), Vasai (West), SB-14, C-Series, North Tapti)
Neelam & Heera Asset(Neelam, Heera, B-134, B-173)
Eastern Offshore Asset(NELP Block KG-98/2 and G1GS15, G-29)
Panna, Mukta, Tapti, CB-OS/2
Ravva

Business Responsibility Report
175
b)
1. Gujarat 5. Tripura
2. Assam 6.
3. Andhra Pradesh 7. West Bengal
4. Tamil Nadu 8. Madhya Pradesh
Onshore Locations (Oil & Gas producing, including JV) :
Rajasthan (including RJ-ON-90/1)
Assam Tripura Ahmedabad Ankleshwar Cambay
Kakinada Karaikal Mehsana Rajahmundry
Uran (Maharashtra) Hazira, Gujarat Ankleshwar, Gujarat Dahej (Gujarat) Tatipaka (A P)
Vadodara Mumbai Chennai KG & Jorhat, KolkataWON Basin WOFF Basin Cauvery Basin A & AA Basin MBA Basin
Dehra DunFrontier Basin
Keshava Deva Geo-data Processing Institute of Drilling Institute of Engineering Institute ofMalaviya Institute of & Interpretation Technology & Ocean Technology Petroleum Safety,Petroleum Exploration Centre (GEOPIC), (IDT), Dehradun (IEOT), Panvel Health &(KDMIPE), Dehradun Dehradun Environment
Management(IPSHEM), Goa
Institute of Reservoir ONGC Academy Regional Training School of Maintenance Centre for ExcellenceStudies (IRS), (ONGCA), Institutes (RTI's) Practices (SMP), in Well LoggingAhmedabad Dehradun Navi Mumbai, Vadodara Technology
Chennai, Sivasagar (CEWELL),& Vadodara Vadodara
Institute ofBiotechnology andGeo-tectonicStudies (INBIGS), Jorhat
c) Basins : Oil & Gas exploratory locations
d) Plants: Processing of Oil & Gas and production of Value added products (LPG, SKO, Naptha, C2-C3, etc.)
e) Institutes : Knowledge support and applied R&D for E&P activities
f) Subsidiaries
ONGC Videsh Limited (ONGC Videsh),New Delhi
Mangalore Refineries & PetrochemicalsLimited (MRPL), Mangalore

Annual Report 2014-15
Business Responsibility Report
176
g) Associates including joint ventures
ONGC Tripura Power ONGC Petro- Mangalore Special ONGC TERI BiotechCompany Limited additions Limited Economic Limited Limited (OTBL), New(OTPC), Tripura (OPaL), Gujarat (MSEZ), Karnataka Delhi
Petronet MHB limited Petronet LNG Dahez SEZ Limited, Pawan Hans Limited (PMHBL), Mangalore Limited (PLL), New Delhi Dahej, Gujarat (PHL), New Delhi
10. Markets served by the Company:
ONGC is marketing its domestic products, mainly crude oil to the Public Sector Oil Marketing Companies (OMCs)– Indian Oil, BPCL and HPCL. It also markets its crude oil to MRPL, ONGC’s subsidiary. ONGC supplies its produced natural gas mainly through GAIL; however, part of the gas is also
marketed directly by ONGC. It markets Value Added Products directly to the Indian consumers and internally consumes products such as HSD & ATF; however, in case of of f-take constraints by the domestic users some products like Naphtha, HSD, ATF, etc.,are also exported.
Section B: Financial Details of the Company
Sl. No. Particulars Amount
1 Paid up capital 4277.76
2 Total Turnover 83,094
3 PAT 17,733
4 Total spending on CSR as a % of PAT (2014-15) 15 PAT)
(` Crore)
`495.23Crore (2.79% of FY
ONGC Mangalore Petrochemicals Ltd (OMPL) which was a joint venture of ONGC has now become a subsidiary of MRPL.
List of activities in which expenditure in 4 above has been incurred:-
Sl. Sector of Activity
1 Promoting health care including preventative health care and sanitation and making available safe drinkingwater.
2 Promoting education including special education and employment enhancing vocation skills especiallyamong children, women, elderly, and the dif ferently abled and livelihood enhancement projects
3 Ensuring environmental sustainability, ecological balance, protections of flora and fauna, animal welfare,agro forestry, conservation of natural resources and maintaining quality of soil, air and water
4 Rural development projects
5 (1) Setting up homes and hostels for women and orphans; set ting up old age homes, day care centres andother such facilities for senior citizens
(2) Protection of national heritage, art and culture including restoration of buildings and sites of historicalimportance and works of art; set ting up public libraries; promotion and development of traditional artsand handicraf ts
(3) Training to promote rural sports, regionally recognised sports, Paralympics sports and Olympic sports
(4) Other areas mentioned in Schedule – VII

Business Responsibility Report
177
Section C: Other Details
1. Does the Company have any Subsidiary Company/Companies?
Yes. ONGC has two direct subsidiary companies as detailed above in section A9(ii)f.
2. Do the Subsidiary Company/Companies participate in the BR Initiatives of the parent company? If yes, then indicate the number of such subsidiary company(s)
Since these Subsidiaries and the joint ventures are separate entities, they carry out Business Responsibility initiatives on their own as per the policies applicable to the respective companies.
3. Do any other entity/entities (e.g. suppliers, distributors etc.) that the Company does business with; participate in the BR initiatives of the Company? If yes, then indicate the percentage of such entity/entities? [Less than 30%, 30-60%, More than 60%]
The BR initiative of ONGC has the cooperation of all its stakeholders (Govt. of India, employees, contractors, vendors, and the community at
2. Principle-wise {as per National Voluntary Guidelines (NVGs)} BR Policy/policies
Nine Business Responsibility Principles
Principle 1: Businesses should conduct and govern themselves with Ethics, Transparency and Accountability
Principle 1.1
Do you have policy/policies for principle 1?
ONGC, being a listed Public Sector Enterprise, conducts and governs itself with Ethics, Transparency and Accountability as per policies mandated by DPE Guidelines on Corporate Governance, Listing Agreement and other guidelines and policies of the DPE in particular and Govt. of India in general.
ONGC also pursues some policy initiatives voluntarily
large) and these stakeholders help ONGC in achieving its business responsibility. However, it is dif ficult to establish the extent their support helps in facil i tating ONGC’s business responsibility initiative.
Section D: BR Information
1. Details of Director/Directors responsible for BR
a) Details of the Director responsible for implementation of the BR policy/policies
Implementation of Policies related to Carbon Management and Sustainability Services are taken care of by Director (Exploration) while policies on Ethics and Transparency and the overall Business Responsibility of the company lies with the Chairman & Managing Director who gets them implemented through the respective group heads.
• DIN Number : 00147870
• Name : Shri D K Sarraf
• Designation : Chairman & Managing Director
• Telephone No : +91-11-23301101
• E-mail id : [email protected]
towards Ethics, Transparency and Accountability:
• The company has well defined and well codified Book of Delegated Powers which has been thoroughly revised in 2015 and af ter approval of the Board implemented across the organisation, HR Manual, Material Management Manual (which has also been reviewed, revised and implemented in 2015) and Works Manual for ensuring continuity, transparency and fairness in following the laid down procedures. The company has an Enterprise Risk Management Cell (ERM), risk framework, risk policy and risk port folio which are periodically monitored by the Risk Management Committee, Audit & Ethics Committee and the Board. In terms of the Listing Agreement, the Board has re-constituted the Risk Management Commit tee with Board level members in 2014.
S.No. Particulars Details
1 DIN Number (if applicable) Nil
2 Name Dr. V Banerjee
3 Designation ED – CM&SG
4 Telephone number +91-11-22440829
5 e-mail id [email protected]
b) Details of the BR heads
Responsibility of implementing the Sustainable Development (SD) policies of ONGC under the given ambit of BRPolicies lies with ED-Chief Carbon Management & Sustainability Group. The details are given below:

Annual Report 2014-15
Business Responsibility Report
178
• Company has a well-structured vigilance department
with units spread across the organization at various
Regions, Assets, Basins and Plants constantly
ushering transparency, ef ficiency and integrity and
best corporate practices in the working of the
organization
• The Company has a Whistle Blower Policy meant for
employees to raise any ethical issues within the
organisation.
• The Company has positioned an Integrity Pact (in
association with Transparency International) which is
signed with bidders to enable them to raise any issues
with regard to tenders floated by the Company.
ONGC was the first Indian company to sign the
Integrity Pact. People with high repute and integrity
are appointed as Independent External Monitors to
oversee implementation of the Pact.
Principle 1.2
Has the policy been formulated in consultation
with the relevant stakeholders?
All policies have been formulated af ter wide
consultation and discussion amongst the
stakeholders and further the same gets reviewed
from time-to-time to cater to emerging and new
business real i t ies/paradigms, af ter wider
consultations amongst stakeholders. The Company
being a Public Sector Enterprise and a National Oil
Company, pursues policies laid down by the
Government of India and other statutory bodies. It is
assumed that those policies are worked out af ter
wider consultations and discussions by the
Government of India.
Principle 1.3
Does the policy conform to any national/
international standards? If yes, specify? (50 words)
The policy and laid down procedures conform to
statutes and policies of the Govt. of India, DPE and
other statutory bodies. It also conforms to mandated
applicable international standards. ONGC voluntarily
follows principles and policies for transparency which
are of international standards like Transparency
International.
Principle 1.4
Has the policy been approved by the Board? If
yes, has it been signed by MD/owner/CEO/
appropriate Board Director?
All policies mandated by the Government of India,
DPE and other Indian statutory bodies are followed
by ONGC af ter due approval of the ONGC Board. All
other policies/manuals which ONGC pursues come
in ef fect only af ter ONGC Board or the assigned
Competent Authority, as delegated by the Board,
approves it.
Principle 1.5
Does the company have a specified committee of
the Board/Director/Of ficial to oversee the
implementation of the policy?
The Company has an Audit & Ethics Commit tee of
the Board of Directors which is bound by its Terms of
Reference as per the Listing Agreement and the
Companies Act, 2013 and is approved by the Board.
Company also has a well-structured vigilance
department with units spread across the organization
at various Regions, Assets, Basins and Plants
constantly ushering transparency, ef ficiency and
integrity and best corporate practices. However, as
the visage of the Principle is very wide, this is
overseen by various organs of the Company.
Principle 1.6
Indicate the link for the policy to be viewed online?
The website of the Company (www.ongcindia.com)
has reference to the various tenets as stated in the
principle under the section on Corporate Governance.
Principle 1.7
Has the policy been formally communicated to all
relevant internal and external stakeholders?
ONGC policies and operational framework is available
on the ONGC website as well as intranet of ONGC.
The engagement routes across all the stakeholders
are:
• The Customers are engaged through Crude Oil Sales
Agreement (COSA), Gas Sales Agreement (GSA)
and regular meeting with B2B partners
• The Communities in and around our areas of
operation are engaged through CSR projects
• Business partners/vendors/contractors are engaged
through vendor meets, business partners meet and
pre-bid conference
• Contract workers are engaged through regular
trainings and SAHYOG Scheme
• Employees are engaged through open house forums
like –VicharManthan, VicharDhara, VicharVishlesan,
Mantrana, etc., and employee web portal and also
through various in-house magazines
• Government and regulatory bodies are engaged
through meetings with the administrative ministry i.e.
Ministry of Petroleum & Natural Gas (MoP&NG),
Department of Public Enterprises (DPE) under the
Ministry of Heavy Industries & Public Enterprises (HI
& PE), Oil Industry Safety Directorate (OISD), Oil
Industry Development Board (OIDB)

Business Responsibility Report
179
• Shareholders and investors are engaged through Investor & Analysts’ Meet, Investors’ Conference, corporate website www.ongcindia.com and press release
Principle 1.8
Does the company have in-house structure to implement the policy/policies?
ONGC follows laid down policy for every critical activity such as-procurement, payment, tendering, contracting, HR and other functions that are governed by well documented policies available for reference to all concerned.
Principle 1.9
Does the Company have a grievance redressal mechanism related to the policy/policies to address stakeholders’ grievances related to the policy/ policies?
Yes. The Company has a structured grievance redressal mechanism in place to address both employees and stakeholders’ grievances related to the policy/policies.For employees, company has a well laid down CDA rules (Conduct, Discipline and Appeal) and also has structured laid down procedures in place to escalate the matter/issues up the hierarchy to seek justice and redress grievances related to the policies.
For external stakeholders, the company has a well laid down grievance redressal system in place with adequate provisions to escalate the matters up the hierarchy up to the Board(Stakeholders Relationship Commit tee – a Board level Commit tee headed by an Independent Director).
ONGC voluntarily facilitates resolving grievances through Independent External Monitors (IEMs) and through Outside Expert Commit tee (OEC).
Principle 1.10
Has the company carried out independent audit/evaluation of the working of this policy by an internal or external agency?
The implementation of Clause 49 of the Listing Agreement with regard to Corporate Governance is audited by the Statutory Auditors. Other policies are validated from time to time by the concerned authorities.
1. Does the policy relating to ethics, bribery and corruption cover only the company?
All the policies relating to ethics, bribery and corruption are “inclusive” and covers company as well as its employees and all other ex ternal stakeholders.
2. Does it extend to the Group/Joint Ventures/ Suppliers/Contractors/NGOs/Others:
Yes
3. How many stakeholder complaints have been received in the past financial year and what percentage was satisfactorily resolved by the management? If so, provide details thereof, in about 50 words or so.
ONGC is a pioneer organization in introducing the Integrity Pact (IP) in India. The mechanism of monitoring IP through Independent Ex ternal Monitors (IEM) has considerably reduced time for resolution of representation/issues coming up during tender processing and has met the objectives set by Transparency International (India) such as greater transparency with regard to integrity between the buyer and seller, improved sense of ethics, reduction in frivolous law suits and representation/complaints from vendors, reduction in external interventions and reduced pol i t ical/diplomatic/administrat ive inter ference.
Representations from bidders/ contractors as well as opinion sought by ONGC against various tenders are referred to IEM. IEMs discuss the issues with ONGC and bidders’ representatives wherever felt necessary by IEMs and give their opinion through a speaking order.
ONGC also has in place a “Stakeholders Relationship Commit tee”.The Commit tee specifically looks into redressing Shareholders’ and Investors’ complaints pertaining to transfer/transmission of shares, non-receipt of annual report, dividend payments, issue of duplicate share certificates and other miscellaneous complaints. The commit tee also monitors implementation and compliance of company’s code of conduct for prevention of insider trading in ONGC securities. The commit tee also oversees and monitors the performance of the registrars and transfer agent and recommends measures for overall improvement in the quality of investor services.
• Number of complaints received during April, 2014 to March, 2015 from Vendors: 37
• All representations were forwarded to IEMs who promptly gave their opinions in all cases for further action.
• Number of complaints received from investors during 2014-15:The total number of complaints/ queries/ correspondence received and replied/ at tended to the satisfaction of the shareholders was 2256. The number of complaints pending as on 31.03.2015 are 101 out of which 97 complaints related to Of fer for Sale- 2004.
Principle 2:
Businesses should provide goods and services that are safe and contribute to sustainability throughout their life cycle.

Annual Report 2014-15
Business Responsibility Report
180
Principle 2.1:
Do you have policy/policies for principle 2?
ONGC pursues its business activities in a safe and sustainable manner. All work practices, procedures and production endeavours comply with the highest Health, Safety and Environment standards as per the Industry norms, Government and relevant statutory bodies. All the products that ONGC make conform strictly to the respective product-making-procedures, laws, statutes and standards governing their production. The exploration & production business activities are pursued and aligned in such a manner that exploitation & production of resources is done in a sustainable manner encompassing their life cycle.
It is further a matter of privilege for ONGC and a sign of unfl inching responsive commitment to sustainability development that Shri D.K. Sarraf, CMD, ONGC has been nominated as a member of the UN Global Compact Board.
Principle 2.2:
Has the policy been formulated in consultation with the relevant stakeholders?
ONGC follows all work practices, procedures and production endeavours pertaining to its area of activities/operations as mandated by Industry, Government and relevant statutory bodies (as detailed in Principle 1.2).
Principle 2.3:
Does the policy conform to any national/ international standards? If yes, specify? (50 words)
Yes; ONGC follows the international standards, practices and standard operating procedures as followed by other E&P companies across the world. Besides, ONGC being a national oil company adheres to all the statutes and policies of the Govt. of India and other statutory bodies such as DGH & OISD.
Principle 2.4:
Has the policy been approved by the Board? If yes, has it been signed by MD/owner/CEO/ appropriate Board Director?
Ministry of Petroleum & Natural Gas is the apex body for the Hydrocarbon industry in the country. All other areas of operations fall under various laws as enacted by the Govt. of India.Subject to above, all internal policies are approved by the Board or authority delegated for the same by the Board.
Principle 2.5:
Does the company have a specified committee of the Board/Director/Of ficial to oversee the implementation of the policy?
The Board oversees the compliance and
implementation of the policies through its various Commit tees as detailed in the Corporate Governance Report of the Annual Report.
Principle 2.6:
Indicate the link for the policy to be viewed online?
The website of the Company (www.ongcindia.com) has reference to the various tenets as stated in the principle under various places. Further, internal policies applicable to various functions of the organisation are available on intranet.
Principle 2.7:
Has the policy been formally communicated to all relevant internal and external stakeholders?
ONGC’s policies and operational framework are available on the ONGC website as well as intranet of ONGC.
Principle 2.8:
Does the company have in-house structure to implement the policy/policies?
Yes. The Company has well-established in-house infrastructure, manpower pool, documented standard operating procedure and other executive & administrative machineries to implement the given policies in the area of safe and sustainable production of goods & services of the Company. The HSE (Health, Safety & Environment) and CM&SG (Carbon Management &Sustainability Group) department of company along with apex management, acts as the nodal department to execute and oversee policies pertaining to safe, healthy and environment friendly operations and compliance with sustainability parameters as mandated and desired.
The process of procurement, payment, tendering, risk management, safe remit tance, fraud prevention, control self-assessment (internal controls) and various other processes are covered by well documented policies, which are available for reference on the website of the Company.
Principle 2.9:
Does the Company have a grievance redressal mechanism related to the policy/policies to address stakeholders’ grievances related to the policy/policies?
Yes: as detailed earlier in Principle1.9.
Principle 2.10:
Has the company carried out independent audit/evaluation of the working of this policy by an internal or external agency?
ONGC is subject to various audits such as Statutory Audit by firms of Chartered Accountants, CAG Audit, Cost Audit, Secretarial Audit, Technical Audits, Quality Audit, Energy Audit, Safety audit, and these

Business Responsibility Report
181
Auditors ensure compliance to various internal and external policies.
1. List up to 3 of your products or services whose design has incorporated social or environmental concerns, risks and/or opportunities.
a. Estimation of casing head gas:
Ahmedabad Asset, under the Global methane Initiative programme steered by CM&SG, has successfully implemented a project to recover well head casing gas from SRP wells and bring it back to production mainstream. Casing gas in SRP wells are required to be bled of f to sustain production causing a concomitant and significant loss of the natural gas and GHG emission. World over, E&P companies employ various means to capture this accumulated gas.
Ahmedabad Asset has installed a cost ef fective system to recover the casing gas and bring it back to the production mainstream. CM&SG has undertaken estimation study and has found that 21500 SCMD of natural gas is being recovered, mitigating around 98112 tons of CO2 equivalent of GHG emission. CM&SG is in the process of formulating policy to implement similar technology at other onshore Assets.
b Rain water harvesting:
Rain Water Har vesting (RWH) projects are implemented/being implemented at dif ferent work centres of ONGC under the umbrella of Sustainable Water Management. The harvested water is being used for beneficial use like gardening, toilet flushing, etc and also for recharging of ground water aquifers.
ONGOING RWH PROJECTS:-
Sl.No. Name of project
1. RWH project at AvaniBhavan -01 Recharge well & Sabarmati complex with 03 Recharge wells
2. RWH projects at Saij & Naika Colony for ground water Recharge through 04 and 06 Recharge wells
3. RWH project at Cementing section, for ground water Recharge through 01 Recharge well
4. RWH project at WSS, Saij with 01 Recharge well
5. RWH project at WSS, Shertha with 02 Recharge well
6. RWH p r o jec t a t Eas te rn Co lony , Chandkheda, with 05 Recharge wells
7. RWH project at Western Colony with 05 Recharge wells
8. RTRWH at K V ,ONGC, Agar tala for gardening and Roof top RWH at NOBH, D-Type quarters, of ficers club, Auditorium for ground water recharge
9. RTRWH at 02 Multi- storied buildings of Colony, Vadodara, harvested water is being used for domestic uses.
10. Surface run-of f RWH Inside ONGC Complex, Makarpura for ground water recharge through 07 recharge wells
11. RWH from 105 acre campus to harvest rain water through storm water drains and store in ground tanks for gardening purpose
12. Surface run-of f RWH system in the campus with 10 recharge wells for ground water recharge
c R&D pilot on CO2 capture and reformation—
ONGC has successfully undertaken a six month long R&D project at Hazira plant on CO2 capture and reformation through micro algal route from SRU vent. The R&D pilot has successfully captured 50% of CO2 from the SRU vent at 0.5 Bar( with a potential of 100% absorption at higher pressure) and the carbonated medium has been used as the micro algal nutrient for growth. The micro algae has then been harvested for biomass which upon digestion produced appreciable quantity of biogas. The project is ready for scaling up for field pilot.
2. For each such product, provide the following details in respect of resource use (energy, water, raw material etc.) per unit of product(optional):
Measurement of usage of water, fuel, per unit is yet to be carried. However the company has put in place all policies and processes to conserve energy and natural resources.
i. Reduction during sour cing/pr oduction/ distribution achieved since the previous year throughout the value chain?
ii. Reduction during usage by consumers (energy, water) has been achieved since the previous year?
The company has embarked upon a number of measures for reduction in use of energy and water. The company aims to sustain operations with less dependence on fresh water resources. The company has undertaken water foot printing of ONGC work centres in a big way and already completed water foot printing at 7 Assets, 2 plants & 1 institute by adopting the concept of 4R:
Reduce: Identify areas to reduce fresh water usage.
Reuse: Identify opportunities to reuse fresh water

Annual Report 2014-15
Business Responsibility Report
182
Recycle: Identify ways to use produced/ef fluent water in place of fresh water.
Replenish: Replenishing ground water through rain water harvesting.
a) Usage of casing gas head will mitigate methane emission into atmosphere by 21500 SCMD at Ahmedabad Asset which will be replicated at other onshore Assets with concomitant environmental mitigation.
b) The rain water harvesting projects mentioned above are a part of replenishment.
c) The R&D project, if successfully impleneted at the commercial scale, will help mitigate the emission of 30000 SCMD of CO2.
3. Does the company have procedures in place for sustainable sourcing (including transportation)?
Company has in place a well-devised procedure for sustainable sourcing. Company has a well-documented Material Management Policy (the Policy has been revamped recently and is available on the website of ONGC) that helps in sourcing the requisites for operations and business activities in a steady, continuous and sustainable manner. Company has policies of long-term contracts and rate-contracts to ensure that operations and business pursuits do not suf fer owing to externalities
Sustainability and Sustainable Development has been embedded in work practices as a Corporate Mantra and are aligned with Kyoto protocol negotiations, GHG mitigation, Carbon management, sustainability and greening the vendor chain.
The Company is pursuing in let ter & spirit the concept of “Greening the vendor in its entire value chain”. Through this policy ONGC is seeking to promote ef forts that lowered carbon footprint not only with in ONGC but also amongst its stakeholders down the vendor’s chain (business partners). To this ef fect ONGC would consider giving preference in course of time to products/services that are eco-friendly, energy ef ficient that lead to reduced emissions and conservation of natural resources.
I. If yes, what percentage of your inputs was sourced sustainably? Also, provide details thereof, in about 50 words or so.
The Company at present does not have a process in place to measure this particular parameter. However, in the future, ef forts will be made to capture relevant information.
4. Has the company taken any steps to procure goods and services from local & small producers, including communities surrounding their place of work?
Being an Indian CPSE (Central Public Sector
Enterprise), ONGC’s procurement policy and practices are guided by the Government Policies and practices. These are based on transparent procurement mechanisms which promote procurement from technically competent suppliers. However, care is also taken for the interest of local suppliers and contractors within the frame work of CVC‘s guidelines. For example ONGC has a special policy to encourage small entrepreneurs in North East Region to provide services pertaining to transport.
If yes, what steps have been taken to improve their capacity and capability of local and small vendors?
ONGC has always encouraged local suppliers to participate in its tendering process and also promote them through vendor development programs. Our continued pursuit in the direction has seen improved participation of small local players and socio-economic development of communities in and around operational locations. At work centres, Vendors Meet are regularly held to explain procedures and policies per taining to the procurements of goods and services to help small local vendors. The Company is also in the process of implementing guidelines of MSMEs (Medium, Small and Micro Enterprises) for procurement goods and services. ONGC also provides certain incentive to MSMEs (Medium, Small & Micro Enterprises) such as exemption from tender fee and Exemption from Bid Security. MSMEs (not their dealers/distributors) registered with District Industry Centres or Khadi and Village Industries Commission or Khadi and Village Industries Board or Coir Board or National Small Industries Corporation (NSIC) or Directorate of Handicraf ts and Handloom or any other body specified by Ministry of MSME are exempted from payment of tender fees. Further they are also exempted from payment of Bid Security irrespective of monetary limit mentioned in their registration certificate provided they are registered for the items for which they intend to quote.
5. Does the company have a mechanism to recycle products and waste? If yes what is the percentage of recycling of products and waste (separately as <5%, 5-10%, >10%). Also, provide details thereof, in about 50 words or so.
ONGC has a policy for Management of Hazardous Chemicals and Materials that was issued in 2002. As per the policy personnel handling hazardous chemical are to be trained for safe handling practices. Separate designated area are provided for storage of hazardous chemicals and all personnel is to be provided Personnel Protective Equipment (PPE) first aid training. Further, instructions were issued for the

Business Responsibility Report
183
auction/sale of Hazardous waste in 2004. The Ministry of Environment & Forest regulates the recycling/reprocessing of hazardous wastes such as used/waste oil,used lead acid batteries and other non-ferrous metal waste under registration scheme , with the objective of channelizing such waste to only those units which possess Environmentally Sound Management (ESM) facilities. The registration is being implemented by Central Pollution Control Board that regularly updates the list of registered units in their website ht tp://cpcb.delhi.nic.in and the hazardous waste is required to be sold / auctioned only to units registered by CPBP. Thus clear instructions have been issued and the above policy is being followed. For example all lead acid batteries are to be sold back to suppliers at the time of purchase of new batteries.
For disposal of e-waste, the limited tender from the firms registered with Central Pollution Control Board for such items is to be invited and the items of e-waste is to be sold to them only to ensure safe disposal of the items.We have an e-waste policy to manage our e-waste.
ONGC is commit ted to recycling of materials, wherever feasible. ONGC’s Mehsana asset has established ef fective infrastructure to control expenses, non-optimal usage of costly materials, ground water and also to ef fectively manage waste disposal and has upgraded existing mud preparation plants through enhancing the mud preparation and storage capacity.
Mehsana Asset is now transporting the costly polymer based mud from drill sites to centralized mud plant for treatment and storage and thereaf ter sent to other drill sites, where new wells are under drilling. Drilling being our most water intensive operation, recycling of drilling mud has ef fectively reduced our water consumption.
Waste generated in ONGC during exploration and production operations are primarily drilling mud and mud cuttings (non-hazardous), chemical sludge and tank bottom sludge (hazardous). Chemical sludge is collected in lagoons having leachate collection facility where water is drained to reduce the quantity of sludge. This chemical sludge is disposed of by land filling in accordance with norms of the State Pollution Control Board. To treat tank bottom sludge, which is mainly organic in content, bio-remediation techniques are employed. Best practices in the oil industry are adopted to manage solid waste arising from operations. Drill mud and cuttings are disposed, re-used in land filling or sold to authorized vendors as per industry practices.
Waste management has been identified as a material issue by ONGC for sustainable development
activities. Accordingly, ONGC is working toward development of a waste management policy and plans to guide and improve its waste management system. ONGC has been adopting a three way strategy to reduce and manage waste:
• Know your waste footprint – Establish the waste base line
• Undertake waste management project wherever feasible and apply
• Manage waste & reporting
Solid & Oily waste Management
Drill cut tings, drilling fluid and generation of oily sludge from cleaning of storage tanks and from various process units of ef fluent treatment plants are few important wastes. The tank bottom sludge and oily waste were identified as hazardous waste and is disposed-of f according to local statutory guidelines. Oily sludge removed periodically is treated by environmentally sound bioremediation techniques using a consortium of bacteria known as Oil Zappers and is rendered non-hazardous. Land is normally acquired by ONGC for shor t duration to carry out its drilling activities. The land degradation takes place during drilling operations due to discharge of waste water from various sources. The land acquired for drilling activities is reclaimed/ restored to its pristine condition before returning to land owners.
Produced water/ Effluents
The Water produced with the oil and gas, is the major ef fluent for the Company as part of its production activities. The produced water, which is part of well fluid is separated and sent to Ef fluent Treatment Plants (ETPs) for further treatment. ONGC operates twenty two ETPs to treat the ef fluent generated at onshore Installations. In order to cope up with enhanced liquid production due to high water cut because of aging of oil fields, twenty one new/ substitute ETPs have been planned /under construction.
At drill sites waste water generated during drilling activities is collected in a waste pit that lined with High Density Poly Ethylene Sheets (HDPE). The waste water from waste pit is recycled for mud preparation and other uses. In North East Sector, where heavy rainfall takes place, waste water is treated by mobile ETPs and reused to avoid overflow of water from waste pits to nearby areas.
In onshore locations, part of treated produced water is used for water injection into the reservoir for pressure maintenance; the remaining quantities are re-injected into sub surface disposal wells located 1000 mts underground. In of fshore location, treated produced water is disposed 40 mts below the sea surface.
The company has developed a comprehensive

Annual Report 2014-15
Business Responsibility Report
184
corporate waste management policy to quantify and, segregate waste at the source for bet ter planning and management. For non-hazardous wastes, there will be ef forts to minimise the disposable quantity through reuse and recycle route.
Principle 3: Businesses should promote the well being of all employees.
Principle 3.1
Do you have policy/policies for principle 3?
Yes. The Company has a wide range of HR policies covering all categories of the employees (workers, of ficers, women employees, SC/ST employees, sports person). It addresses all aspect of professional skill & knowledge up-gradation, employee motivation & welfare measures, employees’ health & general wellbeing measures, women empowerment, empowerment of SC/ST and other disadvantageous class of employees, separation /superannuation and post-retirement welfare measures.
Principle 3.2
Has the policy been formulated in consultation with the relevant stakeholders?
The HR policies of ONGC are formulated in line with DPE guidelines and af ter due consultation with Collectives and employees.
Principle 3.3
Does the policy conform to any national/ international standards? If yes, specify? (50 words)
HR Policies of ONGC conform to the best of International and National standards. The company is perceived to be one of the best employers in the country.
Principle 3.4
Has the policy been approved by the Board? If yes, has it been signed by MD/owner/CEO/appropriate Board Director?
All HR policies are approved by competent authorities as delegated by the Board and signed accordingly.
Principle 3.5
Does the company have a specified committee of the Board/ Director/Official to oversee the implementation of the policy?
The Board of Directors have constituted a Board level Human Resource Management Commit tee to oversee the major decisions in the area of human resources.
Principle 3.6
Indicate the link for the policy to be viewed online?
The intranet of the Company “reports.ongc.co.in” and “webice.ongc.co.in” has link to the various HR policies. In addition, various welfare policies are
communicated via issue of of fice orders, circulars from time to time and the same are uploaded on the intranet of the Company “reports.ongc.co.in” for wider publicity.
Principle 3.7
Has the policy been formally communicated to all relevant internal and external stakeholders?
Yes. ONGC’s HR policies are available on-line on the Company website as well as on the Company’s internal web-ice portal and on ongcreports.net. All policies, procedures and work-flows are documented and are available on-line for easy access, use and information by all employees. Any new initiatives, changes or new announcements are communicated to employees on-line through internal websites and also through formal orders posted on notice boards and through circulation to individuals.
Principle 3.8
Does the company have in-house structure to implement the policy/policies?
ONGC has a structured Human Resource Department set- headed by Director (HR) who implements the policies throughout the Company with the support of senior HR executives.
Principle 3.9
Does the Company have a grievance redressal mechanism related to the policy/policies to address stakeholders’ grievances related to the policy/policies?
Yes. ONGC has a structured employees’grievance redressal mechanism. The mechanism/procedures allow employees to escalate their grievances to the level of Director (HR) of the Company and in some case even to the Executive Commit tee for justifiable redressal of issues & concerns. Collectives and Of ficers association are engaged/associated at every stage to discuss/ negotiate the vexed issues and address their concerns. An Executive Director level position oversees employee relations and industrial relations (ER & IR) and maintains cordial, motivated and a spirited work atmosphere. All the employees have access to CMD and Directors through e-mails as well.
Principle 3.10
Has the company carried out independent audit/evaluation of the working of this policy by an internal or external agency?
The HR policies and practices are reviewed at regular intervals taking cognizance of emerging realities. Regular independent audits, both internal & external, gets carried out to gauge level of employee engagement & satisfaction. Wherever desired and warranted, expert advice from external agencies/

Business Responsibility Report
185
consultancies is solicited to ramp up our practices/ policies to best of industry standards.
The company has carried out independent audit/ evaluation of HR policies. Frequent audits like ISO 9001:2008 Audit, Internal Audit, external audit by government agencies are carried out across the organization.
1. Total number of employees: 33,185 (As on 31.03.2015)
2. Total number of employees hired on temporary/ contractual/casual basis.
• Contractual workers: 14691
• Tenure based: 1202
• Casual workers/contingent : 566
3. In addition to the above, approx. 19121 contract labour were deployed by Contractors providing various services to ONGC during the year.
4. Please indicate the Number of permanent women employees: 2195
5. Please indicate the Number of permanent employees with disabilities: 156
6. Do you have an employee association that is recognized by management?
Yes
A. Executive Cadre: The Association of Scientific and Technical Of ficers (ASTO) has been recognized to represent the issues related to the of ficers
B. Non-Executive Cadre: Ten recognized unions:
1. ONGC (BOP) KarmachariSanghatana, Mumbai
2. ONGC Workmens’ Association, Kolkata
3. Petroleum Employees Union, Chennai
4. Petroleum MazdoorSangh, Ahmedabad
5. ONG Mazdoor Sangh, Ankleshwar
6. ONGC Employees MazdoorSabha, Baroda
7. ONGC Purbanchal Employees’ AssociationSivasagar
8. National Union of ONGC Employees, Dehradun
9. ONGC Workers Union, Agartala
10. Trade Union of ONGC Workers, Silchar.
(Besides above All India SC/ST Employees Welfare Association and All India OBC/MOBC Employees Welfare Association are recognized by ONGC)
7. What percentage of your permanent employees is members of this recognized employee association?
Most executives are member of ASTO. The non-executive cadres of employees are af filiated to various recognised unions. ASTO has a membership of nearly about 94% of executives. Ten recognised
unions have been conferred recognition by the Company on the basis of verification through secret ballot. They recognize all the unionized categories of employees in their respective work-centres, though some may hold membership with rival unions.
8. Please indicate the Number of complaints relating to child labour, forced labour, involuntary labour, sexual harassment in the last financial year and pending, as at the end of the financial year.
9. What percentage of your under mentioned employees were given safety & skill up-gradation training in the last year?
Principle 4: Businesses should respect the interests of, and be responsive towards all stakeholders, especially those who are disadvantaged, vulnerable and marginalized
Principle 4.1
Do you have policy/policies for principle 4?
Yes. ONGC complies with Government directives for uplif tment of weaker section of the society. It is fully commit ted to the welfare of marginalized and vulnerable sections of society. Each of our strategic business units (SBU) has the responsibility to identify and engage with relevant stakeholders to establish a symbiotic relationship.
The Company has a number of policies in place to
address the interests of all stakeholders. As a PSE, the
company pursues all such policies as mandated by
Sl. Category No of No of complaints
No complaints pending at the
filed during end of the
the financial financial year
year
1 Child labour/forced NIL NIL
labour/involuntary labour
2 Sexual harassment NIL NIL
3 Discriminatory NIL NIL
employment
• Permanent Employees
• Permanent Women Employees
• Casual/Temporary/ContractualEmployees
• Employees with Disabili ties
Training of 20084 executives and 4729 non-executives were provided through our premier insti tutes of IPSHEM Goa and ONGC Academy, Dehradun. Apar t from the above, casual, temporary and contractual employees were given requisi te training in safety of operations.

Annual Report 2014-15
Business Responsibility Report
186
the government. The Corporate Social Responsibility
(CSR) and Sustainable Development policy along
with a host of policies of the Government of India are
directed towards disadvantaged, vulnerable and
marginalized section of the society. The DPE revised stits Guidelines for CSR ef fective from 01 April 2014
with ef fect from the same day the amended
Companies Act containing Section 135 making CSR
spend mandatory, came into force along with
Companies (CSR Rules) 2014. Abiding by the
directives of DPE guidelines, ONGC has aligned its
CSR policies. To substantiate our stakeholder
engagement, a ‘communication policy for stakeholder
engagement’ has been draf ted. The goal is to:
Connect, Listen, Respond, Sustain’ – leading to
business value creation with Economic, Social and
Environmental sustainability in view.
As per our CSR & SD policy, ONGC has a well-defined set of objectives, clearly delineated beneficiaries, strategy and project activities which characterize its social projects. The relevant provisions of section 135 and Schedule VII of the Companies Act, 2013 have also been taken into account while finalising the aforesaid policy. The projects are designed to yield discernible, long-term, sustainable benefits for the communities specially disadvantaged, vulnerable and marginalized sections. Through community driven developments, we foster a symbiotic relationship with our stakeholders across communit ies to create more employment opportunities to realize our strategic objective of growing responsibility while improving the livelihoods of people.
The table below depicts the manner in which the Company engages to address the interests of all stake-holders:
Principle 4.2
Has the policy been formulated in consultation with the relevant stakeholders?
The CSR policy and policy of Sustainable development is in compliance with the Companies Act, 2013 and Companies (CSR Policy) Rules, 2014 and DPE Guidelines.
Separate Stakeholder Engagement policy is also under formulation by ONGC, as part of the CSR Policy.
All policies have been formulated af ter wide consultation and discussion amongst the stakeholders and further the same gets reviewed from time-to-time to cater to emerging and new business realities/paradigms, af ter wider consultations amongst stakeholders. The Company being a Public Sector Enterprise and a National Oil Company, pursues policies laid down by the Government of India and other statutory bodies. It is assumed that those policies are worked out af ter wider consultations and discussions by the Government of India.
Stakeholders Mode of engagement
Customers Structured engagement through Crude Oil Sales Agreement (COSA)&Gas Sales Agreement (GSA); Regular / periodic meetings with B2Bpartners.
Communities Direct engagement at work centres through CSR programmes and HRdepartments.
Business partners/ contractors/vendors
Contract workers Safety trainings&SAHYOG Scheme
Employees Open House; Vichar-Manthan; Vichar-Dhara; Vichar-Vishlesan;Mantrana; Employee web portal
Regulatory bodies (DGMS, NSE, BSE, SEBI, OISD, OIDB, etc.) MoP&NG, DPE, HI & PE, OISD, OIDB, etc.
Government bodies
Shareholders, investors Investor & Analyst Meet; AGM; Investor Conferences; Corporate website and press releases
Vendor meets; Business partner meets; Pre-bid conferences
Structured engagement through meetings with administrative Ministry

Business Responsibility Report
187
Principle 4.8
Does the company have in-house structure to implement the policy/policies?
ONGC has a structured framework and laid down well documented procedures in place to execute & implement its policies. ONGC has separate Departments for (i) CSR - headed by Chief CSR, to implement CSR act iv i t ies throughout the organisation and (ii) Carbon Management and Sustainable Development - headed by Chief CM&SG to implement the Sustainability agenda of the Company.
Principle 4.9
Does the Company have a grievance redressal mechanism related to the policy/policies to address stakeholders’ grievances related to the policy/policies?
Yes: as detailed earlier in Principle 1.9.
Principle 4.10
Has the company carried out independent audit/evaluation of the working of this policy by an internal or external agency?
Policies directed towards the bet terment of disadvantaged, vulnerable and marginalised stakeholders are audited & reviewed regularly by internal groups and by Collectives/Of ficers Associations to oversee whether it is meeting intended objectives or not. CSR policies are reviewed and revamped periodically depending upon needs and instructions of the Govt. of India. SD policies also get reviewed regularly by the concerned stakeholders through interaction with internal & external agencies. Since 2011-12, the Sustainability Repor t published by ONGC is third par t y assured.Also, since 2011-12, ONGC has been carrying out the third party Impact Assessment of select CSR initiatives.
1. Has the company mapped its internal and external stakeholders?
Yes. The company has well mapped internal & external stakeholders and it is reflected in Global Reporting Initiative (GRI) report on the corporate website www.ongcindia.com. The key stakeholders are shown below.
• Employees
• Customers
• Communities
• Business partners / contractors/vendors
• Contract workers
• Regulatory bodies (DGMS, NSE, BSE, SEBI, OISD, OIDB)
• Government bodies
• Shareholders, investors
Principle 4.3
Does the policy conform to any national /international standards? If yes, specify?
The policy and laid down procedures conform to statutes and policies of the Govt. of India, DPE and other statutory bodies. It also conforms to mandated applicable international standards. ONGC voluntarily follows principles and policies for transparency which are of international standards like Transparency International.
Principle 4.4
Has the policy been approved by the Board? If yes, has it been signed by MD/owner/CEO/appropriate Board Director?
All such policies being pursued by ONGC gets approved by the Board through its various Commit tees or by Director (HR). The revised CSR Policy as per Companies Act, 2013 has been approved by the Board and has been uploaded on the website of ONGC.
Principle 4.5
Does the company have a specified committee of the Board/Director/Of ficial to oversee the implementation of the policy?
Yes. Director (HR) has been delegated power to implement CSR init iat ives of ONGC. The implementation of CSR policy is to be overseen by a Board Level Commit tee on Corporate Social Responsibil i t y & Sustainable Development (CSR&SD), as per the Companies Act, 2013. Further, in line with the approval of the Board, ONGC has set up and registered an ONGC Foundation under the Indian Trust Act, 1882 for carrying out CSR activities. Necessary steps are on hand to recruit manpower for making the ONGC Foundation an ef fective tool for implementation of CSR policy of ONGC
Principle 4.6
Indicate the link for the policy to be viewed online?
The website of ONGC, www.ongcindia.com, has the link to the CSR and SD activities and to a host of policies directed towards the bet terment of disadvantaged, vulnerable and marginalised section of stakeholders.
Principle 4.7
Has the policy been formally communicated to all relevant internal and external stakeholders?
Yes. For internal stakeholders, all these policies are available on-line on Company websites and also perpetuated through i ts Col lect ives, Of ficers Association and other relevant associations. For external stakeholders, communication in this regard is pursued through interactions at multiple levels.

Annual Report 2014-15
Business Responsibility Report
188
2. Out of the above, has the company identified the disadvantaged, vulnerable & marginalized stakeholders?
Yes. ONGC complies with Government directives for uplif tment of priority section of the society. It is fully commit ted to the welfare of marginalized and vulnerable sections of society.Each of our strategic business units (SBU) has the responsibility to identify and engage with relevant stakeholders to establish a symbiotic relationship.
3. Are there any special initiatives taken by the company to engage with the disadvantaged, vulnerable and marginalized stakeholders? If so, provide details thereof, in about 50 words or so.
CSR activities are planned to maximise benefits to the disadvantaged, vulnerable and marginalized stakeholders. Engagement with these stakeholders is done some t imes t h r ough the i r e l ec ted representatives, local Government of ficials and NGOs working in their area. Notable CSR initiatives in this regard are Varistha jana Swasthya Sewa Abhiyan, Swavalamban Abhiyan, Akshaya Patra Project, etc.
The Company has suitable processes, policies and departments in place to identify and engage with such groups of stakeholders..
Principle 5: Businesses should respect and promote human rights
Principle 5.1
Do you have policy/policies for principle 5?
All policies of ONGC take into account the Human Rights of not only employees but also people likely to be af fected by the operations of the Company.
ONGC is commit ted to conducting its business operations and strategies with the ten universally accepted principles in the area of Human Rights, Child labour, Anti- corruption and Environment. ONGC embraces and supports those ten principles, particularly that on the Human Rights viz: “Businesses should suppor t and respect the protection of internationally proclaimed human rights” and “Make sure that they are not complicit in human rights abuses”. ONGC is fully commit ted to the principles of United Nations Global Compact on human rights and subscribe to the international agreements/ conventions such as Kyoto protocol, Montreal Protocol, UNCLOS (MMD), SOLAS and MARPOL within the framework of Government of India directives. The Company ensures compliance with various labour protection Acts such as Payment of Wages Act 1936, Minimum Wages Act 1948, Equal Remuneration Act 1976, Industrial Dispute Act 1947, ESI Act 1948, Employees Provident fund and Miscellaneous Act 1952, CLRA 1970, Child Labour (Prohibition and Regulation) Act 1986. As a
responsible principal employer, ONGC ensures that contract labour is treated fairly as per law and for any complaints or disputes, the contractor is advised to set tle the issue in accordance with the law. Various in-house policies like service rules, leave rules, gratuity rule, CPF rules, HBA, conveyance advance, education loans also confirm to Human Right values.
Principle 5.2
Has the policy been formulated in consultation with the relevant stakeholders?
ONGC being a Public Sector Enterprise is primarily guided by Government of India policies. The entire gamut of its policies, rules and regulations which govern its functioning have “people first” as its fulcrum.
Principle 5.3
Does the policy conform to any national/ international standards? If yes, specify? (50 words)
The policies of ONGC are in line with national standards and relevant international standard for its operations and business pursuits.
Principle 5.4
Has the policy been approved by the Board? If yes, has it been signed by MD/owner/CEO/appropriate Board Director?
All the policies are approved either by the Board or by designated competent authorities.
Principle 5.5
Does the company have a specified committee of the Board/ Director/Of ficial to oversee the implementation of the policy?
Each Policy incorporates safeguards to ensure that its functioning is overseen by a Competent Authority / Commit tee.
Principle 5.6
Indicate the link for the policy to be viewed online?
The website of ONGC www.ongcindia.com has the link to various policies, rules and regulations of ONGC
Principle 5.7
Has the policy been formally communicated to all relevant internal and external stakeholders?
All Policies of ONGC have been suitably communicated to concerned stakeholders, both internal as well as external.
Principle 5.8
Does the company have in-house structure to implement the policy/policies?
Yes. The company has in place a structured set-up with adequate empowerment to implement requisite policies.

Business Responsibility Report
189
Principle 5.9
Does the Company have a grievance redressal mechanism related to the policy/policies to address stakeholders’ grievances related to the policy/policies?
Yes (as detailed earlier).
Principle 5.10
Has the company carried out independent audit/evaluation of the working of this policy by an internal or external agency?
The policies, rules and regulations in the direction as stipulated by the principle 5 are subject to periodic audit/reviews both by internal and external agencies. Moreover, frequent audits like ISO 9001: 2008, Internal Audit, external audit by government agencies are carried out across the organization.
1. Does the policy of the company on human rights cover only the company or ex tend to the Group/Joint Ventures/Suppliers/Contractors/ NGOs/Others?
The policies towards upholding the Human Rights extend to JV’s and subsidiaries of ONGC
2. How many stakeholder complaints have been received in the past financial year and what percent was satisfactorily resolved by the management?
Please refer answer to para 3 of Principle 1.
Principle 6: Business should respect, protect, and make efforts to restore the environment
Principle 6.1
Do you have policy/policies for principle 6?
ONGC has always ensured that it protects and cares for the environment. The Company has an integrated Health, Safety & Environment (HSE) Policy. The company continually strives to mitigate the environmental impact, that may arise from its business activities such as exploration, drilling & production, by investing in state-of-art technologies, ef fluent & solid waste management, environment monitoring and reporting, bio-diversity conservation ef for ts and up-gradation and sustenance of environment management systems. ONGC has a robust process of internal audit and management review for QHSE management system and regularly reviews its QHSE policy and maps risks. Some notable HSE practices are – Regular QHSE internal audit, Fire safety measures, regular fire and earth quake mock drill, health awareness program, Material Safety Data Sheet (MSDS), Personal Protective Equipment, implementation of Environment Management Systems (EMS), Occupational Health Safety (OHS), near miss reporting, Governance, Risk management and Compliance reporting.
Principle 6.2
Has the policy been formulated in consultation
with the relevant stakeholders?
Yes. All policies of the company have been formulated
in consultation with stakeholders, primarily in
consultation with and under the guidelines of
MoP&NG and Ministry of Environment, Govt. of India
and other statutory bodies.
Principle 6.3
Does the policy conform to any national/
international standards? If yes, specify? (50 words)
The HSE policy of ONGC is in line with International
Standards and conforms to ISO - 14000 and OSHAS -
18001.Policies confirm to all standards, practices and
statutes pertaining to environmental commitments as
expected from and as mandated to a company
engaged in the oil & gas business.
Principle 6.4
Has the policy been approved by the Board? If yes,
has it been signed by MD/owner/CEO/appropriate
Board Director?
Yes, the policy has been approved by the Board and
signed by Chairman & Managing Director, ONGC.
Principle 6.5
Does the company have a specified committee of
the Board/ Director/Of ficial to oversee the
implementation of the policy?
ONGC has a Commit tee of Directors (COD) on
Health, Safety & Environment chaired by an
independent director. This Board level commit tee
oversees and reviews decisions on policy matters
concerning HSE.
Principle 6.6
Indicate the link for the policy to be viewed online?
The website of ONGC,www.ongcindia.com, has a
separate link for HSE activities.
Principle 6.7
Has the policy been formally communicated to all
relevant internal and external stakeholders?
The HSE Policy is displayed at all the work centres
and has been communicated to each employee as
well as contractual employees. A link to our HSE
policy has been provided on ONGC website for
external stakeholders.ONGC continuously engages
with stakeholders at multiple levels through diverse
channels. This engagement helps in the formulation
of company policies directed at progressively
enriching practices and sustainable operations over
time.

Annual Report 2014-15
Business Responsibility Report
190
Principle 6.8
Does the company have in-house structure to
implement the policy/policies ?
ONGC has dedicated HSE Department at Corporate
level as well as at the Strategic Business units (SBU’s)
level comprising of Assets, Basin, Plants and
Institutes. Safety of ficers suitably trained and certified
are posted at SBU levels to ef fectively manage and
report safety performance.
Principle 6.9
Does the Company have a grievance redressal
mechanism related to the policy/policies to
address stakeholders’ grievances related to the
policy/policies?
Yes.
Principle 6.10
Has the company carried out independent
audit/evaluation of the working of this policy by an
internal or external agency?
Company undertakes HSE audit at regular pre-
defined intervals. External bodies engaged in granting
ISO-14000 and OHSAS and other certification agencies
conduct regular audits within the certification period to
oversee that pre-requisites are being met before
granting extensions to these certification.
1. Does the policy related to Principle 6 cover only the
company or extends to the Group/Joint Ventures/
Suppliers/Contractors/NGOs/others.
The HSE policy and processes cover ONGC and its
vendors. All suppliers, NGOs and others Business
partners doing business with the Company within the
Company’s premise subscribes to the Company’s
policies and commitment to the environment.
The policies of the Company ex tend to its
wholly owned subsidiaries, other subsidiaries and to
joint ventures af ter get ting approval of its JV partners
on the tenets & premises of environmental
commitment.
2. Does the company have strategies/ initiatives to
address global environmental issues such as
climate change, global warming, etc.?
The Company is aware of the risks arising due to
climate change. It has a dedicated Carbon
Management & Sustainability Group (CM&SG) with a
specific mandate to position ONGC as the leading
organisation in sustainable development (SD) and to
voluntarily take up carbon management as an activity
to synergise all business activities with sustainable
development particularly to address issues related to
climate change risks and opportunities arising from
carbon mitigation initiatives. The management has
been active in engaging with national and international
climate change forum to ensure that the organization
stays current with global climate change negotiations
and India’s domestic commitments.Fugitive methane
emissions from oil and natural gas systems are
primarily the result of normal operations and system
disruptions.These emissions can be cost-ef fectively
reduced by upgrading technologies or equipment,
and by improving operations. The Global Methane
Initiative (GMI) is an action-oriented initiative from
USEPA to reduce global fugitive methane emissions to
enhance economic growth, promote energy security,
improve the environment, and reduce greenhouse
gases emission. The Global Methane Initiative
facilitates cooperative mitigation activities that result in
bringing more gas to markets through the
Identification, Quantification, and Reduction (IQR)
path.
ONGC entered into a MoU with the United States
Environment Protection Agency (USEPA) in August
2007, to undertake Methane to Market (now GMI)
projects in ONGC and ONGC has formed an internal
and measurement team, procured methane emission
detection and measurement equipment in order to
under take Fugitive Emission detection and
quantification at its operating facilities in-house and
has reduced approx. 14 MMSCM of fugitive methane
over the years. ONGC has also drawn an ef fective
plan to map all its production installations for fugitive
hydrocarbon emission and make the installations leak
free in the near future.
3. Does the company identify and assess potential
environmental risks?
Yes. The environmental footprints are mapped during
the project planning phase and based on impact
assessment remedial measures are put in place
during the operational phase. Af ter September, 2006
gazette notification on Environmental Clearance of
Ministry of Environment & Forests, all new and
expansion projects of ONGC are mandated to obtain
prior environmental Clearance from Expert Appraisal
Commit tee (EAC) of MoEF before commencing
operational activities. The company has obtained 131
environmental clearances so far. The company has
implemented globally recognized environmental
management system like ISO 9001, OHSAS 18001
and ISO 14001 at all its operational work centres.
4. Does the company have any project related to
Clean Development Mechanism? If so, provide
details thereof, in about 50 words or so
ONGC commenced its CDM journey in 2006.Currently
ONGC has 12 registered CDM projects with UNFCCC
that yield Certified Emissions Reductions (CER) approx.
1.9 million yearly. The registered CDM projects are as
under:

Business Responsibility Report
191
5. Has the company undertaken any other initiatives on–clean technology, energy efficiency, renewable energy, etc.
Yes. The Company has taken a host of initiatives to pursue clean technologies, energy ef ficiency measures and renewable energy pursuits. Some of these initiatives are spelled out in detail at Principle-2 under questionnaire 2 &3 (please refer to these for our supplementary response against this questionnaire). To name a few, the Company has taken some energy saving initiatives such as:
• Flare gas recovery
• Use of turbo-expanders in LPG production
• Use of wind and solar energy
• Use of Gas gen set/Gas based captive power plant
• Use of wind ventilators/vapour recovery unit
• Waste heat recovery from gas turbines
• Use of solar water heating systems and energy ef ficient lighting
• Arrest of steam leakages
Focussing on cleaner and renewable sources of energy ONGC has implemented the renewable energy wind project 51 MW at Bhuj, Gujarat, commissioned in 2008. The second of wind power project of 102 MW is being developed at Jaisalmer, Rajasthan. ONGC aims to reduce GHG emissions by focusing on improved energy ef ficiency. The Company has also established “ONGC Energy Centre”, a Trust set up by ONGC to actively pursue alternate energy opportunities.
If yes, please give hyperlink for web page:
ht tp://www.ongcindia.com/wps/wcm/connect/ongcindia/Home/Initiatives/Corporate+Sustainability/
6. Are the Emissions/Waste generated by the company within the permissible limits given by CPCB/SPCB for the financial year being reported?
Yes. The emissions & waste generated by the Company is within permissible limits. Annual Environment Compliance reports are submit ted by the respective work units to respective State Pollution Control Boards (SPCB). All the installations comply with environmental regulations. Procedures are in place for storage, handling and disposal of hazardous chemicals and wastes.
7. Number of show cause/ legal notices received from CPCB/SPCB which are pending (i.e. not resolved to satisfaction) as on end of Financial Year:
There are few incidental instances of environmental pollution as per regulations. All issues have been resolved with CPCB / SPCB.
Principle 7: Businesses, when engaged in influencing public and regulatory policy, should do so in a responsible manner
Principle 7.1
Do you have a policy/policies for principle 7?
Public and regulatory policies relating to operation of E&P Companies in India are formulated by the Government of India.ONGC, perse, is not engaged in influencing public and regulatory policy. However, being a PSE and a responsible corporate citizen of India, it conducts its business in a responsible manner and always pursues the best ethical business practices.
Sl no Project CER/annum
1 1 Waste heat recovery from Process Gas Compressors (PGCs), Mumbai high south(of fshore plat form)
2 Up-gradation of Gas Turbine 1 (GT 1) and Gas Turbine 2 (GT 2) at co-generation plantof Hazira Gas Processing Complex (HGPC)
3 Flare gas recovery project at Uran plant 97740
4 Flare gas recovery project at Hazira Gas Processing Complex (HGPC), Hazira plant 8793
5 Amine Circulation Pumps Energy Ef ficiency at Hazira Plant 4043
6 51 MW wind power project of ONGC at Surajbari 85762
7 Energy Ef ficient Green Building at Mumbai 544
8 Energy Ef ficient Green Building at Dehra Dun 735
9 Gas Flaring Reduction at Neelam&Heera Asset 65811
10 OTPC Natural gas based combined cycle power plant in Tripura, India 1612506
11 Energy Ef ficient Green Building at Kolkata 1881
12 Energy Ef ficient Green Building at Delhi 5940
Total 1896877
5320
7802

Annual Report 2014-15
Business Responsibility Report
192
Principle 7.2
Has the policy been formulated in consultation with the relevant stakeholders?
ONGC being a Public Sector Enterprise is under the control of the Government of India, through the Ministry of Petroleum & Natural Gas.
Principle 7.3
Does the policy conform to any national /international standards? If yes, specify?
(50words)
The Company pursues its business in a responsible manner and policies are as per the best of prevailing National & International standards as applicable for E&P industry. ONGC was bestowed with ‘Certificate of Recognition’ for adopting exemplary corporate governance practices, instituted by the Institute of Company Secretaries of India. ONGC has also received “Excellent” Rating for the year 2014-15 for Compliance of Guidelines on Corporate Governance, issued by Department of Public Enterprises (DPE) for Central Public Sector Enterprises (CPSEs). ONGC has secured 100% Score in this regard and is the only Maharatna to achieve this distinction.
Principle 7.4
Has the policy been approved by the Board? If yes, has it been signed by MD/owner/CEO/appropriate Board Director?
ONGC follows policies of the Govt. of India. All its internal policies are approved by the Board of Directors or its designated authority.
Principle 7.5
Does the company have a specified committee of the Board/Director/Of ficial to oversee the implementation of the policy?
Depending upon the area of operation, the relevant function is under the purview of the concerned Functional Director who ensures that the same is being implemented in a responsible manner. The ONGC Board has constituted a number of Board level Commit tees to oversee functioning of respective areas which are detailed in the Corporate Governance Report of the Annual Report 2014-15.
Principle 7.6
Indicate the link for the policy to be viewed online?
The website of ONGC (www.ongcindia.com) has links to the various policies of ONGC through which one can assess that ONGC conducts its business in a responsible manner.
Principle 7.7
Has the policy been formally communicated to all relevant internal and external stakeholders?
ONGC functions in a transparent and ethical manner and its policies are available on-line for all its internal &
external stakeholders. Further, being a PSE, it is obliged to provide all information to citizens in line with Right to Information Act, 2005.
Principle 7.8
Does the company have in-house structure to implement the policy/policies?
ONGC has an elaborate organisation structure comprising of 6 functional directors headed by Chairman & Managing Director to ensure proper implementation of all the policies in place.
Principle 7.9
Does the Company have a grievance redressal mechanism related to the policy/policies to address stakeholders’ grievances related to the policy/ policies?
Yes.
Principle 7.10
Has the company carried out independent audit/evaluation of the working of this policy by an internal or external agency?
The Company has a dedicated Internal Audit department and concurrently audits are conducted through external agencies on regular basis to ensure that the policies produce the desired results. Further, being a PSE under Govt. of India’s ambit, the Company is subject to scrutiny by statutory bodies such as CAG.
1. Is your company a member of any trade and chamber or association? If Yes, Name only those major ones that your business deals with:
Yes. The Company has association with a number of trade chambers & associations such as:
• Federation of Indian Chambers of Commerce and Industry (FICCI)
• Confederation of Indian Industries (CII)
• Standing Conference on Public Enterprises (SCOPE)
• Petroleum Federation of India (PetroFed)
2. Have you advocated/lobbied through above associations for the advancement or improvement of public good?
Yes/No; if yes specify the broad areas (drop box: Governance and Administration, Economic Reforms, Inclusive Development Policies, Energy security, Water, Food Security, Sustainable Business Principles, Others)
ONGC has always advocated constructive suggestion in area of taxation matters, pricing policies, subsidy sharing, exploration and licensing policies, policies towards pursuing the energy security, sustainable development, corporate social responsibility, that are beneficial to the Industry in specific and society in general. Fur ther, details are available on the Company’s site www.ongcindia.com.

Business Responsibility Report
193
Principle 8: Businesses should support inclusive
growth and equitable development
Principle 8.1
Do you have policy/policies for principle 8?
ONGC supports inclusive growth and equitable
development. A well-defined set of objectives,
beneficiaries, strategy and project activities are
undertaken by ONGC through its Corporate Social
Responsibility (CSR) and Sustainable Development
(SD) projects thereby contributing towards inclusive
development of the Nation. The objective is to yield
discernible, long-term, sustainable benefit for
communities in its operational areas & other backward
districts as identified by the Planning Commission,
GOI. This principle is one of the main pillars of the
existing CSR Policy.
Principle 8.2
Has the policy been formulated in consultation with
the relevant stakeholders?
ONGC being a Public Sector Enterprise follows CSR
Policy and policy on Sustainable Development as per
DPE Guidelines formulated by the Govt. of India and
relevant provisions of the Companies Act, 2013.
Principle 8.3
Does the policy conform to any national/
international standards? If yes, specif y?
(50 words)
The CSR policy complies with Companies Act, 2013
and DPE Guidelines which meet International norms
on CSR.
Principle 8.4
Has the policy been approved by the Board? If yes,
has it been signed by MD/owner/CEO/appropriate
Board Director?
All activities pursued under CSR & SD schemes are
approved by the competent authority as per Book of
Delegated Powers – 2015.
Principle 8.5
Does the company have a specified committee of
the Board/ Director/Of ficial to oversee the
implementation of the policy?
The Company has a Commit tee on CSR & SD chaired
by an Independent Director which conforms to the
DPE Guidelines on CSR & SD as well as section 135 of
the Companies Act, 2013. Director (HR) is the nodal
Functional Director for implementation of CSR
initiatives of ONGC who executes the activities through
corporate and work centre level units.
Principle 8.6
Indicate the link for the policy to be viewed online?
The website of ONGC – www.ongcindia.com has a
link to the CSR policy and policy on Sustainable
Development and other such activities of ONGC.
Principle 8.7
Has the policy been formally communicated to all relevant internal and external stakeholders?
The existing policy has been uploaded on the website of ONGC.
Principle 8.8
Does the company have in-house structure to implement the policy/policies?
ONGC has dedicated departments for CSR at corporate level as well as work centre level.
Principle 8.9
Does the Company have a grievance redressal mechanism related to the policy/policies to address stakeholders’ grievances related to the policy/policies?
Yes.
Principle 8.10
Has the company carried out independent audit/evaluation of the working of this policy by an internal or external agency?
Since 2011-12, ONGC has been carrying out the third party Impact Assessment of select CSR initiatives. The impact assessment was carried out for the following projects: 1) Varisthajan Swasthya Sewa Abhiyan 2) Computer education project 3) Project Utkarsh 4) Project eastern swamp deer 5) Project mangrove restoration and conservation education unit 6) project Haritmoksha. The assessment shows a good correlation of results with its intended objective.
1. Does the company have specified programmes/ initiatives/projects in pursuit of the policy related to Principle 8?
Yes. ONGC has played an anchor role in meeting inclusive developmental goals across the country particularly in the North Eastern parts of the country. ONGC’s operational presence is source of local employment and livelihood generation which improves the overall economic standards of the community and region.Some of the projects and initiatives in the given direction are as follows:
Projects on health care
(i) VaristhajanaSwasthyaSewaAbhiyan: ONGC andHelp-Age India Initiative
(ii) Community Hospital in Lakhimpur- Kheri, Ut tarPradesh:
(iii) Aids and Appliances to person with disability:
(iv) Government General Hospital (GGH), Kakinada:
(v) ONGC Mission Ujala:
Education & Vocational courses:
i. ONGC-GICEIT Computer Education Program:
ii. ONGC- The AkshayaPatra Foundation:
iii. Community School at Sitapur, Ut tar Pradesh:
iv. ONGC Super 30

Annual Report 2014-15
Business Responsibility Report
194
Projects for Physically and Mentally challenged
i. ONGC Centre for vocational rehabilitation for the dif ferently abled:
ii. ONGC –Cheshire Home Project for Physically and Mentally Challenged:
Environment Sustainability:
i. Eastern Swamp Deer Conservation Project (Phase II) :
ii. Harit Moksha: Green Cremation System
Development of Backward Districts:
The sustainable development project is being implemented in Jaisalmer, a backward district in Rajasthan. Project involves set ting up of 49 Wind Turbine Generators (WTG) each of capacity of 2.1 MW with total capacity of 102.9 MW in association with M/S Suzlon Energy Ltd. ONGC contribution towards the project is `5620 million. 22 nos. of WTG have been installed.
Women Empowerment:
ONGC as a leading organization and among the founder member of Women in Public Sector (WIPS) established way back in 1990 under the aegis of SCOPE has always spearheaded women empowerment Initiatives. Women Development Forum (WDF) an internal wing of ONGC women Employees was also formed in line with WIPS to encourage women employee to explore their potential to the fullest.
The basic aims and objectives of WIPS are:
• To promote the growth and development ofWomen in Public Sector.
• To assist the Public Undertakings in optimising thefull potential in Women employees.
• To play a catalytic role in improving the status ofWomen in and around PSEs
Other CSR Initiatives:
i) Hortoki Water Supply Scheme
ii) Rajeev Gandhi International Spor ts Complex, Dehradun
iii) Dashrath Stadium at Agartala
iv) IIIT, Agartala
In addition to above major CSR initiatives undertaken in 2014-15, ONGC has partnered with many NGO and other non- profit organization in implementing several other CSR initiative across our country. All work centre of ONGC have designated CSR of fice to take care of the local people.
2. Are the programmes/projects undertaken through in-house team/own foundation/external NGO/ government structures/any other organization?
The company undertakes projects through in-house department, NGO’s and government agencies. The CSR activities are essentially guided by project based approach in line with the guidelines issued by the Department of Public Enterprises and Ministry of Corporate Af fairs of the Government of India. As per DPE Guidelines, PSEs cannot implement the projects through their employees / staf f.
3. Have you done any impact assessment of your initiative?
Yes as stated at 8.10.
4. What is your company’s direct contribution to community development projects- Amount in INR and the details of the projects undertaken?
Out of the total budget of 6606.12 million, an amount of `4952.29 million was spent on various projects as stated below during 2014-15:
CSR Expenditure for the FY 2014-15
Focus Area Amt. consumed
Education including Vocational courses 46,07,70,250
Health Care 35,77,58,278
Environment and ecological conservation 2,87,41,84,398
Entrepreneurship (self help and livelihood) 1,38,56,873
Initiatives for physically and mentally challenged 3,36,72,170
Women's empowerment and girl child development 83,23,966
Promotion of artisans, craf tsmen, musicians 2,08,80,463
Promoting sports and sports persons 1,22,10,264
Protection of heritage sites 1,57,00,000
Infrastructural support near ONGC operational area 93,86,76,949
Support for cultural / sports events, etc. 20,40,00,923
Water management including ground water recharge 1,22,53,307
Grand Total 4,95,22,87,841

Business Responsibility Report
195
5. Have you taken steps to ensure that this community development initiative is successfully adopted by the community? Please explain in 50 words, or so.
Yes. Successful adoption of community development initiatives by the respective community is ensured through the project implementing agency. The CSR project is developed based on need assessment af ter due interaction with the opinion makers and / or elected representatives and / or local government agencies. The project implementation strategy includes information dissemination, which helps in adoption of the project by the local community. Moreover, ONGC’s operations are not adversely af fecting indigenous communities. We have not received any reported incidents of violation involving rights of local community and indigenous people. CSR policy covers engagement of communities impacted by our operations and activities to come up with solutions that enrich the social capital and enhance positive outcomes of our activities. For instance, we provide elderly health care through 20 mobile medical units operated by HelpAge. We also provide prosthetic support to physically challenged persons. Other communit y init iat ives are Haritmokhsa, education to tribal people, eradication of malnutrition amongst others.
Principle 9: Businesses should engage with and provide value to their customers and consumers in a responsible manner
Principle 9.1
Do you have policy/policies for principle 9?
ONGC engages with customers and consumers in a manner that demonstrates best business practises and is a win-win proposition for all doing business with the Company as per mutually agreed upon business principles and deliverables. ONGC’s main customers are Oil Refining & Gas Marketing Companies to which the Company’s produce that is oil and gas is allocated by the Government of India. The Company enters into a Crude Oil Sale Agreement (COSA) with the Oil Marketing Companies (OMCs) and Gas Sales Agreement (GSA)with GAIL to whom it sells the Crude Oil, Natural Gas etc, following the crude oil /gas sales allocations as done by Govt. of India. The COSA/GSA incorporates suitable provisions with regard to the quality and quantity of the product being supplied by ONGC. Besides this, ONGC also sells its produce to other direct customers under GSA which is governed by the policies and business principles of ONGC.
Principle 9.2
Has the policy been formulated in consultation with the relevant stakeholders?
The COSA/GSA of ONGC has been arrived at in consultation with OMCs and Gas marketing companies on mutually agreed principles. Other sales or purchase agreement are also agreed
mutually.ONGC has therefore laid down policies and guidelines for engaging with and providing value to their customers and consumers in a responsible manner.
Principle 9.3
Does the policy conform to any national/ international standards? If yes, specify? (50 words)
The specifications of quality and measurement in COSA/GSA are in accordance with International standards. More over ONGC ensures that policies followed are as per guidelines of the Government of India.
Principle 9.4
Has the policy been approved by the Board? If yes, has it been signed by MD/owner/CEO/ appropriate Board Director?
Yes. The COSA/GSA are signed by the designated authorities af ter seeking approval as per Book of Delegated Powers 2015.
Principle 9.5
Does the company have a specified committee of the Board/Director/Official to oversee the implementation of the policy?
Company has a structured and dedicated marketing department / establishment headed by a General Manager to oversee implementation of relevant policies in this regard.
Principle 9.6
Indicate the link for the policy to be viewed online?
COSA/GSA being a bipar tite agreement is a confidential document and is not available for inspection to the public. However, general guidelines with respect to conducting business with ONGC and also the standard business/contract terms & conditions of conducting business with ONGC are available on the site www.ongcindia.com.
Principle 9.7
Has the policy been formally communicated to all relevant internal and external stakeholders?
Policies, being an internal policy document, have been circulated within the company (internal stake holders). The need for circulation to external stakeholders has not been felt; moreover, it may compromise ONGC’s commercial interests.
Principle 9.8
Does the company have in-house structure to implement the policy/policies?
As given in response against 9.5 above.
Principle 9.9
Does the Company have a grievance redressal mechanism related to the policy/policies to address stakeholders’ grievances related to the policy/policies?
Yes. COSA/GSA has a built in mechanism for stakeholders’ grievance redressal.

Annual Report 2014-15
Business Responsibility Report
196
Principle 9.10
Has the company carried out independent audit/evaluation of the working of this policy by an internal or external agency?
The COSA/GSA is subject to review as may be mutually agreed upon.
1. What percentage of customer complaints/ consumer cases are pending as on the end of financial year :
None. There are no incidents this year for non-compliance with regulations. We have been complying with all laws and regulations concerning provision of our products and services and have not been imposed any fines for non-compliance this year.
2. Does the company display product information on the product label, over and above what is mandated as per local laws?
For crude oil sale, Batch wise certificates are issued for Crude Oil, which includes various quality parameters including the BS&W. Product labelling related to storage procedures and safet y precautions is clearly indicated at the ONGC installation holding the crude.
All Natural Gas supplied by ONGC to various customers conforms to the agreed contractual specifications.
All VAP’s are supplied with batch-wise test reports and standard handling procedures to be followed in line with OISD/other statutory standards. Relevant BIS specifications (if applicable) and quality cer tificates with parameters are issued while dispatching. Product labelling related to storage procedures and safety precautions are clearly indicated at ONGC installations holding the VAP product.
3. Is there any case filed by any stakeholder against the company regarding unfair trade practices, irresponsible advertising and/or anti-competitive behaviour during the last five years and pending as on end of financial year:
No.
4. Did your company carry out any consumer survey/ consumer satisfaction trends?
Yes. The Company interacts on regular basis with its B2B customers’ with respect to product quality and pricing. This kind of engagement with our partners ensures customer satisfaction. Any concerns related to the product by any of our consumers are addressed immediately. In view of constant interaction and feedback through meetings, no need has been felt to undertake separate surveys to measure customer satisfaction.
NOT APPLICABLE
3. Governance related to BR
• Indicate the frequency with which the Board of Directors, Committee of the Board or CEO to assess the BR performance of the Company. Within 3 months, 3-6 months, Annually, More than 1 year
Annually.
• Does the Company publish a BR or a Sustainability Report? What is the hyperlink for
viewing this report? How frequently it is published?
This is the third Report on Business Responsibility and forms part of Annual Report 2014-15.
ONGC also publishes its ‘Sustainability Report’ annually based on Global Reporting Initiative’s latest reporting guidelines. The Sustainability Reports for FY 09-10 till 13-14 are available on the corporate website of the company www.ongcindia.com.
2a. IF ANSWER TO S.NO. 1 AGAINST ANY PRINCIPLE, IS ‘NO’, PLEASE EXPLAIN WHY: (TICK UP TO 2 OPTIONS)
Sl. Questions P 1 P 2 P 3 P 4 P 5 P 6 P 7 P 8 P 9
1 The company has not understood the Principles
2 The company is not at a stage where it finds itself in a position to formulate and implement the policies on specified principles
3 The company does not have financial or manpower resources available for the task
4 It is planned to be done within next 6 months
5 It is planned to be done within the next 1 year
6 Any other reason (please specify)

Secretarial Audit Report
197
Secretarial Audit Report
We have conducted the secretarial audit of the compliance
of applicable statutory provisions and the adherence to
good corporate practices by Oil and Natural Gas
Corporation Limited (“the company”). Secretarial Audit
was conducted in a manner that provided us a reasonable
basis for evaluating the corporate conducts/statutory
compliances and expressing our opinion thereon.
Based on our verification of the company’s books, papers,
minute books, forms and returns filed and other records
maintained by the company and also the information
provided by the Company, its of ficers, agents and
authorized representatives during the conduct of
secretarial audit, we hereby report that in our opinion, the
company has, during the audit period covering the financial styear ended 31 March, 2015, complied with the statutory
provisions listed hereunder and also that the Company has
proper Board-processes and compliance-mechanism in
place to the extent, in the manner and subject to the
reporting made hereinaf ter:
We have examined the books, papers, minute books,
forms and returns filed and other records maintained by Oil
and Natural Gas Corporation Limited for the financial year stended 31 March, 2015 according to the provisions of:
(i) The Companies Act, 2013 (the Act) and the Rules made
thereunder;
(ii) The Securities Contracts (Regulation) Act, 1956
(‘SCRA’) and the rules made thereunder;
(iii) The Depositories Act, 1996 and the Regulations and
Bye-laws framed thereunder;
(iv)Foreign Exchange Management Act, 1999 and the
rules and regulations made thereunder to the extent of
Foreign Direct Investment, Overseas Direct Investment
and External Commercial Borrowings;
(v) The following Regulations and Guidelines prescribed
under the Securities and Exchange Board of India Act,
1992:
(a) The Securities and Exchange Board of India
(Substantial Acquisition of Shares and Takeovers)
Regulations, 2011;
(b) The Securities and Exchange Board of India
(Prohibition of Insider Trading) Regulations,1992;
(c) The Securities and Exchange Board of India (Issue
of Capital and Disclosure Requirements)
Regulations, 2009;
(d) The Securities and Exchange Board of India
(Employee Stock Option Scheme and Employee
Stock Purchase Scheme) Guidelines, 1999;
(e) The Securities and Exchange Board of India (Issue
and Listing of Debt Securities) Regulations, 2008;
(f) The Securities and Exchange Board of India
(Registrars to an Issue and Share Transfer Agents)
Regulations, 1993 regarding the Companies Act
and dealing with client;
(g) The Securities and Exchange Board of India
(Delisting of Equity Shares) Regulations, 2009;
and
(h) The Securities and Exchange Board of India
(Buyback of Securities) Regulations, 1998;
We have also examined compliance with the
applicable clauses of the following:
(i) Secretarial Standards issued by The Institute of
Company Secretaries of India, though not mandatory;
(ii) The Equity Listing Agreements entered into by the
Company with the National Stock Exchange of India
Ltd. and the Bombay Stock Exchange Ltd.; and
(iii)Guidelines on Corporate Governance for Central Public
Sector Enterprises as stipulated in the O.M. No. th18(8)/2005-GM dated 14 May, 2010 of the Ministry of
Heavy Industries and Public Enterprises, Government
of India.
During the period under review the Company has
To,
The Members,
Oil and Natural Gas Corporation Limited
CIN: L74899DL1993GOI054155

Annual Report 2014-15
Secretarial Audit Report
198
complied with the provisions of the Act, Rules,
Regulations, Guidelines, Standards, etc. mentioned
above except to the extent as mentioned below:
st th1. Except for the period from 1 April, 2014 to 30 April, rd th2014 and 23 May, 2014 to 18 June, 2014, the
composition of the Board of Directors of the Company
during the year 2014-15 did not comply with the
provisions of Clause 49 of the Listing Agreement i.e.,
the Board of Directors did not comprise of the required
number of Independent Directors as per the terms of
the above mentioned Listing Agreements. The
vacancies caused due to retirement / vacation of the
Independent Directors have also not been filled up
within 180 days as per the terms of the Equity Listing
Agreement.
2. For part of the year the composition of the Audit &
Ethics Commit tee and the Nomination and
Remuneration Commit tee were not as per the
requirements of the Act and the Listing Agreement.
3. During the year no separate meeting of the
Independent Directors was held.
We further report that:
Subject to our observations at serial No.1 to 3 above,
the Board of Directors of the Company is duly
constituted with proper balance of Executive Directors,
Non-Executive Directors and Independent Directors.
The changes in the composition of the Board of
Directors that took place during the period under
review were carried out in compliance with the
provisions of the Act.
Adequate notice is given to all directors to schedule the
Board and Commit tee Meetings. Agenda and detailed
notes on agenda are invariably dispatched by post or in
person or by e-mail and simultaneously placed on a
dedicated Portal (for Board members only) of the
Company which is password protected, at least seven
days in advance. However, if required, supplementary
note(s) on agenda are sent later, at shorter notice, for
information of the board members and a system exists
for seeking and obtaining further information and
clarifications on the agenda items before the meeting
and for meaningful participation at the meeting.
Unanimous decision is carried through while the
dissenting members’ views are captured and recorded
as part of the minutes.
During the period under review the Company has spent
₹4952.30 Million (2.79% of FY' 15 PAT) on Corporate
Social Responsibility Measures.
We further report that there are adequate systems and
processes in the company commensurate with the size
and operations of the company to monitor and ensure
compliance with applicable laws, rules, regulations and
guidelines.
For P. P. Agarwal & Co.Company Secretaries
Pramod Prasad AgarwalProprietor
FCS No.: 4955 C. P. No.:10566
Place : New Delhi
Date : 01.07.2015
Note: This report is to be read along with our let ter of even date which is annexed as ‘Annexure-A’ and forms an integral part of this report.

Secretarial Audit Report
199
To,
The Members,
Oil and Natural Gas Corporation Limited
The Secretarial Audit report of even date is to be read along with this let ter.
1. Maintenance of secretarial record is the responsibility of the management of the company. Our responsibility is to
express an opinion on these secretarial records based on our audit.
2. We have followed the audit practices and processes as were appropriate to obtain reasonable assurance about the
correctness of the contents of the Secretarial records. The verification was done on test basis to ensure that correct
facts are reflected in secretarial records. We believe that the processes and practices, we followed provide a
reasonable basis for our opinion.
3. We have not verified the correctness and appropriateness of financial records and Books of Accounts of the
company.
4. Where ever required, we have obtained the Management representation about the compliance of laws, rules and
regulations and happening of events etc.
5. The compliance of the provisions of Corporate and other applicable laws, rules, regulations, standards is the
responsibility of management. Our examination was limited to the verification of procedures on test basis.
6. The Secretarial Audit report is neither an assurance as to the future viability of the company nor of the ef ficacy or
ef fectiveness with which the management has conducted the af fairs of the company.
ANNEXURE- A
For P. P. Agarwal & Co.
Company Secretaries
Pramod Prasad Agarwal
Proprietor
FCS No.: 4955
C. P. No.:10566
Place: New Delhi
Date : 01.07.2015

The of fshore operations involve a high-level of precision and expertise, something which is part of ONGCians' everyday life

Independent Auditors’ Report on StandaloneFinancial Statements
Standalone Financial Statement

Annual Report 2014-15
Auditors’ Report on Standalone Financial Statement
202
1. Report on the Standalone Financial Statements
We have audited the accompanying standalone financial statements of Oil and Natural Gas Corporation Limited (“the Company”), which comprise the
stBalance Sheet as at March 31 2015, the Statement of Profit and Loss, the Cash Flow Statement for the year then ended, and a summary of the significant accounting policies and other explanatory information.
2. Management’s Responsibility for the Standalone Financial Statements
The Company’s Board of Directors is responsible for the matters stated in Section 134 (5) of the Companies Act 2013 (“The Act”) with respect to the preparation of these standalone financial statements that give a true and fair view of the financial position, financial performance and cash flows of the Company in accordance with the accounting principles generally accepted in India, including the Accounting Standards specified under Section 133 of the Act, read with Rule 7 of the Companies (Accounts) Rules, 2014. This responsibility also includes maintenance of adequate accounting records in accordance with the provisions of the Act for safeguarding of the assets of the Company and for preventing and detecting frauds and other irregularities; selection and application of appropriate accounting policies; making judgments and estimates that are reasonable and prudent; and design, implementation and maintenance of adequate internal financial controls, that were operating ef fectively for ensuring the accuracy and completeness of the accounting records, relevant to the preparation and presentation of the financial statements that give a true and fair view and are free from material misstatement, whether due to fraud or error.
3. Auditor’s Responsibility
Our responsibility is to express an opinion on these standalone financial statements based on our audit.
We have taken into account the provisions of the Act, the accounting and auditing standards and matters which are required to be included in the audit report under the provisions of the Act and the Rules made thereunder.
We conducted our audit in accordance with the Standards on Auditing specified under Section 143 (10) of the Act. Those Standards require that we comply with ethical requirements and plan and perform the audit to obtain reasonable assurance about whether the financial statements are free from material misstatement.
An audit involves performing procedures to obtain audit evidence about the amounts and the disclosures in the financial statements. The procedures selected depend on the auditor’s judgment, including the assessment of the risks of material misstatement of the financial statements, whether due to fraud or error. In making those risk assessments, the auditor considers internal financial control relevant to the Company’s preparation
of the financial statements that give a true and fair view in order to design audit procedures that are appropriate in the circumstances, but not for the purpose of expressing an opinion on whether the company has in place an adequate internal financial controls system over financial reporting and the operating ef fectiveness of such controls. An audit also includes evaluating the appropriateness of the accounting policies used and the reasonableness of the accounting estimates made by the Company’s Directors, as well as evaluating the overall presentation of the financial statements.
We believe that the audit evidence we have obtained is suf ficient and appropriate to provide a basis for our audit opinion on the standalone financial statements.
4. Opinion
In our opinion and to the best of our information and according to the explanations given to us, the aforesaid standalone financial statements give the information required by the Act in the manner so required and give a true and fair view in conformity with the accounting principles generally accepted in India, of the state of af fairs of the Company as at March 31, 2015, and its profit and its cash flows for the year ended on that date.
5. Emphasis of Matter
We draw attention to Note No. 44.1.1.b to the financial statements with regard to the dispute between the company and the Government of Gujarat in respect of payment of Royalty on the crude oil produced in the State. The accrual of the additional liabilit y of `117,242.00 million, (reduced to the extent 16,440.00 million paid to Gujarat Government- refer note no. 31.2 to the financial statements), against which an amount of `21,067.60 million has been paid with ef fect from February 1, 2014 and considered as deposit, would depend on the decision of the Hon'ble Supreme Court of India. The amount of `117,242.00 million has been disclosed as contingent liability.
Our opinion is not modified in respect of this matter.
6. Other Matters
I. The financial statements include the Company’s share in the total value of assets, liabilities, expenditure and income of 134 blocks under New Exploration Licensing Policy (NELPs)/Joint Venture (JVs) accounts for exploration and production out of which 6 NELPs/JVs accounts have been certified by other Chartered Accountants and 17 NELP/JVs have been certified by the management in respect of NELPs/JVs operated by other operators. Our opinion is based solely on the certificate of the other Chartered Accountants and management certified accounts.
II. We have placed reliance on technical/commercial evaluation by the management in respect of categorization of wells as exploratory, development, producing and dry well, allocation of cost incurred on them, proved developed hydrocarbon reserves and depletion thereof on producing proper ties,
`
To
The Members of Oil And Natural Gas Corporation Limited
Independent Auditors’ Report on Standalone Financial Statements

Auditors’ Report on Standalone Financial Statement
203
impairment, liability for abandonment costs, liability for NELP and nominated blocks for under per formance against agreed Minimum Work Programme and allocation of depreciation on process plat forms to transportation and facilities.
Our opinion is not modified in respect of these matters.
7. Report on the Other Legal and Regulatory Requirements
I. As required by the Companies (Auditors Report) Order, 2015 (“the Order”), issued by the Central Government of India in terms of the section 143(11) of the Act, we give in Annexure 1 a statement on the matters specified in the paragraphs 3 and 4 of the said Order, to the extent applicable.
II. Based on the verification of books of account of the Company and according to information and explanations given to us, we give below a report on the directions issued by the Comptroller and Auditors General of India in terms of section 143 (5) of the Act:
a. According to information and explanations given to us, the company has not been selected for disinvestment.
b. According to information and explanations given to us, the cases of waiver/write of f of debts/loans/ interest wherever applicable during the year along with the reasons and amounts involved are stated in Annexure 2.
c. According to information and explanations given to us, the company has maintained adequate records in respect of inventories lying with third parties and assets received by the company as a gif t from Government or other authorities.
d. We have carried out a review of age wise analysis of significant pending legal/arbitration cases based on the information and explanations made available to us and report that the reasons for the pendency are mainly on account of adjournment and other matters related to legal procedures. We also report that the company has in place a monitoring mechanism for expenditure incurred on such cases.
III. As required by section 143(3) of the Act, we report that:
a. We have sought and obtained all the information and explanations which to the best of our knowledge and belief were necessary for the purposes of our audit.
b. In our opinion, proper books of account as required by law have been kept by the Company so far as it appears from our examination of those books.
c. The Balance Sheet, the Statement of Profit and Loss, and the Cash Flow Statement dealt with by this Report are in agreement with the books of account.
d. In our opinion, the aforesaid standalone financial statements comply with the Accounting Standards specified under Section 133 of the Act, read with Rule 7 of the Companies (Accounts) Rules 2014.
e. On the basis of the writ ten representations received from the directors as on 31st March 2015 taken on record by the Board of Directors, none of the directors is disqualified as on 31stMarch 2015 from being appointed as a director in terms of Section 164 (2) of the Act.
f. The matter described under “Emphasis of Matters” para above in the event of being decided unfavourably, in our opinion, may have an adverse impact on the functioning of the company.
g. With respect to the other matters to be included in Auditor’s Report in accordance with Rule 11 of the Companies (Audit and Auditors) Rules, 2014 in our opinion and to the best of our information and according to the explanations given to us:
i. The company has disclosed the impact of the pending litigations on its financial position in its financial statements- Refer Note 44.1.1 to the financial statements.
ii. According to information and explanations given to us, the company did not have any long term contracts including derivative contracts for which there were any material foreseeable losses- Refer Note 51 to the financial statements.
iii. There has been no delay in transferring amounts, required to be transferred, to the Investor Education and protection Fund by the Company.
For G. D. Apte & Co.Chartered AccountantsFirm Reg. No: 100515W
(C.M. Dixit)Partner (M.No. 017532)
For Mehra Goel& Co.Chartered AccountantsFirm Reg. No:000517N
(R. K. Mehra)Partner (M.No. 006102)
For Khandelwal Jain & Co.Chartered AccountantsFirm Reg. No: 105049W
(Narendra Jain)Partner (M.No. 048725)
Date : May 28, 2015Place : New Delhi
For Varma & VarmaChartered AccountantsFirm Reg. No:004532S
(P. R. Prasanna Varma)Partner (M.No.025854)
For Lodha & Co.Chartered AccountantsFirm Reg. No: 301051E
(R. P. Singh)Partner (M.No. 052438)

Annual Report 2014-15
Auditors’ Report on Standalone Financial Statement
204
i. a. The Company has generally maintained proper records showing full par ticulars including quantitative details and situation of fixed assets.
b. As per the information and explanations given to us, the fixed assets having substantial value, other than those which are underground/submerged/under joint venture have been physically verified by the management in a phased manner, which in our opinion is reasonable, having regard to the size of company and nature of its business. The reconciliation of physically verified assets with the book records is in progress. Discrepancies noticed on the physical verification and consequential adjustments are carried out on completion of reconciliation. According to information and explanations given by the management and in our opinion, the same is not material.
ii. a. According to the information and explanations given by the management, the inventory has been physically verified in the phased manner (excluding inventory lying with third parties, at some of the site-locations, inventory with joint ventures and intra site material in transit) during the year by the management. In our opinion, the frequency of verification is reasonable.
b. In our opinion, considering the size of the company and nature of its business, the procedure of physical verification of inventory followed by the management needs to be strengthened further.
c. The Company has generally maintained proper records of inventory. During the year, the management has identified certain discrepancies in the physical stock of crude oil which has been writ ten of f as stated on Note No. 50 to the financial Statements. According to the information and explanations given by the management and in our opinion, other than as stated above the discrepancies noticed on physical verification between the physical stock and book records were not material having regard to the size of the Company and nature of its business. In case where discrepancies noticed on physical verification have been identified with inventory records, necessary adjustments have been carried out in the books of account. In respect of cases where the reconciliation is not complete, the management has stated that the ef fect of the same on the accounts would be adjusted on completion of reconciliation.
iii. The Company has granted secured loans to five parties covered in the register maintained under section 189 of the Act.
a. According to information and explanations given to us and based on our verification of books of account, the receipt of principal amount and interest are regular.
b. According to information and explanations given to us and based on our verification of books of account we report that, there was no overdue amount in respect of such loans granted.
iv. In our opinion, and according to the information and explanations given to us, the internal control procedures are generally adequate and commensurate with the size of the Company and the nature of its business with regard to purchases of inventory and fixed assets and for the sale of goods and services. During the course of our audit we have not observed any continuing failure to correct major weaknesses in internal controls.
v. In our opinion and according to information and explanations given to us, the Company has not accepted any deposits as per the provision of the Act.
vi. We have broadly reviewed the costs records maintained by the Company pursuant to the Companies (Cost Records and Audit) Rules, 2014, as amended and prescribed by the Central Government under sub section (1) of section 148 of the Companies Act, 2013 and we are of the opinion that prima facie the prescribed accounts and records have been made and maintained. However, we have not made a detailed examination of the cost records with the view to determine whether they are accurate or complete.
vii. a. According to records of the Company, undisputed statutor y dues including Provident Fund, Employees’ State Insurance, Income Tax, Sales Tax, Service Tax, Wealth Tax, Duty of Customs, Duty of Excise, Value Added Tax, Cess and other statutory dues have been generally regularly deposited with the appropriate authorities. According to the information and explanations given to us, no undisputed amounts payable in respect of the aforesaid dues were outstanding as at March 31, 2015 for a period more than six months from the date of becoming payable.
b. According to the information and explanations given to us, there were no dues in respect of Income Tax, Duty of Excise, Duty of Customs, Cess, Sales Tax, Service Tax, Value Added Tax and Wealth Tax which have not been deposited on account of any dispute except the following:
Annexure 1 to Independent Auditors’ Report(Referred to in paragraph 1 under ‘Report on Other Legal
and Regulatory Requirements’ section of our report of even date)

Auditors’ Report on Standalone Financial Statement
205
Name of the Nature of Forum where dispute Period to Gross Amount Amount Amount statute Dues is pending which the Involved Paid under Unpaid
amount relates Protest (financial year)
Central Excise Central excise Commissioner (Appeals) of 2002-2007 109.20 108.54 0.66 Act, 1944 duty/Interest/ Central Excise, Custom and
Penalty Service Tax
Custom, Excise and Service 2001-2013 4,116.17 109.37 4,006.80 Tax Appellate Tribunal
Hon. High Court 1996-2015 351.33 - 351.33
Hon. Supreme Court 1980-2005 1,283.30 - 1,283.30
Total (A) 5,860.00 217.91 5,642.09
Oil Industries Cess/ Interest Custom, Excise and Service 2004-2009 6.57 - 6.57 (Development) Tax Appellate TribunalAct, 1974
Total (B) 6.57 - 6.57
A.P. Mineral Cess/ Interest Hon. High Court 2005-2014 2,371.75 - 2,371.75 Bearing Ordinance (infrastructure) Cess Rules, 2005
Total (C) 2,371.75 - 2,371.75
The Custom Custom duty/ Custom, Excise and Service 2007-08 5.00 1.00 4.00 Act, 1962 Penalty/ Tax Appellate Tribunal
Interest
Total (D) 5.00 1.00 4.00
Income Tax Income Tax/ Commissioner (Appeals) 2006-2012 74,701.19 44,819.55 29,881.64 Act, 1961 Penalty/ Hon. High Court 2003-2010 1,002.78 14.86 987.92
Interest Hon. Supreme Court 1983-1986 740.22 - 740.22
Income Tax Appellate Tribunal 1995-2011 3,556.25 566.45 2,989.80
Total (E) 80,000.44 45,400.86 34,599.58
Central Sales Sales Tax/ Appellate Tribunal 1993-2000 146.95 20.92 126.03
Tax Act, 1956 Turnover Tax/ Hon. High Court 1978-2013 24,439.03 655.16 23,783.87 and respective Penalty/
Joint Commissioner/ 2000-2010 3,227.65 39.38 3,188.27 States Sales Interest
Commissioner CT-AppealsTax Act
Total (F) 27,813.63 715.46 27,098.17
Finance Act, Service Tax/ Commissioner/Joint/Deputy 2004-2015 2.09 1.98 0.11 1994 Interest/ Commissioner of Central
Penalties Excise, Custom and Service Tax
Custom, Excise and Service 2005-2012 93.46 93.42 0.04 Tax Appellate Tribunal
Directorate General of 2006-2008 637.40 - 637.40 Central Excise, Custom and Service Tax
Hon. High Court 2004-2007 32.48 - 32.48
Total (G) 765.43 95.40 670.03
Grand Total (A+B+C+D+E+F+G) 116,822.82 46,430.63 70,392.19
(` in million)

Annual Report 2014-15
Auditors’ Report on Standalone Financial Statement
206
c. The amount required to be transferred to investor education and protection fund in accordance with the relevant provisions of the Companies Act, 1956 (1 of 1956) and rules made thereunder has been transferred to such fund within time.
viii. The Company does not have accumulated losses at the end of the current financial year and has not incurred cash losses either during the year or during the immediately preceding financial year.
ix. The Company has not issued any debentures and has not borrowed any fund from financial institutions. The company has not defaulted in repayment of dues to the bank.
x. In our opinion and according to the information and explanations given to us, the terms and conditions on which the Company has given guarantees for loans taken by others from banks or financial institutions are not prima facie prejudicial to the interest of the Company.
xi. The company has not availed any term loan during the year.
xii. According to the information and explanations given to us, except for over reporting of crude oil production and inventor y which is under investigation as stated in note no. 50 to the financial statements, no fraud on or by the Company has been noticed or reported during the year.
For G. D. Apte & Co.Chartered AccountantsFirm Reg. No: 100515W
(C.M. Dixit)Partner (M.No. 017532)
For Mehra Goel& Co.Chartered AccountantsFirm Reg. No:000517N
(R. K. Mehra)Partner (M.No. 006102)
For Khandelwal Jain & Co.Chartered AccountantsFirm Reg. No: 105049W
(Narendra Jain)Partner (M.No. 048725)
Date : May 28, 2015Place : New Delhi
For Varma & VarmaChartered AccountantsFirm Reg. No:004532S
(P. R. Prasanna Varma)Partner (M.No.025854)
For Lodha & Co.Chartered AccountantsFirm Reg. No: 301051E
(R. P. Singh)Partner (M.No. 052438)

Auditors’ Report on Standalone Financial Statement
207
Annexure 2 to Independent Auditors’ Report(Referred to in paragraph ii (b) under ‘Report on Other Legal and
Regulatory Requirements’ section of our report of even date)
Cases of waiver/write off of debts/loans/Interest
The cases of waiver/write of fs of debts/loans/interest, wherever applicable during the year along with the reasons and amount involved are as under:
` in million Reasons
26.40 Settlement of Arbitration award
0.01 Details of deposit not available
0.01 Forfeiture of Deposit
1.40 Disallowance of insurance claim
0.26 Long outstanding balance
28.08
Preparation of shot-hole drilling for seismic survey; ONGC made 22 new discoveries in FY'15 - 10 new prospects and 12 new pools

Annual Report 2014-15
Standalone Financial Statement
208
stBalance Sheet as at 31 March, 2015
I. EQUITY AND LIABILITIES
1 Shareholders’ funds
(a) Share capital 3 42,777.60 42,777.60
(b) Reserves and surplus 4 1,403,232.15 1,324,472.45
2 Non-current liabilities
(a) Deferred tax liabilities (Net) 5 177,331.54 165,786.78
(b) Other Long term liabilities 6 11,288.85 11,779.09
(c) Long-term provisions 7 254,433.79 257,270.72
3 Current liabilities
(a) Short-term borrowings 8 13,930.00 -
(b) Trade payables 9 54,891.03 63,724.81
(c) Other current liabilities 10 102,938.07 119,257.45
(d) Short-term provisions 11 19,975.78 7,815.39
TOTAL 2,080,798.81 1,992,884.29
II. ASSETS
1 Non-current assets
(a) Fixed assets
(i) Tangible assets 12 314,211.24 302,291.89
(ii) Producing Properties 13 667,110.29 657,832.64
(iii) Intangible assets 14 696.04 500.61
(iv) Capital work-in-progress 15 126,906.58 116,450.34
(v) Exploratory/Development Wells in Progress 16 158,885.29 139,127.59
(b) Non-current investments 17 181,242.83 172,043.06
(c) Long-term loans and advances 18 194,708.20 181,783.61
(d) Deposit under Site Restoration Fund Scheme 19 125,443.80 113,101.59
(e) Other non-current assets 20 9,962.00 11,319.96
2 Current assets
(a) Current investments - -
(b) Inventories 21 59,635.27 58,825.41
(c) Trade receivables 22 135,782.74 81,656.70
(d) Cash and Cash Equivalents 23 27,600.68 107,988.77
(e) Short-term loans and advances 24 69,476.77 43,669.60
(f) Other current assets 25 9,137.08 6,292.52
TOTAL 2,080,798.81 1,992,884.29
The accompanying notes are an integral part of these financial statements 1 to 54
Particulars Note No. As atst31 March, 2015
As atst 31 March, 2014
(` in million)
(A. K. Srinivasan) Chief Financial Officer
(D.K.Sarraf)Chairman & Managing Director
For and on behalf of the Board
(N. K. Sinha)Company Secretary
For Mehra Goel & Co.Chartered AccountantsFirm Reg. No. 000517N
(R.K.Mehra) Partner (M.No. 006102)
For Khandelwal Jain & Co.Chartered AccountantsFirm Reg. No. 105049W
(Narendra Jain) Partner (M. No. 048725)
New Delhi th28 May, 2015
For Varma & VarmaChartered AccountantsFirm Reg. No. 004532S
For Lodha & Co.Chartered AccountantsFirm Reg. No.301051E
(R.P. Singh) Partner (M.No. 052438)
(P. R.Prasanna Varma)Partner (M. No. 025854)
For G D Apte & Co.Chartered AccountantsFirm Reg. No. 100515W
(C. M. Dixit)Partner (M. No. 017532)
In terms of our report of even date attached

Standalone Financial Statement
209
I INCOME
Revenue from operations (Gross) 26 830,934.67 842,027.80
Less: Excise Duty 2,225.06 3,125.09
Revenue from operations (Net) 828,709.61 838,902.71
Other Income 28 53,665.67 67,131.99
Total Revenue 882,375.28 906,034.70
II EXPENSES
(Increase)/ Decrease in inventories 29 (1,674.29) 1,042.80
Purchases of Stock-in-Trade 44.2.2 44.11 31.80
Production, Transportation, Selling and Distribution Expenditure 31 392,662.80 393,334.90
Exploration Costs writ ten of f
- Survey Costs 19,146.47 15,911.62
- Exploratory well Costs 86,078.16 62,445.15
Depreciation, Depletion, Amortisation and Impairment 32 114,583.12 109,258.90
Financing Costs 33 27.87 3.57
Provisions and Write-of fs 34 2,115.60 2,188.50
Adjustments relating to Prior Period (Net) 35 3,839.09 (2,501.86)
Total Expenses 616,822.93 581,715.38
Profit before Exceptional, Extraordinary items and Tax 265,552.35 324,319.32
Exceptional items - -
Profit before Extraordinary items and Tax 265,552.35 324,319.32
Extraordinary items - -
Profit before Tax 265,552.35 324,319.32
Tax Expense
- Current Tax 82,000.00 65,500.00
- MAT Credit Entitlement - (2,800.00)
- Earlier years (5,848.30) 2,145.87
- Deferred Tax 12,071.11 38,525.38
Profit af ter Tax 177,329.54 220,948.07
Earnings per Equity Share - Basic and Diluted (`) 36 20.73 25.83
(Face Value ` 5/-Per Share)
The accompanying notes are an integral part of these financial statements 1 to 54
Particulars
(` in million)
Statement of Profit & Lossstfor the year ended 31 March, 2015
Note No. 2014-15 2013-14
(A. K. Srinivasan) Chief Financial Officer
(D.K.Sarraf)Chairman & Managing Director
For and on behalf of the Board
(N. K. Sinha)Company Secretary
For Mehra Goel & Co.Chartered AccountantsFirm Reg. No. 000517N
(R.K.Mehra) Partner (M.No. 006102)
For Khandelwal Jain & Co.Chartered AccountantsFirm Reg. No. 105049W
(Narendra Jain) Partner (M. No. 048725)
New Delhi th28 May, 2015
For Varma & VarmaChartered AccountantsFirm Reg. No. 004532S
For Lodha & Co.Chartered AccountantsFirm Reg. No.301051E
(R.P. Singh) Partner (M.No. 052438)
(P. R.Prasanna Varma)Partner (M. No. 025854)
For G D Apte & Co.Chartered AccountantsFirm Reg. No. 100515W
(C. M. Dixit)Partner (M. No. 017532)
In terms of our report of even date attached

Annual Report 2014-15
Standalone Financial Statement
210
A. CASH FLOW FROM OPERATING ACTIVITIES:
Net Profit before tax and extraordinary items 265,552.35 324,319.32
Adjustments For:
- Prior Period Items 3,839.09 (2,501.86)
- Depreciation, Depletion, Amortisation & Impairment 114,583.12 109,258.90
- Exploratory Well Costs Writ ten of f 86,078.16 62,445.15
- Interest on Borrowings 27.87 3.57
- Unrealized Foreign Exchange Loss/(Gain) 222.91 341.11
- Provision for Leave Encashment 1,556.81 (17,273.47)
- Provision for other Employee Benefits 3,279.49 2,764.16
- Other Provision and Write of fs 2,115.60 2,188.50
- Excess Provision writ ten back (6,456.33) (16,328.86)
- Provision for Abadonnment 283.48 243.56
- Interest Income (30,564.45) (33,006.23)
- Excess Liability writ ten Back (856.54) (2,836.39)
- Amortization of Government Grant (14.17) (2.87)
- Dividend Income (4,889.51) 169,205.53 (3,744.37) 101,550.90
Operating Profit before Working Capital Changes 434,757.88 425,870.22
Adjustments for:-
- Receivables (54,503.49) 2,779.65
- Loans and Advances (28,881.97) (2,677.53)
- Other Current Assets (225.33) 4,300.38
- Inventories (542.54) (2,704.45)
- Trade Payable and Other Liabilities (24,277.96) (108,431.29) 29,225.79 30,923.84
Cash generated from Operations 326,326.59 456,794.06
Direct Taxes Paid (Net of tax refund) (76,080.81) (78,080.58)
Cash Flow before prior period 250,245.78 378,713.48
Prior period items (Cash items) (524.60) 166.71
Net Cash Flow from Operating Activities 'A' 249,721.18 378,880.19
B. CASH FLOW FROM INVESTING ACTIVITIES:
Purchase of Fixed Assets (82,389.32) (101,082.42)
Sale of Fixed Assets 62.27 7.28
Exploratory and Development Drilling (177,557.51) (199,047.62)
Advance/Investment in Joint Controlled Entities (2,516.54) (9,910.69)
Loan to Associates 350.45 337.88
Loan and advances to Subsidiary (5,961.93) 6,941.01
Investments/Loans to Public Sector Undertakings - (26,707.47)
Deposit in Site Restoration Fund (12,342.21) (11,770.38)
Dividend Received from Associates 37.80 11.46
Dividend Received from Other Investment 4,851.71 3,732.91
Interest Received 26,332.31 31,984.50
Net Cash Flow from Investing Activities 'B' (249,132.97) (305,503.54)
Year Endedst 31 March, 2015
Year Endedst 31 March, 2014
(` in million)
Cash Flow Statementstfor the year ended 31 March, 2015

Standalone Financial Statement
211
Cash Flow Statementstfor the year ended 31 March, 2015
C. CASH FLOW FROM FINANCING ACTIVITIES:
Short Term Borrowings 13,930.00 -
Dividend Paid (79,133.08) (83,399.48)
Tax on Dividend (15,748.94) (14,170.69)
Interest Paid (24.28) (3.57)
Net Cash Flow from Financing Activities 'C' (80,976.30) (97,573.74)
Net increase/(decrease) in Cash and (80,388.09) (24,197.09)
Cash Equivalents (A+B+C)
stCash and Cash Equivalents as at 1 April, 2014 107,988.77 132,185.86
(Opening Balance)stCash and Cash Equivalents as at 31 March, 2015* Note 23 27,600.68 107,988.77
(Closing Balance)
(80,388.09) (24,197.09)
Notes:
1. The above Cash Flow Statement has been prepared under the 'Indirect Method' as set out in the Accounting Standard (AS) 3 onCash Flow Statements issued by The Institute of Chartered Accountants of India.
2. *Includes Term deposits of `17,340 million (Previous year nil) pledged to Banks against Short term loan taken from Banks. Alsoincludes restricted amount of 247.24 million (Previous year 242.01 million) earmarked for payment of unclaimed dividend.
3. Brackets indicate cash out flow/ deduction.
4 Previous year figures have been re-grouped/re-classified wherever necessary to conform to the current years presentation.
Year Endedst 31 March, 2015
Year Endedst 31 March, 2014
(` in million)
(A. K. Srinivasan)Chief Financial Officer
(D.K.Sarraf)Chairman & Managing Director
For and on behalf of the Board
(N. K. Sinha)Company Secretary
For Mehra Goal & CoChartered AccountantsFirm Reg. No. 000517N
(R. K. Mehra) Partner (M.No. 006102)
For Khandelwal Jain & Co.Chartered AccountantsFirm Reg. No. 105049W
(Narendra Jain)Partner (M. No. 048725)
New Delhith28 May, 2015
For Varma & VarmaChartered AccountantsFirm Reg. No. 004532S
(P. R. Prasanna Varma)Partner (Mem. No. 025854)
For Lodha & Co. Chartered AccountantsFirm Reg. No. 30105IE
(R.P. Singh) Partner (M.No. 052438)
For G.D. Apte & Co.Chartered AccountantsFirm Reg. No. 100515W
(C.M. Dixit)Partner (M. No. 017532)
In terms of our report of even date attached

Annual Report 2014-15
Standalone Financial Statement
212
stNotes to Financial Statements for the year ended 31 March, 2015
1. Corporate information
Oil and Natural Gas Corporation Limited (‘ONGC’ or ‘the Company’) is a public limited company domiciled and incorporated in India. The Company’s shares are listed and traded on Stock Exchanges in India. The Company is engaged in exploration, development and production of crude oil and natural gas.
2. Significant Accounting Policies
a. Basis of preparation
The financial statements are prepared under the historical cost convention on accrual basis in accordance with Generally Accepted Accounting Principles (GAAP), applying the Successful Ef forts Method as per the Guidance Note on Accounting for Oil and Gas Producing Activities (Revised) issued by the Institute of Chartered Accountants of India and Accounting Standards as prescribed under the Companies (Accounts) Rules, 2014 and provisions of the Companies Act, 2013.
As the operating cycle cannot be identified in normal course due to the special nature of industry, the same has been assumed to have duration of 12 months. Accordingly, all assets and liabilities have been classified as current or non-current as per the Company’s operating cycle and other criteria set out in the Schedule III to the Companies Act, 2013.
The financial statements are presented in Indian Rupees and all values are rounded to the nearest million except otherwise stated.
b. Use of Estimates
The preparation of financial statements requires estimates and assumptions which af fect the reported amount of assets, liabilities, revenues and expenses of the reporting period. The dif ference between the actual results and estimates are recognized in the period in which the results are known or materialized.
c. Government Grant
Government Grant related to acquisition of Fixed Assets is treated as ‘Deferred Government Grant’ and an amount equal to propor tionate depreciation of such assets is credited to Statement of Profit and Loss.
d. Fixed Assets
d.1 Tangible Assets
d.1.1 Fixed assets are stated at historical cost less accumulated depreciation and impairment. Fixed assets received as donations/gif ts are capitalised at assessed values with corresponding credit taken to Capital Reserve.
d.1.2 All costs, net of applicable tax credits, relating to acquisition of fixed assets till the time of bringing
the assets to working condition for intended use are capitalised.
d.2 Intangible Assets
Intangible assets are stated at cost of acquisition, net of applicable tax credits, less accumulated amortization and impairment.
e. Exploration, Development and Production Costs
e.1 Pre-acquisition cost
Expenditure incurred before obtaining the right(s) to explore, develop and produce oil and gas are expensed as and when incurred.
e.2 Acquisition Cost
Acquisition costs of an oil and gas property are costs related to right to acquire mineral interest and are accounted/ treated as follows:-
Exploration and Development stage:
Acquisition cost relating to projects under exploration or developments are initially accounted as capital work in progress. Such costs are capitalized by transferring to Producing Property when a well is ready to commence commercial production. In case of abandonment/ relinquishment, such costs are writ ten of f.
Production stage:
Acquisition costs of a producing oil and gas property are capitalized as proved property acquisition cost under producing properties and amortized over the production profile of the underlying asset using the unit of production method over proved reserves.
e.3 Survey Cost
Cost of Survey and prospecting activities conducted in the search of oil and gas are expensed as exploration cost in the year in which these are incurred.
e.4 Exploratory/ Development Wells in Progress
e.4.1 All exploration costs incurred in drilling and equipping exploratory and appraisal wells, cost of drilling exploratory type stratigraphic test wells are initially capitalized as Exploratory Wells in Progress till the time these are either transferred to Producing Properties on completion as per note no.2. f.1.1 or expensed as exploration cost (including allocated depreciation) as and when determined to be dry or of no further use, as the case may be.
e.4.2 Costs of exploratory wells are not carried unless there are indications of suf ficient quantity of reserves and suf ficient progress is being made in assessing the reserves and the economic and operating viability of the project. All such carried costs are subject to review for impairment as per note no. 2.n.7.

Standalone Financial Statement
213
e.4.3 All costs relating to Development Wells are initially capitalized as ‘Development Wells in Progress’ and transferred to ‘Producing Properties’ on “completion” as per note no. 2.f.
f. Producing Properties
f.1.1 Producing Properties are created in respect of an area/field having proved developed oil and gas reserves, when the well in the area/field is ready to commence commercial production.
f.1.2 Cost of temporary occupation of land, successful exploratory wells, all development wells, depreciation on related equipment, facilities and estimated future abandonment costs are capitalised and reflected as Producing Properties.
g. Production Costs
Production costs include pre-well head and post-well head expenses including depreciation and applicable operating costs of support equipment and facilities.
h. Side tracking
h.1 In case of an exploratory well, Cost of Side-tracking is treated in the same manner as the cost incurred on a new exploratory well. The cost of abandoned portion of side tracked exploratory wells is expensed as ‘Exploratory Well Cost written of f.’.
h.2 In case of development wells, the entire cost of abandoned por tion and side tracking is capitalised.
h.3 In case of Producing wells, if the side-tracking results in additional proved developed oil and gas reserves or increases the future economic benefits therefrom beyond previously assessed standard of performance, the cost incurred on side tracking is capitalised, whereas the cost of abandoned portion of the well is depleted in the normal way. Otherwise, the cost of side tracking is expensed as ‘Work over Expenditure’
i. Abandonment Cost
i.1 The full eventual estimated liability towards costs relating to dismantling, abandoning and restoring well sites and allied facilities are recognized in respective assets when the well is complete / facilities are installed. The abandonment cost on dry well is expensed as exploratory well cost.
i.2 Provision for abandonment cost is updated based on the technical assessment at current costs. The ef fects of changes resulting from revisions to estimated liability are adjusted to the carrying amount of the related Asset and considered for depletion on a prospective basis.
j. Jointly Controlled Assets
The Company has Joint Ventures in the nature of Production Sharing Contracts (PSC) with the Government of India and various body corporates for exploration, development and production activities.
j.1 The company’s share in the assets and liabilities along with at tributable income and expenditure of the Jointly Controlled Assets is merged on line by line basis with the similar items in the Financial Statements of the Company and adjusted for depreciation, depletion, survey, dry wells, abandonment, impairment and sidetracking in accordance with the accounting policies of the Company.
j.2 Disposal of Interest
Gain or loss on sale of interest in a cost center, is recognized in the statement of profit and loss, except that no gain is recognized at the time of such sale if substantial uncertainty exists about the recovery of the costs applicable to the retained interest or if the company has substantial obligation for future performance. The gain in such situation is treated as recovery of cost related to that cost center.
j.3 The hydrocarbon reserves in such areas are taken in proportion to the participating interest of the Company.
k. Investments
Long-term investments are valued at cost. Provision is made for any diminution, other than temporary, in the value of such investments.
Current Investments are valued at lower of cost and fair value.
l. Inventories
l.1 Finished goods (other than Sulphur) and stock in pipelines/tanks and carbon credits are valued at cost or net realisable value whichever is lower. Cost of finished goods is determined on absorption costing method. Sulphur is valued at net realisable value. The value of inventories includes excise dut y, royalt y (wherever applicable) but excludes Cess.
l.2 Crude oil in unfinished condition in flow lines up to Group Gathering Stations/plat form and Natural gas is not valued as it is not stored.
l.3 Inventory of stores and spare parts is valued at weighted average cost or net realisable value, whichever is lower. Provisions are made for obsolete and non-moving inventories.
l.4 Unserviceable and scrap items, when determined, are valued at estimated net realisable value.
m. Revenue Recognition
m.1 Revenue from sale of products is recognized on transfer of custody to customers.
m.2 Sale of crude oil and gas (net of levies) produced from Wells in Progress is deducted from expenditure on such wells.
m.3 Sales are inclusive of all statutory levies except Value Added Tax (VAT). Any retrospective revision in prices is accounted for in the year of such revision.

Annual Report 2014-15
Standalone Financial Statement
214
m.4 Revenue in respect of the following is recognized when there is a reasonable certainty regarding ultimate collection:
a. Short lif ted quantity of gas
b. Gas pipeline transportation charges
c. Reimbursable subsidies and grants
d. Surplus from Gas Pool Account
e. Interest on delayed realization from customers
f. Liquidated damages from contractors/suppliers
m.5 Dividend income is recognized when right to receive is established. Interest income is recognized on time proportion basis taking into account the amount outstanding and rate applicable.
n. Depreciation, Depletion, Amortisation and Impairment Depreciation
n.1 Depreciation on fixed assets is provided for under the written down value method over the useful life of Asset as specified in Schedule II to the Companies Act, 2013 except in case of certain items of plant and equipment where useful life ranging from 3 to 25 years has been considered based on technical assessment by the management which is lower than the useful life prescribed under schedule II to the Companies Act 2013.
n.2 Depreciation on additions/deletions during the year is provided on pro rata basis with reference to the date of additions/deletions except low value items not exceeding ` 5,000/- which are fully depreciated at the time of addition.
n.3 Depreciation on subsequent expenditure on fixed assets arising on account of capital improvement or other factors is provided for prospectively over the remaining useful life.
Depreciation on refurbished/revamped assets which are capitalized separately is provided for over the reassessed useful life, which is not more than the life specified in Schedule II to the Companies Act, 2013.
n.4 Depreciation on fixed assets (including support equipment and facilities) used for exploratory/ development drilling and on production facilities is initially capitalised as part of drilling cost or producing properties and expensed/depleted as stated in Note no. 2.f and 2.n.5. Depreciation on equipment/ assets deployed for survey activities is charged to the Statement of Profit and Loss.
n.5 Depletion
Producing Properties are depleted using the “Unit of Production Method”. The rate of depletion is computed with reference to an area covered by individual lease/license/asset/ amortization base by considering the proved developed reserves and related capital costs incurred including estimated future abandonment costs net of salvage value. Acquisition cost of Producing
Properties is depleted by considering the proved reserves. These reserves are estimated annually by the Reserve Estimates Commit tee of the Company, which follows the International Reservoir Engineering Procedures.
Amortisation
n.6 Leasehold land is amortized over the lease period except perpetual leases.
Intangible assets are amortized on Straight Line Method (SLM) over the useful life not exceeding five years from the date of capitalization.
Impairment
n.7 Producing Properties, Development Wells in Progress (DWIP), and Fixed Assets (including Capital Works in Progress) of a “Cash Generating Unit” (CGU) are reviewed for impairment at each Balance Sheet date. In case, events and circumstances indicate any impairment, recoverable amount of these assets is determined. An impairment loss is recognized, whenever the carrying amount of such assets exceeds the recoverable amount. The recoverable amount is higher of its ‘value in use’ or ‘net selling price’ (if determinable). In assessing value in use, the estimated future cash flows from the use of assets and from its disposal at the end of its useful life are discounted to their present value at appropriate rate.
An impairment loss is reversed if there is increase in the recoverable amount and such loss either no longer exists or has decreased. Impairment loss / reversal thereof is adjusted to the carrying value of the respective assets, which in case of CGU, is allocated to its assets on a pro-rata basis. Subsequent to impairment, depreciation is provided on the revised carrying value of the assets over the remaining useful life.
Impairment testing during exploratory phase is carried out at area level when fur ther exploration activities are not planned in near future or when suf ficient data exists to indicate that although a development in the specific area is likely to proceed, the carrying amount of the exploration asset is unlikely to be recovered in full from successful development or by sale. Impairment is reversed subsequently, to the ex tent that conditions for impairment are no longer present.
o. Foreign Exchange Transactions
Transactions in foreign currencies are accounted for at the exchange rate prevailing on the date of the transaction. Foreign currency monetary assets and liabilities at the year-end are translated using mean exchange rate prevailing on the last day of the financial year. The loss or gain thereon and also the exchange dif ferences on set tlement of the foreign currency transactions during the year are recognized as income or expense and

Standalone Financial Statement
215
adjusted to the Statement of Profit and Loss.
p. Employee Benefits
p.1 All short term employee benefits are recognized at their undiscounted amount in the accounting period in which they are incurred.
p.2 Employee Benefit under defined contribution plans comprising provident fund etc. is recognized based on the undiscounted amount of obligations of the company to contribute to the plan. The same is paid to a fund administered through a separate trust.
p.3 Employee benefits under defined benefit plans comprising of gratuity, leave encashment, compensated absences, post-retirement medical benefits and other terminal benefits are recognized based on the present value of defined benefit obligation, which is computed on the basis of actuarial valuation using the Projected Unit Credit Method. Actuarial Liability in excess of respective plan assets is recognized during the year. Actuarial gains and losses in respect of post-employment and other long-term benefits are recognized during the year. The Company contributes all ascertained liabilities with respect to Gratuity and leave/compensated absences to the ONGC’s Gratuity Fund Trust (OGFT) and Life Insurance Corporation of India (LICI) respectively. Other defined benefit schemes are unfunded.
q. Voluntary Retirement Scheme
Expenditure on Voluntary Retirement Scheme (VRS) is charged to the Statement of Profit and Loss when incurred.
r. General Administrative Expenses
General administrative expenses which are directly attributable are allocated to activities and the balance is charged to Statement of Profit and Loss.
s. Insurance claims
The company accounts for insurance claims as under :-
s.1 In case of total loss of asset, by transferring either the carrying cost of the relevant asset or insurance value (subject to deductibles), whichever is lower under the head “Claims Recoverable-Insurance” on intimation to Insurer. In case insurance claim is less than carrying cost, the dif ference is charged to Statement of Profit and Loss.
s.2 In case of partial or other losses, expenditure incurred/payments made to put such assets back into use, to meet third party or other liabilities (less policy deductibles) if any, are accounted for as “Claims Recoverable-Insurance”. Insurance Policy deductibles are expensed in the year the corresponding expenditure is incurred.
s.3 As and when claims are finally received from insurer, the dif ference, if any, between Claims
Recoverable-Insurance and claims received is adjusted to Statement of Profit and Loss.
t. Research Expenditure
Expenditure of capital nature are capitalised and expenses of Revenue nature are charged to the Statement of Profit and Loss, as and when incurred.
u. Taxes on Income
Provision for current tax is made as per the provisions of the Income Tax Act, 1961. Deferred Ta x Liabilit y/Asset resulting from ‘timing dif ference’ between book profit and taxable profit is accounted for considering the tax rate and laws that have been enacted or substantively enacted as on the Balance Sheet date. Deferred Tax Asset is recognized and carried forward only to the extent that there is reasonable certainty that the asset will be realized in future.
v. Borrowing Costs
Borrowing Cost specifically identified to the acquisition or construction of qualifying assets is capitalized as part of such assets. A qualifying asset is one that necessarily takes substantial period of time to get ready for intended use. All other borrowing costs are charged to the Statement of Profit and Loss.
w. Rig Days Costs
Rig movement costs are booked to the next location drilled/planned for drilling. Abnormal Rig days’ costs are considered as unallocable and charged to the Statement of Profit and Loss.
x. Unamortised Expenditure
Dry docking charges of Rigs/ Multipurpose Supply Vessels (MSVs), Geo Technical Vessels (GTVs), Well Stimulation Vessels, Of fshore Supply Vessels (OSVs), Rig/equipment mobilization expenses and other related expenditure is amortized over the period of use not exceeding five years and the balance is carried under head “Unamortized Expenditure" in the Balance Sheet.
y. Provisions, Contingent Liabilities and Contingent Assets
Provisions involving substantial degree of estimation in measurement are recognized when there is a present obligation as a result of past events and it is probable that there will be an out flow of resources embodying economic benefits. Contingent Assets are neither recognized nor disclosed in the financial statements. Contingent liabilities are disclosed by way of notes to account.
z. Earnings per Share
Basic earnings per share are computed by
dividing the net profit af ter tax by the weighted
average number of equity shares outstanding

Annual Report 2014-15
Standalone Financial Statement
216
during the period. Diluted earnings per share is
computed by dividing the profit af ter tax by the
weighted average number of equity shares
considered for deriving basic earnings per share
and also the weighted average number of
equity shares that could have been issued
upon conversion of all dilutive potential equity
shares.
aa. Cash Flow Statement
Cash flows are reported using the indirect method, where by profit before tax is adjusted for the ef fects of transactions of a non-cash nature, any deferrals or accruals of past or future operating cash receipts or payments and item of income or expenses associated with investing or financing cash flows. The cash flows from operating, investing and financing activities of the Company are segregated.
As atst31 March, 2015
As atst31 March, 2014
(` in million)3. Share Capital
Authorised:
30,000,000,000 Equity Shares of 5 each 150,000.00 150,000.00
(Previous Year 30,000,000,000 Equity Shares of ` 5 each)
Issued and Subscribed:8,555,528,064 Equity Shares of 5 each 42,777.64 42,777.64( Previous Year 8,555,528,064 Equity Shares of ` 5 each)
Paid up :
8,555,490,120 Equity Shares of ` 5 each 42,777.45 42,777.45
(Previous Year 8,555,490,120 Equity Shares of ` 5 each)
Add: Shares for feited 0.15 0.15
TOTAL 42,777.60 42,777.60
`
`
3.1 Reconciliation of the equity shares outstanding at the beginning and at the end of the reporting period
Outstanding at the beginning of the year 8,555.49 42,777.45 8,555.49 42,777.45Changes during the year - - - -Outstanding at the end of the year 8,555.49 42,777.45 8,555.49 42,777.45
stAs at 31 March, 2015 stAs at 31 March, 2014No. in million
No. in million
` in million
` in million
Particulars
3.2 Terms/rights attached to equity shares
The company has only one class of equity shares having a par value of 5 per share. Each holder of equity shares is entitled to one vote per share. The dividend proposed by the Board of Directors is subject to the approval of the shareholders in the ensuing Annual General Meeting.
In the event of liquidation of the company, the holders of equity shares will be entitled to receive remaining assets of the company, af ter distribution of all preferential amounts. The distribution will be in proportion to the number of equity shares held by the shareholders.
3.3 Details of shareholders holding more than 5% shares in the company are as under:-
President of India 5897.76 68.94 5897.76 68.94
Life Insurance Corporation of India 677.18 7.92 666.70 7.79
Indian Oil Corporation Limited 657.92 7.69 657.92 7.69
As at March, 2015st 31 As at March, 2014st 31
No. in million
No. in million
%holding
%holding
Name of the Share Holders
Particulars

Standalone Financial Statement
217
3.4 Pursuant to the approval of the members dated 28.01.2011, during the financial year 2010-11, one equity share having face value of `10/- each had been sub-divided into two equity shares of `5/- each and bonus shares in proportion of one new equity bonus share of `5/- each for every one fully paid up equity share of `5/- each held on
09.02.2011 (record date) had been allot ted. The company has issued total 4,277.75 million equity shares of face value of 5 each issued as fully paid up by way of bonus shares during the period of five years immediately preceding the reporting date.
3.5 Shares reserved for issue under option: Nil (previous year nil)
4. Reserves and Surplus
Capital Reserve (Note-4.1)
As per last Balance Sheet 159.44 159.44
Deferred Government Grant (Note-2.c) a) As per last Balance Sheet 24.66 27.53 b) Less: Deduction during the year* 14.17 10.49 2.87 24.66
General Reserve a) As per last Balance Sheet 1,324,288.35 1,201,567.67
Less: Depeciation Adjusted against reserves (net of deferred tax) (Note 12.5) 1,022.20 -
b) Less: Impairment loss (net of deferred tax) - 3,143.02
c) Add: Transferred from Surplus 79,796.07 1,403,062.22 125,863.70 1,324,288.35
Surplusa) As per last Balance Sheet - - b) Add: Profit af ter Tax for the year 177,329.54 220,948.07 c) Less: Proposed Dividend (Note 4.2) 4,277.75 2,138.87 d) Less: Interim Dividend 76,999.44 79,138.31 e) Less: Tax on Dividend 16,256.28 13,807.19 f) Less: Transferred to General Reserve 79,796.07 - 125,863.70 -
TOTAL 1,403,232.15 1,324,472.45
As at st31 March, 2015
As at st31 March, 2014
Particulars
* Represents the amount equivalent to depreciation transferred to the Statement of Profit and Loss.
4.1 Represents assessed value of assets received as gif t.
4.2 The Board of Directors has recommended a final dividend of 0.50 per share (previous year 0.25 per share) which is subject to the approval of the shareholders in the ensuing Annual General Meeting over and above the interim dividend of 9.00 per share (Previous year 9.25 per share).
` `
` `
(` in million)

Annual Report 2014-15
Standalone Financial Statement
218
(` in million)
5. Deferred Tax Liabilities (Net)
As atst31 March, 2015
As atst31 March, 2014
(i) Liabilities Depletion of Producing Properties 228,520.78 218,766.58 Depreciation Allocated to Wells in Progress and 21,984.40 23,002.57 expenses relating to NELP blocks Unamortised Expenditure writ ten of f 3,385.09 3,718.06 Development Wells-in-Progress 11,103.75 10,052.58 Others 12,511.65 7,300.79 Total (i) 277,505.67 262,840.58
(ii) AssetsDepreciation 14,670.18 19,978.75Exploratory wells writ ten of f 29,079.78 18,340.46Provision for Non Moving Inventories 1,762.13 1,876.75Provision for Doubtful Debts/Claims/Advances/Interest Accrued 4,858.02 4,270.17Provision for Abandonment 34,364.43 38,633.84Provision towards Additional Profit Petroleum & interest thereon 3,638.61 3,426.45Provisions unpaid u/s 43B of Income Tax Act, 1961 1,735.81 766.87Others 10,065.17 9,760.51Total (ii) 100,174.13 97,053.80DEFERRED TAX LIABILITY (Net) (i - ii) 177,331.54 165,786.78
Disclosure under Accounting Standard-22 on 'Accounting for Taxes on Income' is as under:
(` in million)
(` in million)
6. Other Long term Liabilities
7. Long Term Provisions
As atst31 March, 2015
As atst31 March, 2015
As atst31 March, 2014
As atst31 March, 2014
Trade payables
- Outstanding dues to other than Micro & Small Enterprises 720.24 998.01
Others
- Deposits from Suppliers and Contractors 252.34 31.23
- Liability for Capital Goods 94.62 88.60
- Liquidated Damages deducted 9,538.19 9,904.05
- Other Liabilities 683.46 757.20
TOTAL 11,288.85 11,779.09
Provision for Employee benefits (Note 37.1.1)
Post Retirement Medical & Terminal Benefits 26,421.00 23,329.52
Long Service Reward (Note 37.1.6.b) - 5,207.47
Gratuity for Contingent Employees (Note 37.9) 73.44 71.08
Provision for Abandonment (Note 43) 227,137.68 228,022.08
Provision for Others (Note 43) 801.67 640.57
TOTAL 254,433.79 257,270.72
Particulars
Particulars
Particulars

Standalone Financial Statement
219
(` in million)
(` in million)
8. Short Term borrowings
As atst31 March, 2015
As atst31 March, 2014
SecuredShort Term Loans from Banks (Note-8.1) 13,930.00 - (Repayble on demand)TOTAL 13,930.00 -
10.1 No amount is due for deposit in Investor Education and Protection Fund.
Particulars
(` in million)10. Other current liabilities
As atst31 March, 2015
As atst31 March, 2014
Interest Accrued but not due on Loans 3.59 - Advance from Customers 512.09 26,202.83 Unclaimed Dividend (Note-10.1) 247.24 242.01 Liability for Capital Goods 17,161.04 18,926.10 Liability for Statutory Payments 28,414.46 17,395.01 Deposits from Suppliers and Contractors 2,984.65 6,914.34 Liability for Employees 5,804.80 9,414.76 Liability for Post Retirement Benefit Scheme 1,125.95 1,142.43 Cash call payable to JV Partners 18,527.83 9,927.26 Liquidated damages deducted 8,110.86 10,666.22 Other Liabilities 20,045.56 18,426.49
TOTAL 102,938.07 119,257.45
Particulars
(` in million)11. Short Term provisions
As atst31 March, 2015
As atst31 March, 2014
Particulars
Provision for Employees Benefits (Note-37.1.1)Unavailed Leave (Note-37.1.2 & 37.1.3) 4,123.49 2,566.68Post Retirement Medical & Terminal Benefits 1,630.27 1,445.70Long Service Reward (Note 37.1.6.b) - 646.86 Gratuity for Contingent Employees (Note 37.9) 5.28 4.20
Provision for Abandonment (Note-43) 405.93 417.11
Provision for income tax net of Advance tax and TDS 8,565.20 -
Provision for Others
Proposed Dividend 4,277.75 2,138.87 Tax on Proposed Dividend 870.85 363.50 Provision for Wealth tax 115.16 126.00 Less: Paid 65.17 49.99 58.82 67.18 Other Provisions (Note-43) 47.02 165.29 TOTAL 19,975.78 7,815.39
8.1 Secured against 17,340 million of principal amount of Term deposit receipt.
9 Trade Payables
As atst31 March, 2015
As atst31 March, 2014
- Outstanding dues to Micro & Small Enterprises (Note - 47) 74.99 81.44
- Outstanding dues to other than Micro & Small Enterprises 54,816.04 63,643.37
TOTAL 54,891.03 63,724.81
Particulars

Annual Report 2014-15
Standalone Financial Statement
220
12.
Tan
gib
le A
sse
ts
Land
Fre
ehol
d 4
,256
.66
459
.85
46.
41
4,6
70.1
0 -
-
-
-
-
-
-
-
-
4
,670
.10
4,2
56.6
6
Land
Lea
seho
ld 5
,780
.76
16.
36
2.4
7 5
,794
.65
628
.19
124
.46
0.7
6 7
51.8
9 -
-
-
-
-
5
,042
.76
5,1
52.5
7
Bui
ldin
g &
Bun
k H
ouse
s 2
2,64
1.04
2
,340
.08
(66
0.95
) 2
5,64
2.07
9
,882
.47
2,7
42.0
3 (
330.
19)
12,
954.
69
125
.84
1.2
7 -
-
1
27.1
1 1
2,56
0.27
1
2,63
2.73
Pla
nt &
Equ
ipm
ent
1,0
25,3
53.8
1 6
1,52
1.20
6
,773
.66
1,0
80,1
01.3
5 7
51,2
61.9
1 4
8,33
1.20
5
,349
.78
794
,243
.33
1,9
27.1
8 1
7.68
1
.01
-
1,9
43.8
5 2
83,9
14.1
7 2
72,1
64.7
2
Furn
itur
es &
Fix
ture
s 6
,974
.78
801
.39
323
.43
7,4
52.7
4 4
,537
.82
1,0
38.2
4 1
36.0
0 5
,440
.06
12.
29
1.5
4 0
.05
-
13.
78
1,9
98.9
0 2
,424
.67
Veh
icle
s#
7,31
4.72
2
,691
.18
477
.84
9,5
28.0
6 4
,300
.58
1,0
43.2
6 4
49.7
2 4
,894
.12
10.
25
-
-
-
10.
25
4,6
23.6
9 3
,003
.89
Off
ice
Equi
pmen
t 6
,364
.84
968
.30
561
.68
6,7
71.4
6 3
,686
.76
1,7
24.0
8 6
2.23
5
,348
.61
21.
43
2.4
1 2
.34
-
21.
50
1,4
01.3
5 2
,656
.65
Tota
l
1,07
8,68
6.61
6
8,79
8.36
7
,524
.54
1,1
39,9
60.4
3 7
74,2
97.7
3 5
5,00
3.27
5
,668
.30
823
,632
.70
2,0
96.9
9 2
2.90
3
.40
-
2,1
16.4
9 3
14,2
11.2
4 3
02,2
91.8
9
Pre
viou
s Y
ear
963
,840
.67
118
,359
.55
3,5
13.6
1 1
,078
,686
.61
687
,737
.04
89,
901.
03
3,3
40.3
4 7
74,2
97.7
3 2
,066
.83
78.
43
8.2
2 4
0.05
2
,096
.99
302
,291
.89
Sha
re in
Joi
nt V
entu
res
74,
089.
54
12,
833.
45
2,5
96.3
6 8
4,32
6.63
5
4,51
1.51
4
,391
.56
2,5
42.1
7 5
6,36
0.90
8
21.7
3 -
-
-
8
21.7
3 2
7,14
4.00
1
8,75
6.30
Pre
viou
s Y
ear
67,
697.
26
6,4
21.5
2 2
9.24
7
4,08
9.54
4
8,77
5.46
5
,749
.19
13.
14
54,
511.
51
797
.53
24.
20
-
-
821
.73
18,
756.
30
Des
crip
tion
st
At
1
Apr
il, 2
014
st
At
1
Apr
il, 2
014
st
At
1
Apr
il, 2
014
For
the
year
For
the
year
Writ
ten
back
/Ad
just
men
ts
Recl
assi
ficat
ion/
Adju
stm
ents
Add
itio
ns
Gro
ss B
lock
Acc
umul
ated
Dep
recl
atio
nA
ccum
ulat
ed I
mpa
irm
ent
Net
Blo
ck
Del
etio
n/A
djus
tmen
tsD
elet
ion/
Adj
ustm
ents
st
At
31
Mar
ch, 2
015
st
At
31
Mar
ch, 2
015
st
At 3
1M
arch
, 201
5
st
At
31
Mar
ch, 2
015
st
At
31M
arch
, 201
4
# V
ehic
les
incl
udes
Sur
vey
Shi
ps,
Cre
w B
oats
and
Hel
icop
ters
. V
ehic
les
also
inc
lude
cos
t of
20
(Pre
viou
s ye
ar 1
0) I
mm
edia
te s
uppo
rt v
esse
ls (
ISV
) am
ount
ing
to
2,59
5.16
mill
ion
(Pre
viou
s ye
ar
1079
.50
mill
ion)
han
ded
over
for o
pera
tion
by In
dian
Nav
y fo
r sec
urit
y of
the
offs
hore
inst
alla
tion.
Not
es12
.1La
nd in
clud
es la
nds
in r
espe
ct o
f ce
rtai
n pr
ojec
ts f
or w
hich
exe
cutio
n of
leas
e/co
nvey
ance
dee
ds a
re in
pro
cess
.12
.2R
egis
trat
ion
of ti
tle d
eeds
in r
espe
ct o
f ce
rtai
n B
uild
ings
is p
endi
ng e
xecu
tion.
12.3
Dep
reci
atio
n fo
r th
e ye
ar in
clud
es
-0.0
4 m
illio
n pe
rtai
ning
to p
rior
perio
d (P
revi
ous
Year
48
.02
mill
ion)
.12
.4B
uild
ing
incl
udes
cos
t of
undi
vide
d in
tere
st in
land
.st
12.5
Pur
suan
t to
the
enac
tmen
t of t
he C
ompa
nies
Act
, 201
3 th
e co
mpa
ny h
as, e
ffec
tive
from
1 A
pril,
201
4, r
evis
ed th
e es
timat
ed u
sefu
l life
of i
ts fi
xed
asse
ts g
ener
ally
in a
ccor
danc
e w
ith
Sch
edul
e-II
to
the
Com
pani
es A
ct, 2
013.
Acc
ordi
ngly
, an
amou
nt o
f 1,
548.
55 m
illio
n ha
s be
en r
educ
ed fr
om th
e ac
cum
ulat
ed d
epre
ciat
ion
and ₹1
022.
20 m
illio
n ha
s be
en a
djus
ted
in th
e op
enin
g ba
lanc
e of
re
tain
ed e
arni
ngs
and ₹5
26.3
5 m
illio
n ad
just
ed a
gain
st d
efer
red
tax
in r
espe
ct o
f ass
ets
who
se u
sefu
l life
has
exh
aust
ed a
s at
Apr
il 1,
201
4. T
he im
pact
of c
hang
e in
use
ful l
ives
as
abov
e on
the
stat
emen
t of p
rofi
t and
loss
is n
ot a
scer
tain
able
due
to c
ompl
exit
y of
allo
catio
n of
cos
t as
men
tione
d at
not
e no
.2. n
.4.
``
``
`
(` in
millio
n)

Standalone Financial Statement
221
13. Producing Properties
Gross Cost Opening Balance (Note 13.2) 1,365,455.52 1,146,652.17 Transfer from Exploratory Wells-in-Progress 10,189.11 8,950.30 Transfer from Development Wells-in-Progress 68,439.05 92,576.75 Depreciation on Facilities 33,475.86 64,756.79 Increase/(Decrease) in estimated Abandonment costs (3,624.27) 52,578.56 Other Adjustments (Note 13.3) (6,031.50) 1,467,903.77 (59.05) 1,365,455.52
Less: Depletion & Impairment Depletion Opening Balance 704,025.21 618,948.25 Depletion for the year (Note 13.1, 32 & 35) 97,651.46 85,076.96 Other Adjustments (Note 13.3) (5,676.86) 795,999.81 - 704,025.21
Impairment
Opening Balance 3,597.67 3,296.81
Impairment provided during the year 1,386.05 417.20
Write back of Impairment (190.05) 4,793.67 (116.34) 3,597.67
NET PRODUCING PROPERTIES 667,110.29 657,832.64
As at st31 March, 2015
As at st31 March, 2014
Particulars
13.1 During the previous year 2013-14, PMT JV had downgraded reserves for the Mid and South Tapti fields due to geological surprises. As a result, the production profile is envisaged only up to 2015-16 and the sale realization (net of operating expenses and statutory levies) is being transferred to Site Restoration Fund pursuant to the Production Sharing Contract. Under these circumstances, the field has been fully depleted and depletion aggregating to 184.69 million (Previous year 9,090.44 million) has been charged to the
Statement of Profit and Loss. Similarly, as at March 31, 2015, the provision for impairment of 263.62 million (Previous year 441.87 million) representing the net asset value and Capital Work in Progress in Tapti field has been carried in the financial statements.
13.2 In respect of Ratna R series field, a producing field of the company, MOPNG had during 1995-96, issued an award of the contract for development of the field
``
``
to a consortium of Essar Oil Limited and Premier Oil limited consequent to which the company stopped production. Pending the execution of the Production Sharing Contract, the company continues to include 2,313.96 million in gross producing property
(including provision for abandonment of 891.74 million.) The said field has been fully impaired and the net carrying amount as at March 31, 2015 is Nil.
13.3 Other adjustment includes an amount of 4,196.00 million which Government of India (GoI) vide let ter
stdated 1 January, 2015, has reimbursed as compensation for past costs incurred by ONGC in certain discovered fields awarded to Joint Ventures/ Private Companies. Accordingly an amount of 257.17 million has been adjusted against the Net
Carrying Amount of assets of Panna, Mukta, Tapti and Ravva fields and balance amount of 3,938.83 million has been accounted for as other income during the year.
``
`
`
`
(` in million)

Annual Report 2014-15
Standalone Financial Statement
222
14. Intangible Assets
As at st31 March, 2015
As at st31 March, 2014
As at st31 March, 2014
Share in Joint Venture
As at st31 March, 2015
Application Software
Gross BlockOpening Balance 6,357.79 6,300.68 99.96 92.76 Additions during the year 504.35 112.03 8.66 7.20 Deletions/Adjustments 97.32 54.92 1.45 - Closing Balance 6,764.82 6,357.79 107.17 99.96 AmortisationOpening Balance 5,834.91 5,480.46 54.93 38.29 Provided during the year 308.52 409.37 20.62 16.64 Deletions/Adjustments 96.95 54.92 1.08 - Closing Balance 6,046.48 5,834.91 74.47 54.93 ImpairmentOpening Balance 22.27 22.27 - - Provided during the year 0.03 - - - Closing Balance 22.30 22.27 - -
Net Block as at the year end 696.04 500.61 32.70 45.03
15. Capital Works-In-Progress
Acquisition Costs-E&P Asset 28.59 28.59
Buildings 5,665.95 4,605.30 Plant and Equipment (Note-15.1) 119,545.11 106,608.89 Capital Stores (including in transit) 3,953.76 7,686.30 Less: Provision for Non-Moving Items 87.00 129,077.82 77.51 118,822.98
Less: ImpairmentOpening Balance 2,401.23 2,331.14 Provided during the year 164.52 686.78 Other adjustments (Note -34) (354.09) - Write back of Impairment (11.83) 2,199.83 (616.69) 2,401.23
NET CAPITAL WORKS-IN-PROGRESS 126,906.58 116,450.34
As at st31 March, 2015
As at st31 March, 2014
Particulars
(` in million)
(` in million)
15.1 Plant and Equipment includes an amount of 8,448.52 million (Previous Year 8,436.64 million) in respect of Capital Works in Progress (CWIP) for C2-C3 plant (including C3-C4 blending and recycling facilities) which is mechanically complete and will be capitalized on completion of test run.
` `

Standalone Financial Statement
223
16. Exploratory/Development Wells in Progress
A) EXPLORATORY WELLS-IN-PROGRESSGross CostOpening Balance 133,955.37 86,489.94 Expenditure during the year 111,701.28 116,872.08 Less: Sale proceeds of Oil and Gas
{(Net of levies `49.19 million)
(Previous year `148.65 million)} 547.85 111,153.43 470.54 116,401.54
Depreciation during the year (Note no. 32) 3,284.45 2,506.44 248,393.25 - 205,397.92
Less :Transfer to Producing Properties 10,189.11 8,950.30 Wells writ ten of f during the year 88,137.36 62,508.91 Other adjustments 2,638.80 100,965.27 (16.66) 71,442.55
147,427.98 133,955.37
Less: Provisions (Note-16.1)/Impairment (Note-42.6)Opening Balance 24,518.71 17,169.79 Provided during the year 1,177.50 7,348.92 Write back during the year (1,203.23) 24,492.98 - 24,518.71
Exploratory Wells-In-Progress (A) 122,935.00 109,436.66
B) DEVELOPMENT WELLS-IN-PROGRESSOpening Balance 30,303.45 35,820.64 Expenditure during the year 71,963.72 85,188.40 Depreciation during the year (Note no. 32) 3,297.72 1,871.16 Less: Transfer to Producing Properties 68,439.05 37,125.84 92,576.75 30,303.45
Less: ImpairmentOpening Balance 612.52 382.05 Provided during the year 563.03 264.47 Write back during the year - 1,175.55 (34.00) 612.52
DEVELOPMENT WELLS-IN-PROGRESS (B) 35,950.29 29,690.93 EXPLORATORY/DEVELOPMENT
WELLS-IN-PROGRESS (A+B) 158,885.29 139,127.59
As at st31 March, 2015
As at st31 March, 2014
Particulars
(` in million)
16.1 During the Financial year 2004-05, the company had acquired 90% Par ticipating Interest in Exploration Block KG-DWN-98/2 from M/s Cairn Energy India Ltd. for a lump sum consideration of `3,711.22 million which, together with subsequent exploratory drilling costs of wells had been capitalised under exploratory wells in progress. During the financial year 2012-13, the company had acquired the remaining 10% participating interest in the block from M/s Cairn Energy India Ltd. on actual past cost basis for a consideration of 2,124.44 million. Initial in-place reserves have
been established in this block and adhering to `
original PSC time lines, a Declaration of Commerciality (DoC) with a conceptual cluster development plan was submit ted on 21.12.2009 for Southern Discovery Area and on 15.07.2010 for Northern Discovery Area. Thereaf ter, in the revised DoC submit ted in December, 2013, Cluster wise development of the Block had been envisaged by division of entire development area into three clusters. The DoC in respect of Cluster II has been reviewed by the Management Commit tee (MC) of the block on 25.09.2014 and preparation of Field Development Plan (FDP) in progress. The review of DOC in respect of Cluster I

Annual Report 2014-15
Standalone Financial Statement
224
and Cluster III by the MC is pending as on st31 March, 2015.
The exploration period of this block had been restructured by Government up to 29.12.2013 in accordance with the Rig Holiday Policy and further extended to 25.1.2014. Under the New Policy guidelines in this regard, the Government has permit ted the contractor to under take appraisal drilling, seismic API and related activities
till submission of FDP which is currently underway and drilling of two appraisal wells is in progress.Pending approval of FDP by the MC in respect of Cluster II and review of DoC by the MC in respect of Cluster I and III, as a matter of abundant caution, the company has retained the provision of 17,216.18 million (Previous Year 17,210.82
million) towards acquisition costs and cost of exploratory wells.
` `
A. TRADE INVESTMENTS
Investment in Equity Instruments
(i) Investment in Subsidiaries
(a) ONGC Videsh Limited-(Unquoted) 1,000,000,000 100 100,000.00 100,000.00(Note 17.4) (1,000,000,000)
(b) Mangalore Refinery and 1,255,354,097 10 10,405.73 10,405.73Petrochemicals Limited (Quoted) (1,255,354,097)
(c) ONGC Mangalore Petrochemicals Limited (unquoted) (Note- 17.1) 920,000,000 10 9,200.00 119,605.73 - 110,405.73
-
(ii) Investment in Associate
(a) Pawan Hans Limited (formerly 120,350 10,000 1,203.50 1,203.50known as "Pawan Hans Helicopter Ltd") (Unquoted)
Ex tent of holding 49% (120,350)(previous year 49%)
(iii) Investment in Joint Venture Companies Unquoted
(a) Petronet MHB Limited. 157,841,000 10 1,578.41 1,578.41(157,841,000)
(b) Mangalore SEZ Limited. 13,000,000 10 130.00 130.00
(13,000,000)(c) ONGC Mangalore Petrochemicals - 10 - 0.23
Limited (Note-17.1)(23,000)
(d) ONGC Petro Additions Limited 997,955,639 10 9,979.55 9,979.55(Note-17.2) (997,955,639)
(e) ONGC Teri Biotech Limited 24,990 10 0.25 0.25(24,990)
(f) ONGC Tripura Power Company 267,489,998 10 2,674.90 2,674.90Limited (Note-17.2) (267,489,998)
17. Non-Current Investments
Particulars
(` in million)
As at st31 March, 2015
As at st 31 March, 2014
No. of Fully Paid
Shares/Bonds/Units
Face Valueper Share/Bond/Unit
(in `)

Standalone Financial Statement
225
(g) Dahej SEZ Limited 23,025,000 10 230.25 230.25 (23,025,000)
Quoted
Patronet LNG Limited 93,750,000 10 987.50 15,580.86 987.50 15,581.09
(93,750,000)
(iv) Investment in Others
(a) Indian Oil Corporation Limited- 334,303,814 10 40,427.97 40,427.97
(Quoted) (334,303,814)
(b) GAIL (India) Limited (Quoted) 61,259,323 10 2,451.06 2,451.06
(61,259,323)
(c) Oil Spill Response Limited 100 0.01 0.01
(Unquoted) (Note-17.3) (100)
42,879.04 42,879.04
Total (A) 179,269.13 170,069.36
B. NON-TRADE INVESTMENTS
Investment in Government or 197,370 10,000 1,973.70 1,973.70
Trust Securities (Unquoted) (197,370)
8.40% GoI Special Bonds 2025
Total (B) 1,973.70 1,973.70
Total Non-current Investment (A+B) 181,242.83 172,043.06
Total Quoted Investments 54,272.26 54,272.26
Total Unquoted Investments 126,970.57 117,770.80
181,242.83 172,043.06
Total Market Value of Quoted Investment 247,691.15 189,917.38
Particulars
(` in million)
As at 31st March, 2015
As at st 31 March, 2014
No. of Fully Paid
Shares/Bonds/Units
Face Valueper Share/Bond/Unit
(in `)
th17.1 With ef fect from 28 February, 2015, ONGC Mangalore Petrochemicals Limited has become subsidiary (previous
year Joint venture) of ONGC on account of direct holding of 48.99% (previous year 46%) and indirect holding of
51.00% (previous year 3%) stake through subsidiary company MRPL.
17.2 The Company is restrained from diluting the investment in the respective companies till the sponsored loans are
fully repaid as per the covenants in the loan agreements.
17.3 Shares of Oil Spill response limited valued at GBP one each at the time of issuance. Total value in INR at the time of
issuance of shares was 6,885/-.
17.4 Loan to ONGC Videsh limited (wholly owned subsidiary) amounting to Nil (previous year 50,000 million) has been
converted into nil (previous year 500 million) fully paid Equity Shares of 100 each.
`
`

Annual Report 2014-15
Standalone Financial Statement
226
18. Long Term Loans and Advances
(Unsecured, considered good unless otherwise stated)
Capital Advances 1,530.90 65.39
Deposits
With Customs/Port Trusts etc. 23.24 22.96
Others
- Considered Good 3,731.49 3,251.90
- Considered Doubt ful 1,010.69 629.88
4,765.42 3,904.74
Less: Provision for Doubt ful Deposits 1,010.69 3,754.73 629.88 3,274.86
Advances to Related Party against Equity pending 12,150.88 18,834.11allotment (Note no. 39.3.1)
Loans & Advances to Subsidiaries 98,713.58 92,343.43
Loans to Public Sector Undertakings
- Considered Good - -
- Considered Doubt ful 240.50 240.50
Less : Provision for Doubt ful Loans 240.50 - 240.50 -
Loans & Advances to Associate (Secured) 33.20 367.84
Loans and Advances to Employees (Note-18.1)
- Secured and Considered Good 7,739.54 7,612.28
- Unsecured and Considered Good 501.07 502.58
- Unsecured and Considered Doubt ful 7.48 1.73
Less: Provision for Doubt ful Loans/Advances 7.48 8,240.61 1.73 8,114.86
Advance Recoverable in Cash or in kind or value to be received
- Considered Good (Note 18.3) 7,008.03 7,354.33
- Considered Doubt ful (Note-18.2) 14,931.69 13,141.40
Less: Provision for Doubt ful Claims/Advances 14,931.69 7,008.03 13,141.40 7,354.33
Cash Call Receivable from JV Partners
- Considered Good 339.52 340.27
- Considered Doubt ful 6,451.35 6,245.07
Less: Provision for Doubt ful Claims/Advances 6,451.35 339.52 6,245.07 340.27
MAT Credit Entitlement - 2,800.00
Advance Payment of Income Tax 256,636.83 329,320.26
Less: Provision for Income Tax 193,700.08 62,936.75 281,031.74 48,288.52
TOTAL 194,708.20 181,783.61
As at st 31 March, 2015
As at st 31 March, 2014
Particulars
(` in million)

Standalone Financial Statement
227
18.1 Loans and advances to employees include an
amount of `0.24 million (Previous Year `0.37
million) outstanding from Key Managerial
Personnel.
18.2 In Ravva Joint Venture, the demand towards
additional profit petroleum raised by Government
of India (GoI), due to dif ferences in interpretation
of the provisions of the Production Sharing
Contract (PSC) in respect of computation of Post
Tax Rate of Return (PTRR), based on the decision
of the Malaysian High Court set ting aside an earlier
arbitral tribunal award in favour of operator, was
disputed by the operator M/s Cairn India Ltd. The
company is not a party to the dispute but has
agreed to abide by the decision applicable to the
operator. The company had made a provision
towards the claim made by the GoI in earlier years
and the amount of provision outstanding as on th31 Mar, 2015 is `10,513.79 million (equivalent to
USD 167.84 million) af ter adjustments for interest
and exchange rate fluctuations. The GoI had
recovered the above amount [including interest
thereon USD 54.88 million (`3437.68 million)]
from the company in earlier years which has
been carried as recoverable under Long Term
Loans and advances in the Balance Sheet as at st 31 March, 2015.
In subsequent legal proceedings, the Appellate
Authority of the Honourable Malaysian High Court
of Kuala Lumpur had set aside the decision of the
Malaysian High Court and the earlier decision of
arbitral tribunal in favour of operator was restored,
against which the GoI has preferred an appeal
before the Federal Court of Malaysia. The Federal
Cour t of Malaysia, vide its order dated th11 October, 2011, has dismissed the said appeal
of the GoI.
The company has taken up the matter regarding
refund of the recoveries made in view of the
favorable judgment of the Federal Court of
Malaysia with MoP&NG. However, according to a thcommunication dated 13 January, 2012 received,
MoP&NG expressed the view that ONGC’s
proposal would be examined when the issue of
ONGC carry under Ravva PSC is decided in its
entirety by the Government along with other
partners.
In view of the perceived uncertainties in obtaining
the refund at this stage, the provision made in the
books as above has been retained and netted of f
against the amount recoverable as above in the stfinancial statements for the year ending 31 Mar
2015. (Figures in INR are reinstated).
18.3 During the financial year 2010-11, the Oil
Marketing Companies, nominees of the GoI
recovered USD 32.07 million (`2,009.02 million)
ONGC’s share as per directives of GoI in respect of
Jointly Controlled Assets-Panna Mukta and Tapti.
The recovery is towards certain observations
raised by auditors appointed by the Director
General of Hydrocarbons (DGH) under Production
Sharing Contract (PSC) for the period 2002-03 to
2005-06 in respect of cost and profit petroleum
share payable to GoI. BGEPIL along with RIL
(“Claimants”) have served a notice of arbitration
on the GoI in respect of dispute, dif ferences and
claims arisen in connection with the term of Panna,
Mukta and Tapti PSCs. Since the company is not a
party to the arbitration proceedings, it had
requested MoP&NG that in case of an arbitral
award the same be made applicable to ONGC
also, as a constituent of contractor for both the
PSCs. Subsequently, vide let ter dated July 4, 2011
MoP&NG has advised ONGC not to par ticipate in
the arbitration initiated by RIL and BGEPIL under
Panna Mukta and Tapti PSCs. MoP&NG has also
stated that in case of an arbitral award, the same
will be applicable to ONGC also as a constituent of
the contractor for both the PSCs. Pending final
arbitral award, the same has been shown as
Receivable from GoI under ‘Advance Recoverable
in Cash or Kind or Value to be Received’ under
Long Term Loans and Advances. (Figures in INR
are reinstated).
19. Deposit under Site Restoration Fund Scheme:
A sum of `125,443.80 million till 31.03.2015
(previous year `113,101.59 million) has been
deposited with banks under section 33ABA of the
Income Tax Act, 1961 and can be withdrawn only
for the purposes specified in the Scheme i.e.
towards removal of equipments and installations in
a manner agreed with Central Government
pursuant to an abandonment plan to prevent
hazards to life, property, environment etc. This
amount is considered as restricted cash and
hence not considered as ‘cash and cash
equivalents’.

Annual Report 2014-15
Standalone Financial Statement
228
21. Inventories*
Raw Materials (Condensate) 4.92 4.61
Finished Goods (Note 21.1) 8,670.87 6,997.45
Traded Goods 1.48 0.61
Stores and spare parts
- on hand 52,760.63 51,995.52
- in transit (including inter-project transfers) 3,042.53 5,111.51
55,803.16 57,107.03
Less: Provision for non-moving items 5,004.68 50,798.48 5,411.10 51,695.93
Unserviceable Items 159.52 126.81
TOTAL 59,635.27 58,825.41
As at st 31 March, 2015
As at st 31 March, 2014
20. Other Non-Current Assets
(Unsecured, Considered Good unless otherwise stated)
A. Long Term Trade Receivables
- Considered Good 1,239.98 863.62
- Considered Doubt ful 1,299.80 947.99
Less : Provision for doubt ful receivables 1,299.80 1,239.98 947.99 863.62
B. Other Receivables
- Considered Good 17.22 14.17
- Considered Doubt ful 516.63 521.48
Less: Provision for doubt ful receivables 516.63 17.22 521.48 14.17
C. Interest Accrued
- On Employee Loans and Advances (Secured) 2,998.57 2,951.13
On Deposits 22.76 26.40
On Other Loans & Advances
- Considered Good 118.73 100.32
- Considered Doubt ful 22.87 41.89
141.60 142.21
Less: Provision for doubt ful interest accrued 22.87 118.73 41.89 100.32
D. Unamortised Expenditure
- Dry Docking Charges 4,426.69 6,621.33
- Mobilisation Charges 1,138.05 5,564.74 742.99 7,364.32
TOTAL 9,962.00 11,319.96
As at st 31 March, 2015
As at st 31 March, 2014
(` in million)
(` in million)
* valued as per accounting "policy no.l"
21.1 This includes an amount of `7.68 million (previous year `3.66 million) in respect of Carbon Credits.
Particulars
Particulars

Standalone Financial Statement
229
(` in million)
(` in million)
22. Trade Receivables
23. Cash and Cash Equivalents
As atst31 March, 2015
As atst31 March, 2015
As atst31 March, 2014
As atst31 March, 2014
(Unsecured, Considered Good unless otherwise stated)
- Outstanding for a period exceeding six months from the due date 10,138.23 3,396.05 - Others 125,644.51 78,260.65
TOTAL 135,782.74 81,656.70
Balances with Banks 2,269.61 1,388.09Cash on Hand 6.73 6.27Short Term Investment in Mutual Funds - 12,052.40 Bank Deposits (Note-23.1 & 8.1) 25,077.10 94,300.00Unclaimed Dividend Account (Note-23.2) 247.24 242.01
TOTAL 27,600.68 107,988.77
23.1 The deposits maintained by the company with banks comprise time deposit, which can be withdrawn by the company at any point without prior notice or penalty on the principal.
23.2 Amount deposited in unclaimed dividend account is earmarked for payment of dividend and cannot be used for any other purpose.
24. Short Term Loans and Advances
(Unsecured, Considered Good unless otherwise stated)
Deposits
With Customs/Port Trusts etc. 4.45 4.49
Others (Note no. 24.1 & 31.2) 33,259.70 33,264.15 4,809.69 4,814.18
Loans to Associate (Secured) 334.64 350.45
Loans to Subsidiaries 6,857.20 6,857.20
Receivable from Subsidiaries 402.65 810.87
Loans and Advances to Employees (Note 24.2)
Secured and Considered good 2,036.42 2,030.47
Unsecured and Considered good 399.60 2,436.02 473.78 2,504.25
Cash Call Receivable from JV Partners 7,809.49 8,389.09Advance Recoverable in Cash or in kind or value to be received 18,372.62 19,943.56
TOTAL 69,476.77 43,669.60
As atst31 March, 2015
As atst31 March, 2014
(` in million)
24.1 Includes 21,067.60 million (Previous year 2,092.23 million) towards dif ferential royalty being deposited from st1 February, 2014 as per the interim order of the Hon'ble Supreme Court of India. (also refer Note no. 44.1.1.b)
24.2 Includes an amount of 0.13 million (Previous Year 0.13 million) outstanding from Key Managerial Personnel.
` `
` `
Particulars
Particulars
Particulars

Annual Report 2014-15
Standalone Financial Statement
230
25. Other Current Assets
26. Revenue From Operations
Secured, considered good
Interest accrued on Employee Loans and Advances 296.61 246.15
Unsecured, considered good
Interest Accrued
- On Investments 1.38 1.38
- On Deposits 1,406.36 1,270.20
- On Loans & Advances 14.19 1,421.93 24.92 1,296.50
Unamortised Expenditure
- Dry Docking Charges 3,581.16 2,933.68
- Mobilisation Charges 635.33 4,216.49 640.69 3,574.37
Other Current Assets * 3,202.05 1,175.50
TOTAL 9,137.08 6,292.52
A. Sale of Products
Own Products 856,872.65 873,702.43
Less: Transfer to Wells in progress {includes levies of `49.19 million (Previous year `148.65 million)} 597.04 522.58
Less: Government of India's (GoI's) share in Profit Petroleum 32,847.82 38,526.99
823,427.79 834,652.86
Traded Products 60.08 823,487.87 44.42 834,697.28
B. Other Operating Revenue
Contractual Short Lif ted Gas Receipts (Note 26.4) 224.15 80.21
Pipeline Transportation Receipts 697.77 691.61
North-East Gas Subsidy (Note 26.5) 2,702.83 2,366.91
Surplus from Gas Pool Account (Note 26.6) 3,267.04 3,720.47
Production Bonus 109.03 57.29
Processing Charges 445.98 7,446.80 414.03 7,330.52
TOTAL 830,934.67 842,027.80
As at st31 March, 2015
2014-15
As at st31 March, 2014
2013-14
(` in million)
(` in million)
*Includes receivable of 532.02 million (Previous Year 442.80 million) from Gratuity Trust as funded status is more than obligation.
Particulars
Particulars

Standalone Financial Statement
231
26.2 For Crude Oil produced in Assam, sales revenue is based on the pricing formula provided by MoP&NG. Revenue from rest of nominated crude is accounted in terms of Crude Oil Sales Agreements (COSAs) already signed and made ef fective from
st1 April, 2010.
26.3 During the previous year, based on the directives issued by MoP&NG and Petroleum Planning and
stAnalysis Cell (PPAC) vide let ters dated 31 May, st2012 and 1 June, 2012 respectively, w.e.f. 1st April,
2012, refineries started making deductions from ONGC payments towards Octroi/ VAT/ CST on discounts allowed by ONGC to refineries on supplies of crude oil. Total deduction made by
st threfineries on this account from 1 April, 2012 to 30 September, 2013 amounting to 25,032.60 million (includes 15,846.70 million for the year 2012-13) was provided for. The company had revised the sales revenue and corresponding statutory levies
stw.e.f. 1 April 2012 onwards, considering deductions made by refineries based on MoP&NG directives.
thAforesaid provision made by the Company till 30 September, 2013 had also been writ ten back.
26.4 Recognition of revenue on account of Short Lif ted Gas amounting to 1,774.13 million (Previous Year 1,253.74 million) has been postponed. This will be
recognized when there is reasonable certainty regarding ultimate collection as per the policy of the company.
26.5 Sales revenue of Natural Gas is based on gas price fixed by GoI from time to time. Till October’14, sales
strevenue is based on MoP&NG order dated 31 stMay’10 wherein ef fective from 1 June’10, the price
of APM gas produced by NOCs was fixed at US$ 4.2/mmbtu less royalty (on NCV basis). On
``
``
th25 October’14, GoI notified “New Domestic Natural Gas Pricing Guidelines, 2014” applicable
stfrom 1 November’14. Under said guidelines, price of domestic gas produced in India during
st st1 November’14 to 31 March’15 has been fixed as US$ 5.05/mmbtu (on GCV basis). For gas consumers in North-East, consumer price is 60% of the producer price and the dif ference between producer price and consumer price is paid to the company through GoI Budget and shown as ‘North-East Gas Subsidy’.
26.6 The company is supplying majority of Natural gas to Gas Authority of India Limited (GAIL) which also purchases gas from other sources and sells to APM and non-APM consumers. Based on the Government directives, excess in Gas Pool Account at the end of financial year is transferred to ONGC/ OIL in accordance with their contribution. Based on the details received from GAIL, an amount of 2,292.30 million (Previous year 3,508.10 million) for Gas Pool Receipts for the
current year and 974.74 million (Previous year 212.37 million) on account of interest on Gas Pool
Account has been considered as ‘Surplus from Gas Pool Account’.
``
``
(` in million)
2014-15 2013-14
Gross Revenue 362,996.20 563,842.85
Less: Value Added Tax (VAT) 10,025.10 17,841.84
Sales Revenue 352,971.10 546,001.01
Less: Statutory Levies 43,374.95 68,440.26
Profit Before Tax 309,596.15 477,560.75
Decrease in
26.1 In terms of the decision of Government of India (GOI), the company has shared 362,996.20 million (Previous Year 563,842.85 million) towards under-recoveries of Oil Marketing Companies (OMCs) on price sensitive products
th thviz. Diesel (till 18 October’14), Domestic LPG and PDS Kerosene for the year 2014-15 (Nil in 4 quarter of FY 2014-15 as per GoI directives) by extending the discount in the prices of Crude Oil, Domestic LPG and PDS Kerosene based on the rates of discount communicated by Petroleum Planning and Analysis Cell (PPAC) and Ministry of Petroleum and Natural Gas (MoP&NG). The impact of discount is as under:
``

Annual Report 2014-15
Standalone Financial Statement
232
2014-15 2013-14Products
QuantityUnit QuantityValue (` in million) Value (` in million)
27 Quantitative Details of Sales Revenue
Crude Oil* MT 24,106,063 567,710.93 23,605,821 561,680.71
Less: From Exploratory areas 15,328 397.40 2,339 61.63
Less: Government of India's share in Profi t Petroleum 30,675.91 536,637.62 35,885.46 525,733.62
3Natural Gas* 000M 17,983,442 189,752.42 19,632,724 186,393.70
Less: From Exploratory areas 29,045 199.64 51,398 460.95
Less: Government of India's share in Profi t Petroleum 2,171.91 187,380.87 2,641.53 183,291.22
Liquified Petroleum Gas MT 1,090,432 34,379.87 1,073,413 30,145.14
Naphtha MT 1,124,307 50,834.86 1,378,894 75,742.79
Ethane/Propane MT 337,294 10,063.93 428,399 14,836.58
Superior Kerosene Oil MT 74,215 2,770.55 85,187 2,779.17
Low Sulphur Heavy Stock MT 18,662 704.92 28,455 1,295.06
High Speed Diesel (HSD) MT 5,638 312.00 8,369 522.43
HSD incl. ULS HSD (Trading) KL 385 21.57 54 2.95
Motor Spiri t (Trading) KL 534 38.22 542 41.06
Aviation Turbine Fuel (ATF) MT 5,325 285.72 3,301 220.03
Liquid Diesel Oil - - 26 1.70
Mineral Turpentine Oil MT 845 46.86 1,137 78.02
Others 10.88 7.51
TOTAL 823,487.87 834,697.28
* Quantity includes share from Joint Ventures as per the Participating Interest or Entitlement Interest, whichever is
applicable.

Standalone Financial Statement
233
28. Other Income
Interest on:
Long Term Investments 165.79 165.79
Deposits with Banks/PSUs 11,439.83 15,125.80
Loans and Advances to Subsidiaries and Associate 4,828.09 4,937.52
Loans and Advances to Employees 482.84 473.44
Income Tax Refund 3,371.10 2,395.49
Site Restoration Fund Deposit 10,031.12 9,432.74
Delayed Payment from Customers and Others 245.68 30,564.45 475.45 33,006.23
Dividend Income from:
Investment in Associates 37.80 11.46
Other Long Term Investments 3,641.15 2,173.11
Short Term -Debt Mutual Funds 1,210.56 4,889.51 1,559.80 3,744.37
Other Non Operating Income
Excess Provisions writ ten back (Note 26.3 & 37.1.6.b) 6,456.33 16,328.86
Liabilities no longer payable writ ten back 856.54 2,836.39
Contractual Receipts 605.31 1,310.16
Profit on sale of Investments - 23.59
Miscellaneous Receipts* (Note 13.3) 10,293.53 18,211.71 9,882.39 30,381.39
TOTAL 53,665.67 67,131.99
2014-15 2013-14
(` in million)
(` in million)29. (Increase)/Decrease in Inventories
2014-15 2013-14
Closing Stock- Finished Goods and Stock in Trade 8,672.35 6,998.06
Opening Stock- Finished Goods and Stock in Trade 6,998.06 8,040.86
(INCREASE)/DECREASE IN INVENTORIES* (1,674.29) 1,042.80
Particulars
Particulars
* includes compensation of 821.90 million towards loss of oil & gas, received from Dedicated Freight Corridor
Corporation of India (DFCCIL).
`
* includes decrease in value of crude oil stock of 623.00 million on account of Prior Period Adjustments.

Annual Report 2014-15
Standalone Financial Statement
234
As at 31.03.2015 As at 31.03.2014Particulars
QuantityUnit QuantityValue (` in million) Value (` in million)
30 Details of Opening and Closing Inventories:
Opening stock
Crude Oil* MT 1,091,633 6,554.46 977,410 7,341.29
Liquefied Petroleum Gas MT 10,230 49.39 15,529 108.60
Naphtha MT 70,545 294.70 91,829 482.04
Ethane/Propane MT 650 11.01 477 7.32
Superior Kerosene Oil MT 8,690 30.95 9,520 28.26
Aviation Turbine Fuel MT 1,775 11.83 1,204 8.60
Low Sulphur Heavy Stock MT 102 1.64 565 9.34
High Speed Diesel MT 2,463 20.55 4,286 37.95
Propane MT - - 90 0.34
Mineral Turpentine Oil MT 144 2.79 164 3.24
High Speed Diesel ** KL 10 0.48 5 0.26
Motor Spiri t** KL 1 0.13 8 0.49
Carbon Credits Units 140,277 3.66 10,508 0.56
Others 16.47 12.57
Total 6,998.06 8,040.86
Closing stock
Crude Oil* MT 949,050 8,048.78 1,091,633 6,554.46
Liquefied Petroleum Gas MT 7,858 73.28 10,230 49.39
Naphtha MT 97,389 458.79 70,545 294.70
Ethane/Propane MT 778 11.69 650 11.01
Superior Kerosene Oil MT 5,951 23.41 8,690 30.95
Aviation Turbine Fuel MT 478 2.28 1,775 11.82
Low Sulphur Heavy Stock MT 282 5.47 102 1.64
High Speed Diesel MT 1,535 30.19 2,463 20.55
Mineral Turpentine Oil MT 151 3.25 144 2.79
High Speed Diesel ** KL 25 0.96 10 0.48
Motor Spiri t** KL 10 0.42 1 0.13
Carbon Credits Units 264,029 7.68 140,277 3.66
Others 6.15 16.48
TOTAL 8,672.35 6,998.06
* Includes Company’s share in stock of Joint venture.** Purchased for trading.

Standalone Financial Statement
235
(` in million)
2014-15 2013-14
Royalty (Note 31.2) 116,079.01 114,889.79
Cess 102,535.02 99,733.91
Motor Spirit Cess - 2.83
National Calamity Contingent Duty 1,123.42 1,097.40
Excise Duty on stock (Net) (Note-31.1) (18.57) (48.87)
Sales Tax 2,585.82 3,122.96
Service Tax 289.81 438.76
Education cess 90.85 2,348.31
Octroi and Port Trust Charges 6,083.06 4,896.60
Staf f Expenditure 16,953.45 19,356.57
Workover Operations 21,015.21 20,944.08
Water Injection, Desalting and Demulsification 12,791.13 11,794.01
Consumption of Stores and Spares 6,118.74 5,753.24
Consumption of Raw Materials 664.43 887.53
Pollution Control 6,695.90 6,189.78
Transport Expenses 4,220.30 3,971.37
Insurance 1,866.47 2,090.83
Power and Fuel 1,867.37 1,935.40
Repairs and Maintenance 9,723.74 9,143.15
Contractual payments including Hire charges etc. 16,646.31 14,403.13
Other Production Expenditure 4,947.89 5,100.75
Transportation and Freight of Products 11,908.72 11,559.67
Research and Development 5,445.29 6,014.37
General Administrative Expenses 32,805.73 38,236.23
CSR expenditure 2,156.01 1,723.68
Exchange Loss (Net) 240.86 1,020.68
Other Expenditure 7,826.83 6,728.74
TOTAL 392,662.80 393,334.90
31. Production, Transportation, Selling And Distribution Expenditure
31.1 Excise duty on sale of product has been deducted from Sales revenue and Excise duty shown above represents the dif ference between Excise duty on opening and closing stock of finished goods.
31.2 During the year, Government has directed the company to make following payments/adjustments towards dif ferential royalty at uniform rate of discount for the period 2008-09 to 2013-14 to the State and Central Government:
Particulars
Differential royalty payable to State Governments: ` in million
Gujarat 16,440.00
Andhra Pradesh 1,260.00
Tamil Nadu 220.00
Differential royalty recoverable from State/ Central Government :
Assam 980.00
Central Government 9,310.00
Net dif ferential royalty paid by ONGC 7,630.00
The same has been accounted for as expenditure on royalty on crude oil. In the absence of any further directive, no provision is considered necessary for the current year.

Annual Report 2014-15
Standalone Financial Statement
236
(` in million)
2014-15 2013-14
33.3 Details of Nature wise Expenditure
Manpower Cost
(a) Salaries, Wages, Ex-gratia etc. 68,260.95 64,241.44
(b) Contribution to Provident and other funds 9,447.01 9,026.52
(c) Provision for gratuity (83.74) (495.95)
(d) Provision for leave 3,999.80 5,153.04
(e) Provision for Post Retirement Medical & Terminal Benefits 3,270.81 2,721.44
(f) Staf f welfare expenses 1,404.08 23,404.04
Sub Total: 86,298.92 104,050.53
Consumption of Raw materials, Stores and Spares (Note-44.3) 49,526.55 51,246.56
Cess 102,550.46 99,737.56
National Calamity Contingent Duty 1,123.45 1,097.39
Excise Duty 2,206.49 3,075.85
Royalty 116,105.10 114,889.82
Sales Tax 2,592.96 3,122.99
Octroi and Port Trust Charges 6,083.50 4,896.64
Service Tax 289.81 438.76
Education cess 90.85 2,349.09
Rent 4,368.73 3,454.80
Rates and taxes 174.49 93.86
Hire charges of equipments and vehicles 133,029.22 142,686.33
Power, fuel and water charges 3,901.18 3,807.67
Contractual drilling, logging, workover etc. 64,607.40 58,279.47
Contractual security 4,752.38 4,030.52
Repairs to building 924.37 726.24
Repairs to plant and equipment 6,471.97 5,737.39
Other repairs 3,063.03 2,410.41
Insurance 3,540.45 4,064.91
Expenditure on Tour / Travel 3,835.78 3,709.08
CSR Expenditure (Note - 31.3.1) 2,156.01 1,723.68
Exchange Loss (Net) 240.86 1,020.68
Miscellaneous expenditure (Note - 31.3.2) 15,197.16 15,451.33
613,131.12 632,101.56
Less:
Allocated to exploration, development drilling, capital jobs,
recoverables etc.
Excise duty adjusted against sales revenue 2,225.06 3,125.09
Prior Period Adjustment - 2,609.20
Production, Transportation, Selling and Distribution
Expenditure
218,243.26 233,032.37
392,662.80 393,334.90
Particulars

Standalone Financial Statement
237
S.No. Particulars In Cash Yet to be paid in cash Total
i. Construction/acquisition of any asset 2,447.73 348.55 2,796.28
ii. On purpose other than (i) above 928.65 1,227.36 2,156.01
Total 3,376.38 1,575.91 4,952.29
31.3.2 The Expenditure in Note no 31.3 includes Statutory Auditors Remuneration as under:
31.3.1 The CSR expenditure contains the following:a. Gross amount required to be spent by the company during the year: 6,606.12 millionb. Amount spent during the year on:
(` in million)
Payment to Auditors (including service tax) 2014-15 2013-14
Audit Fees 15.17 11.24
Certification and Other Services 9.84 11.68
Travelling and Out of Pocket Expenses 19.40 21.44
Total 44.41 44.36
(` in million)
(` in million)
31.4 The expenditure incurred by various in house R&D institutes on scientific research eligible for deductionunder section 35(2AB) of Income Tax Act, 1961 is as under:
Particulars 2014-15 2013-14
Capital Expenditure 302.25 213.31
Revenue Expenditure 4,023.62 5,296.06
32. Depreciation, Depletion, Amortization and Impairment
Depletion 97,723.26 85,106.88
Depreciation & Amortisation 55,311.83 90,262.39
Less: Allocated to :
Exploratory Drilling 3,284.45 2,506.43
Development Drilling 3,297.72 1,871.16
Depreciation on Facilities 33,475.86 64,756.79
Others 297.50 14,956.30 162.25 20,965.76
Impairment Loss (Note - 42)
Provided during the year 3,308.68 3,993.34
Less: Reversed during the year 1,405.12 1,903.56 807.08 3,186.26
TOTAL 114,583.12 109,258.90
2014-15 2013-14
(` in million)
Particulars

Annual Report 2014-15
Standalone Financial Statement
238
34. Provisions and Write Offs
PROVISIONS
For Doubt ful Debts 358.30 130.55
For Doubt ful Claims/Advances 1,174.58 771.45
For Non-Moving Inventories 147.22 976.04
For Others 44.94 96.16
Sub-Total 1,725.04 1,974.20
WRITE-OFFS
Disposal/Condemnation of Fixed Assets 596.48 157.79
Less: Provision writ ten back 354.09 242.39 - 157.79
Claims/Advances 28.08 1.20
Less: Provision 19.01 9.07 - 1.20
Inventory 139.10 55.31
Bad debts - 129.96
Less: Provision writ ten back - - 129.96 -
Sub-Total 390.56 214.30
TOTAL 2,115.60 2,188.50
2014-15 2013-14
(` in million)
Particulars
33 Finance Cost
(` in million)
Particulars 2014-15 2013-14
i) On Short Term Loan 14.83 -
ii) On Cash Credit 12.83 3.18
iii) Others 0.21 0.39
TOTAL 27.87 3.57

Standalone Financial Statement
239
(` in million)
2014-15 2013-14
A. EXPENDITURE
Statutory levies (41.45) -
Other production, selling & distribution expenditure 512.38 (255.98)
Excess Abandonment Provision writ ten back (Refer Note No. 43) - (2,353.23)
Survey 2.52 (6.30)
Exploratory Wells writ ten of f 3,443.99 82.55
Depletion (71.80) (29.93)
Depreciation (0.04) 48.02
Sub-Total 3,845.60 (2,514.87)
B. INCOME
Sales - (13.36)
Interest -Others 0.30 0.22
Other Income 6.21 0.13
Sub-Total 6.51 (13.01)
TOTAL 3,839.09 (2,501.86)
35. Adjustments Relating to Prior Period (Net)
Particulars
2014-15 2013-14
Net Profit af ter Tax (` in million) 177,329.54 220,948.07
Weighted average number of equity shares (No. in million) 8,555.49 8,555.49
Basic & Diluted earnings per equity share (`) 20.73 25.83
Face Value per equity share (`) 5.00 5.00
36. Earning Per Equity Share
Particulars

Annual Report 2014-15
Standalone Financial Statement
240
37. Disclosure under the Revised Accounting Standard -15 on “Employee Benefits”
37.1 Brief Description: A general description of the type of Employee Benefits Plans is as follows:
37.1.1 All the employee benefit plans of the Company are run as Group administration plans (Single Employer
Scheme) including employees seconded to ONGC Videsh Limited (OVL), 100% subsidiary.
37.1.2 Earned Leave (EL) Benefit
Accrual – 30 days per year
Encashment while in service – 75% of Earned Leave balance subject to a maximum of 90 days per calendar year
Encashment on retirement – maximum 300 days
37.1.3 Good Health Reward (Half pay leave)
Accrual - 20 days per year
Encashment while in service - Nil
Encashment on retirement - 50% of Half Pay Leave balance.
37.1.4 Gratuity
15 days salary for each completed year of service. Vesting period is 5 years and the payment is restricted to `1.00
million.
37.1.5 Post-Retirement Medical Benefits
Upon payment of one time prescribed contribution by the employees, full medical benefits on superannuation and
on voluntary retirement subject to the completion of minimum 20 years of service and 50 years of age.
37.1.6 Terminal Benefits
a. At the time of superannuation, employees are entitled to set tle at a place of their choice and they are eligible for
Transfer Travelling Allowance.
b. Employees are gif ted gold coins on retirement up to 31.01.2015, depending upon their level and years of
service. This scheme has been discontinued w.e.f. 27.02.2015. Accordingly `5,854.33 million provided in
earlier years has been writ ten back (Note 7 & 11). Re-measured figures are restated accordingly in note no.
37.3 and 37.5.
37.2 The amounts recognized in the financial statements for defined contribution plans are as under:
(` in million)
Defined Contribution Plans Amount recognized
during the period Management Personnel
Contributory Provident Fund 3,590.02
(1.27)
Employee Pension Scheme-95
(EPF) (0.02)
Composite Social Security Scheme
(CSSS) (0.14)
Post Retirement Benefit Scheme
(PRBS) (1.59)
Contribution for Key
1.35
(CPF) (3,544.51)
352.75 0.05
(208.54)
625.48 0.15
(633.09)
4,876.99 2.15
(20,747.66)

Standalone Financial Statement
241
37.3 The amounts recognized in the balance sheet for post-employment benefit plans are as under:
(` in million)
Sl No. Particulars Gratuity Leave Post-Retirement
Medical Benefits (Note 37.1.6)
1 Present Value of Funded Obligation 20,712.01
(21,867.14)
2 Present Value of Unfunded Obligation - - 27,566.63
(6,310.52)
3 Fair Value of Plan Assets 21,244.03
(19,300.46)
4. Unrecognized Past Service Cost - - - -
5 Net Obligation -532.02
(-442.80) (2,566.68) (24,319.03) (6,310.52)
6 Liability for Retired employees - - - -
7 Total Provision -532.02
(–442.80) (2,566.68) (24,319.03) (6,310.52)
Terminal Benefits
20,099.65 NA NA
(20,890.48)
484.64
(24,319.03)
15,977.45 NA NA
(21,333.28)
4,122.20 27,566.63 484.64
4,122.20 27,566.63 484.64
37.4 The amounts included in the fair value of plan assets of gratuity fund in respect of Reporting Enterprise’s own financial instruments and any property occupied by, or other assets used by the reporting enterprise are Nil (Previous Year Nil)
37.5 Reconciliation showing the movements during the period in the net liability recognized in the balance sheet.
Sl No. Particulars Gratuity Leave Post-Retirement
Medical Benefits (Note 37.1.6)
1 Opening defined benefit obligation 20,890.48
(20,990.07) (20,030.97) (21,518.98) (6,277.36)
2 Current Service Cost 849.66
(861.99) (1076.57) (393.04) (400.75)
3 Past Service Cost - - - -
4. Interest Cost 1,827.92
(1,784.16) (1,752.71) (1,882.87) (533.58)
5. Actuarial losses/(-) gains -1,066.79
(-1,432.31) (2,946.96) (1,729.36) (-884.01)
6. Exchange dif ferences on foreign plans - - - -
7. Benefits paid -1,789.26
(-1,313.43) (-3,940.06) (-17.15)
8A Current Obligation 20,712.01
(20,890.48) (2,195.06) (1,403.44) (689.11)
8B Non-Current Obligation - 17,862.87
(19,672.08) (22,915.59) (5,621.41)
Total (8A+8B) 20,712.01
(20,890.48) (21,867.14) (24,319.03) (6,310.52)
Terminal Benefits
21,867.14 24,319.03 456.19
872.88 365.62 19.45
1,913.38 2,127.91 39.92
3,158.71 2,172.95 -11.75
-7,712.46 -1,418.88 -19.17
(-1,205.22)
2,236.78 1,579.86 50.41
25,986.77 434.23
20,099.65 27,566.63 484.64
(` in million)

Annual Report 2014-15
Standalone Financial Statement
242
37.6
The total amount recognized in the financial statements before allocation is as follows: (` in million)
Sl No. Particulars Gratuity Leave Post-RetirementMedical Benefits
TerminalBenefits
1 Current Service Cost 851.72 744.19 362.36 19.28(861.99) (1,076.57) (393.04) (400.75)
2 Interest on Obligation 1,827.92 1,913.38 2,126.64 39.86(1,784.16) (1,752.71) (1,882.87) (533.58)
3 Expected return on plan assets -1,855.11 -1,688.11 NA NA(-1,825.97) (-1,752.71)
4. Net actuarial Losses/(-) Gains recognized in period -921.87 3,017.60 2,176.81 -11.63(-1,432.31) (4,231.68) (1,729.36) (-884.01)
5 Past Service Cost - - - -
6 Losses (Gains) on curtailments and set tlement - - - -
7 Total included in ‘employee benefit expense’ -97.34 3,987.05 4,665.80 47.51(-462.78) (5,308.25) (4,005.27) (50.31)
8. Actual return on plan assets 1,710.20 1,811.85 NA NA(1,676.61) (467.99)
(` in million)
Particulars For Year ended For Year ended on 31.03.2015 on 31.03.2014
Fair Value of Plan Asset at Beginning 21,333.28 21,079.98
Adjustment in opening corpus consequent to audit (10.19) (115.90)
Expected Return on Plan Assets 1,855.11 1,825.97
Contribution by employer - -
Benefits Paid (1,789.26) (1,307.41)
Actuarial gain/(loss) on Plan Assets (144.91) (149.36)
Fair Value of Plan Asset at the end of the period (Unaudited) 21,244.03 21,333.28
37.7 Statement of Reconciliation of balance of Fair Value of Plan Assets in respect of Gratuity:-

Standalone Financial Statement
243
37.8 Statement of Reconciliation of balance of Fair Value of Plan Assets in respect of Leave:-(` in million)
Particulars For Year ended For Year ended on 31.03.2015 on 31.03.2014
Fair Value of Plan Asset at Beginning 19,300.46 20,030.97
Adjustment in opening corpus consequent to audit (7.75) -
Expected Return on Plan Assets 1,688.11 1,752.71
Contribution by employer 2,567.98 -
Benefits Paid (7,712.46) (1,198.50)
Actuarial gain/(loss) on Plan Assets 141.11 (1,284.72)
Fair Value of Plan Asset at the end of the period (Unaudited) 15,977.45 19,300.46
(` in million)
Gratuity As at As at As at As at As at31-03-2015 31-03-2014 31-03-2013 31-03-2012 31-03-2011
Present Value of Funded obligation 20,712.01 20,890.48 21,067.89 20,534.65 19,674.39as at the end of the period
Fair Value of plan assets as at the 21,244.03 21,333.28 21,079.98 20,114.96 18,171.17end of the period
Surplus/(Deficit) 532.02 442.80 12.09 (419.69) (1,503.22)
Experience Adjustment on plan 1,364.85 1,107.26 1,052.97 526.08 (903.84)Liabilities (loss)/gain
Experience Adjustment on plan (147.05) (170.32) (164.39) (217.84) (118.25)Assets (loss)/gain
37.9 Other disclosures:
Expected Contribution in respect of Gratuity for next year will be 185.53 million (Previous Year 318.68 million)
The company has recognized a gratuity liability of 78.72 million as on 31.03.2015 (Previous year 75.28) as per actuarial valuation for 558 (Previous year 589) Contingent Employees engaged in dif ferent work centres.
` `
` `

Annual Report 2014-15
Standalone Financial Statement
244
(` in million)
Leave Encashment As at As at As at As at As at31-03-2015 31-03-2014 31-03-2013 31-03-2012 31-03-2011
Present Value of Funded obligation 20,099.65 21,867.14 NA NA NA as at the end of the period (Note no.37.1.1, 37.1.2 and 37.1.3)
Fair Value of plan assets as at the 15,977.45 19,300.46 NA NA NAend of the period
Surplus/(Deficit) (4,122.20) (2,566.68) NA NA NA
Experience Adjustment on plan (2,878.21) (2,946.96) - - -Liabilities (loss)/gain
Experience Adjustment on plan 141.11 (1,284.72) NA NA NAAssets (loss)/gain
(` in million)
Leave Encashment As at As at As at As at As at31-03-2015 31-03-2014 31-03-2013 31-03-2012 31-03-2011
Present Value of unfunded NA NA 19,840.16 17,841.28 16,180.23obligation as at the end of the period (Note no.37.1.1, 37.1.2 and 37.1.3)
Experience Adjustment on plan NA NA (2,943.61) (2,062.27) (2,917.77 )Liabilities (loss)/gain
(` in million)
Post-Retirement Medical Benefits As at As at As at As at As at31-03-2015 31-03-2014 31-03-2013 31-03-2012 31-03-2011
Present Value of Unfunded obligation 27,566.63 24,319.03 21,562.76 19,203.33 16,495.66as at the end of the period
Experience Adjustment on plan (1,743.57) (1,729.36) (1,714.98) (2,072.83) (2,010.67 )Liabilities (loss)/gain
(` in million)
Sensitivity Analysis ( In respect of Post-Retirement Medical Benefits) As at 31-03-2015
1.00 % (+) 1.00 % (-)
Ef fect on service and interest cost 308.16 (299.06)
Ef fect on PBO (Closing) 3,542.68 (2,485.58)
(` in million)
Terminal Benefits As at As at As at As at As at31-03-2015 31-03-2014 31-03-2013 31-03-2012 31-03-2011
Present Value of Unfunded obligation 484.64 6,310.52 6,302.64 1,152.11 1,058.67 as at the end of the period
Experience Adjustment on plan 18.01 884.01 (4,695.45) (23.05) (356.15)Liabilities (loss)/gain

Standalone Financial Statement
245
37.10 Investments of Gratuity Trust
Particulars % of Investment
As at 31.03.2015 As at 31.03.2014
Central Govt. Securities 28.57 28.83
State Govt. Securities 15.59 15.47
PSU Bonds 27.44 28.82
Treasury Bills 0.03 0.11
Insurance Investment 28.14 26.55
Equity Mutual Fund 0.23 0.22
Total 100.00 100.00
37.11
Principal actuarial assumption at the balance sheet date (expressed as weighted averages):
Sl No. Particulars Gratuity Leave Post-RetirementMedical Benefits
TerminalBenefits
1 Discount rate 8.50% 8.50% 8.50% 8.50%(8.75%) (8.75%) (8.75%) (8.75%)
2 Expected return on plan assets 8.70% 8.75% NA NA(8.71%) (9.50%)
3. Annual increase in costs NA NA 6.00% 6.00%(6.00%) (6.00%)
4. Annual Increase in Salary 6.00% 6.00% NA NA(6.00%) (6.00%)
The discount rate is based upon the market yield available on Government bonds at the Accounting date with a term that matches. The salary growth rate takes account of inflation, seniority, promotion and other relevant factor on long term basis. Expected rate of return on plan assets is based on market expectation, at the beginning of the year, for return over the entire life of the related obligation.
38. Disclosure under Accounting Standard -17 on “Segment Reporting”
The segment information is presented under the Notes to the Consolidated Financial Statements as required under the standard.
39. Disclosure under Accounting Standard -18 on “Related Party Disclosure”:
39.1 Name of related parties and description of relationship:
Jointly Controlled Entity
i. Petronet LNG Limited
ii. ONGC Teri Biotech Limited
iii. Mangalore SEZ Limited
iv. ONGC Petro-additions Limited
v. ONGC Tripura Power Co. Limited
vi. Dahej SEZ Limited
vii. ONGC Mangalore Petrochemicals Limited (up to 28.02.2015)

Annual Report 2014-15
Standalone Financial Statement
246
39.2 Key Managerial Personnel: i) Shri D K Sarraf, Chairman and Managing Directorii) Shri A K Banerjee, Director (Finance) up to 30.04.2015iii) Shri T K Sengupta, Director (Of fshore) iv) Shri Ashok Verma, Director (Onshore) from 19.06.2014v) Shri D D Misra, Director (HR) from 01.08.2014vi) Shri A K Dwivedi, Director (Exploration) from 16.03.2015vii) Shri Shashi Shanker, Director (T&FS) viii) Shri N K Verma, Director (Exploration) up to 26.08.2014ix) Shri K.S Jamestin, Director (HR) up to 31.07.2014x) Shri N K Sinha, Company Secretary
39.3 Details of Transactions:
39.3.1 Jointly Controlled Entities (` in million)
2013-142014-15Details
Details
Sale of Gas-ONGC Tripura Power Co. limited 3,247.91 1,236.49
Services Received from :a) ONGC Teri Biotech Limitedb) Dahej SEZ Limited.c) Mangalore SEZ Limitedd) ONGC Tripura Power Co. Limited 0.17 0.10
Services Provided to :a) ONGC Petro-additions Limitedb) ONGC Teri Biotech Limitedc) Petronet LNG Limitedd) ONGC Tripura Power Co. Limitede) ONGC Mangalore Petrochemicals Limited (up to 28.02.2015) 3.49 5.90
Dividend Income - Petronet LNG Limited 187.50 234.38
Advance against Equity during Year:a) ONGC Petro-additions Limitedb) ONGC Tripura Power Co. Limited 4,645.36 2,925.10
As at 31.03.2015 31.03.2014
Amount Receivable From : a) ONGC Petro-additions Limitedb) Petronet LNG Limitedc) ONGC Tripura Power Co. Limitedd) ONGC Mangalore Petrochemicals Limited (as on 28.02.2015) 3.46 1.85
Amount Payable : a) ONGC Teri Biotech Limitedb) Dahej SEZ Limited.c) ONGC Tripura Power Co. limitedd) Mangalore SEZ Limited 0.17 0.09
Advance towards equity pending allotment :a) ONGC Petro-addition Limited 7,505.52 6,709.24b) ONGC Tripura Power Co. Limited 4,645.36 2,925.10c) ONGC Mangalore Petrochemicals Limited (upto 28.02.2015) - 9,199.77
244.72 112.4219.04 9.120.39 0.09
125.94 117.630.15 0.120.05 -
125.82 235.96
7,505.52 6,985.60
As at
67.17 54.690.10 -
345.08 373.80
148.33 51.557.54 7.54
- 0.02
39.3.2 Key Managerial Personnel (` in million)
Particulars 2014-15 2013-14
Remuneration to Key Management Personnel 38.04 37.56
Amount Receivable 1.04 1.39
Amount Payable 9.49 10.32

Standalone Financial Statement
247
40. Disclosure under Accounting Standard - 19 on ‘Leases’
The company has certain of fice/residential premises on Operating Lease which are cancellable by giving appropriate notice as per the respective agreements. During the year ` 977.22 million (Previous year 934.64 million) had been paid towards cancellable Operating Lease.
41. Disclosure under Accounting Standard - 27 on Financial Reporting of Interest in Joint Ventures:
41.1 Jointly Controlled Assets
In respect of certain blocks, the Company’s Joint Ventures (JV) with certain bodies corporate have entered into Production Sharing Contracts (PSCs) with GoI. Details of these blocks and JVs as on 31.03.2015 are as under:
`
Sl. Blocks Company's PI * Others Partners and their PI in theJV/Operatorship***
A Jointly Operated JVs
1 Panna, Mukta and Tapti 40% (40%) BGEPIL 30%, RIL 30%
2 AN-DWN-2009/3 60% (60%) OIL 40%
B ONGC Operated JVs
3 CB-OS/1 Development Phase** 55.26% (55.26%) TPL 6.7%, HOEC 38.04%
4 MN-DWN-98/3** 100% (100%)
5 MN-OSN-2000/2 40% (40%) GAIL 20%, IOC 20%, OIL 20%
6 AA-ONN-2001/2 80% (80%) IOC 20%
7 CY-ONN-2002/2 60% (60%) BPRL 40%
8 KG-ONN-2003/1 51% (51%) Cairn India Limited-49%
9 CB-ONN-2004/1** 60% (60%) GSPC 40%,
10 CB-ONN-2004/2 55% (55% ) GSPC 45%
11 CB-ONN-2004/3 65% (65%) GSPC 35%
12 CY-ONN-2004/2 80% (80%) BPRL 20%
13 MB-OSN-2005-1 80% (80%) GSPC 20%
14 Raniganj 74% (74%) CIL 26%
15 Jharia 74% (90%) CIL 26% (CIL 10%)
16 NK-CBM-2001/1 80% (80%) IOC 20%
17 BK-CBM-2001/1 80% (80%) IOC 20%
18 CB-ONN-2005/4 51% (51%) GSPC 49%
19 CB-ONN-2005/10** 100% (51%) (GSPC 49%)
20 WB-ONN-2005/4 75% (75%) OIL 25%
21 AN-DWN-2009/2 60% (60%) OIL 40%
No.

Annual Report 2014-15
Standalone Financial Statement
248
Sl. Blocks Company's PI * Others Partners and their PI in theJV/Operatorship***No.
22 AN-DWN-2009/1 70% (70%) OIL 30%
23 AN-DWN-2009/5** 100% (100%)
24 GK-OSN-2009/1 40% (40%) AWEL 20%, GSPC 20%, IOC 20%
25 GK-OSN-2009/2 40% (40%) AWEL 30%, IOC 30%
26 KG-OSN-2009/1 80% (80%) APGIC 10%, NTPC 10%
27 KG-OSN-2009/2 90% (90%) APGIC 10%
28 KG-OSN-2009/4 50% (50%) APGIC 10%, OIL 30%, NTPC 10%
29 AA-ONN-2009/3 50% (50%) OIL 50%
30 CB-ONN-2009/4 50% (50%) GSPC 50%
31 GK-OSN-2010/1 60% (60%) OIL-30%, GAIL-10%
32 GK-OSN-2010/2 90% (90%) GAIL- 10%
33 CB-ONN-2010/6 80% (80%) IOC- 20%
C Operated by JV Partners
34 Ravva 40% (40%) Cairn India Limited (Operator) 22.5%, VIL 25%, ROPL 12.5%
35 CY-OS-90/1 (PY3) 40% (40%) HEPI (operator) 18%, HOEC 21%, TPL 21%
36 RJ-ON-90/1 30% (30%) Cairn India Limited (Operator) 35%, CEHL 35%
37 CB-OS/2 –Development Phase 50% (50%) Cairn India Limited (operator) 40%, TPL 10%
38 CB-ON/7 –Development Phase 30% (30%) HOEC (Operator) 35%, GSPC 35%
39 CB-ON/3 – Development Phase 30% (30%) EOL (Operator)70%
40 AA-ONN-2002/3 70% (70%) OIL (Operator) 30%
41 AN-DWN-2003/2 45% (45%) ENI (Operator) 40%, GAIL 15%
42 PR-OSN-2004/1 35% (35%) Cairn India Limited (Operator) 35%, TPL 30%
43 CB-ON/2- Development phase 30% (30%) GSPC (Operator) 56%, Geo-Global Resources 14%
44 RJ-ONN-2005/3 40% (40%) GSPC (Operator) 60%
45 AA-ONN-2009/4 50% (50%) OIL (Operator) 50%
46 CY-OSN-2009/2 50% (50%) OIL (Operator) 50%
47 AA-ONN-2010/2 30% (30%) OIL -40%, GAIL-20%, EWP-10%
48 AA-ONN-2010/3 40% (40%) OIL-40%, BPRL-20%
* PI - Participating Interest
**Approval towards assignment of PI is awaited from GoI
*** There is no change in previous year details unless otherwise stated.

Standalone Financial Statement
249
Abbreviations:- APGIC- AP Gas Infrastructure Corporation Ltd, AWEL- Adani Welspun Exploration Ltd, BGEPIL-
British Gas Exploration and Production India Ltd, BPRL- Bharat Petro Resources Ltd, CEHL- Cairn Energy
Hydrocarbons Ltd, CIL- Coal India Ltd, ENI- Ente Nazionale Idrocarburi, Ensearch- Ensearch, EOL- Essar Oil Ltd. ,
GAIL- Gas Authority of India Ltd, GSPC- Gujarat State Petroleum Corporation Ltd, HEPI- Hardy Exploration &
Production India Ltd, HOEC- Hindustan Oil Exploration Company Ltd, IOC- Indian Oil Corporation Ltd, NTPC-
National Thermal Power Corporation Ltd, OIL- Oil India Ltd, VIL- Videocon Industries Ltd, RIL- Reliance Industries
Ltd, ROPL- Ravva Oil (Singapore) Private Ltd, TPL- Tata Petrodyne Ltd.
Sl. No. Joint Ventures / PSCs Company’s PI *
1 NEC-DWN-2002/2 100% (100%)
2 KK-DWN-2002/2 80% (80%)
3. CY-ONN-2004/1 80% (80%)
4. PR-ONN-2005/1 80% (80%)
5. GV-ONN-2005/3 80% (80% )
6. KG-OSN-2005/1 60% (60%)
7. KG-OSN-2005/2 80% (80%)
8. KG-DWN-2005/1 70% (70%)
9. PA-ONN-2005/1 100% (100%)
10. MB-OSN-2005-5 70% (70% )
11. MB-OSN-2005-6 80% (80% )
12. KK-DWN-2005/2 90% (90%)
13. AN-DWN-2009/18 60% (60%)
14. KG-DWN-2009/1 45% (45%)
15. CY-DWN-2004/3 70% (70%)
16. AA-ONN-2001/3 85% (85%)
17. AA-ONN-2005/1 60% (60%)
18. AA-ONN-2001/4 100% (100%)
19. AA-ONN-2002/4 90% (90%)
20. CY-PR-DWN-2004/1 70% (70%)
21. AN-DWN-2009/13 80% (80%)
22. RJ-ON/6 – Development phase (refer note 41.3.5) 30% (30%)
41.2 List of the blocks surrendered during the year are given below:
* PI- Participating Interest

Annual Report 2014-15
Standalone Financial Statement
250
41.3 The Financial position of the JV/NELP blocks are as under:
No. ofJVs/ NELP
Blocks
NELP Block-100% PI 16 30,348.05 233.14 0.17(96.45) (20,154.93) (-20,058.48)
Blocks with other partners (67) (103,668.42) (44,450.57) (182,462.92) (142,405.71) (40,057.21)
Surrendered 70(49) (5,209.85) (9,565.83) (0.37) (2,045.23) (-2,044.86)
Total 134 (135) (146,652.17) (54,358.24) (182,559.74) (164,605.87) (17,953.87)
Assets Liabilities Income Expenditure Profit / (-)Loss before
tax
24,557.43 -24,557.26(19) (37,773.90) (341.84)
48 93,976.40 46,927.57 1,46,952.80 1,08,133.48 38,819.32
4,680.45 12,369.44 276.54 12,024.63 -11,748.09
129,004.90 59,530.15 147,229.51 144,715.54 2,513.97
No. ofJVs/ NELP
Blocks
Assets Liabilities Income Expenditure Profit / (-)Loss before
tax
Audited 117 121,162.67 48,412.46 134,036.87 132,756.44 1,280.43(124) (145,807.09) (51,823.77) (182,255.94) (163,656.37) (18,599.58)
Unaudited 17 7,842.23 11,117.69 13,192.64 11,959.10 1,233.54(11) (845.08) (2,534.47) (303.80) (949.50) (-645.71)
Total 134 129,004.90 59,530.15 147,229.51 144,715.54 2,513.97(135) (146,652.17) (54,358.24) (182,559.74) (164,605.87) (17,953.87)
41.3.1 The financial statements of 117 (previous year 124) out of 134 (previous year 135) JVs/NELP blocks have been incorporated in the accounts to the extent of Company’s participating interest in assets, liabilities, income, expenditure and profit / (loss) before tax on the basis of statements certified in accordance with production sharing contract and in respect of balance 17 (previous year 11) JVs/NELP blocks, the figures have been incorporated on the basis of uncertified statements prepared under the production sharing contracts. Both the figures have been adjusted for changes as per Note No. 2.j.1 The financial positions of JV/NELP are as under:
(` in million)
(` in million)
41.3.2 As per the Production Sharing Contracts signed by the Company with the GoI, the Company is required to complete Minimum Work Programme (MWP) within stipulated time. In case of delay in completion of the MWP, Liquidated Damages (LD) is payable for extension of time to complete MWP. Further, in case the Company does not complete MWP or surrenders the block without completing the MWP, the estimated cost of completing balance work programme is required to be paid to the GoI. During the year LD amounting to (net of reversal) `24.08 million (Previous year `245.65 million) and cost of unfinished MWP (net of reversal) `1,420.64 million (Previous year (net of reversal) `(-) 59.14 million), paid/payable to the GoI is included in survey and wells writ ten of f expenditure respectively.
41.3.3 In respect of 3 NELP blocks (previous year 12) stwhich have expired as on 31 March, 2015, the
Company’s share of Unfinished Minimum Work Programme (MWP) amounting to `820.40 million (previous year to `18,014.12 million) has not been provided for since the company has already applied for further extension of period in these blocks as ‘excusable delay’/special dispensations citing technical complexities, within the extension policy of NELP Blocks, which are under active consideration of GoI. The delays have occurred generally on account of pending statutory clearances from various Govt. authorities like Ministry of Defense, Ministry of Commerce, environmental clearances, State Govt. permissions etc. The above MWP amount of `820.40 million (previous year `18,014.12 million) is included in MWP commitment under note no. 44.1.6.

Standalone Financial Statement
251
41.3.4 The company had acquired Participating Interest (PI) of British Gas Exploration and Production India Ltd (BGEPIL) in the following blocks, ef fective from the following dates as approved by the board of directors.
Name of the Block PI Date of Transfer of PI
KG OSN 2004/1 45% 25.11.2011
KG DWN 98/4 30% 18.05.2011
MN DWN 2002/2 25% 01.12.2011
British Gas has agreed to pay a lump sum amount of USD 50 Million, towards full and final set tlement of carry costs/cash calls due in all the above blocks, subject to government approval for transfer of PI in all the above blocks. Since the government approval in respect of MN DWN 2002/2 is pending, no adjustment is made in the accounts towards the lump sum amount due as above.
41.3.5 The company has relinquished 30% Participating Interest (PI) in SGL Field with future interest in block RJ-ON/6 Jaisalmer Basin Rajasthan to Focus Energy Ltd (Operator), on condition that Focus Energy Ltd (Operator) to pay towards 100% past royalty obligation, PEL/ML fees, other statutory levies and waive of f development/ Production costs payable by ONGC in SGL Field of the block as well as take all future 100% royalty obligation of ONGC as licensee and also not exercise its option of acquiring 30% PI in two gas discoveries namely SSG-1 and SSF-2 in Block. Pending farm out agreement/ government approval, no adjustment is made in the accounts in respect of relinquishment of RJ-ON/6.
41.4 Jointly Controlled Entities:
41.4.1 Company has ownership interest in following Jointly Controlled Entities:
Petronet LNG Limited India 12.50 12.50
Petronet MHB Limited India 28.77 28.77
Mangalore SEZ Limited India 26.00 26.00
ONGC Mangalore Petrochemicals Limited (Note 17.1) India - 46.00
ONGC Petro-additions Limited India 49.36 49.36
ONGC Tripura Power Co. Limited India 49.52 49.52
ONGC Teri Biotech Limited India 49.98 49.98
Dahej SEZ Limited India 50.00 50.00
Ownership Interest (%)Name
As at 31.03.2015 As at 31.03.2014
Country of Incorporation
41.4.2 The Company’s share in assets, liabilities, income, expenses, contingent liabilities and capitalcommitments of Jointly Controlled Entities:
(` in million)
Description As at 31.03.2015 As at 31.03.2014
i) Assets
Fixed Assets 134,214.88 136,189.25
Other Non-Current Asset 12,754.17 19,794.25
Deferred Tax Assets 548.63 256.91
Current Asset 11,410.67 13,334.56
ii) Liabilities
Long Term Borrowings 92,189.53 104,535.79
Other Non-Current liabilities and provisions 6,328.85 6,819.94
Deferred Tax Liability 1,604.41 896.17
Current liabilities and provisions 29,965.13 26,507.16
iii) Income 61,119.59 49,208.33
iv) Expenses 63,002.08 47,442.17
v) Contingent liabilities 13,212.91 8,868.61
vi) Capital commitments 12,156.07 18,372.56

Annual Report 2014-15
Standalone Financial Statement
252
42. Disclosure under Accounting Standard – 28 and
Guidance note on Accounting for Oil and gas
producing Activities (Revised) on “Impairment
of Assets”
42.1 The Company is engaged mainly in the business of
oil and gas exploration and production in On-shore
and Of fshore. In case of onshore assets, the fields
are using common production/transportation
facilities and are suf ficiently economically
interdependent to constitute a single cash
generating unit (CGU). Accordingly, impairment
test of all onshore fields are performed in
aggregate of all those fields at the Asset Level. In
case of Of fshore Assets, a field is generally
considered as CGU except for fields which are
developed as a Cluster, for which common
facilities are used, in which case the impairment
testing is performed in aggregate for all the fields
included in the cluster.
42.2 The Value in Use of producing/developing CGUs is
determined under a multi-stage approach, wherein
future cash flows are initially estimated based on
P r o v e d D e v e l o p e d R e s e r v e s . U n d e r
circumstances where the further development of
the fields in the CGUs is under progress and where
the carrying value of the CGUs is not likely to be
recovered through exploitation of proved
developed reserves alone, the Proved and
probable reserves (2P) of the CGUs are also taken
for the purpose of estimating future cash flows. In
such cases, full estimate of the expected cost of
evaluation/development is also considered while
determining the value in use.
42.3 In assessing value in use, the estimated future cash
flows from the continuing use of the assets and
from its disposal at the end of its useful life are
discounted to their present value. The present
values of cash flows are determined by applying
discount rates of 19.71% (previous year 19.10 %)
for Rupee transactions and 13.89% (previous year
13.00 %) for crude oil and value added products
revenue, which are measured in USD. Future cash
inflows from sale of crude oil and value added
products are computed using the future prices, on
the basis of market-based average prices of the
Dated Brent crude oil as per assessment by ‘Plat t’s
Crude Oil Market wire’ and its co-relations with
benchmark crudes and other petroleum products.
Future cash flows from sale of natural gas is also
computed based on the expected future prices on
the basis of the notification issued by the
Government of India and discounted applying the
rate applicable to the cash flows measured in USD
in view of the new pricing guidelines issued by GoI.
(refer note no.26.5)
42.4 During the year `2,136.53 million (Previous Year
`1,025.48 million) is provided as impairment loss.
Out of this, an amount of `380.89 million (Previous
Year `355.97 million) has been provided as
additional impairment in respect of onshore CGUs
– Jodhpur and Silchar. `146.40 million (Previous
Year `69.05 million) has been provided for already
impaired of fshore CGU- Ratna. For B 121 an
amount of `49.73 million (Previous Year `20.09
million) has been provided as additional
impairment. In addition, ` 367.91 million (Previous
Year `30.42 million) pertaining to block CY-OS-
90/1 (PY-3) has been provided as presently the
field does not have any potential to produce. An
amount of `1,025.81 million (Previous Year `79.40
million) mainly represents additional impairment
charge in respect of certain onshore Pre- NELP
joint venture blocks (RJ ON 6, CB ON 2 and CB ON
3) due to adjustment of cost recovery from revenue
and sharing of 100% royalty. Balance amount of
`73.38 million, 91.14 million (previous year 15.90
million) and `1.27 million has been provided for
Ankleswar, Hazira Plant and Retail Trading
respectively.
42.5 Further, `201.88 million (Previous Year `806.08
million) impairment losses has been reversed
because of decrease in Abandonment cost
estimation in respect Of fshore CGU D-18 and
Tapti.
42.6 Impairment testing of assets under exploratory
phase (Exploratory Wells in Progress) has been
carried out as on 31.03.2015, and an amount of
`1,172.15 million (Previous year `2,546.46 million)
has been provided during the year 2014-15 as
impairment loss. Fur ther, `1,203.23 million
(Previous Year Nil) impairment loss has been
reversed in the Statement of Profit and Loss as
exploratory phase assets have been transferred to
producing properties.

Standalone Financial Statement
253
43. Disclosure under Accounting Standard - 29 on “Provisions, Contingent Liabilities and Contingent Assets”:Movement in Provisions for Abandonment and others:
Other provisions represent provision for Court cases, arbitration and others, where the timing of expected out flows is upon set tlement of the proceedings:
42.7 The following 2P reserves for the respective CGU considered as a basis for the impairment assessment.
(` in million)
Particulars Provision for Abandonment Others
2014-15 2013-14 2014-15 2013-14
Opening Balance 228,439.19 177,454.45 805.86 761.86
Add: Provision made during the year 3,185.16 53,337.97 42.83 96.16
Less: Provision writ ten back/ reclassified/ reduction during the year
Closing Balance 227,543.61 228,439.19 848.69 805.86
4,080.74 2353.23 - 52.16
Name of the CGU Quantity of Reserves used forImpairment Assessment(In Mmt)
G1-GS 15 4.12
Jodhpur Onshore Asset 2.09
Silchar Onshore Asset 1.20
RJ-ON-06 (Pre NELP PSC Block) 1.05
CB-ON-02 (Pre NELP PSC Block) 0.09
Cluster B-193 9.12
Cluster B-22 5.42
ONGC’s of fshore drilling rig ‘Sagar Kiran’; ONGC has drilled 1184 oil wells and 151 gas wells in Of fshore; Western Of fshore production up by 4.3% (16.18 MMT in FY-15 against 15.51 MMT in FY-14)

Annual Report 2014-15
Standalone Financial Statement
254
44.1.1 Contingent Liabilities:
Claims against the Company/ disputed demands not acknowledged as debt:-
(` in million)
I In respect of Company
i. Income Tax 80,032.68 55,087.45
ii. Excise Duty 8,572.86 9,406.06
iii. Custom Duty 190.61 1,599.77
iv. Royalty (Note - 44.1.1.b) 117,738.83 117,301.90
v. Cess 6.57 6.57
vi. AP Mineral Bearing Lands (Infrastructure) Cess 2,371.76 2,211.27
vii. Sales Tax 24,776.47 46,086.36
viii. Service Tax 1,374.57 4225.07
ix. Octroi 205.52 68.54
x. Specified Land Tax (Assam) 3,863.05 3,528.89
xi. Claims of contractors (Incl. LAQ) in Arbitration/Court 72,750.49 50,783.08
xii. Employees Provident Fund 66.35 66.35
xiii. Others 53,578.89 53,911.41
Sub Total (A) 365,528.65 344,282.72
II In respect of Joint Ventures
i. Income Tax 8.91 8.91
ii. Excise Duty 4.17 4.17
iii. Custom Duty 1,473.86 3,798.73
iv. Sales Tax and Service Tax 2,880.48 2,879.82
v Claims of contractors in Arbitration / Court 5,356.90 5,095.94
vi. Others 867.31 854.74
Sub Total (B) 10,591.63 12,642.31
TOTAL (A + B) 376,120.28 356,925.03
Particulars As at st31 March, 2014
As at st31 March, 2015
a. The Company’s pending litigations comprise of claims against the Company and proceedings pending with Ta x/Statutor y/Government Authorities. The Company has reviewed all its pending litigations and proceedings and has made adequate provisions, wherever required and disclosed the contingent liabilities, wherever applicable, in its financial statements. The Company does not expect the outcome of these proceedings to have a material impact on its financial position. Future cash out flows in respect of the above are determinable only on receipt of judgments/decisions pending with various forums/ authorities.
b. In terms of the statutory provisions of Oilfields (Regulation and Development) Act, 1948 (ORDA), Petroleum & Natural Gas (PNG) Rules 1959 and
Notifications issued thereunder; the Company is liable to pay royalty to Central Government (GoI) and State Governments, on production of Crude Oil and Natural Gas from of fshore fields and onshore fields, respectively. Since 2008-09, the Company has been paying royalty on crude oil at realized price which is net of under-recovery of the OMCs shared by the Company as per GoI directives. On an application filed by the State of Gujarat, the Hon’ble High Court of Gujarat in its order dated 30.11.2013 has directed the Company to pay the shortfall of royalty on crude oil produced from the onshore fields in the State of Gujarat on pre-discount prices from 01.04.2008 onwards. Based on the Special Leave Petition filed by the Company against the said order of the Hon’ble High Court of Gujarat, pending further orders, Hon’ble Supreme Court vide order
44. Other Disclosures under Schedule III to the Companies Act, 2013:
44.1 Contingent liabilities and commitments (to the extent not provided for)

Standalone Financial Statement
255
Products Unit 2014-15 2013-14
Crude Oil MT 25,942,770 25,994,1053Natural Gas 000 M 23,523,675 24,851,248
Liquefied Petroleum Gas MT 1,095,081 1,067,230
Ethane/Propane MT 339,319 430,447
Naphtha MT 1,154,660 1,358,414
Superior Kerosene Oil MT 72,189 84,305
Aviation Turbine Fuel MT 11,448 9,658
Low Sulphur Heavy Stock MT 18,841 27,992
High Speed Diesel MT 28,703 36,311
Mineral Turpentine Oil MT 852 1,117
Light Diesel Oil MT - 50
dated 13.02.2014 stayed the operation of the impugned judgment subject to the condition that the company pays royalty to the State of Gujarat on pre-discounted price of crude oil w.e.f. 01.02.2014 onwards. Accordingly, dif ferential amount of `117,242.00 million (reduced to the ex tent 16,440.00 million which is paid to Gujarat Govt.-
refer Note No. 31.2) on this account for the period from April, 2008 to March, 2015 ( 116,326.96 million as on 31.03.2014) has been considered as Contingent Liability. Pending the final outcome of the SLP filed before the Hon’ble Supreme Court, dif ferential royalty (royalty on pre-discount price minus royalty on post-discount price) amounting to 21,067.60 million deposited w.e.f. February, 2014 ( 2,092.23 million as on 31.03.2014) in terms of Hon’ble Supreme Court order has been shown as deposit.
44.1.2 Corporate Guarantees executed by the Company on behalf of its wholly owned subsidiary, ONGC Videsh Limited (OVL):
44.1.3 Guarantees executed for financial obligations:
i) Amount of Guarantee 304,152.81 million (Previous year 321,657.40 million)
ii) Amount outstanding 301,671.35 million (Previous year 314,417.66 million)
44.1.4 Corporate Guarantees executed by the Company on behalf of its subsidiary, MRPL:
i) Amount of Guarantee 29,754.00 million (Previous year 13,513.50 million)
ii) Amount outstanding 3,290.04 million (Previous year 7,370.56 million)
`
`
``
``
``
``
``
44.1.5 Capital Commitments:
Estimated amount of contracts remaining to be executed on capital account:-
i) In respect of Company: 134,081.19 million (Previous year 83,351.44 million).
ii) In respect of Joint Ventures: 3,842.99 million (Previous year 4,367.54 million).
44.1.6 Other Commitments
Estimated amount of Minimum Work Programme (MWP) commit ted under various ‘Production Sharing Contracts’ with Government of India/ Nominated Blocks:
i) In respect Nominated Blocks Nil (Previous year 441.59 million).
ii) In respect of NELP blocks in which the Company has 100% participating interest: 3,000.14 million (Previous year 9,600.47
million).
iii) In respect of NELP blocks in Joint Ventures, company’s share: 32,705.26 million (Previous year 62,247.39 million).
44.1.7 The Company has given an undertaking to The State Bank of India, for a Rupee term loan agreement amounting to 30,350 million (previous year 30,350 million) in respect of ONGC Tripura Power Co. Limited (OTPC) for not to dilute the shareholding till two years af ter Commercial Operation Date (COD) of the project and to bear any cost overrun to the extent of 10% of the estimated project cost of 40,470 million.
``
``
`
` `
``
``
`
44.2 Quantitative Details
44.2.1 Production Quantities (Certified by the Management):
Notes:
1. Production includes internal consumption and intermediary losses.
2. Crude oil production includes condensate of 1.448 MMT (Previous year 1.819 MMT).

Annual Report 2014-15
Standalone Financial Statement
256
44.5 Expenditure in Foreign Currency:
2013-142014-15
Services* 174,771.93 182,380.14
Others 649.03 1,348.49
Total 175,420.96 183,728.63
(` in million)
Particulars
44.2.3 Raw Material Consumed:
2014-15
Quantity QuantityValue at cost( ` in million )
Value at cost( ` in million )
Unit
2013-14
Out of own production:
Crude Oil MT 60,374 710.35 89,117 654.943Natural Gas 000M 919,773 5,700.30 864,774 5,671.753Gas Equivalent Condensate 000M 410,900 1,768.98 482,772 2,132.78
Purchases
Gas Equivalent Condensate MT 15,908 664.93 20,329 889.73
For production of Liquefied Petroleum Gas, Ethane/Propane, Naphtha, Superior Kerosene Oil, Low Sulphur High Stock, Aviation Turbine Fuel and High Speed Diesel.
2014-15
% %Amount( ` in million )
Amount( ` in million )
2013-14
44.3 Consumption of Raw Material, Stores and Spare Parts:
Imported 10,542.40 21.29 10,766.35 21.01
Indigenous 38,984.15 78.71 40,480.21 78.99
Total 49,526.55 100.00 51,246.56 100.00
2013-142014-15
44.4 Value of Imports on CIF Basis:
Capital items 1,508.63 3,850.75
Stores and Spare Parts 12,268.40 13,152.26
Total 13,777.03 17,003.01
(` in million)
*Includes stage payments made against capital works.
44.2.2 Purchases (Traded Products):
2014-15
Quantity QuantityValue ( ` in million ) Value ( ` in million )UnitParticulars
2013-14
High Speed Diesel KL 400 16.65 59 2.68
Motor Spirit KL 548 27.18 541 28.80
Others - 0.28 - 0.32
Total 44.11 31.80

Standalone Financial Statement
257
2013-142014-15
44.6 Earnings in Foreign Currency:
Services 2.43 53.46
FOB value of Sales 50,153.48 74,818.30
Others 72.08 18.08
Total 50,227.99 74,889.84
(` in million)
Particulars
45. Disclosure under Guidance Note on Accounting for “Oil and Gas Producing Activities” (Revised)
Crude Oil (MMT)
Crude Oil (MMT)
Gas (Billion Cubic Meter)
Gas (Billion Cubic Meter)
Total Oil Equivalent (MMTOE)*
Total Oil Equivalent (MMTOE)*
Details
Details
As at31.03.2015
As at31.03.2015
As at31.03.2015
As at31.03.2015
As at31.03.2015
As at31.03.2015
As at31.03.2014
As at31.03.2014
As at31.03.2014
As at31.03.2014
As at31.03.2014
As at31.03.2014
Opening 212.16 222.98 202.723 203.245 414.87 426.22
Addition 12.36 4.71 3.480 18.652 15.84 23.36
Production 16.39 15.54 18.321 19.174 34.71 34.71
Closing 208.13 212.15 187.882 202.723 396.00 414.87
Opening 189.31 190.81 150.595 155.897 339.90 346.71
Addition 9.18 7.94 2.365 0.020 11.55 7.96
Production 8.74 9.44 4.909 5.321 13.65 14.76
Closing 189.75 189.31 148.051 150.596 337.80 339.91
Opening 401.47 413.79 353.318 359.142 754.78 772.93
Addition 21.54 12.65 5.845 18.671 27.39 31.33
Production 25.13 24.97 23.230 24.496 48.36 49.47
Closing 397.88 401.47 335.933 353.317 733.81 754.79
Opening 158.99 160.62 132.710 110.254 291.70 270.87
Addition 11.88 13.90 8.304 41.630 20.18 55.54
Production 16.39 15.53 18.321 19.174 34.71 34.71
Closing 154.48 158.99 122.693 132.710 277.17 291.70
Opening 146.60 150.81 106.984 110.010 253.58 260.81
Addition 5.99 5.18 1.853 2.225 7.84 7.41
Production 8.85 9.39 5.002 5.251 13.85 14.64
Closing 143.74 146.60 103.835 106.984 247.57 253.58
Opening 305.58 311.43 239.694 220.264 545.28 531.69
Addition 17.88 19.09 10.157 43.855 28.03 62.94
Production 25.24 24.92 23.323 24.425 48.56 49.35
Closing 298.22 305.58 226.528 239.694 524.75 545.28
45.2 Company's share of Proved Developed Reserves on the geographical basis is as under:
45.1 Company's share of Proved Reserves on the geographical basis is as under:
Offshore
Onshore
Total
Offshore
Onshore
Total
3* MMTOE denotes “Million Metric Tonne Oil Equivalent” and for calculating Oil equivalent of Gas, 1000 M of Gas has been taken to be equal to 1 MT of Crude Oil.
Variations in totals, if any, are due to internal summation and rounding of f.

Annual Report 2014-15
Standalone Financial Statement
258
45.3 The year-end reserves of the company have been estimated by the Reserves Estimation Commit tee (REC) which follows international reservoir engineering procedures consistently.
The company has adopted deterministic approach for reserves estimation and is following Society of Petroleum Engineers (SPE) – 1997 guidelines which defines reserves as “estimated volumes of crude oils, condensate, natural gas, natural gas liquids and associated substances anticipated to be commercially recoverable from known accumulations from a given date forward, under existing economic conditions, by established operating practices, and under current Government regulations.”
Volumetric estimation is the main procedure in estimation, which uses reservoir rock and fluid properties to calculate hydrocarbons in-place and then estimate that portion which will be recovered from it. As the field gets matured with reasonably good production history is available then performance method such as material
balance, simulation, decline curve analysis are applied to get more accurate assessments of reserves.
The Company uses the services of third party agencies for due diligence and it gets the reserves of its assets audited by third party periodically by internationally reputed consultants who adopt latest industry practices for their evaluation.
The annual revision of estimates is based on the yearly exploratory and development activities and results thereof. New in- place Volume and Ultimate Reserves are estimated for new field discoveries or new pool discoveries in already discovered fields. Also, appraisal activities lead to revision in estimates due to new subsur face data. Similarly, reinterpretation exercise is also carried out for old fields due to necessity of revision in petro-physical parameters, updating of static and dynamic models and performance analysis leading to change in reserves. Intervention of new technology, change in classifications and contractual provisions also necessitates revision in estimation of reserves.
46. Disclosure pursuant to clause 32 of the Listing Agreement: (` in million)
Outstanding as at
31.03.2015
Parliculars Outstanding as at
31.03.2014
Maximum Amount Outstanding during
the year 2014-15
Maximum Amount Outstanding during
the year 2013-14
a) Loans to Subsidiaries:*
i) ONGC Videsh Limited (OVL)*
ii) Mangalore Refinery and Petrochemicals Limited (MRPL)
b) Loan to Associate:
i) Pawan Hans Limited (formerly Pawan Hans Helicopter Ltd) (PHL)
c) Where there is no repayment schedule:
i) ONGC Videsh Limited (OVL) 66,142.28 66,142.28 52,914.93 119,576.99
d) Having repayment schedule of beyond seven years :
i) Employees 10,538.42 10,583.71 10,379.28 10,379.28
e) Where no interest or interest below Section 186(11) of Companies Act:
i) ONGC Videsh Limited (OVL)*
ii) Mangalore Refinery and Petrochemicals Limited (MRPL)
f) In the nature of loans to companies in which
are interested:
66,142.28 66,142.28 52,914.93 119,576.99
39,428.50 46,285.70 46,285.70 50,700.00
367.84 718.17 718.17 1,056.17
66,142.28 66,142.28 52,914.93 119,576.99
Nil Nil Nil Nil
Nil Nil Nil NilFirms\ directors
*Excludes Current account transaction

Standalone Financial Statement
259
g) Investments by the ONGC Videsh Limited (OVL), loanee:
Name of Subsidiary
stAs at 31 March, 2015
No. of Shares No. of Shares` in million ` in million
stAs at 31 March, 2014
a) ONGC Nile Ganga B.V.Equity Shares Class A
Class B Class C 880 234.25 880
b) ONGC Narmada Limited Equity Shares 20,000,000 6.94 20,000,000 6.94
c) ONGC Amazon Alaknanda Ltd.Equity Shares Preference Shares 227,216,319 10,486.04
d) Imperial Energy Limited (formerly Jarpeno Limited)Equity Shares Preference Shares
e) Carabobo One AB Equity Shares 377,678 2,822.02 377,678 2,822.02
f) ONGC (BTC) LimitedEquity Shares 7,398,001 2,339.30 8,000,001 2,529.66
g) Beas Rovuma Energy Mozambique LimitedEquity Shares 7,680 94,289.92 7,680 94,289.92
h) ONGC Videsh Rovuma LimitedEquity Shares 10,000 0.19 - -
i) ONGC Videsh Atlantic LimitedEquity Shares 40,000 1.06 - -
40 8,462.12 40 8,462.12100 21,155.29 100 21,155.29
234.25
12,000 0.56 12,000 0.56165,797,732 7,651.57
1,450 15,574.46 1,450 15,574.46192,210 86,744.37 192,210 86,744.37
Notes :
1. Loan to OVL is repayable within a notice period of minimum one year and carries no interest during the years 2014-15 and 2013-14.
2. Loan to MRPL carries interest @State Bank Advance Rate (SBAR) with a spread of minus 385 basis points. The Loan is repayable quarterly in 28 equal instalments. The repayment of loan had started from the last quarter of FY 2013-14. ONGC can call these loans on notice of 90 days. MRPL can prepay whole or part of the loan to ONGC as per its requirement.
3. The Company has not advanced any money to its employees for the purposes of investment in the securities of the Company.

Annual Report 2014-15
Standalone Financial Statement
260
(` in million)
a) Principal amount remaining unpaid but not due as at year end 74.99 81.44
b) Interest due thereon as at year end - -
c) Interest paid by the Company in terms of Section 16 of Micro, Small and Medium Enterprises Development Act, 2006, along with the amount of the payment made to the supplier beyond the appointed day during the year - -
d) Interest due and payable for the period of delay in making payment (which have been paid but beyond the appointed day during the year) but without adding the interest specified under Micro, Small and Medium Enterprises Development Act, 2006 - -
e) Interest accrued and remaining unpaid as at year end - -
f) Further interest remaining due and payable even in the succeeding years, until such date when the interest dues as above are actually paid to the small enterprise - -
Particulars 2014-15 2013-14
48. Disclosure on Foreign currency exposures at year end that have not been hedged by derivative instrument or otherwise are given below:
Particulars
stAs at 31 March, 2015
Foreign Currency Foreign Currency Equivalent ` Equivalent `
stAs at 31 March, 2014
Import Creditors
AED 0.27 4.61 0.29 4.78
AUD 1.07 51.11 0.64 35.70
CHF 0.11 6.82 - -
EUR 12.15 821.82 14.03 1,158.49
GBP 3.58 331.68 5.86 585.30
JPY 519.05 270.48 974.24 572.86
NOK 1.28 10.01 8.61 86.31
OMR 0.04 6.33 0.04 6.07
SEK 0.03 0.22 0.03 0.28
SGD 0.38 17.51 0.44 21.07
USD 782.90 49,040.84 927.84 55,726.36
Total 50,561.44 58,197.21
Export Receivables
USD 197.92 12,397.94 459.78 27,614.20
MWP Provision
USD 175.30 10,980.66 162.71 9,772.25
Cash Call Payable
USD 1.18 74.13 0.89 53.71
Cash Call Receivable
USD 47.78 2,992.94 81.94 4,921.32
47. Disclosure under Micro, Small and Medium Enterprises Development Act, 2006:
Company had sought confirmation from the vendors whether they fall in the category of Micro or Small Enterprises. Based on the information available, the required disclosure for Micro and Small Enterprises under the above Act is given below:
(Figures in million)

Standalone Financial Statement
261
49. The Company has a system of physical verification of Inventory, Fixed Assets and Capital Stores in a phased manner to cover all items over a period of three years. Adjustment of dif ferences, if any, is carried out on completion of reconciliation.
50. Discrepancies of crude oil of 96,496 MT (valued at `395.47 million as on March 31, 2014) between physical and book records at Ankleshwar Asset have been ascertained by the management during the year and accordingly these have been writ ten of f/adjusted in inventories. Further, 70,746 MT of pit oil lying in book of Ahmedabad Asset (valued at nil as on March 31, 2014) has also been writ ten of f during the year. These write of fs and consequential adjustments thereto have been made on account of over reporting of crude oil production in earlier financial years. The discrepancies as mentioned above are under investigation by the appropriate authorities.
51. The Company did not have any long term contracts including derivative contracts for which there were any material foreseeable losses.
52. Some balances of Trade/Other Receivables, Trade/Other Payables and Loans and Advances are subject to confirmation/reconciliation. Adjustments, if any, will be accounted for on confirmation/reconciliation of the same, which will not have a material impact.
53. Previous year's figures have been regrouped/reclassified, wherever necessary, to conform to current year's classification.
54. Figures in parenthesis as given in these Notes to Financial Statement relate to previous year.
An FPSO (Floating Production Storage and Of floading vessel) unit; ONGC has taken a slew of initiatives to quickly put its fields on production using the latest state-of-the-art technology. The induction of FPSO units to its fleet has greatly advanced the production
schedule in the eastern of fshore.

Annual Report 2014-15
Standalone Financial Statement
262
Seg
men
t In
form
ati
on
- S
tan
dalo
ne
2014-1
52013-1
4
Tota
l U
nallo
cate
dG
ran
dTo
tal
Un
Gra
nd
Part
icu
lars
Off
sh
ore
On
sh
ore
Se
gm
en
tsTo
tal
Off
sh
ore
On
sh
ore
Se
gm
en
tsTo
tal
Re
ve
nu
e
Ex
tern
al S
ale
s 5
96
,73
1
23
4,2
04
830,9
35
-
830,9
35
59
9,4
03
24
2,6
12
842,0
15
-
842,0
15
Inte
r S
eg
men
t S
ale
s -
-
-
-
-
-
Gro
ss R
eve
nu
e5
96
,73
12
34
,20
4830,9
35
-
830,9
35
59
9,4
03
24
2,6
12
842,0
15
-
842,0
15
Less
: E
xcis
e D
uty
2,0
32
19
32,2
25
2,2
25
2,7
72
35
33,1
25
3,1
25
Tota
l R
eve
nu
e594,6
99
234,0
11
828,7
10
-
828,7
10
596,6
31
242,2
59
838,8
90
-
838,8
90
Re
su
lts
Seg
men
t R
esu
lt P
rofit
(+)/
Lo
ss(-
) 2
26
,27
21
9,9
46
246,2
18
246,2
18
26
6,8
62
35
,84
7302,7
09
302,7
09
Un
allo
cate
d C
orp
ora
te E
xpen
ses
-
1
6,0
92
16,0
92
-
15
,13
715,1
37
Op
era
tin
g P
rofi
t226,2
72
19,9
46
246,2
18
(16,0
92)
230,1
26
266,8
62
35,8
47
302,7
09
(15,1
37.0
0)
287,5
72
Inte
rest
Exp
en
ses
-
2
828
-
44
Inte
rest
/Div
iden
d In
co
me
-
3
5,4
54
35,4
54
-
36
,75
136,7
51
Inco
me T
axe
s -
88
,22
388,2
23
-
10
3,3
71
103,3
71
Pro
fit fro
m O
rdin
ary
Activ
ities
22
6,2
72
19
,94
6246,2
18
(6
8,8
89
)177,3
29
26
6,8
62
35
,84
7302,7
09
(8
1,7
61
)220,9
48
Ex
trao
rdin
ary
Gain
-
-
-
-
Ne
t P
rofi
t2
26
,27
21
9,9
46
246,2
18
(6
8,8
89
)177,3
29
26
6,8
62
35
,84
7302,7
09
(8
1,7
61
)220,9
48
Oth
er
Info
rmati
on
Se
gm
en
t A
sse
ts1
,00
4,6
59
53
7,4
48
1,5
42,1
07
1,5
42,1
07
94
1,1
01
46
9,2
61
1,4
10,3
62
1,4
10,3
62
Un
allo
cate
d C
orp
ora
te A
ssets
-
5
38
,69
2538,6
92
-
58
2,5
22
582,5
22
Tota
l A
sse
ts1
,00
4,6
59
53
7,4
48
1,5
42,1
07
53
8,6
92
2,0
80,7
99
94
1,1
01
46
9,2
61
1,4
10,3
62
58
2,5
22
1,9
92,8
84
Se
gm
en
t L
iab
ilit
ies
28
9,5
60
10
3,8
77
393,4
37
393,4
37
32
5,7
44
10
1,4
78
427,2
22
427,2
22
Un
allo
cate
d C
orp
ora
te L
iab
ilitie
s -
24
1,3
51
241,3
51
-
19
8,4
12
198,4
12
Tota
l L
iab
ilit
ies
28
9,5
60
10
3,8
77
393,4
37
24
1,3
51
634,7
88
32
5,7
44
10
1,4
78
427,2
22
19
8,4
12
625,6
34
Cap
ital E
xp
en
dit
ure
18
4,2
84
74
,55
7258,8
41
4,2
37
263,0
78
21
1,5
67
76
,93
3288,5
00
4,3
28
292,8
28
De
pre
cia
tio
n,
De
ple
tio
n a
nd
A
mo
rtis
ati
on
No
n-c
ash
Exp
en
se
s7
55
1,0
01
1,7
56
61,7
62
1,5
95
64
62,2
41
(5
3)
2,1
88
allo
cate
d
88
,22
42
5,1
20
113,3
44
1,1
67
114,5
11
87
,19
5
21
,32
6108,5
21
75
6109,2
77
(`
in m
illio
n)

Statement Pursuant to Section 129 (AOC-1)
ONGC Group Performance at a Glance
Independent Auditors’ Report on Financial Statement
Consolidated
Consolidated Financial Statement

Annual Report 2014-15
Statement Pursuant to Section 129 (AOC-1)
264

Statement Pursuant to Section 129 (AOC-1)
265

Annual Report 2014-15
Group Performance at a Glance
266
FINANCIAL FINANCIAL
Income form Operations 1,660,669 1,782,051 1,658,482 1,511,003 1,252,873 Income from Operations (Gross) 1085787 1105621 1036483 898872 755854
Other Non-operating Income 59,644 68,899 54,907 47,934 37,180 Statutory Levies 213391 229963 240025 216411 175823
Total Revenue 1,720,313 1,850,950 1,713,389 1,558,937 1,290,053 Operating Expenses 407693 430150 374072 307502 255258
Statutory Levies 306,836 299,174 284,369 269,402 247,631 Exchange Loss/(Gain) (10671) 11716 1018 (2675) (463)
Operating Expenses 821,770 901,110 824,465 639,629 488,606 Profit Before Interest Depreciation & Tax (PBIDT) 475374 433792 421368 377634 325236
Exchange Loss/(Gain) (465) (650) 4,206 11,925 42 Recouped Costs 187391 155705 139533 124154 103549
Exploration costs writ ten of f* 109,514 84,881 110,457 105,136 92,620 Operating Income (PBIT) 287983 278087 281835 253480 221687
Profit Before Interest, Depreciation & Tax (PBIDT) 482,658 566,435 489,892 532,845 461,154 Interest(Net) (16431) (32950) (27375) (19241) (11715)
Depreciation, Depletion, Amortisation and Impairment 180,330 166,057 117,633 131,866 113,644 Profit before Tax and Extraordinary Items 304414 311037 309210 272721 233402
Profit Before Interest & Tax (PBIT) 302,328 400,377 372,259 400,979 347,510 Extraordinary Items- Excess of Insurance Claims over BV 0 658 0 4751 6405
Interest Payment 28,624 6,243 4,838 4,349 4,377 Profit before Tax 304414 311695 309210 277472 239807
Profit before Tax and Exceptional Items 273,704 394,134 367,421 396,630 343,133 Corporate Tax 107138 110094 106999 98454 84932
Exceptional item - - - 31,405 - Profit af ter Tax 197276 201601 202211 179018 154875
Profit before Tax 273,704 394,134 367,421 428,035 343,133 Share in Associates for the year 78 99 21 102 107
Corporate Tax 96,975 127,604 127,519 143,746 114,883 Profit relating to minority 3319 3747 3509 1424 1006
Profit af ter Tax 176,729 266,530 239,902 284,289 228,250 Group Profit af ter Tax 194035 197953 198723 177696 153976
Share in Associates for the year 303 118 38 (11) 30 Dividend 70583 68444 68444 66305 64167
Profit relating to minority (6,303) 1,583 (2,256) 2,842 3,720 Tax on Dividend 11992 12017 12014 10383 9172
Group Profit af ter Tax 183,335 265,065 242,196 281,436 224,560 Share Capital 21389 21389 21535 21416 14259
Dividend 81,277 81,277 81,277 83,416 74,859 Net Worth (Equity) 1005653 915729 774127 661994 564017
Tax on Dividend 16,317 13,842 13,053 13,611 12,528 Borrowings 51769 13091 9427 12964 22342
Share Capital 42,778 42,778 42,778 42,778 42,778 Working Capital 192787 172257 240202 202408 173164
Net Worth (Equity) 1,794,742 1,710,556 1,510,417 1,352,666 1,145,312 Capital Employed 869009 752781 693329 618263 513037
Long-term Borrowings 475,827 316,809 88,428 52,086 39,771
Working Capital 26,969 (44,857) 63,899 96,213 75,237 FINANCIAL PERFORMANCE RATIOS
Capital Employed 1,781,914 1,447,991 1,183,203 1,003,223 909,267 PBIDT to Turnover (%) 43.78 39.2 40.7 42.0 43.0
PBDT to Turnover (%) 45.29 42.2 43.3 44.2 44.6
FINANCIAL PERFORMANCE RATIOS Profit Margin(%)- incl. extraordinary items 17.87 17.9 19.2 19.8 20.4
PBIDT to Turnover (%) 29.06 31.79 29.54 35.26 36.81 ROCE(PBIDT to Capital Employed) (%) 54.70 57.6 60.8 61.1 63.4
PBDT to Turnover (%) 27.34 31.44 29.25 34.98 36.46 Net Profit to Equity (%)- incl. extraordinary items 19.29 21.6 25.7 26.8 27.3
Profit Margin (%)- incl. exceptional items 11.04 14.87 14.60 18.63 17.92
ROCE(PBIDT to Capital Employed) (%) 27.09 39.12 41.40 53.11 50.72 BALANCE SHEET RATIOS
Net Profit to Equity (%)- incl. exceptional items 10.22 15.50 16.04 20.81 19.61 Current Ratio 1.38:1 1.31:1 1.75:1 1.79:1 1.97:1
Debt Equity Ratio 0.05 0.01 0.01 0.02 0.04
BALANCE SHEET RATIOS Debtors Turnover Ratio(Days) 24 24 25 20 21
Current Ratio 1.05:1 0.93:1 1.13: 1 1.21:1 1.21:1
Debt Equity Ratio 0.27 0.19 0.06 0.04 0.03 PER SHARE DATA
Debtors Turnover Ratio (Days) 38.27 32.83 33.88 28.31 29.05 Earning Per Share (Rs.)- before extraordinary items* 22.68 23.09 23.23 20.40 17.50
Earning Per Share (Rs.)- af ter extraordinary items* 22.68 23.14 23.23 20.77 18.00
PER SHARE DATA Dividend (%) 330 320 320 310 450
Earning Per Share (`) 21.43 30.98 28.31 32.90 26.25 Book Value Per Share(Rs.)* 118 107 90 77 66
Dividend (%) 190 190 190 195 175
Book Value Per Share (`) 210 200 177 158 134 *restated Post Bonus & split
ONGC GroupPerformance at a Glance
(` in million unless otherwise stated) 2014-15 2013-14 2012-13 2011-12 2010-11
In view of the Notification no. S.O 447(E) dated 28.02.2011, issued by Ministry of Corportae Af fairs, the Balance sheet of the Company is mandatorily required to be prepared in Revised Schedule VI w.e.f 1 April, 2011 onwrads
Accordingly, the figures of FY 2014-15, FY 2013-14, FY 2012-13, FY 2011-12 and FY 2010-11 are given as per the requirement of Revised Schedule VI and earlier years figures are as per Old Schedule VI.* Exploration Costs writ ten of f towards Survey & Dry Wells have been regrouped from Depreciation, Depletion and Amortization since these represents cash expenditure and shown as a separate item.
st st(Schedule III af ter implementation of Companies Act, 2013 w.e.f. 1 April, 2014).

Group Performance at a Glance
267
FINANCIAL FINANCIAL
Income form Operations 1,660,669 1,782,051 1,658,482 1,511,003 1,252,873 Income from Operations (Gross) 1,085,787 1,105,621 1,036,483 898,872 755,854
Other Non-operating Income 59,644 68,899 54,907 47,934 37,180 Statutory Levies 213,391 229,963 240,025 216,411 175,823
Total Revenue 1,720,313 1,850,950 1,713,389 1,558,937 1,290,053 Operating Expenses 407,693 430,150 374,072 307,502 255,258
Statutory Levies 306,836 299,174 284,369 269,402 247,631 Exchange Loss/(Gain) (10,671) 11,716 1,018 (2,675) (463)
Operating Expenses 821,770 901,110 824,465 639,629 488,606 Profit Before Interest Depreciation & Tax (PBIDT) 475,374 433,792 421,368 377,634 325,236
Exchange Loss/(Gain) (465) (650) 4,206 11,925 42 Recouped Costs 187,391 155,705 139,533 124,154 103,549
Exploration costs writ ten of f 109,514 84,881 110,457 105,136 92,620 Operating Income (PBIT) 287,983 278,087 281,835 253,480 221,687
Profit Before Interest, Depreciation & Tax (PBIDT) 482,658 566,435 489,892 532,845 461,154 Interest(Net) (16,431) (32,950) (27,375) (19,241) (11,715)
Depreciation, Depletion, Amortisation and Impairment 180,330 166,057 117,633 131,866 113,644 Profit before Tax and Extraordinary Items 304,414 311,037 309,210 272,721 233,402
Profit Before Interest & Tax (PBIT) 302,328 400,377 372,259 400,979 347,510 Extraordinary Items- Excess of Insurance Claims over Book Value - 658 - 4,751 6,405
Interest Payment 28,624 6,243 4,838 4,349 4,377 Profit before Tax 304,414 311,695 309,210 277,472 239,807
Profit before Tax and Exceptional Items 273,704 394,134 367,421 396,630 343,133 Corporate Tax 107,138 110,094 106,999 98,454 84,932
Exceptional item - - - 31,405 - Profit af ter Tax 197,276 201,601 202,211 179,018 154,875
Profit before Tax 273,704 394,134 367,421 428,035 343,133 Share in Associates for the year 78 99 21 102 107
Corporate Tax 96,975 127,604 127,519 143,746 114,883 Profit relating to minority 3,319 3,747 3,509 1,424 1,006
Profit af ter Tax 176,729 266,530 239,902 284,289 228,250 Group Profit af ter Tax 194,035 197,953 198,723 177,696 153,976
Share in Associates for the year 303 118 38 (11) 30 Dividend 70,583 68,444 68,444 66,305 64,167
Profit relating to minority (6,303) 1,583 (2,256) 2,842 3,720 Tax on Dividend 11,992 12,017 12,014 10,383 9,172
Group Profit af ter Tax 183,335 265,065 242,196 281,436 224,560 Share Capital 21,389 21,389 21,535 21,416 14,259
Dividend 81,277 81,277 81,277 83,416 74,859 Net Worth (Equity) 1,005,653 915,729 774,127 661,994 564,017
Tax on Dividend 16,317 13,842 13,053 13,611 12,528 Borrowings 51,769 13,091 9,427 12,964 22,342
Share Capital 42,778 42,778 42,778 42,778 42,778 Working Capital 192,787 172,257 240,202 202,408 173,164
Net Worth (Equity) 1,794,742 1,710,556 1,510,417 1,352,666 1,145,312 Capital Employed 869,009 752,781 693,329 618,263 513,037
Long-term Borrowings 475,827 316,809 88,428 52,086 39,771
Working Capital 26,969 (44,857) 63,899 96,213 75,237 FINANCIAL PERFORMANCE RATIOS
Capital Employed 1,781,914 1,447,991 1,183,203 1,003,223 909,267 PBIDT to Turnover (%) 43.78 39.21 40.70 41.96 42.98
PBDT to Turnover (%) 45.29 42.18 43.27 44.20 44.60
FINANCIAL PERFORMANCE RATIOS Profit Margin(%)- incl. extraordinary items 17.87 17.89 19.16 19.80 20.40
PBIDT to Turnover (%) 29.06 31.79 29.54 35.26 36.81 ROCE(PBIDT to Capital Employed) (%) 54.70 57.63 60.77 61.08 63.39
PBDT to Turnover (%) 27.34 31.44 29.25 34.98 36.46 Net Profit to Equity (%)- incl. extraordinary items 19.29 21.62 25.67 26.84 27.30
Profit Margin (%)- incl. exceptional items 11.04 14.87 14.60 18.63 17.92
ROCE(PBIDT to Capital Employed) (%) 27.09 39.12 41.40 53.11 50.72 BALANCE SHEET RATIOS
Net Profit to Equity (%)- incl. exceptional items 10.22 15.50 16.04 20.81 19.61 Current Ratio 1.38:1 1.31:1 1.75:1 1.79:1 1.97:1
Debt Equity Ratio 0.05 0.01 0.01 0.02 0.04
BALANCE SHEET RATIOS Debtors Turnover Ratio(Days) 24 24 25 20 21
Current Ratio 1.05:1 0.93:1 1.13: 1 1.21:1 1.21:1
Debt Equity Ratio 0.27 0.19 0.06 0.04 0.03 PER SHARE DATA
Debtors Turnover Ratio (Days) 38.27 32.83 33.88 28.31 29.05 Earning Per Share (`)- before extraordinary items* 22.68 23.09 23.23 20.40 17.50
Earning Per Share (`)- af ter extraordinary items* 22.68 23.14 23.23 20.77 18.00
PER SHARE DATA Dividend (%) 330 320 320 310 450
Earning Per Share (`) 21.43 30.98 28.31 32.90 26.25 Book Value Per Share(`)* 118 107 90 77 66
Dividend (%) 190 190 190 195 175
Book Value Per Share (`) 210 200 177 158 134
ONGC GroupPerformance at a Glance
( in million unless otherwise stated) ` 2009-10 2008-09 2007-08 2006-07 2005-06
*restated Post Bonus & split

Annual Report 2014-15
Statement of Income and Retained Earnings of ONGC Group
268
REVENUES REVENUESSales SalesCrude Oil 662,845 654,029 621,576 640,041 558,993 Crude Oil 527312 491127 543631 475295 382311 Natural Gas 204,306 194,594 174,558 151,320 135,329 Natural Gas 81405 82835 78560 80117 73383 LPG 34,380 30,145 31,484 23,711 18,368 LPG 21924 22752 20169 14867 16279 Naptha 50,835 75,743 76,805 72,167 56,342 Naptha/Aromatic Rich Naptha 47137 48406 43848 37907 35679 Ethane/Propane 10,064 14,837 13,440 12,741 8,796 Ethane/Propane 10249 9890 9291 9095 7401 Superior Kerosene Oil 2,770 2,779 3,686 1,520 679 Superior Kerosene Oil 3255 16701 10775 15754 10605 HSD 312 522 170 103 134 HSD 156 61910 48621 42037 23403 Motor Spirit - - - 30 - Motor Spirit 27 11062 9159 4530 3797 Others 676,896 796,713 727,355 599,982 447,972 Others 370250 349257 254297 183064 188892 Price Revision Arrears - - - Price Revision Arrears 0 0 0 11 156 Sub- Total 1,642,408 1,769,362 1,649,074 1,501,615 1,226,613 Sub- Total 1061715 1093940 1018351 862677 741906 Traded Products 60 44 43 34 172 Write Back of Excess Liability 0 0 Other Operating Revenue 18,201 12,645 9,365 9,354 26,088 Pipeline Revenue 3126 5267 4644 3351 3214 Total Revenue from Operations 1,660,669 1,782,051 1,658,482 1,511,003 1,252,873 Other Receipts 17217 9858 12387 23029 11279 Other Non-operating Income 59,644 68,899 54,907 47,934 37,180 Accretion / (Decretion) in stock 3729 (3444) 1101 9815 (545)Total Revenues 1,720,313 1,850,950 1,713,389 1,558,937 1,290,053 Total Revenues 1085787 1105621 1036483 898872 755854 COST & EXPENSES COST & EXPENSESOperating, Selling & General Operating, Selling & GeneralStatutory Levies (a) Royalties 103561 111574 121057 104558 85242 (a) Royalties 141,451 150,102 137,210 155,316 126,529 (b) Cess/ Excise Duty 98831 103571 108838 100160 76755 (b) Cess 102,535 99,734 99,971 57,831 56,963 (c) Natural Calamity Contingent Duty - Crude Oil 1062 1081 1127 1149 1080 (c) Motor Spirit Cess - 3 (d) Sales Tax 3734 7823 2947 6009 10299 (d) Excise Duty 52,669 37,432 34,732 37,427 51,544 (e) Education Cess* 1719 1784 1861 1303 0 (e) Natural Calamity Contingent Duty - Crude Oil 1,123 1,097 1,101 1,097 1,114 (f) Octroi & Port Trust Charges 4484 4130 4195 3232 2447 (f) Sales Tax 2,586 3,123 3,834 3,339 3,112 (g) VAT 816 800 685 1063 927 (g) Service Tax 298 439 353 8,337 2,018 Sub-total (a to f) 213391 229963 240025 216411 175823 (h) Education Cess 91 2,348 3,111 1,871 1,828 Pipeline Operations (Excluding Depreciation) 11967 10725 10343 9122 7732 (i) Octroi & Port Trust Charges 6,083 4,896 4,057 4,184 4,523 Other Operating Costs 395726 419425 363729 298380 247526 Sub-Total (a to i) 306,836 299,174 284,369 269,402 247,631 Exchange Loss/(Gain) (10671) 11716 1018 (2675) (463)(Accretion) / Decretion in stock 17,229 (5,285) (11,205) (4,641) (8,917) Recouped CostsProduction, Transportation, Selling and Distribution Expenditure 790,530 898,504 813,428 632,912 487,776 (a) Depletion 62242 55883 49259 46439 34318 Provisions and Writ-of fs 10,876 10,315 22,243 11,599 9,635 (b) Depreciation 20767 21822 27874 29060 28556 Exchange Loss (465) (650) 4,206 11,925 42 (c) Amortisation 104815 81110 62837 46925 41001 Adjustments relating to Prior Period (Net) 3,135 (2,423) (1) (241) 112 (d) Impairment (433) (3110) (437) 1730 (326)Exploration Costs Writ ten of f Sub-Total (a to d) 187391 155705 139533 124154 103549 -Survey Costs 20,835 17,471 18,078 14,947 19,542 Total Cost & Expenses 797804 827534 754648 645392 534167 -Exploratory Well Costs 88,679 67,410 92,379 90,189 73,078 Operating Income Before Interest &Tax 287983 278087 281835 253480 221687 Profit Before Depreciation, Interest &Tax 482,658 566,435 489,892 532,845 461,154 InterestDepreciation, Depletion, Amortisation and Impairment 180,330 166,057 117,633 131,866 113,644 -Payments 5564 2386 1135 1906 1597 Total Cost & Expenses 1,417,985 1,450,573 1,341,130 1,157,958 942,543 -Receipts 21995 35336 28510 21147 13312 Operating Income Before Interest &Tax 302,328 400,377 372,259 400,979 347,510 -Net (16431) (32950) (27375) (19241) (11715)Interest Payment 28,624 6,243 4,838 4,349 4,377 Profit before Tax and Extraordinary Items 304414 311037 309210 272721 233402 Profit before Tax and Extraordinary Items 273,704 394,134 367,421 396,630 343,133 Extraordinary Items- Excess of Insurance Claims over Book Value 0 658 0 4751 6405 Exceptional item - - 31,405 - Profit before Tax 304414 311695 309210 277472 239807 Profit before Tax 273,704 394,134 367,421 428,035 343,133 Corporate Tax ( Net) 107138 110094 106999 98454 84932 Corporate Tax (Net) 96,975 127,604 127,519 143,746 114,883 Profit af ter Tax 197276 201601 202211 179018 154875 Profit af ter Tax 176,729 266,530 239,902 284,289 228,250 Share in Associates for the year 78 99 21 102 107 Share in Associates for the year 303 118 38 (11) 30 Profit relating to minority 3319 3747 3509 1424 1006 Profit relating to minority (6,303) 1,583 (2,256) 2,842 3,720 Group Profit af ter Tax 194035 197953 198723 177696 153976 Group Profit af ter Tax 183,335 265,065 242,196 281,436 224,560 Profit & Loss Account Balance b/f 93335 58990 28795 8848 1 Profit & Loss Account Balance brought forward 233,115 205,773 179,959 144,332 116,377 Adjustments (21) -107 0 0 0 Adjustments due to change in share holding /other adjustment 1 46 59 44 (137) Dividend 70583 68444 68444 66305 64167 Transfer to Capital Redemption Reserve - - 46 46 - Tax on Dividend 11992 12017 12014 10383 9172 Dividend 81,277 81,277 81,277 83,416 74,859 Retained Earnings For The Year 204774 176375 147060 109856 80638 Tax on Dividend 16,317 13,842 13,053 13,611 12,528 Transfer to Self Insurance Reserves 4 - - - - Transfer to general Reserve 80,755 132,250 117,757 144,461 104,773 Transfer to Debenture Redemption Reserve 24,003 10,400 4,308 4,319 4,308 Retained Earnings For The Year 214,095 233,115 205,773 179,959 144,332
Statement of Income and Retained Earnings of ONGC Group
(` in million) 2013-14 2012-13 2011-12 2010-112014-15
In view of the Notification no. S.O 447(E) dated 28.02.2011, issued by Ministry of Corportae Af fairs, the Balance sheet of the Company is mandatorily required to be prepared in Revised Schedule VI w.e.f 1 April, 2011 onwrads
Accordingly, the figures of FY 2014-15, FY 2013-14, FY 2012-13, FY 2011-12 and FY 2010-11 are given as per the requirement of Revised Schedule VI and earlier years figures are as per Old Schedule VI.
st st(Schedule III af ter implementation of Companies Act, 2013 w.e.f. 1 April, 2014).

Statement of Income and Retained Earnings of ONGC Group
269
REVENUES REVENUESSales SalesCrude Oil 663,998 654,029 621,576 640,041 558,993 Crude Oil 527,312 491,127 543,631 475,295 382,311 Natural Gas 203,153 194,594 174,558 151,320 135,329 Natural Gas 81,405 82,835 78,560 80,117 73,383 LPG 34,380 30,145 31,484 23,711 18,368 LPG 21,924 22,752 20,169 14,867 16,279 Naptha 50,835 75,743 76,805 72,167 56,342 Naptha/Aromatic Rich Naptha 47,137 48,406 43,848 37,907 35,679 Ethane/Propane 10,064 14,837 13,440 12,741 8,796 Ethane/Propane 10,249 9,890 9,291 9,095 7,401 Superior Kerosene Oil 2,770 2,779 3,686 1,520 679 Superior Kerosene Oil 3,255 16,701 10,775 15,754 10,605 HSD 312 522 170 103 134 HSD 156 61,910 48,621 42,037 23,403 Motor Spirit - - - 30 - Motor Spirit 27 11,062 9,159 4,530 3,797 Others 676,896 796,713 727,355 599,982 447,972 Others 370,250 349,257 254,297 1,83,064 188,892 Price Revision Arrears - - - Price Revision Arrears - - - 11 156 Sub- Total 1,642,408 1,769,362 1,649,074 1,501,615 1,226,613 Sub- Total 1,061,715 1,093,940 1,018,351 862,677 741,906 Traded Products 60 44 43 34 172 Write Back of Excess Liability - -Other Operating Revenue 18,201 12,645 9,365 9,354 26,088 Pipeline Revenue 3,126 5,267 4,644 3,351 3,214 Total Revenue from Operations 1,660,669 1,782,051 1,658,482 1,511,003 1,252,873 Other Receipts 17,217 9,858 12,387 23,029 11,279 Other Non-operating Income 59,644 68,899 54,907 47,934 37,180 Accretion / (Decretion) in stock 3,729 (3,444) 1,101 9,815 (545)Total Revenues 1,720,313 1,850,950 1,713,389 1,558,937 1,290,053 Total Revenues 1,085,787 1,105,621 1,036,483 898,872 755,854 COST & EXPENSES COST & EXPENSESOperating, Selling & General Operating, Selling & GeneralStatutory Levies (a) Royalties 103,561 111,574 121,057 104,558 85,242 (a) Royalties 141,451 150,102 137,210 155,316 126,529 (b) Cess/ Excise Duty 98,831 103,571 108,838 100,160 76,755 (b) Cess 102,535 99,734 99,971 57,831 56,963 (c) Natural Calamity Contingent Duty - Crude Oil 1,062 1,081 1,127 1,149 1,080 (c) Motor Spirit Cess - 3 (d) Sales Tax 3,734 7,823 2,947 6,009 10,299 (d) Excise Duty 52,669 37,432 34,732 37,427 51,544 (e) Education Cess* 1,719 1,784 1,861 1,303 -(e) Natural Calamity Contingent Duty - Crude Oil 1,123 1,097 1,101 1,097 1,114 (f) Octroi & Port Trust Charges 4,484 4,130 4,195 3,232 2,447 (f) Sales Tax 2,586 3,123 3,834 3,339 3,112 (g) VAT 816 800 685 1,063 927 (g) Service Tax 298 439 353 8,337 2,018 Sub-Total (a to f) 213,391 229,963 240,025 216,411 175,823 (h) Education Cess 91 2,348 3,111 1,871 1,828 Pipeline Operations (Excluding Depreciation) 11,967 10,725 10,343 9,122 7,732 (i) Octroi & Port Trust Charges 6,083 4,896 4,057 4,184 4,523 Other Operating Costs 395,726 419,425 363,729 298,380 247,526 Sub-total (a to i) 306,836 299,174 284,369 269,402 247,631 Exchange Loss/(Gain) (10,671) 11,716 1,018 (2,675) (463)(Accretion) / Decretion in stock 17,229 (5,285) (11,205) (4,641) (8,917) Recouped CostsProduction, Transportation, Selling and Distribution Expenditure 790,530 898,504 813,428 632,912 487,776 (a) Depletion 62,242 55,883 49,259 46,439 34,318 Provisions and Writ-of fs 10,876 10,315 22,243 11,599 9,635 (b) Depreciation 20,767 21,822 27,874 29,060 28,556 Exchange Loss (465) (650) 4,206 11,925 42 (c) Amortisation 104,815 81,110 62,837 46,925 41,001 Adjustments relating to Prior Period (Net) 3,135 (2,423) (1) (241) 112 (d) Impairment (433) (3,110) (4,37) 1,730 (326)Exploration Costs Writ ten of f Sub-Total (a to d) 187,391 155,705 139,533 124,154 103,549 -Survey Costs 20,835 17,471 18,078 14,947 19,542 Total Cost & Expenses 797,804 827,534 754,648 645,392 534,167 -Exploratory Well Costs 88,679 67,410 92,379 90,189 73,078 Operating Income Before Interest &Tax 287,983 278,087 281,835 253,480 221,687 Profit Before Depreciation, Interest &Tax 482,658 566,435 489,892 532,845 461,154 InterestDepreciation, Depletion, Amortisation and Impairment 180,330 166,057 117,633 131,866 113,644 -Payments 5,564 2,386 1,135 1,906 1,597 Total Cost & Expenses 1,417,985 1,450,573 1,341,130 1,157,958 942,543 -Receipts 21,995 35,336 28,510 21,147 13,312 Operating Income Before Interest &Tax 302,328 400,377 372,259 400,979 347,510 -Net Interest (16,431) (32,950) (27,375) (19,241) (11,715)Interest Payment 28,624 6,243 4,838 4,349 4,377 Profit before Tax and Extraordinary Items 304,414 311,037 309,210 272,721 233,402 Profit before Tax and Extraordinary Items 273,704 394,134 367,421 396,630 343,133 Extraordinary Items- Excess of Insurance Claims over Book Value - 658 - 4,751 6,405 Exceptional item - - 31,405 - Profit before Tax 304,414 311,695 309,210 277,472 239,807 Profit before Tax 273,704 394,134 367,421 428,035 343,133 Corporate Tax (Net) 107,138 110,094 106,999 98,454 84,932 Corporate Tax ( Net) 96,975 127,604 127,519 143,746 114,883 Profit af ter Tax 197,276 201,601 202,211 179,018 154,875 Profit af ter Tax 176,729 266,530 239,902 284,289 228,250 Share in Associates for the year 78 99 21 102 107 Share in Associates for the year 303 118 38 (11) 30 Profit relating to minority 3,319 3,747 3,509 1,424 1,006 Profit relating to minority (6,303) 1,583 (2,256) 2,842 3,720 Group Profit af ter Tax 194,035 197,953 198,723 177,696 153,976 Group Profit af ter Tax 183,335 265,065 242,196 281,436 224,560 Profit & Loss Account Balance brought forward 93,335 58,990 28,795 8,848 1 Profit & Loss Account Balance b/f 233,115 205,773 179,959 144,332 116,377 Adjustments (21) -107 - - - Adjustments due to change in share holding /other adjustment 1 36 59 44 (137) Dividend 70,583 68,444 68,444 66,305 64,167 Transfer to Capital Redemption Reserve - - 46 46 - Tax on Dividend 11,992 12,017 12,014 10,383 9,172 Dividend 81,277 81,277 81,277 83,416 74,859 Retained Earnings For The Year 204,774 176,375 147,060 109,856 80,638 Tax on Dividend 16,317 13,842 13,053 13,611 12,528 Transfer to Self Insurance Reserves 4 - - - - Transfer to general Reserve 80,755 132,250 117,757 144,461 104,773 Transfer to Debenture Redemption Reserve 24,003 10,400 4,308 4,319 4,308 Retained Earnings For The Year 214,095 233,105 205,773 179,959 144,332
Statement of Income and Retained Earnings of ONGC Group
( in million) ` 2009-10 2008-09 2007-08 2006-07 2005-06
*upto 2005-06 Education Cess is included in respective heads of levies

Annual Report 2014-15
Statement of Financial Position of ONGC Group
270
RESOURCES RESOURCESA. Own A. Own Net Worth 1. Net Worth
(a) Equity (a) Equityi) Share Capital 42,778 42,778 42,778 42,778 42,778 i) Share Capital 21389 21389 21535 21416 14259 ii) Reserves & Surplus 1,761,766 1,678,738 1,482,498 1,321,614 1,110,495 ii)Reserves & Surplus 992677 900846 759331 645719 553421
Sub-Total 1,804,544 1,721,516 1,525,276 1,364,392 1,153,273 Sub-Total 1014066 922235 780866 667135 567680 (b) Less: Miscelaneous Expenditure 9,802 10960 14,859 11,726 7,961 (b) Less Def fered Revenue Expenditure 8413 6506 6739 5141 3663 Net Worth 1,794,742 1,710,556 1,510,417 1,352,666 1,145,312 Net Worth 1005653 915729 774127 661994 564017
B. Long-term Borrowings 475,827 316,809 88,428 52,086 39,771 2. Long Term LiabilitiesC. Deferred Tax Liability (Net) 181,759 178,635 142,251 121,846 111,526 Net Deferred Tax Liability 102912 92231 87376 81119 71633 D. Minority Interest 24,731 29,120 19,466 22,240 19,891 Total Own Funds ( 1 + 2 ) 1108565 1007960 861503 743113 635650 TOTAL RESOURCES ( A+B+C+D ) 2,477,059 2,235,120 1,760,562 1,548,838 1,316,500 B. Minority Interest 16432 14113 11448 8321 7230 DISPOSITION OF RESOURCES C. OutsideA. Non-current assets 1. Unsecured Loans
1. Fixed Assets(Net) a) Indian Loans 34550 6015 2079 1881 1745 i). Tangible assets 686,712 462,254 406,745 306,080 266,924 b) Foreign Loans 10260 1492 1458 4526 13181 ii) Producing Properties 910,049 912,681 705,395 608,004 571,896 Total Unsecured Loans 44810 7507 3537 6407 14926 iii) Intangible assets 1,169 754 1,041 1,364 1,735 2. Secured Loans 6959 5584 5890 6557 7416
Total Block Capital 1,597,930 1,375,689 1,113,181 915,448 840,555 Total Outside Resources 51769 13091 9427 12964 22342 2. Goodwill on consolidation 201,399 183,545 83,255 77,976 89,928 TOTAL RESOURCES ( A+ B+C ) 1176766 1035164 882378 764398 665222 3. Long-term Loans and Advances(Excluding Capital Advance) 93,620 83,077 67,002 51,029 58,250 4. Deposit with Bank Under Site Restoration Fund Scheme 136,424 120,830 106,349 94,753 81,262 DISPOSITION OF RESOURCES5. Other non-current Assets (Excluding DRE) 71,662 53,474 19,642 20,302 5,619 A. Goodwill on consolidation 95385 114039 25777 30616 17103 6. Sub Total (1+2+3+4+5) 2,101,035 1,816,615 1,389,429 1,159,508 1,075,614 B. Block Capital7. Less: Non-current Liabilities 1. Fixed Assets 243762 184956 193961 185355 138806
a. Other Long Term Liabilities 18,294 18,467 17,163 10,758 9,731 2 Producing Properties (Gross) 511665 452980 362714 351741 312639 b. Liability for Abandonment Cost 298,198 274,266 207,255 203,982 198,469 Less: Libility for Abandonment Cost 174590 171451 129325 151857 128675 c. Long Term Provisions 29,598 31,034 45,707 37,758 33,384 Total Block Capital 580837 466485 427350 385239 322770 Sub total (7) 346,090 323,767 270,125 252,498 241,584 C. Working Capital
Net Non Current Asset (A)=(6)-(7) 1,754,945 1,492,848 1,119,304 907,010 834,030 a) Current AssetsB. Net Working Capital i) Inventories 82400 65424 72985 58744 49432
1. Current Assets ii) Debtors (Net of Provision) 71424 71814 70469 48167 44271 i) Inventories 106,062 148,015 127,726 131,680 85,676 iii) Cash & Bank Balances 149704 156331 186525 150653 45721 ii) Trade Receivables 187,970 160,290 153,956 117,181 99,730 iv) Deposit with Bank Under Site Restoration Fund Scheme# 74138 69624 64034 56103 45336 iii) Cash & Cash equivalents 160,969 244,801 196,190 278,914 208,158 v) Loans & Advances and Others 127998 143953 81332 74738 120683 iv) Short-term Loans & Advances 100,330 66,317 59,766 52,210 40,124 Sub-Total 505664 507146 475345 388405 305443 v) Others Current Assets (Excluding DRE) 9,658 8,135 9,082 19,643 5,955 Less
Sub-Total 564,989 627,558 546,720 599,628 439,643 (b) Current Liabilities and ProvisionsLess: and Short Term Loans 312877 334889 235143 185997 132279 2. Current Liabilities Working Capital 192787 172257 240202 202408 173164
i) Short-term borrowings 42,886 139,073 115,271 100,538 20,843 D. CAPITAL EMPLOYED 869009 752781 693329 618263 513037 ii) Trade payables 303,873 306,803 186,148 176,036 155,863 E. INVESTMENTS 51593 34803 44821 35832 35579 iii) Other current liabilities 168,669 217,039 170,869 202,917 176,615 F. CAPITAL WORKS IN PROGRESS 176039 165222 86351 64055 76292 iv) Short-term provisions 22,592 9,500 10,533 23,924 11,085 G. EXPLORATORY/DEVELOPMENT WELLS IN PROGRESS 80125 82358 57877 46248 40314
Sub-Total 538,020 672,415 482,821 503,415 364,406 Net Working Capital 26,969 (44,857) 63,899 96,213 75,237 TOTAL DISPOSITION 1176766 1035164 882378 764398 665222 C. Capital Employed 1,781,914 1,447,991 1,183,203 1,003,223 909,267 # Excluded for Current Ratio.D. Investments
i) Non-current Investments 47,470 47,205 20,453 20,412 28,920 ii) Current Investments 21 254 829 8,795 2,080
E. Capital Works in Progress (Including Capital Advance) 435,687 557,603 419,676 399,855 273,854 F. Exploratory/Development Wells in Progress 211,967 182,067 136,401 116,553 102,379
TOTAL DISPOSITION (C+D+E+F) 2,477,059 2,235,120 1,760,562 1,548,838 1,316,500
Statement of Financial Position of ONGC Group
(` in million) 2013-14 2012-13 2011-12 2010-112014-15
In view of the Notification no. S.O 447(E) dated 28.02.2011, issued by Ministry of Corportae Af fairs, the Balance sheet of the Company is mandatorily required to be prepared in Revised Schedule VI w.e.f 1 April, 2011 onwrads
Accordingly, the figures of FY 2014-15, FY 2013-14, FY 2012-13, FY 2011-12 and FY 2010-11 are given as per the requirement of Revised Schedule VI and earlier years figures are as per Old Schedule VI.
st (Schedule III af ter implementation of Companies Act., st2013 w.e.f. 1 April, 2014).

Statement of Financial Position of ONGC Group
271
RESOURCES RESOURCESA. Own A. Own1. Net Worth 1. Net Worth
(a) Equity (a) Equityi) Share Capital 42,778 42,778 42,778 42,778 42,778 i) Share Capital 21,389 21,389 21,535 21,416 14,259 ii) Reserves & Surplus 1,761,766 1,678,738 1,482,498 1,321,614 1,110,495 ii)Reserves & Surplus 992,677 900,846 759,331 645,719 553,421
Sub-Total 1,804,544 1,721,516 1,525,276 1,364,392 1,153,273 Sub-Total 1,014,066 922,235 780,866 667,135 567,680 (b) Less Miscelaneous Expenditure 9,802 10960 14,859 11,726 7,961 (b) Less: Def fered Revenue Expenditure 8,413 6,506 6,739 5,141 3,663 Net Worth 1,794,742 1,710,556 1,510,417 1,352,666 1,145,312 Net Worth 1,005,653 915,729 774,127 661,994 564,017
B. Long-term Borrowings 475,827 316,809 88,428 52,086 39,771 2. Long Term LiabilitiesC. Deferred Tax Liability (Net) 181,759 178,635 142,251 121,846 111,526 Net Deferred Tax Liability 102,912 92,231 87,376 81,119 71,633 D. Minority Interest 24,731 29,120 19,466 22,240 19,891 Total Own Funds ( 1 + 2 ) 1,108,565 1,007,960 861,503 743,113 635,650 TOTAL RESOURCES ( A+B+C+D ) 2,477,059 2,235,120 1,760,562 1,548,838 1,316,500 B. Minority Interest 16,432 14,113 11,448 8,321 7,230 DISPOSITION OF RESOURCES C. OutsideA. Non-current assets 1. Unsecured Loans
1. Fixed Assets( Net) a) Indian Loans 34,550 6,015 2,079 1,881 1,745 i). Tangible assets 686,712 462,254 406,745 306,080 266,924 b) Foreign Loans 10,260 1,492 1,458 4,526 13,181 ii) Producing Properties 910,049 912,681 705,395 608,004 571,896 Total Unsecured Loans 44,810 7,507 3,537 6,407 14,926 iii) Intangible assets 1,169 754 1,041 1,364 1,735 2. Secured Loans 6,959 5,584 5,890 6,557 7,416 Total Block Capital 1,597,930 1,375,689 1,113,181 915,448 840,555 Total Outside Resources 51,769 13,091 9,427 12,964 22,342 2. Goodwill on consolidation 201,399 183,545 83,255 77,976 89,928 TOTAL RESOURCES ( A+ B+C ) 1,176,766 1,035,164 882,378 764,398 665,222 3. Long-term Loans and Advances(Excluding Capital Advance) 93,620 83,077 67,002 51,029 58,250 4. Deposit with Bank Under Site Restoration Fund Scheme 136,424 120,830 106,349 94,753 81,262 DISPOSITION OF RESOURCES5. Other non-current Assets (Excluding DRE) 71,662 53,474 19,642 20,302 5,619 A. Goodwill on consolidation 95,385 114,039 25,777 30,616 17,103 Subtotal (6)= (1+2+3+4+5) 2,101,035 1,816,615 1,389,429 1,159,508 1,075,614 B. Block Capital7. Less Non-current Liabilities 1. Fixed Assets 243,762 184,956 193,961 185,355 138,806
a. Other Long Term Liabilities 18,294 18,467 17,163 10,758 9,731 2 Producing Properties (Gross) 511,665 452,980 362,714 351,741 312,639 b. Libility for Abandonment Cost 298,198 274,266 207,255 203,982 198,469 Less: Liability for Abandonment Cost 174,590 171,451 129,325 151,857 128,675 c. Long Term Provisions 29,598 31,034 45,707 37,758 33,384 Total Block Capital 580,837 466,485 427,350 385,239 322,770
Sub total (7) 346,090 323,767 270,125 252,498 241,584 C. Working CapitalNet Non Current Asset (A)=(6)-(7) 1,754,945 1,492,848 1,119,304 907,010 834,030 a) Current AssetsB. Net Working Capital i) Inventories 82,400 65,424 72,985 58,744 49,432 1. Current Assets ii) Debtors (Net of Provision) 71,424 71,814 70,469 48,167 44,271
i) Inventories 106,062 148,015 127,726 131,680 85,676 iii) Cash & Bank Balances 149,704 156,331 186,525 150,653 45,721 ii) Trade Receivables 187,970 160,290 153,956 117,181 99,730 iv) Deposit with Bank Under Site Restoration Fund Scheme# 74,138 69,624 64,034 56,103 45,336 iii) Cash & Cash equivalents 160,969 244,801 196,190 278,914 208,158 v) Loans & Advances and Others 127,998 143,953 81,332 74,738 120,683 iv) Short-term Loans & Advances 100,330 66,317 59,766 52,210 40,124 Sub-Total 505,664 507,146 475,345 388,405 305,443 v) Others Current Assets (Excluding DRE) 9,658 8,135 9,082 19,643 5,955 Less:
Sub-Total 564,989 627,558 546,720 599,628 439,643 (b) Current Liabilities and ProvisionsLess and Short Term Loans 312,877 334,889 235,143 185,997 132,279
2. Current Liabilities Working Capital 192,787 172,257 240,202 202,408 173,164 i) Short-term borrowings 42,886 139,073 115,271 100,538 20,843 D. CAPITAL EMPLOYED 869,009 752,781 693,329 618,263 513,037 ii) Trade payables 303,873 306,803 186,148 176,036 155,863 E. INVESTMENTS 51,593 34,803 44,821 35,832 35,579 iii) Other current liabilities 168,669 217,039 170,869 202,917 176,615 F. CAPITAL WORKS IN PROGRESS 176,039 165,222 86,351 64,055 76,292 iv) Short-term provisions 22,592 9,500 10,533 23,924 11,085 G. EXPLORATORY/DEVELOPMENT WELLS IN PROGRESS 80,125 82,358 57,877 46,248 40,314 Sub-Total 538,020 672,415 482,821 503,415 364,406 Net Working Capital 26,969 (44,857) 63,899 96,213 75,237 TOTAL DISPOSITION 1,176,766 1,035,164 882,378 764,398 665,222 D. Capital Employed 1,781,914 1,447,991 1,183,203 1,003,223 909,267 E Investments i) Non-current Investments 47,470 47,205 20,453 20,412 28,920
ii) Current Investments 21 254 829 8,795 2,080 3. Capital Works in Progress (Including Capital Advance) 435,687 557,603 419,676 399,855 273,854 4. Exploratory/Development Wells in Progress 211,967 182,067 136,401 116,553 102,379
TOTAL DISPOSITION (A+B) 2,477,059 2,235,120 1,760,562 1,548,838 1,316,500
Statement of Financial Position of ONGC Group
( in million) ` 2009-10 2008-09 2007-08 2006-07 2005-06
# Excluded for Current Ratio.

Annual Report 2014-15
272
Independent Auditors’ Report on Consolidated Financial Statements
Auditors’ Report on Consolidated Financial Statements
To
The Members of Oil and Natural Gas Corporation Limited1. Report on the Consolidated Financial Statements
We have audited the accompanying consolidated financial statements of Oil and Natural Gas Corporation Limited (“hereinaf ter referred to as “the Holding Company ”) and its subsidiaries (the Holding Company and its subsidiaries together referred to as “the Group”), its associate and jointly control entities, comprising of the Consolidated Balance Sheet as at March 31, 2015, the Consolidated Statement of Profit and Loss, the Consolidated Cash Flow Statement for the year then ended and a summary of the significant accounting policies and other explanatory information (hereinaf ter referred to as “the consolidated financial statements”).
2. Management’s Responsibility for the Consolidated Financial StatementsThe Holding Company’s Board of Directors is responsible for the preparation of these consolidated financial statements in terms of the requirements of the Companies Act 2013 (“hereinaf ter referred to as “the Act”) that give a true and fair view of the consolidated financial position, consolidated financial performance and consolidated cash flows of the Group including its Associate and Jointly Controlled entities in accordance with the accounting principles generally accepted in India, including the Accounting Standards specified under Section 133 of the Act, read with Rule 7 of the Companies (Accounts) Rules, 2014. The respective Board of Directors of the companies included in the Group and of its Associate and Jointly Controlled Entities are responsible for maintenance of adequate accounting records in accordance with the provisions of the Act for safeguarding the assets of the Group and for preventing and detecting frauds and other irregularities; the selection and application of appropriate accounting policies; making judgments and estimates that are reasonable and prudent; and the design, implementation and maintenance of adequate internal financial controls, that were operating ef fectively for ensuring the accuracy and completeness of the accounting records, relevant to the preparation and presentation of the financial statements that give a true and fair view and are free from material misstatement, whether due to fraud or error, which have been used for the purpose of preparation of the consolidated financial statements by the Directors of the Holding Company, as aforesaid.
3. Auditor’s ResponsibilityOur responsibility is to express an opinion on these consolidated financial statements based on our audit. While conducting the audit, we have taken into account the provisions of the Act, the accounting and auditing standards and matters which are required to be included in the audit report under the provisions of the Act and the Rules made thereunder.We conducted our audit in accordance with the Standards on Auditing specified under Section 143(10) of the Act. Those Standards require that we comply with ethical requirements and plan and perform the audit to obtain reasonable assurance
about whether the consolidated financial statements are free from material misstatement.An audit involves performing procedures to obtain audit evidence about the amounts and the disclosures in the consolidated financial statements. The procedures selected depend on the auditor’s judgement, including the assessment of the risks of material misstatement of the consolidated financial statements, whether due to fraud or error. In making those risk assessments, the auditor considers internal financial control relevant to the Holding Company’s preparation of the consolidated financial statements that give a true and fair view in order to design audit procedures that are appropriate in the circumstances but not for the purpose of expressing an opinion on whether the Holding company has an adequate internal financial controls system over financial reporting in place and the operating ef fectiveness of such controls. An audit also includes evaluating the appropriateness of the accounting policies used and the reasonableness of the accounting estimates made by the Holding company’s Board of Directors, as well as evaluating the overall presentation of the consolidated financial statements.We believe that the audit evidence obtained by us and the audit evidence obtained by the other auditors in terms of their reports referred to in sub-paragraph6(iii) of the Other Matters paragraph below, is suf ficient and appropriate to provide a basis for our audit opinion on the consolidated financial statements.
4. OpinionIn our opinion and to the best of our information and according to the explanations given to us, the aforesaid consolidated financial statements give the information required by the Act in the manner so required and give a true and fair view in conformity with the accounting principle generally accepted in India, of the consolidated state of af fairs of the Group, its associate and jointly controlled entities as at March 31, 2015, and their consolidated profit and their consolidated cash flows for the year ended on that date.
5. Emphasis of Matters i. We draw at tention to Note no. 46.2.5 to the
consolidated financial statements with regard to the dispute between the Holding company and the Government of Gujarat in respect of payment of Royalty on the crude oil produced in the State. The accrual of the additional liability of 117,242.00 million, (reduced to the extent `16,440.00 million paid to Gujarat Government- refer Note no. 32.4 to the consolidated financial Statements), against which an amount of 21,067.60 million has been paid with ef fect from February 1, 2014 and considered as deposit, would depend on the decision of the Hon'ble Supreme Court of India. The amount of `117,242.00 million has been disclosed as contingent liability.
ii. Based on the report of the auditors on the financial statements of one of the subsidiary, ONGC Videsh Limited:a. We draw at tention to Note No. 44.9 of the
consolidated financial statements relating to Impairment Testing of CGU, Imperial Energy,

Auditors’ Report on Consolidated Financial Statements
273
Russia as conducted by the management, where the auditors have stated that they have relied upon the results of the Impairment Testing wherein no additional Impairment provision is required.
b. The company has outsourced its internal audit of the corporate of fice, overseas subsidiaries and overseas project of fices during the year. In respect of which the Auditors have stated that the system of internal audit needs to be strengthened particularly with reference to timely execution of internal audit as defined in the scope and submission of its final reports to Audit Committee.
iii. Based on the report of the auditors on the financial statements on one of the Jointly Controlled Entity, Mangalore SEZ Limited, “Dues from” and “Dues to” related parties are based on the books of account of the company and the confirmation of the balances have not been obtained.
Our opinion is not modified in respect of these matters.
6. Other Matters
i. The consolidated financial statements include the Holding Company’s share in the total value of assets, liabilities, expenditure and income of 134 blocks under New Exploration Licensing Policy (NELPs) / Joint
Venture (JVs) accounts for exploration and production out of which 6 NELPs / JVs accounts have been certified by other Chartered Accountants and 17 NELP / JVs have been certified by the management in respect of NELPs / JVs operated by other operators. Our opinion is based solely on the certificate of the other Chartered Accountants and management certified accounts.
ii. We have placed reliance on technical/commercial evaluation by the management in respect of categorization by the Holding Company of wells as exploratory, development, producing and dry well, allocation of cost incurred on them, proved developed hydrocarbon reserves and depletion thereof on producing proper ties, impairment, liabilit y for abandonment costs, liability for NELP and nominated blocks for under performance against agreed Minimum Work Programme and allocation of depreciation on process platforms to transportation and facilities.
iii.We did not audit the financial statements of three subsidiaries and six Jointly Controlled Entities whose financial statements reflect total assets as at March 31, 2015 total revenues and net cash inflow/(out flow) for the year ended on that date considered as under in the consolidated financial statements:
Subsidiaries
Jointly Controlled Entities
Name of the Subsidiary Total Assets as at March 31, 2015#
ONGC Videsh Limited (OVL) 986,025.26 191,488.86 1,476.58
Mangalore Refinery andPetrochemicals Limited (MRPL) $ 412,026.76 579,169.14 (38,091.79)
Total Revenue for the year Net Cashstended 31 March, 2015# Inflow/(Outflow)#
Name of the Jointly Group Effective share Group Effective share Group Effective shareControlled Entities in Total Assets as at in Total Revenue for in Net Cash Inflow/
31st March, 2015 the year ended (Outflow)31st March, 2015
Petronet LNG Limited $ 13,898.35 49,569.66 (1,087.05)Petronet MHB Limited $ 1,679.00 417.83 (268.58)ONGC Teri Biotech Limited $ 248.98 96.85 4.15Mangalore SEZ Limited # 3,838.44 198.94 (129.09)ONGC Tripura Power Company Limited # 25,167.76 3,850.36 2,836.86ONGC Petro Additions Limited $ 108,862.70 - (2,965.48)
(` in million)
(` in million)
# As per the Consolidated financial statements of OVL/MRPL.$ Consolidated financial statements of MRPL includes its subsidiary, ONGC Mangalore Petrochemicals Limited, which is an indirect Subsidiary of the Holding Company.
# As per the Consolidated Financial Statements of the Jointly Controlled Entities. $ As per the Standalone Financial Statements of the Jointly Controlled Entities.
These financial statements have been audited by other auditors whose reports have been furnished to us by the Management and our opinion on the consolidated financial statements, in so far as it relates to the amounts and disclosures included in respect of these subsidiaries and
jointly controlled entities, and our report in terms of sub-sections (3) and (11) of section 143 of the Act, in so far as it relates to the aforesaid subsidiaries and jointly controlled entities, is based solely on the reports of the other auditors.

Annual Report 2014-15
Auditors’ Report on Consolidated Financial Statements
274
iv. We did not audit the financial statements of one Jointly Controlled Entity whose financial statements reflect total assets as at March 31, 2015 total revenues and net
cash inflow/(out flow) for the year ended on that date considered as under in the consolidated financial statements:
repor ts of the Holding company, subsidiary companies and jointly controlled companies incorporated in India, we give in the Annexure a statement on the matters specified in the paragraphs 3 and 4 of the Order, to the extent applicable.
2. Based on the comments in the auditors’ reports of the Holding company and the subsidiary companies /jointly controlled companies incorporated in India as referred to in para 6(iii) above, we report that a paragraph on the directions issued by the Comptroller and Auditors General of India in terms of section 143 (5) of the Act has been included in respect of the auditors’ report of Holding Company and MRPL, a subsidiary. Accordingly, we give below a report on the directions issued by the Comptroller and Auditors General of India in terms of section 143 (5) of the Act:
a. The Holding company and MRPL have not been selected for disinvestment.
b. According to information and explanations givento us, the cases of waiver/write of f of debts/loans/interest wherever applicable during the year along with the reasons and amounts involved are stated in Annexure 2.
c. The Holding company and MRPL have maintained adequate records in respect of inventories lying with third parties and assets received as a gif t from Government or other authorities, wherever so received.
d. In case of Holding company, we have carried out a review of age wise analysis of significant pending legal/arbitration cases based on the information and explanations made available to us and report that the reasons for the pendency are mainly on account of adjournment and other matters related to legal procedures. We also report that the holding company has in place a monitoring mechanism for expenditure incurred on such cases. In case of MRPL, a subsidiary, a repor t on age wise analysis of pending legal/arbitration cases including the reasons for pendency and existence/ef fectiveness of a
This financial statements are unaudited and have been furnished to us by the management and our opinion on the consolidated financial statements in so far as its relates to the amounts and disclosures included in respect of this jointly controlled entity, and our report in terms of sub-sections (3) and (11) of section 143 of the Act, in so far as it relates to the aforesaid jointly controlled entity, is based solely on such unaudited financial statements. In our opinion and according to information and explanations given to us by the Management, these financial statements are not material to the Group.
v. The consolidated financial statements also include the group share of net profit of `303.10 million for theyear ended March 31, 2015 as considered in the consolidated financial statements, in respect of Pawan Hans Limited, an associate whose financial information has not been audited by us. This financial information is unaudited and have been furnished to us by the management and our opinion on the consolidated financial statements in so far as its relates to the amounts and disclosures included in respect of this associate, and our report in terms of sub-sections (3) and (11) of section 143 of the Act, in so far as it relates to the aforesaid associate, is based solely on unaudited financial information. In our opinion and according to information and explanations given to us by the Management, this financial information is not material to the Group.
Our opinion on the consolidated financial statements, and our report on Other Legal and Regulatory Requirements below, is not modified in respect of the above matters with respect to our reliance on the work done and the reports of the other auditors and the financial statements certified by the Management.
7. Repor t on Other Legal and Regulator y Requirements
1. As required by the Companies (Auditors Report) Order, 2015 (“the Order”), issued by the Central Government of India in terms of the section 143(11) of the Act, based on the comments in the auditors’
Jointly Controlled Entity
Name of the Jointly Group Effective share Group Effective share Group Effective shareControlled Entity in Total Assets as at in Total Revenue for in Net Cash Inflow/
st31 March, 2015 the year ended (Outflow)st31 March, 2015
Dahej SEZ Limited $ 4,756.58 287.53 148.09
(` in million)
$ As per the Standalone Financial Statements of the Jointly Controlled Entity.

Auditors’ Report on Consolidated Financial Statements
275
subsidiaries and jointly controlled companies incorporated in India, none of the directors of the Group companies, and joint controlled companies incorporated in India is disqualified as on March 31, 2015 from being appointed as a directors in terms of Section 164 (2) of the Act.
f. The mat ter described under “Emphasis of Matters” para above in the event of being decided unfavorably, in our opinion, may have an adverse impact on the functioning of the Holding Company.
g. With respect to the other matters to be included in Auditor’s Report in accordance with Rule 11 of the Companies (Audit and Auditors) Rules 2014, in our opinion and to the best of our information and according to the explanations given to us:
i. The consolidated financial statements has disclosed the impact of the pending litigations on its financial position of the Group and the Jointly Controlled Entities.– Refer Note 46.2.1 to the consolidated financial statements;
ii. According to information and explanations given to us, the group has made provision for material foreseeable losses in respect of long term contracts including derivative contracts: Refer Note 32.9 to the consolidated financial statements;
iii. There has been no delay in transferring amounts, required to be transferred, to the Investor Education and Protections Fund by the group and its jointly controlled entities incorporated in India.
monitoring mechanism for expenditure incurred on such cases is as stated in Annexure 3.
3. As required by section 143(3) of the Act, we report, to the extent applicable, that:
a. We have sought and obtained all the information and explanations which to the best of our knowledge and belief were necessary for the purposes of our audit of the aforesaid consolidated financial statements.
b. In our opinion, proper books of account as required by law relating to preparation of the aforesaid consolidated financial statements have been kept so far as it appears from our examination of those books and the reports of the other auditors.
c. The Consol idated Balance She et, the Consolidated Statement of Profit and Loss, and the Consolidated Cash Flow Statement dealt with by this Report are in agreement with the relevant books of account maintained for the purpose of preparation of the consolidated financial statements.
d. In our opinion, the aforesaid consolidated financial statements comply with the Accounting Standards specified under Section 133 of the Act, read with Rule 7 of the Companies (Accounts) Rules, 2014.
e. On the basis of the writ ten representations received from the directors of the Holding company as on March 31, 2015 taken on record by the Board of Directors of the holding company and the reports of the statutory auditors of its
For M/s Mehra Goel & Co.Chartered AccountantsFirm Reg No. 000517N
Partner (Mem. No. 017532)
Place : New DelhiDate : May 28, 2015
(R. K. Mehra)Partner (Mem. No. 006102)
For M/s G. D. Apte & Co.Chartered AccountantsFirm Reg No. 100515W
(C. M. Dixit)
For Khandelwal Jain & Co.Chartered AccountantsFirm Reg No. 105049W
(Narendra Jain)Partner (M.No. 048725)
For M/s Varma & VarmaChartered Accountants Firm Reg No. 004532S
(P. R. Prasanna Varma)Partner (M.No. 025854)
For Lodha & Co.Chartered AccountantsFirm Reg. No: 301051E
(R. P. Singh)Partner (M.No. 052438)

Annual Report 2014-15
Auditors’ Report on Consolidated Financial Statements
276
According to the information and explanations given by the management and in our opinion, other than as stated above the discrepancies noticed on physical verification between the physical stock and book records were not material having regard to the size of the holding company and nature of its business. In case where discrepancies noticed on physical verification have been identified with inventory records, necessary adjustments have been carried out in the books of account. In respect of cases where the reconciliation is not complete, the management has stated that the ef fect of the same on the accounts would be adjusted on completion of reconciliation.
iii. (a) & (b) The Subsidiaries and the jointly controlled entities have not granted loans to parties covered in the register maintained under section 189 of the Act, except in case of ONGC Videsh Limited, a subsidiary, where long term loans having outstanding balance of 13,193.23 million as at March 31, 2015, have been granted to its subsidiaries and no amount was due for recovery during the year. The Holding company has granted secured loans to five parties covered in the register maintained under section 189 of the Act. According to the information and explanations given to us and the based on our verification of books of account, the receipt of principal amount and interest are regular and there was no overdue amount in respect of on such loans granted.
iv. In our opinion, the internal control procedures in respect of the Group and its Jointly Controlled Entities are generally adequate and commensurate with the size and the nature of its business with regard to purchases of inventory and fixed assets and for the sale of goods and services. During the course of our audit, we have not observed any continuing failure to correct major weaknesses in internal controls. However, in case of ONGC Videsh Limited, a subsidiary, all purchases of fixed assets and inventory in respect of the non-operated/ operated joint ventures are made outside India by the respective operators in case of a subsidiary OVL. It is not practically feasible or appropriate to check the internal control system being prevalent at respective overseas projects size for non-operated/ operated joint ventures.
v. In our opinion, the Group and its Jointly Controlled Entities have not accepted any deposits as per the provision of the Act. However, in case of one of the subsidiaries, viz. MRPL, though the company has complied with the provisions of section 73 to 76 of
`
i. a. The Group and its jointly controlled entities have generally maintained proper records showing full par ticulars including quantitative details and situation of fixed assets. However, in case of the non-operated Joint Ventures outside India of ONGC Videsh Limited, a subsidiary, the locations of fixed assets should be updated regularly.
b. The fixed assets of the group and its jointly controlled entities (other than those underground/ submerged/ under joint venture operations/assets in case of the Holding company), have been physically verified during the year at reasonable intervals having regard to the size and nature of the business and the discrepancies on such verification were not material. In case of the Holding company the reconciliation of physically verified assets with the book records is in progress. Discrepancies noticed on physical verification and consequential adjustments are carried out on completion of reconciliation. In respect of ONGC Videsh Limited, a subsidiary, since the Physical verification of Fixed assets situated at headquarters amounting to 58.27 million (net book value) is still in Progress, we are unable to comment on material discrepancies, if any.
ii. a. The inventories of the group and its jointly controlled entities have been physically verified during the year by the management. In case of the Holding company, the verification has been conducted in a phased manner excluding inventory lying with third party, at some of the site-locations, inventory with joint venture operations/assets and intra site material in transit. In our opinion, the frequency of verification is reasonable.
b. The procedure of physical verification of inventory in case of the subsidiaries and the jointly controlled entities followed by the management were reasonable and adequate in relation to the size of the companies and nature of their business. In case of Holding company, the procedure of physical verification of inventor y followed by the management needs to be strengthened further.
c. The Subsidiaries and the jointly controlled entities have generally maintained proper records of inventory and the discrepancies noticed on physical verification between the physical stock and book records, which were not material have been properly dealt with in the financial statements. The Holding Company has generally maintained proper records of inventory. During the year, the management of the Holding company has identified certain discrepancies in the physical stock of crude oil which has been writ ten of f as stated on Note No. 49 to the consolidated financial Statements.
Annexure 1 to Consolidated Auditors' Report
(Referred to in paragraph 1 under 'Report on Other Legal and Regulatory Requirements' section of our report of even date)

Auditors’ Report on Consolidated Financial Statements
277
statutory dues including Provident Fund, Investor Education and Protection Fund, Employees’ State Insurance, Income Tax, Sales Tax, Service Tax, Wealth Tax, Duty of Customs, Duty of Excise, Value Added Tax, Cess and other statutory dues with the appropriate authorities. According to the information and explanations given to us, no undisputed amounts payable in respect of the aforesaid dues were outstanding as at March 31, 2015 for a period more than six months from the date of becoming payable.
b. There were no dues in respect of Income Tax, Duty of Excise, Duty of Customs, Cess, Sales Tax, Service Tax, Value Added Tax and Wealth Tax which have not been deposited on account of any dispute except as detailed under where in case of the Jointly Controlled Entities, amounts have been reported to the extent of the ef fective share:
the Act and the rules framed thereunder with regard to filing the statutory returns, there has been delay in filing of the said Return.
vi. We have broadly reviewed the costs records maintained by the Holding company and based on the Auditors report of the subsidiaries and the Jointly Controlled Entities, we are of the opinion that prima facie the prescribed accounts and records pursuant to the Companies (Cost Records and Audit) Rules, 2014, as amended and prescribed by the Central Government under sub section (1) of section 148 of the Act, have been made and maintained wherever applicable. However, we have not made a detailed examination of the cost records with the view to determine whether they are accurate or complete.
vii. a. The Group and its Jointly Controlled entities have generally been regular in depositing undisputed
The Holding Company
Name ofthe statue
Nature of Dues
Forum where dispute is pendingPeriod towhich the amountrelates
(financial)year)
GrossAmountInvolved
AmountPaid
underProtest
Amount Unpaid
(` in million)
CentralExcise Excise, Custom and Service Tax 2002-2007 109.20 108.54 0.66
Act, 1944 /Penalty Custom, Excise and Service TaxAppellate Tribunal 2001-2013 4,116.17 109.37 4,006.80
Hon. High Court 1996-2015 351.33 - 351.33
Hon. Supreme Court 1980-2005 1,283.30 - 1,283.30
Total (A) 5,860.00 217.91 5,642.09
Oil Industries Cess/ Interest Custom, Excise and Service TaxAppellate Tribunal 2004-2009 6.57 - 6.57
Total (B) 6.57 - 6.57
A.P. MineralBearingOrdinance(infrastructure)Cess Rules,2005
Total (C) 2,371.75 - 2,371.75
The CustomAct, 1962
Income TaxAct, 1961 Penalty/
Interest
Total (E) 80,000.44 45,400.86 34,599.58
Central excise Commissioner (Appeals) of Centralduty / Interest
(Development)
Act, 1974
Cess/ Interest Hon. High Court 2005-2014 2,371.75 - 2,371.75
Custom duty / Custom, Excise and Service TaxPenalty / Appellate Tribunal 2007-08 5.00 1.00 4.00 Interest
Total (D) 5.00 1.00 4.00
Income Tax/ Commissioner (Appeals) 2006-2012 74,701.19 44,819.55 29,881.64Hon. High Court 2003-2010 1,002.78 14.86 987.92 Hon. Supreme Court 1983-1986 740.22 - 740.22
Income Tax Appellate Tribunal 1995-2011 3,556.25 566.45 2,989.80

Annual Report 2014-15
Auditors’ Report on Consolidated Financial Statements
278
The Holding Company
ONGC Videsh Limited (OVL)
Name ofthe statue
Nature of Dues
Forum where dispute is pendingPeriod towhich the amountrelates
(financial)year)
GrossAmountInvolved
AmountPaid
underProtest
Amount Unpaid
(` in million)
Central Sales Sales Tax / Appeallate Tribunal 1993 - 2000 146.95 20.92 126.03 Tax Act, 1956 Turnover Tax/ Hon. High Court 1978-2013 24,439.03 655.16 23,783.87and Penalty / Joint Commissioner / Commissioner 2000-2010 3,227.65 39.38 3,188.27 respective Interest CT-AppealsStates SalesTax Act
Total (F) 27,813.63 715.46 27,098.17
Finance Act, Service Tax / Commissioner /Joint / Deputy1994 Interest Commissioner of Central Excise,
Penalties Custom and Service Tax 2004-2015 2.09 1.98 0.11
Custom, Excise and Service TaxAppellate Tribunal 2005-2012 93.46 93.42 0.04
Directorate General of CentralExcise, Custom and Service Tax 2006-2008 637.40 - 637.40
Hon. High Court 2004-2007 32.48 - 32.48
Total (G) 765.43 95.40 670.03
Grand Total (A+B+C+D+E+F+G) 116,822.82 46,430.63 70,392.19
Name of Statute
Income-Tax Act 1961 Disputed Income-taxdemand
Service Tax-FinanceAct, 1994
Total 64,594.17
Nature of Dues Amount Period to which Forum where( in ` Million) amount relates dispute is pending
6,702.88 AY 06-07 to AY 11-12 CIT(A)
Demand cum show 57,891.29 FY 10-11 to Commissioner-cause under Service FY 13-14 Service Tax
Tax

Auditors’ Report on Consolidated Financial Statements
279
Manglore Refineries & Petrochemicals Limited
Name of thestatute
Karnataka AppellateTribunal
Value Added Tax -Interest
The Karnataka Value Added Tax -Sales Tax Act Interest1957/Cental Value Added Tax -
Sales Tax Act Interest1956 Value Added Tax -
PenaltyValue Added Tax -
InterestIncome Tax /Interest /
Penalty AY 2003-04 10.93 10.93 AY 2006-07 233.58 111.10 AY 2007-08 129.39 129.39
Income Tax Act, AY 2008-09 362.49 362.49 1961 AY 2009-10 1,014.82 1,014.82
Commisioner of AY 2008-09 126.72 - Income Tax (Appeals) AY 2010-11 754.77 698.02
Mumbai AY 2011-12 594.02 297.01 Disallowance u/s 14A Commisioner of
Income Tax (Appeals) AY 2011-12 10.05 - Custom Duty/
Interest /Penalty
Central Excise to 2012-13 248.18 23.07 Act - 1944 Joint Secretary - MOF 2002-03 to 2012-13 1.24 0.72
Comissioner -Mangalore 1999-2000 to 2012-13 54.59 -
Total 4,627.31 2,959.43
Nature of Dues Forum Where Period to which Gross Amount Amount dispute the amount Involved Paid
is pending relates underFinancial Year Protest
Central Sales tax Karnataka Appellate 2009-10 4.53 - - penalty Tribunal
Central Sales tax- 2009-10 18.33 12.10 Interest
Appellate authority 2006-07 0.43 0.21 mangalore
Karnataka Appellate 2009-10 0.13 0.13Tribunal
Karnataka Appellate 2010-11 0.66 0.66 Tribunal
Appellate authority 2011-12 3.48 - mangalore
Appellate authority 2011-12 4.80 2.48mangalore
Mumbai High court AY 1993-03 296.30 296.30
Income Tax AppealateTribunal - Mumbai
The Customs Supreme court of india 1996-2006 101.53 - Act - 1962 CESTAT - Bangalore 1997-2008 645.97 -
Comissioner 2011-12 to 10.37 - (Appeals) Mangalore 2013-14
1996-1997Central Excise Duty / CESTAT - Bangalore
Service Tax / Interest /penalty
(` in million)
Petronet LNG Limited
Name of the Nature of Dues Amounts Period to which Fourm where dispute instatute (` in million) the amount pending
relates
0.81 2003-04 to 2007-08 CESTAT - Delhi
Service Service Tax and 4.71 2006-07 to 2010-11 Commissioner Adjudication Delhi
Tax Interest 0.39 2011-12 CESTAT - Delhi
0.02 2012-13 Additional commissioner Delhi 0.05 2013-14 Additional commissioner Delhi
Customs Act Custom Duty 11.02 2013-14 and 2014-15 Commissioner of customs appeals
1962
Income Tax Income tax and 15.55 2007-08 Order received on 20.03.2015,Act 1961 Interest appeal pending to be filed with CIT
(Appeals)

Annual Report 2014-15
Auditors’ Report on Consolidated Financial Statements
280
ONGC Petro-additions Limited
ONGC Tripura Power Company Ltd.
Name of Statute
Stamp Duty Demand for Stamp 0.99 2009 Deputyduty Commissioner of
revenue and stamp
Nature of Dues Amount Period to which Forum where(` in Million) amount relates dispute is pending
Name of Statute
Income Tax Act 1961 Demand for AY 12-13 4.94 FY 2011-12 Commissioneru/s 143(3) (Appeals)
Customs Act 1962 Demand u/s 18 (2) 94.81
Nature of Dues Amount Period to which Forum where(` in Million) amount relates dispute is pending
FY 2011-12 Commissioner(Appeals)
interest of the Group and its jointly controlled entities.
xi. The term loans availed by the Group and Jointly controlled Entities have been applied for the purpose for which the loans were obtained except in case of a subsidiary, MRPL where `11,704.73 million were invested in deposits with banks.
xii. No fraud on or by the Group and its Jointly Controlled Entities has been noticed or reported during the year except for over reporting of crude oil production and inventory in case of the Holding Company as stated in Note No. 49 to the consolidated financial statements. An irregularity was also noticed in the log books for hiring of the taxi service in case of ONGC Videsh Limited, a subsidiary, involving an amount of 12.80 million. As informed further, the said cases are under investigation.
`
c.There has been no delay in transferring amounts, required to be transferred, to the Investor Education and protections Fund by the Group and its Jointly Controlled Entities in accordance with the relevant provisions of the Companies Act, 1956 (1 of 1956) and rules made thereunder.
viii. As per the consolidated financial statements, there are no accumulated losses at the end of the current financial year and no cash losses were incurred during the year or during the immediately preceding financial year.
ix. The Group and its jointly controlled entities have not defaulted in repayment of dues to financial institutions, banks or debentures holders.
x. In our opinion, the terms and conditions on which the Group and its jointly controlled entities have given guarantees for loans taken by others from banks or financial institutions are not prima facie prejudicial to the
For M/s Mehra Goel & Co.Chartered AccountantsFirm Reg No. 000517N
Partner (Mem. No. 017532)
Date : May 28, 2015
Place : New Delhi
(R. K. Mehra)Partner (Mem. No. 006102)
For M/s G. D. Apte & Co.Chartered AccountantsFirm Reg No. 100515W
(C. M. Dixit)
For Khandelwal Jain & Co.Chartered AccountantsFirm Reg No. 105049W
(Narendra Jain)Partner (M.No. 048725)
For M/s Varma & VarmaChartered Accountants Firm Reg No. 004532S
(P. R. Prasanna Varma)Partner (M.No. 025854)
For Lodha & Co.Chartered AccountantsFirm Reg. No: 301051E
(R. P. Singh)Partner (M.No. 052438)

Auditors’ Report on Consolidated Financial Statements
281
Holding Company:
The cases of waiver/write of fs of debts/loans/interest, wherever applicable during the year along with the reasons and amount involved are as under:
Annexure 2 to Consolidated Auditors’ Report(Referred to in paragraph 2 (b) under ‘Report on Other Legal and
Regulatory Requirements’ section of our report of even date)
Case of waiver/write off of debts/loans/Interest
` in million Reasons
26.40 Settlement of Arbitration award
0.01 Details of deposit not available
0.01 Forfeiture of Deposit
1.40 Disallowance of insurance claim
0.26 Long outstanding balance
28.08
Particulars in million Reasons
Central Sales Tax on
sales to PSU Oil
Marketing Companies
`
1,930.80 These have been expenses to the Statement to Profit and Loss
on account of prevailing industry practice.
Subsidiary : Mangalore refinery and Petrochemicals Limited (MRPL)

Annual Report 2014-15
Auditors’ Report on Consolidated Financial Statements
282
Annexure 3 to Consolidated Auditors’ Report(Referred to in paragraph 2 (d) under ‘Report on Other Legal and
Regulatory Requirements’ section of our report of even date)
Subsidiary: Manglore Refinery & Petrochemicals Limited (MRPL)
Age-wise analysis of pending legal/arbitration cases
1 0 – 3 years Nil Nil Nil NA
2 4 – 6 years Nil Nil Nil NA
3 7 – 10 years 6 224.77 11.33 The delay is attributable to adjournments in
court / legal matters / other court related matters
4 Above 10 years 1 154.19 2.49 Awaiting listing for final hearing at High Court
The legal expenses are approved by the Board of Directors along with other expenses in revenue budget. Further whenever payments are made the appropriate approvals are obtained as per the delegation of Authority in place. Engagement of Advocate and all payments above 25,000/- ( twenty five thousand only) are to be approved by D(F) and Functional Director.`
Sr.No.
Ageing ofpending cases
No. ofcases
Amountinvolved
(` in million)
LegalExpenses
(` in million)
Reasons for pendency / Present Position
Exploratory data acquisition in progress; ONGC is the largest exploration acreage and mining lease holder in India.

Consolidated Financial Statement
283
Consolidated Balance Sheet stas at 31 March, 2015
I. EQUITY AND LIABILITIES1 Shareholders’ funds
(a) Owner's Fund(i) Share capital 4 42,777.60 42,777.60 (ii) Reserves and surplus 5 1,761,766.43 1,678,737.70
(b ) Minority Interest 24,731.33 29,119.982 Non-current liabilities
(a) Long-term borrowings 6 475,827.54 316,808.58 (b) Deferred tax liabilities 7 187,613.14 178,757.38 (c) Other Long term liabilities 8 18,294.44 18,467.17 (d) Long-term provisions 9 327,796.11 305,299.55
3 Current liabilities(a) Short-term borrowings 10 42,885.71 139,072.72 (b) Trade payables 11 303,873.06 306,803.41 (c) Other current liabilities 12 168,669.28 217,038.79 (d) Short-term provisions 13 22,592.14 9,500.29
TOTAL 3,376,826.78 3,242,383.17 II. ASSETS
1 Non-current assets(a) Fixed assets
(i) Tangible assets 14 686,712.14 462,253.51 (ii) Producing Properties 15 910,049.33 912,681.47 (iii) Intangible assets 16 1,169.25 754.36 (iv) Capital work-in-progress 17 422,114.72 538,269.86 (v) Exploratory/Development Wells in Progress 18 211,967.25 182,066.98
(b) Goodwill on consolidation 19 201,398.86 183,544.90 (c) Non-current investments 20 47,469.93 47,204.63 (d) Deferred tax Asset 7 5,854.11 122.28 (e) Long-term loans and advances 21 107,191.98 102,409.69 (f) Deposit under Site Restoration Fund Scheme 26.5 136,423.99 120,829.56 (g) Other non-current assets 22 77,248.28 60,859.15
2 Current assets(a) Current investments 23 21.46 254.37 (b) Inventories 24 106,062.23 148,014.59 (c) Trade receivables 25 187,970.09 160,289.96 (d) Cash and Cash Equivalents 26 160,969.17 244,801.26 (e) Short-term loans and advances 27 100,330.38 66,317.22 (f) Other current assets 28 13,873.61 11,709.38
TOTAL 3,376,826.78 3,242,383.17 Accompanying Notes are an integral of this Financial Statements. 1 to 50
Particulars Note No. As atst31 March, 2015
As atst31 March, 2014
(` in million)
(A K Srinivasan)Chief Financial Officer
(D.K.Sarraf)Chairman & Managing Director
For and on behalf of the Board
(N. K. Sinha)Company Secretary
For Mehra Goel & Co. Chartered AccountantsFirm Reg. No. 000517N
(R K Mehra) Partner (M. No. 006102)
For Lodha & Co.Chartered AccountantsFirm Reg. No. 3010151E
(R P Singh)Partner (M. No. 052438)
New DelhithMay 28 , 2015
For Varma & VarmaChartered AccountantsFirm Reg. No. 004532S
(P. R. Prasanna Varma)Partner (M. No. 025854)
For Khandelwal Jain & Co Chartered AccountantsFirm Reg. No. 105049W
(Narendra Jain) Partner (M. No. 048725)
For G D Apte & Co.Chartered AccountantsFirm Reg. No. 100515W
(C. M. Dixit)Partner (M. No. 017532 )
In terms of our report of even date attached

Annual Report 2014-15
Consolidated Financial Statement
284
Consolidated Statement of Profit and Lossstfor the year ended 31 March, 2015
I REVENUERevenue from Operations (Gross) 29 1,660,668.64 1,782,051.84 Less Excise Duty 51,771.15 37,281.28 Revenue from Operations (Net) 1,608,897.49 1,744,770.56 Other Income 30 59,644.43 68,899.00 TOTAL REVENUE 1,668,541.92 1,813,669.56
II EXPENSES (Increase)/ Decrease in Inventories 31 17,229.16 (5,285.36)Purchases of stock-in-trade - 0.32 Production, Transportation, Selling and Distribution Expenditure 32 1,045,130.60 1,159,747.17 Exploration Costs writ ten of f -Survey costs 20,834.87 17,471.47 -Exploratory well costs 88,679.32 67,409.85 Depreciation, Depletion, Amortisation and Impairment 33 180,329.65 166,057.47 Finance Costs 34 28,623.76 6,243.34 Provisions and Write-of fs 35 10,875.98 10,314.61 Adjustments relating to Prior Period (Net) 36 3,134.93 (2,423.37)TOTAL EXPENSES 1,394,838.27 1,419,535.50
Profit before Exceptional, Extraordinary items and Tax 273,703.65 394,134.06 Exceptional items - - Profit before Extraordinary items and Tax 273,703.65 394,134.06 Extraordinary items - - PROFIT BEFORE TAX 273,703.65 394,134.06 Tax Expenses - Current Tax 100,649.26 90,449.09 - Earlier years (5,895.19) 2,449.89 - MAT Credit (422.78) (2,872.04) - Deferred Tax 2,642.81 37,576.92 PROFIT AFTER TAX 176,729.55 266,530.20 Add: Share of Profit/(Loss) in Associate 20.4 303.10 118.15 GROUP PROFIT AFTER TAX 177,032.65 266,648.35 Attributable to: Equity holders of Parent (ONGC) 183,335.20 265,065.33 Minority Interest (6,302.55) 1,583.02
177,032.65 266,648.35
Net Group Profit atributable to ONGC Equity holders 183,335.20 265,065.33
Earning per Equity Share-Basic and Diluted (`) 37 21.43 30.98 (Face Value `5/- per Share)
Accompanying Notes are an integral of this Financial Statements. 1 to 50
Particulars Note No. 2014-15 2013-14
(` in million)
(A K Srinivasan)Chief Financial Officer
(D.K.Sarraf)Chairman & Managing Director
For and on behalf of the Board
(N. K. Sinha)Company Secretary
For Mehra Goel & Co. Chartered AccountantsFirm Reg. No. 000517N
(R K Mehra) Partner (M. No. 006102)
For Lodha & Co.Chartered AccountantsFirm Reg. No. 3010151E
(R P Singh)Partner (M. No. 052438)
New DelhithMay 28 , 2015
For Varma & VarmaChartered AccountantsFirm Reg. No. 004532S
(P. R. Prasanna Varma)Partner (M. No. 025854)
For Khandelwal Jain & Co Chartered AccountantsFirm Reg. No. 105049W
(Narendra Jain) Partner (M. No. 048725)
For G D Apte & Co.Chartered AccountantsFirm Reg. No. 100515W
(C. M. Dixit)Partner (M. No. 017532 )
In terms of our report of even date attached

Consolidated Financial Statement
285
A. CASH FLOW FROM OPERATING ACTIVITIES:
Profit before tax and extraordinary items 273,703.65 394,134.06
Adjustments For:
- Prior Period Items 3,134.93 (2,423.37)
- Depreciation, Depletion and Amortisation & Impairment 180,329.65 165,809.04
- Exploration Well Costs Writ ten of f 88,679.32 67,409.85
- Interest on Borrowings 28,623.77 6,243.35
- Foreign Exchange Loss/Translation Adjustment 1,529.83 21,188.73
- Provision for Employee Benefits 4,836.30 (14,509.31)
- Provision for Abandonment 283.48 243.56
- Profit/Loss on sale of fixed assets (1.49) 15.55
- Other Provision and Write of fs 10,875.98 10,563.05
- Excess Provision/Liability writ ten Back (7,379.91) (19,216.85)
- Interest Income (34,477.24) (32,434.34)
- Def fered Government Grant (14.17) (2.87)
- Dividend Received (4,679.25) (3,550.25)
- Provision for Mark to Market loss on Derivative contracts (18.95) 2,244.85
- Profit on sale of investment (75.74) 271,646.51 (14.50) 201,566.49
Operating Profit before Working Capital Changes 545,350.16 595,700.55
Adjustments for:-
- Receivables (60,395.74) 5,713.05
- Loans and Advances (30,071.31) (1,371.97)
- Other Current Assets (30,202.12) (148,012.35)
- Inventories 44,624.37 (22,016.16)
- Trade Payable and Other Liabilities (39,722.85) (115,767.65) 207,718.63 42,031.20
Cash generated from Operations 429,582.51 637,731.75
Direct Taxes Paid (Net of tax refund) (90,292.34) (105,666.61)
Cash Flow before prior period and Extra ordinary Items 339,290.17 532,065.14
Prior period items 795.56 638.65
NET CASH FLOW FROM OPERATING ACTIVITIES 'A' 340,085.73 532,703.79
B. CASH FLOW FROM INVESTING ACTIVITIES:
Purchase of Fixed Assets (169,059.75) (149,385.04)
Sale of Fixed Assets 86.51 29.04
Acquisition, Exploration and Development Cost (185,278.12) (466,269.90)
Sale of Investments-Net 310.77 651.49
Loans and Advance to Subsidiary - (0.01)
Advance/Investment in Joint Controlled Entities/Associates (757.39) (4,664.61)
Loans to Public Sector Undertakings and Other Bodies Corporate - (26,707.48)
Gain on Foreign Exchange Forward exchange Contract 126.41 797.15
Deposit in Site Restoration Fund (15,594.43) (14,480.37)
Project Development/ Preoperative expenditure (net of advances) (15,396.59) (11,297.24)
Dividend Received 4,679.25 3,551.30
Interest Received 30,682.70 31,450.08
Tax paid on Interest Income (756.56) -
NET CASH FLOW FROM INVESTING ACTIVITIES 'B' (350,957.20) (636,325.59)
Year Endedst 31 March, 2015
Year Endedst 31 March, 2014
(` in million)
Consolidated Cash Flow Statementstfor the year ended 31 March, 2015

Annual Report 2014-15
Consolidated Financial Statement
286
C. CASH FLOW FROM FINANCING ACTIVITIES:
Share Issue Expense (22.55) -
Advance Against Equity - 1,781.72
Proceeds from Borrowings 170,779.95 331,987.96
Repayment of Borrowings (151,136.67) (84,764.56)
Foreign Exchange Fluctuation Related to Borrowing Cost (18,040.26) 161.76
Dividend Paid (79,203.67) (83,453.45)
Tax on Dividend (15,748.94) (14,170.69)
Interest Paid (11,991.38) (7,251.97)
Change in Minority Interest (1,044.24) 7,955.45
NET CASH FLOW FROM FINANCING ACTIVITIES 'C' (106,407.76) 152,246.22
NET INCREASE/(DECREASE) IN CASH AND CASH EQUIVALENTS (A+B+C) (117,279.23) 48,624.42
Cash and Cash Equivalents as at 1st April, 2014 (Opening Balance) Note 26 244,632.41 196,007.99
Add: Other Adjustments to Cash and Cash Equivalent # 2,613.30 -
247,245.71 196,007.99
Cash and Cash Equivalents as at 31st March,2015* (Closing Balance) Note 26 129,966.48 244,632.41
(117,279.23) 48,624.42
#Adjustment on account of increase in shareholding in ONGC Mangalore Petrochemicals Ltd.
Notes:
1. The above Cash Flow Statement has been prepared under the 'Indirect Method' as set out in the Accounting Standard-3 on Cash Flow Statement.
2. Cash and Cash equivalent excludes 31,002.69 million (Previous year 168.85 million) in current account/deposit account of interest warrant/refund accounts, under lien, pledge with banks/Govt. authorities in respect of MRPL.
3. * Includes Term deposits of `17,340 million (Previous year Nil) pledged to Banks against Short term loan taken from Banks. Also includes restricted amount of 379.75 million (Previous year 389.69 million) earmarked for payment of unclaimed dividend/unpaid interest on debenture.
4. Cash Balance includes 6,885.17 million share of jointly controlled entity. (Previous year 7,769.03 million)
5. In case of ONGC Videsh Ltd, the Adjustment have not been made to purchase of fixed assets etc. (investing activities), on account of increase / decrease in Capital Creditors. The impact of the above is not readily ascertainable.
6. Bracket indicates cash out flow.
7. Previous years figures have been regrouped wherever necessary to conform to current year's classification.
Year Endedst 31 March, 2015
Year Endedst 31 March, 2014
(` in million)
Note
Consolidated Cash Flow Statementstfor the year ended 31 March, 2015
(A K Srinivasan)Chief Financial Officer
(D.K.Sarraf)Chairman & Managing Director
For and on behalf of the Board
(N. K. Sinha)Company Secretary
For Mehra Goel & Co. Chartered AccountantsFirm Reg. No. 000517N
(R K Mehra) Partner (M. No. 006102)
For Lodha & Co.Chartered AccountantsFirm Reg. No. 3010151E
(R P Singh)Partner (M. No. 052438)
New DelhithMay 28 , 2015
For Varma & VarmaChartered AccountantsFirm Reg. No. 004532S
(P. R. Prasanna Varma)Partner (M. No. 025854)
For Khandelwal Jain & Co Chartered AccountantsFirm Reg. No. 105049W
(Narendra Jain) Partner (M. No. 048725)
For G D Apte & Co.Chartered AccountantsFirm Reg. No. 100515W
(C. M. Dixit)Partner (M. No. 017532 )
In terms of our report of even date attached

Consolidated Financial Statement
287
1. Group information
Oil and Natural Gas Corporation Limited (‘ONGC’ or
‘the Company’) is a public limited company domiciled
and incorporated in India. The Company’s shares are
listed and traded on Stock exchanges in India. The
Consolidated Financial Statements relate to the
Company, its Subsidiaries, Joint Venture Entities and
Associate. The Group (comprising of Company and its
subsidiaries), Joint Venture Entities and Associate are
mainly engaged in Exploration & Production (E&P) of
Oil & Gas in India and abroad including Refinery,
Power Generation, Petrochemicals, LNG supply,
Pipeline Transpor tation, SEZ development and
Helicopter services.
2. Significant Group Accounting Policies
2.1 Principles of Consolidation
The Consolidated Financial Statements have
been prepared on the following basis: -
i) The financial statements of the Company
and its subsidiary companies are
combined on a line-by-line basis by
adding together the book values of like
items of assets, liabilities, income and
expenses af ter eliminating intra-group
balances and intra-group transactions
resulting in unrealized profits or losses in
accordance with Accounting Standard
(AS) 21 – “Consolidated Financial
Statements”.
ii) The financial statements of Joint Venture
entities are combined by applying
proportionate consolidation method on a
line by line basis on like items of assets,
liabilities, income and expenses af ter
eliminating propor tionate share of
unrealized profits or losses in accordance
with Accounting Standard (AS) 27 -
“Financial Reporting of Interests in Joint
Ventures”.
iii) Investments in Associates are accounted
for using equity method in accordance
with Accounting Standard (AS) 23 –
“Accounting for Investments in Associates
in Consolidated Financial Statements”.
iv) The consolidated financial statements are
prepared using uniform accounting
policies for like transactions and other
events in similar circumstances and are
presented to the extent possible, in the
same manner as the Company ’s
separate Financial Statements except as
otherwise stated.
v) The dif ference between the cost of
investment in the subsidiaries/associates
/Joint ventures, and the net assets at the
time of acquisition of shares in the
subsidiaries/associates/joint ventures is
recognized in the Consolidated Financial
Statements as Goodwill or Capital
Reserve, as the case may be.
vi) Profit or loss at tributable to minority
interest and to owners of the parent in the
statement of profit and loss has been
presented as allocation for the period.
vii) Minorities’ share of Net Assets of
subsidiaries is identified and presented
in the Consolidated Balance Sheet within
equity, separately from the equity of the
parent Company’s shareholders.
viii) In case of foreign subsidiaries and
joint ventures, foreign currency
transactions are translated as per the
provisions of Accounting Standard (AS)
11 – “Accounting for Ef fects of changes
in Foreign Exchange Rates” in the
Consolidated Financial Statements.
ix) The dif ference between the proceeds
from disposal of investments in a
subsidiary and the carrying amount of
its net assets as on the date of disposal
is recognized in the Consolidated
Statement of Profit and Loss.
2.2 Other significant Accounting Policies
a. Basis of preparation
The financial statements are prepared under
the historical cost convention on accrual basis
in accordance with Generally Accepted
Accounting Principles (GAAP), applying the
Successful Ef forts Method as per theGuidance
Note on Accounting for Oil and Gas Producing
Activities (Revised) issued by the Institute of
Char tered Accountants of India and
Accounting Standards as prescribed under the
Companies (Accounts) Rules, 2014 and
provisions of the Companies Act, 2013.
As the operating cycle cannot be identified in
normal course due to the specific nature of
industry, the same has been assumed to have
duration of 12 months. Accordingly, all assets
and liabilities have been classified as current or
non-current as per the operating cycle and
other criteria set out in the Schedule III to the
Companies Act, 2013.
The financial statements are presented in
stNotes to Consolidated Financial Statements for the year ended 31 March, 2015

Annual Report 2014-15
Consolidated Financial Statement
288
Indian Rupees and all values are rounded to the
nearest million except otherwise stated.
b. Use of Estimates
The preparation of financial statements
requires estimates and assumptions, which
af fect the reported amount of assets, liabilities,
revenues and expenses for the reporting
period. The dif ference between the actual
results and estimates are recognized in the
period in which the results are known or
materialized.
c. Government Grant
Government Grant related to acquisition of
Fixed Assets is treated as ‘Deferred
Government Grant’ and amount equal to
proportionate depreciation of such assets is
credited to Statement of profit and loss
d. Fixed Assets
d.1 Tangible Assets
d.1.1 Fixed assets are stated at historical cost less
accumulated depreciation and impairment.
Fixed assets received as donations/gif ts are
capital ised at assessed values with
corresponding credit taken to Capital Reserve.
d.1.2 All costs, net of applicable tax credits, relating
to acquisition of fixed assets till the time of
bringing the assets to working condition for
intended use are capitalised.
d.2 Intangible Assets
Intangible assets are stated at cost of
acquisition, net of applicable tax credits, less
accumulated amortization and impairment.
e. Exploration, Development and Production
Costs
e.1 Pre-acquisition cost
Expenditure incurred before obtaining the
right(s) to explore, develop and produce oil and
gas are expensed as and when incurred.
e.2 Acquisition Cost
Acquisition costs of an oil and gas property are
the costs related to right to acquire mineral
interest and are accounted/ treated as follows:-
Exploration and Development stage:
Acquisition cost relating to projects under
exploration or developments are initially
accounted as capital work in progress. Such
costs are capitalized by transferring to
Producing Property when a well is ready to
commence commercial production. In case of
abandonment/ relinquishment, such costs are
writ ten of f.
Production stage: Acquisition costs of a
producing oil and gas property are capitalized
as proved property acquisition cost under
producing properties and amortized over the
production profile of the underlying asset using
the unit of production method over proved
reserves.
e.3 Survey Cost
Cost of Survey and prospecting activities
conducted in the search of oil and gas are
expensed as exploration cost in the year in
which these are incurred.
e.4 Explorator y/ Development Wells in
Progress
e.4.1 All exploration costs incurred in drilling and
equipping exploratory and appraisal wells,
cost of drilling exploratory type stratigraphic
test wells are initially capitalized as Exploratory
Wells in Progress till the time these are either
transferred to Producing Proper ties on
completion as per Note no. 2.2.f.1 or expensed
as exploration cost (including allocated
depreciation) as and when determined to be
dry or of no further use, as the case may be.
e.4.2 Costs of exploratory wells are not carried
unless there are indications of suf ficient
quantity of reserves; suf ficient progress is
made in assessing the reserves and the
economic & operating viability of the project.
All such carried costs are subject to review for
impairment as per Note no. 2.2.n.4.
e.4.3 All costs relating to Development Wells are
initially capitalized as ‘Development Wells in
Progress’ and transferred to ‘Producing
Properties’ on completion as per Note no
2.2.f.1 and 2.2.f.2.
f. Producing Properties
f.1 Producing Properties are created in respect of
an area/field having proved developed oil and
gas reserves when the well in the area/field is
ready to commence commercial production.
f.2 Cost of temporary occupation of land,
successful exploratory wells, all development
wells, depreciation on related equipment,
facilities and estimated future abandonment
costs are capitalised and reflected as
Producing Properties.
g. Production Costs
Production costs include pre-well head and
post -we l l head expenses inc lud ing
depreciation and applicable operating costs of
support equipment and facilities.

Consolidated Financial Statement of ONGC Group
289
h. Side tracking
h.1 In case of an exploratory well, Cost of Side-
tracking is treated in the same manner as the
cost incurred on a new exploratory well.The
cost of abandoned portion of side tracked
exploratory wells is expensed as ‘Exploratory
Well Cost writ ten of f.
h.2 In case of development wells, the entire cost of
abandoned portion and side tracking are
capitalised.
h.3 In case of Producing wells,if it results in
additional proved developed oil & gas reserves
or increases the future economic benefits
therefrom beyond previously assessed
standard of per formance, the cost incurred on
side tracking is capitalised, whereas the cost of
abandoned portion of the wellis depleted in the
normal way. Otherwise, the cost of side tracking
is expensed as ‘Work over Expenditure’.
i. Abandonment Cost
i.1 The full eventual estimated liability towards
costs relating to dismantling, abandoning and
restoring well sites and allied facilities are
recognized in respective assets when the well is
completed/facilities are installed. The
abandonment cost on dry well is expensed as
exploratory well cost.
i.2 Provision for abandonment cost is updated
based on the technical assessment at current
costs. The ef fects of changes resulting from
revisions to estimated liability are adjusted to
the carrying amount of the related Asset and
considered for depletion on a prospective
basis.
j. Jointly Controlled Assets
j.1 Unincorporated Joint Ventures in the nature of
Production Sharing Contracts (PSC) have been
entered with the Government of India/other
countries and various bodies corporate for
exploration, development and production and
other activities. These unincorporated joint
ventures have been classified as Jointly
controlled Asset.
j.2 The share in the assets and liabilities along with
at tributable income, and expenditure, of the
Jointly Controlled Assets is merged on line by
line basis with the similar items in the
Consolidated Financial Statements and
adjusted for depreciation, depletion, survey,
dry wells, abandonment, impairment and
sidetracking in accordance with the accounting
policies.
j.3 Disposal of Interest
Gain or loss on sale of interest in a cost centre,
is recognized in the statement of profit and
loss, except that no gain is recognized at the
time of such sale if substantial uncertainty
exists about the recovery of the costs
applicable to the retained interest or if the
company has substantial obligation for future
performance. The gain in such situation is
treated as recovery of cost related to that cost
centre.
j.4 The hydrocarbon reserves in such areas are
taken in propor tion to the par ticipating
interest.
k. Investments
Long-term investments are valued at
cost.Provision is made for any diminution,
other than temporary, in the value of such
investments.
Current Investments are valued at lower of cost
and fair value.
l. Inventories
l.1 Finished goods (other than Sulphur) and stock
in pipelines/tanks and carbon credits are
valued at Cost or net realizable value
whichever is lower. Cost of Finished goods is
determined on absorption costing method.
Sulphur is valued at net realizable value. The
value of inventories includes excise duty,
royalty (wherever applicable) but excludes
Cess
l.2 Crude oil in unfinished condition in flow lines up
to Group Gathering Stations/plat form and
Natural Gas in Pipelines is not valued.
l.3 Inventory of stores and spare parts is valued at
Weighted Average Cost or net realizable value,
whichever is lower. Provisions are made for
obsolete and non-moving inventories.
l.4 Raw material and Stock in Process is valued at
lower of cost or net realizable value. Raw
material is valued based on First in First Out
(FIFO) basis. Cost of Stock in Process
comprises of raw material cost and
proportionate Conversion cost.
l.5 Unser viceable and scrap items, when
determined, are valued at estimated net
realizable value.
m. Revenue Recognition
m.1 Revenue from sale of products is recognized
on transfer of custody to customers.
m.2 Any dif ference as of the reporting date

Annual Report 2014-15
Consolidated Financial Statement
290
between the entitlement quantity minus the
quantities sold in respect of crude oil (including
condensate), if positive (i.e. under lif t quantity)
the proportionate production expenditure is
treated as prepaid expenses and, if negative
(i.e. over lif t quantity), a liability for the best
estimate of the group’s proportionate share of
production expenses as per the Joint Operating
Agreement / Production Sharing Agreement is
created in respect of the quantity of crude oil to
be foregone in future period towards
set tlement of the over-lif t quantity of crude oil
with corresponding charge to statement of
Profit & Loss.
m.3 Any payment received in respect of short lif ted
gas quantity for which an obligation exists to
supply such gas in subsequent periods is
recognized as Deferred Revenue in the year of
receipt. The same is recognized as revenue in
the year in which such gas is actually supplied
for the quantity supplied or in the year in which
the obligation to supply such gas ceases,
whichever is earlier.
m.4 Sale of crude oil and gas (net of levies)
produced from Wells in Progress is deducted
from expenditure on such wells.
m.5 Sales are inclusive of all statutory levies except
Value Added Tax (VAT). Any retrospective
revision in prices is accounted for in the year of
such revision.
m.6 Revenue in respect of fixed price contracts is
recognized for the quantum of work done on
the basis of percentage of completion method.
The quantum of work done is measured in
proportion of cost incurred to date to the
estimated total cost of the contract or based on
reports of physical work done.
m.7 Finance income in respect of assets given on
finance lease is recognized based on a pattern
reflecting a constant periodic rate of return on
the net investment outstanding in respect of the
finance lease.
m.8 Dividend income is recognized when right to
receive is established. Interest income is
recognized on time proportion basis taking into
account the amount outstanding and rate
applicable.
m.9 Lease Premium from the lease of land is
recognized over primary lease period as per
the agreement. Lease rental income is
accounted for on the time proportion basis as
per the terms agreed with lessees.
m.10 Revenue in respect of the following is
recognized when there is reasonable certainty
regarding ultimate collection:
a. Gas pipeline transportation charges
b. Reimbursable subsidies and grants
c. Surplus from Gas Pool Account
d. Interest on delayed realization from
customers
e. Liquidated damages from contractors/
suppliers
n. Depreciation, Depletion, Amortisation and
Impairment
n.1 Depreciation,
n.1.1 Depreciation on fixed assets is provided for
under the writ ten down value method over the
useful life of Asset specified in Schedule II to
the Companies Act, 2013 except in case of
certain items of fixed assets where the useful
life has been considered based on technical
assessment which is less than useful life
prescribed under Schedule II to the
Companies Act, 2013.
n.1.2 Depreciation on additions/deletions during the
year is provided on pro rata basis with
reference to the date of additions/deletions
except low value items not exceeding 5,000/-
which are fully depreciated at the time of
addition
n.1.3 Depreciation on subsequent expenditure on
fixed assets arising on account of capital
improvement or other factors is provided for
prospectively over the remaining useful life.
Depreciation on refurbished/revamped assets
which are capitalized separately is provided for
over the reassessed useful life, which is not
more than the life specified in Schedule II to the
Companies Act, 2013.
n.1.4 Depreciation on fixed assets (including
support equipment, facilities and those taken
on lease) used for exploratory/ development
drilling and on production facilitiesis initially
capitalised as part of drilling cost or producing
properties and expensed/depleted as stated in
note no 2.2.f & 2.2.n.2. Depreciation on
equipment/ assets deployed for survey activities
is charged to Statement of Profit and Loss.
n.2 Depletion
n.2.1 Producing Properties are depleted using the
“Unit of Production Method”. The rate of
depletion is computed with reference to an
area covered by individual lease/license/asset/

Consolidated Financial Statement
291
amortization base by considering the proved
developed reserves and related capital costs
incurr ed inc luding est imated fu tur e
abandonment costs net of salvage value. In
case of acquisition cost, Producing Properties
is depleted by considering the proved
reserves. These reserves are estimated
annually by the Reserve Estimates Commit tee
of the Company, which follows the International
Reservoir Engineering Procedures.
n.3 Amortisation
n.3.1 Leasehold land is amortized over the lease
period except perpetual leases.
n.3.2 Right of way/ Right of use of land are amortized
on Straight Line Method (SLM) over the
estimated life of associated Asset.
n.3.3 Other Intangible Assets ( sof tware, copy right,
patents etc.) are amortized on Straight Line
Method (SLM) over the useful life not exceeding
ten years from the date of capitalization
n.4 Impairment
n.4.1 Producing Properties, Development Wells in Progress (DWIP) and Fixed Assets (including Capital Works in Progress) of a “Cash Generating Unit” (CGU) are reviewed for impairment at each Balance Sheet date. In case, events and circumstances indicate any impairment, recoverable amount of these assets is determined. An impairment loss is recognized, whenever the carrying amount of such assets exceeds the recoverable amount. The recoverable amount is higher of its ‘value in use’ or ‘net selling price’ (if determinable). In assessing value in use, the estimated future cash flows from the use of assets and from its disposal at the end of its useful life are discounted to their present value at appropriate rate.
An impairment loss is reversed if there is increase in the recoverable amount and such loss either no longer exists or has decreased. Impairment loss / reversal thereof is adjusted to the carrying value of the respective assets, which in case of CGU, is allocated to its assets on a pro-rata basis. Subsequent to impairment, depreciation is provided on the revised carrying value of the assets over the remaining useful life.
n.4.2 Impairment testing during exploratory phase is carried out at area level when fur ther exploration activities are not planned in near future or when suf ficient data exists to indicate that although a development in the specific area is likely to proceed, the carrying amount of
the exploration asset is unlikely to be recovered in full from successful development or by sale. Impairment is reversed subsequently, to the extent that conditions for impairment are no longer present.
o. Foreign Exchange Transactions
o.1 Foreign currency transactions on initial recognition in the reporting currency are accounted for at the exchange rates prevailing on the date of transaction.
o.2 At each Balance Sheet date, foreign currency monetary items are translated using the mean exchange rates prevailing on the balance sheet date and non-monetary items are translated using the exchange rate prevailing on the date of transaction or on the date when the fair value of such item was determined.
o.3 The loss or gain thereon and also the exchange dif ferences on set tlement of the foreign currency transactions during the year are recognized as income or expense and adjusted to the statement of profit & loss.
o.4 In respect of integral foreign operations:
o.4.1 The foreign currency transactions on initial recognition in the reporting currency are recorded following the note no 2.2.o.1. For practical reasons, the average exchange rate of the relevant month is taken for the transactions of the month in respect of joint venture operations, where actual date of transaction is not available.
o.4.2 At each Balance Sheet date, monetary and non-monetary items are translated following the policy stated in note no. 2.2.o.2.
o.4.3 All exchange dif ferences are treated following the policy stated in note no.2.2.o.3.
o.5 The financial statements of the non-integral foreign operations are incorporated in the financial statements using the following principles:
o.5.1 The assets and liabilities, both monetary and non-monetary, of the non-integral foreign operation are translated at the average of the exchange rate prevailing on the date of the balance sheet;
o.5.2 Income and expense items of the non-integral foreign operation are translated at the average exchange rates for the period to which the financial statements relate;
o.5.3 The resulting exchange dif ferences are accumulated in a foreign currency translation reserve until the disposal of the net investment in the non-integral foreign operation.

Annual Report 2014-15
Consolidated Financial Statement
292
o.5.4 Exchange dif ferences arising on net investment in
a non-integral foreign operation are accumulated
in a foreign currency translation reserve until the
disposal of such investment, at which time they are
recognized as income or as expenses.
o.6 In the case of forward exchange contracts, the
premium or discount arising at the inception of
such contracts, is amortized as income or expense
over the life of the contract as well as exchange
dif ference on such contracts, i.e. dif ference
between the exchange rate at the reporting /
settlement date and the exchange rate on the date
of inception / the last reporting date, is recognized
as income / expense for the period.
p. Employee Benefits
p.1 All shor t term employee benefits are
recognized at their un discounted amount in the
accounting period in which they are incurred.
p.2 Employee Benefit under defined contribution
plans comprising provident fund etc. is
recognized based on the un discounted
amount of obligations of the group to contribute
to the plan. The same is paid to a fund
administered through a separate trust.
p.3 Employee benefits under defined benefit plans
comprising of gratuity, leave encashment,
compensated absences, post-retirement
medical benefits and other terminal benefits are
recognized based on the present value of
defined benefit obligation, which is computed
on the basis of actuarial valuation using the
Projected Unit Credit Method. Actuarial Liability
in excess of respective plan assets is
recognized during the year. Actuarial gains and
losses in respect of post-employment and other
long-term benefits are recognized in the
statement of profit & loss. The Company
contributes all ascer tained liabilities with
respect to Gratuity and leave/compensated
absences to the ONGC’s Gratuity Fund Trust
(OGFT) and Life Insurance Corporation of India
(LICI) respectively. Other defined benefit
schemes are unfunded.
q. Voluntary Retirement Scheme
Expenditure on Voluntary Retirement Scheme
(VRS) is charged to statement of profit & loss
when incurred.
r. General Administrative Expenses
General administrative expenses which are
directly or specifically at tributable are allocated
to activities and the balance is charged to
Statement of Profit & Loss.
s. Insurance claims
The insurance claims are accounted for as
under :-
s.1 In case of total loss of asset, by transferring
either the carrying cost of the relevant asset or
insurance value (subject to deductibles),
whichever is lower under the head “Claims
Recoverable-Insurance” on intimation to
Insurer. In case insurance claim is less than
carrying cost, the dif ference is charged to
statement of profit & loss.
s.2 In case of partial or other losses, expenditure
incurred/payments made to put such assets
back into use, to meet third party or other
liabilities (less policy deductibles) if any, are
accounted for as “Claims Recoverable-
Insurance”. Insurance Policy deductibles are
expensed in the year the corresponding
expenditure is incurred.
s.3 As and when claims are finally received from
insurer, the dif ference, if any, between Claims
Recoverable-Insurance and claims received is
adjusted to statement of profit & loss.
t. Research Expenditure
Expenditure of capital nature are capitalised
and expenses of Revenue nature are charged
to the Statement of Profit and Loss, as and
when incurred.
u. Taxes on Income
Provision for current tax is made as per the
provisions of the Income Tax Act, 1961/other
applicable tax laws. Deferred Tax Liability /
Asset resulting from ‘timing dif ference’
between book profit and taxable profit is
accounted for considering the tax rate and
laws that have been enacted or substantively
enacted as on the Balance Sheet date.
Deferred Tax Asset is recognized and carried
forward only to the extent that there is
reasonable certainty that the asset will be
realized in future.
v. Borrowing Costs
Borrowing Cost specifically identified to the
acquisition or construction of qualif ying
assets is capitalized as par t of such assets.
A qualif ying asset is one that necessarily
takes substantial period of time to get
ready for intended use. All other borrowing
costs are charged to statement of profit &
loss.
w. Rig Days Costs
Rig movement costs are booked to the next

Consolidated Financial Statement
293
location drilled/planned for drilling. Abnormal
Rig days’ costs are considered as un-allocable
and charged to statement of profit & loss.
x. Unamortized Expenditure
x.1 Dry docking charges of Rigs/ Multipurpose
Supply Vessels (MSVs), Geo Technical Vessels
(GTVs), Well Stimulation Vessels, Of fshore
Supply Vessels (OSVs), Rig/equipment
mobilization expenses and other related
expenditure are amortized over the period of
use not exceeding five years and balance is
carried under head “Unamortized Expenditure"
in the balance sheet.
y. Transportation Costs
Transportation Costs in respect of the quantity
of gas short transported, for which the right
exists to transport such gas in subsequent
periods at no charge, is treated as Deferred
Expenditure in the year of payment. The same
is treated as cost in the year in which the gas is
actually transpor ted for the quantit y
transported or in the year in which the right to
transport such gas ceases, whichever is earlier.
z. Lease
z.1 Assets given on Lease:
z.1.1 Assets given on finance lease are accounted for
as per Accounting Standard (AS) 19 “Leases”.
Such assets are included as a receivable at an
amount equal to the net investment in the lease.
z.1.2 Initial direct costs incurred in respect of finance
leases are recognized in the statement of profit and
loss in the year in which such costs are incurred.
z.2 Assets taken on Lease
z.2.1 Assets taken on finance lease are capitalized
and recognized at the lower of the fair value of
the asset and the discounted value of the
minimum lease installments. The lease
payments are bifurcated into repayment and
interest components, based on a fixed interest
rate and installment as derived from the
underlying agreement. The lease commitments
are carried under liabilities exclusive of interest.
The interest component is recognized in the
statement of profit & loss in accordance with the
lease installments.
z.2.2 Assets acquired on lease where a significant
portion of the risks and rewards of ownership
are retained by the lessor are classified as
operating leases. Lease rentals are charged to
the statement of profit & loss on accrual basis.
aa. Claims
Claims / Surrenders on/to Petroleum Planning
and Analysis Cell, Government of India are
booked on ‘in principle acceptance’ thereof
on the basis of available instructions/
clarifications subject to final adjustments, as
stipulated. All other claims and provisions are
booked on the merits of each case.
ab. Provisions, Contingent Liabilities and
Contingent Assets
Provisions involving substantial degree of
estimation in measurement are recognized
when there is a present obligation as a result of
past events and it is probable that there will be
an out flow of resources embodying economic
benefits. Contingent Assets are neither
recognized nor disclosed in the financial
statements. Contingent liabilities are disclosed
by way of notes to accounts.
ac. Accounting for derivatives
Accounting for Derivatives, other than those
covered under Accounting Standard (AS) 11,
is done on mark to market basis and the losses
are charged to statement of Profit & Loss.
Unrealized gains are ignored.
ad. Amortization of Goodwill
Goodwill arising on Consolidation of
Companies having Hydrocarbon reserves are
amortized based on “Unit of Production
Method” considering the related Proved
Reserves. Other goodwill on consolidation is
not amortized
ae. Earnings per Share
Basic earnings per share are computed by
dividing the net profit af ter tax by the weighted
average number of equity shares outstanding
during the period. Diluted earnings per share is
computed by dividing the profit af ter tax by the
weighted average number of equity shares
considered for deriving basic earnings per
share and also the weighted average number
of equity shares that could have been issued
upon conversion of all dilutive potential equity
shares.
af. Cash Flow Statement
Cash flows are reported using the indirect
method, where by profit before tax is adjusted
for the ef fects of transactions of a non-cash
nature, any deferrals or accruals of past or
future operating cash receipts or payments
and item of income or expenses associated
with investing or financing cash flows. The cash
flows from operating, investing and financing
activities of the Company are segregated

Annual Report 2014-15
Consolidated Financial Statement
294
3. The consolidated financial statements represent consolidation of accounts of "Oil and Natural GasCorporation Limited", its subsidiaries, Joint ventures entities and associate as detailed below:-
A Subsidiaries1 ONGC Videsh Limited (OVL) India 100% 100% Audited1.1 ONGC Nile Ganga B.V. (ONGBV) The Netherlands Class A and Class A and
Class B 100% Class B 100% Audited1.1 (i) ONGC Campos Ltda. Brazil 100% 100% Audited1.1 (ii) ONGC Nile Ganga (Cyprus) Ltd. Cyprus 100% 100% Audited1.1 (iii) ONGC Nile Ganga (San Cristobal) B.V. The Netherlands 100% 100% Audited1.1 (iv) ONGC Satpayev E&P B.V. The Netherlands 100% 100% Audited1.1 (v) ONGC Caspian E&P B.V. The Netherlands 100% 100% Audited1.2 ONGC Nile Ganga B.V. (ONGBV) The Netherlands Class C 55% direct Class C 55% direct
(balance 45% (balance 45% held by OMEL) held by OMEL) Audited
1.3 ONGC Narmada Limited (ONL) Nigeria 100% 100% Unaudited1.4 ONGC Amazon Alaknanda Limited (OAAL) Bermuda 100% 100% Audited1.5 Imperial Energy Limited Cyprus 100% 100% Audited1.5 (i) Imperial Energy Tomsk Limited Cyprus 100% 100% Audited1.5 (ii) Imperial Energy (Cyprus) Limited Cyprus 100% 100% Audited1.5 (iii) Imperial Energy Nord Limited Cyprus 100% 100% Audited1.5 (iv) Biancus Holdings Limited Cyprus 100% 100% Audited1.5 (v) Redclif fe Holdings Limited Cyprus 100% 100% Audited1.5 (vi) Imperial Frac Services (Cyprus) Limited Cyprus 100% 100% Audited1.5 (vii) San Agio Investments Limited Cyprus 100% 100% Audited
11.5 (viii) LLC Sibinternef t Russia 55.90% 55.90% Audited1.5 (ix) LLC Alliancenef tegaz Russia 100% 100% Audited1.5 (x) LLC Nord Imperial Russia 100% 100% Audited1.5 (xi) LLC Rus Imperial Group Russia 100% 100% Audited1.5 (xii) LLC Imperial Frac Services Russia 50% 50% Audited1.6 Carabobo One AB Sweden 100% 100% Audited1.6 (i) Petro Carabobo Ganga B.V. The Netherlands 100% 100% Audited1.7 ONGC (BTC) Limited Cayman Islands 100% 100% Unaudited1.8 Beas Rovuma Energy Mozambique Ltd. Bri tish Virgin Islands 60% 60% Audited1.9 ONGC Videsh Rovuma Ltd. (OVRL) Mauritius 100% - Audited1.10 ONGC Videsh Atlantic Inc. (OVAI) Texas 100% - Unaudited
21.11 ONGC Hydrocarbons Ltd. Mauritius - 100% -21.12 Krishna Rovuma Energy Mozambique Ltd. Mauritius - 100% -
2. Mangalore Refinery and Petrochemicals Ltd. (MRPL) India 71.63% 71.63% Audited2.1 ONGC Mangalore Petrochemicals Ltd. (OMPL)
(note 3.1) India 85.53% 48.15% AuditedB Joint Venture Entities1. Petronet LNG Limited (PLL) India 12.50% 12.50% Audited2. Petronet MHB Ltd (PMHBL) India 28.77% 28.77% Audited3. Mangalore SEZ Ltd (MSEZ) (note 3.2) India 26.82% 26.46% Audited4. ONGC Petro Additions Ltd. (OPaL) India 49.36% 49.36% Audited5. ONGC Tripura Power Company Ltd. ( OTPC) India 49.52% 49.52% Audited6. ONGC Teri Biotech Ltd. (OTBL) India 49.98% 49.98% Audited7. Dahej SEZ Limited (DSEZ) India 50.00 % 50.00 % Unaudited8. ONGC Mit tal Energy Limited (OMEL) (through OVL) Cyprus 49.98% 49.98% Unaudited9. Shell MRPL Aviation Fuels & Services Limited India 50.00% 50.00%
(SMASL) (through MRPL) Audited10. Mangalam Retail Services Ltd (through MRPL) India 49.98% - Audited11. Nor th East Transmission Company Ltd. (NETC)
(through OTPC) India 12.88% 12.88% Unaudited12. Mangalore STP Limited (through MSEZ) India 18.78% 18.52% Audited13. MSEZ Power Ltd (through MSEZ) India 26.82% - AuditedC Associates1. Pawan Hans Ltd. (PHL) India 49.00 % 49.00 % Unaudited
Name of the Subsidiaries/ Joint Venture and Associates
Country of Incorporation
Proportion Ownership InterestAs on
Status of Audit As on
31.03.201531.03.2015
SlNo.
31.03.2014

Consolidated Financial Statement
295
1 Although the subsidiary company OVL has 47.52 per cent ef fective ownership interest, it has 55.9 per cent of voting rights in LLC Sibinternef t. LLC Sibinternef t is therefore a subsidiary of the Company, in accordance with the Companies Act, 2013 of India and included in consolidation of accounts accordingly.
2 these companies have been liquidated w.e.f.11th June, 2014
3.1 During current year, OMPL has become subsidiary (previous year Joint venture) of ONGC Group on account of direct holding of 48.99% ( previous year 46%) by ONGC and indirect holding of 51.00% (previous year 3%) stake through subsidiary company MRPL with ef fect from 28th February, 2015.
3.2 Includes holding of 0.96% by OMPL. 3.3 In view of dif ferent sets of environments/prevalent
laws in respect of respective countries in which the subsidiaries/JVs are operating, the accounting policies followed (for treatment of depreciation of Tangible Assets, sales revenue and royalty etc.) by the subsidiaries/JVs are dif ferent from the accounting policies of the Company. For
consolidation of financial statement, the transactions reported which have been arrived using such dif ferent accounting policies by the group companies have been considered and disclosed at Note no. 9.2, 13.2, 14.2,14.3,14.5, 14.6,14.7, 14.8, 14.9,15.2, 16.2, 17.1(c),17.1(d), 17.1(e), 17.1(f), 24.3, 24.4, 24.5, 28.2, 29.6, 29.7, 32.3, 32.5 &45.2.4.
3.4 Pursuant to the enactment of the Companies Act, 2013 the Group has, ef fective from 1st April, 2014, revised the estimated useful life of its fixed assets generally in accordance with Schedule-II to the Companies Act, 2013. Accordingly, an amount of ₹2,582.22million (net of deferred tax of ₹1192.03 million) has been adjusted in the opening balance of retained earnings in respect of assets whose useful life has exhausted as at April 1, 2014. Further, consequent to the adoption of revised estimate of useful life of assets depreciation charged to Consolidated statement of profit & loss is lower by `4,137.14 million except in case of parent company ONGC, wherein the impact of the same is not ascertainable.
As atst31 March, 2014
(` in million)4. Share Capital
4.2 Terms/rights attached to equity shares
The company has only one class of equity shares having a par value of `5 per share. Each holder of equity shares is entitled to one vote per share. The dividend proposed by the Board of Directors is subject to the approval of the shareholders in the ensuing Annual General Meeting.
In the event of liquidation of the company, the holders of equity shares will be entitled to receive remaining assets of the company, af ter distribution of all preferential amounts. The distribution will be in proportion to the number of equity shares held by the shareholders.
4.1 Reconciliation of the equity shares outstanding at the beginning and at the end of the reporting period
Outstanding at the beginning of the year 8,555.49 42,777.45 8,555.49 42,777.45Changes during year - - - -Outstanding at the end of the year 8,555.49 42,777.45 8,555.49 42,777.45
st As at 31 March, 2015 As at 31 March, 2014st
No. in million
No. in million
` in million
` in million
Particulars
Particulars
Authorised:
30,000,000,000 Equity Shares of ` 5 each 150,000.00 150,000.00
(Previous Year 30,000,000,000 Equity Shares of 5 each)
Issued and Subscribed:8,555,528,064 Equity Shares of 5 each 42,777.64 42,777.64(Previous Year 8,555,528,064 Equity Shares of 5 each)
Paid up :
8,555,490,120 Equity Shares of 5 each 42,777.45 42,777.45(Previous Year 8,555,490,120 Equity Shares of 5 each)
Add: Shares for feited 0.15
TOTAL 42,777.60 42,777.60
`
``
``
0.15
As atst31 March, 2015

Annual Report 2014-15
Consolidated Financial Statement
296
4.5 Shares reserved for issue under option : Nil (previous year Nil)
5 Reserves and Surplus
4.3 Details of shareholders holding more than 5% shares in the company are as under:-
Capital Reserve ( Note 5.1)a) As per last Balance Sheet 1,234.97 1154.05b) Addition/(deletion) 38.77 1,273.74 80.92 1,234.97
Capital Redemption Reserve (Note 5.3)a) As per Last Balance Sheet 91.97 91.95b) Addition/(deletion) 0.01 91.98 0.02 91.97
Securities Premium Account a) As per last Balance Sheet 144.33 144.33b) Less: Share issue expense 16.15 128.18 - 144.33
Debenture Redemption Reserve (Note no. 5.4)a) As per Last Balance Sheet 24,488.86 14088.91b) Add: Transferred from Surplus Account 24,002.99 10399.95c) Less: Transfer to General Reserve 19,700.00 28,791.85 - 24,488.86
Deferred Government Grant ( Note 2.2.c)a) As per last Balance Sheet 41.73 27.53b) Addition during the year - 17.07c) Less: Deduction during the year (Note no. 5.5) 14.17 27.56 2.87 41.73
Self Insurance Reserves (Note 5.8)a) As per Last Balance Sheet - - b) Addition/(deletion) 4.35 4.35 - -
Foreign Exchange Translation Reserve (Note 5.6)a) As per Last Balance Sheet 70,763.79 37554.33b) Addition/(deletion) 4,384.84 33209.48c) Less: Transfer to Capital Redemption Reserve 0.01 75,148.62 0.02 70,763.79
Foreign Currency Monetary Item Difference Account (Note no. 5.7)a) As per Last Balance Sheet (3,925.56) -b) Addition/(deletion) (4,513.13) (8,438.69) (3,925.56) (3,925.56)
Hedging Reserve ( Note 32.7)a) As per Last Balance Sheet 11.12 -b) Addition/(deletion) (11.53) (0.41) 11.12 11.12
General Reservea) As per Last Balance Sheet 1,352,771.69 1,223,664.23 b) Add: Adj. with opening reserve (Note no. 3.4) (2,582.22) (3,143.02)c) Add:transfer from Debenture Redemption Reserve 19,700.00 d) Add: Transferred from Surplus Accounts 80,754.55 14,50,644.02 132250.48 1,352,771.69
Surplusa) As per last Balance Sheet 233,114.80 205,772.78 b) Add: Transferred from Profit and Loss Account of owners share 183,335.20 265,065.33 c) Add: Adjusment due to change in holding/other adjustment 1.08 45.90 d) Less: Proposed Dividend 4,277.75 2,138.87 e) Less: Interim Dividend 76,999.44 79,138.31 f) Less: Tax on Dividend 16,316.77 13,841.60 g) Less: Transfer to self Insurance Reserve 4.35 h) Less: Transfer to Debenture redumption reserve 24,002.99 10,399.95 i) Less: Transferred to General Reserve 80,754.55 214,095.23 132,250.48 233,114.80TOTAL 17,61,766.43 1,678,737.70
President of India 5897.76 68.94 5897.76 68.94Life Insurance Corporation of India 677.18 7.92 666.70 7.79Indian Oil Corporation Limited 657.92 7.69 657.92 7.69
As at st31 March, 2015
stAs at 31 March, 2015
As at st31 March, 2014
As at 31 March, 2014st
No. in million
No. in million
%holding
%holding
Name of the share holder
Particulars
4.4 Pursuant to the approval of the members dated 28.01.2011, during the financial year 2010-11, one equity share having face value of `10/- each had been sub-divided into two equity shares of `5/- each and bonus shares in proportion of one new equity bonus share of `5/- each for every one fully
(` in million)
paid up equity share of `5/- each held on 09.02.2011 (record date) had been allot ted. The company has issued total 4277.75 million equity shares of face value of `5 each issued as fully paid up by way of bonus shares during the period of five years immediately preceding the reporting date.

Consolidated Financial Statement
297
:5.1 Includes `159.44 million (Previous year `159.44 million) being assessed value of assets received as gif t and 940.22 million (Previous year 901.45 million) being Capital Reserve on Consolidation.
5.2 The Board of Directors has recommended a final dividend of 0.5 per share (previous year 0.25per share) which is subject to the approval of the
5.5 Represents the amount equivalent to depreciation transferred to Statement of Profit and Loss.
5.6 Foreign Exchange Translation Reserve: The subsidiary, ONGC Videsh Limited has followed the Accounting Standard (AS) 11 - Ef fects of Changes in Foreign Exchange Rates (revised 2003) for incorporating in the consolidated
shareholders in the ensuing Annual General Meeting over and above the interim dividend of 9 pershare (Previous year 9.25 pershare).
5.3 Includes `91.86 Million Capital Redemption Reserve created on redemption of Preference share capital during 2011-12 and 2012-13 in respect of subsidiary, MRPL.
financial statements following the principles for translation of the financial statements of Non-integral Foreign Operations. Accordingly, the foreign exchange dif ference of `4,384.84 Million (Previous year `33,209.48 Million) has been accounted as foreign exchange translation reserve.
(` in million)
8.40 % 5 Years Unsecured Non-ConvertibleRedeemable Bonds in the nature of Debentures-Series I( redeemed on 23rd Dec-2014) 16,830.22 2,869.78 19,700.00 -8.54 % 10 Years Unsecured Non- ConvertibleRedeemable Bonds in the nature of Debentures- Series II 1,566.33 369.79 - 1936.12Total (A) 18,396.55 3,239.57 19,700.00 1,936.12Unsecured 3.75% 10 years USD Bonds-USD 500 millions 3,312.85 2,638.98 - 5,951.83Unsecured 2.50% 5 years USD Bonds-USD 300 Million 2,760.71 4,381.48 - 7,142.19Total (B) 6,073.56 7,020.46 13,094.02Unsecured 3.25% 5 year USD Bonds - USD 750 Millionsdue 2019 - 6,689.38 - 6,689.38Unsecured 4.625% 10 year USD Bonds -USD 750 Millions due 2024 - 3,343.76 - 3,343.76Unsecured 2.75% 7 year EUR Bonds -EUR 525 Millions due 2021 - 3,611.89 - 3,611.89Total (C) - 13,645.03 - 13,645.03TOTAL (A+B+C) 24,470.11 23,905.06 19,700.00 28,675.17
Particulars Balanceas on
st31 March, 2014
Additionduring year
Transferduring
the year
Balanceas on
st 31 March, 2015
5.8 In respect of Joint venture company, OTPC, Self-insurance reserve @0.1% p.a. on Gross Block of Fixed Assets (except assets covered under mega insurance policy) is created as at the end of the year by appropriating current year profit towards future losses which may arise from un-insured risks and
(` in million)
Particulars As at st31 March, 2015
As at st31 March, 2014
Opening Balance (3,925.56) - Additions during the year (5,768.99) (4,616.00)Amortized during the year 1,255.86 690.44Closing Balance (8,438.69) (3,925.56)
the same is shown as ''self-insurance reserve'' under 'Reserve & Surplus'.
5.9 Above Reserve and Surplus includes `(-) 7,052.34 million share of jointly controlled entities (Previous year (-)3,575.69 Million).
5.4 Debenture Redemption Reserve: -
Debenture Redemption Reserve includes `28,675.17 million (previous Year `24,470.11 million) in respect of subsidiary company OVL, as follows:
5.7 Foreign Currency Monetary Item Exchange Account:In case of subsidiary, ONGC Videsh Limited,the details of the exchange dif ferences on long term monetary items are as under:-

Annual Report 2014-15
Consolidated Financial Statement
298
6.1 Above include, Secured long term borrowings of`99,142.71 million share of jointly controlled entities (Previous year `112,385.66 million) and Unsecured long term borrowings of `9,073.39 million share of jointly controlled entities (Previous year 7,256.69 million).
6.2 Secured Loan
6.2.1 Zero coupon bond (ZCB): The Joint Venture, PMHBL has issued Zero Coupon Bonds to Lenders as per Corporate Debt Restructuring (CDR) Approved Scheme, repayable in 36 quarterly installments commencing from Sept 2006 and ending on June 2015. The ZCBs are secured by first mor tgage on Immovable Properties- present & future, first charge on movable properties - present & future and charge on all receivables from the project on pari passu basis. Balance outstanding as on 31st March 2015 is nil (Previous year `12.65 million) out of which Group’s share is nil (Previous year 3.64 million).
6.2.2 The Subsidiary, MRPL has external commercial borrowing (ECB) of `40,628.25 million (Previous year `38,948.00 million), secured by first pari passu charge over immovable and movable fixed assets both present and future. The interest rate for ECB are based on 6 month LIBOR plus spread. The ef fective interest rate are 3.2247%, 3.7019%, 2.7957%, 2.4157% and 2.8641% on `6,250.50 million, `9,375.75 million, `18,751.50 million,`3,125.25 million and 3,125.25 million respectively to be repaid annually by 2020-21.
6.2.3 The Joint Venture, PLL has availed loan from Banks, secured by first ranking mortgage and first charge on pari passu basis on all movable and
immovable properties, both present and future including current assets except on trade receivables on which second charge is created on pari passu basis at an average interest rate of 10.02% p.a. Balance outstanding as on 31st March, 2015 is Nil (Previous year `9,706.30 million) out of which group’s share is Nil (Previous year 1,213.29 million)
6.2.4 The Subsidiary, OMPL has external commercial borrowings (ECB) arrangement from a consor t ium of banks for USD 331.32 million(previous year USD 310 million), secured by first charge on all fixed asset and second charge of the project asset & all current assets. The rate of interest for ECB are LIBOR+3.13% to LIBOR+3.15%. ECB’s are repayable in 14 equal half yearly installments commencing from 1st April, 2015 and 31st October, 2015 respectively. Balance outstanding as on 31st March 2015 is `18,208.95 million (Previous year `18,618.60 million) out of which group’s share is `18,208.95 million (Previous year 8,964.65 million)
6.2.5 The Subsidiary OMPL has borrowed Rupee Term Loan from a Consortium of Banks at an interest rate of “SBI base rate+1.25%” secured by first charge on all fixed assets and second charge on the current assets. The Rupee Term Loan is repayable in 36 equal quarterly installments beginning from 31st December, 2015. Balance outstanding as on 31st March 2015 is `18,636.49 million (Previous year `17,293.90 million) out of which group’s share is `18,636.49 million (Previous year 8,326.82 million).
6.2.6 The joint venture, OPaL has borrowed Secured
(` in million)6 Long-Term Borrowings
A. Secured(a) Zero Coupon Bond (Note no. 6.2.1) - 3.64 (b) Term Loan (Note 6.2.2 to 6.2.9)
- From Banks 103,102.16 100,654.50 - From Others 63,529.70 166,631.86 42,450.65 143,108.79
B. Unsecured(a) Non Convertible Redeemable Bonds (Note 6.3.2) 181,218.50 48,423.00 (b) Non Convertible Redeemable Debentures (Note 6.3.1) 3,700.00 3,700.00 (c) Term Loan
- From Banks ( Note 6.3.5 & 6.3.7) 113,186.00 106,606.50 - From Others ( note 6.3.3) 5,250.00 8,000.00
(d) Non-current maturities of finance lease obligations(Note 6.3.4) 4,237.84 4,811.12
(e) Sales Tax Deferment Loan (Note 6.3.6) 1,603.34 309,195.68 2,159.17 173,699.79
TOTAL (A+B) 475,827.54 316,808.58
As at st31 March, 2015
As at st31 March, 2014
Particulars

Consolidated Financial Statement
299
term loan from a Consortium of Banks and has also availed External Commercial Borrowings (ECB), which are secured by first ranking pari passu mortgage / charge on immovable and movable properties and assets both present and future and second ranking pari passu charge on the current assets with working capital lender on reciprocal basis. The details of interest rates, terms of repayment & outstanding amounts are as below:-
6.2.7 The Joint Venture, MSEZ has term loan from a Consortium of Banks at the interest rate “base rate+agreed spread (i.e. at 11.25%) ” secured by mortgage and hypothecation of immovable and movable assets repayable in 36 unequal quarterly installment commencing af ter moratorium period of 6 month from commercial operation date which was extended from 1st April, 2014 to 1s April, 2015. Balance outstanding as on 31st March, 2015 is `5,447.85 million (Previous year 5,546.62 million) out of which group’s share `1,461.14 million (Previous year 1,467.76 million).
6.2.8 The Joint Venture, OTPC has taken Rupees Term loan from State Bank of India(SBI), secured by first rank pari-passu charge on all immoveable properties - present and future, relating to the project and first charge by way of hypothecation on all moveable properties - present and future, relating to project and first charge on all the
receivables, Let ter of credit and Escrow Account. Interest on the RTL is at SBI base rate (floating)+ 0.50% (spread) and is repayable in 60 equal quarterly installments commencing from the 31st March, 2014. Balance outstanding for the same on 31st March, 2015 is `26,944.84 million (Previous year `23,131.10 million) out of which group’s share is `13,344.22 million (Previous year `11,455.49 million). Further, the Joint venture company NETC of OTPC (NETC), has availed loan from PFC by creating a first charge on its immovable properties acquired for the project along with the revenue and receivables from the project - present and future against which Group’s share is `2,185.57 million (previous year `1,886.38 million) as on 31st March, 2015.
6.2.9 The Joint Venture, PLL has external commercial borrowings from Internat ional Finance Corporation Washington D.C., USA, Proparco,
(` in million)
Bank Loan-Medium Termloan
Bank Loan -Long TermLoan
Sub Debt* Base rate ofrespective bank+spread 0.75%(10.90% -
ExternalcommercialborrowingsUSD 50 Million
External 6 month USDcommercial LIBOR +rangeborrowings 347 to 352 basisUSD 250 Million points
Sub Total 168,440.79 161,445.77 83,142.37 79,689.63
Less : Current Maturity of long term Debt 22,093.52 21,399.74 10,905.36 10,562.91
Total 146,347.27 140,046.03 72,237.01 69,126.72
10.50% By 31.12.2015 21,399.86 21,399.74 10,562.97 10,562.91
11.75% 41 equal quarterly 113,168.42 110,303.61 55,859.93 54,445.86instalments startingfrom Q4 FY2016-17to Q4FY2025-26
Repayable af ter 3 19,999.31 16,434.62 9,871.66 8,112.13year from date ofdisbursement
11.00% (i.e. Dec, 2016).ef fectively on31.03.15)
6 month USD 9 half yearly 3,153.00 3,024.50 1,556.32 1,492.89LIBOR +324 instalment startingbasis points from March, 2016
to March, 2020
15 half yearly 10,720.20 10,283.30 5,291.49 5,075.84instalments startingfrom March, 2016to March, 2023
Type of loan EffectiveRate
Terms ofRepayment
Outstanding Amount as on
31.03.2015 31.03.2014 31.03.2015 31.03.2014
Group’s share in outstanding on
*secured by way of hypothecation in favor of the lender of movable fixed assets and other immovable fixed asset , both present and future located at SEZ Dahej.

Annual Report 2014-15
Consolidated Financial Statement
300
France & Asian Development Bank at an average cost of 8.87% p.a. (inclusive of hedge cost) and loan from Bajaj Allianz Life Insurance Company Ltd (Indian lender) has been repaid during the year. In respect of external commercial borrowings from International Finance Corporation Washington D.C., USA, and Proparco, France, PLL, has entered into derivative contracts to hedge the loan including interest. Balance outstanding as on 31st March, 2015, is `10,738.10 million (Previous year `13,771.10 million) out of which group’s share is
`1,342.26 million (Previous year `1,721.39 million).
6.3 Unsecured Loan
6.3.1 Non-conver tible redeemable debenture (Rupee Bonds):
During the financial year 2009-10, the subsidiary, OVL, had raised funds from the financial markets by issuance of non-convertible redeemable debenture (Rupee Bonds) in the nature of debentures as per following:-
8.54 % 10 Years Unsecured Non-Convertible Redeemable 3,700.00 6-Jan-2010 6-Jan-2020
Bonds in the nature of Debentures- Series II of face value of
`1 million each
Particulars
Particulars
Amount
Amount
(` in million)
(` in million)
Date ofissue
Date ofissue
Due date ofredemption
Due Date ofRedemption
Coupon
The above securities have been listed in National Stock Exchange of India Ltd. (NSE). Subsidiary Company, OVL is required to maintain 100% asset cover as per SEBI guidelines. There is no put / call option on these bonds. The bonds are repayable in full (bullet repayment) on maturity date.
6.3.2 Foreign Currency Bonds
the subsidiary, OVL, had raised funds from the international financial markets by issuance of non-convertible redeemable Reg-S foreign currency bonds as per following:
The above US$ 500 million 3.75 per cent Notes due 99.598% and US$ 750 million Reg S notes 2024 2023, the US$ 300 million 2.5 per cent Notes due were issued at price of 99.454%. The bonds have 2018, the US$ 750 million 3.25 per cent Notes due been issued in denomination of US$ 200,000 and 2019 and US$ 750 million 4.625 per cent Notes due integral multiples of US$ 1,000 in excess thereof. 2024 have been listed on Singapore Exchange The € 525 million notes 2021 were issued at price of (SGX). The € 525 million 2.75 percent Notes due 99.623%. Euro note denomination is € 100,000 and 2021 have been listed in the Frankfurt Stock multiples of €1,000 thereaf ter. There is no periodical Exchange. The US$ 300 million Reg S bonds were put/call option. The bonds are repayable in full issued at price of 99.655% and US$ 500 million Reg (bullet repayment) on maturity date. The foreign S bonds were issued at price of 99.950% . The US$ exchange dif ference in respect of the foreign 750 million Reg S notes 2019 were issued at price of currency bonds* till 31 March, 2015 amounting to
USD 500 million unsecured non-convertible payable semiannually in arrears
USD 300 million unsecured non-convertible 16,287.00 07-May-13 07-May-18 2.50%, payable semiannually in arrears
USD 750 million unsecured non-convertible 45,127.50 15 July, 2014 15 July, 2019 3.25%, payable semi-annually in arrears
USD 750 million unsecured non-convertibleReg S Bonds
EUR 525 million unsecured Euro Bonds* 43,044.75 15 July, 2014 15 July, 2021 2.75%, payableannually in arrears
Foreign Exchange difference ** 2,861.75
Total 1,79,593.50
27,145.00 07-May-13 07-May-23 3.75%, Reg S Bonds
Reg S Bonds
Reg S Bonds
45,127.50 15 July, 2014 15 July, 2024 4.625%, payablesemi-annually inarrears

Consolidated Financial Statement
301
`2,861.75 Million (previous year `4,616.00 Million) has been generated, which is amortized over the outstanding tenure of the loan as per the provision of Para 46A of AS 11.*Except the Euro designated bonds which are capitalised to the respective assets of block Area 1, Mozambique Of fshore.** The foreign exchange dif ference on the foreign currency bonds till 31.03.2015 amounting to`2,861.75 million (Previous year 4,616.00 Million) has been amortized over the outstanding tenure of the loan as per the provision of paragraph 46A of AS 11.
6.3.3 The Subsidiary, MRPL has availed unsecured term loan from Oil Industry Development Board (OIDB) of 5,250.00 million (previous year 8,000.00 million). The interest rates on the same are 8.89 %, 9.04%, 8.73% ,8.98%, 8.94%, 9.27%, 9.06% and 9.15% on 1,825.00 million, 175.00 million,937.50 million, 2,062.50 million, 87.90 million,2,230.00 million, 399.60 million, and 282.50
million respectively, which are repayable by2018-19.
`
` `
` `` ` `` ` `
6.3.4 The subsidiary, OVL has unsecured of finance lease obligation of 5,515.42 million (Previous year 6,028.84 million).
6.3.5 The subsidiary, OVL has availed a term loan for5 year from Bank amounting to 111,186.00 million (USD1,775 million){Previous year106,606.50 million (USD1,775 million)} for the
purpose of acquisition of block in Mozambique.6.3.6 The Subsidiary, MRPL, has deferred payment
liability representing ‘SalesTax deferment’ of1,603.34 million (Previous year 2,159.17
million) with nil interest rate, to be repaid by2019-20.
6.3.7 The Subsidiary OMPL has availed a term loan from bank amounting to 2,000.00 million (Previous year Nil) repayable in 2 equal instalments, with first repayment beginning from August 2016. The rate of interest is Axis base rate+0.50% payable on monthly basis.
6.3.8 The Joint Venture, PLL has raised the fund by issuing Non-conver tible Bonds which are unsecured, The details of rate, repayable period & outstanding amount are as below:-
``
`
`
` `
`
7. Deferred Tax Liabilities The Deferred Tax Liability/Asset of the company, its subsidiaries and joint ventures as at 31st March, 2015 comprises of the major components of Deferred Tax Liabilities and Deferred Tax Assets under Accounting Standard-22 on ‘Accounting for Taxes on Income’ the details of the same given here under:
(` in million)
Particulars As atst31 March, 2015
As atst31 March, 2014
(i) Liabilities Depletion of Producing Properties 2,28,520.78 2,18,766.58Depreciation Allocated to Wells in Progress & expenses relating to NELP 21,984.40 23,002.57Deferred Revenue Expenditure writ ten of f 3,385.09 5,432.45Development wells-in Progress 12,724.71 10,052.58Depreciation 29,968.56 18,419.17Others 12,511.65 7,300.79Deferred tax liability - Subsidiaries of OVL 7,037.69 7,347.56Total 3,16,132.88 2,90,321.70(ii) Assets Depreciation (refer Note no. 7.1) 32,348.62 22,690.58Unabsorbed losses and allowances 469.03 132.90Dry wells writ ten of f 29,079.78 18,340.46Provision for Non-Moving Inventories 1,762.13 1,876.75Provision for Doubt ful Debts/ Claims /Advances/ Interest 4,858.02 4,270.17Provision for Abandonment 34,364.43 38,633.84Provision toward Additional Profit Petroleum & interest 3,638.61 3,426.45Statutory duties unpaid u/s 43B 1754.05 780.47Others 14,365.29 14,649.08Deferred tax asset - Subsidiaries of OVL 11,733.89 6,885.90TOTAL 1,34,373.85 1,11,686.60
(` in million)
Type of Bonds RepaymentFrequency
Repayableperiod
Outstanding as on Group's share in outstanding on
Bonds-8.35% debenture Bullet 2018 3,000.00 3,000.00 375.00 375.00Bonds-9.00% debenture Bullet 2017 4,000.00 - 500.00 -Bonds-9.05% debenture Bullet 2019 6,000.00 - 750.00 -
13,000.00 3,000.00 1,625.00 375.00
31.03.2015 31.03.2014 31.03.201431.03.2015

Annual Report 2014-15
Consolidated Financial Statement
302
7.1 Includes an amount of `1,192.03 million on account of Transitional provision of Companies Act 2013. (refer Note no. 3.4)
7.2 The above includes Net Deferred Tax Asset of
5,854.11 million (Previous year 122.28million) and Net Deferred Tax Liability of 187,613.15 million (Previous Year 178,757.38 million)in respect of various components/entities consolidated as below.
` ``
`
(` in million)
(` in million)
Particulars As atst31 March, 2015
As atst31 March, 2015
As atst31 March, 2014
As atst31 March, 2014
Net Deferred Tax Liability of ONGC 1,77,331.54 1,65,786.79
Net Deferred Tax Liability of OVL 8,066.79 6,921.94
Net Deferred Tax Liability of ONGBV - 201.62
Net Deferred Tax Liability of OAAL 703.12 328.23
Net Deferred Tax Liability of Carabobo One AB 382.70 54.02
Net Deferred Tax Liability of MRPL 1.12 4,703.24
Net Deferred Tax Liability of PLL 908.75 691.25
Net Deferred Tax Liability of OTPC 190.55 70.29
Net Deferred Tax Liability of MSEZ 28.57 -
Consolidated Net Deferred Tax Liability 1,87,613.14 1,78,757.38
Net Deferred Tax Asset of ONGBV 5,782.00 -
Net Deferred Tax Asset of PMHBL 71.99 122.24
Net Deferred Tax Asset of OTBL 0.11 0.04
Consolidated Net Deferred Tax Asset 5,854.11 122.28
Trade payables - Outstanding dues to Micro & Small Enterprises - - - Outstanding dues to other than Micro & Small Enterprises 741.91 1,020.45 Others- Advance from customers 4,128.70 3,624.65 - Deposits from Suppliers and Contractors 252.34 31.23 - Liability for Capital Goods 445.57 1,773.16 - Liabilities for Liquidated Damages 9,538.19 9,904.05 - Other Liabilities 3,187.73 2,113.63 TOTAL 18,294.44 18,467.17
8. Other Long Term Liabilities
8.1 Above other long term liabilities includes 6,643.12 million share of jointly controlled entities (Previous year`7,274.89 million).
`
Particulars
(` in million)
As atst31 March, 2015
As atst31 March, 2014
Provision for Employee benefits ( Note no. 38)
- Unavailed Leave 316.54 386.24
\ - Gratuity 81.72 74.61
- Post Retirement Medical & Terminal Benefits 27,152.60 28,778.25
Provision for Abandonment (Note no. 45) 298,197.94 274,266.03 Other Provisions (Note no. 45) 2,047.31 1,794.42
TOTAL 327,796.11 305,299.55
9. Long Term Provisions
Particulars

Consolidated Financial Statement
303
(` in million)
As atst31 March, 2015
As atst31 March, 2014
Secured (Note 10.1)
Short Term Loans from Banks 17,206.74 810.75
Unsecured
Loans Repayable on demand from Bank 9,604.79 3,868.75
Other Short Term Loans :
From Banks 12,223.85 133,633.50
From Others 3,850.33 759.72
TOTAL 42,885.71 139,072.72
10. Short Term Borrowings
9.1 Above long term provisions includes 17.65 million share of jointly controlled entities (Previous year`15.74 million).
9.2 The overseas subsidiaries and the Joint Venture Companies of OVL provide for the retirement
Above Secured short term borrowing includesNil(Previous year `810.75 million) shares of jointly controlled entities and unsecured short term borrowing includes `10,124.79 million (Previous year `3,868.75 million) shares of jointly controlled entities.
10.1 Short Term Loan - Secured
10.1.1 The company has availed short term borrowing of `13,930 million (Previous year Nil) as against of `17,340 million (Previous year Nil) of principal amount of Term deposit receipt with bank.
10.1.2 The subsidiary OMPL has outstanding secured short term Loan from Bank of `3168.01 million (Previous year Nil), secured by way of hypothecation of OMPL’s stock of raw materials, finished goods, stock-in-process, stores, spares, components, book debts, outstanding monies receivable, claim, bills, contracts, engagements, securities, both present and future and further secured by second ranking pari passu charge against company’s immovable and movable fixed Asset both present and future.
10.1.3 The subsidiary, MRPL has outstanding secured short term Loan of `108.73 million (Previous year `471.51 million) from Bank secured by way of hypothecation of MRPL’s stock of raw materials, finished goods, stock-in-process, stores, spares, components, book debts, outstanding moneys receivable, claim, bills, contracts, engagements, securities, both present and future and further secured by second ranking pari passu charge against said company’s immovable and movable fixed Asset both present and future. This includesnil (Previous year 471.51 million) in respect of joint venture company of MRPL, Shell MRPL Aviation Fuels & Services Pvt Ltd.
benefits in accordance with the laws of their respective jurisdictions. The net impact on account of this dif ference in accounting policy is not ascertainable.
10.1.4 The Joint venture company, OTPC has borrowed short term loan from bank repayable within one year from date of first disbursement, that is by 30th September, 2014 and accordingly the same has be repaid during year. The short term loan was secured by first rank paripassu charge on all immovable properties, present and future relating to project and first charge on all the receivable, let ter of credit and Escrow Account at interest rate SBI base rate (floating)+.75% (spread). The balance outstanding as on 31.03.2015 is ofNil(Previous year `685.00 million) out of which group’s share is Nil(Previous year 339.24 million).
10.2 Short term Loan-Unsecured
10.2.1 The Joint venture, OPaL has borrowed short term loans from bank of `19,460.00 million (Previous year Nil) repayable on quar terly basis by 31.03.2016 out of which group’s share is`9,605.46 million (Previous year Nil).
10.2.2 The Subsidiary, OMPL has borrowed short term loan from bank repayable on demand of`12,199.09 million (Previous year `7,389.26 million) out of which group’s share is `12,199.09 million (Previous year 3,557.85 million).
10.2.3 The Joint venture, PLL has borrowed short term buyers credit from bank repayable on demand of Nil(Previous year `2,487.20 million) out of which group’s share is Nil(Previous year 310.90 million).
10.2.4 The subsidiary OVL has availed bridge/short term loan from bank of Nil (Previous year `133,633.50 million) for the purpose of acquisition of par ticipating interest in Area 1 of fshore, Mozambique.
10.2.5 The Joint venture company, OTPC has borrowed short term loan from TFCSL is repayable within six
Particulars

Annual Report 2014-15
Consolidated Financial Statement
304
month from the date of first disbursement of loan at rate of 10.60% p.a payable monthly, The balance outstanding as on 31.03.2015 is of `1,000.00 million (Previous year nil) out of which group’s share is 495.20 million (Previous year Nil).
10.2.6 The Joint venture company, OTPC has borrowed short term loan from Axis Bank is repayable within
six month from the date of first disbursement of loan at rate of base rate +0.50% p.a payable monthly, The balance outstanding as on 31.03.2015 is of `50.00 million (Previous year nil) out of which group’s share is `24.76 million (Previous year Nil).
Particulars
(` in million)
As atst31 March, 2015
As atst31 March, 2014
Current Maturity of Long Term debt (Note 6.2 & 6.3) 19,453.84 34,028.47
Current Maturity of Finance Lease Obligations (Note 6.3.4) 1,277.58 1,217.72
Interest Accrued but not due on Borrowings 3,060.17 2,098.79
Interest Accrued and due on Borrowings 148.67 135.13
Interest Accrued and due on mature debenture (Note 12.3) 0.19 0.19
Non- Recourse Deferred Credit( Note 12.4) 1,088.19 1,043.37
Less: Set of f against Provision for non receipt of instalments 728.97 359.22 698.95 344.42
Advance from Customers 1,271.88 27,087.13
Unclaimed Dividend (Note 12.2) 255.07 248.59
Liability for Capital Goods 33,744.93 28,044.22
Liability for Statutory Payments 32,958.61 30,295.08
Liability for Gratuity 24.98 18.22
Deposits from Suppliers and Contractors 3,202.48 9,948.28
Amount payble to operator 6,217.40 21,371.81
Cash Call payable to JV Partners 18,527.83 9,927.26
Liability for Employees 5,981.07 9,641.61
Liability for Superannuation Benefits 1,125.95 1,142.43
Liabilities for Liquidated Damages 8,110.86 10,666.22
Other Liabilities 32,948.55 30,823.22
TOTAL 168,669.28 217,038.79
12. Other Current Liabilities
(` in million)
As atst31 March, 2015
As atst31 March, 2014
- Outstanding dues to Micro & Small Enterprises 83.45 82.20
- Outstanding dues to other than Micro & Small Enterprises (Note 11.3) 303,752.98 306,459.33
- Deferred Credit on Gas Sale (Note 11.2) 36.63 261.88
TOTAL 303,873.06 306,803.41
11. Trade Payables
11.1 Above trade payable includes `1,170.43 million share of jointly controlled entities (Previous year3,618.23million).
11.2 Deferred credit on gas sales represents amounts received from gas customers against "Take or Pay" obligations under relevant gas sales agreements. The amounts are to be utilized to supply gas in subsequent year(s) free of charge to such customers.
`
11.3 In case of subsidiary MRPL, trade payables include 147,854.73 million (previous year79,141.99 million) being overdue amount payable
to National Iranian Oil Company (NIOC) pending set tlement due to non-finalization of remit tance channel arising out of UN/US/EU backed sanctions .
``
Particulars

Consolidated Financial Statement
305
12.1 Above other current liabilities includes `18,672.45 million share of jointly controlled entities (Previous year 18,792.07million).
12.2 No amount is due for payment to Investor Education and Protection Fund.
12.3 Liabilities for interest towards disputed claimin respect of subsidiary company, MRPL.
12.4 In respect of subsidiary company, OVL Non-
recourse deferred credit of `1,088.19 Million (Previous year `1,043.37 Million) represents the non-recourse deferred credit from contractors of pipeline project executed by the Company in Sudan. The Non-recourse deferred credit is repayable from the instalments of pipeline lease rentals from Ministry of Energy and Mining (MEM), Sudan.
(` in million)
As atst 31 March, 2015
As atst 31 March, 2014
Provision for Employees Benefits ( Note no. 38)
Unavailed Leave 4,227.88 2,701.15
Gratuity 6.41 4.53
Post Retirement Medical & Terminal Benefits 1,632.19 2,142.42
Provision for Abandonment (note 45) 411.60 424.39
Provision for Others
Proposed Dividend 4,277.75 2,138.87
Tax on Proposed Dividend 910.15 397.92
Provision for wealth Tax 115.16 126.00
Less: Paid 65.16 50.00 58.82 67.18
Provision for taxation (Net of Advance tax & TDS) 8,675.22 56.98
MAT Payable 96.29 72.32
Other Provisions (note no. 13.2 & 45) 2,304.65 1,494.53
TOTAL 22,592.14 9,500.29
13. Short Term Provisions
13.1 Above short term provisions includes 442.28 million share of jointly controlled entities (Previous year 351.03 million).
13.2 Other provisions
The subsidiary, MRPL, had recognized liability
`
`
Particulars
based on substantial degree of estimation for excise duty payable on clearance of goods lying in stock as on 31st March, 2015 for 2,057.60 Million (Previous year 1,155.18 million).
``

Annual Report 2014-15
Consolidated Financial Statement
306
14.
Tan
gib
le A
sse
ts
Land
Fre
ehol
d 4
,320
.20
463
.02
46.
41
4,7
36.8
1 -
-
-
-
-
-
-
4
,736
.81
4,3
20.2
0
Land
Lea
seho
ld 1
7,94
8.51
2
,962
.49
1,2
33.7
7 1
9,67
7.23
1
,517
.65
417
.76
(11
2.26
) 2
,047
.67
-
-
-
-
17,
629.
56
16,
430.
86
Bui
ldin
g &
Bun
k H
ouse
s 3
9,66
7.52
5
,514
.64
308
.33
44,
873.
83
13,
092.
13
4,0
58.3
1 (
1,00
7.87
) 1
8,15
8.31
1
25.8
4 1
.27
-
127
.11
26,
588.
41
26,
449.
55
Pla
nt &
Equ
ipm
ent
1,3
07,8
57.2
6 2
94,2
38.4
2 2
,930
.11
1,5
99,1
65.5
7 9
02,7
43.2
6 6
7,81
0.73
9
2.82
9
70,4
61.1
7 1
,927
.18
17.
68
1.0
1 1
,943
.85
626
,760
.55
403
,186
.82
Furn
itur
es &
Fix
ture
s 1
6,35
6.88
1
,555
.25
264
.72
17,
647.
41
11,
541.
45
2,6
84.2
8 (
176.
38)
14,
402.
11
11.
87
1.5
4 0
.05
13.
36
3,2
31.9
4 4
,803
.56
Off
ice
Equi
pmen
t 7
,995
.77
1,7
01.5
1 4
44.6
4 9
,252
.64
4,5
75.0
4 2
,005
.90
(89
.30)
6,6
70.2
4 2
1.81
2
.41
2.3
4 2
1.88
2
,560
.52
3,3
98.9
2
Veh
icle
s in
clud
es S
urve
y
Shi
ps, C
rew
Boa
ts a
nd
Hel
icop
ters
(no
te14
.1(k
)) 9
,526
.28
3,0
17.8
9 7
98.2
1 1
1,74
5.96
5
,852
.43
1,3
53.6
2 6
74.6
9 6
,531
.36
10.2
5 -
-
10.
25
5,2
04.3
5 3
,663
.60
Tota
l 1
,403
,672
.42
309
,453
.22
6,0
26.1
9 1
,707
,099
.45
939
,321
.96
78,
330.
60
(61
8.30
) 1,
018,
270.
86
2,0
96.9
5 2
2.90
-
3
.40
2,1
16.4
5 6
86,7
12.1
4 4
62,2
53.5
1
Pre
viou
s Ye
ar 1
,235
,984
.90
170
,978
.92
3,2
91.4
0 1
,403
,672
.42
827
,192
.31
115
,612
.15
3,4
82.5
0 9
39,3
21.9
6 2
,048
.00
78.
43
40.
05
(10
.57)
2,0
96.9
5 4
62,2
53.5
1
The
abov
e in
clud
es th
e
com
pany
's s
hare
in J
oint
Ven
ture
Ass
ets
273
,306
.67
25,
795.
19 1
69,0
64.0
5 1
30,0
37.8
1 1
55,8
02.3
6 5
,906
.86
99,
125.
76
62,
583.
46
821
.73
-
-
-
821
.73
66,
632.
62
116
,682
.58
Pre
viou
s Ye
ar 2
22,8
28.4
2 5
2,19
6.92
1
,718
.67
273
,306
.67
131
,477
.52
23,
384.
34
(94
0.50
) 1
55,8
02.3
6 7
97.5
3 24
.20
8
21.7
3 1
16,6
82.5
8
Des
crip
tion
stA
t 1
Apr
il, 2
014
stA
t 1
Apr
il, 2
014
stA
t 1
Apr
il, 2
014
For
the
year
For
the
year
Wri
tten
back
Re
clas
sific
atio
nA
ddit
ions
Gro
ss B
lock
Acc
umul
ated
Dep
recl
atio
nA
ccum
ulat
ed I
mpa
irm
ent
Net
Blo
ck
Del
etio
n/A
djus
tmen
tD
elet
ion/
Adj
ustm
ent
stA
t 31
Mar
ch, 2
015
stA
t 31
M
arch
, 201
5
stA
t 31
M
arch
, 201
5
stA
s 31
M
arch
, 201
5
stA
t 31
M
arch
, 201
4
14.1
Abo
ve in
clud
es:-
(a)
Add
itio
ns to
Tan
gibl
e Fi
xed
Ass
ets
are
net o
f ` 4
,353
.08
mill
ion
on a
ccou
nt o
f for
eign
cu
rren
cy tr
ansl
atio
n ad
just
men
t dur
ing
the
year
(Pre
viou
s ye
ar
2,1
95.4
8 m
illio
n).
(b)
Land
in
clud
es
land
in
re
spec
t of
ce
rtai
n pr
ojec
ts
for
whi
ch
exec
utio
n of
le
ase/
conv
eyan
ce d
eeds
are
in p
roce
ss.
(c)
Reg
istr
atio
n of
title
dee
ds in
resp
ect o
f cer
tain
Bui
ldin
gs is
pen
ding
exe
cutio
n.(d
)In
res
pect
of
subs
idia
ry M
RP
L, l
and
leas
e ho
ld o
f 2
49.9
6 m
illio
n (P
revi
ous
year
249
.96
mill
ion)
has
not
bee
n am
ortiz
ed i
n vi
ew o
f th
e fa
ct t
hat
even
tual
ly t
he
owne
rshi
p w
ill g
et tr
ansf
erre
d to
the
com
pany
on
expi
ry o
f the
leas
e pe
riod.
(e)
Pla
nt &
Equ
ipm
ent
incl
udes
an
amou
nt o
f 7
82.9
8 m
illio
n (P
revi
ous
year
7
82.9
8 m
illio
n)be
ing
MR
PL'
s sh
are
of a
n as
set j
oint
ly o
wne
d w
ith
anot
her c
ompa
ny. N
et B
lock
39
.15
mill
ion
(Pre
viou
s ye
ar
39.
15m
illio
n).
(f)
In r
espe
ct o
f sub
sidi
ary
MR
PL
land
leas
e ho
ld o
f 28
.82
mill
ion
(pre
viou
s ye
ar
36.5
6
mill
ion)
is in
pos
sess
ion
of th
e co
mpa
ny to
war
ds w
hich
form
al le
ase
deed
s ar
e ye
t to
be
exec
uted
. Net
blo
ck
28.8
2 m
illio
n (p
revi
ous
year
36
.56
mill
ion)
.(g
)N
et T
angi
ble
Ass
ets
incl
ude
39,4
89.1
1 m
illio
nsha
re o
f jo
intly
con
trol
led
enti
ties
(Pre
viou
s ye
ar
30,
606.
58 m
illio
n).
(h)
Dep
reci
atio
n fo
r the
yea
r inc
lude
s 1
9.32
mill
ion
pert
aini
ng to
p
rior p
erio
d (P
revi
ous
year
(-
)85.
79 m
illio
n)
`
``
``
` `
``
``
``
``
(` in
millio
n)
(i)
Pla
nt &
Equ
ipm
ent i
nclu
des
Jett
y &
Tre
stle
hav
ing
Gro
ss b
lock
of
12,8
73.8
0 m
illio
n (P
revi
ous
year
8
,368
.90
mill
ion)
(D
ahej
) an
d 38
43.1
0 m
illio
n (P
revi
ous
year
382
5.20
mill
ion)
(K
ochi
) in
the
book
s of
Joi
nt V
entu
re C
ompa
ny, P
etro
net L
NG
Ltd
, ou
t of
whi
ch G
roup
sha
re i
s
1,60
9.23
mill
ion
(Pre
viou
s ye
ar
104
6.11
m
illio
n)(
Dah
ej)
and
480.
39 m
illio
n (P
revi
ous
year
4
78.1
5 m
illio
n)(
Koc
hi).
As
per
the
agre
emen
t, ow
ners
hip
of J
etty
& T
rest
le (
Dah
ej)
wou
ld b
e tr
ansf
erre
d to
the
Guj
arat
M
arit
ime
Boa
rd in
the
yea
r 20
35 a
nd o
wne
rshi
p of
Jet
ty &
Tre
stle
(K
ochi
) w
ould
be
tran
sfer
red
to th
e C
ochi
n P
ort T
rust
in th
e ye
ar 2
039.
(j)
Bui
ldin
g in
clud
es c
ost o
f und
ivid
ed in
tere
st in
land
.(k
)V
ehic
les
incl
ude
Sur
vey
Shi
ps, C
rew
Boa
ts a
nd H
elic
opte
rs. V
ehic
les
also
incl
ude
cost
of
20
(Pre
viou
s ye
ar 1
0) I
mm
edia
te s
uppo
rt v
esse
ls (
ISV
) am
ount
ing
to
2,59
5.16
m
illio
n (P
revi
ous
year
1,
079.
50 m
illio
n) h
ande
d ov
er fo
r ope
ratio
n by
Indi
an N
avy
for
se
curi
ty o
f the
off
shor
e in
stal
latio
n.(l
) In
res
pect
of p
aren
t com
pany
, ON
GC
, in
case
of c
erta
in i
tem
s of
pla
nt a
nd e
quip
men
t w
here
use
ful l
ife r
angi
ng f
rom
3 to
25
year
s ha
s be
en c
onsi
dere
d ba
sed
on te
chni
cal
asse
ssm
ent b
y th
e m
anag
emen
t w
hich
is lo
wer
than
th
e us
eful
life
pre
scrib
ed u
nder
sc
hedu
le II
to th
e C
ompa
nies
Act
201
3(re
fer
Acc
ount
ing
polic
y no
. 2.2
.n.1
.1 a
nd n
ote
no. 3
.4).
``
``
``
``
` `

Consolidated Financial Statement
307
(` in million)
14.2 The accounting policies for treatment of depreciation of fixed assets by the subsidiaries/Joint Venture/Associate Entities are dif ferent from the accounting policies of the Group. Such dif ferent policy of depreciation of Fixed Assets have been adopted in respect of the following:-
14.3 Title to Fixed Assets under Production Sharing Agreements
OVL, its Subsidiaries and Joint Venture Companies,in consortium with other partners (Consortium) carries on its business in respect of exploration, development and production of hydrocarbons under agreements with the host governments. Several of these agreements, governing OVL’s activities in the fields / projects, provide that the title to the fixed assets and other ancillar y installations shall pass to host Government or its nominated entities either upon acquisition/first use of such assets or upon 100% recovery of such costs through allocation of "Cost Oil" and "Cost Gas" or upon relinquishment of the relevant contract areas or termination of the relevant agreement. However, as per the terms of the agreements, the Consortium and/or Operator has the custody of all such assets and is entitled to use, free of charge all such assets for Petroleum Operations throughout the term of the respective agreements. The Consortium also has the custody and maintenance of such assets and bears all risks of accidental loss and damage and all costs necessary to maintain such assets and to replace or repair such damage or loss. Under the circumstances, such assets are kept in the records
of the said company during the currency of the respective agreements.
14.4 Apart from the above assets, the joint venture company, Petronet MHB Limited (PMHBL) has taken lease land from HPCL for its stations at Mangalore, Hassan and Devangonthi on a long term lease basis for the period of 30 years on annual rental basis. Also, there are six pieces of land acquired by PMHBL through KIADB for sectionalized valve stations for which absolute sale deeds are yet to be registered in the name of the PMHBL and the amount paid `0.28 Million (Previous year `0.28 million) is shown as capital advance under note 21.
14.5 The Subsidiary of OVL “OAAL” and joint venture company of OVL “OMEL” provide depreciation on fixed assets using the straight line method. The amount involved is `1,460.63 Million (Previous year `1,132.80 million) shown as depreciation under Note 33.
14.6 Due to dif ferent nature of their operation, PHL, an Associate of the Company, follows dif ferent accounting policies in respect to depreciation. Depreciation is charged by PHL on straight line method whereas the company provides Writ ten Down Value Method of depreciation. It is not
MRPL 5,225.19 7044.75 2,10,362.75 59,929.42
Petronet LNG Ltd. 390.12 381.97 8,665.01 7,826.58
Petronet MHB Ltd. 41.95 144.37 276.1 306.25
Mangalore SEZ Ltd.* 34.28 0.54 2,057.41 927.61
OMPL (refer Note no. 3.1) - 30.78 - 1,230.69
OPaL 388.78 202.77 4,668.77 5,008.17
OTPC** 534.16 206.57 20,231.87 11,578.79
Total 6,614.48 8,011.75 2,46,261.91 86,807.51
*Depreciation on certain Assets whose useful life has been taken on the basis of the technical assessments (refer Accounting policy no. 2.2.n.1.1):-
** Depreciation has been provided on the basis of CERC Tarif f Regulations 2014, as notified by Central Electricity Regulatory Commission.
Writ ten Down
Value Methodat the ratesspecified inSchedule
II.
StraightLine
Method
Name of Subsidiaries / JV/Associate
Accounting Policies
2014-15 2013-14 2013-14Company Subsidiaries/JV 2014-15
Proportionate Depreciation Proportionate Net block
Asset Useful life used for depreciationElectrical Installations & Equipment 15Hydrolic works, pipelines & sluices 30

Annual Report 2014-15
Consolidated Financial Statement
308
Particulars
15 Producing Properties
As at st 31 March, 2015
As at st 31 March, 2014
(` in million)
Gross Cost
Opening Balance 1,823,490.87 1,486,412.69
Expenditure during year 13,697.42 56,865.77
Transfer from Exploratory Wells-in-Progress 11,571.40 12,159.44
Transfer from Development Wells-in-Progress 87,305.45 124,450.52
Depreciation on Facilities 33,475.86 64,756.79
Increase/(Decrease) in estimated Abandonment costs 20,765.91 68,078.85
Foreign Currency Translation Adjustments (Note 15.2) (39,045.50 ) 10,825.86
Other Adjustments (Note 15.5) (6,031.50) 1,945,229.91 (59.05) 1,823,490.87
Less: Depletion & Impairment
Depletion
Opening Balance 906,970.01 777,720.44
Depletion for the year 142,587.83 121,130.77
Foreign Currency Translation Adjustments (15,659.48) 8,118.80
Other Adjustments (refer Note no. 15.5 ) (5,456.49) 1,028,441.87 - 906,970.01
Impairment
Opening Balance 3,839.39 3,296.81
Impairment provided for the period ( Note 43.5.3) 3,089.37 658.92
Write back of Impairment (190.05) 6,738.71 (116.34) 3,839.39
910,049.33 912,681.47
NET PRODUCING PROPERTIES
practicable for the Company to make adjustment for the purposes of applying the equity method.
14.7 During the year, the Joint Venture Company OPaL, has provided depreciation on mobile phones considering estimated useful life of 3 years & 4 months. The group’s share of gross value of Mobile Phones is `1.06Million (Previous year` 0.49 million) and net book value of `0.73 Million (Previous year ` 0.34 million) (refer Accounting policy no. 2.2.n.1.1).
14.8 During the year The Joint Venture Company NETC has charged depreciation on the assets at rates and methodology provided under CERC Tarif f Regulations 2014 except on mobiles and sof tware at the rate 33.33%. Self-insurance reserve @0.1% p.a. on Gross Block of Fixed Assets (except assets covered under mega insurance policy) is created as at the end of the year by appropriating current year profit towards future losses which may arise from un-insured risks and the same is shown as ''self-insurance reserve'' under 'Reserve & Surplus' (refer note no. 5.9).
14.9 During the year, subsidiary company MRPL, has depreciated certain Assets whose life is other than
life specified in Schedule II of the Companies Act, 2013, based on the company policy. This resulted in lower deprecation for the period by 7.94 Million with consequential impact on Fixed Assets (refer Accounting policy no. 2.2.n.1.1).
Type of Assets Life Considered
Plant and Equipment
(Employee scheme Computer) 7 Years
Furniture and Fix tures
(Employee Scheme Furniture) 7 Years
Vehicles
(Employee Scheme Vehicles) 5 Years
14.10 In respect of Subsidiary company, OVL, as per set tlement agreement dated 22nd December 2010, 30% ownership held by GNPOC (ONGC Videsh Share 11.25%) partners in Sudan Crude Oil Transpor tation System (SCOTS) has been transferred to Government of Sudan (GoS) on 1st September 2014, and GoS has become 100% owner of SCOTS from the date. The net book value of fixed assets (ONGC Videsh Share) amounting to USD 1.61 million has been charged of f during the year.

Consolidated Financial Statement
309
15.1 Above includes nil share of jointly controlled entities (previous year nil)
15.2 In respect of subsidiary OVL, above includes Foreign currency translation dif ferences in respect of Sakhlian-1, in pursuance to para 46A of Accounting standard 11 (change in foreign exchange rate) as follows:-
(` in million)
Particulars Year endedst 31 March, 2015
Year endedst 31 March, 2014
Exchange loss arising on reporting of long-term foreign currency
monetary items relating to depreciable assets:
Amount remaining to be amortized at the beginning of the year 3,066.13 1,120.37
Exchange loss/(gain) arising during the year 1,054.42 2,231.12
Less: Depletion charged to statement of profit and loss for the year 359.44 285.36
Amount remaining to be amortized at the end of the year 3,761.11 3,066.13
15.3 During the previous year 2013-14, PMT JV had downgraded reserves for the Mid and South Tapti fields due to geological surprises. As a result, the production profile is envisaged only up to 2015-16 and the sale realization (net of operating expenses and statutory levies) is being transferred to Site Restoration Fund pursuant to the Production Sharing Contract. Under these circumstances, the field has been fully depleted and depletion aggregating to `184.69 million (Previous year`9,090.44 million) has been charged to the Statement of Profit and Loss. Similarly, as at March 31, 2015, the provision for impairment of `263.62 mil l ion (Previous year `441.87 mil l ion) representing the net asset value and Capital Work in Progress in Tapti field has been carried in the financial statements.
15.4 In respect of Ratna R series field, a producing field of the company, MOPNG had during 1995-96, issued an award of the contract for development of
the field to a consortium of Essar Oil Limited and Premier Oil limited consequent to which the company stopped production. Pending the execution of the Production Sharing Contract, the company continues to include `2,313.96 million in gross producing property (including provision for abandonment of `891.74 million.) The said field has been fully impaired and the net carrying amount as at March 31, 2015 is Nil.
15.5 Other adjustment includes an amount of 4,196.00 million which Government of India (GoI) vide let ter dated 1st January, 2015, has reimbursed as compensation for past costs incurred by ONGC in the discovered Panna, Mukta, Tapti and Ravva fields awarded to Joint Ventures/Private Companies. Accordingly an amount of `257.17 million has been adjusted against the Net Carrying Amount of assets (Gross cost less accumulated depletion) of those fields and balance amount of `3,938.83 million has been accounted for as other income during the year

Annual Report 2014-15
Consolidated Financial Statement
310
16.
Inta
ng
ible
Asse
ts
Com
pute
r S
oftw
are
6,9
02.3
8 8
89.0
4 9
4.87
7
,696
.55
6,2
61.9
7 4
73.9
4 5
3.73
6
,682
.18
22.
27
0.0
3 -
22.
30
992
.07
618
.14
Cop
yrig
hts
& P
aten
ts 5
6.50
-
-
5
6.50
5
6.50
-
-
5
6.50
-
-
-
-
Go
odw
ill (
Not
e 16
.3)
20.
13
-
-
20.
13
14.
08 2
.01
- 1
6.09
-
-
4
.04
6.05
Rig
ht o
f w
ay
146.
54
64.
48
11.
85
199
.17
16.
37
9.7
0 0
.04
26.
03
-
-
173
.14
130
.17
Tota
l 7
,125
.55
953
.52
106
.72
7,9
72.3
5 6
,348
.92
485
.65
53.
77
6,7
80.8
0 2
2.27
0.0
3 -
-
22.
30
1,1
69.2
5 7
54.3
6
Pre
viou
s Ye
ar 6
,957
.81
198
.58
18.
94
7,1
25.5
5 5
,894
.29
526
.30
71.
67
6,3
48.9
2 2
2.27
-
-
-
2
2.27
7
54.3
6
The
abov
e in
clud
es th
e 6
83.0
7 1
56.4
6 4
23.7
8 4
15.7
5 4
02.3
6 3
8.12
3
17.1
7 1
23.3
1 -
-
-
-
-
2
92.4
4 2
80.7
1
Com
pany
's s
hare
in J
oint
Ven
ture
Ass
ets
Pre
viou
s Ye
ar 5
08.9
6 18
1.64
7.5
3 68
3.07
2
99.6
3 1
51.4
4 4
8.71
4
02.3
6 -
-
280
.71
Des
crip
tion
stA
t 1
Apr
il, 2
014
stA
t 1
Apr
il, 2
014
stA
t 1
Apr
il, 2
014
For
the
year
For
the
year
Wri
tten
back
Re
clas
sific
atio
nA
ddit
ions
Gro
ss B
lock
Acc
umul
ated
Dep
recl
atio
nA
ccum
ulat
ed I
mpa
irm
ent
Net
Blo
ck
Del
etio
n/A
djus
tmen
tD
elet
ion/
Adj
ustm
ent
stA
t 31
M
arch
, 201
5
stA
t 31
M
arch
, 201
5
stA
t 31
M
arch
, 201
5
stA
t 31
M
arch
, 201
5
stA
t 31
M
arch
, 201
4
16.1
Abo
ve in
clud
es:-
16.2
The
Ass
ocia
te, P
awan
Han
s Lt
d, is
cha
rgin
g co
st o
f so
ftw
are
purc
hase
d/de
velo
ped
(a)
Add
itio
n to
Inta
ngib
le A
sset
are
net
of `3
.31
mill
ion
on a
ccou
nt o
f fo
reig
n cu
rren
cy
in-h
ouse
up
to
0.50
mill
ion
each
to s
tate
men
t of p
rofi
t & lo
ss in
the
year
of p
urch
ase.
tran
slat
ion
adju
stm
ent d
urin
g th
e ye
ar(p
revi
ous
year
(-
) 24.
28 m
illio
n)16
.3R
epre
sent
s co
nsid
erat
ion
for p
urch
ase
of b
usin
ess
(Nit
roge
n P
lant
) in
exce
ss o
f bo
ok
(b)
Net
In
tang
ible
as
set
incl
ude
26
0.2
9
mill
ion
shar
es
of
join
tly
cont
rolle
d va
lue
of n
et a
sset
s ac
quir
ed b
y su
bsid
iary
MR
PL.
enti
ties(
prev
ious
yea
r
91.2
1mill
ion)
.
``
``
(` in
millio
n)

Consolidated Financial Statement
311
17 Capital Works in Progress
A Tangible Assets In Progress
Buildings 8,097.47 6,934.03
Plant and Equipment 253,670.46 368,702.96
Others 3,532.52 5,116.34
Capital Stores (including in transit) 3,953.76 7,686.30
Less: Provision for Non-Moving Items 495.90 268,758.31 77.51 388,362.12
B Less: Impairment
Opening Balance 2,401.23 2,331.14
Provided for the year 164.52 686.78
Write back of Impairment (354.09) (594.56)
Other adjustments (11.83) 2,199.83 (22.13) 2,401.23
C Intangible Assets In Progress
Acquisition Costs-E&P Asset (Note no. 17.1.g) 151,673.90 149,005.00
Intangible Asset under Development 3,882.34 155,556.24 3,303.97 152,308.97
NET CAPITAL WORKS-IN-PROGRESS (A-B+C) 422,114.72 538,269.86
As at st31 March, 2015
As at st31 March, 2014
17.1 Above includes:-(a) Plant and Equipment includes an amount of
` 8,448.52 million (Previous Year 8,436.64 million) in respect of Capital Works in Progress (CWIP) for C2-C3 plant (including C3 C4 blending and recycling facilities) which is mechanically complete and will be capitalized on completion of test run.
(b) CWIP of `95,280.44 million share of jointly controlled entities (Previous year `106,279.69 million).
(c) In respect of subsidiary company, MRPL, an amount of `1,680.25 million (previous year`1,710.35 million) has been capitalized under CWIP on account of exchange dif ference arising on reporting of long term foreign currency monetary items pursuant to Notification no GSR (914)E dated 29th December 2011 issued by MCA, from the financial year ending 31st March 2012, to adjust exchange dif ference arising on reporting of long term foreign currency monetary items, in so far as , they relate to the acquisition of depreciable assets, against the cost of such assets and depreciate the said adjustment, over the balance life of the assets.
(d) In respect of Joint Venture Company, OPaL, an amount of (-) `118.83 million (Previous year `10.28 million) has been capitalized under CWIP on account of exchange dif ference arising on reporting of long term foreign currency monetary items instead of charging to Statement of profit & loss.
(e) In respect of subsidiary company, OMPL, an amount of 267.19 million (Previous year 825.05
million) has been capitalized under CWIP on account of exchange dif ference arising on reporting of long term foreign currency monetary items, pursuant to notification no. GSR(914)E dated 29th December, 2011 issued by Ministry of Corporate Af fairs, Govt. of India.
(f) In respect of Joint Venture Company, OTPC, an amount of `39.51 million (Previous year`73.69 million) has been capitalized under CWIP on account of exchange dif ference arising on reporting of long term foreign currency monetary items instead of charging to Statement of profit & loss, pursuant to notification no. GSR(914) E dated 29th December, 2011 issued by Ministry of Corporate Af fairs, Govt. of India.
(g) Acquisition cost relates to the cost for acquiring property or mineral right of proved or unproved oil and gas properties, by OVL which are currently under exploration/Development stage. Such costs will be transferred to producing property on commercial production from the project or writ ten of f in case of relinquishment of project. Accordingly, acquisition cost of `2,668.90 million (Previous year `137,058.94 million) has been capitalized during the year under CWIP.
(h) In respect of Joint Venture Company, MSEZ, has an obligation vide Government order no. RD 309REH dated 20.06.2007 to provide various compensation to the Project Displaced Families (PDFs) including one job per family and site for construction. The PDFs can opt for cash in lieu of site and cash in lieu of job. The estimated provision in respect of various compensations is included in
(` in million)(` in million)
Particulars

Annual Report 2014-15
Consolidated Financial Statement
312
capital work in progress of `34.47 million (previous year `59.50 million) as group share. Capital work in progress includes of `205.43 million (previous year `168.34 million) as group share on account of mandatory and unavoidable expenditure incurred on creation of infrastructure
at R&R colony, pursuant to Government of Karnataka Order no. KE309REH, 2006, Bangalore dated 20.06.2007. The expenditure will be transferred to the cost of land in the year in which the obligation is completed.
18 Exploratory/Development Wells In Progress
A) EXPLORATORY WELLS-IN-PROGRESS
Gross Cost
Opening Balance 164,509.06 99,601.32
Acqusition Cost - -
Expenditure during the year 119,971.45 131,660.13
Less : Sale proceeds of Oil and Gas (Net of levies) 547.85 119,423.60 470.54 131,189.59
Depreciation during the year 3,284.46 2,506.44
287,217.12 233,297.35
Less :
Transfer to Producing Properties 11,571.41 12,159.44
Wells writ ten of f during the year 90,738.53 67,473.61
Foreign Currency Translation Adjustments (588.47) (10,828.10)
Other adjustments 2,704.66 104,426.13 (16.66) 68,788.29
182,790.99 164,509.06
Less : Provision/Impairment(Note 18.1 (a), (b) & (c )
Opening Balance 27,935.56 20,579.92
Provision for year 1,186.10 7,355.64
Write back during year (1,203.23) 27,918.43 - 27,935.56
EXPLORATORY WELLS-IN-PROGRESS (A) 154,872.56 136,573.50
B) DEVELOPMENT WELLS-IN-PROGRESS
Opening Balance 46,189.74 57,845.32
Expenditure during the year 98,411.72 109,654.08
Depreciation during the year 3,297.72 1,871.16
Foreign Currency Translation Adjustments (2,239.75) 1,269.70
Less: Transfer to Producing Properties 87,305.45 12,164.24 124,450.52 (11,655.58)
58,353.98 46,189.74
Less: Impairment
Opening Balance 696.26 465.79
Provision for the year 563.03 264.47
Write back during the year - 1,259.29 (34.00) 696.26
DEVELOPMENT WELLS-IN-PROGRESS (B) 57,094.69 45,493.48
EXPLORATORY/DEVELOPMENTWELLS-IN-PROGRESS (A+B) 211,967.25 182,066.98
As at st31 March, 2015
As at st31 March, 2014
(` in million)
Particulars

Consolidated Financial Statement
313
31.03.2015 31.03.2014
Gross Goodwill 269,075.41 244,982.36
Less : Accumulated Amortization 48,142.86 41,903.77
Less : Provision for Impairment 19,533.69 19,533.69
TOTAL 201,398.86 183,544.90
(` in million)
19.1 Above includes addit ional go odwil l on consolidation of `6,124.36 million resulting on
OMPL becoming subsidiary with ef fect from 28th Feb, 2015. (refer Note 3.1).
19. Goodwill on Consolidation:
Particulars
18.1 Above includes:-
(a) During the Financial year 2004-05, the company had acquired 90% Par ticipating Interest in Exploration Block KG-DWN-98/2 from M/s Cairn Energy India Ltd. for a lump sum consideration of`3,711.22 million which, together with subsequent exploratory drilling costs of wells had been capitalised under exploratory wells in progress. During the financial year 2012-13, the company had acquired the remaining 10% participating interest in the block from M/s Cairn Energy India Ltd. on actual past cost basis for a consideration of `2,124.44 million. Initial in-place reserves have been established in this block and adhering to original PSC time lines, a Declaration of Commerciality (DoC) with a conceptual cluster development plan was submitted on 21.12.2009 for Southern Discovery Area and on 15.07.2010 for Northern Discovery Area. Thereaf ter, in the revised DoC submitted in December, 2013, Cluster wise development of the Block had been envisaged by division of entire development area into three clusters. The DoC in respect of Cluster II has been reviewed by the Management Committee (MC) of the block on 25.09.2014 and preparation of Field Development Plan (FDP) in progress. The review of DOC in respect of Cluster I and Cluster III by the MC is pending as on 31st March, 2015.
The exploration period of this block had been restructured by Government upto 29.12.2013 in accordance with the Rig Holiday Policy and further extended to 25.1.2014. Under the New Policy guidelines in this regard, the Government has permit ted the contractor to undertake appraisal drilling, seismic API and related activities till submission of FDP which is currently underway
and drilling of two appraisal wells is in progress.
Pending approval of FDP by the MC in respect of Cluster II and review of DoC by the MC in respect of Cluster I and III, as a matter of abundant caution, the company has retained the provision of `17,216.18 million (Previous Year of `17,210.82 million) towards acquisition costs and cost of exploratory wells.
(b) In respect of Farsi Block, Iran, the Subsidiary company, OVL in consortium with other partners entered into an Exploration Service Contract (ESC) with National Iranian Oil Company (NIOC) on25th December 2002. Af ter exploratory drilling, FB area of the block proved to be a gas discovery and was later rechristened as Farzad-B. NIOC announced the Date of Commerciality for Farzad-B as 18th August 2008. However, the Development Service Contract is pending. Provision has been made in respect of the OVL’s investment in exploration in the Farsi Block amounting to`1,511.17 million till 31.03.2015 (previous year `1,502.56 million).
(c) The Subsidiary company OVL, has 60% PI in Block XXIV, Syria where the development is currently suspended. In view of deteriorating law and order situation in Syria, operations of the project are temporarily suspended since 29th April 2012. In view of the same, provision has been made in respect of cost of development wells in progress amounting to `83.74 million (Previous year:`83.74 Million) and successful exploratory wells amounting to `1,914.29 million (Previous year:`1,914.29 Million) in respect of the project.
18.2 Above Exploratory well in progress/Development well in progress includes nil share of jointly controlled entities (previous year nil).

Annual Report 2014-15
Consolidated Financial Statement
314
20 Non-Current Investment
A TRADE INVESTMENTS
Investment in Equity Instruments
(i) Investment in Associate
(a) Pawan Hans Limited- (Unquoted) 120,350 10,000.00 2,454.69 2,189.39
Extent of holding 49% (previous year 49%)
(Net of Capital reserve of 285.32 million)
(Note 20.3)
(ii) Investment in Others
(a) Indian Oil Corporation Limited- (Quoted) 334,303,814 10.00 40,427.97 40,427.97
(b) GAIL (India) Limited (Quoted) 61,259,323 10.00 2,451.06 2,451.06
(c) Oil Spill Response Ltd. (Unquoted) 100 (Note 20.1) 0.01 0.01
(d) Adani Petronet (Dahej) Port Pvt. Ltd.
(Unquoted) (Note 20.5) 11,250,000 10.00 112.50 112.50
(e) Bharuch Dahej Railway Company 5,000,000 10.00 50.00 50.00
Limited (BDRCL)-(Unquoted)
B NON-TRADE INVESTMENTS
Investment in Government or Trust Securities
(Unquoted)
(i) 8.40% Oil Co. GOI Spl. Bonds 2025 197,370 10,000.00 1,973.70 1,973.70
(ii) Other Central Govt Securities - -
Total Non-current Investment 47,469.93 47,204.63
Total Quoted Investments 42,879.03 42,879.03
Total Unquoted Investments 4,590.90 4,325.60
TOTAL 47,469.93 47,204.63
Total Market value of Quoted Investments 146,997.47 117,193.24
`
No. of Shares/Bonds/Units
Face Valueper Share/Bond/Unit
(in `)
As atst31 March,
2015
As atst31 March,
2014
(` in million)
20.1 Shares of Oil Spill response limited valued at GBP one each at the time of issuance. Total value in INR at the time of issuance of shares was 6,885/-
20.2 Above includes:-
(a) Figures in parenthesis relate to previous year.
(b) Long term investment includes 303.48 millionshare of jointly controlled entities (previousyear 299.99 million).
(c) Long-term investments are valued at cost. Provision is made for any diminution, other
than temporary, in the value of such investments
20.3 In the financial year 2010-11, Company had acquired an additional number of 95,850 equity shares of 10,000/- each in its Associate Pawan Hans Ltd. (PHL) for 958.50 million resulting in increase in the holding to 49.00% from 21.54%. The above acquisition has resulted in Capital Reserve of 285.32 million, computed in accordance with
Accounting Standard (AS) 23 on ‘Accounting for Investments in Associates in Consolidated Financial Statements’.
`
`
``
`
20.4 In respect of PHL (Associate), the Audited Accounts for the Financial year 2014-15, have not been received. For the purpose of consolidation of PHL, the audited Annual Accounts for the year 2013-14 and unaudited accounts for the year 2014-15 have been considered. The dif ference in share of profit amounting to 90.40 million between audited Profit Af ter Tax (PAT) and unaudited PAT for the year2013-14 has been considered as share of profit in Associate. The share of profit (unaudited) for the year 2014-15 amounting to 212.70 million has also been considered as share of profit in Associate. During the year, dividend of 37.80million has been received from Associate and same has been adjusted against carrying value of investment.
20.5 The joint venture company PLL has investment in its joint venture company “Adani Petronet (Dahej) Port Pvt. Ltd. This investment is under lock in for a period of 5 years from the date of commercial operation (i.e. 01.09.2010) of the investee as per the Dahej LNG Port Terminal Concession Agreement dated 20th December, 2005 with Gujarat Maritime Board.
`
`
`
Particulars

Consolidated Financial Statement
315
21 Long - Term Loans And Advances
Secured and Considered good
Loans & Advances to Associates 33.20 367.84
Loans and Advances to Employees 7,739.54 7,612.28
Capital Advances 658.40 788.65
Loans and advances to Others 138.59 8,569.73 119.17 8,887.94
Unsecured
(Considered Good unless otherwise stated)
Capital Advances 12,913.53 18,544.04
Public Sector Undertakings
Considered Good - -
Considered Doubt ful 240.50 240.50
Less : Provision for doubt ful Advances 240.50 - 240.50 -
Advances against Equity pending allotment
(Note 41.3.1) 6,017.62 9,953.78
Loans and Advances to Employees
Considered Good 756.49 739.17
Considered Doubt ful 7.48 1.73
Less : Provision for Doubt ful Loan/Advances 7.48 756.49 1.73 739.17
Adv Recoverable in Cash or in kind
Considered Good ( Note 21.3) 7,119.70 7,488.78
Considered Doubt ful (Note 21.2 ) 14,931.69 13,141.40
Less : Provision for Doubt ful Claims/Advances 14,931.69 7,119.70 13,141.40 7,488.78
Loans & Advances to Others
Considered Good 1,512.47 960.52
Considered Doubt ful (Note 21. 4) 2,506.22 1,690.70
Less : Provision for Doubt ful Loan/Advances 2,506.22 1,512.47 1,690.70 960.52
Cash Call Receivable from Jv partners
Considered Good 339.52 340.27
Considered Doubt ful 6,451.35 6,245.07
Less : Provision for Doubt ful cash call 6,451.35 339.52 6,245.07 340.27
MAT Credit Entitlement 402.58 2,909.32
Advance payment of Tax 258,806.53 329,690.97
Less : Provision for Taxation 193,700.08 65,106.45 281,031.74 48,659.23
Deposits
With Customs/Port Trusts etc. 54.04 37.89
Security Deposits 125.72 157.81
Other Deposit
Considered Good 4,274.13 3,730.94
Considered Doubt ful 1,010.69 629.88
Less: Provision for Doubt ful Deposits 1,010.69 4,453.89 629.88 3,926.64
TOTAL 107,191.98 102,409.69
As at st31 March, 2015
As at st31 March, 2014
(` in million)
Particulars

Annual Report 2014-15
Consolidated Financial Statement
316
21.1 Above long term loan & advances includes` 5,879.86 million share of jointly controlled entities (Previous Year 10,099.72 million).
21.2 In Ravva Joint Venture, the demand towards additional profit petroleum raised by Government of India (GoI), due to dif ferences in interpretation of the provisions of the Production Sharing Contract (PSC) in respect of computation of Post Tax Rate of Return (PTRR), based on the decision of the Malaysian High Court set ting aside an earlier arbitral tribunal award in favour of operator, was disputed by the operator M/s Cairn India Ltd. The company is not a party to the dispute but has agreed to abide by the decision applicable to the operator. The company had made a provision towards the claim made by the GoI in earlier years and the amount of provision outstanding as on 31th March, 2015 is `10,513.79 million (equivalent to USD 167.84 million) af ter adjustments for interest and exchange rate fluctuations. The GoI had recovered the above amount [including interest thereon USD 54.88 million (`3,437.68 million )] from the company in earlier years which has been carried as recoverable under Long Term Loans and advances in the Balance Sheet as at 31st March, 2015.
In subsequent legal proceedings, the Appellate Authority of the Honourable Malaysian High Court of Kuala Lumpur had set aside the decision of the Malaysian High Court and the earlier decision of arbitral tribunal in favour of operator was restored, against which the GoI has preferred an appeal before the Federal Court of Malaysia. The Federal Court of Malaysia, vide its order dated 11th October, 2011, has dismissed the said appeal of the GoI.
The company has taken up the matter regarding refund of the recoveries made in view of the favorable judgment of the Federal Court of Malaysia with MoPandNG. However, according to a communication dated 13th January 2012 received, MoP&NG expressed the view that ONGC’s proposal would be examined when the issue of ONGC carry under Ravva PSC is decided in its entirety by the Government along with other partners.
In view of the perceived uncertainties in obtaining the refund at this stage, the provision made in the books as above has been retained and netted of f against the amount recoverable as above in the financial statements for the year ending 31stMarch, 2015."
21.3 During the financial year 2010-11, the Oil Marketing Companies, nominees of the GoI recovered USD 32.07 million (`2,009.02 million) ONGC’s share as per directives of GoI in respect of Jointly Controlled Assets-Panna Mukta and Tapti. The recovery is towards certain observations raised by auditors appointed by the Director General of Hydrocarbons (DGH) under Production Sharing Contract (PSC) for the period 2002-03 to 2005-06 in respect of cost and profit petroleum share payable to GoI. BGEPIL along with RIL (“Claimants”) have served a notice of arbitration on the GoI in respect of dispute, dif ferences and claims arisen in connection with the term of Panna, Mukta and Tapti PSC’s. Since the company is not a party to the arbitration proceedings, it had requested MoP&NG that in case of an arbitral award the same be made applicable to ONGC also, as a constituent of contractor for both the PSC’s. Subsequently, vide let ter dated July 4, 2011 MoPNG has advised ONGC not to participate in the arbitration initiated by RIL and BGEPIL under Panna Mukta and Tapti PSC’s. MoP&NG has also stated that in case of an arbitral award, the same will be applicable to ONGC also as a constituent of the contractor for both the PSC's. Pending final arbitral award, the same has been shown as Receivable from GoI under ‘Advance Recoverable in Cash or Kind or Value to be Received’ under Long Term Loans and Advances. (Figures in INR is reinstated).
21.4 The Company has participating interest (PI) in the exploration Blocks Satpayev Area Kazakhstan, SS-04 Bangladesh, SS-09 Bangladesh, EP-3 Myanmar and B-2 Myanmar. As per the carry agreements, ONGC V idesh is financing expenditure in these exploration blocks during the exploratory period (carry loan). The amount of carry loan will be refunded in the event of commercial discovery and production from the projects. The share of expenditure financed by ONGC Videsh in these Blocks has been accounted for as loan to JV partners. Provision has been made towards the amount of carry loan of`2,502.82 Million as on 31st March, 2015 (Previous year: 1,687.30 Million) in view of the blocks being under exploration as there is no certainty of commercial discovery. Accordingly, provision has been made towards the amount of carry loan of `2,502.82 Million as on 31st March, 2015 (Previous year 1,687.30 Million) to KMG in view of the block being under exploration as there is no certainty of commercial discovery. (Refer Note 35.2)

Consolidated Financial Statement
317
22 Other Non - Current Assets
A Secured and Considered good
Interest accrued on loan & advances
- Employees 3,180.78 3,180.78 3,029.45 3,029.45
B Unsecured, Considered Good unless otherwise stated
(i) Trade Receivables
- Considered Good 53,734.46 38,287.59
- Considered doubt ful 18,630.08 6,476.81
Less : Provision for doubt ful receivables 18,630.08 53,734.46 6,476.81 38,287.59
(ii) Other Receivables
- Considered Good (Note no. 22.2) 14,605.59 12,029.85
- Considered Doubt ful 5,155.62 4,932.46
Less : Provision for doubt ful receivables 5,155.62 14,605.59 4,932.46 12,029.85
(iii) Interest Accrued
- On Deposits 22.76 26.40
- On Loans & Advances
- Considered Good 118.73 100.32
- Considered doubt ful 22.87 41.89
Less : Provision for interest Accrued 22.87 141.49 41.89 126.72
(iv) Unamortised Expenditure
- Dry Docking Charges 4,426.69 6,621.33
- Mobilisation charges 1,159.27 5,585.96 764.21 7,385.54
TOTAL 77,248.28 60,859.15
As at st31 March, 2015
As at st31 March, 2014
(` in million)
23 Current Investments
Other InvestmentsInvestments in Govt. Securities (unquoted) - 62.35
Other Investments (unquoted) 21.46 192.02
TOTAL 21.46 254.37
Total Quoted Investments - -
Total Unquoted Investments 21.46 254.37
As at st31 March, 2015
As at st31 March, 2014
(` in million)
22.1 Above other non-current Asset includes 252.08 million share of jointly controlled entities (previous year 29.92
million)
22.2 Above includes in respect of subsidiary company, MRPL, an amount of 2,579.25 million (previous year 2,661.58
million) in respect of Income tax paid under dispute.
` `
`
23.1 Above Current investment includes `21.46 million share of jointly controlled entities (previous year `254.37 million).
Particulars
Particulars

Annual Report 2014-15
Consolidated Financial Statement
318
(Unsecured, Considered Good unless otherwise stated)
Trade Receivables - Outstanding for a period
exceeding six months :
- Considered Good 19,059.03 10,057.04
- Considered Doubt ful 914.28 759.35
Less Provision for Doubt ful debts 914.28 19,059.03 759.35 10,057.04
Other:
- Considered Good 168,911.06 150,232.92
- Considered Doubt ful 242.66 126.56
Less Provision for Doubt ful debts 242.66 168,911.06 126.56 150,232.92
TOTAL 187,970.09 160,289.96
As at st31 March, 2015
As at st31 March, 2014
(` in million)
Raw Material 8,183.09 26,856.29
Raw Material in transit 4,691.13 12,874.22 13,515.24 40,371.53
Stock in Process 4,046.02 4,661.66
Finished Goods (Note 24.2) 27,943.34 42,575.23
Less: Provision for Stock loss 5.91 27,937.43 5.91 42,569.32
Traded Goods 1.48 0.61
Stores and spare parts
- on hand 65,119.42 62,498.54
- in transit 3,268.63 5,276.40
68,388.05 67,774.94
Less: Provision for non-moving 7,344.49 61,043.56 7,490.28 60,284.66
Unserviceable Items 159.52 126.81
TOTAL 106,062.23 148,014.59
As at st31 March, 2015
As at st31 March, 2014
(` in million)24 Inventories (Valuation as per policy no. 2.2.1)
25 Trade Receivables
24.1 Above inventories includes 1,222.12 million the stock of crude oil till such delivery point is not share of jointly controlled entities (Previous year recognized.`1,930.74 million).
24.4 Finished goods of subsidiary company MRPL, 24.2 This includes an amount of 7.68 million (previous includes Sulphur amounting to 49.45 million
year 3.66 million) in respect of Carbon Credits. (previous year 19.99 million) which is valued lower of cost or net realizable value.
24.3 In respect of joint venture arrangements ofOVL, where the property in crude oil produced 24.5 The subsidiary company, MRPL does not quantify does not pass on up-to a specific delivery point, or value the scrap and unserviceable items.
`
` `` `
25.1 Above trade receivable includes 2,841.80 million share of jointly controlled entities (Previous year 3,942.17 million).
Particulars
Particulars

Consolidated Financial Statement
319
(Secured, Considered Good)Loan & Advances to Associate 334.64 350.45 Loans and Advances to Employees 2,077.32 2,411.96 2,085.35 2,435.80 (Unsecured, Considered Good unlessotherwise stated) Loan to Public Sector Undertakings - - Loan & advances to EmployeesConsidered Good 453.37 517.97 Considered Doubt ful 0.81 0.81 Less : Provision for doubt ful 0.81 453.37 0.81 517.97
Balance with Tax Authorities 23.21 96.62 Cash Call Receivable from JV Partners 7,809.49 23,308.68 Adv Recoverable in Cash or in kindConsidered Good 45,320.92 24,212.16 Considered Doubt ful 2,853.17 3,030.84 Less : Provision for doubt ful 2,853.17 45,320.92 3,030.84 24,212.16
Advance payment of Tax 21,227.91 20,413.73 Less : Provision for Taxation 15,548.64 5,679.27 12,800.83 7,612.90 MAT Credit 137.40 28.21 Deposits With Customs/Port Trusts etc. 5,235.06 3,295.19 Other Deposits (Note no. 27.2) 33,266.57 4,817.21 Less: Provision for doubt ful 6.87 38,494.76 7.52 8,104.88
TOTAL 100,330.38 66,317.22
As at st31 March, 2015
As at st31 March, 2014
(` in million)27 Short Term Loans And Advances
Particulars
26 Cash and Cash Equivalents
Balance with Bank in Current Accounts 14,499.96 13,052.16
Cash on hand 10.32 11.52
Short Term Investment in Mutual Funds 394.85 12,372.59
Bank Deposit (Note no. 10.1.1 ) 114,232.55 218,908.79
Deposit towards margin money against guarantees issued 31,451.74 66.51
Unpaid Interest on debentures Account 0.19 0.19
Unclaimed Dividend Account (Note no. 26.2 ) 379.56 389.50
TOTAL 160,969.17 244,801.26
As at st31 March, 2015
As at st31 March, 2014
(` in million)
26.1 Amount deposited in unclaimed dividend account and can be withdrawn only for the purposes is earmarked for payment of dividend and cannot specified in the Scheme i.e. towards removal of be used for any other purpose. equipment’s and installations in a manner agreed
26.2 Unclaimed dividend Accounts includes 124.49 with Central Government pursuant to an million (previous year `140.91 million) pertaining abandonment plan to prevent hazards to life, to minority shares in subsidiary company MRPL. property, environment etc.
26.3 Above Cash and Bank balance include 6,885.17 (b) In respect of subsidiary company OVL, investment million share of jointly controlled entities (Previous with bank for site restoration amounting toyear 7,769.03 million). 10,980.19 million (previous year 7,727.97
26.4 The deposits maintained by the company with million)made in accordance with agreement for banks comprise time deposit, which can be Abandonment with respective countries under withdrawn by the company at any point without operation. prior notice or penalty on the principal. These amounts aggregating to 136,423.99
26.5 Above ‘Cash &Cash Equivalent’ does not include :- million (previous year 120,829.56 million) are (a) In respect of company deposit under Site considered as restricted cash and hence not
Restoration Fund Scheme of amounting to treated as ‘cash and cash equivalents’ and 125,443.80 million (previous year 113,101.59 disclosed separately as non-current asset on the
million) which have been deposited with banks face of Balance Sheet under the head “Deposit under section 33ABA of the Income Tax Act, 1961 under Site Restoration Fund Scheme”.
`
`
` ` `
``
` `
Particulars

Annual Report 2014-15
Consolidated Financial Statement
320
Secured and Considered good
Interest Accrued on Loans & Advances
- Employee 296.61 246.15
- Others 11.07 307.68 - 246.15
(Unsecured, Considered Good unless otherwise stated)
Interest Accrued
- On Investments 1.38 1.38
- On Deposits 3,095.75 2,215.02
- On Loans & Advances 457.69 3,554.82 793.02 3,009.42
Other Current Assets (Note 28.3 & 28.4) 5,652.48 4,738.61
Fixed Assets held for sale (Note 28.5) 77.96 77.96
Cost of Ongoing Project (Note 28.2) 64.18 62.87
Unamortised Expenditure
- Dry Docking Charges 3,581.16 2933.68
- Mobilisation charges 635.33 4,216.49 640.69 3,574.37
TOTAL 13,873.61 11,709.38
As at st31 March, 2015
As at st31 March, 2014
(` in million)28 Other Current Assets
Particulars
27.1 Above, short term loans And advances includes being deposited by the company from 1st `551.47 million share of jointly controlled entities February, 2014 as per the interim order of the (Previous year 182.14 million). Hon'ble Supreme Court of India. (also refer Note
27.2 Includes 21,067.60 million (previous year no. 46.2.5) 2,092.23 million) towards dif ferential royalty
``
`
28.1 Above other current assets includes `616.86 28.4 Includes receivable of 532.02 million (Previous million share of jointly controlled entities (Previous Year 442.80 million) from Gratuity Trust as funded year 346.45 million) status is more than obligation in respect of the
parent company ONGC.28.2 In respect of Joint venture Company OTBL, revenue from projects based on execution and 28.5 Includes in respect of subsidiary company MRPL, costs at tributable and allocable thereto are Fixed Assets of 77.96 million (previous yearrecognized on substantial completion. Till the time 77.96 million) related to Plant and Machinery and of completion of project same are being carried as Other depreciable Assets which have been fully costs of ongoing project. depreciated and freehold land at cost which
are held for sale. Fixed Assets held for sale are 28.3 The subsidiary company, OVL has lease valued at lower of cost or estimated realizable investment in Khartoum-Port Sudan Pipeline value.Project.(refer Note 42.1)
``
`
``

Consolidated Financial Statement
321
29.2 For Crude Oil produced in Assam, sales revenue is based on the pricing formula provided by MoP&NG. Revenue from rest of nominated crude is accounted in terms of Crude Oil Sales Agreements (COSAs) already signed and made ef fective from 1st April, 2010.
29.3 During the previous year, Based on the directives issued by MoP&NG and Petroleum Planning and Analysis Cell (PPAC) vide let ters dated 31st May, 2012 and 1st June, 2012 respectively, w.e.f. 1st April, 2012, refineries started making deductions from ONGC payments towards Octroi/ VAT/ CST on discounts allowed by ONGC to refineries on supplies of crude oil. Total deduction made by refineries on this account from 1st April, 2012 to 30th September, 2013 amounting to `25,032.60 million (includes `15,846.70 million for the year 2012-13) was provided for. During the year, the
company has decided to revise the sales revenue and corresponding statutory levies w.e.f. 1st April 2012 onwards, considering deductions made by refineries based on MoP&NG directives. Aforesaid provision made by the Company till 30th September, 2013 has also been writ ten back.
29.4 Recognition of revenue on account of Short Lif ted Gas amounting to 1,774.13 million (Previous Year `1,253.74 million) has been postponed. This will be recognized when there is reasonable certainty regarding ultimate collection as per the policy of the company.
29.5 Sales revenue of Natural Gas is based on gas price fixed by GoI from time to time. Till October’14, sales revenue is based on MoP&NG order dated 31st May’10 wherein ef fective from 1st June’10, the price of APM gas produced by NOCs was fixed at US$ 4.2/mmbtu less royalty (on NCV basis).On
Particulars
A. Sale of Products
Own Product 1,675,852.82 1,808,411.76
Less :
Transfer to Exploratory Wells in Progress 597.04 522.58
Government of India's (GoI's) share in Profit Petroleum 32,847.82 33,444.86 38,526.99 39,049.57
1,642,407.96 1,769,362.19
Traded Products Revenue 60.08 44.42
B. Other Operating Revenue
Pipeline Transportation Receipts 6,589.14 4,170.92
Contractual Short Lif ted Gas Receipts 224.15 80.21
Surplus from Gas pool Account (Note 29.8) 3,267.04 3,720.47
North-East Gas Subsidy (Note 29.7) 2,702.83 2,366.91
SEZ Lease Income 158.70 234.77
Other Operation Income 4,703.74 1,600.63
Processing Charges 445.98 414.03
Production Bonus 109.02 18,200.60 57.29 12,645.23
TOTAL 1,660,668.64 1,782,051.84
2014-15 2013-14
(` in million)29 Revenue From Operations
29.1 In terms of the decision of Government of India (GOI), the company has shared `3,62,996.20 million (Previous Year 5,63,842.85 million) towards under-recoveries of Oil Marketing Companies (OMCs) on price sensitive products viz. Diesel (till 18th October’14), Domestic LPG and PDS Kerosene for the year 2014-15 (Nil in 4th
`
quarter of FY 2014-15 as per GoI directives) by extending the discount in the prices of Crude Oil, Domestic LPG and PDS Kerosene based on the rates of discount communicated by Petroleum Planning and Analysis Cell (PPAC) and Ministry of Petroleum and Natural Gas (MoP&NG). The impact of discount is as under:
Gross Revenue 3,62,996.20 5,63,842.85
Less: Value Added Tax (VAT) 10,025.10 17,841.84
Sales Revenue 3,52,971.10 5,46,001.01
Less: Statutory Levies 43,374.95 68,440.26
Profit Before Tax 3,09,596.15 4,77,560.75
2014-15Decrease in 2013-14
(` in million)

Annual Report 2014-15
Consolidated Financial Statement
322
25th October’14, GoI notified “New Domestic Natural Gas Pricing Guidelines, 2014” applicable from 1st November’14. Under said guidelines, price of domestic gas produced in India during1st November’14 to 31st March’15 has been fixed as US$ 5.05/mmbtu (on GCV basis). For gas consumers in North-East, consumer price is 60% of the producer price and the dif ference between producer price and consumer price is paid to the company through GoI Budget and shown as ‘North-East Gas Subsidy’.
29.6 In respect of Joint venture company PLL, revenue from services of `510.15 million (previous year` 253.83 million) are net of service tax.
29.7 OVL’s Subsidiary -ONGBV follows the entitlement method for revenue recognition associated with sale of crude oil and liquids for its share of petroleum production as specified in the Exploration Production Sharing Agreement (EPSA) and Crude Oil Pipeline Agreement (COPA). The amount reported using such method is `23,762.33 Million (previous year `39,747.98 million).
29.8 The company is supplying majority of Natural gas to Gas Authority of India Limited (GAIL) which also purchases gas from other sources and sells to APM and non-APM consumers. Based on the Government directives, excess in Gas Pool Account at the end of financial year is transferred to ONGC/ OIL in accordance with their contribution. Based on the details received from GAIL, an amount of `2,292.30 million (Previous year`3,508.10 million) for Gas Pool Receipts for the current year and `974.74million (Previous year`212.37 million) on account of interest on Gas Pool Account has been considered as ‘Surplus from Gas Pool Account’.
29.9 Above revenue from operation includes`61,921.15 million share of jointly controlled entities (previous year 50,232.74 million).
29.10 In case of the Joint venture company OTPC, CERC vide provisional order dated 20.12.2013 has allowed billing upto 90 % of the tarif f sanctioned. The revenue from operations for the period Jan 2014 to March, 2015 includes unbilled revenue in which group share is `346.11million (Previous year 77.06 million).
Particulars
Interest Income
Long Term Investments 166.42 169.59
Deposits with Banks/PSUs 18,567.58 18,388.08
Loans and Advances to Associate 64.52 493.81
Loans and Advances to Employees 504.68 100.92
Income Tax Refund 3,371.10 2,395.65
Site Restoration Fund Deposit 10,031.11 9,432.74
Delayed Payment from Customers and Others 405.96 33,111.37 523.58 31,504.37
Dividend Income
Long Term Investments 3,453.65 1,938.74
Short Term -Debt Mutual Funds 2,620.66 6,074.31 2,444.30 4,383.04
Other Non Operating Income
Excess Provisions writ ten back
(Note no. 29.3 & 38.1.5.b)) 6,498.74 16,343.62
Liabilities no longer required writ ten back 923.01 2,873.23
Contractual Receipts 543.00 1,055.10
Miscellaneous Receipts (Note 15.5 & 30.2) 12,494.00 20,458.75 12,739.64 33,011.59
TOTAL 59,644.43 68,899.00
2014-15 2013-14
(` in million)30 Other Income
30.1 Above other income includes 571.30 million share of jointly controlled entities (previous year 228.20 million). 30.2 Includes compensation of ` 821.90 million towards loss of oil & gas, received from Dedicated Freight Corridor
Corporation of India (DFCCIL).
` `

Consolidated Financial Statement
323
Particulars
Closing Stock
- Stock in Process 4,046.02 4,661.66
- Finished Goods and Stock in trade 27,944.82 31,990.84 42,575.84 47,237.50
Opening Stock
- Stock in Process 4,661.66 2,351.30
- Finished Goods and Stock in trade 42,575.84 39,625.72
Add/(less) Adjustment 1,982.50 49,220.00 (24.88) 41,952.14
NET (INCREASE)/DECREASE IN INVENTORIES 17,229.16 (5,285.36)
(Note no. 31.2)
2014-15 2013-14
(` in million)31 (Increase)/Decrease Inventories
31.1 Above includes 362.14 million share of jointly controlled entities (previous year ` (-) 26.59 million)31.2 In respect of parent company, ONGC, above includes decrease in value of crude oil stock of 623.00 million
on account of Prior Period Adjustments.
``
Royalty (Note 32.3 & 32.4) 141,451.06 150,101.83 Cess 102,535.02 99,733.91 Motor Spirit Cess - 2.83 Natural Calamity Contingent Duty 1,123.42 1,097.40 Excise Duty on stock (Net) (Note 32.5) 898.28 150.76 Sales Tax 2,585.82 3,122.96 Service Tax 297.86 438.76 Education cess 90.85 2,348.31 Octroi and Port Trust Charges 6,083.06 4,896.60 Staf f Expenditure 24,042.89 25,308.78 Workover Operations 21,738.49 20,944.08 Water Injection, Desalting and Demulsification 12,791.13 11,794.01 Consumption of Raw Materials, Stores and Spares 576,377.23 680,855.45 Pollution Control 6,573.59 6,133.59 Transport Expenses 9,857.13 9,419.99 Insurance 2,400.91 2,516.25 Power and Fuel 5,907.56 2,865.97 Repairs and Maintenance 12,285.44 10,800.47 Contractual payments including Hire charges etc. 16,718.21 14,407.07 Other Production Expenditure 31,809.12 35,583.73 Transportation and Freight of Products 11,908.72 11,559.67 Research and Development 5,445.29 6,014.37 Expenditure incurred on CSR 2,208.44 1,806.29 General Administrative Expenses 32,887.78 38,251.76 Exchange Loss (Net) (572.20) (2,894.69) Provision for mark to market loss on derivative contracts(Note-32.7& 32.8) 107.46 2,244.85 Adjustments for overlif t/(underlif t) (552.96) 503.46 Loss on sale of investment (net) (75.74) (38.09)Loss on sale of Asset 6.07 16.40 Other Expenditure ( Note 32.6) 18,200.67 19,760.40 TOTAL 1,045,130.60 1,159,747.17
2014-15 2013-14
(` in million)32 Production, Transportation, Selling and Distribution Expenditure
Particulars
32.1 Above production, transportation, selling and distribution expenditure includes 56,653.32 million, share ofjointly controlled entities (previous year 43,919.03 million).
`

Annual Report 2014-15
Consolidated Financial Statement
324
Manpower Cost (a) Salaries, Wages, Ex-gratia etc. 73,821.95 69445.52 (b) Contribution to Provident and other funds 9,960.65 9439.23 (c) Provision for gratuity 433.87 (404.88) (d) Provision for leave 4,430.01 5492.8
(e) Provision for Post Retirement Medical & Terminal Benefits 3,262.08 2736.92
(f) Staf f welfare expenses 1,704.86 23680.23Sub Total: 93,613.42 110,389.82 Consumption of Raw materials, Stores and Spares 619,126.39 726,528.20 Cess 102,550.46 99,737.56 National Calamity Contingent Duty 1,123.45 1,097.39 Excise Duty 52,669.43 38,378.68 Royalty 141,477.15 156,927.24 Sales Tax 2,592.96 3,122.99 Octroi and Port Trust Charges 6,083.50 4,896.64 Service Tax 297.86 438.76 Education cess 90.85 2,349.09 Rent 5,129.53 4,144.97 Rates and taxes 5,481.38 893.77 Hire charges of equipments and vehicles 133,095.88 142,787.19 Power, fuel and water charges 8,763.00 43,667.14 Contractual drilling, logging, workover etc. 62,989.38 58,274.68 Contractual security 4,798.82 4,030.52 Repairs to building 1,052.89 1,842.23 Repairs to plant and equipment 8,172.72 5,767.87 Other repairs 3,806.90 2,947.19 Insurance 4,074.92 4,599.02 Expenditure on Tour / Travel 8,604.56 4,011.31 CSR Expenditure 2,156.01 1,805.31 Exchange Loss (Net) (352.45) 2,356.80 Adjustment for overlif t/(underlif t) (552.96) 503.46 other operating expenditure 31,668.04 31,993.48 Miscellaneous expenditure 17,505.91 21,987.06
1,316,020.00 1,475,478.37Less:Allocated to exploration, development drilling, capitaljobs, recoverables etc. 219,118.25 278,449.92 Excise duty adjusted against sales revenue 51,771.15 37,281.28 Production, Transportation, Selling and DistributionExpenditure 1,045,130.60 1,159,747.17
2014-15 2013-14
(` in million)32.2 Details of Nature wise Expenditure
32.3 The Subsidiary of OVL- ONGBV conducts its operations in Sudan jointly with Sudapet the national oil company of Sudan among others. All government stakes other than income taxes are considered to be royalty interest. Royalties on production represent the entitlement of the government of Sudan to a portion of ONGBV’s
share of crude oil and liquid production and are recorded using the rates in ef fect under the terms of the contract at the time of production. Royalties / taxes in Syrian concession are accounted similarly by ONGBV. The amount of royalty repor ted in respect of Sudan and Syrian concession is `8,161.81 Million under Royalty above (previous year 15,863.65 million).

Consolidated Financial Statement
325
Differential royalty payable to State Governments:
Gujarat 1,6440.00
Andhra Pradesh 1,260.00
Tamil Nadu 220.00
Differential royalty recoverable from State/ Central Govt.:
Assam 980.00
Central Govt. 9,310.00
Net dif ferential royalty paid by ONGC 7,630.00
Particulars FY 14-15 FY 13-14
Audit Fee 22.27 17.26
Certification Fee 12.73 14.75
Out-of f pocket 20.69 22.69
Total 55.69 54.70
(` in million)
(` in million)
32.4 During the year, Government has directed the company (ONGC) to make following payments/ adjustments towards dif ferential royalty at uniform rate of discount for the period 2008-09 to 2013-14 to the State and Central Government:
The same has been accounted for as expenditure on royalty on crude oil. In the absence of any further directive, no provision is considered necessary for the current year
32.5 Excise duty on sale of product has been deducted from Sales revenue and Excise duty shown above representsthe dif ference between excise duty on opening and closing stock of finished goods.
32.6 Above Other Expenditure includes Auditor’s Remuneration :-
32.7 Derivative Contracts accounting as per the Accounting Standard(AS)30 "Financial instruments: Recognition and
The Joint venture company (SMASL) [through Measurement" in respect of those derivative
subsidiary company MRPL] has hedged the transactions which are not covered by the existing
financial risks mainly relating to changes in the Accounting Standard(AS) 11 .This treatment has
exchange rates by using forward contracts, in line resulted in net gain of `15.53 million (group share)
with its risk management policy.(previous year nil) arising out of fair valuation of
The Joint venture company (SMASL) [through outstanding derivative contracts which hassubsidiary company MRPL] has adopted, during been recognized in "Hedging Reserve" under the year under review, the principles of hedge "Reserve and Surplus".
Forward contracts for receivables including firm commitments 164.07 389.45
and highly probable forecasted transactions
Receivables, including firm commitments and highly 49.39 3.24
probable forecasted transactions
Category of derivative Instruments
Particulars
Group share as onst 31 March, 2014
Group share as onst 31 March, 2014
Group share as onst 31 March, 2015
Group share as onst 31 March, 2015
(` in million)
(` in million)Un-hedged foreign currency exposures of group share as at 31st March, 2015 are as under ( refer Note 48):-
Particulars of derivative contracts entered into for hedging foreign currency exchange risks, which are stoutstanding as at 31 March, 2015 are as under:-

Annual Report 2014-15
Consolidated Financial Statement
326
32.8 Derivative instruments and un-hedged foreign banks whereby it has swapped the principalcurrency exposure: and interest amounts payable towards Bonds
issued in domestic markets into USD liability as The subsidiary company, OVL has entered into follows:cross currency swap transactions with various
Underlying Notional Principal Amount (` in Million) Amount ( USD in Million) Date
8.54% 10 Years UnsecuredNon-Convertible RedeemableBonds in the nature of
th Debentures- Series II 3,700.00 73.93 6 Jan., 2020
Total
Notional Principal Termination
3,700.00 73.93
The swaps of 15,000.00 million Crore in respect of The above swap position outstanding on 31 March 8.40% Bonds, 2014 were fully set tled during the year. 2015 has been revalued on that date based on Mark-The net swap set tlement amount payable to counter to-market positions reported by counter-party banks. banks worked out to 3,244.30 million. The business of The Mark-to-market (MTM) position as on March, 2015 the subsidiary company, OVL is carried out entirely amounted to 1,213.38 million (Previous periodoutside India. The revenues of the OVL are received 4,350.18 million). This is af ter adjusting for the net entirely in foreign currency and substantially all the swap set tlement amount of 3,244.26 million in expenses are incurred in foreign currency. December, 2014. During the year 31st March,2015 Accordingly, the Company has swapped the Bonds Mark to market loss amounting to 107.46 million issued in Indian Rupees into USD so as to align the (Previous period ` 2,244.85 million) has been charged currency of its liabilities and assets, thereby hedging to statement of profit & loss Account.the resulting exposure.
`
``
``
`
Depletion 142,659.63 121,160.69
Amortisation of Goodwill 4,415.75 4,544.99
Depreciation 67,955.95 115,896.62
Less : Allocated to :
Exploratory Drilling 3,284.45 2,506.43
Development Drilling 3,297.72 1,871.16
Depreciation on Facilities 33,475.86 64,756.79
Others 297.50 27,600.42 9,845.15 36,917.09
Impairment Loss (Note 44)
During the year 7,058.97 4,241.78
Less: Reversal during the period 1,405.12 5,653.85 807.08 3,434.70
TOTAL 180,329.65 166,057.47
2014-15 2013-14
(` in million)33 Depreciation, Depletion, Amortization And Impairment
33.1 Above depreciation, depletion, amortization and impairment, includes `1,684.00 million share of jointlycontrolled entities (previous year 832.44 million).
32.9 The group has made provision for material foreseeable losses in respect of long term contract includingderivative contracts (refer Note 32.7 & 32.8).
Particulars

Consolidated Financial Statement
327
35.1 Above provisions and write of fs includes 1.91 million shares of jointly controlled entities (previous year 26.68 million).
35.2 Above include in respect of subsidiary company OVL, provision for doubt ful debts/claims on account of carry loan of 815.52 Million (previous year 665.20 million) to KMG in view of the fact that block is under exploration and since there is un-certainty of commercial discovery and consequent recovery of the loan (refer Note 21.4).
`
` `
i) Interest expenses 8,630.75 4,776.06
ii) Other borrowing costs 1,397.43 392.66
iii) Lease Finance Charges 527.55 411.55
iv) Foreign Exchange Fluctuation considered asBorrowing Cost 18,068.03 663.07
TOTAL 28,623.76 6,243.34
2014-15 2013-14
(` in million)
PROVISIONS
For Doubt ful Debts (Note-35.2) 5,246.07 3,305.11
For Doubt ful Advances 1,176.49 4,483.48
For Non-Moving Inventory 370.87 1,780.50
For Others 3,691.99 (145.56)
Sub-Total 10,485.42 9,423.53
WRITE-OFFS
Disposal/Condemnation of Fixed Assets (Net) 242.39 157.79
Claims/Advances 28.08 677.98
Less: Provisions 19.01 9.07 - 677.98
Inventory 139.10 55.31 Bad debts - 129.96 Less: Provisions - - 129.96 - Sub-Total 390.56 891.08 TOTAL 10,875.98 10,314.61
2014-15 2013-14
(` in million)35 Provisions And Write Offs
34 Finance Costs
34.1 Above finance costs includes `2,716.40 million share of jointly controlled entities (previous year `765.03 Million).
Particulars
Particulars
A. EXPENDITUREStatutory levies (41.45) - Other production, selling & distribution expenditure 671.40 (188.93)Excess Abandonment Provision writ ten back - (2,353.23)Interest -Others 608.30 343.82 Exchange Fluctuation - - Survey (1,200.17) (6.30)Dry Wells 3,443.99 82.55 Depletion (71.80) 164.56 Depreciation ( Note 14.1.h) 19.32 (85.79)Sub-Total 3,429.59 (2,043.32)B. INCOMESales 51.21 (104.88)Interest -Others 43.13 0.23 Other Income 200.32 484.70
Sub-Total 294.66 380.05
TOTAL (NET) 3,134.93 (2,423.37)
2014-15 2013-14
(` in million)36 Adjustments Relating to Prior Period (Net) :
Particulars

Annual Report 2014-15
Consolidated Financial Statement
328
36.1 Above adjustments relating to prior period include (-) 106.72 million shares of jointly controlled entities (Previousyear 64.28 million).
Net Group Profit af ter tax atributable to ONGC
Equity holders (` in million) 183,335.20 265,065.33
Weighted Average Number of Shares (Nos. in million) 8,555.49 8,555.49
Basic & Diluted earnings per equity share ( ` ) 21.43 30.98
Face Value per equity Share ( ` ) 5.00 5.00
2014-15 2013-14
37 Earnings Per Equity Share
Particulars
38 Disclosure under the Revised Accounting Standard-15 on “Employee Benefits” of Group(Considered for the company and its subsidiaries OVL & MRPL on standalone basis to the extent available):-
38.1 Brief Description: A general description of the type of Employee Benefits Plans of Group Companies is as follows:
38.1.1 Earned Leave (EL) Benefit Accrual – 30 days per yearEncashment while in service – 75% of Earned Leave balance subject to a maximum of 90 days per calendar yearEncashment on retirement – maximum 300 days
38.1.2 Good Health Reward (Half pay leave) Accrual - 20 days per yearEncashment while in service - NilEncashment on retirement - 50% of Half Pay Leave balance.
38.1.3 Gratuity15 days salary for each completed year of service. Vesting period is 5 years and the payment is restricted to 1.00 million.
38.1.4 Post-Retirement Medical BenefitsUpon payment of one time prescribed contribution by the employees, full medical benefits on superannuation and on voluntary retirement subject to the completion of minimum 20 years of service and 50 years of age.
38.1.5 Terminal Benefitsa. At the time of superannuation, employees are
entitled to set tle at a place of their choice andthey are eligible for Transfer TravellingAllowance.
b. Employees are gif ted gold coins on retirementup to 31.01.2015, depending upon their leveland years of service. This scheme has beendiscontinued w.e.f. 27.02.2015. Accordingly`5,854.33 million provided in earlier years hasbeen writ ten back.
38.1.6 In terms of DPE Guidelines, the Company has formulated a Post-Retirement Benefit Scheme (PRBS) as a defined contribution scheme.
38.2 The amounts recognized in the financial statements for defined contribution plans are as under:
(` in million)
Defined Contribution Plans Amount recognized during the period
Contributory Provident Fund(CPF) 3,728.66(3,667.71)
Employee Pension Scheme-95(EPF) 352.75(208.54)
Composite Social Security Scheme (CSSS) 625.48(633.09) (0.14)
Post Retirement Benefit Scheme (PRBS) 4,876.99(20,747.66)
Employer’s contribution to Superannuation Fund 84.03(71.40)
Contribution forKey Management
Personnel
2.13(1.90)
0.05(0.02)
0.15
2.15(1.59)
0.92(0.79)

Consolidated Financial Statement
329
38.3 The amounts recognized in the balance sheet for post-employment benefit plans are as under :
38.4 The amounts included in the fair value of plan assets of gratuity fund in respect of Group own financialinstruments and any property occupied by, or other assets used by the reporting enterprise are Nil (PreviousYear Nil)
38.5 Reconciliation showing the movements during the period in the net liability recognized in the balance sheet:
(` in million)
(` in million)
Sl Particulars Gratuity Leave Post-RetirementMedical Benefits Benefits
1 Present Value of Funded Obligation 21,220.86(21,339.12)
2 Present Value of Unfunded Obligation - - 27,617.69(24,363.88)
3 Fair Value of Plan Assets 21,721.19 - - (21,762.24)
4. Unrecognized Past Service Cost - - - -
5 Net Obligation -500.33(-423.12)
6 Liability for Retired employees - - - -
7 Total Provision -500.33 4,122.20 27,617.69 494.01 (-423.12) (2,566.68) (24.363.88) (6,319.04)
TerminalNo.
20,099.65 - -(21,867.14)
494.01(6,319.04)
15,977.45(19,300.46)
4,122.20 27,617.69 494.01(2,566.68) (24,363.88) (6,319.04)
Sl Particulars Gratuity Leave Post-RetirementMedical Benefits Benefits
1 Opening defined benefit obligation 21,339.13(21,392.35)
2 Current Service Cost 875.45(887.20)
3 Past Service Cost - - - -
4. Interest Cost 1,867.18(1,817.35)
5. Actuarial losses/(-) gains -1,053.40(-1,434.97)
6. Liability Transfer In 0.07 - - -
7. Benefits paid -1,807.57(-1,322.80)
8A Current Obligation 20,712.01(20,890.48)
8B Non-Current Obligation - 17,862.87(19,672.08)
Total (8A+8B) 20,712.01(20,890.48)
TerminalNo.
21,867.14 24,363.88 464.71(20,030.97) (21,562.59) (6,285.91)
872.88 368.66 20.54(1,076.57) (395.96) (401.55)
1,913.38 2,131.83 40.67(1,752.71) (1,886.47) (534.29)
3,158.71 2,174.17 -11.22(2,946.96) (1,726.19) (-885.05)
-7,712.46 -1,420.85 -20.69(-3,940.06) (-1,207.33) (-17.65)
2,236.78 1,579.86 50.41(2,195.06) (1,403.44) (689.11)
25,986.77 434.23(22,915.59) (5,621.41)
20,099.65 27,617.69 494.01(21,867.14) (24,368.88) (6,319.04)

Annual Report 2014-15
Consolidated Financial Statement
330
38.6 The total amount recognized in the financial statements before allocation is as follows:
38.7 Statement of Reconciliation of balance of Fair Value of Plans Assets in respect of Gratuity : -
38.8 Statement of Reconciliation of balance of Fair Value of Plans Assets in respect of Leave:-
(` in million)
(` in million)
(` in million)
Sl Particulars Gratuity Leave Post-RetirementMedical Benefits Benefits
1 Current Service Cost 875.45(887.20)
2 Interest on Obligation 1,867.18(1,817.35)
3 Expected returna on plan assets -1,892.43(-1,852.70)
4. Net actuarial Losses/ (-) Gainsrecognized in period
5 Past Service Cost - - - -
6 Losses (Gains) on curtailments and - - - -set tlement
7 Total included in ‘employee benefitexpense’.
8. Actual return on plan assets 1,751.71(1,711.28)
TerminalNo.
872.88 368.66 20.54(1,076.57) (395.96) (401.55)
1,913.38 2,131.84 40.67(1,752.71) (1,886.47) (534.29)
-1,688.11 - -(-1,752.71)
-912.68 3,017.60 2,174.17 -11.21(-1,442.91) (4,231.68) (1,726.19) (-885.05)
-62.48 4,115.75 4,674.67 50.00(-441.71) (5,308.25) (4,008.62) (50.79)
1,811.85 NA NA(467.99)
Particulars For Year ended on31.03.2015 31.03.2014
Fair Value of Plan Asset at Beginning 21,762.24 21,387.20
Adjustment in opening corpus consequent to audit 27.13 (89.17)
Expected Return on Plan Assets 1,873.33 1,922.41
Contribution by Employer - -
Transfer from other Company 0.07 -
Benefits Paid (1,800.86) (1,316.78)
Actuarial gain/loss on Plan Assets (140.72) (141.42)
Fair Value of Plan Asset at the end of the period (Unaudited) 21,721.19 21,762.24
For Year ended on
Particulars For Year ended on31.03.2015 31.03.2014
Fair Value of Plan Asset at Beginning 19,300.46 20,030.97
Adjustment in opening corpus consequent to audit (7.75) -
Expected Return on Plan Assets 1,688.11 1,752.71
Contribution by employer 2,567.98 -
Benefits Paid (7,712.46) (1,198.50)
Actuarial gain/loss on Plan Assets 141.11 (1,284.72)
Fair Value of Plan Asset at the end of the period (Unaudited) 15,977.45 19,300.46
For Year ended on

Consolidated Financial Statement
331
38.9 Other disclosures:(` in million)
(` in million)
(` in million)
The Group has recognized a gratuity liability of ` 78.72 million as on 31.03.2015 (Previous year 75.28) as per actuarial valuation for 558 Contingent Employees engaged in dif ferent work centres.
`
Gratuity As at31-03-2015
Present Value of Funded obligationas at the end of the period 21,220.86 21,339.12 21,470.17 20,828.86 19,928.73
Fair Value of plan assets as at theend of the period 21,721.19 21,762.24 21,387.20 20,376.51 18,354.26
Surplus/(Deficit) 500.33 423.12 (82.97) (452.35) (1,574.47)
Experience Adjustment on planLiabilities (loss)/gain 1,364.87 1,129.49 1,063.09 550.41 (838.47)
Experience Adjustment on planAssets (loss)/gain (142.86) (162.38) (163.24) (213.77) (118.11)
As at As at As at As at31-03-2014 31-03-2013 31-03-2012 31-03-2011
Leave Encashment As at31-03-2015
Present Value of Funded obligationas at the end of the period(Note no.35.1.1 and 35.1.2) 20,099.65 21,867.14 - - -
Fair Value of plan assets as at theend of the period 15,977.45 19,300.46
Surplus/(Deficit) (4,122.20) (2,566.68)
Experience Adjustment on planLiabilities (loss)/gain (2,878.21) (2,946.96) - - -
Experience Adjustment on planAssets (loss)/gain 141.11 (1,284.72)
As at As at As at As at31-03-2014 31-03-2013 31-03-2012 31-03-2011
Leave Encashment As at31-03-2015
Present Value of unfunded obligationas at the end of the period(Note no.35.1.1 and 35.1.2) - - 19,840.16 17,841.28 16,180.23
Experience Adjustment on planLiabilities (loss)/gain - - (2,943.61) (2,062.27) (2,917.77)
As at As at As at As at31-03-2014 31-03-2013 31-03-2012 31-03-2011
(` in million)
Post-Retirement Medical Benefits As at
31-03-2015
Present Value of Unfunded obligation
as at the end of the period
Experience Adjustment on plan
Liabilities (loss)/gain
As at As at As at As at
31-03-2014 31-03-2013 31-03-2012 31-03-2011
27,617.69 24,363.88 21,606.37 19,238.93 16,512.40
(1,744.08) (1,729.25) (1,713.33) (2,071.54) (2,010.95)

Annual Report 2014-15
Consolidated Financial Statement
332
(` in million)
Sensitivity Analysis ( In respect of Post-Retirement Medical Benefits) As at 31-03-2015
1.00 % (+) 1.00 % (-)
Ef fect on service and interest cost 308.16 (299.06)
Ef fect on PBO (Closing) 3,536.26 (2,477.65)
(` in million)
38.10 Investments of Gratuity Trust
Particulars % of Investment
For Year ended on31.03.2015 31.03.2014
Central Govt. Securities 28.65 28.98
State Govt. Securities 15.24 15.15
PSU Bonds 27.40 28.81
Treasury Bills 0.03 0.10
Insurance Investment 27.51 26.01
Equity Mutual Fund 0.23 0.22
Others 0.95 0.73
Total 100.00 100.00
For Year ended on
Terminal Benefits As at
31-03-2015
Present Value of Unfunded obligation
as at the end of the period
Experience Adjustment on plan
Liabilities (loss)/gain
As at As at As at As at
31-03-2014 31-03-2013 31-03-2012 31-03-2011
494.01 6,319.04 6,311.19 1,158.72 1,064.71
17.80 883.56 (4,694.35) (22.77) (355.59)

Consolidated Financial Statement
333
The discount rate is based upon the market yield available on Government bonds at the Accounting date with aterm that matches. The salary growth rate takes account of inflation, seniority, promotion and other relevant factoron long term basis. Expected rate of return on plan assets is based on market expectation, at the beginning of theyear, for return over the entire life of the related obligation.
39 Disclosure under Accounting Standard-16 on “Borrowing Costs”
Borrowing cost capitalized during the period is 16,589.29 million (previous year 13,659.16 million).
38.11 Principal actuarial assumption at the balance sheet date (expressed as weighted averages):-
Sl Particulars Gratuity Leave Post-RetirementMedical Benefits Benefits1
1 Discount rate 8.50%(8.75%)
2 Expected return on plan assets 8.50-8.70%(8.70-8.71%)
3. Annual increase in costs NA NA 0.00-6.00%(0.00-6.00%)
4. Annual Increase in Salary 6.00%(6.00%)
TerminalNo.
8.50% 8.50% 8.50%(8.75%) (8.75%) (8.75%)
8.75% NA NA(9.50%)
0.00-6.00%(0.00-6.00%)
6.00% NA NA(6.00%)
Drilling operation in onshore; ONGC accounts for 69% of crude oil and 70% of natural gas production of India.

Annual Report 2014-15
Consolidated Financial Statement
334

Consolidated Financial Statement
335
40.1 Notes :
40.1.1 The annexed matrix presentation depicts the geographical segments based on assets as primary segments and business segments as secondary segments.
40.1.2 Segments have been identified and reported taking into account the dif fering risks and returns, the organization structure and the internal reporting systems. These have been organized into the following main geographical and business segments:
Geographical Segments
a) In India - Of fshore
- Onshore
b) Outside India.
Business Segments
a) Exploration & Production
b) Refining
40.1.3 Segment Revenue, Results, Assets and Liabilities include the respective amounts identifiableto each of the segments and amount allocatedon reasonable basis. Un-allocated includes common expenditure incurred for all the segments and expenses incurred at the corporate level.
40.1.4 Inter Segment Sales have been priced at prevailing market rates.
40.1.5 Segment Assets includes `1,169.26 million of Intangible Assets (Previous year 754.36 million)
Revenue from operation (Gross) 29 1,660,668.64 1,782,051.84
Prior period Sales 36 51.21 (104.88)
Total 1,660,719.85 1,781,946.96
Segment Revenue as per Note no. 40.1 1,660,719.85 1,781,946.96
2014-15Particulars Note 2013-14
(` in million)
41 Disclosure under Accounting Standard -18 on "Related Party Disclosure :
41.1 Name of related parties and description of relationship :
41.1.1 Joint Ventures/Jointly Controlled Entities :
"
Sl No. Name
i Petronet MHB Ltd (PMHBL) ii ONGC Petro-additions Limited (OPaL)
iii Petronet LNG Limited (PLL) iv ONGC Tripura Power Co. Limited (OTPC)
v ONGC Teri Biotech Limited (OTBL) vi Dahej SEZ Limited\
vii Mangalore SEZ Limited (MSEZ) viii Adani Petronet (Dahej) Port Pvt. Ltd (throughPLL)
ix Mangalore STP Limited (through MSEZ) x Shell MRPL Aviation Fuels & Services Pvt.
Limited (through MRPL)
xi Mangalam Retail Services Limited(through MRPL)
xiii ONGC Mangalore Petrochemicals Ltd( refer note no. 3.1) (through MSEZ)
xii ONGC Mit tal EnergyLimited, Cyprus (OVL)
xiv MSEZ Power Ltd
40.1.6 Reconciliation of the Segment Revenue with the Revenue as per note 29 & 36 is given below:

Annual Report 2014-15
Consolidated Financial Statement
336
41.2 Key Management Personnel:
A. KMPs of Parent Companyi) Mr. D. K. Sarraf, Chairman and Managing Director.ii) Mr. A. K. Banerjee, Director (Finance)iii) Mr. T. K. Sengupta, Director (Of fshore) iv) Mr. Ashok Varma, Director (Onshore) from 19.06.2014v) Mr. D. D. Misra, Director( HR) from 01.08.2014vi) Mr. A. K. Dwivedi, Director (Exploration) from 16.03.2015vii) Mr. Shashi Shanker, Director( T& FS) viii) Mr. N. K. Verma Director (Exploration) up to 26.08.2014ix) Mr. K. S. Jamestin, Director (HR) up to 31.07.2014x) Mr. N K Sinha, Company Secretary , ONGC
B. KMPs of Subsidiaries and Joint Ventures Entities
i) Mr. Narendra K Verma, Managing Director, OVL Videsh, (from 27.08.2014)ii) Mr. S. P. Garg, Director (Finance) also Managing Director (upto 27.08.14), OVLiii) Mr. S. Bhattacharya, Director (Operations) OVL, (upto 31.10.2014)iv) Mr. Anil Bhandari, Director (Exploration) , OVLv) Mr. P. K. Rao, Director (Operations) (from 01.11.2014)vi) Mr. H. Kumar, Managing Director, MRPL from 14.08.2014.vii) Mr. Vishnu Agarwal, Director (Finance) MRPLviii) Mr. V. G. Joshi, Director (Refinery), MRPL ix) Mr. P. Upadhya, Managing Director, MRPL, upto July 2014x) Mr. Dinesh Mishra, Company Secretary, MRPLxi) Mr. A. R. Baron Mackay Holding B.V., Director, ONGC Nile Ganga B.V.xii) Mr. Costas Christoforou, Director, Imperial Energy Limitedxiii) Ms. Arlene Nahikian, Director, Imperial Energy Limitedxiv) Ms. K. Antoniadou, Director, Imperial Energy Limitedxv) Ms. E. Chrysanthou, Director, Imperial Energy Limitedxvi) Mr. A. Loizou, Director, Imperial Energy Limitedxvii) Mr. Roland Göransson, Director, Carabobo One ABxviii) Mr. Richard Chindt, Director, Carabobo One AB
xix) S B Singh, Company Secretary, OVLxx) Rajarshi Gupta, Director, ONGC Videsh Atlantic Inc.xxi) Sookraj Seechurn, Director, ONGC Videsh Rovuma Limitedxxii) Mr. Poonam Keenoo-Seegoolam, Director , ONGC Videsh Rovuma Limitedxxiii) Dr. A. K. Balyan (Managing Director & CEO) PLLxxiv) R. K. Garg Director – Finance, PLLxxv) Rajendra Singh Director(Technical), PLLxxvi) Rajiv Banga, Managing Director & CEO, MSEZ (up to 31.03.2015)xxvii) Gouranga Charan Swain, CFO, MSEZxxviii) Ashish Kulkarni, Company Secretary, MSEZ
xxix) Anil Khurana, Managing Director, PMHBLxxx) Chandan Kumar Das, CFO, PMHBLxxxi) Sachin Jayaswal, Company Secretary, PMHBLxxxii) Sudhindra Kumar Dube Managing Director, OTPC(up to 30.11.2014)xxxiii) Satyajit Ganguly, Managing Director, OTPC ( from 4.11..2014)xxxiv) Umesh Chandra, Managing Director, NETCxxxv) M. Krishna, Director, NETCxxxvi) Satyanarayana, CEO, OPaL (from 8th May, 2014)xxxvii) Dr. P. S. V. Rao, CEO, OPaL (up to 29th April, 2014)xxxviii) S P Bandopadhyay,CFO, OPaL(up to 31.01.2015)
xxxix) Rajendra Parakh, CFO OPaL( from 01.02.2015)xl) Subodh Prasad Pankaj, Company Secretary, OPaLxli) S. Ramachandran, CEO, OMPLxlii) Susil K Shenoy, CFO, OMPLxliii) Hitesh Jain, Company secretary, OMPL (up to 11.05.2014)xliv) Shyam kumar, company Secretary, OMPL (from 13.08.2014)xlv) V N Diwakar, CEO, SMAFS (from20.02.2015)xlvi) S Chockalingam, CFO and Company Secretary, SMAFSxlvii) Dr. Banwari Lal, CEO, OTBL
Mr.Mr. Mr.
Mr. Mr.Mr.Mr.Mr.Mr.Mr.Mr.Mr.Mr.Mr.Mr.Mr.
Mr.Mr. Mr.Mr.Mr.Mr.Mr.Mr.Mr.

Consolidated Financial Statement
337
Sale of Products toa) Shell MRPL Aviation Fuels & Services Pvt. Limited 5,792.34 5,877.10b) ONGC Tripura Power Co. limited 3,247.91 1,236.49Services Received from :a) ONGC Teri Biotech Ltd 244.72 112.42b) Dahej SEZ Ltd. 19.04 9.12c) Petronet MHB Ltd 19.95 62.57d) Mangalore SEZ Ltd. 31.18 13.68e) ONGC Tripura Power Co. Ltd 0.17 -Services Provided to :a) ONGC Petro-additions Ltd. 125.94 117.63b) ONGC Teri Biotech Limited 0.15 0.12c) Mangalore SEZ Ltd. 700.26 -d) ONGC Tripura Power Co. Ltd. 125.82 235.96e) ONGC Mangalore Petrochemicals Limited( up to 28.02.15) 3.49 7.16f) Petronet MHB Ltd 28.72 29.18g) Petronet LNG Ltd 0.05 -h) Shell MRPL Aviation Fuels & Services Pvt. Limited 11.22 0.33Dividend Incomea) Petronet LNG Limited 187.50 234.38b) Shell MRPL Aviation Fuels & Services Pvt. Limited 15.00 12.00Details As on 31.03.2015 As on 31.03.2014Amount Receivable : a) ONGC Petro-additions Limited 67.17 54.69b) ONGC Tripura Power Co. Ltd 345.08 373.80c) Mangalam Retail Services Limited 0.05 -d) Mangalore SEZ Ltd. 982.16 119.37e) ONGC Mangalore Petrochemicals Limited (as on 31.03.15) 3.46 685.32f) Shell MRPL Aviation Fuels & Services Pvt. Limited 289.10 622.96g) Petronet MHB Ltd 0.20 6.59h) Petronet LNG Ltd 0.10 -Amount Payable : a) ONGC Teri Biotech Ltd 148.33 51.55b) Dahej SEZ Ltd. 7.54 7.54c) ONGC Tripura Power Co. Ltd - 02d) Mangalore SEZ Ltd 0.17 0.09Advance against Equity outstanding :a) ONGC Petro-addition Limited 7,505.52 6,709.24b) ONGC Tripura Power Co. Ltd 4,645.36 2,925.10c) ONGC Mangalore Petrochemicals Ltd( as on 28.02.15) - 9,799.76d) Mangalam Retail Services Ltd - 0.50
2014-15 2013-14
(` in million)
(` in million)
41.3 Details of Group Related Party Transactions (before elimination):-41.3.1 Jointly Controlled Entities :
Details
41.3.2 Key Management Personnel
Particulars 2014-15 2013-14
Remuneration to Key Management Personnel 103.88 69.08
Amount Receivable 1.04 1.39
Amount Payable 9.49 10.32

Annual Report 2014-15
Consolidated Financial Statement
338
42 Disclosure under Accounting Standard - 19 on
'Leases'
42.1 Khartoum - Port Sudan Pipeline Project:
The subsidiary company , OVL had completed the
12”X741 Kms multi-product pipeline from
Khartoum refinery to Port Sudan for the Ministry of
Energy and Mining of the Government of Sudan
(GOS) on Build, Own, Lease and Transfer (BOLT)
basis and handed over the same to GOS during the
financial year 2005-06. The project was
implemented in consortium with Oil India Limited,
Company’s share being 90%.
The payment under the contract with GOS were
scheduled to be received over a period of 10 years
including a moratorium of one year from the date of
the contract (30 Sept, 2004) in 18 equal semi-
annual instalments along with lease rental. The
lease period commenced from the date of handing
over of the pipeline system and will continue till all
payments by GOS are completed. All titles in the
works and the transportation system shall vest in
the Company and the title shall pass to GOS in
proportion to the payments made by GOS against
total payments due to Company under the
contract. Further, subject to regular payments on
due dates by GOS to the Company, GOS shall have
the exclusive right to use and operate the pipeline
system and the Company shall not assign, transfer,
sub-let, sub-contract, mortgage or create any rights
to any third party or encumbrances or make any
disposition to any third party. Accordingly, the
amount of net investment in the lease (i.e. aggregate
of Minimum Lease Payments minus unearned
Finance Income) is recognized and recorded as
receivables under the lease. The finance income
thereon has been recognized based upon
the pattern reflecting the constant periodic rate of
return on the outstanding net investment in the lease.
The first 11 instalments under the contract due till
30th December 2010 have been received. Amount
towards the 12th,13th, 14th, 15th, 16th, 17th and
18th instalments of `6,195.72 Million, USD 98.91
Million (Company's share `5,576.15 Million, USD
89.02 Million) due on 30th June, 2011, 30th
December, 2011, 30th June 2012, 30th December,
2012, 30th June, 2013, 30th December, 2013 and
30th June, 2014 respectively have not yet been
received.
a) Reconciliation between the total gross investment inthe lease and the present value of minimum leasepayments as at year end
- Not later than one year 758.36 746.41 1,516.48 1,504.53
- Later than one year and not later than five years - - - -
- Later than five years - - - -
Total
b) Unearned Finance Income 11.95 95.62
c) Unguaranteed residual value accruing to OVL's benefit Nil Nil
d) Accumulated provision for uncollectible minimum leasepayments receivable Nil Nil
e) Contingent rents recognised in the statement of profitand loss for the period Nil Nil
f) General description of the significant leasing arrangement As described inpara above
g) Accounting Policy followed in respect of initial directcosts no. 2.2.z.1.2
758.36 746.41 1,516.48 1,504.53
As described inpara above
As per Note As per Note no. 2.2.z.1.2
st31 March, 2015
Gross GrossNet Net
st 31 March, 2014
The disclosure in accordance with the Accounting Standard (AS) 19 viz. Leases is as under:(` in million)
Particulars
The EPC contractor which executed the project claimed additional costs aggregating to`2,327.08 Million (Previous year 2,231.23 Million) (USD 37.15 Million), said Company’s 90% share being `2,094.37 Million (Previous year `2,008.11
Million) (USD 33.44 Million), which have not been accepted by the said Company. The said company, in turn has filed a claim as per the contract with GOS for their approval of an aggregate amount of `2,892.72 Million (Previous

Consolidated Financial Statement
339
year `2,773.57 Million) (USD 46.18 Million), said company’s share being `2,603.44 Million (Previous year `2,496.21 Million) (USD 41.56 Million). No revenue in respect of the claim on GOS has been recognized since the claim has not been accepted by GOS. OVL has served a pre-arbitral notice on GOS which is a requirement prior to initiating any legal proceedings in Sudan. The EPC contractor has initiated arbitration with a claim for `1,596.69 Million (Previous year `1,530.93 Million) (USD 25.49 Million) plus interest against the Company. Pending set tlement with the EPC contractor, an amount of `1,437.02 Million (Previous year `1,377.84 Million) (USD 22.94 Million) being the Company’s 90% share out of total claim of `1,596.69 Million (Previous year`1,530.93 Million) (USD 25.49 Million) has been accounted as liability in the relevant year of claim. The arbitration award has been pronounced on27th March, 2014. The award provides for the payment of 207.53 Million (USD 3.31 Million) and interest `15.99 Million (USD 0.26 Million). The parties have filed petitions in the high court reiterating respective averments and seeking revision/ modifications of the arbitral award. Since the said company has already accounted for the claim amount as expenditure for 1,437.02 Million (Previous year `1,377.84 Million) (USD 22.94 Million), the dif ferential of the amount accounted for and award will be adjusted subject to directions/decision of the honorable court. The interest amount would be treated on clarity of the issue based on directions/decision of the honorable court in this regard. Meanwhile the said company has paid `19.26 million (USD 0.31 million) against the arbitration award, [said Company share 17.33 million (USD 0.28 million)] and `8.54 mil l ion (USD 0.14 mil l ion),[said Company share ` 7.69 million (USD 0.13 million)] against interest @4.5% on 31.10.2014 to Dodsal to avoid excess interest burden on the
awarded amount.
42.2 Financial Lease for BC-10 Project
ONGBV owns 15% equity shares in Tamba B.V. The Netherlands; with the balance held by Shell E & P Of f shore Ser vices B.V., The Netherlands (“SEPBV”), and Petrobras Netherlands B.V. The Netherlands (“PNBV”). Tamba B.V. has been established to facilitate the development and production of hydrocarbons in the BC-10 concession, Campos Basin area in Brazil. Tamba B.V. has a third party lease for a major oil field equipment (FPSO) and constructed other sub-sea assets for onwards lease to BC-10 Project. Both financial leases commenced on 31st December 2008.
Tamba B.V. leases part of its assets from a third party, Brazilian Deepwater and re-leased these to BC-10 joint venture operated by Shell Brasil Ltd. The risks and rewards incidental to ownership are largely transferred to the lessee. These assets are capitalised and recognised in the balance sheet of BC-10 as from the date the lease contract is concluded, at the lower of the fair value of the asset and the discounted value of the minimum lease instalments. The lease instalments payable are broken down into repayment and interest components, based on a fixed interest rate and instalments as derived from the underlying agreement. The lease commitments are carried under long-term liabilities exclusive of interest. The interest component is recognised in the statement of profit and loss account in accordance with the lease instalments.
Revenue of finance lease contracts represents the transfer of economic ownership from Tamba B.V. (lessor) to the lessee of the asset, being an af filiate. Cost of sales represents the costs associated with the finance lease contracts. The said Company’s share of the lease liability (at USD 1= 62.64) are tabulated below:-
Lease liability
Opening balance as at 01.04.2014 6,139.25
Interest 527.53
Lease Payments 1,281.69
Foreign Currency Translation Adjustment 130.31
Closing balance as at 31.03.2015 5,515.41
The Company's 27% share of future estimated minimum lease expenses in the year and their present values are scheduled to be as follows:
< 1 Year 1-5 Years >5 Years Total
Future minimum lease payments: 1,284.35 4,059.92 1,602.71 6,946.97
Present value of minimum lease payments 1,247.39 3,260.47 877.25 5,385.10
(` in million)
(` in million)
Particulars

Annual Report 2014-15
Consolidated Financial Statement
340
Tamba B.V., JV company of ONGBV (27%) has entered into a 15-year lease contract for the supply of the FPSO with a third party. The lease contract contains priced termination options for each of the 15 years and priced extension options for the4 years following the initial 15-year term. The Company can exercise a priced purchase option during the term of the lease. The interest rate implicit in the lease is 9.5% (Previous year 9.5%).
42.3 The company has certain of fice/ residential premises on Operating Lease which are cancellable by giving appropriate notice as per the respective agreements. During the year 998.07
million (Previous year 1,020.78 Million) had been paid towards cancellable Operating Lease.
42.4 The Joint venture company, OTPC, has certain of fice premises under operating lease non-cancellable agreements. The lease rental expense recognized in the Statement of Capital Work-in-Progress for the period ended March 31, 2015 is`9.24 million (previous year 9.24 million) as group share. Liability amounting to `3.72 million (previous year `3.73 million) as group share has been provided for rent equalization reserve till March 31st , 2014.
Particulars As at 31.03.2015 As at 31.03.2014
Not later than one year 9.24 11.55
Later than one year and not later than five years 34.66 43.91
Later than five years - -
Total 43.9 55.46
(` in million)
43. Disclosure under Accounting Standard - 27 on Financial Reporting of Interest in Joint Ventures:
43.1 Jointly Controlled Assets in India
In respect of certain blocks, the Company's Joint Ventures (JV) with certain body corporates have entered into Production Sharing Contracts (PSCs) with GoI. Details of these blocks and JVs as on 31.03.2015 are as under:
Sl. No. Blocks Company's PI * Others Partners and their PI in the
JV/Operatorship***
A Jointly Operated JVs
1 Panna, Mukta and Tapti 40% (40%) BGEPIL 30%, RIL 30%
2 AN-DWN-2009/3 60% (60%) OIL 40%
B ONGC Operated JVs
3 CB-OS/1 Development Phase** 55.26% (55.26%) TPL 6.7%, HOEC 38.04%
4 MN-DWN-98/3** 100% (100%)
5 MN-OSN-2000/2 40% (40%) GAIL 20%, IOC 20%, OIL 20%
6 AA-ONN-2001/2 80% (80%) IOC 20%
7 CY-ONN-2002/2 60% (60%) BPRL 40%
8 KG-ONN-2003/1 51% (51%) Cairn India-49%
9 CB-ONN-2004/1** 60% (60%) GSPC 40%,
10 CB-ONN-2004/2 55% (55% ) GSPC 45%
11 CB-ONN-2004/3 65% (65%) GSPC 35%
12 CY-ONN-2004/2 80% (80%) BPRL 20%
13 MB-OSN-2005-1 80% (80%) GSPC 20%
14 Raniganj 74% (74%) CIL 26%
15 Jharia 74% (90%) CIL 26% (10%)
16 NK-CBM-2001/1 80% (80%) IOC 20%
The group share in future minimum lease payments and payment profile under the non-cancelableoperating leases are as follows:

Consolidated Financial Statement
341
Sl. No. Blocks Company's PI * Others Partners and their PI in the
JV/Operatorship***
17 BK-CBM-2001/1 80% (80%) IOC 20%
18 CB-ONN-2005/4 51% (51%) GSPC 49%
19 CB-ONN-2005/10** 100% (51%) (GSPC 49%)
20 WB-ONN-2005/4 75% (75%) OIL 25%
21 AN-DWN-2009/2 60% (60%) OIL 40%
22 AN-DWN-2009/1 70% (70%) OIL 30%
23 AN-DWN-2009/5** 100% (100%)
24 GK-OSN-2009/1 40% (40%) AWEL 20%, GSPC 20%, IOC 20%
25 GK-OSN-2009/2 40%(40%) AWEL 30%, IOC 30%
26 KG-OSN-2009/1 80% (80%) APGIC 10%, NTPC 10%
27 KG-OSN-2009/2 90% (90%) APGIC 10%
28 KG-OSN-2009/4 50% (50%) APGIC 10%, OIL 30%, NTPC 10%
29 AA-ONN-2009/3 50% (50%) OIL 50%
30 CB-ONN-2009/4 50% (50%) GSPC 50%
31 GK-OSN-2010/1 60% (60%) OIL-30%, GAIL-10%
32 GK-OSN-2010/2 90% (90%) GAIL- 10%
33 CB-ONN-2010/6 80% (80%) IOC- 20%
C. Operated by JV Partners
34 Ravva 40% (40%) Cairn India (Operator) 22.5% , VIL
25%, ROPL 12.5%
35 CY-OS-90/1 (PY3) 40% (40%) HEPI (operator) 18%, HOEC 21%
TPL 21%
36 RJ-ON-90/1 30% (30%) Cairn India (Operator) 35%, CEHL
35%
37 CB-OS/2 –Development Phase 50% (50%) Cairn India (operator) 40% ,
TPL 10%
38 CB-ON/7 –Development Phase 30% (30%) HOEC (Operator) 35%, GSPC 35%
39 CB-ON/3 – Development Phase 30% (30%) EOL (Operator)70%
40 AA-ONN-2002/3 70% (70%) OIL (Operator) 30%
41 AN-DWN-2003/2 45%(45%) ENI (Operator) 40% GAIL 15%
42 PR-OSN-2004/1 35% (35%) Cairn India (Operator) 35%, TPL 30%
43 CB-ON/2- Development phase 30% (30%) GSPC (Operator) 56%,
Geo-Global Resources 14%
44 RJ-ONN-2005/3 40% (40%) GSPC (Operator) 60%
45 AA-ONN-2009/4 50% (50%) OIL(Operator) 50%
46 CY-OSN-2009/2 50% (50%) OIL 50% (Operator)
47 AA-ONN-2010/2 30% (30%) OIL -40%, GAIL-20%, EWP-10%
48 AA-ONN-2010/3 40%(40%) OIL-40%, BPRL-20%

Annual Report 2014-15
Consolidated Financial Statement
342
* PI - Participating Interest
** Approval towards assignment of PI is awaited from GoI
*** There is no change in previous year details unless otherwise stated.
Abbreviations:- APGIC- AP Gas Infrastructure Hardy Exploration and Production India Ltd, andand,
Corporation Ltd, AWEL- Adani Wels pun Exploration HOEC- Hindustan Oil Exploration Company Ltd, , IOC-
Ltd, BGEPIL- British Gas Exploration and Production Indian Oil Corporation Ltd, , NTPC- National Thermal
India Ltd, BPRL- Bharat Petro Resources Ltd, , CEHL- Power Corporation Ltd, OIL- Oil India Ltd, , VIL-
Cairn Energy Hydrocarbons Ltd, CIL- Coal India Ltd, Videocon Industries Ltd, RIL- Reliance Industries Ltd,
ENI- Ente Nazionale Idrocarburi, Ensearch- Enserach, ROPL- Ravva Oil (Singapore) Private Ltd, , TPL- Tata
EOL- Essar Oil Ltd., GAIL- Gas Authority of India Ltd, , Petrodyne Ltd.
GSPC- Gujarat State Petroleum Corporation Ltd, HEPI-
Sl. No. Joint Ventures / PSCs Company's PI *
1. NEC-DWN-2002/2 100% (100%)
2. KK-DWN-2002/2 80% (80%)
3. CY-ONN-2004/1 80% (80%)
4. PR-ONN-2005/1 80% (80%)
5. GV-ONN-2005/3 80% (80% )
6. KG-OSN-2005/1 60% (60%)
7. KG-OSN-2005/2 80% (80%)
8. KG-DWN-2005/1 70% (70%)
9. PA-ONN-2005/1 100% (100%)
10. MB-OSN-2005-5 70% (70% )
11. MB-OSN-2005-6 80% (80% )
12. KK-DWN-2005/2 90% (90%)
13. AN-DWN-2009/18 60%(60%)
14. KG-DWN-2009/1 45%(45%)
15. CY-DWN-2004/3 70% (70%)
16. AA-ONN-2001/3 85% (85%)
17. AA-ONN-2005/1 60% (60%)
18. AA-ONN-2001/4 100% (100%)
19. AA-ONN-2002/4 90% (90%)
20. CY-PR-DWN-2004/1 70% (70%)
21. AN-DWN-2009/13 80% (80%)
22. RJ-ON/6 – Development phase (refer Note 41.3.5) 30% (30%)
* PI - Participating Interest
43.2 List of the blocks surrendered during the year are given below:

Consolidated Financial Statement
343
43.3. The Financial position of the JV/NELP blocks are as under :(` in million)
(` in million)
No. of Jvs/Assets Liabilities Income Expenditure
NELP Blocks before tax
NELP
Block-100% PI*
Blocks with
other partners
Surrendered 70 4,680.45
(49) (-2,044.86)
Total 134
(135) (182,559.74)
Profit / (-) Loss
16 30,348.05 233.14 0.17 24,557.43 -24,557.26
(19) (37,773.90) (341.84) (96.45) (20,154.93) (-20,058.48)
48 93,976.40 46,927.57 1,46,952.80 1,08,133.48 38,819.32
(67) (103,668.42) (44,450.57) (182,462.92) (142,405.71) (40,057.21)
12,369.44 276.54 12,024.63 -11,748.09
(5,209.85) (9,565.83) (0.37) (2,045.23)
1,29,004.90 59,530.15 1,47,229.51 1,44,715.54 2,513.97
(146,652.16) (54,358.24) (164,605.87) (17,953.87)
No. of JVs/NELP Blocks before tax
Profit / (-) LossAssets Liabilities Income Expenditure
Audited 117 1,21,162.67 48,412.46 1,34,036.87 1,32,756.44 1,280.43(124) (145,807.09) (51,823.77) (182,255.94) (163,656.37) (18,599.58)
Unaudited 17 7,842.23 11,117.69 13,192.64 11,959.10 1,233.54(11) (845.07) (2,534.46) (303.79) (949.50) (-645.71)
Total 134 1,29,004.90 59,530.15 1,47,229.51 1,44,715.54 2,513.97(135) (146,652.16) (54,358.23) (182,559.73) (164,605.87) (17,953.87)
43.3.1 The financial statements of 117 (previous year 124) out of 134 (previous year 135) JVs/NELP have been incorporated in the accounts to the extent of Company’s par ticipating interest in assets, liabilities, income, expenditure and profit / (loss) before tax on the basis of statements certified in
accordance with production sharing contract and in respect of balance 17 (previous year 11) JVs/NELP, the figures have been incorporated on the basis of uncer tified statements prepared under the production sharing contracts. Both the figures have been adjusted for changes as per Note No. 2.2.j
43.3.2 In respect of 3 NELP blocks (previous year 12) which have expired as on 31st March, 2015, the Company’s share of Unfinished Minimum Work Programme (MWP) amounting to `820.40 million (previous year to 18,014.12 million) has not been provided for since the company has already applied for further extension of period in these blocks as ‘excusable delay’/ special dispensations citing technical complexities, within the extension policy of NELP Blocks, which are under active consideration of GoI. The delays have occurred generally on account of pending statutory clearances from various Govt. authorities like Ministry of Defense, Ministry of Commerce, environmental clearances, State Govt. permissions etc. The above MWP amount of 820.40 million (previous year 18,014.12 million) is included in MWP commitment under note no. 46.1.2.
43.3.3 As per the Production Sharing Contracts signed
`
``
by the Company with the GoI, the Company is required to complete Minimum Work Programme (MWP) within stipulated time. In case of delay in completion of the MWP, Liquidated Damages (LD) is payable for extension of time to complete MWP. Further, in case the Company does not complete MWP or surrender the block without completing the MWP, the estimated cost of completing balance work programme is required to be paid to the GoI. During the year LD amounting to (net of reversal)24.08 million (Previous year 245.65 million) and
cost of unfinished MWP (net of reversal) 1,420.64 million (Previous year (net of reversal) (-) 59.14 million), paid/payable to the GoI is included in survey and wells written of f expenditure.
43.3.4 The company had acquired Participating Interest (PI) of British Gas Exploration & Production India Ltd (BGEPIL) in the following blocks, effective from the following dates as approved by the board of directors.
` ```
The financial positions of JV/NELP are as under:
Particulars
Name of the Block PI Date of Transfer of PI
KG OSN 2004/1 45% 25.11.2011
KG DWN 98/4 30% 18.05.2011
MN DWN 2002/2 25% 01.12.2011
* PI - Participating Interest

Annual Report 2014-15
Consolidated Financial Statement
344
43.4 Company's share in Joint Ventures (Outside India) through Subsidiary - OVL
Sl.No. participating
share (%)
1 Block 06.1 Vietnam, Of fshore 45% TNK Vietnam
production
2 Block 2a, 2b & 4, GNPOC. Sudan, (Through ONGC NileGanga B.V.) Sudapet - 5%
3 Block 1a, 1b, & 4, GPOCSouth Sudan, (Through ONGCNile Ganga B.V.) Nilepet - 5% Currently under temporary
shutdown due to securi tysituation.
4 Block 5A South Sudan,Onshore Nilepet - 8% (SPOC) exploration, development and
production. Currently undertemporary shutdown due tosecuri ty si tuation.
5 Sakhalin -1 Project, Russia,Of fshore
SMNG - 11.5%R N Astra – 8.5%
6 AFPC Project Syria, Onshore (Through ONGC Nile
1Ganga B.V.)
7 MECL Colombia, Onshore (Through ONGC AmazonAlaknanda Limited) and
8 Block BC-10 Brazil, Of fshore (Through ONGC Nile GangaB.V.)
9 OOO Imperial Frac Service (Through Imperial Energy Ltd) Aleksandrovich
Borisov – 50%
10 San Cristobal Project Venezuela,Onshore (Through ONGC NileGanga B.V.)
Name of the Project and Company's Other Operator Status Country of Operation Consortium
Members
TNK Vietnam B.V. The project is under B.V. -35%, development andPetrovietnam - 20%
25% CNPC - 40% Joint Operatorship The project is under Petronas - 30% (GNPOC) production.
25% CNPC - 40% Joint Operatorship The project is under Petronas - 30% (GPOC) production.
24.125% Petronas - 67.875% Joint Operatorship The project is under
20% ENL - 30% ENL The project is underSODECO - 30% development and production
38.75% Fulin – 50% SSPD The project is underMit tals – 11.25% production. Currently under
temporary shutdown due tosecuri ty si tuation.
50% Sinopec – 50% Joint Operatorship The project is underexploration, development
production
27% Shell – 73% Shell The project is underdevelopment and production
2
50% Mr. Vladimir ONGC Videsh The company providesFraccing Services
40% CVP- 60% Joint Operatorship The project is underdevelopment and production
British Gas has agreed to pay a lump sum amount Focus Energy Ltd (Operator), on condition thatof USD 50 Million, towards full and final set tlement Focus Energy Ltd (Operator) to pay towards 100%of carry costs/cash calls due in all the above past royalty obligation, PEL/ML fees, otherblocks, subject to government approval for statutory levies and waive of f of development/transfer of PI in all the above blocks. Since the Production costs payable by ONGC in SGL Fieldgovernment approval in respect of MN DWN of the block as well as take all future 100% royalty2002/2 is pending, no adjustment is made in the obligation of ONGC as licensee and also notaccounts towards the lump sum amount due as exercise its option of acquiring 30% PI in two gasabove. discoveries namely SSG-1 and SSF-2 in Block.
43.3.5 The company has relinquished 30% Participating Pending farm out agreement/governmentInterest (PI) in SGL Field with future interest in approval, no adjustment is made in the accountsblock RJ-ON/6 Jaisalmer Basin Rajasthan to in respect of relinquishment of RJ-ON/6.

Consolidated Financial Statement
345
Sl.No. participating
share (%)
Name of the Project and Company's Other Operator Status Country of Operation Consortium
Members11 Block A-1 Myanmar, Of fshore 17% Daewoo – 51% Daewoo The project is under
MOGE- 15% production.KOGAS – 8.5%GAIL – 8.5%
12 Block A-3 Myanmar, Of fshore 17% Daewoo – 51% Daewoo The project is underKOGAS – 8.5% production.GAIL – 8.5%MOGE- 15%
13 Farsi Block Project Iran, Of fshore 40% IOC – 40% ONGC Videsh The project ’s explorationOIL – 20% period ended on 24 Sept
2009. Agreement on MDPand Development servicecontract is pending.
14 Block X XIV Syria, Onshore 60% IPRMEL - 25% IPR MEL IPRMEL the OperatorTriocean-15% declared Force Majeure
ef fective 29 April 201215 Khar toum–Por t Sudan Pipeline 90% OIL – 10% ONGC Videsh The pipeline has been
Project Sudan, Onshore completed and is underlease.
16 Block RC-8 Colombia, Of fshore 40% Ecopetrol - 40% ONGC Videsh The project is underPetrobras – 20% exploration
17 Block RC-9 Colombia, Of fshore 50% Ecopetrol - 50% Ecopetrol The project is underexploration
18 Block RC-10 Colombia, Of fshore 50% Ecopetrol - 50% ONGC Videsh The project is underexploration
19 Block BM-SEAL-4, Brazil, Offshore 25% Petrobras- 75% Petrobras The project is under(Through ONGC Nile Ganga B.V) exploration
20 Block LLA - 69, Colombia, 50% Sinopec – 50% Joint The project is underOnshore (Through MECL) Operatorship exploration
21 Block SSJN-7 Colombia, Onshore 50% Pacific - 50% Pacific The project is underexploration
22 Block CPO-5 Colombia, Onshore 70% Petro Dorado – 30% ONGC Videsh The project is underexploration
23 SHWE Of fshore Pipeline Project, 17% Daewoo – 51% Daewoo Pipeline is completed andMyanmar, Of fshore KOGAS – 8.5% is under use for
GAIL – 8.5% transpor tation of gas fromMOGE – 15% Blocks A1/A3, Myanmar
24 Onshore Gas Pipeline Project 8.35% CNPC-SEAP– 50.90% CNPC-SEAP The project is under(SEAGPCL), Myanmar, Onshore Daewoo – 25.04% operation.(Through ONGC Nile Ganga B.V.) KOGAS– 4.17%
GAIL – 4.17% MOGE – 7.37%
25 Carabobo Project, Venezuela 11% CVP - 71% Joint The project is underOnshore (Through Carabobo Repsol Exp-11% operatorship development andOne AB) INDOIL-7% production.
26 Satpayev Contract Area 3575, 25% KMG – 75% SOLLP The project is underKazakhstan, Of fshore Exploration
27 Azeri, Chirag, Guneshli fields 2.72% BP - 35.79% BP The project is underAzerbaijan, Of fshore SOCAR - 11.65% development and
Chevron - 11.27% productionInpex - 10.96%Statoil - 8.56%Ex xon-Mobil - 8.00%TPAO - 6.75%Itochu - 4.30%

Annual Report 2014-15
Consolidated Financial Statement
346
Sl.No. participating
share (%)
Name of the Project and Company's Other Operator Status Country of Operation Consortium
Members
28 BTC Pipeline Azerbaijan, Onshore 2.36% BP - 30.1% BP The project is under
(Through ONGC (BTC)) SOCAR - 25% operation
Chevron - 8.9%
Statoil - 8.71%
TPAO - 6.53%
Eni - 5%
Total - 5%
Itochu - 3.40%
Inpex - 2.5%
Conoco Philips - 2.5%
29 Block Area 1, Mozambique 16.00% Anadarko- 26.5% Anadarko The project is under3Of fshore Mitsui-20% development
Cove Energy-8.5%
BPRL-10%
OIL-4%
ENH-15%
30 Block SS 04, Bangladesh, 45.00% OIL-45% ONGC Videsh The project is under
Of fshore BAPEX-10% exploration
31 Block SS 09, Bangladesh, 45.00% OIL-45% ONGC Videsh The project is under
Of fshore BAPEX-10% exploration
32 Block B2, Myanmar, Onshore 97.00% Machinery and Solutions ONGC Videsh The project is under
Company Ltd. - 3% exploration
33 Block EP3, Myanmar, Onshore 97.00% Machinery and Solutions ONGC Videsh The project is under
Company Ltd. - 3% exploration
Abbreviations used: CNPC – China National Petroleum Development Company Limited; SOLLP – Satpayev Corporation; CNPC-SEAP-CNPC South-East Asia Operating Company LLP (100% subsidiary of KMG); Pipeline Co Ltd; CVP – Corporacion Venezolana Del SSPD: Syria Shell Petroleum Development B.V.; Sudapet Petroleo S.A.; Daewoo – Daewoo International – Sudapet Limited; Triocean: Tri-Ocean Mediterranean; Corporation; ENL – Exxon Nef tegas Limited; Fulin – Fulin SOCAR: State Oil Company of Azerbaijan Republic; Investments Sarl; GAIL – GAIL (India) Limited; GNPOC - TPAO - Turkish Petroleum Corporation; BREML - Beas Greater Nile Petroleum operating Company; GPOC - Rovuma Energy Mozambique Ltd; ENH - Empresa Greater Pioneer Operating Company; SPOC - Sudd Nacional De Hidrocarbonates, E.P; BAPEX - Petroleum Operating Company;IOC – Indian Oil Bangladesh Petroleum Exploration & Production Corporation Limited; INDOIL- Indoil Netherlands B.V.; Company Limited
1.IPRMEL – IPR Mediterranean Exploration Limited; KMG ONGC Videsh has ef fectively 38.75% interest in KazMunayGas; KOGAS – Korea Gas Corporation; B.V; Himalaya Energy Syria B.V. (HESBV) with Mit tals and Mit tals – Mit tal Investments Sarl; MOGE- Myanmar Oil Fulin ef fectively holding 11.25% and 50% interest and Gas Enterprise; Nilepet - Nilepet Limited, South respectively. HESBV, through its subsidiaries, holds Sudan; OCL – ONGC Campos Ltda.. OIL – Oil India 33.33%, 37.5% and 36% interest in Ash Sham (including Limited; Pacific - Pacific Stratus Energy, Colombia; deep and lateral) concession, Deir-Ez-Zor and Annexure-Petrobras – Petroleo Brasileiro S.A.; Petro-Dorado - IV (including deep and lateral) concessions and a gas Petro-Dorado South America S.A.; Petronas – Petronas utilization agreement in Syria; the balance interest in the Carigali Overseas Sdn Bhd; Petronas Ve: PC Venezuela concessions being held by SSPD- the Operator.
2.Ltd; Petrovietnam – Vietnam Oil and Gas Group; Repsol – In case of Block BC-10 Brazil, Of fshore additional 12% Repsol YPF Cuba SA; Repsol Exp- Repsol Exploracion stake was acquired on 30th December 2013.
3.S.A.; SEAGPCL – South East Asia Gas Pipeline In case of Area 1 of fshore Block, Mozambique, 10% is Company Ltd.; Shell – Shell Brazil Ltda; Sinopec – directly held by ONGC Videsh Ltd. and 6% through Sinopec Overseas Oil and Gas Limited; SMNG – subsidiary BREML. Oil India Limited holds 4% PI through Sakhalinmornef tegas Shelf; SODECO – Sakhalin Oil BREML.

Consolidated Financial Statement
347
43.5 Company's share in Joint Ventures through subsidiary OVLThe Company, its Subsidiaries’ and the Joint Venture Company’s share of assets, liabilities, income and expenses in the Joint Ventures as furnished by the Operator has been incorporated in the financial statements as given below:
(` in million)
Project Asset Liabilities Income Expenditure*(Including Loss
depreciation)stA. Audited as of 31 March, 2015
Block 06.1, Vietnam 6,821.46 2,072.54 8,006.48 6,469.14 1,537.34
Farsi Block, Iran 0.37 (7.87) - 9.33 (9.33)
MECL, Colombia 27,165.45 5,459.29 16,403.28 10,829.59 5,573.69
LLC Imperial Frac Service-Jarpeno 173.16 7.06 298.99 276.61 22.38
BREML, Mozambique 22,082.06 38,475.29 - 861.47 (861.47)
Petro Carabobo, Venezuela** 15,069.89 2,049.48 1,403.13 (1,041.80) 2,444.93
Block 2a, 2b & 4, Sudan 27,494.55 7,117.59 23,841.52 10,904.56 12,936.96
Block 1a, 1b, & 4, South Sudan 7,048.42 49.97 644.61 - 644.61
Block BC-10 & Exploratory Blocks, Brazil 52,816.52 33,331.50 26,633.59 14,151.49 12,482.10
PIVSA (San Cristobal), Venezuela 26,331.77 58,291.54 19,005.19 13,000.97 6,004.22
Pipeco 1 onshore Project, Myanmar(SEAGP) 5,863.16 611.45 1,968.96 1,383.67 585.29
Tamba B.V. 28,500.32 7,171.50 3,269.50 13.44 3,256.06
AFPC, Syria 60.46 2.70 0.38 3,744.80 (3,744.42)
Block SS-04, Bangladesh 13.07 4.62 - 40.40 (40.40)
Block SS-09, Bangladesh 12.71 4.62 - 31.49 (31.49)
Sudan Pipeline, OVL's Share (90%) 3.47 2,147.95 11.95 118.07 (106.12)
B. Audited as of 31 December, 2014
Sakhalin 1 Russia 1,98,723.54 73,382.12 63,959.95 39,744.86 24,215.09
Block RC-8, Colombia 0.54 10.51 0.01 (481.30) 481.31
Block RC-10, Colombia 0.33 - 0.03 (570.51) 570.54
Block RC-9, Colombia 0.24 (0.04) 0.15 93.92 (93.77)
CPO 5 Block, Colombia 1,691.78 - 0.37 (563.85) 564.22
C. Unaudited
Block A-1, Myanmar 15,166.97 2,712.11 6,510.03 2,666.58 3,843.45
Block A-3, Myanmar 4,072.13 159.41 2,032.41 1,062.48 969.93
SHWE Of fshore Pipeline Myanmar 1,811.01 25.01 1,591.81 478.95 1,112.86
Block XXIV, Syria 181.05 528.47 - 19.74 (19.74)
Block SSJN-7, Colombia - 15.49 0.31 109.27 (108.96)
Block Area 1, Mozambique 1,64,272.22 581.49 - 790.20 (790.20)
Block 5A, South Sudan 10,103.68 263.08 - 583.48 (583.48)
Satpayev Block, Kazakhstan 4,893.74 65.18 - 903.55 (903.55)
ACG, Azerbaijan 52,701.79 6,245.16 10,257.08 11,538.43 (1,281.35)
Grand Total 6,73,075.86 2,40,777.21 1,85,839.73 1,17,169.03 68,670.71
Profit/(-)
before Tax

Annual Report 2014-15
Consolidated Financial Statement
348
*Represents expenditure as per joint venture statement. In the accounts of the Company, the amount is reflected af ter net ting of f as per the Accounting Standard (AS) 27 viz. Financial Reporting of interests in Joint Ventures. ** Excludes signature bonus paid by Subsidiary and classified under capital work-in-progress
43.5.1 The OVL’s share of The Company’s share of assets, liabilities, income and expenses has been converted into the reporting currency at the average exchange rate over the period for which the details are provided by the Operators. Generally the details are provided by the operators on monthly basis except in respect of Sakhalin-1, Russia, where the details are provided by the Operator on quarterly basis.
43.5.2 Block 5A, Blocks 1,2 &4 in Republic of South SudanONGC Videsh has 24.125% participating interest in Block 5A, South Sudan. The project is jointly operated by the partners Petronas Carigali Nile Ltd, ONGC Videsh Limited and Nilepet, the national oil company of South Sudan.In view of security situation due to internal conflict in the country all petroleum operation in Block 5A is temporarily shut down from 22nd December 2013. However, recently ceasefire agreement has been signed by the warring parties and the negotiations are in progress under the mediation of African Union and Inter Government Authorities on Development (IGAD). All actions are taken by the partners to resume production swif tly on security clearance by the host government.
43.5.3 AFPC, SyriaONGC Nile Ganga BV (ONGBV) and Fulin Investments Sarl, a subsidiary of China National Petroleum Company International (CNPCI), hold 50% shareholding each in the Dutch joint venture company, Himalaya Energy Syria B.V. (HESBV). HESBV in turn through three German entities viz. HES Ash Sham GmbH, HES Deir Ez Zor GmbH and HES Gas Syria GmbH holds 33.33% to 37.5% Participating Interest (PI) in four Production
Sharing Contracts (PSCs) in Syria. The Syria business for the above PSC of ONGBV is structured as separate class of business (Class C). Ef fective 1st December 2011, Al Furat Petroleum Company (AFPC) an Operating Company jointly held by the Syria Shell Petroleum Development B.V. (SSPD) a company acting as an operator for the Contractor and HESBV (collectively the Contractor) and General Petroleum Company (GPC), Syria, which represents Government of Syria in the Operating Company, were included in the list of sanctioned enterprises by the European Union (EU) as part of the strengthening of the sanctions on Syria. Due to the sanctions, HESBV, as an EU company, has been forbidden to directly or indirectly make funds or resources available to or for the benefit of AFPC and GPC.On the 16th May 2012, the Syrian court (the 1st degree cour t) ruled in favour of “single management”, provided that Contractor will be kept informed of all transactions. In addition the court considered that Contractor’s share of profits should be set aside in a separate bank account. AFPC Chairman appealed for three motives (i) to challenge the above two cour t-determined measures that allows Contractor to monitor the Chairman's powers; (ii) to exercise all powers required for running AFPC and solely operate the bank accounts; and (iii) to challenge the requirement to set aside profits. On 28th of November, 2012, the Court of appeal in Syrian Court rejected the appeal of the Chairman. As a result, the first degree court judgment became final.An impairment provision of `3,741.69 million has been made in respect of AFPC, Syria in view of the prevailing geo-political situation in the country and uncertainty about resumption of production.
43.6 Jointly Controlled Entities:43.6.1 Group ownership interests in Jointly Controlled
Entities are as mentioned in Note 3.B.43.6.2 The Group’s share in assets, liabilities, income,
expenses, contingent liabilities and capital commitments of Jointly Controlled Entities:
Particulars As at 31.03.2015 As at 31.03.2014i) Assets
Fixed Assets 135,029.84 136,977.47Other Non Current Asset 12,915.11 19,929.43Deferred Tax Assets 548.63 256.91 Current Asset 12,507.61 15,196.41
ii) Liabilities Long Term Borrowings 100,767.71 112,760.66Other Non Current liabilities and provisions 7,007.21 7,431.17Deferred Tax Liability 1,605.53 896.72 Current liabilities and provisions 30,966.17 28,271.87
iii) Income 64,299.22 52,520.52iv) Expenses 66,169.29 50,824.14v) Contingent liabilities 13,217.04 8,868.61
vi) Capital commitments 12,156.07 18,372.56
(` in million)

Consolidated Financial Statement
349
44 Disclosure under Accounting Standard – 28 and Guidance note on Accounting for Oil and gas producing Activities (Revised) on “Impairment of Assets”
44.1 The Company is engaged mainly in the business of oil and gas exploration and production in On-shore and Of fshore. In case of onshore assets, the f ie lds ar e us ing common pr oduct ion/ transpor tation facilities and are suf ficiently economically interdependent to constitute a single cash generating unit (CGU). Accordingly, impairment test of all onshore fields are performed in aggregate of all those fields at the Asset Level. In case of Of fshore Assets, a field is generally considered as CGU except for fields which are developed as a Cluster, for which common facilities are used, in which case the impairment testing is performed in aggregate for all the fields included in the cluster.
44.2 The Value in Use of producing/developing CGUs is determined under a multi-stage approach, wherein future cash flows are initially estimated based on Proved Developed Reserves. Under circumstances where the further development of the fields in the CGUs is under progress and where the carrying value of the CGUs is not likely to be recovered through exploitation of proved developed reserves alone, the Proved and probable reserves (2P) of the CGUs are also taken for the purpose of estimating future cash flows. In such cases, full estimate of the expected cost of evaluation/development is also considered while determining the value in use.
44.3 In assessing value in use, the estimated future cash flows from the continuing use of the assets and from its disposal at the end of its useful life are discounted to their present value. The present values of cash flows are determined by applying discount rates of 19.71% (previous year 19.10 %) for Rupee transactions and 13.89% (previous year 13.00 %) for crude oil and value added products revenue, which are measured in USD. Future cash inflows from sale of crude oil and value added products are computed using the future prices, on the basis of market-based average prices of the Dated Brent crude oil as per assessment by ‘Plat t’s Crude Oil Market wire’ and its co-relations with benchmark crudes and other petroleum products. Future cash flows from sale of natural gas is also computed based on the expected future prices on the basis of the notification issued by the Government of India and discounted applying the rate applicable to the cash flows measured in USD in view of the new pricing guidelines issued by GoI.
44.4 During the year `2,136.53 million (Previous Year`1,025.48 million) is provided as impairment loss. Out of this, an amount of 380.89 million (Previous Year `355.97million)has been provided as additional impairment in respect of onshore CGUs – Jodhpur and Silchar. `146.40 million(Previous Year ` 69.05 million) has been provided for already impaired of fshore CGU- Ratna. For B 121 an amount of `49.73 million (Previous Year`20.09 million) has been provided as additional impairment. In addition, `367.91 million (Previous Year ` 30.42 million) pertaining to block CY-OS-90/1 (PY-3) has been provided as presently the field does not have any potential to produce. An amount of 1,025.81 million (Previous Year 79.40 million) mainly represents additional impairment charge in respect of certain onshore Pre- NELP joint venture blocks (RJ ON 6, CB ON 2 and CB ON 3) due to adjustment of cost recovery from revenue and sharing of 100% royalty. Balance amount of 73.38 million, 91.14 million (previous year `15.90 million) and `1.27 million has been provided for Ankleswar, Hazira Plant and Retail Trading respectively.
44.5 Further, ` 201.88 million (Previous Year `806.08 million impairment losses has been reversed because of decrease in Abandonment cost estimation in respect Offshore CGU D-18 and Tapti.
44.6 Impairment testing of assets under exploratory phase (Exploratory Wells in Progress) has been carried out as on 31.03.2015, and an amount of`1,172.15 million (Previous year 2,546.46 million) has been provided during the year 2014-15 as impairment loss. Fur ther, `1,203.24 million (Previous Year Nil) impairment loss has been reversed in the Statement of Profit and Loss as exploratory phase assets have been transferred to producing properties.
44.7 The following 2P reserves for the respective CGU considered as a basis for the impairment assessment:-
Name of the CGU Quantity of Reservesused for Impairment
Assessment (in MMT)
G1-GS 15 4.12
Jodhpur Onshore Asset 2.09
Silchar Onshore Asset 1.20
RJ-ON-06 (Pre NELPPSC Block) 1.05
CB-ON-02 (Pre NELPPSC Block) 0.09
Cluster B-193 9.12
Cluster B-22 5.42

Annual Report 2014-15
Consolidated Financial Statement
350
44.8 The subsidiary Company, OVL has assessed indicators for impairment and carried out impairment test in respect of Cash Generating Units (CGUs) based on value in use method as on 31st March, 2015 where indicators were observed. However, no impairment in any of the CGU, except AFPC, Syria, was required since the value in use of the CGU’s is higher than their respective carrying value. In respect of the projects Imperial Energy Russia, GPOC South Sudan, Block 5A South Sudan, BC-10 Brazil, San Cristobal Venezuela, MECL Colombia, GNPOC Sudan, Carabobo Venezuela, ACG Azerbaijan and Sakhalin Russia, operations are carried out with common production and transportation facilities, catering the various fields in the project which are suf ficiently economically interdependent and hence constitute a single cash generating unit for the purposes of Accounting Standard 28 (AS-28) -Impairment of Assets and impairment test is performed in aggregate for all the fields in the respective project.
Due to the ongoing political turmoil in Syria, the Company has made a provision for impairment of the net carrying value amounting to USD 61.18 Mn (` 3,741.69 Mn) in respect of the project AFPC,
Syria. There is no impairment in any other CGUs based on impairment test carried out by the said Company.
The following 2P reserves for the respective CGU considered as a basis for the impairment assessment:-
Projects (CGU) Proved and
Probable
Reserves
(MMT)
BC -10, Brazil 9.988
San Cristobal, Venezuela 9.808
MECL, Colombia 4.429
Block 5A, South Sudan 6.308
GNPOC, Sudan 9.726
GPOC, South Sudan 6.366
Carabobo, Venezuela 7.620
Sakhalin-I, Russia 106.647
ACG, Azerbaijan 16.770
Imperial Energy, Russia 103.457
44.9 The subsidiary Company, OVL acquired Imperial Energy during 2008-09. A provision for impairment of 19,786.86 million was made in financial year 2011-12 on the basis of Impairment test. The Carrying value of the CGU Imperial Energy, Russia as on 31st March 2015 is 71,297.72 million. The Company carries out impairment test on annual basis based on the latest information available in respect of production profile, capex etc.Imperial Energy has undertaken to test new technology with a view to augment the recovery of oil and gas reserves, the preliminary results of which are encouraging.The Company has carried out impairment test during the year based upon the existing technology. As per the impairment test conducted by the Company, Value in Use exceeded Carrying Value of assets indicating no impairment for the year.
`
Particulars
45 Disclosure under Accounting Standard - 29 on "Provisions, Contingent Liabilities and Contingent Assets":Movement in Provisions - Abandonment liability & others.
For Court cases, arbitration and others, where the timing of expected out flows is upon set tlement of the proceedings and in case of provision for abandonment expected out flow af ter end of :
(` in million)
Provision for Abandonment Others
2014-15 2013-14 2014-15 2013-14
Opening Balance 274,690.42 207,692.12 3,288.95 1828.77
Add: Provision made during the year 27,999.86 69,351.54 1,184.59 1,490.43
Less: Provision writ ten back/reclassified/
reduction during the year 4,080.74 2,353.23 121.58 30.25
Closing Balance 298,609.54 274,690.42 4,351.96 3,288.95

Consolidated Financial Statement
351
46 Disclosures under Schedule III to the Companies Act, 2013:
46.1 Capital Commitment not provided for:-
46.1.1 Estimated amount of contracts remaining to be executed on capital account:-
i. In respect of Company - 266,494.43 million (Previous year 260,496.14 million).
ii In respect of Joint Ventures - 3842.99 million (Previous year 27,708.70 million).
46.1.2 Estimated amount of Minimum Work Programme (MWP) commit ted under various ‘Production Sharing Contracts’:-
i) In respect Nominated Blocks Nil (Previous year 441.59 million).
ii) In respect of NELP blocks in which the Company has 100% participating interest – 3,000.14 million (Previousyear 9,600.47 million).
iii) In respect of NELP blocks in Joint Ventures, company’s share - 32,705.26 million (Previous year62,247.39 million).
`
` `
`
``
``
Sl. Particulars As at As atst stNo. 31 March, 2015 31 March, 2014
I) in respect of Group & Joint Venture Entities: i. Income tax matters 92,708.08 63,951.09ii. Excise Duty matters 8,888.13 9,702.14iii. Custom Duty matters 1,044.01 2,319.33vi. Royalty 117,738.83 117,301.90v. Cess 6.57 6.57vi. Sales Tax 24,809.39 46,118.72vii. Octroi 205.52 68.54viii. AP Mineral Bearing Land (Infrastructure) Cess 2,371.76 2,211.27ix Specified Land Tax (Assam) 3,863.05 3,528.89x. Claims of contractors in Arbitration/Court. 74,424.80 55,814.99xi. In respect of other matters 83,109.13 73,906.78xii. Service Tax 59,289.55 53,768.09xiii. EPF 66.35 66.35
Sub Total (I) 468,525.17 428,764.66II) in respect of unincorporated Joint Ventures :
i. Income tax matters 8.91 8.91ii. Excise Duty matters 4.17 4.17iii. Custom Duty matters 1,473.86 3,798.73iv. Cess - -v. Sales Tax 2,649.82 2,649.81vi. Claim of GoI for additional profit petroleum 4,935.93 4,732.63vii. Claims of contractors in Arbitration/Court 420.97 363.31viii. Service Tax 230.02 230.02ix. in respect of other matters 888.99 854.74
Sub Total (II) 10,612.67 12,642.32Total (I+II) 479,137.48 441,406.98
(` in million)
46.2 Contingent Liabilities:
Claims against the Company/ disputed demands not acknowledged as debt:-

Annual Report 2014-15
Consolidated Financial Statement
352
46.2.1 The Group’s pending litigations comprise of claims against the and proceedings pending with Tax/Statutory/Government Authorities. The has reviewed all its pending litigations and proceedings and has made adequate provisions, wherever required and disclosed the contingent liabilities, wherever applicable, in its financial statements. The does not expect the outcome of these proceedings to have a material impact on its financial position. Future cash out flows in respect of the above are determinable only on receipt of judgments/decisions pending with various forums/authorities.
46.2.2 Apart from above Group share of contingent liabilities in respect of Associates company PHL is of 198.30 million (previous year 185.16 million) .
46.2.3 In addition, in respect of the subsidiary company, OVL, liability for payment to contractual workers for regularization of their services is pending with labor court under civil suit. The amount of liability is not ascertainable.
46.2.4 In respect of subsidiary company OVL, all known contingent liabilities have been indicated. The contingent liabilities, if any, in respect of joint ventures, where the Company is the non-operator are not ascertainable except Sakhalin-1 where the Operator has intimated that the status of contingent liability is Nil.
46.2.5 In terms of the statutory provisions of Oilfields (Regulation and Development) Act, 1948 (ORDA), Petroleum & Natural Gas (PNG) Rules 1959 and Notifications issued thereunder; the Company is liable to pay royalty to Central Government (GoI) and State Governments, on production of Crude Oil and Natural Gas from of fshore fields and onshore fields, respectively. Since 2008-09, the Company has been paying royalty on crude oil at realized price which is net of under-recovery of the OMCs shared by the Company as per GoI directives. On an application filed by the State of Gujarat, the Hon’ble High Court of Gujarat in its order dated 30.11.2013 has directed the Company to pay the short fall of royalty on crude oil produced from the onshore fields in the State of Gujarat on pre-discount prices from 01.04.2008 onwards. Based on the Special Leave Petition filed by the Company against the said order of the Hon’ble High Court of Gujarat, pending further orders, Hon’ble Supreme Court vide order dated 13.02.2014 stayed the operation of the impugned judgment subject to the condition that the company pays royalty to the State of Gujarat on pre-discounted price of crude oil w.e.f. 01.02.2014 onwards. Accordingly, dif ferential amount of117,242 million (reduced to the extent 16,440
million which is paid to Gujarat Govt.- refer Note No. 32.4) on this account for the period from April, 2008 to March, 2015 ( 116,326.96 million as on
GroupGroup
Group
`
` `
`
31.03.2014) has been considered as Contingent Liability. Pending the final outcome of the SLP filed before the Hon’ble Supreme Court, dif ferential royalty (royalty on pre-discount price minus royalty on post-discount price) amounting to 21,067.60 million deposited w.e.f. February, 2014 ( 2,092.23 million as on 31.03.2014) in terms of Hon’ble Supreme Court order has been shown as deposit.
46.2.6 In respect of joint venture company, Petronet MHB Limited, there are 128 cases (previous year 127 cases) regarding enhancement of land compensation pending with Karnataka High Court against Order of Principal Judge Bangalore Rural District Court. All cases filed by landowner at various stage of proceedings and hence no provision is envisaged.
46.2.7 In respect of joint venture company, Petronet MHB Limited, party “Petronet India Ltd (PIL)” has initiated Arbitration proceedings for recovery of their Operationalization Fees of 11.30 million (Group share 3.25 million). The company has contested the liability on this account.
46.2.8 In respect of joint venture company, Mangalore SEZ Limited, is in possession of 2.47 acres of land in exchange for equivalent quantum of forest land from the Govt of Karnatka, Forest Department, vide
thagreement dated 7 December, 2011 on lease for period of 20 years. A sum of 1.14 million has been paid towards compensatory af forestation to MoEF as per their demand and included in development of land. The MoEF has revised the fair value of af forestation already fixed by it which is being contested by the state govt before supreme court for its decision. As the amount in respect of dif ferential value, if any which the company has agreed to pay to KIADB is not determinable, no provision could be made by the company.
46.2.9 Performance Guarantees executed under the contracts:
i. The Company has given an undertaking to State bank of India (SBI), for an additional funding up to 2,223.50 million (previous year 2,234.00 million) in respect of joint venture company “ONGC Tripura Power Co. Limited (OTPC)” for cost overrun, if any.
ii. The Company has given a Performance Guarantee on behalf of Petro Carabobo Ganga B.V. to Government of Venezuela in respect of Carabobo 1 Project. The total investment commitment is estimated at USD 1,154.75 Million (Previous Year USD 1,333.00 Million). The Company is confident that Petro Carabobo Ganga B.V. will be able to honor its obligations. The outstanding guarantee obligation of the OVL was 72,333.54 Million as at 31st March, 2015 (previous year
80,059.98 Million) The Company is confident that Petro Carabobo Ganga B.V.
``
``
`
``
`
`

Consolidated Financial Statement
353
will be able to honor its obligations.
iii. ONGBV has given counter guarantee to the State Bank of India for the issue of performance bonds in favour of Nigerian National Petroleum Corporation, on behalf of ONGC Mit tal Energy Limited, with a ma ximum of 51% of the guaranteed amounts. The outstanding guarantee obligation of the company was USD 76.50 million (Previous year USD 76.50 million). The outstanding guarantee obligation of the company was 4,791.96 Million (USD 76.50 million) (previous year 4,594.59 Million (USD 76.50 million) as at 31.03.2015.
iv. The subsidiary Company, OVL has issued Per formance Guarantee in respect of
``
concessionary contract for Block BC-10, Brazil and Blocks BM-S-73 and BM-ES-42 on behalf of ONGC Campos Ltda (OCL). The Company is confident that OCL will be able to honor its obligations.
v. The subsidiary Company, OVL has given per formance guarantee to ANP, the regulatory authority in Brazil, favoring ONGC Campos Ltda (OCL) for BC-10 Project where OCL has a 27% participating interest (previous year 15% PI) and Shell Brazil is the operator.
46.3 Additional disclosure on Consolidated Financial Statements under schedule-III of Companies Act, 2013
An onshore drilling rig in Karaikal; ONGC has produced 1,743 million metric tonnes of oil equivalent so far; drilled 4738 oil wells and 607 gas wells in Onshore;

Annual Report 2014-15
Consolidated Financial Statement
354
46.3
A
dd
itio
nal d
isclo
su
re o
n C
on
so
lid
ate
d F
inan
cia
l S
tate
me
nts
un
de
r S
ch
ed
ule
-III
o
f C
om
pan
ies A
ct,
2013.
AP
aren
t :-
A.1
ON
GC
Lim
ited
Indi
a 7
0.81
1,2
98,9
54.2
7 1
01.4
8 1
79,6
47.3
8 6
9.21
1
,211
,604
.71
80.
60
214
,931
.67
BS
ubsi
diar
ies
B.1
Indi
anB
.1.1
ON
GC
Vid
esh
Lim
ited
Indi
a 1
4.49
265
,891
.89
12.
77
22,
601.
28
14.
24
249
,305
.00
13.
37
35,
657.
60B
.1.2
Man
galo
re R
efin
ery
and
Pet
roch
emic
als
Ltd.
(M
RP
L)In
dia
2.4
6 4
5,09
9.36
(
7.31
) (
12,9
34.6
1) 4
.05
70,
897.
92
1.6
3 4
,342
.21
B.1
.3O
NG
C M
anga
lore
Pet
roch
emic
als
Ltd.
(O
MP
L)In
dia
0.3
7 6
,851
.33
(0.
29)
(51
6.00
) -
-
-
-
B.2
For
eign
B.2
.1O
NG
C N
ile G
anga
B.V
. (A
& B
Cla
ss)
The
Net
herla
nds
3.4
6 6
3,47
5.28
(
3.58
) (
6,33
2.47
) 3
.15
55,
104.
13
2.4
8 6
,625
.28
B.2
.2O
NG
C C
ampo
s Lt
da.
Bra
zil
0.1
0 1
,851
.25
2.2
2 3
,927
.72
0.7
1 1
2,44
7.11
0
.02
60.
50B
.2.3
ON
GC
Nile
Gan
ga (
Cyp
rus)
Lim
ited
C
ypru
s 0
.51
9,4
28.8
2 0
.03
59.
88
0.5
1 8
,981
.64
0.0
9 2
39.2
8 B
.2.4
ON
GC
Nile
Gan
ga (
San
Cris
toba
l) B
.V.
The
Net
herla
nds
1.6
7 3
0,54
4.63
(
2.71
) (
4,78
9.43
) 1
.67
29,
265.
19
(0.
78)
(2,
081.
76)
B.2
.5O
NG
C S
atpa
yev
E&P
B.V
.Th
e N
ethe
rland
s-
0.0
1 -
(0.
25)
- 0
.25
- (
0.25
)B
.2.6
ON
GC
Cas
pian
E&
P B
.V.
The
Net
herla
nds
0.4
5 8
,204
.87
0.5
0 8
77.4
4 0
.44
7,6
18.8
4 (
0.70
) (
1,85
8.80
)B
.2.7
ON
GC
Nile
Gan
ga B
.V.
C C
lass
The
Net
herla
nds
(0.
11)
(1,
948.
33)
(2.
07)
(3,
661.
25)
0.0
9 1
,513
.72
(0.
13)
(35
8.79
)B
.2.8
ON
GC
Nar
mad
a Li
mit
edN
iger
ia 0
.01
94.
57
-
-
0.0
1 9
0.68
-
(1.
59)
B.2
.9O
NG
C A
ma
zon
Ala
knan
da L
imit
edB
erm
uda
1.4
1 2
5,82
5.66
(
0.33
) (
578.
87)
1.4
4 2
5,21
3.81
1
.03
2,7
36.5
7 B
.2.1
0Im
peria
l Ene
rgy
Lim
ited
Cyp
rus
(3.
03)
(55
,587
.95)
(0.
45)
(78
8.02
) (
2.91
) (
50,9
04.3
8) (
0.50
) (
1,32
6.07
)B
.2.1
1Im
peria
l Ene
rgy
Tom
sk L
imit
edC
ypru
s 0
.01
184
.73
- (
0.52
) 0
.01
202
.83
- (
1.86
)B
.2.1
2Im
peria
l Ene
rgy
(Cyp
rus)
Lim
ited
Cyp
rus
0.2
3 4
,147
.60
- (
0.62
) 0
.26
4,5
50.4
0 -
(1.
66)
B.2
.13
Impe
rial E
nerg
y N
ord
Lim
ited
Cyp
rus
0.9
4 1
7,21
8.48
-
(0.
29)
1.0
8 1
8,88
9.92
-
1.2
8 B
.2.1
4R
K Im
peria
l Ene
rgy
(Kos
tana
i) L
imit
edC
ypru
s -
-
-
-
-
-
-
-
B
.2.1
5Fr
eshs
prin
g In
vest
men
ts L
imit
edC
ypru
s -
-
-
-
-
-
-
-
B
.2.1
6N
efsi
lius
Hol
ding
s Li
mit
edC
ypru
s -
-
-
-
-
-
-
-
B
.2.1
7B
ianc
us H
oldi
ngs
Lim
ited
Cyp
rus
0.0
2 2
81.5
2 (
0.01
) (
20.5
5) 0
.02
315
.08
(0.
01)
(27
.41)
B.2
.18
Red
clif
fe H
oldi
ngs
Lim
ited
Cyp
rus
0.0
6 1
,018
.33
- (
0.81
) 0
.06
1,1
17.4
3 -
(1.
53)
B.2
.19
Impe
rial E
nerg
y G
as L
imit
edC
ypru
s -
-
-
-
-
-
-
-
B
.2.2
0Im
peria
l Fra
c S
ervi
ces
(Cyp
rus)
Lim
ited
Cyp
rus
- 2
.17
- (
4.12
)-
3.6
4 0
.01
23.
10
B.2
.21
San
Agi
o In
vest
men
ts L
imit
edC
ypru
s-
10.
42
(0.
03)
(56
.46)
- 2
8.50
(
0.01
) (
15.4
3)B
.2.2
2LL
C S
ibin
tern
eft
Rus
sia
(0.
02)
(38
6.82
) (
0.03
) (
55.7
2) (
0.02
) (
416.
71)
(0.
05)
(12
3.54
)B
.2.2
3 L
LC A
llian
cene
fteg
az
Rus
sia
(0.
08)
(1,
550.
66)
(0.
57)
(1,
017.
04)
(0.
05)
(89
0.11
) (
0.79
) (
2,10
1.25
)B
.2.2
4LL
C N
ord
Impe
rial
Rus
sia
0.1
9 3
,555
.76
(0.
48)
(85
3.01
) 0
.38
6,5
68.1
7 (
0.19
) (
501.
86)
B.2
.25
LLC
Impe
rial T
rans
ser
vice
Rus
sia
-
-
-
-
-
-
-
-
B.2
.26
LLC
Rus
Impe
rial G
roup
Rus
sia
- (
61.1
7) (
0.05
) (
86.4
2) 0
.01
146
.02
(0.
19)
(51
3.14
)B
.2.2
7LL
C S
trat
umR
ussi
a -
-
-
-
-
-
-
-
As
% o
fC
onso
lidat
edN
et A
sset
s
As
% o
fC
onso
lidat
edN
et A
sset
s
As
% o
fC
onso
lidat
edpr
ofit
or
loss
As %
of
Cons
olid
ated
prof
it or
loss
Am
ount
Am
ount
Am
ount
Am
ount
Net
Ass
et (
i.e. T
otal
Ass
etm
inus
Tot
al L
iabi
litie
s)as
on
31st
Mar
ch, 2
015
Net
Ass
et (
i.e. T
otal
Ass
etm
inus
Tot
al L
iabi
litie
s)as
on
31st
Mar
ch, 2
014
Sha
re in
Pro
fit
of lo
ss A
ccou
ntfo
r th
e fi
nanc
ial y
ear
ende
d31
st M
arch
, 201
5
Sha
re in
Pro
fit
of lo
ss A
ccou
ntfo
r th
e fi
nanc
ial y
ear
ende
d31
st M
arch
, 201
4
S N
o.N
ame
of t
he e
ntit
yC
ount
ry o
fin
corp
orat
ion
(` in
millio
n)

Consolidated Financial Statement
355
B.2
.28
LLC
Impe
rial F
rac
Ser
vice
sR
ussi
a-
51.
32
0.0
1 1
3.55
0
.01
91.
63
0.0
5 1
41.5
0 B
.2.2
9C
arab
obo
One
AB
Sw
eden
(0.
58)
(10
,721
.97)
- (
0.92
) (
0.52
) (
9,18
4.03
)-
10.
08
B.2
.30
Pet
ro C
arab
obo
Gan
ga B
.V.
The
Net
herla
nds
0.6
0 1
1,07
6.45
(
0.06
) (
105.
01)
0.5
5 9
,708
.01
(0.
03)
(74
.51)
B.2
.31
ON
GC
BTC
Ltd
Cay
man
Isla
nds
0.0
7 1
,357
.74
0.2
9 5
12.2
3 0
.05
823
.74
0.2
0 5
41.0
3 B
.2.3
2B
eas
Rov
uma
Ener
gy M
ozam
biqu
e Li
mit
edB
ritis
h V
irgi
n is
land
1.0
7 1
9,70
3.95
(
0.49
) (
861.
47)
0.4
7 8
,230
.62
(0.
01)
(29
.00)
B.2
.33
ON
GC
Vid
esh
Rov
uma
Ltd.
Rep
ublic
of
Mau
ritiu
s-
0.0
9 -
(0.
34)
-
-
- -
B
.2.3
4O
NG
C V
ides
h A
tlant
ic In
c.Te
xas
-
0.7
1 -
(0.
72)
-
-
-
-
CM
inor
ity
Inte
rest
in a
ll su
bsid
iari
es 1
.35
24,
731.
33
(3.
56)
(6,
302.
55)
1.6
6 2
9,11
9.98
0
.59
1,5
83.0
2 D
Ass
ocia
tes
D.1
Indi
an
D.1
.1P
awan
Han
s Lt
d. (
PH
L)In
dia
0.1
3 2
,454
.69
0.1
7 3
03.1
0 0
.13
2,1
89.3
9 0
.04
118
.15
EJo
int
vent
ures
Ent
itie
sE.
1In
dian
E.1.
1P
etro
net L
NG
Lim
ited
(P
LL)
Indi
a 0
.39
7,1
10.8
0 0
.62
1,1
03.1
5 0
.36
6,2
32.6
5 0
.33
889
.90
E.1.
2P
etro
net M
HB
Ltd
(P
MH
BL)
In
dia
0.0
8 1
,489
.77
0.0
6 9
8.06
0
.08
1,3
91.7
2 0
.04
110
.44
E.1.
3M
anga
lore
SEZ
Ltd
(M
SEZ
) (n
ote
3.1)
Indi
a 0
.01
208
.85
- (
4.84
) 0
.01
210
.82
0.0
2 4
3.13
E.
1.4
ON
GC
Man
galo
re P
etro
chem
ical
s Lt
d.(O
MP
L) (
note
3.2
)nd
ia -
-
(
2.21
) (
3,91
5.10
) -
3
6.37
-
(2.
26)
E.1.
5O
NG
C P
etro
Add
itio
ns L
td. (
OP
aL)
Indi
a 0
.54
9,9
72.9
0 -
(3.
82)
0.5
7 9
,976
.72
- (
1.79
)E.
1.6
ON
GC
Trip
ura
Pow
er C
ompa
ny L
td. (
OTP
C)
Indi
a 0
.17
3,1
44.2
5 0
.21
364
.04
0.1
6 2
,801
.39
0.0
2 4
8.88
E.
1.7
ON
GC
Ter
i Bio
tech
Ltd
. (O
TBL)
Indi
a 0
.01
103
.77
0.0
1 2
2.56
-
81.
25
0.0
1 2
2.44
E.
1.8
Dah
ej S
EZ L
imit
ed (
DS
EZ)
Indi
a 0
.04
676
.79
0.0
5 9
0.38
0
.03
604
.17
0.0
4 1
09.3
8 E.
1.9
She
ll M
RP
L A
viat
ion
Fuel
s &
Ser
vice
s P
vt
Li
mit
ed (
SM
AS
L)(t
hrou
gh M
RP
L)In
dia
0.0
2 3
56.3
3 0
.02
38.
69
-
-
-
-
E.1.
10M
anga
lam
Ret
ail S
ervi
ces
Lim
ited
(M
RS
L(t
hrou
gh M
RP
L)In
dia
- 0
.57
-
-
-
-
-
-
E.1.
11N
orth
Eas
t Tra
nsm
issi
on C
ompa
ny L
td.
(NET
C)
(thr
ough
OTP
C)
Indi
a -
-
-
-
-
-
-
-
E.
1.12
Man
galo
re S
TP L
imit
ed (
thro
ugh
MS
EZ)
Indi
a -
-
-
-
-
-
-
-
E.
2F
orei
gnE.
2.1
ON
GC
Mit
tal E
nerg
y Li
mit
edC
ypru
s (
0.47
) (
8,55
3.56
) (
0.02
) (
41.1
5) (
0.47
) (
8,16
0.84
) (
0.06
) (
161.
78)
E.2.
2P
etro
Car
abob
o S
.A.
Ven
ezue
la 0
.13
2,3
11.1
8 1
.24
2,1
91.2
8 0
.00
64.
06
0.0
2 5
9.69
E.
2.3
Car
abob
o In
geni
ería
y C
onst
rucc
ione
s, S
.A.
Ven
ezue
la-
0.3
0 -
0.0
2 -
0.2
7 -
0.0
2 E.
2.4
Pet
role
ra In
dove
nezo
lana
S.A
.V
enez
uela
1.1
3 2
0,74
8.07
3
.04
5,3
75.3
6 1
.32
23,
068.
92
2.2
7 6
,049
.03
E.2.
5S
outh
-Eas
t Asi
a G
as P
ipel
ine
Com
pany
Lim
ited
Hon
gkon
g 0
.15
2,6
93.0
6 0
.02
38.
98
0.1
5 2
,543
.86
(0.
06)
(16
4.42
)E.
2.6
Tam
ba B
.V.
The
Net
herla
nds
1.2
2 2
2,40
0.55
1
.53
2,6
99.9
3 1
.09
19,
150.
80
0.6
2 1
,652
.87
Tota
l 1
00.0
0 1
,834
,423
.97
100
.00
177
,032
.65
100
.00
1,7
50,6
35.2
9 1
00.0
0 2
66,6
48.3
5
As
% o
fC
onso
lidat
edN
et A
sset
s
As
% o
fC
onso
lidat
edN
et A
sset
s
As
% o
fC
onso
lidat
edpr
ofit
or
loss
As %
of
Cons
olid
ated
prof
it or
loss
Am
ount
Am
ount
Am
ount
Am
ount
Net
Ass
et (
i.e. T
otal
Ass
etm
inus
Tot
al L
iabi
litie
s)as
on
31st
Mar
ch, 2
015
Net
Ass
et (
i.e. T
otal
Ass
etm
inus
Tot
al L
iabi
litie
s)as
on
31st
Mar
ch, 2
014
Sha
re in
Pro
fit
of lo
ss A
ccou
ntfo
r th
e fi
nanc
ial y
ear
ende
d31
st M
arch
, 201
5
Sha
re in
Pro
fit
of lo
ss A
ccou
ntfo
r th
e fi
nanc
ial y
ear
ende
d31
st M
arch
, 201
4
S N
o.N
ame
of t
he e
ntit
yC
ount
ry o
fin
corp
orat
ion
(` in
millio
n)

Annual Report 2014-15
Consolidated Financial Statement
356
As at31.03.15
Opening 212.16 222.98 202.723 203.245 414.87 426.22
Addition 12.36 4.71 3.480 18.652 15.84 23.36
Production 16.39 15.54 18.321 19.174 34.71 34.71
Closing 208.13 212.15 187.882 202.723 396.00 414.87
Opening 189.31 190.81 150.595 155.897 339.90 346.71
Addition 9.18 7.94 2.365 0.020 11.55 7.96
Production 8.74 9.44 4.909 5.321 13.65 14.76
Closing 189.75 189.31 148.051 150.596 337.80 339.91
Opening 401.47 413.79 353.318 359.142 754.78 772.93
Addition 21.54 12.65 5.845 18.671 27.39 31.33
Production 25.13 24.97 23.230 24.496 48.36 49.47
Closing 397.88 401.47 335.933 353.317 733.81 754.79
As at As at As at As at As at31.03.14 31.03.15 31.03.14 31.03.15 31.03.14
A. In India
Crude Oil(MMT)Details
Gas(Billion Cubic Meter)
Total Oil Equivalent (MMTOE)(Note 47.2.1)
Offshore
Onshore
Total in India
47 Disclosure under Guidance Note on "Accounting for Oil & Gas Producing Activities" (approved by Reserve Estimates Committee):
47.1 Company's share of Proved Reserves on the geographical basis is as under:
Seismic survey in progress; 83% of established in-place reserves (out of 10.9 BT) in the country has been discovered by ONGC.

Consolidated Financial Statement
357
As at31.03.15
Opening 9.501 9.956 - - 9.501 9.956
Addition 0.193 0.286 - - 0.193 0.286
Ded/Adj - - - - - -
Production 0.705 0.741 - - 0.705 0.741
Closing 8.988 9.501 - - 8.988 9.501
Opening 6.377 6.595 - - 6.377 6.595
Addition - - - - - -
- - - - - -
Production - 0.218 - - - 0.218
Closing 6.377 6.377 - - 6.377 6.377
Opening 5.887 5.921 - - 5.887 5.921
Addition - - - - - -
- - - - - -
Production - 0.034 - - - 0.034
Closing 5.887 5.887 - - 5.887 5.887
Opening 36.905 32.894 73.354 70.531 110.259 103.425
Addition 1.235 5.499 0.044 3.399 1.279 8.898
- - - - - -
Production 1.536 1.488 0.618 0.576 2.154 2.064
Closing 36.605 36.905 72.780 73.354 109.384 110.259
Opening 0.566 0.598 4.562 6.414 5.128 7.012
Addition - - - - - -
0.001 - - 0.001 0.001 0.001
Production 0.030 0.032 1.774 1.851 1.804 1.883
Closing 0.535 0.566 2.789 4.562 3.324 5.128
Opening 2.581 2.581 - - 2.581 2.581
Addition - - - - - -
- - - - - -
Production - - - - - -
Closing 2.581 2.581 - - 2.581 2.581
Opening 7.741 4.717 0.656 0.334 8.397 5.051
Addition 2.152 3.342 0.049 0.335 2.200 3.677
- - - - - -
Production 0.812 0.318 0.042 0.013 0.854 0.331
Closing 9.081 7.741 0.663 0.656 9.744 8.397
Opening 3.483 3.453 - - 3.483 3.453
Addition 0.491 0.626 - - 0.491 0.626
- (0.001) - - - (0.001)
Production 0.618 0.597 - - 0.618 0.597
Closing 3.355 3.483 - - 3.355 3.483
As at As at As at As at As at31.03.14 31.03.15 31.03.14 31.03.15 31.03.14
Ded/Adj
Ded/Adj
Ded/Adj
Ded/Adj
Ded/Adj
Ded/Adj
Ded/Adj
B. Outside India
Crude Oil(MMT)
Details
Gas(Billion Cubic Meter)
Total Oil Equivalent (MMTOE)(Note 47.2.1)
GNOP,Sudan
GPOC,South Sudan
Block 5A,South Sudan
AFPC, Syria
BC-10,Brazil
MECL,Colombia
Sakhalin-1, Russia
Block 06.1, Vietnam

Annual Report 2014-15
Consolidated Financial Statement
358
As at31.03.15
As at As at As at As at As at31.03.14 31.03.15 31.03.14 31.03.15 31.03.14
Opening 14.583 14.970 4.685 4.721 19.268 19.691
Addition - - - - - -
Ded/Adj - - - - - -
Production 0.265 0.387 0.024 0.036 0.290 0.423
Closing 14.317 14.583 4.661 4.685 18.978 19.268
Opening 10.199 10.966 - - 10.199 10.966
Addition - - - - - -
Ded/Adj - - - - - -
Production 0.645 0.767 - - 0.645 0.767
Closing 9.554 10.199 - - 9.554 10.199
Opening 3.796 0.022 - - 3.796 0.022
Addition - 3.795 - - - 3.795
Ded/Adj - - - - - -
Production 0.063 0.021 - - 0.063 0.021
Closing 3.734 3.796 - - 3.734 3.796
Opening 1.803 1.803 - - 1.803 1.803
Addition - - - - - -
Ded/Adj - - - - - -
Production - - - - - -
Closing 1.803 1.803 - - 1.803 1.803
Opening - - 11.691 10.297 11.691 10.297
Addition - - - 1.595 - 1.595
Ded/Adj - - - - - -
Production - - 0.662 0.201 0.662 0.201
Closing - - 11.029 11.691 11.029 11.691
Opening 8.763 9.646 - - 8.763 9.646
Addition - - - - - -
Ded/Adj - - - - - -
Production 0.859 0.883 - - 0.859 0.883
Closing 7.904 8.763 - - 7.904 8.763
Opening 112.185 104.122 94.948 92.297 207.133 196.419
Addition 4.070 13.548 0.092 5.329 4.162 18.877
Ded/Adj 0.001 (0.001) - 0.001 0.001 -
Production 5.533 5.486 3.120 2.677 8.653 8.163
Closing 110.721 112.185 91.921 94.948 202.641 207.133
Crude Oil(MMT)
Details
Gas(Billion Cubic Meter)
Total Oil Equivalent (MMTOE)(Note 47.2.1)
IEC, Russia
PIVSA,Venezuela
Carabobo-1,Venezuela
BLOCK-XXIV, Syria
BLOCK-A1 & A3,
Myanmar
ACG,Azerbaijan
TotalOutside India

Consolidated Financial Statement
359
47 .2 Company's share of Proved Developed Reserves on the geographical basis is as under:
As at31.03.15
As at As at As at As at As at31.03.14 31.03.15 31.03.14 31.03.15 31.03.14
Opening 158.99 160.62 132.710 110.254 291.70 270.87
Addition 11.88 13.90 8.304 41.630 20.18 55.54
Production 16.39 15.53 18.321 19.174 34.71 34.71
Closing 154.48 158.99 122.693 132.710 277.17 291.70
Opening 146.60 150.81 106.984 110.010 253.58 260.81
Addition 5.99 5.18 1.853 2.225 7.84 7.41
Production 8.85 9.39 5.002 5.251 13.85 14.64
Closing 143.74 146.60 103.835 106.984 247.57 253.58
Opening 305.58 311.43 239.694 220.264 545.28 531.69
Addition 17.88 19.09 10.157 43.855 28.03 62.94
Production 25.24 24.92 23.323 24.425 48.56 49.35
Closing 298.22 305.58 226.528 239.694 524.75 545.28
A. In India
B. Outside India
Crude Oil(MMT)
Details
Gas(Billion Cubic Meter)
Total Oil Equivalent (MMTOE)(Note 47.2.1)
Offshore
Onshore
Total inIndia
Opening 2.456 2.784 - - 2.456 2.784
Addition 0.546 0.413 - - 0.546 0.413
Ded/Adj - - - - - -
Production 0.705 0.741 - - 0.705 0.741
Closing 2.297 2.456 - - 2.297 2.456
Opening 4.312 4.530 - - 4.312 4.530
Addition - - - - - -
Ded/Adj - - - - -
Production - 0.218 - - - 0.218
Closing 4.312 4.312 - - 4.312 4.312
Opening 2.565 2.599 - - 2.565 2.599
Addition - - - - - -
Ded/Adj - - - - - -
Production - 0.034 - - - 0.034
Closing 2.565 2.565 - - 2.565 2.565
Opening 11.903 13.391 10.276 10.163 22.179 23.554
Addition 2.481 - 0.033 0.689 2.514 0.689
Ded/Adj - - - - - -
Production 1.536 1.488 0.618 0.576 2.154 2.064
Closing 12.848 11.903 9.691 10.276 22.539 22.179
GNOP, Sudan
GPOC,South Sudan
Block 5A,South Sudan
Sakhalin-1,Russia

Annual Report 2014-15
Consolidated Financial Statement
360
As at
31.03.15
As at As at As at As at As at
31.03.14 31.03.15 31.03.14 31.03.15 31.03.14
Opening 0.566 0.598 4.563 6.414 5.129 7.012
Addition - - - - - -
Ded/Adj - - - - - -
Production 0.030 0.032 1.774 1.851 1.804 1.883
Closing 0.536 0.566 2.789 4.563 3.324 5.129
Opening 2.206 2.206 - - 2.206 2.206
Addition - - - - - -
Ded/Adj - - - - - -
Production - - - - - -
Closing 2.206 2.206 - - 2.206 2.206
Opening 3.324 1.626 0.244 0.137 3.568 1.763
Addition 4.271 2.016 0.247 0.120 4.518 2.136
Ded/Adj - - - - - -
Production 0.812 0.318 0.042 0.013 0.854 0.331
Closing 6.783 3.324 0.450 0.244 7.233 3.568
Opening 3.190 3.000 - - 3.190 3.000
Addition 0.442 0.787 - - 0.442 0.787
Ded/Adj - - - - - -
Production 0.618 0.597 - - 0.618 0.597
Closing 3.014 3.190 - - 3.014 3.190
Opening 4.444 4.831 1.095 1.131 5.539 5.962
Addition - - - - - -
Ded/Adj - - - - - -
Production 0.265 0.387 0.024 0.036 0.290 0.423
Closing 4.178 4.444 1.071 1.095 5.249 5.539
Opening 2.047 1.660 - - 2.047 1.660
Addition 0.880 1.154 - - 0.880 1.154
Ded/Adj - - - - - -
Production 0.645 0.767 - - 0.645 0.767
Closing 2.282 2.047 - - 2.282 2.047
Opening 0.535 0.022 - - 0.535 0.022
Addition 0.448 0.534 - - 0.448 0.534
Ded/Adj - - - - - -
Production 0.063 0.021 - - 0.063 0.021
Closing 0.920 0.535 - - 0.920 0.535
Crude Oil(MMT)Details
Gas(Billion Cubic Meter)
Total Oil Equivalent (MMTOE)(Note 47.2.1)
Block 06.1,Vietnam
AFPC,Syria
BC-10,Brazil
MECL,Colombia
IEC,Russia
PIVSA,Venezuela
Carabobo - 1,Venezuela

Consolidated Financial Statement
361
As at31.03.15
As at As at As at As at As at31.03.14 31.03.15 31.03.14 31.03.15 31.03.1
Opening 0.049 0.049 - - 0.049 0.049
Addition - - - - - -
Ded/Adj - - - - - -
Production - - - - - -
Closing 0.049 0.049 - - 0.049 0.049
Opening - - 2.614 - 2.614 -
Addition - - 3.702 2.815 3.702 2.815
Ded/Adj - - - - -
Production - - 0.662 0.201 0.662 0.201
Closing - - 5.654 2.614 5.654 2.614
Opening 3.384 4.267 - - 3.384 4.267
Addition 0.403 - - - 0.403 -
Ded/Adj - - - - - -
Production 0.859 0.883 - - 0.859 0.883
Closing 2.928 3.384 - - 2.928 3.384
Opening 40.981 41.563 18.792 17.845 59.773 59.408
Addition 9.471 4.904 3.982 3.624 13.453 8.528
Ded/Adj - - - - - -
Production 5.533 5.486 3.120 2.677 8.653 8.163
Closing 44.918 40.981 19.654 18.792 64.573 59.773
Crude Oil(MMT)
Details
Gas(Billion Cubic Meter)
Total Oil Equivalent (MMTOE)(Note 47.2.1)
BLOCK-XXIV,Syria
BLOCK-A1 & A3,
Myanmar
ACG, Azerbaijan
Total Outside India
47.2.1 MMTOE denotes “Million Metric Tone Oil Equivalent” and for calculating Oil equivalent of Gas, 1000 M3 of Gas has been taken to be equal to 1 MT of Crude Oil. Variations in totals, if any, are due to internal summation and rounding of f.
47.2.2 The year-end reserves of the company and its subsidiary, OVL have been estimated by the Reserves Estimation Commit tee (REC) which follows international reser voir engineering procedures consistently
The company and its subsidiary, OVL has adopted deterministic approach for reserves estimation and is following Society of Petroleum Engineers (SPE) – 1997 guidelines which defines reserves as “estimated volumes of crude oils, condensate, natural gas, natural gas liquids and associated substances anticipated to be commercially recoverable from known accumulations from a given date forward, under existing economic
conditions, by established operating practices, and under current Government regulations.”
Volumetric estimation is the main procedure in estimation, which uses reservoir rock and fluid properties to calculate hydrocarbons in-place and then estimate that portion which will be recovered from it. As the field gets matured with reasonably good production history is available then performance method such as material balance, simulation, decline curve analysis are applied to get more accurate assessments of reserves.
The Company uses the services of third party agencies for due diligence and it gets the reserves of its assets audited by third party periodically by internationally reputed consultants who adopt latest industry practices for their evaluation.
The annual revision of estimates is based on the yearly exploratory and development activities and results thereof. New In place Volume and Ultimate

Annual Report 2014-15
Consolidated Financial Statement
362
48 Disclosure on Foreign currency exposures at year end that have not been hedged by Company derivative instrument or otherwise are given below (refer Note 32.7 & 32.8):-
49 In respect of parent company, ONGC, discrepancies of crude oil of 96,496 MT (valued at 395.47 million as on March31, 2014) between physical and book records at Ankleshwar Asset have been ascertained by themanagement during the year and accordingly these have been writ ten of f/adjusted in inventories. Further, 70,746MT of pit oil lying in book of Ahmedabad Asset (valued at nil as on March 31, 2014) has also been writ ten of f during the year. These write of fs and consequential adjustments thereto have been made on account of over reporting of crude oil production in earlier financial years. The discrepancies as mentioned above are under investigation by the appropriate authorities.
50 The figures in respect of the company, Subsidiaries/Joint Venture Companies have been regrouped/ rearranged based upon the details obtained from the management as part of consolidation process, Audited/unaudited accounts of respective group companies. Some balances of Trade/Other Receivables, Trade/Other Payables and Loans & Advances are subject to confirmation/reconciliation. Adjustments, if any, will be accounted for on confirmation/reconciliation of the same, which will not have a material impact.
Reserves are estimated for new field discoveries or new pool discoveries in already discovered fields. Also, appraisal activities lead to revision in estimates due to new subsur face data. Similarly, reinterpretation exercise is also carried out for old fields due to necessity of revision in petro-physical
parameters, updating of static & dynamic models and performance analysis leading to change in reserves. Intervention of new technology, change in classifications and contractual provisions also necessitates revision in estimation of reserves.
Import CreditorsAED 0.27 4.61 0.29 4.78 AUD 1.07 51.11 0.64 35.70 CHF 0.11 6.82 - - EUR 12.15 821.82 14.03 1,158.49 GBP 3.58 331.68 5.86 585.30 JPY 519.05 270.48 974.24 572.86 NOK 1.28 10.01 8.61 86.31 OMR 0.04 6.33 0.04 6.07 SEK 0.03 0.22 0.03 0.28 SGD 0.38 17.51 0.44 21.07 USD 782.90 49,040.84 927.84 55,726.36 Total 50,561.44 58,197.21 Export ReceivablesUSD 197.92 12,397.94 459.78 27,614.20 MWP ProvisionUSD 175.30 10,980.66 162.71 9,772.25 Cash Call PayableUSD 1.18 74.13 0.89 53.71 Cash Call ReceivableUSD 47.78 2,992.94 81.94 4,921.32
ParticularsForeign
CurrencyForeign
Currency
As at 31st March 2015 As at 31st March 2014
Equivalent(`)
Equivalent(`)

Electronic Clearing Services
363
Electronic Clearing Services (ECS) Request Form
The Company extends the ECS facility to shareholders so as to enable them to receive dividend through electronic mode to their bank. This facility will be available in the following centres: Ahmedabad, Bangalore, Bhubaneswar, Chandigarh, Chennai, Delhi, Guwahati, Hyderabad, Jaipur, Kanpur, Kolkata, Mumbai, Nagpur, Patna, Thiruvananthapuram, Agra, Allahabad, Amritsar, Aurangabad, Baroda, Bhopal, Calicut, Cochin, Coimbatore, Dehradun, Erode, Gorakhpur, Gwalior, Hubli, Indore, Jabalpur, Jalandhar, Jammu, Jamshedpur, Jodhpur, Kolhapur, Lucknow, Ludhiana, Madurai, Mangalore, Mysore, Nasik, Panjim, Pune, Raipur, Rajkot, Salem, Shimla, Surat, Trichur, Trichy, Udaipur, Varanasi, Vijayawada, Visakhapatnam. Those who wish to avail the facility may fill up the ECS form given below and send the same to the Share Transfer Agent of the Company - M/s Karvy Computershare Private Limited in case of shares held in physical form and to their respective Depository Participant in case of shares held in Electronic/Demat form.
Electronic Clearing Services (ECS) Request form(Note: If you are already receiving through ECS, please ignore this form)
SHAREHOLDERS IN PHYSICAL FORM SHAREHOLDERS IN DEMAT FORM
To be sent to your Depositary participant (DP)
Dear Sir,
Subject : ECS Mandate/ Bank form for Dividend Payment
I the undersigned, shareholder of Oil and Natural Gas Corporation Limited (ONGC), wish to opt for ECS facility for payment of dividend. The following is a confirmation of my details and I hereby confirm my choice to opt for payment of dividend payable to me by a physical dividend warrant/demand draf t, on account of any circumstances beyond the control of ONGC, that may af fect payment of dividend through ECS.
1) For shares held in physical form
Folio No:
2) For shares held in Electronic form
[Shareholders holding shares in electronic form should forward this
form to their respective Depository Participant (DP)].
DP ID
Client ID
3) Name & Address :
4) Bank Particulars :
Bank Name
Branch Name & Address
Account No. (as appearing in cheque book)
Account type
9 digit MICR code as appearing on the cheque
Karvy Computershare Pvt. Ltd
Karvy Selenium Tower B,
Plot 31-32, Gachibowli
Financial District, Nanakramguda,
Hyderabad-500 032
Phone No. 040- 67162222
Fax No: 040- 23001153

Annual Report 2014-15
Electronic Clearing Services
364

Proxy form
365
Proxy form[Pu
I/We, being the member (s) of …………. shares of the above named company, hereby appoint
1. ................
2. of having e-mail Id
3.
.....................…………………… ............................…………………. ……………….....................................or failing him
................
ndAnd whose signature(s) are appended below as my/our proxy to at tend and vote (on a poll) for me/us and on my/our behalf at the 22 Annual General Meeting of the th company, to be held on Tuseday, 15 September, 2015 at 10.00 A.M. at NDMC Indoor Stadium, Talkatora Garden, New Delhi and at any adjournment thereof in
respect of such resolutions as are indicated below:
Affix revenuestampof `1
Signed this…..........… day of……….............. 2015
Signature of shareholder
Signature of first Proxy holder Signature of second Proxy holder Signature of third Proxy holder
Note: This form of proxy in order to be ef fective should be duly completed and deposited at the Registered Office of the Company, not less than 48 hours before the commencement of the Meeting.
Name of the member (s):
Registered address:
E-mail Id:
Folio No/ Client Id:
DP ID:
Attendance Slip
OIL AND NATURAL GAS CORPORATION LIMITED CIN: L74899DL1993GOI054155
Reg. office: JEEVAN BHARATI, 124 INDIRA CHOWK, NEW DELHI- 110001Website: www.ongcindia.com email: [email protected] Tel: 011-23301277/1299
Please fill in this at tendance slip and hand i t over at the entrance of the meeting venue.
Client ID*
D.P ID* Folio No.
No. of share(s) held
I cer tify that I am a member/proxy for the member of the Company.nd th I hereby record my presence at the 22 Annual General Meeting of the Oil And Natural Gas Corporation Limited held on Tuesday, 15 September, 2015 at 10.00 A.M.
at NDMC Indoor Stadium, Talkatora Garden, New Delhi.
Members/proxy’s name in Block Let ters
*Applicable for investor holding Share(s) in electronic form. Signature of Member/Proxy
OIL AND NATURAL GAS CORPORATION LIMITED CIN: L74899DL1993GOI054155
Reg. office: JEEVAN BHARATI, 124 INDIRA CHOWK, NEW DELHI- 110001Website: www.ongcindia.com email:[email protected] Tel: 011-23301277/1299
SI No. RESOLUTIONS
ORDINARY BUSINESS
SPECIAL BUSINESS
1 To receive, consider and adopt the Audited Financial Statements including consolidated Financial Statements of thest Company as at 31 March, 2015, together with the Board's Repor t, the Repor t of Auditors' thereon and comments of
the Comptroller & Auditor General of India, in terms of Section 143 (6) of the Companies Act, 2013.
2 To confirm the payment of two interim dividends and declare final dividend on equity shares for the year 2014 -15.
3 To appoint a Director in place of Shri Shashi Shanker (DIN-06447938) who retires by rotation and being eligible,of fers himself for re-appointment.
4 To authorise Board of Directors of the Company to fix the remuneration of the Joint Statutory Auditors of theCompany for the Financial Year 2015-16, in terms of the provisions of section 139(5) read with section 142 ofthe Companies Act, 2013.
Vote(please mention no. of shares
For Against Abstain
5 To appoint Shri U. P. Singh (DIN-00354985) as Director of the Company.
6 To appoint Shri A. K. Dwivedi(DIN-07048874) as Director of the Company.
7 To appoint Smt. Atreyee Das (DIN- 07194189) as Director of the Company.
8 To appoint Shri V. P. Mahawar (DIN- 07208090) as Director of the Company.st 9 To ratify the remuneration of the Cost Auditors for the financial year ending 31 March 2016.

Annual Report 2014-15
Proxy Form
366

ndRoute map of the Venue of 22 AGM of ONGC
Talkatora StadiumTalkatora Stadium
Connaught Place
Connaught Place


ONGC, an equal opportunity employer celebrates diversity at work place and the power that it brings along, energizes our nation.

www.ongcindia.com /ONGCLimited @ONGC_