Global Research Unit Working Paper #2020-024 - CityU ...
40
© 2020 by Cheung. All rights reserved. Short sections of text, not to exceed two paragraphs, may be quoted without explicit permission provided that full credit, including © notice, is given to the source. Global Research Unit Working Paper #2020-024 A Decade of RMB Internationalization Yin-Wong Cheung, City University of Hong Kong
-
Upload
khangminh22 -
Category
Documents
-
view
0 -
download
0
Transcript of Global Research Unit Working Paper #2020-024 - CityU ...

© 2020 by Cheung. All rights reserved. Short sections of text, not to exceed two paragraphs, may be quoted without explicit permission provided that full credit, including © notice, is given to the source.
Global Research Unit Working Paper #2020-024
A Decade of RMB Internationalization Yin-Wong Cheung, City University of Hong Kong

A Decade of RMB Internationalization
Yin-Wong Cheung
(This Version: December 2020)
Abstract This article recounts China’s renminbi (RMB) internationalization experiences since the 2009 RMB cross-border trade settlement initiative. In the first few years, the RMB made inroads into global financial markets and had a few remarkable accomplishments, including the Special Drawing Right currency status. Since the 2015 market turmoil, RMB internationalization has levelled off – possibly due to changes in both domestic and geopolitical conditions. The RMB is currently under-represented in the global market compared with China’s economic importance. China’s deliberate and schematic policies will elevate the RMB’s global stature in a gradual manner but there will not be a leapfrogging in the near term. JEL classifications: F02, F31, F33, G15, G18
Acknowledgments: I thank Iikka Korhonen and Mikko Mäkinen for their constructive comments and suggestions, as well as Roger Lee and David Wong for their research assistance. I also gratefully acknowledge the continuing support from the Hung Hing Ying and Leung Hau Ling Charitable Foundation (孔慶熒及梁巧玲慈善基金). Correspondence address: Yin-Wong Cheung, Hung Hing Ying Chair Professor of International Economics, Department of Economics and Finance, City University of Hong Kong, Hong Kong. Email: [email protected]

1
1. Introduction The coronavirus pandemic continues to reshape the global economy in drastic and lasting ways.
Among other things, lockdowns have caused serious breakdowns of intra-country and cross-
border interactions, and imposed pernicious effects on the real economy. The resulting
disruptions highlight the risk of dependency on a single global supply chain and the potential
benefits of diversified supply sources. They have also prompts countries to evaluate the merits of
breaking up a complex global supply chain and setting up diverse regional supply chains with a
view to creating a resilient and inclusive economy.
The crisis has also weighed heavily on global financial markets, reviving concerns about
the US dollar’s role in the international monetary system and its reserve currency status. At the
start of the pandemic, the US dollar played its usual role as a safe-haven currency. With the
economic headwind caused by the public health crisis and uncertain political outlook, the market
began to fret about the global stature of the US dollar. Will the US dollar benefit from the
pandemic turmoil and enhance its status as a safe-haven and the preeminent global currency as in
the wake of the 2008 global financial crisis (GFC), or will the US buckle under the pandemic,
dethroning the US dollar? Will China capitalize on its early exit of pandemic lockdowns and
strengthen its currency’s global stature?
Given the US bungling of the crisis and China’s successes in containing and suppressing
the outbreak, China is now expected to lead the global post-pandemic recovery. This creates a
possibility that the Chinese currency, the renminbi (RMB), supplants the US dollar’s primacy in
the global financial system.
After the difficult experience of dollar shortage during the 2008 GFC, China promoted the
international use of the RMB and approved a pilot scheme of RMB cross-border trade settlement
in 2009 to reduce dollar dependence.1 International investors prepared for a global RMB with
such features as RMB-oriented investment vehicles and themes. Academics generated various
assessments of the RMB’s global role and prospects for toppling the US dollar.
1 International Monetary Fund (2010) considers the RMB, euro, and yen to be the three national currencies capable of competing with the US dollar in the global market. Studies on RMB internationalization include Cheung et al. (2011), Eichengreen (2013), Eichengreen and Kawai (2015), Frankel (2012), and Prasad (2016).

2
In late 2015, the IMF announced the RMB’s Special Drawing Right inclusion when the
RMB internationalization process was stalled in the next few years by China’s tightened capital
controls and financial deleveraging policies.
In this study, I take stock of China’s policy of internationalizing the RMB and its
accomplishments. Why is such an assessment necessary? Conceivably, the RMB’s path to global
currency stardom is complicated. In addition to the commonly mentioned economic and political
fundamentals,2 the RMB’s global status depends on social and institutional characteristics,
geoeconomic and geopolitical environments, and reactions from the US and other incumbents.
My discussion begins with a recounting of China’s experiences internationalizing the
RMB. Next, given a comprehensive assessment of China’s direct and indirect policies to
promote the RMB usage overseas is beyond the scope of this paper, the analysis turns to the
RMB’s prospects and main policy issues. Hopefully, my selected areas of focus offer a
reasonable overview of RMB internationalization.
The study is structured as follows. Section 2 describes China’s main policies to promote
the RMB’s global usage. Section 3 looks at the current global status of the RMB. Section 4 deals
with offshore RMB trading. Section 5 evaluates the RMB’s internationalization in retrospect.
The last section summarizes and offers final thoughts.
2. Policies to promote RMB internationalization In July 2009, China approved a pilot cross-border trade settlement scheme to promote and
facilitate the use of the RMB overseas.3 RMB settlement of foreign trade allowed Chinese
companies to reduce their exchange risks and currency conversion costs, as well as their reliance
on the US dollar.
China more recently has introduced measures to support the RMB cross-border settlement
scheme and promote global use of the RMB. These include (i) the appointment of local RMB
clearing banks in the offshore markets for clearing cross-border RMB transactions, (ii) the setup
of bilateral RMB currency swap agreements to provide a liquidity backdrop during an RMB
shortage, and (iii) the assignment of Renminbi Qualified Foreign Institutional Investor (RQFII)
2 See e.g. Cheung (2015), Chinn and Frankel (2007), Chen and Peng (2010), Eichengreen (2014), Lane and Burke (2001), Li and Zhang (2017), and Prasad and Ye (2013). 3 The scheme initially covered designated companies in five pilot cities (Shanghai and four cities in Guangdong Province). By August 2011, all regions in China were covered under the scheme.

3
quotas for accessing China’s onshore capital markets. The main stated functionality of the first
two policy measures was the provision of RMB liquidity to support cross-border trade and
investment. The third policy measure was intended to enhance the attractiveness of offshore
RMB holdings. The three measures, discussed in detail below, constitute the main elements in
developing an offshore RMB business.
Hong Kong has played a unique role in China’s strategy of internationalizing the RMB.
The special administrative region, sometimes labelled the “super-connector” between China and
the rest of the world, is legally part of China, but nevertheless considered “offshore” for the
purposes of RMB transactions.4 On top of its advanced financial market infrastructure, Hong
Kong is quite capable of and amenable to implementing the nitty-gritty regulatory requirements
China wants in its offshore RMB initiatives. By experimenting with specific RMB
internationalization policies in Hong Kong, China has been able to evaluate the effects of the
policies before introducing them to the rest of the world while maintaining capital controls and
tightly regulated domestic financial markets.
2.1 Local RMB clearing banks
To prepare for cross-border RMB transactions, China designated the Bank of China (Hong
Kong) in December 2003 as an RMB clearing bank to settle RMB transactions in Hong Kong. It
was the first such facility outside mainland China. A first-mover advantage and China’s policy
support catapulted Hong Kong into the position of leading global hub for offshore RMB
business, providing its market with the world’s largest offshore pool of RMB liquidity.
China has since designated offshore RMB clearing banks at other financial centers across
continents and time zones. Out of the 26 financial centers with an offshore RMB clearing bank,
ten are in Asia. This relatively heavy concentration is indicative of China’s plans to establish a
regional RMB presence in Asia before going global. Table 1 lists the offshore RMB clearing
banks in chronological order.
London, the archetype global financial center with the largest foreign exchange market and
extensive multinational corporation networks, was the first financial center in the European time
zone that China assigned an offshore RMB clearing bank in June 2014 (although Frankfurt
4 Under The Basic Law of the Hong Kong Special Administrative Region, Hong Kong is allowed its own currency, as well as its own legal and financial systems.

4
quickly followed). Indeed, London was quite aggressive in developing its offshore RMB
business. It was the first G7 country with a local RMB clearing bank, the first to sign a bilateral
local currency swap line with China (RMB 200 billion in June 2013), the first to issue sovereign
debt denominated in RMB (October 2014), and the first foreign market in which China’s central
bank issued overseas debt (October 2015). With Toronto joining the group in November 2014,
the core network of offshore centers with local RMB clearing facilities covers the global
financial world and makes 24-hour round-the-clock RMB trading possible.
The assignment of a local clearing bank has both symbolic and practical elements. It is
symbolic in the sense that, since 2004, foreign banks and corporations have had access to
offshore RMB clearing through the RMB real-time gross settlement system in Hong Kong.
China’s Cross-Border Interbank Payment System (CIPS), which was launched in October 2015
further reduces the practical role of offshore RMB clearing banks. Authorized by the People’s
Bank of China, CIPS is a specialized clearing system that works with direct and indirect
participants to provide clearing and payment services for financial institutions in the cross-border
RMB and offshore RMB businesses. By July 2020, CIPS has 33 direct participants and 947
indirect participants from over 90 countries and regions on six continents.5
2.2 Bilateral local currency swap agreements
During the 2008 GFC, an unexpectedly sharp drop in global US dollar liquidity severely
constrained international trade and depressed global economic activity. To alleviate its
vulnerability to a dollar shortage, China established bilateral currency swap agreements
involving the RMB and the national currencies of signing counterparty countries. Since
December 2008, China has signed bilateral local currency swap agreements worth over RMB 3.7
trillion with more than 39 foreign central banks or monetary authorities (People’s Bank of China,
2020). Table 2 lists the bilateral swap agreements signed between 2008 and 2019.
These swap agreements support bilateral trade and investment and promote the
international use of the RMB. In principle, they allow these countries to bypass the US dollar and
free them from the US dollar dominance in global trade. They also provide a liquidity backdrop
5 See http://www.cips.com.cn/cipsen/7050/index.html for additional information. CIPS is operated by the China International Payment Service Corp.

5
in the event of RMB shortage. The local currency swap agreement is now a staple feature of
China’s strategic promotion of international RMB use.
Focusing on China’s swap line policy, Garcia-Herrero and Xia (2015), Liao and McDowell
(2014) and Lin et al. (2016) show that the choice of counterparty countries and swap line
amounts are determined by trade intensity, economic size, strategic partnership, free trade
agreements, as well as the levels of corruption and political stability of the counterparty country.
Song and Xia (2020) show that the signing of a RMB bilateral local currency swap arrangement
promotes RMB use in settling the corresponding cross-border trade. They also observe that RMB
swap agreements are quite different from swap agreements between the Federal Reserve and the
world’s other leading central banks used to ensure global dollar liquidity. The importance of
these Federal Reserve swap agreements became timely again in March 2020, when they were
activated to counter liquidity shortages triggered by the coronavirus pandemic.
2.3 The RQFII program
In the initial phase of building up offshore RMB liquidity, China contemplated several
ways to shore up demand. In December 2011, China introduced the Renminbi Qualified Foreign
Institutional Investor (RQFII) program that gives approved foreign institutions access to offshore
RMB to invest in China’s onshore financial markets.6 The RQFII program is a variant of the
original QFII program introduced in 2002. It allows authorized foreign investors to invest
onshore using a foreign currency (usually US dollars).
The first batch of institutions in the program included only authorized subsidiaries of
China’s brokerage houses and fund managers in Hong Kong. These groups mainly invested in
the Chinese onshore bond market and were geared toward fixed income products instead of
equities. The RQFII program has since been expanded to different financial centers overseas and
covers other asset classes beyond fixed income products. Table 3 lists the RQFII arrangements.
Since the RQFII program launched, China has introduced several other inbound investment
schemes, including the Shanghai-Hong Kong Stock Connect in 2014, the Shenzhen-Hong Kong
6 Offshore RMB market products include Dim Sum bonds, RMB-denominated equities, as well as exchange-traded and over-the-counter RMB derivatives.

6
Stock Connect in 2016, and Bond Connect programs in 2017.7 The “connect” programs were
designed for specific onshore financial markets with investors directly investing in these markets
via Hong Kong. The RQFII program offers a broader range of investable securities. In any case,
all these inbound investment schemes compete with the RQFII program for foreign capital.
Over time, the RQFII program has undergone several modifications in participant
qualification rules and eligible investment classes. China ended the quota limit for the RQFII
program on June 6, 2020 (State Administration of Foreign Exchange, 2019a). Together with the
removal of investment caps, China has sought to simplify the paperwork on the remittance of the
qualified investor’s profits from domestic securities investment and other requirements. These
changes are aimed at improving the setup for authorized institutional investors seeking to deploy
their offshore RMB in China’s onshore capital markets.
There has been no corresponding lifting of quotas for the Qualified Domestic Institutional
Investor program, however. The QDII program governs Chinese residents investing in overseas
markets. As a result, China’s portfolio flow rules remain asymmetric.
2.4 Other policy measures
China uses a multipronged strategy in promoting RMB acceptance in the global market. In
addition to global trade and investment transactions, China has sought to burnish geoeconomic
and geopolitical perceptions of its currency.
2.4.1 SDR
Heavy lobbying efforts on China’s part in the early 2010s help get the RMB included in
the IMF’s basket of Special Drawing Right (SDR) currencies. China’s campaign for recognition
as a global economic power finally paid off in November 2015, with the IMF announcing that
the RMB would be joining the select group of SDR currencies. The move was lauded as an
acknowledgement of China’s importance in the global economy and ongoing reform efforts. Not
only was the RMB the first developing-country currency included in the SDR basket, it was also
the first new currency added to the basket since the euro’s launch in 1999.
7 As of August 2020, two global depositary receipts (GDRs) were listed on the London Stock Exchange via the Shanghai-London Stock Connect program launched in June 2019. The two listings are also available to international investors through Hong Kong via the Shanghai-Hong Kong Stock Connect.

7
On October 1, 2016, the RMB officially joined the SDR basket with a 10.9% weight. The
current weights of the other four SDR currencies are 41.7% for the US dollar, 30.9% for the
euro, 9% for the Japanese yen and 8.1% for the British pound. Official global reserve currency
status has provided a symbolic boost to the RMB’s global credibility.
2.4.2 Commodity pricing
The US dollar’s role in commodity pricing attests to its international primacy. Key globally
traded commodities, including oil and gold, are quoted and traded in US dollars – a market
practice that reinforces the currency’s global dominance.
As part of its broad RMB internationalization policy, China has introduced RMB-
denominated commodity contracts for the global community. The strategy leverages the
phenomenal growth of China’s presence in global commodities over recent decades (World
Bank, 2018). As the world’s top participant of many traded commodities, China has become
increasingly dissatisfied with the common practice of dollar pricing of international transactions.
The promotion of RMB-denominated commodity contracts reflects China’s yearning to reduce
its reliance on US-dollar based trading of commodities and offer RMB-denominated hedging
tools for domestic investors and consumers. In addition to fostering global uses of the RMB, the
strategy undermines US dollar hegemony in the commodity space. Solanko (2020), for example,
points out that the euro is now the dominant currency in Russian exports to China.8 Both
countries’ interests align in avoiding the US dollar in bilateral trade arrangements where state-
owned energy companies figure heavily.
China currently limits foreign investors to certain RMB-denominated commodity
contracts, most notably those involving gold, iron ore, or oil. China has focused on the gold
market because it is one of the world’s biggest gold producing, consuming, and importing
countries. In September 2014, China opened to global investors its RMB-denominated gold
bullion trading on the Shanghai International Gold Exchange, which is located in the Shanghai
free trade zone.9 The Shanghai International Gold Exchange is a fully-owned subsidiary of the
Shanghai Gold Exchange. It is known as the “International Board” of the Exchange. In April
8 See also Bank of Russia (2020). It reflects the concerted efforts of China and Russia to move the world away from the US dollar. 9 Since October 2011, the century-old bullion house Chinese Gold & Silver Exchange Society in Hong Kong has offered exchange trading of gold in RMB to both local and global investors.

8
2016, the Shanghai Gold Exchange launched an RMB-denominated Shanghai Gold Benchmark
Price, or Shanghai Gold Fix. Futures contracts based on the RMB-denominated gold fix are now
offered, for example, on the Chicago Mercantile Exchange and the Dubai Gold & Commodities
Exchange.
International investors gained the possibility of trading RMB-denominated iron ore futures
and crude oil futures contracts in 2018. RMB-denominated iron ore futures contracts were
launched in October 2013 on the Dalian Commodity Exchange. Overseas institutions were
allowed to participate in trading in February 2018, and overseas retail investors were allowed in
February 2019.
China finally launched its RMB-denominated oil futures contracts on the Shanghai
International Energy Exchange in March 2018, six years after the original planned launch date.
International traders were invited to join the trading platform. Besides boosting the status of the
RMB, the Shanghai oil contract aspires to be a regional (and, hopefully, eventually global)
benchmark that rivals established global benchmarks such as the Intercontinental Exchange’s
Brent crude oil contract and the New York Mercantile Exchange’s West Texas Intermediate
Crude Oil futures contract.
Since the launch, RMB-denominated oil contracts have seen heavy trading volumes in
Shanghai. There has even been talk of a petroyuan-petrodollar rivalry (Kamel and Wang, 2019;
Mathews and Selden, 2018; Salameh, 2018). Bloomberg Intelligence reports that Shanghai oil
contracts accounted for 10.5% of the global market trading volume at the start of June 2020.10
During most quarters since the launch, the global market share of the volume has been above
10%. As of June 2020, China had opened to overseas investors three additional RMB-
denominated futures contracts: purified terephthalic acid (PTA) futures, natural rubber futures,
and low-sulfur fuel futures.
Evidently, China is following its gradualism approach in opening up its domestic RMB-
denominated commodity trading. In addition to being part of the broader policy of promoting
global uses of the RMB, RMB-denominated commodity contracts boost China’s pricing power
over key commodities, offer RMB-denominated hedging tools, and circumvent the US dollar
influences in the global commodity arena.
10 See Appendix A1.

9
2.4.3 International initiatives
In addition to securing the SDR currency title and offering RMB-denominated commodity
contracts, China has been crafting international initiatives with the potential to foster RMB use
overseas. Two prime examples are the Belt and Road Initiative on infrastructure and trade and
the Asian Infrastructure Investment Bank on financing infrastructure projects.11 These initiatives
dovetail nicely with the RMB internationalization project. If trade and infrastructure projects
thrive among member countries of the Belt and Road Initiative, there is an increased possibility
for using RMB in financing of these projects to e.g. safeguard against financial risk.
3. The RMB’s global status
China’s measured implementation of policies that strengthening the RMB’s global role has wide
implications. Over the past decade, the RMB has made considerable headway into global
markets as RMB business activity has spread from Asia to other parts of the world. In this brief
stocktaking of the current global status of the RMB, I assess international RMB use by
considering global foreign exchange (FX) trading, holdings of international reserves, use in
world payments, and the Renminbi Globalisation Index compiled by the Standard Chartered
Bank.
3.1 Global FX trading
The world’s largest financial market, the global FX market, provides decentralized trading
of national currencies. Trading activity is typically used to gauge the relative importance of
national currencies. The Bank for International Settlements (BIS) triennial central bank surveys
give a detailed account of FX turnover in the global FX market. The growing role of the RMB is
well illustrated by its global FX trading share.
The BIS triennial surveys show that the average RMB daily FX turnover in the global
market surged from 29.2 billion in 2010, 119.6 billion in 2013, and 202.1 billion in 2016, to
285.0 in 2019. The surveys (BIS 2010, 2013, 2016, 2019) further show that the RMB’s global
trading share increased between 2010 and 2019 from 0.9% to 4.3%, and rose from 17th to eighth
most traded currency.
11 See http://english.www.gov.cn/beltAndRoad/ and https://www.aiib.org/en/index.html.

10
Despite the rapid gains of the RMB in global FX trading, its turnover is still low given
China’s economic size and international trade. Table 4 lists for each SDR currency the ratios of
average daily turnover to gross domestic product (GDP) and to international trade volume. The
Hong Kong data are included for comparison purposes. Note that the currency of Hong Kong, a
special administrative region with an economy size 2.6% that of China’s, ranked ninth most-
traded currency, accounting for 3.5% of global turnover in the 2019 BIS triennial survey.
The top four most-traded currencies in 2019 were the US dollar, the euro, the British pound
and the Japanese yen. The US dollar accounted for above 80% of all transactions.12 The fifth
SDR currency, the RMB, ranked eighth most traded. The RMB average daily FX turnover to
GDP and to international trade ratios are the smallest among the SDR currencies. According to
these two ratios, the US dollar, as the predominant global currency, is the most heavily traded
currency. Compared to the other SDR currencies, RMB turnover is quite low with respect to
economic measures such as GDP and trade volume.
Table 5 presents the shares of global FX trading contributed by trading hubs that issue the
SDR currencies and the Hong Kong dollar. Global FX trading is concentrated in a few
international financial centers. For instance, the top two trading locations, the UK and the US,
account for over half of global turnover. The euro area and Japan collectively contribute roughly
10% to 15% of global trading. 13 Between 2010 and 2019, China’s share of global FX trading
increased from 0.4% to 1.6% (a share noticeably lower than that of Hong Kong). Compared to
other financial centers, including Hong Kong, China has room to expand its FX trading business.
3.2 Share of global reserves
Even before the announced RMB’s inclusion in the SDR currency basket in November
2015 and the conferral of IMF official global reserve status, predictions abounded about the
trend of the RMB’s share of global reserves. The Economist Intelligence Unit (2014), for
example, indicated that a majority of institutional investors – especially those in China –
expected the RMB to overtake the US dollar as the main global reserve currency. Chen and Peng
(2010), Hu (2008), and Lee (2014), in contrast, predicted that the RMB would only account for
12 Since two currencies are involved in any FX transaction, the sum of the percentage shares of individual currencies totals 200% instead of 100%. 13 The euro area data comprise data from member countries of the euro area.
11
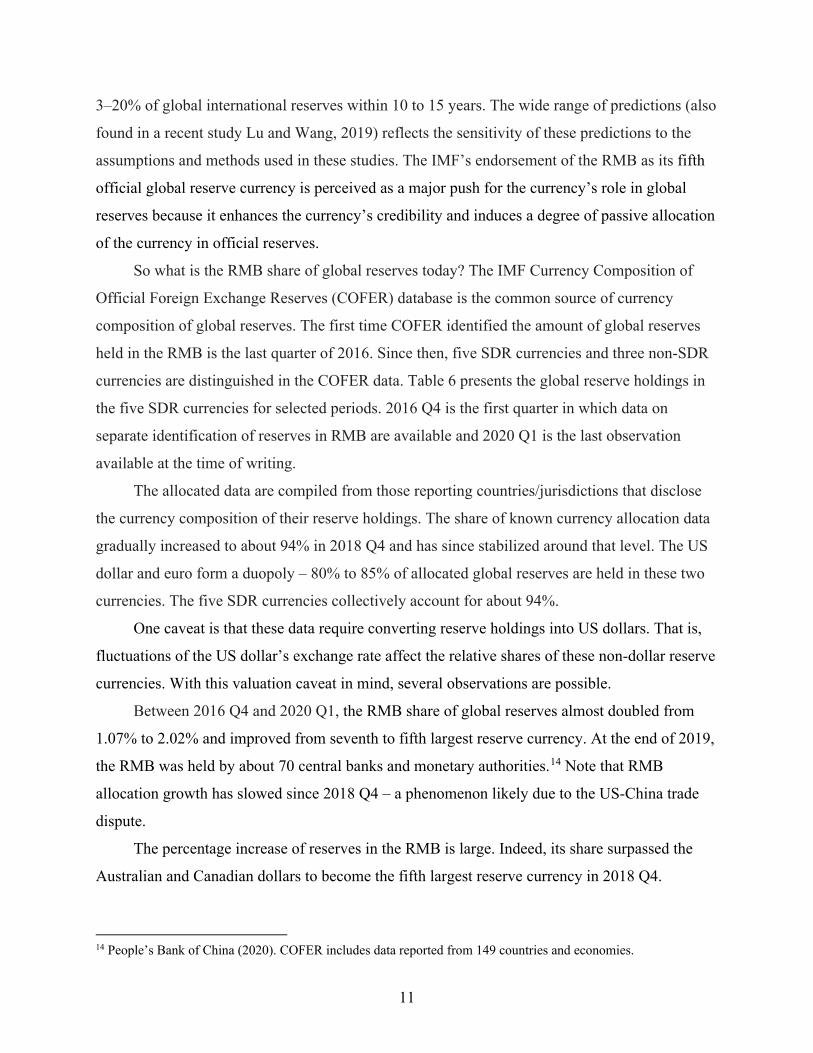
3–20% of global international reserves within 10 to 15 years. The wide range of predictions (also
found in a recent study Lu and Wang, 2019) reflects the sensitivity of these predictions to the
assumptions and methods used in these studies. The IMF’s endorsement of the RMB as its fifth
official global reserve currency is perceived as a major push for the currency’s role in global
reserves because it enhances the currency’s credibility and induces a degree of passive allocation
of the currency in official reserves.
So what is the RMB share of global reserves today? The IMF Currency Composition of
Official Foreign Exchange Reserves (COFER) database is the common source of currency
composition of global reserves. The first time COFER identified the amount of global reserves
held in the RMB is the last quarter of 2016. Since then, five SDR currencies and three non-SDR
currencies are distinguished in the COFER data. Table 6 presents the global reserve holdings in
the five SDR currencies for selected periods. 2016 Q4 is the first quarter in which data on
separate identification of reserves in RMB are available and 2020 Q1 is the last observation
available at the time of writing.
The allocated data are compiled from those reporting countries/jurisdictions that disclose
the currency composition of their reserve holdings. The share of known currency allocation data
gradually increased to about 94% in 2018 Q4 and has since stabilized around that level. The US
dollar and euro form a duopoly – 80% to 85% of allocated global reserves are held in these two
currencies. The five SDR currencies collectively account for about 94%.
One caveat is that these data require converting reserve holdings into US dollars. That is,
fluctuations of the US dollar’s exchange rate affect the relative shares of these non-dollar reserve
currencies. With this valuation caveat in mind, several observations are possible.
Between 2016 Q4 and 2020 Q1, the RMB share of global reserves almost doubled from
1.07% to 2.02% and improved from seventh to fifth largest reserve currency. At the end of 2019,
the RMB was held by about 70 central banks and monetary authorities.14 Note that RMB
allocation growth has slowed since 2018 Q4 – a phenomenon likely due to the US-China trade
dispute.
The percentage increase of reserves in the RMB is large. Indeed, its share surpassed the
Australian and Canadian dollars to become the fifth largest reserve currency in 2018 Q4.
14 People’s Bank of China (2020). COFER includes data reported from 149 countries and economies.

12
Nevertheless, the RMB share was still small relative to the other four SDR currencies: 61.99%
for the US dollar, 20.05% for the euro, 5.70% for the Japanese yen, and 4.43% the British pound.
The scale of RMB use as a reserve asset is not large. For instance, the dollar value of
reserves held in RMB increased by US$131 billion between 2016 Q1 and 2020 Q1. During the
same period, reserves held in dollars rose by US$1.293 trillion, almost ten times more. It is worth
noting that, some countries – including China – are believed to have reduced their US dollar
reserve holdings during this period. For example, Russia shifted a portion of its reserves from the
dollar to the euro and the RMB in 2018 (BOFIT, 2020).15
Does the introduction of a fifth global reserve currency – the RMB – undercut the US
dollar’s premier reserve currency status? Since the RMB became a reserve currency, the US
dollar share of global reserves has dropped from 65.36% (2016 Q4) to 61.99% (2020 Q1). Does
it represent a variation within the 60% to 65% range observed in the last two decades, or is it part
of the secular downward trend of the US dollar share that started from the height of above 80%
in the early 1970s?16 Without offering a definitive answer, I would note that the RMB, euro,
Japanese yen, and British pound all registered small increases in their shares during the same
period.
The currency composition data can be influenced by China’s gradual disclosure of its
currency composition to COFER in the two or three years following 2015 Q2. China’s State
Administration of Foreign Exchange (2019b, 2020) reports that in 2014 and 2015, 58% of
China’s reserves were held in US dollars, i.e. less than the global average of 65% in 2014 and
66% in 2015. Note that China in these years held over US$ 3.5 trillion reserves and that the
allocated reserves reported by COFER are US$ 6.8 trillion in 2014 and US$ 7.4 trillion in 2015.
Thus, the gradual inclusion of China’s currency composition can affect the reported US dollar
share of global reserves.
On the other hand, one should not underestimate the RMB’s potential as a reserve
currency. In addition to China’s continuing financial liberalization process, Chinese stocks and
bonds enjoy an increasing presence in major global equity and bond indexes. These market
15 The percentages of the Bank of Russia assets accounted for the euro and the RMB surpassed, respectively, the 30% and 10% levels after 2018 (Bank of Russia, 2019; 2020). 16 See Appendix A.2 for the plot of the US dollar share of allocated global reserves. The US dollar share dropped below the 50% mark in 1990 and 1991.
13
developments improve the appeal of Chinese assets and support the RMB’s quest at becoming a
viable reserve currency.
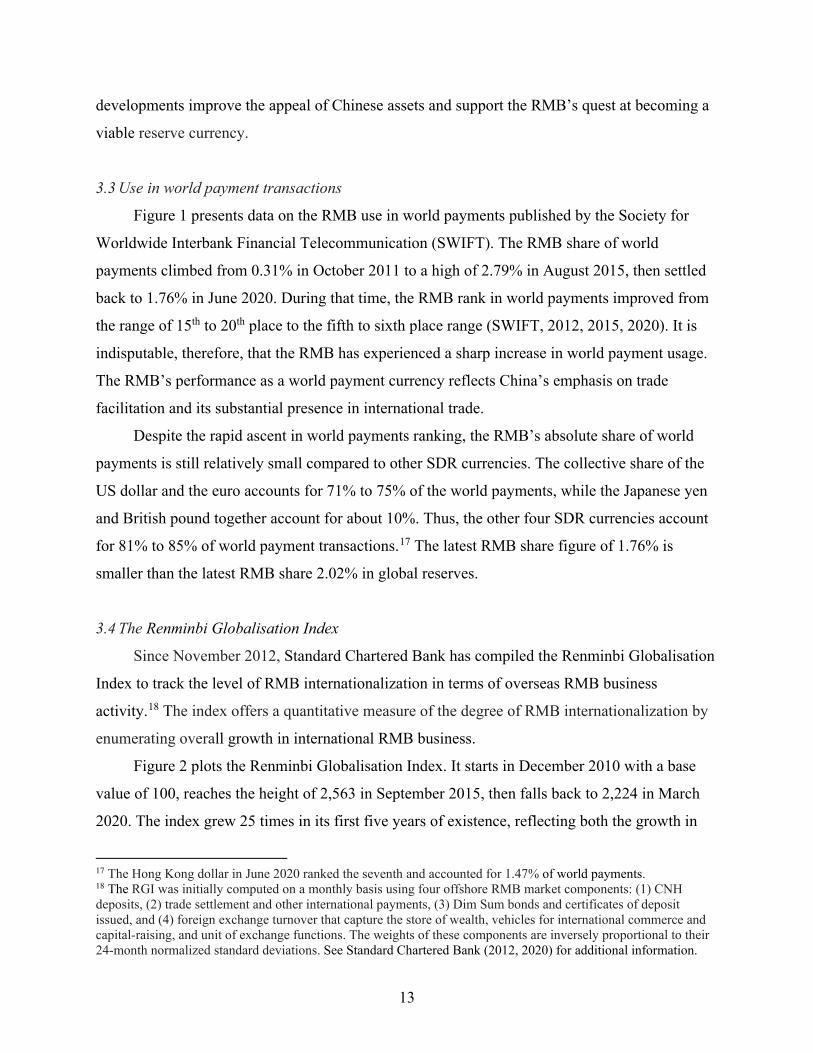
3.3 Use in world payment transactions
Figure 1 presents data on the RMB use in world payments published by the Society for
Worldwide Interbank Financial Telecommunication (SWIFT). The RMB share of world
payments climbed from 0.31% in October 2011 to a high of 2.79% in August 2015, then settled
back to 1.76% in June 2020. During that time, the RMB rank in world payments improved from
the range of 15th to 20th place to the fifth to sixth place range (SWIFT, 2012, 2015, 2020). It is
indisputable, therefore, that the RMB has experienced a sharp increase in world payment usage.
The RMB’s performance as a world payment currency reflects China’s emphasis on trade
facilitation and its substantial presence in international trade.
Despite the rapid ascent in world payments ranking, the RMB’s absolute share of world
payments is still relatively small compared to other SDR currencies. The collective share of the
US dollar and the euro accounts for 71% to 75% of the world payments, while the Japanese yen
and British pound together account for about 10%. Thus, the other four SDR currencies account
for 81% to 85% of world payment transactions.17 The latest RMB share figure of 1.76% is
smaller than the latest RMB share 2.02% in global reserves.
3.4 The Renminbi Globalisation Index
Since November 2012, Standard Chartered Bank has compiled the Renminbi Globalisation
Index to track the level of RMB internationalization in terms of overseas RMB business
activity.18 The index offers a quantitative measure of the degree of RMB internationalization by
enumerating overall growth in international RMB business.
Figure 2 plots the Renminbi Globalisation Index. It starts in December 2010 with a base
value of 100, reaches the height of 2,563 in September 2015, then falls back to 2,224 in March
2020. The index grew 25 times in its first five years of existence, reflecting both the growth in
17 The Hong Kong dollar in June 2020 ranked the seventh and accounted for 1.47% of world payments. 18 The RGI was initially computed on a monthly basis using four offshore RMB market components: (1) CNH deposits, (2) trade settlement and other international payments, (3) Dim Sum bonds and certificates of deposit issued, and (4) foreign exchange turnover that capture the store of wealth, vehicles for international commerce and capital-raising, and unit of exchange functions. The weights of these components are inversely proportional to their 24-month normalized standard deviations. See Standard Chartered Bank (2012, 2020) for additional information.

14
the number of offshore financial centers included in the Index and the proliferation of RMB
businesses in these centers.19 Clearly, there is strong momentum behind the RMB
internationalization process between 2010 and 2015.
The Renminbi Globalisation Index shows that, after September 2015, the global level of
RMB business dropped for about two years. It then stabilized and moved slightly upward in mid-
2018. Note that the RMB share of world payments in Figure 1 shows an inflection point around
August 2015 at which it begin a roughly two-year decline, echoing the non-monotonic RMB
internationalization process displayed in Figure 2. The change in the internationalization
dynamics is also hinted at in Table 4, which shows that the growth of RMB turnover in the 2019
BIS triennial survey was lower than in the 2016 survey.
The setback highlights the limit of unilateral efforts to promote the international
acceptance of the RMB. The various capital control measures introduced in response to the
market turmoil that followed the August 2015 modification of the RMB central parity formation
mechanism (People’s Bank of China, 2015) caught global investors off guard. These capital
control measures aimed at reining in capital outflow triggered by RMB depreciation
expectations, financial deleveraging policy, and restricting investment overseas. The measures
reinforced the asymmetric policy framework of welcoming inflows of foreign capital while
limiting outflows. Foreign investors were forced to re-evaluate China’s market reform policies
while putting on hold commitments to RMB businesses.
Of course, the trade dispute between the world’s two largest economies, China and the US,
during Donald Trump’s presidency has further impeded the RMB internationalization process.20
Tariffs and the re-revamping of global supply chains triggered by trade disputes affect China’s
interactions with the rest of the global community. Disruption of global production chains and
the associated economic uncertainty affect not only China’s trade and economic relationship with
the US, but also its allies. The economic (and political) discord underlying the dispute further
hinders RMB use globally.
4. Offshore RMB trading
19 The index initially only covered Hong Kong. Singapore and London were added in August 2011, Taiwan in July 2013, New York in January 2014, and Paris and Seoul in August 2014. 20 Rising populism and deglobalization forces work against the RMB’s international acceptance.

15
As noted earlier, China has adopted a broad strategy of developing offshore RMB centers to
internationalize the RMB. The strategy allows China to retain its strict capital controls and
tightly managed financial markets while assessing market responses to various RMB-
denominated products in managing funding and investment needs, RMB exchange rate flexibility
and convertibility, and their implications for authorities’ ability to manage the Chinese economy.
At the same time, both Chinese and foreign market participants can gain practical experiences of
conducting international business in RMB in a legal environment recognized by international
participants.
Do offshore markets contribute to the global status of a currency? The premier global
currency, the US dollar, illustrates the symbiosis between a global currency’s stature and the
offshore market network. The US dollar’s prominence benefits from full-fledged offshore US
dollar markets around the globe. At the minimum, offshore markets allow a currency to perform
its potential as an international currency outside the country where it is issued.
In principle, the scale and scope of offshore markets and a currency’s international role
are determined by overseas demand and market forces. In the RMB case, however, China
assumes an active policy stance in orchestrating and promoting its offshore markets. Do these
policies affect the evolution and the growth of the offshore RMB business? Focusing on offshore
RMB trading, Cheung and Yiu (2017) find that the distribution of offshore RMB trading in the
2013 BIS survey was affected by the swap line arrangement.21 Cheung et al. (2019) examine the
evolution of a financial center’s share of offshore RMB trading and find that offshore RMB
trading was transiting towards the geographical distribution of global FX trading between 2016
and 2019. Policies, including assignments of local RMB clearing banks, currency swap
agreements, and the RQFII program had little effect.
Table 7 gives the correlation between a financial center’s share of the SDR currency’s
turnover and its share of total FX trading in a given year in the recent BIS surveys. Compared
with the RMB, the other four SDR currencies are recognized global currencies, albeit with
different prominence levels. They are also the top four most traded currencies. For these four
SDR currencies, their correlations are quite close to one – a financial center share of global FX
21 It was also affected by the size of the financial markets in the host jurisdiction and the bilateral foreign direct investment flows with China.

16
trading is quite closely associated with its trading shares of these four SDR currencies. That is,
trading patterns and opportunities of these four global currencies are similar around the world.
The correlation estimates pertaining to the RMB are well below one. The geographic
distribution of RMB trading is dissimilar to that of global FX trading. Moreover, the distribution
of RMB trading across financial centers is different from those of the other four SDR currencies.
The result is in accordance with the view that the RMB is still undergoing its internationalization
process, and that the other four SDR currencies are established global currencies. We anticipate
that as the RMB migrates toward the status of a key global currency, it will transit to a
geographic trading pattern similar to that of global FX trading and offer investors opportunities
similar to those of the other four SDR currencies.
Table 8 shows that offshore RMB trading is quite highly concentrated in four financial
centers: Hong Kong, the UK, Singapore, and the US. With about 40% of offshore RMB trading
according to recent BIS surveys, Hong Kong is clearly the premier offshore RMB center. The
UK and Singapore alternate between the largest or the second-largest RMB trading center
outside Greater China, while the US follows closely behind. These four centers collectively
account for over 90% of the offshore RMB trading turnover. Compared with Table 5, I infer that
offshore RMB trading is disproportionally concentrated in Hong Kong and Singapore – an
observation that is in accordance with China’s strategy of promoting the regional uses of the
RMB before global uses (Cheung, 2015; Ehlers and Packer, 2013; Ehlers et al., 2016). China’s
RMB internationalization policy may have favored Hong Kong and other Asian financial
centers, but for the RMB to evolve to be a full-fledged global currency, its trading must
gradually spread to other parts of the world according to FX market forces that determine where
the RMB is traded.
To shed light on the importance of the offshore RMB trading relative to onshore trading,
Table 9 presents, for each SDR currency, the growth rates for turnover in the onshore and
offshore segments across selected BIS triennial surveys. For the 2010–2013 and 2013–2016
periods, the growth of RMB trading in both onshore and offshore markets was quite pronounced
compared with those of the other four SDR currencies. The increase in offshore turnover was
also higher than onshore turnover. Between April 2016 and April 2019, however, onshore
trading turnover grew by 83%, which is more than double of the 30% increase in offshore RMB
turnover. The offshore RMB turnover growth rate is slightly lower than those of the US dollar

17
and euro, i.e. after two consecutive increases, the relative offshore share of RMB activity
declined in the 2019 BIS survey. RMB turnover growth in the 2019 BIS triennial survey is also
lower than that of 2016. That lower growth coincides with lower growth in offshore RMB
trading.
The relative subdued growth of offshore RMB turnover mirrors the slowdown of the
internationalization momentum revealed in Figures 1 and 2 above. The post-2015 capital
controls and geopolitical shifts reduce the appetite for RMB activity overseas. While tightening
capital outflows, China has implemented additional policies for global investors to access its
onshore markets. In addition to relaxing restrictions on participating in domestic bond, stock, and
commodity (futures) markets, and removing the quota limit of the RQFII program, China has
introduced specific policies to promote onshore RMB trading. Specifically, to improve and
encourage onshore FX trading, China has gradually granted foreign central banks, sovereign
wealth funds, and international financial institutions full participation in its onshore FX market
and expanded the set of currencies that can be directly traded against the RMB. As of August
2020, 66 foreign central banks participated in the onshore FX trading platform CFETS, which
offers direct trading between the RMB and 24 other currencies.22,23
To further foster direct trade with non-US dollar, China in the second half of 2020 waived
for three years interbank transaction fees between the RMB and twelve other currencies (the
Hungarian forint, Korean won, Malaysian ringgit, New Zealand dollar, Polish zloty, Russian
ruble, Saudi riyal, Singapore dollar, South African rand, Thai baht, Turkish lira, United Arab
Emirates dirham). With direct exchanges with other currencies, China can further bypass the US
in settling cross-border transactions and promote international use of the RMB.
5. RMB internationalization in retrospect
China’s rapid economic growth in the last few decades has made it an important global economy
participant. It is the second-largest economy globally, the largest trading country with substantial
manufacturing power, and a significant trading partner for many economies. As trade and
22 CFETS does not provide the names of participating central banks. Since September 2015, the RMB has become technically convertible for authorized foreign central banks that are allowed to participate in the onshore interbank RMB market. The onshore interbank RMB market was opened to authorized foreign commercial banks in May 2016. 23 The currencies with direct RMB trading are listed in the Appendix A.3. In addition to these currencies, CFETS also supports regional trading of KZT, MNT, and KHR against the RMB.

18
finance are highly intertwined in the modern economy, it is entirely logical that China will
advance its influence in global financial markets. In the aftermath of the 2008 GFC, the then
governor of the People’s Bank of China, Zhou Xiaochuan, raised the concern of relying on one
super-sovereign reserve currency. He implicitly challenged the US dollar hegemony and implied
an international role for the RMB (Zhou, 2009). On the heels of global liquidity squeeze
triggered by the coronavirus pandemic, the central bank’s current governor, Yi Gang, called for a
new SDR allocation to cushion the international monetary system (Yi, 2020).24 The promotion of
the SDR, which echoes Zhou (2009), could undermine the global stature of the US dollar and
increase the global level of RMB reserves. These proposals, together with China’s actual
measures to promote the global acceptance of the RMB, are manifestations of China’s yearning
for a global RMB and shift away from the US dollar.
5.1 A decade of ups and downs
When China explicitly embarked in 2009 on its quest to raise the RMB to the status of
global reserve currency, it was greeted with both praise and skepticism.25 The previous two
sections shows the RMB’s strong start in building up its stature of a global currency, but the
progress hit speed bumps after 2015 when China abruptly implemented a series of administrative
capital control measures.
Like the 2008 GFC, the coronavirus pandemic initially triggered a surge in demand for safe
US dollar-denominated assets, buttressing the safe-haven role of the US dollar. Indeed, Gopinath
et al. (2020) affirm that the US dollar’s dominance is pervasive. Further, the prevalence of the
US dollar in invoicing global trade has not weakened despite the US’s declining share of overall
trade (Boz et al., 2020).26
After the initial response, the global market shifted its attention to the US responses to the
pandemic and rekindled the concern about the risk the US dollar posted to the international
24 The fourth, and most recent, SDR allocation of 161.2 billion took place on August 28, 2009. It was preceded by an allocation of SDR 9.3 billion in 1970–1972, an allocation of SDR 12.1 billion (1979–1981), and an allocation of SDR 21.5 billion (August 10, 2009). The third allocation was a special one-time allocation targeting countries that joined the IMF after 1981. 25 Chen et al. (2009), Lee (2014), and Subramanian (2011a,b) suggest the RMB was well poised to become a main global currency, while Eichengreen (2013) and Yu and Gao (2011) adopt a more conservative view. See also Eichengreen and Kawai (2015). 26 While the US accounts for about 12% of global trade, the US dollar is used in about 50% of international trade contracts (Boz et al., 2020). The euro is also used extensively in international trade.

19
monetary system and the possible demise of the US dollar’s supremacy. While the pandemic
arose under different geoeconomic and geopolitical conditions than in 2008, it reminded the
world of US hegemony and repeated abuses by the US of its exorbitant privilege. The rippling
economic shocks from the pandemic first sent the US dollar value up and then down. The dip in
the US dollar coupled with the economic and political uncertainties inflicting the US have
revived the talk and speculation of replacing the US dollar with the RMB.
China undeniably made admirable accomplishments that include expanding cross-border
transactions in RMB and offshore RMB trading, acquiring the prestigious SDR currency title,
offering RMB-denominated commodity contracts, and climbing the ranks in global FX trading
and global reserve currencies. Yet, for all of China’s economic heft, the RMB, compared to the
US dollar, is a small player on the global stage. For instance, the RMB shares of global FX
turnover, global central bank reserves, and world payments are 4.32%, 2.02%, 1.76%,
respectively. They are small fractions of the corresponding US dollar shares (more than 80%,
60%, and 40%, respectively).
Given China’s economic power and policies designed to promote the RMB’s international
use, when will the RMB be a significant player in the global monetary system? While some
might find the minute scale and scope of the RMB use surprising, especially given China’s
predominance in international trade, we should remember that a currency’s global status depends
on both economic and geopolitical factors. Economic strength, while important, is not the sole
determinant of a currency’s global stature. The global significance of a currency encapsulates a
complex nexus of the issuing country’s domestic economic and political fundamentals and its
leadership abroad as perceived by global investors. It also rests on the credibility, confidence,
and trust earned by the currency. Thus, despite China’s growing economic prowess and
deliberate efforts, the RMB’s progress can be constrained by non-economic factors. Obviously,
maintaining controls on both capital inflows to and outflows from China will act as a brake on
the RMB internationalization.
In hindsight, China’s botched handling of the mid-2015 market turmoil caused global
investors to re-assess the RMB globalization process. The fiasco stirred up concerns on China’s
inextricable link of economic policy and political ideology, and the uncertainty surrounding
China’s determination on liberalizing financial markets. These concerns do not help to
popularize the RMB. The growth of RMB global usage is further hampered by the China-US
20
trade dispute, which has spilled over to technology and finance areas. As noted in previous
sections, these events all contributed to the slowdown in RMB progress in the second half of the
2010s.
5.2 Multipronged strategy: positive and negative factors
Despite these tensions, China has continued its multipronged strategy to promote the
RMB’s global usage and acceptance directly and indirectly while keeping a tight grip on the
currency. One approach involves strengthening geopolitical and geoeconomic influence. In this
regard, China has increased its level of engagement and secured key positions in major
international organizations such as the United Nations, IMF, and the World Bank, and has joined
a variety of other international organizations.27 China has also set up its own international
economic and financial network, including the Asian Infrastructure Investment Bank, Belt and
Road Initiative, New Development Bank, and Shanghai Cooperation Organisation. By
participating in these existing and new international organizations, China strengthens the
political and economic links with the rest of the world and creates more opportunities for
soliciting support for global use of the RMB.
Another approach has been to step up efforts to open up domestic financial markets,
including stock, bond, and commodity markets to authorized global investors. For the onshore
stock and bond markets, this already means global investors can participate via the Shanghai-
Hong Kong Stock Connect, the Shenzhen-Hong Kong Stock Connect, and Bond Connect
programs. Chinese stocks and bonds are also increasingly exposed to foreign investors as they
are included in internationally traded in global indexes. For example, onshore stocks and bonds
are included in the MSCI global and regional indexes, the Bloomberg Barclays Global Aggregate
Bond Index, and JP Morgan Government Bond Index – Emerging Markets. It is expected that
Chinese stocks and bonds will be included in more international indexes in the near future.28 The
inclusion in these benchmark indexes signifies the index provider’s recognition of China’s
financial market reform efforts and will enhance the RMB’s global acceptance and use.
27 China has taken part in different capacities in hundreds of international organizations (CIA World Factbook - https://www.cia.gov/library/publications/the-world-factbook/fields/317.html#CH). 28 FTSE Russell announced that Chinese government debt would be incorporated in its World Government Bond Index (subject to confirmation in March 2021).

21
In 2020, China initiated the testing phase of its digital RMB project.29 The introduction of
digital RMB highlights China’s leading position in the fintech field. The digital RMB will entail
a digital transaction platform offering low fees. Digital RMB transactions will be extended to
cross-border transactions if the digit transaction platform is connected to e.g. the CIPS. Similar
to the CIPS, the digital currency project could facilitate cross-border RMB and offshore RMB
businesses. In this sense, a digital RMB also advances the use of the Chinese currency overseas.
Of course, a digital RMB backed by China’s central bank could only be a form, but not a
fundamental, change if, for example, capital controls and exchange rate management policies
remain in place.
While China has actively prepared for the global usage of the RMB, some of its other
policies – including both economic and non-economic policies – may have unintended
consequences. The 2015 fiasco well illustrates the deterring effect of capital control policies.
Moreover, RMB internationalization is not purely China’s decision. Diplomacy is essential in
promoting international use of the RMB. Thus, while China has constantly emphasized a
peaceful development policy, territorial disputes with neighboring countries, especially in the
South China Sea, have served to revive historical animosities.30 These territorial disputes, which
do nothing to assuage China’s skeptics and complicate diplomacy, also create a drag on efforts to
promote the RMB’s global use. This is highly relevant as the most natural users of the RMB
would presumably be China’s neighbors. The RMB global image also is likely to be damaged by
its “wolf warrior” diplomacy, in which China adopts a belligerent attitude towards critics from
foreign governments and companies and blatantly deploys social media to ridicule foreigners
with different opinions.31
The trade dispute between the US and China that started in mid-2018 could also impede
RMB penetration into the global market. The implications of the dispute for the RMB usage are
beyond the trade relationship between the two countries. For instance, the trade dispute has
triggered the discussion of reshaping supply chains away from China, affecting China’s
economic interactions with other countries. The pandemic experience further makes re-
29 Kiff, et al. (2020) offers a recent survey of research on retail Central Bank Digital Currency (CBDC). Fernández-Villaverde et al. (2020) analyzes the implications of CBDC for private banking. 30 See e.g. Huang and Billo (2015). Stokes (2015) indicates that territorial disputes undermined China’s popularity in the region. 31 There are also complaints against China’s coercive diplomacy (Hanson et al., 2020). The growing unfavorability to this approach is reported in e.g. Silver, Devlin and Huang (2020).

22
structuring the global supply chain a serious topic. The trade dispute has gradually spilled over
into technology and finance spaces. Such a development makes the geopolitical situation more
complicated. The related increasing bellicose rhetoric can affect global investors’ views on, at
least temporarily, on the RMB’s prospects.
While China continues its efforts to promote the RMB’s global use from different policy
directions, the trajectory of the RMB global stature as measured by e.g. shares of international
reserves and world payments appears to have levelled off. For the RMB to evolve into a key
global currency, the process will benefit from deep, liquid, and transparent domestic financial
markets with limited capital controls and favorable geopolitical conditions that create credibility
and confidence for global investors.
6. Final thoughts
The replacement of an incumbent global currency is a rare occurrence in international finance.
The last time it happened was the US dollar replaced the British pound after WWII. There have
since been several unsuccessful challenge the US dollar’s global dominance by the Deutsche
mark, Japanese yen, and the euro.32 With support from China’s extraordinary economic
performance, the RMB was seen as in the early 2010s as the latest serious competitor to the US
dollar and a credible contender for the global currency title.
Naysayers are quick to point out that the US dollar’s global stature was never preordained.
The rise of the US dollar was supported by strong US economic and political attributes, not to
mention the trust conferred by global investors. These attributes include a dynamic and vibrant
US economy, a highly liquid and efficient financial sector, an open and transparent legal system,
and global economic and military leadership. With these vital economic and political
fundamentals, the US dollar has earned substantial credibility and trust from global investors
over time. While some claim that the Trump administration has weakened US economic
institutions, its legal system, and diplomatic links, it is unclear how such enfeeblements would
give the RMB a definite edge over the US dollar.
Despite China’s repeated reassurances, there are concerns about the scope and the pace of
its reform programs. Anecdotal evidence suggests that, while China has steadily opened its
32 See Eichengreen and Flandreau (2009), Franke (1999), Frankel (2012), Ministry of Finance, Japan (2003), and Takagi (2011). The euro attempt can be argued as an on-going case (European Commission, 2018).

23
domestic markets to foreign financial institutions, this has been at a pace set by China. The
question thus arises as to whether such policies are likely to make China’s promises of unfettered
capital flows at market-driven exchange rates convincing to the global community. After all, the
confidence of global investors and their trust in the currency affect the rate at which the RMB
penetrates international financial markets and gains dominance as the top global currency.
There is no doubt that the RMB is currently under-represented in the global market, and
its role is not commensurate with China’s global economic importance. The RMB global role
will be enhanced over time as China continues to liberalize its financial markets, loosen its grip
on the RMB, and reduce restrictions on capital flows. The US dollar has been the top global
currency for over 75 years and definitely enjoys an incumbency advantage. China’s deliberate
and systematic policies will doubtless assist in the RMB’s quest for global stature, but they are
unlikely to dethrone the incumbent US dollar in the near term.

24
References
Bank for International Settlements (2019). Triennial Central Bank Survey of Foreign Exchange and Derivatives Market Activity in 2019, Bank for International Settlements: Basel.
Bank for International Settlements (2016). Triennial Central Bank Survey of Foreign Exchange and Derivatives Market Activity in 2016, Bank for International Settlements: Basel.
Bank for International Settlements (2013). Triennial Central Bank Survey of Foreign Exchange and Derivatives Market Activity in 2013, Bank for International Settlements: Basel.
Bank for International Settlements (2010). Triennial Central Bank Survey of Foreign Exchange and Derivatives Market Activity in 2010, Bank for International Settlements: Basel.
Bank of Russia (2020). Bank of Russia Annual Report for 2019, Bank of Russia.
Bank of Russia (2019). Bank of Russia Annual Report for 2018, Bank of Russia.
BOFIT (2020). “Oil revenues also boost Russia’s foreign currency and gold reserves,” BOFIT Weekly 2020/03. https://www.bofit.fi/en/monitoring/weekly/2020/vw202003_4/.
Boz, Emine, Camila Casas, Georgios Georgiadis, Gita Gopinath, Helena Le Mezo, Arnaud Mehl, and Tra Nguyen (2020). “Patterns in Invoicing Currency in Global Trade,” Working Paper (WP/20/126), IMF.
Chen, Hongyi, and Wensheng Peng (2010). “The Potential of the Renminbi as an International Currency.” In Wensheng Peng and Chang Shu (eds.), Currency Internationalization: Global Experiences and Implications for the Renminbi, (pp. 115-138), London: Palgrave Macmillan.
Chen, Hongyi, Wensheng Peng, and Chang Shu (2009). “Renminbi as an International Currency: Potential and Policy Considerations,” Working Paper (No. 18/2009), HKIMR.
Cheung, Yin-Wong (2015). “The role of offshore financial centers in the process of renminbi internationalization.” In Barry Eichengreen and Masahiro Kawai (eds.), Renminbi internationalization: Achievements, prospects, and challenges, (pp. 207-235), Tokyo: Asian Development Bank Institute & Washington: Brookings Institution Press.
Cheung, Yin-Wong, Guonan Ma, and Robert N. McCauley (2011). “Renminbising China’s foreign assets,” Pacific Economic Review, 16(1), 1-17.
Cheung, Yin-Wong, Robert N. McCauley, and Chang Shu (2019). “Geographic spread of currency trading: The renminbi and other EM currencies,” China & World Economy, 27(5), 25-36.
Cheung, Yin-Wong, and Matthew Yiu (2017). “Offshore renminbi trading: Findings from the 2013 Triennial Central Bank Survey,” International Economics, 152, 9-20.
Chinn, Menzie D., and Jeffrey Frankel (2007). “Will the Euro Eventually Surpass the Dollar as Leading International Reserve Currency?” In Richard H. Clarida (ed.), G7 Current

25
Account Imbalances: Sustainability and Adjustment, (pp. 283-338), Chicago: University of Chicago Press.
Economist Intelligence Unit (2014). “Renminbi Rising: Onshore and Offshore Perspectives on Chinese Financial Liberalization,” The Economist, February.
Ehlers, Torsten and Frank Packer (2013). “FX and derivatives markets in emerging economies and the internationalization of their currencies,” BIS Quarterly Review, December, 55-67.
Ehlers, Torsten, Frank Packer and Feng Zhu (2016). “The changing landscape of renminbi offshore and onshore markets,” BIS Quarterly Review, December, 72-73.
Eichengreen, Barry (2013). “Renminbi Internationalization: Tempest in a Teapot?” Asian Development Review, 30, 148-164.
Eichengreen, Barry (2014). “International Currencies Past, Present and Future: Two Views from Economic History,” Working Paper (No. 2014-31), Bank of Korea.
Eichengreen, Barry and Marc Flandreau (2009). “The rise and fall of the dollar (or when did the dollar replace sterling as the leading international currency?),” European Review of Economic History, 13, 377-411.
Eichengreen, Barry and Masahiro Kawai (eds.) (2015). Renminb Internationalization: Achievements, Prospects, and Challenges, Tokyo: Asian Development Bank Institute & Washington: Brookings Institution Press.
Eichengreen, Barry and Domenico Lombardi (2017). “RMBI or RMBR: Is the renminbi destined to become a global or regional currency?” Asian Economic Papers, 16(1), 35-59.
European Commission (2018). “Towards a Stronger International Role of the Euro: Commission Contribution to the European Council and the Euro Summit”, December 13-14, https://ec.europa.eu/commission/publications/towards-stronger-international-role-euro-commission-contribution-european-council-13-14-december-2018_en.
Fernández-Villaverde, Jesús, Daniel Sanches, Linda Schilling, and Harald Uhlig (2020). “Central Bank Digital Currency: Central Banking For All?” Working Paper No. 26753, NBER.
Franke, Günter (1999). “The Bundesbank and the Markets.” In Deutsche Bundesbank (eds.) Fifty Years of the Deutsche Mark: Central Bank and the Currency in Germany since 1948”, (pp. 219-267), Oxford: Oxford University Press.
Frankel, Jeffrey (2012). “Internationalization of the RMB and Historical Precedents,” Journal of Economic Integration, 27, 329-65.
Garcia-Herrero, Alicia and Le Xia (2015). “RMB bilateral swap agreements: How China chooses its partners,” Asia-Pacific Journal of Accounting & Economics, 22 (4), 368-383.

26
Gopinath, Gita, Emine Boz, Camila Casas, Federico J. Díez, Pierre-Olivier Gourinchas, and Mikkel Plagborg-Møller (2020). “Dominant Currency Paradigm,” American Economic Review, 110(3), 677-719.
Hanson, Fergus, Emilia Currey, and Tracy Beattie (2020). “The Chinese Communist Party’s Coercive Diplomacy,” Policy Brief (Report No. 36/2020), Australia: Australian Strategic Policy Institute International Cyber Policy Centre.
He, Qing, Iikka Korhonen, Junjie Guo, and Fangge Liu (2016). “The geographic distribution of international currencies and RMB internationalization,” International Review of Economics and Finance, 42, 442–458.
Hu, Fred (2008). “The Role of the RMB in the World Economy,” Cato Journal, 28, 219-224.
Huang, Jing and Andrew Billo, eds. (2015). Territorial Disputes in the South China Sea: Navigating Rough Waters, London: Palgrave Macmillan.
International Monetary Fund (2010). “Reserve Accumulation and International Monetary Stability: Supplementary Information,” Policy Papers Supplementary Information, International Monetary Fund - Strategy, Policy and Review Department, www.imf.org/external/np/pp/eng/2010/041310a.pdf.
Kamel, Maha and Hongying Wang (2019). “Petro-RMB? The Oil Trade and the Internationalization of the Renminbi,” International Affairs, 95 (5), 1131–1148.
Kiff, John, Jihad Alwazir, Sonja Davidovic, Aquiles Farias, Ashraf Khan, Tanai Khiaonarong, Majid Malaika, Hunter K Monroe, Nobu Sugimoto, Hervé Tourpe, and Peter Zhou (2020). “A Survey of Research on Retail Central Bank Digital Currency,” IMF Working Paper (WP/20/104).
Lane, Philip R., and Dominic Burke (2001). “The Empirics of Foreign International Reserves,” Open Economies Review, 12, 423-434.
Lee, Jong-Wha (2014). “Will the Renminbi Emerge as an International Reserve Currency?” World Economy, 37(1), 42-62.
Liao, Steven and Daniel McDowell (2015). “Redback Rising: China’s Bilateral Swap Agreements and Renminbi Internationalization,” International Studies Quarterly, 59(3), 401-422.
Li, Cheng, and Xiaojing Zhang (2017). “Renminbi Internationalization in the New Normal: Progress, Determinants and Policy Discussions,” China & World Economy, 25(2), 22-44.
Lin, Zhitao, Wenjie Zhan, and Yin-Wong Cheung (2016). “China’s Bilateral Currency Swap Lines,” China & World Economy, 24(6), 19-42.
Lu, Yinqiu, and Yilin Wang (2019). “Determinants of Currency Composition of Reserves: A Portfolio Theory Approach with an Application to RMB,” IMF Working Paper (WP/19/52).
27
Mathews, John A. and Mark Selden (2018). “China: The Emergence of the Petroyuan and the Challenge to US Dollar Hegemony,” The Asia-Pacific Journal, 16 (22:3), Article ID 5218.
Ministry of Finance, Japan (2003). “Promotion of the Internationalization of the Yen,” Chairpersons' Report - Study Group on the Promotion of the Internationalisation of the Yen.
Packer, Frank, Andreas Schrimpf, and Vladyslav Sushko (2019). “Renminbi turnover tilts onshore,” BIS Quarterly Review, December, 35-6.
People’s Bank of China (2015). “Public Announcement of the People’s Bank of China on Reforming the RMB Exchange Rate Regime,” http://www.pbc.gov.cn/english/130721/2831438/index.html.
People’s Bank of China (2020). 2020 RMB Internationalization Report, People’s Bank of China.
Prasad, Eswar S. (2016). Gaining Currency: The Rise of the Renminbi, Oxford: Oxford University Press.
Prasad, Eswar, and Sandy Lei Ye (2013). “The Renminbi’s Prospects as a Global Reserve Currency,” Cato Journal, 33 (3), 563-570.
Salameh, Mamdouh G. (2018). “Will the Petro-Yuan Be the Death Knell for the Petrodollar?” USAEE Working Paper No. 18-338.
Schrimpf, Andreas, and Vladyslav Sushko (2019). “Sizing up global foreign exchange markets,” BIS Quarterly Review, December, 21-38.
Silver, Laura, Kat Devlin, and Christine Huang (2020). Unfavorable Views of China Reach Historic Highs in Many Countries, Pew Research Center.
Solanko, Laura (2020). “Will Coronavirus affect Russia’s ‘pivot to the East’?” Bulletin Blog, Bank of Finland, https://www.bofbulletin.fi/en/blogs/2020/will-coronavirus-affect-russia-s-pivot-to-the-east/.
Song, Ke, and Le Xia (2020). “Bilateral swap agreement and Renminbi settlement in cross- border trade,” Economic and Political Studies, 8(3), 355-373.
Standard Chartered Bank (2012). “CNH – Introducing the Renminbi Globalization Index,” Standard Chartered Bank Global Research. November 14, “On the ground” newsletter.
Standard Chartered Bank (2020). “Offshore Renminbi – Staying active,” Standard Chartered Bank Global Research, May 13 “On the ground” newsletter.
State Administration of Foreign Exchange (2019a). “Abolish Restrictions on the Investment Quota of Qualified Foreign Investors (QFII/ RQFII) and Further Expand the Opening up of Financial Markets,” https://www.safe.gov.cn/en/2019/0910/1552.html.

28
State Administration of Foreign Exchange (2019b). State Administration of Foreign Exchange 2018 Annual Report, State Administration of Foreign Exchange.
State Administration of Foreign Exchange (2020). State Administration of Foreign Exchange 2019 Annual Report, State Administration of Foreign Exchange.
Stokes, Bruce (2015). “How Asia-Pacific Publics See Each Other and Their National Leaders,” Washington: Pew Research Center.
Subramanian, Arvind (2011a). “Renminbi Rules: The Conditional Imminence of the Reserve Currency Transition,” Working Paper No. 11–14, Peterson Institute for International Economics.
Subramanian, Arvind (2011b). Eclipse: Living in the Shadow of China’s Economic Dominance, Washington: Institute of International Economics.
SWIFT (2012), RMB Tracker – January 2012, SWIFT.
SWIFT (2015). RMB Tracker – September 2015, SWIFT.
SWIFT (2020), RMB Tracker – July 2020, SWIFT.
World Bank Group (2018). Commodity Markets Outlook (October), Washington: World Bank.
Takagi, Shinji (2011). “Internationalizing the Yen, 1984–2003: Unfinished Agenda or Mission Impossible?” In Cheung, Yin-Wong, and Gounan Ma (eds.), Asia and China in the Global Economy, (pp. 219-244), Singapore: World Scientific Publishing.
Yi, Gang (2020). “The IMF should turn to special drawing rights in its Covid-19 response,” Financial Times, July 16, Opinion section.
Yu, Yongding, and Haihong Gao (2011). “Internationalisation of the Renminbi.” In Yin-Wong Cheung and Guonan Ma (eds.), Asia and China in the Global Economy, (pp. 191-217), Singapore: World Scientific Publishing.
Zhou, Xiaochuan (2009). “Reform the International Monetary System,” BIS Review, 41/2009, http://www.bis.org/review/r090402c.pdf.

29
Appendix A.1. Shares of oil futures trading volume, major crude exchanges (Bloomberg Intelligence).
A.2. US dollar share of allocated global official reserves, 1965–2019 (COFER, IMF)
0%
10%
20%
30%
40%
50%
60%
70%
80%
90%
1965
1967
1969
1971
1973
1975
1977
1979
1981
1983
1985
1987
1989
1991
1993
1995
1997
1999
2001
2003
2005
2007
2009
2011
2013
2015
2017
2019

30
A3. Direct foreign exchange trading with other currencies The table lists, besides the Hong Kong dollar and the US dollar, the currencies that have official direct bilateral currency trading arrangements with the RMB in CFETS.
Starting date Currency August 2010 Malaysian ringgit December 2010 Russian ruble June 2012 Japanese yen April 2013 Australian dollar March 2014 New Zealand dollar June 2014 British pound September 2014 Euro October 2014 Singapore dollar November 2015 Swiss franc June 2016 Korean won June 2016 September 2016 September 2016 November 2016 December 2016 December 2016 December 2016 December 2016 December 2016 December 2016 December 2016
South African rand UAE dirham Saudi riyal Canadian dollar Hungarian forint Danish krone Polish zloty Swedish krona Norwegian krone Turkish lira Mexican peso
February 2018 Thai baht

31
Table 1. Offshore RMB clearing banks
Offshore financial center Authorization (PBoC) Authorized bank Hong Kong, China December 2003 Bank of China, Hong Kong Macau, China September 2004 Bank of China Taiwan December 2012 Bank of China Singapore February 2013 Industrial and Commercial Bank of China London, UK June 2014 China Construction Bank Frankfurt, Germany June 2014 Bank of China Seoul, South Korea July 2014 Bank of Communications Paris, France September 2014 Bank of China Luxembourg September 2014 Industrial and Commercial Bank of China Doha, Qatar November 2014 Industrial and Commercial Bank of China Toronto, Canada November 2014 Industrial and Commercial Bank of China Sydney, Australia November 2014 Bank of China Bangkok, Thailand January 2015 Industrial and Commercial Bank of China Kuala Lumpur, Malaysia January 2015 Bank of China Santiago, Chile May 2015 China Construction Bank Budapest, Hungary June 2015 Bank of China Johannesburg, South Africa July 2015 Bank of China Buenos Aires, Argentina September 2015 Industrial and Commercial Bank of China Zambia September 2015 Bank of China Zurich, Switzerland November 2015 China Construction Bank New York, US September 2016 Bank of China
J.P. Morgan (February 14, 2018) Moscow, Russia September 2016 Industrial and Commercial Bank of China Dubai, UAE December 2016 Agricultural Bank of China Karachi, Pakistan May 2018 Bank of China Tokyo, Japan October 2018 Bank of China
MUFG Bank (May 2019) Manila, Philippines September 2019 Bank of China
Sources: Bloomberg, People’s Bank of China (PBoC), and State Administration of Foreign Exchange (SAFE).

32
Table 2. Bilateral RMB Currency Swap Agreements
Signing date Counterparty Swap amount 20 January 2009 Hong Kong Monetary Authority RMB 200 billion and HK$ 227 billion 8 February 2009 Bank Negara Malaysia RMB 80 billion and MYR 40 billion 11 March 2009 National Bank of the Republic of Belarus RMB 20 billion and BYR 8 trillion 23 March 2009 Bank Indonesia RMB 100 billion and IDR 175 trillion 2 April 2009 Central Bank of Argentina RMB 70 billion and ARS 38 billion 20 April 2009 Bank of Korea RMB 180 billion and KRW 38 trillion 9 June 2010 The Central Bank of Iceland RMB 3.5 billion and ISK 66 billion 23 July 2010 Monetary Authority of Singapore RMB 150 billion and SG$ 30 billion 18 April 2011 Reserve Bank of New Zealand RMB 25 billion and NZD 5 billion 19 April 2011 Central Bank of the Republic of Uzbekistan RMB 0.7 billion and UZS 167 billion 6 May 2011 Bank of Mongolia RMB 5 billion and MNT 1 trillion 13 June 2011 National Bank of Kazakhstan RMB 7 billion and KZT 150 billion 26 October 2011 Bank of Korea RMB 360 billion and KRW 64 trillion 22 November 2011 Hong Kong Monetary Authority RMB 400 billion and HK$ 490 billion 22 December 2011 Bank of Thailand RMB 70 billion and THB 320 billion 23 December 2011 State Bank of Pakistan RMB 10 billion and PKR 140 billion 17 January 2012 Central Bank of the United Arab Emirates RMB 35 billion and AED 20 billion 8 February 2012 Bank Negara Malaysia RMB 180 billion and MYR 90 billion 21 February 2012 Central Bank of the Republic of Turkey RMB 10 billion and TRY 3 billion 20 March 2012 Bank of Mongolia RMB 10 billion and MNT 2 trillion 22 March 2012 Reserve Bank of Australia RMB 200 billion and AUD 30 billion 26 June 2012 National Bank of Ukraine RMB 15 billion and UAH 19 billion 7 March 2013 Monetary Authority of Singapore RMB 300 billion and SG$ 60 billion 26 March 2013 Central Bank of Brazil RMB 190 billion and BRL 60 billion 22 June 2013 Bank of England RMB 200 billion and GBP 20 billion 9 September 2013 Hungarian National Bank RMB 10 billion and HUF 375 billion 12 September 2013 Bank of Albania RMB 2 billion and ALL 35.8 billion 30 September 2013 The Central Bank of Iceland RMB 3.5 billion and ISK 66 billion 9 October 2013 European Central Bank RMB 350 billion and EUR 45 billion 25 April 2014 Reserve Bank of New Zealand RMB 25 billion and NZD 5 billion 18 July 2014 Central Bank of Argentina RMB 70 billion and ARS 90 billion 21 July 2014 Swiss National Bank RMB 150 billion and CHF 21 billion 21 August 2014 Bank of Mongolia RMB 15 billion and MNT 4.5 trillion 16 September 2014 Central Bank of Sri Lanka RMB 10 billion and LKR 225 billion 11 October 2014 Bank of Korea RMB 360 billion and KRW 64 trillion 13 October 2014 The Central Bank of the Russian Federation RMB 150 billion and RUB 815 billion 3 November 2014 Qatar Central Bank RMB 35 billion and QAR 20.8 billion 8 November 2014 Bank of Canada RMB 200 billion and CAD 30 billion 22 November 2014 Hong Kong Monetary Authority RMB 400 billion and HK$ 505 billion 14 December 2014 National Bank of Kazakhstan RMB 7 billion and KZT 200 billion 22 December 2014 Bank of Thailand RMB 70 billion and THB 370 billion 23 December 2014 State Bank of Pakistan RMB 10 billion and PKR 165 billion 18 March 2015 Central Bank of Suriname RMB 1 billion and SRD 520 million 25 March 2015 Central Bank of Armenia RMB 1 billion and AMD 77 billion 30 March 2015 Reserve Bank of Australia RMB 200 billion and AUD 40 billion 10 April 2015 South African Reserve Bank RMB 30 billion and ZAR 54 billion 17 April 2015 Bank Negara Malaysia RMB 180 billion and MYR 90 billion
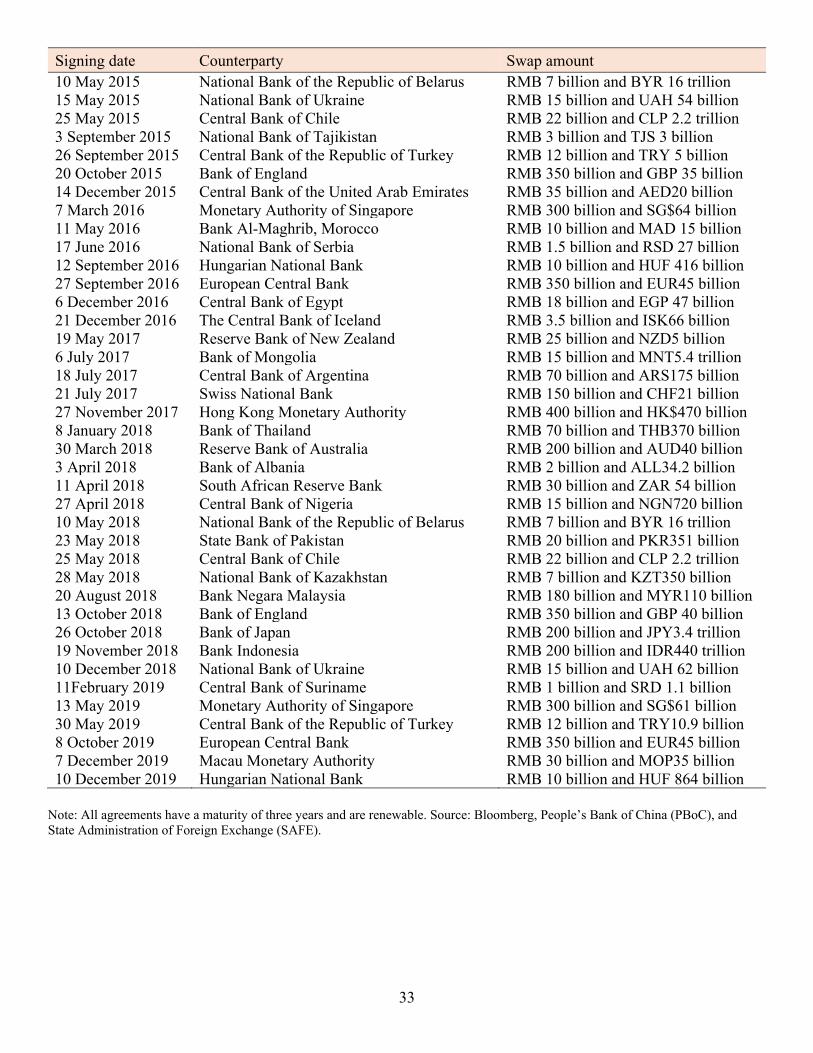
33
Signing date Counterparty Swap amount 10 May 2015 National Bank of the Republic of Belarus RMB 7 billion and BYR 16 trillion 15 May 2015 National Bank of Ukraine RMB 15 billion and UAH 54 billion 25 May 2015 Central Bank of Chile RMB 22 billion and CLP 2.2 trillion 3 September 2015 National Bank of Tajikistan RMB 3 billion and TJS 3 billion 26 September 2015 Central Bank of the Republic of Turkey RMB 12 billion and TRY 5 billion 20 October 2015 Bank of England RMB 350 billion and GBP 35 billion 14 December 2015 Central Bank of the United Arab Emirates RMB 35 billion and AED20 billion 7 March 2016 Monetary Authority of Singapore RMB 300 billion and SG$64 billion 11 May 2016 Bank Al-Maghrib, Morocco RMB 10 billion and MAD 15 billion 17 June 2016 National Bank of Serbia RMB 1.5 billion and RSD 27 billion 12 September 2016 Hungarian National Bank RMB 10 billion and HUF 416 billion 27 September 2016 European Central Bank RMB 350 billion and EUR45 billion 6 December 2016 Central Bank of Egypt RMB 18 billion and EGP 47 billion 21 December 2016 The Central Bank of Iceland RMB 3.5 billion and ISK66 billion 19 May 2017 Reserve Bank of New Zealand RMB 25 billion and NZD5 billion 6 July 2017 Bank of Mongolia RMB 15 billion and MNT5.4 trillion 18 July 2017 Central Bank of Argentina RMB 70 billion and ARS175 billion 21 July 2017 Swiss National Bank RMB 150 billion and CHF21 billion 27 November 2017 Hong Kong Monetary Authority RMB 400 billion and HK$470 billion 8 January 2018 Bank of Thailand RMB 70 billion and THB370 billion 30 March 2018 Reserve Bank of Australia RMB 200 billion and AUD40 billion 3 April 2018 Bank of Albania RMB 2 billion and ALL34.2 billion 11 April 2018 South African Reserve Bank RMB 30 billion and ZAR 54 billion 27 April 2018 Central Bank of Nigeria RMB 15 billion and NGN720 billion 10 May 2018 National Bank of the Republic of Belarus RMB 7 billion and BYR 16 trillion 23 May 2018 State Bank of Pakistan RMB 20 billion and PKR351 billion 25 May 2018 Central Bank of Chile RMB 22 billion and CLP 2.2 trillion 28 May 2018 National Bank of Kazakhstan RMB 7 billion and KZT350 billion 20 August 2018 Bank Negara Malaysia RMB 180 billion and MYR110 billion 13 October 2018 Bank of England RMB 350 billion and GBP 40 billion 26 October 2018 Bank of Japan RMB 200 billion and JPY3.4 trillion 19 November 2018 Bank Indonesia RMB 200 billion and IDR440 trillion 10 December 2018 National Bank of Ukraine RMB 15 billion and UAH 62 billion 11February 2019 Central Bank of Suriname RMB 1 billion and SRD 1.1 billion 13 May 2019 Monetary Authority of Singapore RMB 300 billion and SG$61 billion 30 May 2019 Central Bank of the Republic of Turkey RMB 12 billion and TRY10.9 billion 8 October 2019 European Central Bank RMB 350 billion and EUR45 billion 7 December 2019 Macau Monetary Authority RMB 30 billion and MOP35 billion 10 December 2019 Hungarian National Bank RMB 10 billion and HUF 864 billion
Note: All agreements have a maturity of three years and are renewable. Source: Bloomberg, People’s Bank of China (PBoC), and State Administration of Foreign Exchange (SAFE).

34
Table 3. RQFII Accumulated Approved Quota (RMB billion as of December 2019)
Location Authorized quota limit Accumulated Approved Quota Hong Kong 500 345.817 Singapore 100 78.255 United Kingdom 80 48.484 France 80 24.0 South Korea 120 78.887 Germany 80 10.543 Canada 50 8.853 Australia 50 32.006 Switzerland 50 9.6 Luxembourg 50 15.187 Malaysia 50 1.6 Thailand 50 2.1 United States 250 32.52 Ireland 50 1.85 Japan 200 9.0 IMF 1.6 Netherlands 50 Chile 50 Hungary 50 Qatar 30 UAE 50
Sources: Bloomberg, People’s Bank of China (PBoC), and State Administration of Foreign Exchange (SAFE).

35
Table 4. FX average daily turnover, economic size, and trade volume Turnover share (%) Turnover/GDP (%) Turnover/Trade (%) USD 2019 88.30 27.98 138.27
2016 87.58 24.20 120.10 2013 87.04 28.61 122.43 2010 84.86 23.20 121.02
EUR 2019 32.28 15.77 22.10
2016 31.39 13.60 20.06 2013 33.41 14.15 20.24 2010 39.04 11.78 20.77
JPY 2019 16.81 22.42 75.44
2016 21.62 24.69 88.16 2013 23.05 20.66 75.20 2010 18.99 14.21 61.82
GBP 2019 12.79 29.65 72.45
2016 12.80 22.26 60.65 2013 11.82 23.30 54.27 2010 12.88 20.60 56.33
CNY 2019 4.32 2.09 6.17
2016 3.99 1.84 5.32 2013 2.23 1.37 3.00 2010 0.86 0.65 1.43
HKD 2019 3.53 63.91 19.70
2016 1.73 28.14 8.33 2013 1.45 29.12 8.09 2010 2.37 43.05 13.29
Note: For the SDR currencies and the Hong Kong dollar, the table lists their shares of global FX average daily turnover, average daily turnover to GDP ratios, and average daily turnover to international trade ratios based on data from the Bank for International Settlements (2010, 2013, 2016, 2019), IFS and IMF DOTS.

36
Table 5. Geographical distribution of global FX turnover
2010 2013 2016 2019 US 17.9% (2) 18.9% (2) 19.5% (2) 16.5% (2) Euro Area 9.4% (3) 9.0% (3) 8.2% (3) 6.5% (5) Japan 6.2% (4) 5.6% (5) 6.1% (6) 4.5% (6) United Kingdom 36.7% (1) 40.9% (1) 36.9% (1) 43.1% (1) China 0.4% (23) 0.7% (17) 1.1% (14) 1.6% (9) Hong Kong 4.7% (7) 4.1% (6) 6.7% (5) 7.6% (4)
Note: For each jurisdiction, the table reports its share of global FX average daily turnover and rank (in parentheses) based on data from the Bank for International Settlements (2010, 2013, 2016, 2019). Table 6. Global FX reserve holdings (USD billion), selected data Q4 2016 Q1 2017 Q4 2017 Q1 2018 Q4 2018 Q1 2019 Q4 2019 Q1 2020 Total 10727.24 10912.28 11457.89 11617.67 11436.07 11610.77 11824.74 11731.94 Allocated 8418.16 8832.16 10012.68 10401.28 10727.03 10897.83 11075.20 10961.62 Unallocated 2309.08 2080.12 1445.21 1216.38 709.04 712.93 749.55 770.32 allocated/total 78.47 80.94 87.39 89.53 93.80 93.86 93.66 93.43 USD 5501.86 5713.17 6280.48 6531.19 6623.30 6727.09 6744.83 6794.91 Euro 1610.82 1703.08 2019.19 2117.51 2217.38 2208.79 2279.30 2197.30 JPY 333.70 400.76 491.01 477.28 557.65 584.63 631.00 624.97 GBP 365.09 376.98 454.12 486.13 474.17 495.70 511.51 486.08 RMB 90.29 94.89 123.47 145.67 203.08 212.26 215.81 221.48 Allocated shares USD 65.36 64.69 62.73 62.79 61.74 61.73 60.90 61.99 Euro 19.14 19.28 20.17 20.36 20.67 20.27 20.58 20.05 JPY 3.96 4.54 4.90 4.59 5.20 5.36 5.70 5.70 GBP 4.34 4.27 4.54 4.67 4.42 4.55 4.62 4.43 RMB 1.07 1.07 1.23 1.40 1.89 1.95 1.95 2.02 SDR-5 93.87 93.85 93.56 93.81 93.93 93.86 93.75 94.19 Other 2.34 2.32 2.43 2.45 2.47 2.42 2.54 2.33
Note: Global FX reserves holdings in selected currencies and as of selected dates extracted from COFER, IMF. Table 7. Correlation between specific currency share and total FX share
2010 2013 2016 2019 USD 0.9997 0.9998 0.9996 0.9997 Euro 0.9897 0.9907 0.9810 0.9888 GBP 0.9796 0.9862 0.9862 0.9867 JPY 0.8911 0.9611 0.9188 0.9279 RMB 0.4719 0.4247 0.5257 0.4941
Note: For a given currency and a given year, the fable reports the correlation between a financial center’s share of the currency’s turnover and its share of total FX trading.

37
Table 8. The top four Offshore RMB FX Trading Centers
Rank 2010 2013 2016 2019
1 Hong Kong
36.33
Hong Kong 43.38
Hong Kong 38.58
Hong Kong 41.41
2 Singapore
25.30
United Kingdom 21.29
Singapore 21.29
United Kingdom 21.80
3 United Kingdom
23.01
Singapore 20.92
United Kingdom 19.56
Singapore 16.38
4 United States
10.28
United States 7.56
United States 12.13
United States 11.49
Note: The table lists the top four offshore RMB FX trading centers as reported in the corresponding BIS triennial survey. Each trading center’s share of offshore RMB trading in percentage is given under its name.
Table 9. Growth of offshore and onshore trading
2010-13 2013-16 2016-19
USD (total) 35.56 -1.64 27.32 onshore 42.60 -1.60 10.39 offshore 33.99 -1.65 31.34
Euro (total) 13.59 -8.96 30.90
onshore 20.06 -9.80 7.17 offshore 12.44 -8.80 35.35
GBP (total) 21.93 4.11 28.08
onshore 28.47 -6.05 48.47 offshore 14.82 16.47 8.07
JPY (total) 62.91 -5.31 -2.36
onshore 13.50 11.88 -7.51 offshore 80.88 -9.24 -0.91
RMB (total) 276.74 72.90 41.54
onshore 244.07 65.14 82.87 offshore 287.56 75.18 30.08
Global FX turnover 33.15 -2.98 26.61
Note: The table presents the growth of FX trading turnover over the BIS triennial surveys indicated in the column headings. For each SDR currency, it reports the growth rates in percentage of the currency’s turnover, of its onshore trading, and its offshore trading. The row labelled “Global FX turnover” gives the growth rates of the global FX turnover across these surveys.

38
Figure 1. The RMB as a global payments currency.
Source: SWIFT RMB Tracker (various issues).
Figure 2. The Standard Chartered Renminbi Globalisation Index.
Source: Standard Chartered Bank (https://research.sc.com/rgi-dashboard/).