
cjar.pdf - CityU College of Business
110
CYAN MAGENTA YELLOW BLACK Volume 10 • Issue 3 • September 2017 Consulting Editors Bin Ke, National University of Singapore T.J. Wong, University of Southern California Editors-in-Chief J.B. Kim, City University of Hong Kong Minghai Wei, Sun Yat-sen University Associate Editors Donghua Chen, Nanjing University Oliver Zhen Li, National University of Singapore Feng Liu, Xiamen University Oliver Rui, China Europe International Business School Xijia Su, China Europe International Business School Donghui Wu, The Chinese University of Hong Kong Editorial Board Sudipta Basu, Temple University Jeffrey Callen, University of Toronto Charles J.P. Chen, China Europe International Business School Shijun Cheng, University of Maryland Xingqiang Du, Xiamen University Zhaoyang Gu, The Chinese University of Hong Kong Charles Hsu, The Hong Kong University of Science and Technology Thomas Jeanjean, Essec Business School Guohua Jiang, Peking University Clive S. Lennox, University of Southern California Bingxuan Lin, The University of Rhode Island Changjiang Lv, Fudan University Zengquan Li, Shanghai University of Finance and Economics Gerald Lobo, University of Houston Suresh Radhakrishnan, University of Texas at Dallas Dan A. Simunic, The University of British Columbia Herve ´ Stolowy, HEC Paris Joanna Shuang Wu, University of Rochester Jingsong Tan, Sun Yat-sen University Stella Wu, University of Western Sydney Xi Wu, Central University of Finance and Economics Zezhong Xiao, Cardiff University Zhifeng Yang, Stony Brook University Zili Zhuang, The Chinese University of Hong Kong Editorial Office Xiaoyan Lu Junsheng Zhang Guojian Zheng Ying Zheng ISSN 1755-3091 Available online at www.sciencedirect.com ScienceDirect China Journal of Accounting Research Five-year plans, China finance and their consequences Donghua Chen, Oliver Zhen Li, Fu Xin 189 The significance of research—Comments on the Five-Year Plan paper Feng Liu 227 How much control causes tunneling? Evidence from China Wenting Chen, Shanmin Li, Crystal Xiaobei Chen 231 Influence of Chinese entrepreneurial companiesÕ internationa- lization on independent innovation: Input incentive effect and efficiency improvement effect Xin Xu, Yun Xia, Chuntao Li 247 Stock index adjustments, analyst coverage and institutional holdings: Evidence from China Song Zhu, Xiaoyu Jiang, Xiaoli Ke, Xiaoyu Bai 281 HOSTED BY 10 3 China Journal of Accounting Research Vol. 10/3 (2017) 189–294 ELSEVIER Aims and Scope The focus of the China Journal of Accounting Research is to publish theoretical and empirical research papers that use contemporary research methodologies to investigate issues about accounting, finance, auditing and corporate governance in China, the Greater China region and other emerging markets. The Journal also publishes insightful commentaries about China-related accounting research. The Journal encourages the application of economic and sociological theories to analyze and explain accounting issues under Chinese capital markets accurately and succinctly. The published research articles of the Journal will enable scholars to extract relevant issues about accounting, finance, auditing and corporate governance relate that to the capital markets and institutional environment of China. China Journal of Accounting Research Website: http://www.cnjar.com http://www.cb.cityu.edu.hk/research/cjar
-
Upload
khangminh22 -
Category
Documents
-
view
1 -
download
0
Transcript of cjar.pdf - CityU College of Business

CYAN MAGENTA YELLOW BLACK
Volume 10 • Issue 3 • September 2017Consulting Editors
Bin Ke,
National University of Singapore
T.J. Wong,
University of Southern California
Editors-in-Chief
J.B. Kim,
City University of Hong Kong
Minghai Wei, Sun Yat-sen University
Associate Editors
Donghua Chen, Nanjing University
Oliver Zhen Li,
National University of Singapore
Feng Liu, Xiamen University
Oliver Rui,
China Europe International Business School
Xijia Su,
China Europe International Business School
Donghui Wu,
The Chinese University of Hong Kong
Editorial Board
Sudipta Basu, Temple University
Jeffrey Callen, University of Toronto
Charles J.P. Chen,
China Europe International Business School
Shijun Cheng, University of Maryland
Xingqiang Du, Xiamen University
Zhaoyang Gu,
The Chinese University of Hong Kong
Charles Hsu,
The Hong Kong University of Science and Technology
Thomas Jeanjean, Essec Business School
Guohua Jiang, Peking University
Clive S. Lennox,
University of Southern California
Bingxuan Lin, The University of Rhode Island
Changjiang Lv, Fudan University
Zengquan Li,
Shanghai University of Finance and Economics
Gerald Lobo, University of Houston
Suresh Radhakrishnan,
University of Texas at Dallas
Dan A. Simunic, The University of British Columbia
Herve Stolowy, HEC Paris
Joanna Shuang Wu, University of Rochester
Jingsong Tan, Sun Yat-sen University
Stella Wu, University of Western Sydney
Xi Wu,
Central University of Finance and Economics
Zezhong Xiao, Cardiff University
Zhifeng Yang, Stony Brook University
Zili Zhuang,
The Chinese University of Hong Kong
Editorial Office
Xiaoyan Lu
Junsheng Zhang
Guojian Zheng
Ying Zheng
ISSN 1755-3091
Available online at www.sciencedirect.com
ScienceDirect
China Journal ofAccountingResearch
Five-year plans, China finance and their consequencesDonghua Chen, Oliver Zhen Li, Fu Xin 189
The significance of research—Comments on the Five-YearPlan paperFeng Liu 227
How much control causes tunneling? Evidence from ChinaWenting Chen, Shanmin Li, Crystal Xiaobei Chen 231
Influence of Chinese entrepreneurial companies� internationa-lization on independent innovation: Input incentive effect andefficiency improvement effectXin Xu, Yun Xia, Chuntao Li 247
Stock index adjustments, analyst coverage and institutionalholdings: Evidence from ChinaSong Zhu, Xiaoyu Jiang, Xiaoli Ke, Xiaoyu Bai 281
HO ST E D BY
10
3
Ch
ina
Jo
urn
al
of
Acco
un
ting
Researc
hV
ol.
10/3
(2017)
189–
294
EL
SE
VIE
R
Aims and Scope
The focus of the China Journal of Accounting Research is to publish theoretical and empiricalresearch papers that use contemporary research methodologies to investigate issues aboutaccounting, finance, auditing and corporate governance in China, the Greater China regionand other emerging markets. The Journal also publishes insightful commentaries aboutChina-related accounting research. The Journal encourages the application of economic andsociological theories to analyze and explain accounting issues under Chinese capital marketsaccurately and succinctly. The published research articles of the Journal will enable scholarsto extract relevant issues about accounting, finance, auditing and corporate governance relate thatto the capital markets and institutional environment of China.
China Journal of Accounting Research
Website: http://www.cnjar.comhttp://www.cb.cityu.edu.hk/research/cjar

Production and hosting by Elsevier
Radarweg 29, 1043 NX Amsterdam, The Netherlands
ISSN 1755-3091
� China Journal of Accounting Research
Founded by Sun Yat-sen University and City University of Hong Kong
Sponsored by:
Published quarterly in March, June, September, and December
All rights reserved. No part of this journal may be reproduced, stored in a retrieval system or transmitted in any means, elec-tronic, mechanical, photocopying, recording or otherwise, without the prior permission of Editorial Office of China Journal ofAccounting Research.
Notice
No responsibility is assumed by China Journal of Accounting Research nor Elsevier for any injury and/or damage to persons,property as a matter of product liability, negligence, or otherwise, or from any use or operation of any methods, products, in-structions, or ideas contained in the material herein. Although all advertising material is expected to conform to ethical stan-dards, inclusion in this publication does not constitute a guarantee or endorsement of the quality or value of such product or ofthe claims made of it by its manufacturer.
China Journal of Accounting Research has been indexed by Emerging Sources Citation Index (ESCI), Cabell’s Directory,Scopus, CNKI, Australian Business Deans Council (ABDC) Journal Quality List and Excellence in Research for Australia (ERA)Journal List.
Guidelines for Manuscripts Submitted toThe China Journal of Accounting Research
The China Journal of Accounting Research ‘‘CJAR’’ (ISSN 1755-3091) publishes quarterly. It contains peer-reviewedarticles and commentaries on accounting, auditing and corporate governance issues that relate to the greater China region.
We welcome the submission of both theoretical and empirical research papers pertinent to researchers, regulators and practi-tioners. Authors should note:
1 Submissions must be original contributions and not under consideration by any other journal. The author must state the workis not submitted or published elsewhere.
2 Authors submitting articles, notes and comments will be entitled to two free copies. Each author of a book review will receivea copy of the relevant issue.
3 Authors should submit their manuscripts (in Word format) via email to [email protected]. All text, including endnotes,must be double-spaced. Authors will be notified when manuscripts are received by CJAR.
4 Authors should note:
• a cover page showing the title of the paper, the author’s name, title and affiliation, e-mail address, and any acknowledge-ment should be included.
• to promote anonymous review, author(s) should confine his/her identify (such as name, affiliation, biographical informa-tion, and acknowledgment) to the cover page only.
• supply an abstract of about 120 words, stating the study’s findings, sample and methodology in that order.
• key terms used in the text should be defined or explained as early as possible after they are first introduced.
• words in a foreign language are to be in italics.
• all citations in the text should refer to the author’s (or authors’) name and the year of publication.
Examples: ‘‘the debt contracting explanation for conservatism (Watts and Zimmerman, 1986; Basu, 1997; Ahmed et al,2002). Using the Basu (1997) asymmetric timeliness regression’’
• include a list of reference for works cited as follows:
• reference to a journal publication:
Basu, S., Waymire, G.B., 2006. Record keeping and human evolution. Accounting Horizons 20 (3), 201–229.
• reference to a book:
Watts, R.L., Zimmerman, J.L., 1986. Positive accounting theory. Prentice Hall, Englewood Cliffs, NJ.
• reference to a chapter in an edited book:
Ball, R., 2001. Infrastructure requirements for an economically efficient system of public financial reporting and disclo-sure, 127–169. In: Litan, R., Herring, R. (Editors), Brookings-Wharton Papers on Financial Services. Brookings InstitutionPress, Washington, DC.
• omit all full stops in abbreviations. Example: ‘eg’, ‘ie’, ‘Co’, ‘Ltd’, ‘etc’
• dates are in the order – date, month, year, eg ‘5 May 1975’
• quotation marks are single, but within a quotation are double.
• use endnotes rather than footnotes.
• put each table on a separate sheet; do not embed in the text but indicate where the table would best be inserted.
5 China Journal of Accounting Research copyright in works published by CJAR.
For additional information, please contact Irene Li, Department of Accountancy, City University of Hong Kong, Tat Chee Avenue,Kowloon Tong, Hong Kong. Telephone: +852 3442 7932. Fax: +852 3442 0349. E-mail: [email protected].

CHINA JOURNAL OF ACCOUNTING RESEARCH
Volume 10/3 (2017)
Available online at www.sciencedirect.com
ScienceDirect
HO ST E D BY

Consulting Editors
Bin Ke
National University of Singapore
T.J. Wong
University of Southern California
Editors-in-Chief
J.B. KimCity University of Hong Kong
Minghai WeiSun Yat-sen University
Associate Editors
Donghua Chen
Nanjing University
Oliver Zhen Li
National University of Singapore
Feng Liu
Xiamen University
Oliver Rui
China Europe International Business School
Xijia Su
China Europe International Business School
Donghui Wu
The Chinese University of Hong Kong
Editorial Board
Sudipta Basu, Temple UniversityJeffrey Callen, University of Toronto
Charles J.P. Chen, China Europe International Business SchoolShijun Cheng, University of Maryland
Xingqiang Du, Xiamen University
Zhaoyang Gu, The Chinese University of Hong KongCharles Hsu, The Hong Kong University of Science and Technology
Thomas Jeanjean, Essec Business SchoolGuohua Jiang, Peking University
Clive S. Lennox, University of Southern CaliforniaBingxuan Lin, The University of Rhode Island
Changjiang Lv, Fudan UniversityZengquan Li, Shanghai University of Finance and Economics
Gerald Lobo, University of HoustonSuresh Radhakrishnan, University of Texas at Dallas
Dan A. Simunic, The University of British ColumbiaHerve Stolowy, HEC Paris
Joanna Shuang Wu, University of RochesterJingsong Tan, Sun Yat-sen University
Stella Wu, University of Western SydneyXi Wu, Central University of Finance and Economics
Zezhong Xiao, Cardiff UniversityZhifeng Yang, Stony Brook University
Zili Zhuang, The Chinese University of Hong Kong
Editorial Office
Xiaoyan LuJunsheng Zhang
Guojian ZhengYing Zheng

Five-year plans, China finance and their consequences
Donghua Chen a,⇑, Oliver Zhen Li b, Fu Xin c
aNanjing University, ChinabNational University of Singapore, SingaporecHohai University, China
A R T I C L E I N F O
Article history:
Received 20 May 2016Accepted 5 June 2017Available online 23 August 2017
JEL classification:
G3O2P2P3
Keywords:
Five-year plansGovernment engineeringIndustrial policiesCorporate financeEconomic growthChina
A B S T R A C T
An important factor influencing corporate finance and economic growth inChina lies in its government sponsored industrial policies. Examining China’sfive-year plans during 1991–2010, we find that state-owned firms in govern-ment supported industries enjoy faster growth in initial public offerings andhigher offer prices. Further, they enjoy faster growth in loans granted by majornational banks. However, this preferential access to capital by state-ownedfirms appears to be achieved at the expense of non-state-owned firms whichare crowded out. Government support induces more investment but alsobrings more overinvestment, which mainly comes from the non-state sector.Finally, supported industries have higher stock market returns and cash flowgrowth that dampen when state ownership increases.� 2017 Sun Yat-sen University. Production and hosting by Elsevier B.V. Thisis an open access article under the CC BY-NC-ND license (http://creativecom-
mons.org/licenses/by-nc-nd/4.0/).
1. Introduction
While the first three decades after the establishment of the communist China in 1949 were marred by polit-ical turmoil, instabilities, ideological rigidness and natural and human-made disasters, China’s economy has
http://dx.doi.org/10.1016/j.cjar.2017.06.001
1755-3091/� 2017 Sun Yat-sen University. Production and hosting by Elsevier B.V.
This is an open access article under the CC BY-NC-ND license (http://creativecommons.org/licenses/by-nc-nd/4.0/).
⇑ Corresponding author.E-mail address: [email protected] (D. Chen).
q We thank workshop and conference participants at Fudan University, National Chengchi University, National University ofSingapore, National University of Taiwan, Peking University, University of Hong Kong, University of International Business andEconomics, China Accounting and Finance Review International Symposium 2010 and Journal of Contemporary Accounting andEconomics Conference 2013 for comments and suggestions. This project has benefited from a generous Tier 2 grant from the Ministry ofEducation of Singapore, # R-521-000-024-112 and National Natural Science Foundation of China, # 71372032.
China Journal of Accounting Research 10 (2017) 189–230
HO ST E D BY Contents lists available at ScienceDirect
China Journal of Accounting Research
journal homepage: www.elsevier .com/locate /c jar
China Journal of Accounting Research 10 (2017) 189–230
HO ST E D BY

been growing rapidly since the start of its economic reform in 1978. Its GDP reached about USD8.34 trillion(RMB51.93 trillion) in 2012 (National Bureau of Statistics of China, 2013), exceeding Japan to become thesecond largest economy in world in 2010. It currently has the largest foreign currency reserve in the world,reaching USD2.85 trillion in 2011, representing 30% of the global reserve (State Administration of ForeignExchange, 2011). China’s securities market was established just two decades ago. However, by the end of2010, its total market capitalization reached USD4.01 trillion (RMB26.54 trillion), representing 66.69% ofChina’s GDP (China Securities Regulatory Commission, 2011). By the end of 2012, its total capitalizationwas RMB22.97 trillion.
On the other end of the spectrum, China’s rapid economic growth appears to contradict and defy main-stream economic and finance theories. China is a highly politically centralized country. Its government hasthe power to nominate provincial and ministerial level officials and owns a significant portion of the nationaleconomy. China’s leaders have the authority to directly interfere with almost all aspects of China’s economic,civil, and political affairs. China lacks the rule of law that is considered essential for the development of thecapital markets (La Porta, Lopez-de-Silanes, Shleifer and Vishny, 1997, 1998, 2002a).
Therefore, it is high time for us to re-recognize the important role played the government in economicdevelopment. After many countries failed in their attempt to become developed countries in the 1970s, manyeconomists conclude that government interventions are detrimental. This view appears to be going to oneextreme of the pendulum (Lin, 2012). With the success of China’s economic reform, its government’s modelof economic development has been receiving more and more attention, especially its ability for strategic eco-nomic planning (Sachs, 2011; Stern, 2011). We start from such a background and depict how the Chinese gov-ernment, playing the role of a central planner, influences resource allocations in China’s capital markets andthe consequences of such an influence.
We study official documents of China’s five-year plans and identify industries that the Chinese governmentemphasizes. We consider two financial markets, the equity market (initial and seasoned equity markets) andthe bank loan market. If the government is effective in channeling resources to strategically important indus-tries, then these industries should enjoy higher equity finance and bank loan growth. Further, corporateinvestment should be affected by the government’s national strategies. We also examine consequences of thisgovernment engineering to determine if five-year plans are at least partially responsible for China’s economicgrowth. If there is a positive association between the two, we conclude that government engineering is effectivein spurring economic growth.1
A good knowledge of the heavy influence that China’s political system exerts on corporate finance is impor-tant for us to understand the myriads of economic and social activities of China and its business entities. Wetry to comprehend China’s corporate finance from the angle of its political superstructure and the interactionbetween the market mechanism and government control. This research can be useful in helping us understandthe following issues: (1) Why can China, a country with such a severe degree of government interference, growits economy consistently at a rapid pace over the last three decades? (2) What is the association between gov-ernment engineering and corporate finance? (3) What are the consequences of government engineering?
Focusing on four ofChina’s strategic five-year national plans during 1991–2010, we find that government sup-ported industries enjoy faster IPOgrowth.However, supported state-ownedfirms appear to crowdout non-state-owned firms. As the government controls the IPO approval and reviewmechanism, IPO resources are scarce andthe government can exert a powerful influence on initial equity offerings. In the SEO market, the government’scontrol power is subdued due to an increase in market orientation. In the bank loan market, the government’spower is further subdued due to a further increase inmarket orientation.We find that the government’s influenceexistsmainly in loans granted bymajor national banks to state-owned firms. This pattern helps us understand theinteractive effect of the government force and the market force in influencing resource allocations.
On the investment dimension, we find that supported industries invest more. This pattern is present in boththe state and non-state sectors. However, non-state-owned firms appear to overinvest more in response to gov-ernment support. This evidence is consistent with the fact that the Chinese economy is investment-driven andthe momentum of investment mainly comes from the non-state sector (Barnett and Brooks, 2006).
1 Of course, even if we fail to find a positive association, we still cannot dismiss government engineering as ineffective as external benefitsthat cannot be internalized within certain supported industries are often the basis of government policies.
190 D. Chen et al. / China Journal of Accounting Research 10 (2017) 189–230

Finally, we examine the economic performance of the five-year plan national strategies. We find that gov-ernment supported industries enjoy higher stock market returns and cash flow growth but these positive effectsdampen when state ownership increases. However, government supported industries have a higher ratio ofnon-performing loans.
While results concerning industry stock returns, cash flow growth, and the ratio of non-performing loansare not entirely consistent with each other, they help us objectively evaluate the effect of government engineer-ing on industry performance as five-year plans are complicated and multi-dimensional strategies. Industriesconsistent with government policies may generate external benefits that are difficult to internalize. A high levelof non-performing loans in supported industries can be a price paid for these external benefits. However, thegovernment can potentially internalize these external benefits. While to a certain industry, an increase in non-performing loans hurts its individual interest, to the government, losses due to non-performing loans can beoffset by other ensuing benefits and therefore an industrial policy can still be rational. We show that supportedindustries have a higher level of non-performing loans but also higher stock returns and cash flow growth.This suggests that in formulating industrial policies, the government probably considers the balance betweenindividual industries’ interests and the society’s aggregate interest. This perspective helps us comprehend thecoexistence of the prevalence of low efficiency industries and the rapid economic growth in China.
An important innovation of our study is that we focus on government engineered five-year plans which playan important role in China’s recent economic development and its people’s everyday life. It is important tonote that even based on economists most critical of China’s economic development, its growth has so far beena sustained one. China’s experience can be useful to other late developing countries.
Allen et al. (2005) challenge the ‘‘law, finance and growth” paradigm by providing evidence of China’s eco-nomic growth under a backward system of law and finance. They examine the finance and growth of the statesector, the listed sector and the private sector and find that the more financially constrained private sectorenjoys faster growth and support the possibility of informal financing or relationship-based financing. How-ever, Ayyagari et al. (2010) compare China’s formal and informal financing channels and show that firms withaccess to formal financing channels grow faster than those that can only access informal channels, not sup-porting Allen et al. (2005). Allen et al. (2011) propose a substitutive mechanism in explaining China’s growth.They point out that at the early growth stage of a developing country, there could exist a dynamic and adap-tive mechanism that is more effective than those in developed countries, such as a mature law and finance sys-tem. They do not provide evidence of this mechanism. Our logic is similar to Allen et al. (2005, 2011). Nationalindustrial policies can be the substitutive mechanism proposed in Allen et al. (2011). We establish links amonggovernment engineering, finance, investment and performance, and potentially reconcile Allen et al. (2011,2005) and Ayyagari et al. (2010).
This paper proceeds as follows. Section 2 reviews the literature on the nexus among government, financeand economic growth. Section 3 describes China’s institutional settings and its five-year plan program. Sec-tion 4 discusses research questions. Section 5 describes data, research design and presents empirical results.Section 6 concludes.
2. Literature
Studying corporate finance in emerging and transitional economies, one needs to start from fundamentalssuch as these economies’ cultures, histories, political and legal systems (Williamson, 2000; Claessens et al.,2002). These systems are intertwined and influence each other in an ever-changing process of evolution. Issuessuch as corporate finance are born within these fundamental factors. Only through a good understanding ofthese fundamental factors can one gain a glimpse of how these factors combine to explain corporate financeand economic growth.
2.1. Political forces, the big push, catching up and the economy
The structure of a nation’s political system can affect how resources are allocated in the economy and thesociety (Olson, 1965; Shleifer and Vishny, 1994; Alesina and Rodrik, 1994; Fisman, 2001; La Porta et al.,2002b; Dinc, 2005; Faccio, 2006; Khwaja and Mian, 2005; Sapienza, 2004; Claessens et al., 2008; Perotti
D. Chen et al. / China Journal of Accounting Research 10 (2017) 189–230 191

and Vorage, 2008, 2009). An important criterion for assessing the power of a political system is the govern-ment’s ability in playing a dominant role in resource allocations. During the early stage of the industrialrevolution, governments of today’s developed European and North American countries all played a crucialrole in building the economic system, in protecting private properties and in promoting trade (Adelmanand Morris, 1988). After the Second World War, with the resurrection of the post-war economy, the role gov-ernments play in nations’ economic development was widely recognized. The economies of Japan, SouthKorea and the South-East Asian region took off. Behind the South-East Asia Miracle are governments(World Bank, 1993). However, during South-East Asia’s financial crisis in the middle of 1990s, the role ofthe government was criticized (Stiglitz and Yusuf, 2001). Interestingly, when the 2008 global financial crisishit, the debate was reignited on the limited role that the market mechanism could play in resource allocations.Governments stepped forward to save their financial markets and researchers start to reevaluate the role of thegovernment.
Since the start of its economic reform in 1978, China has realized more than 30 years of rapid economicgrowth. Even though this growth is not gained without problems such as pollutions, corruptions and ineffi-ciencies, it still represents a major achievement and helps enhance China’s prestige and lift hundreds of mil-lions of people out of abject poverty. Brandt and Rawski (2008) call this ‘‘China’s Great EconomicTransformation”. Economic growth of developing nations often cannot be simplistically viewed from a freemarket perspective.
Murphy et al. (1989) propose a model of industrialization for under-developed countries. They point outthat a premise for industrialization in South-East Asian economies such as South Korea is the government-initiated coordinated investment strategies in various industries. Trindade (2005) use the big push theory inopen economies and explains how Taiwan and South Korea’s industrialization is achieved under their govern-ments’ export oriented schemes. Governments can act as the engine of economic growth. China is probablydoing this on a massive scale due to the size of its economy and the power of its government.
China’s contemporary history of humiliation (since its defeat in the First Opium War against the BritishEmpire, 1839–1842) and foreign domination has created a yearning for catching up among its people and lead-ers. A prosperous and powerful country can defend its people’s properties, rights and dignities. To many Chi-nese people, the biggest threat to property rights may come from external forces and not from within. Externalthreats are associated with a nation’s backwardness. Economic development is an important premise for rightsprotection.
The reason that the catching up strategy can be successful partially lies in the fact that developed countries’experience of success and failure reduces the information cost of national strategic decision-making and par-tially lies in the fact that governments can reduce transaction cost. To a certain extent, more advanced coun-tries serve as an experimental ground for all sorts of technologies, systems, ideals and philosophies. If thecatching up strategy is successful, the biggest beneficiaries are governments as they can enhance their legiti-macy of ruling.
A less developed country may have to start from simple imitation if it strives to catch up with moreadvanced countries. China is no exception. China’s catching up economic development strategy has gonethrough three stages: catching up based on a simple imitation of the completely planned economy of the for-mer Soviet Union; catching up based on the comparative advantage strategies driven by both the governmentand the market; and catching up based on system innovation. Currently, China is transforming from the sec-ond stage to the third stage. This is the technological background of today’s China.
Transforming is difficult. As a poor developing country, China formulated a catching up strategy by devel-oping heavy industries after its establishment in 1949. As this strategy was inconsistent with China’s naturalendowment and technology at that time, economic growth was slow. After the start of the economic reform in1978, the government changed the national strategy of developing heavy industries to the more advantageouslabor intensive industries and realized rapid economic growth (Lin et al., 1994). The Chinese government runsthe country like a giant corporation. To enhance economic efficiency and create a competitive environment, itsupports key industries (the so-called lifeline or pillar industries), it creates state-owned firms aimed at realiz-ing government’s multiple goals, and it tilts financial resources towards preferred industries and state-ownedfirms. Stern (2011) calls this framework of economic development ‘‘China’s Superior Economic Model”.
192 D. Chen et al. / China Journal of Accounting Research 10 (2017) 189–230

Above said, we are not to deny that the market economy is potentially the most important and effectivemechanism in resource allocations. For late developing countries, however, due to the lack of a mature marketsystem, many industries that can contribute to the whole economy cannot be properly developed due to a highlevel of transaction cost. Governments can emerge to reduce the transaction cost and thus their role has eco-nomic rationale. This is especially true in China as more than two thousand years of ruling by the elite greatlyreduces the mass’s resistance to this model of development.
2.2. Formal versus informal financing
Allen et al. (2005) show that the economic growth of China, especially the rapid growth of its private sectorin an environment with weak property rights protection and a weak financial system, suggests the existence ofsome form of alternative financing channels and governance mechanism. Ayyagari et al. (2010), using opinionsurveys of 2400 Chinese firms, investigate the effects of formal and informal financing channels on firm per-formance. They claim that their analysis does not support Allen et al.’s (2005) hypothesis of the importance ofalternative financing channels. In fact, firms receiving formal financing significantly outperform firms usinginformal financing. Guariglia et al. (2011) investigate the effect of internal financing channels on firm growth.They find that among firms facing restrictions on external financing, those with ample free cash flows growfaster. They suggest that developing countries do not necessarily need a highly developed external financingmarket to warrant rapid economic growth. Note that Ayyagari et al. (2010) and Guariglia et al. (2011) arenot necessarily in conflict with Allen et al. (2005). It is not difficult to imagine that even in the presence ofinformal and internal financing channels, formal financing can be more effective.
The above studies suggest that financing channels, for example, the presence of and the reliance on informalfinancing or internal financing, in developing countries such as China, are fundamentally different from thoseof developed countries. We argue for another dimension of financing in China, that is, government engineer-ing. Government industrial policies, to a large extent, can exert a heavy influence on whether firms obtainfinance to realize their growth opportunities. This perspective potentially enriches corporate finance theoriesfor developing countries. From a certain perspective, our research extends Ayyagari et al. (2010) as we poten-tially explain why firms receiving formal financing significantly outperform firms using informal financing.When formal financing channels are heavily influenced by governments’ industrial strategies, firms receivinggovernment support can crowd out firms not receiving government support. This logic helps us understandconditions under which formal, informal and internal financing channels interact and impact firm perfor-mance. Formal finance is important to government supported industries. In non-supported industries, infor-mal or internal finance potentially plays a bigger role. Therefore, our research helps us better assess Allen et al.(2005), Ayyagari et al. (2010) and Guariglia et al. (2011).
2.3. Political connections and corporate finance
The corporate finance literature has accumulated a vast reservoir of evidence on how political connectionsinfluence governance, finance, investment and firm performance. Shleifer and Vishny (1994) propose a modelof government control and show that political connections bring about excess employment, low efficiency andcorruption (Stigler, 1971; Peltzman, 1976; Kornai, 1979; McChesney, 1987; De Soto, 1990). Researchers oftenfind that non-state-owned firms are more efficient than state-owned firms which naturally have political con-nections and that the privatization of state-owned firms often brings efficiency gains (Kikeri et al., 1992;Megginson et al., 1994; Sun and Tong, 2003). Further, political connections increase the risk of governmentrent-seeking and property rights exploitation (Agrawal and Knoeber, 2001; Hadlock et al., 2002; Helland andSykuta, 2004; Faccio, 2006). Due to this risk, firms with political connections under-perform non-connectedfirms (Fan et al., 2007).
On the other hand, political connections can bring benefits to connected firms. Backman (1999) and Dinc(2005) show that the government brings benefits to firms with political connections through its control ofbanks. De Soto (1990) finds that political connections bring about tax benefits. Fisman (2001) provides evi-dence that the health condition of Indonesia’s former president Suharto affects the value of firms connectedto him. Faccio’s (2006) international study shows that high level executives who enter politics bring benefits
D. Chen et al. / China Journal of Accounting Research 10 (2017) 189–230 193

to their firms. However, these benefits are often obtained through wealth redistribution and rather thanthrough wealth creation. That is, politically connected firms establish unfair competition and exploit otherfirms to create gains for themselves. In sum, most of the studies on political connections suggest that politicalconnections negatively impact overall resource allocations.
Political connections are not necessarily the original purposes of policy-makers. If the effect of politicalconnections is universally negative, then where does the economic growth of many developing countries,including China, come from? If, among some developing countries, governments’ economic planning iseffective to a certain extent, will this offer an explanation for the widespread government interferenceof economic affairs? It is possible that political connections are merely a by-product of government-ledeconomic development. Foregoing economic development to avoid these by-products may not be a desiredsolution.
Further, allow us to raise the research stake a little higher by thinking about the causality of the aboveissues. Will this help us explain why small government-large market countries are mostly developed countrieswhile large government-small market countries are often developing countries? What is the causal relationbetween these? It is possible that a shrinking government is a result of economic development rather than thateconomic development is a result of a small government, and that the nexus between law and finance is moreimportant in developed countries (King and Levine, 1993; Levine and Zervos, 1998; Rajan and Zingales, 1998;La Porta et al., 1997, 1998, 2002a; Demirguc-Kunt and Maksimovic, 1998; Levine, 1999; Beck and Levine,2002) while the link between the government and finance fits developing countries better.
3. China and its five-year national plan program
3.1. Political control system
China is a highly politically centralized country. It has thirty-four provinces, direct administrative cities, orminority autonomous regions. It has twenty-nine ministries, 333 prefecture-level governments, 2858 county-level governments and over 40,000 township-level governments (China Statistical Yearbook, 2010). This sys-tem employs about 10 million people. However, the control power of such a large organization resides with thePolitburo of the Central Committee of the Communist Party of China (CCCPC). The Politburo is the supremedecision-making organization. The State Council and ministries below it convert national policies into exe-cutable government policies. This political control system functions through appointments, promotions, rota-tions and cross-postings of government officials (Huang, 2002).
3.2. Banking and finance
After its establishment in 1949, communist China adopted a policy of financial repression (McKinnon,1973). Four major state-owned banks (Industrial and Commercial Bank of China, Bank of China, China Con-struction Bank and Agricultural Bank of China) dominate the banking system (Allen et al., 2005). During1949–1990, the securities markets were non-existent.
China’s stock market was established in 1990 (Shenzhen and Shanghai Exchanges), originating from theideal of ‘‘crossing the river by feeling the rocks”.2 However, the government tightly controls the stock market.To facilitate market development, in October 1992, the State Council established the Securities Commission ofthe State Council as a regulatory authority of all securities businesses and the Securities Regulatory Commis-sion as the monitoring authority of the Securities Commission of the State Council. In 1998, State Councilreform merged these two organizations into the China Securities Regulatory Commission (CSRC) directlyunder the State Council. It is the counterpart to the SEC of the U.S. All chairmen of the CSRC came fromhigh level government officials. Before becoming CSRC chairmen, they were State Council secretariats or gen-eral managers of the People’s Bank of China (China’s central bank), or even Politburo members of the highest
2 ‘‘If it turns out to be good, we will do it. If it turns out to be bad, we will shut it down. We can try this.” (Deng Xiaoping’s (formerChinese President) talk during excursions to China’s southern cities).
194 D. Chen et al. / China Journal of Accounting Research 10 (2017) 189–230

decision-making organization. This way, China’s central government effectively controls the securities regula-tory authority and therefore realizes its goal of policy promotions.
Since 1992, the IPO and SEO offering processes have experienced several reforms.3 A major trend is thetransition from an approval system to a review system. Of course, the monitoring mechanism for IPOs andSEOs has not been fundamentally changed. Though CSRC adopted a review system for IPOs and SEOs in2004, in practice, both stock exchanges still use an approval system.4 From CSRC’s official documents gov-erning IPOs and SEOs, a common criterion for equity offerings is that ‘‘they are consistent with the nationalindustrial policies”.
Based on the above discussion of China’s political control system, we have reasons to believe that China’scentral government can fulfill its policy goals through its effective political control system and tilts financialresources towards supported industries.
3.3. Origin of five-year plans
Five-year plans originated from the former Soviet Union. On November 22, 1926, at the seventh expansion-ary conference of the Executive Committee of the Communist International, Joseph Stalin stated the doctrinethat ‘‘The socialist economy is the most centralized economy. The socialist economy should progress based onplans.” (Complete Works of Stalin, People’s Publishing House, China, 1954). Based on his socialist economicphilosophy, in December 1927, at the Fifteenth Congress of the All-Union Communist Party (Bolsheviks) of theformer Soviet Union, Stalin further developed his doctrine of centralized and planned socialist economy. Underhis guidance, the former Soviet Union adopted highly concentrated and all-encompassing economic plans. TheSixteenth Congress of the All-Union Communist Party approved the 1928–1932 national economic plan. Thissignaled the birth of five-plans in the former Soviet Union. By the time it completed the second five-year plan, theformer Soviet Union had become the largest economy in Europe and the second largest economy in the world.
3.4. China’s five-year plans
As early as 1928, the government of the Republic of China started drawing plans for economic growth, forexample, the fundamental industry-building plan in 1928 and the five-year plan for heavy industries (1935)(Wu, 2013, p. 164). These plans were interrupted by the Japanese invasion of China during 1937–1945. How-ever, the 1928–1937 is considered a golden ten-year period in contemporary Chinese economic history with anaverage annual industry growth of 8.7% (Fairbank, 1994).
After the communist government took over the country in 1949, China went through three years of eco-nomic recovery. In 1953, China started its first five-year plan covering 1953–1957. The focus of the FirstFive-Year Plan was ‘‘developing heavy industries” (People’s Daily, 1953). Since 1953, China has implementedeleven five-year plans. Year 2011 marked the first year of the Twelfth Five-Year Plan.5
Before the start of the economic reform in 1978, due to a lack of statistical data and technical expertise, Chi-nese government’s capabilities of formulating five-year plans were limited. This was especially true during theGreat Leap Forward and the Cultural Revolution periods. Plans were often interrupted or the goals were setunrealistically high, causing a spate of problems or even disasters during implementation. In fact, during1949–1978, China focused on socialist ideologies, politics, power struggle, ‘‘the revolution”, and not on eco-nomic development.
Since the start of the economic reform in 1978, China’s economy has gradually moved to an increasinglymarket-oriented system. The government’s abilities in managing economic and social affairs also improve.
3 For China’s regulations on IPOs, please refer to Kao et al. (2009). For China’s regulations on rights offerings, please refer to Chen andYuan (2004).4 Based on CSRC’s official interpretation (Chi Bin, 2011) (Source: http://www.qgcy.org/show.asp?id = 3519).5 The twelve five-year plans are: First Five-Year Plan (1953–1957), Second Five-Year Plan (1958–1962), Third Five-Year Plan (1966–
1970), Fourth Five-Year Plan (1971–1975), Fifth Five-Year Plan (1976–1980), Sixth Five-Year Plan (1981–1985), Seventh Five-Year Plan(1986–1990), Eighth Five-Year Plan (1991–1995), Ninth Five-Year Plan (1996–2000), Tenth Five-Year Plan (2001–2005) and EleventhFive-Year Plan (2006–2010) and Twelfth Five-Year Plan (2011–2015). Note that due to the three-year famine in 1959–1961, the ThirdFive-Year Plan was delayed by three years and the economy went through a period of adjustment.
D. Chen et al. / China Journal of Accounting Research 10 (2017) 189–230 195

Starting from the Sixth Five-Year Plan formulated during 1981–1982, the procedure has become more andmore formalized. By the end of the last year of the current five-year plan period, the Politburo will convenea session to discuss and propose recommendations for the next five-year plan. Based on these recommenda-tions, the State Council will formulate outlines for making the plan. After its approval in the next year’sNational People’s Congress, the new five-year plan is finalized.
China’s Eighth Five-Year Plan (1991–1995) reflected reform philosophies of Deng Xiaoping’s ‘‘Talks dur-ing Excursions to China’s Southern Cities”. It is a relatively special five-year plan.6 Based on Deng’s ‘‘three-step” strategy, the government formulated the Eighth Five-Year Plan and the long-term ten-year (1991–2000)scheme (Deng, 1993; Chinese Communist Party Central Committee, 1987).7 The government also soughtadvices from various strata of the society.
The formulation of the Ninth Five-Year Plan (1996–2000) started in September 1995. Based on achieve-ments and experience of the Eighth Five-Year Plan, the Chinese government also proposed long-term goalsfor the year 2010. At the same time, China’s economy weathered through the 1997 Asian financial crisisand progressed towards its goals. The average annual GDP growth was 8.3% during the Ninth Five-Year Planperiod. In 2000, GDP reached RMB8.94 trillion (exceeding USD1 trillion). Average per capita GDP reachedUSD856 (National Bureau of Statistics of China, 2001).
The Tenth Five-Year Plan (2001–2005) was formulated during a period when China’s overall economic sit-uation was relatively good. By that time, GDP has exceeded USD1 trillion. The situation of consumer goodsshortage was largely eliminated and a consumer market began to take shape. The formulation of the TenthFive-Year Plan was different from that of previous ones. First, the planning committee listened to suggestionsfrom international organizations such as the World Bank.8 Second, based on the national plan, specializedplans and regional plans were also made.
As the importance of five-year plans on people’s standard of living and national development became moreapparent, the formulation process also became more democratic and transparent. Many people from differentsocial strata participated in the formulation of the Eleventh Five-Year Plan (Jiang, 2006). For example, theNational Development and Reform Committee was made up of experts from various different governmentdepartments and organizations. Further, comments and suggestions were taken from members of the NationalPeople’s Congress, National Political Consultative Congress, the Eleventh Five-Year Plan Expert Committee,political and military organizations, the so-called democratic parties, representatives from provinces, directadministrative cities and minority autonomous regions. The State Council also held four conferences to listento comments and advices.
The Twelfth Five-Year Plan, which started in 2011 and which is not covered in this study, is markedly dif-ferent from previous ones. It contains more intangible themes such as sustainable growth, moving up the valuechain, reducing income disparities, improving citizens’ lives, enhancing scientific development, education,urbanization, environmental protection, energy efficiency and domestic consumption (Chinese CommunistParty Central Committee, 2010; KPMG, 2011). It signals a crucial stage in China’s reform and transition.
Five-year plans have exerted a profound influence on China’s national economy and social life. They pro-vide guidance for major projects and help fulfill government’s goals. An important objective of five-year plans
6 Early 1992, Deng Xiaoping gave talks in Wuchang, Shenzhen, Zhuhai, Shanghai and other cities. These talks are historicallysummarized as ‘‘Deng Xiaoping’s Talks during Excursions to China’s Southern Cities”. During this period, Deng proposed many boldideas and smashed conservative thinking in economic development at that time. These ideas include: ‘‘More audacious reform”, ‘‘Thedifference between socialism and capitalism does not lie in more planned economy or more market economy.”, ‘‘Planned economy doesnot equal socialism as capitalism also has plans. Market economy does not equal capitalism as socialism also has markets.” After Dengtalks, the central committee adjusted the Eighth Five-Year Plan on dimensions such as the pace of economic reform, industrial structure,the use of foreign investment, import and export, scale of investments, etc.7 Deng Xiaoping proposes a three-step formula for China’s modernization development, reflecting long-term strategies for China’s
economic reform. First step, GDP in 1990 should double that in 1981 to cover people’s basic needs. Second step, from 1991 to the end ofthe twentieth century, GDP should double again. Third step, by the middle of the twenty-first century, GDP per capita should reach thatof medium developed countries.8 Early 1999, World Bank was entrusted by the National Development and Planning Committee to provide recommendations on
China’s Tenth Five-Year Plan and the 2015 long-term scheme. World Bank produced ‘‘China’s Intermediate Economic Transition: SeveralIssues Related to Economic Development in the Tenth Five-Year Plan”. This document contained 21 reports and provided valuable viewson China’s economic development and reform (World Bank, 2000)
196 D. Chen et al. / China Journal of Accounting Research 10 (2017) 189–230

is guidance for various industries, that is, industrial policies. Compared with the completely free market econ-omy and the completely planned economy, five-year plans reflect a mixture of the two and are a manifestationof China’s pragmatism.
4. Research questions
4.1. Five-year plans and corporate finance
An important method for realizing government industrial strategies is the creation of preferential financingopportunities. This method can also encourage more firms to enter supported industries until the marginalbenefit equals the marginal cost. In China, both the equity market and the loan market are, to a varyingdegree, controlled by the central government. The government has the review and approval rights of initialand seasoned equity offering applications. The government can further control the equity market throughits personnel control system. For example, the chairman of the CSRC is named by the State Council. Finally,major banks are state-owned. Therefore, the capital markets are capable of carrying out government’s indus-trial policies. We predict that firms in government supported industries have a larger chance of obtainingequity finance and bank loans.
State-owned firms play an important role in carrying out government strategies. The government’s controlover state-owned firms is obviously stronger than its control over non-state-owned firms. Further, supportingstate-owned firms can also enlarge the base of state ownership and build a foundation for carrying out the nextstrategy. In a way, preserving state-ownership potentially helps the government carry out national strategies.Therefore, out of strategic considerations as well as profit motives, government strategies are more tiltedtowards industries with a high concentration of state ownership. Of course, state-owned firms are also likelymore willing to carry out national strategies. We predict that state ownership enhances supported industries’ability to obtain financing opportunities.
4.2. Five-year plans and corporate investment
China’s economic growth is largely investment driven. The proportion of investment in GDP growthexceeds 30% (Barnett and Brooks, 2006). Therefore, how government policies affect corporate investment isan important empirical question. Since the 2008 financial crisis, China’s economy has received a lot of atten-tion, especially its level of investment. In an investment-driven economy, supported industries will need to useinvestment to realize their growth. We predict that government supported industries invest more than non-supported industries.
4.3. Five-year plans and industry performance
We cannot avoid a discussion and an examination of the association between government engineering andindustry performance. However, this is a tricky issue. The literature appears to believe that government inter-ference brings about resource allocation distortion and inefficiency (Fan et al., 2007; Morck, Yavuz andYeung, 2011). This certainly is a viable proposition. However, distortion and inefficiency cannot be entirelymeasured in short-run economic or financial terms. For example, a government may be willing to enter indus-tries that have low short-term profit prospects or even no profit prospects at all but are deemed strategic orvital to the national interest or have long-term prospects. Therefore, relatively short-run inferior economic orfinancial outcome associated with government engineering should not necessarily be viewed as distortional orinefficient. Further, even in economic or financial terms, government engineering may not necessarily be asso-ciated with inefficiency. The Chinese economy has been growing rapidly in the last three decades. It would behard to imagine that the government has been doing this all wrong and economic growth is primarily drivenby firms in non-supported industries.
Based on the above, there are two potentially opposing explanations of this tricky issue. We treat it as anempirical question and examine whether government engineering, as manifested in five-year plans, is associ-ated with superior or inferior industry performance. We consider three measures of performance, stock
D. Chen et al. / China Journal of Accounting Research 10 (2017) 189–230 197

performance (a market measure), growth in cash flow (an accounting measure) and the ratio of non-performing loans. Of course, we hasten to admit, and to avoid contradicting our discussion earlier, that relyingon the capital markets for evaluating five-year plans is narrowly focused. Five-year plans affect many aspectsof the economy and we capture just a part of the picture by focusing on the capital markets.
5. Data and empirical analyses
5.1. Data
We hand-collect actual reports of four five-year plans by the Chinese central government during 1991–2010,covering the Eighth (1991–1995), Ninth (1996–2000), Tenth (2001–2005) and Eleventh (2006–2010) Five-YearPlans. We analyze the content of their ‘‘industry schemes” to determine government supported industries.Listed firms’ industry classifications are based on the ‘‘Index for Listed Firms’ Industry Classifications” pub-lished by the China Securities Regulatory Commission (CSRC) in 2001 and ‘‘Guideline # 6 of Listed Firms’Conduct of Businesses – Modified Industry Classifications” published in 2007. Classifications for industrialfirms are based on ‘‘Classifications and Code Standards of National Economic Industries” – National Stan-dards (Guo Biao) GB/T4754 published by the National Bureau of Statistics of China in 1983 and the morerecently revised ‘‘National Industry Classifications” GB/T4754-2002 published in 2003.
Data for Chinese listed firms come from (Research Set) RESSET for IPO and SEO data covering 1991–2010 and (China Stock Market Trading Database) CSMAR for bank loan data covering 1996–2010. Annualreports of China’s banking industry are hand-collected. We examine the industry distribution of non-performing loans. We hand-collect China Statistical Yearbooks to obtain industry economic growth data.
5.2. Capturing government engineering
In order to evaluate the government’s influence on the national economy and the capital markets, we collectfive-year plan government documents (see Appendix A). These reports include: ‘‘Guidelines for the nationaleconomy and social development ten-year scheme and the Eighth Five-Year Plan of the People’s Republic ofChina” (Fourth Plenum of the Seventh Conference of the National People’s Congress, April 9, 1991), ‘‘Guide-lines for the national economy and social development Ninth Five-Year Plan and goals beyond year 2010 ofthe People’s Republic of China” (Fourth Plenum of the Eighth Conference of the National People’s Congress,March 17, 1996), ‘‘Guideline for the national economy and social development Tenth Five-Year Plan of thePeople’s Republic of China” (Fourth Plenum of the Ninth Conference of the National People’s Congress,March 15, 2001) and ‘‘Guideline for the national economy and social development Eleventh Five-Year Planof the People’s Republic of China” (Fourth Plenum of the Tenth Conference of the National People’s Con-gress, March 14, 2006).
These documents detail plans for China’s industrial deployment during the next five years. For example, thethird chapter of the Eighth Five-Year Plan contains ‘‘goals and policies for the development of major eco-nomic sectors during the Eighth Five-Year Plan”. It covers several industries, such as agriculture and the agri-cultural economy, hydroelectric industry, energy industry, transportation and postal communication industry,raw materials industry, geological survey and atmospheric industry, electronic industry, machinery manufac-turing industry, national defense industry and national defense research and development, and textile indus-try, etc. For each industry, these reports explicitly point out the goals and directions of that industry duringthe next five years as well as measures to achieve these goals. From these documents, we identify keywordsthat determine government supported industries. We define an industrial policy variable IP that equals 1 ifan industry is supported by the government in the current five-year plan period, and 0 otherwise.
5.3. Growth in finance
5.3.1. IPO/SEO
Since the establishment of two stock exchanges in 1990, China now has 1718 listed firms and a total amountof raised capital of RMB3662 billion (China Statistics Yearbook, 2010). We are interested in how the govern-
198 D. Chen et al. / China Journal of Accounting Research 10 (2017) 189–230

Table 1Sample Selections for Equity Finance (IPOs/SEOs) and Bank Loan Finance.
Firm Number
Panel A: IPOs
A1: IPO Sample Selection
A-share firms listed in 1991–2010 2060minus: Financial firms 30minus: Firms missing information on IPO amount 7Final sample 2023
Eighth Five-YearPlan (1991–1995)
Ninth Five-YearPlan (1996–2000)
Tenth Five-YearPlan (2001–2005)
Eleventh Five-YearPlan (2006–2010)
A2: IPO Sample Distribution
Final sample 2023 282 722 328 791Supported
firms1469 175 549 297 448
% ofsupportedfirms
(72.61) (62.06) (76.04) (90.55) (56.64)
A3: IPO Industry Distribution
Industries 41 36 41 37 41Supported
Industries24 24 26 17
% ofsupportedindustries
(66.67) (58.54) (70.27) (41.46)
Firms =1 =2 =3 >3 Total
Panel B: SEOs
B1: SEO Total Sample
Rights Issue 650 393 178 61 18 1010Additional Offering 722 547 157 16 2 917Total 1927
Five-Year Plans Rights Issues Additional Offerings
B2: SEO Distribution Over Five-Year Plans
Eighth Five-Year Plan 219 3Ninth Five-Year Plan 635 52Tenth Five-Year Plan 101 67Eleventh Five-Year Plan 55 795Total 1010 917Loan types Big4 Non-Big4
N Loan sum N Loan sum
Panel C: Bank Loans
C1: Types of Loans
Non-Collateralized Loans 330 94.6628 291 215.1753Collateralized Loans 682 60.3518 844 144.9589Project finance, trade finance and bill discount 9 3.0171 21 46.1803Letter of credit and bill purchase 9 0.4620 14 6.4781Others 111 62.4998 156 63.1229C2: Loan distribution over time
Five-Year Plans Big4 Non-Big4
N Loan Sum N Loan Sum
Ninth Five-Year Plan (1996–2000) 42 24.7746 32 10.0013Tenth Five-Year Plan (2001–2005) 583 80.0171 539 154.0553Eleventh Five-Year Plan (2006–2010) 516 116.2018 755 311.8589
D. Chen et al. / China Journal of Accounting Research 10 (2017) 189–230 199

Tab
le2
Descriptive
statistics
forequityfinan
ce(IPOs/SEOs)
andban
kloan
finan
ce.
Industry
Industry
Abbr.
EquityIssues
(billionRMB)
Ban
kLoan
s(billionRMB)
IPO
SEO
Big4
Non-Big4
Agriculture
AGRIC
20.63
35.10
1.50
1.02
Extractive
MIN
ES
230.85
54.50
1.36
3.83
FoodProcessing
FDPROC
13.80
18.76
1.57
1.39
FoodProduction
FDPROD
8.68
18.31
0.05
0.30
Beverag
eProduction
BEVRG
15.81
14.46
2.33
0.15
Textile
Industry
TXTLS
20.54
23.95
3.48
3.71
Garments
andOther
Fiber
Products
GARMTS
18.37
5.31
1.14
0.22
Leather,Furs,Downan
dRelated
Products
LETHR
1.30
1.64
Tim
ber
Processing,
Bam
boo,Can
e,Palm
Fiber
andStraw
Products
WOOD
2.41
2.33
0.04
Furniture
Man
ufacturing
FURN
3.28
2.25
Pap
ermak
ingan
dPap
erProducts
PAPER
16.11
16.70
3.50
4.99
PrintingIndustry
PRIN
T2.81
0.86
0.01
0.05
Stationery,
Educational
andSportsGoods
STAT
4.06
0.38
Petroleum
Processingan
dCokingProducts
PTRLM
5.05
6.74
2.57
0.30
Raw
Chem
ical
Materialsan
dChem
ical
Products
CHEMS
69.25
70.24
5.07
20.70
Chem
ical
Fibers
CHMSFIB
R14
.03
11.32
0.97
0.38
Rubber
Products
RUBBR
2.86
3.06
0.85
2.06
Plastic
Products
PLASTIC
S12
.22
9.27
0.75
4.54
Electronic
Components
Man
ufacturing
ELCTRCOMP
40.27
54.36
4.30
5.64
Household
Electronic
Applian
cesMan
ufacturing
HHELCTR
13.37
19.31
9.61
11.30
Nonmetal
Mineral
Products
GLASS
23.22
57.53
6.39
4.71
Smeltingan
dPressingofFerrousMetals
FERMTAL
38.75
165.45
0.48
19.43
Smeltingan
dPressingofNonferrousMetals
NFERMTAL
22.82
63.23
1.55
2.30
Metal
Products
MTLPR
22.62
18.27
0.50
10.89
OrdinaryMachineryMan
ufacturing
GENMACHN
32.30
39.32
0.54
1.19
SpecialPurposesEquipmentMan
ufacturing
SPLMACHN
50.65
45.87
1.30
12.49
TransportationEquipmentMan
ufacturing
CARS
62.65
135.35
6.55
32.93
ElectricEquipmentan
dMachinery
ELCTRMCHN
69.67
86.85
35.48
8.07
Instruments,Meters,Culturalan
dOfficial
Machinery
INSTR
11.46
5.69
0.29
0.69
Medical
andPharmaceuticalProducts
MEDIC
AL
54.86
44.24
3.43
3.32
BiologicalProducts
BIO
LG
8.61
4.80
1.36
0.70
Other
Man
ufacturing
OTHMANU
5.52
2.45
1.05
1.10
ElectricPower,Steam
andHotWater
Productionan
dsupply
POWER
35.59
128.81
65.30
36.14
Gas
Productionan
dSupply
GAS
7.68
11.32
Construction
CONSTR
133.05
24.58
0.69
11.29
Transportationan
dwarehousing
TRANS
140.25
141.69
9.24
59.18
Inform
ationTechnology
IT81
.23
63.45
4.69
53.12
Wholesale
andRetail
WHLSL
35.44
90.01
7.44
6.73
RealEstate
RLEST
18.24
183.64
34.05
18.13
Social
Services
SRVC
28.53
37.32
5.86
2.85
Broad
castingan
dMedia
MEDIA
12.57
4.45
2.04
3.13
Others
OTHR
9.61
56.48
10.42
10.15
Total
1421.04
1779.66
238.24
360.28
200 D. Chen et al. / China Journal of Accounting Research 10 (2017) 189–230

ment engineered industrial policies affect corporate finance. We follow Rajan and Zingales (1998) but useindustry and five-year plan combinations as units. Specifically, we aggregate amounts raised in (the frequencyof) IPOs/SEOs for a specific industry during a five-year plan period.
Table 3Equity Finance Activities and Five-Year Plans. The growth rate of IPO/SEO total amount (number) during Five-Year Plan t (comparedwith the previous five-year plan) for Industry j: Growth in IPO amount, (SumIPOjt � SumIPOjt�1)/SumIPOjt�1; Growth in IPOfrequency, (NumIPOjt � NumIPOjt�1)/NumIPOjt�1; Growth in SEO amount, (SumSEOjt � SumSEOjt�1)/SumSEOjt�1; Growth in SEOfrequency, (NumSEOjt � NumSEOjt�1)/NumSEOjt�1, where Sum indicates IPO/SEO amount and Num indicates IPO/SEO number. SOEis the value-weighted ratio of state ownership enterprises over the public firms. Growthjt is the growth rate for industry j in during the tthfive-year plan based on China Statistical Yearbook, log(Assets)jt is the logarithm transformation of Industry j’s median total assets,P10_5jt and P11_5jt are indicators that equal 1 for the Tenth and Eleventh Five-Year Plans and 0 otherwise, respectively.
Industry IPO growth SEO growth SOE Log assets Industrial growth
Amount Freq. Amount Freq.
Panel A: MeansAGRIC 36.630 5.692 28.640 3.433 0.748 24.020 0.645MINES 6.127 0.264 30.300 3.950 0.978 26.660 1.422FDPROC 4.912 1.067 9.606 1.944 0.557 23.980 1.527FDPROD 10.340 1.644 24.400 5.048 0.779 24.070 1.147BEVRG 1.555 0.701 21.770 2.506 0.825 24.770 1.073TXTLS 2.043 0.377 5.122 1.150 0.598 24.340 0.869GARMTS 1.585 0.033 0.437 �0.197 0.367 24.230 1.107LETHR 2.197 �0.250 4.224 1.000 0.047 21.810 1.165WOOD 3.400 1.000 �1.000 �1.000 0.591 23.450 1.791FURN 1.951 �0.250 �1.000 �1.000 0.004 22.900 1.782PAPER 0.639 �0.202 10.070 3.893 0.824 24.570 1.284PRINT 0.578 �0.500 �1.000 �1.000 0.163 22.600 1.028STAT �1.000 �1.000 4.121 0.500 0.667 22.730 0.972PTRLM 9.760 5.000 11.640 4.000 0.744 24.050 1.491CHEMS 4.099 1.845 5.765 2.175 0.826 25.340 1.411CHMSFIBR 13.350 2.280 12.640 4.211 0.743 24.490 1.004RUBBR 1.532 0.167 9.906 1.750 0.779 23.860 1.163PLASTICS 2.205 0.527 0.272 �0.163 0.504 24.080 1.390ELCTRCOMP 24.270 2.838 33.380 5.285 0.790 24.790 2.086HHELCTR 36.940 4.056 5.753 0.000 0.918 24.910 0.855GLASS 1.187 0.273 10.710 1.839 0.708 24.890 1.271FERMTAL 2.395 0.569 12.750 0.756 0.957 26.510 1.527NFERMTAL 36.670 5.754 14.670 5.100 0.785 25.140 1.978MTLPR 6.673 1.652 10.570 1.989 0.682 24.470 1.358GENMACHN 2.872 0.937 12.880 2.361 0.835 24.930 1.462SPLMACHN 3.440 0.877 11.800 2.292 0.794 24.850 1.425CARS 3.577 0.552 18.740 3.417 0.895 25.670 1.543ELCTRMCHN 2.363 0.609 23.360 3.542 0.620 25.430 1.620INSTR 3.864 3.040 4.011 1.944 0.602 23.160 1.525MEDICAL 2.647 0.423 6.814 2.147 0.627 24.760 1.278BIOLG 3.689 1.533 20.000 1.556 0.477 23.510 1.823POWER 1.094 �0.017 14.080 3.463 0.980 26.350 1.713GAS 10.990 0.944 0.414 �0.250 0.799 24.210 1.526CONSTR 28.180 3.880 18.800 4.544 0.923 25.590 1.666TRANS 21.430 1.001 16.870 2.450 0.888 26.280 0.340IT 6.667 1.991 7.801 1.850 0.822 25.850 3.368WHLSL 2.489 0.266 6.951 1.492 0.780 25.210 0.967RLEST 0.969 �0.154 11.370 2.441 0.731 25.640 2.091SRVC 31.230 6.261 11.140 1.788 0.796 24.640 0.991MEDIA 5.974 �0.500 3.131 0.000 0.833 23.460 0.232OTHR 2.471 �0.233 6.037 0.525 0.519 25.240 1.221
Sample avg. 9.005 1.457 12.260 2.261 0.695 24.590 1.369(continued on next page)
D. Chen et al. / China Journal of Accounting Research 10 (2017) 189–230 201

Table 3 (continued)
Industry IPO growth SEO growth
Amount Freq. Amount Freq.
Panel B: Supported industries versus non-supported industriesSupported
Mean 10.480 1.802 13.470 2.538Median 1.870 0.538 5.891 1.710N 65 65 63 63
Non-supported
Mean 6.918 0.968 10.490 1.856Median 1.914 0.000 4.864 1.000N 46 46 43 43
Supported vs. non-supported
Mean 3.562 0.834 2.980 0.682Median �0.044 0.538 1.027 0.710
T-test (Z-test)
t-statistics 0.90 1.30 0.89 1.03z-statistics 0.80 1.47 1.19 1.19
***Represents significance level at 1%.**Represents significance level at 5%.*Represents significance level at 10%.
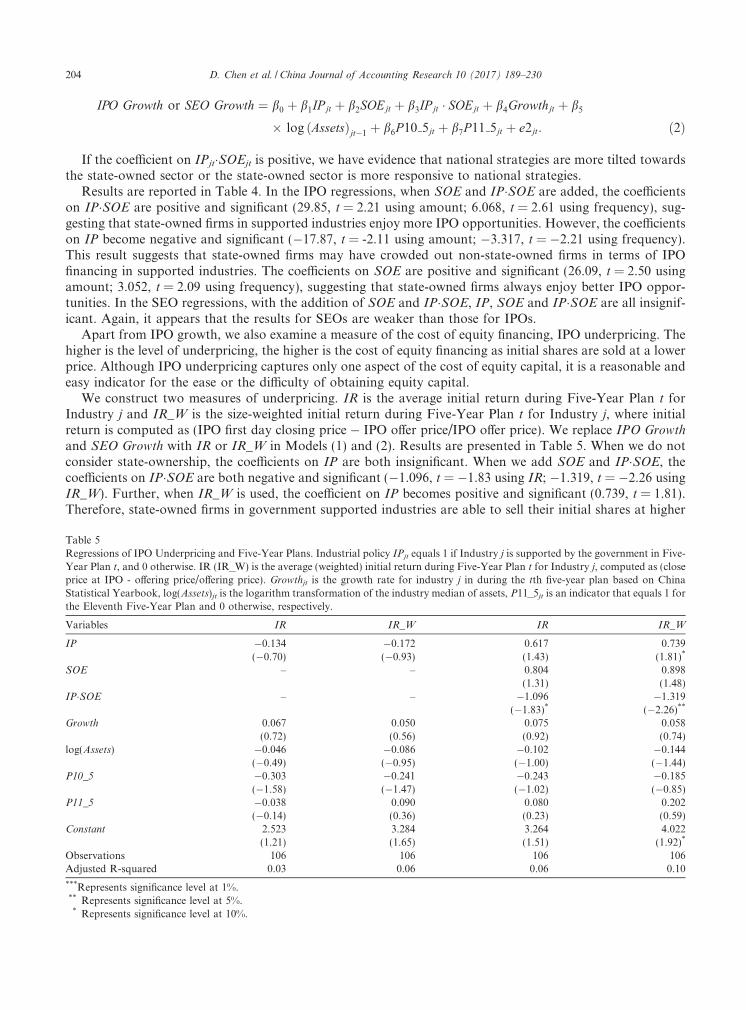
Table 4Regressions of Equity Finance Activities and Five-Year Plans. Industrial policy IPjt equals 1 if Industry jis supported by the government inFive-Year Plant, and 0 otherwise. The growth rate of IPO/SEO total amount (number) during Five-Year Plan t (compared with theprevious five-year plan) for Industry j: Growth in IPO amount, (SumIPOjt � SumIPOjt�1)/SumIPOjt�1; Growth in IPO frequency,(NumIPOjt � NumIPOjt�1)/NumIPOjt�1; Growth in SEO amount, (SumSEOjt � SumSEOjt�1)/SumSEOjt�1; Growth in SEO frequency,(NumSEOjt � NumSEOjt�1)/NumSEOjt�1, where Sum indicates IPO/SEO amount and Num indicates IPO/SEO number. SOE is the value-weighted ratio of state ownership enterprises over the public firms. Growthjt is the growth rate for industry j in during the tth five-year planbased on China Statistical Yearbook, log(Assets)jt is the logarithm transformation of Industry j’s median total assets, P10_5jt and P11_5jtare indicators that equal 1 for the Tenth and Eleventh Five-Year Plans and 0 otherwise, respectively.
Variables IPO growth SEO growth
Amount Freq. Amount Freq. Amount Freq. Amount Freq.
IP 7.187 1.554 �17.87 �3.317 4.827 1.181 �3.329 �1.431(2.06)** (2.54)** (�2.11)** (�2.21)** (1.45) (2.22)** (�0.35) (�0.80)
SOE – – 26.09 3.052 – – 9.827 1.480(2.50)** (2.09)** (1.47) (1.40)
IP�SOE – – 29.85 6.068 – – 9.841 3.317(2.21)** (2.61)** (0.82) (1.59)
Growth �3.391 �0.444 �2.554 �0.331 1.337 0.237 1.582 0.292(�1.09) (�1.07) (�1.02) (�0.96) (0.99) (1.07) (1.10) (1.13)
log(Assets) �6.116 �1.133 �11.54 �1.898 �0.856 �0.112 �2.683 �0.498(�2.43)** (�3.02)*** (�3.32)*** (�3.72)*** (�0.37) (�0.35) (�1.15) (�1.57)
P10_5 �12.21 �2.517 �1.120 �0.897 �20.49 �4.421 �16.96 �3.651(�3.24)*** (�4.10)*** (�0.25) (�1.29) (�5.88)*** (�7.30)*** (�4.92)*** (�6.52)***
P11_5 8.144 1.646 27.46 4.482 �0.536 0.839 6.297 2.318(1.07) (1.28) (2.51)** (2.58)** (�0.08) (0.78) (0.97) (2.32)**
Constant 157.0 28.53 257.1 42.99 35.87 5.310 68.77 12.63(2.65)** (3.24)*** (3.40)*** (3.85)*** (0.66) (0.74) (1.31) (1.82)*
Observations 111 111 111 111 106 106 106 106Adjusted R-squared 0.15 0.24 0.24 0.32 0.34 0.51 0.35 0.53
*** Represents significance level at 1%.** Represents significance level at 5%.* Represents significance level at 10%.
202 D. Chen et al. / China Journal of Accounting Research 10 (2017) 189–230

We compute the growth rate of IPO/SEO in total amount (number) during Five-Year Plan t (comparedwith the previous five-year plan) for Industry j. We define four variables: Growth in IPO amount,(SumIPOjt � SumIPOjt�1)/SumIPOjt�1; Growth in IPO frequency, (NumIPOjt � NumIPOjt�1)/NumIPOjt�1; Growth in SEO amount, (SumSEOjt � SumSEOjt�1)/SumSEOjt�1; Growth in SEOfrequency, (NumSEOjt � NumSEOjt�1)/NumSEOjt�1, where Sum indicates IPO/SEO amount and Num
indicates IPO/SEO number. We estimate the following regression to determine if government industrialpolicies affect corporate finance:
IPO Growth or SEO Growth¼ b0þb1IP jtþb2Growthjtþb3 logðAssetsÞjt�1þb4P10 5jtþb5P11 5jtþ e1jt; ð1Þwhere Growthjt is the growth rate for Industry j in during the tth Five-Year Plan based on China StatisticalYearbook, log(Assets)jt�1 is the logarithm transformation of Industry j’s median total assets, P10_5jt orP11_5jt is an indicator that equals 1 for the Tenth or the Eleventh Five-Year Plan, and 0 otherwise. If the coef-ficient on IPjt is positive, then we have evidence that government industrial policies, as reflected in five-yearplans, influence the equity finance market.
Panels A and B, Table 1 report sample selections for IPOs and SEOs, respectively. Table 2 shows that thetotal IPO amount is RMB1421.04 billion and the total SEO amount is RMB1779.66 billion during 1991–2010.The Extractive industry (MINES) and the Transportation and Warehousing industry (TRANS) are the twobiggest recipients of equity finance opportunities.
Panel A, Table 3 shows the industry distribution of IPO/SEO growth. Overall, the average IPO growth inamount (growth in frequency) is 9.005 (1.457). The average SEO growth in amount (growth in frequency) is12.260 (2.261). In terms of IPO growth in amount, the Household Electronic Appliances industry(HHELCTR) has the highest growth of 36.940, followed by the Smelting and Pressing of Nonferrous Metalsindustry (NFERMTAL) of 36.760 and the Agriculture industry (AGRIC) of 36.630. The industry with thehighest growth in IPO frequency is the Social Services industry (SRVC) of 6.261, followed by the Smeltingand Pressing of Nonferrous Metals industry (NFERMTAL) and the Agriculture industry (AGRIC).
Overall SEO growth in amount (growth in frequency) is 12.260 (2.261). The industry with the highest SEOgrowth in amount (growth in frequency) is the Electronic Components Manufacturing industry (ELCTR-COMP), 33.380 (5.285). Using total assets as weights, the proportion of state-ownership is 69.5%, suggestingthat the state occupies a dominant place in the capital markets. The Electric Power, Steam and Hot Waterindustry (POWER) has the highest level of state-ownership, 98.0%, followed by the Extractive industry(MINES), 97.8%. Therefore, state ownership is dominant in traditional industries and utilities.
Panel B, Table 3 compares IPO and SEO growth for supported and non-supported industries. All differ-ences are insignificant. Regression results for IPOs and SEOs are reported in Table 4. Each observation isan industry-five-year-plan combination. Consistent with our expectation, in government supported industries,the growth of IPOs (in terms of amount and frequency) is higher than that in other industries. The coefficienton IP is positive and significant (7.187, t = 2.06 for growth in IPO amount; 1.554, t = 2.54 for growth in IPOfrequency). The coefficient on industrial policy IP is higher for IPO amount than that for IPO frequency, sug-gesting that the IPO amount grows even faster, consistent with the government’s intention of supporting theseindustries. The growth in SEO frequency is also higher in government supported industries than that in otherindustries. The coefficient on IP is 1.181 (t = 2.22).
When comparing the results for IPOs and SEOs, we find that the effect of industrial policies is stronger forIPOs than for SEOs, suggesting that government’s ability in implementing industrial policies is likely strongerin the initial offering market than in the secondary market. This is consistent with the fact that the role playedby the government in reviewing and approving of IPOs is larger than that of SEOs. SEO firms already haveobtained the listing status and the market force plays a larger role in them. Further, regulatory authorities aremore careful dealing with initial offerings than with secondary offerings. As for an already listed firm, its SEOapplication time and cost are usually shorter or lower than those of an IPO firm. In addition, SEO firms oftenneed to attract new investors through good performance. This is a more market-oriented mechanism. The roleof the government in influencing SEOs is reduced (as comparedwith IPOs) as themarket force becomes stronger.
State ownership is very important in China’s economy. Using shareholder data from CCER, we computethe proportion of state ownership for each industry, SOE, to determine whether a high level of state ownershipenables supported industries to obtain equity finance more easily. We estimate the following regression:
D. Chen et al. / China Journal of Accounting Research 10 (2017) 189–230 203
IPO Growth or SEO Growth ¼ b0 þ b1IP jt þ b2SOEjt þ b3IP jt � SOEjt þ b4Growthjt þ b5
� log ðAssetsÞjt�1 þ b6P10 5jt þ b7P11 5jt þ e2jt: ð2Þ
If the coefficient on IPjt�SOEjt is positive, we have evidence that national strategies are more tilted towardsthe state-owned sector or the state-owned sector is more responsive to national strategies.
Results are reported in Table 4. In the IPO regressions, when SOE and IP�SOE are added, the coefficientson IP�SOE are positive and significant (29.85, t = 2.21 using amount; 6.068, t = 2.61 using frequency), sug-gesting that state-owned firms in supported industries enjoy more IPO opportunities. However, the coefficientson IP become negative and significant (�17.87, t = -2.11 using amount; �3.317, t = �2.21 using frequency).This result suggests that state-owned firms may have crowded out non-state-owned firms in terms of IPOfinancing in supported industries. The coefficients on SOE are positive and significant (26.09, t = 2.50 usingamount; 3.052, t = 2.09 using frequency), suggesting that state-owned firms always enjoy better IPO oppor-tunities. In the SEO regressions, with the addition of SOE and IP�SOE, IP, SOE and IP�SOE are all insignif-icant. Again, it appears that the results for SEOs are weaker than those for IPOs.
Apart from IPO growth, we also examine a measure of the cost of equity financing, IPO underpricing. Thehigher is the level of underpricing, the higher is the cost of equity financing as initial shares are sold at a lowerprice. Although IPO underpricing captures only one aspect of the cost of equity capital, it is a reasonable andeasy indicator for the ease or the difficulty of obtaining equity capital.
We construct two measures of underpricing. IR is the average initial return during Five-Year Plan t forIndustry j and IR_W is the size-weighted initial return during Five-Year Plan t for Industry j, where initialreturn is computed as (IPO first day closing price � IPO offer price/IPO offer price). We replace IPO Growth
and SEO Growth with IR or IR_W in Models (1) and (2). Results are presented in Table 5. When we do notconsider state-ownership, the coefficients on IP are both insignificant. When we add SOE and IP�SOE, thecoefficients on IP�SOE are both negative and significant (�1.096, t = �1.83 using IR; �1.319, t = �2.26 usingIR_W). Further, when IR_W is used, the coefficient on IP becomes positive and significant (0.739, t = 1.81).Therefore, state-owned firms in government supported industries are able to sell their initial shares at higher
Table 5Regressions of IPO Underpricing and Five-Year Plans. Industrial policy IPjt equals 1 if Industry j is supported by the government in Five-Year Plan t, and 0 otherwise. IR (IR_W) is the average (weighted) initial return during Five-Year Plan t for Industry j, computed as (closeprice at IPO - offering price/offering price). Growthjt is the growth rate for industry j in during the tth five-year plan based on ChinaStatistical Yearbook, log(Assets)jt is the logarithm transformation of the industry median of assets, P11_5jt is an indicator that equals 1 forthe Eleventh Five-Year Plan and 0 otherwise, respectively.
Variables IR IR_W IR IR_W
IP �0.134 �0.172 0.617 0.739(�0.70) (�0.93) (1.43) (1.81)*
SOE – – 0.804 0.898(1.31) (1.48)
IP�SOE – – �1.096 �1.319(�1.83)* (�2.26)**
Growth 0.067 0.050 0.075 0.058(0.72) (0.56) (0.92) (0.74)
log(Assets) �0.046 �0.086 �0.102 �0.144(�0.49) (�0.95) (�1.00) (�1.44)
P10_5 �0.303 �0.241 �0.243 �0.185(�1.58) (�1.47) (�1.02) (�0.85)
P11_5 �0.038 0.090 0.080 0.202(�0.14) (0.36) (0.23) (0.59)
Constant 2.523 3.284 3.264 4.022(1.21) (1.65) (1.51) (1.92)*
Observations 106 106 106 106Adjusted R-squared 0.03 0.06 0.06 0.10
***Represents significance level at 1%.** Represents significance level at 5%.* Represents significance level at 10%.
204 D. Chen et al. / China Journal of Accounting Research 10 (2017) 189–230

prices, again indicating the relative ease that state-owned firms in supported industries have in obtainingequity capital.
5.3.2. Bank loans
Allen et al. (2005) investigate four important financing channels when Chinese firms invest in fixed assets:domestic bank loans, self-financing, state budget and foreign direct investment. They point out that domesticbank loans are the most important channel. We therefore investigate the effect of industrial policies on bankloans. We follow Foos et al. (2010) to compute growth in bank loans for an industry. We also hand-collectinformation on the lead banks of these loans. According to Allen et al. (2005), China’s banking industry ismainly occupied by four major state-owned banks. We therefore divide banks into two categories: Big4state-owned banks (Industrial and Commercial Bank of China, Bank of China, Agricultural Bank of Chinaand Bank of Construction) and non-Big4 banks.9 We further divide the sample into loans with collateralsand loans without collaterals. We estimate the following regression separately for big-four banks and non-big-four banks with and without collaterals.
Loan Growth ¼ b0 þ b1IP jt þ b2Growthjt þ b3 log ðAssetsÞjt�1 þ b4P11 5jt þ e3jt: ð3ÞIf the coefficient on IPjt is positive, we have evidence that government industrial policies, as reflected in five-
year plans, influence the bank loan market. Panel C, Table 1 shows the sample selection process for bank loans.Based on an earlier discussion of China’s political control system, China’s control of its financial system is
an integral part of its political control system. For example, the chairmen of the Industrial and CommercialBank of China and the Bank of China were members of the Sixteenth and Seventeenth Chinese CommunistParty Central Committees. They, being a part of the political control system, certainly behave differently fromother bank executives. Among many differences, an important one is the ability and the intent to carry outnational policies. Therefore, we expect to observe differences between the Big4 national banks and non-Big4 banks. The Big4 national banks are more likely to carry out national policies.
From descriptive statistics in Table 2, we observe evidence that China’s bank loan market is mainly headedby national banks (Allen et al., 2005). Among the 2467 bank loans (RMB598.52 billion), RMB238.24 billionare attributable to the Big4 national banks and RMB360.28 billion are attributable to other banks (includingnational banks such as China Development Bank and Bank of Communication). The Big4 national banksaccount for 39.80% of the loan market, suggesting that they have a scale advantage over other banks. We alsosee that the Big4 national banks and non-Big4 banks differ in clienteles. Among the Big4 banks, the industryreceiving the most loans is the electric power, steam and hot water production and supply industry (POWER),a total of RMB65.30 billion. This industry is mainly represented by national monopolies. The second clientelegroup is the real estate industry (RLEST), representing RMB34.05 billion. Non-Big4 banks have only about ahalf of that amount in these industries. The Big4 national banks’ monopolistic power is high in traditionalindustries and high-profit industries.
Panel A, Table 6 presents basic information on bank loan growth. Panel B, Table 6 compares bank loangrowth between supported and non-supported industries. It appears that supported industries have a signif-icantly higher level of loan growth than non-supported industries and this pattern mainly occurs in loans ini-tiated by Big4 banks.
Table 7 reports regression results on bank loan growth. Again, each observation is an industry-five-year-plan combination. In Panel A based on the full sample, we find that loan growth is affected by industrialpolices. The coefficient on IP is positive and significant (6.168, t = 2.07 using loan amount).
Next, we consider the role of state-ownership by estimating the following regression:
Loan Growth ¼ b0 þ b1IP jt þ b2SOEjt þ b3IP jt � SOEjt þ b4Growthjt þ b5 log ðAssetsÞjt�1 þ b6P11 5jt þ e4jt:
ð4ÞHowever, with the addition of SOE and IP�SOE, the coefficients on IP, SOE and IP�SOE are all insignificant.
In Panel B, Table 7, we perform our analysis based on combinations of Big4, non-Big4 banks and loanswith and without collaterals. For loans issued by Big4 banks, before we introduce SOE and IP�SOE, only
9 Interestingly, the names of these Big4 state-owned banks all reflect flavors of industrial policies.
D. Chen et al. / China Journal of Accounting Research 10 (2017) 189–230 205

Table 6Bank loan growth and five-year plans. Industrial policy IPjt equals 1 if Industry j is supported by the government in Five-Year Plan t, and0 otherwise. The growth rate of Loan total amount (number) during Five-Year Plan t (compared with the previous five-year plan) forIndustry j: Growth in Loan amount, (SumLoanjt � SumLoanjt�1)/SumLoanjt�1; Growth in Loan frequency, (NumLoanjt � NumLoanjt�1)/NumLoanjt�1. Growth in Loan (ALL) is from both Big4 national banks and Non-big4 national banks. Growth in Loan (Big4) is fromcollateral and non-collateral loans issued by Big4 national banks. Growth in Loan (NonBig4) is from collateral and non-collateral loansissued by Non-Big4 national banks. Growth in Loan (Big4/Collateral) is from collateral loans issued Big4 national banks. Growth in Loan(Big4/Non-Collateral) is from non-collateral loans issued Big4 national banks. Growth in Loan (NonBig4/Collateral) is from collateralloans issued by NonBig4 national banks. Growth in Loan (NonBig4/Non-Collateral) is from non-collateral loans issued by NonBig4national banks.
Industry ALL Big4 NonBig4
Amount Freq. Amount Freq. Amount Freq.
Panel A: MeansAGRIC 33.980 7.219 �0.429 �0.833 17.750 4.300MINES 48.990 14.000 1.157 1.333 . .FDPROC 3.311 6.633 2.089 4.298 1.656 �0.222FDPROD �1.000 �1.000 �1.000 �1.000 �1.000 �1.000BEVRG 3.118 1.000 �0.861 0.333 1.198 1.000TXTLS 19.100 11.110 1.008 4.500 3.088 7.167GARMTS 0.215 1.250 0.070 1.125 1.376 4.000LETHR . . . . . .WOOD . . . . . .FURN . . . . . .PAPER 1.337 �0.533 �0.828 �0.577 13.920 0.333PRINT �1.000 �1.000 . . �1.000 �1.000STAT . . . . . .PTRLM 2.310 11.080 4.821 10.020 . .CHEMS 34.390 25.690 0.804 0.351 52.180 9.526CHMSFIBR 3.673 3.000 0.970 1.500 �0.420 1.250RUBBR 0.409 �0.200 1.130 0.000 �0.534 �0.500PLASTICS . . �0.707 2.000 �1.000 �1.000ELCTRCOMP 2.420 8.694 0.312 7.313 0.461 0.667HHELCTR 7.961 0.833 9.235 0.750 7.939 0.667GLASS 3.238 2.815 0.343 1.469 5.828 5.500FERMTAL 1.454 4.250 �1.000 �1.000 27.510 2.000NFERMTAL 0.997 9.575 �0.073 3.375 0.220 0.267MTLPR 6.610 16.500 . . 31.890 3.500GENMACHN 0.240 0.667 0.475 0.833 0.251 1.333SPLMACHN 15.590 �0.059 0.324 0.556 17.990 �0.120CARS 13.150 3.238 3.608 �0.556 14.340 2.095ELCTRMCHN 11.290 3.301 9.541 1.975 3.673 3.712INSTR 0.555 0.300 �0.777 �0.889 1.097 0.500MEDICAL 2.885 11.090 5.996 9.714 �0.392 0.571BIOLG 1.640 13.140 1.145 6.286 �0.544 �0.813POWER 15.980 18.610 1.385 0.706 21.930 16.850GAS 11.210 3.000 . . 11.210 3.000CONSTR 8.454 0.000 �0.588 2.083 3.889 0.385TRANS 3.884 5.426 2.294 4.850 4.455 4.024IT 9.475 2.746 �0.365 1.978 3.803 3.076WHLSL 1.631 0.289 0.223 0.286 0.743 0.065RLEST 12.320 25.440 7.237 10.340 2.207 16.530SRVC 1.964 8.719 0.591 6.821 �0.103 1.462MEDIA 0.786 �0.688 14.260 �0.200 �0.207 �0.909OTHR 11.020 10.310 0.167 2.894 52.020 12.690
Sample avg. 8.503 7.485 2.064 3.152 10.880 3.812(continued on next page)
206 D. Chen et al. / China Journal of Accounting Research 10 (2017) 189–230

the coefficient on IP for loans with collaterals in amount is significant (2.303, t = 2.07). After we introduceSOE and IP�SOE, the coefficients on IP are negative and significant (�6.600, t = �2.25 in amount with col-laterals; �2.999, t = �1.72 in frequency without collaterals; �4.863, t = �1.71 in amount without collaterals).The coefficients on IP�SOE are positive and significant (14.113, t = 2.75 in amount with collaterals; 8.351,t = 2.16 in frequency without collaterals; 9.525, t = 1.94 in amount without collaterals). Therefore, for loansinitiated by Big4 banks, government engineering benefits state-owned firms while crowding out non-state-owned firms. However, this pattern does not exist in loans initiated by non-Big4 banks. Overall, it appearsthat Big4 banks are more likely to grant policy-oriented loans.
5.4. Investment
Based on the above analyses of the IPO, SEO and the bank loan markets, it is natural to consider and deter-mine whether financing opportunities spur investment. This is especially important as China’s economy isinvestment-driven. We define new investment INEWjt as ITOTALjt � IMAINTENANCEjt (Richardson, 2006), whereITOTAL is measured as cash payments for fixed assets, intangible assets, and other long-term assets from the cashflow statement, scaled by beginning total assets. This definition of ITOTAL is equivalent to capital expenditureused in US-based studies. IMAINTENANCE is measured as depreciation and amortization, scaled by beginningtotal assets. All observations are industry-five-pear plan combinations. We estimate the following regression:
INEWjt ¼ b0 þ b1IP jt þ b2Growthjt þ b3 log ðAssetsÞjt�1 þ b4P10 5jt þ b5P11 5jt þ e5jt: ð5Þ
We use the average value of investment for all firms in the industry. All other variables are as defined earlier. Ifthe coefficient on IPjt is positive, we have evidence that supported industries invest more than non-supportedindustries.
To determine investment efficiency, we also measure overinvestment following Richardson (2006) and esti-mate the following regression:
INEWit ¼ c0 þ c1VP it�1 þ c2Leverageit�1 þ c3Cashit�1 þ c4Ageit�1 þ c5Sizeit�1 þ c6Stock Returnit�1
þ c7INEWit�1 þ Year þ Industry þ e6it; ð6Þ
Table 6 (continued)
Industry ALL Big4/Collateral Big4/Non-Collateral
NonBig4/Collateral
NonBig4/Non-Collateral
Amount Freq. Amount Freq. Amount Freq. Amount Freq. Amount Freq.
Panel B: Supported industries versus non-supported industriesSupported
Mean 12.420 9.826 4.193 2.832 1.164 1.682 13.310 3.870 6.871 0.901Median 4.287 3.000 2.539 0.900 �0.622 �0.619 4.054 2.500 0.964 �0.608N 33 33 22 22 24 24 20 20 22 22
Non-support
Mean 3.331 4.395 1.454 0.910 �0.272 �0.506 20.720 2.393 5.013 0.942Median 1.090 0.667 0.241 0.000 �1.000 �1.000 2.921 0.967 �0.471 �0.250N 25 25 17 17 13 13 16 16 12 12
Supported vs. non-supported
Mean 9.089 5.431 2.739 1.922 1.436 2.188 �7.41 1.477 1.858 �0.041Median 3.197 2.333 2.298 0.900 0.378 0.381 1.133 1.533 1.435 �0.358
T-test (Z-test)t-statistics 2.62** 1.79* 2.04** 1.82* 1.63 2.32** �0.56 1.04 0.40 �0.03z-statistics 2.07** 1.71* 2.05** 1.74* 2.14** 2.11** 1.00 1.56 0.73 �0.18
***Represents significance level at 1%.** Represents significance level at 5%.* Represents significance level at 10%.
D. Chen et al. / China Journal of Accounting Research 10 (2017) 189–230 207

Table 7Regressions of bank loan growth and five-year plans. Industrial policy IPjt equals 1 if Industry j is supported by the government in Five-Year Plan t, and 0 otherwise. SOEjt is the proportion of state ownership for Industry j during the tth five-year plan. The growth rate ofLoan total amount (number) during Five-Year Plan t (compared with the previous five-year plan) for Industry j: Growth in Loan amount,(SumLoanjt � SumLoanjt�1)/SumLoanjt�1; Growth in Loan frequency, (NumLoanjt � NumLoanjt�1)/NumLoanjt�1. Growth in Loan(ALL) is from both Big4 national banks and Non-big4 national banks. Growth in Loan (Big4) is from collateral and non-collateral loansissued by Big4 national banks. Growth in Loan (NonBig4) is from collateral and non-collateral loans issued by Non-Big4 national banks.Growth in Loan (Big4/Collateral) is from collateral loans issued Big4 national banks. Growth in Loan (Big4/Non-Collateral) is from non-collateral loans issued Big4 national banks. Growth in Loan (NonBig4/Collateral) is from collateral loans issued by NonBig4 nationalbanks. Growth in Loan (NonBig4/Non-Collateral) is from non-collateral loans issued by NonBig4 national banks. Growthjt is the growthrate for industry j in during the tth five-year plan based on China Statistical Yearbook, log(Assets)jt is the logarithm transformation of theindustry median of assets, P11_5jt is an indicator that equals 1 for the Eleventh Five-Year Plan and 0 otherwise, respectively.
Variables ALL ALL
Amount Freq. Amount Freq.
Panel A: Bank loan growth and five-year plan
IP 6.168 0.918 �10.169 �8.086(2.07)** (0.36) (�1.06) (�1.18)
SOE – – 5.195 �3.246(0.70) (�0.46)
IP�SOE – – 24.250 13.576(1.54) (1.34)
Growth �1.285 2.796 �0.371 3.013(�0.49) (1.39) (�0.14) (1.44)
log(Assets) 2.493 0.820 �0.061 0.394(0.95) (0.81) (�0.02) (0.32)
P11_5 �8.957 �17.07 �5.393 �16.295(�2.36)** (�4.53)*** (�1.49) (�4.39)***
Constant �48.34 �6.975 6.418 4.365(�0.75) (�0.30) (0.09) (0.17)
Observations 58 58 58 58Adjusted R-squared 0.11 0.35 0.13 0.34Variables Big4/Collateral Big4/Non-Collateral Big4/Collateral Big4/Non-Collateral
Amount Freq. Amount Freq. Amount Freq. Amount Freq.
Panel B: Bank loan growth and five-year plan
IP 2.303 1.307 0.493 0.268 �6.600 �3.999 �4.863 1.209(2.07)** (1.40) (0.59) (0.46) (�2.25)** (�1.72)* (�1.71)* (0.72)
SOE – – – – 2.224 �2.074 �6.997 0.263(0.54) (�0.98) (�1.80)* (0.17)
IP�SOE – – – – 14.113 8.351 9.525 �1.584(2.75)** (2.16)** (1.94)* (�0.60)
Growth �1.605 �0.540 0.507 0.580 �0.927 �0.348 0.722 0.533(�1.28) (�1.07) (0.69) (0.89) (�0.78) (�0.63) (0.92) (0.77)
log(Assets) 1.803 0.755 1.192 0.325 0.005 0.186 1.484 0.426(2.01)* (1.53) (1.81)* (1.30) (0.00) (0.36) (2.34)** (0.98)
P11_5 �2.510 �5.279 �2.178 �6.333 �0.765 �4.760 �1.865 �6.575(�1.24) (�2.99)*** (�1.54) (�3.67)*** (�0.44) (�2.58)** (�1.32) (�3.00)***
Constant �38.119 �12.387 �28.253 �3.633 1.995 2.124 �32.420 �5.928(�1.78)* (�1.09) (�1.75)* (�0.55) (0.09) (0.19) (�2.24)** (�0.64)
Observations 39 39 37 37 39 39 37 37Adjusted R-squared 0.21 0.40 0.08 0.48 0.39 0.43 0.14 0.44
NonBig4/Collateral NonBig4/Collateral NonBig4/Collateral NonBig4/Collateral
IP �9.358 1.389 �0.936 �1.852 �17.026 �4.623 18.830 �5.663(�0.87) (1.11) (�0.16) (�1.45) (�0.54) (�1.29) (1.06) (�1.45)
SOE – – – – 53.380 �0.394 45.523 �4.035(1.46) (�0.11) (1.53) (�0.82)
IP�SOE – – – – 9.520 8.987 �32.628 6.513(0.16) (1.47) (�0.99) (1.39)
(continued on next page)
Line missing
208 D. Chen et al. / China Journal of Accounting Research 10 (2017) 189–230

where INEWit is the difference between total investment (ITOTAL) and depreciation and amortization(IMINTENANCE) for Firm i in Period t. VP is Tobin’s Q, measured as the sum of the market value of equityand net liabilities over the book value of tangible assets. Leverage is the ratio of total liabilities to total assets.Cash is cash and cash equivalents scaled by beginning total assets. Age is the log of listing years. Size is the logof total assets. Stock Return is the annual stock return. INEWit-1 is new investment in Period t � 1. We estimatethe coefficients and obtain the residual e [See Appendix B for regression results of the estimation model]. Wecompute the proportion of firms with e > 0 for each industry, Freq[e > 0]. The higher is the value of Freq[e > 0]for an industry, the more severe is its overinvestment problem.
To determine if supported industries have more overinvestment, we estimate the following regression:
Freq½e > 0�jt ¼ b0 þ b1IP jt þ b2Growthjt þ b3 log ðAssetsÞjt�1 þ b4P10 5jt þ b5P11 5jt þ e7jt: ð7Þ
If the coefficient on IPjt is positive, we have evidence that supported industries have more overinvestment.Panel A, Table 8 presents information on investment in various industries. The three industries with the
highest level of new investments are the extractive (MINES), transportation and warehousing (TRANS),and construction (CONSTR) industries. This pattern is consistent with China’s current investment situationin that investment in infrastructure is intense. Panel B, Table 8 compares investment in supported industriesand non-supported industries. Total investment, new investment and overinvestment in supported industriesall exceed those in non-supported industries.
Table 9 presents regression results. Supported industries have a higher level of new investment. The coef-ficient on IP is positive and significant (0.012, t = 2.56). On the other hand, supported industries also have amore severe level of overinvestment. In the overinvestment regression, the coefficient on IP is positive and sig-nificant (0.046, t = 2.85).
As seen earlier, industries with heavier state-ownership are more likely to obtain financing opportunities.We therefore examine the effect of state ownership on investment and overinvestment. We add SOE andIP�SOE and estimate the following regressions:
INEWit ¼ b0 þ b1IP jt þ b2SOEjt þ b3IP jt � SOEjt þ b4Growthjt þ b5 log ðAssetsÞjt�1 þ b6P10 5jt
þ b7P11 5jt þ e8jt; ð8Þ
Freq½e > 0�jt ¼ b0 þ b1IP jt þ b2SOEjt þ b3IP jt � SOEjt þ b4Growthjt þ b5 log ðAssetsÞjt�1 þ b6P10 5jt
þ b7P11 5jt þ e9jt: ð9Þ
If the coefficient on IPjt�SOEjt is positive, we have evidence that state-owned firms invest more.Results on the effect of state-ownership are presented in Table 9. When we use INEW, the coefficient on IP is
positive and significant (0.013, t = 1.79) while the coefficient on IP�SOE is insignificant. When we use ameasure of industry overinvestment, the coefficient on IP is positive and significant (0.083, t = 2.65) and
Table 7 (continued)
NonBig4/Collateral NonBig4/Collateral NonBig4/Collateral NonBig4/Collateral
Growth �7.226 �0.022 2.645 0.150 �3.116 0.390 5.383 0.038(�0.69) (�0.03) (1.11) (0.42) (�0.28) (0.41) (1.67) (0.08)
log(Assets) 8.654 0.756 2.018 0.430 �0.131 0.322 0.223 0.178(2.05)* (1.60) (1.08) (1.33) (�0.02) (0.50) (0.08) (0.43)
P11_5 6.213 �3.501 �5.232 �5.005 16.362 �2.744 �3.249 �4.288(0.34) (�1.54) (�1.00) (�2.58)** (0.69) (�1.09) (�0.62) (�2.37)**
Constant �183.950 �13.362 �43.153 �4.748 �16.735 �3.733 �33.387 3.265(�1.81)* (�1.19) (�0.92) (�0.60) (�0.12) (�0.28) (�0.46) (0.34)
Observations 36 36 34 34 36 36 34 34Adjusted R-squared �0.06 0.05 �0.08 0.16 �0.05 0.07 0.03 0.13
*** Represents significance level at 1%.** Represents significance level at 5%.* Represents significance level at 10%.
D. Chen et al. / China Journal of Accounting Research 10 (2017) 189–230 209

Table 8Investment and five-year plans. ITOTAL is measured as cash payments for fixed assets, intangible assets, and other long-term assets from the cash flow statement, scaled by beginning total assets. INEWit is the difference between totalinvestment (ITOTAL) and depreciation and amortization (IMINTENANCE) for firm i in t. Overinvestment, e, is theresidual estimated from the following model. INEWit = c0 + c1VPit�1 + c2Leverageit�1 + c3Cashit�1 + c4Ageit�1 + c5-�1 + c2Leverageit�1 + c3Cashit�1 + c4Ageit�1 + c5Sizeit�1 + c6Stock Returnit�1 + c7INEWit�1 + Year + Industry + eit.
Industry ITOTAL INEW Over-investmentFreq[e > 0]
Panel A: Investment and overinvestmentAGRIC 0.059 0.040 0.389MINES 0.124 0.082 0.403FDPROC 0.075 0.045 0.300FDPROD 0.076 0.048 0.260BEVRG 0.064 0.037 0.383TXTLS 0.074 0.041 0.350GARMTS 0.063 0.040 0.314LETHR 0.034 0.018 0.354WOOD 0.079 0.045 0.261FURN 0.078 0.060 0.467PAPER 0.090 0.049 0.392PRINT 0.067 0.037 0.306STAT 0.039 0.034 0.500PTRLM 0.068 0.028 0.416CHEMS 0.094 0.059 0.354CHMSFIBR 0.075 0.034 0.308RUBBR 0.069 0.030 0.389PLASTICS 0.098 0.062 0.360ELCTRCOMP 0.080 0.046 0.319HHELCTR 0.027 0.011 0.292GLASS 0.098 0.064 0.363FERMTAL 0.083 0.036 0.262NFERMTAL 0.089 0.059 0.301MTLPR 0.073 0.051 0.345GENMACHN 0.057 0.034 0.307SPLMACHN 0.059 0.040 0.345CARS 0.065 0.037 0.410ELCTRMCHN 0.055 0.033 0.361INSTR 0.054 0.035 0.352MEDICAL 0.063 0.039 0.344BIOLG 0.083 0.057 0.410POWER 0.106 0.069 0.364GAS 0.083 0.055 0.325CONSTR 0.085 0.084 0.302TRANS 0.103 0.074 0.374IT 0.048 0.029 0.317WHLSL 0.051 0.035 0.318RLEST 0.021 0.013 0.324SRVC 0.085 0.052 0.338MEDIA 0.064 0.059 0.192OTHR 0.051 0.033 0.270
Sample avg. 0.071 0.045 0.337
Panel B: Supported industries versus non-supported industriesSupported
Mean 0.077 0.051 0.357Median 0.072 0.046 0.361N 83 83 83
(continued on next page)
210 D. Chen et al. / China Journal of Accounting Research 10 (2017) 189–230

the coefficient on IP�SOE is negative and significant (�0.071, t = �1.68), suggesting that while firms in sup-ported industries tend to overinvest, state-owned firms actually overinvest less.
Ding et al. (2010) find that overinvestment exists in all types of Chinese firms, including non-state-ownedfirms with presumably better corporate governance and higher production efficiency. A possible explanationfor our result is that major projects of state-owned firms all have to be approved by the government while theinvestment decision making of non-state-owned firms is more flexible, causing more overinvestment by non-state-owned firms.
Table 9Regressions of investment and five-year plans. ITOTAL is measured as cash payments for fixed assets, intangible assets, and other long-termassets from the cash flow statement, scaled by beginning total assets. INEWit is the difference between total investment (ITOTAL) anddepreciation and amortization (IMINTENANCE) for firm i in t. Overinvestment, e, is the residual estimated from the following model.INEWit = c0 + c1VPit�1 + c2Leverageit�1 + c3Cashit�1 + c4Ageit�1 + c5Sizeit�1 + c6Stock Returnit�1 + c7INEWit + 1 + Year + Industry + eit.Industrial policy IPjt equals 1 if Industry j is supported by the government in Five-Year Plan t, and 0 otherwise. SOEjt is the proportion ofstate ownership for Industry j during Five-Year Plan t. Growthjt is the growth rate for industry j in during the tth five-year plan based onChina Statistical Yearbook, log(Assets)jt is the logarithm transformation of the industry median of assets, P11_5jt is an indicator thatequals 1 for the Eleventh Five-Year Plan and 0 otherwise, respectively.
Variables INEW Over-investment INEW Over-investmentFreq[e > 0] Freq[e > 0]
IP 0.012 0.046 0.013 0.083(2.56)** (2.85)*** (1.79)* (2.65)**
SOE – – �0.007 0.052(�1.25) (1.47)
IP�SOE – – �0.002 �0.071(�0.19) (�1.68)*
Growth 0.002 0.014 0.002 0.015(0.57) (0.90) (0.55) (0.90)
log(Assets) �0.002 �0.016 �0.002 �0.016(�0.49) (�1.33) (�0.47) (�1.34)
P11_5 �0.007 �0.014 �0.007 �0.012(�1.38) (�0.67) (�1.44) (�0.57)
Constant 0.076 0.638 0.078 0.624(1.03) (2.50)** (1.04) (2.37)**
Observations 150 150 150 150Adjusted R-squared 0.04 0.04 0.05 0.06
*** Represents significance level at 1%.** Represents significance level at 5%.* Represents significance level at 10%.
Table 8 (continued)
Industry ITOTAL INEW Over-investmentFreq[e > 0]
Non-supported
Mean 0.065 0.038 0.312Median 0.063 0.034 0.328N 67 67 67
Support vs non-supported
Mean 0.012 0.013 0.045Median 0.009 0.012 0.033
T-test (Z-test)
t-statistics 2.73*** 2.82*** 2.54**
z-statistics 2.54** 3.23*** 2.62***
*Represents significance level at 10%.*** Represents significance level at 1%.** Represents significance level at 5%.
D. Chen et al. / China Journal of Accounting Research 10 (2017) 189–230 211

Table 10Stock returns and five-year plans. BHARjt is the market adjusted buy-and-hold cumulative abnormal return. We use two measures ofBHARjt for industries: one is weighted based on firms’ market value of tradable shares, BHAR_WOSjt; and the other one is weighted basedon firms’ market value of all shares, including non-tradable shares, BHAR_WTSjt.
Industry 5-Year buy-and-hold abnormal return
Weighted by outstanding share market value Weighted by total share market value
Panel A: MeansAGRIC 2.705 3.097MINES 0.987 0.425FDPROC 1.683 1.740FDPROD 3.839 4.572BEVRG 3.175 2.951TXTLS 0.673 1.338GARMTS 0.498 1.169LETHR �0.546 0.052WOOD 0.120 0.622FURN �0.486 0.110PAPER 0.225 0.854PRINT �1.380 �0.561STAT �1.413 �0.437PTRLM 1.850 1.840CHEMS 1.172 1.238CHMSFIBR 0.828 1.457RUBBR �0.181 0.634PLASTICS 1.747 2.561ELCTRCOMP 0.721 1.359HHELCTR 0.390 0.712GLASS 1.809 2.402FERMTAL �0.922 �0.293NFERMTAL 2.309 2.259MTLPR 0.547 0.892GENMACHN 2.666 2.961SPLMACHN 3.178 2.826CARS 1.821 2.297ELCTRMCHN 3.311 3.117INSTR 3.177 3.278MEDICAL 2.897 3.242BIOLG 4.134 3.519POWER 1.102 1.442GAS �1.089 �0.420CONSTR �0.132 0.184TRANS �0.387 �0.073IT 0.980 1.779WHLSL 2.180 2.740RLEST 0.770 1.061SRVC 0.554 1.000MEDIA 1.091 1.051OTHR 0.916 1.191
Sample avg. 1.240 1.580
Industry 5-Year Buy-and-hold Abnormal Return
Weighted by Outstanding Share Market Value (WOS) Weighted by Total Share Market Value (WTS)
Panel B: Supported industries versus non-supported industriesSupported
Mean 1.210 1.386Median 0.138 0.183N 64 64
(continued on next page)
212 D. Chen et al. / China Journal of Accounting Research 10 (2017) 189–230

5.5. Industry performance
It is important to determine if government engineering is associated with an improvement or deteriorationin the performance of supported industries. Government engineering is a strategy that is not necessarily con-sistent with the free market mechanism. Therefore, supported industries may not perform well in the long run.On the other hand, the government may be able to identify industries that are promising in the future or areimportant for the national economy. If this is the case, supported industries can perform well in the long run.
It is also important to note that the economic performance of supported industries may not fit the originalgoals and purposes of government policies as the government often considers the aggregate interest of thewhole economy and the aggregate interest may not be consistent with the interest of a certain industry. Thatis, the external benefit of supporting an industrial can be scattered in the society and not directly reflectedwithin the industry that is the target of the policy. Therefore, even if we cannot find a link between governmentsupport and economic performance, we still cannot disapprove the rationale of government engineering.
5.5.1. Buy-and-hold abnormal return, BHAR
BHAR is the market adjusted buy-and-hold cumulative abnormal return (Barber and Lyon, 1997; Lyonet al., 1999) for an industry. We compute BHARjt for Industry j starting from the beginning of Five-Year Plant to its end. We use two measures of BHAR: one is weighted based on firms’ market value of tradable shares,BHAR_WOS; and the other is weighted based on firms’ market value of all shares, including non-tradableshares, BHAR_WTS.10
Panel A, Table 10 presents values of these two return measures for various industries. Panel B, Table 10compares these two measures for supported and non-supported industries. Without control variables, thereis no significant difference in returns between supported and non-supported industries. We then estimatethe following regression:
BHARjt ¼ b0 þ b1IP jt þ b2Growthjt þ b3logðAssetsÞjt þ e10jt: ð10Þ
The purpose of this analysis is to determine whether government supported industries fare better or worse inthe long run in the stock market.
Regression results are reported in Table 11. Each observation is an industry-five-year-plan combination.The coefficients on IP are largely insignificant (0.654, t = 1.56 using BHAR_WOS; 0.429, t = 1.15 usingBHAR_WTS).
Next, we add state-ownership SOE and IP�SOE, and estimate the following regression:
Table 10 (continued)
Industry 5-Year Buy-and-hold Abnormal Return
Weighted by Outstanding Share Market Value (WOS) Weighted by Total Share Market Value (WTS)
Non-supported
Mean 1.280 1.834Median 0.374 0.553N 49 49
Supported vs non-supported
Mean �0.070 �0.448Median �0.236 �0.370
T-test (Z-test)t-statistics �0.14 �0.91z-statistics �0.69 �1.15
***Represents significance level at 1%.**Represents significance level at 5%.*Represents significance level at 10%.
10 Chinese state-owned firms often just sell a portion of their shares. Therefore, many of their shares are non-tradable.
D. Chen et al. / China Journal of Accounting Research 10 (2017) 189–230 213

BHARjt ¼ b0 þ b1IP jt þ b2SOEjt þ b3IP jt � SOEjt þ b4Growthjt þ b5logðAssetsÞjt þ e11jt: ð11ÞWith the addition of SOE and IP�SOE, the coefficients on IP are positive and significant (5.652, t = 4.11 using
BHAR_WOS; 4.469, t = 3.69 using BHAR_WTS), suggesting that supported industries enjoy higher stockreturns. However, when state ownership increases, stock performance declines. The coefficients on IP�SOE
are negative and significant (�6.943, t = �3.88 using BHAR_WOS; �5.611, t = �3.51 using BHAR_WTS).Based on this result, we can potentially conclude that low efficiency associated with state ownership damp-
ens the positive effect of government support on industry stock performance. On the other hand, we perhapscan also argue that as some of the external benefit of government engineering cannot be internalized by thestate sector, the performance of the state sector is not as good as that of the non-state sector which potentiallyabsorbs some of the external benefit.
5.5.2. Operating cash flow
We also consider an accounting based measure of performance, the growth in operating cash flow,CashFlowjt. It is the compounded average annual growth rate of net operating cash flow for Industry j duringFive-Year Plan t. We estimate the following regression:
CashFlowjt ¼ b0 þ b1IP jt þ b2Growthjt þ b3 log ðAssetsÞjt þ e12jt: ð12ÞThe purpose of this examination is that cash flow reflects another dimension of industry performance, com-plementing results based on industry stock returns.
Panel A, Table 12 provides information on cash flow in various industries. Panel B, Table 12 compares thegrowth in cash flow between supported and non-supported industries. There is some weak evidence that sup-ported industries have higher cash flow growth (difference in mean = 0.050, t = 1.83). Regression results are
Table 11Regressions of stock returns and five-year plans. Industrial policy IPjt equals 1 if Industry j is supported by the government in Five-YearPlan t, and 0 otherwise. SOEjt is the proportion of state ownership for Industry j during Five-Year Plan t. BHARjt is the market adjustedbuy-and-hold cumulative abnormal return. We use two measures of BHARjt for industries: one is weighted based on firms’ market value oftradable shares, BHAR_WOSjt; and the other one is weighted based on firms’ market value of all shares, including non-tradable shares,BHAR_WTSjt. Industrial policy IPjt equals 1 if Industry j is supported by the government in Five-Year Plan t, and 0 otherwise. log(Assets)jt is the logarithm transformation of Industry j’s median total assets.
5-Year buy-and-hold abnormal return
Variables Weighted by OutstandingShare Market Value (WOS)
Weighted by Total ShareMarket Value (WTS)
Weighted by OutstandingShare Market Value (WOS)
Weighted by Total ShareMarket Value (WTS)
IP 0.654 0.429 5.652 4.469(1.56) (1.15) (4.11)*** (3.69)***
SOE – – 1.527 1.214(1.40) (1.23)
IP�SOE – – �6.943 �5.611(�3.88)*** (�3.51)***
Growth 0.269 0.235 0.255 0.222(1.22) (1.20) (1.39) (1.29)
log(Assets) �0.199 �0.249 �0.105 �0.170(�0.92) (�1.28) (�0.46) (�0.89)
P10_5 �0.164 �0.600 �0.513 �0.886(�0.45) (�1.74)* (�1.21) (�2.36)**
P11_5 3.058 3.405 2.355 2.827(4.60)*** (5.56)*** (2.83)*** (3.87)***
Constant 4.414 6.189 1.662 3.917(0.85) (1.32) (0.33) (0.91)
Observations 113 113 113 113Adjusted R-
squared0.28 0.41 0.35 0.46
*** Represents significance level at 1%.** Represents significance level at 5%.* Represents significance level at 10%.
214 D. Chen et al. / China Journal of Accounting Research 10 (2017) 189–230

Table 12Growth of operating cash flows and five-year plans. Cashflow is the averagegrowth rate of net operating cash flow in every five-year plan.
Industry Cashflow
AGRIC 0.066MINES 0.224FDPROC 0.048FDPROD 0.182BEVRG 0.194TXTLS 0.170GARMTS 0.072LETHR �0.160WOOD �0.061FURN �0.147PAPER 0.169PRINT 0.041STAT 0.190PTRLM 0.147CHEMS 0.181CHMSFIBR 0.086RUBBR 0.055PLASTICS 0.051ELCTRCOMP �0.005HHELCTR 0.150GLASS 0.101FERMTAL 0.220NFERMTAL 0.200MTLPR 0.147GENMACHN 0.184SPLMACHN 0.102CARS 0.072ELCTRMCHN 0.086INSTR 0.111MEDICAL 0.435BIOLG 0.195POWER 0.042GAS 0.151CONSTR 0.118TRANS 0.095IT 0.164WHLSL 0.254RLEST 0.135SRVC 0.156MEDIA 0.123OTHR 0.132
Sample avg. 0.066
Industry Cashflow
Panel B: Supported industries versus non-supported industriesSupported
Mean 0.153Median 0.137N 85
Non-supported
Mean 0.103Median 0.128N 64
(continued on next page)
D. Chen et al. / China Journal of Accounting Research 10 (2017) 189–230 215

reported in Table 13. Each observation is an industry-five-year-plan combination. The coefficient on IP is pos-itive and significant (0.058, t = 2.04), suggesting that supported industries enjoy higher cash flow growth.
Next, we add state-ownership SOE and IP�SOE and estimate the following regression:
Cash Flowjt ¼ b0 þ b1IP jt þ b2SOEjt þ b3IP jt � SOEjt þ b4Growthjt þ b5 log ðAssetsÞjt þ e13jt: ð13ÞWith the addition ofSOE and IP�SOE, the coefficients on IP are positive and significant (0.107, t = 2.12), sug-
gesting that supported industries enjoy higher growth of cash flow. However, as state ownership increases, thegrowth rate of cash flow declines. The coefficients on IP�SOE are negative and significant (�0.099, t = �1.67).
5.5.3. Non-performing loan ratio, NPLR
The buy-and-hold return and cash flow analyses above capture performance in the stock market or inaccounting terms. As we have earlier examined the effect of the government support in the loan market, wealso estimate a performance measure for the loan market. We follow Morck et al. (2011) and compute thenon-performing loan ratio NPLRjt for Industry j during 2006–2010. Data come from hand-collected annualreports of the CBRC for 2006–2010.
Table 13Regressions of growth of operating cash flows and five-year plans. Cashflow is the average growthrate of net operating cash flow in every five-year plan. Industrial policy IPjt equals 1 if Industry j issupported by the government in Five-Year Plan t, and 0 otherwise. SOEjt is one if the ultimatecontroller is state ownership for Industry j during Five-Year Plan t. Growthjt is the growth rate forindustry j in during the tth five-year plan based on China Statistical Yearbook, log(Assets)jt is thelogarithm transformation of Industry j’s median total assets.
Variables Cashflow Cashflow
IP 0.058 0.107(2.04)** (2.12)**
SOE – 0.034(0.84)
IP�SOE – �0.099(�1.67)*
Growth 0.009 0.010(0.45) (0.49)
log(Assets) �0.002 �0.004(�0.09) (�0.16)
P11_5 0.028 0.028(1.01) (1.02)
Constant 0.124 0.145(0.23) (0.26)
Observations 149 149Adjusted R-squared 0.01 0.02
***Represents significance level at 1%.** Represents significance level at 5%.* Represents significance level at 10%.
Table 12 (continued)
Industry Cashflow
Supported vs non-supportedMean 0.050Median 0.009
T-test (Z-test)
t-statistics 1.83*
z-statistics 1.14
***Represents significance level at 1%.**Represents significance level at 5%.* Represents significance level at 10%
216 D. Chen et al. / China Journal of Accounting Research 10 (2017) 189–230

Panel A, Table 14 shows the level of non-performing loans for various industries. Panel B, Table 14 com-pares the level of non-performing loans between supported and non-supported industries. We find no signif-icant difference. Next, we take a logistic transformation of NPLR and estimate the following regressions:
log½NPLRjt=ð1��NPLRjtÞ ¼ b0 þ b1IP jt þ b2 log ðVAÞjt þ e14jt; ð14Þlog½NPLRjt=ð1��NPLRjtÞ ¼ b0 þ b1IP jt þ b2SOEjt þ b3IP jt � SOEjt þ b4logðVAÞjt þ e15jt; ð15Þ
where VAjt is value-added for Industry j. We use these equations to determine whether supported industrieshave more or less non-performing loans.
The issue of non-performing loans in China’s banking system has been a topic of interest. China’s bankingsystem has experienced several major reforms and through the establishment of several big asset managementfirms, non-performing loans have been drastically reduced. Based on annual reports of China’s BankingRegulatory Commission, the ratio of non-performing loans exhibits steady decline over 2005–2010. However,government industrial policies may distort the bank loan market, causing the ratio of non-performing loans tobe higher in supported industries than in non-supported industries. This logic would be consistent with Allenet al. (2005) and Morck et al. (2011).
Table 14Non-performing loans and five-year plans. NPLRjt is non-performing loan ratio for Industry j in Year t.
Industry NPLR
Panel A: Non-performing loansAGRIC 0.217MINES 0.017MACHN 0.054POWER 0.019CONSTR 0.023TRANS 0.016IT 0.037WHLSL 0.079RESTAUNT 0.102MONEY 0.005RLEST 0.036RENT 0.044SICENCE 0.068ENVIRONMNT 0.009SRVC 0.033EDU 0.027HEALTH 0.030CULTURE 0.078PUBLIC 0.028
Sample avg. 0.049
Panel B: Supported industries versus non-supported industriesSupported
Mean 0.069Median 0.032N 25
Non-supported
Mean 0.041Median 0.024N 70
Support vs. non-support
Mean 0.028Median 0.008
T-test (Z-test)
t-statistics 1.14z-statistics 1.15
D. Chen et al. / China Journal of Accounting Research 10 (2017) 189–230 217

Table 15 presents results covering 2006–2010. In this analysis, as we only have data for one five-year plan,each observation is an industry-year combination. The coefficient on IP is positive and marginally significant(1.659, t = 1.64), suggesting that the ratio of non-performing loans is higher in supported industries than innon-supported industries. This is evidence of a negative effect of government support, consistent withMorck et al. (2011) that government-led resource allocations can create distortion. The coefficient on SOE
is negative and significant (�2.199, t = �3.12), suggesting that state-owned firms in non-supported industriesactually have a lower non-performing loan ratio. The coefficient on IP�SOE is insignificant (�0.715,t = �0.64), suggesting no difference in the non-performing loan ratio between state-owned and non-state-owned firms in supported industries.
The above results are different from our stock market performance and cash flow growth analyses earlier.We do not attempt a formal reconciliation here. Five-year plans are multi-dimensional and an analysis of themhas to be conducted from different angles. Finding different results enriches our understanding of this modeland helps us more objectively evaluate its consequences. Of course, the evidence that state-owned firms in non-supported industries have a lower non-performing loan ratio may be specific for the time period 2006–2010used in the analysis as the government established several asset management companies that took over manynon-performing loans from banks.
6. Conclusion
Since the start of its economic reform in 1978, China has achieved rapid and sustained economic growth.What does China’s rapid growth tell us? Is the China experiment useful to other economies? These areunavoidable questions of our era. Different from prior research on China’s economy, we focus on an economicmanagement model long used by the Chinese government – five-year plans. We examine the influence of fourfive-year plans from 1991 to 2010 on China’s capital markets and their economic consequences.
We find that industries supported by the government enjoy faster growth in equity and debt finance. Thispattern is more pronounced in industries with heavy state ownership. Further, as their respective market ori-entation improves, the government’s control of the IPO, SEO and bank loan markets declines. We also findthat government supported industries have higher stock market returns and cash flow growth that dampen asstate ownership increases. Supported industries also have a higher ratio of non-performing loans. These find-ings provide a new perspective in understanding the role played by government economic engineering on cor-porate finance and its economic consequences.
Table 15Regressions of non-performing loans and five-year plans. Industrial policy IPjt equals 1 if Industry j issupported by the government in Five-Year Plan t, and 0 otherwise. SOEjt is the proportion of stateownership for Industry j during Five-Year Plan t. NPLRjt is non-performing loan ratio for Industry j.We take the logistic transformation of NPLRjt. VAjt is value added Industry j.
Variables log[NPLR/(1 � NPLR)] log[NPLR/(1 � NPLR)]
IP 0.730 1.659(1.28) (1.64)*
SOE – �2.199(�3.12)***
IP�SOE – �0.715(�0.64)
log(VA) �0.230 �0.595(�0.87) (�2.14)**
Constant �1.726 2.730(�0.75) (1.08)
Observations 95 95Adjusted R-squared 0.03 0.22
*** Represents significance level at 1%.** Represents significance level at 5%.* Represents significance level at 10%.
218 D. Chen et al. / China Journal of Accounting Research 10 (2017) 189–230

Appendix
A.Capturinggovernmentengineering
Tim
eEvent/Codes
Eighth
Five-YearPlan(1991–1995)
Dec.30th,1990
TheSeventh
Plenum
ofthe13th
CommunistParty
ofChina(C
PC)Central
Committeedeliberated
andad
optedtheCPC
Central
Committee’ssuggestionsab
outmak
ingtheten-yearprogram
ofnational
economic
andsocial
developmentan
dthe
Eighth
Five-YearPlan.
Mar.,1990
TheFourthSessionofthe7thNational
People’sCongress(N
PC)deliberated
andad
optedtheState
Council’sreportab
outthe
outlineoften-yearprogram
ofnationaleconomic
andsocial
developmentan
dtheEighth
Five-YearPlan.
Deng
Xiaoping’s
talk
During
Excursionsto
China’s
Southern
Cities,1992
Marked
byDengXiaoping’sserioustalk
in1992
and14th
National
CongressoftheCommunistParty
ofChina,
China’s
reform
,openingupan
dmodernizationenteredanew
stagein
theEighth
Five-YearPeriod.Focusesareenhan
cingagriculture,
basic
industries
andbasic
facilities,reorgan
izingan
dim
provingtheprocessingindustry,highligh
tingthedevelopmentof
electronicindustry,developingtheconstructionindustry
andthetertiary
industry
actively,establishingmachinery,
electronics,
petrochem
ical,au
tomobileman
ufacturing,
andbuildingindustry
aspillarindustries.
Details
Machineryindustry:equipmentfortran
sportation,energy,raw
materialindustries,etc,
especiallybasic
machineryan
dbasic
components
andparts;Electronicsindustry:integrated
circuit,computer,
communicationequipment,an
dnew
generation
household
applian
ce;Petroleum
industry:comprehensive
utilizationan
ddeepprocessingofethylene,syntheticfiber,synthetic
resin,synthetic
rubber
andbasic
organ
icraw
materials;Automobileindustry:majorcaran
dligh
t-weigh
tvehicle
enterprises;
Constructionindustry:buildingmaterialsindustry.Tertiaryindustry:science
andtechnology,education,inform
ation
consultationindustry;commercial,finan
ce,insurance,tourism
,an
dresidentserviceindustry.
Ninth
Five-YearPlan(1996–2000)
Sep.28th,1995
The5thPlenum
ofthe14th
CPC
Central
Committeeap
provedproposalsfortheNinth
Five-YearPlanofnational
economic
andsocial
developmentan
dlong-term
objectives
through
theyear
2010.
Mar.17th,1996
The4thSessionofthe8thNPC
deliberated
andad
optedtheoutlineontheNinth
Five-YearPlanofnational
economic
and
social
developmentofan
dlong-term
objectives
through
theyear
2010.
D. Chen et al. / China Journal of Accounting Research 10 (2017) 189–230 219

Details
Reinforcingagriculture
should
bethepriority
ofthenational
economy.
Officialsat
allmajorlevelsshould
work
ondeveloping
agriculture
andallindustries
should
contribute
tothedevelopmentofagriculture
andruraleconomy.
Thego
vernmentshould
continueto
strengthen
basic
facilities
andbasic
industries.Energy
industry
(electricpower,coal,petroleum
andnaturalgas);
tran
sportationindustry
(focusingonincreasingrailroad
tran
sportationcapab
ilityan
dtakingad
vantage
ofvariousother
modes
oftran
sportation,such
asroad
s,waterways,airan
dpipelines);postal
andtelecommunicationindustry;raw
material
industry
(ironan
dsteelindustry,nonferrousmetal
industry).Governmentshould
promote
pillarindustries
andad
just
and
improve
ligh
ttextileindustry.1.
Machineryindustry:enhan
cingthedevelopmen
tan
dman
ufacturingcapab
ilityoflarge
integrated
equipmentforproducingelectric
power,chem
ical
fertilizer,ethylenean
dso
on,im
provingtheperform
ance
and
qualityofmajorbasicmachinerylikeCNC
machinetoolan
dmajormachineryparts
likehyd
raulicpressure,pneumatic,seal,
instrumentan
dmeter,etc.;2.
Electronicsindustry:focusingondevelopingintegrated
circuits,new
components,computeran
dcommunicationequipment,an
denhan
cingthecapab
ilityofprovidinginform
atizationsystem
andequipmentforeconomic
andsocial
development;3.
Petrochem
ical
industry:developingdeepprocessingan
dcomprehensive
utilizationcapab
ility,
focusingondevelopingsynthetic
fiber,synthetic
resinan
dsynthetic
rubber;4.
Automobileindustry:focusingondeveloping
auto
parts,economycars
andheavy
vehicles,establishingindependentau
tomotive
technology
developmentsystem
tocarry
outscaleproduction;5.
Constructionindustry
andbuildingmaterialindustry:focusingonconstructingurban
andrural
housingan
dpublicprojects,im
provingan
denhan
cingdesigncapab
ility,
reinforcingconstructionman
agem
ent,gu
aran
teeing
project
quality;
6.Lighttextileindustry:Activelydeveloptertiary
industries
such
ascommercial
serviceindustry:continuingto
developcommercial
retailoutlets,perfectingnon-staple
agriculturalproducts,industrial
consumer
goods,an
dproduction
materialwholesales;
tourism
;inform
ationconsultationindustry.
Tenth
Five-YearPlan(2001–2005)
Oct.11th,2000
The5thplenum
ofthe15th
CPC
Central
Committeeap
provedRecommendationsbytheChineseCommunistParty
Central
CommitteeontheForm
ulationoftheTenth
Five-YearNational
Economic
andSocial
DevelopmentPlan.
Oct.19th,2000
PremierZhuRongjiexplained
recommendationsfordrawinguptheTenth
Five-YearPlan.
Mar.15th,2001
The4thSessionofthe9thNPC
approvedtheplan.
220 D. Chen et al. / China Journal of Accounting Research 10 (2017) 189–230
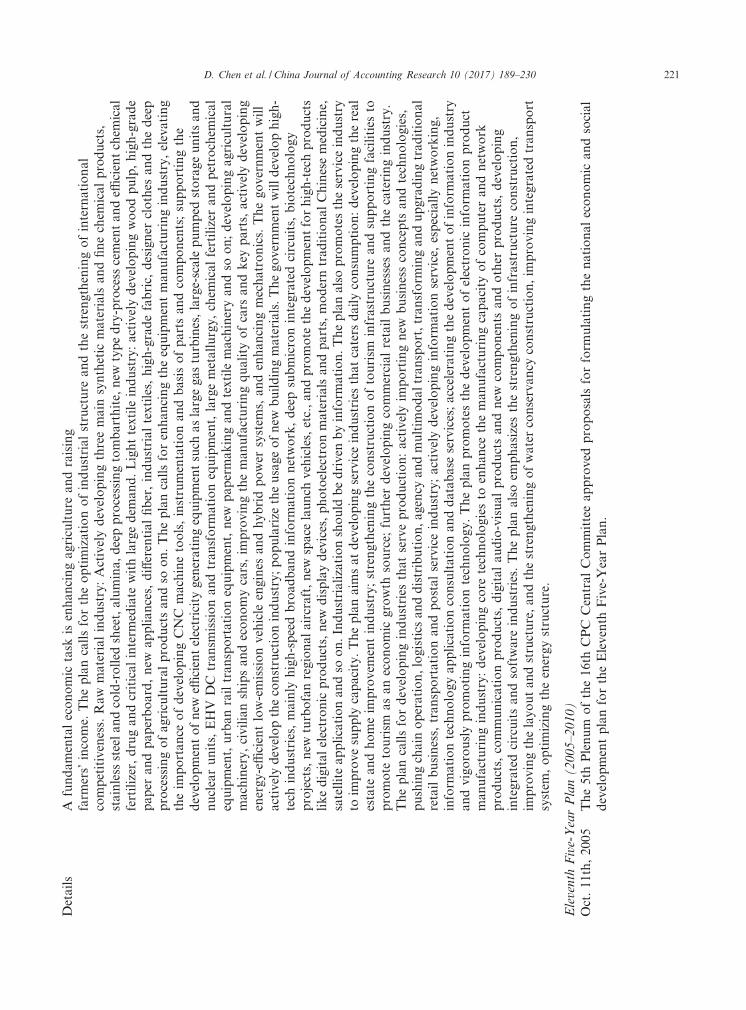
Details
Afundam
entaleconomic
task
isenhan
cingagriculture
andraising
farm
ers’income.
Theplancallsfortheoptimizationofindustrial
structure
andthestrengtheningofinternational
competitiveness.
Raw
materialindustry:Activelydevelopingthreemainsynthetic
materials
andfinechem
ical
products,
stainless
steelan
dcold-rolled
sheet,alumina,
deepprocessingtombarthite,new
typedry-process
cementan
deffi
cientchem
ical
fertilizer,drugan
dcritical
interm
ediate
withlargedem
and.Lighttextileindustry:actively
developingwoodpulp,high-grade
pap
eran
dpap
erboard,new
applian
ces,
differential
fiber,industrial
textiles,high-gradefabric,
designer
clothes
andthedeep
processingofagriculturalproductsan
dso
on.Theplancallsforenhan
cingtheequipmentman
ufacturingindustry,elevating
theim
portan
ceofdevelopingCNC
machinetools,instrumentationan
dbasisofparts
andcomponents;supportingthe
developmentofnew
efficientelectricitygeneratingequipmentsuch
aslargegasturbines,large-scalepumped
storage
unitsan
dnuclearunits,EHV
DC
tran
smissionan
dtran
sform
ationequipment,largemetallurgy,
chem
ical
fertilizer
andpetrochem
ical
equipment,urban
railtran
sportationequipment,new
pap
ermak
ingan
dtextilemachineryan
dso
on;developingagricultural
machinery,
civilian
shipsan
deconomycars,im
provingtheman
ufacturingqualityofcars
andkey
parts,actively
developing
energy-efficientlow-emissionvehicle
engines
andhyb
ridpower
system
s,an
denhan
cingmechatronics.Thego
vernmentwill
actively
developtheconstructionindustry;popularize
theusage
ofnew
buildingmaterials.Thego
vernmentwilldevelophigh-
tech
industries,mainly
high-speedbroad
ban
dinform
ationnetwork,deepsubmicronintegrated
circuits,biotechnology
projects,new
turbofanregional
aircraft,new
spacelaunch
vehicles,etc.,an
dpromote
thedevelopmen
tforhigh-techproducts
likedigital
electronic
products,new
displaydevices,photoelectronmaterialsan
dparts,moderntrad
itional
Chinesemedicine,
satelliteap
plicationan
dso
on.Industrializationshould
bedrivenbyinform
ation.Theplanalso
promotestheserviceindustry
toim
prove
supply
capacity.
Theplanaimsat
developingserviceindustries
that
caters
daily
consumption:developingthereal
estate
andhomeim
provementindustry;strengtheningtheconstructionoftourism
infrastructure
andsupportingfacilities
topromote
tourism
asan
economic
growth
source;
further
developingcommercial
retailbusinessesan
dthecateringindustry.
Theplancallsfordevelopingindustries
that
serveproduction:actively
importingnew
businessconcepts
andtechnologies,
pushingchainoperation,logisticsan
ddistribution,agency
andmultim
odaltran
sport,tran
sform
ingan
dupgrad
ingtrad
itional
retailbusiness,tran
sportationan
dpostal
serviceindustry;actively
developinginform
ationservice,
especiallynetworking,
inform
ationtechnology
applicationconsultationan
ddatab
aseservices;acceleratingthedevelopmentofinform
ationindustry
andvigo
rouslypromotinginform
ationtechnology.
Theplanpromotesthedevelopmentofelectronic
inform
ationproduct
man
ufacturingindustry:developingcore
technologiesto
enhan
cetheman
ufacturingcapacityofcomputeran
dnetwork
products,communicationproducts,digital
audio-visual
productsan
dnew
components
andother
products,developing
integrated
circuitsan
dsoftwareindustries.Theplanalso
emphasizes
thestrengtheningofinfrastructure
construction,
improvingthelayo
utan
dstructure,an
dthestrengtheningofwater
conservan
cyconstruction,im
provingintegrated
tran
sport
system
,optimizingtheenergy
structure.
Eleventh
Five-YearPlan(2005–2010)
Oct.11th,2005
The5thPlenum
ofthe16th
CPC
Central
Committeeap
provedproposals
forform
ulatingthenational
economic
andsocial
developmentplanfortheEleventh
Five-YearPlan.
D. Chen et al. / China Journal of Accounting Research 10 (2017) 189–230 221

Details
Investmentto
theagriculture
industry
isthemost
importan
tfocusofgo
vernmentinvestment.Theindustrial
structure
of
agriculture
should
beoptimized:increasingtheweigh
tofthebreedingindustry,acceleratingthedevelopmentofan
imal
farm
ingan
ddairy
farm
ing,
anddevelopingtheaq
uaculture
andaq
uatic
product
processing.
Acceleratingthedevelopmentofhigh-techindustries.Enhan
cingtheelectronicinform
ationindustry:includingdevelopingthe
integrated
circuits,software,
new
electronic
components
andother
core
industries,focusingonopticalcommunication,
wirelesscommunication,high-perform
ance
computingan
dnetwork
equipmentan
dother
inform
ationindustries,settingup
thesoftware,microelectronics,optoelectronicsan
dother
industrial
bases,promotingtheform
ationofoptoelectronicsindustry
chain.Cultivatebioindustry:focusingondevelopingthebio-m
edicine,
bio-agriculture,bio-energy
andbio-m
anufacturing.
Promotingtheaerospaceindustry.Developingthenew
materialsindustry.Revitalizingtheequipmentman
ufacturing
industry:includinglargean
deffi
cientcleanpower
generationequipment,EHV
tran
smissionan
dsubstationequipment,large
ethyleneequipment,largecoal-chem
ical
equipment,largemetallurgical
equipment,integrated
coal
miningequipment,large
ship’sfitting,
railtran
sitequipment,environmen
talprotectionan
dcomprehensive
utilizationofresources
equipment,
numerical
controlmachine.
Optimizingtheenergy
industry:orderly
developingthecoal,actively
developingtheelectric
power,acceleratingthedevelopmentoftheoilan
dgas,an
dstrivingto
developtherenew
able
energy
sources.Adjustingthe
structure
andlayo
utofraw
materialsindustry:optimizingthedevelopmentofthemetallurgical
industry,actively
developing
thefinechem
ical
industry,strivingto
developthetrad
itional
Chinesemedicineindustry.
Acceleratingthedevelopmentofserviceindustries.Givingpriority
tothedevelopmen
toftran
sportationindustry,strivingto
developthemodernlogisticsindustry,an
ddevelopingthefinan
cial
services
industry
inan
orderly
man
ner,actively
developing
theinform
ationserviceindustry,developingthereal
estate
industry,vigo
rouslydevelopingthetourism
industry,strengthening
themunicipal
utilities
industry,acceleratingthedevelopmentofcommunityserviceindustry,developingsportsan
dthesports
industry.
Appendix
B.Regressionsofestimatingoverinvestment(R
ichardson,2006)
I NEWitis
thedifference
betweentotalinvestment(ITOTAL)an
ddepreciationan
dam
ortization(IMIN
TENANCE)forFirm
iin
Periodt.VP
isTobin’s
Q,measuredas
thesum
ofthemarket
valueofequityan
dnet
liab
ilitiesoverthebookvalueoftangible
assets.Leverageis
theratio
oftotalliab
ilitiesto
totalassets.Cash
iscash
andcash
equivalents
scaled
bybeginningtotalassets.Ageis
thelogoflistingyears.
Sizeis
the
logoftotalassets.Stock
Return
isthean
nual
stock
return.I N
EWit�1isnew
investmentin
Periodt�
1.
Variables
NMean
S.D
.Min
Q1
Q25
Median
Q75
Q99
Max
Panel
A:Main
variables
I TOTALt
12,692
0.068
0.078
0.000
0.000
0.014
0.042
0.092
0.395
0.409
I NEWt
12,692
0.042
0.080
�0.417
�0.048
�0.003
0.016
0.062
0.347
0.887
VPt�
112,692
2.510
1.625
0.907
0.907
1.430
2.012
3.008
9.373
10.596
Leverage t�1
12,692
0.481
0.185
0.008
0.077
0.350
0.487
0.617
0.909
1.000
Cash
t�1
12,692
0.176
0.142
0.004
0.004
0.077
0.139
0.234
0.761
0.790
Linemissing
222 D. Chen et al. / China Journal of Accounting Research 10 (2017) 189–230

Age t�1
12,692
1.669
0.737
0.000
0.000
1.099
1.792
2.197
2.773
2.944
Size t�1
12,692
21.220
1.005
14.937
19.124
20.544
21.121
21.818
24.000
26.762
Return
t�1
12,692
0.345
0.954
�0.751
�0.751
�0.273
�0.006
0.704
4.183
4.183
I NEWt�
112,692
0.046
0.084
�0.274
�0.048
�0.003
0.019
0.068
0.374
0.880
Variables
VP=Tobin’sQ
I NEW
Panel
B:Estim
ationmodel
VPt�
10.003
(4.94)
***
Leverage t�1
�0.020
(�5.19)***
Cash
t�1
0.037
(7.55)
***
Age t�1
�0.007
(�6.56)***
Size t�1
0.003
(3.84)
***
Stock
Return
t�1
0.002
(2.05)
**
I NEWt�
10.359
(45.02)***
Constan
t�0
.053
(�2.95)***
Year&
Industry
Yes
Observations
12,692
Adjusted
R-squared
0.21
*Represents
sign
ificance
levelat
10%.
***Represents
sign
ificance
levelat
1%.
**Represents
sign
ificance
levelat
5%.
D. Chen et al. / China Journal of Accounting Research 10 (2017) 189–230 223

References
Agrawal, D., Knoeber, C., 2001. Do some outside directors play a political role? J. Law Econ. 44 (1), 179–198.Alesina, A., Rodrik, D., 1994. Distributive politics and economic growth. Quart. J. Econ., 465–490Allen, F., Qian, J., Qian, M., 2005. Law, finance, and economic growth in China. J. Financ. Econ. 77, 57–116.Allen, F., Qian, J., Zhang, C. 2011. An Alternative View on Law, Institutions, Finance and Growth, Working paper.Ayyagari, M., Demirguc-Kunt, A., Maksimovic, V., 2010. Formal versus informal finance: evidence from China. Rev. Finan. Stud. 23 (8),
3048–3097.Barber, B.M., Lyon, J.D., 1997. Detecting long-run abnormal stock returns: the empirical power and specification of test statistics. J.
Finan. Econ. 43, 341–372.Barnett, S., Brooks, R. 2006. What’s Driving Investment in China? IMF working paper.Beck, T., Levine, R., 2002. Industry growth and capital allocation: does having a market- or bank-based system matter? J. Finan. Econ.
64, 147–180.Brandt, V.L., Rawski, T.G., 2008. China’s Great Economic Transformation. Cambridge University Press.Chen, K.C.W., Yuan, H., 2004. Earnings management and capital resource allocation: evidence from China’s accounting-based regulation
of rights issues. Account. Rev. 79 (3), 645–666.Claessens, S., Feijen, E., Laeven, L., 2008. Political connections and preferential access to finance: the role of campaign contributions. J.
Financ. Econ. 88, 554–580.Claessens, S., Djankov, S., Fan, J.P.H., Lang, L., 2002. Disentangling the incentive and entrenchment effects of large shareholdings. J.
Finan. 57 (6), 2741–2771.De Soto, H., 1990. The Other Path: The Invisible Revolution in the Third World. Perennial Library.Demirguc-Kunt, A., Maksimovic, V., 1998. Law, finance, and firm growth. J. Finan. 53, 2107–2137.Dinc, I.S., 2005. Politicians and banks: political influences on government-owned banks in emerging markets. J. Finan. Econ. 77 (2), 453–
479.Ding, S., Guariglia, A., Knight, J., 2010. Does China Overinvest? Evidence From a Panel of Chinese Firms. Working paper.Faccio, M., 2006. Politically connected firms. Am. Econ. Rev. 96 (1), 369–386.Fan, J.P.H., Wong, T.J., Zhang, T., 2007. Politically connected CEOs, corporate governance, and post-IPO performance of China’s newly
partially privatized firms. J. Finan. Econ. 84, 330–357.Fisman, R., 2001. Estimating the value of political connections. Am. Econ. Rev. 91, 1095–1102.Foos, D., Norden, L., Weber, M., 2010. Loan growth and riskiness of banks. J. Bank. Finan. 34 (12), 2929–2940.Guariglia, A., Liu, X., Song, L., 2011. Internal finance and growth: microeconometric evidence on Chinese firms. J. Dev. Econ. 96 (1), 79–
94.Hadlock, C.J., Lee, D.S., Parrino, R., 2002. CEO careers in regulated environments: evidence from electric and gas utilities. J. Law Econ.
45, 535–563.Helland, E., Sykuta, S., 2004. Regulation and the evolution of corporate boards: monitoring, advising, or window dressing. J. Law Econ.
74, 167–192.Huang, Y., 2002. Managing Chinese bureaucrats: an institutional economics perspective. Polit. Stud. 50, 61–79.Kao, J.L., Wu, D., Yang, Z., 2009. Regulations, earnings management, and post-IPO performance: the Chinese evidence. J. Bank. Finan.
33, 63–76.Khwaja, A.I., Mian, A., 2005. Do lenders favor politically connected firms: rent provision in an emerging financial market. Quart. J. Econ.
120 (4), 1371–1411.Kikeri, S., Nellis, J., Shirley, M., 1992. Privatization: The Lessons of Experience. World Bank, Washington, D.C..King, R., Levine, R., 1993. Finance and growth: Schumpeter might be right. Quart. J. Econ. 108, 717–738.Kornai, J., 1979. Resource-constrained versus demand-constrained systems. Econometrica 47 (4), 801–820.KPMG, 2011. China’s 12th Five-Year Plan: Overview.La Porta, R., Lopez-De-Silanes, F., Shleifer, A., Vishny, R., 1998. Law and finance. J. Polit. Econ. 106 (6), 1113–1155.La Porta, R., Lopez-De-Silanes, F., Shleifer, A., Vishny, R., 1997. Legal determinants of external finance. J. Finan. 52, 1131–1150.La Porta, R., Lopez-De-Silanes, F., Shleifer, A., Vishny, R., 2002a. Investor protection and corporate valuation. J. Finan. 57 (3), 1147–
1170.La Porta, R., Lopez-de-Silanes, F., Shleifer, A., 2002b. State ownership of banks. J. Finan. 57 (1), 256–301.Levine, R., Zervos, S., 1998. Stock market, banks, and economic growth. Am. Econ. Rev. 88, 537–558.Levine, R., 1999. Law, finance, and economic growth. J. Finan. Intermed. 8, 36–67.Lyon, J.D., Barber, B.M., Tsai, C.L., 1999. Improved tests of long-run abnormal returns. J. Finan. 54, 165–201.McChesney, F., 1987. Rent extraction and rent creation in the economic theory of regulation. J. Legal Stud. 16 (1), 101–118.McKinnon, R., 1973. Money and Capital in Economic Development. Brookings Institution Press, Washington, DC.Megginson, W.L., Nash, R.C., Randenborgh, M., 1994. The financial and operating performance of newly privatized firms: an
international empirical analysis. J. Finan. 49, 403–452.Morck, R., Yavuz, M.D., Yeung, B., 2011. Banking system control, capital allocation, and economy performance. J. Finan. Econ. 100 (2),
264–283.Murphy, K.M., Shleifer, A., Vishny, R., 1989. Industrialization and the big push. J. Polit. Econ. 97 (5), 1003–1026.Olson, M., 1965. The Logic of Collective Action: Public Goods and the Theory of Groups. Harvard University Press.Peltzman, S., 1976. Toward a more general theory of regulation. J. Law Econ. 19 (Aug.), 807–820.
224 D. Chen et al. / China Journal of Accounting Research 10 (2017) 189–230

Perotti, E., Vorage, M., 2008. Political Allocation of Finance. Working paper.Perotti, E., Vorage, M., 2009. Political Allocation of Bank Finance. Working paper.Rajan, R.G., Zingales, L., 1998. Financial dependence and growth. Am. Econ. Rev. 88 (3), 559–586.Richardson, S., 2006. Over-investment of free cash flow. Rev. Acc. Stud. 11, 159–189.Sapienza, P., 2004. The Effects of government ownership on bank lending. J. Finan. Econ. 72, 357–384.Shleifer, A., Vishny, R., 1994. Politicians and firms. Quart. J. Econ. 109 (4), 995–1025.Stern, A., 2011. China’s superior economic model. Wall Street J. 1.Stigler, G.J., 1971. The theory of economic regulation. Bell J. Econ.Stiglitz, J.E., Yusuf, S. (Eds.), 2001. Rethinking the East Asian miracle. A Copublication of the World Bank and Oxford University Press.Sun, Q., Tong, W.H.S., 2003. China share issue privatization: the extent of its success. J. Finan. Econ. 70, 183–222.Trindade, V., 2005. The big push, industrialization and international trade: the role of exports. J. Dev. Econ. 78, 22–48.Williamson, O.E., 2000. The new institutional economics: taking stock, looking ahead. J. Econ. Lit. 38 (3), 595–613.World Bank, 1993. East Asian Miracle.
References in Chinese
Chinese Communist Party Central Committee, 2010. Recommendations to the Twelfth Five-Year Plan.China Securities Regulatory Commission, 2011. Monthly Report of Securities Market, August, 2011.Deng, X., 1993. Selected Works of Deng Xiaoping, vol. 3. People’s Publishing House.Fairbank, J.K., 1994. Cambridge university history of the Republic of China. Translated by Pingquan, Y. et al. China Social Science Press.Jiang, Y., 2006. How was the Eleventh Five-Year Plan Formulated? People’s Net <http://www.china.com.cn/>.Lin, Y., Cai, F., Li, Z., 1994. The Miracle of China: Development Strategy and Economic Reform. Shanghai Sanlian Publishing House.Lin, Y., 2012. The Quest for Prosperity: How Developing Economies can Take Off. Princeton University Press.People’s Daily, 1953. Fight for the Great Aim of Socialist Industrialization: Celebration of Forth Year Birthday of People’s Republic of
China. Editorial of the People’s Daily, 1 October.Sachs, J., 2011. America Needs a Long-Term Economic Strategy: Interviewing. Jeffrey Sachs.Wu, X., 2013. Gains and Losses of Economic Reforms. Zhejiang University Press.
Further reading
Acemoglu, D., Johnson, S., 2005. Unbundling institutions: law vs. politics. J. Polit. Econ. 113 (5), 949–995.Acemoglu, D., Johnson, S., Robinson, J., 2001. The colonial origins of comparative development: an empirical investigation. Am. Econ.
Rev. 91, 1369–1401.Bai, C., Lu, J., Tao, Z., 2006. Themultitask theory of state enterprise reform: empirical evidence fromChina.Am.Econ.Rev. 96 (2), 353–357.Barzel, Y., 1989. Economic Analysis of Property Rights. Cambridge University Press.Blanchard, O., Shleifer, A. 2001. Federalism With and Without Political Centralization: China vs. Russia. IMF Staff Working Papers,
Special Issue, 2001, International Monetary Fund.Caijing (Chinese language financial magazine), 2011. 6 November.Chen, Y., 1952. Directions and goals for finance and economics for 1952. People’s Daily, Editorial, 17 November 1952. Important
government documents since the founding of the People’s Republic of China, vol. 3.China Securities Regulatory Commission, 2001. Index for Listed Firms’ Industry Classifications, 4 April.China Securities Regulatory Commission, 2007. Guideline # 6 of Listed Firms’ Conduct of Business: Changing Industry Classifications, 20
December.China State Council, 1994. Automobile Industry Policy.China State Council, 2004. Automobile Industry Development Policy.Derashid, C., Zhang, H., 2003. Effective tax rates and the ‘‘industrial policy” hypothesis: evidence from Malaysia. J. Int. Account., Audit.
Tax. 12, 45–62.Dollar, D., Wei, J.-S. 2007. Das (wasted) Capital: Firm Ownership and Investment Efficiency in China. NBERWorking Paper No. 13103,
National Bureau of Economic Research, Inc.Fan, J.P.H., Wong, T.J., Zhang, T., n et al., forthcoming. Founder succession and accounting properties. Contemp. Account. Res.,
forthcomingGerschenkron, A., 1962. Economic Backwardness in Historical Perspective: A Book of Essays. Frederick A. Praeger Publishers.Guan, H., Lin, Z., 2011. Five year plan and course of economic development of China. China Econ.Jin, H., Qian, Y., Weingast, B.R., 2005. Regional decentralization and fiscal incentives: federalism, Chinese style. J. Pub. Econ. 89, 1719–
1742.La Porta, R., Lopez-de-Silanes, F., Pop-Eleches, C., Shleifer, A., 2004. Judicial checks and balances. J. Polit. Econ. 112, 445–470.Levine, R., 2002. Bank-based or market-based financial systems: which is better? J. Finan. Intermed. 11, 1–30.Lewis, W.A., 1949. The Principles of Economic Planning. George Allen and Unwin Ltd, London.Li, H., Zhou, L., 2005. Political turnover and economic performance: the incentive role of personnel control in China. J. Public Econ. 89
(9–10), 1743–1762.
D. Chen et al. / China Journal of Accounting Research 10 (2017) 189–230 225

Lin, J.Y., Yao, Y., 2001. Chinese rural industrialization in the context of the East Asian miracle. Chapter 4. In: Stiglitz, J.E., Yusuf, S.(Eds.), Rethinking the East Asian Miracle. A Co-Publication of the World Bank and Oxford University Press.
Lin, Y., Srinivasan, A., Yamada, T., 2011. The Real Effect of Lending by State Owned Banks: Evidence from Japan During the Crisis ofthe 90s. Working paper.
Liu, G. Research Report on China’s Ten Five-Year Plan. People’s Publishing House.Martin, M.F., 2010. Understanding China’s political system. In: Congressional Research Service Report for Congress.Monthly Report on China’s Economy, 2010 <http://www.china-economic-data.com/>.Montinola, G., Qian, Y., Weingast, B.R., 1995. Federalism, Chinese style: the political basis for economic success in China. World Polit.
48 (1), 50–81.Morris, C.T., Adelman, I., 1988. Comparative Patterns of Economic Development, 1850–1914. Hopkins Press.National Bureau of Statistics of China, 1983. Classification and Code Standard of National Economy Industry - National Standard (Guo
Biao) GB/T4754.National Bureau of Statistics of China, 2003. National Industries Classification GB/T4754-2002.National Bureau of Statistics of China, 2011. Bulletin of the Verification of Gross Domestic Product (GDP) in Year 2010 <http://www.
stats.gov.cn/>.National Bureau of Statistics of China. China Statistical Yearbook. Various years of volumes.National People’s Congress, 1986. The Eighth Five Year Plan.National People’s Congress, 1991. The Outline of Eighth Five Year Plan and the National Economic and Social Development Plan of
People’s Republic of China for Ten Years.National People’s Congress, 1996. Ninth Five Year Plan and Outline of Future Perspective in 2010 of the National Economic and Social
Development of People’s Republic of China.National People’s Congress, 2001. The Outline of Tenth Five Year Plan of the National Economic and Social Development of People’s
Republic of China.National People’s Congress, 2006. The Outline of Eleventh Five Year Plan of the National Economic and Social Development of People’s
Republic of China.Piotroski, J., Wong, T.J., 2010. Institutions and Information Environment of Chinese Listed Firms, Capitalizing China. NBER.Qian, Y., Weingast, B., 1997. Federalism as a commitment to preserving market incentives. J. Econ. Perspect. 11, 83–92.Qian, Y., Roland, G., 1998. Federalism and the soft budget constraint. Am. Econ. Rev. 88, 1143–1162.Rajan,R.G., Zingales, L., 2003. The great reversals: the politics of financial development in the twentieth century. J. Financ. Econ. 69 (1), 5–50.Rajan, R.G., Zingales, L., 2004. Saving Capitalism from the Capitalists: Unleashing the Power of Financial Markets to Create Wealth and
Spread Opportunity. Princeton University Press.Ritter, J., 1984. The ‘‘hot issue” market of 1980. J. Bus. 57 (2), 215–240.Saich, T., 2004. Governance and Politics of China. In: Comparative Government and Politics, second ed.Stalin, J.V., 1954. Complete Works of Stalin. People’s Publishing Press, China.State Administration of Foreign Exchange of China, 2011. Foreign Currency Exchange in China <http://www.safe.gov.cn/>.Vining, A., Boardman, A., 1992. Ownership vs. competition: efficiency in public enterprise. Public Choice 73 (March), 205–239.Zhang, W., Cheung, N.S., 2008. China’s Economic System.Zhou, L., 2004. Chinese officials’ motivation and cooperation: a discussion of China’s regional protectionism and overlapping
development. Econ. Res. J. 6.Zhu, R., 2011. Zhu Rongji’s Talks. People’s Publishing House.
226 D. Chen et al. / China Journal of Accounting Research 10 (2017) 189–230

The significance of research—Comments on theFive-Year Plan paper
Feng LiuXiamen University, China
All accounting and financial behaviors are rooted in specific institutional environments. These behaviorspertain to specific firms, and firms operate in different economic systems. Therefore, institutions such as thepolitical, legal, economic, cultural, and religious institutions that shape an economic entity will surely bereflected in firms’ accounting and financial behaviors. Accounting and finance research that does not considerinstitutions lacks relevancy and vitality.
Modigliani and Miller (1958) are the starting point of modern corporate finance research. However, a seriesof assumptions in Modigliani and Miller (1958) is designed to limit or weaken the role played by the institu-tional environment on investors’ behaviors. Subsequent research relaxes Modigliani and Miller’s (1958)assumptions and introduces social institutions, such as taxes and bankruptcy costs. During the last three dec-ades, accounting and finance studies published in influential academic journals have been based on capitalmarkets and institutions in the United States. The discussion on institutions is not salient, as all authors, read-ers, editors, reviewers, and even critics are from or assumed to be from the United States, and they exchangestories under the same social scenarios.
Accounting and finance research based on Jensen and Mecklin’s (1976) agency theory during the last threedecades was undoubtedly mainstream. Such research has made the Journal of Accounting and Economics andthe Journal of Financial Economics successful. Agency theory leads researchers’ attention to firms’ internalorganization and market participants’ characteristics. It has also made some assumptions on external environ-ments related to the free market, protection intellectual properties, and a mature legal system. Research oncapital structure, earnings management, and tax shields requires certain assumptions to be made of institu-tions, such as profit-seeking capital and discretionary decision making based on firm and shareholder value.Solving the so-called capital structure puzzle calls for attention to institutions.
At the end of the last century, China introduced a framework originating fromUSmarkets and institutions toconduct its accounting and finance research. The Shanghai and Shenzhen Exchanges are constantly supplyingdata for this kind of research. We have been making steady improvement in our research. Earlier replicationshave beenmodified by adding institutions (such as shareholder identities and state ownership) and using differentChinese settings or data. However, most of the research is literature-driven and not issue-driven, with the goal ofanswering questions, using Chinese settings and data that Western scholars are interested in but cannot answer.This kind of research already respects institutions and their effects on accounting and finance behaviors. How-ever, it is not guided by institutions, nor is it issue-driven. Therefore, although we sometimes see statistical sig-nificance, we are often unable to explain reality and sometimes even see contradictory explanations.Unguided byreal issues, accounting and finance research is often a tempest in a teacup and does not deal with important ques-tions. Researchers should always aim to answer real theoretical and practical questions.
Real institution-guided and issue-driven research should stem from China’s institutional environment or itsbusiness reality and discuss persistent and important questions in this market or economic system using cur-rent theories. If these theories cannot provide an explanation, they can become researchers’ treasure troves.This is also the logic of Justin Lin’s New Structural Economics.
D. Chen et al. / China Journal of Accounting Research 10 (2017) 189–230 227
Contents lists available at ScienceDirect
China Journal of Accounting Research
journal homepage: www.elsevier .com/locate /c jar
China Journal of Accounting Research 10 (2017) 189–230
HO ST E D BY

The current accounting and finance theories were mainly formed during the 1990s. Although the US econ-omy is still a free market economy, it has been experiencing big, if not fundamental, changes during the last 20years due to the Internet, securitization, and big data. Businesses like Google, Uber, and Airbnb are occupyingimportant places in the economy. This has reduced the ability of our current accounting and finance theoriesto explain these firms. Furthermore, our market is characterized by the coexistence of centralization, intenseregulation, central-local government relationships, Confucian culture, the coexistence of SOEs and non-SOEs,and so on. Research exploring these common phenomena under such institutions and real business scenarioscan thus be considered as institution-guided and issue-driven.
In short, accounting and financial behaviors pertain to specific firms, and firms operate in a given economicenvironment. Factors shaping and constraining economic environments are broadly defined as institutions,which include politics, law, economy, and culture. Professor TJ Wong once called for the paradigm of a‘‘top-down” research approach, which requires accounting and finance research to start from its fundamentalsource. This begs the question of where the source is.
Now let’s turn to the Five-Year Plan paper.Although prior studies address microeconomic accounting and finance research in light of China’s institu-
tional characteristics, this paper starts from a point that appears to be somewhat disconnected: China’s Five-Year Plans. By dissecting Five-Year Plans, the authors explore a more general idea: how macroeconomic poli-cies influence microeconomic firm behaviors or the macroeconomic policy transmission mechanism. The focusof the paper is still firms’ finance behaviors. The authors find that SOEs supported by the Five-Year Planshave access to more and cheaper capital and have more overinvestments and nonperforming loans, and thatnon-SOEs are crowded out.
The China Journal of Accounting Research (CJAR) seeks papers of this style. These papers start from Chi-na’s institutional background and contribute distinct findings with a solid theoretical foundation to theaccounting and finance literature. We expect that the authors and CJAR can work together to mainstreamthis type of research.
However, as a critical reader, I still have several issues to clarify.First, what is the positioning of the research? Is this paper a Five-Year Plan study or a study on how Five-
Year Plans affect firms’ financial behaviors? If it is a Five-Year Plan study, the authors need to focus on whichof the 13 Five-Year Plans is most effective, what kinds of Five-Year Plans are effective, and other such ques-tions. To discuss the effectiveness of Five-Year Plans, they would need to use Justin Lin’s comparative advan-tages and the roles of the government as theoretical foundations. The authors describe their results in such away as to prevent readers from negative interpretations. They imply that Five-Year Plans cannot be consid-ered simply as government interference in the market and that cheap finance obtained by state-owned firmscannot be considered as a negative effect of government action. If we leave the macroeconomy, then we cannotunderstand the microeconomy.
Of course, the CJAR does not reject macro research, although it is not a major theme of the journal. Tomake the paper more influential, we suggest that its position be revised: the influence of macro policies andinstitutions on firms’ financial and accounting behaviors – evidence from Five-Year Plans. Such a positionchange would require some revision of the article. An important question should be discussed: why areFive-Year Plans an important factor? Of course, one can use Justin Lin’s theories here, too. We suggest, ifpossible, that the authors build a framework of the determinants of Chinese firms’ accounting and financebehaviors; this would make Five-Year Plans a key factor.
Second, if the focus is on how macro policies influence firms’ behaviors, how does this link to La Porta,Lopez-deSilanes, Shleifer, and Vishny (LLSV) or other related studies? Answering this question wouldenhance readability. Alternatively, is it possible to infer a more general conclusion based on Five-Year Plansand firms’ financial performance, like LLSV’s conclusion that legal protection of investors’ rights determinesthe prosperity of capital markets? Currently, the paper provides research findings but still lacks – or we haveoverlooked – such generalizability. Prior works, such as implicit contracts and perk consumption, have suchqualities. The authors appear to combine macro and micro rationality and try to convey the idea that underdifferent institutions, macro and micro rationality have different criteria. For example, state-owned firms sup-ported by industrial policies have a low cost of capital. This would be considered discriminatory in the US freemarket. However, if one considers the rationale behind macro policies, then the criteria for micro rationality
228 D. Chen et al. / China Journal of Accounting Research 10 (2017) 189–230

can change. Alternatively, this could be a creative idea the authors are trying to convey. However, it appearsthat the authors have not expressed it clearly and readers can only sense it vaguely.
Third, what are the links from Five-Year Plans to corporate finance, accounting behaviors, and accounting-based performances? We suggest the authors explore a few cases where firms grow quickly because of supportfrom Five-Year Plans.
Two key indicators in the paper, IPO and investment amount, are a result of government actions. When theChina Securities Regulatory Commission screens IPO applications, it pays attention to whether they are con-sistent with industrial policies. If the applications are inconsistent, they are declined. Therefore, we canobserve an almost mechanical relationship between financial resource allocation and Five-Year Plans. Simi-larly, in China, large capital investments are not solely determined by firms, as firms need to obtain permis-sions from the National Development and Reform Commission (NDRC) and Environmental ProtectionAgency. For example, Jianlin Wang has to obtain approvals to invest in amusement parks to compete withDisneyland. The Shanghai Disneyland needs to do that, too. Hence, it is reasonable to conjecture that indus-tries supported by Five-Year Plans have priority in obtaining investment permissions.
These two measures would make sense when used to distinguish different mechanisms. Are there othermechanisms and other measures?
Fourth, why are non-state-owned firms crowded out in Five-Year Plans? Many studies show that the driv-ing force of China’s economic growth is the non-state sector. If Five-Year Plans crowd out non-state-ownedfirms, does this mean that Five-Year Plans are detrimental to China’s economic development? Additionally,nonperforming loans are related to Five-Year Plans and state-owned firms in policy-supported industries per-form even worse. This finding also needs further explanation.
A more general research question addresses the relationship between Five-Year Plans and formal and infor-mal financing. What is the underlying logic here? Does it account for why Five-Year Plans can crowd out non-state-owned firms?
Informal financing must exist because formal financing channels are blocked or because of a high level ofregulations. A study by Lu and Yao (2004) suggests that non-state-owned firms can obtain more capital andachieve better performance when financing channels are less regulated, consistent with findings in this paper.That said, why do Five-Year Plans crowd out non-state-owned firms? Is it because of official disapproval orcost disadvantages? Is the crowding out of non-state-owned firms inconsistent with privatization? Does thepaper consider the effect of these institutional factors?
Fifth, are human behaviors discussed thoroughly enough? Under the framework of Justin Lin’s New Insti-tutional Economics, the government is rational. To obtain a good reputation, government officials are willingto implement ‘‘nationwide welfare maximization” policies. The authors’ judgment of the competitive advan-tages of a nation or a region is correct in general.
From our perspective, the authors could focus more on human behaviors. Are policymakers purely rationalwithout any self-interest or concerns? Perhaps the authors could more thoroughly consider the topic from thecultural perspective.
Irrational behaviors exist naturally. How does this idea affect Five-Year Plans? For example, do NDRCmembers’ past experiences and geographic origins affect the formation and implementation of Five-YearPlans, and if so, to what degree? In implementing Five-Year Plans, is there any agency cost, and what wouldit be? How would it affect the mechanisms (e.g., nonlinear, multidirectional forms)? The authors subsequentlyexamine the associations between industrial policies and insider trading, analyst behaviors, information envi-ronment, and so on. As this paper is the first study of a series, perhaps the authors should consider thinkingoutside the box.
I hope that papers published in the CJAR can explore the secrets of ‘‘the China miracle” in an ideology-neutral sense, without the priori assumption that government is the engine of the miracle. Maybe it is reallythe masses that create the miracle. Is it possible that we adopt an attitude of truth-seeking and objectivelyexamine the transmission from macro policies to firm behaviors or discuss the formation of the developmentof China’s accounting and financial system? Without such an attitude, we are not taking research seriously.
D. Chen et al. / China Journal of Accounting Research 10 (2017) 189–230 229

Acknowledgements
I am grateful for the helpful comments raised by Prof. Zhen Zheng from Xiamen University.
References
Lu, F., Yao, Y. 2004. Legality, Financial Development and Economic Growth under Financial Repression.Social Science in China 2004(1), 42–55.
Lin, J. 2014. New Structural Economics. Peking University Pressing.Modigliani, F., Miller, M. 1958. The Cost of Capital, Corporation Finance and the Theory of Investment.
American Econ. Rev. 48(3), 261–297.Jensen, M., Meckling, W. 1976. Theory of the Firm: Managerial Behavior, Agency Costs and Ownership
Structure, J. Financ. Econ. 3(4), 305–360.La Port, R., Lopez-De-Silanes, F., Shleifer, A., Vishny, R. 1998. Law and Finance, J. Polit. Econ, 106(6),
1113–1155.Wong, T. 2016. Institutions, Governance and Accountability: A Review of Corporate Governance
Research on Listed Firms in China, Foundations and Trends in Accounting, 9, 259–326.
230 D. Chen et al. / China Journal of Accounting Research 10 (2017) 189–230

How much control causes tunneling? Evidence fromChina
Wenting Chen a, Shanmin Li b, Crystal Xiaobei Chen c,⇑
aSchool of Accounting, Guangdong University of Foreign Studies, ChinabSun Yat-sen Business School, Sun Yat-sen University, ChinacHIT Shenzhen Graduate School, China
A R T I C L E I N F O
Article history:
Received 7 June 2016Accepted 28 October 2016Available online 9 December 2016
JEL classification:
G34G32G38
Keywords:
TunnelingShareholding ratiosCorporate control transfersRelated party transactions
A B S T R A C T
We study the dynamic causal effects of the shareholding ratio of controllingshareholder on tunneling behavior in China. We use control-right-transfersas the event to conduct the study. We obtain 394 control-right-transfer samplesin China corporate control market from 2001 to 2008. We use related partytransactions amount to capture control shareholders’ tunneling activities,and make the following findings. Firstly, tunneling behavior is significantlyaffected by the shareholding ratio of controlling shareholder. Secondly, therelationship between tunneling and shareholding ratio of controlling share-holder takes an N shape (incline-decline-incline). There are at least two turningpoints in the relationship. Furthermore, firms with shareholding ratios of con-trolling shareholder that range from 34.46% to 39.01% (8.99–18.04%) exhibitthe most (least) severe tunneling. Firm size is significantly positively relatedto tunneling activities. In addition, the shareholding ratios of the board andthe tunneling activities are significantly negatively correlated. These findingsimply the shareholding ratio decision of controlling shareholder in controltransfers lead to agency problems manifested in China in a particular formof tunneling.� 2016 Sun Yat-sen University. Production and hosting by Elsevier B.V. Thisis an open access article under the CC BY-NC-ND license (http://creativecom-
mons.org/licenses/by-nc-nd/4.0/).
http://dx.doi.org/10.1016/j.cjar.2016.10.001
1755-3091/� 2016 Sun Yat-sen University. Production and hosting by Elsevier B.V.
This is an open access article under the CC BY-NC-ND license (http://creativecommons.org/licenses/by-nc-nd/4.0/).
⇑ Corresponding author at: Xili District, Shenzhen 518020, China. Fax: +86 755 26033494.E-mail addresses: [email protected] (W. Chen), [email protected] (S. Li), [email protected] (C.X. Chen).
China Journal of Accounting Research 10 (2017) 231–245
HO ST E D BY Contents lists available at ScienceDirect
China Journal of Accounting Research
journal homepage: www.elsevier .com/locate /c jar

1. Introduction
Ever since the tunneling behavior of controlling shareholders was first identified, it has been studied exten-sively. Companies with concentrated ownership structures1 typically have one controlling shareholder.2 Con-trolling shareholders can access benefits by either creating or transferring a company’s wealth. When creatingwealth, controlling shareholders derive benefits from the general value enhancement that results fromimproved management, which is known as the alignment (incentive) effect. Conversely, when engaging inwealth transfers, controlling shareholders obtain private benefits by expropriating minority shareholder ben-efits, which is also known as the tunneling (entrenchment) effect (Shleifer and Vishny, 1986; Johnson et al.,2000). It is generally believed that ownership structure affects controlling shareholders’ tunneling and align-ment decisions and that in turn, tunneling behavior affects firm value.
Most of the research on this topic examines the relationship between ownership structure and firm value,with the assumption that ownership structure (particularly with respect to the difference between control rightsand cash-flow rights) affects the controlling shareholders’ tunneling behavior, which affects firm value. Thegeneral findings in this direction support the inverted U-shaped (or concave) relationship between ownershipstructure and firm value (Morck et al., 1988; Stulz, 1988; McConnell and Servaes, 1990). In addition, someresearch finds that a disparity between control rights and cash-flow rights triggers tunneling activity, whichdecreases firm value (Lins, 2003; Claessens et al., 2002).
Subsequent studies have investigated the relationship between tunneling and firm value and have arrived atresults that are consistent with the conclusions discussed above. Tunneling activity and firm value are nega-tively correlated, and more severe tunneling activity leads to lower firm value (Jiang et al., 2010).
Thus far, no studies have examined the direct relationship between the shareholding ratio of controllingshareholder and tunneling. Although previous studies assume that certain ownership structures will triggertunneling and eventually affect firm value, none of the previous research directly examines how the sharehold-ing ratio of controlling shareholder affects tunneling. The theoretical models of Johnson et al. (2000) andLLSV (2002) imply that controlling shareholders’ equity holdings affect their tunneling behavior, but thereis no empirical evidence to support this theoretical conjecture.
In this paper, we aim to offer a comprehensive study of the causal effects of the shareholding ratio of con-trolling shareholder on tunneling behavior in China; our primary purpose was to study the direct relationshipbetween the shareholding ratio of controlling shareholder and tunneling activity. We use control-rights-transfer events to study the research question in the China corporate control market from 2001 to 2008.Theoretically, we modify and extend the theoretical models of Johnson et al. (2000) and LLSV (2002). Weexplicitly study the direct relationship between the shareholding ratio of controlling shareholder andtunneling. We then offer empirical findings and analysis to verify our theoretical conjectures.
Our primary findings are as follows: (1) tunneling activities are likely to be a consequence of the controlledshareholding ratio, whereas the shareholding ratio of controlling shareholder is not significantly impacted bytunneling activities; (2) in addition to being a monotonic or quadratic function relation, the relationshipbetween tunneling activities and the shareholding ratio of controlling shareholder is a cubic function relation,an ‘‘incline-decline-incline” trend (an N-shaped) relationship; and (3) firms with shareholding ratios of con-trolling shareholders in the 34.46–39.01% range have the most severe tunneling activities, whereas firms inthe 8.99–18.04% range have the least tunneling activities.
We make five major contributions to the literature (Johnson et al., 2000; Bae et al., 2002; Bertrand et al.,2002; Baek et al., 2006; Urzua I, 2009; Atanasov et al., 2010; Jiang et al., 2010; Siegel and Choudhury, 2012;Buchuk et al., 2014, and Piotroski and Zhang, 2014). First, we provide direct evidence of the relationshipbetween the shareholding ratio of controlling shareholder and tunneling behavior. Second, we construct atheoretical model to depict the cubic function relation between the two variables. Third, we design a set of
1 Over the past decade, studies have shown that corporate ownership structures are concentrated rather than dispersed in most countries,particularly those with weak investor protections (La Porta et al, 1998, 1999).2 The controlling shareholder is either the shareholder that controls the company and owns 50% or more equity or the shareholder that
owns less than 50% equity but dominates the company’s daily operations and decision-making and uses the company’s property by virtueof his superior position.
232 W. Chen et al. / China Journal of Accounting Research 10 (2017) 231–245

multiple regression models both to capture the relationship between the two variables and to test our theoret-ical conjecture. Fourth, we complement the current literature by conducting the study using control-right-transfer samples. Finally, we find that there are two turning points of the shareholding ratio of controllingshareholder that trigger more severe or less severe tunneling activities.
The remainder of the paper is structured as follows. Section 2 reviews the current literature, and Section 3introduces the institutional background and data. Section 4 presents the theoretical model and the hypotheses.In section 5, we design a set of regression models to test the theoretical conjecture and the hypotheses. Section 6contains the robustness test, and Section 7 concludes the paper.
2. Literature Review
Morck et al. (1988) first define the ‘‘entrenchment effect” as a decrease in the value of corporate assets whenmanaged by a manager with high levels of control rights and low levels of cash-flow rights. La Porta et al.(2000) find that Czech markets have been plagued by massive expropriation from minority shareholdersand introduce the concept of ‘‘tunneling” to describe the expropriation of assets from both firms and mutualfunds by controlling shareholders. More specifically, La Porta et al. (2002) define ‘‘tunneling” as the activity ofcontrolling shareholders who divert firm profits to themselves before distributing the remainder as dividends.Such diversion or tunneling can take the form of salaries, transfer pricing, subsidized personal loans, non-arm’s-length asset transactions and even outright theft. Researchers (La Porta et al., 2000, 2002; Johnsonet al., 2000) generally refer to tunneling activity as a situation in which controlling shareholders transfer acompany’s property or profit counter to the interests of minority shareholders by virtue of their superior con-trol positions. We adopt this latter definition.
The literature focuses on the relationship between the structure of ownership control and firm value (LaPorta et al., 2000, 2002; Claessens et al., 2002; Lemmon and Lins, 2003; Offenberg, 2009; Jiang et al.,2010). Claessens et al. (2002) find that firm value increases when the controlling shareholder has commensu-rate cash flow ownership, which is, of course, consistent with a positive incentive effect. However, firm valuedecreases when the control rights of the controlling shareholder exceed its cash-flow ownership, which is con-sistent with the tunneling effect. Faccio and Lang (2002) and Lins (2003) report similar findings. Chan et al.(2003) suggest a non-monotonic function relation between the cash-flow ownership of the controlling share-holder and firm value. Morck et al. (1988) present an inverted U-shaped (Claessens et al., 2002) relationshipbetween managerial control rights and firm value. Stulz (1988) depicts a concave relationship between man-agerial control rights and firm value, and McConnell and Servaes (1990) provide empirical support for sucha concave relationship. Shleifer and Vishny (1997) suggest that when managerial control rights exceed a cer-tain level, the controlling shareholders prefer to gain private benefits through tunneling; their findings alsosupport the inverted U-shaped relationship between a controlling shareholder’s control right and firm value.The general findings on this topic are consistent with the inverted U-shaped or concave relationship betweenthe managerial control right and firm value, which implies that a managerial control right is positively relatedto firm value before reaching a certain level, at which it becomes negative and tunneling begins. As discussedabove, most current studies focus on the effects of a managerial control rights on firm value instead of theeffects of the shareholding ratio of controlling shareholder on tunneling behavior.
Indeed, few studies directly examine the relationship between the controlled shareholding ratio and tunnel-ing. It is generally believed that the relationship between tunneling and the shareholding ratio of controllingshareholder is not stable and may be affected either by time or by company operations (Xi and Yu, 2006; Baiand Wu, 2008). Johnson et al. (2000) deduce a theoretical model with implications for a concave relationshipbetween the shareholding ratio of controlling shareholder and tunneling behavior; however, there is no empir-ical evidence to support this theoretical conjecture. In this paper, we consider transfers of control rightsinvolving public Chinese companies as events and then study how a highly concentrated ownership structureand tunneling behavior influence one another.
We choose to use transfers of control rights through equity transfer agreements as our key events becausewhen control rights are transferred, controlling shareholders will carefully reselect the shareholding ratio tomaximize their private benefit (La Porta et al., 2002). The current controlling shareholder transfers controlrights to the bidder that offers the largest ‘‘bribe” (including possibly illegal actions) instead of to the bidder
W. Chen et al. / China Journal of Accounting Research 10 (2017) 231–245 233

with the greatest ability to maximize performance (Bayne, 1963; Jennings, 1956). Thus, the controlling share-holder’s behavior would lead to unsuccessful acquisitions because of the controlling shareholder’s greed inattempting to maximize private benefits when transferring control rights (Kahan, 1993; Bebchuk, 1994).Bae et al. (2002) show that controlling shareholder blocs’ acquisition prices are established to enhance thoseblocs’ value, to the detriment of minority shareholders. Prior studies also show that controlling shareholders’incentives to obtain the private benefits of control are closely related to the proportion of ownership held dur-ing the period of a control rights transfer and therefore, they have a significant influence on firm value afterthat transfer (La Porta et al., 2002; Bayne, 1963; Jennings, 1956; Kahan, 1993; Bebchuk, 1994). Thus, thetransfer of control rights is a major event through which controlling shareholders can pursue tunneling.
3. Institutional background and data
3.1. Institutional background
As an emerging financial market, China has highly concentrated firm ownership and lacks a comprehensivelegal system to protect the interests of minority investors (Aharony et al., 2000; Allen et al., 2005; Fan et al.,2007; Jiang et al., 2010; Berkowitz et al., 2015). More specifically, regulators in China have a long tradition ofprotecting state interests and little experience with litigation driven by private plaintiffs (Allen et al., 2005;MacNeil, 2002). As a rapidly developing transitional economy, China is an excellent laboratory in which tostudy the direct relationships between the controlling shareholders’ tunneling behavior and firm value.
A special feature of China’s corporate control market consists of state-owned enterprises (SOEs). Green(2003) reports that the Chinese stock market was organized by the government as a vehicle for SOEs to raisecapital and improve their operating performance. To make this vehicle effective, the state aimed to retain suf-ficient equity interests to control public firms. Thus, the ownership of public Chinese companies is heavily con-centrated in the hands of the state. As shown in Table 1, from 2001 to 2008, the ownership structure of publiccompanies changed from 81% state-owned shares, 15% legal person shares and 4% private shares to 58% state-owned shares, 35% legal person shares and 7% private shares. The ratio of shares owned by the state isdecreasing. But the sum of shares owned by both the state and legal person still accounts for a significant share(more than 90%) of the ownership structure.
Table 2 shows the development of China’ s corporate control market from 2001 to 2008 using our sample.During our sample period, China’s corporate control market grew rapidly. From 2001 to 2008, the number oftransfers of corporate control increased from 30 to 134, with the highest number (134) in 2008. In addition, inJuly 2005, the Chinese government announced a policy to convert non-tradable shares3 into tradable shares.This ‘‘Share Segregation Reform” policy aimed to achieve a balance among the interests of non-tradableshareholders and tradable shareholders through a consultative mechanism and therefore to eliminate differ-ences in the share transfer system in the A-share market. Generally, non-tradable shareholders of listed com-panies had to pay a certain consideration (compensation) to holders of tradable shares (typically minorityshareholders) to secure the liquidity rights of their share blocs. As of October 30, 2006, the capitalizationof reformed companies comprised more than 94% of the total Shanghai and Shenzhen stock markets. The pol-icy had been completely implemented by the end of 2007. Thus, the market began to bloom in 2005 andreached its zenith in 2008.
Table 1Ownership structure of public companies in China from 2001 to 2008. Data source: China Stock Market Accounting Research (CSMAR).
2001 2002 2003 2004 2005 2006 2007 2008
State-owned shares 0.81 0.77 0.68 0.64 0.61 0.59 0.57 0.58Legal person shares 0.15 0.19 0.31 0.34 0.36 0.38 0.37 0.35Private shares 0.04 0.04 0.01 0.03 0.03 0.03 0.07 0.07
3 Non-tradable shares refer to block shares (state-owned shares and legal person shares) that could not be traded in the market before2005 (Jiang et al. (2010)).
234 W. Chen et al. / China Journal of Accounting Research 10 (2017) 231–245

In China, tunneling by controlling shareholders is commonly observed (Tang and Wei, 2002; Li et al., 2004;Wang and Zhang, 2004). Unlike most developed markets, China’s controlling-shareholder activity is muchmore consistent with the tunneling effect than with the alignment effect because of China’s immature marketfor corporate control and its imperfect legal system and because the ownership structures of public Chinesecompanies are heavily concentrated in the hands of the state (70% on average) (Green, 2003), as discussedabove. Thus, the influence of a highly concentrated ownership structure on tunneling behavior is an importanttopic to investigate both to improve the level of investor protection and to develop an appropriate regulatoryframework.
Our primary measure of tunneling is the related party transactions (RPT) amount. Previous studies suggestthat related party transactions are popular means of tunneling (Bae et al., 2002; Joh, 2003; Baek et al., 2006;Cheung et al., 2006, 2010; Jiang et al., 2010). Liu and Lu (2007) indicate that tunneling behavior in China pri-marily occurs in the form of loans from controlled companies to majority shareholders, in addition to othertypes of related-party transactions. Peng et al. (2011) also find that related-party transactions were used toeffect tunneling activities in China from 1998 to 2004.
As noted previously, over the past decade, tunneling has been commonly observed in China. Table 3 showspublic Chinese companies’ tunneling activities from 2001 to 2008.
Tunneling activities were widespread from 2001 to 2008; the highest Ln (RPT) value reached 19.78 in 2008.In 2007, the China Securities Regulatory Commission amended the ‘‘Administration of the Takeover of ListedCompanies Procedures” and revised the regulation of public company acquisition according to its newlyrevised ‘‘Securities Law” to improve the efficiency of the country’s capital markets.
In another study, Gao and Kling (2008) analyze the tunneling data for public Chinese firms from 1998 to2002 and find that improvements in corporate governance have prevented operational tunneling. However, Li(2010) studies the tunneling effect from 2002 to 2007 and finds that privately controlled public companiesengage in more tunneling despite having better corporate governance.
3.2. Data description and preliminary analysis
We select sample companies that have had control rights transferred through equity transfer agreementsfrom January 2001 to December 2008. We search for the name and ownership of each of the top ten share-holders disclosed in the CSMAR Database.4 Next, we collected the financial data and corporate governancedata obtained from the CSMAR Database, including ‘‘The Mergers and Acquisitions of Public Companies inChina Database,” ‘‘China’s Corporate Governance Structure Database” and ‘‘Shareholders of China’s PublicCompanies Research Database”. Stata 14 software is used as for processing the data.
Our data selection criteria are as follows:
(1) We select public companies that witnessed their controlling shareholder change during the sampleperiod.
Table 3The tunneling activity of public companies from 2001 to 2008. This table presents the tunneling activity of public companies of China from2001 to 2008. We use Ln(RPT) to measure tunneling severity. The higher the RPT, the more sever the tunneling. Data source: CSMAR.
2001 2002 2003 2004 2005 2006 2007 2008
Ln(RPT) 17.80 17.53 18.29 18.21 18.92 18.88 19.24 19.78
Table 2China’s corporate control market development from 2001 to 2008. Data source: CSMAR.
2001 2002 2003 2004 2005 2006 2007 2008
Control transfers 30 27 21 21 43 22 96 134
4 Website: http://www.gtadata.com/.
W. Chen et al. / China Journal of Accounting Research 10 (2017) 231–245 235

(2) For companies that were the subject of two or more control rights transfers in a three-year period, weselect only the last event as a sample event to exclude the stack effect.
(3) To avoid a situation in which the company’s actual controlling shareholder did not change, we eliminatecompanies in which control-rights transfers occurred between a parent company and either a subsidiarycompany or an affiliated (sister) company.
(4) We eliminate financial companies from our analysis.(5) We eliminate companies for whom the transactions have not been completed or were terminated.(6) We eliminate companies that had transactions that were free of charge.(7) We eliminate companies that have individual data missing and/or that have abnormal extremes.
We obtain 394 control-rights-transfer samples during the study period.Table 4 reports descriptive statistics for the sample companies in the sample period.Table 4 shows that public companies with control transfers had an average non-negative cumulative abnor-
mal return (‘‘CAR”) of 0.0088, which indicates that on average, the reaction of the market to control transferswas positive during the sample period. The mean RPT value, the average tunneling activity value is 19.0122,which indicates that our sample firms exhibited noticeable tunneling activity during the sample period. Theaverage shareholding ratio of controlling shareholder (HLD) is approximately 0.3541, and the average boardsize is greater than 9. The average return on assets (ROA) is 0.0452. The average debt ratio is 0.5224. Theaverage firm size is 21.2559. It is notable that most firms have substantial RPT on their balance sheets.
To examine the dynamic relationship between the shareholding ratio of controlling shareholder and tunnel-ing behavior, we divide the sample into 10 deciles based on the shareholding ratio of controlling shareholderduring the pre-event period (T � 1), and we compute Ln (RPT) at time T (the event year). The results arereported in Table 5.
Table 5 reports the RPT values of the 10 controlled shareholding deciles for the control transfer samples.Decile 6 has the highest RPT values, whereas decile 1 has the lowest RPT values, which indicate that firmswith shareholding ratio of controlling shareholders in the 34.46–39.01% range have the most severe tunnelingactivity, whereas firms in the 8.99–18.04% range have the least tunneling activity. Tunneling increases first andthen decreases as the shareholding ratio of controlling shareholder increases until the 9th decile, at which pointtunneling increases again, which clearly indicates that the relationship between the shareholding ratio of con-trolling shareholder and tunneling activity is not simply monotonic.
Prior research reports not only that there is an inverted U-shaped relationship between firm value and theshareholding ratio of the controlling shareholder (Claessens et al., 2002; Li et al., 2004) but also that thechange in firm value is caused by tunneling behavior; however, there is no clear evidence of how tunnelingbehaviors change with the shareholding ratio of controlling shareholder. From the above findings, we caninfer not only that the shareholding ratio of controlling shareholder and tunneling activities are not relatedin a monotonic or quadratic function relation but also that there is more than one turning point in the trend.
Table 4Descriptive statistics. Ln(RPT) is to measure tunneling severity. Other firm characteristics are as follows: (1) HLD represents theshareholding ratio of the controlling shareholder; (2) ROA is the return on total assets and measures the overall operation performance;(3) LEV is the asset-liability ratio and represents the financial risks of the company; (4) SIZE is the logarithm of the firm’s total assets andrepresents firm size; (5) Boardsize is the size of the board of directors, and different board sizes have different balancing abilities withrespect to the activity of the controlling shareholder; (6) Boardhold is the shareholding ratio of the board of directors; (7) CAR is thecumulative abnormal return measured with a value-weighted market model estimated over the period [�42, 126]. All variables areaveraged across the period and across firms. All observations are processed by excluding singular values (we winsorize all continuousvariables, except the dummy variables, at the 1st and 99th percentiles).
Variable CAR Ln(RPT) HLD ROA LEV SIZE Boardsize Boardhold
N 394 394 394 394 394 394 394 394Mean 0.0088 19.0122 0.3541 0.0452 0.5224 21.2559 9.3655 0.0144Std.dev. 0.5984 2.2279 0.1512 0.0733 0.2131 1.0849 1.9855 0.0631Min �1.8710 11.9184 0.0899 �0.3326 0.0743 18.8781 5 0Max 1.5429 28.2885 0.7303 0.2381 1.7329 24.3459 15 0.3687
236 W. Chen et al. / China Journal of Accounting Research 10 (2017) 231–245

Therefore, we should employ a more comprehensive design to study the effect of the interaction between thesetwo variables.
4. Theoretical model and hypotheses
Johnson et al. (2000) and LLSV (2002) establish a basic theoretical framework for tunneling behavior.We extend the models of Johnson et al. (2000) and LLSV (2002) to control rights transfer events. Specif-
ically, in one extension, we divide the entire sample into two subsets—Good Transfers and Bad Transfers—and study the direct relationship between the two variables in these two sub-samples. We consider this exten-sion to be one of the contributions of this study.
Assumptions:
(1) The controlling shareholder owns share a of the firm, and outsiders own share (1� a).(2) The total assets of the target firm are denoted by TA, and the CARs related to the control transfer are
denoted by R.(3) The controlling shareholder usurps s of the total assets (TA) of the target in the control transfer.(4) The cost of tunneling (usurping s) is cðk; sÞ ¼ 1
2k s2, and a higher value of k represents either weaker cor-
porate governance regulation, a weaker legal system or both (i.e., it is less costly to usurp assets from thetarget).
(5) The cost of tunneling is greater than zero but less than the total stealing amount to trigger tunneling; thatis, 0 < 1
2k s2 6 s, which implies that 0 < 1
k s 6 2.
The controlled optimization problem may be written as follows:
MaxUðs;R; k; aÞ ¼ Max aRðTA� sÞ þ s� 1
2ks2
� �ð1Þ
Differentiating Eq. (1) with respect to a yields the following:
@U=@s@U=@a
¼ RS � R � TA1� aR� s
k
ð2Þ
When the CARs of control transfers are greater than zero (R > 0), we obtain the following:
ðRs� R � TAÞ < 0 because s < TA and R > 0Because 0 < 1
k s 6 2 (Assumption (5)),
Table 5The tunneling behavior under different ranges of shareholding ratio of controlling shareholder. Thesample is divided into 10 deciles based on the shareholding ratio of controlling shareholder in the pre-event period (T � 1), and the RPT are computed at time T (the event year) for the Transfer samples.
8.99-18.04
18.12-22.19
22.36-26.43
26.64-29.67
29.68-34.43
34.46-39.01
39.14-44.08
44.27-51.51
51.53-59.76
59.91-73.03
Mean of RPTs 18.3861 18.5777 18.2502 18.5125 18.7881 19.1945 18.986 18.9497 19.0258 19.08
17.617.8
1818.218.418.618.8
1919.219.4
Ln
(RPT
)
HLD(T-1)(%)
W. Chen et al. / China Journal of Accounting Research 10 (2017) 231–245 237

when a is small, 0 6 s 6 k, s/k 6 1, we obtain the following:ð1� aR� s
kÞ > 0, which yields @s@a < 0;
when a is large, k < s 6 2k, 1 < s/k 6 2, we obtain the following:ð1� aR� s
kÞ 6 0, which yields @s@a P 0.
Therefore, our first hypothesis is as follows:
H1. The relationship between the tunneling behavior and the shareholding ratio of controlling shareholderexhibits a ‘‘decline-incline” trend, which resembles a U shape graphically (see Fig. 1).
As discussed above, corporate governance laws and mechanisms are underdeveloped in China. If corporategovernance rules were more developed, the tunneling behavior of controlling shareholders would be punished.The cost of tunneling decreases sharply when controlling shareholders own most of the shares of the target. Inthis instance, we define the cost of tunneling as follows:
ð1� aÞc2k
s2;where 0 < c � 1; 0 < a < 1
Eq. (2) can be revised as follows:
@s@a
¼ RS � R � TA� cs2
2k ð1� aÞc�1
1� aR� sk ð1� aÞc ð3Þ
Because c � 1, we obtain the following:
cs2
2kð1� aÞc�1 � 0
Eq. (5) can be written as follows:
@s@a
¼ RS � R � TA1� aR� s
k ð1� aÞc ð4Þ
When the CARs of a control transfer are less than zero (R < 0), we obtain the following:when a ! 1 and ð1� aÞc ! 0,
we obtain 1� aR� sk ð1� aÞc � 1� aR > 0
� �,
which implies that Eq. (4) is greater than zero, or @s@a > 0.
Thus, we present another important hypothesis:
H2. Given that controlling shareholders in China control more than 80% of the shares of firms on average,the relationship between the tunneling and the shareholding ratio of controlling shareholder exhibits an‘‘incline-decline-incline” trend, which resembles an N-shape graphically (see Fig. 2).
Our theoretical conjectures above extend the findings of previous studies and offer a more complete pictureof the relationship between the shareholding ratio of controlling shareholder and tunneling behavior.
To test the validity of our theoretical conjectures, we use control-rights-transfer events of publically listedChinese companies as the setting in which to empirically test the relationship between the shareholding struc-ture and tunneling activities empirically.
Figure 1. The quadratic function relation between the shareholding ratios of controlling shareholders and the tunneling activities.
238 W. Chen et al. / China Journal of Accounting Research 10 (2017) 231–245

5. Model specification and empirical results
The findings above indicate that tunneling activity is significantly affected by the shareholding ratio of con-trolling shareholder and that the relationship between tunneling activity and shareholding ratios is not simplymonotonic or quadratic.
We borrow the method of La Porta et al. (1998) and construct a multivariate analysis model to examine thedynamic relationship. Our primary proxy for tunneling is RPT amount.5 We also use other tunneling proxies(PBC) for robust tests. The data source for RPT is the CSMAR database. CSMAR database provides deal-level information on RPT for all A-share listed firms in China since 1997. For each transaction, CSMAR data-base provides information about the type of transaction, the relationship between the listed firm and its coun-ter party, and the amount of money involved in the transaction. We include only RPT in which a listed firmexperienced a control transfer and the information on the amount is provided.
Jiang et al. (2010) and Li et al. (2004) indicate that the factors affecting tunneling behavior include the sizeof a company’s board of directors, the ratio of independent directors and other corporate governance char-acteristics. Therefore, we use governance characteristics as control variables to differentiate the effects of acompany’s governance characteristics on tunneling from other factors.
Based on our preliminary data analysis in Section 3 and theoretical conjecture in Section 4, we designModel 1 to tests the monotonic function relation.
Model 1:
LnðRPTÞ ¼ a0 þ b1HLDþ b2ROAþ b3LEV þ b4Sizeþ b5Boardsizeþ b6Indbsizeþ b7Boardhold
þ b8Ceodualityþ b9Normalþ b10Stateþ b11Mindexþ biIndustryþ year ð5Þwhere:
Ln(RPT) is a measure of the level of tunneling severity of the controlling shareholder;HLD represents the shareholding ratio of the controlling shareholder;ROA is return on total assets and measures the overall operational performance of the company;LEV is the asset-liability ratio and represents the financial risk of the company;SIZE is the logarithm of the firm’s total assets and indicates firm size;Boardsize is the size of the board of directors; different board sizes have different balancing capabilities rel-ative to the activity of the controlling shareholder;Boardhold is the shareholding ratio of the board of directors;Indbsize represents the ratio of independent directors on the board of directors;Ceoduality represents whether the posts of general manager and chairman of the board of public companiesare held by the same person, where 1 represents the general manager and chairman of the board being thesame person and 0 represents the general manager and chairman of the board being separate individuals;Normal represents whether the public company has a normal trading status, where 1 represents the com-pany with a normal trading status and 0 represents non-normal trading status;
Figure 2. The cubic function relation between the shareholding ratios of controlling shareholders and the tunneling activities.
5 Previous studies show that it is difficult to measure tunneling accurately. The proxies for tunneling are according to either the valueimplications or the RPT.
W. Chen et al. / China Journal of Accounting Research 10 (2017) 231–245 239

State represents the actual type of the company’s controlling shareholder, where 1 represents a state-ownedholding and 0 represents a holding that is not state-controlled;Mindex refers to the area’s degree of marketization—which will affect the level of corporate governance—inwhich we use the market index (1997–2007) created by Fan et al. (2009), with 2008 following the index of2007; andIndustry is an industry dummy variable, and according to the industry classification standard of the ChinaSecurities Regulatory Commission (2001), we set 21 dummy variables (excluding the financial industry, themanufacturing industry classified by the second category, and other industries classified by the main cate-gory standard).
Model 1 tests the monotonic function relation between the two variables that can be inferred from previousstudies. If b1 is significant and negative, the shareholding ratio of controlling shareholder negatively influencestunneling activity. If b1 is significant and positive, the shareholding ratio of controlling shareholder positivelyaffects tunneling activity.
Next, we add the square of the shareholding ratio of the controlling shareholder (HLD2) to the Model fortesting the quadratic function relation. It is our second model.
Model 2:
LnðRPTÞ ¼ a0 þ b1HLD2 þ b2ROAþ b3LEVþ b4Sizeþ b5Boardsizeþ b6Indbsize
þ b7Boardholdþ b8Ceodualityþ b9Normalþ b10Stateþ b11Mindexþ biIndustry
þ year ð6ÞHLD2 represents the square of the shareholding ratio of the controlling shareholder.The other control variables are the same as in Model 1; Model 2 is the second stage for testing the quadratic
function relation between tunneling and the shareholding ratio of controlling shareholder.If, for the control transfer sample, the coefficient of HLD2 is significantly positive, and there is a U-shaped
relation between tunneling and the shareholding ratio of the controlling shareholder. Thus, we can confirmH1.
Finally, we add the cube of the shareholding ratio (HLD3) to the Model for testing the cubic function rela-tion. It is our last model.
Model 3:
LnðRPTÞ ¼ a0 þ b1HLD3 þ b2ROAþ b3LEVþ b4Sizeþ b5Boardsizeþ b6Indbsize
þ b7Boardholdþ b8Ceodualityþ b9Normalþ b10Stateþ b11Mindexþ biIndustry
þ year ð7ÞHLD3 represents the cube of the shareholding ratio of the controlling shareholder.All other variables are defined as in Models 1 and 2.Model 3 is designed to test the cubic function relation between tunneling and the shareholding ratio of the
controlling shareholder. If, for our control transfer sample, the coefficient of HLD3 is significantly positive,there will be an N-shaped relation, and we can thus confirm H2.
Table 6 presents the results of Multiple regression analysis of the shareholding ratio and the tunneling ofcontrolling shareholders. For Model 1, the coefficient of HLD is significantly positive. It indicates that tun-neling activity and shareholding ratio of controlling shareholder are positively correlated, and bigger share-holding ratio of controlling shareholder leads to more severe tunneling activities. For Model 2, thecoefficient of HLD2 is significantly positive. This result confirms H1 of our theoretical conjecture, which positsthat the quadratic relationship between the shareholding ratio of controlling shareholder and tunneling is a Ushape. For Model 3, the coefficient of HLD3 is significantly positive. This result indicates that the cubic func-tion relation between the shareholding ratio of controlling shareholder and tunneling is an N shape (incline-decline-incline), which confirms H2 of our theoretical conjecture. The coefficients of Size are significantly pos-itive in all three Models. It means the bigger the company, the more tunneling activities. The leverage (LEV)
240 W. Chen et al. / China Journal of Accounting Research 10 (2017) 231–245

Table 6Multiple regression analysis of the relationship between shareholding ratio and tunneling of controlling shareholders. Model 1 tests themonotonic function relation between the two variables. Model 2 tests H1, the quadratic function relation between the two variables.Model 3 tests H2, the cubic function relation between the two variables. RPT is a measure of the level of tunneling severity of thecontrolling shareholder; HLD represents the shareholding ratio of the controlling shareholder; ROA is return on total assets and measuresthe overall operational performance of the company; LEV is the asset-liability ratio and represents the financial risk of the company; SIZEis the logarithm of the firm’s total assets and indicates firm size; Boardsize is the size of the board of directors; different board sizes havedifferent balancing capabilities relative to the activity of the controlling shareholder; Boardhold is the shareholding ratio of the board ofdirectors; Indbsize represents the ratio of independent directors on the board of directors; Ceoduality represents whether the posts ofgeneral manager and chairman of the board of public companies are held by the same person, where 1 represents the general manager andchairman of the board being the same person and 0 represents the general manager and chairman of the board being separate individuals;Normal represents whether the public company has a normal trading status, where 1 represents the company with a normal trading statusand 0 represents non-normal trading status; State represents the actual type of the company’s controlling shareholder, where 1 represents astate-owned holding and 0 represents a holding that is not state-controlled; Mindex refers to the area’s degree of marketization—whichwill affect the level of corporate governance—in which we use the market index (1997–2007) created by Fan (2009), with 2008 following theindex of 2007; and Industry is an industry dummy variable, and according to the industry classification standard of the China SecuritiesRegulatory Commission (2001), we set 21 dummy variables (excluding the financial industry, the manufacturing industry classified by thesecond category, and other industries classified by the main category standard). HLD2 represents the square of the shareholding ratio ofthe controlling shareholder; HLD3 represents the cube of the shareholding ratio of the controlling shareholder.
Variables Ln(RPT)
Model 1 Model 2 Model 3
HLD 1.918(0.004)***
HLD2 2.189(0.009)***
HLD3 2.884(0.018)**
ROA �0.615 �0.578 �0.510(0.649) (0.669) (0.706)
LEV 0.920 0.948 0.971(0.090)* (0.080)* (0.073)*
Size 1.165 1.161 1.159(0.000)*** (0.000)*** (0.000)***
Boardsize �0.020 �0.019 �0.019(0.646) (0.655) (0.666)
Boardhold �4.417 �4.460 �4.511(0.001)*** (0.001)*** (0.001)***
Indbsize 1.482 1.433 1.386(0.070)* (0.079)* (0.089)*
Ceoduality �0.109 �0.117 �0.127(0.662) (0.642) (0.617)
State �0.239 �0.230 �0.218(0.234) (0.253) (0.280)
Normal 0.217 0.231 0.241(0.505) (0.478) (0.462)
Mindex 0.022 0.022 0.023(0.608) (0.607) (0.595)
Industry Control Control ControlConstant �7.839 �7.442 �7.312
(0.000)*** (0.000)*** (0.000)***
Observations 394 394 394R-squared 0.442 0.439 0.437White’s test Prob > 0.9983 Prob > 0.9992 Prob > 0.9994Mean VIF 2 2 2
Robust p-values are report in parentheses. We also do the White’s test to ensure our results reported are robust and no evidence showsheteroskedasticity in our models.*** p < 0.01.** p < 0.05.* p < 0.1.
W. Chen et al. / China Journal of Accounting Research 10 (2017) 231–245 241

and the ratio of independent directors (Indbsize) are positively related to tunneling behavior of control share-holders, while the shareholding ratio of the board and the tunneling activities are significantly negatively cor-related. It shows that the more shares the board holds, the less tunneling activities happen.
Table 7Hausman specification test.
Test: Ho: difference in coefficients not systematic
chi2(1) = (b � B)0 [(V_b � V_B)^(�1)](b � B)= 0.00
Prob > chi2 = 0.9514(V_b � V_B is not positive definite)
Table 8Robustness test. This table reports re-estimation results for the relationship between shareholding ratioand tunneling of controlling shareholders with an alternative proxy of tunneling.
Variables ORECTA
Model 1 Model 2 Model 3
HLD 0.091(0.077)*
HLD2 0.139(0.039)**
HLD3 0.218(0.031)**
ROA �0.228 �0.234 �0.234(0.017)** (0.014)** (0.014)**
LEV 0.098 0.099 0.099(0.060)* (0.058)* (0.057)*
Size �0.016 �0.016 �0.017(0.039)** (0.034)** (0.031)**
Boardsize 0.002 0.002 0.002(0.542) (0.570) (0.599)
Boardhold �0.160 �0.164 �0.166(0.093)* (0.083)* (0.080)*
Indbsize �0.127 �0.128 �0.129(0.030)** (0.029)** (0.027)**
Ceoduality 0.014 0.015 0.015(0.392) (0.367) (0.363)
State �0.011 �0.012 �0.012(0.353) (0.314) (0.325)
Normal �0.029 �0.027 �0.027(0.263) (0.282) (0.283)
Mindex �0.000 �0.000 �0.000(0.889) (0.866) (0.884)
Industry Control Control ControlConstant 0.369 0.388 0.400
(0.005)*** (0.002)*** (0.002)***
Observations 241 241 241R-squared 0.345 0.351 0.354White’s test Prob > 0.3118 Prob > 0.3160 Prob > 0.3119Mean VIF 1.92 1.92 1.92
Robust p-values are report in parentheses. We also do the White’s test to ensure our results reported arerobust and no evidence shows heteroskedasticity in our models.*** p < 0.01.** p < 0.05.* p < 0.1.
242 W. Chen et al. / China Journal of Accounting Research 10 (2017) 231–245

6. Robustness
6.1. Endogeneity
Because there is no heteroskedasticity in the models reported in Table 6, we use a Hausman specificationtest to find any endogenous variables in the 2SLS model. Table 7 indicates that all the variables in Model 3 areexogenous.
6.2. Alternative measures of tunneling
We use another tunneling measurement, other receivables over total assets (ORECTA) as a measure of tun-neling activity. According to Jiang et al. (2010), controlling shareholders used inter-corporate loans to siphonbillions of RMB from hundreds of Chinese public companies during the 1996–2006 period, and a substantialportion of these loans (between 30% and 40% of total OREC6 in the top three deciles) were made for the ben-efit of controlling shareholders and/or their affiliates. Thus, inter-corporate lending is a major method oftunneling.
We re-estimate the three Models using ORECTA as the tunneling proxy. Table 8 reports that the relation-ship between shareholding ratio and tunneling of controlling shareholders is an N shape (incline-decline-incline), which confirms our conclusion.
7. Conclusion
In this paper, we present a theoretical conjecture depicting the causal effects of the shareholding ratio ofcontrolling shareholder on tunneling activity in control transfers. We test the theoretical conjectures usingdata for 394 control rights transfer samples from 2001 to 2008. We use related party transactions amountto capture control shareholders’ tunneling activities.
The results confirm the theoretical predictions and show that shareholding ratio of controlling shareholderhas a significant effect on tunneling behavior, although the impact paths are different from the previous stud-ies. The effect reveals a cubic function (an N shape) relationship. Furthermore, firms with shareholding ratioof controlling shareholders that range from 34.46% to 39.01% (8.99–18.04%) exhibit the most (least) severetunneling. Firm size is significantly positively related to tunneling activities. In addition the shareholding ratioof the board and the tunneling activities are significantly negatively correlated. These findings imply the share-holding ratio decision of controlling shareholder in control transfers leads to agency problems manifested inChina in a particular form of tunneling. The overall findings also expand the understanding of tunnelingbehavior in a transitional economy, and suggest a market-based governance mechanism to protect minorityshareholders from expropriation.
Acknowledgments
The authors acknowledge financial support from the National Natural Science Foundation of China(NSFC Nos. 71372149, and 71402034), the philosophy and social sciences major issue research projects ofthe Ministry of Education of China (Grant No. 8151027501000039). The authors are especially grateful toProf. Roni Michaely, for his comments in the academic seminar held by Sun Yat-sen Business School. Theauthors also thank Prof. Xue Wang from Ohio State University for her meaningful discussion in 2016CAPANA/CJAR conference.
6 In their study, Jiang et al. (2010) indicate that tens of billions in renminbi (RMB) have been siphoned from hundreds of Chinese firmsby controlling shareholders. Typically reported as part of ‘‘other receivables” (OREC), these loans are found on the balance sheets of amajority of Chinese firms and collectively represent a large portion of the assets and market values of such firms. This situation has beenreferred to as the OREC problem.
W. Chen et al. / China Journal of Accounting Research 10 (2017) 231–245 243

References
Aharony, J., Lee, C., Wong, T., 2000. Financial packaging of IPO firms in China. J. Account. Res. 38, 103–126.Allen, F., Qian, J., Qian, M.J., 2005. Law, finance, and economic growth in China. J. Financ. Econ. 77 (1), 57–116.Atanasov, V., Black, B., Ciccotello, C., Gyoshev, S., 2010. How does law affect finance? An examination of equity tunneling in Bulgaria. J.
Financ. Econ. 96, 155–173.Bae, K., Kang, J., Kim, J., 2002. Tunneling or value added? Evidence from mergers by Korean business groups. J. Finance 57, 2695–2740.Baek, J., Kang, J., Lee, I., 2006. Business groups and tunneling: evidence from private securities offerings by Korean chaebols. J. Finance
61, 2415–2449.Bai, Y.X., Wu, L.S., 2008. The impact of takeovers and change of ultimate control on operating performance of state-owned enterprises. J.
Financial Res. 6, 130–143.Bayne, D.C., 1963. A Philosophy of Corporate Control. University of Pennsylvania Law Review, p. 112.Bebchuk, L.A., 1994. Efficient and inefficient sales of corporate control. Q. J. Econ. 109 (4), 957–993.Berkowitz, D., Lin, C., Ma, Y., 2015. Do property rights matter? Evidence from a property law enactment. J. Financ. Econ. 116, 583–593.Bertrand, M., Mehta, P., Mullainathan, S., 2002. Ferreting out tunneling: an application to Indian business groups. Quart. J. Econ. 117,
121–148.Buchuk, D., Larrain, B., Munoz, F., Urzua I, F., 2014. The internal capital markets of business groups: evidence from intra-group loans.
J. Financ. Econ. 112, 190–212.Chan, K., Hu, S.Y., Wang, Y.Z., 2003. When will the controlling shareholder expropriate the investors? Cash flow rights and investment
opportunity perspective. Acad. Econ. Papers 31, 301–331.Cheung, Y., Rau, P., Stouraitis, A., 2006. Tunneling, propping, and expropriation: evidence from connected party transactions in Hong
Kong. J. Financ. Econ. 82, 343–386.Cheung, Y., Rau, P., Stouraitis, A., 2010. Helping hand or grabbing hand? Central vs. local government shareholders in Chinese listed
firms. Rev. Finance 14, 669–694.Claessens, S., Simeon, D., Joseph, F., Lang, L., 2002. Disentangling the incentive and entrenchment effects of large shareholdings. J.
Finance 57, 2741–2771.Faccio, M., Lang, Larry H.P., 2002. The ultimate ownership of Western European Corporation. J. Financ. Econ. 65, 365–395.Fan, G., Wang, X.L., Zhu, H.P., 2009. NERI INDEX of Marketization of China’s Provinces 2009 Report. Economic Science Press,
Beijing, pp. 259–288.Fan, J., Wong, T., Zhang, T., 2007. Politically connected CEOs, corporate governance, and Post-IPO performance of China’s newly
partially privatized firms. J. Financ. Econ. 84, 330–357.Gao, L., Kling, G., 2008. Corporate governance and tunneling: empirical evidence from China. Pacific-Basin Finance J. 16, 591–605.Green, S., 2003. China’s Stock Market. Profile Books Ltd., London.Jennings, R.W., 1956. Trading in corporate control. California Law Rev. 44, 1–39.Jiang, G.H., Lee, Charles M.C., Heng, Y., 2010. Tunneling through intercorporate loans: the China experience. J. Financ. Econ. 98, 1–20.Joh, S., 2003. Corporate governance and firm profitability: evidence from Korea before the economic crisis. J. Financ. Econ. 68, 287–322.Johnson, S., Boone, P., Breach, A., Friedman, E., 2000. Corporate governance in the Asian financial crisis. J. Financ. Econ. 58, 141–186.Kahan, M., 1993. Sale of corporate control. J Law Econ Organ 9 (2), 368–379.La Porta, R., Lopez- de- Silanes, F., Shleifer, A., Vishny, R.W., 1998. Law and finance. J. Political Econ. 106, 1113–1155.La Porta, R., Lopez-de-Silanes, F., Shleifer, A., Vishny, R., 1999. The quality of government. J. Law Econ. Organ. 15, 222–279.La Porta, R., Lopez- de- Silanes, F., Shleifer, A., Vishny, R.W., 2000. Investor protection and corporate governance. J. Financ. Econ. 58,
3–27.La Porta, R., Lopez- de- Silanes, F., Shleifer, A., Vishny, R.W., 2002. Investor protection and corporate valuation. J. Finance 57, 1147–
1170.Lemmon, M., Lins, K., 2003. Ownership structure, corporate governance and firm value: evidence from the East Asian financial crisis. J.
Finance 58, 1445–1468.Li, G.P., 2010. The pervasiveness and severity of tunneling by controlling shareholders in China. China Econ. Rev. 21, 310–323.Li, Z.Q., Sun, Z., Wang, Z.W., 2004. Tunneling and ownership structure: evidence from the lending of controlling shareholder from the
Chinese listed companies. Account. Res. 12, 3–13.Lins, K., 2003. Equity ownership and firm value in emerging markets. J. Financ. Quant. Anal. 38, 159–184.Liu, Q., Lu, Z., 2007. Corporate governance and earnings management in the Chinese listed companies: a tunneling perspective. J.
Corporate Finance 13, 881–906.MacNeil, I., 2002. Adaptation and convergence in corporate governance: the case of Chinese listed companies. J. Corporate Law Stud. 2,
289–344.McConnell, John J., Servaes, H., 1990. Additional evidence on equity ownership and corporate value. J. Financ. Econ. 27, 595–612.Morck, R., Shleifer, A., Vishney, R.W., 1988. Management ownership and market valuation: an empirical analysis. J. Financ. Econ. 20,
293–315.Offenberg, D., 2009. Firm size and the effectiveness of the market for corporate control. J. Corporate Finance 15, 66–79.Peng, W. Qian, John Wei, K.C., Yang, Z.S., 2011. Tunneling or propping: evidence from connected transactions in China. J. Corporate
Finance 17, 306–325.Piotroski, J., Zhang, T., 2014. Politicians and the IPO decision: the impact of impending political promotions on IPO activity in China. J.
Financ. Econ. 111, 111–136.
244 W. Chen et al. / China Journal of Accounting Research 10 (2017) 231–245

Shleifer, A., Vishny, R.W., 1986. Large shareholders and corporate control. J. Political Econ. 94 (3), 461–488.Shleifer, A., Vishny, R.W., 1997. A survey of corporate governance. J. Finance 52, 737–783.Siegel, J., Choudhury, P., 2012. A reexamination of tunneling and business groups: new data and new methods. Rev. Financial Stud. 25,
1763–1798.Stulz, Rene.M., 1988. Managerial control of voting rights: financing policies and the market for corporate control. J. Financ. Econ. 20,
25–54.Tang, Z.M., Wei, Jiang., 2002. A study on the expropriation degree of large shareholders of China’s listed companies. Econ. Res. J. 4,
44–50.Urzua I, F., 2009. Too few dividends? Groups’ tunneling through chair and board compensation. J. Corporate Finance 15, 245–256.Wang, Z.H., Zhang, Y., 2004. The block stock transfer and corporate control. Manage. World 5, 116–126.Xi, J.F., Yu, P.Y., 2006. The study on transfer of the control right and it’s related operating performance and earnings management.
Nankai Business Rev. 9 (4), 42–48.
W. Chen et al. / China Journal of Accounting Research 10 (2017) 231–245 245


Influence of Chinese entrepreneurial companies’internationalization on independent innovation:Input incentive effect and efficiency improvement effect
Xin Xu a,⇑, Yun Xia b, Chuntao Li c
aSchool of Accounting and Finance, Zhongnan University of Economics and Law, ChinabSchool of International Business, Jinan University,ChinacSchool of Finance, Zhongnan University of Economics and Law,China
A R T I C L E I N F O
Article history:
Received 7 September 2015Accepted 22 May 2017Available online 17 July 2017
JEL Classifications:
O32F23
Keywords:
InternationalizationR&DPatent outputStrategic emerging industries
A B S T R A C T
Within the special environment of the ChiNext market, we study how an inter-nationalization strategy affects the independent innovation of Chinese entre-preneurial companies from two dimensions: R&D input and patent output.An internationalization strategy has a significant incentive effect on R&Dinput and a significant efficiency improvement effect on patent output. Entre-preneurial companies with higher degrees of internationalization have higherR&D inputs and patent outputs. After endogeneity is controlled, these effectsstill exist. Internationalization strategy has more pronounced effects on inde-pendent innovation in strategic emerging industries. The results elucidate theinternationalization strategy and independent innovation of Chinese entrepre-neurial companies, and have valuable implications for Chinese regulators inmaking international development policies for strategic emerging industriesand independent innovation.� 2017 Sun Yat-sen University. Production and hosting by Elsevier B.V. Thisis an open access article under the CC BY-NC-ND license (http://creativecom-
mons.org/licenses/by-nc-nd/4.0/).
1. Introduction
In the context of a rapidly growing knowledge economy and increasing economic globalization, indepen-dent innovation and internationalization have become inevitable means for many companies to achieve lastingsurvival and development and a lasting competitive edge. In view of the significance and urgency of indepen-
http://dx.doi.org/10.1016/j.cjar.2017.05.001
1755-3091/� 2017 Sun Yat-sen University. Production and hosting by Elsevier B.V.
This is an open access article under the CC BY-NC-ND license (http://creativecommons.org/licenses/by-nc-nd/4.0/).
⇑ Corresponding author.E-mail addresses: [email protected] (X. Xu), [email protected] (Y. Xia), [email protected] (C. Li).
China Journal of Accounting Research 10 (2017) 247–280
HO ST E D BY Contents lists available at ScienceDirect
China Journal of Accounting Research
journal homepage: www.elsevier .com/locate /c jar

dent innovation and internationalization, China has established a development strategy focused on buildingan innovative nation and ‘‘going global.” Innovation and internationalization are the ‘‘new normal” for Chi-nese companies’ strategic behaviors. However, the mutual influence of the two major strategies, the indepen-dent innovation strategy and the internationalization strategy, has not been fully recognized, which is nothelpful for implementing them or forming synergies. The core issue is whether internationalization can pro-mote Chinese companies’ independent innovation and improve their capacity for innovation. In the longrun, investigating this question may reveal the mechanisms underlying how internationalization affects corpo-rate behavior and firm performance. To become strong in innovation, China must better integrate globalresources to deepen and promote Chinese companies’ independent innovation and further accelerate its sus-tainable development. Therefore, exploring the effects of companies’ internationalized operations on indepen-dent innovation not only improves Chinese companies’ capacity for independent innovation using foreignresources, but also facilitates an understanding of the economic consequences of internationalization and eval-uates its outcomes. This way, it can guide the implementation of the Chinese going global strategy.
Research on the relations between companies’ internationalized operations and innovation is important inboth economics and management sciences. However, no universal conclusion about their relations has beenreached. Scholars have various views regarding whether companies’ internationalization can promote inde-pendent innovation (Hitt et al., 1997; Von Zedtwitz and Gassmann, 2002; Sanna-Randaccio and Veugelers,2007; Lileeva and Trefler, 2010; Bustos, 2011; Bratti and Felice, 2012). The empirical evidence has not beenconverged. In addition, according to recent research, a self-selection effect exists between internationalizationand independent innovation (Clerides et al., 1998; Bernard and Jensen, 1999; Melitz, 2003). Independent inno-vation and internationalization have reverse causality. Innovation-driven competitive edge can promote inter-nationalization and expand overseas markets (Roper and Love, 2002; Lopez and Garcıa, 2005; Cassiman andGolovko, 2011; Altomonte et al., 2013). Therefore, the endogeneity problem exists between companies’ inter-nationalization and independent innovation, which causes inconsistent and even opposite conclusions regard-ing their relations. Controlling endogeneity is a key strategy for identifying the relations between companies’internationalization and independent innovation.
In China, some scholars have studied the influence of internationalization on productivity from the per-spective of exports (Zhang et al., 2008, 2009; Qian et al., 2011) and have provided a preliminary understandingof whether local companies’ internationalization can promote productivity. However, few scholars havefocused on the evidence showing that internationalization influences independent innovation. Thus, in-depth research using the actual conditions in China is necessary.
139.67
214.68
343.54
428.71
504.34
600.99
45.8 63.24103.74
136.93168.97
207.27
0
100
200
300
400
500
600
700
2009 2010 2011 2012 2013 2014
Year
Ove
rsea
s inc
ome/
R&
D in
vest
men
ts(1
00 m
illio
n)
Overseas income R&D investments
Figure 1. Trend in the overseas income and R&D investments of Chinese ChiNext companies.
248 X. Xu et al. / China Journal of Accounting Research 10 (2017) 247–280

Since its establishment in 2009, the ChiNext market has provided a large amount of capital support forcultivating and developing strategic and emerging industries and optimizing and upgrading industrial struc-tures. Various high-tech companies, such as LENS Technology Co., Ltd., LEPU Medical Co., Ltd. andJINFU Technology Co., Ltd., have emerged and driven China’s innovative economy. According to statisticsfrom Wind Database, the total R&D input of ChiNext market companies jumped from 4.58 billion yuan in2009 to 20.727 billion yuan in 2014, with an annual average growth rate of 70.5%. ChiNext companies haveactively implemented internationalization strategies to expand overseas markets. Correspondingly, the totalrevenue of overseas businesses also jumped from 13.967 billion yuan in 2009 to 60.099 billion yuan in 2014,with an annual average growth rate of 92.3% (see Fig. 1). In particular, the proportion of the overseas revenueof LENS Technology has topped 95%. Thus, ChiNext companies have become typical examples of combininginternationalization and independent innovation. In this context, studying whether Chinese companies’ inter-nationalization positively affects independent innovation is of policy significance and urgency.
We use Chinese ChiNext companies as research objects and study the influence of Chinese entrepreneurialcompanies’ internationalization strategies on independent innovation1 from the dimensions of R&D input andpatent output. We consider the special environment of the Chinese ChiNext market as a natural setting inwhich to examine the influence of entrepreneurial companies’ internationalization on independent innovationand to test relevant theories. First, Chinese ChiNext companies are positioned to promote emerging industriesand innovative companies. Thus, independent innovation is an important standard for Chinese ChiNext com-panies. By the end of 2012, the proportion of companies in strategic emerging industries to all ChiNext com-panies was as high as 64%. Compared with companies on the main board and the small and medium enterpriseboard, ChiNext companies better reflect the influence of internationalization on independent innovation. Sec-ond, innovation and internationalization levels are influenced by organizational scale. However, choosing Chi-nese ChiNext companies as research objects eliminate the scale effect on internationalization and innovation.In innovation economics, company scale is a key factor influencing innovation (Schumpeter, 1942). However,the relation between scale and innovation is still controversial. Schumpeter (1942) argues that only large com-panies can afford R&D expenditures, take failures through large-scale innovation and enjoy the advantages ofinnovation, namely the ‘‘Schumpeter Hypothesis.” However, Porter (1985) and Barney (1991) argue thatalthough small companies have no scale advantages, they can flexibly focus on their competitive technologicalfields. Different from small companies, large companies can bear the high sunk costs and exploration costs ofoverseas markets and the high risks of international trade. Therefore, large companies can expand into over-seas markets more easily (Teece, 1986; Clerides et al., 1998; Melitz, 2003). Studies have also proved thatexport-oriented manufacturers are large in scale (Bernard and Jensen, 1999; Greenaway et al., 2005). Thus,it is necessary to control the scale effect on internationalization and innovation. As most ChiNext companiesare small companies in the start-up and growth phases, the scale effects of large companies can be eliminated,improving the study of the influence of small companies’ internationalization on independent innovation.Third, in economics, product diversification exerts extensive influences on innovation (Schumpeter, 1942;Hoskisson and Johnson, 1992; Hitt et al., 1997; Miller, 2004). Thus, the influence of industrial diversificationon innovation should be controlled in studying internationalization. Interim Measures on Administration of
Initial Public Offering and Listing on ChiNext promulgated by the China Securities Regulatory Commissionon March 31, 2009 andMeasures on Administration of Initial Public Offering and Listing on ChiNext on Febru-ary 11, 2014 explicitly state that ‘‘issuers in the ChiNext market shall mainly engage in one main business.”Accordingly, emphasis on business simplification excludes the possibility of diversification, providing a natu-ral setting in which to study the influence of internationalization on independent innovation.
We make a number of theoretical contributions to the literature. First, we depict internationalization fromseveral dimensions, such as export sales intensity, export sales proportion and overseas institutions. We alsostudy the influence of Chinese entrepreneurial companies’ internationalization on independent innovationfrom the dimensions of R&D input and patent output. This facilitates a comprehensive understanding ofthe influence of internationalization on independent innovation. We supplement empirical evidence of the
1 There exist different dimensions and perspectives of innovation. The innovation discussed herein refers to technology innovation. Theauthors appreciate the referee’s advice very much.
X. Xu et al. / China Journal of Accounting Research 10 (2017) 247–280 249

influence of internationalization on innovation output and partly reveal the mechanisms underlying the influ-ence of internationalization on companies’ behaviors and firm performance. After controlling endogenous fac-tors, internationalization strategies exert input incentive effects on R&D and companies with higher degrees ofinternationalization have higher R&D inputs; furthermore, internationalization strategies exert efficiencyimprovement effects on patent production and companies with higher degrees of internationalization havehigher patent output efficiencies. Second, different from studies in which mature companies are the objects,we mainly study Chinese entrepreneurial companies. Third, we study in-depth how an internationalizationstrategy affects the independent innovation of strategic emerging industries in the Chinese ChiNext market.In strategic emerging industries, internationalization has a more pronounced input incentive effect and effi-ciency improvement effect on independent innovation. This provides evidence of and policy references forthe implementation of the going global strategy of Chinese companies and industries.
The remainder of this paper is organized as follows. Section 2 reports the theoretical analysis and researchhypotheses. Section 3 describes the research design. Section 4 documents the empirical results and analysis.Section 5 discusses the influence of internationalization on strategic emerging industries. Section 6 concludesthe paper.
2. Theoretical analysis and research hypothesis
The relationship between international operation and innovation has always been an important topic ineconomics and management, but no unified conclusion has been reached on this issue. Recent empirical evi-dence has given rise to three hypotheses.
2.1. Internationalization promotes innovation
In this hypothesis, internationalization, as the process of studying and knowledge accumulation, can helpcompanies obtain more resources, information, ideas, technologies and opportunities (Kotabe, 1990; Kobrin,1991; Hitt et al., 1997); use the international market to dilute and reduce R&D costs (Cheng and Bolon, 1993;Granstrand et al., 1993; Kotabe et al., 2002); and form innovative strategic alliances (Santos et al., 2004). Thelearning effect (Grossman and Helpman, 1991; Bratti and Felice, 2012; Love and Ganotakis, 2013) and thecompetitive incentive effect (Hitt et al., 1997; Bratti and Felice, 2012) of internationalization can increase com-panies’ attention to innovation, improve their capacity for innovation and earn more exclusive income ofinnovation (Teece, 1986; Kafouros et al., 2008). The learning effect of internationalization is the significanttheoretical basis of the hypothesis that internationalization promotes innovation, and is the focus of empiricalresearch. Thus, a company’s internationalization has a positive effect on innovation.
2.2. Internationalization hinders innovation
In this hypothesis, internationalization increases companies’ risk of leaking knowledge and technology(Sanna-Randaccio and Veugelers, 2007); increases costs in management, coordination and informationexchange; and increases misunderstandings between different R&D teams and opportunistic behavior(Fisch, 2003), impeding R&D team cohesion (Von Zedtwitz and Gassmann, 2002). Therefore, international-ization increases the risks and costs of company innovation, thereby hindering it.
2.3. Internationalization is irrelevant to innovation: Self-selection
In this hypothesis, companies enter the international market and possess higher innovative capability as aresult of the self-selection effect. In the global market, companies undertake extremely high sunk costs, highrisk and more fierce competition, so they must demonstrate heterogeneity in scale, technical innovation andperformance, which generates the self-selection effect of internationalization (Clerides et al., 1998; Melitz,2003; Helpman et al., 2004). Unlike non-international companies, international companies possess higherinnovative capabilities and higher productivities before they enter overseas markets. In addition, they can bearhigh sunk costs, developing costs and high-risk international transactions, making them more likely to expand
250 X. Xu et al. / China Journal of Accounting Research 10 (2017) 247–280

into overseas markets (Bernard and Jensen, 1999; Melitz, 2003). Recently, the self-selection effect has beensupported by more empirical evidence (Baldwin and Gu, 2004; Greenaway et al., 2005), which challengesthe causal relationship of the hypothesis that internationalization promotes innovation.
Moreover, recent research has found that corporate innovation has the reverse effect on the international-ization of companies (Altomonte et al., 2013) and that innovation can strengthen companies’ market powerand thus facilitates international expansion (Roper and Love, 2002; Lopez and Garcıa, 2005; Cassiman andGolovko, 2011). Internationalization itself can also be seen as an innovative firm process (Bilkey and Tesar,1977; Prashantham, 2005). Therefore, strong endogeneity exists between the internationalization and innova-tion of an enterprise, which has led to inconsistencies in the research.
Some of the typical microeconometric studies summarized in Table 1 show that no consistent understand-ing has been achieved regarding whether internationalization promotes independent innovation. There arevarious contradictions and controversies surrounding the empirical evidence, especially that from differentregions and countries. Empirical research has focused more on total factor productivity (TFP) to measurecompanies’ innovation and performance. However, productivity is not the most appropriate and direct inno-vation measure. First, sales revenue is used to calculate productivity. As price and quantity data cannot beseparated, they cannot distinguish between the influence of price (market force) and quantity (productivity).Second, productivity indirectly measures innovation, but it cannot embody companies’ learning effects. How-ever, Grossman and Helpman (1991) argue that companies’ innovation demonstrates the learning effect. Thus,the proxy variable that directly measures innovation is used to further study the learning effect ofinternationalization.
Griliches (1990) points out that innovation is an activity that at least includes R&D input and patent out-put. A patent is the direct output of R&D, and R&D input and patent output reflect innovation to somedegree. We use R&D input and patent output to measure companies’ innovation, which can demonstratethe influence of internationalization on independent innovation from the input-output perspective.
Internationalization and innovation are two engines of economic growth. However, compared with the pri-ority and establishment of the internationalization strategy, Chinese attention to innovation is far behind. Inview of China’s resource endowment, the Chinese government established the export-oriented strategy in the1980s. Currently, exports contribute much more to China’s GDP than innovation. At the micro level, thismacroeconomic outcome reflects that companies engage in export and other international behavior earlierthan they do independent innovation. In the context of economic development transformation, international-ization can promote independent innovation, which can improve companies’ sustainable development andChina’s sustainable economic growth. In China, some scholars have studied the impact of internationalizationon productivity from the export perspective (Zhang et al., 2008, 2009; Qian et al., 2011), which provides aninitial understanding of the influence of local companies’ internationalization on productivity. However,the domestic literature still lacks direct evidence of how internationalization affects independent innovation.Bernard et al. (2006) indicate that it is of little significance to argue the learning effect or the self-selection effecton companies’ productivity in developing countries. Instead, the focus should be shifted from technologyintroduction and learning to independent innovation according to the different developmental stages of devel-oping countries, and to the relevant realization conditions and feasible paths. Thus, the key is to promoteindependent innovation through internationalization and boost the sustainable improvement of productivity.Given the insufficient evidence of the influence of internationalization on R&D input and patent output, in-depth research on the basis of China’s special situation is necessary. Therefore, we propose the followinghypotheses.
Hypothesis 1. If the other conditions remain unchanged, internationalization has an incentive effect oncorporate R&D, and higher internationalization entails higher R&D input.
Hypothesis 2. If the other conditions remain unchanged, internationalization can improve the efficiency ofcompanies’ patent outputs, and higher internationalization entails higher patent output.
X. Xu et al. / China Journal of Accounting Research 10 (2017) 247–280 251

Tab
le1
Empirical
evidence
ofinternationalizationan
dtechnology
innovation.
Study
Sam
ple
Journal
Resultsan
dconclusions
Hitt,Hoskissonan
dKim
(199
7)29
5USlisted
compan
iesfrom
1988
to19
90Academ
yof
Man
agem
ent
Journal
They
findthat
compan
ies’international
diversificationhas
apositive
effectonR&D
inputintensity.They
thinkthat
international
diversificationprovides
more
incomesupport
forinnova
tion
investment.In
themeantime,
they
pointoutthat
internationalization
andinnovationinteract.
Clerides,Lachan
dTyb
out(199
8)Cross-countryresearch:AllColombiancompan
ieswithmore
than
10people
from
1981
to19
91,28
00largeMexican
compan
iesfrom
1986
to19
90,allMoroccan
compan
ieswithmore
than
10peoplefrom
1984
to19
91
Quarterly
Journal
of
Economics
Aself-selectioneffectexists
inColombianan
dMexican
compan
ies,
whereasthelearningeffectexists
inMoroccan
compan
ies.
Bernardan
dJensen
(199
9)50
,000
to60
,000
American
man
ufacturingcompan
iesfrom
1984
to19
92Journal
of
International
Economics
They
findthat
thereisaself-selectioneffectan
d,unlike
noninternational
compan
ies,international
compan
ieswith
heterogeneouscharacteristicsaremore
innova
tive
before
entryinto
overseasmarkets.They
achieve
betterperform
ance
andbecome
export-orientedcompan
ies.
Baldwin
andGu
(200
4)10
,106
Can
adiancompan
iesfrom
1984
to19
90an
d90
36Can
adian
compan
iesfrom
1990
to19
96Oxford
Review
of
Economic
Policy
They
findthat
export-orientedmarket
participationispositively
relatedwithcompan
yproductivity.
Thelearningeffect,the
international
market
competitioneffectan
deconomiesofscale
promote
productivity.
Theparticipationoftheinternational
market
enab
lescompan
iesto
increase
R&D
input.However,before
andafter
entryinto
overseasmarkets,export-orientedcompan
iesaremore
innovative
than
non-exp
ort-orientedcompan
iesan
daself-selection
effectexists.
Greenaw
ay,
Gullstrandan
dKneller(200
5)
3570
Swedishman
ufacturingcompan
iesfrom
1980
to19
97Review
of
World
Economics
Exp
ort-orientedcompan
iesan
dnon-exp
ort-orientedcompan
ieshav
eincredibly
similar
perform
ance
characteristicsan
dthereisno
heterogeneity.Before
andafterthesecompan
iesenteroverseas
markets,thereisnosign
ificantdifference
betweentheirproductivities.
Van
Biesebroeck
(200
5)Cross-countryresearch:10
5Burundicompan
iesin
1993
,23
4Cam
erooniancompan
iesfrom
1992
to19
94,20
7Ethiopian
compan
iesin
1996
,20
9Ghan
aian
compan
iesfrom
1991
to19
93,18
8Ivory
Coastcompan
iesfrom
1994
to19
95,26
7domesticKenyan
compan
iesfrom
1992
to19
94,24
1Tan
zaniancompan
iesfrom
1992
to19
94,26
2Zam
biancompan
iesfrom
1992
to19
94an
d20
3Zim
bab
weancompan
iesfrom
1992
to1994
Journal
of
International
Economics
Thereisalearningeffectin
nineSub-Sah
aran
African
countries.
Exp
ort-orientedcompan
ieshavebetterproductivitiesthan
non-
export-orientedcompan
ies.After
entryinto
overseasmarkets,the
productivityofexport-orientedcompan
iesim
proves.
Salomonan
dJin
(201
0)1744
Span
ishman
ufacturingcompan
iesfrom
1990
to1997
Strategic
Man
agem
ent
Journal
Exp
ortingisassociated
withtheex
post
increase
ininnovative
productivityforboth
technologicallylead
ingan
dlagg
ingfirm
s.However,subsequentto
exporting,
technologicallylead
ingfirm
sap
ply
formore
patents
than
technologicallylagg
ingfirm
s.
252 X. Xu et al. / China Journal of Accounting Research 10 (2017) 247–280

Brattian
dFelice
(201
2)16
35Italianman
ufacturingcompan
iesfrom
1998
to20
03TheWorld
Economy
Supportthetheory
ofpromotionan
dfindthat
exportcanincrease
the
probab
ilityofintroducingproduct
innovation.Thelearningeffect
exists.
Altomonte,
Aquilan
te,Bekes
andOttav
iano
(201
3)
Cross-countryresearch:14
,759
Europeanman
ufacturingcompan
ies
from
theEFIG
Edatab
asein
2008,such
asthose
from
Austria,
France,German
y,Hungary,Italy,
Spainan
dtheUK
Economic
Policy
Exp
ort
itselfisonly
anaspectofcompan
ies’internationalization.
Internationalizationismore
than
exportation.Compan
ies’
internationalizationissign
ificantlyrelatedwithinnovation.In
the
longterm
,compan
ies’internationalizationisprobab
lydrivenby
innova
tion.
Love
andGan
otakis
(201
3)41
2UK
smallan
dmedium-sized
high-techcompan
iesfrom
2001
to20
04International
Business
Review
Support
thetheory
ofpromotionan
dfindthat
afterexport,the
probab
ilityofcompan
yinnovationishigher
than
that
fornon-exp
ort
compan
ies,butthat
innova
tionintensity
does
notincrease.
X. Xu et al. / China Journal of Accounting Research 10 (2017) 247–280 253

Tab
le2
Variable
definitions.
Variable
Sym
bol
Definition
Dependent
variab
les
R&D
intensity
RD_intensity
R&D
intensity
=R&D
expenditures/totalassets
atyear-end.
Chan
gesin
R&D
intensity
4RD_intensity
4RD_intensity
=(R
&D
expendituresforthisyear
�R&D
expendituresforlast
year)/totalassets
atlast
year-end.
Technologicalinnovation
perform
ance
4Patents
Thenumber
ofnew
patents
gran
tedbytheChinaIntellectual
Property
Office
intheyear,includingthenumber
ofinventions,
utility
patents
anddesignpatents.
Exp
lanatory
variab
les
Internationalizationoffirm
Overseas_Sales
Overseasrevenueintensity
=overseassalesrevenue/totalassets
atyear-end.
Exp
ort_R
ate
Theproportionofoverseasrevenue=
overseasrevenue/totalrevenueat
year-end.
Overseas_Agency
Dummyvariab
le.If
thecompan
yhas
overseasbranches
orinvestmentinstitutions,
thevalueis1;
otherwise,
thevalueis0.
Chan
gesin
compan
ies’
internationalization
4Overseas_Sales
Chan
gesin
overseasrevenueintensity
=(overseasrevenueforthisyear
�overseasrevenueforlastyear)/totalassetsat
lastyear-
end.
4Exp
ort_R
ate
Chan
gesin
theproportionofoverseasrevenue=
(overseasrevenueforthisyear
�overseasrevenueforlast
year)/totalrevenue
atlast
year-end.
Control
variab
les
Totalsalesoffirm
Total_Sales
Total_Sales
=(domesticrevenueforthisyear
+overseasrevenueforthisyear)/totalassets
atyear-end.
Chan
gesin
totalsalesoffirm
4Total_Sales
4Total_Sales
=(domesticrevenueforthisyear
+overseasrevenueforthisyear
�domesticrevenueforlast
year
�overseas
revenueforlast
year)/totalassets
atyear-end.
Domesticrevenueoffirm
Domes_S
ales
Domesticrevenueintensity
=domesticrevenueforthisyear/totalassets
atyear-end.
Chan
gesin
domesticrevenue
offirm
4Domes_S
ales
4Domes_S
ales
=(domesticrevenueforthisyear
�domesticrevenueforlast
year)/totalrevenueat
last
year-end.
Firm
investment
opportunities
Tobin’sQ
Tobin’sQ
=firm
’smarket
value/firm
’sreplacementcost=
(number
oftrad
ableshares
*thisyear’sclosingprice
+non-tradab
le
shares
*bookvalueofnet
assets
per
share+
bookvalueofliab
ilities)/totalassets
atyear-end.
Chan
gesin
investment
opportunitiesoffirm
4Tobin’sQ
Tobin’sQ
=(number
oftrad
able
shares
*thisyear’sclosingprice
+non-tradab
leshares
*bookvalueofnet
assets
per
shareof
thisyear
+bookvalueofliab
ilitiesofthisyear
�number
oftrad
able
shares
*last
year’sclosingprice
+non-tradab
le
shares
*bookvalueofnet
assets
per
shareoflast
year
+bookvalueofliab
ilitiesoflast
year)/totalassets
atlast
year-end.
Finan
cial
risk
Lev
Asset-liabilityratio=
totalliab
ilities/totalassets
atyear-end.
Chan
gein
finan
cial
risk
4Lev
(Totalliab
ilitiesforthisyear
�totalliab
ilitieslast
year)/totalassets
atyear-end.
CEO
gender
Ceo_G
ender
IftheCEO
ismale,
thevalueis1;
otherwise,
thevalueis0.
CEO
age
Ceo_A
geTheageoftheCEO.
Educational
backgroundof
CEO
Ceo_E
ducation
IftheCEO
has
aBachelor’s,Master’sorDoctoraldegree,
thevalueis1;
otherwise,
thevalueis0.
Overseasexperience
ofCEO
Ceo_E
xperience
IftheCEO
has
experience
studyingorworkingab
road
,thevalueis1;
otherwise,
thevalueis0.
CEO
duality
Dual
Dummyvariab
leequal
to1forCEO
dualityan
d0otherwise.
Proportionofthelargest
shareholder
First_S
take
Theproportionofthelargestshareholder’sshareholdingin
thecompan
ies.
Nature
ofthecontrolling
owner
Property
Adummyvariab
leequal
to1forastate-owned
listed
compan
yan
d0otherwise.
Venture
capital
VC
Ifthefirm
isventure
capital
backed,thevalueis1;
otherwise,
thevalueis0.
Firm
life
cycle
Age
Thesurvival
timeofthefirm
from
thebeginningto
thisyear.
Stock
knowledge
offirm
Patents_p
ast_totalThenumber
ofpatents
thefirm
accumulatedin
pastyears.
Firm
size
Size
Size=
Naturallogarithm
oftotalassets
atyear-end.
Industry
effects
Industry
First-level
industry
classificationaccordingto
theCSRC
industry
stan
dard.Wedefineeigh
tdummyvariab
lesforwhichthe
benchmarkisL,representingthecommunicationan
dculture
industry.
Yeareffects
Year
Wedefinethreedummyvariab
les,forwhichthebenchmarkyear
is2009.
254 X. Xu et al. / China Journal of Accounting Research 10 (2017) 247–280

3. Research design
3.1. Sample selection and data sources
We use Chinese ChiNext companies from 2009 to 2012 as research samples and financial data from theChina Stock Market and Accounting Research (CSMAR) Database. Using the annual reports of listed com-panies, we hand collect the R&D data, overseas income structures and overseas institutions. The patent dataof listed companies are from the China Patent Database published by China Intellectual Property Office Intel-lectual Property Press. We classify and arrange the patents owned by listed companies according to year. Afterexcluding the missing data, we obtain a final sample of 825 firm-year observations. Of these observations, 36,153, 281 and 355 correspond to 2009, 2010, 2011 and 2012, respectively.
3.2. Model specifications and variable definitions
To test Hypothesis 1, we build the following regression models, Models (1)–(4), according to the relevantliterature (Himmelberg and Petersen, 1994; Hubbard, 1998). The model variables are defined in Table 2. All ofthe behaviors related to cross-border expansion can be regarded as companies’ internationalization; the sales,manufacturing or R&D in different areas or overseas markets embody internationalization (Hitt et al., 1994,1997). Therefore, according to the relevant literature (Hitt et al., 1997; Lu and Beamish, 2004; Altomonteet al., 2013), we adopt overseas sales intensity (Overseas_Sales), the proportion of overseas revenue (Expor-t_Rate) and overseas institutions (Overseas_Agency) to measure the degree of internationalization. Due tothe different institutions in Hong Kong, Macao, Taiwan and mainland China, the sales revenues in these threeareas are included in the overseas sales revenue.
RD intensityt ¼ b0 þ b1Total Salest þ b2Tobins0Qt þ b3Levt þ b4Ceo Gendert þ b5Ceo Aget
þ b6Ceo Educationt þ b7Ceo Experiencet þ b8Dualt þ b9First Staket þ b10Propertyt
þ b11VCt þ b12Sizet þ b13Industry þ b14Year þ f ð1ÞRD intensityt ¼ b0 þ b1Overseas Salest þ b2Domes Salest þ b3Tobins
0Qt þ b4Levt þ b5Ceo Gendert
þ b6Ceo Aget þ b7Ceo Educationt þ b8Ceo Experiencet þ b9Dualt þ b10First Staket
þ b11Propertyt þ b12VCt þ b13Sizet þ b14Industry þ b15Year þ f ð2ÞRD intensityt ¼ b0 þ b1Export Ratet þ b2Tobins
0Qt þ b3Levt þ b4Ceo Gendert þ b5Ceo Aget
þ b6Ceo Educationt þ b7Ceo Experiencet þ b8Dualt þ b9First Staket þ b10Propertyt
þ b11VCt þ b12Sizet þ b13Industry þ b14Year þ f ð3ÞRD intensityt ¼ b0 þ b1Overseas Agencyt þ b2Total Salest þ b3Tobins
0Qt þ b4Levt þ b5Ceo Gendert
þ b6Ceo Aget þ b7Ceo Educationt þ b8Ceo Experiencet þ b9Dualt þ b10First Staket
þ b11Propertyt þ b12VCt þ b13Sizet þ b14Industry þ b15Year þ f ð4Þ
To alleviate the impact of endogeneity, we build Models (5), (6) and (7) to further investigate the influenceof companies’ internationalization on R&D input according to Models (1), (2) and (3). The definitions of themain variables are presented in Table 2.
DRD intensity ¼ b0 þ b1DTotal Salesþ b2DTobins0Qþ b3DLev þ b4Industry þ b5Year þ f ð5Þ
DRD intensity ¼ b0 þ b1DOverseas Salesþ b2DDomes Salesþ b3DTobins0Qþ b4DLevþ b5Industry
þ b6Year þ f ð6ÞDRD intensity ¼ b0 þ b1DExport Rateþ b2DTobins
0Qþ b3DLevþ b4Industry þ b5Year þ f ð7Þ
X. Xu et al. / China Journal of Accounting Research 10 (2017) 247–280 255

To better alleviate the impact of endogeneity, we also use the two-stage least squares (TSLS) method to testthe influence of companies’ internationalization on R&D. We follow the literature (Lileeva and Trefler, 2010;Bustos, 2011; Bratti and Felice, 2012) and choose the proportion of assets of foreign-funded firms in ChiNextcompanies with output values of over 5 million yuan (Foreign_ratio) as an instrumental variable for interna-tionalization. The data are from the Industrial Statistics Data of the National Bureau of Statistics. The pro-portion of foreign assets in ChiNext companies with output values over 5 million yuan is a good indicator ofthe degree of internationalization. It also has no direct interaction with corporate independent innovation andis irrelevant to the regression residuals of Models (2), (3) and (4). That is, it meets the instrumental variables’exogeneity requirements. The TSLS regression process is as follows. During the first stage, Overseas_Sales,Export_Rate and Overseas_Agency are adopted to conduct the regression of Foreign_ratio and all controlvariables except for Overseas_Sales, Export_Rate and Overseas_Agency from Models (2), (3) and (4), includ-ing Domes_Sales (only in Overseas_Sales), Tobin’s Q, Lev, Ceo_Gender, Ceo_Age, Ceo_Education,Ceo_Experience, Dual, First_Stake, Property, VC, Size, Year and Industry. The following induction modelis used:
Overseas Salesi=Export Ratei=Overseas Agencyi ¼ u0 þ u1Foreign ratioi
þXmj¼1
u1þmOther- exogenous -variableji þ e ð8Þ
where other exogenous variables include Domes_Sales (only in Overseas_Sales), Tobin’s Q, Lev, Ceo_Gender,Ceo_Age, Ceo_Education, Ceo_Experience, Dual, First_Stake, Property, VC, Size, Year and Industry. Thefitted values of Overseas_Sales, Export_Rate and Overseas_Agency are extracted using the preceding equa-tion. During the second stage, the fitted values of Overseas_Sales, Export_Rate and Overseas_Agency replaceOverseas_Sales, Export_Rate and Overseas_Agency in Models (2), (3) and (4) to conduct the regression anal-ysis. To test Hypothesis 2, we construct the Poisson regression in Models (9), (10) and (11) according to relatedstudies (Pakes and Griliches, 1980; Bound et al., 1984; Hausman et al., 1984). The variables are defined inTable 2. Patent output has strong lagged effects and results from current and lagged R&D expenditures.We control the lagged one period and lagged two period of companies’ R&D inputs (RD_intensityt-1 andRD_intensityt-2).
DPatentst ¼ b0 þ b1RD intensityt þ b2RD intensityt�1 þ b3RD intensityt�2 þ b4Overseas Salest
þ b5Domes Salest þ b6Patent past totalt þ b7Ceo Gendert þ b8Ceo Aget
þ b9Ceo Educationt þ b10Ceo Experiencet þ b11Dualt þ b12Aget þ b13First Staket
þ b14Propertyt þ b15VCt þ b16Sizet þ b17Levt þ b18Industry þ b19Year þ f ð9ÞDPatentst ¼ b0 þ b1RD intensityt þ b2RD intensityt�1 þ b3RD intensityt�2 þ b4Export Ratet
þ b5Patent past totalt þ b6Ceo Gendert þ b7Ceo Aget þ b8Ceo Educationt
þ b9Ceo Experiencet þ b10Dualt þ b11Aget þ b12First Staket þ b13Propertyt þ b14VCt
þ b15Sizet þ b16Levt þ b17Industry þ b18Year þ f ð10ÞDPatentst ¼ b0 þ b1RD intensityt þ b2RD intensityt�1 þ b3RD intensityt�2 þ b4Overseas Agencyt
þ b5Patent past totalt þ b6Ceo Gendert þ b7Ceo Aget þ b8Ceo Educationt
þ b9Ceo Experiencet þ b10Dualt þ b11Aget þ b12First Staket þ b13Propertyt þ b14VCt
þ b15Sizet þ b16Levt þ b17Industry þ b18Year þ f ð11ÞThe empirical literature indicates that dependent variables (RD_intensity and 4Patents) and independent
variables (Overseas_Sales, Export_Rate and Overseas_Agency) may be influenced by company characteristics(Bernard and Jensen, 1999; Melitz, 2003; Greenaway et al., 2005) and manager characteristics2 (Faleye, 2011;
2 The authors are grateful for the referees’ suggestions.
256 X. Xu et al. / China Journal of Accounting Research 10 (2017) 247–280

Tab
le3
Industry
affiliationofChiN
extcompan
ies.
Industry
2009
2010
2011
2012
Number
Percentage
(%)
Number
Percentage
(%)
Number
Percentage
(%)
Number
Percentage
(%)
Panel
AIndustry
affiliationsofthefullsample
A(A
griculture,Forestry,Anim
alHusban
dry
and
Fishery)
00
42.61
62.14
71.97
B(M
ining)
00
10.65
41.42
51.4
C(M
anufacturing)
2158.33
101
66.01
187
66.55
229
64.51
E(C
onstruction)
00
10.65
20.71
30.85
F(Transportationan
dStorage)
12.78
10.65
20.71
30.85
G(Inform
ationTechnology)
822
.22
3019
.61
5519
.57
7721
.69
H(W
holesale
andRetail)
25.56
21.31
20.71
20.56
K(Social
Service)
38.33
74.58
144.98
185.07
L(C
ommunicationan
dCulture)
12.78
63.93
93.21
113.1
Total
3610
015
310
028
110
035
510
0
Strategic
emergingindustries
Panel
BStrategic
emergingindustries
affiliationsofsample
firm
s
Energy
savingan
denvironmentalprotection
industry
14
65.83
94.92
114.8
New
generationofinform
ationtechnology
832
2726.21
5027.32
7331.88
Biomedicine
624
1514
.56
3116
.94
3716
.16
High-endequipmentman
ufacturing
624
2524.27
4926.78
5624.45
New
energy
28
1312
.62
168.74
177.42
New
materials
14
1514
.56
2312
.57
2912
.66
New
energy
automobile
14
21.95
52.73
62.63
Total
2510
010
310
018
310
022
910
0
X. Xu et al. / China Journal of Accounting Research 10 (2017) 247–280 257

Debrulle and Maes, 2015; Naldi et al., 2015; Sala and Yalcin, 2015). For example, venture companies oradventurous managers tend to choose the internationalization strategy. These kinds of companies or managersare more inclined to invest in innovative high-risk projects. Therefore, we select firm size (Size), firm invest-ment opportunities (Tobin’s Q), financial risk (Lev), CEO duality (Dual), proportion of the largest share-holder (First_Stake), nature of the controlling owner (Property), venture capital (VC), firm life cycle (Age),CEO gender (Ceo_Gender), CEO age (Ceo_Age), educational background of CEO (Ceo_Education) andoverseas experience of CEO (Ceo_Experience) as our control variables.
4. Empirical results
4.1. Descriptive statistics
Table 3 shows the industry affiliations of ChiNext companies. Panel A shows 229 and 77 companies in themanufacturing and information technology industries, respectively. Panel B presents the sample by strategicemerging industries, with 73 companies in new generation of information technology and 56 companies inhigh-end equipment manufacturing. The number of companies in energy saving and environmental protectionand new energy automotive is relatively small.
Table 4 presents the descriptive statistics of overseas income for ChiNext companies. Of the 355 ChiNextcompanies, 81 (22.82%) are non-exporters that never export, 190 (53.52%) are exporters that always export, 80are entrants (22.82%) that begin exporting and 1 is a quitter that no longer exports. This shows that the degreeof internationalization of ChiNext companies is higher and that most companies actively explore the interna-tional market to earn overseas income.
Table 5 presents the descriptive statistics of export region distribution for ChiNext companies. It shows thatChiNext companies have expanded their businesses in five continents, with a considerable number of compa-nies selling their products and services to Europe, North America and South America. From the dynamictrend, the export region of ChiNext companies is mainly in Asia (excluding Hong Kong, Macao and Taiwan)and Hong Kong, and Macao and Taiwan. Asia is the area with the largest overseas export of ChiNext com-panies in China. In 2012, 182 companies exported their products to Asia (excluding Hong Kong, Macao andTaiwan) and 62 companies exported their products to Hong Kong, and Macao and Taiwan. Moreover, underthe guidance of the ‘‘going out” strategy, ChiNext companies have actively explored markets in Europe andNorth America. The companies that export to Europe and North America have maintained increasing trends.
Table 6 presents the descriptive statistics for the sample of ChiNext companies. The mean value of RD_in-tensityt, RD_intensityt�1 and RD_intensityt-2 of the sample companies are 2.32%, 2.23% and 2.36%, respec-tively, which are higher than 2%, the basic survival line recognized by the OECD. This indicates that underthe guidance of the national strategy for building an innovative nation, great value has been attached to inde-pendent innovation by Chinese enterprises. Investment in technological innovation has also greatly increased.
Table 4Overseas income of ChiNext companies.
Industry Non-exporters Exporters Entrants Quitters Switchers
A (Agriculture, Forestry, Animal Husbandry and Fishery) 5 2 0 0 0B (Mining) 3 2 0 0 0C (Manufacturing) 22 143 62 0 2E (Construction) 0 2 1 0 0F (Transportation and Storage) 1 2 0 0 0G (Information Technology) 50 24 2 1 0H (Wholesale and Retail) 0 2 0 0 0K (Social Service) 0 8 10 0 0L (Communication and Culture) 0 5 5 0 1Total 81 190 80 1 3
Note: Switchers refer to two situations: there is no overseas income in one year, but there is overseas income before and after that year;there is overseas income in one year, but there is no overseas income before or after that year.
258 X. Xu et al. / China Journal of Accounting Research 10 (2017) 247–280

This phenomenon reflects the clear positioning of the ChiNext market, which is committed to supporting thegrowth and strength of high-tech and high-growth enterprises. The mean value of 4RD_intensity is 0.43%,representing the increase in momentum of R&D in ChiNext companies. The mean value of 4Patent is10.7624, which shows that ChiNext companies have strong capabilities for innovation. However, new patentsare distributed unevenly with a great standard deviation of 21.0348, which reflects significant differences in theinnovation capabilities of the sample companies.
In terms of internationalization, the mean value of Export_Rate is 12.72%, indicating that on average12.72% of ChiNext companies’ incomes come from overseas markets. The means of 4Export_Rate and
Table 5Export region distribution of ChiNext companies.
Year Europe Asia (except Hong Kong, Macaoand Taiwan)
NorthAmerica
SouthAmerica
Africa Oceania HongKong, Macao and Taiwanprovincea
2009 9b 17b 6 4 3 2 82010 29 170 33 14 11 6 352011 30 163 35 14 14 9 402012 43 182 46 15 10 5 62
Note: As the data disclosure of ChiNext companies in terms of their income details and regional segment reports is not clear or complete,the values in Table 5 are repeatedly calculated.a Hong Kong, Macao and Taiwan are listed individually due to the different institutions between the mainland, Hong Kong, Macao and
Taiwan. We find that the vast majority of ChiNext companies disclose information for Hong Kong, Macao and Taiwan separately.b Nine ChiNext companies had overseas income from Europe and seventeen ChiNext companies had overseas income from Asia
(excluding Hong Kong, Macao and Taiwan) in 2009. The other values in Table 5 can be deduced from this.
Table 6Descriptive statistics.
Variables N Mean Max Min Median SD
RD_intensityt 825 0.0232 0.1400 0.0000 0.0200 0.01714RD_intensity 470 0.0043 0.0698 �0.0216 0.0022 0.00874Patentst 825 10.7624 349.0000 0.0000 4.0000 21.0348Overseas_Salest 825 0.0584 0.7783 0.0000 0.0050 0.10834Overseas_Sales 470 0.0002 0.2256 �0.3015 0.0000 0.0443Export_Ratet 825 0.1272 0.9930 0.0000 0.0145 0.21354Export_Rate 470 0.0014 0.3965 �0.3964 0.0017 0.0700Overseas_Agencyt 825 0.6424 1.0000 0.0000 1.0000 0.4796Total_ Salest 825 0.4179 1.8800 0.0800 0.3801 0.21544Total_Sales 470 0.0339 0.8788 �0.3390 0.0306 0.1055Domes_Salest 825 0.3596 1.8800 0.0100 0.3300 0.21344Domes_Sales 470 0.0337 0.8788 �0.3300 0.0251 0.0995Tobin’s Qt 825 2.6290 4.6293 0.9737 1.4799 0.46594Tobin’s Q 470 0.0678 2.2879 �2.0606 0.0862 0.4469Levt 825 0.1741 0.7670 0.0110 0.1417 0.12644Lev 470 0.0783 1.3677 �0.1681 0.0406 0.1301Ceo_Gendert 825 0.9358 1.0000 0.0000 1.0000 0.2453Ceo_Aget 825 46.5467 66.0000 27.0000 47.0000 5.8692Ceo_Educationt 825 0.7648 1.0000 0.0000 1.0000 0.4244Ceo_Experiencet 825 0.1018 1.0000 0.0000 0.0000 0.3026Dualt 825 0.4836 1.0000 0.0000 0.0000 0.5000First_Staket 825 0.3380 0.6887 0.0877 0.3125 12.7597Propertyt 825 0.0400 1.0000 0.0000 0.0000 0.1961VCt 825 0.6206 1.0000 0.0000 1.0000 0.4855Aget 825 9.1952 26.0000 1.0000 9.0000 4.4421RD_intensityt�1 825 0.0223 0.2015 0.0000 0.0223 0.0244RD_intensityt�2 825 0.0236 0.1990 0.0000 0.0235 0.0295Patents_past_totalt 825 16.9285 859.0000 0.0000 6.0000 46.7520Sizet 825 2.1974 2.2824 2.1353 2.1939 0.0259
X. Xu et al. / China Journal of Accounting Research 10 (2017) 247–280 259

Tab
le7
Regressionresultsfortheinternationalizationan
dR&D
inputofChiN
extcompan
ies(Level
model).
Variables
Predictedsign
RD_intensity
RD_intensity
RD_intensity
RD_intensity
RD_intensity
RD_intensity
Fullsample
Fullsample
Compan
ieswith
non-overseasincome
Compan
ieswith
overseasincome
Fullsample
Fullsample
Model
(1)
Model
(2)
Model
(3)
Model
(4)
Model
(5)
Model
(6)
Total_Sales
+0.04
6***
0.01
4***
(3.24)
(5.22)
Overseas_Sales
+0.017*
**
0.01
7***
(3.36)
(3.33)
Domes_S
ales
+0.01
5***
0.00
5*0.02
7***
(5.28)
(1.68)
(6.72)
Exp
ort_R
ate
+0.00
1*
(1.77)
Overseas_Agency
+0.00
6***
(5.17)
Ceo_G
ender
+0.00
20.00
2�0
.002
0.00
20.00
30.00
1(0.99)
(0.74)
(�0.59
)(0.74)
(1.27)
(0.68)
Ceo_A
ge�
�1.06E
�04
�8.5E�0
5�1
.53E
�04
�5.05E
�05
�1.01E
�04
�0.15E
�05
(�1.17
)(�
0.95
)(�
0.93
)(�
0.50
)(�
1.11
)(�
0.47
)
Ceo_E
ducation
+0.00
4***
0.00
4***
0.00
40.00
6***
0.00
4***
0.00
5***
(3.56)
(3.53)
(1.46)
(4.33)
(3.41)
(3.99)
Ceo_E
xperience
+�0
.004
**
�0.003
*�0
.004
�0.004
**
�0.004
**88
�0.004
***
(�2.14
)(�
1.94
)(�
1.02
)(�
2.24
)(�
2.19
)(�
2.63
)
Dual
+/�
0.00
20.00
20.00
3*0.00
10.00
10.00
2(1.53)
(1.39)
(1.77)
(1.11)
(1.30)
(1.46)
First_S
take
+/�
�9.84E
�05*
*�1
.17E
�04*
**
�5.56E
�05
�1.83E
�04*
**
�1.07E
�04*
**
�1.00E
�04*
*
(�2.42
)(�
2.91
)(�
0.77
)(�
3.94
)(�
2.63
)(�
2.54
)
Property
+/�
0.00
6**
0.00
40.00
10.00
6**
0.00
5*0.00
4*
(2.04)
(1.53)
(0.31)
(2.05)
(1.74)
(1.87)
VC
+8.31
E�0
40.00
10.00
13.13
E�0
40.00
17.90
E�0
4(0.78)
(0.95)
(0.71)
(0.26)
(0.54)
(0.76)
Tobin’sQ
+0.00
5***
0.00
6***
0.00
8***
0.00
3**
0.00
6***
0.00
6***
(3.67)
(5.04)
(4.15)
(2.14)
(4.50)
(5.25)
Lev
��0
.005
�0.014
***
�0.008
�0.015
***
�0.006
�0.014
***
(�1.18
)(�
3.05
)(�
1.03
)(�
2.83
)(�
1.24
)(�
2.98
)
260 X. Xu et al. / China Journal of Accounting Research 10 (2017) 247–280

Size
+�5
.41E
�04
0.00
10.00
20.00
4�0
.001
0.00
1(�
0.23
)(0.41)
(0.42)
(1.41)
(�0.36
)(0.06)
Constan
t?
0.01
5�0
.006
0.00
2�0
.043
0.01
9�0
.016
(0.70)
(�0.27
)(0.05)
(�1.64
)(0.84)
(�0.36
)
Industry
Yes
Yes
Yes
Yes
Yes
Yes
Year
Yes
Yes
Yes
Yes
Yes
Yes
F-statistics
15.27*
**
15.88*
**
7.77
***
13.85*
**
14.63*
**
17.52*
**
Prob>F
0.00
000.00
000.00
000.00
000.00
000.00
00Adj.R2
0.28
480.30
240.31
680.37
060.27
560.32
48N
825
825
322
503
825
825
T-statisticsin
parentheses
arerobust.
*Statistical
sign
ificance
atthe10%
levelfortw
o-tailedtests.
**Statistical
sign
ificance
atthe5%
levelfortw
o-tailedtests.
***Statistical
sign
ificance
atthe1%
levelfortw
o-tailedtests.
X. Xu et al. / China Journal of Accounting Research 10 (2017) 247–280 261

4Overseas_Sales are 0.14% and 0.02%, respectively, showing the increase in momentum of the proportion ofoverseas incomes of ChiNext companies. In addition, the mean value of Overseas_Agency is 0.6424, whichsuggests that 64.24% of the companies have set up branches abroad.
As for the control variables, the mean value of Ceo_Gender is 0.9358, indicating that 93.58% of the samplecompanies have male CEOs. The mean value of Ceo_Education is 0.7648, implying that the vast majority ofChiNext companies’ CEOs are highly educated. The mean and median of Ceo_Experience are 0.1018 and0.0000, respectively, showing that CEOs with overseas experience are rarely seen in ChiNext companies. Only10.18% of the sample companies have CEOs with overseas experience. Moreover, the mean and median of Levare 0.1741 and 0.1417, respectively, meaning that the financial risks of ChiNext companies are generally low.The mean, median and standard deviation of First_Stake are 0.3380, 0.3125 and 12.7597, respectively. Thus,large shareholders are commonly seen in ChiNext companies and the proportions of the largest shareholdersvary drastically. The mean and median of Property are 0.0400 and 0.0000, respectively, denoting that the vastmajority of ChiNext companies are non-state-owned companies. The mean of VC is 0.6206, which suggeststhat the vast majority of ChiNext companies are associated with the equity support of venture capital.
4.2. Multivariate regression analysis
Table 7 examines the impacts of the internationalization of ChiNext companies on R&D investments.According to the regression results, the F-statistics of all of the models are significant at the 1% level, indicat-ing high-fitting precision. All of the values of adjusted R2 are greater than 27%, signifying that the explanationis reliable. With all other related factors controlled, there is a significant positive relationship between
Table 8Regression results for the internationalization and R&D input of ChiNext companies (Change model).
Variables Predictedsign
4RD_intensity 4RD_intensity 4RD_intensity 4RD_intensity 4RD_intensityFull sample Full sample Companies with non-
overseas incomeCompanies withoverseas income
Full sample
Model (1) Model (2) Model (3) Model (4) Model (5)
4Total_Sales + 0.014***
(3.75)
4Overseas_Sales + 0.022** 0.023***
(2.41) (2.74)
4Domes_Sales + 0.013*** 0.013** 0.013**
(3.21) (2.10) (2.41)
4Export_Rate + 0.001*
(1.77)
4Tobin’s Q + 0.002** 0.002** 0.003* 0.001 0.003**
(2.15) (2.11) (1.80) (0.58) (2.33)
4Lev � �0.008*** �0.008*** �0.009* �0.012*** �0.008**
(�2.58) (�2.60) (�1.87) (�2.79) (�2.09)
Constant ? 0.002 0.002 0.003 �0.004 0.001(0.57) (0.64) (0.90) (�0.44) (0.05)
Industry Yes Yes Yes Yes YesYear Yes Yes Yes Yes YesF-statistics 2.83*** 2.68*** 2.84** 2.44*** 1.85**
Prob > F 0.0006 0.0009 0.0172 0.0030 0.0402Adj. R2 0.0482 0.0478 0.0494 0.0647 0.0331N 470 470 178 292 300
T-statistics in parentheses are robust.* Statistical significance at the 10% level for two-tailed tests.
** Statistical significance at the 5% level for two-tailed tests.*** Statistical significance at the 1% level for two-tailed tests.
262 X. Xu et al. / China Journal of Accounting Research 10 (2017) 247–280

Total_Sales and RD_intensity in Model (1). The regression coefficient is 0.046, which is significant at the 1%level. This indicates that R&D intensity is stronger when the sales income of a company is higher. We conductfurther tests in Model (2), dividing the sales revenues of companies into Overseas_Sales and Domes_Sales
Table 9Two-stage regression results for the internationalization and R&D input of ChiNext companies (Foreign_ratio).
Variables Predicted sign Full sample Full sample Full sampleRD_intensity RD_intensity RD_intensity
Model (1) Model (2) Model (3)
Overseas_Sales + 0.201***
(4.67)
Domes_Sales + 0.044***
(6.06)
Export_Rate + 0.114***
(4.61)
Overseas_Agency + 0.031***
(4.61)
Ceo_Gender + �0.004* �0.003 0.001(�1.69) (�1.24) (0.62)
Ceo_Age � 2.19E�04* 3.60E�04*** 1.58E�04(1.92) (2.67) (1.49)
Ceo_Education + 0.003*** 0.002 0.007***
(2.65) (1.54) (5.13)
Ceo_Experience + �0.004** �0.008*** �0.010***
(�2.31) (�4.18) (�4.58)
Dual +/� 5.09E�04 �8.33E�04 0.002(0.46) (�0.69) (1.50)
First_Stake +/� �2.26E�04*** �2.21E�04 �2.52E�05(�4.78) (�4.67) (�0.57)
Property +/� 0.005* 0.011*** 0.009***
(1.85) (3.76) (3.20)
VC + 0.002* �0.002 �4.18E�04(1.79) (�1.39) (�0.39)
Tobin’s Q + 0.011*** 0.011*** 0.007***
(6.64) (6.47) (5.43)
Lev � �0.046*** �0.014*** �0.007(�5.27) (�2.86) (�1.50)
Size + 0.010*** 0.009*** �0.004*
(3.15) (2.83) (�1.82)
Constant ? �0.109*** �0.089*** 0.015(�3.37) (�2.78) (0.71)
Industry Yes Yes YesYear Yes Yes YesF-statistics 16.51*** 15.93*** 15.93***
Prob > F 0.0000 0.0000 0.0000Adj. R2 0.3112 0.2942 0.2942N 825 825 825
T-statistics in parentheses are robust.* Statistical significance at the 10% level for two-tailed tests.
** Statistical significance at the 5% level for two-tailed tests.*** Statistical significance at the 1% level for two-tailed tests.
X. Xu et al. / China Journal of Accounting Research 10 (2017) 247–280 263

Tab
le10
Regressionresultsfortheinternationalizationan
dpatentoutputofChiN
extcompan
ies.
Variables
Predictedsign
4Patents
4Patents
4Patents
4Patents
4Patents
Fullsample
Compan
ieswithnon-overseasincome
Compan
ieswithoverseasincome
Fullsample
Fullsample
Model
(1)
Model
(2)
Model
(3)
Model
(4)
Model
(5)
RD_intensity
+17.134
***
12.307
***
7.69
3***
16.392
***
12.967
***
(24.09)
(3.87)
(9.92)
(23.43)
(18.03
)
RD_intensity
t-1
+2.63
1***
4.67
2***
3.01
8***
2.34
1***
2.68
7***
(6.03)
(3.30)
(5.14)
(5.29)
(6.11)
RD_intensity
t-2
+3.27
7***
7.45
7***
6.68
1***
3.45
6***
3.02
3***
(6.42)
(5.44)
(10.29)
(6.72)
(5.81)
Overseas_Sales
+0.280*
**
3.56
1***
(5.03)
(15.88)
Domes_S
ales
+0.19
1***
0.58
3***
0.33
1***
(2.76)
(3.31)
(3.00)
Exp
ort_R
ate
+0.28
8***
(6.35)
Overseas_Agency
+0.72
2***
(22.99
)
Patents_p
ast_total
+0.00
4***
0.02
1***
0.00
4***
0.00
4***
0.00
3***
(36.43)
(26.61
)(29.99)
(39.12)
(35.40
)
Ceo_G
ender
+0.24
0***
1.10
3***
0.37
3***
0.21
3***
0.21
7***
(4.51)
(5.32)
(5.25)
(4.01)
(4.07)
Ceo_A
ge�
�0.015
***
0.01
9***
0.01
8***
0.01
4***
0.01
1***
(7.20)
(3.38)
(6.57)
(6.73)
(5.08)
Ceo_E
ducation
+0.11
0***
0.05
90.18
9***
0.10
8***
0.17
5***
(3.88)
(0.73)
(4.96)
(3.81)
(6.17)
Ceo_E
xperience
+0.02
70.58
5***
0.14
0***
0.02
50.13
9***
(0.70)
(6.92)
(2.87)
(0.65)
(3.53)
Dual
+/�
�0.004
0.28
2***
�0.154
***
�0.009
0.01
8(�
0.16
)(4.45)
(�4.71
)(�
0.38
)(0.73)
Age
��0
.014
***
�0.058
***
�0.012
***
�0.013
***
0.01
2***
(�5.15
)(�
7.97
)(�
3.30
)(�
4.72
)(4.63)
First_S
take
+/�
0.00
9***
0.00
30.00
6***
0.00
8***
0.00
9***
(9.82)
(1.33)
(5.04)
(9.60)
(9.96)
264 X. Xu et al. / China Journal of Accounting Research 10 (2017) 247–280

Property
+/�
0.18
8***
0.33
3**
0.70
1***
0.19
8***
0.27
1***
(4.03)
(2.50)
(12.83)
(4.24)
(5.79)
VC
+0.35
1***
0.33
3***
0.50
8***
0.35
2***
0.32
8***
(13.99
)(5.27)
(14.96)
(14.08)
(13.15)
Size
+10
.816
***
7.49
6***
8.14
2***
11.196
***
10.474
***
(24.86
)(5.88)
(12.86)
(25.80)
(24.31)
Lev
�0.18
0*1.39
9***
�1.083
***
0.02
4�0
.025
(1.82)
(6.00)
(�7.17
)(0.26)
(�0.26
)
Constan
t?
�24.247*
**
�17.077*
**
�16.495*
**
�25.083*
**
�24.073*
**
(�25
.24)
(�6.09
)(�
11.46)
(�26
.21)
(�25
.28)
Industry
Yes
Yes
Yes
Yes
Yes
Year
Yes
Yes
Yes
Yes
Yes
LR
v2
5,00
3.97
***
1,41
6.41
***
2,90
0.44
***
5,03
5.52
***
5,58
6.99
***
Prob>v2
0.00
000.00
000.00
000.00
000.00
00PseudoR2
0.26
300.36
180.23
720.26
470.29
37N
825
322
503
825
825
Weuse
thePoissonmodel.
T-statisticsin
parentheses
arerobust.
*Statistical
sign
ificance
atthe10
%levelfortw
o-tailedtests.
**Statistical
sign
ificance
atthe5%
levelfortw
o-tailedtests.
***Statistical
sign
ificance
atthe1%
levelfortw
o-tailedtests.
X. Xu et al. / China Journal of Accounting Research 10 (2017) 247–280 265

Tab
le11
Regressionresultsfortheinternationalizationan
dpatentoutputofChiN
extcompan
ies(robustnesstests).
Variables
Predictedsign
Ln(4
Patents+1)
Ln(4
Patents+1)
Ln(4
Patents+1)
Ln(4
Patents+1)
Ln(4
Patents+
1)Fullsample
Compan
ieswithnon-overseasincome
Compan
ieswithoverseasincome
Fullsample
Fullsample
Model
(1)
Model
(2)
Model
(3)
Model
(4)
Model
(5)
RD_intensity
+12.900
***
4.16
2*3.70
8***
11.934
***
8.09
2***
(4.27)
(1.81)
(3.14)
(4.05)
(2.79)
RD_intensity
t-1
+2.29
52.41
13.37
72.50
32.25
9(1.09)
(0.92)
(1.16)
(1.19)
(1.11)
RD_intensity
t-2
+2.25
90.21
63.08
12.11
02.21
3(1.22)
(0.08)
(1.30)
(1.14)
(1.23)
Overseas_Sales
+0.234*
0.70
2*
(1.83)
(1.71)
Domes_S
ales
+0.40
5*0.79
9***
0.02
9*
(1.70)
(2.87)
(1.82)
Exp
ort_R
ate
+0.43
7**
(2.19)
Overseas_Agency
+0.67
9***
(7.58)
Patents_p
ast_total
+0.00
8***
0.02
7***
0.00
6***
0.00
8***
0.00
7***
(9.33)
(8.67)
(6.82)
(9.39)
(8.83)
Ceo_G
ender
+0.22
60.43
9*0.05
10.19
10.19
8(1.33)
(1.78)
(0.24)
(1.33)
(1.21)
Ceo_A
ge�
�0.002
�0.005
0.00
1�0
.001
0.00
2(�
0.30
)(�
0.44
)(0.07)
(�0.16
)(0.30)
Ceo_E
ducation
+0.15
70.05
80.25
5**
0.15
90.23
2**
(1.57)
(0.37)
(2.07)
(1.59)
(2.39)
Ceo_E
xperience
+�0
.118
0.06
70.37
6**
�0.118
0.25
2*
(�0.85
)(0.31)
(2.26)
(�0.86
)(1.87)
Dual
+/�
0.06
20.19
90.06
70.06
10.08
8(0.71)
(1.58)
(0.60)
(0.69)
(1.04)
Age
��0
.004
�0.058
***
0.00
1�0
.004
�0.005
(�0.41
)(�
7.97
)(0.09)
(�0.40
)(�
0.58
)
First_S
take
+/�
0.32
90.19
70.84
7**
0.30
60.42
8(1.01)
(1.59)
(2.00)
(0.94)
(1.36)
266 X. Xu et al. / China Journal of Accounting Research 10 (2017) 247–280

Property
+/�
0.35
20.48
00.54
6*0.35
40.45
7**
(1.62)
(1.60)
(1.91)
(1.63)
(2.17)
VC
+0.15
4*0.08
10.15
00.15
6*0.14
2*
(1.80)
(0.66)
(1.37)
(1.83)
(1.72)
Size
+4.17
3**
3.83
73.82
9*4.72
8***
3.73
2**
(2.47)
(1.54)
(1.71)
(2.82)
(2.31)
Lev
�0.36
21.26
8**
�0.062
0.17
70.16
1(0.96)
(2.46)
(�0.13
)(0.50)
(0.47)
Constan
t?
�8.690
**
�7.357
�8.514
*�1
0.130*
**
�8.527
**
(�2.31
)(�
1.34
)(�
1.70
)(�
2.73
)(�
2.38
)
Industry
Yes
Yes
Yes
Yes
Yes
Year
Yes
Yes
Yes
Yes
Yes
F-statistics
9.63
***
6.62
***
5.46
***
10.02*
**
12.57*
**
Prob>F
0.00
000.00
000.00
000.00
000.00
00Adj.R2
0.23
850.32
920.20
360.24
020.28
84N
825
322
503
825
825
Weuse
theOLSmodel.
T-statisticsin
parentheses
arerobust.
*Statistical
sign
ificance
atthe10%
levelfortw
o-tailedtests.
**Statistical
sign
ificance
atthe5%
levelfortw
o-tailedtests.
***Statistical
sign
ificance
atthe1%
levelfortw
o-tailedtests.
X. Xu et al. / China Journal of Accounting Research 10 (2017) 247–280 267

according to the source of sales revenue. A significant positive relationship is discovered between Overseas_-Sales, Domes_Sales and RD_intensity. The regression coefficients are 0.017 and 0.015, respectively, which aresignificant at the 1% level. This shows that more overseas and domestic incomes lead to stronger R&D inten-sity. Furthermore, overseas income, which measures a company’s degree of internationalization, contributesmore to R&D investments than domestic income (0.017 > 0.015). The results demonstrate that an internation-alization strategy has a significant incentive effect on R&D inputs. The entrepreneurial companies with higherdegrees of internationalization have higher R&D inputs.
To obtain robust results, we conduct further tests grouped by the existence of overseas income. One groupconsists of ChiNext companies without internationalization, which means that all of their revenues are domes-tic. The other group is made up of ChiNext companies that have overseas revenues. The results are displayedin Models (3) and (4). Overseas_Sales is significantly positively related to RD_intensity in Model (4). Theregression coefficient is 0.017, which is significant at the 1% level. Thus, an internationalization strategy hasa significant incentive effect on R&D input. The entrepreneurial companies with higher degrees of internation-alization have higher R&D inputs.
Using Export_Rate and Overseas_Agency as proxy variables of internationalization, further tests are con-ducted in Models (5) and (6). Export_Rate is significantly positively related to RD_intensity in Model (5). Theregression coefficient is 0.001, which is significant at the 10% level. This illustrates that companies with higherdegrees of internationalization have higher R&D inputs. Additionally, Overseas_Agency is significantly pos-itively related to RD_intensity in Model (6). The regression coefficient is 0.006, which is significant at the 1%level. This implies that setting up branches overseas has a significant positive effect on domestic R&D. Overall,these results provide support for Hypothesis 1. An internationalization strategy has a significant incentiveeffect on R&D input. The entrepreneurial companies with higher degrees of internationalization have higherR&D inputs.
In terms of the control variables, Tobin’s Q is significantly positively related to RD_intensity. This showsthat better investment opportunities increase R&D intensity investments.
To obtain more robust results, the Change model is used to further investigate the impacts of ChiNext com-panies’ internationalization on R&D. The results are shown in Table 8. A significant positive relationshipbetween 4Total_Sales and 4RD_intensity is shown in Model (1). The regression coefficient is 0.014, whichis significant at the 1% level. This shows that changes in sales revenues cause changes in R&D investmentsin the same direction. 4Overseas_Sales and 4Domes_Sales are significantly positively related to 4RD_inten-sity in Model (2). The regression coefficients are 0.022 and 0.013, respectively, which are significant at the 5%and 1% levels, respectively. This shows that greater changes in overseas and domestic income lead to greaterchanges in R&D intensity. Furthermore, overseas income, which measures a company’s degree of internation-alization, contributes more to changes in R&D investments than domestic income (0.022 > 0.013). This sup-ports the conclusion that an internationalization strategy has an incentive effect on R&D. Changes in thedegree of internationalization beget changes in RD_intensity in the same direction.
To make our test results more robust, we conduct further tests grouped by the existence of overseas income.One group consists of ChiNext companies without internationalization, which means that all of their revenues
Table 12Univariate analysis of the influence of internationalization on R&D input and patent output (exporters vs. non-exporters).
Variable Mean (N) Mean difference test Median (N) Median difference test
Exporters Non-exporters Exporters Non-exporters
RD_intensity 0.0326 (190) 0.0237 (81) 1.6792* 0.0198 (190) 0.0121 (81) 3.573***
Variable Mean (N) Mean difference test Median (N) Median difference test
Exporters Non-exporters Exporters Non-exporters4Patents 14.2017 (190) 4.71080 (81) 6.1218 *** 7.0000 (190) 1.0000 (81) 10.616****
**Statistical significance at the 5% level for two-tailed tests.* Statistical significance at the 10% level for two-tailed tests.
*** Statistical significance at the 1% level for two-tailed tests.
268 X. Xu et al. / China Journal of Accounting Research 10 (2017) 247–280

continued
onnextpage
Tab
le13
Regressionresultsfortheinternationalizationan
dR&D
inputofChiN
extcompan
ies(subsample
test
bystrategicem
ergingindustries).
Variables
Strategic
emerging
industries
Non-strategic
emergingindustries
Strategic
emerging
industries
Non-strategic
emergingindustries
Strategic
emerging
industries
Non-strategic
emergingindustries
Strategic
emerging
industries
Non-strategic
emergingindustries
RD_intensity
RD_intensity
RD_intensity
RD_intensity
RD_intensity
RD_intensity
RD_intensity
RD_intensity
Fullsample
Fullsample
Fullsample
Fullsample
Fullsample
Fullsample
Compan
ieswith
overseasincome
Compan
ieswith
overseasincome
Model
(1)
Model
(2)
Model
(3)
Model
(4)
Model
(5)
Model
(6)
Model
(7)
Model
(8)
Overseas_Sales
0.023*
**
0.00
70.01
7**
0.01
1(4.03)
(0.68)
(2.57)
(1.30)
Domes_S
ales
0.02
4***
0.00
9*0.02
4***
0.03
1***
(6.36)
(1.88)
(4.39)
(5.14)
Exp
ort_R
ate
0.00
4**
�0.006
(2.25)
(�1.16
)
Overseas_Agency
0.00
5***
0.01
3***
(3.48)
(5.57)
Total_Sales
0.00
20.00
9**
(0.57)
(2.15)
Ceo_G
ender
�0.004
0.00
8**
�0.003
0.01
0**
�0.003
0.01
0***
�0.002
0.00
8**
(�1.57
)(2.16)
(�1.25
)(2.47)
(�1.35
)(2.61)
(�0.68
)(2.39)
Ceo_A
ge�1
.63E
�04
�7.56E
�05
�1.43E
�04
�1.12E
�04
�1.20E
�04
�5.49E
�05
�1.80E
�04
2.66
E�0
4*
(�1.58
)(�
0.45
)(�
1.33
)(�
0.66
)(�
1.13
)(�
0.34
)(�
1.30
)(1.80)
Ceo_E
ducation
0.00
4***
0.00
40.00
3**
0.00
40.00
40.00
4*0.00
7***
0.00
4*
(2.89)
(1.45)
(2.53)
(1.62)
(2.88)
(1.66)
(3.98)
(1.83)
Ceo_E
xperience
�0.004
**
0.00
1�0
.004
*0.00
1�0
.005
**
�0.001
�0.006
**
0.00
2(�
1.97
)(0.35)
(�1.95
)(0.31)
(�2.38
)(�
0.37
)(�
2.41
)(0.55)
Dual
0.00
3**
�6.23E
�04
0.00
2**
�4.69E
�04
0.00
3**
4.24
E�0
40.00
4***
�0.005
**
(2.31)
(�0.27
)(2.03)
(�0.21
)(2.06)
(0.19)
(2.81)
(�2.39
)
First_S
take
�1.75E
�04*
**
�1.11E
�04
�1.61E
�04
�1.08E
�04
�1.51E
�04*
**
�2.16E
�05
�2.49E
�04*
**
�1.18E
�04
(�3.94
)(�
1.35
)(�
3.49
)(�
1.30
)(�
3.32
)(�
0.27
)(�
4.21
)(�
1.62
)
Property
�8.57E
�05
0.00
9*�6
.08E
�04
0.00
9*�7
.05E
�04
0.01
4***
0.00
20.01
2***
(�0.03
)(1.84)
(�0.18
)(1.87)
(�0.21
)(3.07)
(0.36)
(2.65)
VC
�2.51E
�04
0.00
3�0
.001
0.00
2�0
.002
0.00
2�6
.98E
�04
0.00
3*
(�0.21
)(1.15)
(�1.09
)(1.05)
(�1.27
)(1.10)
(�0.45
)(1.68)
X. Xu et al. / China Journal of Accounting Research 10 (2017) 247–280 269

Tobin’sQ
0.00
5***
0.00
8***
0.00
5***
0.00
7***
0.00
5***
0.00
6***
0.00
4**
0.00
5*
(3.31)
(3.50)
(3.48)
(3.12)
(3.63)
(3.00)
(2.21)
(1.68)
Lev
�0.017
***
�0.006
�0.006
�0.001
�0.006
�2.65E
�04
�0.009
�0.026
***
(�3.31
)(�
0.65
)(�
1.15
)(�
0.07
)(�
1.24
)(�
0.03
)(�
1.24
)(�
2.84
)
Size
0.00
5**
�0.007
0.00
3�0
.008
*0.00
3�0
.009
**
0.00
50.00
4(2.01)
(�1.41
)(1.32)
(�1.73
)(1.07)
(�1.97
)(1.40)
(0.83)
Constan
t�0
.008
0.05
90.01
20.07
9*0.01
50.07
3*1.21
E�0
4�0
.069
(�0.36
)(1.26)
(0.50)
(1.72)
(0.61)
(1.68)
(0.01)
(�1.38
)
Industry
Yes
Yes
Yes
Yes
Yes
Yes
Yes
Yes
Year
Yes
Yes
Yes
Yes
Yes
Yes
Yes
Yes
F-statistics
17.36*
**
6.19
***
14.58*
**
6.33
***
14.92*
**
8.00
***
13.19*
**
6.35
***
Prob>F
0.00
000.00
000.00
000.00
000.00
000.00
000.00
000.00
00Adj.R2
0.34
030.30
500.28
740.30
160.30
510.37
160.39
010.41
01N
540
285
540
285
540
285
325
178
T-statisticsin
parentheses
arerobust.
*Statistical
sign
ificance
atthe10
%levelfortw
o-tailedtests.
**Statistical
sign
ificance
atthe5%
levelfortw
o-tailedtests.
***Statistical
sign
ificance
atthe1%
levelfortw
o-tailedtests.
Table
13(continued)
270 X. Xu et al. / China Journal of Accounting Research 10 (2017) 247–280

Tab
le14
Regressionresultsfortheinternationalizationan
dR&D
inputofChiN
extcompan
ies(C
han
gemodel,subsample
test
bystrategicem
ergingindustries).
Variables
Strategic
emerging
industries
Non-strategic
emergingindustries
Strategic
emerging
industries
Non-strategic
emergingindustries
Strategic
emerging
industries
Non-strategic
emergingindustries
Strategic
emerging
industries
Fullsample
Fullsample
Fullsample
Fullsample
Compan
ieswith
overseasincome
Compan
ieswith
overseasincome
Compan
ieswithnon-
overseasincome
4RD_intensity
4RD_intensity
4RD_intensity
4RD_intensity
4RD_intensity
4RD_intensity
4RD_intensity
Model
(1)
Model
(2)
Model
(3)
Model
(4)
Model
(5)
Model
(6)
Model
(7)
4Overseas_Sales
0.03
0***
0.00
80.02
2**
0.01
0(3.11)
(0.41)
(1.97)
(0.75)
4Domes_S
ales
0.02
2***
0.00
40.01
00.01
7**
0.01
1*
(4.02)
(0.59)
(1.22)
(2.47)
(1.84)
4Exp
ort_R
ate
0.00
5**
�0.006
(2.46)
(�0.49
)
4Tobin’sQ
0.00
10.00
3*0.00
6**
0.00
3*0.00
10.00
10.00
1***
(0.45)
(1.97)
(2.45)
(1.85)
(0.01)
(0.88)
(2.97)
4Lev
�0.009
**
�0.007
�0.005
�0.008
**
�0.010
**
�0.010
*�0
.017
***
(�2.11
)(�
1.45
)(�
0.85
)(�
2.14
)(�
2.16
)(�
1.93
)(�
4.46
)
Constan
t0.00
20.00
2�0
.006
0.00
30.00
1�0
.003
0.00
3(0.56)
(0.47)
(�1.45
)(0.49)
(0.07)
(�0.79
)(0.90)
Industry
Yes
Yes
Yes
Yes
Yes
Yes
Yes
Year
Yes
Yes
Yes
Yes
Yes
Yes
Yes
F-statistics
2.61
***
1.87
**
1.94
**
2.07
**
2.63
**
2.84
***
2.42
***
Prob>F
0.00
190.03
780.03
720.02
550.01
80.00
250.01
00Adj.R2
0.06
340.06
70.05
210.10
480.04
870.18
230.11
67N
311
159
189
111
192
100
119
T-statisticsin
parentheses
arerobust.
*Statistical
sign
ificance
atthe10
%levelfortw
o-tailedtests.
**Statistical
sign
ificance
atthe5%
levelfortw
o-tailedtests.
***Statistical
sign
ificance
atthe1%
levelfortw
o-tailedtests.
X. Xu et al. / China Journal of Accounting Research 10 (2017) 247–280 271

Tab
le15
Regressionresultsfortheinternationalizationan
dpatentoutputofChiN
extcompan
ies(subsample
test
bystrategicem
ergingindustries).
Variables
Strategic
emergingindustries
Non-strategic
emergingindustries
Strategic
emergingindustries
Fullsample
Fullsample
Compan
ieswith
overseasincome
Compan
ieswith
non-overseasincome
4Patents
4Patents
4Patents
4Patents
4Patents
4Patents
4Patents
4Patents
Model
(1)
Model
(2)
Model
(3)
Model
(4)
Model
(5)
Model
(6)
Model
(7)
Model
(8)
RD_intensity
16.289
***
15.143
***
8.87
7***
19.169
***
17.996
***
14.713
***
18.043
***
18.564
***
(18.71
)(18.32
)(14.64)
(12.30)
(11.76)
(6.44)
(14.37)
(7.40)
RD_intensity
t-1
4.14
7***
4.42
0***
4.68
7***
3.75
2***
4.25
2**
3.66
2***
2.01
2*6.78
3***
(5.12)
(5.45)
(5.68)
(4.64)
(5.24)
(4.48)
(1.98)
(4.49)
RD_intensity
t-2
4.91
4***
4.96
7***
5.16
1***
�0.097
�0.318
�0.244
5.96
7***
2.88
8*
(6.92)
(6.96)
(7.24)
(�0.15
)(�
0.50
)(�
0.39
)(7.20)
(1.78)
Overseas_Sales
0.756*
**
0.21
2*1.03
7***
(5.45)
(1.86)
(6.54)
Domes_S
ales
0.26
0***
0.57
1***
0.10
1*1.16
7***
(2.88)
(4.12)
(1.81)
(5.70)
Exp
ort_R
ate
0.18
2***
0.52
1***
(2.89)
(5.38)
Overseas_Agency
0.506*
**
1.06
2***
(14.45)
(13.54
)
Patents_p
ast_total
0.00
3***
0.00
3***
0.00
3***
0.02
2***
0.02
2***
0.02
1***
0.00
3***
0.01
7***
(28.08
)(28.42
)(26.15)
(37.45)
(37.45)
(34.38
)(23.30)
(20.68
)
Ceo_G
ender
0.11
7*0.11
3*0.07
20.15
30.08
60.18
1*0.06
00.32
2*
(1.82)
(1.76)
(1.12)
(1.49)
(0.84)
(1.77)
(0.87)
(1.78)
Ceo_A
ge�0
.023
***
�0.022
***
�0.017
***
0.00
8**
0.00
7**
0.01
0***
�0.017
***
�0.054
***
(�8.77
)(�
8.63
)(�
6.59
)(2.14)
(2.03)
(2.79)
(�5.43
)(�
9.59
)
Ceo_E
ducation
0.08
5***
0.09
6***
0.14
4***
0.24
6***
0.23
6***
0.32
0***
�0.027
0.34
2***
(2.56)
(2.92)
(4.36)
(4.25)
(4.08)
(5.69)
(�0.74
)(3.67)
Ceo_E
xperience
�0.062
�0.060
�0.117
**
0.10
70.09
2�0
.083
�0.355
***
0.44
7***
(�1.29
)(�
1.25
)(�
2.42
)(1.33)
(1.14)
(�1.01
)(�
6.05
)(5.07)
Dual
0.13
8***
0.13
7***
0.15
1***
�0.268
***
�0.253
***
�0.195
***
�0.040
0.58
1***
(4.61)
(4.61)
(5.08)
(�5.57
)(�
5.29
)(�
4.06
)(�
1.11
)(8.98)
First_S
take
1.034*
**
0.96
0***
0.95
3***
0.24
80.06
50.16
80.70
8***
0.27
7(9.61)
(9.07)
(8.91)
(1.39)
(0.38)
(0.97)
(13.28)
(1.12)
Property
0.47
5***
0.47
9***
0.45
4***
�0.725
***
�0.632
***
�0.466
***
0.48
7***
0.25
0(7.06)
(7.12)
(6.71)
(�8.49
)(�
7.63
)(�
5.45
)(6.44)
(1.32)
272 X. Xu et al. / China Journal of Accounting Research 10 (2017) 247–280

VC
0.34
4***
0.36
0***
0.31
9***
0.08
8*0.08
1*0.13
1***
0.29
7***
0.43
4***
(11.10
)(11.66
)(10.41)
(1.85)
(1.70)
(2.70)
(8.26)
(6.45)
Tobin’sQ
0.22
4***
0.21
8***
0.16
0***
0.19
0***
0.22
9***
0.29
8***
0.26
9***
0.07
9(5.66)
(5.52)
(4.07)
(3.14)
(4.12)
(5.13)
(5.55)
(1.00)
Lev
�0.290
**
0.16
10.07
2�0
.312
�0.692
***
�0.958
***
�0.955
***
�2.499
***
(�2.49
)(1.43)
(0.63)
(�1.43
)(�
3.69
)(�
5.05
)(�
6.37
)(�
10.99)
Size
12.249
***
12.421
***
11.940
***
4.42
8***
5.60
5***
5.38
0***
12.998
***
7.14
5***
(23.89
)(24.32
)(23.50)
(4.90)
(6.12)
(5.89)
(21.75)
(5.64)
Constan
t�2
4.813*
**
�25.28
8***
�24.662*
**
�9.314
***
�11.906*
**
�12.87
9***
�26.568*
**
�14.14
8***
(�21
.91)
(�22
.46)
(�22
.05)
(�4.71
)(�
5.94
)(�
6.35
)(�
20.20)
(�5.08
)
Industry
Yes
Yes
Yes
Yes
Yes
Yes
Yes
Yes
Year
Yes
Yes
Yes
Yes
Yes
Yes
Yes
Yes
LR
v23,19
2.39
***
3,16
9.24
***
3,38
5.06
***
2,91
6.10
***
2,92
2.18
***
3,10
3.89
***
2,15
2.64
***
1,41
5.67
***
Prob>v2
0.00
000.00
000.00
000.00
000.00
000.00
000.00
000.00
00PseudoR2
0.25
000.24
820.26
510.50
180.50
280.53
410.25
680.37
66N
540
540
540
285
285
285
325
215
Weuse
thePoissonmodel.
T-statisticsin
parentheses
arerobust.
*Statistical
sign
ificance
atthe10%
levelfortw
o-tailedtests.
**Statistical
sign
ificance
atthe5%
levelfortw
o-tailedtests.
***Statistical
sign
ificance
atthe1%
levelfortw
o-tailedtests.
X. Xu et al. / China Journal of Accounting Research 10 (2017) 247–280 273

Tab
le16
Regressionresultsfortheinternationalizationan
dpatentoutputofChiN
extcompan
ies(subsample
test
bystrategicem
ergingindustries,robustnesstests).
Variables
Strategic
emergingindustries
Non-strategic
emergingindustries
Strategic
emergingindustries
Fullsample
Fullsample
Compan
ies
withoverseas
income
Compan
ies
withnon-overseas
income
Ln(4
Patents+1)
Ln(4
Patents+1)
Ln(4
Patents+
1)Ln(4
Patents+1)
Ln(4
Patents+
1)Ln(4
Patents+1)
Ln(4
Patents+
1)Ln(4
Patents+1)
Model
(1)
Model
(2)
Model
(3)
Model
(4)
Model
(5)
Model
(6)
Model
(7)
Model
(8)
RD_intensity
10.264
**
9.38
3**
5.74
6*12
.878
***
12.643
***
8.98
3**
6.69
7*6.83
3*
(2.47)
(2.35)
(1.84)
(3.24)
(3.26)
(2.26)
(1.82)
(1.76)
RD_intensity
t-1
3.31
13.35
63.46
73.03
03.53
62.64
74.11
03.37
6(1.15)
(1.17)
(1.24)
(1.14)
(1.34)
(1.02)
(1.04)
(0.89)
RD_intensity
t-2
4.61
3*4.58
4*4.82
1*1.24
71.75
21.19
45.51
20.86
9(1.81)
(1.80)
(1.95)
(0.53)
(0.75)
(0.52)
(1.65)
(0.23)
Overseas_Sales
0.10
4*0.73
8*0.73
4*
(1.72)
(1.80)
(1.87)
Domes_S
ales
0.24
6*0.35
7*0.38
4*0.98
4**
(1.82)
(1.81)
(1.77)
(2.08)
Exp
ort_R
ate
0.11
1*0.78
2***
(1.75)
(2.66)
Overseas_Agency
0.596*
**
0.53
3***
(5.50)
(3.50)
Patents_p
ast_total
0.00
6***
0.00
6***
0.00
6***
0.03
0***
0.03
0***
0.02
9***
0.00
5***
0.02
4***
(6.93)
(6.97)
(6.50)
(10.96)
(10.99)
(10.50)
(5.36)
(6.24)
Ceo_G
ender
0.02
90.01
4�0
.041
0.27
50.22
20.27
3�0
.162
0.30
8(0.13)
(0.06)
(�0.19
)(1.20)
(0.99)
(1.23)
(�0.57
)(0.90)
Ceo_A
ge�0
.008
�0.008
�0.005
0.01
10.01
40.01
30.00
4�0
.020
(�0.87
)(�
0.87
)(�
0.56
)(1.12)
(1.37)
(1.34)
(0.28)
(�1.55
)
Ceo_E
ducation
0.27
7**
0.28
3**
0.35
3***
0.04
80.02
10.07
80.32
5**
0.29
2(2.28)
(2.34)
(2.98)
(0.31)
(0.14)
(0.52)
(2.12)
(1.48)
Ceo_E
xperience
�0.308
*�0
.310
*�0
.434
**
0.10
70.09
80.07
5�0
.468
**
�0.051
(�1.76
)(�
1.77
)(�
2.53
)(0.53)
(0.49)
(0.38)
(�2.12
)(�
0.19
)
Dual
0.12
30.12
70.15
1�0
.018
�0.036
0.02
40.08
30.22
8(1.12)
(1.16)
(1.42)
(�0.14
)(�
0.27
)(0.18)
(0.58)
(1.38)
First_S
take
0.51
80.48
40.47
2�0
.090
�0.060
0.13
71.20
9**
0.02
9(1.24)
(1.16)
(1.17)
(�0.19
)(�
0.13
)(0.29)
(2.18)
(0.05)
274 X. Xu et al. / China Journal of Accounting Research 10 (2017) 247–280

Property
0.96
1***
0.97
0***
0.97
4***
�0.522
*�0
.496
*�0
.308
0.96
1**
0.84
0*
(3.19)
(3.22)
(3.33)
(�1.84
)(�
1.76
)(�
1.08
)(2.46)
(1.85)
VC
0.19
4*0.19
9*0.15
90.05
00.05
80.07
00.20
00.07
6(1.81)
(1.86)
(1.53)
(0.38)
(0.45)
(0.55)
(1.43)
(0.48)
Tobin’sQ
0.24
7*0.24
3*0.19
00.12
80.16
40.14
0�0
.163
0.25
0(1.84)
(1.81)
(1.46)
(0.93)
(1.23)
(1.07)
(�0.89
)(1.34)
Lev
0.13
00.01
3�0
.055
0.07
5�0
.068
�0.017
0.01
70.52
6(0.27)
(0.03)
(�0.13
)(0.13)
(�0.13
)(�
0.03
)(0.03)
(0.76)
Size
6.01
2***
6.25
4***
5.84
8***
2.68
73.56
21.97
85.32
3**
4.08
4(2.84)
(2.97)
(2.87)
(1.03)
(1.37)
(0.77)
(2.01)
(1.24)
Constan
t�1
2.170*
**
�12.743*
**
�12.023*
**
�5.406
�7.518
�4.709
�10.948*
�7.340
(�2.61
)(�
2.75
)(�
2.69
)(�
0.94
)(�
1.32
)(�
0.84
)(�
1.87
)(�
1.01
)
Industry
Yes
Yes
Yes
Yes
Yes
Yes
Yes
Yes
Year
Yes
Yes
Yes
Yes
Yes
Yes
Yes
Yes
F-statistics
7.15
***
7.50
***
9.45
***
10.95*
**
11.67*
**
12.10*
**
3.82
***
5.08
***
Prob>F
0.00
000.00
000.00
000.00
000.00
000.00
000.00
000.00
00Adj.R2
0.19
830.19
940.24
460.50
220.51
080.52
050.15
860.28
27N
540
540
540
285
285
285
325
215
Weuse
theOLSmodel.
T-statisticsin
parentheses
arerobust.
*Statistical
sign
ificance
atthe10
%levelfortw
o-tailedtests.
**Statistical
sign
ificance
atthe5%
levelfortw
o-tailedtests.
***Statistical
sign
ificance
atthe1%
levelfortw
o-tailedtests.
X. Xu et al. / China Journal of Accounting Research 10 (2017) 247–280 275

are domestic. The other group consists of ChiNext companies that have overseas revenues. The results are dis-played in Models (3) and (4). 4Overseas_Sales and 4Domes_Sales are significantly positively related to4RD_intensity in Model (4). The regression coefficients are 0.023 and 0.013, respectively, which are signifi-cant at the 1% and 5% levels, respectively. Thus, an internationalization strategy has a significant incentiveeffect on R&D input for internationalized ChiNext companies. Overseas income, which measures a company’sdegree of internationalization, contributes more to changes in R&D investments than domestic income(0.023 > 0.013).
4Export_Rate is significantly positively related to 4RD_intensity in Model (5). The regression coefficientis 0.001, which is significant at the 10% level. This indicates that a higher 4Export_Rate, which measures thedegree of internationalization, strengthens RD_intensity. The empirical evidence reported in Table 8 thus sup-ports Hypothesis 1. An internationalization strategy has an incentive effect on R&D. In addition, the controlvariables in the model are consistent with the previous regression results.
Based on previous studies (Lileeva and Trefler, 2010; Bustos, 2011; Bratti and Felice, 2012), we use TSLS totest the effects of internationalization on independent innovation while considering the endogeneity of inter-nationalization. The corresponding results are shown in Table 9.
As shown in Table 9, an internationalization strategy still has an incentive effect on R&D input after con-trolling for endogeneity. Companies with higher degrees of internationalization have higher R&D inputs. Theempirical evidence reported in Table 9 provides additional support for Hypothesis 1.
To completely investigate the influence of an internationalization strategy on entrepreneurial companies’independent innovation, an empirical analysis of the influences of internationalization on the efficiency ofpatent output is displayed in the remaining part. In light of the related literature (Pakes and Griliches,1980; Hausman et al., 1984), we adopt the Poisson model to explore the relationship between international-ization, R&D input and patent output. The results are shown in Table 10.
According to Models (1) to (5) in Table 10, when other variables such as RD_intensityt�1 and RD_inten-sityt�2 are controlled, RD_intensity, Patents_past_total and 4Patents are significantly positively related. Thecorresponding regression coefficients are significant at the 1% level. This shows that companies with higherR&D inputs and more knowledge stock have more patent outputs.
In Models (1), (3), (4) and (5), the proxy variables of internationalization strategy, such as Overseas_Sales,Export_Rate and Overseas_Agency, are significantly positively related to 4Patents. The correspondingregression coefficients are 0.280, 3.561, 0.288 and 0.722, respectively, which are all significant at the 1% level.Thus, internationalization can significantly increase entrepreneurial companies’ patent outputs. Moreover,Overseas_Sales has greater effects on patent output than Domes_Sales in Model (3) (3.561 > 0.331). Therefore,an internationalization strategy can improve the efficiency of patent output. The empirical evidence reportedin Table 10 thus supports Hypothesis 2.
In Table 11, the ordinary least squares (OLS) model is adopted to replace the Poisson model for furtherrobustness testing. Models (1), (3), (4) and (5) show that when other variables such as RD_intensityt�1 andRD_intensityt�2 are controlled, proxy variables of internationalization strategy such as Overseas_Sales,Export_Rate and Overseas_Agency are significantly positively related to 4Patents. The corresponding regres-sion coefficients are 0.234, 0.702, 0.437 and 0.679, respectively, which are significant. This shows that interna-tionalization can significantly increase the number of entrepreneurial companies’ patent outputs. In Model (3),Overseas_Sales has a greater effect on patent output (0.702 > 0.029) than Domes_Sales. This result is essen-tially the same as that in Table 10, further demonstrating that our results are robust. The internationalizationstrategies of companies have obvious efficiency improvement effects on patent output. The higher the degree ofinternationalization, the higher companies’ patent outputs. This further supports Hypothesis 2.
To make the results more robust, the differences between export and non-export companies in R&D inputsand patent outputs are compared. The results are shown in Table 12.
Table 12 shows that export companies have higher R&D intensities and more patent outputs than non-export companies regardless of the mean and median. An internationalization strategy has an incentive effecton R&D and R&D output. Thus, Hypotheses 1 and 2 are supported.
276 X. Xu et al. / China Journal of Accounting Research 10 (2017) 247–280

5. Influence of internationalization on strategic emerging industries: An expanding analysis
Decision of the State Council on Accelerating the Fostering and Development of Strategic Emerging Industries
(2010, No. 32), promulgated by the State Council in October 2010, determines the focus on the development ofenergy saving, new generation of IT and seven other strategic emerging industries, requiring the relevantdepartments to promptly formulate plans and implement specific supporting measures. Moreover, GuidingOpinions on Promoting the Internationalization of Strategic Emerging Industries (2011, No. 310), jointly pro-mulgated by the Ministry of Commerce, the National Development and Reform Committee and nine otherministries and commissions in September 2011, explicitly state that global innovation resources are to be usedto enhance the ability of industrial innovation. To this end, the ChiNext market attaches more importance tothe development of strategic emerging industries. We believe that the ChiNext market is perfect for research-ing the impacts of internationalization strategy on R&D in strategic emerging industries, as a large sum ofhigh-quality companies in strategic emerging industries are listed in the ChiNext market.
Conforming with the Strategic Emerging Industry Classification (2012) (Trial) compiled by the NationalStatistics Bureau in December 2012, the samples are subdivided into strategic emerging industries to furtherexplore the effects of internationalization strategy on R&D in strategic emerging industries.
More specifically, in correspondence with the main business and prime products disclosed in the prospec-tuses, 540 observations defined in strategic emerging industries include 27 observations in the energy savingand environmental protection industry, 158 observations in the new generation of IT industry, 89 observationsin the pharmaceutical industry, 136 observations in the high-end equipment manufacturing industry, 48 obser-vations in the new energy industry, 68 observations in the new materials industry and 14 observations in thenew energy vehicles industry. Table 13 reports the results.
In Table 13, a comparison of Models (1) and (2) shows a significant positive relationship between Over-seas_Sales and RD_intensity in strategic emerging industries. The regression coefficient is 0.023, which is sig-nificant at the 1% level. However, in non-strategic industries, there is no significant relationship betweenoverseas sales and R&D input. This shows that the internationalization strategies in strategic emerging indus-tries positively promote R&D. Companies with higher degrees of internationalization have higher R&Dinputs.
A comparison of Models (3) and (4) shows that Export_Rate, which measures internationalization, is sig-nificantly positively related to RD_intensity. The regression coefficient is 0.004, which is significant at the 5%level. However, no significant relation is found between overseas sales and R&D input in non-strategic indus-tries. This shows that the internationalization strategies in strategic emerging industries have incentive effectson R&D. Companies with higher proportions of overseas sales have higher R&D inputs.
In Models (5) and (6), Overseas_Agency has significant positive impacts on RD_intensity in either strategicor non-strategic industries. The regression coefficients are 0.005 and 0.013, respectively, which are significantat the 1% level. Thus, the establishment of overseas institutions positively promotes R&D for companies inboth strategic and non-strategic industries. In addition, a comparison of Models (7) and (8) shows that thedifferent natures of strategic emerging industries cause overseas sales to have different influences on RD_in-tensity from those of other internationalization companies. In strategic emerging industries, both the regres-sion coefficients and significance levels are higher than those of non-strategic companies (coefficient0.017 > 0.011, T value 2.57 > 1.3). This further shows that an internationalization strategy has more pro-nounced incentive effects on R&D inputs in strategic emerging industries. An internationalization strategyhas a more positive role in promoting the R&D of companies in strategic emerging industries.
To enhance the robustness of the results, as shown in Table 8, the Change model is used to further examinethe impacts of internationalization on R&D in strategic emerging industries. The results are shown inTable 14.
A comparison of Models (1) and (2) in Table 14 shows that 4Overseas_Sales and 4Domes_Sales are sig-nificantly positively related to 4RD_intensity. The regression coefficients are 0.030 and 0.022, respectively,which are significant at the 1% level. In non-strategic industries, changes in overseas and domestic sales haveno significant impacts on changes in R&D inputs. This shows that the internationalization strategy mainlyexerts positive impacts on R&D in companies in strategic emerging industries. More changes in overseasand domestic sales cause greater changes in R&D input. In addition, compared with domestic revenues,
X. Xu et al. / China Journal of Accounting Research 10 (2017) 247–280 277

changes in overseas revenues, which measure companies’ internationalization, cause greater changes in R&Dinputs (0.030 > 0.022). This further proves that in strategic emerging industries an internationalization strat-egy has an incentive effect on R&D input, and that changes in the degree of internationalization lead tochanges in R&D input in the same direction.
In Models (3) and (4), the 4Export_Rate of strategic industrial companies is positively related to thechange in R&D input. The regression coefficient is 0.005, which is significant at the 5% level. In non-strategic industrial companies, changes in the proportion of overseas sales have no significant impacts onR&D input. This shows that in strategic industrial companies, greater changes in the proportion of overseassales, which measure the degree of internationalization, cause greater changes in R&D input. Therefore,implementing internationalization strategies in strategic industrial companies have an incentive effect onR&D.
Compared with Models (5) and (6), changes in overseas sales have significant effects on strategic industrialcompanies’ R&D. The regression coefficient of 4Overseas_Sales is 0.022, which is significant at the 5% level.No significant impact is found in non-strategic industries. In addition, comparing Models (5) and (7) showsthat an internationalization strategy has a more significant influence on R&D input in strategic emergingindustries than in non-strategic emerging industries.
To comprehensively study the impact of an internationalization strategy on the independent innovation ofstrategic emerging industries, we further examine the impact of internationalization on patent output in strate-gic emerging industries. The results are shown in Tables 15 and 16.
Models (1) to (6) in Table 15 show that after controlling other variables such as RD_intensityt�1 andRD_intensityt�2, proxy variables of internationalization strategy such as Overseas_Sales, Export_rate andOverseas_Agency are significantly positively related to 4Patents in both strategic emerging and non-strategic industries. The regression coefficients are 0.756, 0.182, 0.506 and 0.212, 0.521 and 1.062, respectively.This proves that internationalization can significantly improve entrepreneurial companies’ patent outputs inboth strategic and non-strategic emerging industries.
Comparing Models (1) and (4) shows that in strategic emerging industries, Overseas_Sales has a greaterimpact on patent output than domestic sales (0.756 > 0.260). In non-strategic industrial companies, Dome_S-ales has a greater impact than Overseas_Sales on patent output (0.571 > 0.212). The results of Model (7) showthat in strategic industrial companies, Overseas_Sales has a greater impact than Domes_Sales on patent out-put (1.037 > 0.101). The results illustrate that in strategic emerging industries, companies with higher degreesof internationalization have higher patent outputs. Thus, an internationalization strategy can enhance com-panies’ patent outputs in strategic emerging industries.
In Table 16, the OLS model substitutes the Poisson model for further robustness testing. The regressionresults are substantially the same as those in Table 15, which further demonstrates that our results are robust.In summary, an internationalization strategy has more pronounced effects on the independent innovationinput and efficiency of strategic emerging industries.
6. Conclusions and implications
Guided by the ‘‘going-out” strategy, Chinese enterprises have accelerated their pace of internationalizationin recent years. We study how an internationalization strategy affects the independent innovation of Chineseentrepreneurial companies from two dimensions: R&D input and patent output. The main findings are out-lined as follows.
First, a large number of ChiNext companies have implemented internationalization strategies and haveactively expanded into overseas markets to earn foreign revenues.
Second, an internationalization strategy has a significant incentive effect on R&D input. Companies withhigher degrees of internationalization have higher R&D inputs. After controlling for endogeneity, the incen-tive effect still exists.
Third, an internationalization strategy has significantly improved the efficiency of patent outputs. Compa-nies with higher degrees of internationalization have higher patent output efficiencies.
Fourth, an internationalization strategy has more pronounced effects on independent innovation in strate-gic emerging industries.
278 X. Xu et al. / China Journal of Accounting Research 10 (2017) 247–280

Improving independent innovation capability and building a long-term competitive advantage are not onlyvital to the survival and development of China’s companies, but also important to China’s long-term eco-nomic development. An internationalization strategy is conducive to enhancing Chinese companies’ indepen-dent innovation, regardless of R&D input or patent output. Therefore, Chinese entrepreneurial companiesshould clearly understand that an internationalization strategy is an important way to enhance independentinnovation capacity. They must adhere to the going-out strategy, actively expand overseas markets, integrateglobal resources through various approaches such as exports and overseas investment and establish foreigninstitutions to enhance their independent innovation capacities. However, aside from encouraging and guidingcompanies to open up to the world, the government should vigorously promote the internationalization ofstrategic emerging industries to achieve industrial transformation and improvement.
From the two dimensions of R&D input and patent output, we provide empirical evidence that Chineseentrepreneurial companies’ internationalization strategies influence their independent innovation. This studyhas two limitations. First, the ChiNext companies’ sales data are not reported clearly or completely withrespect to detail or regional division, making it difficult to confirm overseas sales in certain regions. Thus,we fail to study the influences of internationalization on innovation under the distribution of export regions.Second, the sample period used covers 2009 to 2012. Future studies should choose longer sample periods.
Acknowledgments
The authors thank Charles Chen, Oliver Rui, the anonymous referees and the editor for their constructivesuggestions, and the CJAR symposium participants at Hunan University for their helpful comments. Anyerrors are the sole responsibility of the authors. This study is supported by the National Natural ScienceFoundation of China (Project No. 71402189) and the Fundamental Research Funds for the Central Univer-sities of the Chinese Ministry of Education (Project No. 2014116).
References
Altomonte, C., Aquilante, T., Bekes, G., Ottaviano, G.I.P., 2013. Internationalization and innovation of firms: evidence and policy. Econ.Policy 28 (76), 663–700.
Baldwin, J., Gu, W., 2004. Trade liberalization: export market participation, productivity growth and innovation. Oxford Rev. Econ.Policy 20 (3), 372–392.
Barney, J.B., 1991. Firm resource and sustained competitive advantage. J. Manage. 17, 99–120.Bernard, A.B., Jensen, J.B., 1999. Exceptional exporter performance: cause, effect, or both? J. Int. Econ. 47 (1), 1–26.Bernard, A.B., Jensen, J.B., Schott, P.K., 2006. Trade costs, firms and productivity. J. Monet. Econ. 53, 917–937.Bilkey, W.J., Tesar, G., 1977. The export behavior of smaller sized Wisconsin manufacturing firms. J. Int. Bus. Stud. 8, 93–98.Bound, J., Cummins, C., Griliches, Z., 1984. Who Does R&D and Who Patents, in R&D, Patents and Productivity. University of Chicago
Press, Chicago, IL.Bratti, M., Felice, G., 2012. Are exporters more likely to introduce product innovations? The World Economy 35 (11), 1559–1598.Bustos, P., 2011. Trade liberalization, exports and technology upgrading: evidence on the impact of MERCOSUR on Argentinean firms.
Am. Econ. Rev. 101 (1), 304340.Cassiman, B., Golovko, E., 2011. Innovation and internationalization through exports. J. Int. Bus. Stud. 42 (1), 56–75.Cheng, J.L.C., Bolon, D.S., 1993. The management of multinational R&D, a neglected topic in international business research. J. Int. Bus.
Stud. 24, 1–18.Clerides, S., Lach, S., Tybout, J., 1998. Is learning by exporting important? Micro-dynamic evidence from Colombia, Mexico and
Morocco. Quart. J. Econ. 113 (1), 903–948.Debrulle, J., Maes, J., 2015. Start-ups’ internationalization: the impact of business owners’ management experience, start-up experience
and professional network on export intensity. Euro. Manage. Rev. 12, 171–187.Faleye, O., 2011. CEO directors, executive incentives, and corporate strategic initiatives. J. Financ. Res. 34 (2), 241–277.Fisch, J.H., 2003. Optimal dispersion of R&D activities in multinational corporations with a genetic algorithm. Res. Policy 32, 1381–1396.Granstrand, O., Hikanson, L., Sjiilander, S., 1993. Internationalization of R&D: a survey of some recent research. Res. Policy 22, 413–
430.Greenaway, D., Gullstrand, J., Kneller, R., 2005. Exporting may not always boost firm productivity. Rev. World Econ. 141 (4), 561–582.Griliches, Z., 1990. Patents statistics as economic indicators: a survey. J. Econ. Lit. 28 (4), 1661–1707.Grossman, G.M., Helpman, E., 1991. Trade, knowledge spillover, and growth. Euro. Econ. Rev. 35, 517–526.Hausman, J., Hall, B., Griliches, Z., 1984. Econometric models for count data with an application to patent R&D relationship.
Econometrica 7, 909–938.Helpman, E., Melitz, M., Yeaple, S., 2004. Export versus FDI with heterogeneous firms. Am. Econ. Rev. 94 (1), 300–316.
X. Xu et al. / China Journal of Accounting Research 10 (2017) 247–280 279

Himmelberg, C.P., Petersen, B.C., 1994. R&D and internal finance: a panel study of small firms in high-tech industries. Rev. Econ. Stat.76, 38–51.
Hitt, M.A., Hoskisson, R.E., Ireland, H., 1994. A midrange theory of the interactive effects of international and product diversification oninnovation and performance. J. Manage. 20, 297–326.
Hitt, M.A., Hoskisson, R.E., Kim, H., 1997. International diversification: effects on innovation and firm performance in product-diversified firms. Acad. Manag. J. 40 (4), 767–798.
Hoskisson, R.O., Johnson, R.A., 1992. Corporate restructuring and strategic change: the effect on diversification strategy and R&Dintensity. Strateg. Manag. J. 13, 625–634.
Hubbard, R.G., 1998. Capital market imperfections and investment. J. Econ. Lit. 36 (1), 193–225.Kafouros, M.I., Buckley, P.J., Sharp, J.A., Wang, C.Q., 2008. The role of internationalization in explaining innovation performance.
Technovation 28 (1–2), 63–74.Kobrin, S., 1991. An empirical analysis of the determinants of global integration. Strateg. Manag. J. 12, 17–31.Kotabe, M., Srinivasan, S.S., Aulakh, P.S., 2002. Multinationality and firm performance: the moderating role of R&D and marketing
capabilities. J. Int. Bus. Stud. 33, 79–97.Kotabe, M., 1990. The relationship between offshore sourcing and innovativeness of U.S. multinational firms: an empirical investigation.
J. Int. Bus. Stud. 21 (4), 623–638.Lileeva, A., Trefler, D., 2010. Improved access to foreign markets raises plant-level productivityEllipsisfor some plants. Quart. J. Econ.
125 (3), 1051–1099.Lopez, J., Garcıa, R.M., 2005. Technology and export behavior: a resource-based view approach. Int. Bus. Rev. 14, 539–557.Love, J.H., Ganotakis, P., 2013. Learning by exporting: lessons from high-technology SMEs. Int. Bus. Rev. 22, 1–17.Lu, J.W., Beamish, P.W., 2004. International diversification and firm performance: the S-curve hypothesis. Acad. Manag. J. 47 (4), 598–
609.Melitz, M., 2003. The impact of trade in intra-industry reallocations and aggregate industry productivity. Econometrica 71 (6), 1695–1725.Miller, D.J., 2004. Firm’s technological resources and the performance effects of diversification: a longitudinal study. Strateg. Manag. J.
25, 1097–1119.Naldi, L., Acbtenbagen, L., Davidsson, P., 2015. International corporate entrepreneurship among SMEs: a test of Stevenson’s notion of
entrepreneurial management. J. Small Bus. Manage. 53 (3), 780–800.Pakes, A., Griliches, Z., 1980. Patents and R&D at the firm level: a first look. Econ. Lett. 5, 377–381.Porter, M.E., 1985. Competitive Advantage. Free Press, New York.Prashantham, S., 2005. Toward a knowledge-based conceptualization of internationalization. J. Int. Entrepren. 3, 37–52.Qian, X.F., Wang, J.R., Huang, Y.H., Wang, S., 2011. Exports and the productivity of Chinese industrial enterprises: self-selection effect
or learning by exporting effect? J. Quant. Techn. Econ. 2, 37–51 (in Chinese).Roper, S., Love, J.H., 2002. Innovation and export performance: evidence from U.K. and German manufacturing plants. Res. Policy 31,
1087–1102.Sala, D., Yalcin, E., 2015. Export experience of managers and the internationalization of firms. World Econ. 38 (7), 1064–1089.Salomon, R., Jin, B., 2010. Do leading or lagging firms learn more from exporting? Strateg. Manag. J. 31, 1088–1113.Sanna-Randaccio, F., Veugelers, R., 2007. Multinational knowledge spillovers with decentralised R&D: a game-theoretic approach. J. Int.
Bus. Stud. 38, 47–63.Santos, J., Doz, Y., Williamson, P., 2004. Is your innovation process global? Sloan Manage. Rev. 45 (4), 31–37.Schumpeter, J.A., 1942. Capitalism, Socialism and Democracy. Unwin, London.Teece, D.J., 1986. Profiting from technological innovation: implications for integration, collaboration, licensing and public policy. Res.
Policy 15 (6), 285–305.Van Biesebroeck, J., 2005. Exporting raises productivity in Sub-Saharan African manufacturing plants. J. Int. Econ. 67, 373–391.Von Zedtwitz, M., Gassmann, O., 2002. Market versus technology drive in R&D internationalization: four different patterns of managing
research and development. Res. Policy 31, 569–588.Zhang, J., Li, Y., Liu, Z.B., 2008. Exporting and productivity of Chinese firms: empirical study based on manufacturing firms of Jiangsu
Province. Manage. World 12, 11–26 (in Chinese).Zhang, J., Li, Y., Liu, Z.B., 2009. Does exporting boost productivity of Chinese firms. Manage. World 12, 11–26 (in Chinese).
280 X. Xu et al. / China Journal of Accounting Research 10 (2017) 247–280

Stock index adjustments, analyst coverage andinstitutional holdings: Evidence from China
Song Zhu a,⇑, Xiaoyu Jiang a, Xiaoli Ke a, Xiaoyu Bai b
aBusiness School, Beijing Normal University, ChinabBank of China, China
A R T I C L E I N F O
Article history:
Received 25 February 2016Accepted 6 December 2016Available online 14 April 2017
JEL:
G2M3
Keywords:
Stock index adjustmentAnalyst coverageInstitutional holding
A B S T R A C T
Using 231 pairs of matched firms from 2009 to 2012 in Chinese stock market,we find that the stock index adjustment significantly affects the analyst cover-age, which in addition to the stock index leads to more analyst coverage, whiledeletion from the stock index has no significant effect, indicating that stockindex adjustment can significantly change the information environments offirms that are added to the index. An index adjustment also affects institutionalholdings in consideration of new information (e.g., changes in fundamentalsand information environments). Changes in institutional holdings are partiallydue to changes in analyst coverage, and both index funds and other types canchange their portfolios in response to changes in the target firms’informativeness.� 2017 Sun Yat-sen University. Production and hosting by Elsevier B.V. Thisis an open access article under the CC BY-NC-ND license (http://creativecom-
mons.org/licenses/by-nc-nd/4.0/).
1. Introduction
The ‘‘S&P game” is another name for the arbitrage that occurs in response to the addition of stocks in theS&P 500 index (Lee et al., 2008), which is conducted by both index fund managers and other traders. Usually,significantly positive (negative) abnormal returns around the index addition (deletion) are found (Harris andGurel, 1986). A large increase occurs in correlating the trading volume of stocks added to the index with thevolume of those that remained in the index, and the opposite is true as a result of the deletions (Greenwoodand Sosner, 2007). Due to the arbitrage surrounding the times of index changes, investors in funds linked tothe S&P 500 Index and the Russell 2000 Index lose between $1 and 2.1 billion a year for the two indicescombined, and the losses can be greater if benchmarked assets are considered; the pre-reconstitution period
http://dx.doi.org/10.1016/j.cjar.2016.12.005
1755-3091/� 2017 Sun Yat-sen University. Production and hosting by Elsevier B.V.
This is an open access article under the CC BY-NC-ND license (http://creativecommons.org/licenses/by-nc-nd/4.0/).
⇑ Corresponding author.E-mail address: [email protected] (S. Zhu).
q This paper is sponsored by a National Natural Science Fund (71302023).
China Journal of Accounting Research 10 (2017) 281–293
HO ST E D BY Contents lists available at ScienceDirect
China Journal of Accounting Research
journal homepage: www.elsevier .com/locate /c jar

is lengthened or involuntary deletions are taken into account (Chen et al., 2006). However, recent researchfinds that a buy–hold index portfolio outperformed the annually rebalanced index in the 1979–2004 period.Although the short-term momentum and poor long-term returns of new issues partially explain these returns,index deletions were found to provide significantly higher factor-adjusted returns than index additions (Caiand Houge, 2008). This suggests that changing holdings around index adjustment may not be a wise decision.
Although changes in institutional index fund holdings are responsible for the observed abnormal returns inresponse to S&P 500 changes (Shleifer, 1986; Harris and Gurel, 1986), there has been scant supporting empir-ical evidence (Pruitt and Wei, 1989; Chen et al., 2004; Green and Jame, 2011). Do changes in institutionalholding only result from the portfolio management of index funds? Addition and deletion announcements alsocontain valuable and relevant new information that may further affect the portfolio management for bothindex funds and other institutional investors. Moreover, Beneish and Whaley (1996) and Shleifer (1986) sug-gest that analysts may also alter their attitudes regarding firms that are added to or deleted from the stockindex, which is not supported by evidence. Do stock index adjustments also affect analysts’ coverage and stockrecommendations, further influencing changes in institutional holdings and ultimately leading to a more vola-tile market reaction to index adjustment? There are no clear answers, as little work has been done in this area.
We use 231 pairs of matched Chinese firms in the same industry, during the same year and the same quarterwith similar assets over the 2009–2012 period, and find that stock index adjustments significantly affect analystcoverage, which in addition to the stock index, leads to more analyst coverage (proxied by the number of ana-lysts and stock recommendations). In contrast, deletion from the stock index has no significant effect, indicat-ing that stock index adjustments can significantly change the information environments of firms added to theindex, as Beneish and Whaley (1996) and Shleifer (1986) suggest. Index adjustments also affect institutionalholdings, as Pruitt and Wei (1989) note, even in cases of new information, such as changes in fundamentalsand information environments. Moreover, changes in institutional holdings can be partially due to changes inanalyst coverage, such that index and other funds change their portfolios in response to changes in the infor-mativeness of the target firms.
Our paper contributes to the literature in the following ways. First, we provide more rigorous evidence forthe effects of stock index adjustments on institutional holdings in relation to the validity of the related hypothe-ses. We use matched samples and a multi-regression to investigate the information content of stock indexchanges, such as changes in firms’ profitability, growth potential or the information available for decisions—any of which may coincide with stock index adjustments and lead to changes in institutional holdings. Second,we examine the influence of index adjustments on firms’ information environments and show how the formeraffects the latter’s analyst coverage and stock recommendations, which then influence their market performanceand investor holdings. Our finding provides some evidence for the information content hypothesis concerningstock index adjustment. Third, our work provides further evidence of the stock index adjustments, analyst cov-erage and institutional holdings in the Asian Pacific and other emerging markets. Finally, the conclusions of thispaper will be useful for studies on the future of stock indices in China. In 2015, China’s stock market experi-enced a dramatic uprush and collapse, and the stock index future is now heavily criticized by many scholarsand investors. Our work on the logic and patterns of institutional investors’ reactions to stock index adjust-ments can provide some evidence and useful clues about the regulation of stock indices in China’s future.
The remainder of this paper is organized as follows. Section 2 reviews the relevant literature and Section 3presents the stock index adjustments in China. Section 4 describes the research design and the empirical anal-ysis is shown in Section 5. The final section concludes our paper and discusses future research.
2. Literature review
There are many studies on the market created in reaction to stock index adjustments, and several hypothe-ses are proposed. The downward-sloping demand curve hypothesis suggests that the demand of index fundmanagers reduces the stock’s supply for non-indexing investors, permanently increasing the market clearingprice (Shleifer, 1986; Chakrabarti et al., 2005). The liquidity hypothesis suggests that the addition or deletionof a stock from the index alters the stock’s liquidity, which affects its price (Shleifer, 1986; Beneish andWhaley, 1996). Price pressure is attributable to index trading, because index fund managers must add or deletethe stock from their portfolios to avoid unfavorable tracking errors by which they may be evaluated. Reflect-
282 S. Zhu et al. / China Journal of Accounting Research 10 (2017) 281–293

ing a supply and demand imbalance, securities prices adjust to new levels in response to this buying and sellingpressure exerted by the index-fund managers (Harris and Gurel, 1986; Elliott et al., 2006; Platikanova, 2008).The information content hypothesis proposes that addition and deletion announcements contain valuable andrelevant information. Inclusion (exclusion) signals a real or perceived increase (decrease) in management qual-ity, and the S&P’s inclusion of a stock in an index may act as a certification of quality, leading to a price andpossible volume increase due to trading by index managers (Beneish and Whaley, 1996; Denis et al., 2003; Cai,2007; Gygax and Otchere, 2010). The investor awareness hypothesis suggests that investors cannot invest in asecurity of which they are unaware, and firms have a shadow cost for being unknown that decreases as thefirms become better recognized. A stock’s addition to an index alerts investors of its existence, increasingthe number of analysts following it, its information dissemination and its liquidity and breadth of ownership.These factors lead to a reduction in the firms’ shadow costs and the investors’ required rate of return, whichresults in an increase in the firms’ stock price and expected stock returns (Chen et al., 2004; Elliott et al., 2006).
All of these hypotheses imply changes in investor trading, particularly that of institutional investors such asindex funds. Shleifer (1986) and Harris and Gurel (1986) suggest that changes in institutional index fund hold-ings are responsible for the observed abnormal returns in response to S&P 500 changes, but they do not pro-vide evidence. Pruitt and Wei (1989), Chen et al. (2004) and Green and Jame (2011) examine the actualchanges in institutional holdings following both additions to and deletions from the S&P 500. They reveal thatchanges in institutional holdings in response to additions or deletions from the S&P 500 are positively corre-lated. However, they do not consider the informational content of the stock index change, such as changes infirms’ profitability and growth potential, or the information available for decisions—all of which may coincidewith stock index adjustments and ultimately lead to changes in institutional holdings. A stock’s addition to anindex alerts investors of its existence, increasing the number of analysts following it and its information dis-semination. Financial analysts are outsiders who generally have less access to firm-level, idiosyncratic infor-mation. As such, they can focus their efforts on obtaining and mapping industry- and market-levelinformation into prices. Unlike institutions and insiders, analysts convey their private information throughfirm-specific earnings forecasts and stock recommendations (Piotroski and Roulstone, 2004). Mikhail et al.(2007) find that both large and small traders react to analyst reports (analysts’ recommendations). However,few studies have been conducted examining index adjustments’ effects on firms’ information environments,which further affect their market performance and investor holdings.
3. Stock index and index adjustment in China
Unlike the U.S., Japan and other major security markets where most of the listed firms in a single countryare traded in one stock exchange, in mainland China there are two stock exchanges—Shanghai StockExchange and Shenzhen Stock Exchange—that manage the trading of publicly listed firms in mainland China.Up to 31 December 2012, there have been 975 firms listed in the Shanghai Stock Exchange, with 921 (54) in theA-share (B-share) market. There have been 1537 firms listed in the A-share market in the Shenzhen StockExchange, including 481 firms on the Main Board, 701 on the Small and Medium Enterprise Market Boardand 355 on the Growth Enterprises Market Board. Another distinguishing factor is that unlike the S&P 500 orRussell 2000 in the U.S., the Nikkei 225 in Japan and the Hang Seng Index in Hong Kong, there are twomajor stock indices for the Shanghai and Shenzhen Stock Exchanges in mainland China: namely, the Shang-hai Composite Index (Code: 000001) (SHCI as the acronyms hereafter) and the Compositional Index of Shen-zhen Stock Market (Code: 399001) (SZCI as the acronyms hereafter), respectively.
The SHCI is the most important stock index in China in terms of presenting changes in market volatility. Itstarted on 15 July 1991, based on 100 points, and is disclosed to global investors via Thomson Reuters,Bloomberg and other channels. The SHCI is based on all of the listed firms in the Shanghai Stock Exchange,computed as the market value of sample firms and multiplied by its weight, which is the number of stocksissued by sample firms.1 If a firm launches an IPO, it will be included in the index on the 11th day of its trading
1 Given that the index also contains the B-shares, which are priced in terms of U.S. dollars, the market value is exchanged based on theappropriate exchange rate, usually the middle rate of RMB yuan against the U.S. dollar on the last trading day of each week by ChinaForeign Exchange Trade Center.
S. Zhu et al. / China Journal of Accounting Research 10 (2017) 281–293 283

on the market. If a firm delists, it will be excluded from the index on the exclusion day. It is often commonknowledge on the market several months in advance that a firm is going IPO, so there are already many ana-lysts covering the IPO firms. For the delisted firms, listed firms in China delist if they suffer losses for threecontinuous years. Before the financial report is provided for the last year when the firm may delist, the marketmight already know something, but may be unsure whether the firm will delist. Thus, there are a few days forthe market, institutional investors, analysts and other investors to discover whether a particular stock is beingadded to or deleted from the Shanghai Composite Index.
The SZCI is based on 40 typical listed firms and started on 23 January 1995 with a base of 1000 points. TheSZCI is computed as the market value of sample firms multiplied by its weight, which is the circular number ofstocks issued by sample firms, not the total number of stocks. To maintain objectivity and fairness, the SZCI isadjusted considering the norm of the component stocks. On each January, May and September, the SZCI maybe adjusted. First, the Shenzhen Stock Exchange looks at all of the listed firms and filters out those that meet thefollowing requirements: a listed time of more than 3 months, a market value based on circular stocks to the totalmarket value of all firms that is in the top 90% and a trading-to-total-market value of all firms in the top 90%.Given the circular market and trading values, representative of the industry and growth, financial position andoperating performance for the past three years and compliance with regulations in the past two years, the Shen-zhen Stock Exchange weights each factor and then chooses up to 40 firms as being representative of the Shen-zhen Stock Exchange. Thus, it has a small window during which the market, institutional investors, analystsand other investors can determine whether particular stocks will be added to or deleted from the SZCI.
There is another important stock index, the Hushen 300 index (Code: 000300) (SH300 as the acronymshereafter), that contains 300 listed firms in either the Shanghai Stock Exchange or the Shenzhen StockExchange. It covers firms with 70% market value to the total value of all listed firms in both exchanges. Thisindex is a single-stock index that represents the market, and it is recognized by both the Shanghai StockExchange and the Shenzhen Stock Exchange. The HS300 started on 31 December 2004 with a base of 1000points, and is based on sample firms with daily trading volumes in the top 50% of all listed firms in China.Those with daily market values in the top 300 of the total samples are selected, and the weight of each samplestock is well balanced, with the industry distribution covering most industries. The HS300 is adjusted biannu-ally, with enforcement in early January and July and two weeks of advanced disclosure of the adjustment list.Each time the HS300 is adjusted, the adjustment ratio (stocks adjusted to total number) is lower than 10%.Moreover, firms that have suffered a loss during the most recent year are not added to the HS300 unless theysignificantly affect the representativeness of the index. The only index future in China’s security market is theHS300 future, which is based on the HS300. Thus, the HS300 is more influential than the SHCI and the SZCI,especially for institutional investors.
4. Research design
4.1. Data and samples
The SHCI is based on all listed firms, such that additions to the index provide no additional information.Thus, we collect all of the stock index adjustments for the HS300 since they began to the end of 2012 from theWIND database. Analyst coverage (number of analysts and stock recommendations) is available from thethird quarter of 2009 to the first quarter of 2013, and the holdings of institutional investors are available fromthe third quarter of 2004 to the first quarter of 2013 in the WIND database.2 Given that we need to calculatethe changes in variables, our sample firms are from the fourth quarter of 2009 to the fourth quarter of 2012.To make the study more rigorous, we use matched samples. The matching is based on the same industry, thesame year, the same quarter and similar size. After dropping the financial industry, our final sample is 462: 231stock index adjustment firms and 231 matched firms from 2009 to 2012, including 112 firms added to theHS300 with 112 matched firms and 119 firms dropped from the HS300 with 119 matched firms.
2 As analyst coverage, institutional holdings and other financial information are disclosed on a quarterly basis, we collect our data basedon quarterly financial statements.
284 S. Zhu et al. / China Journal of Accounting Research 10 (2017) 281–293
4.2. Model and variables
We suggest that the stock index adjustment not only affects the portfolio management for index funds, butalso affects other institutional investors by influencing their information environments, namely the analystcoverage, which affects institutional decision making.
To examine whether stock index adjustments affect information environments, namely, analyst coverage,our model is based on O’Brien and Nhushan (1990) with additional controlling factors:
DNumAnalyst ¼ a0 þ a1Indexing þ a2DNumInst þ a3DROE þ a4DGROW þ a5DLEV þ a6DSIZE
þ a7Ret þ a8Quarter þX
aiIndsi þX
ajYearsj þ e ð1ÞOur analyst coverage measure includes two variables. NumAnalyst is the number of analysts in a particular
firm, and NumRating is the total number of stock recommendations (Buy, Upgrade, Hold, Downgrade andSell) issued by analysts in a particular firm. As we want to compare the analyst coverage before and after stockindex adjustment, we use the changes in the two variables. DNumAnalyst is the change in the number of ana-lysts in the next quarter compared to the event quarter when the target firm is added to or dropped from thestock market index. DNumRating is the change in the number of total stock recommendations in the nextquarter compared to the event quarter. As a robustness test, we also use the change in the number of ‘‘Buy”(DNumBuy), positive (Buy and Upgrade) (DNumPositive) and negative (Sell and Downgrade) (DNumNega-tive) recommendations. For matched firms, all of the variables listed above represent changes in the samequarter as for target firms.
Indexing refers to the stock index adjustment, with 1 indicating that the target firm is added to the stockmarket index, �1 indicating that it is dropped and 0 being matched firms.
NumInst is the number of institutional investors in the target firm in the event quarter, and DNumInst isthe change in the number of institutional investors in the target firm in the event quarter compared to the pre-vious quarter (Pruitt and Wei, 1989). For the matched firms, all of the above variables are the changes in thesame quarters as the target firms.
DROE is the change in return on equity (ROE) in the event quarter compared to the previous quarter.DGROW is the change in revenue growth in the event quarter compared to the previous quarter. DLEV isthe change in leverage (total debt ratio) in the event quarter compared to the previous quarter. DSIZE isthe change in scale (nature log form of total assets) in the event quarter compared to the previous quarterand Ret is the raw market return during the event quarter. For matched firms, all of the above variables mea-sure the change in the same quarter as the target firms.
Inds are the industry dummy variables, namely 11 dummy variables for 12 industry categories used by theChina Securities Regulatory Commission (CSRC) after dropping the financial industry. Years are the yeardummy variables, namely 3 dummy variables for 4 years. Quarter is a dummy variable where 1 indicatesthe quarter 1, and 0 otherwise because the Hushen 300 only adjusts twice a year in January and July.
To investigate the influence of analyst coverage on the effects that stock index adjustments have on insti-tutional holdings, we use the Baron and David (1986) method, which is popular in the management literature.Our models are set as follows:
DInsthold ¼ b0 þ b1Indexing þ b2DROE þ b3DGROW þ b4DLEV þ b5DSIZE þ b6Quarter
þX
biIndsi þX
bjYearsj þ e ð2ÞDInsthold ¼ c0 þ c1Indexing þ c2DNumAnalyst þ c3DROE þ c4DGROW þ c5DLEV þ c6DSIZE
þ c7Quarter þX
ciIndsi þX
cjYearsj þ e ð3ÞInsthold is the institutional investor holding (in the percentage of the invested firm’s total stock) in the event
quarter, and DInsthold is the change in institutional holding during the subsequent quarter of the event quar-ter in which the target firm is added to or dropped from the stock market index, compared to the event quarter(Green and Jame, 2011). For matched firms, all of the above variables are the change in the same quarter asthe target firms.
S. Zhu et al. / China Journal of Accounting Research 10 (2017) 281–293 285

Indexing, DNumAnalyst, DROE, DGROW, DLEV, DSIZE, Inds and Years are the same as above.According to Baron and David (1986), if a1 > 0, b1 > 0, c1 > 0, c2 > 0 and c1 < b1, then the analyst coverage
plays a partial mediation role in the influence that stock index adjustments have on institutional holdings. Ifc1 > 0 is not significant while a1 > 0, b1 > 0 and c2 > 0 are significant, then the analyst coverage has a wholemediation effect, suggesting that the stock index adjustment affects the institutional holding total via the ana-lyst coverage. Otherwise, the analyst coverage has no mediation effect.
5. Empirical analysis
5.1. Descriptive statistics
Table 1 shows the mean comparisons for the interested variables among different groups. Panel A shows thecomparisons between firms added to the stock index and matched firms. The change in institutional holdings
Table 1Mean comparisons.
Match_Add (112) Add (112) Difference t
Panel A Comparisons between Add and Match
DInsthold 2.930 6.002 �3.072 �2.71***
DNuminst �33.036 �44.776 11.741 2.93***
DNumAnalyst �1.152 �0.303 �0.848 �1.88*
DNumRating �1.116 �0.169 �0.946 �2.37**
DNumBuy �0.321 �0.071 �0.250 �0.90DNumPositive �0.830 �0.063 �0.767 �1.92*
DNumNegative 0 0.009 �0.009 �0.22DROE �5.221 �5.562 0.3401 0.28DGROW 2.720 �12.051 14.772 2.48**
DLEV 0.611 0.385 0.226 0.51DSIZE 0.042 0.043 �0.001 �0.10Ret �0.443 �2.616 2.173 0.97
Drop (119) Match_Drop (119) Difference t
Panel B Comparisons between Drop and Match
DIsthold 1.845 3.639 �1.794 �2.62**
DNuminst �24.260 �32.554 8.294 2.79***
DNumAnalyst �0.504 �0.655 0.151 0.41DNumRating �0.369 �0.873 0.504 1.46DNumBuy 0.075 �0.428 0.504 2.48**
DNumPositive �0.092 �0.798 0.705 2.08**
DNumNegative 0.008 �0.008 0.016 0.53DROE �2.430 �3.334 0.904 0.75DGROW 3.388 �11.284 14.673 2.06**
DLEV 0.549 0.094 0.455 0.77DSIZE 0.035 0.065 �0.029 �0.82Ret 2.925 2.460 0.464 0.20
DInsthold is the change in institutional investors’ holding during the next quarter compared to the event quarter when the target firm isadded to or dropped from the stock market index. Add indicates that the target firm is added to the market index, Drop means it is deletedfrom the market index, and Match refers to the matched firms. DNumInst is the change in the number of institutional investors on thetarget firm in the event quarter compared to the previous quarter. DNumAnalyst is the change in the number of analysts in a particularfirm in the next quarter to the event quarter. DNumRating is the change in the number of total stock recommendations in a particular firmin the next quarter compared to the event quarter. DNumBuy is the change in the number of ‘‘Buy” recommendations in a particular firmin the next quarter compared to the event quarter. DNumPositive is the change in the number of ‘‘Buy” and ‘‘Increase” recommendationsin a particular firm in the next quarter compared to the event quarter. DNumNegative is the change in the number of ‘‘Sell” and‘‘Decrease” recommendations in a particular firm in the next quarter compared to the event quarter. DROE is the change in ROE in theevent quarter compared to the previous quarter. DGROW is the change in revenue growth in the event quarter compared to the previousquarter. DLEV is the change in leverage (total debt ratio) in the event quarter compared to the previous quarter. DSIZE is the change inscale (nature log form of total assets) in the event quarter compared to the previous quarter. Ret is the raw market return during the eventquarter. For matched firms, all of the above variables are the change in the same quarter as the target firms.
286 S. Zhu et al. / China Journal of Accounting Research 10 (2017) 281–293
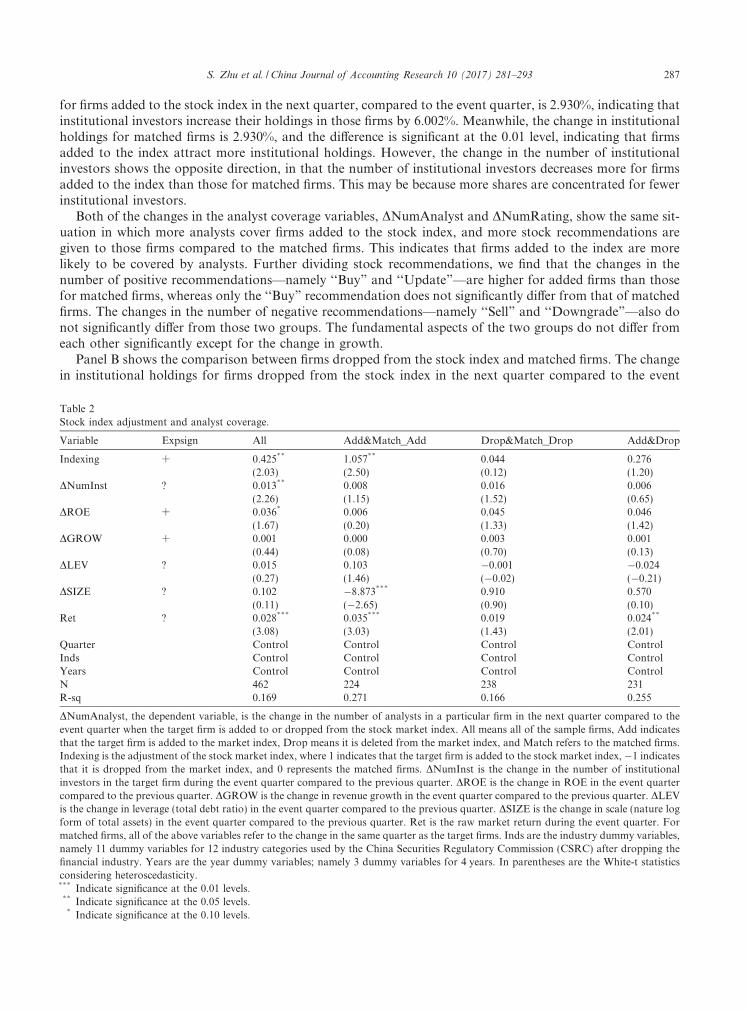
for firms added to the stock index in the next quarter, compared to the event quarter, is 2.930%, indicating thatinstitutional investors increase their holdings in those firms by 6.002%. Meanwhile, the change in institutionalholdings for matched firms is 2.930%, and the difference is significant at the 0.01 level, indicating that firmsadded to the index attract more institutional holdings. However, the change in the number of institutionalinvestors shows the opposite direction, in that the number of institutional investors decreases more for firmsadded to the index than those for matched firms. This may be because more shares are concentrated for fewerinstitutional investors.
Both of the changes in the analyst coverage variables, DNumAnalyst and DNumRating, show the same sit-uation in which more analysts cover firms added to the stock index, and more stock recommendations aregiven to those firms compared to the matched firms. This indicates that firms added to the index are morelikely to be covered by analysts. Further dividing stock recommendations, we find that the changes in thenumber of positive recommendations—namely ‘‘Buy” and ‘‘Update”—are higher for added firms than thosefor matched firms, whereas only the ‘‘Buy” recommendation does not significantly differ from that of matchedfirms. The changes in the number of negative recommendations—namely ‘‘Sell” and ‘‘Downgrade”—also donot significantly differ from those two groups. The fundamental aspects of the two groups do not differ fromeach other significantly except for the change in growth.
Panel B shows the comparison between firms dropped from the stock index and matched firms. The changein institutional holdings for firms dropped from the stock index in the next quarter compared to the event
Table 2Stock index adjustment and analyst coverage.
Variable Expsign All Add&Match_Add Drop&Match_Drop Add&Drop
Indexing + 0.425** 1.057** 0.044 0.276(2.03) (2.50) (0.12) (1.20)
DNumInst ? 0.013** 0.008 0.016 0.006(2.26) (1.15) (1.52) (0.65)
DROE + 0.036* 0.006 0.045 0.046(1.67) (0.20) (1.33) (1.42)
DGROW + 0.001 0.000 0.003 0.001(0.44) (0.08) (0.70) (0.13)
DLEV ? 0.015 0.103 �0.001 �0.024(0.27) (1.46) (�0.02) (�0.21)
DSIZE ? 0.102 �8.873*** 0.910 0.570(0.11) (�2.65) (0.90) (0.10)
Ret ? 0.028*** 0.035*** 0.019 0.024**
(3.08) (3.03) (1.43) (2.01)Quarter Control Control Control ControlInds Control Control Control ControlYears Control Control Control ControlN 462 224 238 231R-sq 0.169 0.271 0.166 0.255
DNumAnalyst, the dependent variable, is the change in the number of analysts in a particular firm in the next quarter compared to theevent quarter when the target firm is added to or dropped from the stock market index. All means all of the sample firms, Add indicatesthat the target firm is added to the market index, Drop means it is deleted from the market index, and Match refers to the matched firms.Indexing is the adjustment of the stock market index, where 1 indicates that the target firm is added to the stock market index,�1 indicatesthat it is dropped from the market index, and 0 represents the matched firms. DNumInst is the change in the number of institutionalinvestors in the target firm during the event quarter compared to the previous quarter. DROE is the change in ROE in the event quartercompared to the previous quarter. DGROW is the change in revenue growth in the event quarter compared to the previous quarter. DLEVis the change in leverage (total debt ratio) in the event quarter compared to the previous quarter. DSIZE is the change in scale (nature logform of total assets) in the event quarter compared to the previous quarter. Ret is the raw market return during the event quarter. Formatched firms, all of the above variables refer to the change in the same quarter as the target firms. Inds are the industry dummy variables,namely 11 dummy variables for 12 industry categories used by the China Securities Regulatory Commission (CSRC) after dropping thefinancial industry. Years are the year dummy variables; namely 3 dummy variables for 4 years. In parentheses are the White-t statisticsconsidering heteroscedasticity.*** Indicate significance at the 0.01 levels.** Indicate significance at the 0.05 levels.* Indicate significance at the 0.10 levels.
S. Zhu et al. / China Journal of Accounting Research 10 (2017) 281–293 287

quarter is 1.845% while the change in institutional holdings for matched firms is 3.639%. The difference is sig-nificant at the 0.05 level, indicating that firms dropped from the index attract more institutional holdings.However, the change in the number of institutional investors shows the opposite direction. The analyst cov-erage (number of analysts and stock recommendations) does not significantly differ between firms droppedfrom the stock index and matched firms. Only the ‘‘Buy” recommendation and positive recommendation(‘‘Buy” and ‘‘Update”) are higher for matched firms than for those dropped from the stock index.
5.2. Stock index adjustment and analyst coverage
Table 2 shows the effects of stock index adjustments on analyst coverage, particularly the number of ana-lysts covered. The first column shows the results for all of the sample firms (firms added to and dropped fromthe index, and matched firms). The coefficient for indexing, namely, the proxy for stock index adjustment, is
Table 3Stock index adjustment and analyst’s stock recommendation.
Variable DNumRating DNumBuy DNumPositive DNumNegative
All Add&Match_Add Drop&Match_Drop
Indexing 0.398** 1.106*** �0.256 0.062 0.376** 0.014(2.02) (2.77) (�0.81) (0.50) (2.00) (0.71)
DNumInst 0.015*** 0.010 0.021** 0.003 0.016*** 0.001**
(2.76) (1.40) (2.21) (0.63) (2.95) (2.13)DROE 0.040** 0.007 0.061* 0.009 0.042* 0.001
(1.99) (0.21) (1.91) (0.80) (1.86) (0.43)DGROW 0.002 �0.001 0.005 0.003** 0.004 �0.000
(1.05) (�0.20) (1.23) (2.40) (1.49) (�1.27)DLEV �0.030 0.057 �0.058 �0.007 �0.017 �0.001
(�0.59) (0.81) (�0.86) (�0.18) (�0.34) (�0.29)DSIZE 0.893 �5.397* 1.316 0.153 0.479 �0.005
(1.07) (�1.74) (1.28) (0.26) (0.59) (�0.11)Ret 0.023*** 0.017 0.026** 0.016*** 0.029*** 0.000
(2.65) (1.30) (2.25) (2.68) (3.53) (0.30)Quarter Control Control Control Control Control ControlInds Control Control Control Control Control ControlYears Control Control Control Control Control ControlN 462 224 238 462 462 462R-sq 0.128 0.165 0.197 0.078 0.137 0.063
DNumAnalyst, the dependent variable, is the change in the number of analysts in a particular firm during the next quarter compared to theevent quarter when the target firm is added to or dropped from the stock market index. All means all of the sample firms, Add indicatesthat the target firm is added to the market index, Drop means it is deleted from the market index, and Match refers to the matched firms.Indexing is the adjustment of the stock market index, 1 indicates that the target firm is added to the stock market index,�1 indicates that itis dropped from the market index, and 0 is for matched firms. DNumInst is the change in the number of institutional investors in the targetfirm during the event quarter compared to the previous quarter. DNumRating is the change in the number of total stock recommendationsin a particular firm in the next quarter compared to the event quarter. DNumBuy is the change in the number of ‘‘Buy” recommendationsin a particular firm in the next quarter compared to the event quarter. DNumPositive is the change in the number of ‘‘Buy” and ‘‘Upgrade”recommendations in a particular firm in the next quarter compared to the event quarter. DNumNegative is the change in the number of‘‘Sell” and ‘‘Downgrade” recommendations in a particular firm in the next quarter compared to the event quarter. DROE is the change inROE in the event quarter compared to the previous quarter. DGROW is the change in revenue growth in the event quarter compared tothe previous quarter. DLEV is the change in leverage (total debt ratio) in the event quarter compared to the previous quarter. DSIZE is thechange in scale (nature log form of total assets) in the event quarter compared to the previous quarter. Ret is the raw market return duringthe event quarter. For matched firms, all of the above variables are the changes in the same quarter as the target firms. Inds are theindustry dummy variables, namely, 11 dummy variables for 12 industry categories used by the China Securities Regulatory Commission(CSRC) after dropping the financial industry. Years are the year dummy variables, namely, 3 dummy variables for 4 years. In theparentheses are the White-t statistics considering heteroscedasticity.*** Indicate significance at the 0.01 levels.** Indicate significance at the 0.05 levels.* Indicate significance at the 0.10 levels.
288 S. Zhu et al. / China Journal of Accounting Research 10 (2017) 281–293
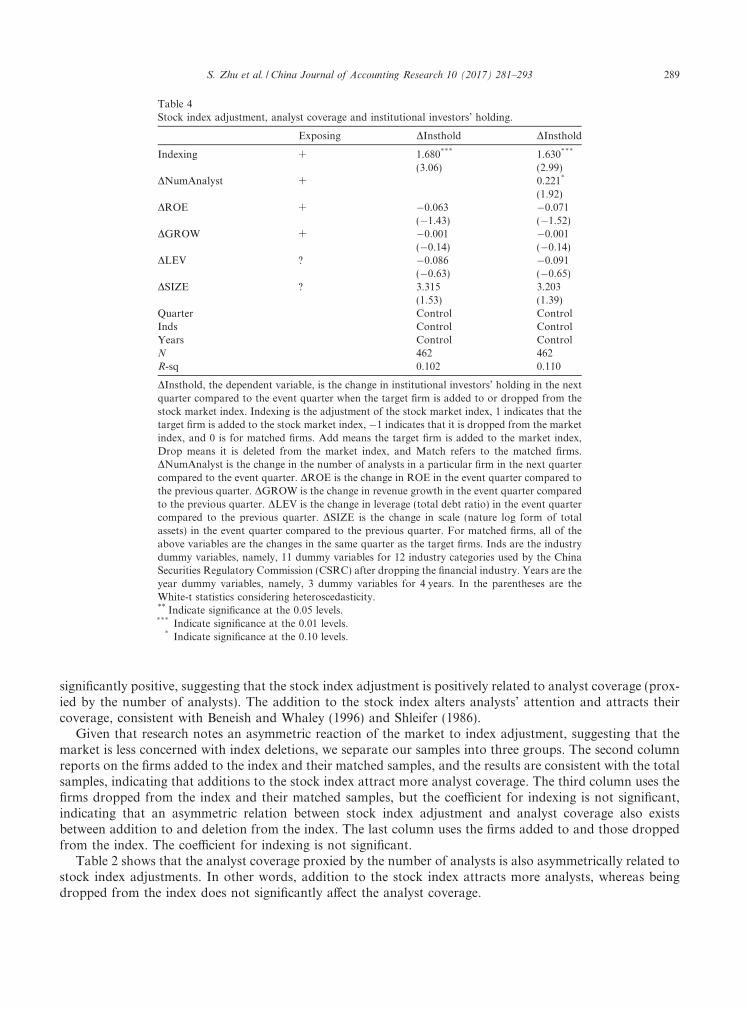
significantly positive, suggesting that the stock index adjustment is positively related to analyst coverage (prox-ied by the number of analysts). The addition to the stock index alters analysts’ attention and attracts theircoverage, consistent with Beneish and Whaley (1996) and Shleifer (1986).
Given that research notes an asymmetric reaction of the market to index adjustment, suggesting that themarket is less concerned with index deletions, we separate our samples into three groups. The second columnreports on the firms added to the index and their matched samples, and the results are consistent with the totalsamples, indicating that additions to the stock index attract more analyst coverage. The third column uses thefirms dropped from the index and their matched samples, but the coefficient for indexing is not significant,indicating that an asymmetric relation between stock index adjustment and analyst coverage also existsbetween addition to and deletion from the index. The last column uses the firms added to and those droppedfrom the index. The coefficient for indexing is not significant.
Table 2 shows that the analyst coverage proxied by the number of analysts is also asymmetrically related tostock index adjustments. In other words, addition to the stock index attracts more analysts, whereas beingdropped from the index does not significantly affect the analyst coverage.
Table 4Stock index adjustment, analyst coverage and institutional investors’ holding.
Exposing DInsthold DInsthold
Indexing + 1.680*** 1.630***
(3.06) (2.99)DNumAnalyst + 0.221*
(1.92)DROE + �0.063 �0.071
(�1.43) (�1.52)DGROW + �0.001 �0.001
(�0.14) (�0.14)DLEV ? �0.086 �0.091
(�0.63) (�0.65)DSIZE ? 3.315 3.203
(1.53) (1.39)Quarter Control ControlInds Control ControlYears Control ControlN 462 462R-sq 0.102 0.110
DInsthold, the dependent variable, is the change in institutional investors’ holding in the nextquarter compared to the event quarter when the target firm is added to or dropped from thestock market index. Indexing is the adjustment of the stock market index, 1 indicates that thetarget firm is added to the stock market index, �1 indicates that it is dropped from the marketindex, and 0 is for matched firms. Add means the target firm is added to the market index,Drop means it is deleted from the market index, and Match refers to the matched firms.DNumAnalyst is the change in the number of analysts in a particular firm in the next quartercompared to the event quarter. DROE is the change in ROE in the event quarter compared tothe previous quarter. DGROW is the change in revenue growth in the event quarter comparedto the previous quarter. DLEV is the change in leverage (total debt ratio) in the event quartercompared to the previous quarter. DSIZE is the change in scale (nature log form of totalassets) in the event quarter compared to the previous quarter. For matched firms, all of theabove variables are the changes in the same quarter as the target firms. Inds are the industrydummy variables, namely, 11 dummy variables for 12 industry categories used by the ChinaSecurities Regulatory Commission (CSRC) after dropping the financial industry. Years are theyear dummy variables, namely, 3 dummy variables for 4 years. In the parentheses are theWhite-t statistics considering heteroscedasticity.** Indicate significance at the 0.05 levels.*** Indicate significance at the 0.01 levels.
* Indicate significance at the 0.10 levels.
S. Zhu et al. / China Journal of Accounting Research 10 (2017) 281–293 289

Table 3 shows the effects of stock index adjustments on analysts’ stock recommendations. The first columnis for the total number of stock recommendations. The coefficient for indexing is significantly positive, whichmeans that the stock index adjustment leads to changes in stock recommendation issued by the analyst. Col-umns 2 and 3 regress for additional samples and deletion of samples, respectively. Added sample firms tend tohave more stock recommendations issued by analysts in the next quarter than the matched firms, whereasdeleted firms exhibit no significant difference compared to matched firms. The above results are consistent withTable 2; that is, that addition to the stock index leads to higher analyst coverage while deletion has little effect.The last three columns further separate the stock recommendations, but only the total ‘‘Buy” and ‘‘Upgrade”recommendations (DNumPositive) are significantly changed if the stock index is adjusted—details that areonly evident for firms added to the index.3
In all, Tables 2 and 3 show that stock index adjustments lead to changes in analyst coverage for the targetfirms, with addition making the firm more attractive to analysts and prompting more stock recommendations(especially positive, e.g., ‘‘Buy” and ‘‘Upgrade”) and deletion resulting in little change.
Table 5Robust tests.
Add&Match_Add Drop&Match_Drop DNumRating DNumBuy DNumPositive DNumNegative
Indexing 3.053*** 2.854** 1.583** 1.743** 1.631*** 1.685*** 1.653*** 1.682***
(2.73) (2.46) (2.31) (2.46) (2.97) (3.08) (3.02) (3.06)DNumAnalyst 0.211* 0.341** 0.247* 0.388* 0.182 �0.396
(1.75) (1.98) (1.93) (1.71) (1.40) (�0.38)DROE �0.139* �0.141* �0.042 �0.062 �0.073 �0.066 �0.071 �0.063
(�1.90) (�1.90) (�0.84) (�1.06) (�1.56) (�1.45) (�1.51) (�1.42)DGROW 0.006 0.007 �0.006 �0.008 �0.002 �0.002 �0.002 �0.001
(0.33) (0.34) (�1.07) (�1.18) (�0.18) (�0.24) (�0.19) (�0.15)DLEV �0.176 �0.192 �0.064 �0.044 �0.081 �0.083 �0.085 �0.086
(�0.94) (�1.03) (�0.60) (�0.41) (�0.58) (�0.61) (�0.62) (�0.63)DSIZE 24.441*** 25.815*** 1.881 1.218 3.026 3.147 3.158 3.309
(2.65) (2.66) (1.24) (0.77) (1.31) (1.37) (1.39) (1.52)Quarter Control Control Control Control Control Control Control ControlInds Control Control Control Control Control Control Control ControlYears Control Control Control Control Control Control Control ControlN 224 224 238 238 462 462 462 462R-sq 0.140 0.144 0.163 0.187 0.111 0.112 0.107 0.103
DInsthold, the dependent variable, is the change in institutional investors’ holding in the next quarter when the target firm is added to ordropped from the stock market index (the event quarter) compared to the previous quarter. Indexing is the adjustment of the stock marketindex, 1 indicates that the target firm is added to the stock market index, �1 indicates that it is dropped from the market index, and 0 is formatched firms. Add indicates that the target firm is added to the market index, Drop means it is deleted from the market index, and Matchrefers to the matched firms. DNumAnalyst is the change in the number of analysts of a particular firm in the next quarter compared to theevent quarter. DNumRating is the change in the number of total stock recommendation in a particular firm in the next quarter comparedto the event quarter. DNumBuy is the change in the number of ‘‘Buy” recommendations in a particular firm in the next quarter comparedto the event quarter. DNumPositive is the change in the number of ‘‘Buy” and ‘‘Upgrade” recommendations in a particular firm in the nextquarter compared to the event quarter. DNumNegative is the change in the number of ‘‘Sell” and ‘‘Downgrade” recommendations in aparticular firm in the next quarter compared to the event quarter. DROE is the change in ROE in the event quarter compared to theprevious quarter. DGROW is the change in revenue growth in the event quarter compared to the previous quarter. DLEV is the change inleverage (total debt ratio) in the event quarter compared to the previous quarter. DSIZE is the change in scale (nature log form of totalassets) in the event quarter compared to the previous quarter. For matched firms, all of the above variables are the changes in the samequarter as target firms. Inds are the industry dummy variables, namely, 11 dummy variables for 12 industry categories used by the ChinaSecurities Regulatory Commission (CSRC) after dropping the financial industry. Years are year dummy variables, namely, 3 dummyvariables for 4 years. In the parentheses are the White-t statistics considering heteroscedasticity.*** Indicate significance at the 0.01 levels.** Indicate significance at the 0.05 levels.* Indicate significance at the 0.10 levels.
3 We run the regressions for the change in the number of positive stock recommendations for Add&Match versus Drop&Match, and thecoefficient for indexing is only significant for the former.
290 S. Zhu et al. / China Journal of Accounting Research 10 (2017) 281–293

5.3. Stock index adjustment and institutional investor holdings
Table 4 examines the effects of stock index adjustments on institutional holdings and how analyst coverageinfluences this relationship. The first column presents the direct effects of stock index adjustments on institu-tional holdings. It shows a significant positive coefficient for indexing, namely the stock index adjustment mea-sure, which means that a change in the stock index’s status significantly affects the holding by institutionalinvestors, consistent with Pruitt and Wei (1989), Chen et al. (2004) and Green and Jame (2011).
When the influence of analyst coverage is added (DNumAnalyst) in column 2, the coefficient of DNumA-nalyst is significantly positive, suggesting that the change in analyst coverage leads to a change in institutionalinvestors when the firm is added to or dropped from the stock index. This is consistent with the assertion ofMikhail et al. (2007) that institutional investors listen to analysts. The coefficient for indexing is still signifi-cantly positive; however, its magnitude drops from 1.706 to 1.648. In all, the results suggest that the changein analyst coverage has a partial mediation effect on the influence of stock index adjustment on institutionalinvestors. In other words, the change in institutional holdings of firms added to or dropped from the stockindex results not only from tracking the index portfolio strategies of index funds, but also partially fromthe changed information environments, which affect the portfolio management of institutional investors.Comparing the R-square value in the two regressions, it is about an 8% increase if considering the effect ofanalyst coverage, confirming the influence of analyst coverage on the changes in institutional holdings thatsurround the stock index adjustments.
Table 5 shows the results of more robustness tests. The first two columns compare the firms added to thestock index and their matched samples. Consistent with the results for all of the samples, the coefficients forindexing are significantly positive in both columns. However, the magnitude drops if the influence of analystcoverage is added, as it is also positively related to the changes in institutional holdings. This means that com-pared to matched sample firms, firms added to the stock index attract more analyst coverage, resulting inhigher institutional holdings and increased holdings gained by tracking the index portfolio strategies of theindex funds. Analyst coverage does influence the portfolio management of institutional investors.
This phenomenon is also seen in firms dropped from the stock index, the coefficients for indexing in thesecond two columns and the changes in the analyst coverage—all of which are significant. However, becausedeletion from the stock index does not significantly change the information environment (proxied by numberof analysts4 and stock recommendations5), the stock index adjustment only affects the portfolio managementfor index funds, and not other institutional investors, by influencing their information environments.
The last four columns show the results for stock recommendations. The coefficients for indexing are all sig-nificantly positive, which means that a change in the stock index’s status really affects firms’ institutional hold-ings. If analyst coverage is significant under the regressions for DNumRating, then addition to the stock indexleads to higher institutional holdings not only due to the index portfolio strategies of index funds, but also dueto more stock recommendations.
In all, Tables 4 and 5 suggest that changes in the institutional holdings of firms added to the stock indexpartially result from tracking the index portfolio strategies of index funds, and partially from changes in ana-lyst coverage, which affects the portfolio management of institutional investors.
5.4. Robustness tests6
5.4.1. Another stock index
We also collect all stock index adjustments for the SHCI and SZCI, from when they began to the end of2012 from the WIND database. After dropping the financial industry, our final sample is 98: specifically 49stock index adjustment firms and 49 matched firms. The regression results are better than the previous match-
4 Shown in the third column of Table 2.5 Shown in the third column of Table 3.6 We also consider the stock repurchase influence on our conclusion. However, there is no stock repurchase for our sample firms during
the sample period, so it has no repurchase influence.
S. Zhu et al. / China Journal of Accounting Research 10 (2017) 281–293 291

ing when we use 49 pairs of matched firms from 2009 to 2012. The stock index adjustments significantly affectthe analyst coverage; specifically, addition to the stock index generates more analyst coverage (proxied by thenumber of analysts and stock recommendations) while deletion has no significant effect. Moreover, the chan-ged institutional holdings are partially the result of the changes in analyst coverage, suggesting that index andother funds change their portfolios based on the changed informativeness of the target firms.
5.4.2. Mergers and acquisitions (M&A)
M&A events may significantly change the holdings of institutional investors, coinciding with stock indexadjustments to render our conclusion biased. To avoid the M&A influence, we check our data for theM&A activities during the sample year instead of only concentrating on the sample quarter to allow forthe long M&A process. Of the sample firms added to the stock index (Add), 0 have M&A in the sample year,compared to 0 for matched firms (Match_Add). This result is 2.5% for firms dropped from the index (Drop)and 3.4% for their matched samples (Match_Drop). We include a dummy variable, M&A, in the regression tocheck the influence of stock index adjustments on analyst coverage and institutional holdings. The results arebasically the same as above; that is, the coefficient for M&A is not significant. Thus, our previous conclusionsare not biased on the M&A activities.
5.4.3. Punished by the regulation authoritySome firms may be punished by the regulation authority, China Securities Regulatory Commission
(CSRC), for financial fraud, information disclosure, insider trading or other illegal activities. This then reflectstheir corporate governance and the stewardship of management that affects the valuation of institutionalinvestors. The punishment may also coincide with a stock index adjustment. Thus, to allow for this effect,we also check our data for punishment during the sample year (not only concentrated on the sample quarterto allow for the long process of punishment). Of the sample firms, 2.7% of those added to the stock index(Add) are punished by the CSRC in the sample year, compared to 0.9% for the matched firms (Match_Add).The result is 0.8% for firms dropped from the index (Drop) and 1.7 for their matched samples (Match_Drop).We include a dummy variable, Punish, in the regression to check the influence of the stock index adjustmentson analyst coverage and institutional holdings. The results are basically the same as above that is the coeffi-cient for Punish is not significant. Thus, our previous conclusions are not biased for punishment by the reg-ulation authority.
5.4.4. Self-selection of stock index adjustmentThe stocks that are added to a stock index are selected based on many benchmarks, such as firm size and
liquidity. Such stocks may be larger and perform better than those outside of the stock index; thus, they aremore likely to be followed by analysts.7 The relation between a stock index and the analysts following it maycreate a sample selection problem. We use the Heckman two-step method to address this issue, and the modelsare set as follows.
Indexing ¼ h0 þ h1PreGrowþ h2PreROE þ h3Tradeþ h4MV þ h5PunishþX
hiIndsi þ e ð4ÞModel (4) is the first step (probit model) in determining whether a firm should be added or dropped from
the stock index. Usually, an adjustment to the stock index considers past operating performance, past oper-ating compliance, the industry and growth and the trade volume and market value of the circular stock. Thus,we include the following factors in the first model regression: PreGrow, the sales growth rate for the past year;PreROE, the ROE for the past year; Trade, the trade volume in log form; MV, the market value of the circularstock in log form; and Punish, a dummy variable equal to 1 if the sample firm was punished by the CSRC inthe sample year, and 0 otherwise. Inds are the industry dummy variables; namely, 11 dummy variables for 12industry categories are used by the China Securities Regulatory Commission (CSRC) after dropping the finan-cial industry.
7 Thanks to the anonymous referee for pointing out the endogeneity problem.
292 S. Zhu et al. / China Journal of Accounting Research 10 (2017) 281–293

DNumAnalyst ¼ #0 þ #1IMRþ #2Indexing þ #3DNumInst þ #4DROE þ #5DGROW þ #6DLEV
þ #7DSIZE þ #8Ret þX
#iIndsi þX
#jYearsj þ e ð5ÞModel (5) is the second step of the Heckman tests, where IMR is the inverse Mills ratio. The variables are
defined as in model (1).The regression result shows that the coefficient of IMR is not significant, which means the sample selection
issue is not significant. In contrast, the coefficient of Indexing remains significantly positive, indicating that astock index adjustment does affect the analysts following it for a specific stock. Our conclusion is that the sam-ple selection problem does not have a significant effect.
6. Conclusions
Even though there are several hypotheses in the literature explaining market reactions to stock index adjust-ments, scant rigorous empirical evidence has been provided (Pruitt and Wei, 1989; Chen et al., 2004; Greenand Jame, 2011). Little has been done in terms of the influence of index adjustments on firms’ informationenvironments, which further affects market performance and investor holdings. Using 231 pairs of samplefirms in China, we give direct evidence of the price pressure and investor awareness hypotheses on the stockindex adjustment effect. Our results suggest that changes in institutional holdings for firms added to the stockindex partially result from tracking the index portfolio strategies of index funds, and partially stem from thechanged analyst coverage, which affects the portfolio management of institutional investors. Deletion from anindex does not reflect this phenomenon.
An important weakness of this study is that our sample period is only from 2009 to 2012, which may be tooshort in that it does not cover a bear and a bull market period. The results may appear to be due to a bearmarket sentiment that affects the investors’ behavior, and thus using a longer period may improve the resultsand our conclusions.
References
Baron, R.M., David, A.K., 1986. Moderator-mediator variables distinction in social psychological research: conceptual, strategic, andstatistical considerations. J. Pers. Soc. Psychol. 51, 1173–1182.
Beneish, M.D., Whaley, R.E., 1996. An anatomy of the S&P game: the effects of changing the rules. J. Finance 51 (5), 1909–1930.Cai, J., 2007. What’s in the news? Information content of S&P 500 additions. Financ. Manage. 36 (3), 113–124.Cai, J., Houge, T., 2008. Long-term impact of Russell 2000 index rebalancing. Financ. Anal. J. 64 (4), 76–91.Chakrabarti, R., Huang, W., Jayaraman, N., Lee, J., 2005. Price and volume effects of changes in MSCI indices-nature and causes. J.
Bank. Finance 29, 1237–1264.Chen, H., Noronha, G., Singal, V., 2004. The price response to S&P 500 index additions and deletions: evidence of asymmetry and a new
explanation. J. Finance 59 (4), 1901–1930.Chen, H., Noronha, G., Singal, V., 2006. Index changes and losses to index fund investors. Financ. Anal. J. 62 (4), 31–47.Denis, D.K., McConnell, J.T., Ovtchinnikov, A.V., Yu, Y., 2003. S&P 500 index additions and earnings expectations. J. Finance 58 (5),
1821–1840.Elliott, W.B., Van Ness, B.F., Walker, M.D., Warr, R.S., 2006. What drives the S&P 500 inclusion effect? An analytical survey. Financ.
Manage. 35 (4), 31–48.Green, T.C., Jame, R., 2011. Strategic trading by index funds and liquidity provision around S&P 500 index additions. J. Financ. Market
14, 605–624.Greenwood, R.M., Sosner, N., 2007. Trading patterns and excess comovement of stock returns. Financ. Anal. J. 63 (5), 69–81.Gygax, A.F., Otchere, I., 2010. Index composition changes and the cost of incumbency. J. Bank. Finance 34, 2500–2509.Harris, L., Gurel, E., 1986. Price and volume effects associated with changes in the S&P 500 list: New evidence for the existence of price
pressures. J. Finance 41 (4), 815–829.Lee, C.I., Gleason, K.C., Madura, J., 2008. Intraday and night index arbitrage. Q. J. Finance Account. 47 (2), 3–16.Mikhail, M.B., Walther, B.R., Willis, R.H., 2007. When security analysts talk, who listens? Account. Rev. 82 (5), 1227–1253.O’Brien, P.C., Nhushan, R., 1990. Analyst following and institutional ownership. J. Account. Res. 28, 55–76.Piotroski, J.D., Roulstone, B.T., 2004. The influence of analysts, institutional investors, and insiders on the incorporation of market,
industry, and firm-specific information into stocks prices. Account. Rev. 79 (4), 1119–1151.Platikanova, P., 2008. Long-term price effect of S&P 500 addition and earnings quality. Financ. Anal. J. 64 (5), 62–76.Pruitt, S.W., Wei, K.C., 1989. Institutional ownership and changes in the S&P 500. J. Finance 44 (2), 509–513.Shleifer, A., 1986. Do demand curves for stocks slope down? J. Finance 41 (3), 579–590.
S. Zhu et al. / China Journal of Accounting Research 10 (2017) 281–293 293