Accenture plc (ACN) - Tippie College of Business
28
Important disclosures appear on the last page of this report. The Henry Fund Henry B. Tippie College of Business Jack Wells [[email protected]] Accenture plc (ACN) April 14, 2021 Information Technology – Technology Consulting Services Stock Rating HOLD Investment Thesis Target Price $290-305 We recommend a HOLD rating on Accenture plc with a 2-7% upside. Accenture is positioned for growth in the Technology Services sector due to their exposure to emerging technologies such as cloud and cybersecurity. This expertise is especially important as industries migrate to more digitized infrastructures. Drivers of Thesis • Information Technology spending across industries is recovering at a faster rate than expected, driving our 11.75% revenue growth forecast in 2021. Revenue growth and contract profitability will drive gross margin expansion • Companies that were slow to upgrade their networks before the pandemic are now embracing cloud infrastructures and applications. ACN continues to grow their cloud and digital marketing portfolio through acquisitions and partnerships, which will enhance their digital capabilities across industries • Accenture’s strong partnerships and joint ventures with major technology companies, as well as deep relationships with clients across several industries, exposes them to more IT service spending than competitors Risks to Thesis • Technology stocks may be considered overvalued and could see a pullback as investors switch from growth to value • The pandemic has disproportionately affected emerging economy countries that ACN operates in. Clients in these regions may hold back on IT spending Henry Fund DCF $305 Henry Fund DDM $257 Relative Multiple $169 Price Data Current Price $284 52wk Range $166 – 288 Consensus 1yr Target $297 Key Statistics Market Cap (B) $185.5 Shares Outstanding (M) 666.3 Institutional Ownership 73.28% Beta 1.00 Dividend Yield 1.26% Est. 5yr Growth 9.75% Price/Earnings (TTM) 32.98 Price/Earnings (FY1) 30.80 Price/Sales (TTM) 3.94 Price/Book (mrq) 9.66 Profitability Operating Margin 14.69% Profit Margin 11.52% Return on Assets (TTM) 11.57% Return on Equity (TTM) 31.88% Earnings Estimates Year 2018 2019 2020 2021E 2022E 2023E EPS HF est. $6.46 - $7.49 - $8.03 - $8.72* $9.07 $9.39* $10.21 $10.23* $11.67 growth 16.19% 15.94% 7.21% 13.01% 12.48% 14.33% 12 Month Performance Company Description Accenture is a technology services firm based in Dublin, Ireland that engages in strategy and consulting, technology, and operational services. These services are provided to help clients transform their businesses to compete in today’s digital world. Accenture competes globally through their three geographic segments: North America, Europe, and Emerging Markets. Their customers span over 40 industries organized in their five industry groups: Communications, Media & Technology; Financial Services; Health & Public Service; Products; and Resources. 30.8 31.8 17.7 20.3 30.0 13.0 0 10 20 30 40 P/E Gross Margin (%) EV/EBITDA ACN Industry 0% 10% 20% 30% 40% 50% A M J J A S O N D J F M ACN S&P 500 Source: FactSet Source: YahooFinance *See Earnings Announcement (Pg. 5)
-
Upload
khangminh22 -
Category
Documents
-
view
1 -
download
0
Transcript of Accenture plc (ACN) - Tippie College of Business

Important disclosures appear on the last page of this report.
The Henry Fund
Henry B. Tippie College of Business
Jack Wells [[email protected]]
Accenture plc (ACN) April 14, 2021
Information Technology – Technology Consulting Services Stock Rating HOLD
Investment Thesis Target Price $290-305 We recommend a HOLD rating on Accenture plc with a 2-7% upside. Accenture is positioned for growth in the Technology Services sector due to their exposure to emerging technologies such as cloud and cybersecurity. This expertise is especially important as industries migrate to more digitized infrastructures. Drivers of Thesis
• Information Technology spending across industries is recovering at a faster rate than expected, driving our 11.75% revenue growth forecast in 2021. Revenue growth and contract profitability will drive gross margin expansion
• Companies that were slow to upgrade their networks before the pandemic are now embracing cloud infrastructures and applications. ACN continues to grow their cloud and digital marketing portfolio through acquisitions and partnerships, which will enhance their digital capabilities across industries
• Accenture’s strong partnerships and joint ventures with major technology companies, as well as deep relationships with clients across several industries, exposes them to more IT service spending than competitors
Risks to Thesis
• Technology stocks may be considered overvalued and could see a pullback as investors switch from growth to value
• The pandemic has disproportionately affected emerging economy countries that ACN operates in. Clients in these regions may hold back on IT spending
Henry Fund DCF $305 Henry Fund DDM $257 Relative Multiple $169 Price Data Current Price $284 52wk Range $166 – 288 Consensus 1yr Target $297 Key Statistics Market Cap (B) $185.5 Shares Outstanding (M) 666.3 Institutional Ownership 73.28% Beta 1.00 Dividend Yield 1.26% Est. 5yr Growth 9.75% Price/Earnings (TTM) 32.98 Price/Earnings (FY1) 30.80 Price/Sales (TTM) 3.94 Price/Book (mrq) 9.66 Profitability Operating Margin 14.69% Profit Margin 11.52% Return on Assets (TTM) 11.57% Return on Equity (TTM) 31.88%
Earnings Estimates Year 2018 2019 2020 2021E 2022E 2023E
EPS HF est.
$6.46 -
$7.49 -
$8.03 -
$8.72* $9.07
$9.39* $10.21
$10.23* $11.67
growth 16.19% 15.94% 7.21% 13.01% 12.48% 14.33%
12 Month Performance Company Description
Accenture is a technology services firm based in Dublin, Ireland that engages in strategy and consulting, technology, and operational services. These services are provided to help clients transform their businesses to compete in today’s digital world. Accenture competes globally through their three geographic segments: North America, Europe, and Emerging Markets. Their customers span over 40 industries organized in their five industry groups: Communications, Media & Technology; Financial Services; Health & Public Service; Products; and Resources.
30.8 31.8
17.720.3
30.0
13.0
0
10
20
30
40
P/E Gross Margin (%) EV/EBITDA
ACN Industry
0%
10%
20%
30%
40%
50%
A M J J A S O N D J F M
ACN S&P 500
Source: FactSet
Source: YahooFinance
*See Earnings Announcement (Pg. 5)

Page 2
COMPANY DESCRIPTION
Accenture plc (ACN) is a professional services provider with technology-focused capabilities across their service segments. The company competes worldwide, operating in more than 40 industries with clients in over 120 countries.3 Accenture’s revenue breakdowns by industry groups and geographic segments are in Figure 1.
2020 Revenue Breakdown
Figure 1
Source: ACN 10K
ACN derives its revenues by providing consulting and outsourcing services to each of its industry group segments. They break down their revenues by these two types of work; consulting made up about 55% of 2020 revenues, and outsourcing accounted for the remaining 45%.3 The services differ in that consulting reflects finite, distinct projects with defined outcomes and deliverables, while outsourcing reflects ongoing, repeatable services or capabilities. Consulting services include strategy and management for designing, redesigning and implementing new systems and related processes for clients. ACN also engages in some non-technology consulting. Contracts for consulting generally last six months to two years. Outsourcing contracts typically span several years as they require ongoing services to transition or manage client operations and systems. Each of the Strategy and Consulting, Interactive, Technology, and Operations services are powered by Accenture’s technology expertise; they have a network of over 100 innovation hubs around the world used for R&D on emerging technologies, partnering with growth-stage technology companies, and applying the innovated technologies to clients’ business architectures.3
Communications, Media & Technology
The Communications, Media & Technology industry group is split into three client groups: Communications & Media, High Tech, and Software & Platforms. Communications
and Media companies include wireless, broadcast, entertainment, publishing, cable, and service provider companies. Those clients made up 45% of Communications, Media & Technology revenues in 2020.3
High Tech clients made up 21% of the industry revenue. These companies include enterprise technology, network equipment, semiconductors, consumer technology, aerospace and defense, and medical equipment companies.
Software & Platforms clients are cloud-based enterprises and consumer software companies, as well as social, e-commerce, advertising, and gaming platform companies. These clients made up the remaining 34% of the industry group’s revenues in 2020.3
We forecast the Communications, Media & Technology industry group to grow at 13% in 2021 and a 5.94% CAGR over the eight-year forecast period. Growth for this segment will be driven by increased spending on digitization and cloud infrastructures. 70% of Accenture’s revenues come from emerging technologies like cloud and cybersecurity4; The software, technology, and service providers in this industry group will work with Accenture for its technology expertise as they expand their offerings to digitizing businesses.
Financial Services
Accenture’s Financial Services segment is split between Banking & Capital Markets clients and Insurance clients. Banking & Capital Markets businesses accounted for 69% of Financial services revenue in 2020 and includes retail and commercial banks, mortgage lenders, payment providers, investment banks, wealth and asset management firms, and other diversified financial enterprises. The other 31% of Financial Services revenues came from insurance companies.3
We expect Financial Services revenues to grow by 15% in 2020 and a 5.92% CAGR over the forecast period. Financial Services is one of the industries that is continuing to invest in new technologies like cloud, artificial intelligence (AI), and 5G to increase operational efficiency and security while decreasing costs. Gartner research predicts banking and securities and insurance IT spending to resemble pre-pandemic levels by the end of 2021.5 We expect spending on these infrastructure upgrades to increase rapidly as the pandemic subsides, and Accenture will benefit from

Page 3
helping banking clients continue their digital transformations.
Health & Public Services
Clients in the Health & Public Services industry group include healthcare providers and insurers, which made up 36% of the industry revenue for Accenture in 2020. The other 64% of revenues came from the public service sub-industry, which includes defense departments, public safety authorities, human and social services agencies, educational institutions, and cities. Accenture Federal Services, a wholly owned subsidiary of ACN, works specifically with the US federal government which represented about 35% of Health & Public Services revenues and 14% of North American revenues in 2020.3
We forecast the Health & Public Services segment to account for the highest revenue growth of any industry over the forecast period. We have revenues in this segment growing at 16% in 2020 and a 6.54% CAGR over the next 8 years. There has been a lot of pressure and necessity for enterprises in this industry to upgrade their digital infrastructures to improve healthcare quality and costs. Spending on new technologies for healthcare has accelerated during the pandemic because of the need for integrated networks to help with contracting abilities, care management, and analytics to evaluate cost and quality performance in real time. Digital modernization will increase further in the healthcare industry because of new trends like telehealth, value-based care, and a changing supply chain for medical equipment.
We also expect public services institutions in areas like education and defense to increase spending on technologies. Educational institutions will continue incorporating some sort of hybrid learning environments, and defense departments and military forces will upgrade their cybersecurity networks and intelligence technologies. These spending increases will benefit Accenture as they help these clients migrate to cloud-based infrastructures with enhanced security. Accenture Federal Services will also likely benefit from the American Jobs Plan which will dedicate substantial investments to emerging technologies.
Products
The Products industry group has traditionally generated more revenues than any other industry segment. Products
is divided into three sub-segments: Consumer Goods, Retail & Travel Services; Industrial; and Life Sciences. Consumer Goods, Retail & Travel Services businesses accounted for 52% of total Products revenue in 2020.3
These clients range from food and beverage, household goods, and tobacco companies to agribusiness, airlines, and department stores. Accenture’s Industrial clients are electrical equipment manufacturers and suppliers, construction and heavy equipment companies, real estate business services, consumer durables, freight and logistics, and automotive and public transportation companies. Those businesses made up 25% of Products revenues. The remaining 24% of 2020 Products sales came from Life Sciences companies, such as biopharmaceuticals, medical technology, and biotechnology companies and distributors.3
We forecast Products revenues to grow at 10% in 2021 and a 5.83% CAGR over our forecast period. Consumer goods companies like supermarkets and retailers will rely on Accenture’s help to transform their business models to reflect shifting trends in shopping habits. These trends include technologies and applications that make shopping more efficient for consumers, as well as analytics and business intelligence technology to recognize purchasing behaviors and manage inventory. However, retailers that were severely adversely impacted by the pandemic may have to put off IT spending for a year or two as they recover.
Industrial clients like logistics and public transportation companies will also invest in Internet of Things (IoT), business intelligence, and security technologies to enhance efficiencies to their businesses. We also expect high growth in biopharmaceutical and medical technology IT spending for similar reasons as the Health & Public Services segment.
Resources
The Resources industry group comprises three sub-segments: Chemicals & Natural Resources, Energy, and Utilities. Chemical & Natural Resources clients make up 30% of the group’s sales. Energy companies in the oil and gas industry make up 28% of the group’s revenues, and the remaining 42% of revenues are earned from electric, gas, water, and new energy providers.3
Resources is Accenture’s smallest industry by revenue and is forecast to grow at the lowest rate going forward. We

Page 4
expect 4% revenue growth in 2021 and a 3.74% CAGR over the next eight years. This industry group was the most negatively impacted by COVID due to decreases in oil and natural gas demand. It was also Accenture’s only industry group with a Q2 FY21 decrease in revenues compared to the same period last year.6
The Energy and Chemicals industries in this product group continue to be under some pressure which will impact their spending on technology. However, Accenture management noted in their recent earnings call that they are working with energy plants from health and safety, security, and efficiency perspectives, and they believe they are well positioned to help these industries going forward.7 We believe moves to modernize the energy sector, such as through the Biden administration’s new American Jobs Plan, will expose ACN to more enterprise spending for their services.
Cost Structure Analysis
Figure 2
Sources: ACN 10K, HF Model
Figure 2 above shows Accenture’s gross, operating, and net margins since 2017 and forecast through 2028. Cost of services is Accenture’s largest expense, consisting of its various compensation costs for contract delivery, recruiting and training, and software development. Accenture’s other largest expenses are sales & marketing and general & administrative costs, respectively.
We forecast cost of services to slightly decrease as a percentage of revenues over the forecast period as they have been over the past several years. Sales & marketing and general & administrative costs are forecast as a constant percentage of revenues based on a historical average.
The decrease in cost of services as a percentage of sales drives our forecasted increase in operating margins. ACN operating margin has increased from 12.6% to 14.7% over the past four years, and we expect that trend to continue as the company enhances operational efficiencies and contract profitability.
Figure 3 below shows operating income and margins for each of Accenture’s industry segments in 2019 and 2018, before they changed their reportable segments to geographies in 2020. Communications, Media & Technology yields the highest operating margin, while Products is the most lucrative segment.
Industry Segment Income and Margins
Figure 3 ($ millions)
Source: ACN 10K
Additional Company Analysis
The biggest driver for revenue growth in each of Accenture’s industry groups is increased enterprise spending on technology infrastructure. Businesses in all industries are undergoing rapid digitization. Gartner research forecasts $4.1 trillion in worldwide IT spending in 2021, an increase of 8.4% from 2020.8 Businesses cut back on technology spending during the initial stages of the pandemic, leading to decreased IT spending of 2.2% in 2020, but we are confident that digital transformations sweeping through all industries will drive spending in the future. This is an investment positive for Accenture as they help businesses migrate to the cloud and update other aspects of their infrastructures and applications. Accenture has a history of investing early in emerging technologies and just doubled down on their cloud strategy with plans to spend $3 billion on Accenture Cloud First over the next three years.7 Accenture Cloud First is a multi-service group that helps clients across all industries accelerate digital transformations.
In 2020 Accenture began managing its business under a new growth model through its North America, Europe, and Growth Markets geographic segments.3 These segments are now the company’s reportable segments rather than
Operating
Income
Operating
Margin
Operating
Income
Operating
Margin
Communications, Media & Technology 1,555$ 18% 1,380$ 17%
Financial Services 1,238$ 15% 1,365$ 16%
Health & Public Service 739$ 10% 766$ 11%
Products 1,720$ 14% 1,664$ 15%
Resources 1,053$ 16% 724$ 12%
TOTAL 6,305$ 14.6% 5,899$ 14.4%
FY2019 FY2018

Page 5
the industry groups described earlier in the report. ACN still goes to market by industry, but the new growth model simplifies their organizational structure and allows their multi-service teams to have more agility between global and local clients. Accenture’s global presence has led to their operating in over 40 industries, which gives them expertise to provide industry-specific solutions, as well as cross-industry insights. This also protects them from any industry-specific IT spending pressure.
Another differentiator for ACN is its strong partnerships and joint ventures with major technology companies such as Microsoft, Amazon Web Services, Google, SAP, and Salesforce. Accenture’s over 180 partners extend their technology and business capabilities. Some of these relationships span decades such as Avanade, their joint venture with Microsoft, that was formed in 2000.9 Accenture also has deep relationships with clients in all its industry segments. Of Accenture’s top 100 clients, about 97 have worked with ACN for more than a decade.4
Security is another area where we see potential high growth for Accenture. ACN works with all the leading cybersecurity providers, which positions them well to capitalize on increased security spending across all industries. According to IDC data, managed security services accounted for about 43% of the $55 billion security market in 2019. We expect that to grow rapidly as businesses digitize their infrastructures and cyber-attacks become more prevalent.10 Businesses with sensitive information like financial services and healthcare companies will especially drive revenue growth for Accenture’s cybersecurity services.
Debt Maturity Analysis
Accenture historically has very little debt compared to equity and has no plans to change their capital structure. They currently have an A+ credit rating from S&P with a stable outlook.2 They have multiple borrowing facilities including syndicated loans, revolving credit facilities and guaranteed lines of credit but currently have no borrowings under said facilities. Total outstanding debt was about $62 million in 2020, and Accenture consistently maintains enough cash to pay off the debt they incur.3
ESG Analysis
Accenture has a low total ESG Risk score of 11, which is only in the 3rd percentile.1 Their Environment Risk Score,
Social Risk Score, and Governance Risk Score are 0.6, 5.0, and 5.8, respectively, according to Sustainalytics.1 They are not involved in any products or activities that are considered significantly risky by ESG standards.
ACN tries to play their part in sustainability by partnering with the United Nations to challenge and support companies to work on Sustainable Development Goals (SDG’s).11 SDG’s include gender equality, climate action, and quality education.
Accenture has lower ESG risk than competitors like IBM, DXC, Tata Consultancy, and Cognizant. Capgemini is the only competitor with lower ESG risk, with a Sustainalytics ESG Risk score of 10 versus Accenture’s 11.1
RECENT DEVELOPMENTS
2021 Q2 Earnings Announcement
Accenture’s latest earnings call on March 18th highlighted a strong quarter and a return to pre-pandemic growth. Management increased all elements of its full-year outlook after recording record new bookings of $16 billion, with 18 clients having $100 million in bookings each.7 Half of bookings came from consulting and the other half outsourcing, and the majority of bookings were driven by technology services and operations. The results show Accenture taking market share faster than they did pre-pandemic.
Earnings came in at $2.03 per share and revenue at $12.1 billion, beating expectations of $1.90 per share on revenues of $11.8 billion. ACN has an optimistic outlook for the second half of 2021 and beyond for all markets, services, and industries of its business. They emphasized their focus on Accenture Cloud First, planning to invest $3 billion over three years to help clients move to the cloud.7 ACN management forecasts overall cloud growth to continue its double-digit growth that it had in Q2.
Management guidance for FY21 revenues is $47.2-$48.1 billion. We forecast $49.5 billion in revenues, which is also higher than analyst consensus of $49.1 billion. Guidance for FY21 EPS is $8.67 to $8.85, and analyst consensus is $8.72. However, management only gives guidance and FactSet only gives estimates for diluted EPS. We do not have sufficient information to calculate estimated basic EPS for Accenture management or other analysts, but those numbers would be closer to our EPS estimates.

Page 6
We are confident in our revenue and EPS estimates being slightly higher than consensus due to our bullish outlook on enterprise IT services spending across industries in the next three years.
COVID-19 Impact
The pandemic was, for the most part, beneficial to Accenture’s operations. Their consulting segment did not do as well as outsourcing due to the nature of the work being more hands-on and decreased enterprise IT spending. Consulting revenues were up 4% and outsourcing up 14% in the latest quarter.6 In addition, there are certain industries that have delayed work with Accenture as a result of the pandemic, especially in the Travel and Energy industries that were more significantly impacted.
Most of Accenture’s operations and financial results were positively impacted by the pandemic. Accenture saw increased demand from clients across most industry groups in connection with their digital transformations, cloud adoptions and security demand. Covid has accelerated the need for businesses to innovate with rapid adoptions of emerging technologies, which is now being seen in both digital leaders and businesses that were lagging in digital transformations pre-pandemic. Our forecast takes this increased demand across industries into account, and we expect more demand for Accenture’s services over the next five years.
Venture & Acquisition Activity
Accenture engages in a lot of acquisition activity to enhance its broad services portfolio. They refer to these activities as ventures and acquisitions (V&A) rather than M&A because they often partner with and invest in growth-stage companies to create innovative enterprise technologies.3 V&A activity typically amounts to about 20% of ACN operating cash flow annually, and CEO Julie Sweet gave guidance on acquisitions of at least $2 billion for FY21.7 ACN typically does not disclose financial terms of these deals. Much of their acquisition focus recently has been on smaller companies that will grow their digital, cloud, and security portfolios. We view this as an investment positive because of the digitization sweeping across industries as mentioned earlier. Recent acquisitions include Wolox, an Argentinean cloud-native company that will improve Accenture Cloud First capabilities. Other recent acquisitions include Real Protect, a Brazilian
security and cyber defense provider, and Sentelis, a data consulting company specializing in designing and scaling data and AI capabilities. Acquisitions of these companies help Accenture scale their business across the world and expand to emerging markets. Figure 4 below shows Accenture’s recent M&A and joint venture activity in 2021.
ACN Recent V&A Activity
Figure 4
Source: Bloomberg MA
The technology services industry is consolidating as larger competitors acquire smaller players to enhance their industry expertise in niche areas and enter new geographic markets. We believe Accenture’s high volume of acquisitions is a good strategy for growth because they have focused acquisitions on emerging technology companies dispersed throughout the world, and they scale these companies up after acquiring them. This kind of M&A strategy will give companies more exposure to increased spending on cloud, artificial intelligence, automation, analytics, and security. Capgemini, Cognizant, and EPAM have also made several acquisitions of smaller technology companies over the past year.
MARKETS AND COMPETITION
Accenture faces strong competition in the Technology Services industry. A small number of companies command relatively high market share, and many smaller players compete with low barriers to entry. Accenture competes with other multinational IT service providers, including the service business segments of technology companies. They also compete with offshore IT service providers in lower cost locations like India, as well as large private firms like Deloitte that provide consulting and other IT services. Accenture is a leader in this industry because of the full range of services they provide at a global scale, which is
Deal Type Announcement Date Target Name
Acquisition 4/7/2021 CoreCompete, Inc.
JV 4/1/2021 SUMIKA DX ACCENT
Acquisition 3/29/2021 Cygni Group
Acquisition 3/10/2021 fable+
Acquisition 3/9/2021 RichRelevance
Acquisition 3/3/2021 Repl Group Worldwide
Acquisition 3/1/2021 Cirrus Connect
Acquisition 3/1/2021 GRA Supply Chain
Acquisition 3/1/2021 Pollux Automation
Acquisition 2/16/2021 Infinity Works Consulting
Acquisition 2/15/2021 Edenhouse Solutions
Acquisition 2/2/2021 Future State
Acquisition 2/2/2021 Businessnet System
Acquisition 2/1/2021 Imaginea Technologies
Acquisition 1/15/2021 Wolox
Acquisition 1/11/2021 Real Protect Informatics

Page 7
not replicated by any of its competitors. This also makes it difficult to compare Accenture to its competitors because they all compete only in some of the same segments and locations as ACN. The market share breakdown can be seen in figure 5 below.
Figure 5
Source: Bloomberg BI
Companies most poised for growth in this industry are those more exposed to emerging technologies. Competitors that base their revenues on legacy services, such as hardware rather than cloud, will struggle as businesses go through digital transformations. We expect a recovery in IT spending on projects after businesses put them off during the pandemic. Other key themes to consider within the industry are client relationships, headcount utilization, acquisition activity, geographic scale, and types of services provided.
Competitors
Accenture’s competitors in the Technology Services industry include IBM, Deloitte, EPAM Systems (EPAM), DXC Technology (DXC), Capgemini (CAP), and Cognizant (CTSH), among many others. Financial metric comparisons of these companies are in Figure 6. Deloitte is missing because it is privately owned, but they reported revenues of $47.6 billion in FY2020.12
Figure 6 ($ millions)
Source: FactSet
Accenture is the largest competitor by market cap. They lag IBM in sales and gross margins, but IBM’s service segments only make up about 65% of their total revenues.13 ACN has a relatively high P/E ratio which is likely based on their high growth expectations. EPAM has a much higher P/E ratio than other competitors as its price increased dramatically over the past year. We believe EPAM has similar growth expectations to ACN because of their high exposure to emerging technology service offerings.
Technology Exposure
The pandemic halted enterprise IT spending in 2020, but spending is beginning to rebound and will grow rapidly in the next few years. Figure 7 below is the IDC Worldwide IT Services Spending forecast through 2024. We believe the IDC’s 2021 forecast is low, as the vaccine rollout has gone better than expected and businesses have shown signs of increased spending since this forecast was made.
Worldwide IT Services Spending
Figure 7
Source: IDC, December 202014
Figure 8
Source: Bloomberg Intelligence
Accenture’s recent record bookings is another sign that enterprises are already spending on technology services

Page 8
again. Increased IT spending is the most important trend in the Technology Services industry, and Accenture is the best positioned to benefit from the trend as 70% of their sales come from emerging technologies, as Figure 8 shows. That percentage of revenues from emerging technologies is the highest in the IT services industry.4 Capgemini also has high exposure to these products with 65% of revenues coming from technologies like cloud and security.10
ACN also benefits in that more than half of their revenues come from consulting, which will likely see revenue growth as businesses invest in transforming their infrastructures. Accenture provides end-to-end services as companies begin their network upgrades. Competitors like IBM and DXC, who are more focused on outsourcing rather than consulting, will not capture the same revenues from industries that are transitioning to digitized business architectures. As seen in Figure 9 below, only the “big four” accounting firms have larger consulting market share, but these companies focus more on accounting and finance consulting rather than technology and operations strategy.
Figure 9
Source: Gartner Research15
Client Relationships
Partnerships and joint ventures with major clients are a competitive advantage for companies in the Technology Services industry. These relationships help expand addressable markets beyond technology budgets and give competitors more industry expertise. As mentioned, Accenture has strong partner relationships with many of its clients that span decades. Figure 10 below compares client relationships for Accenture, Tata Consultancy, and Infosys.
“Diamond” clients are those who contribute at least $100 million to annual sales. Accenture has strong relationships with their 216 diamond clients which make up almost 50% of total sales, and these partnerships will help them drive revenues going forward. EPAM Systems also reports that about 31% of their 2020 revenues came from their top 10 customers.16
Exposure to Top Clients
Figure 10 ($ billions)
Source: Bloomberg Intelligence
Geographic Dispersion
Accenture has a history of moving early into low-cost regions to capture growth markets before competitors. Competitors disclose their geographic segments in various ways: IBM generates 46.3% of revenues in North America, 32.1% in EMEA, and 21.6% in Asia. EPAM competes only in Europe, North America, and Russia. DXC earns most of their revenues in the United States and Europe. We believe Accenture’s diverse geographic presence allows them to offset any suppressed spending in certain markets and capture IT spending in emerging economies better than most of their competitors.
Headcount Utilization
Headcount utilization is a key profitability metric for IT service firms. Because these firms deliver services rather than products, they can measure profitability by the proportion of billable hours to total working hours of their employees. Many competitors do not disclose their headcount utilization rate, but Accenture is a leader of those that do. This is important because it shows how efficient Accenture employees are across all regions. Figure 11 below shows headcount utilization rates of Accenture and its competitors that disclose headcount information.
Accenture Tata Consultancy Infosys
TTM Sales $44.70 $21.66 $13.15
Clients
Contributing $100+
Million
216 48 29
Assumed Revenue
from "Diamond"
Clients
$21.60 $4.80 $2.90
Contribution to
Sales48.3% 22.2% 22.1%

Page 9
Figure 11
Source: CFRA Industry Survey
Overall, we view Accenture, EPAM Systems, and Capgemini as having the best outlook going forward to due to their expertise in emerging technologies and partnerships with global technology leaders. Accenture has much more experience in consulting, while EPAM has traditionally focused on their software engineering, but EPAM’s newer consulting focus will help them build stronger relationships across multiple industries. Competitors like IBM and DXC are having a harder time transitioning from legacy products to digital and therefore will see less growth going forward.
ECONOMIC OUTLOOK
Real GDP
United States Real Gross Domestic Product (GDP) increased 4.1% in the fourth quarter of 2020. The growth reflects a continued economic recovery from the pandemic. We expect real GDP to grow at 6.5% in 2021 due to more vaccinations and the latest stimulus bill, as well as the proposed American Jobs Plan. Recent positive jobs numbers will also impact growth in GDP. This forecast bodes well for Accenture, as GDP growth will increase enterprise spending on IT infrastructure and accelerate business digitization strategies.
Figure 12
Source: FRED Economic Data17
The sluggish progress of vaccinations outside the US will likely keep other economies from growing at the same rate as the US. This could negatively impact Accenture as they provide their services globally, including around 21% in growth markets. We also see inflation as a potential risk to GDP growth. Record spending by the US government on stimulus and a potential infrastructure bill, coupled with pent-up demand and high consumer savings, could lead to inflation in the near term. If that happens, the Fed may raise interest rates, which would slow growth. We recognize this threat, but do not expect inflation to get out of control.
Business Confidence Index
The business confidence index (BCI) is used to monitor output growth and predict changes in economic activity. A BCI above 100 suggests increased confidence in the performance of businesses in the near term, while numbers below 100 indicate the opposite. The BCI recently rose above 100 as the economy has begun to reopen and vaccinations have been administered. The positive BCI is another reason we are bullish on Accenture. As business confidence continues to increase, enterprises will invest in upgrades to their IT infrastructures to support their recoveries and will look to Accenture for help.
Business Confidence Index
Figure 13
Source: OECD18
Interest Rates
The United States has experienced a historically low interest rate environment during the pandemic due to low treasury yields. The fed plans to hold steady on low short-term interest rates through 2023, but we are seeing increased pressure on long term interest rates with the 10-year moving as high as 1.75% and the bond now around 2.35%. Increasing long-term rates will make borrowing
2017 2018 2019 2020
Accenture 91.0 91.0 91.0 93.0
EPAM Systems 78.4 78.1 77.9 78.2
Gartner, Inc 64.0 63.0 62.0 63.3
Cognizant Technology 92.0 92.0 92.0 91.0
Average 81.4 81.0 80.7 81.4
Headcount Utilization (%)Company

Page 10
more costly for companies in the IT services industry, but Accenture does not have significant debt.
Comparable Treasuries
Figure 14
Source: FactSet
Rising interest rates are mostly due to sell-offs because of economic recovery expectations. This could hurt growth stocks in the technology sector like Accenture in the short term, but we do not believe it will be a significant as these companies will benefit overall from the pandemic recovery.
VALUATION
We calculated an intrinsic share price for Accenture using the discounted cash flow (DCF), economic profit (EP), dividend discount model (DDM), and relative valuation methods. We believe the DCF and EP models accurately reflect an intrinsic value of the company based on its operating profits and assets, and we believe the DDM provides a “floor” price for Accenture based on their dividends returned to shareholders. Each of these models is a product of assumptions highlighted below.
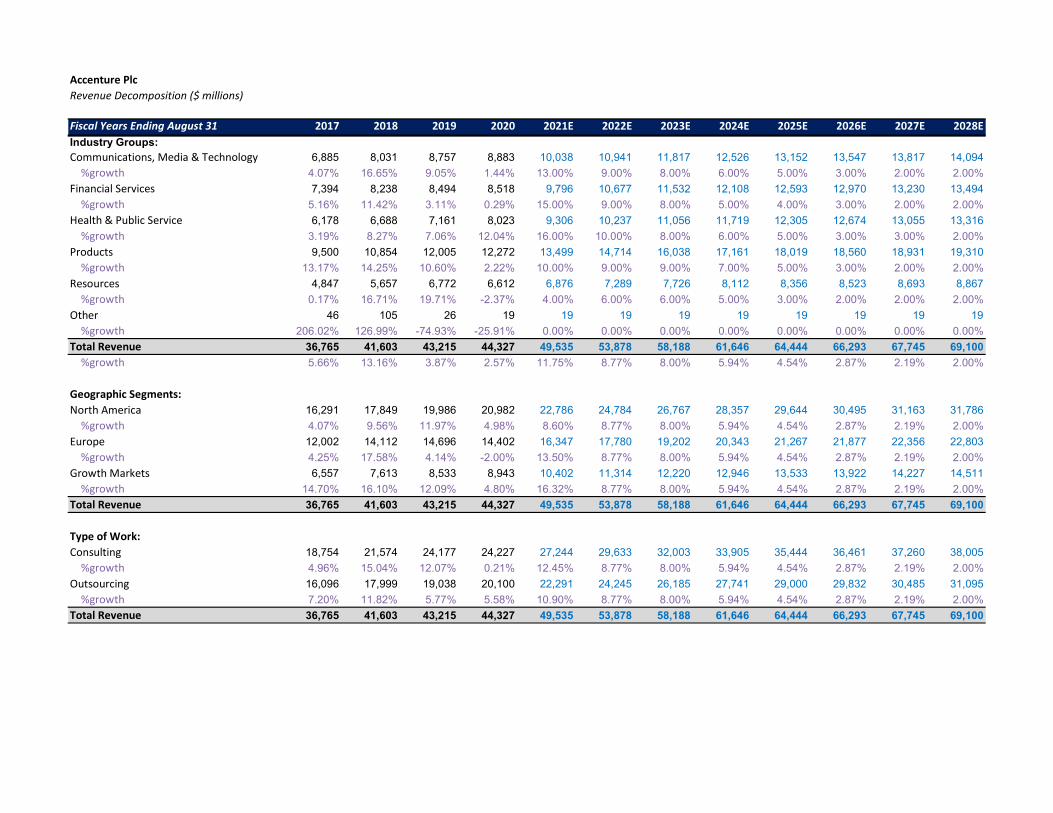
Revenues
Figure 15 shows revenue growth since 2017 and assumptions through 2028 for each of Accenture’s industry segments. These assumptions were detailed in the company description section. We are bullish on all segments in the near term with Health & Public Services seeing the highest growth. We forecast Resources as the slowest-growing industry, with low single-digit growth throughout the forecast period.
Figure 15
Source: HF Forecast and ACN 10K
Figure 16 below gives a clearer picture of total revenue growth throughout the forecast period. We expect overall revenue growth to have a continuing value around 2%, which is in line with our long-term real GDP growth expectations. Our revenue estimates for 2021 through 2023 are slightly higher than analyst consensus estimates. For example, we have total revenues growing at 11.75%, 8.77%, and 8.00% for 2021, 2022 and 2023, respectively. Analysts have growth rates of 10.60%, 7.57%, and 7.16% for the same years. We are more bullish about enterprise IT spending as companies across every industry shift to cloud-based infrastructures with help from Accenture.
Figure 16
Source: HF Forecast and ACN 10K
Cost of Sales and Operating Expenses
Cost of services have decreased over the past five years from 68.37% of revenues in 2016 to 64.47% in 2020. We forecast cost of services to slightly decrease as a percentage of revenues every year as Accenture takes advantage of more operational efficiencies through their new growth model described earlier in the report.

Page 11
Sales and marketing, general and administrative, and research and development expenses are forecast as constant percentages of total revenues. Each of these expenses have remained relatively consistent as a percentage of revenues over the past 10 years.
Investments
Accenture’s long-term investments have increased over the past five years from $199 million in 2016 to $325 million in 2020. We forecast this trend to continue in our forecast period. These investments consist of equity securities in publicly traded and privately held companies. The largest portion of their long-term investments is from Accenture’s investment in Duck Creek Technologies, which had a carrying amount of about $230 million in 2020.
Payouts
ACN pays dividends and repurchases shares consistently. Their historical dividend payout ratio has averaged about 39% over the last 10 years, and we expect that ratio to continue through our forecast horizon.
FactSet analysts have diluted earnings growing at 10.5%, 7.8%, and 9.4% in 2021, 2022, and 2023, respectively. These growth rates are lower than our 13.0%, 12.5%, and 14.3% basic earnings growth rates for the same years. We are comfortable with our growth rates being higher due to our more bullish revenue and margin estimates for the next few years. In addition, Accenture’s earnings growth has averaged 13.1% over the last three fiscal years. Our average earnings growth is 10% for the full forecast period. Our dividend and earnings forecasts can be seen in Figure 17 below.
Figure 17
Source: HF Forecast
We expect annual stock repurchases to be consistent with Accenture’s historical average, around $2.5 billion.
Capital Expenditures
We grew capital expenditures using management guidance, which is $2 billion for 2021. After that, capital expenditures increase by our forecasted inflation rate which stays around 2%. Depreciation expense significantly increased in 2020, which we took into account for our 2021 depreciation forecast. After that, depreciation is forecast as a percentage of net PPE.
Discounted Cash Flow and Economic Profit
Our DCF and EP models return a price of $305. These models incorporate a WACC of 7.03%, which is based on the following assumptions:
• 2.22% risk-free rate based on the 20-year Treasury
• 1.00 beta based on 5, 2, and 1 year monthly and weekly betas7
• Henry Fund-estimated Equity Risk Premium of 4.90%
• 2.70% pre-tax cost of debt based on the risk-free rate plus a Tech Services credit spread2
• 98.2% market value weight of equity and 1.8% market value weight of debt
We believe these models give an accurate intrinsic value of the company based on its operating profits and invested capital. We then used sensitivity testing to provide a target price range. A breakdown of our DCF and EP calculations can be found in the appendix.
Dividend Discount Model
Our DDM model yields a price of $257. We believe this model provides a floor price of Accenture based on the dividend growth that we highlighted in the Payouts section. The 3.5% continuing value of EPS we used is based on a long-term growth rate of the Technology Services industry related to the economy. We have CV year ROE of 27.59% and used a 7.12% cost of equity.
Relative Valuation
We used a Price-to-Earnings multiple to find the relative value of Accenture’s stock. We compared six competitors to come up with relative values of $169 and $220 for 2021 and 2022, respectively. Accenture’s P/E is on the high end

Page 12
compared to competitors, likely because they still have a lot of growth potential as businesses rely on their services to help with digital transformations. We do not believe the relative valuation gives a good indication of Accenture’s price because they do not have any pure competitors.
KEYS TO MONITOR
Accenture is well positioned to continue taking market share in the technology services industry. Their global presence, early investments in emerging technologies, and strong partnerships and relationships that span decades with clients are all key differentiators that will drive growth going forward. Keys to monitor that will affect Accenture’s intrinsic value going forward include:
• Enterprise IT spending by industry
• Competitor investments in technology
• Pullback in technology stock prices
• Pandemic recovery in growth markets
We believe ACN is currently trading slightly below its intrinsic price according to our DCF model. Any economic downturn caused by a resurgence of the pandemic, or from inflation related to fiscal spending and the economy reopening, could hurt Accenture’s stock price. However, we are bullish on the economy performing well in the short term and believe Accenture will be able to outperform peers due to its competitive advantages.

Page 13
REFERENCES
1. YahooFinance (ACN) 2. FactSet (ACN_US) 3. Accenture 10K 4. Bloomberg BI – Accenture Outlook 5. https://www.gartner.com/en/newsroom/press-
releases/2021-04-07-gartner-forecasts-worldwide-it-spending-to-reach-4-trillion-in-2021
6. ACN 10Q - FY21 Q2 7. ACN FY21 Q2 Earnings Call 8. https://www.gartner.com/en/newsroom/press-
releases/2021-04-07-gartner-forecasts-worldwide-it-spending-to-reach-4-trillion-in-2021
9. https://www.avanade.com/en-us/about-avanade/story
10. Bloomberg BI – Technology Services Industry 11. https://www.accenture.com/us-
en/about/responsible-business/responsible-company-citizen
12. https://www2.deloitte.com/az/en/pages/about-deloitte/articles/global-revenue-announcement1.html
13. IBM FY20 Annual Report 14. IDC Worldwide IT Spending Forecast (December 2020) 15. Gartner Research – 2020 Global Consulting Market
Share 16. EPAM Systems, inc. FY20 10K 17. St Louis FRED – Real GDP Growth 18. OECD Business Confidence Index
DISCLAIMER
Henry Fund reports are created by graduate students in the Applied Securities Management program at the University of Iowa’s Tippie College of Business. These reports provide potential employers and other interested parties an example of the analytical skills, investment knowledge, and communication abilities of our students. Henry Fund analysts are not registered investment advisors, brokers or licensed financial professionals. The investment opinion contained in this report does not represent an offer or solicitation to buy or sell any of the aforementioned securities. Unless otherwise noted, facts and figures included in this report are from publicly available sources. This report is not a complete compilation of data, and its accuracy is not guaranteed. From time to time, the University of Iowa, its faculty, staff, students, or the Henry Fund may hold an investment position in the companies mentioned in this report.
Accenture PlcRevenue Decomposition ($ millions)
Fiscal Years Ending August 31 2017 2018 2019 2020 2021E 2022E 2023E 2024E 2025E 2026E 2027E 2028EIndustry Groups:Communications, Media & Technology 6,885 8,031 8,757 8,883 10,038 10,941 11,817 12,526 13,152 13,547 13,817 14,094
%growth 4.07% 16.65% 9.05% 1.44% 13.00% 9.00% 8.00% 6.00% 5.00% 3.00% 2.00% 2.00%
Financial Services 7,394 8,238 8,494 8,518 9,796 10,677 11,532 12,108 12,593 12,970 13,230 13,494
%growth 5.16% 11.42% 3.11% 0.29% 15.00% 9.00% 8.00% 5.00% 4.00% 3.00% 2.00% 2.00%
Health & Public Service 6,178 6,688 7,161 8,023 9,306 10,237 11,056 11,719 12,305 12,674 13,055 13,316
%growth 3.19% 8.27% 7.06% 12.04% 16.00% 10.00% 8.00% 6.00% 5.00% 3.00% 3.00% 2.00%
Products 9,500 10,854 12,005 12,272 13,499 14,714 16,038 17,161 18,019 18,560 18,931 19,310
%growth 13.17% 14.25% 10.60% 2.22% 10.00% 9.00% 9.00% 7.00% 5.00% 3.00% 2.00% 2.00%
Resources 4,847 5,657 6,772 6,612 6,876 7,289 7,726 8,112 8,356 8,523 8,693 8,867
%growth 0.17% 16.71% 19.71% -2.37% 4.00% 6.00% 6.00% 5.00% 3.00% 2.00% 2.00% 2.00%
Other 46 105 26 19 19 19 19 19 19 19 19 19
%growth 206.02% 126.99% -74.93% -25.91% 0.00% 0.00% 0.00% 0.00% 0.00% 0.00% 0.00% 0.00%
Total Revenue 36,765 41,603 43,215 44,327 49,535 53,878 58,188 61,646 64,444 66,293 67,745 69,100
%growth 5.66% 13.16% 3.87% 2.57% 11.75% 8.77% 8.00% 5.94% 4.54% 2.87% 2.19% 2.00%
Geographic Segments:North America 16,291 17,849 19,986 20,982 22,786 24,784 26,767 28,357 29,644 30,495 31,163 31,786
%growth 4.07% 9.56% 11.97% 4.98% 8.60% 8.77% 8.00% 5.94% 4.54% 2.87% 2.19% 2.00%
Europe 12,002 14,112 14,696 14,402 16,347 17,780 19,202 20,343 21,267 21,877 22,356 22,803
%growth 4.25% 17.58% 4.14% -2.00% 13.50% 8.77% 8.00% 5.94% 4.54% 2.87% 2.19% 2.00%
Growth Markets 6,557 7,613 8,533 8,943 10,402 11,314 12,220 12,946 13,533 13,922 14,227 14,511
%growth 14.70% 16.10% 12.09% 4.80% 16.32% 8.77% 8.00% 5.94% 4.54% 2.87% 2.19% 2.00%
Total Revenue 36,765 41,603 43,215 44,327 49,535 53,878 58,188 61,646 64,444 66,293 67,745 69,100
Type of Work:Consulting 18,754 21,574 24,177 24,227 27,244 29,633 32,003 33,905 35,444 36,461 37,260 38,005
%growth 4.96% 15.04% 12.07% 0.21% 12.45% 8.77% 8.00% 5.94% 4.54% 2.87% 2.19% 2.00%
Outsourcing 16,096 17,999 19,038 20,100 22,291 24,245 26,185 27,741 29,000 29,832 30,485 31,095
%growth 7.20% 11.82% 5.77% 5.58% 10.90% 8.77% 8.00% 5.94% 4.54% 2.87% 2.19% 2.00%
Total Revenue 36,765 41,603 43,215 44,327 49,535 53,878 58,188 61,646 64,444 66,293 67,745 69,100

Accenture PlcIncome Statement ($ millions)
Fiscal Years Ending August 31 2017 2018 2019 2020 2021E 2022E 2023E 2024E 2025E 2026E 2027E 2028ERevenues:
Revenue 36,765 41,603 43,215 44,327 49,535 53,878 58,188 61,646 64,444 66,293 67,745 69,100
Operating Expenses:
Cost of services excl. D&A 24,933 28,234 29,008 28,578 32,198 34,951 37,671 39,830 41,555 42,661 43,509 44,290
Depreciation and Amortization 802 927 893 1,773 1,830 1,900 1,740 2,056 2,139 2,214 2,292 2,372
Sales & marketing 3,754 4,199 4,447 4,626 5,081 5,527 5,969 6,323 6,610 6,800 6,949 7,088
General & administrative costs 1,429 1,613 1,762 1,966 1,967 2,139 2,310 2,447 2,558 2,632 2,689 2,743
Research & Development 704 791 800 871 939 1,022 1,103 1,169 1,222 1,257 1,284 1,310
Total operating expenses 32,133 35,762 36,910 37,813 42,015 45,538 48,794 51,826 54,084 55,564 56,724 57,803
Operating income 4,633 5,841 6,305 6,514 7,520 8,340 9,394 9,820 10,360 10,729 11,022 11,297
Interest income 38 56 88 69 91 94 113 134 158 183 210 237
Interest expense 16 20 23 33 33 36 38 45 47 49 51 52
Other income (expense), net (39) (70) (118) 224 - - - - - - - -
Income before income taxes 4,616 5,808 6,252 6,774 7,578 8,398 9,469 9,909 10,470 10,863 11,181 11,482
Income tax expense 981 1,593 1,406 1,589 1,773 1,965 2,216 2,319 2,450 2,542 2,616 2,687
Net income 3,635 4,215 4,846 5,185 5,805 6,433 7,253 7,590 8,020 8,321 8,565 8,795
Net income (loss) attributable to noncontrolling interests in Accenture Holdings plc & Accenture Canada Holdings Inc.(149) (95) (7) (6) (6) (5) (5) (4) (4) (4) (4) (4)
Net income (loss) attributable to noncontrolling interests - other (41) (60) (60) (71) (80) (86) (93) (99) (103) (106) (109) (111)
Net income attributable to Accenture Plc 3,445 4,060 4,779 5,108 5,720 6,341 7,155 7,487 7,912 8,211 8,452 8,680
Weighted average class A common shares outstanding - basic 620 628 638 636 630 622 614 606 599 592 585 579
Year end shares outstanding 636 640 636 635 626 617 610 602 595 588 582 576
Earnings per class A ordinary share - basic 5.56 6.46 7.49 8.03 9.07 10.20 11.66 12.36 13.22 13.88 14.44 14.99
Dividends per share 2.42 2.66 2.92 3.20 3.52 3.96 4.53 4.80 5.13 5.39 5.61 5.82

Accenture PlcBalance Sheet ($ millions)
Fiscal Years Ending August 31 2017 2018 2019 2020 2021E 2022E 2023E 2024E 2025E 2026E 2027E 2028ECash & cash equivalents 4,127 5,061 6,127 8,415 8,828 10,672 12,731 14,996 17,504 20,083 22,760 25,561
Short-term investments 3 3 3 94 4 4 4 4 4 4 4 4
Receivables & contract assets 4,569 4,996 8,095 7,847 6,955 7,565 8,170 8,656 9,048 9,308 9,512 9,702
Unbilled services, net 2,316 2,500 - - - - - - - - - -
Other current assets 1,082 1,025 1,225 1,393 1,442 1,492 1,545 1,599 1,655 1,713 1,773 1,835
Total current assets 12,097 13,586 15,451 17,750 17,228 19,733 22,449 25,254 28,210 31,107 34,048 37,102
Contract assets 41 23 71 43 52 56 61 64 67 69 71 72
Investments 212 216 240 325 329 334 339 344 350 355 360 366
Property & equipment, gross 3,053 3,126 3,347 3,859 5,859 7,859 9,929 12,072 14,289 16,584 18,960 21,418
Total accumulated depreciation 1,912 1,862 1,956 2,314 4,144 6,044 7,784 9,841 11,979 14,194 16,485 18,857
Property & equipment, net 1,141 1,264 1,391 1,546 1,716 1,816 2,145 2,231 2,310 2,391 2,474 2,561
Lease assets - - - 3,183 3,533 3,739 4,418 4,596 4,757 4,924 5,096 5,275
Goodwill 5,002 5,383 6,206 7,710 8,752 8,752 8,752 8,752 8,752 8,752 8,752 8,752
Deferred contract costs 756 705 681 723 810 881 951 1,008 1,053 1,084 1,107 1,129
Deferred tax assets 2,215 2,087 4,349 4,153 4,102 4,052 4,002 3,953 3,905 3,857 3,810 3,763
Other non-current assets 1,226 1,186 1,400 1,646 1,704 1,763 1,825 1,889 1,955 2,023 2,094 2,167
Total assets 22,690 24,449 29,790 37,079 38,226 41,127 44,943 48,092 51,360 54,562 57,813 61,187
Current portion of long-term debt & bank borrowings 3 5 6 8 5 5 5 5 6 6 6 6
Accounts payable 1,525 1,349 1,647 1,350 1,704 1,854 2,002 2,121 2,217 2,281 2,331 2,377
Deferred revenues 2,670 2,838 3,189 3,637 3,499 3,806 4,110 4,355 4,552 4,683 4,786 4,881
Accrued payroll & related benefits 4,060 4,569 4,891 5,084 4,436 4,825 5,211 5,520 5,771 5,936 6,066 6,188
Accrued consumption taxes 383 - - 662 438 477 515 545 570 587 599 611
Income taxes payable 708 498 378 454 542 601 677 709 749 777 800 821
Lease liabilities - - - 756 839 888 1,049 1,091 1,130 1,169 1,210 1,253
Other accrued liabilities 475 893 951 712 654 711 768 813 850 875 894 912
Total current liabilities 9,824 10,152 11,062 12,663 12,117 13,166 14,337 15,160 15,845 16,313 16,692 17,049
Long-term debt 22 20 16 54 26 26 28 29 29 30 30 31
Deferred revenues 663 618 565 691 853 927 1,002 1,061 1,109 1,141 1,166 1,189
Retirement obligation 1,409 1,411 1,766 1,859 1,925 1,992 1,922 1,855 1,790 1,727 1,667 1,609
Deferred tax liabilities 137 126 133 180 186 193 199 206 214 221 229 237
Income taxes payable 575 957 893 931 1,094 1,213 1,367 1,431 1,512 1,569 1,615 1,658
Lease liabilities - - - 2,668 2,961 3,134 3,702 3,851 3,987 4,126 4,271 4,420
Other non-current liabilities 349 442 527 534 553 572 593 613 635 657 680 704
Total non-current liabilities 3,155 3,573 3,900 6,917 7,597 8,057 8,813 9,046 9,276 9,471 9,657 9,848
Total Liabilities 12,980 13,724 14,962 19,579 19,714 21,223 23,151 24,206 25,121 25,785 26,349 26,897
Restricted share units 1,095 1,235 1,412 1,585 1,585 1,585 1,585 1,585 1,585 1,585 1,585 1,585
Common Stock & APIC 3,516 4,871 5,804 7,167 7,167 7,167 7,167 7,167 7,167 7,167 7,167 7,167
Treasury shares, at cost (1,649) (2,117) (1,388) (2,566) (2,566) (2,566) (2,566) (2,566) (2,566) (2,566) (2,566) (2,566)
Retained earnings (accumulated deficit) 7,082 7,952 10,422 12,376 13,396 14,794 16,689 18,787 21,146 23,686 26,375 29,204
Accumulated other comprehensive income (loss) (1,095) (1,576) (1,841) (1,562) (1,562) (1,562) (1,562) (1,562) (1,562) (1,562) (1,562) (1,562)Total Accenture plc shareholders' equity 8,949 10,365 14,409 17,001 18,021 19,419 21,314 23,412 25,771 28,311 31,000 33,829Noncontrolling interests 761 360 419 499 491 485 478 473 468 466 463 461
Total shareholders' equity 9,710 10,725 14,828 17,499 18,512 19,904 21,792 23,885 26,239 28,777 31,464 34,290

Accenture PlcHistorical Cash Flow Statement ($ millions)
Fiscal Years Ending August 31 2011 2012 2013 2014 2015 2016 2017 2018 2019 2020
Net income 2,553 2,825 3,555 3,176 3,274 4,350 3,635 4,215 4,846 5,185
Depreciation, amortization & other 513 594 593 621 646 729 802 927 893 1,773
Reorganization costs (benefits), net 2 2 (272) (18) - - - - - -
Share-based compensation expense 450 538 616 671 680 758 795 977 1,093 1,198
Pension settlement charge - - - - - - 461 - - -
Loss (gain) on sale of businesses - - - - - (849) - - -
Deferred tax expense (benefit) (196) (176) (210) (74) (459) 66 (364) 94 (96) 171
Other adjustments, net 81 (94) (90) 105 (238) (54) 88 8 (88) (244)
Receivables from clients, net (486) 16 (214) (465) (159) (177) (170) (476) - -
Unbilled services, current & non-current, net (134) (144) (96) (240) (268) (193) 96 (235) - -
Receivables & contract assets, current & non-current - - - - - - - - (526) 722
Other current & non-current assets (467) (126) (21) (343) (401) (656) (416) (510) (490) (503)
Accounts payable 63 (68) (5) 73 114 73 174 (168) 177 (360)
Deferred revenues, current & non-current 295 230 (82) 94 183 303 (39) 177 258 236
Accrued payroll & related benefits 442 420 88 (139) 587 386 (118) 646 387 (8)
Income taxes payable, current & non-current 187 73 (261) 109 105 (251) 16 184 (163) 55
Other current & non-current liabilities 140 169 (298) (84) 29 91 12 188 335 (10)
Net cash flows from (used in) operating activities 3,442 4,257 3,303 3,486 4,092 4,575 4,973 6,027 6,627 8,215
Proceeds from maturities & sales of available-for-sale investments 11 13 - - - - - - - -
Purchases of available-for-sale investments (11) (8) - - - - - - - -
Purchases of property & equipment (404) (372) (370) (322) (395) (497) (516) (619) (599) (599)
Purchases of businesses & investments, net of cash acquired (306) (174) (804) (740) (792) (933) (1,704) (658) (1,193) (1,532)
Proceeds from sales of businesses & investments - - - - 11 815 (24) 20 28 230
Other cash flows from investing activities, net 7 6 17 6 6 4 10 7 9 6
Net cash flows from (used in) investing activities (703) (535) (1,156) (1,056) (1,170) (610) (2,234) (1,250) (1,756) (1,895)
Proceeds from issuance of shares 557 454 516 558 554 591 676 753 848 955
Purchases of shares (2,172) (2,099) (2,544) (2,559) (2,453) (2,605) (2,649) (2,639) (2,691) (2,916)
Proceeds from (repayments of) long-term debt, net (2) (6) () 1 1 (1) (2) (4) (5) (7)
Cash dividends paid (644) (951) (1,122) (1,255) (1,353) (1,438) (1,568) (1,709) (1,864) (2,038)
Excess tax benefits from share-based payment arrangements 171 78 114 114 84 92 - - - -
Other cash flows from financing activities, net (33) (36) (29) (24) (35) (36) (18) (110) (55) (44)
Net cash flows from financing activities (2,122) (2,559) (3,066) (3,165) (3,202) (3,397) (3,560) (3,709) (3,767) (4,049)
Effect of exchange rate changes on cash & cash equivalents 246 (223) (90) 25 (280) (23) 42 (134) (39) 17
Net increase (decrease) in cash & cash equivalents 863 939 (1,009) (711) (561) 545 (779) 935 1,065 2,288
Cash & cash equivalents, beginning of period 4,838 5,701 6,641 5,632 4,921 4,361 4,906 4,127 5,061 6,127
Cash & cash equivalents, end of period 5,701 6,641 5,632 4,921 4,361 4,906 4,127 5,061 6,127 8,415
Interest paid 15 15 14 18 15 16 16 20 23 28
Income taxes paid 824 1,034 963 963 1,434 1,425 1,289 1,373 1,587 1,360
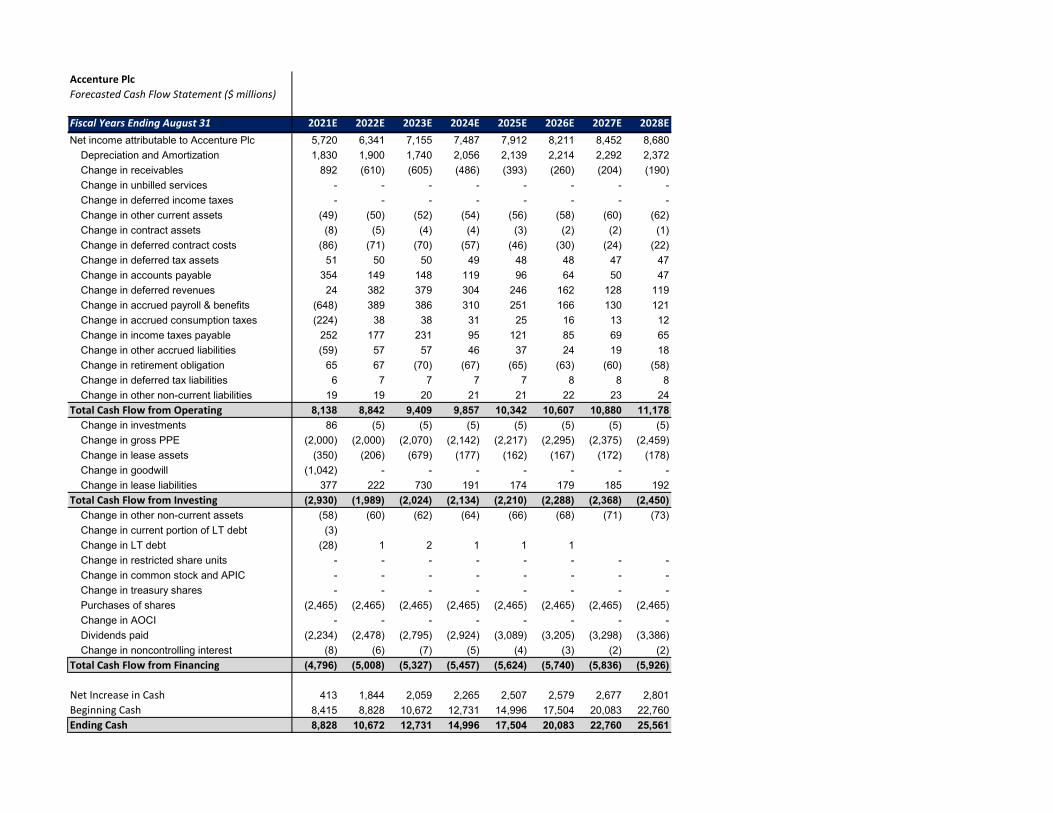
Accenture PlcForecasted Cash Flow Statement ($ millions)
Fiscal Years Ending August 31 2021E 2022E 2023E 2024E 2025E 2026E 2027E 2028ENet income attributable to Accenture Plc 5,720 6,341 7,155 7,487 7,912 8,211 8,452 8,680
Depreciation and Amortization 1,830 1,900 1,740 2,056 2,139 2,214 2,292 2,372
Change in receivables 892 (610) (605) (486) (393) (260) (204) (190)
Change in unbilled services - - - - - - - -
Change in deferred income taxes - - - - - - - -
Change in other current assets (49) (50) (52) (54) (56) (58) (60) (62)
Change in contract assets (8) (5) (4) (4) (3) (2) (2) (1)
Change in deferred contract costs (86) (71) (70) (57) (46) (30) (24) (22)
Change in deferred tax assets 51 50 50 49 48 48 47 47
Change in accounts payable 354 149 148 119 96 64 50 47
Change in deferred revenues 24 382 379 304 246 162 128 119
Change in accrued payroll & benefits (648) 389 386 310 251 166 130 121
Change in accrued consumption taxes (224) 38 38 31 25 16 13 12
Change in income taxes payable 252 177 231 95 121 85 69 65
Change in other accrued liabilities (59) 57 57 46 37 24 19 18
Change in retirement obligation 65 67 (70) (67) (65) (63) (60) (58)
Change in deferred tax liabilities 6 7 7 7 7 8 8 8
Change in other non-current liabilities 19 19 20 21 21 22 23 24
Total Cash Flow from Operating 8,138 8,842 9,409 9,857 10,342 10,607 10,880 11,178
Change in investments 86 (5) (5) (5) (5) (5) (5) (5)
Change in gross PPE (2,000) (2,000) (2,070) (2,142) (2,217) (2,295) (2,375) (2,459)
Change in lease assets (350) (206) (679) (177) (162) (167) (172) (178)
Change in goodwill (1,042) - - - - - - -
Change in lease liabilities 377 222 730 191 174 179 185 192
Total Cash Flow from Investing (2,930) (1,989) (2,024) (2,134) (2,210) (2,288) (2,368) (2,450)
Change in other non-current assets (58) (60) (62) (64) (66) (68) (71) (73)
Change in current portion of LT debt (3)
Change in LT debt (28) 1 2 1 1 1
Change in restricted share units - - - - - - - -
Change in common stock and APIC - - - - - - - -
Change in treasury shares - - - - - - - -
Purchases of shares (2,465) (2,465) (2,465) (2,465) (2,465) (2,465) (2,465) (2,465)
Change in AOCI - - - - - - - -
Dividends paid (2,234) (2,478) (2,795) (2,924) (3,089) (3,205) (3,298) (3,386)
Change in noncontrolling interest (8) (6) (7) (5) (4) (3) (2) (2)
Total Cash Flow from Financing (4,796) (5,008) (5,327) (5,457) (5,624) (5,740) (5,836) (5,926)
Net Increase in Cash 413 1,844 2,059 2,265 2,507 2,579 2,677 2,801
Beginning Cash 8,415 8,828 10,672 12,731 14,996 17,504 20,083 22,760
Ending Cash 8,828 10,672 12,731 14,996 17,504 20,083 22,760 25,561

Accenture PlcCommon Size Income Statement ($ millions)
Fiscal Years Ending August 31 2017 2018 2019 2020 2021E 2022E 2023E 2024E 2025E 2026E 2027E 2028ERevenues:
Revenues 100.00% 100.00% 100.00% 100.00% 100.00% 100.00% 100.00% 100.00% 100.00% 100.00% 100.00% 100.00%Operating Expenses:
Cost of services excl. D&A 67.82% 67.86% 67.12% 64.47% 65.00% 64.87% 64.74% 64.61% 64.48% 64.35% 64.22% 64.10%Depreciation and Amortization 2.18% 2.23% 2.07% 4.00% 3.69% 3.53% 2.99% 3.34% 3.32% 3.34% 3.38% 3.43%Sales & marketing 10.21% 10.09% 10.29% 10.44% 10.26% 10.26% 10.26% 10.26% 10.26% 10.26% 10.26% 10.26%General & administrative costs 3.89% 3.88% 4.08% 4.44% 3.97% 3.97% 3.97% 3.97% 3.97% 3.97% 3.97% 3.97%Research & Development 1.92% 1.90% 1.85% 1.96% 1.90% 1.90% 1.90% 1.90% 1.90% 1.90% 1.90% 1.90%Pension settlement charge 0.00% - - - - - - - - - - -Reorganization costs (benefits), net - - - - - - - - - - - -
Total operating expenses 87.40% 85.96% 85.41% 85.31% 84.82% 84.52% 83.86% 84.07% 83.92% 83.82% 83.73% 83.65%Operating income 12.60% 14.04% 14.59% 14.69% 15.18% 15.48% 16.14% 15.93% 16.08% 16.18% 16.27% 16.35%Gain (loss) on investments, net - - - - - - - - - - - -Interest income 0.10% 0.14% 0.20% 0.16% 0.18% 0.17% 0.19% 0.22% 0.24% 0.28% 0.31% 0.34%Interest expense 0.04% 0.05% 0.05% 0.07% 0.07% 0.07% 0.07% 0.07% 0.07% 0.07% 0.07% 0.08%Other income (expense), net -0.11% -0.17% -0.27% 0.51% 0.00% 0.00% 0.00% 0.00% 0.00% 0.00% 0.00% 0.00%Gain (loss) on sale of businesses 0.00% - - - - - - - - - - -Income before income taxes 12.56% 13.96% 14.47% 15.28% 15.30% 15.59% 16.27% 16.07% 16.25% 16.39% 16.50% 16.62%Income tax expense 2.67% 3.83% 3.25% 3.58% 3.58% 3.65% 3.81% 3.76% 3.80% 3.83% 3.86% 3.89%Net income 9.89% 10.13% 11.21% 11.70% 11.72% 11.94% 12.47% 12.31% 12.45% 12.55% 12.64% 12.73%Net income (loss) attributable to noncontrolling interests in Accenture Holdings plc & Accenture Canada Holdings Inc.-0.41% -0.23% -0.02% -0.01% -0.01% -0.01% -0.01% -0.01% -0.01% -0.01% -0.01% -0.01%Net income (loss) attributable to noncontrolling interests - other -0.11% -0.14% -0.14% -0.16% -0.16% -0.16% -0.16% -0.16% -0.16% -0.16% -0.16% -0.16%Net income attributable to Accenture Plc 9.37% 9.76% 11.06% 11.52% 11.55% 11.77% 12.30% 12.14% 12.28% 12.39% 12.48% 12.56%
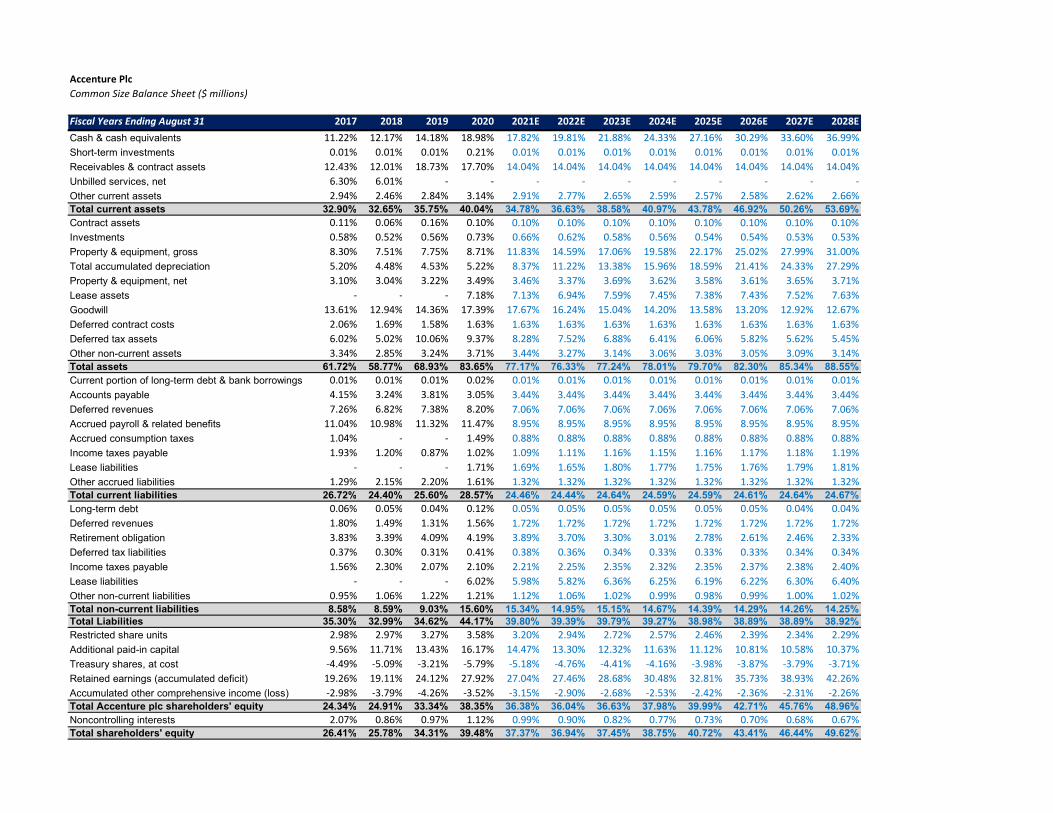
Accenture PlcCommon Size Balance Sheet ($ millions)
Fiscal Years Ending August 31 2017 2018 2019 2020 2021E 2022E 2023E 2024E 2025E 2026E 2027E 2028ECash & cash equivalents 11.22% 12.17% 14.18% 18.98% 17.82% 19.81% 21.88% 24.33% 27.16% 30.29% 33.60% 36.99%Short-term investments 0.01% 0.01% 0.01% 0.21% 0.01% 0.01% 0.01% 0.01% 0.01% 0.01% 0.01% 0.01%Receivables & contract assets 12.43% 12.01% 18.73% 17.70% 14.04% 14.04% 14.04% 14.04% 14.04% 14.04% 14.04% 14.04%Unbilled services, net 6.30% 6.01% - - - - - - - - - -Other current assets 2.94% 2.46% 2.84% 3.14% 2.91% 2.77% 2.65% 2.59% 2.57% 2.58% 2.62% 2.66%Total current assets 32.90% 32.65% 35.75% 40.04% 34.78% 36.63% 38.58% 40.97% 43.78% 46.92% 50.26% 53.69%Contract assets 0.11% 0.06% 0.16% 0.10% 0.10% 0.10% 0.10% 0.10% 0.10% 0.10% 0.10% 0.10%Investments 0.58% 0.52% 0.56% 0.73% 0.66% 0.62% 0.58% 0.56% 0.54% 0.54% 0.53% 0.53%Property & equipment, gross 8.30% 7.51% 7.75% 8.71% 11.83% 14.59% 17.06% 19.58% 22.17% 25.02% 27.99% 31.00%Total accumulated depreciation 5.20% 4.48% 4.53% 5.22% 8.37% 11.22% 13.38% 15.96% 18.59% 21.41% 24.33% 27.29%Property & equipment, net 3.10% 3.04% 3.22% 3.49% 3.46% 3.37% 3.69% 3.62% 3.58% 3.61% 3.65% 3.71%Lease assets - - - 7.18% 7.13% 6.94% 7.59% 7.45% 7.38% 7.43% 7.52% 7.63%Goodwill 13.61% 12.94% 14.36% 17.39% 17.67% 16.24% 15.04% 14.20% 13.58% 13.20% 12.92% 12.67%Deferred contract costs 2.06% 1.69% 1.58% 1.63% 1.63% 1.63% 1.63% 1.63% 1.63% 1.63% 1.63% 1.63%Deferred tax assets 6.02% 5.02% 10.06% 9.37% 8.28% 7.52% 6.88% 6.41% 6.06% 5.82% 5.62% 5.45%Other non-current assets 3.34% 2.85% 3.24% 3.71% 3.44% 3.27% 3.14% 3.06% 3.03% 3.05% 3.09% 3.14%Total assets 61.72% 58.77% 68.93% 83.65% 77.17% 76.33% 77.24% 78.01% 79.70% 82.30% 85.34% 88.55%Current portion of long-term debt & bank borrowings 0.01% 0.01% 0.01% 0.02% 0.01% 0.01% 0.01% 0.01% 0.01% 0.01% 0.01% 0.01%Accounts payable 4.15% 3.24% 3.81% 3.05% 3.44% 3.44% 3.44% 3.44% 3.44% 3.44% 3.44% 3.44%Deferred revenues 7.26% 6.82% 7.38% 8.20% 7.06% 7.06% 7.06% 7.06% 7.06% 7.06% 7.06% 7.06%Accrued payroll & related benefits 11.04% 10.98% 11.32% 11.47% 8.95% 8.95% 8.95% 8.95% 8.95% 8.95% 8.95% 8.95%Accrued consumption taxes 1.04% - - 1.49% 0.88% 0.88% 0.88% 0.88% 0.88% 0.88% 0.88% 0.88%Income taxes payable 1.93% 1.20% 0.87% 1.02% 1.09% 1.11% 1.16% 1.15% 1.16% 1.17% 1.18% 1.19%Lease liabilities - - - 1.71% 1.69% 1.65% 1.80% 1.77% 1.75% 1.76% 1.79% 1.81%Other accrued liabilities 1.29% 2.15% 2.20% 1.61% 1.32% 1.32% 1.32% 1.32% 1.32% 1.32% 1.32% 1.32%Total current liabilities 26.72% 24.40% 25.60% 28.57% 24.46% 24.44% 24.64% 24.59% 24.59% 24.61% 24.64% 24.67%Long-term debt 0.06% 0.05% 0.04% 0.12% 0.05% 0.05% 0.05% 0.05% 0.05% 0.05% 0.04% 0.04%Deferred revenues 1.80% 1.49% 1.31% 1.56% 1.72% 1.72% 1.72% 1.72% 1.72% 1.72% 1.72% 1.72%Retirement obligation 3.83% 3.39% 4.09% 4.19% 3.89% 3.70% 3.30% 3.01% 2.78% 2.61% 2.46% 2.33%Deferred tax liabilities 0.37% 0.30% 0.31% 0.41% 0.38% 0.36% 0.34% 0.33% 0.33% 0.33% 0.34% 0.34%Income taxes payable 1.56% 2.30% 2.07% 2.10% 2.21% 2.25% 2.35% 2.32% 2.35% 2.37% 2.38% 2.40%Lease liabilities - - - 6.02% 5.98% 5.82% 6.36% 6.25% 6.19% 6.22% 6.30% 6.40%Other non-current liabilities 0.95% 1.06% 1.22% 1.21% 1.12% 1.06% 1.02% 0.99% 0.98% 0.99% 1.00% 1.02%Total non-current liabilities 8.58% 8.59% 9.03% 15.60% 15.34% 14.95% 15.15% 14.67% 14.39% 14.29% 14.26% 14.25%Total Liabilities 35.30% 32.99% 34.62% 44.17% 39.80% 39.39% 39.79% 39.27% 38.98% 38.89% 38.89% 38.92%Restricted share units 2.98% 2.97% 3.27% 3.58% 3.20% 2.94% 2.72% 2.57% 2.46% 2.39% 2.34% 2.29%Additional paid-in capital 9.56% 11.71% 13.43% 16.17% 14.47% 13.30% 12.32% 11.63% 11.12% 10.81% 10.58% 10.37%Treasury shares, at cost -4.49% -5.09% -3.21% -5.79% -5.18% -4.76% -4.41% -4.16% -3.98% -3.87% -3.79% -3.71%Retained earnings (accumulated deficit) 19.26% 19.11% 24.12% 27.92% 27.04% 27.46% 28.68% 30.48% 32.81% 35.73% 38.93% 42.26%Accumulated other comprehensive income (loss) -2.98% -3.79% -4.26% -3.52% -3.15% -2.90% -2.68% -2.53% -2.42% -2.36% -2.31% -2.26%Total Accenture plc shareholders' equity 24.34% 24.91% 33.34% 38.35% 36.38% 36.04% 36.63% 37.98% 39.99% 42.71% 45.76% 48.96%Noncontrolling interests 2.07% 0.86% 0.97% 1.12% 0.99% 0.90% 0.82% 0.77% 0.73% 0.70% 0.68% 0.67%Total shareholders' equity 26.41% 25.78% 34.31% 39.48% 37.37% 36.94% 37.45% 38.75% 40.72% 43.41% 46.44% 49.62%

Accenture PlcValue Driver Estimation ($ millions)
Fiscal Years Ending August 31 2011 2017 2018 2019 2020 2021E 2022E 2023E 2024E 2025E 2026E 2027E 2028E
NOPLAT:EBITA:
Revenue 27,353 36,765 41,603 43,215 44,327 49,535 53,878 58,188 61,646 64,444 66,293 67,745 69,100
Cost of services excl. D&A 18,453 24,933 28,234 29,008 28,578 32,198 34,951 37,671 39,830 41,555 42,661 43,509 44,290
Depreciation and Amortization 513 802 927 893 1,773 1,830 1,900 1,740 2,056 2,139 2,214 2,292 2,372
Sales & marketing 3,094 3,754 4,199 4,447 4,626 5,081 5,527 5,969 6,323 6,610 6,800 6,949 7,088
General & administrative costs 1,338 1,429 1,613 1,762 1,966 1,967 2,139 2,310 2,447 2,558 2,632 2,689 2,743
Research & Development 482 704 791 800 871 939 1,022 1,103 1,169 1,222 1,257 1,284 1,310Plus: Implied Interest on Operating Leases 45 68 89 88 93 86 95 101 119 124 128 133 137
EBITA 3,517 5,211 5,930 6,393 6,607 7,606 8,435 9,495 9,939 10,484 10,857 11,155 11,434
Adjusted Taxes:Marginal Tax Rate: 21.30% 20.00% 20.70% 23.60% 23.40% 23.40% 23.40% 23.40% 23.40% 23.40% 23.40% 23.40% 23.40%
Income tax expense 959 981 1,593 1,406 1,589 1,773 1,965 2,216 2,319 2,450 2,542 2,616 2,687Plus: Pension settlement charge - - - - - - - - - - - - -Plus: Reorganization costs (benefits), net .32 - - - - - - - - - - - -Less: Gain (loss) on investments, net .23 - - - - - - - - - - - -Less: Interest income (9) (8) (12) (21) (16) (21) (22) (26) (31) (37) (43) (49) (56)Plus: Interest expense 3 3 4 5 8 8 9 9 11 11 11 12 12Less: Other income (expense), net (4) 8 14 28 (53) - - - - - - - -Less: Gain (loss) on sale of businesses - .05 - - - - - - - - - - -Plus: Operating lease interest 10 14 18 21 22 20 22 24 28 29 30 31 32
Less : Adjusted Taxes 960 998 1,619 1,439 1,550 1,780 1,974 2,222 2,326 2,453 2,541 2,610 2,676
Plus : Change in deferred taxes (196) (364) 94 (96) 171 57 57 56 56 56 55 55 55
NOPLAT 2,360 3,848 4,405 4,858 5,228 5,883 6,518 7,330 7,669 8,086 8,372 8,599 8,813
Invested Capital (IC):Operating Assets:
Working Cash (lesser of actual or % sales) 3,070 4,127 4,670 4,851 4,976 5,560 6,048 6,532 6,920 7,234 7,441 7,604 7,756
Receivables & contract assets 3,236 4,569 4,996 8,095 7,847 6,955 7,565 8,170 8,656 9,048 9,308 9,512 9,702
Unbilled services, net 1,386 2,316 2,500 - - - - - - - - - -
Total Operating Assets: 7,692 11,012 12,166 12,946 12,823 12,515 13,613 14,702 15,575 16,282 16,749 17,116 17,458
Operating Liabilities:Accounts payable 949 1,525 1,349 1,647 1,350 1,704 1,854 2,002 2,121 2,217 2,281 2,331 2,377
Deferred revenues 2,219 2,670 2,838 3,189 3,637 3,499 3,806 4,110 4,355 4,552 4,683 4,786 4,881
Accrued payroll & related benefits 3,259 4,060 4,569 4,891 5,084 4,436 4,825 5,211 5,520 5,771 5,936 6,066 6,188
Accrued consumption taxes 349 383 - - 662 438 477 515 545 570 587 599 611
Income taxes payable 238 708 498 378 454 542 601 677 709 749 777 800 821
Total Operating Liabilities: 7,014 9,347 9,254 10,104 11,187 10,619 11,562 12,515 13,250 13,859 14,264 14,582 14,879
Net Operating Working Capital 678 1,665 2,913 2,842 1,636 1,896 2,051 2,187 2,325 2,423 2,486 2,534 2,580
LT Operating Assets:Contract assets 49 41 23 71 43 52 56 61 64 67 69 71 72
Property & equipment, net 785 1,141 1,264 1,391 1,546 1,716 1,816 2,145 2,231 2,310 2,391 2,474 2,561
Lease assets 1,660 3,288 3,258 3,445 3,183 3,533 3,739 4,418 4,596 4,757 4,924 5,096 5,275
Deferred contract costs 560 756 705 681 723 810 881 951 1,008 1,053 1,084 1,107 1,129
LT Operating Liabilities:Deferred revenues 553 663 618 565 691 853 927 1,002 1,061 1,109 1,141 1,166 1,189
Income taxes payable 1,619 575 957 893 931 1,094 1,213 1,367 1,431 1,512 1,569 1,615 1,658
Invested Capital (IC): 1,560 5,652 6,588 6,973 5,510 6,059 6,403 7,393 7,732 7,989 8,243 8,502 8,769
Free Cash Flow (FCF):NOPLAT 3,848 4,405 4,858 5,228 5,883 6,518 7,330 7,669 8,086 8,372 8,599 8,813
Change in IC 1,250 936 384 (1,463) 549 343 990 339 257 253.9 259 267
FCF 2,599 3,469 4,473 6,691 5,334 6,175 6,340 7,330 7,829 8,118 8,340 8,546
Return on Invested Capital (ROIC):NOPLAT 3,848 4,405 4,858 5,228 5,883 6,518 7,330 7,669 8,086 8,372 8,599 8,813
Beginning IC 4,403 5,652 6,588 6,973 5,510 6,059 6,403 7,393 7,732 7,989 8,243 8,502
ROIC 87% 78% 74% 75% 107% 108% 114% 104% 105% 105% 104% 104%
Economic Profit (EP):Beginning IC 4,403 5,652 6,588 6,973 5,510 6,059 6,403 7,393 7,732 7,989 8,243 8,502
x (ROIC - WACC) 80% 71% 67% 68% 100% 101% 107% 97% 98% 98% 97% 97%
EP 3,539 4,008 4,395 4,738 5,496 6,093 6,880 7,150 7,543 7,810 8,020 8,216

Accenture PlcWeighted Average Cost of Capital (WACC) Estimation
Cost of Equity: ASSUMPTIONS:Risk-Free Rate 2.22% 20-yr treasury bondBeta 1.00 Average of 1, 2, and 5-year monthly, weekly and daily betasEquity Risk Premium 4.90% Henry Fund estimateCost of Equity 7.12%
Cost of Debt:Risk-Free Rate 2.22% 20-yr treasury bondImplied Default Premium 0.48%Pre-Tax Cost of Debt 2.70% Risk-free plus Tech Services A+ credit spread (FactSet)Marginal Tax Rate 23.40%After-Tax Cost of Debt 2.06%
Market Value of Common Equity: MV WeightsTotal Shares Outstanding 635
Current Stock Price $278.34MV of Equity 176,660 98.20%
Market Value of Debt:Short-Term DebtCurrent Portion of LTD 8
Long-Term Debt 54
PV of Operating Leases 3,183
MV of Total Debt 3,245 1.80%
Market Value of the Firm 179,906 100.00%
Estimated WACC 7.03%

Accenture PlcDiscounted Cash Flow (DCF) and Economic Profit (EP) Valuation Models
Key Inputs: CV Growth of NOPLAT 3.50% CV Year ROIC 104% WACC 7.03% Cost of Equity 7.12%
Fiscal Years Ending August 31 2021E 2022E 2023E 2024E 2025E 2026E 2027E 2028E
DCF Model:Free Cash Flow (FCF) 5,334 6,175 6,340 7,330 7,829 8,118 8,340 8,546
Continuing Value (CV) 241,426
PV of FCF 4,984 5,391 5,171 5,587 5,575 5,401 5,185 150,081
Value of Operating Assets: 187,374
Non-Operating Adjustments:Excess Cash 3,440
Investments 419
Debt (62)
PV of operating leases (3,183)
Retirement obligation (1,356)
Value of Equity 186,631
Shares Outstanding 635
Intrinsic Value of Last FYE 294.05$ Implied Price as of Today 304.60$
EP Model:Economic Profit (EP) 5,496 6,093 6,880 7,150 7,543 7,810 8,020 8,216
Continuing Value (CV) 232,924
PV of EP 5,135 5,319 5,612 5,449 5,371 5,196 4,986 144,795
Total PV of EP 181,864
Invested Capital (last FYE) 5,510
Value of Operating Assets: 187,374
Non-Operating Adjustments:Excess Cash 3,440
Investments 419
Debt (62)
PV of operating leases (3,183)
Retirement obligation (1,356)
Value of Equity 186,631
Shares Outstanding 635
Intrinsic Value of Last FYE 294.05$
Implied Price as of Today 304.60$

Accenture PlcDividend Discount Model (DDM) or Fundamental P/E Valuation Model
Fiscal Years Ending August 31 2021E 2022E 2023E 2024E 2025E 2026E 2027E 2028E
EPS 9.07$ 10.20$ 11.66$ 12.36$ 13.22$ 13.88$ 14.44$ 14.99$
Key Assumptions CV growth of EPS 3.50% CV Year ROE 27.59% Cost of Equity 7.12%
Future Cash Flows P/E Multiple (CV Year) 24.13 EPS (CV Year) 14.99$ Future Stock Price 361.68$ Dividends Per Share 3.52 3.96 4.53 4.80 5.13 5.39 5.61 361.68 Discounted Cash Flows 3.29 3.45 3.68 3.64 3.64 3.56 3.46 223.50
Intrinsic Value as of Last FYE 248.23$ Implied Price as of Today 257.14$

Accenture PlcRelative Valuation Models
EPS EPSTicker Company Price 2021E 2022E P/E 21 P/E 22IBM IBM $133.23 $9.03 $10.13 14.75 13.15 CTSH Cognizant Tech $78.88 $3.90 $4.34 20.23 18.18 CAP-FR Capgemini $174.04 $8.96 $10.24 19.42 17.00 HON Honeywell International $216.80 $7.85 $8.88 27.62 24.41 HPE Hewlett-Packard Enterprises $15.70 $0.60 $1.03 26.17 15.24 DXC DXC Technology $31.79 $2.33 $0.57 13.64 55.77 ATO-FR Atos $68.51 $8.40 $9.31 8.16 7.36
Average 18.57 21.59
ACN Accenture Plc $278.34 $9.07 $10.20 30.7 27.3
Implied Relative Value: P/E (EPS21) $ 168.52 P/E (EPS22) 220.20$

Accenture PlcPresent Value of Operating Lease Obligations ($ millions)
Fiscal Years Ending August 31 2010 2011 2012 2013 2014 2015 2016 2017 2018 2019 2020Year 1 407 427 443 455 482 470 517 562 598 688 771
Year 2 284 305 354 365 387 411 446 506 543 597 653
Year 3 214 238 284 284 299 331 375 452 474 517 549
Year 4 174 184 217 219 217 273 319 405 411 428 456
Year 5 154 132 170 164 171 238 258 353 339 363 372
Thereafter 613 556 649 675 608 732 903 1,429 1,286 1,246 1,149
Total Minimum Payments 1,846 1,842 2,118 2,160 2,164 2,455 2,817 3,707 3,651 3,840 3,949
Less: Cumulative Interest 189 182 211 218 206 241 288 419 393 394 384
PV of Minimum Payments 1,657 1,660 1,907 1,943 1,958 2,214 2,530 3,288 3,258 3,445 3,564
Implied Interest in Year 1 Payment 44.7 44.8 51.4 52.4 52.8 59.7 68.2 88.6 87.8 92.9
Pre-Tax Cost of Debt 2.70% 2.70% 2.70% 2.70% 2.70% 2.70% 2.70% 2.70% 2.70% 2.70% 2.70%Years Implied by Year 6 Payment 4.0 4.2 3.8 4.1 3.6 3.1 3.5 4.0 3.8 3.4 3.1Expected Obligation in Year 6 & Beyond 153570 132224 169951 163549 170804 238170 257949 353254 338630 363107 371856
Present Value of Lease PaymentsPV of Year 1 396 415 431 443 470 457 503 547 583 670 750
PV of Year 2 270 289 336 346 367 390 423 479 515 566 619
PV of Year 3 198 220 263 262 276 305 347 417 438 477 507
PV of Year 4 156 166 195 197 195 246 287 364 370 385 410
PV of Year 5 134 116 149 143 150 209 226 309 296 318 326
PV of 6 & beyond 503 454 533 552 501 607 745 1,171 1,057 1,029 953
Capitalized PV of Payments 1,657 1,660 1,907 1,943 1,958 2,214 2,530 3,288 3,258 3,445 3,564

Accenture PlcSensitivity Tables
304.60 0.85 0.90 0.95 1.00 1.05 1.10 1.15 304.60 2.10% 2.30% 2.50% 2.70% 2.90% 3.10% 3.30%4.60% 419.67 385.73 356.88 332.21 310.48 291.55 274.80 6.50% 367.68 367.67 367.65 367.64 367.62 367.61 367.59 4.70% 406.45 373.90 346.19 322.47 301.54 283.29 267.13 6.70% 344.54 344.55 344.55 344.56 344.57 344.57 344.58 4.80% 394.04 362.78 336.12 313.28 293.10 275.49 259.88 6.90% 324.15 324.18 324.20 324.22 324.24 324.27 324.29 4.90% 382.37 352.30 326.63 304.60 285.12 268.11 253.01 7.12% 304.49 304.53 304.56 304.60 304.64 304.67 304.71 5.00% 371.37 342.41 317.66 296.39 277.57 261.11 246.50 7.30% 289.87 289.92 289.96 290.01 290.06 290.10 290.15 5.10% 360.99 333.07 309.17 288.62 270.41 254.48 240.32 7.50% 275.32 275.38 275.43 275.49 275.54 275.60 275.65 5.20% 351.17 324.22 301.13 281.24 263.61 248.17 234.45 7.70% 262.18 262.24 262.30 262.36 262.42 262.48 262.54
304.60 1.60% 1.80% 2.00% 2.22% 2.40% 2.60% 2.80% 304.60 59.00% 61.00% 63.00% 65.00% 67.00% 69.00% 71.00%2.90% 318.95 302.08 286.94 271.96 260.85 249.53 239.18 8.00% 310.13 310.13 310.13 310.13 310.13 310.13 310.13 3.10% 333.29 314.68 298.06 281.73 269.67 257.45 246.30 9.00% 308.41 308.41 308.41 308.41 308.41 308.41 308.41 3.30% 349.48 328.79 310.46 292.55 279.40 266.13 254.09 10.00% 306.70 306.70 306.70 306.70 306.70 306.70 306.70 3.50% 367.89 344.72 324.35 304.60 290.18 275.70 262.63 11.22% 304.60 304.60 304.60 304.60 304.60 304.60 304.60 3.70% 389.01 362.85 340.03 318.09 302.18 286.31 272.05 12.00% 303.27 303.27 303.27 303.27 303.27 303.27 303.27 3.90% 413.51 383.65 357.87 333.32 315.64 298.13 282.49 13.00% 301.56 301.56 301.56 301.56 301.56 301.56 301.56 4.10% 442.24 407.76 378.35 350.62 330.84 311.37 294.12 14.00% 299.84 299.84 299.84 299.84 299.84 299.84 299.84
304.60 75.00% 85.00% 95.00% 103.66% 115.00% 125.00% 135.00%20.40% 312.68 314.12 315.26 316.07 316.95 317.59 318.14 21.40% 308.90 310.32 311.45 312.25 313.12 313.75 314.29 22.40% 305.11 306.52 307.64 308.43 309.28 309.91 310.44 23.40% 301.33 302.72 303.82 304.60 305.44 306.06 306.59 24.40% 297.54 298.92 300.00 300.77 301.61 302.22 302.73 25.40% 293.76 295.11 296.18 296.94 297.77 298.37 298.88 26.40% 289.97 291.31 292.36 293.12 293.93 294.52 295.03
Pre-Tax Cost of Debt
Cost
of E
quity
2021 Cost of Services
Wor
king
Cas
h
Mar
gina
l Tax
Rat
e
Beta
ERP
Risk Free Rate
NO
PLAT
CV
Gro
wth
ROIC CV Year
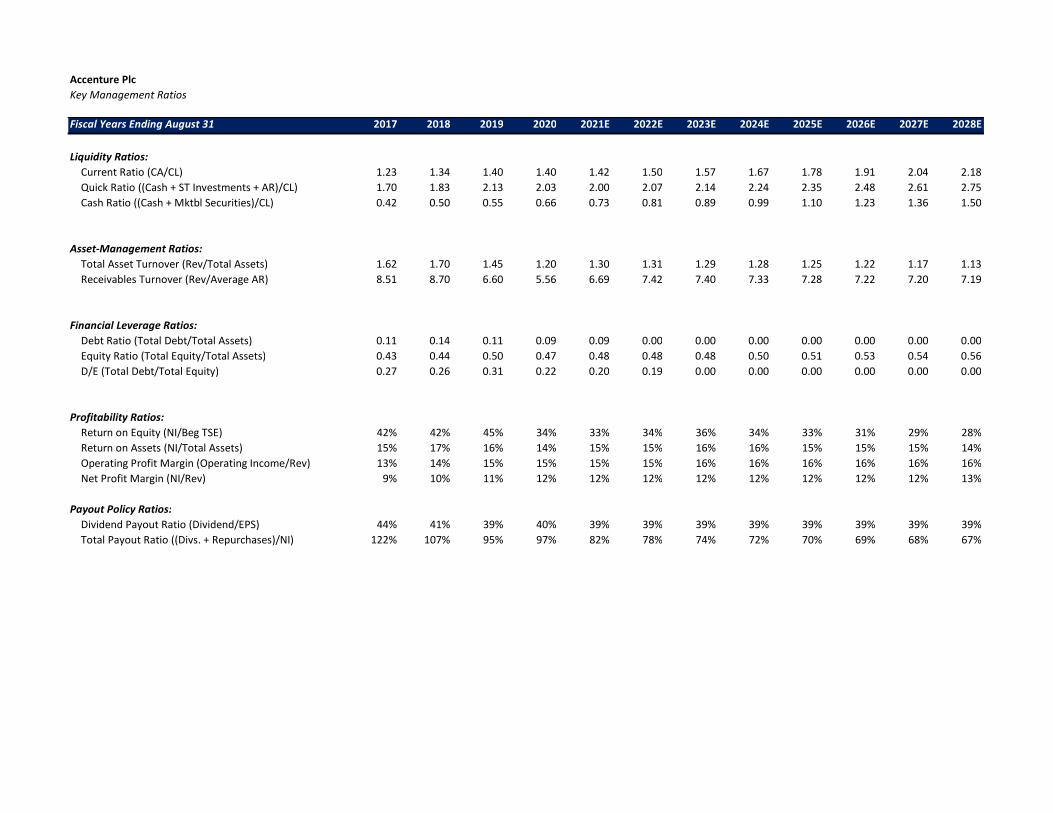
Accenture PlcKey Management Ratios
Fiscal Years Ending August 31 2017 2018 2019 2020 2021E 2022E 2023E 2024E 2025E 2026E 2027E 2028E
Liquidity Ratios:Current Ratio (CA/CL) 1.23 1.34 1.40 1.40 1.42 1.50 1.57 1.67 1.78 1.91 2.04 2.18Quick Ratio ((Cash + ST Investments + AR)/CL) 1.70 1.83 2.13 2.03 2.00 2.07 2.14 2.24 2.35 2.48 2.61 2.75Cash Ratio ((Cash + Mktbl Securities)/CL) 0.42 0.50 0.55 0.66 0.73 0.81 0.89 0.99 1.10 1.23 1.36 1.50
Asset-Management Ratios:Total Asset Turnover (Rev/Total Assets) 1.62 1.70 1.45 1.20 1.30 1.31 1.29 1.28 1.25 1.22 1.17 1.13Receivables Turnover (Rev/Average AR) 8.51 8.70 6.60 5.56 6.69 7.42 7.40 7.33 7.28 7.22 7.20 7.19
Financial Leverage Ratios:Debt Ratio (Total Debt/Total Assets) 0.11 0.14 0.11 0.09 0.09 0.00 0.00 0.00 0.00 0.00 0.00 0.00Equity Ratio (Total Equity/Total Assets) 0.43 0.44 0.50 0.47 0.48 0.48 0.48 0.50 0.51 0.53 0.54 0.56D/E (Total Debt/Total Equity) 0.27 0.26 0.31 0.22 0.20 0.19 0.00 0.00 0.00 0.00 0.00 0.00
Profitability Ratios:Return on Equity (NI/Beg TSE) 42% 42% 45% 34% 33% 34% 36% 34% 33% 31% 29% 28%Return on Assets (NI/Total Assets) 15% 17% 16% 14% 15% 15% 16% 16% 15% 15% 15% 14%Operating Profit Margin (Operating Income/Rev) 13% 14% 15% 15% 15% 15% 16% 16% 16% 16% 16% 16%Net Profit Margin (NI/Rev) 9% 10% 11% 12% 12% 12% 12% 12% 12% 12% 12% 13%
Payout Policy Ratios:Dividend Payout Ratio (Dividend/EPS) 44% 41% 39% 40% 39% 39% 39% 39% 39% 39% 39% 39%Total Payout Ratio ((Divs. + Repurchases)/NI) 122% 107% 95% 97% 82% 78% 74% 72% 70% 69% 68% 67%