
GIS and Logit Regression Model Applications in Land Use ...
11
American Journal of Remote Sensing 2015; 3(1): 6-16 Published online April 8, 2015 (http://www.sciencepublishinggroup.com/j/ajrs) doi: 10.11648/j.ajrs.20150301.12 ISSN: 2328-5788 (Print); ISSN: 2328-580X (Online) GIS and Logit Regression Model Applications in Land Use/Land Cover Change and Distribution in Usangu Catchment Canute Hyandye * , Christina Geoffrey Mandara, John Safari Institute of Rural Development Planning (IRDP), Dodoma, Tanzania Email address: [email protected] (C. Hyandye) To cite this article: Canute Hyandye, Christina Geoffrey Mandara, John Safari. GIS and Logit Regression Model Applications in Land Use/Land Cover Change and Distribution in Usangu Catchment. American Journal of Remote Sensing. Vol. 3, No. 1, 2015, pp. 6-16. doi: 10.11648/j.ajrs.20150301.12 Abstract: This study applied time series analysis to examine land use/land cover (LULC) change and distribution in Usangu watershed and multinomial logistic regression in the GIS environment to model the influence of the related driving factors. Historical land use/cover data of the watershed were extracted from the 2000, 2006 and 2013 Landsat images using GIS and remote sensing data processing and analysis techniques. Data was analyzed using ArcMap 10.1, ERDAS Imagine, SPSS and IDRISI Selva software. Eight factors likely to influence LULC change and LULC distribution were assessed. These include elevation, slope, distance from roads, distance from rivers networks, population density, Normalized Vegetation Index (NDVI), annual rainfall and soil types. Results show that LULC changes are mainly influenced by variations in annual rainfall, population density and distance from road networks. LULC distribution is determined mainly by terrain and edaphic factors namely elevation, slope and soil types. NDVI does not influence LULC change nor determine the LULC distribution, but can be used to show concentration of LULC types on a landscape. Combination of GIS, remote sensing and statistical analysis capabilities are powerful tools for assessing and model processes of land use change and their underlying causes in terms of time and space. It is concluded that ingeniously integration of remote sensing, GIS application combined with multi-source spatial data analysis give great possibility of quantifying and explaining the temporal and spatial LULC changes and distribution in a given watershed. Keywords: LandUse/Cover, Change and Distribution, GIS, Remote Sensing, Multinomial Logit Regression, Usangu 1. Introduction The transformation of land use and land cover is driven by a range of different factors and mechanisms. While climate, technology and economics are key determinants of land-use change at different spatial and temporal scales [1],geomorphology and edaphic factors determine the LULC distribution on the landscape [2] . Existence and changes of LULC in a given time and location occur as a result of many factors. These factors include political, economic, cultural, technological, and natural driving factors, including factors that derive from the spatial configuration (also referred to as natural configuration). Natural driving factors include site factors (spatial configuration, topography, and soil conditions) as well as natural disturbances such as drought, wildfires and floods which induce long term global change [3]. The LULC change distribution varies in space and time. This is because physical and social characteristics of communities vary in space and time, so do land-use choices, resulting in a spatial pattern of land-use types [4]. LULC change driving factors have been defined as the underlying elements that trigger landscape changes [5]. These factors influence the trajectories of landscape development [6]. The study of driving factors of landscape change has a long tradition in geography and landscape research [7], and is gaining increasing attention in landscape-change research. Indeed, driving factors have been identified as one of the six core concepts for the modelling of land-use change [8]. The driving factors form a complex system of dependencies and interactions and affect a whole range of temporal and spatial levels. Time series analysis of land cover changes and the identification of the driving factors responsible for these changes are neededindesigning appropriate management techniques for natural resources and also for projecting future land cover trajectories [9]. Land cover change information is needed regarding what and how changes occur, where and when they occur, the rates at which they occur, and the social and physical factors that drive those changes [10]. Good
-
Upload
khangminh22 -
Category
Documents
-
view
0 -
download
0
Transcript of GIS and Logit Regression Model Applications in Land Use ...

American Journal of Remote Sensing 2015; 3(1): 6-16
Published online April 8, 2015 (http://www.sciencepublishinggroup.com/j/ajrs)
doi: 10.11648/j.ajrs.20150301.12
ISSN: 2328-5788 (Print); ISSN: 2328-580X (Online)
GIS and Logit Regression Model Applications in Land Use/Land Cover Change and Distribution in Usangu Catchment
Canute Hyandye*, Christina Geoffrey Mandara, John Safari
Institute of Rural Development Planning (IRDP), Dodoma, Tanzania
Email address: [email protected] (C. Hyandye)
To cite this article: Canute Hyandye, Christina Geoffrey Mandara, John Safari. GIS and Logit Regression Model Applications in Land Use/Land Cover Change
and Distribution in Usangu Catchment. American Journal of Remote Sensing. Vol. 3, No. 1, 2015, pp. 6-16. doi: 10.11648/j.ajrs.20150301.12
Abstract: This study applied time series analysis to examine land use/land cover (LULC) change and distribution in Usangu
watershed and multinomial logistic regression in the GIS environment to model the influence of the related driving factors.
Historical land use/cover data of the watershed were extracted from the 2000, 2006 and 2013 Landsat images using GIS and
remote sensing data processing and analysis techniques. Data was analyzed using ArcMap 10.1, ERDAS Imagine, SPSS and
IDRISI Selva software. Eight factors likely to influence LULC change and LULC distribution were assessed. These include
elevation, slope, distance from roads, distance from rivers networks, population density, Normalized Vegetation Index (NDVI),
annual rainfall and soil types. Results show that LULC changes are mainly influenced by variations in annual rainfall, population
density and distance from road networks. LULC distribution is determined mainly by terrain and edaphic factors namely elevation,
slope and soil types. NDVI does not influence LULC change nor determine the LULC distribution, but can be used to show
concentration of LULC types on a landscape. Combination of GIS, remote sensing and statistical analysis capabilities are
powerful tools for assessing and model processes of land use change and their underlying causes in terms of time and space. It is
concluded that ingeniously integration of remote sensing, GIS application combined with multi-source spatial data analysis give
great possibility of quantifying and explaining the temporal and spatial LULC changes and distribution in a given watershed.
Keywords: LandUse/Cover, Change and Distribution, GIS, Remote Sensing, Multinomial Logit Regression, Usangu
1. Introduction
The transformation of land use and land cover is driven by
a range of different factors and mechanisms. While climate,
technology and economics are key determinants of land-use
change at different spatial and temporal scales
[1],geomorphology and edaphic factors determine the LULC
distribution on the landscape [2] . Existence and changes of
LULC in a given time and location occur as a result of many
factors. These factors include political, economic, cultural,
technological, and natural driving factors, including factors
that derive from the spatial configuration (also referred to as
natural configuration). Natural driving factors include site
factors (spatial configuration, topography, and soil conditions)
as well as natural disturbances such as drought, wildfires and
floods which induce long term global change [3]. The LULC
change distribution varies in space and time. This is because
physical and social characteristics of communities vary in
space and time, so do land-use choices, resulting in a spatial
pattern of land-use types [4]. LULC change driving factors
have been defined as the underlying elements that trigger
landscape changes [5]. These factors influence the
trajectories of landscape development [6]. The study of
driving factors of landscape change has a long tradition in
geography and landscape research [7], and is gaining
increasing attention in landscape-change research. Indeed,
driving factors have been identified as one of the six core
concepts for the modelling of land-use change [8].
The driving factors form a complex system of dependencies
and interactions and affect a whole range of temporal and
spatial levels. Time series analysis of land cover changes and
the identification of the driving factors responsible for these
changes are neededindesigning appropriate management
techniques for natural resources and also for projecting future
land cover trajectories [9]. Land cover change information is
needed regarding what and how changes occur, where and
when they occur, the rates at which they occur, and the social
and physical factors that drive those changes [10]. Good
American Journal of Remote Sensing 2015; 3(1): 6-16 7
understanding of biological, social and physical factors which
regulate and shape landuse/cover in a certain landscape is a
pre-requisite towards proper eco-environment management.
Understanding of land use change dynamics is foremost
concerned with quantities of change [11].
Several LULC change related studies [12-14] have been
carried out in Usangu catchment. However, these studies did
not include spatial analyses of the driving factors of LULC
change. Indeed, many studies on LULC analysis is Tanzania
have focused only on quantifying the amount of the change
and qualitative description of the factors causing the changes
observed. To a less extent spatial-temporal and statistical
analysis of the driving factors of LULC changes have been
studied. Spatial analysis is instrumental in land use planning
and informed decision making. In addition, spatial LULC
analysis with respect to parameters like slope, elevation,
annual rainfall amounts look into more interwoven and
hidden factor-factor and factor LULC change relationships.
The choice of factors for analysis in this study (i.e. rainfall
amounts and distribution, population density) was guided by
facts provided by the districts’ officers in Usangu catchment
as well as the common factors discussed in literature [15,
16].The contributions of each driving factor on the observed
LULC change need to be identified so as to enable informed
decisions while managing landscapes. The objective of this
study is to assess changes and distributions of LULC in
Usangu Watershed landscapes from 2000-2013. The study
demonstrates applications of GIS in integrating data from
various sources and use of multinomial regression approach
in accounting for LULC changes and distribution.
2. Material and Methods
2.1. Study Area
Usangu sub-catchment is found in the upper part of Rufiji
Basin in Tanzania. It lies between latitudes 7°45′ and 9°25′
South, and longitudes 33°40′ and 35°40′ East, covering an area
of approximately 20,800 km2. About 4,840 km
2 (23%) of the
Usangu sub-catchment is in the alluvial plains below 1100 m
above the mean sea level (amsl). The remaining 77% of the
catchment area lies in the ‘high catchment’, which ranges in
altitude from about 1,100 to over 2,000 m amsl. The catchment
is surrounded by the Kipengere, Poroto and Chunya mountains
with elevations up to 3000m amsl. The Usangu catchment is
vital to Tanzania for its irrigated rice production as well as for
its livelihoods options for smallholder farmers and agro-
pastoralists [17].
Usangu catchment is characterized by uni-modal rainfall
which starts in November/December and ends in April/May
[18]. The highlands surrounding the wetlands are among the
areas with the heaviest rainfall in Tanzania, from where the
bulk of the flow to Great Ruaha River is generated [19]. The
highlands receive precipitation of about 1600 mm/year, while
the plains receive around 500-700 mm/year [17]. Major
tributaries to the Great Ruaha River with confluences in the
Usangu catchment are Mbarali, Kimani, Chimala and
Ndembera River.
2.2. Data Types and Sources
Historical land use/cover data of the watershed were
extracted from the 2000, 2006 and 2013 Landsat images.
Satellite imagery for land use/cover analysis was acquired
through direct download from the U.S. Geological Survey
website (http:\\glovis.usgs.gov). Usangu Catchment extends
over three different Landsat paths and rows. The dates of the
satellite imagery used in the study and their associated path
and rows are shown in Table 1. The spatial resolution of these
satellite images 30 meters.
Table 1.Characteristics of satellite imageries used.
Year path168/row066 path169/row065 path169/row066
2000 2000-05-11 2000-07-21 2000-07-21
2006 2006-06-05 2006-05-27 2006-05-27
2013 2013-06-08 2013-05-14 2013-05-14
The images were purposely selected from the US
Geological Survey website, based on the growing calendar in
such a way that major crops that are cultivated in the study
area were still in the field. Other data used included digital
elevation model, population density data, river and roads
network shapefiles. Population data for 2002 and 2012 were
downloaded from Tanzania Bureau of Statistics website
(http://www.nbs.go.tz/). The population density for 2002 was
then projected for 2006 population estimate.Data for the soil
types were extracted from version (3.6) of the digitized FAO
Soil Map of the World
(http://www.waterbase.org/download_data.html). Soil names
were coded as “Soil1, Soil2…Soil8” for subsequent analyses.
Names and descriptions of soils types are presented in Table
2. Note, the satellite images and soil data were extracted from
the international sources as earlier mentioned because such
data could not be obtained from the country’s sources.
Table 2. Soil types and their description.
Soil type Code Description
Leptosols Soil1 Very shallow soils over hard rock or in unconsolidated very gravelly material
Fluvisols Soil2 Young soils in alluvial deposits
Cambisols Soil3 Weakly to moderately developed soils
Andosols Soil4 Young soils formed from volcanic deposits
Lixisols Soil5 Soils with subsurface accumulation of low activity clays and high base saturation
Solonetz Soil6 Soils with subsurface clay accumulation, rich in sodium
Acrisols Soil7 Soils with subsurface accumulation of low activity clays and low base saturation
Nitisols Soil8 Deep, dark red, brown or yellow clayey soils having a pronounced shiny, nut-shaped structure
8 Canute Hyandye, et al.: GIS and Logit Regression Model Applications in Land Use/Land Cover Change and
Distribution in Usangu Catchment
2.3. Data Processing and Analysis
Satellite images were pre-processed before classification
was performed. Layer stacking was performed to combine
bands and then image edges were trimmed out in ArcMap
using the Landsat WRS II path and raw shapefiles. Images of
the same year but from different path and rows were
radiometrically corrected and then mosaicked in ERDAS
Imagine 2011 software [20]. Supervised classification was
performed in ArcMap 10.1[21] whereby the training sites
were selected based on the ground-truth GNSS(Global
Satellite Navigation System) coordinates which were
collected during field reconnaissance. Other ancillary data
like shapefiles of roads, irrigation project maps, rivers and
settlements facilitated the selection of classification training
samples. Each imagery was classified into 9 landuse/cover
classes as modified from Anderson scheme of landuse/cover
classification [22]. Landuse/cover classes for this study and
their details areshown in Table 3.
Table 3. Land use/land cover classes and their descriptions.
Class Details
Grassland (GRA) Tall to short grasses, sometimes bare soils in dry season.
Wetland (WET) Areas with lands partially covered with water and grasses
Woodland (WOD) Areas with wood trees but less closed canopy
Forest (FOR) Areas with closed trees, thick canopy, both natural and planted forests.
Shrubs (SHR) Short and scatted trees, mainly thorn buses and acacia trees
Agricultural land (AGR) All land with crops
Bare land (Rock&Soils) (BAR) Bare soils, rock out crops, quarry areas, sands, eroded soils
Water (WAT) Rivers, water in wetlands, fish ponds and water in agricultural areas
Urban (URB) Tarmac and gravel roads, concrete areas, urban and rural settlements
2.4. Land Use/Cover Classification Accuracy Assessment
The accuracy of image classification was checked using
the ground truthing GNSS points data as well as other
reference points which were randomly selected from the
features of the satellite images. A maximum of 60 points was
selected for each LULC class. As shown in Table 4, the
individual accuracy of the LULC types were estimated using
the producer’s accuracy (omission error) and user’s accuracy
(commission error).
Table 4. Classification accuracy (%) for LULC maps for the year 2000, 2006 and 2013.
2000
2006
2013
Class name Producer Accuracy Users Accuracy Producer Accuracy Users Accuracy Producer Accuracy Users Accuracy
Grassland 95.0 79.2 86.7 71.2 91.7 64.0
Wetland 83.6 85.0 85.0 85.0 86.7 85.2
Woodland 85.2 86.7 75.4 86.8 90.0 91.5
Forest 91.7 98.2 93.3 100.0 90.0 96.4
Shrubs 86.7 80.0 93.3 78.9 93.3 94.9
Agric 90.0 81.8 86.7 83.9 90.0 76.1
Bare land (Rock&Soils) 97.5 92.9 75.0 81.1 66.7 100.0
Water 81.0 95.9 86.7 98.1 75.0 100.0
Urban 78.3 94.0 83.3 89.3 81.7 87.5
The overall classification accuracy (%) are 87.3, 85.4 and85.7 for 2000, 2006 and 2013, respectively while the overall kappa statistics for the same years are
0.86, 0.84 and 0.86, respectively.
The producer’s accuracy was computed by dividing the
number of samples in an individual class identified correctly
by the respective reference totals while the user’s accuracy
was computed by dividing the number of samples in an
individual class identified correctly with the classified totals
[23, 24]. The overall classification accuracy was derived by
dividing the total number of correctly classified landuse
classes by the total number of reference data [23]. Kappa
statistics, also known as Khat - Coefficient of agreement
[25]was calculated using the following formula;
^1 1
2
1
( )
( )
k k
ii i ii i
k
i ii
NK
x x x
N x x
+ += =
+ +=
− ×=
− ×∑ ∑
∑ (1)
Where k is the number of rows, xiiis the number of
observations correctly classified for a particular category
(summarized in the diagonal of the matrix), xi+ and x+i are
marginal totals for raw and column i associated with the
category, and N is the total number of observations in the entire
error matrix. Kappa statistics is a measure of agreement or
accuracy between remote sensing-derived classification map and
the reference data. Looking at the 2013 users’ accuracy on bare
land and water, the scores highlight that having local knowledge
of the study area has a bearing on the accuracy of the
classification. Other studies have found the same pattern [26, 27].
2.5. Land Use/Change Detection
IDRISI Selva software[28] was used for land use/cover

American Journal of Remote Sensing 2015; 3(1): 6-16 9
change detection. This was achieved through cross-tabulation
of classified images using Change/Time series analysis tool
(CROSS TAB). Classified images were cross-tabulated in
pairs, that is 2000/2006 and 2006/2013 classified images.
The results of cross-tabulation were summarized in a
spreadsheet whereby the quantity and percentage of change
of each land cover/use class were calculated.
2.6. Land Use/Cover Change and Distribution Influencing
Factors
Multinomial logistic regression analysis was carried out
using SPSS Version 17 to determine how the identified land
use/cover drivers influence the existence of the observed land
use/cover class in a specific location (spatial distribution) and
observed LULC change. Classified images contained
multiple categories of LULC classes, hence necessitated the
choice of this analysis model [29]. Classified Land use/cover
of 2000, 2006 and 2013 together with the eight LULC drivers
were converted into polygons, overlaid and their database file
was exported into SPSS as Y and X variables for statistical
analysis. The LULC driving factors considered were graded
maps of slope, elevation, distance from roads, distance from
rivers, population density, annual rainfall, Normalized
Difference Vegetation Index (NDVI) and soil types. The
analysis outputs were individual logistic regression equations
for each land use/cover category except for bare land class
which was a reference category. The individual regression
coefficients exponents (eβ) of the independent variables (odds
ratio) were translated as the magnitude of the probable
change in LULC due to change in one unit in independent
variable in the logit model.The resulting logistic regression
odds ratio values are presented in Table 7, 8 and 9.
The analysis of the influence of factors related to
distribution of LULC on the landscape was performed using
graphical analysis and interpretation of odds values. The
classified images were cross-tabulated with the driving
factors maps, and then the graphs of the cross-tabulated
results were generated.
3. Results and Discussions
3.1. LandUse/Cover Classification Accuracy
The overall classification accuracy of the classification for
2000, 2006 and 2013 were 87.3, 85.4 and 85.7%, respectively.
The overall Kappa Statistics for the 2000 imagery was 0.86
while for 2006 and 2013 was 0.84. The USGS satellite
imagery classification scheme has set the minimum standard
for accuracy assessment to be 85% [16, 22]. Generally, the
results of classification accuracy assessment in this study are
acceptable. Kappa values greater than 0.80 (i.e. >80%)
represent strong agreement or accuracy between the
classification made and the ground reference information
[25]. Land use/cover type classes in Usangu catchment from
the year 2000 to 2013 are shown in Fig.s 1 a-c. These figures
clearly show that land use/cover types are not static over time.
They change either naturally or under the influence of human
activities.
Fig. 1. LULC maps for Usangu Catchment for years (a) 2000 (b) 2006 (c)
2013.
Transition matrices in Tables 5 and 6 illustrate the changes
of land uses in Usangu sub-catchment for the period between
2000 and 2013. Each row indicates the proportion (%) of the
original land use that changed into other land uses by the end
of the period. Diagonal elements are the retention frequencies,
that is, the lands of a given class that maintains its identity
with no change to another LULC class. Last but one row in
Tables 5 and 6 show the amount of gain or loss of each land

10 Canute Hyandye, et al.: GIS and Logit Regression Model Applications in Land Use/Land Cover Change and
Distribution in Usangu Catchment
class (in km2) between 2000/2006 and 2006/2013. The
percentages of the change are shown in the last row of each
table. Since the main economic activity in the study area is
agriculture, discussion on changes on agricultural land is
given due emphasis.
Table 5. Land use/cover change matrix (km2) from 2000-2006.
2000
GRA WET WOD FOR SHR AGR BAR WAT URB 2006 Total
2006
GRA 2407.0 488.0 436.7 118.7 774.7 918.4 39.4 2.4 155.3 5340.6
WET 288.2 367.2 22.7 0.1 90.1 507.5 8.7 4.1 35.0 1323.5
WOD 449.7 58.3 1912.3 426.2 1209.1 378.8 0.7 3.5 28.7 4467.5
FOR 109.3 5.5 229.2 340.4 165.8 51.5 0.3 0.0 5.4 907.5
SHR 1196.9 113.6 1351.2 97.2 640.9 683.5 4.5 0.2 45.8 4133.6
AGR 902.4 274.1 862.0 13.4 646.6 632.7 13.3 1.2 81.7 3427.4
BAR 415.8 48.8 0.2 0.1 16.9 44.5 14.6 0.2 44.1 585.1
WAT 1.3 4.0 0.1 0.0 0.3 3.5 0.1 0.6 0.3 10.3
URB 242.5 52.4 18.1 12.6 105.3 2.6 3.7 0.9 76.4 514.5
2000 Total 6013.0 1411.8 4832.6 1008.5 3649.6 3223.1 85.4 13.2 472.7 20709.9
Change (km2) -672.4 -88.4 -365.1 -101.0 484.0 204.2 499.8 -2.8 41.8
Change (%) -11.2 -6.3 -7.6 -10.0 13.3 6.3 585.5 -21.6 8.8
Note: GRA: Grass land, WET: Wetland, WOD: Woodland, FOR: Forest, SHR: Shrubs, AGR: Agric, BAR: Bare land, WAT: Water, URB: Urban
Table 6. Land use/cover change matrix (km2) from 2006-2013.
2006
GRA WET WOD FOR SHR AGR BAR WAT URB 2013 Total
2013
GRA 3081.4 328.9 744.8 200.1 1691.9 1184.9 347.6 1.5 351.7 7932.9
WET 476.9 451.3 75.6 3.7 104.8 254.9 53.4 4.8 42.9 1468.5
WOD 210.1 40.1 1586.3 119.9 910.3 981.4 1.8 0.4 7.0 3857.4
FOR 87.4 0.1 299.6 216.5 70.8 9.1 0.0 0.0 7.9 691.5
SHR 306.4 1.1 759.8 190.4 647.4 88.4 0.1 0.0 17.2 2010.8
AGR 934.1 470.8 927.2 151.8 602.1 792.3 130.0 3.2 89.1 4100.6
BAR 45.0 4.2 0.3 0.3 4.8 15.4 19.8 0.0 3.6 93.3
WAT 1.4 1.6 7.1 0.9 0.8 1.0 0.1 0.3 0.5 13.6
URB 197.9 25.4 66.6 23.8 100.6 99.9 32.5 0.1 84.6 631.4
2006 Total 5340.6 1323.5 4467.5 907.5 4133.6 3427.4 585.1 10.3 604.5 20799.9
Change (km2) 2592.3 145.0 -610.1 -216.0 -2122.8 673.2 -491.8 3.2 26.9
Change (%) 48.5 11.0 -13.7 -23.8 -51.4 19.6 -84.0 31.4 4.4
The total area under agriculture in 2000 was 3223.1km2
and 3427.4km2 in 2006. Between 2000 and 2006, agricultural
land expanded by 204.2km2(6.3%). This expansion of
agricultural land resulted from converting other
landuse/cover classes into agriculture as follows; Grassland
(902.4 km2), Woodland (862 km
2), Shrubs (646.6 km
2) and
Wetlands (274.1 km2). Similarly, between 2006 and 2013
agriculture land expanded by 19.6%). Major land classes of
2006 which were converted to agriculture in 2013 are
Grasslands (934.1 km2), Woodlands (927.2 km
2), Shrubs
(602 km2) and Wetlands (470.8 km
2). Here, major
agricultural expansion has taken place in the grassland areas,
although woodland, shrubs and wetlands conversions are also
significant.
Results in Tables 5 and 6 show that forests are being
converted mainly into woodlands, shrubs and agriculture. On
the other hand, wetlands are converted mainly to grasslands
and agriculture both in 2000-2006 and 2006-2013. Looking
into land uses/covers which have been converted into
agriculture in 2006 and 2013; it implies that agriculture
extends to areas with favourable features for crops that are
cultivated in the study area. Major lands which are being
converted to urban class are grasslands and shrubs.
3.2. Determinants of Landuse/Cover Change and
Distribution
The multinomial logit regression used in this study involved
eight LULC change and distribution factors as earlier
mentioned in Introduction section. The individual regression
odds ratio values results from analysis are shown in Tables 7, 8
and 9.
The magnitude of probability (Odds) of a change of a
particular LULC to another is indicated by the magnitude of
the Odds ratio values. The odds ratio represents the change in
odds of being in one of the categories of outcome when the
value of a predictor increases by one unit, controlling for other
factors in the model [30]. The Odds ratio value less than 1 in
this table shows how less likely the change in LULC occurs as
a result in the additional 1 unit of the independent variable.
Odds ratio value greater than 1 indicates the number of times
the change is more likely to occur compared to the reference
dependent category. The amount of change can be significant
or non-significant. The non-significant cases (p>0.05) in
Tables 7, 8 and 9 are denoted by an asterisk “*”. The changes
in LULC due to effects of increasing the driving factor by one
unit are significant if p<0.05. In this research, LULC classes
and soil types were categorical data while other factors were

American Journal of Remote Sensing 2015; 3(1): 6-16 11
continuous data. During the multinomial logistic regression
analysis, bare land was purposively considered as the reference
category while Nitisols (Soils8) was taken as a reference
category for soil type classes.
Table 7. Results of Logistic Regression (Odds ratios) for LULC in 2000.
LULC
GRA WET WOD FOR SHR AGR WAT URB
Factors
Slope 1.890 1.236 1.768 1.549 1.742 1.767 1.595 1.438
Elevation 3.488 1.020* 7.631 14.372 4.716 3.150 3.124 2.076
D-Roads 1.432 1.603 2.135 1.850 2.033 1.507 1.620 1.133
D-Rivers 1.371 1.257 1.165 1.179 1.169 1.584 1.217 1.320
P-Density 2.008 1.819 1.950 2.044 2.105 1.883 2.825 2.209
Annual Rain 1.388 0.428 2.671 6.302 2.398 1.581 3.734 2.238
NDVI 2.507 2.738 4.290 1.802 3.084 2.817 6.953 1.857
[Soils1] 0.557* 0.016 0.078 0.057 0.301* 2.375* 979.863 6.534*
[Soils2] 0.496* 0.023 0.038 0.001 0.258* 3.605* 5620.257 4.853*
[Soils3] 1.249* 0.010 0.255 0.002 0.877* 3.677* 6.011 7.077*
[Soils4] 0.547* 0.019 0.107 0.077 0.459* 3.129* 1112.108 10.415
[Soils5] 5.880* 0.022 0.383* 0.004 3.067* 10.758 1333.821 29.857
[Soils6] 1.347* 0.026 0.059 0.004 0.311* 5.528* 102.077 27.312
[Soils7] 2.853* 0.151* 2.069* 1.907* 3.349* 8.622 3785.201 35.868
[Soils8](Ref) - - - - - - - -
*p<0.05, LULC reference category is Bare land, Soil types reference category is Soils8 (Nitisols)
Note: D-Roads = Distance from Roads-Rivers=Distance from Rivers-Density=Population Density, Soils1=Leptosols, Soil2=Fluvisols, Soil3=Cambisols,
Soil4=Andosols, Soil5=Lixisols, Soil6=Solonetz, Soil7=Acrisols, Soil8=Nitisols
Table 8. Results of Logistic Regression (Odds ratios) for LULC in 2006
LULC
GRA WET WOD FOR SHR AGR WAT URB
Factors
Slope 1.064 1.217 1.069 1.002* 1.086 1.160 .467 .930
Elevation 4.352 1.873 7.062 10.247 5.231 3.932 .485 3.926
D-Roads 1.115 1.038 1.549 1.554 1.270 1.421 3.494 .883
D-Rivers 1.079 0.717 0.983 0.970 1.107 0.998* .717 .958
P-Density 0.905 0.779 0.745 0.959 0.722 0.741 1.670 1.241
Annual Rain 0.846 0.292 1.087 1.162 0.559 0.640 1.020* 1.189
NDVI 24.454 130.326 188.067 12.899 49.692 73.622 147.695 4.777
[Soils1] 0.015 0.405* 0.007 0.002 0.004 0.019 .109* .051
[Soils2] 0.016 0.590* 0.007 0.002 0.003 0.016 .147* .039
[Soils3] 0.024 0.159 0.008 0.003 0.013 0.044 .007* .038
[Soils4] 0.018 0.283* 0.010 0.003 0.003 0.013 .044* .067
[Soils5] 0.053 0.144 0.027 0.014 0.012 0.029 .070* .256
[Soils6] 0.055 0.263* 0.014 0.017 0.014 0.043 .009* .059
[Soils7] 0.074 0.973* 0.046 0.025 0.031 0.058 .176* .176
[Soils8](Ref) - - - - - - - -
*p<0.05, LULC reference category is Bare land, Soil types reference category is Soils8 (Nitisols)
Table 9. Results of Logistic Regression (Odds ratios) for LULC in 2013.
LULC
GRA WET WOD FOR SHR AGR WAT URB
Factors
Slope 1.740 1.323 1.753 1.344 1.587 1.515 2.003 1.414
Elevation 2.720 1.344 2.540 8.310 5.020 2.204 2.326 2.265
D-Roads 1.853 1.717 2.568 4.244 4.537 1.914 3.400 1.028*
D-Rivers 1.498 1.532 1.162 1.425 1.197 1.418 1.116 1.308
P-Density 1.427 1.417 1.291 1.296 2.032 1.381 2.031 1.736
Annual Rain 2.646 1.639 4.114 11.438 4.815 4.857 8.746 3.419
NDVI 1.256 0.551 0.394 0.625 0.486 0.525 0.416 1.085
[Soils1] 1.444 16.007 0.085 0.027 0.149 0.273 0.109 0.368
[Soils2] 1.171* 33.526 0.055 0.001 0.000 0.481 1.203* 0.218
[Soils3] 6.907 57.276 0.288 0.000 0.057 0.622 0.007 2.204
[Soils4] 4.893 35.945 0.427 0.099 0.766* 0.931* 0.601 1.396
[Soils5] 90.169 238.227 7.007 0.090 4.736 8.116 2.363 9.137
[Soils6] 5.440 22.756 0.244 0.010 0.012 0.605 0.008 5.163
[Soils7] 14.156 16.364 2.338 1.206 9.620 2.224 1.675 4.875
[Soils8](Ref) - - - - - - - -
*p<0.05, LULC reference category is Bare land, Soil types reference category is Soils8 (Nitisols)
12 Canute Hyandye, et al.: GIS and Logit Regression Model Applications in Land Use/Land Cover Change and
Distribution in Usangu Catchment
The results in Tables 7, 8 and 9 present three types of
information. First, Odds (probability) of dependent variable
(LULC classes) to change as a result of change in one unit of
an independent variable. Second, possibility of change in
space of one LULC class to another as one move spatially
from one category to another of the same influencing factor,
example from low elevation to high elevation, or from one
soil type to another.
Although the logistic regression model was set in such a
way that LULC (dependent variable) was influenced by
several factors, some of the factors change with time while
others do not. For example elevation and slope do not change
with time but do so across the landscape. Annual rainfall,
population density and NDVI change with time; and this
change determines LULC. The nature of land
geomorphology (slope and elevation) acts as natural barriers
to landscape ecosystem change by limiting at different
degrees the movement of human activities. Steep slopes and
high elevations, for example, favour forests, grasses but
discourage agriculture. Hence, these two factors account for
the existing distribution of LULC distributions on a given
geographical location.
3.2.1. LandUse/Land Covers Change
General analysis of the odds ratio values shown in Tables 7,
8 and 9 indicate that compared to other factors, elevation,
annual rainfall, NDVI and soil types bear large values in
almost all land use classes. The higher the odds ratio values,
the higher the probability of that particular LULC class to
change as a result of changing the magnitude of independent
factor by one unit [31, 32]. The odds ratio associated with
soil types are all less than one (OR<1) almost in all LULC
classes except grasslands (2000&2013), wetlands (2013),
water (2000&2013) and urban (2000&2013). This implies
that the spatial change in soil typesalso leads to changes in
spatial distribution of grassland, water, urban lands and
wetlands.
It can also be noted that even in cases where odds ratio
values associated with soil types are statistically significant,
the effect of the change is small (OR<1). This implies that,
compared to bare land, chances are low for LULC to change
on different soil types across the landscape. Interesting
results associated with soil types can be seen on soils 5
(Lixisols) and soil7 (Acrisols), respectively. The odds ratios
for these soils are higher under wetlands, grasslands,
agricultural lands, water and urban lands. These two soils are
characterized with subsurface accumulation of low activity
clays, whereby Lixisols have higher base saturation than
Acrisols. They are older, well-formed and deep soils which
favor agriculture. Conversion of grassland and wetlands to
agriculture is a common feature in the study area (Table 5
and 6). Therefore, these soils determine spatial distribution of
agriculture and wetlands in the study area. Spatial change to
other soil types leads to great LULC changes associated with
agriculture, wetlands and grass lands.
Odds ratio associated with slope and distance from water
networks do not show great variations in Tables 7, 8 and 9.
Almost all values for distance from rivers are less than 1. So
the influences of these two independent variables are less
discussed in this paper. A study by Cihlar et al. (2001) found
that slope class has a strong relation with land use class.
Lands on the steep areas are always related to land uses like
forestry and pastures and meadows.
The influence of each factor on LULC change and
distribution as shown by odds ratio values in Tables 7, 8 and
9 are further summarized in terms of the decreasing
magnitude of odds ratio in Table 10. This summary shows the
most affected LULC class when the selected factors
magnitudes are changed by one unit in a particular year of
observation.
Table 10. Odds ratio of change of selected LULC (Decreasing in magnitude) under different factors.
Factor 2000 2006 2013
Elevation FOR>WOD>SHR>GRA>AGR FOR>WOD>SHR>GRA>AGR FOR>SHR>GRA>WOD>WAT
D-Roads WOD>SHR>FOR>WAT WAT>FOR>WOD>AGR SHR>FOR>WAT>WOD
P-Density WAT>URB>FOR>GRA WAT>URB>FOR>GRA SHR>WAT>GRA>WET>AGR
Annual rain FOR>WAT>WOD URB>FOR>WOD FOR>WAT>AGR
NDVI WAT>WOD>SHR>WET>GRA WOD>WAT>WET>SHR>GRA GRA>URB>FOR>WET>AGR
Soil[5] WAT>URB>AGR>GRA>SHR URB>WET>WAT>GRA WET>GRA>URB>AGR>WOD
Soil[7] WAT>URB>AGR>SHR>GRA WET>URB>WAT>GRA WET>GRA>SHR>URB>WOD
Generally, Table 10 shows that elevation determines
greatly the distribution of forestlands, woodlands and shrubs
compared to the reference land category. Field observation
shows that the higher the altitude, the more the forests and
woodlands. It can also be note that increase of distances from
roads also affects distribution of forests, woodlands and
water bodies. Population density has great impacts on water
bodies, urban lands, grasslands and wetlands. Changes in
forest lands, woodlands and water resources are also
controlled by the amount of annual precipitation. Changes in
annual precipitation affect much these types of LULC classes.
3.2.2. Land use/land Covers Distribution
Landscapes in Usangu watershed are covered by wide
variations of biological as well as physical features. There is
a distinct change in vegetation from the highlands to the
lowlands. The existence of such land use/cover types across
the watershed landscape is a function of many factors
ranging from demographic, climatic, edaphic and social-
economic aspects. These factors also influence the changes in
LULC which take place in a catchment [15, 29]. This study
has shown that there is close relationship between the

American Journal of Remote Sensing 2015; 3(1): 6-16 13
distribution and existence of a given LULC with annual
rainfall, elevation and soil types. However, the existence and
distribution of LULC are mainly influenced by
geomorphologic/relief, climatic or edaphic factors. The
influence of elevation on LULC is demonstrated in Fig. 2.
Fig. 2. LULC distribution along elevation grades.
Agriculture, which is the main economic activity in the
Usangu plains, is dominant in low elevation areas (1020-
1100m amsl). By 2013, itoccupied about 40.7% of all land
area, and its size decreases as the elevation increases. At
2000-2500m amsl, it occupies only 9.5% of all the land cover.
This pattern of distribution can be attributed to elevation
barrier. As elevation increases, accessibility to the area and
agricultural activities become difficult. Similarly,
Fig.3depicts reduced human settlementswith increase in
altitude. Large population is found in elevations from 1100-
2000m amsl, then decreases drastically to areas located at
2000-2500m amsl. Low population in high altitude areas
gives a room for existance of forests and woolands.
Agricultural land and urban areas are also distributed mainly
in these areas. Agricultural activities are dominant in
wetlands which are located in low altitudes (less than 1100 m
amsl).
Fig. 3.Changes in population densitywith altitude in Usangu Catchment.
Distribution of LULC based on elevation trend has been
reported in previous studies and resulted almost the same as
the one reported in this study. Remnant montane humid
forestare found above 2,000m amsl while Miombo woodland
dominates the elevations between 2,000m and 1,100m amsl
[18]. Areas below 1,100m amsl are dominated by the fans
and Usangu wetlands. The fans are fertile and consequently
many agricultural activities are concentrated here.

14 Canute Hyandye, et al.: GIS and Logit Regression Model Applications in Land Use/Land Cover Change and
Distribution in Usangu Catchment
Fig. 4. LULC distribution on slope grades (bar chart) and total LULC in each slope grade (pie chart).
As discussed earlier, terrain in landscapes determines
human activities. Evidence from field observation shows
reduced human activities in terms of tree cutting and charcoal
burning with increase in altitude. Conversely, flatness of the
area encourages the type of economic activities that take
place in Usangu catchment. For this reason, large part of the
flat areas (0-2% slope)is occupied by different LULC types
as indicated in Fig 4. Similarly, a pie chart inserted in Fig.4
shows that about 54% ofthe area covered by Usangu
catchment lies in the slope measuring 0-2%. Steep slopes
hinders infrustuctural development like roads, irrigation
schemes and houses for settlements. This explains why urban
areas (65.0%) lie between 0-2% slope. Steep areas (slope of
10-15%,15-25and >25%) are dominated by trees and shrubs,
but in the decreasing magnitude. Moderate slope (10-15%) to
steep area (15-25% slope) can be tolerated by big trees, but
very steep slopes (25% slope) coupled with shallow soils
discouaragesexistance of big trees as there may be frequent
land slides and soil erosion [2].
Distance from roads is another important predictor of
distribution of certain LULC types; of special interests in this
study are urban and agricultural lands. Current lands
occupied by these LULC classes are a result of converting
other land covers like forests, shrubs or grass lands in support
of economic activities such as transportation and irrigation.
Major irrigation schemes in the study area (e.g. Kapunga,
Igomelo, Mbarali Estates, Madibira and Ihahi) are close to
road networks. In general, roads attract human settlements.
Fig.5 shows that about 95.3% of urban land (settlements) is
found within 0-10 kilometers from road networks, while
2.3% and 0.9% of urban lands are found at 10-20 km and 30-
40 km, respectively.On the other hand, agricultural lands
(48.6%) are distributed within 0-10km from roads. This
proportion decreases slowly as distance from roads reaches to
as far as 40-50kms (6.3%).
Fig. 5. LULC distribution with respect to distance from the roads network in Usangu catchment.
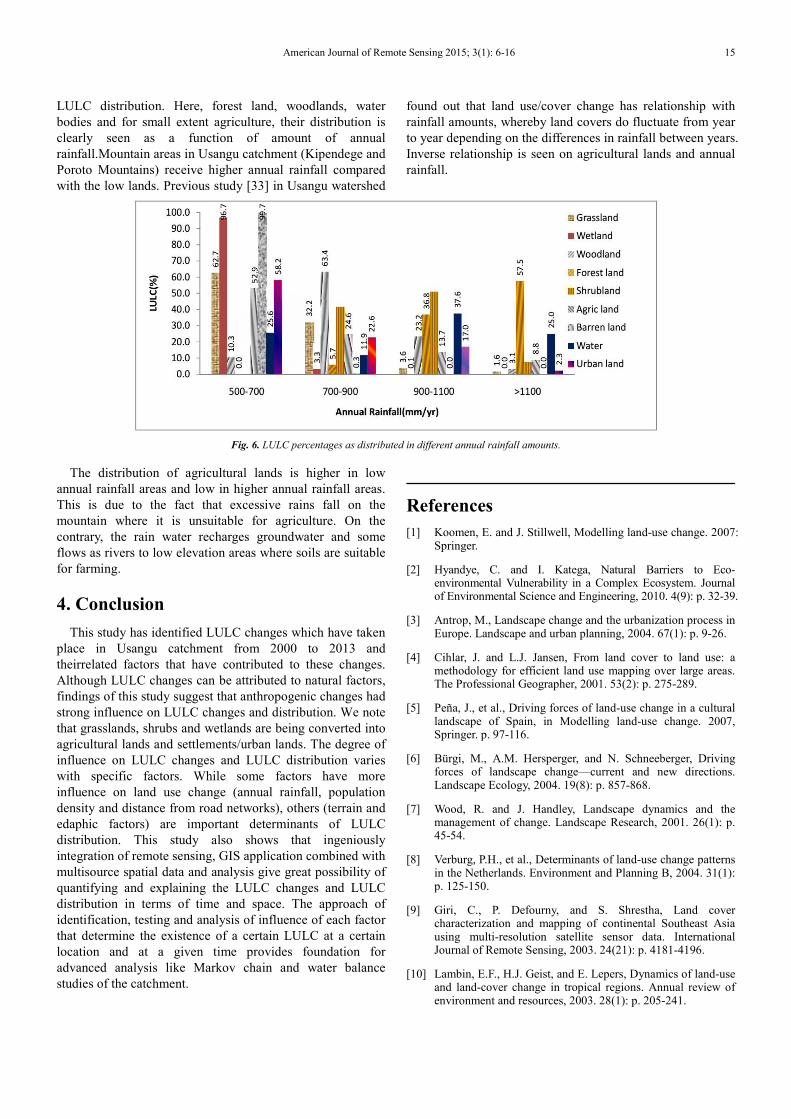
As shown earlier in Tables 7, 8 and 9 and summary of
results in Table 10, amount of annual rainfall distribution
determines distribution of certain LULC classes. Information
in Fig.6 gives further details of the influence of rainfall on
American Journal of Remote Sensing 2015; 3(1): 6-16 15
LULC distribution. Here, forest land, woodlands, water
bodies and for small extent agriculture, their distribution is
clearly seen as a function of amount of annual
rainfall.Mountain areas in Usangu catchment (Kipendege and
Poroto Mountains) receive higher annual rainfall compared
with the low lands. Previous study [33] in Usangu watershed
found out that land use/cover change has relationship with
rainfall amounts, whereby land covers do fluctuate from year
to year depending on the differences in rainfall between years.
Inverse relationship is seen on agricultural lands and annual
rainfall.
Fig. 6. LULC percentages as distributed in different annual rainfall amounts.
The distribution of agricultural lands is higher in low
annual rainfall areas and low in higher annual rainfall areas.
This is due to the fact that excessive rains fall on the
mountain where it is unsuitable for agriculture. On the
contrary, the rain water recharges groundwater and some
flows as rivers to low elevation areas where soils are suitable
for farming.
4. Conclusion
This study has identified LULC changes which have taken
place in Usangu catchment from 2000 to 2013 and
theirrelated factors that have contributed to these changes.
Although LULC changes can be attributed to natural factors,
findings of this study suggest that anthropogenic changes had
strong influence on LULC changes and distribution. We note
that grasslands, shrubs and wetlands are being converted into
agricultural lands and settlements/urban lands. The degree of
influence on LULC changes and LULC distribution varies
with specific factors. While some factors have more
influence on land use change (annual rainfall, population
density and distance from road networks), others (terrain and
edaphic factors) are important determinants of LULC
distribution. This study also shows that ingeniously
integration of remote sensing, GIS application combined with
multisource spatial data and analysis give great possibility of
quantifying and explaining the LULC changes and LULC
distribution in terms of time and space. The approach of
identification, testing and analysis of influence of each factor
that determine the existence of a certain LULC at a certain
location and at a given time provides foundation for
advanced analysis like Markov chain and water balance
studies of the catchment.
References
[1] Koomen, E. and J. Stillwell, Modelling land-use change. 2007: Springer.
[2] Hyandye, C. and I. Katega, Natural Barriers to Eco-environmental Vulnerability in a Complex Ecosystem. Journal of Environmental Science and Engineering, 2010. 4(9): p. 32-39.
[3] Antrop, M., Landscape change and the urbanization process in Europe. Landscape and urban planning, 2004. 67(1): p. 9-26.
[4] Cihlar, J. and L.J. Jansen, From land cover to land use: a methodology for efficient land use mapping over large areas. The Professional Geographer, 2001. 53(2): p. 275-289.
[5] Peña, J., et al., Driving forces of land-use change in a cultural landscape of Spain, in Modelling land-use change. 2007, Springer. p. 97-116.
[6] Bürgi, M., A.M. Hersperger, and N. Schneeberger, Driving forces of landscape change—current and new directions. Landscape Ecology, 2004. 19(8): p. 857-868.
[7] Wood, R. and J. Handley, Landscape dynamics and the management of change. Landscape Research, 2001. 26(1): p. 45-54.
[8] Verburg, P.H., et al., Determinants of land-use change patterns in the Netherlands. Environment and Planning B, 2004. 31(1): p. 125-150.
[9] Giri, C., P. Defourny, and S. Shrestha, Land cover characterization and mapping of continental Southeast Asia using multi-resolution satellite sensor data. International Journal of Remote Sensing, 2003. 24(21): p. 4181-4196.
[10] Lambin, E.F., H.J. Geist, and E. Lepers, Dynamics of land-use and land-cover change in tropical regions. Annual review of environment and resources, 2003. 28(1): p. 205-241.

16 Canute Hyandye, et al.: GIS and Logit Regression Model Applications in Land Use/Land Cover Change and
Distribution in Usangu Catchment
[11] Jansen, L., G. Carrai, and M. Petri, Land-use change at cadastral parcel level in Albania, in Modelling Land-Use Change. 2007, Springer. p. 25-44.
[12] Kikula, I., Charnley, S., Yanda, P., Ecological changes in the Usangu Plains and their implications on the downstream flow of the Great Ruaha river in Tanzania. Research Report No.99. 1996, Institute of Resource Assessment: Dar es Salaam.
[13] Kashaigili, J.J., et al., Dynamics of Usangu plains wetlands: Use of remote sensing and GIS as management decision tools. Physics and Chemistry of the Earth, Parts A/B/C, 2006. 31(15): p. 967-975.
[14] Kashaigili, J.J., Impacts of land-use and land-cover changes on flow regimes of the Usangu wetland and the Great Ruaha River, Tanzania. Physics and Chemistry of the Earth, Parts A/B/C, 2008. 33(8–13): p. 640-647.
[15] Behera, D., et al., Modelling and analyzing the watershed dynamics using Cellular Automata (CA)–Markov model–A geo-information based approach. Journal of earth system science, 2012. 121(4): p. 1011-1024.
[16] Weng, Q., Land use change analysis in the Zhujiang Delta of China using satellite remote sensing, GIS and stochastic modelling. Journal of environmental management, 2002. 64(3): p. 273-284.
[17] Shu, Y. and K.G. Villholth, Analysis of Flow and Baseflow Trends in the Usangu Catchment, Tanzania. IWMI, International Water Management Institute, Pretoria, South Africa. http://www.ru.ac.za/static/institutes/iwr/SANCIAHS/2012/documents/047_Shu.pdf 2012.
[18] SMUWC, Final Report, Water Resources. Supporting report 7, Directorate of Water Resources, Dar es salaam, Tanzania. 2001a. p. 81.
[19] Kadigi, R.M., et al., Water for irrigation or hydropower generation?—Complex questions regarding water allocation in Tanzania. Agricultural water management, 2008. 95(8): p. 984-992.
[20] Geosystems, L., ERDAS imagine. 2011: Atlanta,Georgia.
[21] ESRI, ArcGIS Desktop 10.1. 2011, Environmental Systems Research Institute: Redlands, CA.
[22] Anderson, J.R., et al., A land use and land cover classification system for use with remote sensor data: US Geological Survey Professional Paper 964,28.Washington,1976.
[23] Kiptala, J., et al., Land use and land cover classification using phenological variability from MODIS vegetation in the Upper Pangani River Basin, Eastern Africa. Physics and Chemistry of the Earth, Parts A/B/C, 2013. 66: p. 112-122.
[24] Lillesand, T.M. and R.W. Kiefer, Remote sensing and image interpretation. 1994, Wiley, New York.
[25] Jensen, J.R., Introductory Digital Image Processing: A Remote Sensing Perspective. 2007: Prentice Hall.
[26] Naidoo, R. and K. Hill, Emergence of indigenous vegetation classifications through integration of traditional ecological knowledge and remote sensing analyses. Environmental Management, 2006. 38(3): p. 377-387.
[27] Molnár, Z., et al., Distribution of the (semi-) natural habitats in Hungary I. Marshes and grasslands. Acta Botanica Hungarica, 2008. 50: p. 59-105.
[28] Labs, C., IDRISI Selva v17. GIS and Image Processing Software 2012.
[29] Abdel-Kader, F.H., Digital soil mapping at pilot sites in the northwest coast of Egypt: A multinomial logistic regression approach. The Egyptian Journal of Remote Sensing and Space Science, 2011. 14(1): p. 29-40.
[30] Tabachnick, B. and L. Fidell, Multivariate analysis of variance and covariance. Using multivariate statistics, 2007. 3: p. 402-407.
[31] Westergren, A., et al., Eating difficulties, need for assisted eating, nutritional status and pressure ulcers in patients admitted for stroke rehabilitation. Journal of clinical nursing, 2001. 10(2): p. 257-269.
[32] Hu, Z. and C. Lo, Modeling urban growth in Atlanta using logistic regression. Computers, Environment and Urban Systems, 2007. 31(6): p. 667-688.
[33] Kashaigili, J.J., et al. Integrated hydrological modelling of wetlands for environmental management: the case of the Usangu wetlands in the Great Ruaha catchment. in RIPARWIN Seminar Presentation, Sokoine Univ. of Agric. Morogoro, Tanzania. 2005.