Using Geographic Information Systems (GIS) to Understand a Community's Primary Care Needs
Upload
khangminh22Category
view
1download
0
European Scientific Journal June 2015 edition vol.11, No.18 ISSN: 1857 – 7881 (Print) e - ISSN 1857- 7431
174
GEOGRAPHIC INFORMATION SYSTEM (GIS) SPATIAL ANALYST TECHNIQUES A
REFERENCE FOR DETERMINING THE POSITION OF CELLULAR SYSTEMS
Ass. Prof. PhD. Haitham K.Ali Ass. Prof. PhD. Hussien D. Mohammed
MA Jihan S. Abdaljabar Sulaimany Polytechnic University, Kurdistan- Iraq
Abstract: The Base Transverse Station (BTS) is one of the main units in the mobile communication system task. It represents the connection chain between the mobile station and the server, and it plays a major role for the completion of the process of communication between users. The towers locations (BTS) and its distributions have negative or positive effect on the active coverage power which affects the communication system. In this paper, the real locations for twenty two towers had been taken and these towers were distributed in six regions in the southern west side of sulaimany city in Iraq. By drawing the pattern for these BTS with radius equal to 200m and 300m using the Geographic Information System (GIS) program, a remarkable difference had been noticed in the radius of these cells. There active coverage areas which are suitable for good communication. Also there are interference regions and weak regions, which are areas with a weak signal or hidden areas; thus both can cause some types of fading. The weakness of the signal at these areas appears because of the irregular distribution of the towers. Finally, this paper summarizes the re-distribution of the towers and as a result the number of the towers had been - eliminated and the - weak area and the - Interference region - had been reduced in order to ensure maximum access of the active coverage area.
Keywords: GIS, BTS, Iraq, sulaimany, area, Interference, communication Introduction Wireless communication is one of the most rapidly growing industries worldwide. It could be cellular phones, pagers, or the more

European Scientific Journal June 2015 edition vol.11, No.18 ISSN: 1857 – 7881 (Print) e - ISSN 1857- 7431
175
traditional systems such as radio and television broadcasting. Wireless communication has become a fundamental infrastructure rivaling other traditional infrastructures such as transportation, electricity, and water supply systems. (International Interdisciplinary Journal, December 2014) A complete end-to-end location-based mobility solution involves three elements: GIS technology, position tracking, and visualization. However, the combination of all three elements is the chemistry for situational awareness. (GIS for Homeland Security, November 2001) GIS provides specialized processing power for the acquisition, access, and analysis of geographic and spatially referenced data. GIS is the core of knowledge for a location-based service solution because it manages and serves data relative to the surrounding environment such as addresses, streets, areas of interest, risks, and hazards. Position tracking is a critical element in location-based services. In a mobile environment, there are essentially two forms of location tracking which are, automatic and manual. Automatic location tracking is a systematic process of the mobile device and the wireless network using either GPS or cellular tower triangulation. Position tracking also includes radio-frequency identification and telemetry technologies. For example, a paper was published in 2007 which represents a study on how to build a GIS application that provides visualization of the tower locations BTS located at Depok City in the form of point on the map. Many information about its spread was easy when permission was given to build the tower base stations in the Depok city, and as such BTS tower construction is expected to be controlled. (Rini and Salim, 2012). Radio-frequency identification is often used to track information on objects, such as shipping containers, hazardous materials, or sensitive cargo, and their whereabouts. Telemetry provides the ability to track position as well as package data from I/O sources such as vehicle computer buses to monitor critical sensors including emergency lights and security systems. With millions of dollars being spent on building wireless communication systems, there is a significant incentive to develop engineering tools that can be used in the accurate and efficient designing and planning of such systems. As the wireless system grows to meet the increasing and changing demands for service, the design tool is again a valuable asset in planning optimum modifications of the system to accommodate growth (International Interdisciplinary Journal, December 2014). The use of mobile phones has a direct impact on the deployment of BTSs. Therefore, to serve an increasing number of users requires an increasing number of BTSs which requires enormous capital investment. This means that mobile cellular communication companies must carefully plan the deployment and configurations of BTSs in order to optimize signal coverage and thus support voice and data traffic at a level of Quality of
European Scientific Journal June 2015 edition vol.11, No.18 ISSN: 1857 – 7881 (Print) e - ISSN 1857- 7431
176
Service (QoS) expected by customers and specified by the network regulator, while at the same time, minimizing the cost(International Interdisciplinary Journal, December 2014).Using GIS program for re-distribution, the BTS towers will be able to decrease pollution and reduce deforestation. Natural disasters also have a critical geographic dimension. Careful analysis of spatial data using GIS can give insight into these problems and suggest ways in which they can be addressed, thus saving a lot of money (Garcia 2003). GIS Applications There are many applications of GIS such as: 1. GIS is used in telecommunication information resources(such as BTS) management which is done using the programmable interfaces provided by Google Earth API, to create an information management system which has the map functions to probe the application of GIS in telecommunication information management. It uses Oracle database to save the system data. These can improve the system's extensibility greatly and reduce the developing difficulty and cost remarkable cost in managing various kinds of resources and making various kinds of decision (Zhenghua, 2011). 2. By analyzing the current status of mobile communication network management system, and using ArcGIS, Java, Flex and other technologies to implement the integrated network management system (Zhao 2010). 3. The Municipality of Reggio Calabria in 2006 started a project. Its main purpose was the development of a GIS, capable of "storing" the results of measurement campaigns and also to apply a theoretical model for developing scenarios of exposure to electromagnetic field. The aim was to assess whether the presence of fixed installations for cellular phone is compatible with the health of citizens, or if the values of exposure to electromagnetic fields produced by them are within the limits set by law. This was achieved through the implementation of a GIS which was able to manage, store, process all data relating to devices GSM, GPRS, UMTS with also the possibility to update the database and insert new installations (Vincnzo et.al. , 2009) Analysis of the Distribution of the Mobile Communication Procedure: To find the perfect locations for the towers of the mobile communication, it is important to identify the overall details of the mutual towers. Therefore, this was done using a program called Arc GIS (Version 9.3).

European Scientific Journal June 2015 edition vol.11, No.18 ISSN: 1857 – 7881 (Print) e - ISSN 1857- 7431
177
First: There are 22 BTS towers in the southern east side of sulaimany/Iraq city. These towers can be divided into 6 main towers according to their areas: 1. Ashti area: contains five towers. 2. Parki Azady area: contains five towers. 3. Ali-Najy area: contains four towers. 4. Baranan area: contains three towers. 5. Shuqakan area: contains two towers. 6. Karezawshk area: contains three towers. Second: From the satellite image, the above towers can be distributed according to their areas as shown in figure (1):
Fig (1) Distribution of towers
Third: it is important to measure the distance between the server and each one of the twenty two BTS towers using the GIS program. Therefore, the results can be shown in table (1) below.

European Scientific Journal June 2015 edition vol.11, No.18 ISSN: 1857 – 7881 (Print) e - ISSN 1857- 7431
178
Table (1) The distance between the towers and the server. Fourth: The distance between the BTS towers had been measured and the results shown in table (2) below. Where T is a symbol of a tower
Table (2) BTS distances Fifth: To make it more clearly, figure (2) shows the distance between the server and each one of the BTS tower. This figure represents several dimensions which are 1000, 2000, 3000 and 4000 m from the server to the BTS. For example, in the figure, the last zone which is karezawshk-3 required a distance of 3592m from the server.

European Scientific Journal June 2015 edition vol.11, No.18 ISSN: 1857 – 7881 (Print) e - ISSN 1857- 7431
179
Scale 1:30,000
Fig (2) Server coverage of sites Seventh: After entering all the actual values of the BTS towers now, it is easy to draw the site coverage by taking the antenna into the consideration. Hence this is related to the towers that were imposed to be omnidirectional antenna or panel antenna. This consideration provides equal coverage to all the directions which have been selected in all the previous parts (R=200m, R=300m) with constant antennas height. The study of the coverage area for all sites gives us a clear vision on the coverage area, the weak area, and the interference region (overlapping region). Also, it can show the effective coverage area for one of the tower and all of the towers. A. Site Coverage Cell Radius Equal to 200m: The cell radius represents the maximum coverage area for BTS where they are making all towers in site to have equal radius of 200m. Figure (3) shows the coverage distribution of the towers, where we note that there are areas in these distance that represents interference region, weak area and good coverage area. With regards to interference region, areas are a lot at the towers of: Ali-Naji-1, Ali-Naji-2, Ashty-1, Park Azady-4 and Park Azadi-3 The weak area is identified as a purple color and these four areas had been measured by (GIS): 1- 0.433Km2 , 2- 0.025338 Km2 3- 0.002243 Km2,

European Scientific Journal June 2015 edition vol.11, No.18 ISSN: 1857 – 7881 (Print) e - ISSN 1857- 7431
180
4- 0.981494 Km2 Thus, the total coverage area or dead zone where transmission is not working is at 1.442 Km2. .
Fig (3) Site coverage at R=200m B. Site Coverage at R=300m: As a result of all areas weak region at R=200m, the radius had been increased from 200m to 300m and it is proposed second distance for the purpose of analysis. In Figure (4), as a note, despite the increase in coverage range for each (BTS), there is also a severe interference region or overlapping region. That is: 1. In (Ashty-1, Ashty-4, Ashty-3, Ashty-5, Parky Azady-3) towers. 2. In (Shuqakan-2, Shuqakan-1, and Karezawishk-1) towers. 3. In (Ali-Najy-1, Ali-Najy-2, Parky Azady-2, and Ashty-2) towers and the other areas. Other zones represents weak region and these are the five areas which had been measured by GIS shown as in fig (5): 1- First Area =0.317492 Km2 2- Second Area = 0.20396 Km2 3- Third Area = 0.508979 Km2 4- Fourth Area = 0.013184 Km2 5- Fifth Area = 0.0013184 Km2

European Scientific Journal June 2015 edition vol.11, No.18 ISSN: 1857 – 7881 (Print) e - ISSN 1857- 7431
181
Fig (4) Site coverage at R=300m
Fig (5) Weak area zones at R=300m Eighth: The typical site coverage area which includs all weak area and coverage area had been determined. The typical coverage area for the site at R=200m is as shown in figure (6)

European Scientific Journal June 2015 edition vol.11, No.18 ISSN: 1857 – 7881 (Print) e - ISSN 1857- 7431
182
Fig (6) Typical area for R=200m In the above figure, it had been founded - that the- typical area with the help of GIS is equal to 3.8 km2.Therefore the active coverage area for the towers is equal to the process of subtracting weak areas from typical area which is equal to 2.358 Km2. Furthermore, a significant increase in the percentage of the area (weak area) had been found, and was compared to the coverage area. The typical area of the site at R=300m is shown in fig (7). It is equal to 5.433 Km2 and the difference between this area and the total weak area will give the active coverage area which is equal to 4.389 Km2. From figure (6), it is important to note that the existence of weak area was a result of the random distribution of towers and not from the lack of coverage redistribution of towers. So, in order to eliminate the weak areas and improve transmissions between the towers, we need constant power and constant cell radius.
Fig (7) Typical area at R=300m

European Scientific Journal June 2015 edition vol.11, No.18 ISSN: 1857 – 7881 (Print) e - ISSN 1857- 7431
183
Optimal Distribution of Mobile Towers: According to the given presence of many weak areas in the last figure when R=300m due to the irregularity in the distribution of the towers and also the existence of interference regions, severe nature had adverse effect on reception of the receiver of the other towers through the creation of the so called “multi path fading” . Furthermore it also affects the interference region which is termed as “loss power”. It serves purpose of improving the performance of the communication system by increasing active coverage for BTS, the elimination of the weak zones reducing interference regions and getting the optimization of the number of the towers in a site. We will re-distribute the towers at R=300m in an assigned manner based on geographic location for the tower so that it becomes an influential and a probative ability of BTS (all the towers have constant power and cell radius). In order to find the new locations for the BTS towers, an image was taken from a satellite and placed at 25 m long and reduce 300m and toke the image of the satellite using the GIS to find the new location and then manually changing the location of the BTS in order to have a satisfactory results. This new method works on typical area doing re-distribution of the towers in a way that makes “active coverage area” to be the highest that use the lowest number of mobile tower with the help of GIS to determine the new locations on the satellite image. The new locations of towers in UTM coordinate is shown in table (3).
Table (3) Optimum UTM coordinates of the towers

European Scientific Journal June 2015 edition vol.11, No.18 ISSN: 1857 – 7881 (Print) e - ISSN 1857- 7431
184
From the table, we note that the number of the towers is reduced from 22 towers to 19 towers, with the exception for each of the following towers (Ali-Naji-1, Ashty-1, and Ashty-3). In addition, the distances between the server and location of the new towers are shown in the table (4).
Table (4) Distance from the servers optimum distribution The new distribution process with the coverage area is shown in fig (8). It can be noticed the disappearing of the weak area and the increasing of the activate coverage area were almost equal to the typical area as shown in figure (9)

European Scientific Journal June 2015 edition vol.11, No.18 ISSN: 1857 – 7881 (Print) e - ISSN 1857- 7431
185
Fig (8) Optimal distribution of BTS towers at R=300m
Fig (9) Teypical area for optimal distribution
With the help of GIS, we measure active coverage area which was 4.798 Km2 and typical area to be 4.798 Km2. Also, we note that the value of active area is more than higher compared with the value of its real coordination before distribution .In the comparison of the distances between the server and the towers in the case of normal distribution and optimal distribution, we notify that in optimal distribution the distances between the towers and the server decreases significantly with the exception of Karezawishk tower. In other words, the optimal distribution has worsened to reduce the distances between the server and the tower.
European Scientific Journal June 2015 edition vol.11, No.18 ISSN: 1857 – 7881 (Print) e - ISSN 1857- 7431
186
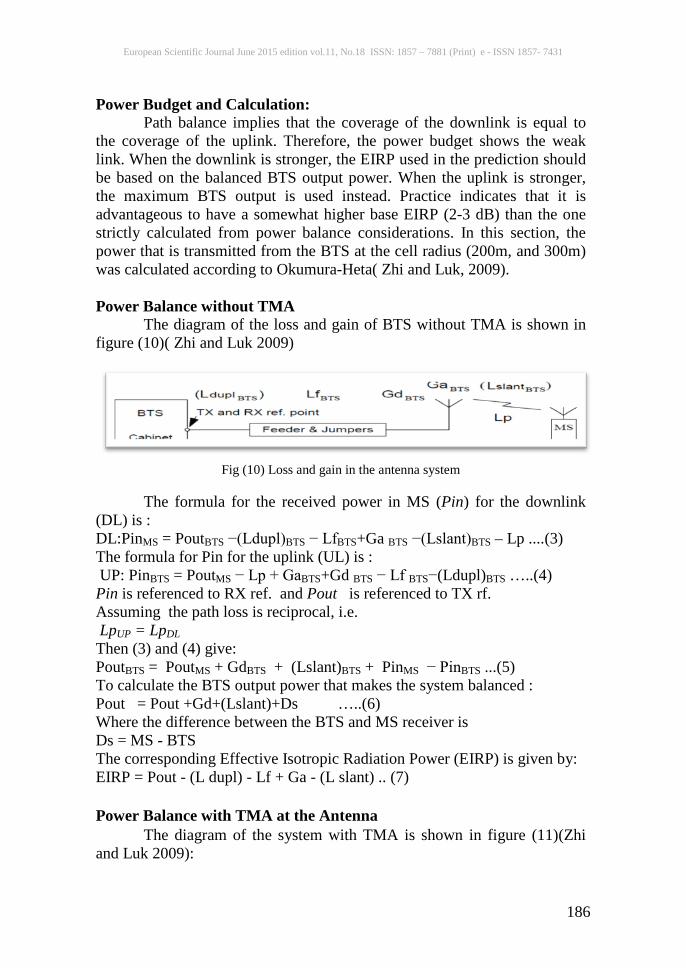
Power Budget and Calculation: Path balance implies that the coverage of the downlink is equal to the coverage of the uplink. Therefore, the power budget shows the weak link. When the downlink is stronger, the EIRP used in the prediction should be based on the balanced BTS output power. When the uplink is stronger, the maximum BTS output is used instead. Practice indicates that it is advantageous to have a somewhat higher base EIRP (2-3 dB) than the one strictly calculated from power balance considerations. In this section, the power that is transmitted from the BTS at the cell radius (200m, and 300m) was calculated according to Okumura-Heta( Zhi and Luk, 2009). Power Balance without TMA The diagram of the loss and gain of BTS without TMA is shown in figure (10)( Zhi and Luk 2009)
Fig (10) Loss and gain in the antenna system The formula for the received power in MS (Pin) for the downlink (DL) is : DL:PinMS = PoutBTS −(Ldupl)BTS − LfBTS+Ga BTS −(Lslant)BTS – Lp ....(3) The formula for Pin for the uplink (UL) is : UP: PinBTS = PoutMS − Lp + GaBTS+Gd BTS − Lf BTS−(Ldupl)BTS …..(4) Pin is referenced to RX ref. and Pout is referenced to TX rf. Assuming the path loss is reciprocal, i.e. LpUP = LpDL Then (3) and (4) give: PoutBTS = PoutMS + GdBTS + (Lslant)BTS + PinMS − PinBTS ...(5) To calculate the BTS output power that makes the system balanced : Pout = Pout +Gd+(Lslant)+Ds …..(6) Where the difference between the BTS and MS receiver is Ds = MS - BTS The corresponding Effective Isotropic Radiation Power (EIRP) is given by: EIRP = Pout - (L dupl) - Lf + Ga - (L slant) .. (7) Power Balance with TMA at the Antenna The diagram of the system with TMA is shown in figure (11)(Zhi and Luk 2009):

European Scientific Journal June 2015 edition vol.11, No.18 ISSN: 1857 – 7881 (Print) e - ISSN 1857- 7431
187
Fig (11) System with TMA at the antenna The formula for Pin for the downlink (DL) is : DL: PinMS = PoutBTS – Lf – (Ldupl) +Ga− L – (Lslant) − LP …..(8) The formula for Pin for the uplink (UL) is: ULBTS: PinBTS = PoutMS – Lp + Ga + Gd …..(9) Assuming that the path loss is reciprocal i.e. LpUP = LpDL Then, (8) and (9) gives: PoutBTS = PoutMS+Gd + Lf+ L + (Ldupl) + (Lslant)+ Pin –Pin .....(10) To calculate the BTS output power that makes the system balanced for a certain MS power class the following formula is used: PoutBTS = PoutMS+Gd + Lf +(Ldupl)+(Lslant)+Ds….(11) Where the difference between the BTS and MS receiver sensitivity is : D = MS – BTS. The corresponding EIRP is given by: EIRP = Pout –Lf – (Ldupl) + Ga – (Lslant) .(12) Calculating propagation loss (Lp) at (900MHz): f The propagation loss (Lp): Lp=146.8−13.82log hB+(44.9−6.55 log hB )log d−a(hM) From the standard data sheet of the company: hM=1.5 m , hB=25m By substituting these values in (a(hM)) equation : a(hM)=3.2[log (11.75hM)]2 −497 a(1.5)=3.2[log (11.75×1.5]2 −497 ~ 0dB By substituting in equation (Lp) , the area are: Lp=146.8−13.82 log (hB)+[44.9− 6.55 log (hB)] log (d) Lp=146.8− 13.82 log (25)+[44.9− 6.55 log (25)] log (d) Lp=127.48+35.743 log (d) As there are a cell radius in(Km): At d=0.2 Km, Lp200m=102.497 dB At d=0.3 Km, Lp300m=108.79 dB The mobile received power is: Pin(Ms) = pout (BTS) – L Duplex (BTS) – Lf Feed and Jumper loss(BTS) + Ga(BTS) − LSlant – Lp

European Scientific Journal June 2015 edition vol.11, No.18 ISSN: 1857 – 7881 (Print) e - ISSN 1857- 7431
188
To calculate the BTS output power that makes the system balanced, the path loss is reciprocal, i.e Lpuplink = Lpdownlink ,and Pin(Ms) = (Ms) For Link Budget sheet for GSM900: Lduplex( Bts) =4.5 dB Lf Feeder+Jumper loss( BTS) = cable + connector loss =2.2dB Ga (BTS)= 17.5dBi Pin MS = −102dBm LSlant(BTS) = 1.5dB Therefore: Pout (BTS) =Pin Ms + L Duplex (BTS) + Lf(BTS) – Ga (BTS) + LSlant(BTS) +Lp For: R=d=200m Pout (BTS) = − 102 + 4.5 + 2.2 – 17.2 + 1.5 + 102.497= −8.803dBm For: R=d=300m Pout (BTS) = − 102 + 4.5 + 2.2 – 17.5 + 1.5 + 108.79 = − 2.51dBm However, the other losses such as Interference margin, Body loss, Combiner loss, Duplex loss of TMA and Penetration loss would be added to the result of Pout (BTS) in order to reach the final value. Conclusion: The process of studying the distribution of mobile communication tower with the help of GIS was the target of this paper, where the real locations of the towers belonging to the communication company were added to the GIS software in order to deal with it. Patterns for all towers were drawn according to the cell radius. Thus, the cell radius was selected from the existing distances between the towers, whereas the radius does not have effect on the capacity of the communication system. We noticed that during the process of analysis, there were areas like Over lapping area, weak area, and active area at the cell radius equal to R=200m and R=300m. Also, from the analysis, we found: • There are more than interference region which negatively affects the work of the system by generating multipath fading and losses in BTS power. • The weak area at these distances is more than high and amounted to a total of 1.442km2 for R=200m. In addition, the weak area equals 1.044km2 at R=300m. Active Coverage area did not meet the ambition which amounted to 2.358 for R=200m, and mounted to 1.798Km2 for R=300m. In this paper, we worked on the redistribution of the towers based on a fixed value for the BTS powers, towers, height, cell radius, and geographic location of the towers. For the new distribution, we found: • Reducing the number of mobile tower from 22 to 19 towers.

European Scientific Journal June 2015 edition vol.11, No.18 ISSN: 1857 – 7881 (Print) e - ISSN 1857- 7431
189
• Reducing interference area, eliminating weak area, increasing active coverage area, and reducing the distances between the server and the BTS towers. The process of distribution, such as the optimization in the number of towers has several targets, likely: Reduce the cost for Communication Company; reduce environmental pollution and electromagnetic radiation, improving urban aesthetic of the city, minimizing the interference region between the towers, and improving communication system tools by reducing the distances between the towers and the server. References: International Interdisciplinary Journal of Scientific Research, December 2014. “GIS for Homeland Security” .An ESRI White Paper .November 2001. Rini.I, and R.A.Salim. “BTS tower geographical information system (GIS) in depok city”. Gunadarma University, Faculty of Computer Science, 2007. Garcia, A.P, " Effect of terrain on electromagnetic propagation in urban environments and GIS planning tools, Antennas and Propagation ", IEEE (ICAP 2003) Twelfth International Conference on (Conf. Publ. No. 491),2003. Zhenghua. S,"Application of GIS in Telecommunication Information Resources Management System",Information Management, Innovation Management and Industrial Engineering (ICIII), 2011 International Conference on, volume 1,2011. Zhao Q,"An integrated network management system of mobile communication system solution based on GIS", Computer Science and Information Technology (ICCSIT), 2010 3rd IEEE International Conference on, volume 2, 2010. Vincnzo .B, G. Armocida, G. Bilotta, “GIS supporting the plan of BTS for mobile network in urban context”. Iuva University. Italy. August 2009.
Copyright © 2022 FDOKUMEN