social network analyst
41
Social Network Analysis
Transcript of social network analyst

Social Network Analysis

Background: Network Analysis
2
Newman et al, 2006
Newman et al, 2006
A very early example of network analysis comes from the city of Kχnigsberg (now Kaliningrad). Famous mathematician Leonard Euler used a graph to prove that there is no path that crosses each of the city’s bridges only once (Newman et al, 2006).
SNA has its origins in both social science and in the broader fields of network analysis and graph theory
Network analysis concerns itself with the formulation and solution of problems that have a network structure; such structure is usually captured in a graph (see the circled structure to the right)
Graph theory provides a set of abstract concepts and methods for the analysis of graphs. These, in combination with other analytical tools and with methods developed specifically for the visualization and analysis of social (and other) networks, form the basis of what we call SNA methods.
But SNA is not just a methodology; it is a unique perspective on how society functions. Instead of focusing on individuals and their attributes, or on macroscopic social structures, it centers on relations between individuals, groups, or social institutions
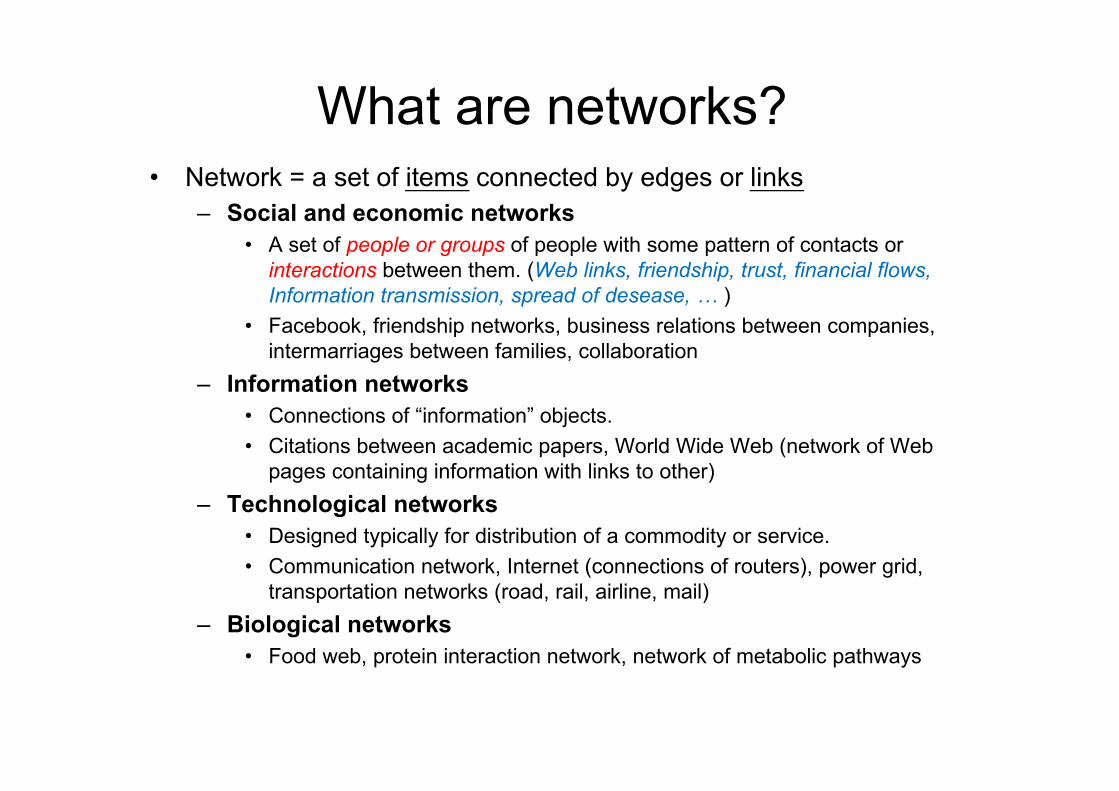
What are networks?• Network = a set of items connected by edges or links
– Social and economic networks• A set of people or groups of people with some pattern of contacts or
interactions between them. (Web links, friendship, trust, financial flows, Information transmission, spread of desease, … )
• Facebook, friendship networks, business relations between companies, intermarriages between families, collaboration
– Information networks• Connections of “information” objects. • Citations between academic papers, World Wide Web (network of Web
pages containing information with links to other)– Technological networks
• Designed typically for distribution of a commodity or service. • Communication network, Internet (connections of routers), power grid,
transportation networks (road, rail, airline, mail) – Biological networks
• Food web, protein interaction network, network of metabolic pathways
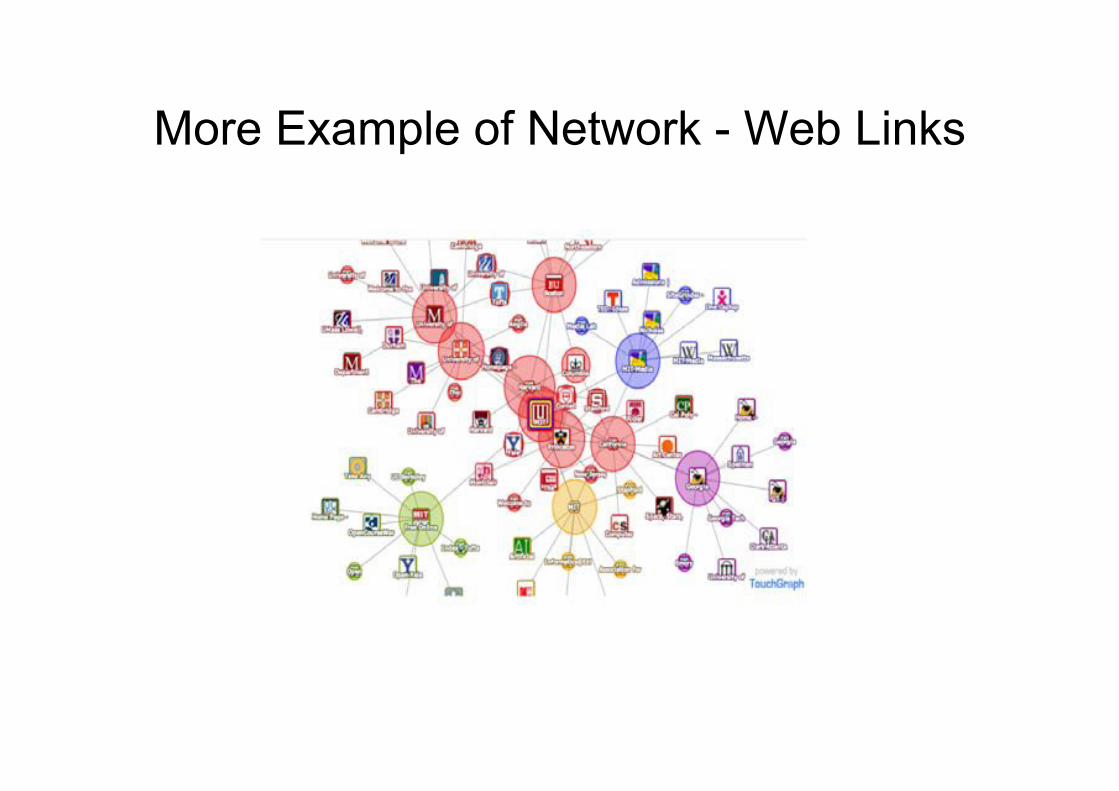
More Example of Network - Web Links

More Example of Network - Frienship

More Example of Network - CoAuthoring

More Example of Network - Information Transmision
Community structure of political blogs. The colors reflect political orientation, red for conservative, and blue for liberal. Orange links go from liberal to conservative, and purple ones from
conservative to liberal. The size of each blog reflects the number of other blogs that link to it.

More Example of Network - Disease

More Example of Network - Email Recommendation

This is an early depiction of what we call an ‘ego’ network, i.e. a personal network. The graphic depicts varying tie strengths via concentric circles (Wellman, 1998)
Background: Social Science
10
Wellman, 1998
Studying society from a network perspective is to study individuals as embedded in a network of relations and seek explanations for social behavior in the structure of these networks rather than in the individuals alone. This ‘network perspective’ becomes increasingly relevant in a society that Manuel Castells has dubbed the network society.
SNA has a long history in social science, although much of the work in advancing its methods has also come from mathematicians, physicists, biologists and computer scientists (because they too study networks of different types)
The idea that networks of relations are important in social science is not new, but widespread availability of data and advances in computing and methodology have made it much easier now to apply SNA to a range of problems
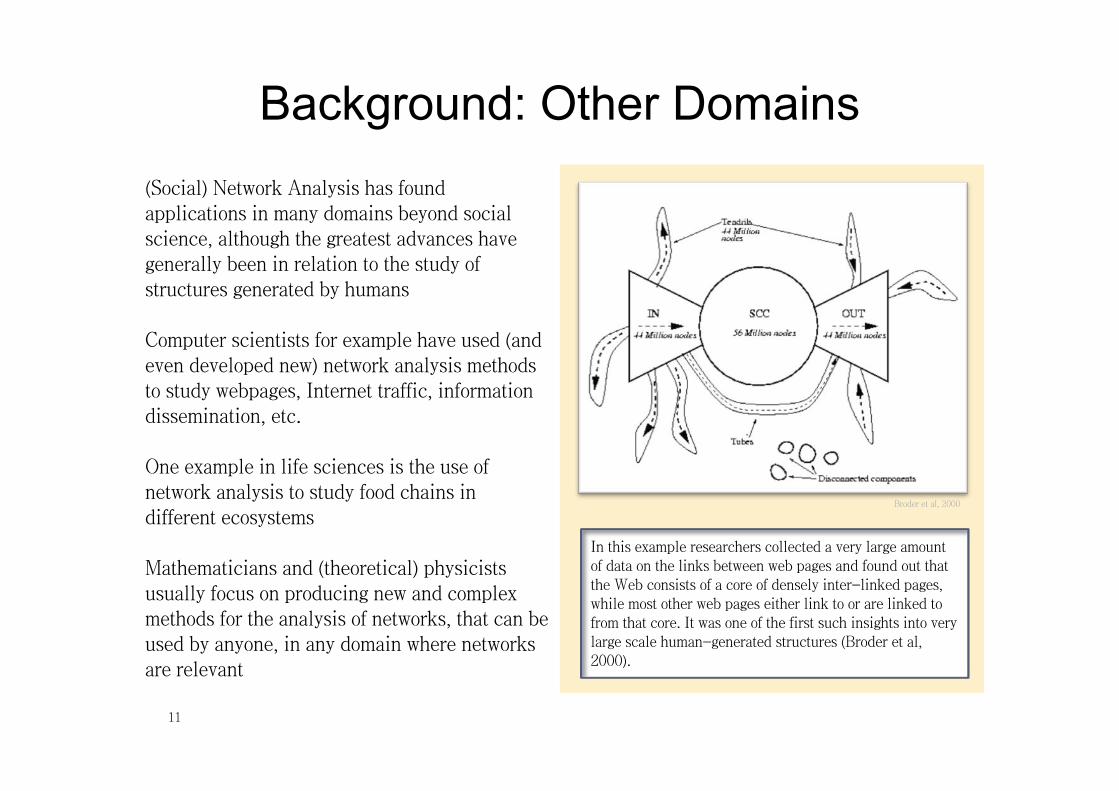
In this example researchers collected a very large amount of data on the links between web pages and found out that the Web consists of a core of densely inter-linked pages, while most other web pages either link to or are linked to from that core. It was one of the first such insights into very large scale human-generated structures (Broder et al, 2000).
Background: Other Domains
11
Broder et al, 2000
(Social) Network Analysis has found applications in many domains beyond social science, although the greatest advances have generally been in relation to the study of structures generated by humans
Computer scientists for example have used (and even developed new) network analysis methods to study webpages, Internet traffic, information dissemination, etc.
One example in life sciences is the use of network analysis to study food chains in different ecosystems
Mathematicians and (theoretical) physicists usually focus on producing new and complex methods for the analysis of networks, that can be used by anyone, in any domain where networks are relevant

The Abundant of Data• Large on‐line systems leave detailed records
– Online communities: MyScace, Facebook, LiveJournal– Email, blogging, electronic markets, instant messaging– Online publications repositories, arXiv, MedLine
• Scale– 436‐node network of email exchange over 3‐months at corporate
research lab [Adamic‐Adar, SocNets ‘03]– 43,553‐node network of email exchange over 2 years at a large
university [Kossinets‐Watts, Science ‘06]– 4.4‐million‐node network of declared friendships on a blogging
community [Liben‐Nowell et al., PNAS ‘05, Backstrom et at., KDD ‘06]– 240‐million‐node network of all IM communication over a month on
Microsoft Instant Messenger [Leskovec‐Horvitz, WWW ‘08]

Practical applications
13
Businesses use SNA to analyze and improve communication flow in their organization, or with their networks of partners and customers
Law enforcement agencies (and the army) use SNA to identify criminal and terrorist networks from traces of communication that they collect; and then identify key players in these networks
Social Network Sites like Facebook use basic elements of SNA to identify and recommend potential friends based on friends-of-friends
Civil society organizations use SNA to uncover conflicts of interest in hidden connections between government bodies, lobbies and businesses
Network operators (telephony, cable, mobile) use SNA-like methods to optimize the structure and capacity of their networks
Basic Concepts
14
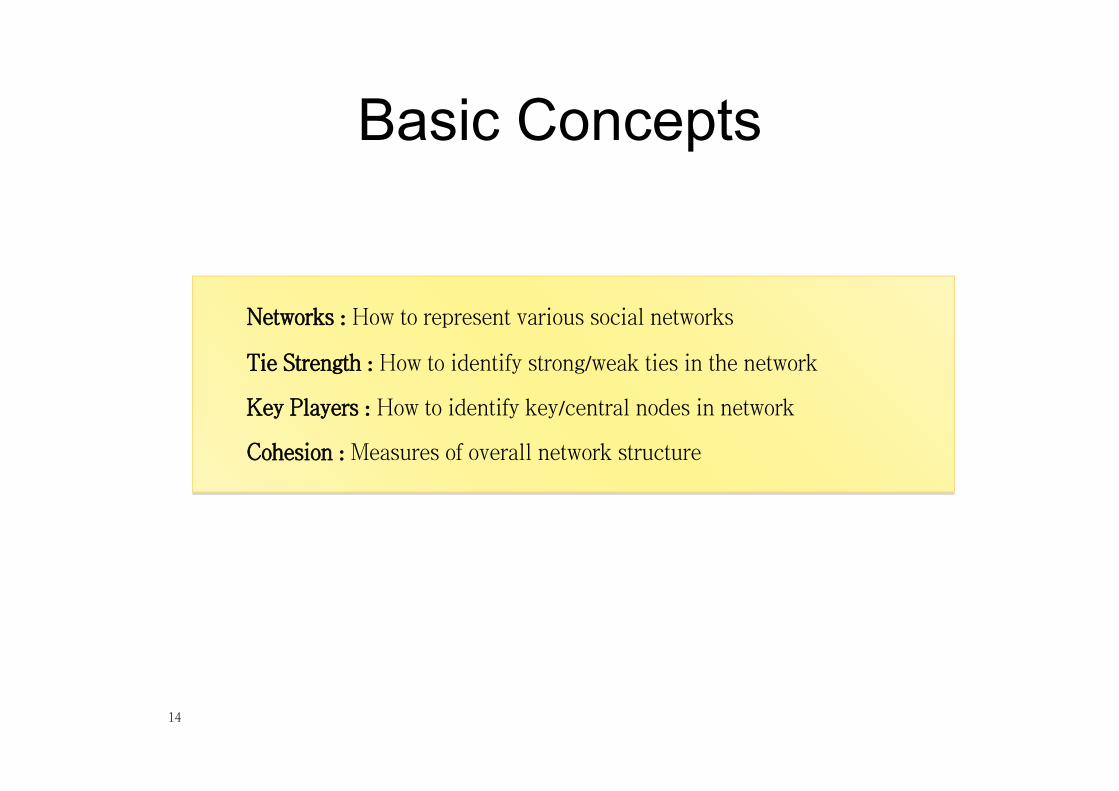
Networks : How to represent various social networks
Tie Strength : How to identify strong/weak ties in the network
Key Players : How to identify key/central nodes in network
Cohesion : Measures of overall network structure

NetworksHow to represent various social
network
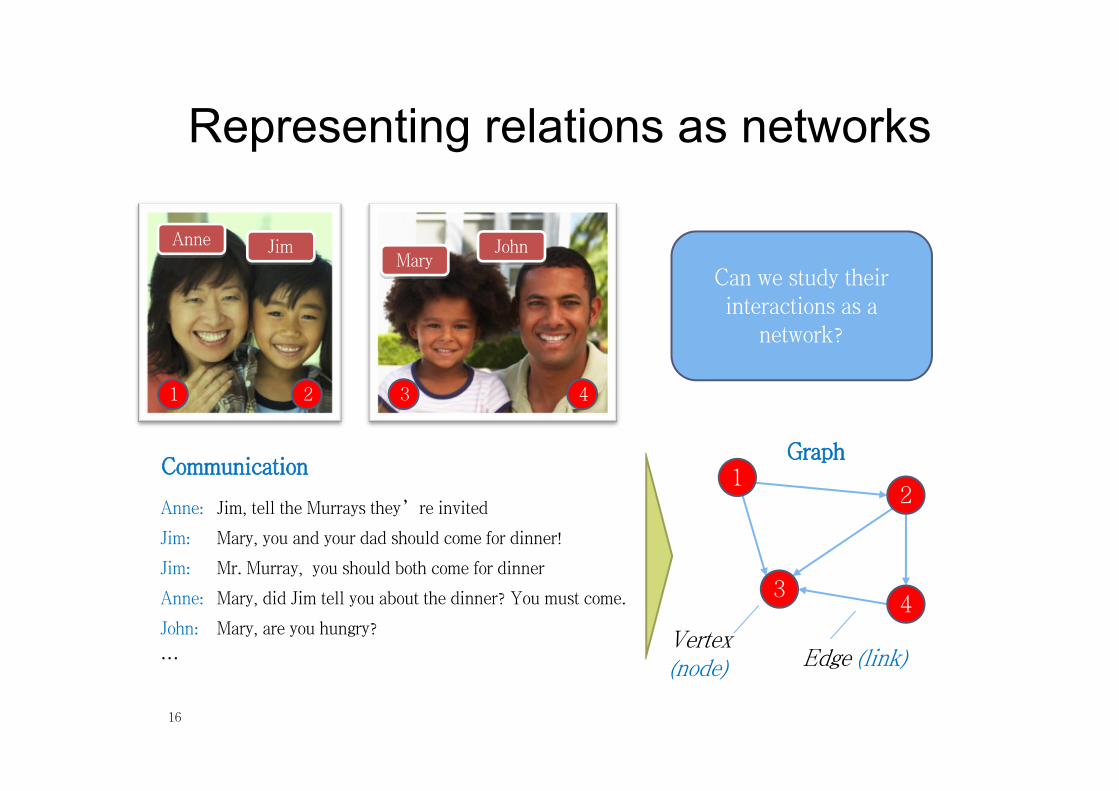
Representing relations as networks
16
12
34
1 2 3 4
Graph
AnneAnne JimJimMaryMary
JohnJohn
Vertex (node) Edge (link)
Can we study their interactions as a
network?
Communication
Anne: Jim, tell the Murrays they’re invited
Jim: Mary, you and your dad should come for dinner!
Jim: Mr. Murray, you should both come for dinner
Anne: Mary, did Jim tell you about the dinner? You must come.
John: Mary, are you hungry?
…
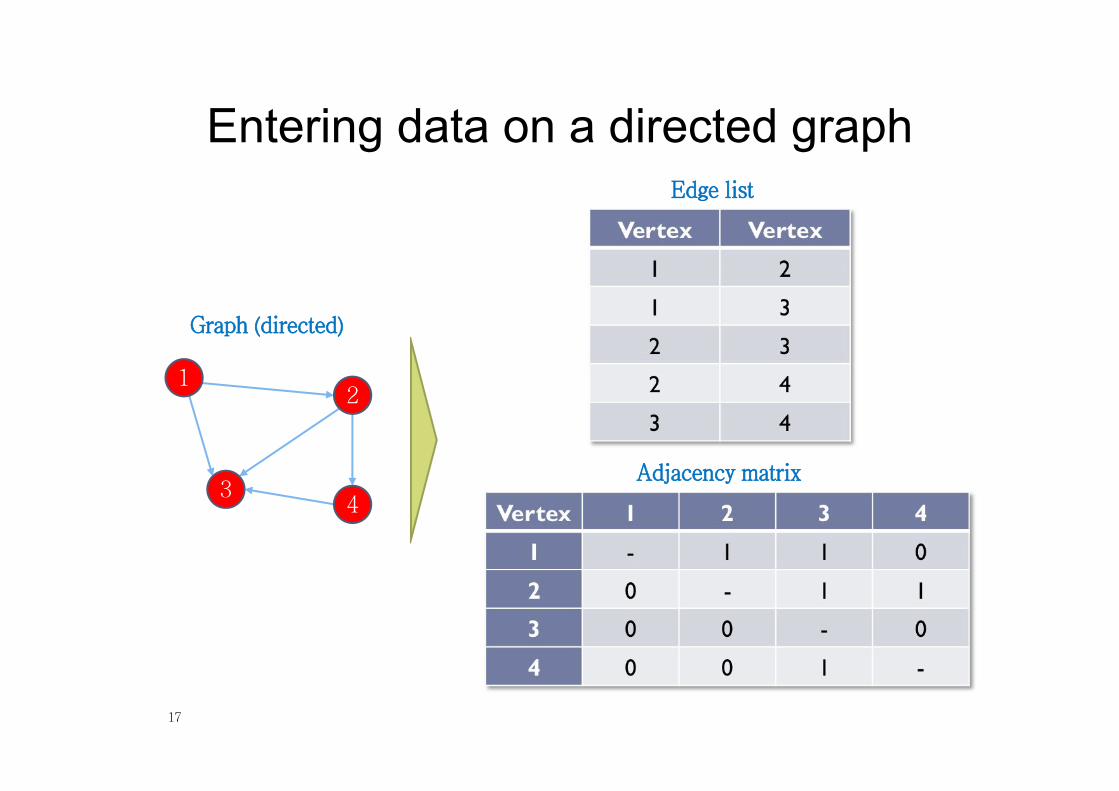
Entering data on a directed graph
17
12
34
Graph (directed)
Edge list
Adjacency matrix
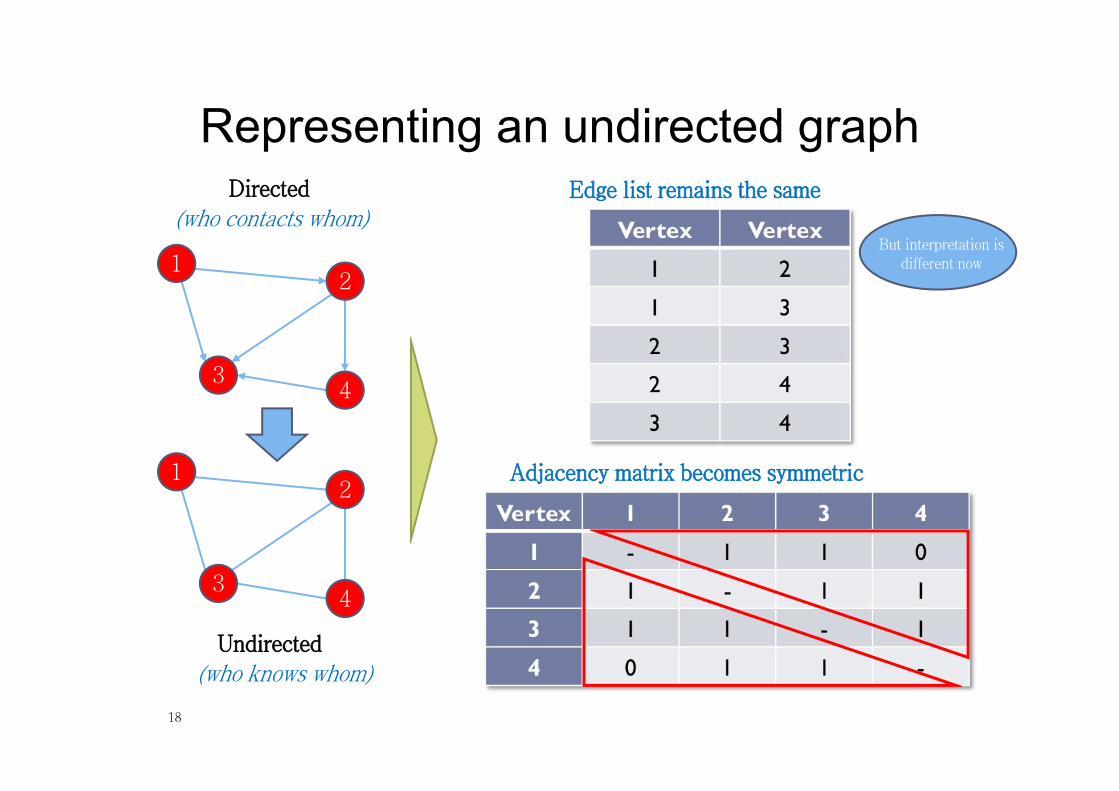
Representing an undirected graph
18
12
34
Edge list remains the same
Adjacency matrix becomes symmetric
12
34
Directed
Undirected(who knows whom)
(who contacts whom)But interpretation is
different now

Tie StrengthHow to identify strong/weak ties in
network

Adding weights to edges (directed or undirected)
20
Edge list: add column of weights
Adjacency matrix: add weights instead of 1
Weights could be:•Frequency of interaction in period of observation•Number of items exchanged in period•Individual perceptions of strength of relationship•Costs in communication or exchange, e.g. distance•Combinations of these
12
34
30
2
37
225
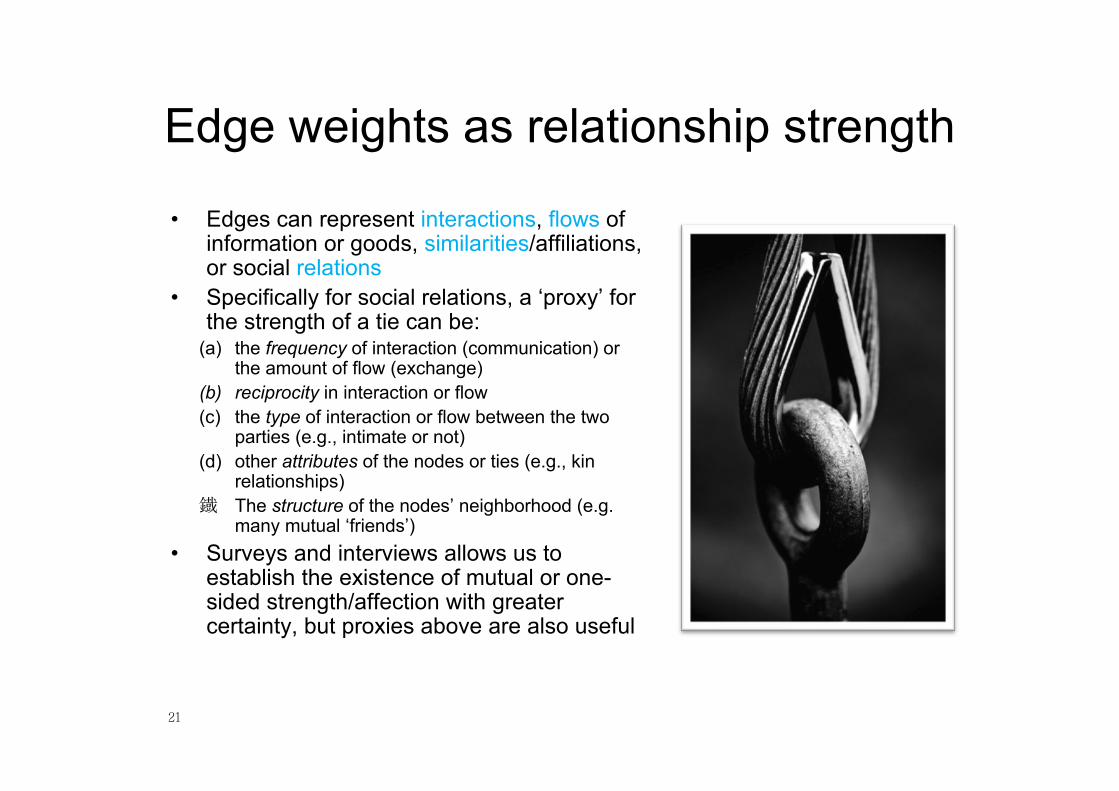
Edge weights as relationship strength
• Edges can represent interactions, flows of information or goods, similarities/affiliations, or social relations
• Specifically for social relations, a ‘proxy’ for the strength of a tie can be:
(a) the frequency of interaction (communication) or the amount of flow (exchange)
(b) reciprocity in interaction or flow(c) the type of interaction or flow between the two
parties (e.g., intimate or not)(d) other attributes of the nodes or ties (e.g., kin
relationships)鐡 The structure of the nodes’ neighborhood (e.g.
many mutual ‘friends’)• Surveys and interviews allows us to
establish the existence of mutual or one-sided strength/affection with greater certainty, but proxies above are also useful
21

Homophily, transitivity, and bridging• Homophily is the tendency to relate to people
with similar characteristics (status, beliefs, etc.)
– It leads to the formation of homogeneous groups (clusters) where forming relations is easier
– Extreme homogenization can act counter to innovation and idea generation (heterophily is thus desirable in some contexts)
– Homophilous ties can be strong or weak• Transitivity in SNA is a property of ties: if there
is a tie between A and B and one between B and C, then in a transitive network A and C will also be connected
– Strong ties are more often transitive than weak ties; transitivity is therefore evidence for the existence of strong ties (but not a necessary or sufficient condition)
– Transitivity and homophily together lead to the formation of cliques (fully connected clusters)
• Bridges are nodes and edges that connect across groups
– Facilitate inter-group communication, increase social cohesion, and help spur innovation
– They are usually weak ties, but not every weak tie is a bridge
22
Homophily
Strong Weak
Transitivity Bridging
Interlinked groups
Heterophily
Cliques
Social network
TIES
CLUSTERING

Key PlayersHow to identify key/central nodes
in network
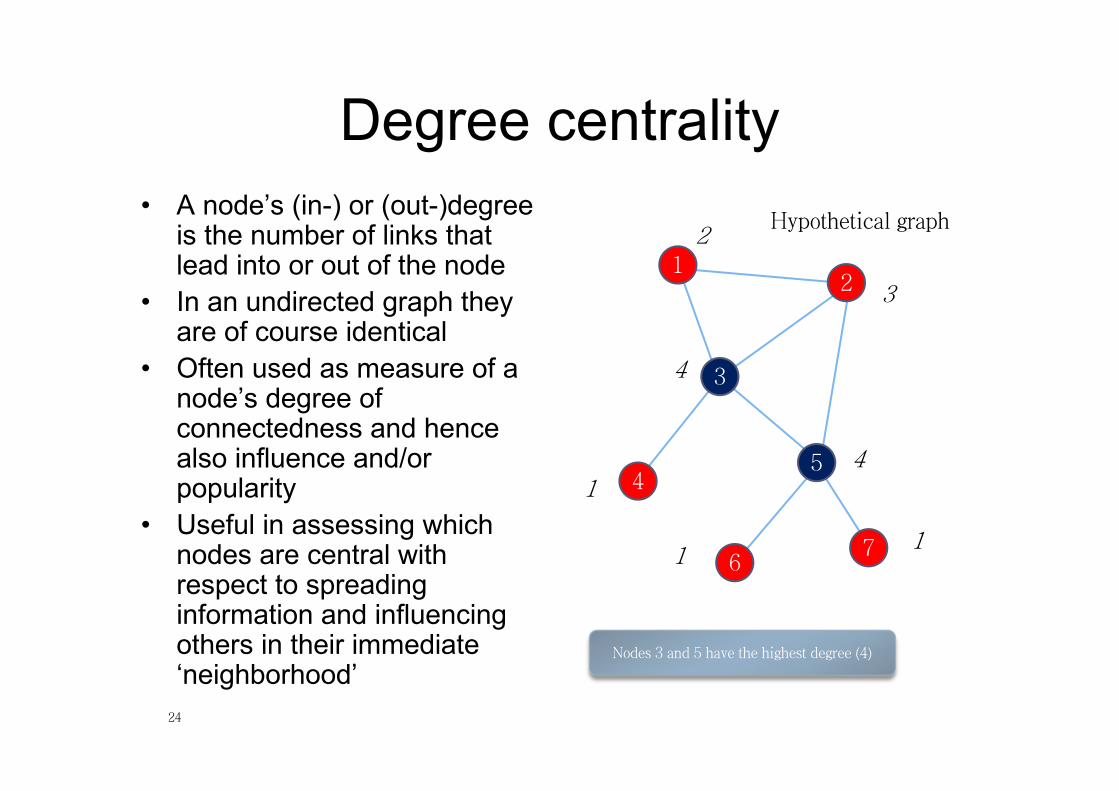
Degree centrality• A node’s (in-) or (out-)degree
is the number of links that lead into or out of the node
• In an undirected graph they are of course identical
• Often used as measure of a node’s degree of connectedness and hence also influence and/or popularity
• Useful in assessing which nodes are central with respect to spreading information and influencing others in their immediate ‘neighborhood’
24
12
3
45
67
2
3
4
14
11
Nodes 3 and 5 have the highest degree (4)
Hypothetical graph
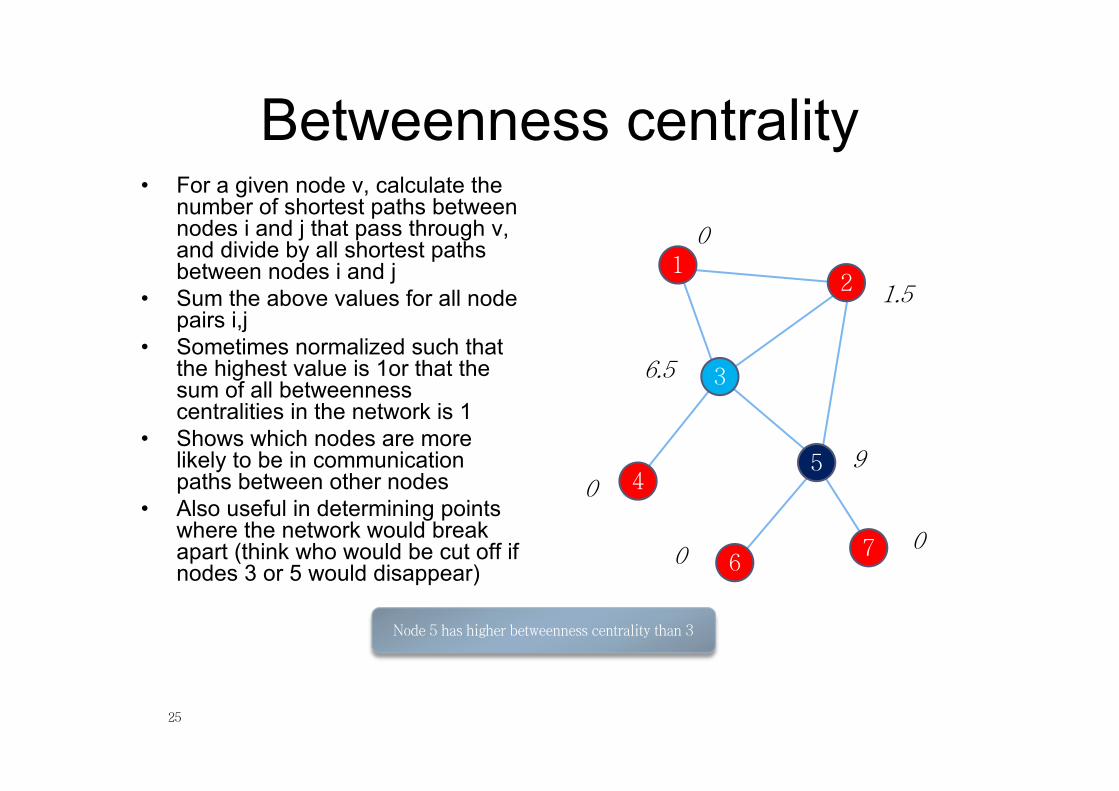
Betweenness centrality• For a given node v, calculate the
number of shortest paths between nodes i and j that pass through v, and divide by all shortest paths between nodes i and j
• Sum the above values for all node pairs i,j
• Sometimes normalized such that the highest value is 1or that the sum of all betweenness centralities in the network is 1
• Shows which nodes are more likely to be in communication paths between other nodes
• Also useful in determining points where the network would break apart (think who would be cut off if nodes 3 or 5 would disappear)
25
12
3
45
67
0
1.5
6.5
09
00
Node 5 has higher betweenness centrality than 3

Closeness centrality• Calculate the mean length of all
shortest paths from a node to all other nodes in the network (i.e. how many hops on average it takes to reach every other node)
• It is a measure of reach, i.e. the speed with which information can reach other nodes from a given starting node
26
12
3
45
67
0.5
0.67
0.75
0.460.75
0.460.46
Nodes 3 and 5 have the highest (i.e. best) closeness, while node 2 fares almost as well

Eigenvector centrality• A node’s eigenvector centrality is
proportional to the sum of the eigenvector centralities of all nodes directly connected to it
• In other words, a node with a high eigenvector centrality is connected to other nodes with high eigenvector centrality
• This is similar to how Google ranks web pages: links from highly linked-to pages count more
• Useful in determining who is connected to the most connected nodes
27
12
3
45
67
0.36
0.49
0.54
0.190.49
0.170.17
Node 3 has the highest eigenvector centrality, closely followed by 2 and 5
Note: The term ‘eigenvector’ comes from mathematics (matrix algebra), but it is not necessary for understanding how to interpret this measure

Interpretation of measures (Case Study)
28
鐡 Degree
鐡 Betweenness
鐡 Closeness
鐡 Eigenvector
How many people can this person reach directly?
How likely is this person to be the most direct route between two people in the network?
How fast can this person reach everyone in the network?
How well is this person connected to other well-connected people?
Centrality measure Interpretation in social networks

Identifying sets of key players• In the network to the right, node
10 is the most central according to degree centrality
• But nodes 3 and 5 together will reach more nodes
• Moreover the tie between them is critical; if severed, the network will break into two isolated sub-networks
• It follows that other things being equal, players 3 and 5 together are more ‘key’ to this network than 10
• Thinking about sets of key players is helpful!
29
1
4
67
8
910
0
3 5
2

CohesionHow to characterize network
structure
Reciprocity (degree of)
31
1 2
3 4
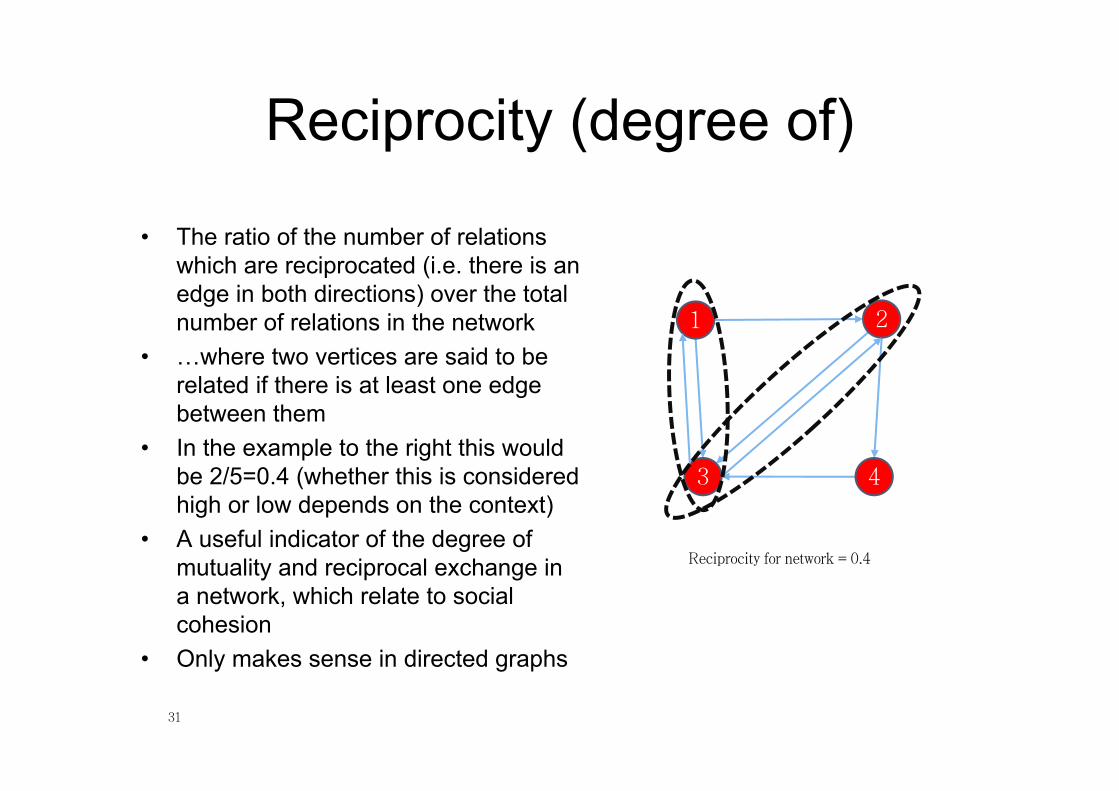
• The ratio of the number of relations which are reciprocated (i.e. there is an edge in both directions) over the total number of relations in the network
• …where two vertices are said to be related if there is at least one edge between them
• In the example to the right this would be 2/5=0.4 (whether this is considered high or low depends on the context)
• A useful indicator of the degree of mutuality and reciprocal exchange in a network, which relate to social cohesion
• Only makes sense in directed graphs
Reciprocity for network = 0.4

Density
32
12
34
• A network’s density is the ratio of the number of edges in the network over the total number of possible edges between all pairs of nodes (which is n(n-1)/2, where n is the number of vertices, for an undirected graph)
• In the example network to the right density=5/6=0.83 (i.e. it is a fairly dense network; opposite would be a sparse network)
• It is a common measure of how well connected a network is (in other words, how closely knit it is) – a perfectly connected network is called a clique and has density=1
• A directed graph will have half the density of its undirected equivalent, because there are twice as many possible edges, i.e. n(n-1)
• Density is useful in comparing networks against each other, or in doing the same for different regions within a single network
12
34
density = 5/6 = 0.83
density = 5/12 = 0.42
Edge present in network
Possible but not present

Clustering
33
12
3
45
67
1
0.67
0.33
0.17
• A node’s clustering coefficient is the number of closed triplets in the node’s neighborhood over the total number of triplets in the neighborhood. It is also known as transitivity.
• E.g., node 1 to the right has a value of 1 because it is only connected to 2 and 3, and these nodes are also connected to one another (i.e. the only triplet in the neighborhood of 1 is closed). We say that nodes 1,2, and 3 form a clique.
• Clustering algorithms identify clusters or ‘communities’ within networks based on network structure and specific clustering criteria (example shown to the right with two clusters is based on edge betweenness, an equivalent for edges of the betweenness centrality presented earlier for nodes)
Cluster A
Cluster B

Network communities• Communities
– Or groups, clusters– Sets of nodes with lots of connections inside and few to outside
(the rest of the network)
• Groups formation– In a social network nodes explicitly declare group membership:
• Ex> Facebook groups– What factors influence a person’s decision to join a group?
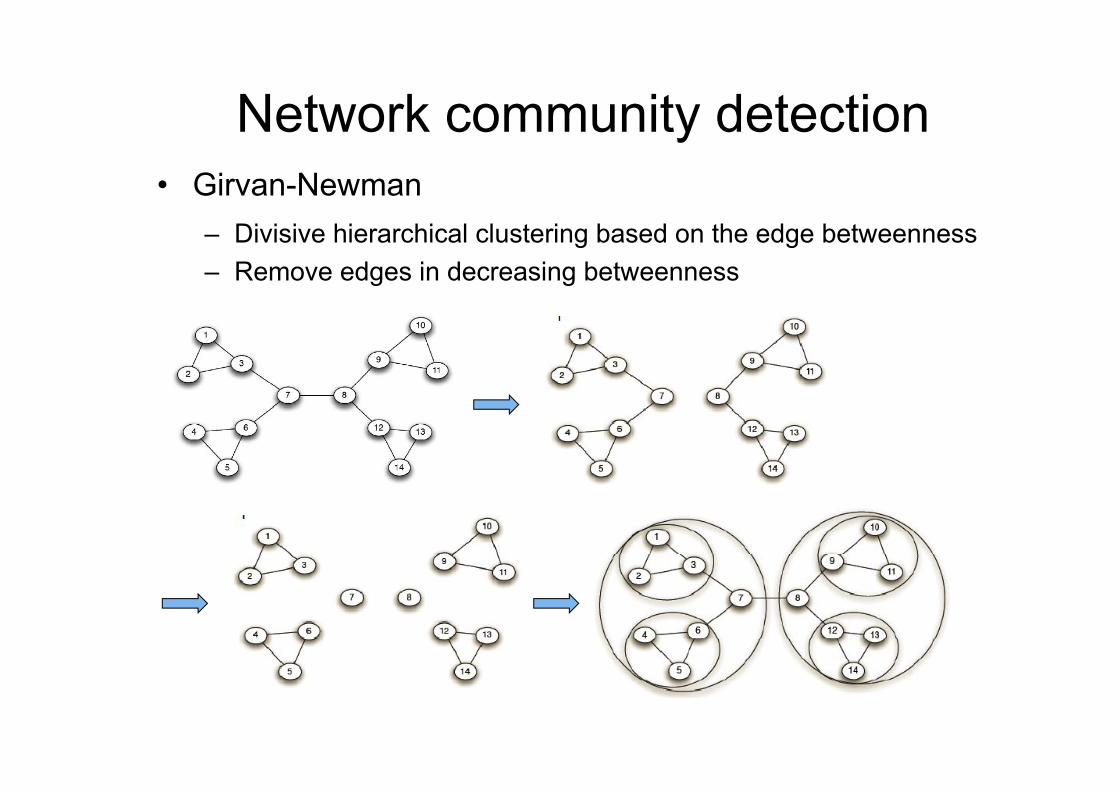
Network community detection• Girvan-Newman
– Divisive hierarchical clustering based on the edge betweenness– Remove edges in decreasing betweenness

Structural holes• Structural hole
– The social gap between two groups– Lack of connection between two nodes that is bridged by a broker– It provide Ego with access to novel information and power
– “Can you get an idea which is mundane and well known in one place to another place where people would get value out of it?"

Average and longest distance
37
12
3
45
67
• The longest shortest path (distance) between any two nodes in a network is called the network’s diameter
• The diameter of the network on the right is 3; it is a useful measure of the reach of the network (as opposed to looking only at the total number of vertices or edges)
• It also indicates how long it will take at most to reach any node in the network (sparser networks will generally have greater diameters)
• The average of all shortest paths in a network is also interesting because it indicates how far apart any two nodes will be on average (average distance)
diameter

Small Worlds
38
• A small world is a network that looks almost random but exhibits a significantly high clustering coefficient (nodes tend to cluster locally) and a relatively short average path length (nodes can be reached in a few steps)
• It is a very common structure in social networks because of transitivity in strong social ties and the ability of weak ties to reach across clusters (see also next page…)
• Such a network will have many clusters but also many bridges between clusters that help shorten the average distance between nodes
local cluster
bridge
You may have heard of the famous “6 degrees” of separation
Preferential Attachment
39
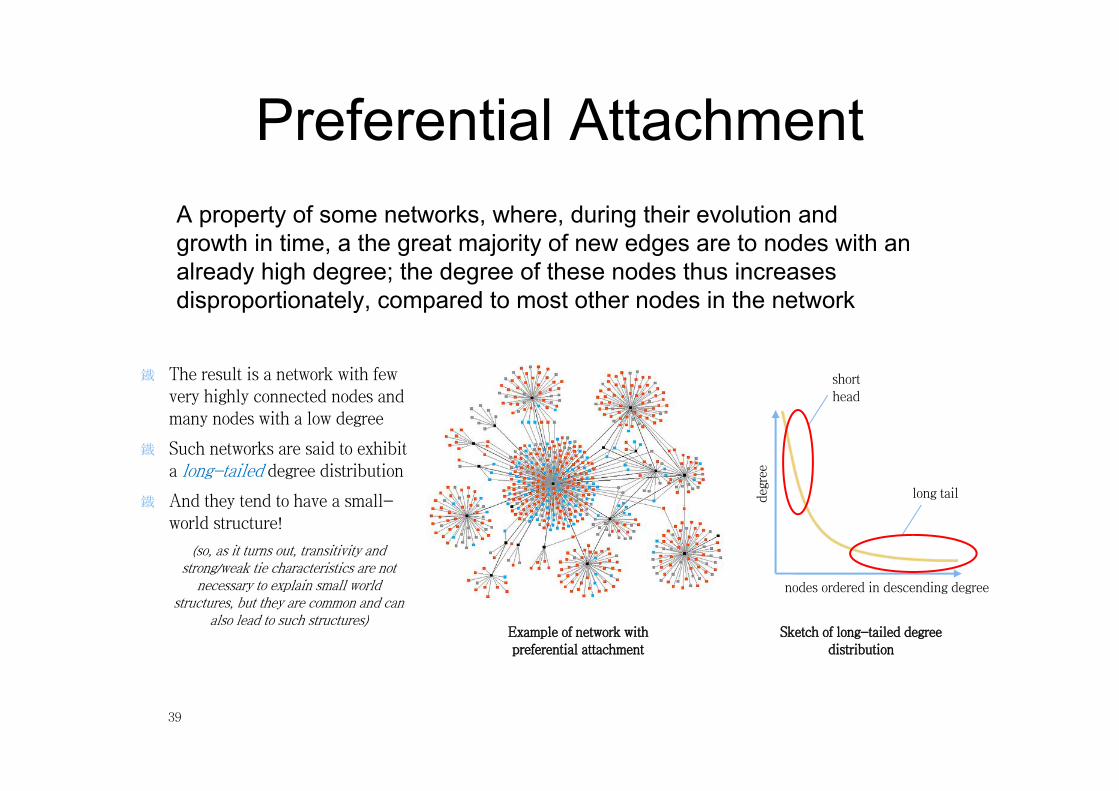
A property of some networks, where, during their evolution and growth in time, a the great majority of new edges are to nodes with an already high degree; the degree of these nodes thus increases disproportionately, compared to most other nodes in the network
鐡 The result is a network with few very highly connected nodes and many nodes with a low degree
鐡 Such networks are said to exhibit a long-tailed degree distribution
鐡 And they tend to have a small-world structure!
(so, as it turns out, transitivity and strong/weak tie characteristics are not
necessary to explain small world structures, but they are common and can
also lead to such structures)
nodes ordered in descending degree
degr
ee
short head
long tail
Example of network with preferential attachment
Sketch of long-tailed degree distribution

Reasons for preferential attachment
40
We want to be associated with popular people, ideas,
items, thus further increasing their popularity,
irrespective of any objective, measurable
characteristics
We evaluate people and everything else based on objective quality criteria, so higher quality nodes
will naturally attract more attention, faster
Among nodes of similar attributes, those that reach
critical mass first will become ‘stars’ with
many friends and followers (‘halo effect’)
Popularity Quality Mixed model
May be impossible to predict who will become a star, even if quality matters
Also known as‘the good get better’
Also known as‘the rich get richer’

Tools• Many more tools are used for SNA, although they
generally require more expert knowledge. Some of these are:– NodeXL (Windoews, licensed)– Pajek (Windows, free)– UCInet (Windows, shareware)– Netdraw (Windows, free)– Mage (Windows, free)– GUESS (all platforms, free and open source)– R packages for SNA (all platforms, free and open source)– Gephi (all platforms, free and open source)
• The field is continuously growing, so we can expect to see more user-friendly applications coming out in the next years…
41