Lisbon strategy and EU countries’ performance: social inclusion and sustainability
02/09/2014
SOCIAL INCLUSION IN THE CLASSROOM: APPLYING SOCIAL NETWORK ANALYSIS
CHRISTOFOROS MAMAS, JAN GEORGESON, IRENE KAIMI

INTRODUCTION TO PROJECT
•Small-scale exploratory study
•Funded by IHC (Institute of Health and Community)
•Comparative project
•In progress
OBJECTIVES
1. To take a ‘snapshot’ of the friendship networks and social and academic aspects of inclusion of Year 4 and Year 5 primary school students.
2. To examine the relationship between social and academic inclusion.
3. To compare the social and academic inclusion as well as friendships of pupils identified as having special educational needs and that of their peers.
4. To begin to understand the underlying reasons that lead to the formation of social and academic inclusion.
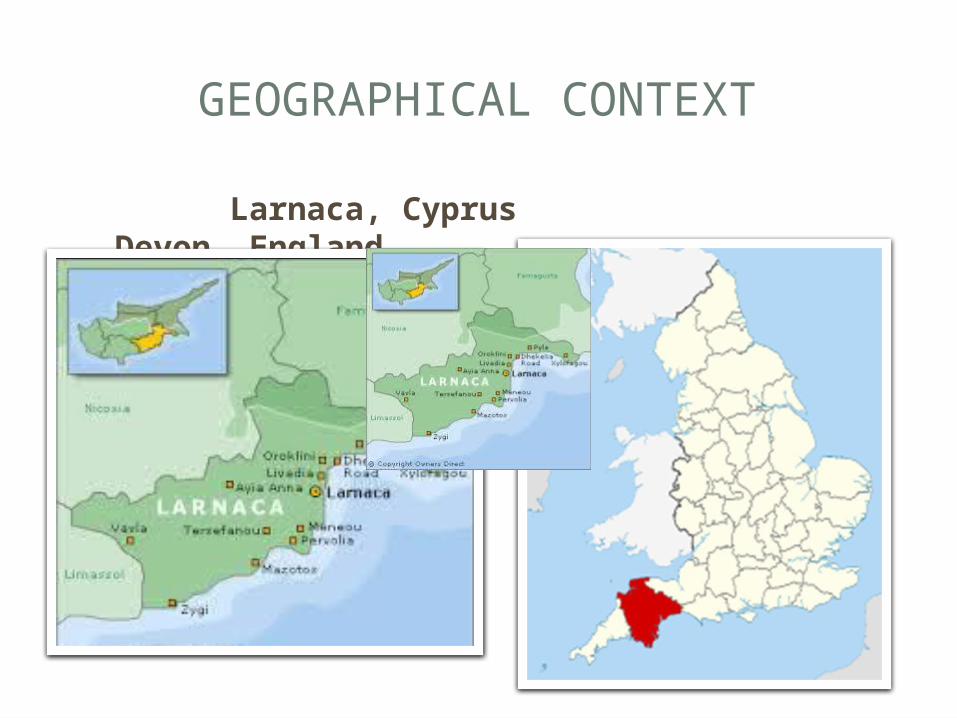
GEOGRAPHICAL CONTEXT
Larnaca, Cyprus Devon, England
THEORETICAL CONTEXT
•Inclusion: principled approach to the development of education and society’, which is ‘linked to democratic participation within and beyond education’ (Booth & Ainscow, 2011)
•Relational sociology (figurational): attention to people’s (children’s) interdependencies (Elias, 2000)
•Inclusion and participation – relationship between social and academic aspects (Mamas, 2012)
•Importance of peer relationships and friendships for all children
•Inclusive pedagogy: what teachers do, why and how - extending what is generally available to everybody (Florian & Black-Hawkins, 2013)
METHODOLOGY
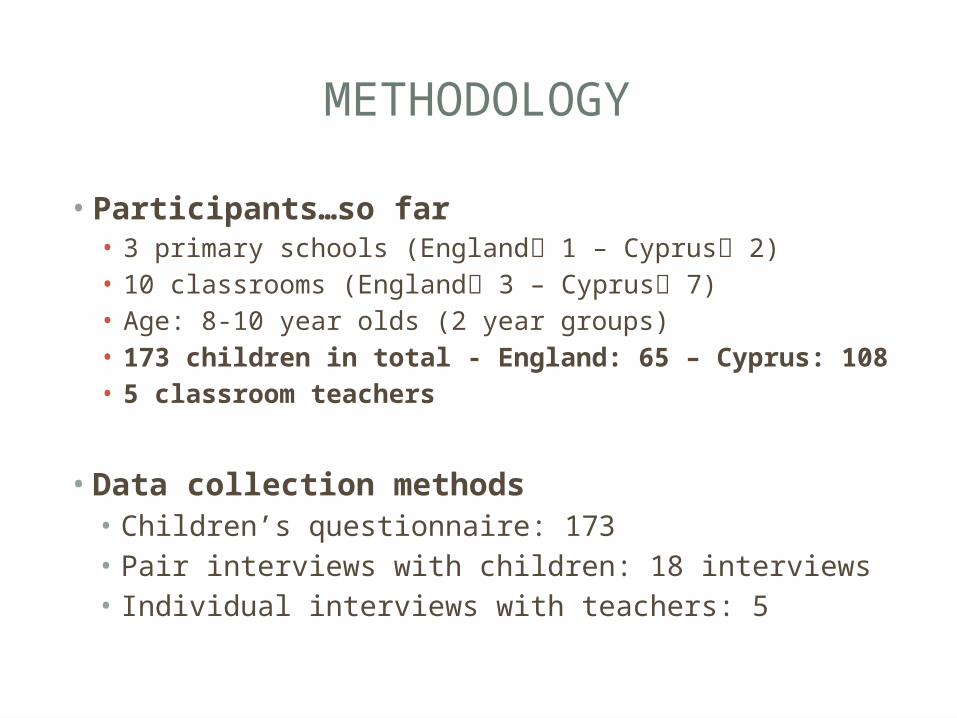
•Participants…so far• 3 primary schools (England 1 – Cyprus 2)• 10 classrooms (England 3 – Cyprus 7)• Age: 8-10 year olds (2 year groups)• 173 children in total - England: 65 – Cyprus: 108• 5 classroom teachers
•Data collection methods• Children’s questionnaire: 173 • Pair interviews with children: 18 interviews • Individual interviews with teachers: 5
METHODOLOGY
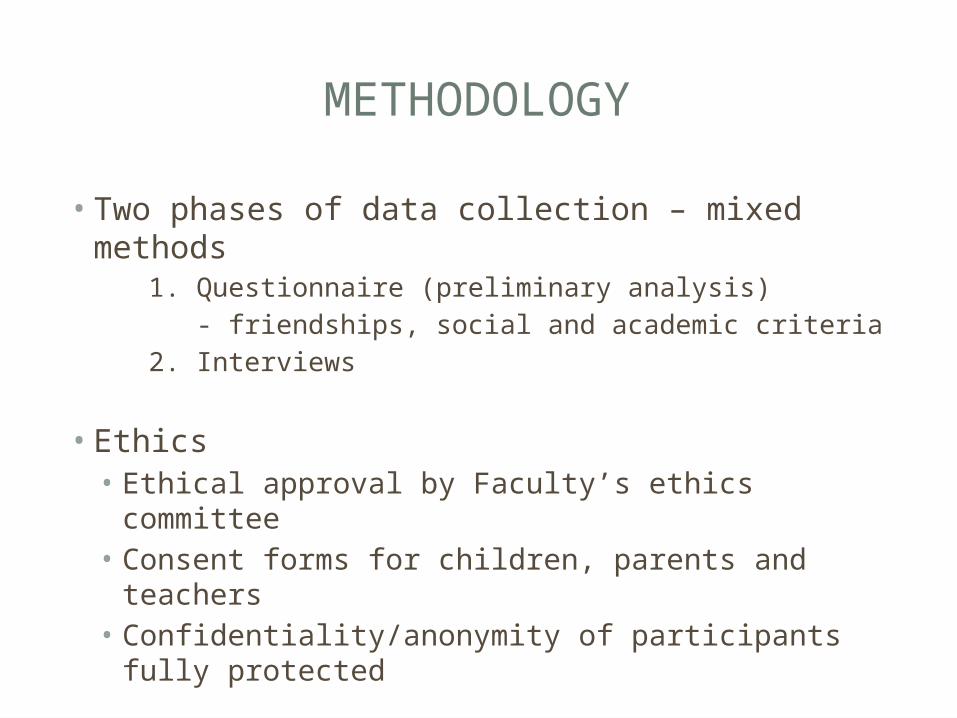
•Two phases of data collection – mixed methods
1. Questionnaire (preliminary analysis)- friendships, social and academic criteria
2. Interviews
•Ethics• Ethical approval by Faculty’s ethics committee
• Consent forms for children, parents and teachers
• Confidentiality/anonymity of participants fully protected
ANALYSIS
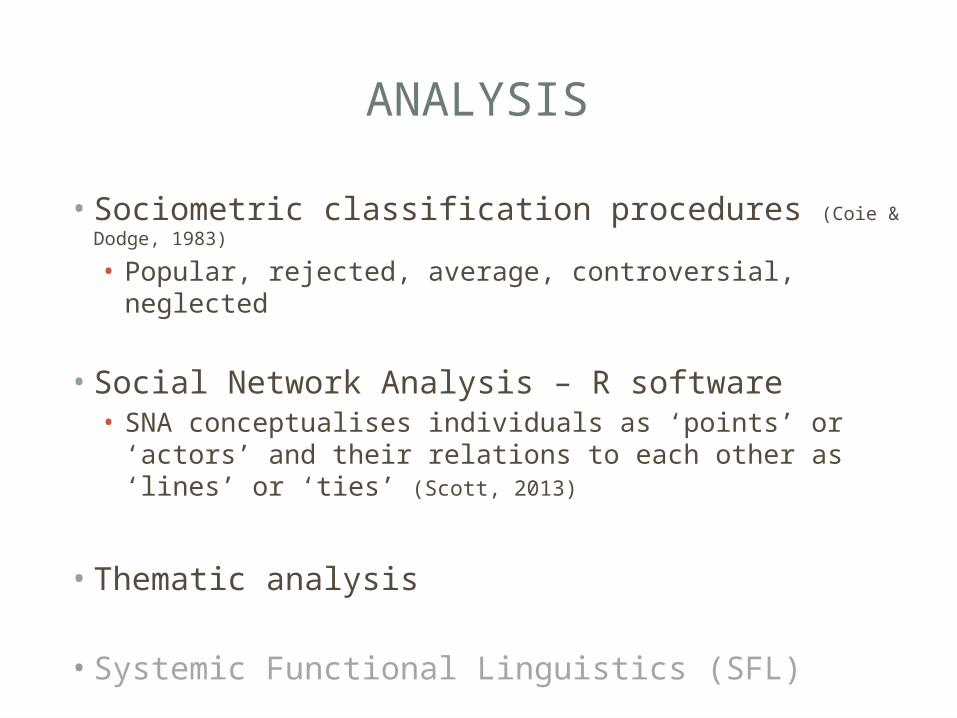
•Sociometric classification procedures (Coie & Dodge, 1983)• Popular, rejected, average, controversial, neglected
•Social Network Analysis – R software• SNA conceptualises individuals as ‘points’ or ‘actors’ and their relations to each other as ‘lines’ or ‘ties’ (Scott, 2013)
•Thematic analysis
•Systemic Functional Linguistics (SFL)
SOCIOMETRIC STATUS
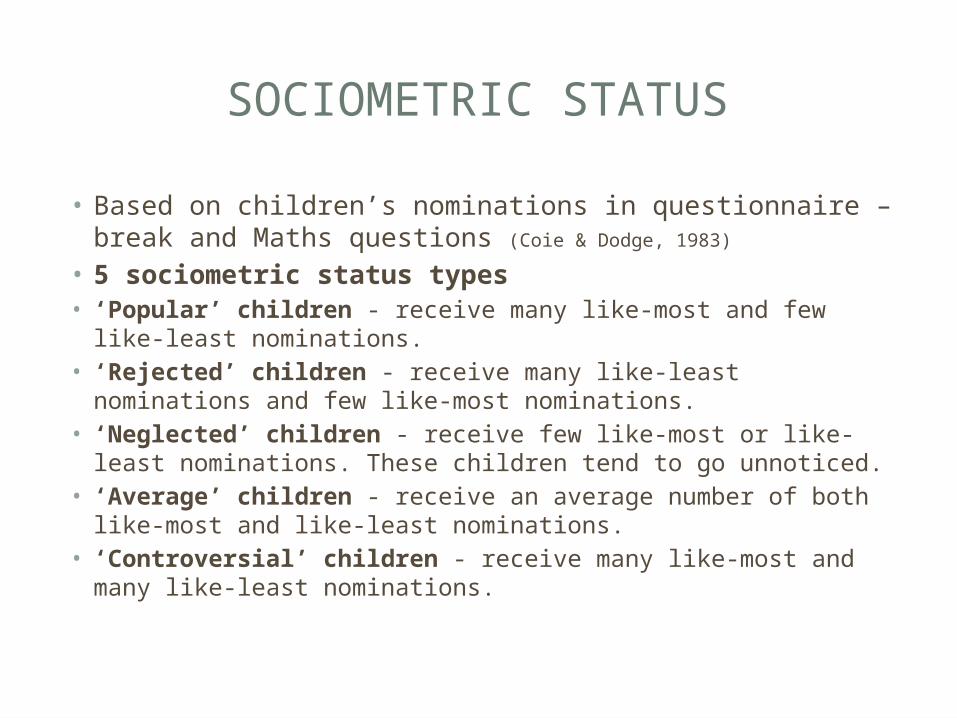
• Based on children’s nominations in questionnaire – break and Maths questions (Coie & Dodge, 1983)
• 5 sociometric status types• ‘Popular’ children - receive many like-most and few like-least nominations.
• ‘Rejected’ children - receive many like-least nominations and few like-most nominations.
• ‘Neglected’ children - receive few like-most or like-least nominations. These children tend to go unnoticed.
• ‘Average’ children - receive an average number of both like-most and like-least nominations.
• ‘Controversial’ children - receive many like-most and many like-least nominations.
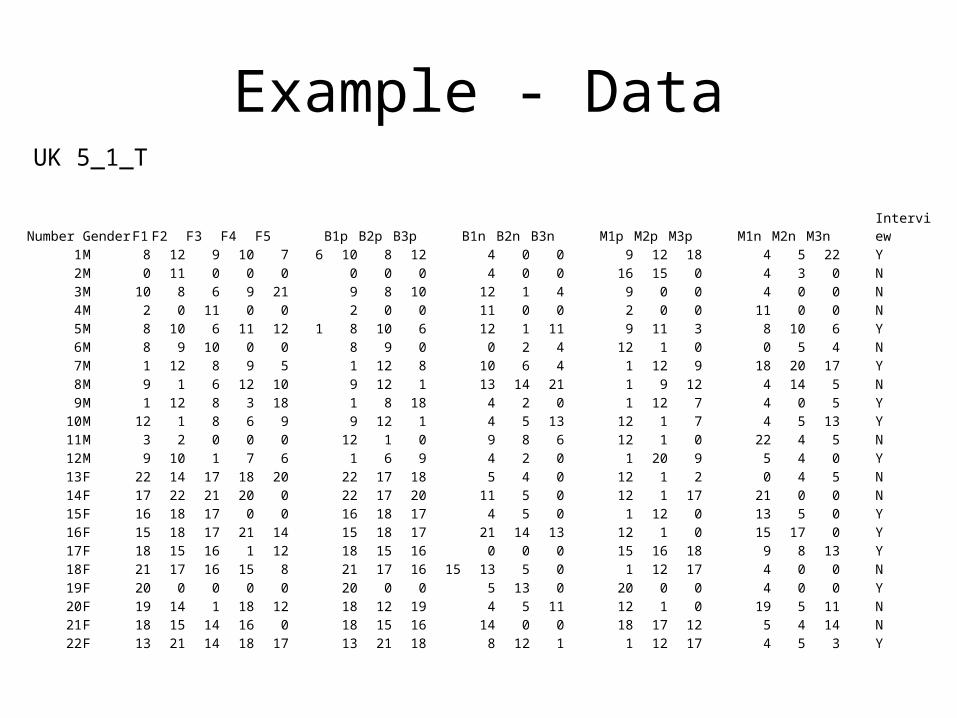
Example - Data
Number GenderF1 F2 F3 F4 F5 B1p B2p B3p B1n B2n B3n M1p M2p M3p M1n M2n M3nInterview
1M 8 12 9 10 7 6 10 8 12 4 0 0 9 12 18 4 5 22 Y2M 0 11 0 0 0 0 0 0 4 0 0 16 15 0 4 3 0 N3M 10 8 6 9 21 9 8 10 12 1 4 9 0 0 4 0 0 N4M 2 0 11 0 0 2 0 0 11 0 0 2 0 0 11 0 0 N5M 8 10 6 11 12 1 8 10 6 12 1 11 9 11 3 8 10 6 Y6M 8 9 10 0 0 8 9 0 0 2 4 12 1 0 0 5 4 N7M 1 12 8 9 5 1 12 8 10 6 4 1 12 9 18 20 17 Y8M 9 1 6 12 10 9 12 1 13 14 21 1 9 12 4 14 5 N9M 1 12 8 3 18 1 8 18 4 2 0 1 12 7 4 0 5 Y10M 12 1 8 6 9 9 12 1 4 5 13 12 1 7 4 5 13 Y11M 3 2 0 0 0 12 1 0 9 8 6 12 1 0 22 4 5 N12M 9 10 1 7 6 1 6 9 4 2 0 1 20 9 5 4 0 Y13F 22 14 17 18 20 22 17 18 5 4 0 12 1 2 0 4 5 N14F 17 22 21 20 0 22 17 20 11 5 0 12 1 17 21 0 0 N15F 16 18 17 0 0 16 18 17 4 5 0 1 12 0 13 5 0 Y16F 15 18 17 21 14 15 18 17 21 14 13 12 1 0 15 17 0 Y17F 18 15 16 1 12 18 15 16 0 0 0 15 16 18 9 8 13 Y18F 21 17 16 15 8 21 17 16 15 13 5 0 1 12 17 4 0 0 N19F 20 0 0 0 0 20 0 0 5 13 0 20 0 0 4 0 0 Y20F 19 14 1 18 12 18 12 19 4 5 11 12 1 0 19 5 11 N21F 18 15 14 16 0 18 15 16 14 0 0 18 17 12 5 4 14 N22F 13 21 14 18 17 13 21 18 8 12 1 1 12 17 4 5 3 Y
UK 5_1_T
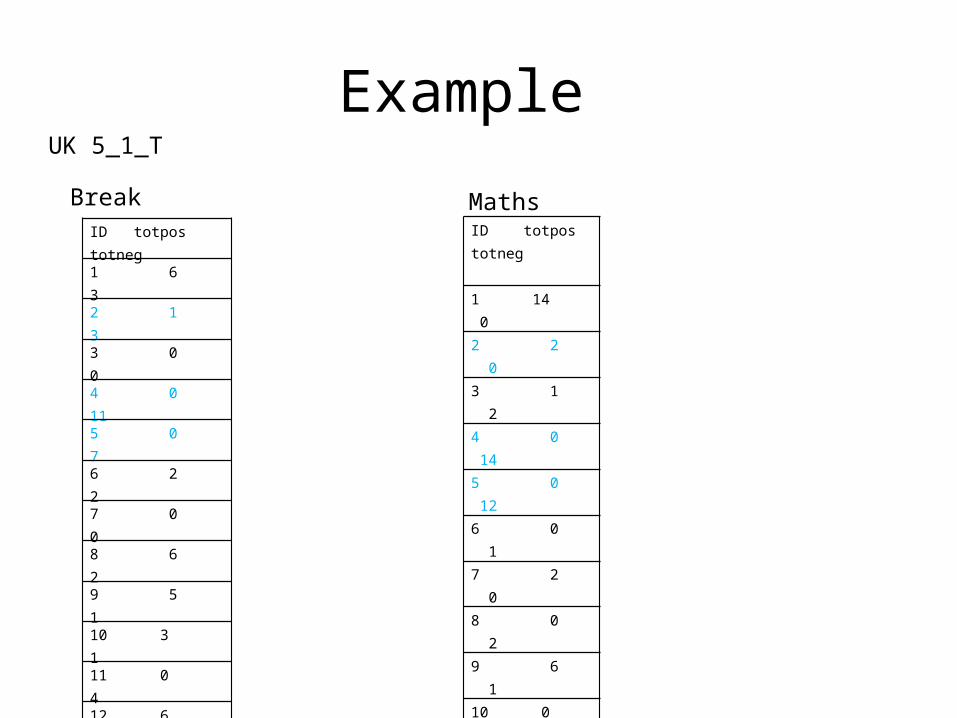
Example
ID totpos totneg 1 14 02 2 03 1 24 0 145 0 126 0 17 2 08 0 29 6 110 0 111 1 212 15 013 0 314 0 215 2 116 2 017 4 218 3 119 0 120 2 121 0 122 0 2
UK 5_1_T
MathsBreakID totpos totneg1 6 32 1 33 0 04 0 115 0 76 2 27 0 08 6 29 5 110 3 111 0 412 6 313 1 514 0 315 3 016 4 017 5 018 8 019 1 020 2 021 2 222 2 0
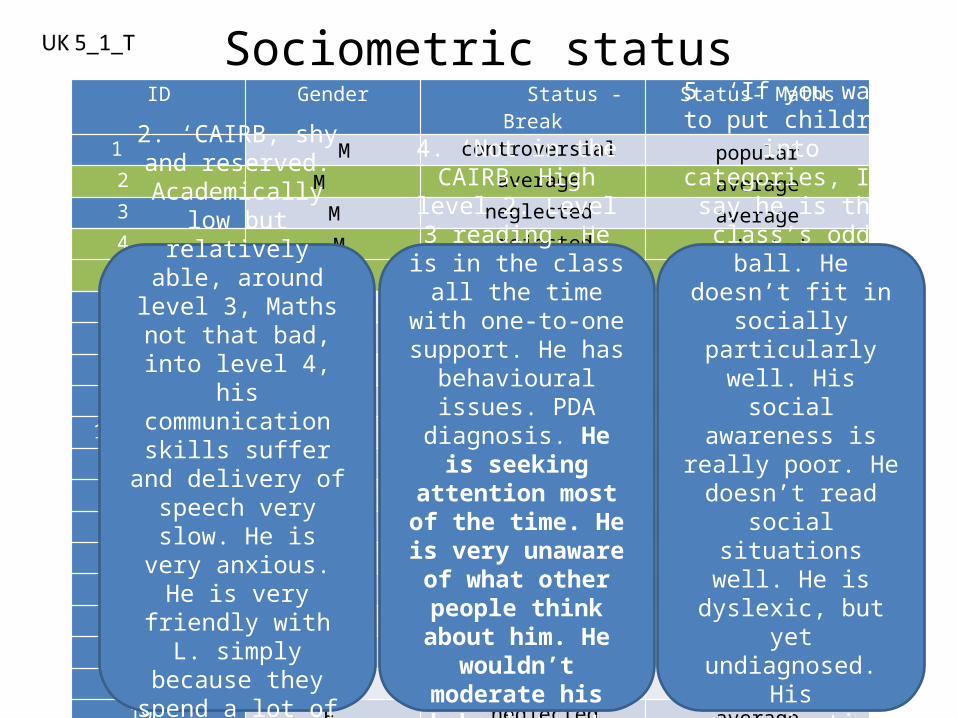
Sociometric statusID Gender Status -
BreakStatus- Maths
1 M controversial popular2 M average average3 M neglected average4 M rejected rejected5 M rejected rejected6 M average average
7 M neglected average8 M popular average
9 M popular popular10 M average average
11 M rejected average12 M controversial popular13 F rejected average14 F rejected average15 F average average16 F popular average
17 F popular average18 F popular average19 F neglected average20 F neglected average21 F average average22 F neglected average
4. ‘Not in the CAIRB. High
level 2. Level 3 reading. He is in the class all the time
with one-to-one support. He has behavioural issues. PDA diagnosis. He is seeking
attention most of the time. He is very unaware of what other people think about him. He
wouldn’t moderate his behaviour at
all by thinking ‘oh, they are looking at me’.
5. ‘If you want to put children
into categories, I’d say he is the class’s odd ball. He
doesn’t fit in socially
particularly well. His social
awareness is really poor. He doesn’t read
social situations well. He is
dyslexic, but yet
undiagnosed. His
communication skills are
quite odd. He’s had a tricky
time at school’.
2. ‘CAIRB, shy and reserved. Academically
low but relatively
able, around level 3, Maths not that bad, into level 4,
his communication skills suffer and delivery of speech very slow. He is
very anxious. He is very
friendly with L. simply
because they spend a lot of time together in the CAIRB. Emotionally he is around 4-5’.

Example – Network break
12
3
4
5
6
7
89
10
1112
13
14
15
16
17
1819
20
21
22
Negative choices
1
2
3
4
5
6
7
8
9
10
11
12
1314
1516
17
18
19
20
21
22
Positive choicesLIKE-LEAST LIKE-MOST
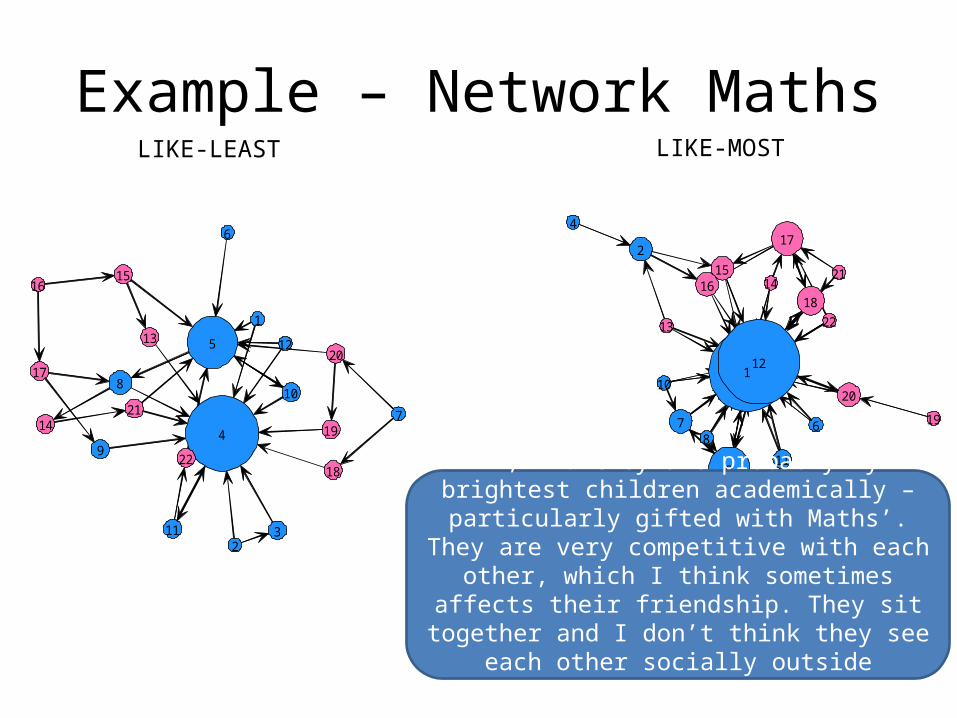
Example – Network Maths
1
23
4
5
6
7
8
9
10
11
1213
14
1516
17
18
19
20
21
22
Negative choices
1
2
3
4
5
678
9
10
11
12
13
1415
16
17
18
1920
21
22
Positive choicesLIKE-LEAST LIKE-MOST
‘1, 12: they are probably my brightest children academically – particularly gifted with Maths’.
They are very competitive with each other, which I think sometimes
affects their friendship. They sit together and I don’t think they see
each other socially outside school’.

Friendships • Network
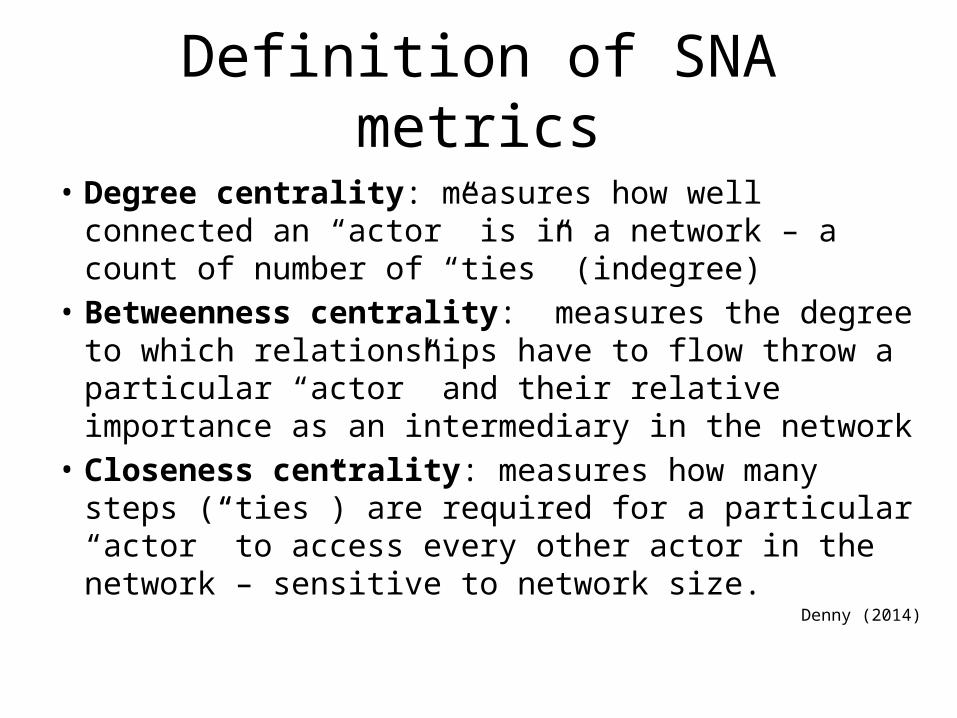
Definition of SNA metrics
• Degree centrality: measures how well connected an “actor” is in a network – a count of number of “ties” (indegree)
• Betweenness centrality: measures the degree to which relationships have to flow throw a particular “actor” and their relative importance as an intermediary in the network
• Closeness centrality: measures how many steps (“ties”) are required for a particular “actor” to access every other actor in the network – sensitive to network size.
Denny (2014)
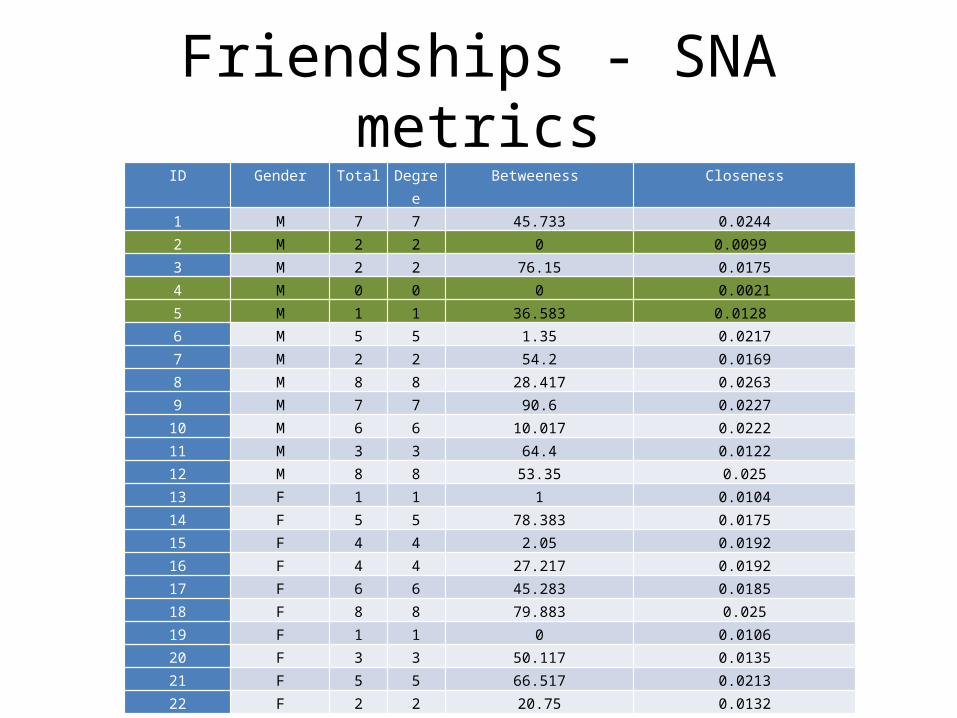
Friendships - SNA metrics
ID Gender Total Degree
Betweeness Closeness
1 M 7 7 45.733 0.02442 M 2 2 0 0.0099 3 M 2 2 76.15 0.01754 M 0 0 0 0.00215 M 1 1 36.583 0.0128 6 M 5 5 1.35 0.02177 M 2 2 54.2 0.01698 M 8 8 28.417 0.02639 M 7 7 90.6 0.022710 M 6 6 10.017 0.022211 M 3 3 64.4 0.012212 M 8 8 53.35 0.02513 F 1 1 1 0.010414 F 5 5 78.383 0.017515 F 4 4 2.05 0.019216 F 4 4 27.217 0.019217 F 6 6 45.283 0.018518 F 8 8 79.883 0.02519 F 1 1 0 0.010620 F 3 3 50.117 0.013521 F 5 5 66.517 0.021322 F 2 2 20.75 0.0132
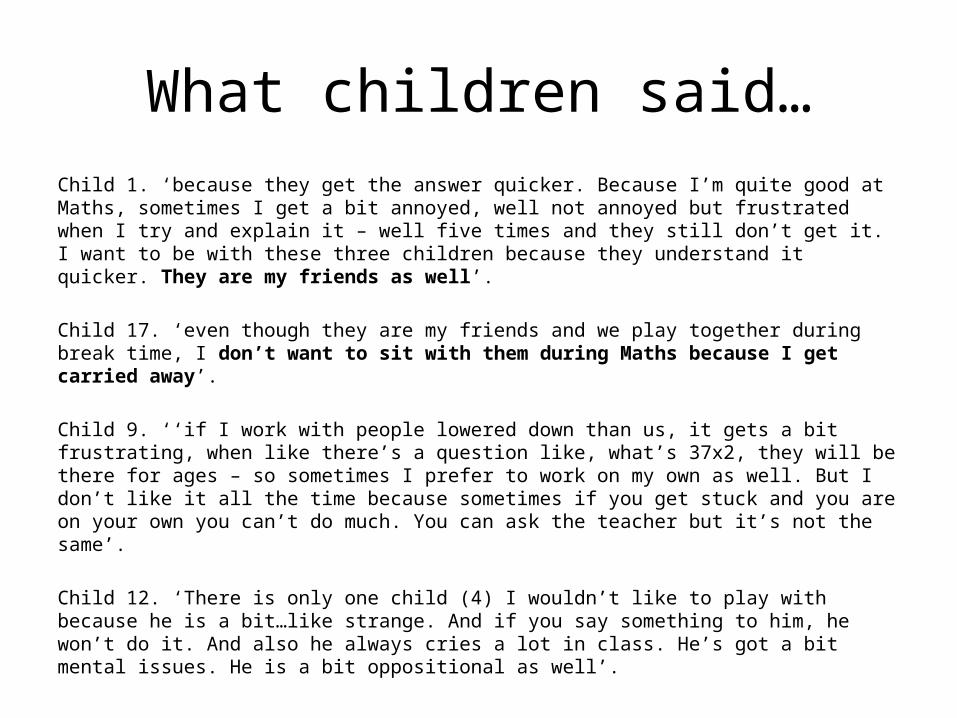
What children said…Child 1. ‘because they get the answer quicker. Because I’m quite good at Maths, sometimes I get a bit annoyed, well not annoyed but frustrated when I try and explain it – well five times and they still don’t get it. I want to be with these three children because they understand it quicker. They are my friends as well’.
Child 17. ‘even though they are my friends and we play together during break time, I don’t want to sit with them during Maths because I get carried away’.
Child 9. ‘‘if I work with people lowered down than us, it gets a bit frustrating, when like there’s a question like, what’s 37x2, they will be there for ages – so sometimes I prefer to work on my own as well. But I don’t like it all the time because sometimes if you get stuck and you are on your own you can’t do much. You can ask the teacher but it’s not the same’.
Child 12. ‘There is only one child (4) I wouldn’t like to play with because he is a bit…like strange. And if you say something to him, he won’t do it. And also he always cries a lot in class. He’s got a bit mental issues. He is a bit oppositional as well’.

Child 12. ‘I wouldn’t choose him because he has autism but he is actually quite good at Maths’. I. ‘So is that a problem?’ ‘Yes, because he is special. Once we went to Lego land and he sat down in the middle and said I’m not moving. So, this is like… and he is quite heavy actually. He’s got a bit of a mental problem. He is quite funny to listen to. Child 1. ‘They go to the rainbow unit, called the CAIRB, and they do special things there. Because they have learning disabilities and autism but L. is better at talking to people. In the classroom, they always sit together with two other girls and they get help from Mrs. (teaching assistant).
TESTSAll data pulled together for 7 UK and
3 CY classes
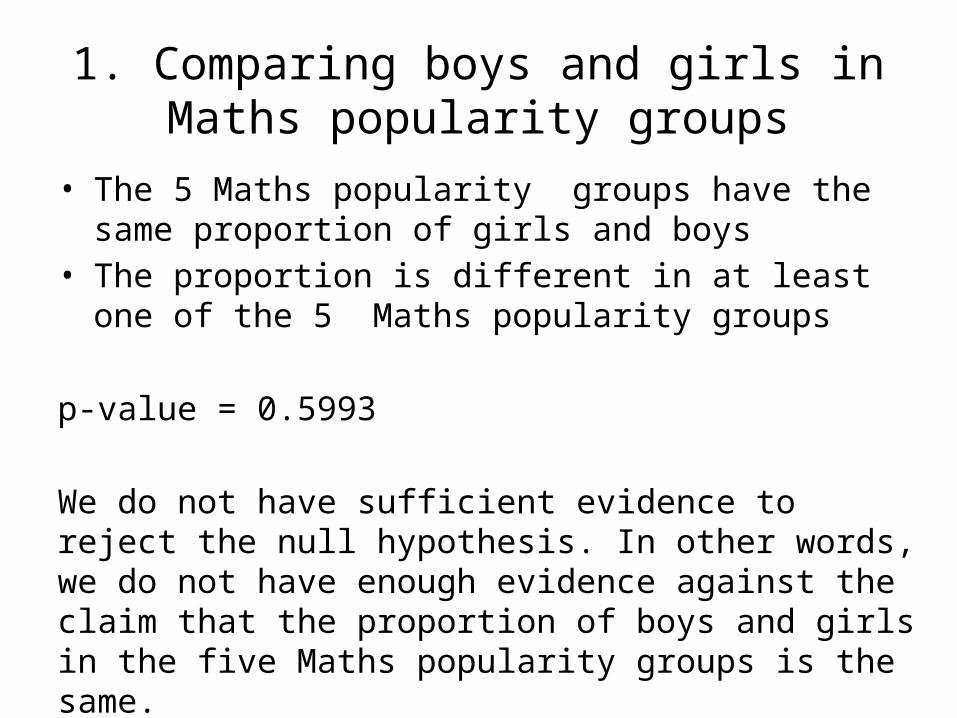
1. Comparing boys and girls in Maths popularity groups
• The 5 Maths popularity groups have the same proportion of girls and boys
• The proportion is different in at least one of the 5 Maths popularity groups
p-value = 0.5993
We do not have sufficient evidence to reject the null hypothesis. In other words, we do not have enough evidence against the claim that the proportion of boys and girls in the five Maths popularity groups is the same.
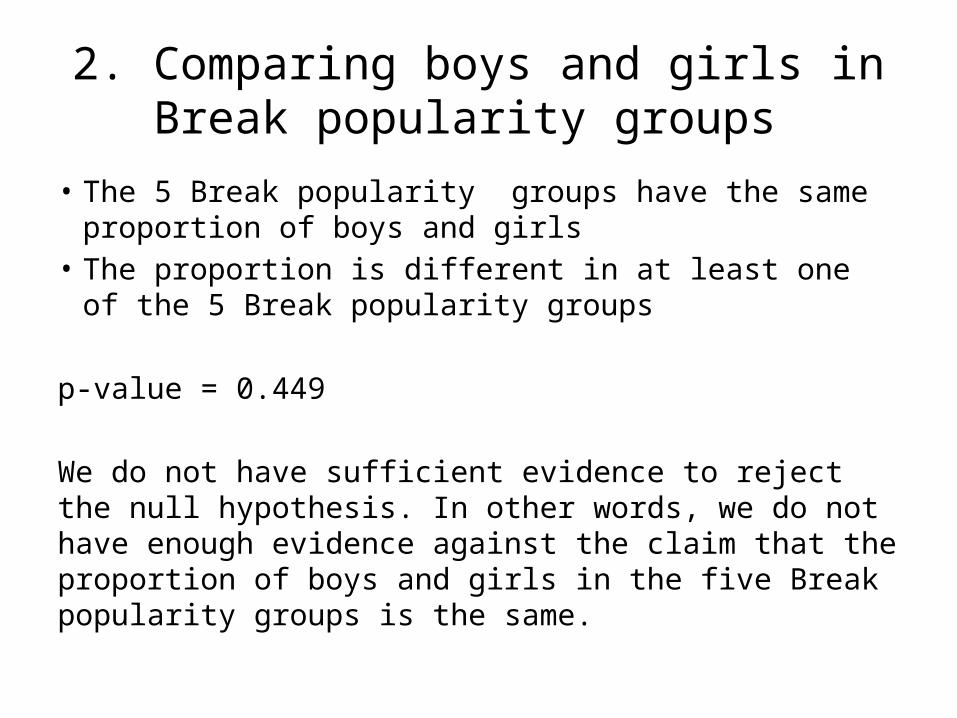
2. Comparing boys and girls in Break popularity groups
• The 5 Break popularity groups have the same proportion of boys and girls
• The proportion is different in at least one of the 5 Break popularity groups
p-value = 0.449
We do not have sufficient evidence to reject the null hypothesis. In other words, we do not have enough evidence against the claim that the proportion of boys and girls in the five Break popularity groups is the same.

3. Comparing break and maths in popularity groups - overall
• : the proportion of children in each of the five popularity groups is the same for maths and break
• the proportion of children in at least one of the five popularity groups is not the same for maths and break
p-value =0.031
• We do have sufficient evidence to reject the null hypothesis.

4. Comparing break and maths in popularity groups by group
Five different tests, one for each group• : the proportion of children in the group (e.g. average ) is the
same for maths and break • the proportion of children in the group (e.g. average) is not the
same for maths and break
• The above p-values suggest that there is some evidence to marginally suggest differences in the average and controversial groups, but not in the neglected, popular and rejected groups at a 5% level of significance.
• Note however, that the p-values are anyway high, but when we do pairwise multiple comparisons, significance is suggested by very low p-values (much lower than 5%), which we do not have here. Essentially our conclusions suggest no difference in the proportions in any of the groups.
Group Average Controversial
Neglected Popular
Rejected
P-value 0.0314 0.0455 0.6394 0.1851 0.9126
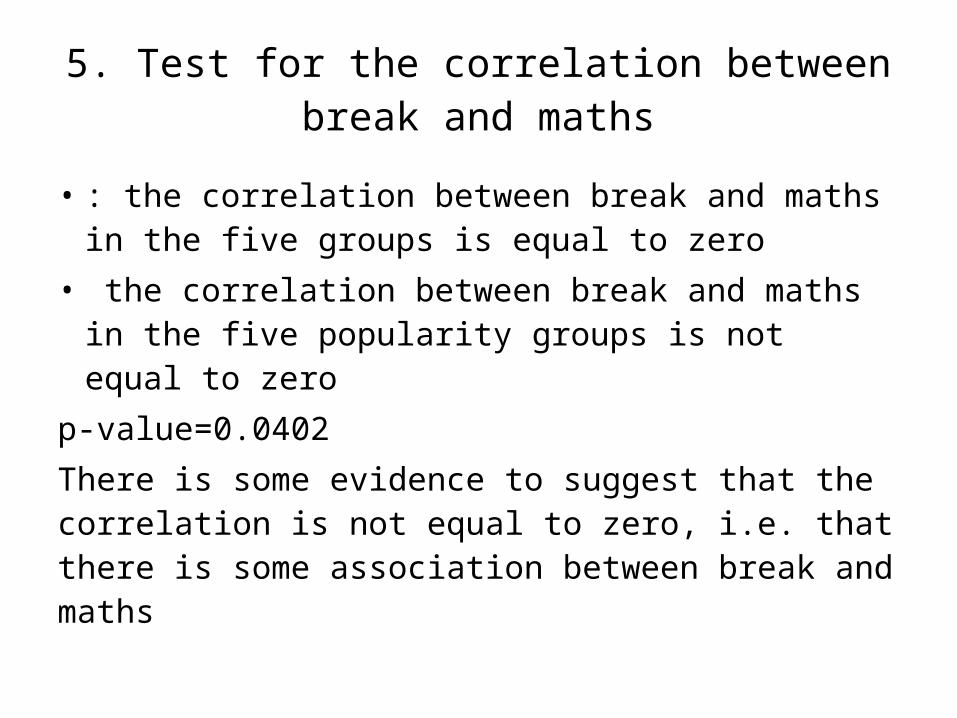
5. Test for the correlation between break and maths
• : the correlation between break and maths in the five groups is equal to zero
• the correlation between break and maths in the five popularity groups is not equal to zero
p-value=0.0402There is some evidence to suggest that the correlation is not equal to zero, i.e. that there is some association between break and maths

REFERENCES• Booth, T. and Ainscow, M. (2011) Index for Inclusion: developing learning
and participation in schools. Bristol: CSIE.• Coie, J.D. and Dodge, K.A. (1983) Continuities and changes in children’s social status: A five-year longitudinal study. Merrill-Palmer Quarterly, 29, 261-82.
• Denny, M. (2014) Social Network Analysis. Institute for Social Science Research: University of Massachusetts Amherst, 1-19.
• Elias, N. (2000). The Civilizing Process (Rev. Ed.). Oxford: Blackwell Publications.
• Florian, L. and Black-Hawkins, K. (2013) Exploring Inclusive Pedagogy. British Educational Research Journal, 37(5), pp.813-828.
• Mamas, C. (2012). Pedagogy, Social Status and Inclusion in Cypriot Schools. International Journal of Inclusive Education, 16(11), pp.1223-1239.
• Scott, J. (2013) Social Network Analysis (3rd ed.). London: SAGE.
Thank [email protected]
Copyright © 2022 FDOKUMEN