
Debating Poverty Porn on Twitter: Social Media as a Place for Everyday Socio-Political Talk

Massive Social Network Analysis:Mining Twitter for Social Good
David Ediger Karl JiangJason Riedy David A. BaderGeorgia Institute of Technology
Atlanta, GA, USA
Courtney Corley Rob FarberPacific Northwest National Lab.
Richland, WA, USA
William N. ReynoldsLeast Squares Software, Inc.
Albuquerque, NM, USA
Abstract—Social networks produce an enormous quan-tity of data. Facebook consists of over 400 million ac-tive users sharing over 5 billion pieces of informationeach month. Analyzing this vast quantity of unstructureddata presents challenges for software and hardware. Wepresent GraphCT, a Graph Characterization Toolkit formassive graphs representing social network data. On a 128-processor Cray XMT, GraphCT estimates the betweennesscentrality of an artificially generated (R-MAT) 537 millionvertex, 8.6 billion edge graph in 55 minutes and a real-world graph (Kwak, et al.) with 61.6 million verticesand 1.47 billion edges in 105 minutes. We use GraphCTto analyze public data from Twitter, a microbloggingnetwork. Twitter’s message connections appear primarilytree-structured as a news dissemination system. Within thepublic data, however, are clusters of conversations. UsingGraphCT, we can rank actors within these conversationsand help analysts focus attention on a much smaller datasubset.
I. INTRODUCTION
Since the explosion of the Internet in the 1990s, nu-
merous researchers have focused on identifying unifying
characteristics of online communities. Efforts such as
identifying political factionalism [1] or recommendation
networks [24] have provided unique, simplifying insights
into the behavior of human social groups linked by
electronic networks. Such insights are of intellectual
and practical interest. Underlying this interest is the
hypothesis that relationships and behaviors in virtual
communities re ect similar phenomena in the real world,
such as commercial proclivities, political leanings, and
propensity for violence.
Social media provide tremendous challenges for re-
searchers and analysts trying to gain insight into human
and group dynamics. A central problem is the sheer
amount of data available in social media. For example,
the social media aggregation site Spinn3r [34] advertises
that they provide information on over 20 million blogs,
feeds that stream over 100 thousand posts and an 8 month
archive consisting of 21 TB of data. Facebook currently
involves over 400 million active users with an average of
120 `friendship connections each and sharing 5 billionreferences to items each month [11].
One analysis approach treats the interactions as graphs
and applies tools from graph theory, social network
analysis, and scale-free networks [29]. However, the
volume of data that must be processed to apply these
techniques overwhelms current computational capabilities.
Even well-understood analytic methodologies require
advances in both hardware and software to process the
growing corpus of social media.
Social media provides staggering amounts of data.
Extracting knowledge from these volumes requires au-
tomation. Computing quickly over this data is a challenge
for both algorithms and architectures.
We present GraphCT, a Graph Characterization Toolkit
capable of applying complex analysis tools to massive
graphs. We analyze graphs representing Twitter s pub-
lic data stream using GraphCT and demonstrate that
the packaged metrics reveal interesting characteristics
of Twitter users interactions. The graph is rich with
broadcast trees that repeat the same news stories or other
information. We want to identify in uential sources and
not those who only rebroadcast information. Removing
tree-like broadcast networks identifies conversations, and
ranking users focuses on conversations with important or
in uential users. An analyst can focus on a handful of
conversations rather than tens of thousands of interactions.
These graphs are huge with respect to traditional social
network analysis tools but do not present GraphCT s full
capabilities. We also apply GraphCT to massive artificial
networks similar in size to the Facebook friend network.
On a 128-processor Cray XMT, approximating a complex
metric, betweenness centrality, on an artificial graph with
537 million vertices and 8.54 billion edges takes 55
minutes. An estimate on a real-world graph [22], [23]
with 61.6 million vertices and 1.47 billion edges takes
105 minutes. We are unaware of any other package or
2010 39th International Conference on Parallel Processing
0190-3918/10 $26.00 © 2010 IEEE
DOI 10.1109/ICPP.2010.66
583

system that applies complex measurements to graphs of
this size. These graphs are 3-4 orders of magnitude larger
than graphs analyzed by packages with similar features.
The Cray XMT is an architecture designed for analysis of
large data sets. The cost even of approximating a metric
on massive graphs is worth noting. Approximations on
Section III s real data demonstrate large variability and
significant errors; more work on approximation quality
is needed.
The remainder of this introduction provides further
background on graph representations for social networks.
Section II brie y summarizes the algorithms we apply to
the Twitter network. The analysis results are discussed
in Section III. Details of GraphCT, our tool for massive
social network analysis, appear in Section IV. Section V
summarizes GraphCT s application to the Twitter data
and presents future directions for massive social network
analysis.
A. Graph Analysis for Social Networks
We treat social network interactions as a graph and use
graph metrics to ascribe importance within the network.
There are two common representation approaches. One
is to represent the actors by vertices and connect two
actors whenever they share an interaction. Another forms
a bipartite graph considering both actors and interactions
as vertices and connecting actors with interactions. We
use the former representation connecting actors to actors
in the remainder of this paper.
For social media sites like Twitter, user names (@foo)
are vertices, and we add an edge from @foo to @barwhenever @foo posts a message mentioning @bar. For
most metrics, we treat the graph as undirected, so an edge
from @foo to @bar also connects @bar back to @foo.
This representation aggregates interactions and focuses
on the relationships between actors. A directed model
connecting only @foo to @bar could model directed
ow and is of future interest.
Various measures of the vertices and connectivity
within a graph identify critical portions. A simple measure
like the degree distribution re ects the relative volume of
messages related to individual actors. Another measure,
betweenness centrality [14], can identify critical vertices
in a network. High centrality scores indicate that a
vertex lies on a considerable fraction of shortest paths
connecting pairs of vertices and may play an important
role in the network. Betweenness centrality has been
applied extensively to the study of various networks
including biological networks [19], sexual networks and
the transmission of the AIDS virus [25], identifying key
actors in terrorist networks [8], organizational behavior,
and transportation networks [16].
Betweenness centrality measures the fraction of short-
est paths passing through a vertex. Considering shortpaths within a length k of the shortest paths pro-
duces k-betweenness centrality [20], a measure intended
to be more robust against changes within the graph.
Section II-A summarizes the k-betweenness centrality
algorithm.
B. Social Network Graph Characteristics
The graphs representing social networks often share
common characteristics [28] useful for tuning software.
The degree distribution tends towards a heavy tail; a
few vertices have high degree while most have very
low degrees. Natural clusters form, but the clusters
do not partition the graph. The clusters overlap where
communities share members, and some actors may not
join any larger communities. Characteristics change over
time. This paper considers only a snapshot, but ongoing
work examines the data s temporal aspects.
II. ALGORITHMS FOR MASSIVE SOCIAL NETWORK
ANALYSIS
GraphCT supplies multithreaded implementations of
known algorithms for the Cray XMT. We review the
algorithms and their implications for multithreaded im-
plementation.
A. Algorithm Summary
The analysis in Section III considers degree distribu-
tions, connected components, and betweenness centrality
along with a few graph manipulations. GraphCT provides
routines for the former but assumes all manipulations
occur before being given the data or can be expressed as
colorings. GraphCT collects highly parallel algorithms for
betweenness centrality [26], [20], connected components
(similar to [5]), and others. We brie y describe these
algorithms.
Computing degree distributions and histograms is
straight-forward. Our static, undirected graph data struc-
ture uses the compressed sparse row format and con-
tains the degrees implicitly. The degree statistics are
summarized by their mean and variance. A histogram
produces a general characterization of the graph; a few
high degree vertices with many low degree vertices
indicates a similarity to scale-free social networks.
GraphCT extracts connected components from the
graph though a technique similar to Kahan s algorithm [5].
In the first phase searches breadth-first simultaneously
from every vertex of the graph to greedily color neighbors
with integers. These parallel searches track which colors
584

collide. The next phase repeatedly absorbs higher labeled
colors into lower labeled neighbors. Relabeling the colors
downward occurs as another parallel breadth-first search.
This effectively combines the second and third steps in
Kahan s method. Once there are no more collisions, the
remaining colors determine the components.
Betweenness centrality is a more complex metric for
ranking vertices. Betweenness centrality counts along
how many shortest paths a particular vertex lies. More
precisely,
BC(v) =∑
s �=v �=t∈V
σst(v)
σst,
where V is the set of vertices, σst(v) is the number of
shortest paths from s to t passing through v, and σst is the
total number of shortest paths from s to t. Approximating
this metric by randomly sampling a small number of
source vertices s improves the running times and allows
computation of approximate betweenness centrality on
massive graphs. Sampling does not degrade the score
quality significantly on artificial networks [3]. Section III
investigates the sampling trade-off on real data.
Betweenness centrality is not robust against noise.
Adding or removing a single edge may drastically alter
many vertices betweenness centrality scores. Considering
not only the shortest paths but also all paths within length
k of the shortest paths introduces robustness against
small changes and produces k-betweenness centrality [26].
k-Betweenness centrality considers alternate paths that
may become important should the shortest path change.
When k = 0, this produces the traditional betweenness
centrality.
The algorithm GraphCT uses to compute k-
betweenness centrality runs across every source vertex s.
The contributions by each source vertex can be computed
independently and in parallel, given sufficient memory
(O(S(m+n)), where S is the number of parallel source
vertices). A parallel breadth-first search finds the shortest
paths from s to all other vertices. The breadth-first search
also follows links within the same level, one level back,
and so on up to k − 1 levels back to accumulate paths
of length at most k longer than the shortest.
A recurrence generalizing Brandes s betweenness
centrality recurrence [6] computes the k-betweenness
centrality path counts. The value for a vertex v depends on
its predecessors values. Another parallel sweep following
the breadth-first search levels evaluates the recurrence.
B. Software and Hardware Needs for Massive SNA
Path-based metrics like betweenness centrality contain
opportunities for fine-grained parallelism beyond running
multiple searches simultaneously. Unlike that coarse level
of parallelism, the fine-grained parallelism within each
search does not require O(m+ n) data storage per task.
Exposing the fine-grained parallelism permits pipelining
of memory accesses for latency tolerance, but exploiting
the parallelism requires a few programming environment
and hardware features. The irregular memory access
patterns also dictate a globally addressable memory space.
Such common programming environments as
OpenMP [31] and Cray [32] compilers expose the
fine-grained parallelism through looping constructs
and compiler directives. The only synchronization
operation required by Section II-A s analysis algorithms
is an atomic fetch-and-add operation. This operation is
available through standard environments like OpenMP
and platform-specific compilers like Cray s.
Taking advantage of the fine-grained parallelism re-
quires light-weight thread management. The loops are
not strict vector loops but irregular combinations of
reads, conditionals, operations, and writes. Some current
hardware platforms such as current GPGPUs vector-
ize conditional-laden loops through predicated instruc-
tions [36]. All threads read all instructions for all possible
conditional outcomes, but each thread executes fully only
those instructions that match a particular conditional path.
For our algorithms, the irregular activities within the loops
restrict the active execution to only a few threads at any
time, wasting computational resources.
In contrast, the Cray XMT [21] provides significant
hardware assistance for massive graph analysis. The
architecture tolerates high memory latencies by main-
taining many active thread contexts in hardware. These
threads are fully general and do not rely on pseudo-
vectorization. Synchronization costs are amortized over
the same memory latencies, leading to high processor
efficiency even with many data dependencies. Scaling the
number of available thread contexts directly with memory
size permits.
Each Threadstorm processor within a Cray XMT con-
tains 128 thread contexts in hardware streams. Streams
may be blocked temporarily waiting for memory and are
remapped to new threads when synchronizing memory
accesses retry too often. The processor dispatches one
instruction per cycle, selecting an instruction from each
ready stream in turn. There is no cache in the processors;
all latency is handled by threading. Each processor is
accompanied by 8 GiB of DDR RAM, and processors
are connected through Cray s SeaStar network.
The Cray XMT features a large, globally addressable
memory with hashed addresses breaking locality and
alleviating hot spots. Synchronization takes place at
585

TABLE ICOMMON MICROBLOGGING SYMBOLS USED ON TWITTER.
Symbol Interpretation
@ User foo is addressed as @foo within notices.# A “hashtag” is a user-provided word denoting a topic.
the level of 64-bit words. The Cray XMT supports
atomic fetch-and-add operations along with more exotic
synchronization primitives like full/empty bits. The
cost of synchronization is amortized over the cost of
memory access, and fine-grained synchronization latency
is tolerated through same the massively multithreaded
architecture.
The Cray XMT used for these experiments is located
at Pacific Northwest National Lab and contains 128
Threadstorm processors running at 500 MHz. These 128
processors support over 12 thousand user thread contexts.
The globally addressable shared memory totals 1 TiB
and can hold graph data structures containing more than
4 billion vertices and 34 billion edges.
III. APPLYING MASSIVE SNA TO REAL DATA
A. Micro-Blogging: Twitter
As an example of the power and utility of GraphCT
for projecting complex network data into analytically
tractable information, we consider networks derived from
real-world social media, Twitter. Twitter is a social
network in which short 140-character messages, known
as “tweets”, are transmitted via cell phones and personal
computers onto a central server where they can be viewed
by the entire community. Analyses reported here are
evaluated on Twitter updates aggregated by Spinn3r [34],
a web and social media indexing service which conducts
real-time indexing of all blogs. From the Spinn3r corpus
several representative Twitter data sets are extracted
motivated by two crises occurring in September 2009.
1) In uenza H1N1 Tweets in September 2009: While
the impact of the 2009 global in uenza H1N1/A pan-
demic was milder than expected, concern persists due
to the severity of previous pandemics. In particular the
1918 Spanish Flu infected 500 million individuals and
caused 50 million deaths worldwide between March
1918 and June 1920 [27]. The correlation between open
communications and public health information is clear in
the abrupt explosion of social media articles published
in the 17th week of April 2009. Table II reports the
number of English non-spam social media articles (not
including micro-blogs), with keywords h1n1 or swineflu, posted during the first eight weeks of the pandemic
TABLE IINOVEL INFLUENZA H1N1/A ENGLISH, NON-SPAM ARTICLES (NOT
INCLUDING MICRO-BLOGS) POSTED PER WEEK IN 2009
Week in 2009 # Articles
17th 5 59118th 108 03819th 61 34120th 26 25621th 19 22422th 37 93823th 14 39324th 27 502
in 2009 [9]. Informed by the previous statement, a harvest
of all public tweets published during an arbitrary time-
frame, September 2009, containing the keywords flu,
h1n1, influenza and swine flu is aggregated into
one data set. An example H1N1 topic Twitter stream is
provided in Fig. 1.
2) Atlanta Flood Tweets in September 2009#atlflood: A second crisis motivating a Twitter data
set is the dramatic ooding of Atlanta, Georgia in late
September 2009. The following is a quote from the
federal agency that tracks ooding in the United States:
the U.S. Geological Survey cannot accurately
characterize the probability due to its extreme
rarity [...] Nationwide, given that our old-
est streamgauging records span about 100
years, the USGS does not cite probabilities for
oods that are beyond a 0.2 percent (500-year)
ood [35].
Twitter users ocked to this medium to share photographs,
news updates, weather conditions and the location of
• jaketapper: every yr 36,000 Ams (on avg) die fromregular u. this COULD be higher. + the big diff is thereg u kills older Ams, H1N1 kills the young
• jaketapper: @EdMorrissey Asserting that all thatsbeing done to prevent the spread of H1N1 is offeringthat hand-washing advice is just not true.
• jaketapper: @dancharles as someone with a pregnantwife i will clearly take issue with that craziness. they aremore vulnerable to H1N1,as are toddlers
• dancharles: RT @jaketapper @Slate: Sanjay Guptahas swine u http://bit.ly/B9IFe <= Glad I listened tohis “stay u free ” tips
Fig. 1. Example of a Twitter conversation between Jake Tapper andDan Charles in the H1N1 data set.
586

current ood points throughout the metroplex by con-
catenating the hashtag #atlflood to their tweets. We
created a data set of all public tweets during a five day
window between the 20th and 25th of September 2009
containing the hashtag #atlflood.3) All public tweets September 1st, 2009: A third
data set is compiled from all public tweets posted on
September 1st, 2009. We leverage the larger size of this
data to evaluate performance (runtime and accuracy) of
GraphCT s algorithms.
B. Tweet GraphsUser interaction graphs are created by adding an
edge into the graph for every mention (denoted by the
prefix @) of a user by the tweet author. Duplicate user
interactions are thrown out so that only unique user-
interactions are represented in the graph. Selected tweet
graph characteristics are listed in Table III of both the full
graph and of the largest weakly connected component
(LWCC).
TABLE IIITWITTER USER-TO-USER GRAPH CHARACTERISTICS
Tweet Graph Data UsersUnique userinteractions
Tweets withresponses
Sep 2009 H1N1 46,457 36,886 3,444(LWCC) 13,200 16,541 1,772
20-25 Sep 2009 #atlflood 2,283 2,774 279(LWCC) 1,488 2,267 247
1 Sep 2009 all 735,465 1,020,671 171,512(LWCC) 512,010 879,621 148,708
C. Degree (Power Law) Distribution of DataA criterion in many complex systems is that properties
are often distributed as power laws, also known as 80/20
rules or Pareto rules where 80% of the effects come from
20% of the causes. The numbers 80 and 20 are not special,
one observes power laws with different breakdowns. The
key fact is the disproportionate in uence of relatively few
elements. For our purposes, power laws are important
since they imply that by characterizing the in uential
elements in a community, we can characterize the com-
munity as a whole. In network theory, a key distribution
of interest is the degree distribution. So called scale-free 1
1The term “scale-free” is a technical characterization of powerlaw distributions. They are so named because changing the scaleof measurement (e.g. going from imperial to metric units) leavesthe mathematical structure of the distribution unchanged; there is nopreferred scale in the distribution. In contrast, the normal distribution,can be transformed to a simpler mathematical form by choosing alength scale equal to the standard deviation.
TABLE IVTOP 15 USERS BY BETWEENNESS CENTRALITY
Rank Data SetH1N1 atl ood
1 @CDCFlu @ajc2 @addthis @driveafastercar3 @Official_PAX @ATLCheap4 @FluGov @TWCi5 @nytimes @HelloNorthGA6 @tweetmeme @11AliveNews7 @mercola @WSB_TV8 @CNN @shaunking9 @backstreetboys @Carl
10 @EllieSmith_x @SpaceyG11 @TIME @ATLINtownPaper12 @CDCemergency @TJsDJs13 @CDC_eHealth @ATLien14 @perezhilton @MarshallRamsey15 @billmaher @Kanye
Fig. 2. Degree distribution of the Twitter user-user graph.
networks exhibit power-law distributions in their degree
distributions most connections are concentrated in a
small fraction of the vertices (e.g. 80 of the connections
involve 20% of the vertices or 90/10 or 99/1) [30].
Power laws have been observed in broad variety of social
networks [30], [13], [25]. Scale-free tweet mention graphs
would imply that a few Twitter users and “mentioners”
are responsible for a disproportionately high fraction of
a community s discourse.
An observation in all three datasets is that there
are relatively few high-degree vertices (see Fig. 2).
Twitter users tend to refer to relatively few “broadcast”
vertices. Empirically examining some of the top vertices
(Table. IV) in the twitter datasets reveals that these high-
degree vertices are dominated by major media outlets
587

and government organizations2.
One interpretation of Twitter s user network structure is
in news dissemination. Users track topics of interest from
major sources and occasionally re-broadcast (retweet)that information. Information ows one way, from the
broadcast hub out to the users. In incidental communi-
cation, the user will refer to the broadcast source. This
leads to the question about the nature of these “second
order” communications. Is Twitter used simply as a one-
to-many broadcast medium, or are there many-to-many
communication patterns hidden in the data?
To examine this question, we looked for subgraphs in
the data that exhibited many-to-many attributes. We used
a straight-forward approach to identify subgraphs. We
retained only pairs of vertices that referred to one-another
through `@ tags (see Table III). This lead to dramatic
reductions in the size of the networks. We present the
results graphically in Fig. 3 for each of the data sets and
an example Twitter stream with conversation from ABC
news correspondent Jake Tapper in Fig. 1.
Our analyses of sub-communities in Twitter data
informed the following conclusions. Sub-communities are
relatively small fractions of the overall data. Qualitative
measurements assist identification of scaling behavior.
We observed reduction factors, due to filtering non-
conversation interactions, as high as two orders of magni-
tude (see Table III). Inspection of the high ranking users
derived from the GraphCT betweenness centrality scores
on the smaller datasets show the content is on-topic (i.e.
relevant to keyword search) and uncluttered with noise
(e.g. spam, off-topic conversations). We also observe
some groups within the subcommunities using Twitter as
a text messaging service, engaging in direct conversations
regarding the topic of interest. An interesting artifact in
the tweet graphs show numerous “self-referring” vertices,
Tweeters whose updates reference themselves, informing
evidence that Twitter mimics an echo chamber in addition
to a broadcast messaging service.
D. Runtime Characteristics
In social media analysis, many times we are interested
in only the most information rich sources, or those
actors that have the greatest ability to broker information
between parties. The betweenness centrality metric is
used to assign varying scores related to the latter of
the previous statement. To evaluate the effectiveness of
2For the H1N1 data, the authors were able to identify the high-referenced vertices as media and government outlets. For the AtlantaFlood data, the authors from the Atlanta area examined the data andidentified most of the top vertices as Atlanta based newspapers, TVand radio personalities.
GraphCT on real-world data we compare performance,
both in accuracy and runtime, on the task of identifying
top ranked actors, across evaluation settings. Exact
betweenness centrality is compared against approximate
centrality. The value in this comparison is the identifi-
cation of trade-offs between run-time performance and
accuracy. Even on medium sized graphs, on the order
of 107 vertices and edges, exact centrality measurements
become intractable (bounded by memory capacity and
processor speeds) on commodity machines. Because
of this the GraphCT betweenness algorithm allows for
varying levels of approximation (see Section II-A). In
addition to understanding the trade-offs through varying
levels of approximation, an analyst or user may require a
task to identify a set of the top N% actors in a given social
network. Moreover, to compare accuracy of approximate
BC vs. exact we use normalized set Hamming distance
as a metric to compare the top N% ranked actors across
evaluations [17], [12].
E. Analysis and Conclusions
Let us first consider the runtime performance of
GraphCT executed on real-world graphs. Due to the
many-component property of the Twitter data, we allocate
several evaluation settings by varying the percentage of
randomly sampled nodes (see Section II-A). Specifically
we randomly sample 10%, 25% and 50% of the nodes
in each tweet graph, achieving 90% confidence with
the runtime averaged over 10 realizations for each
evaluation setting and data set. Exact centrality, 100%
node sampling, is the control for these calculations. The
runtime characteristics are graphed on a log-linear scale in
Fig. 4; the x-axis is the percentage of all vertices randomly
sampled in the approximate betweenness centrality calcu-
lations and the y-axis measures the runtime in seconds.
Inspecting the figure, there is a clear and dramatic runtime
performance difference of 10% sampling compared to
exact calculations, 30 seconds compared to nearly 49
minutes respectively.
Analysts incorporating GraphCT algorithms into their
work ows may have explicit requirements on the accuracy
of results, acknowledging the trade-off between runtime
speed and accuracy of the approximate betweenness
centrality. In analyzing social networks, the analyst is
most interested in the actors with the highest score. To
inform these decisions we evaluate accuracy of simple
betweenness centrality when 10%, 25% and 50% of the
nodes in each real-world tweet graph are sampled. The
chosen metric, described in the previous section, is the
normalized top k set Hamming distance. The top 1%,
588

Original Largest Component Subcommunity
1164 vertices 37 vertices
17k vertices 1184 vertices
Atlanta Flood
H1N1
Fig. 3. Subcommunity filtering on Twitter data sets
5%, 10% and 20% users by approximate betweenness
centrality score are compared to the top N% exact
centrality ranked users, achieving 90% confidence with
the accuracies averaged over 10 realizations for each
evaluation setting and data set. The accuracy trade-
off results are plotted in Fig. 5; the y-axis is labeled
with the percent of top k actors present in both exact
and approximate BC rankings and the x-axis labels
the percentage of all vertices randomly sampled in the
approximate betweenness centrality calculations. The
accuracy remains above 80% comparing the top 1% and
5% users when sampling 10% of the real-world tweet
graphs. The accuracy climbs to over 90% comparing the
top 1% and 5% ranked users and sampling 25% and 50%
of the vertices.
IV. GRAPHCT: SNA ALGORITHMS FOR MASSIVE
GRAPHS
The literature contains a number of different social
network analysis software packages developed for se-
quential workstations and high performance, parallel
machines [33], [4], [15]. Workstation implementations
are limited in the size of graphs they analyze by the size
of main memory and the inability of the cache hierarchy
to accelerate irregular memory accesses. A representative
software package is typically limited to several hundred
thousand or several million vertices.
GraphCT is a multithreaded Graph Characterization
Toolkit implemented on the massively multithreaded Cray
XMT. It is designed from the ground up to expose fine-
grained parallelism and profitably use tens of thousands
of hardware threads. Loading massive datasets into
589
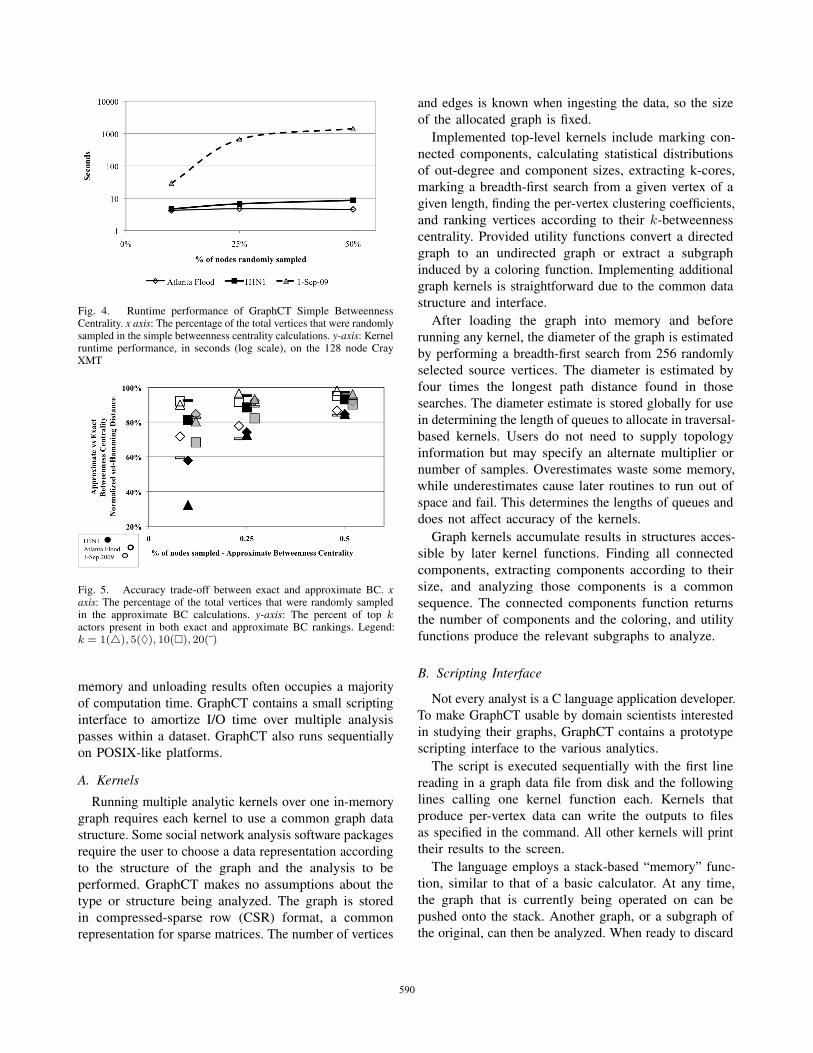
Fig. 4. Runtime performance of GraphCT Simple BetweennessCentrality. x axis: The percentage of the total vertices that were randomlysampled in the simple betweenness centrality calculations. y-axis: Kernelruntime performance, in seconds (log scale), on the 128 node CrayXMT
Fig. 5. Accuracy trade-off between exact and approximate BC. xaxis: The percentage of the total vertices that were randomly sampledin the approximate BC calculations. y-axis: The percent of top kactors present in both exact and approximate BC rankings. Legend:k = 1(�), 5(♦), 10(�), 20( )
memory and unloading results often occupies a majority
of computation time. GraphCT contains a small scripting
interface to amortize I/O time over multiple analysis
passes within a dataset. GraphCT also runs sequentially
on POSIX-like platforms.
A. Kernels
Running multiple analytic kernels over one in-memory
graph requires each kernel to use a common graph data
structure. Some social network analysis software packages
require the user to choose a data representation according
to the structure of the graph and the analysis to be
performed. GraphCT makes no assumptions about the
type or structure being analyzed. The graph is stored
in compressed-sparse row (CSR) format, a common
representation for sparse matrices. The number of vertices
and edges is known when ingesting the data, so the size
of the allocated graph is fixed.
Implemented top-level kernels include marking con-
nected components, calculating statistical distributions
of out-degree and component sizes, extracting k-cores,
marking a breadth-first search from a given vertex of a
given length, finding the per-vertex clustering coefficients,
and ranking vertices according to their k-betweenness
centrality. Provided utility functions convert a directed
graph to an undirected graph or extract a subgraph
induced by a coloring function. Implementing additional
graph kernels is straightforward due to the common data
structure and interface.
After loading the graph into memory and before
running any kernel, the diameter of the graph is estimated
by performing a breadth-first search from 256 randomly
selected source vertices. The diameter is estimated by
four times the longest path distance found in those
searches. The diameter estimate is stored globally for use
in determining the length of queues to allocate in traversal-
based kernels. Users do not need to supply topology
information but may specify an alternate multiplier or
number of samples. Overestimates waste some memory,
while underestimates cause later routines to run out of
space and fail. This determines the lengths of queues and
does not affect accuracy of the kernels.
Graph kernels accumulate results in structures acces-
sible by later kernel functions. Finding all connected
components, extracting components according to their
size, and analyzing those components is a common
sequence. The connected components function returns
the number of components and the coloring, and utility
functions produce the relevant subgraphs to analyze.
B. Scripting Interface
Not every analyst is a C language application developer.
To make GraphCT usable by domain scientists interested
in studying their graphs, GraphCT contains a prototype
scripting interface to the various analytics.
The script is executed sequentially with the first line
reading in a graph data file from disk and the following
lines calling one kernel function each. Kernels that
produce per-vertex data can write the outputs to files
as specified in the command. All other kernels will print
their results to the screen.
The language employs a stack-based “memory” func-
tion, similar to that of a basic calculator. At any time,
the graph that is currently being operated on can be
pushed onto the stack. Another graph, or a subgraph of
the original, can then be analyzed. When ready to discard
590

this graph and return to the previous, the graph can be
recalled.
An example script follows:
read dimacs patents.txtprint diameter 10save graphextract component 1 => comp1.binprint degreeskcentrality 1 256 => k1scores.txtkcentrality 2 256 => k2scores.txtrestore graphextract component 2print degrees
The script reads a DIMACS-formatted file called
patents.txt into memory. The diameter of the graph is ex-
plicitly estimated using breadth first searches originating
from a random selection of 10 percent of the vertices.
The full graph is stored, and then the largest component
is extracted. At the same time, this component is stored
to disk in a binary format called comp1.bin. The degree
distribution statistics from this component are printed
to the screen. k-Betweenness centrality is estimated for
k = 1 on this component using 256 random source
vertices and the resulting scores are written to disk in a
per-vertex manner as k1scores.txt. This is repeated for
k = 2. The full graph is restored in memory and the
second largest component is then extracted. The degree
distribution statistics are produced for this component.
The current implementation contains no loop constructs
or feedback mechanisms. GraphCT reads the script line-
by-line; an external process can monitor the results and
control execution. Simple loop structures are a topic for
future consideration.
C. Performance and Scalability Characteristics
The software implementation of GraphCT was de-
signed from the ground up to take advantage of the
massively multithreaded Cray XMT architecture and
leverage the fine-grained multithreading and low-cost
synchronization primitives in order to achieve high
performance on a variety of sparse graphs. Previously
published experiments establish GraphCT s scalability on
the Cray XMT for social networks [26], [20], [10]. Fig. 6
shows performance of betweenness centrality estimation
on our data sets (Table III) and the much larger follower
graph from Kwak, et al. [22], [23]. The follower graph
from Kwak, et al. contains 61.6 million and 1.47 billionedges. GraphCT required 105 minutes on 128 processor
Cray XMT to estimate betweenness centrality using 256
source vertices. Estimation on an artificial, scale-29 R-
Size = vertices ⋅ edges
Tim
e (s
)
1
10
100
1000
10000
●
4.9s 5.0s
16.6s
33.9s
66.0s
6303.0s
106 108 1010 1012 1014 1016 1018
● #atlflood tweets September 2009H1N1 tweets September 2009All tweets 1 September 2009All tweets 1−9 September 2009All tweets September 2009Twitter follower graph from Kwak, et al.
Fig. 6. Time in seconds for GraphCT to estimate betweenness centralityusing 256 source vertices on a 128-processor Cray XMT. Table IIIgives sizes for the first three data sets. The user interaction graph oftweets from 1-9 Sept. 2009 consists of 4.1 million vertices, 7.1 millionedges; the graph for all of Sept. 2009 consist of 7.2 million verticesand 18.2 million edges. The follower graph from [22], [23] contains61.6 million and 1.47 billion edges.
MAT [7] graph of 537 million vertices and 8.6 billion
edges3 requires 55 minutes, emphasizing a difference
between real-world and artificial data.
A large number of graph datasets consist of plain
text files. One simple example is a DIMACS formatted
graph [2], which is made up of an edge list and an
integer weight for each edge. A single file with millions
of lines of edge list could overwhelm the main memory
on a service node, so GraphCT parses large text files on
the Cray XMT. We copy the file from disk to the main
memory of the Cray XMT and parse the file in parallel
into the internal binary compressed sparse row format. A
1 TiB main memory enables efficient loading and parsing
of much larger text input than does relying on the service
node and out-of-core algorithms.
V. CONCLUSIONS
Analyzing the social interaction graph induced by
public Twitter messages exposes Twitter s use in news
dissemination. Many relationships fall into tree-like
broadcast patterns. A few users are repeated by many.
3R-MAT parameters: A = 0.55, B = C = 0.1, D = 0.25, scale29, edge factor 16
591

Considering direction, bidirectional links are good indi-
cators of conversations even ignoring the time of each
message.
The moderate quality of approximations in Section III
show that more work on sampling is needed. We cur-
rently conjecture that the unguided random sampling in
GraphCT may miss components when the graph is not
connected. Another interesting problem is in quantifying
significance and confidence of approximations over noisy
graph data.
The September 2009 Twitter data also is relatively
small compared to GraphCT s capabilities. The data from
September 2009 has 735 thousand vertices and 1 million
edges, requiring only around 30 MiB of memory in
our na¨ve storage format. The Facebook friend network
consists of over 400 million users. A scale-29 R-MAT [7]
graph of 537 million vertices and 8.6 billion edges
emulates such a network and requires at least 7 GiB
for the basic graph connectivity data without weights
or other generally useful information. Approximating
the centrality on this graph using the 1 TiB Cray XMT
requires 55 minutes using 256 samples. Approximating
centrality similarly on the real-world Kwak, et al. Twitter
data set [22], [23] of 61.6 million vertices and 1.47 billion
edges requires 105 minutes. We are unaware of other
tools for evaluating complex metrics on such large graphs.
The combination of GraphCT and the Cray XMT s
massive multithreading permits exploration of graph data
sets previously considered too massive. GraphCT is freely
available as open source software from our web site and
runs both on the Cray XMT and on POSIX platforms.
During the publishing of this paper, we discovered
(via a re-send of a Twitter message) independent research
also analyzing public Twitter streams [22], [23]. We have
applied GraphCT on the Cray XMT to their data set
to gather performance data and still are analyzing the
graph metric results. Java, et al. [18] in 2007 present
an early work analyzing Twitter that applies relatively
simple analysis to a smaller data set and hypothesizes
more varied use than appears in our research.
ACKNOWLEDGMENTS
This work was supported in part by the CASS-MT
Center led by Pacific Northwest National Laboratory and
NSF Grants CNS-0708307 and IIP-0934114. We thank
Cray for providing their technical support on the Cray
XMT.
REFERENCES
[1] L. A. Adamic and N. Glance, “The political blogosphere andthe 2004 U.S. Election: Divided They Blog,” in InternationalConference on Knowledge Discovery and Data Mining, ser.International Workshop on Link Discovery, vol. 3rd, Chicago,Illinois, 2005, pp. 36–43.
[2] R. Anderson and J. C. Setubal, “Goldberg s algorithm for themaximum ow in perspective: A computational study,” in NetworkFlows and Matching: First DIMACS Implementation Challenge,1993, pp. 1–18.
[3] D. A. Bader, S. Kintali, K. Madduri, and M. Mihail, “Approximat-ing betweenness centrality,” in Proc. 5th Workshop on Algorithmsand Models for the Web-Graph (WAW2007), ser. Lecture Notes inComputer Science, vol. 4863. San Diego, CA: Springer-Verlag,December 2007, pp. 134–137.
[4] V. Batagelj and A. Mrvar, “Pajek - program for large networkanalysis,” Connections, vol. 21, pp. 47–57, 1998.
[5] J. Berry, B. Hendrickson, S. Kahan, and P. Konecny, “Software andalgorithms for graph queries on multithreaded architectures,” inProc. Workshop on Multithreaded Architectures and Applications,Long Beach, CA, March 2007.
[6] U. Brandes, “A faster algorithm for betweenness centrality,” J.Mathematical Sociology, vol. 25, no. 2, pp. 163–177, 2001.
[7] D. Chakrabarti, Y. Zhan, and C. Faloutsos, “R-MAT: A recursivemodel for graph mining,” in Proc. 4th SIAM Intl. Conf. on DataMining (SDM). Orlando, FL: SIAM, Apr. 2004.
[8] T. Coffman, S. Greenblatt, and S. Marcus, “Graph-based tech-nologies for intelligence analysis,” Communications of the ACM,vol. 47, no. 3, pp. 45–47, 2004.
[9] C. D. Corley, D. J. Cook, A. R. Mikler, and K. P. Singh, “Text andstructural data mining of in uenza mentions in web and socialmedia,” Public Health Informatics special issue in InternationalJournal of Environmental Research and Public Health, vol. 7,2010.
[10] D. Ediger, K. Jiang, J. Riedy, and D. A. Bader, “Massivestreaming data analytics: A case study with clustering coefficients,”in Workshop on Multithreaded Architectures and Applications(MTAAP), Atlanta, Georgia, Apr. 2010.
[11] Facebook, “User statistics,” February 2010. [Online]. Available:http://www.facebook.com/press/info.php?statistics
[12] R. Fagin, R. Kumar, and D. Sivakumar, “Comparing top k lists,” inProceedings of the fourteenth annual ACM-SIAM symposium onDiscrete algorithms. Baltimore, Maryland: Society for Industrialand Applied Mathematics, 2003, pp. 28–36.
[13] M. Faloutsos, P. Faloutsos, and C. Faloutsos, “On power-law rela-tionships of the internet topology,” Proceedings of the conferenceon Applications, Dec. 1998.
[14] L. Freeman, “A set of measures of centrality based on between-ness,” Sociometry, vol. 40, no. 1, pp. 35–41, 1977.
[15] D. Gregor and A. Lumsdaine, “Lifting sequential graph algorithmsfor distributed-memory parallel computation,” SIGPLAN Not.,vol. 40, no. 10, pp. 423–437, 2005.
[16] R. Guimera, S. Mossa, A. Turtschi, and L. Amaral, “The world-wide air transportation network: Anomalous centrality, communitystructure, and cities global roles,” Proceedings of the NationalAcademy of Sciences USA, vol. 102, no. 22, pp. 7794–7799, 2005.
[17] R. Hamming, “Error detecting and error correcting codes,” BellSystem Technical Journal, vol. 26, no. 2, pp. 147–160, 1950.
[18] A. Java, X. Song, T. Finin, and B. Tseng, “Why we Twit-ter: understanding microblogging usage and communities,” inWebKDD/SNA-KDD 07: Proceedings of the 9th WebKDD and1st SNA-KDD 2007 workshop on Web mining and social networkanalysis. New York, NY, USA: ACM, 2007, pp. 56–65.
[19] H. Jeong, S. Mason, A.-L. Barabasi, and Z. Oltvai, “Lethalityand centrality in protein networks,” Nature, vol. 411, pp. 41–42,2001.
592

[20] K. Jiang, D. Ediger, and D. A. Bader, “Generalizing k-Betweenness centrality using short paths and a parallel multi-threaded implementation,” in The 38th International Conferenceon Parallel Processing (ICPP 2009), Vienna, Austria, Sep. 2009.
[21] P. Konecny, “Introducing the Cray XMT,” in Proc. Cray UserGroup meeting (CUG 2007). Seattle, WA: CUG Proceedings,May 2007.
[22] H. Kwak, C. Lee, H. Park, and S. Moon, “What is Twitter,a social network or a news media?” in 19th World-WideWeb (WWW) Conference, Raleigh, North Carolina, Apr. 2010.[Online]. Available: http://an.kaist.ac.kr/∼sbmoon/paper/intl-conf/2010-www-twitter.pdf
[23] C. Lee, H. Kwak, H. Park, and S. Moon, “Finding in uentialsbased on the temporal order of information adoption in Twitter,”in 19th World-Wide Web (WWW) Conference, Raleigh, NorthCarolina, Apr. 2010.
[24] J. Leskovec, A. Singh, and J. Kleinberg, “Patterns of in uencein a recommendation network,” in Paci c-Asia Conference onKnowledge Discovery and Data Mining. Springer-Verlag, 2005,pp. 380–389.
[25] F. Liljeros, C. Edling, L. Amaral, H. Stanley, and Y. Aberg, “Theweb of human sexual contacts,” Nature, vol. 411, pp. 907–908,2001.
[26] K. Madduri, D. Ediger, K. Jiang, D. A. Bader, and D. Chavarr´a-Miranda, “A faster parallel algorithm and efficient multithreadedimplementations for evaluating betweenness centrality on massivedatasets,” in Proc. Workshop on Multithreaded Architectures and
Applications (MTAAP 09), Rome, Italy, May 2009.[27] C. Mills, J. Robins, and M. Lipsitch, “Transmissibility of 1918
pandemic in uenza,” Nature, 2004.[28] A. Mislove, M. Marcon, K. P. Gummadi, P. Druschel, and
B. Bhattacharjee, “Measurement and analysis of online socialnetworks,” in IMC 07: Proceedings of the 7th ACM SIGCOMMconference on Internet measurement. New York, NY, USA:ACM, 2007, pp. 29–42.
[29] M. Newman, “The structure and function of complex networks,”SIAM Review, vol. 45, no. 2, pp. 167–256, 2003.
[30] ——, “Power laws, Pareto distributions and Zipf s law,” Contem-porary Physics, vol. 46, pp. 323–351, 2005.
[31] OpenMP Application Program Interface; Version 3.0, OpenMPArchitecture Review Board, May 2008.
[32] M. Ringenburg and S.-E. Choi, “Optimizing loop-level parallelismin Cray XMTTM applications,” in Cray User s Group, May 2009.
[33] J. G. Siek, L.-Q. Lee, and A. Lumsdaine, The Boost GraphLibrary: user guide and reference manual. Boston, MA, USA:Addison-Wesley Longman Publishing Co., Inc., 2002.
[34] “Weblog crawling provided by Spinn3r,” last accessed 15February 2010. [Online]. Available: http://www.spinn3r.com
[35] “September ooding information and data,” last accessed 20January, 2010. [Online]. Available: http://ga.water.usgs.gov/
ooding-sept09.html[36] V. Volkov and J. W. Demmel, “Benchmarking GPUs to tune dense
linear algebra,” in SC 08: Proceedings of the 2008 ACM/IEEEconference on Supercomputing. Piscataway, NJ, USA: IEEEPress, 2008, pp. 1–11.
593
Copyright © 2022 FDOKUMEN