
Twitter Announces Third Quarter 2021 Results
12
October 26, 2021 Twitter Announces Third Quarter 2021 Results Reports Total Revenue of $1.28 Billion and 13% Year-over-Year Growth in Monetizable Daily Active Usage (mDAU) SAN FRANCISCO, California - Twitter, Inc. (NYSE: TWTR) today announced financial results for its third quarter 2021. “I am proud of our third quarter results. We’re improving personalization, facilitating conversation, delivering relevant news, and finding new ways to help people get paid on Twitter,” said Jack Dorsey, Twitter’s CEO. “Average monetizable DAU (mDAU) reached 211 million, up 13% year over year in Q3, accelerating from 11% year over year growth in Q2, driven by ongoing product improvements and global conversation around current events.” “Our focus is paying off, and we are pleased with our performance in the third quarter, with revenue up 37% year- over-year, reflecting strength across all major products and geographies,” said Ned Segal, Twitter’s CFO. “We continued to drive increased value for our advertisers thanks to revenue product innovation, including progress on our brand and direct response offerings, strong sales execution, and a broad increase in advertiser demand. These factors contributed to 41% year-over-year growth in ad revenue in Q3.” Third Quarter 2021 Operational and Financial Highlights Except as otherwise stated, all financial results discussed below are presented in accordance with generally accepted accounting principles in the United States of America, or GAAP. As supplemental information, we have provided certain non-GAAP financial measures in this press release’s supplemental tables, and such supplemental tables include a reconciliation of these non-GAAP measures to our GAAP results. The sum of individual metrics may not always equal total amounts indicated due to rounding. ● Q3 revenue totaled $1.28 billion, an increase of 37% year over year. ○ Advertising revenue totaled $1.14 billion, an increase of 41% year over year. ■ Total ad engagements increased 6% year over year. ■ Cost per engagement (CPE) increased 33% year over year. ○ Data licensing and other revenue totaled $143 million, an increase of 12% year over year. ○ US revenue totaled $742 million, an increase of 45% year over year. ○ International revenue totaled $542 million, an increase of 28% year over year, or 27% on a constant currency basis. ● Q3 operating loss of $743 million, or an operating margin of -58%, includes a one-time litigation-related net charge of $766 million 1 , as well as ongoing investments. Adjusted operating income, which excludes the one-time litigation-related net charge, was $23 million reflecting an adjusted operating margin of 2%. This compares to operating income of $56 million, representing an operating margin of 6% in the same period of the previous year. 1 Includes a charge of $809.5 million to settle a shareholder class action lawsuit partially offset by an insurance recovery of $5.8 million. In addition, during the quarter we received insurance proceeds of $38.0 million related to the settlement of separate earlier shareholder derivative lawsuits.
-
Upload
khangminh22 -
Category
Documents
-
view
2 -
download
0
Transcript of Twitter Announces Third Quarter 2021 Results

October 26, 2021
Twitter Announces Third Quarter 2021 Results
Reports Total Revenue of $1.28 Billion and 13% Year-over-Year Growth in Monetizable Daily Active Usage (mDAU)
SAN FRANCISCO, California - Twitter, Inc. (NYSE: TWTR) today announced financial results for its third quarter 2021. “I am proud of our third quarter results. We’re improving personalization, facilitating conversation, delivering relevant news, and finding new ways to help people get paid on Twitter,” said Jack Dorsey, Twitter’s CEO. “Average monetizable DAU (mDAU) reached 211 million, up 13% year over year in Q3, accelerating from 11% year over year growth in Q2, driven by ongoing product improvements and global conversation around current events.” “Our focus is paying off, and we are pleased with our performance in the third quarter, with revenue up 37% year-over-year, reflecting strength across all major products and geographies,” said Ned Segal, Twitter’s CFO. “We continued to drive increased value for our advertisers thanks to revenue product innovation, including progress on our brand and direct response offerings, strong sales execution, and a broad increase in advertiser demand. These factors contributed to 41% year-over-year growth in ad revenue in Q3.” Third Quarter 2021 Operational and Financial Highlights Except as otherwise stated, all financial results discussed below are presented in accordance with generally accepted accounting principles in the United States of America, or GAAP. As supplemental information, we have provided certain non-GAAP financial measures in this press release’s supplemental tables, and such supplemental tables include a reconciliation of these non-GAAP measures to our GAAP results. The sum of individual metrics may not always equal total amounts indicated due to rounding.
● Q3 revenue totaled $1.28 billion, an increase of 37% year over year. ○ Advertising revenue totaled $1.14 billion, an increase of 41% year over year.
■ Total ad engagements increased 6% year over year. ■ Cost per engagement (CPE) increased 33% year over year.
○ Data licensing and other revenue totaled $143 million, an increase of 12% year over year. ○ US revenue totaled $742 million, an increase of 45% year over year. ○ International revenue totaled $542 million, an increase of 28% year over year, or 27% on a
constant currency basis.
● Q3 operating loss of $743 million, or an operating margin of -58%, includes a one-time litigation-related net charge of $766 million1, as well as ongoing investments. Adjusted operating income, which excludes the one-time litigation-related net charge, was $23 million reflecting an adjusted operating margin of 2%. This compares to operating income of $56 million, representing an operating margin of 6% in the same period of the previous year.
1 Includes a charge of $809.5 million to settle a shareholder class action lawsuit partially offset by an insurance recovery of $5.8 million. In addition, during the quarter we received insurance proceeds of $38.0 million related to the settlement of separate earlier shareholder derivative lawsuits.

● Stock-based compensation (SBC) expense grew 42% year over year to $164 million and was approximately 13% of total revenue.
● Q3 net loss was $537 million, representing a net margin of -42% and diluted EPS of ($0.67). This compares to a net income of $29 million, a net margin of 3%, and diluted EPS of $0.04 in the same period of the previous year.
● Net cash provided by operating activities in the quarter was $389 million, compared to $215 million in the same period last year. Capital expenditures totaled $409 million, compared to $289 million in the same period last year, driven by infrastructure investments in data center build-outs to support audience growth and product innovation.
● Average monetizable daily active usage (mDAU) was 211 million for Q3, compared to 187 million in the same period of the previous year and 206 million in the previous quarter.
○ Average US mDAU was 37 million for Q3, compared to 36 million in the same period of the previous year and 37 million in the previous quarter.
○ Average international mDAU was 174 million for Q3, compared to 152 million in the same period of the previous year and 169 million in the previous quarter.
Outlook We continue to expect total revenue to grow faster than expenses in 2021 (excluding the litigation settlement announced in Q3), and we expect to continue our investment posture as we enter next year. Our 30%+ headcount growth in 2021, with annual merit increases, and other investments we made in 2021, including our new data center, will flow into annual expenses for 2022, likely resulting in a mid-20% increase in total expenses next year prior to hiring any more people or making additional investments during 2022. Before providing 2022 guidance in February, we wanted to share some additional information regarding the sale of MoPub. The sale is expected to close in Q1, and while the associated product, engineering, and go-to-market teams are largely expected to shift to direct response, SMB, and commerce upon closing, it will take time for their work to deliver results. As a result, we do not expect to recoup the total revenue loss associated with the sale of MoPub in 2022, which is estimated to be between $200 and $250 million. Despite some expected 2022 revenue loss, there are no changes to our goal of generating $7.5 billion or more of annual revenue in 2023 with an increased focus and additional resources working on increasing our market share within the ~$150 billion and growing addressable market for ads on our website and apps. Our outlook for Q4’21, which includes MoPub, is as follows:
● Total revenue is expected to be between $1.5 billion and $1.6 billion. ● GAAP operating income is expected to be between $130 million and $180 million. ● Capital expenditures are expected to be between $85 million and $135 million. ● Stock-based compensation expense is expected to be approximately $175 million.
Note that our outlook for Q4 reflects foreign exchange rates as of October 2021. For more information regarding the non-GAAP financial measures discussed in this press release, please see "Non-GAAP Financial Measures" and the reconciliations of these non-GAAP financial measures to the most directly comparable financial measures calculated in accordance with GAAP below.

Appendix Third Quarter 2021 Webcast and Conference Call Details Twitter will host a conference call today, Tuesday, October 26, 2021, at 3pm Pacific Time (6pm Eastern Time) to discuss financial results for the third quarter of 2021. The company will be following the conversation about the earnings announcement on Twitter. To have your questions considered during the Q&A, Tweet your question to @TwitterIR using $TWTR. To listen to a live audio webcast, please visit the company’s Investor Relations page at investor.twitterinc.com. Twitter has used, and intends to continue to use, its Investor Relations website and the Twitter accounts of @jack, @nedsegal, @Twitter, and @TwitterIR as means of disclosing material nonpublic information and for complying with its disclosure obligations under Regulation FD. Fourth Quarter Earnings Release Details Twitter expects to release financial results for the fourth quarter and full year of 2021 on February 10, 2022, after market close. Twitter will host a conference call on the same day to discuss these financial results at 3pm Pacific Time (6pm Eastern Time). About Twitter, Inc. (NYSE: TWTR) Twitter (NYSE: TWTR) is what’s happening and what people are talking about right now. To learn more, visit about.twitter.com and follow @Twitter. Let’s talk. A Note About Metrics Twitter defines monetizable daily active usage or users (mDAU) as people, organizations, or other accounts who logged in or were otherwise authenticated and accessed Twitter on any given day through twitter.com or Twitter applications that are able to show ads. Average mDAU for a period represents the number of mDAU on each day of such period divided by the number of days for such period. Changes in mDAU are a measure of changes in the size of our daily logged in or otherwise authenticated active total accounts. To calculate the year-over-year change in mDAU, we subtract the average mDAU for the three months ended in the previous year from the average mDAU for the same three months ended in the current year and divide the result by the average mDAU for the three months ended in the previous year. Additionally, our calculation of mDAU is not based on any standardized industry methodology and is not necessarily calculated in the same manner or comparable to similarly titled measures presented by other companies. Similarly, our measures of mDAU growth and engagement may differ from estimates published by third parties or from similarly titled metrics of our competitors due to differences in methodology. The numbers of mDAU presented in our earnings materials are based on internal company data. While these numbers are based on what we believe to be reasonable estimates for the applicable period of measurement, there are inherent challenges in measuring usage and engagement across our large number of total accounts around the world. Furthermore, our metrics may be impacted by our information quality efforts, which are our overall efforts to reduce malicious activity on the service, inclusive of spam, malicious automation, and fake accounts. For example, there are a number of false or spam accounts in existence on our platform. We have performed an internal review of a sample of accounts and estimate that the average of false or spam accounts during the third quarter of 2021 represented fewer than 5% of our mDAU during the quarter. The false or spam accounts for a period represents the average of false or spam accounts in the samples during each monthly analysis period during the quarter. In making this determination, we applied significant judgment, so our estimation of false or spam accounts may not accurately represent the actual number of such accounts, and the actual number of false or spam accounts could be higher than we have estimated. We are continually seeking to improve our ability to estimate the total number of spam accounts and eliminate them from the calculation of our mDAU, and have made improvements in our spam detection capabilities that have resulted in the suspension of a large number of spam, malicious automation, and fake accounts. We intend to continue to make such improvements. After we determine an account is spam, malicious automation, or fake, we stop counting it in our mDAU, or other related metrics. We also treat multiple accounts held by a single person or organization as multiple mDAU because we permit people and organizations to have more than one account. Additionally, some accounts used by organizations are used by many people within the organization. As such, the calculations of our mDAU may not accurately reflect the actual number of people or organizations using our platform.

In addition, geographic location data collected for purposes of reporting the geographic location of our mDAU is based on the IP address or phone number associated with the account when an account is initially registered on Twitter. The IP address or phone number may not always accurately reflect a person’s actual location at the time they engaged with our platform. For example, someone accessing Twitter from the location of the proxy server that the person connects to rather than from the person’s actual location. We regularly review and may adjust our processes for calculating our internal metrics to improve their accuracy. Forward-Looking Statements This press release contains forward-looking statements within the meaning of Section 27A of the Securities Act of 1933 and Section 21E of the Securities Exchange Act of 1934. Forward-looking statements generally relate to future events or Twitter's future financial or operating performance. In some cases, you can identify forward-looking statements because they contain words such as "may," "will," "should," "expects," "plans," "anticipates," "going to," "could," "intends," "target," "projects," "contemplates," "believes," "estimates," "predicts," "potential," or "continue," or the negative of these words or other similar terms or expressions that concern Twitter's expectations, strategy, priorities, plans, or intentions. Forward-looking statements in this press release include, but are not limited to, statements regarding Twitter’s future financial and operating performance, including its growth opportunities and its outlook and guidance and assumptions underlying such outlook and guidance; the impact of the COVID-19 pandemic and the timing of recovery from the pandemic on advertiser demand across Twitter’s platform and on Twitter’s operating results; the timing and impact of Twitter’s proposed sale of MoPub, including revenue impact, and Twitter’s expectations regarding future headcount growth and other costs and expenses, including its SBC expenses. Twitter's expectations and beliefs regarding these matters may not materialize, and actual results in future periods are subject to risks and uncertainties, including changes in our plans or assumptions, that could cause actual results to differ materially from those projected. These risks include the possibility that: the COVID-19 pandemic and related impacts will continue to adversely impact our business, financial condition, and operating results and the achievement of our strategic objectives, as well as the markets in which we operate and worldwide and regional economies; Twitter's total accounts and engagement do not grow or decline; Twitter’s strategies, priorities, or plans take longer to execute than anticipated; Twitter's new products and product features do not meet expectations or fail to drive mDAU growth; advertisers continue to reduce or discontinue their spending on Twitter; data partners reduce or discontinue their purchases of data licenses from Twitter; Twitter experiences expenses that exceed its expectations; and Twitter’s expectations regarding its divestiture do not materialize. The forward-looking statements contained in this press release are also subject to other risks and uncertainties, including those more fully described in Twitter's Annual Report on Form 10-K for the fiscal year ended December 31, 2020, and Twitter's Quarterly Report on Form 10-Q for the fiscal quarter ended June 30, 2021, each filed with the Securities and Exchange Commission. Additional information will also be set forth in Twitter's Quarterly Report on Form 10-Q for the fiscal quarter ended September 30, 2021. The forward-looking statements in this press release are based on information available to Twitter as of the date hereof, and Twitter disclaims any obligation to update any forward-looking statements, except as required by law. Non-GAAP Financial Measures To supplement Twitter's financial information presented in accordance with generally accepted accounting principles in the United States of America, or GAAP, Twitter considers certain financial measures that are not prepared in accordance with GAAP, including revenues excluding foreign exchange effect, which we refer to as on a constant currency basis, adjusted income (loss) from operations, adjusted operating margin, non-GAAP income (loss) before income taxes, non-GAAP provision for (benefit from) income taxes, non-GAAP net income (loss), non-GAAP diluted net income (loss) per share, adjusted EBITDA, non-GAAP costs and expenses, adjusted net income (loss), adjusted diluted net income (loss) per share, and adjusted free cash flow. In order to present revenues on a constant currency basis for the fiscal quarter ended September 30, 2021, Twitter translated the applicable measure using the prior year's monthly exchange rates for its settlement currencies other than the US dollar. We have presented adjusted income (loss) from operations solely to exclude the one time net charge related to litigation in the three and nine months ended September 30, 2021, and no other adjustments were made in the calculation of this measure. Adjusted operating margin is calculated by dividing adjusted operating income (loss) by GAAP revenue. Twitter defines non-GAAP income (loss) before income taxes as income (loss) before income taxes adjusted to exclude stock-based compensation expense, amortization of acquired intangible assets, non-
cash interest expense related to convertible notes, non-cash expense related to acquisitions, impairment (gain) on investments in privately held companies, restructuring charges, and one-time non-recurring gain, if any; Twitter defines non-GAAP provision for (benefit from) income taxes as the current and deferred income tax expense commensurate with the non-GAAP measure of profitability using the estimated annual effective tax rate, which is dependent on the jurisdictional mix of earnings; and Twitter defines non-GAAP net income (loss) as net income (loss) adjusted to exclude stock-based compensation expense, amortization of acquired intangible assets, non-cash interest expense related to convertible notes, non-cash expense related to acquisitions, impairment (gain) on investments in privately held companies, restructuring charges, and one-time non-recurring gain, if any, and adjustment to income tax expense based on the non-GAAP measure of profitability using the estimated annual effective tax rate, which is dependent on the jurisdictional mix of earnings. Non-GAAP diluted net income (loss) per share is calculated by dividing non-GAAP net income (loss) by the non-GAAP diluted shares. When the convertible notes are dilutive, interest expense, net of tax, is added back to non-GAAP net income to calculate non-GAAP diluted net income per share. The non-GAAP diluted shares are GAAP diluted shares plus the potential additional common stock impact of the convertible senior notes that were anti-dilutive for the GAAP diluted share calculation. Twitter defines adjusted EBITDA as net income (loss) adjusted to exclude stock-based compensation expense, depreciation and amortization expense, interest and other expense, net, provision for (benefit from) income taxes, restructuring charges, and one-time non-recurring gain, if any. Twitter defines non-GAAP costs and expenses as total costs and expenses adjusted to exclude stock-based compensation expense, amortization of acquired intangible assets, non-cash expense related to acquisitions, restructuring charges, and one-time non-recurring gain, if any. We have presented adjusted net income (loss) solely to exclude the income tax provision from the establishment of a valuation allowance against the deferred tax assets in the nine months ended September 30, 2020, and no other adjustments were made in the calculation of this measure. Adjusted diluted net income (loss) per share is calculated by dividing adjusted net income (loss) by the GAAP diluted shares. When the convertible notes are dilutive, interest expense, net of tax, is added back to adjusted net income to calculate adjusted diluted net income per share. Adjusted free cash flow is GAAP net cash provided by operating activities less capital expenditures (i.e., purchases of property and equipment including equipment purchases that were financed through finance leases, less proceeds received from the disposition of property and equipment). Twitter is presenting these non-GAAP financial measures to assist investors in seeing Twitter's operating results through the eyes of management, and because it believes that these measures provide an additional tool for investors to use in comparing Twitter's core business operating results over multiple periods with other companies in its industry.
Twitter believes that revenues on a constant currency basis, adjusted income (loss) from operations, adjusted operating margin, non-GAAP income (loss) before income taxes, non-GAAP provision for (benefit from) income taxes, non-GAAP net income (loss), non-GAAP diluted net income (loss) per share, adjusted EBITDA, non-GAAP costs and expenses, adjusted net income (loss), and adjusted diluted net income (loss) per share provide useful information about its operating results, enhance the overall understanding of Twitter's past performance and future prospects, and allow for greater transparency with respect to key metrics used by Twitter's management in its financial and operational decision-making. Twitter uses these measures to establish budgets and operational goals for managing its business and evaluating its performance.
Twitter believes that revenues on a constant currency basis is a useful metric that facilitates comparison to its historical performance. Twitter believes that adjusted income (loss) from operations, adjusted operating margin, non-GAAP net income (loss), non-GAAP diluted net income (loss) per share, adjusted EBITDA, non-GAAP costs and expenses, adjusted net income (loss), and adjusted diluted net income (loss) per share help identify underlying trends in its business that could otherwise be masked by expenses and one-time gains or charges, or the effects of the tax provisions from the establishment of a valuation allowance against deferred tax assets described above, which are non-operating expenses.
Twitter is also presenting adjusted income (loss) from operations and adjusted operating margin to better reflect operating performance and improve comparability with past periods.
In addition, Twitter believes that adjusted free cash flow provides useful information to management and investors about the amount of cash from operations and that it is typically a more conservative measure of cash flows.

However, adjusted free cash flow does not necessarily represent funds available for discretionary use and is not necessarily a measure of its ability to fund its cash needs.
These non-GAAP financial measures should not be considered in isolation from, or as a substitute for, financial information prepared in accordance with GAAP. These non-GAAP financial measures are not based on any standardized methodology prescribed by GAAP and are not necessarily comparable to similarly titled measures presented by other companies.
Contacts Investors: [email protected] Press: [email protected]

TWITTER, INC. CONDENSED CONSOLIDATED BALANCE SHEETS
(In thousands) (Unaudited)
September 30, 2021 December 31, 2020 Assets Current assets:
Cash and cash equivalents $ 3,473,865 $ 1,988,429
Short-term investments 3,937,447 5,483,873
Accounts receivable, net 1,014,208 1,041,743
Prepaid expenses and other current assets 194,914 123,063
Assets held for sale 28,800 —
Total current assets 8,649,234 8,637,108
Property and equipment, net 2,053,480 1,493,794
Operating lease right-of-use assets 1,115,929 930,139 Intangible assets, net 46,702 58,338
Goodwill 1,293,826 1,312,346
Deferred tax assets, net 1,133,816 796,326
Other assets 296,358 151,039
Total assets $ 14,589,345 $ 13,379,090
Liabilities and stockholders’ equity Current liabilities:
Accounts payable $ 207,912 $ 194,281
Accrued and other current liabilities (1) 1,688,768 663,532
Convertible notes, short-term — 917,866
Operating lease liabilities, short-term 218,301 177,147
Total current liabilities 2,114,981 1,952,826
Convertible notes, long-term 3,556,934 1,875,878
Senior notes, long-term 693,744 692,994 Operating lease liabilities, long-term 980,764 819,748 Deferred and other long-term tax liabilities, net 40,009 31,463
Other long-term liabilities 30,282 36,099
Total liabilities 7,416,714 5,409,008
Stockholders’ equity: Common stock 4 4
Additional paid-in capital 8,468,708 9,167,138
Treasury stock (5,291) (5,297)
Accumulated other comprehensive loss (106,794) (66,094)
Accumulated deficit (1,183,996) (1,125,669)
Total stockholders’ equity 7,172,631 7,970,082
Total liabilities and stockholders’ equity $ 14,589,345 $ 13,379,090
(1) In the third quarter of 2021, we entered into an agreement to settle a shareholder class action lawsuit and recorded an accrual of $809.5 million, which is included in accrued and other current liabilities on the consolidated balance sheet as of September 30, 2021.

TWITTER, INC. CONDENSED CONSOLIDATED STATEMENTS OF OPERATIONS
(In thousands, except per share data) (Unaudited)
Three Months Ended
September 30, Nine Months Ended
September 30, 2021 2020 2021 2020
Revenue $ 1,283,817 $ 936,233 $ 3,510,262 $ 2,427,308
Costs and expenses Cost of revenue 484,479 361,388 1,282,419 933,464
Research and development 324,252 208,877 874,820 625,071
Sales and marketing 301,078 215,285 837,572 643,858
General and administrative (1) 150,855 94,576 409,864 450,181
Litigation settlement, net (2) 765,701 — 765,701 —
Total costs and expenses 2,026,365 880,126 4,170,376 2,652,574
Income (loss) from operations (742,548) 56,107 (660,114) (225,266)
Interest expense (13,284) (39,614) (40,362) (112,712)
Interest income 8,125 17,167 28,328 75,077
Other income (expense), net 20,625 (3,977) 76,370 (12,057)
Income (loss) before income taxes (727,082) 29,683 (595,778) (274,958)
Provision (benefit) for income taxes (190,325) 1,024 (192,675) 1,082,784
Net income (loss) $ (536,757) $ 28,659 $ (403,103) $ (1,357,742)
Net income (loss) per share: Basic $ (0.67) $ 0.04 $ (0.51) $ (1.73)
Diluted $ (0.67) $ 0.04 $ (0.51) $ (1.73)
Weighted-average shares used to compute net income (loss) per share:
Basic 797,985 790,827 796,775 785,788
Diluted 797,985 806,383 796,775 785,788
(1) In the second quarter of 2020, we recorded $150 million in general and administrative expenses in the consolidated statements of operations related to a draft complaint from the Federal Trade Commission. (2) In the third quarter of 2021, we entered into an agreement to settle a shareholder class action lawsuit and recorded a charge of $809.5 million partially offset by an insurance recovery of $5.8 million. In addition, during the quarter we received insurance proceeds of $38.0 million related to the settlement of separate earlier shareholder derivative lawsuits.

TWITTER, INC. CONDENSED CONSOLIDATED STATEMENTS OF CASH FLOWS
(In thousands) (Unaudited)
Three Months Ended September 30, Nine Months Ended September 30, 2021 2020 2021 2020 Cash flows from operating activities
Net income (loss) $ (536,757) $ 28,659 $ (403,103) $ (1,357,742) Adjustments to reconcile net income (loss) to net cash provided by operating activities:
Depreciation and amortization expense 133,448 121,983 399,312 366,469 Stock-based compensation expense 164,295 115,969 453,370 346,748 Amortization of discount on convertible notes — 26,673 — 74,733 Bad debt expense 2,043 (634) 2,434 16,861 Deferred income taxes (199,772) (6,345) (222,789) (32,382) Deferred tax assets valuation allowance establishment — — — 1,101,374 Impairment (gain) on investments in privately-held companies (24,900) 339 (76,794) 8,842 Other adjustments 54 (2,571) 1,521 (7,756) Changes in assets and liabilities, net of assets acquired and liabilities assumed from acquisitions:
Accounts receivable (69,139) (136,469) 19,830 97,812 Prepaid expenses and other assets (33,874) (27,722) (78,394) (24,765) Operating lease right-of-use assets 55,842 43,595 159,891 121,712 Accounts payable 17,883 20,512 20,701 (5,722) Accrued and other liabilities 929,848 71,922 1,029,091 76,497 Operating lease liabilities (49,991) (41,124) (143,939) (120,111)
Net cash provided by operating activities 388,980 214,787 1,161,131 662,570 Cash flows from investing activities
Purchases of property and equipment (411,227) (290,746) (871,603) (577,829) Proceeds from sales of property and equipment 2,076 1,910 6,913 5,815 Purchases of marketable securities (619,318) (1,981,219) (2,785,014) (5,103,983) Proceeds from maturities of marketable securities 1,103,717 1,085,761 3,188,254 3,566,895 Proceeds from sales of marketable securities 48,820 66,718 1,141,614 925,387 Purchases of investments in privately-held companies (1,692) (2,500) (33,189) (3,839) Investments in Finance Justice Fund (29,300) — (52,000) — Business combinations, net of cash acquired — — (22,937) (34,285) Other investing activities — — (8,385) (11,050)
Net cash provided by (used in) investing activities 93,076 (1,120,076) 563,653 (1,232,889) Cash flows from financing activities
Proceeds from issuance of convertible notes — — 1,437,500 1,000,000 Purchases of convertible note hedges — — (213,469) — Proceeds from issuance of warrants concurrent with note hedges — — 161,144 — Debt issuance costs — — (16,769) (14,662) Repayment of convertible notes (954,000) — (954,000) — Repurchases of common stock (169,457) — (664,821) — Taxes paid related to net share settlement of equity awards (6,215) (3,726) (21,712) (18,344) Payments of finance lease obligations — (4,117) (565) (20,573) Proceeds from exercise of stock options 51 31 2,037 454 Proceeds from issuances of common stock under employee stock purchase plan — — 39,531 34,395
Net cash provided by (used in) financing activities (1,129,621) (7,812) (231,124) 981,270 Net increase (decrease) in cash, cash equivalents and restricted cash (647,565) (913,101) 1,493,660 410,951 Foreign exchange effect on cash, cash equivalents and restricted cash (4,392) 924 (8,391) (14,854) Cash, cash equivalents and restricted cash at beginning of period 4,148,502 3,135,940 2,011,276 1,827,666 Cash, cash equivalents and restricted cash at end of period $ 3,496,545 $ 2,223,763 $ 3,496,545 $ 2,223,763 Supplemental disclosures of non-cash investing and financing activities
Common stock issued in connection with acquisitions $ — $ — $ — $ 1,312 Changes in accrued property and equipment purchases $ (144,550) $ 63,400 $ (6,293) $ 103,649
Reconciliation of cash, cash equivalents and restricted cash as shown in the consolidated statements of cash flows
Cash and cash equivalents $ 3,473,865 $ 2,201,073 $ 3,473,865 $ 2,201,073 Restricted cash included in prepaid expenses and other current assets 3,156 2,251 3,156 2,251 Restricted cash included in other assets 19,524 20,439 19,524 20,439 Total cash, cash equivalents and restricted cash $ 3,496,545 $ 2,223,763 $ 3,496,545 $ 2,223,763

TWITTER, INC. RECONCILIATION OF GAAP TO NON-GAAP FINANCIAL MEASURES
(In thousands, except per share data) (Unaudited)
Three Months Ended Nine Months Ended September 30, September 30, 2021 2020 2021 2020 Non-GAAP net income (loss): Net income (loss) (1) (2) $ (536,757) $ 28,659 $ (403,103) $ (1,357,742) Exclude: Provision (benefit) for income taxes (190,325) 1,024 (192,675) 1,082,784
Income (loss) before income taxes (727,082) 29,683 (595,778) (274,958) Exclude:
Stock-based compensation expense 164,295 115,969 453,370 346,748 Amortization of acquired intangible assets 10,808 5,424 30,647 17,984 Non-cash interest expense related to convertible notes (3) — 26,673 — 74,733 Impairment (gain) on investments in privately-held companies (24,900) 339 (76,794) 8,842
Non-GAAP income (loss) before income taxes (576,879) 178,088 (188,555) 173,349 Non-GAAP provision (benefit) for income taxes (4) (142,461) 26,713 (69,867) 1,174,944
Non-GAAP net income (loss) $ (434,418) $ 151,375 $ (118,688) $ (1,001,595)
Non-GAAP diluted net income (loss) per share: Non-GAAP net income (loss) $ (434,418) $ 151,375 $ (118,688) $ (1,001,595) GAAP basic shares 797,985 790,827 796,775 785,788
Dilutive securities (5) — 15,556 — — Non-GAAP diluted shares (6) 797,985 806,383 796,775 785,788 Non-GAAP diluted net income (loss) per share $ (0.54) $ 0.19 $ (0.15) $ (1.27)
Adjusted EBITDA: Net income (loss) (1) (2) $ (536,757) $ 28,659 $ (403,103) $ (1,357,742) Exclude:
Stock-based compensation expense 164,295 115,969 453,370 346,748 Depreciation and amortization expense 133,448 121,983 399,312 366,469 Interest and other expense (income), net (15,466) 26,424 (64,336) 49,692 Provision (benefit) for income taxes (190,325) 1,024 (192,675) 1,082,784
Adjusted EBITDA $ (444,805) $ 294,059 $ 192,568 $ 487,951
Stock-based compensation expense by function: Cost of revenue $ 11,627 $ 8,581 $ 33,479 $ 23,333 Research and development 101,515 66,111 269,983 204,686 Sales and marketing 27,105 25,550 84,647 73,572 General and administrative 24,048 15,727 65,261 45,157
Total stock-based compensation expense $ 164,295 $ 115,969 $ 453,370 $ 346,748
Amortization of acquired intangible assets by function: Cost of revenue $ 7,587 $ 5,424 $ 21,059 $ 17,984 Research and development 3,071 — 9,188 — Sales and marketing 150 — 400 —
Total amortization of acquired intangible assets $ 10,808 $ 5,424 $ 30,647 $ 17,984
Non-GAAP costs and expenses: Total costs and expenses $ 2,026,365 $ 880,126 $ 4,170,376 $ 2,652,574 Exclude:
Stock-based compensation expense (164,295) (115,969) (453,370) (346,748) Amortization of acquired intangible assets (10,808) (5,424) (30,647) (17,984)
Total non-GAAP costs and expenses $ 1,851,262 $ 758,733 $ 3,686,359 $ 2,287,842
TWITTER, INC. RECONCILIATION OF GAAP TO NON-GAAP FINANCIAL MEASURES
(In thousands, except per share data) (Unaudited) (Continued)
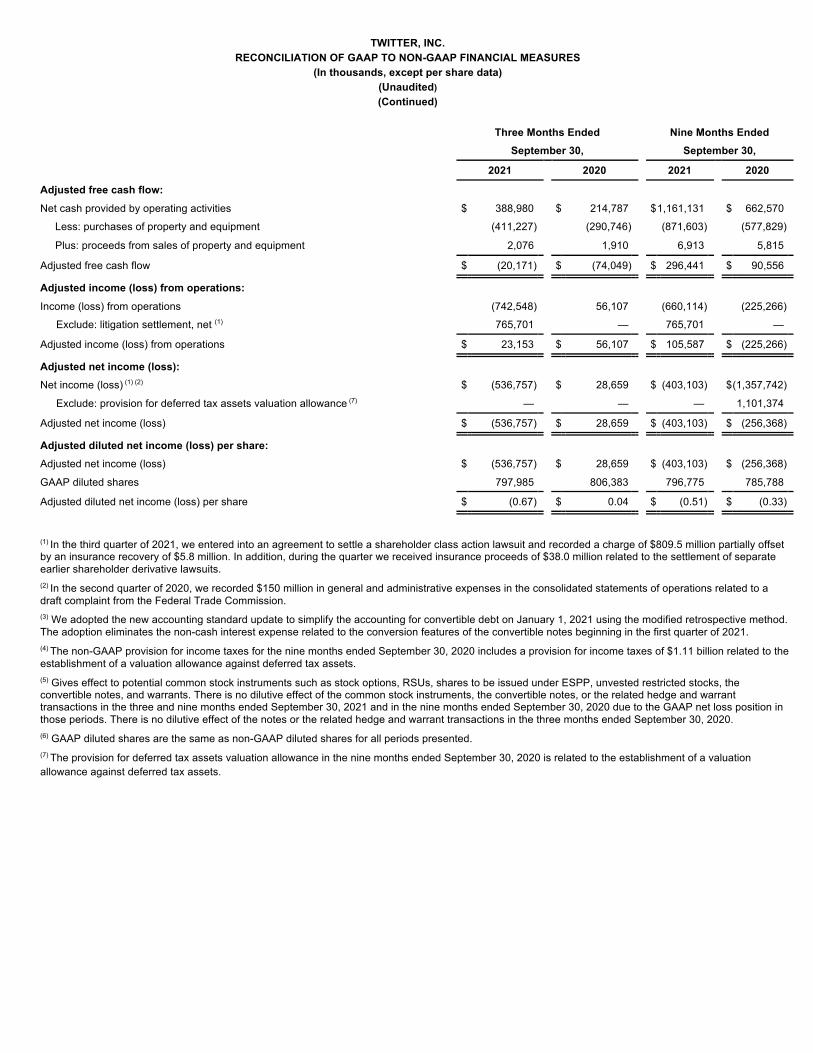
Three Months Ended Nine Months Ended September 30, September 30, 2021 2020 2021 2020 Adjusted free cash flow: Net cash provided by operating activities $ 388,980 $ 214,787 $ 1,161,131 $ 662,570
Less: purchases of property and equipment (411,227) (290,746) (871,603) (577,829)
Plus: proceeds from sales of property and equipment 2,076 1,910 6,913 5,815
Adjusted free cash flow $ (20,171) $ (74,049) $ 296,441 $ 90,556
Adjusted income (loss) from operations: Income (loss) from operations (742,548) 56,107 (660,114) (225,266)
Exclude: litigation settlement, net (1) 765,701 — 765,701 —
Adjusted income (loss) from operations $ 23,153 $ 56,107 $ 105,587 $ (225,266)
Adjusted net income (loss): Net income (loss) (1) (2) $ (536,757) $ 28,659 $ (403,103) $ (1,357,742)
Exclude: provision for deferred tax assets valuation allowance (7) — — — 1,101,374
Adjusted net income (loss) $ (536,757) $ 28,659 $ (403,103) $ (256,368)
Adjusted diluted net income (loss) per share: Adjusted net income (loss) $ (536,757) $ 28,659 $ (403,103) $ (256,368)
GAAP diluted shares 797,985 806,383 796,775 785,788
Adjusted diluted net income (loss) per share $ (0.67) $ 0.04 $ (0.51) $ (0.33)
(1) In the third quarter of 2021, we entered into an agreement to settle a shareholder class action lawsuit and recorded a charge of $809.5 million partially offset by an insurance recovery of $5.8 million. In addition, during the quarter we received insurance proceeds of $38.0 million related to the settlement of separate earlier shareholder derivative lawsuits. (2) In the second quarter of 2020, we recorded $150 million in general and administrative expenses in the consolidated statements of operations related to a draft complaint from the Federal Trade Commission. (3) We adopted the new accounting standard update to simplify the accounting for convertible debt on January 1, 2021 using the modified retrospective method. The adoption eliminates the non-cash interest expense related to the conversion features of the convertible notes beginning in the first quarter of 2021. (4) The non-GAAP provision for income taxes for the nine months ended September 30, 2020 includes a provision for income taxes of $1.11 billion related to the establishment of a valuation allowance against deferred tax assets. (5) Gives effect to potential common stock instruments such as stock options, RSUs, shares to be issued under ESPP, unvested restricted stocks, the convertible notes, and warrants. There is no dilutive effect of the common stock instruments, the convertible notes, or the related hedge and warrant transactions in the three and nine months ended September 30, 2021 and in the nine months ended September 30, 2020 due to the GAAP net loss position in those periods. There is no dilutive effect of the notes or the related hedge and warrant transactions in the three months ended September 30, 2020. (6) GAAP diluted shares are the same as non-GAAP diluted shares for all periods presented. (7) The provision for deferred tax assets valuation allowance in the nine months ended September 30, 2020 is related to the establishment of a valuation allowance against deferred tax assets.

TWITTER, INC. RECONCILIATION OF GAAP REVENUE TO NON-GAAP CONSTANT CURRENCY REVENUE
(In millions) (Unaudited)
Three Months Ended Nine Months Ended September 30, September 30, 2021 2020 2021 2020 Revenue, advertising revenue, data licensing and other revenue, international revenue and international advertising revenue excluding foreign exchange effect (1): Revenue $ 1,284 $ 936 $ 3,510 $ 2,427 Foreign exchange effect on 2021 revenue using 2020 rates (2) (28) Revenue excluding foreign exchange effect $ 1,282 $ 3,482 Revenue year-over-year change percent 37 % 45 % Revenue excluding foreign exchange effect year-over-year change percent 37 % 43 % Advertising revenue $ 1,141 $ 808 $ 3,093 $ 2,053 Foreign exchange effect on 2021 advertising revenue using 2020 rates (2) (28) Advertising revenue excluding foreign exchange effect $ 1,139 $ 3,065 Advertising revenue year-over-year change percent 41 % 51 % Advertising revenue excluding foreign exchange effect year-over-year change percent 41 % 49 % Data licensing and other revenue $ 143 $ 128 $ 418 $ 375 Foreign exchange effect on 2021 data licensing and other revenue using 2020 rates — — Data licensing and other revenue excluding foreign exchange effect $ 143 $ 418 Data licensing and other revenue year-over-year change percent 12 % 11 % Data licensing and other revenue excluding foreign exchange effect year-over-year change percent 12 % 11 % International revenue $ 542 $ 424 $ 1,559 $ 1,081 Foreign exchange effect on 2021 international revenue using 2020 rates (2) (28) International revenue excluding foreign exchange effect $ 540 $ 1,531 International revenue year-over-year change percent 28 % 44 % International revenue excluding foreign exchange effect year-over-year change percent 27 % 42 % International advertising revenue $ 493 $ 381 $ 1,419 $ 960
Foreign exchange effect on 2021 international advertising revenue using 2020 rates (2) (28) International advertising revenue excluding foreign exchange effect $ 491 $ 1,391 International advertising revenue year-over-year change percent 30 % 48 % International advertising revenue excluding foreign exchange effect year-over-year change percent 29 % 45 % (1) The sum of individual amounts may not always equal total amounts indicated due to rounding.