Twitter, Inc. - cloudfront.net
74
UNITED STATES SECURITIES AND EXCHANGE COMMISSION Washington, D.C. 20549 FORM 10-Q (Mark One) ☒ QUARTERLY REPORT PURSUANT TO SECTION 13 OR 15(d) OF THE SECURITIES EXCHANGE ACT OF 1934 For the quarterly period ended September 30, 2017 OR ☐ TRANSITION REPORT PURSUANT TO SECTION 13 OR 15(d) OF THE SECURITIES EXCHANGE ACT OF 1934 FOR THE TRANSITION PERIOD FROM TO Commission File Number 001-36164 Twitter, Inc. (Exact name of registrant as specified in its charter) Delaware 20-8913779 (State or other jurisdiction of incorporation or organization) (I.R.S. Employer Identification No.) 1355 Market Street, Suite 900 San Francisco, California 94103 (Address of principal executive offices and Zip Code) (415) 222-9670 (Registrant’s telephone number, including area code) Indicate by check mark whether the registrant (1) has filed all reports required to be filed by Section 13 or 15(d) of the Securities Exchange Act of 1934 during the preceding 12 months (or for such shorter period that the registrant was required to file such reports), and (2) has been subject to such filing requirements for the past 90 days. YES ☒ NO ☐ Indicate by check mark whether the registrant has submitted electronically and posted on its corporate Web site, if any, every Interactive Data File required to be submitted and posted pursuant to Rule 405 of Regulation S-T (§232.405 of this chapter) during the preceding 12 months (or for such shorter period that the registrant was required to submit and post such files). YES ☒ NO ☐ Indicate by check mark whether the registrant is a large accelerated filer, an accelerated filer, a non-accelerated filer, smaller reporting company, or an emerging growth company. See the definitions of “large accelerated filer,” “accelerated filer,” “smaller reporting company,” and “emerging growth company” in Rule 12b-2 of the Exchange Act. Large accelerated filer ☒ Accelerated filer ☐ Non-accelerated filer ☐ (Do not check if a smaller reporting company) Smaller reporting company ☐ Emerging growth company ☐ If an emerging growth company, indicate by check mark if the registrant has elected not to use the extended transition period for complying with any new or revised financial accounting standards provided pursuant to Section 13(a) of the Exchange Act. ☐ Indicate by check mark whether the registrant is a shell company (as defined in Rule 12b-2 of the Exchange Act). YES ☐ NO ☒ The number of shares of the registrant’s common stock outstanding as of October 26, 2017 was 742,793,573.
-
Upload
khangminh22 -
Category
Documents
-
view
0 -
download
0
Transcript of Twitter, Inc. - cloudfront.net

UNITED STATESSECURITIES AND EXCHANGE COMMISSION
Washington, D.C. 20549
FORM 10-Q
(Mark One)☒ QUARTERLY REPORT PURSUANT TO SECTION 13 OR 15(d) OF THE SECURITIES EXCHANGE ACT OF 1934
For the quarterly period ended September 30, 2017
OR
☐ TRANSITION REPORT PURSUANT TO SECTION 13 OR 15(d) OF THE SECURITIES EXCHANGE ACT OF 1934FOR THE TRANSITION PERIOD FROM TO
Commission File Number 001-36164
Twitter, Inc.(Exact name of registrant as specified in its charter)
Delaware 20-8913779(State or other jurisdiction ofincorporation or organization)
(I.R.S. EmployerIdentification No.)
1355 Market Street, Suite 900San Francisco, California 94103
(Address of principal executive offices and Zip Code)
(415) 222-9670(Registrant’s telephone number, including area code)
Indicate by check mark whether the registrant (1) has filed all reports required to be filed by Section 13 or 15(d) of the Securities Exchange Act of 1934 duringthe preceding 12 months (or for such shorter period that the registrant was required to file such reports), and (2) has been subject to such filing requirements forthe past 90 days. YES ☒ NO ☐
Indicate by check mark whether the registrant has submitted electronically and posted on its corporate Web site, if any, every Interactive Data File required to besubmitted and posted pursuant to Rule 405 of Regulation S-T (§232.405 of this chapter) during the preceding 12 months (or for such shorter period that theregistrant was required to submit and post such files). YES ☒ NO ☐
Indicate by check mark whether the registrant is a large accelerated filer, an accelerated filer, a non-accelerated filer, smaller reporting company, or an emerginggrowth company. See the definitions of “large accelerated filer,” “accelerated filer,” “smaller reporting company,” and “emerging growth company” in Rule 12b-2of the Exchange Act.
Large accelerated filer ☒ Accelerated filer ☐
Non-accelerated filer ☐ (Do not check if a smaller reporting company) Smaller reporting company ☐
Emerging growth company ☐
If an emerging growth company, indicate by check mark if the registrant has elected not to use the extended transition period for complying with any new orrevised financial accounting standards provided pursuant to Section 13(a) of the Exchange Act. ☐
Indicate by check mark whether the registrant is a shell company (as defined in Rule 12b-2 of the Exchange Act). YES ☐ NO ☒
The number of shares of the registrant’s common stock outstanding as of October 26, 2017 was 742,793,573.

TABLE OF CONTENTS PART I – FINANCIAL INFORMATION PageItem 1. Financial Statements (Unaudited) 6 Consolidated Balance Sheets as of September 30, 2017 and December 31, 2016 6
Consolidated Statements of Operations for the Three and Nine Months Ended September 30, 2017 and September 30,
2016 7
Consolidated Statements of Comprehensive Loss for the Three and Nine Months Ended September 30, 2017 and
September 30, 2016 8 Consolidated Statements of Cash Flows for the Nine Months Ended September 30, 2017 and September 30, 2016 9 Notes to Consolidated Financial Statements 10Item 2. Management’s Discussion and Analysis of Financial Condition and Results of Operations 25Item 3. Quantitative and Qualitative Disclosures About Market Risk 40Item 4. Controls and Procedures 41
PART II – OTHER INFORMATION Item 1. Legal Proceedings 42Item 1A. Risk Factors 42Item 6. Exhibits 69 Signatures 71
2

SPECIAL NOTE REGARDING FORWARD-LOOKING STATEMENTS
This Quarterly Report on Form 10-Q contains forward-looking statements within the meaning of Section 27A of the Securities Act of 1933, asamended, and Section 21E of the Securities Exchange Act of 1934, as amended, which statements involve substantial risks and uncertainties.Forward-looking statements generally relate to future events or our future financial or operating performance. In some cases, you can identifyforward-looking statements because they contain words such as “may,” “will,” “should,” “expects,” “plans,” “anticipates,” “could,” “intends,” “target,”“projects,” “contemplates,” “believes,” “estimates,” “predicts,” “potential” or “continue” or the negative of these words or other similar terms orexpressions that concern our expectations, strategy, plans or intentions. Forward-looking statements contained in this Quarterly Report on Form 10-Q include, but are not limited to, statements about:
• our ability to attract and retain users and increase the level of engagement, including ad engagement, of our users;
• our beliefs regarding MAUs, DAUs, cost per ad engagement and changes in ad engagements;
• our ability to develop or acquire new products, product features and services, improve our existing products and services,including with respect to Promoted Tweet product features and video and performance advertising, and increase the value of ourproducts and services;
• our business strategies, plans and priorities, including our plans for growth, investment in and refinement of our products andservices, including our decisions to deprecate, discontinue or not launch certain products and product features;
• our ability to provide new content from third parties, including our ability to secure live streaming video content on economic andother terms that are acceptable to us;
• our ability to attract advertisers to our platforms, products and services and increase the amount that advertisers spend with us;
• our expectations regarding our user growth and growth rates and the continued usage of our mobile applications, including theimpact of seasonality and a recent change to the Safari interface;
• our ability to increase our revenue and our revenue growth rate, including by differentiating and scaling revenue products andour expectations regarding revenue mix;
• our expectations regarding revenue growth vis-à-vis audience growth, competition and the effects of advertiser sales cycle andproduct deprecation;
• our ability to improve user monetization, including of our logged out and syndicated audiences;
• our future financial performance, including trends in cost per ad engagement, revenue, cost of revenue, operating expenses,including stock-based compensation and income taxes; our expectations regarding our tax expense and cash taxes;
• our expectations regarding outstanding litigation;
• the effects of seasonal trends on our results of operations;
• the impact of our recent financial results on our valuation allowance for federal and state deferred tax assets;
• the sufficiency of our cash and cash equivalents and cash generated from operations to meet our working capital and capitalexpenditure requirements;
• our ability to timely and effectively scale and adapt our existing technology and network infrastructure;
• our ability to successfully acquire and integrate companies and assets; and
• our expectations regarding international operations.
We caution you that the foregoing list may not contain all of the forward-looking statements made in this Quarterly Report on Form 10-Q.
3

You should not rely upon forward-looking statements as predictions of future events. We have based the forward-looking statementscontained in this Quarterly Report on Form 10-Q primarily on our current expectations and projections about future events and trends that we believemay affect our business, financial condition, operating results, cash flows or prospects. The outcome of the events described in these forward-looking statements is subject to risks, uncertainties and other factors described in the s ection titled “Risk Factors” and elsewhere in this QuarterlyReport on Form 10-Q. Moreover, we operate in a very competitive and rapidly changing environment. New risks and uncertainties emerge from timeto time and it is not possible for us to predict all risks and uncertainties that could have an impact on the forward-looking statements contained in thisQuarterly Report on Form 10-Q. We cannot assure you that the results, events and circumstances reflected in the forward-looking statements will beachiev ed or occur, and actual results, events or circumstances could differ materially from those described in the forward-looking statements.
The forward-looking statements made in this Quarterly Report on Form 10-Q relate only to events as of the date on which the statements aremade. We undertake no obligation to update any forward-looking statements made in this Quarterly Report on Form 10-Q to reflect events orcircumstances after the date of this Quarterly Report on Form 10-Q or to reflect new information or the occurrence of unanticipated events, except asrequired by law. We may not actually achieve the plans, intentions or expectations disclosed in our forward-looking statements and you should notplace undue reliance on our forward-looking statements. Our forward-looking statements do not reflect the potential impact of any future acquisitions,mergers, dispositions, joint ventures or investments we may make.
4

NOTE REGARDING KEY METRICS
We review a number of metrics, including monthly active users, or MAUs, changes in daily active users or daily active usage, or DAUs,changes in ad engagements and changes in cost per ad engagement, to evaluate our business, measure our performance, identify trends affectingour business, formulate business plans and make strategic decisions. See the section titled “Management’s Discussion and Analysis of FinancialCondition and Results of Operations—Key Metrics” for a discussion of how we calculate MAUs, changes in DAUs, changes in ad engagements andchanges in cost per ad engagement.
The numbers of active users presented in this Quarterly Report on Form 10-Q are based on internal company data. While these numbers arebased on what we believe to be reasonable estimates for the applicable period of measurement, there are inherent challenges in measuring usageand user engagement across our large user base around the world. For example, there are a number of false or spam accounts in existence on ourplatform. We have performed an internal review of a sample of accounts and estimate that false or spam accounts represented less than 5% of ourMAUs as of December 31, 2016. In making this determination, we applied significant judgment, so our estimation of false or spam accounts may notaccurately represent the actual number of such accounts, and the actual number of false or spam accounts could be higher than we have estimated.We are continually seeking to improve our ability to estimate the total number of spam accounts and eliminate them from the calculation of our activeusers, and in the past have made improvements in our spam detection capabilities that have resulted in the suspension of a large number ofaccounts. Spam accounts that we have identified are not included in the active user numbers presented in this Quarterly Report on Form 10-Q. Wetreat multiple accounts held by a single person or organization as multiple users for purposes of calculating our active users because we permitpeople and organizations to have more than one account. Additionally, some accounts used by organizations are used by many people within theorganization. As such, the calculations of our active users may not accurately reflect the actual number of people or organizations using our platform.
Our metrics are also affected by applications that automatically contact our servers for regular updates with no discernible user-initiated actioninvolved, and this activity can cause our system to count the users associated with such applications as active users on the day or days such contactoccurs. As of December 31, 2016, approximately 8.5% of users used third party applications that may have automatically contacted our servers forregular updates without any discernible additional user-initiated action. As such, the calculations of our active users presented in this QuarterlyReport on Form 10-Q may be affected as a result of this activity.
In addition, our data regarding user geographic location for purposes of reporting the geographic location of our MAUs is based on the IPaddress or phone number associated with the account when a user initially registered the account on Twitter. The IP address or phone number maynot always accurately reflect a user’s actual location at the time such user engaged with our platform. For example, a mobile user may appear to beaccessing Twitter from the location of the proxy server that the user connects to rather than from a user’s actual location.
We regularly review and may adjust our processes for calculating our internal metrics to improve their accuracy. Our measures of user growthand user engagement may differ from estimates published by third parties or from similarly-titled metrics of our competitors due to differences inmethodology.
We present and discuss our total audience based on both internal metrics and relying on data from Google Analytics, which measures logged-out visitors to our properties.
5

P ART I — FINANCIAL INFORMATION Item 1. Financial Statements
TWITTER, INC.CONSOLIDATED BALANCE SHEETS
(In thousands, except par value)(Unaudited)
September 30, December 31, 2017 2016 Assets Current assets:
Cash and cash equivalents $ 1,586,558 $ 988,598 Short-term investments 2,671,538 2,785,981 Accounts receivable, net of allowance for doubtful accounts of $5,362 and $7,216 as of September 30, 2017 and December 31, 2016, respectively
509,854
650,650
Prepaid expenses and other current assets 234,472 226,967 Total current assets 5,002,422 4,652,196
Property and equipment, net 753,317 783,901 Intangible assets, net 54,560 95,334 Goodwill 1,187,880 1,185,315 Other assets 77,610 153,619
Total assets $ 7,075,789 $ 6,870,365 Liabilities and stockholders' equity Current liabilities:
Accounts payable $ 103,112 $ 122,236 Accrued and other current liabilities 296,152 380,937 Capital leases, short-term 81,938 80,848
Total current liabilities 481,202 584,021 Convertible notes 1,604,932 1,538,967 Capital leases, long-term 85,622 66,837 Deferred and other long-term tax liabilities, net 11,858 7,556 Other long-term liabilities 62,769 68,049
Total liabilities 2,246,383 2,265,430 Commitments and contingencies (Note 12) Stockholders' equity:
Preferred stock, $0.000005 par value-- 200,000 shares authorized; none issued and outstanding — — Common stock, $0.000005 par value-- 5,000,000 shares authorized; 741,907 and 721,572 sharesissued and outstanding as of September 30, 2017 and December 31, 2016, respectively
4
4
Additional paid-in capital 7,628,966 7,224,534 Accumulated other comprehensive loss (36,756) (69,253)Accumulated deficit (2,762,808) (2,550,350)Total stockholders' equity 4,829,406 4,604,935
Total liabilities and stockholders' equity $ 7,075,789 $ 6,870,365
The accompanying notes are an integral part of these consolidated financial statements.
6

TWITTER, INC.CONSOLIDATED STATEMENTS OF OPERATIONS
(In thousands, except per share data)(Unaudited)
Three Months Ended Nine Months Ended September 30, September 30, 2017 2016 2017 2016 Revenue $ 589,633 $ 615,934 $ 1,711,739 $ 1,812,413 Costs and expenses
Cost of revenue 210,016 225,159 643,263 626,530 Research and development 136,115 177,049 408,014 511,354 Sales and marketing 172,957 224,436 527,847 697,226 General and administrative 63,266 67,379 203,973 200,884
Total costs and expenses 582,354 694,023 1,783,097 2,035,994 Income (loss) from operations 7,279 (78,089) (71,358) (223,581)
Interest expense (26,732) (24,860) (78,537) (74,687)Other income (expense), net 1,922 6,640 (39,076) 19,680 Loss before income taxes (17,531) (96,309) (188,971) (278,588)Provision for income taxes 3,564 6,562 10,171 11,231 Net loss $ (21,095) $ (102,871) $ (199,142) $ (289,819)Net loss per share attributable to common stockholders:
Basic $ (0.03) $ (0.15) $ (0.27) $ (0.42)Diluted $ (0.03) $ (0.15) $ (0.27) $ (0.42)
Weighted-average shares used to compute net loss per share attributable to common stockholders:
Basic 736,515 704,359 729,626 698,104 Diluted 736,515 704,359 729,626 698,104
The accompanying notes are an integral part of these consolidated financial statements.
7

TWITTER, INC.CONSOLIDATED STATEMENTS OF COMPREHENSIVE LOSS
(In thousands)(Unaudited)
Three Months Ended Nine Months Ended September 30, September 30, 2017 2016 2017 2016 Net loss $ (21,095) $ (102,871) $ (199,142) $ (289,819)Other comprehensive income (loss), net of tax:
Change in unrealized gain on investments in available-for-sale securities 564 594 404 4,075 Change in foreign currency translation adjustment 9,508 (2,400) 32,093 (4,818)
Net change in accumulated other comprehensive loss 10,072 (1,806) 32,497 (743)Comprehensive loss $ (11,023) $ (104,677) $ (166,645) $ (290,562)
The accompanying notes are an integral part of these consolidated financial statements.
8

TWITTER, INC.CONSOLIDATED STATEMENTS OF CASH FLOWS
(In thousands)(Unaudited)
Nine Months Ended September 30, 2017 2016 Cash flows from operating activities
Net loss $ (199,142) $ (289,819)Adjustments to reconcile net loss to net cash provided by operating activities:
Depreciation and amortization expense 303,347 282,782 Stock-based compensation expense 331,352 477,138 Amortization of discount on convertible notes 59,644 55,590 Changes in bad debt provision 26 2,253 Deferred income taxes (1,343) 58 Impairment of investments in privately-held companies 62,439 2,000 Other adjustments (1,278) 7,374 Changes in assets and liabilities, net of assets acquired and liabilities assumed from acquisitions:
Accounts receivable 155,598 51,191 Prepaid expenses and other assets 4,353 2,331 Accounts payable (14,458) (26,291)Accrued and other liabilities (67,436) 1,905
Net cash provided by operating activities 633,102 566,512 Cash flows from investing activities
Purchases of property and equipment (117,800) (170,552)Purchases of marketable securities (2,020,115) (2,277,727)Proceeds from maturities of marketable securities 2,023,778 2,033,257 Proceeds from sales of marketable securities 108,818 174,017 Proceeds from sales of long-lived assets 35,000 — Changes in restricted cash 3,209 (6,606)Purchases of investments in privately-held companies (825) (81,502)Business combinations, net of cash acquired — (80,142)Other investing activities (10,102) (1,181)
Net cash provided by (used in) investing activities 21,963 (410,436)Cash flows from financing activities
Taxes paid related to net share settlement of equity awards (7,049) (11,098)Payments of capital lease obligations (80,685) (73,897)Proceeds from exercise of stock options 7,872 7,070 Proceeds from issuances of common stock under employee stock purchase plan 14,019 15,821 Other financing activities — 570
Net cash used in financing activities (65,843) (61,534)Net increase in cash and cash equivalents 589,222 94,542 Foreign exchange effect on cash and cash equivalents 8,738 5,944 Cash and cash equivalents at beginning of period 988,598 911,471 Cash and cash equivalents at end of period $ 1,586,558 $ 1,011,957 Supplemental disclosures of non-cash investing and financing activities
Common stock issued in connection with acquisitions $ — $ 644 Equipment purchases under capital leases $ 100,633 $ 63,022 Changes in accrued property and equipment purchases $ (23,521) $ 7,779
The accompanying notes are an integral part of these consolidated financial statements.
9

TWITTER, INC.NOTES TO CONSOLIDATED FINANCIAL STATEMENTS
(Unaudited) Note 1. Description of Business and Summary of Significant Accounting Policies
Twitter, Inc. (“Twitter” or the “Company”) was incorporated in Delaware in April 2007, and is headquartered in San Francisco, California.Twitter offers products and services for users, advertisers, developers and platform and data partners.
Basis of Presentation
The consolidated financial statements include the accounts of the Company and its wholly-owned subsidiaries. All significant intercompanyaccounts and transactions have been eliminated in consolidation.
The accompanying unaudited consolidated financial statements have been prepared in accordance with generally accepted accountingprinciples in the United States of America (“GAAP”). The unaudited interim consolidated financial statements have been prepared on the same basisas the audited consolidated financial statements and reflect, in management’s opinion, all adjustments of a normal, recurring nature that arenecessary for the fair statement of the Company’s financial position, results of operations and cash flows for the interim periods, but are notnecessarily indicative of the results expected for the full fiscal year or any other period.
The accompanying interim consolidated financial statements and these related notes should be read in conjunction with the consolidatedfinancial statements and related notes included in the Company’s Annual Report on Form 10-K for the year ended December 31, 2016.
Use of Estimates
The preparation of the Company’s consolidated financial statements in conformity with GAAP requires management to make estimates andassumptions that affect the reported amounts of assets, liabilities, revenue and expenses, as well as related disclosure of contingent assets andliabilities. Actual results could differ materially from the Company’s estimates. To the extent that there are material differences between theseestimates and actual results, the Company’s financial condition or operating results will be affected. The Company bases its estimates on pastexperience and other assumptions that the Company believes are reasonable under the circumstances, and the Company evaluates theseestimates on an ongoing basis.
Certain prior period amounts have been reclassified to conform to the current period presentation.
Recent Accounting Pronouncements
Recently adopted accounting pronouncements
In March 2016, the Financial Accounting Standards Board (“FASB”) issued a new accounting standard update on simplifying the accountingfor share-based payment transactions, including the income tax consequences, classification of awards as either equity or liabilities, andclassification on the statement of cash flows. The new guidance also allows an entity to account for forfeitures when they occur. This guidancebecame effective for reporting periods beginning after December 15, 2016. The Company adopted this new guidance on January 1, 2017. Uponadoption, tax benefits in excess of stock-based compensation costs, and tax deficiencies, are recorded in the consolidated statements of operationsas a component of the provision for income taxes, whereas they previously were recorded in equity. The previously unrecognized excess taxbenefits as of December 31, 2016 were recorded as an increase to deferred tax assets. However, given the valuation allowance placed onsubstantially all of the Company’s deferred tax assets, the recognition upon adoption did not have an impact on the Company’s accumulated deficit.As a result of adopting the new standard utilizing the modified retrospective approach, the Company’s deferred tax assets increased byapproximately $0.93 billion with a corresponding increase in its valuation allowance. The Company also elected to account for forfeitures as theyoccur, rather than estimate expected forfeitures. The adoption of this new guidance resulted in a net cumulative-effect adjustment of $13.3 millionincrease to accumulated deficit as of January 1, 2017, related to the accounting of forfeitures using the modified retrospective method. Additionally,the Company adopted the aspects of the guidance affecting the cash flow presentation retrospectively, which resulted in an immaterialreclassification of excess tax benefits from financing activities to operating activities in the Company’s consolidated statements of cash flows.
10

In January 2017, the FASB issued a new accounting standard update on simplif ying the accounting for goodwill impairment. The newguidance eliminates the requirement to calculate the implied fair value of goodwill (i.e., Step 2 of the goodwill impairment test) to measure a goodwillimpairment charge. Instead, entities will record a n impairment charge based on the excess of a reporting unit’s carrying amount over its fair value.The Company adopted this guidance prospectively during the three months ended March 31, 2017 and the adoption had no impact on theCompany’s financial statem ents.
In May 2017, the FASB issued a new accounting standard update on clarifying when changes to share-based payment awards must beaccounted for as modifications. According to the new guidance, entities will apply the modification accounting guidance if the value, vestingconditions or classification of the award changes. The Company adopted this guidance prospectively during the three months ended June 30, 2017and the adoption had no impact on the Company’s financial statements.
Recently issued accounting pronouncements not yet adopted
In May 2014, the FASB issued a new accounting standard update on revenue recognition from contracts with customers. The new guidancewill replace all current GAAP guidance on this topic and eliminate industry-specific guidance. According to the new guidance, revenue is recognizedwhen promised goods or services are transferred to customers in an amount that reflects the consideration for which the Company expects to beentitled in exchange for those goods or services. The guidance will be effective for fiscal years, and interim periods with those fiscal years, beginningafter December 15, 2017 and can be applied either retrospectively to each period presented or as a cumulative-effect adjustment as of the date ofadoption. In March 2016, April 2016, May 2016 and December 2016, the FASB further amended the guidance to clarify the implementation onprincipal versus agent considerations, the identification of performance obligation and the licensing implementation guidance to provide narrow-scope improvements and practical expedients, and technical corrections and improvements. The Company will adopt this standard effective January1, 2018 using the modified retrospective method. The Company is finalizing its analysis of the impact this standard will have on the consolidatedfinancial statements and continues to validate the recognition impact on data licensing and other revenue. The Company does not expect the impactof adopting the standard to be material to the Company’s consolidated financial statements. As part of the Company’s assessment andimplementation plan, the Company is finalizing changes to its policies and procedures and evaluating and implementing changes to its internalcontrols. The Company continues to finalize its required disclosures under the new standard.
In March 2017, the FASB issued a new accounting standard update on shortening the premium amortization period for purchased non-contingently callable debt securities. The new guidance shortens the amortization period for the premium on purchased non-contingently callabledebt securities to the earliest call date. Currently, entities generally amortize the premium as a yield adjustment over the contractual life of thesecurity. This guidance will be effective for fiscal years, and interim periods within those years, beginning after December 15, 2018. Early adoption ispermitted. The Company is evaluating the impact of adopting this new accounting standard update on the financial statements and relateddisclosures.
With the exception of the standards discussed above, there have been no other recent accounting pronouncements or changes in accountingpronouncements during the nine months ended September 30, 2017, as compared to the recent accounting pronouncements described in theCompany’s Annual Report on Form 10-K for the fiscal year ended December 31, 2016, that are of significance or potential significance to theCompany.
11

Note 2. Cash, Cash Equivalent s and Short-term InvestmentsCash, cash equivalents and short-term investments consist of the following (in thousands):
September 30, December 31, 2017 2016 Cash and cash equivalents:
Cash $ 279,615 $ 253,808 Money market funds 920,105 422,515 U.S. government and agency securities including treasury bills 29,995 12,639 Corporate notes, commercial paper and certificates of deposit 356,843 299,636
Total cash and cash equivalents $ 1,586,558 $ 988,598 Short-term investments:
U.S. government and agency securities including treasury bills $ 971,514 $ 1,183,768 Corporate notes, commercial paper and certificates of deposit 1,700,024 1,602,213
Total short-term investments $ 2,671,538 $ 2,785,981
The contractual maturities of securities classified as available-for-sale as of September 30, 2017 were as follows (in thousands):
September 30, 2017 Due within one year $ 2,089,071 Due after one year through two years 582,467
Total $ 2,671,538
The following tables summarize unrealized gains and losses related to available-for-sale securities classified as short-term investments on the
Company’s consolidated balance sheets (in thousands):
September 30, 2017 Gross Gross Gross Aggregated Amortized Unrealized Unrealized Estimated Costs Gains Losses Fair Value
U.S. government and agency securities including treasury bills $ 972,996 $ 129 $ (1,611) $ 971,514 Corporate notes, commercial paper and certificates of deposit
1,700,172 254 (402) 1,700,024
Total available-for-sale securities classified as short-term investments
$ 2,673,168 $ 383 $ (2,013) $ 2,671,538
December 31, 2016 Gross Gross Gross Aggregated Amortized Unrealized Unrealized Estimated Costs Gains Losses Fair Value
U.S. government and agency securities including treasury bills $ 1,185,274 $ 136 $ (1,642) $ 1,183,768 Corporate notes, commercial paper and certificates of deposit
1,603,048 114 (949) 1,602,213
Total available-for-sale securities classified as short-term investments
$ 2,788,322 $ 250 $ (2,591) $ 2,785,981
The gross unrealized loss on securities in a continuous loss position for 12 months or longer was not material as of September 30, 2017 andDecember 31, 2016.
12

Investments are reviewed periodically to identify possible other-than-temporary impairments. No impairment loss has been recorded on thesecurities included in the tables above as the Company believes that the decrease in fair value of these securities is temporary and expects torecover the initial cost of investment for these securities .
Note 3. Fair Value Measurements
The Company measures its cash equivalents, short-term investments and derivative financial instruments at fair value. The Companyclassifies its cash equivalents, short-term investments and derivative financial instruments within Level 1 or Level 2 because the Company valuesthese investments using quoted market prices or alternative pricing sources and models utilizing market observable inputs. The fair value of theCompany’s Level 1 financial assets is based on quoted market prices of the identical underlying security. The fair value of the Company’s Level 2financial assets is based on inputs that are directly or indirectly observable in the market, including the readily-available pricing sources for theidentical underlying security that may not be actively traded.
The following tables set forth the fair value of the Company’s financial assets and liabilities measured at fair value on a recurring basis as ofSeptember 30, 2017 and December 31, 2016 based on the three-tier fair value hierarchy (in thousands):
September 30, 2017 Level 1 Level 2 Level 3 Total Assets Cash equivalents:
Money market funds $ 920,105 $ — $ — $ 920,105 Treasury bills 29,995 — — 29,995 Commercial paper — 344,724 — 344,724 Certificates of deposit — 12,119 — 12,119
Short-term investments: U.S. government securities — 593,594 — 593,594 Agency securities — 377,920 — 377,920 Corporate notes — 747,623 — 747,623 Commercial paper — 264,822 — 264,822 Certificates of deposit — 687,579 — 687,579
Other current assets: Foreign currency contracts — 2,555 — 2,555
Total $ 950,100 $ 3,030,936 $ — $ 3,981,036 Liabilities Other current liabilities:
Foreign currency contracts — 1,353 — 1,353 Total $ — $ 1,353 $ — $ 1,353
13

December 31, 2016 Level 1 Level 2 Level 3 Total Assets Cash equivalents:
Money market funds $ 422,515 $ — $ — $ 422,515 Treasury bills 12,639 — — 12,639 Corporate notes — 7,387 — 7,387 Commercial paper — 292,249 — 292,249
Short-term investments: U.S. government securities — 657,502 — 657,502 Agency securities — 526,266 — 526,266 Corporate notes — 689,986 — 689,986 Commercial paper — 311,238 — 311,238 Certificates of deposit — 600,989 — 600,989
Other current assets: Foreign currency contracts — 1,955 — 1,955
Total $ 435,154 $ 3,087,572 $ — $ 3,522,726 Liabilities Other current liabilities:
Foreign currency contracts — 500 — 500 Total $ — $ 500 $ — $ 500
In 2014, the Company issued $935.0 million principal amount of 0.25% convertible senior notes due in 2019 (the “2019 Notes”) and
$954.0 million principal amount of 1.00% convertible senior notes due in 2021 (the “2021 Notes” and together with the 2019 Notes, the “Notes”) in aprivate placement to qualified institutional buyers pursuant to Rule 144A under the Securities Act of 1933, as amended. Refer to Note 8 –Convertible Senior Notes for further details on the Notes. The estimated fair value of the 2019 Notes and 2021 Notes based on a market approachas of September 30, 2017 was approximately $887.3 million and $878.1 million, respectively, which represents a Level 2 valuation. The estimatedfair value was determined based on the estimated or actual bids and offers of the Notes in an over-the-counter market on the last business day ofthe period.
Derivative Financial Instruments
The Company enters into foreign currency forward contracts with financial institutions to reduce the risk that its earnings may be adverselyaffected by the impact of exchange rate fluctuations on monetary assets or liabilities denominated in currencies other than the functional currency ofa subsidiary. These contracts do not subject the Company to material balance sheet risk due to exchange rate movements because gains andlosses on these derivatives are intended to offset gains and losses on the hedged foreign currency denominated assets and liabilities. These foreigncurrency forward contracts are not designated as hedging instruments.
The Company recognizes these derivative instruments as either assets or liabilities in the consolidated balance sheets at fair value based ona Level 2 valuation. The Company records changes in the fair value (i.e., gains or losses) of the derivatives as other income (expense), net in theconsolidated statements of operations. The notional principal of foreign currency contracts outstanding was equivalent to $512.7 million and $536.9million at September 30, 2017 and December 31, 2016, respectively.
The fair values of outstanding derivative instruments for the periods presented on a gross basis are as follows (in thousands): September 30, December 31,
Balance Sheet Location 2017 2016 Assets Foreign currency contracts not designated as hedginginstruments
Other current assets $ 2,555 $ 1,955
Liabilities Foreign currency contracts not designated as hedginginstruments
Other current liabilities $ 1,353 $ 500
14
The Company recognized $2.7 million and $5.1 million of net gains on the foreign currency contracts in the three and nine months ended
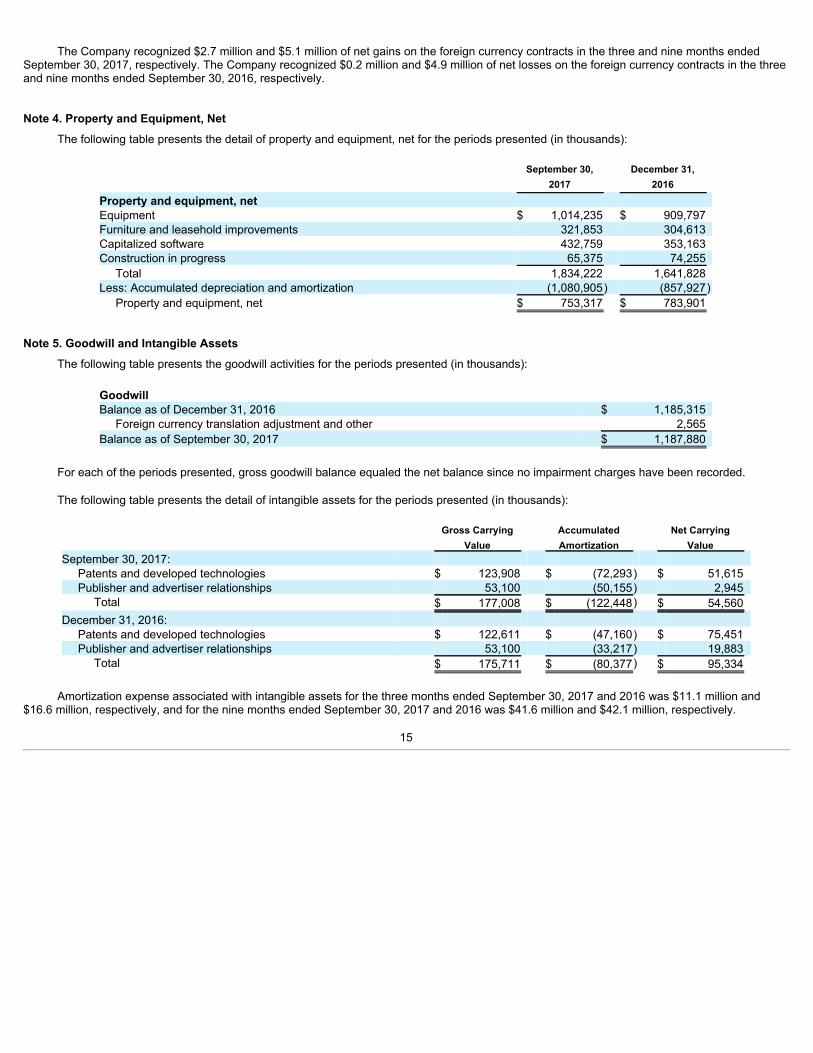
September 30, 2017, respectively. The Company recognized $0.2 million and $4.9 million of net losses on the foreign currency contracts in the threeand nine months ended September 30, 2016, respectively. Note 4. Property and Equipment, Net
The following table presents the detail of property and equipment, net for the periods presented (in thousands):
September 30, December 31, 2017 2016 Property and equipment, net Equipment $ 1,014,235 $ 909,797 Furniture and leasehold improvements 321,853 304,613 Capitalized software 432,759 353,163 Construction in progress 65,375 74,255
Total 1,834,222 1,641,828 Less: Accumulated depreciation and amortization (1,080,905) (857,927)
Property and equipment, net $ 753,317 $ 783,901
Note 5. Goodwill and Intangible Assets
The following table presents the goodwill activities for the periods presented (in thousands):
Goodwill Balance as of December 31, 2016 $ 1,185,315
Foreign currency translation adjustment and other 2,565 Balance as of September 30, 2017 $ 1,187,880
For each of the periods presented, gross goodwill balance equaled the net balance since no impairment charges have been recorded.
The following table presents the detail of intangible assets for the periods presented (in thousands):
Gross Carrying Accumulated Net Carrying Value Amortization Value September 30, 2017:
Patents and developed technologies $ 123,908 $ (72,293) $ 51,615 Publisher and advertiser relationships 53,100 (50,155) 2,945
Total $ 177,008 $ (122,448) $ 54,560 December 31, 2016:
Patents and developed technologies $ 122,611 $ (47,160) $ 75,451 Publisher and advertiser relationships 53,100 (33,217) 19,883
Total $ 175,711 $ (80,377) $ 95,334
Amortization expense associated with intangible assets for the three months ended September 30, 2017 and 2016 was $11.1 million and$16.6 million, respectively, and for the nine months ended September 30, 2017 and 2016 was $41.6 million and $42.1 million, respectively.
15

Estimated future amortization expense as of September 30 , 2017 is as follows (in thousands):
Remainder of 2017 $ 4,880 2018 16,096 2019 8,537 2020 6,263 2021 5,867 Thereafter 12,917
Total $ 54,560
Note 6. Accrued and Other Current LiabilitiesThe following table presents the detail of accrued and other current liabilities for the periods presented (in thousands):
September 30, December 31, 2017 2016 Accrued compensation $ 92,992 $ 82,354 Accrued restructuring 35,945 55,942 Accrued publisher, content and ad network costs 22,243 44,362 Deferred revenue 23,094 33,659 Accrued tax liabilities 35,012 34,253 Accrued fixed assets and maintenance 7,457 25,265 Accrued other 79,409 105,102
Total $ 296,152 $ 380,937
Note 7. Investments in Privately-Held Companies
The Company makes strategic investments in privately-held companies and assesses the accounting for these investments under the equityor cost method. The Company also evaluates each investee to determine if the investee is a variable interest entity and, if so, whether the Companyis the primary beneficiary of the variable interest entity. The Company has determined, as of September 30, 2017, there were no variable interestentities required to be consolidated in the Company’s consolidated financial statements. The Company’s investments in privately-held companiesare primarily accounted for using the cost method which had a carrying value of $27.6 million and $90.2 million as of September 30, 2017 andDecember 31, 2016, respectively. The maximum loss the Company can incur for its investments is their carrying value. These investments inprivately-held companies are included within Other Assets on the consolidated balance sheets.
The Company periodically evaluates the carrying value of the cost-method investments, when events and circumstances indicate that thecarrying amount of the investment may not be recovered. The Company estimates the fair value of the cost-method investments to assess whetherimpairment losses shall be recorded using Level 3 inputs. These investments include the Company’s holdings in privately-held companies that arenot exchange traded and therefore not supported with observable market prices hence the Company may determine the fair value by reviewingequity valuation reports, current financial results, long-term plans of the private company, the amount of cash that the privately-held company hason-hand, the ability to obtain additional financing and overall market conditions in which the private company operates.
In the three months ended June 30, 2017, the Company determined that the estimated fair value of a cost-method investment, valued usingLevel 3 inputs, was below its carrying value and that the carrying value of this investment was not expected to be recoverable within a reasonableperiod of time. The Company calculated the expected value of the cost-method investment based on third-party offers received by the investee andthe Company’s expectation of its negotiated investment value based on the amount of cash that the investee had on-hand, the investee’s ability toobtain additional financing and overall market conditions in which the investee operated. Based on this analysis, the Company recorded a $55.0million other-than-temporary impairment charge during the three months ended June 30, 2017 within other income (expense), net in the consolidatedstatements of operations.
16

In the three months ended September 30, 2017, based on the investee completing a financing with third parties and reorganization on August12, 2017 , the Company finalized its calculation of the expected value of the cost-method investment using a Monte Carlo option pricing model.Based on this analysis, the Company recorded a $7.4 million other-than-temporary impairment charge during the three months ended September30, 2017 within other income (expense), net in the consolidated statements of operations. Total other-than-temporary impairment charge recorded inthe nine months ended September 30, 2017 and 2016 was $62.4 million and $2.0 million, respec tively. No impairment charge was recorded in thethree months ended September 30, 2016.
Note 8. Convertible Senior Notes
In 2014, the Company issued $935.0 million principal amount of 2019 Notes and $954.0 million principal amount of 2021 Notes. The total netproceeds from this offering were approximately $1.86 billion, after deducting $28.3 million of initial purchasers’ discount and $0.5 million debtissuance costs in connection with the 2019 Notes and the 2021 Notes.
The interest rates are fixed at 0.25% and 1.00% per annum for the 2019 Notes and the 2021 Notes, respectively, and are payable semi-annually in arrears on March 15 and September 15 of each year, commencing on March 15, 2015. For the three months ended September 30, 2017and 2016, the Company recognized $22.5 million and $21.3 million, respectively, of interest expense related to the amortization of initial purchasers’discount and debt discount prior to capitalization of interest, and $3.0 million and $2.9 million, respectively, of coupon interest expense. For the ninemonths ended September 30, 2017 and 2016, the Company recognized $66.0 million and $62.6 million, respectively, of interest expense related tothe amortization of initial purchasers’ discount and debt discount prior to capitalization of interest, and $8.9 million and $8.9 million, respectively, ofcoupon interest expense.
The Notes consisted of the following (in thousands):
September 30, 2017 December 31, 2016 2019 Notes 2021 Notes 2019 Notes 2021 Notes
Principal amounts: Principal $ 935,000 $ 954,000 $ 935,000 $ 954,000 Unamortized initial purchasers' discount and debt discount(1)
(100,572) (183,496) (136,376) (213,657)
Net carrying amount $ 834,428 $ 770,504 $ 798,624 $ 740,343 Carrying amount of the equity component (2) $ 222,826 $ 283,283 $ 222,826 $ 283,283
(1) Included in the consolidated balance sheets within convertible notes and amortized over the remaining lives of the Notes.(2) Included in the consolidated balance sheets within additional paid-in capital.
As of September 30, 2017, the remaining life of the 2019 Notes and 2021 Notes is approximately 23 months and 47 months, respectively.
17

Note 9. Net Loss per ShareBasic net loss per share is computed by dividing total net loss attributable to common stockholders by the weighted-average common shares
outstanding during the period. The weighted-average common shares outstanding is adjusted for shares subject to repurchase such as unvestedrestricted stock granted to employees in connection with acquisitions, contingently returnable shares and escrowed shares supportingindemnification obligations that are issued in connection with acquisitions and unvested stock options exercised.
Diluted net loss per share is computed by dividing the net loss attributable to common stockholders by the weighted-average number ofcommon shares outstanding, during the period, including potential dilutive common stock instruments. In the three and nine months endedSeptember 30, 2017 and 2016, the Company’s potential common stock instruments such as stock options, restricted stock units (“RSUs”), shares tobe purchased under the 2013 Employee Stock Purchase Plan (“ESPP”), shares subject to repurchases, conversion feature of the Notes and thewarrants were not included in the computation of diluted loss per share as the effect of including these shares in the calculation would have beenanti-dilutive.
The following table presents the calculation of basic and diluted net loss per share for periods presented (in thousands, except per sharedata).
Three Months EndedSeptember 30,
Nine Months EndedSeptember 30,
2017 2016 2017 2016 Net loss $ (21,095) $ (102,871) $ (199,142) $ (289,819)Basic shares:
Weighted-average common shares outstanding 740,290 711,340 733,698 704,418 Weighted-average restricted stock subject to repurchase (3,775) (6,981) (4,072) (6,314)Weighted-average shares used to compute basic net loss per share 736,515 704,359 729,626 698,104
Diluted shares: Weighted-average shares used to compute diluted net loss per share 736,515 704,359 729,626 698,104
Net loss per share attributable to common stockholders: Basic $ (0.03) $ (0.15) $ (0.27) $ (0.42)Diluted $ (0.03) $ (0.15) $ (0.27) $ (0.42)
The following number of potential common shares at the end of each period were excluded from the calculation of diluted net loss per shareattributable to common stockholders because their effect would have been anti-dilutive for the periods presented (in thousands):
Three and Nine Months Ended September 30, 2017 2016
RSUs 32,153 54,666 Warrants 24,329 24,329 Stock options 5,002 8,953 Shares subject to repurchase and others 6,133 8,468
Since the Company expects to settle the principal amount of the outstanding Notes in cash, the Company uses the treasury stock method for
calculating any potential dilutive effect of the conversion spread on diluted net income per share, if applicable. The conversion spread of 24.3 millionshares will have a dilutive impact on diluted net income per share of common stock when the average market price of the Company’s common stockfor a given period exceeds the conversion price of $77.64 per share for the Notes.
If the average market price of the common stock exceeds the exercise price of the warrants, $105.28, the warrants will have a dilutive effecton the earnings per share assuming that the Company is profitable. Since the average market price of the common stock is below $105.28, thewarrants are anti-dilutive.
18

Note 10. Stockholders’ Equity
Equity Incentive Plans
The Company’s 2013 Equity Incentive Plan became effective upon the completion of the Company’s initial public offering and serves as thesuccessor to the 2007 Equity Incentive Plan. Initially, 68.3 million shares were reserved under the 2013 Equity Incentive Plan and any shares subjectto options or other similar awards granted under the 2007 Equity Incentive Plan that expire, are forfeited, are repurchased by the Company orotherwise terminate unexercised will become available under the 2013 Equity Incentive Plan. The number of shares of the Company’s commonstock available for issuance under the 2013 Equity Incentive Plan were and will be increased on the first day of each fiscal year beginning with the2014 fiscal year, in an amount equal to the least of (i) 60,000,000 shares, (ii) 5% of the outstanding shares on the last day of the immediatelypreceding fiscal year or (iii) such number of shares determined by the Company’s Board of Directors. No additional shares have been issued underthe 2007 Equity Incentive Plan since 2013.
Employee Stock Purchase Plan
The number of shares available for sale under the ESPP were and will be increased on the first day of each fiscal year beginning with the2014 fiscal year, in an amount equal to the least of i) 11.3 million shares; ii) 1% of the outstanding shares of the Company’s common stock as of thelast day of the immediately preceding fiscal year; or iii) such other amount as determined by the Company’s Board of Directors.
During the nine months ended September 30, 2017, employees purchased an aggregate of 1.1 million shares under the ESPP at a weighted-average price of $12.43 per share. During the nine months ended September 30, 2016, employees purchased an aggregate of 1.3 million sharesunder the ESPP at a price of $11.99 per share. During the three months ended September 30, 2017 and 2016, the Company recorded $1.9 millionand $4.4 million, respectively, and recorded $6.3 million and $15.8 million during the nine months ended September 30, 2017 and 2016,respectively, of stock-based compensation expense related to the ESPP.
Restricted Common Stock
The Company has granted restricted common stock to certain continuing employees in connection with the acquisitions. Vesting of this stockis dependent on the respective employee’s continued employment at the Company during the requisite service period, which is generally up to fouryears from the issuance date, and the Company has the right to repurchase the unvested shares upon termination of employment. The fair value ofthe restricted common stock issued to employees is recorded as compensation expense on a straight-line basis over the requisite service period.
The activities for the restricted common stock issued to employees for the nine months ended September 30, 2017 are summarized as follows(in thousands, except per share data):
Weighted-Average Number of Grant-Date Fair Shares Value Per Share Unvested restricted common stock at December 31, 2016 5,097 $ 23.04
Vested (1,477) $ 24.40 Canceled (474) $ 38.71
Unvested restricted common stock at September 30, 2017 3,146 $ 20.04
19

Stock Option Activity
A summary of stock option activity for the nine months ended September 30, 2017 is as follows (in thousands, except years and per sharedata): Options Outstanding
Weighted- Weighted- Average Average Remaining Number of Exercise Contractual Life Aggregate Shares Price Per Share (in years) Intrinsic Value Outstanding at December 31, 2016 8,723 $ 7.71 4.25 $ 98,240
Options exercised (3,526) $ 2.23 Options canceled (195) $ 2.74
Outstanding at September 30, 2017 5,002 $ 11.75 5.00 $ 48,053 Exercisable at September 30, 2017 4,062 $ 9.61 4.34 $ 43,239
The total intrinsic values of stock options exercised during the three months ended September 30, 2017 and 2016 were $4.8 million and
$5.8 million, respectively, and $48.9 million and $38.0 million during the nine months ended September 30, 2017 and 2016, respectively.
Performance Restricted Stock Units Activity
The Company grants restricted stock units to certain of its executive officers periodically that vest based on the Company’s attainment of theannual financial performance goals and the executives’ continued employment through the vesting date, approximately one year (“PRSUs”). ThesePRSUs are granted when the annual performance targets are set by the Compensation Committee of the Board of Directors, generally in the firstquarter of each financial year.
During the nine months ended September 30, 2017, the Company granted 345,622 PRSUs, at the 100% target level, for the 2017performance goals with a weighted-average grant date fair value of $15.39 per share. During the year ended December 31, 2016, the Companygranted 165,833 PRSUs, at the 100% target level, of which 117,808 vested in 2017.
The Company also grants restricted stock units to certain of its executive officers that vest based on Twitter stock price performance relativeto a broad-market index over a two year period from the grant date and the executives continued employment through the vesting date(“TSR RSUs”). During the nine months ended September 30, 2017, the Company granted 146,067 TSR RSUs with a weighted-average grant datefair value of $13.02 per share.
In addition, there are 1,741,867 additional PRSUs and TSR RSUs that will vest based on performance goals and Total Shareholder Return(“TSR”) targets in 2018 to 2020, if achieved, at target levels. Since the performance and TSR targets for those additional awards have not beenestablished, they are not considered granted nor are they presented as outstanding.
20

RSU Activity
The following table summarizes the activity related to the Company’s RSUs, excluding PRSUs, for the nine months ended September 30,2017. For purposes of this table, vested RSUs represent the shares for which the service condition had been fulfilled as of each respective date (inthousands, except per share data):
RSUs Outstanding
Weighted- Average Grant- Date Fair Value Shares Per Share Unvested and outstanding at December 31, 2016 48,069 $ 22.64
Granted 11,176 $ 15.51 Vested (16,444) $ 22.25 Canceled (10,648) $ 22.26
Unvested and outstanding at September 30, 2017 32,153 $ 20.49
The total fair value of RSUs vested during the three months ended September 30, 2017 and 2016 was $88.3 million and $124.5 million,
respectively, and $275.3 million and $336.9 million during the nine months ended September 30, 2017 and 2016, respectively. Stock-Based Compensation Expense
Stock-based compensation expense is allocated based on the cost center to which the award holder belongs. Total stock-basedcompensation expense by function is as follows (in thousands): Three Months Ended September 30, Nine Months Ended September 30, 2017 2016 2017 2016 Cost of revenue $ 5,625 $ 7,165 $ 17,830 $ 22,991 Research and development 57,174 87,163 185,185 253,658 Sales and marketing 22,433 41,227 68,216 133,184 General and administrative 15,727 22,972 60,121 67,305
Total stock-based compensation expense $ 100,959 $ 158,527 $ 331,352 $ 477,138
The Company capitalized $12.0 million and $20.2 million of stock-based compensation expense associated with the cost for developing
software for internal use in the three months ended September 30, 2017 and 2016, respectively, and $42.3 million and $60.7 million in the ninemonths ended September 30, 2017 and 2016, respectively.
As of September 30, 2017, there was $609.6 million of gross unamortized stock-based compensation expense related to unvested awardswhich will be recognized, net of actual forfeiture in the future, over a weighted-average period of 2.3 years. Upon adoption of the stock-basedcompensation expense simplification rule as of January 1, 2017, the Company no longer applies a forfeiture rate to determine the unamortizedstock-based compensation expense; instead, the Company accounts for forfeitures as they occur.
Note 11. Income Taxes
The Company is subject to taxation in the United States and various state and foreign jurisdictions. Earnings from non-US activities aresubject to local country income tax. The material jurisdictions in which the Company is subject to potential examination by taxing authorities includethe United States, California and Ireland. The Company is currently under a Federal income tax examination by the Internal Revenue Service (IRS)for tax years 2011, 2012 and 2013, and under examination in California for tax years 2013 through 2015. The Company believes that adequateamounts have been reserved in these jurisdictions. The Company does not provide for federal income taxes on the undistributed earnings of itsforeign subsidiaries as such earnings are to be reinvested indefinitely outside the U.S. The Company computes its quarterly income tax provision byusing a forecasted annual effective tax rate and adjusts for any discrete items arising during the quarter.
21
The Company recorded an income tax provision of $ 3.6 million and $ 6 .6 million for the three months ended September 30 , 201 7 and 2016, respectively , and an income tax provision of $ 10.2 million and $ 11.2 million for the nine months ended September 30, 2017 and 2016,respectively . As of September 30 , 2017 , based on the available objective evidence, management believes it is more likely than not that the taxbenefits of the U.S. losses incurred during the nine months ended September 30 , 2017 will not be realiz ed by the end of the 201 7 fiscal year.Accordingly, the Company did not record the tax benefits of the U.S. losses incurred during the nine months ended September 30 , 2017 . Theprimary difference between the effective tax rate and the federal statutory tax rate relates to the valuation allowances on the Company’s netoperating losses and foreign tax rate differences.
During the three and nine months ended September 30, 2017, the amount of gross unrecognized tax benefits increased by $13.4 million and$36.8 million, respectively. As of September 30, 2017, the Company has $306.4 million of unrecognized tax benefits, including $297.3 million ofunrecognized tax benefits which, if recognized, will not affect the annual effective tax rate as these unrecognized tax benefits would increasedeferred tax assets which would be subject to a full valuation allowance, while the remaining $9.1 million of unrecognized tax benefits which, ifrecognized, would affect the annual effective tax rate. Note 12. Commitments and ContingenciesCredit Facility
The Company has a revolving credit agreement with certain lenders, which provides for a $1.0 billion revolving unsecured credit facilitymaturing on October 22, 2018. The Company is obligated to pay interest on loans under the credit facility and other customary fees for a creditfacility of this size and type, including an upfront fee and an unused commitment fee. Obligations under the credit facility are guaranteed by one ofthe Company’s wholly-owned subsidiaries. In addition, the credit facility contains restrictions on payments including cash payments of dividends.
As of September 30, 2017, no amounts had been drawn under the credit facility.
Leases
The Company has entered into various non-cancelable operating lease agreements for certain offices and data center facilities withcontractual lease periods expiring through 2028. Under the terms of certain leases, the Company is committed to pay for certain taxes, insurance,maintenance and management expenses. Certain of these arrangements have free rent periods or escalating rent payment provisions, and theCompany recognizes rent expense under such arrangements on a straight-line basis.
There were no material changes in the Company’s leases compared to the disclosure in its Annual Report on Form 10-K for the fiscal yearended December 31, 2016.
Legal Proceedings
The Company is currently involved in, and will likely in the future be involved in, legal proceedings, claims and government investigations inthe normal course of business. These proceedings, in the form of both individual and class action litigation, have included, but are not limited tomatters involving intellectual property, defamation, privacy, securities, employment and contractual rights. Legal fees and other costs associated withsuch actions are expensed as incurred. The Company assesses, in conjunction with its legal counsel, the need to record a liability for litigation andcontingencies. Litigation accruals are recorded when and if it is determined that a loss related matter is both probable and reasonably estimable.Material loss contingencies that are reasonably possible of occurrence, if any, are subject to disclosure. As of September 30, 2017 and December31, 2016, there was no litigation or contingency with at least a reasonable possibility of a material loss. No material losses have been recordedduring the three and nine months ended September 30, 2017 and 2016 with respect to litigation or loss contingencies.
22

Indemnification
In the ordinary course of business, the Company often includes standard indemnification provisions in its arrangements with its customers,partners, suppliers and vendors. Pursuant to these provisions, the Company may be obligated to indemnify such parties for losses or claims sufferedor incurred in connection with its service, breach of representations or covenants, intellectual property infringement or other claims made againstsuch parties. These provisions may limit the time within which an indemnification claim can be made. It is not possible to determine the maximumpotential amount under these indemnification obligations due to the limited history of prior indemnification claims and the unique facts andcircumstances involved in each particular agreement. The Company has never incurred significant expense defending its licensees against thirdparty claims, nor has it ever incurred significant expense under its standard service warranties or arrangements with its customers, partners,suppliers and vendors. Accordingly, the Company had no liabilities recorded for these provisions as of September 30, 2017 and December 31, 2016.
Note 13. Operations by Geographic AreaRevenue
Revenue by geography is based on the billing addresses of the customers. The following table sets forth revenue by services and revenue bygeographic area (in thousands): Three Months Ended September 30, Nine Months Ended September 30, 2017 2016 2017 2016 Revenue by services:
Advertising services $ 502,802 $ 544,966 $ 1,465,730 $ 1,610,231 Data licensing and other 86,831 70,968 246,009 202,182
Total revenue $ 589,633 $ 615,934 $ 1,711,739 $ 1,812,413 Three Months Ended September 30, Nine Months Ended September 30, 2017 2016 2017 2016 Revenue by geographic area:
United States $ 332,092 $ 373,954 $ 1,007,351 $ 1,124,897 Japan 90,608 73,860 237,455 189,235 Rest of World 166,933 168,120 466,933 498,281
Total revenue $ 589,633 $ 615,934 $ 1,711,739 $ 1,812,413
Property and Equipment, net
The following table sets forth property and equipment, net by geographic area (in thousands):
September 30, December 31, 2017 2016 Property and equipment, net:
United States $ 705,848 $ 728,429 International 47,469 55,472
Total property and equipment, net $ 753,317 $ 783,901
23

Note 14. Related Party Transactions
The Company has a partnership agreement for no consideration with Square, Inc., for which Jack Dorsey (the Company’s Chief ExecutiveOfficer) serves as Chief Executive Officer, to enable U.S. political donations through Tweets. Neither Square, Inc. nor the Company will pay eachother any amounts in connection with the agreement. The agreement has no impact on the Company’s financial statements.
Certain of the Company’s directors have affiliations with customers of the Company. The Company recognized revenue under contractual
obligations from such customers of $6.2 million and $16.2 million for the three and nine months ended September 30, 2017, respectively. TheCompany had outstanding receivable balances of $4.2 million from such customers as of September 30, 2017.
Note 15. Restructuring ChargesOn October 25, 2016, the Board of Directors of the Company approved a reduction in force plan (“2016 Plan”) of up to approximately 9% of
the Company’s positions globally. The reduction in force was undertaken to eliminate investment in noncore areas and drive toward greaterefficiency, while allowing the Company to continue to invest in its highest priorities.
On December 17, 2016, the Board of Directors of the Company approved a lease abandonment plan (“2016 Lease Plan”) to abandon excessoffice space with lease terms expiring through 2028.
The following table summarizes the activities related to restructuring charges, as discussed above (in thousands):
2016 Employee 2016 Termination Plan Lease Plan Charges $ 21,611 $ 79,685 Cash payment (11,629) (3,562)Non-cash and other adjustments (6,357) (19,577)Accrued as of December 31, 2016 $ 3,625 $ 56,546 Charges (1) $ 772 $ 2,824 Cash payment (4,225) (20,369)Non-cash and other adjustments 76 (3)Accrued as of September 30, 2017 $ 248 $ 38,998 Reflected in consolidated balance sheets as of September 30, 2017: Accrued and other current liabilities $ 248 $ 35,697 Other long-term liabilities $ — $ 3,301
(1) For the three months ended September 30, 2017, the Company recorded restructuring charges related to its 2016 Lease Plan of $0.5 million
within sales and marketing, $0.4 million within research and development, $0.3 million within general and administrative and $0.1 millionwithin cost of revenue in the consolidated statements of operations. For the nine months ended September 30, 2017, the Company recordedrestructuring charges related to its 2016 Lease Plan of $1.8 million within sales and marketing, $1.0 million within research and development,$0.6 million within general and administrative and $0.2 million within cost of revenue in the consolidated statements of operations.
24

I tem 2. MANAGEMENT’S DISCUSSION AND ANALYSIS OF FINANCIAL CONDITION AND RESULTS OF OPERATIONSThe following discussion and analysis of our financial condition and results of operations should be read in conjunction with the consolidated
financial statements and related notes thereto included in Item 1 “Financial Statements” in this Quarterly Report on Form 10-Q. This discussioncontains forward-looking statements that involve risks and uncertainties. Our actual results could differ materially from those discussed below.Factors that could cause or contribute to such differences include, but are not limited to, those identified below and those discussed in the sectiontitled “Risk Factors” included elsewhere in this Quarterly Report on Form 10-Q.
Overview and Highlights of Quarterly ResultsRevenue in the third quarter of 2017 totaled $589.6 million, a decrease of 4% compared to $615.9 million in the third quarter of 2016.
• Advertising revenue totaled $ 502.8 million, a decrease of 8% year-over-year.
• Data licensing and other revenue totaled $ 86.8 million, an increase of 22% year-over-year.
• U.S. revenue totaled $ 332.1 million, a decrease of 11% year-over-year.
• International revenue totaled $ 257.5 million, an increase of 6% year-over-year.
• Total ad engagements increased 99% year-over-year.
• Cost per ad engagement decreased 54% year-over-year.
Net loss was $21.1 million, a decrease of 79% year-over-year.
Non-GAAP net income was $77.8 million, an increase of 27% year-over-year.
Adjusted EBITDA was $207.0 million, an increase of 14% year-over-year.Cash, cash equivalents and short-term investments in marketable securities totaled $4.26 billion as of September 30, 2017.
Average monthly active users were 330 million for the three months ended September 30, 2017, an increase of 4% year-over-year andcompared to 326 million (1) for the three months ended June 30, 2017.
Average daily active usage for the three months ended September 30, 2017 grew 14% year-over-year. ( 1 ) Reported average Monthly Active Users reflects adjustments for approximately 1-2 million users per quarter of certain third-party applications that were included as TwitterMAUs that should not have been considered MAUs in certain prior periods. Daily Active Usage was not affected. Further details regarding the adjustment can be found in thesection titled "Note About Our MAU Adjustment."
25

Key MetricsWe review a number of metrics, including the following key metrics, to evaluate our business, measure our performance, identify trends
affecting our business, formulate business plans and make strategic decisions.
Monthly Active Users (MAUs) . We define MAUs as Twitter users who logged in or were otherwise authenticated and accessed Twitterthrough our website, mobile website, desktop or mobile applications, SMS or registered third-party applications or websites in the 30-day periodending on the date of measurement. Average MAUs for a period represent the average of the MAUs at the end of each month during the period.MAUs are a measure of the size of our logged in or otherwise authenticated active user base. In the three months ended September 30, 2017, wehad 330 million average MAUs, which represents an increase of 4% from the three months ended September 30, 2016 (1) . The growth in averageMAUs was driven by a combination of organic growth, marketing, and product, including the ongoing benefits of improved relevance in email, pushnotifications and the timeline. In the three months ended September 30, 2017, we had 69 million average MAUs in the United States and 261 millionaverage MAUs in the rest of the world, which represent increases of 4% and 4%, respectively, from the three months ended September 30, 2016.For additional information on how we calculate MAUs and factors that can affect this metric, see the section titled “Note Regarding Key Metrics.”
MAU growth is typically seasonally weak in the fourth quarter. In addition, a recent change to the Safari interface may affect some third-partyapps including Twitter. For Twitter, any impact would affect MAUs that access Twitter by using registered third party applications when thoseapplications automatically contact our servers for regular updates without discernible user-initiated action, which we refer to as third-party auto-polling MAU. However, we do not serve ads to this subset of MAUs and as a result, no revenue is generated from such MAUs .
(1) Reported average Monthly Active Users reflects adjustments for approximately 1-2 million users per quarter of certain third-party applications that were included as TwitterMAUs that should not have been considered MAUs in certain prior periods. Daily Active Usage was not affected. Further details regarding the adjustment can be found in thesection titled "Note About Our MAU Adjustment."
26

Note A bout Our MAU Adjustment We discovered that since the fourth quarter of 2014 we had included users of certain third-party applications as Twitter MAUs that should not
have been considered MAUs. These third-party applications used Digits, a software development kit of our now-divested Fabric platform, thatallowed third-party applications to send authentication messages via SMS through our systems, which did not relate to activity on the Twitterplatform. The table below presents the impact for the periods beginning in the fourth quarter of 2016. Due to our data retention policies, we do nothave data to reconcile periods prior to the fourth quarter of 2016, but our estimates suggest the prior period adjustments are smaller than those inthe fourth quarter of 2016.
Three Months Ended December 31, 2016 Three Months Ended March 31, 2017 Three Months Ended June 30, 2017
UnitedStates International Worldwide United
States International Worldwide UnitedStates International Worldwide
(in millions) Previously Reported MAU 67 252 319 70 259 328 68 260 328 Adjustment (1) — (1) (1) (1) (1) (2) — (2) (2)Adjusted MAU 67 251 318 69 257 327 68 258 326 (1) The difference between Adjusted MAU and Previously Reported MAU does not correspond to the amount of the Adjustment due to rounding.
Changes in Daily Active Users/Daily Active Usage (DAU) . We define daily active users or daily active usage as Twitter users who logged in or
were otherwise authenticated and accessed Twitter through our website, mobile website or mobile applications on any given day. Average DAU for aperiod represents the number of DAUs on each day of such period divided by the number of days for such period. Changes in DAU are a measure ofchanges in the size of our daily logged in or otherwise authenticated active user base. To calculate the year-over-year change in DAUs, we subtractthe average DAU for the three months ended in the previous year from the average DAU for the same three months ended in the current year anddivide the result by the average DAU for the three months ended in the previous year. Prior to reporting results for the third quarter of 2016, we haddiscussed DAUs and the ratio of MAUs to DAUs. In those instances, for comparability and consistency with MAUs, DAUs also included users whoaccessed Twitter through our desktop applications and third-party properties. For additional information on how we calculate changes in DAUs andfactors that can affect this metric, see the section titled “Note Regarding Key Metrics.” Reported DAU metrics were not impacted by the MAUadjustment discussed above as DAU do not include users from third-party applications.
DAU grew faster than MAU in the third quarter of 2017 as we continued to benefit from organic growth, product and marketing investmentsmade in this quarter and in prior periods.
Changes in Ad Engagements and Cost per Ad Engagement . We define an ad engagement as a user interaction with one of our pay-for-
performance advertising products. Ad engagements with our advertising products are based on a user completing an objective set out by anadvertiser such as expanding, Retweeting, liking or replying to a Promoted Tweet, viewing an embedded video, downloading or engaging with apromoted mobile application, clicking on a website link, signing up for marketing emails from advertisers, following the account that tweets aPromoted Tweet, or completing a transaction on an external website. We believe changes in ad engagements is one way to measure userengagement with our advertising products. We believe changes in cost per ad engagement is one way to measure demand.
27

In the three months ended September 30 , 2017 , ad engagements increased 99 % from the three months ended September 30 , 2016 . Theincrease was driven by a continuing mix shift toward video ad impressions as well as higher click - through rates across all ad formats on a like-for-like basis . In the three months ended September 30 , 2017 , average cost per ad engagement de creased 54 % from the three months endedSeptember 30 , 2016 . The decrease in cos t per ad engagement reflects a higher mix of video ad engagements and lower cost per ad engagementacross the majority of ad formats compared to the third quarter of 2016.
Non-GAAP Financial MeasuresTo supplement our consolidated financial statements presented in accordance with generally accepted accounting principles in the United
States, or GAAP, we consider certain financial measures that are not prepared in accordance with GAAP, including Adjusted EBITDA, non-GAAPincome before income taxes, non-GAAP provision for income taxes as it relates to the calculation of non-GAAP net income, and non-GAAP netincome. These non-GAAP financial measures are not based on any standardized methodology prescribed by GAAP and are not necessarilycomparable to similarly-titled measures presented by other companies.
Adjusted EBITDA
We define Adjusted EBITDA as net loss adjusted to exclude stock-based compensation expense, depreciation and amortization expense,interest and other expenses, provision (benefit) for income taxes, restructuring charges and one-time nonrecurring gain, if any.
The following table presents a reconciliation of net loss to Adjusted EBITDA for each of the periods indicated (in thousands): Three Months Ended September 30, Nine Months Ended September 30, 2017 2016 2017 2016 Reconciliation of Net Loss to Adjusted EBITDA Net loss $ (21,095) $ (102,871) $ (199,142) $ (289,819)
Stock-based compensation expense 100,959 158,527 331,352 477,138 Depreciation and amortization expense 97,492 100,878 303,347 282,782 Interest and other expense, net 24,810 18,220 117,613 55,007 Provision for income taxes 3,564 6,562 10,171 11,231 Restructuring charges and one-time nonrecurring gain 1,269 — (8,529) 47
Adjusted EBITDA $ 206,999 $ 181,316 $ 554,812 $ 536,386
28

Non-GAAP Net Income
We define non-GAAP net income as net loss adjusted to exclude stock-based compensation expense, amortization of acquired intangibleassets, non-cash interest expense related to convertible notes, non-cash expense related to acquisitions, impairment of investments in privately-heldcompanies, restructuring charges and one-time nonrecurring gain, and adjustment to income tax expense based on the non-GAAP measure ofprofitability using our blended U.S. statutory tax rate (which was 37%).
Non-GAAP Income before Income Taxes . We define non-GAAP income before income taxes as loss before income taxes adjusted toexclude stock-based compensation expense, amortization of acquired intangible assets, non-cash interest expense related to convertible notes, non-cash expense related to acquisitions, impairment of investments in privately-held companies, and restructuring charges and one-time nonrecurringgain.
Non-GAAP Provision for Income Taxes . We define non-GAAP provision for income taxes as the current and deferred income tax expensecommensurate with the non-GAAP measure of profitability using our blended U.S. statutory tax rate (which was 37%).
The following table presents a reconciliation of net loss to non-GAAP net income for each of the periods indicated (in thousands):
Three Months Ended September 30, Nine Months Ended September 30,
2017 2016 2017 2016 Reconciliation of Net Loss to Non-GAAP Net Income Net loss $ (21,095) $ (102,871) $ (199,142) $ (289,819)Exclude: Provision for income taxes 3,564 6,562 10,171 11,231
Loss before income taxes (17,531) (96,309) (188,971) (278,588)Stock-based compensation expense 100,959 158,527 331,352 477,138 Amortization of acquired intangible assets 11,077 16,572 41,608 42,118 Non-cash interest expense related to convertible notes 20,355 18,650 59,644 55,590 Impairment of investments in privately-held companies 7,439 — 62,439 — Restructuring charges and one-time nonrecurring gain 1,269 — (8,529) 47
Non-GAAP income before income taxes 123,568 97,440 297,543 296,305 Non-GAAP provision for income taxes 45,720 36,053 110,091 109,633
Non-GAAP net income $ 77,848 $ 61,387 $ 187,452 $ 186,672
We use non-GAAP financial measures of Adjusted EBITDA, non-GAAP income before income taxes, non-GAAP provision for income taxes,
and non-GAAP net income in evaluating our operating results and for financial and operational decision-making purposes. We believe that AdjustedEBITDA, non-GAAP income before income taxes and non-GAAP net income help identify underlying trends in our business that could otherwise bemasked by the effect of the expenses that we exclude in Adjusted EBITDA, non-GAAP income before income taxes and non-GAAP net income. Webelieve that Adjusted EBITDA, non-GAAP income before income taxes and non-GAAP net income provide useful information about our operatingresults, enhance the overall understanding of our past performance and future prospects and allow for greater transparency with respect to keymetrics used by our management in its financial and operational decision-making. We also use these measures to establish budgets and operationalgoals for managing our business and evaluating our performance.
These non-GAAP financial measures should not be considered in isolation from, or as a substitute for, financial information prepared inaccordance with GAAP. There are a number of limitations related to the use of these non-GAAP financial measures rather than net loss, which is thenearest GAAP equivalent of these financial measures. Some of these limitations are:
• These non-GAAP financial measures exclude restructuring charges, one-time nonrecurring gain and certain recurring, non-cashcharges such as stock-based compensation expense, amortization of acquired intangible assets, non-cash interest expense related toconvertible notes and impairment of investments in privately-held companies;
29

• Stock-based compensation expense has been, and will continue to be for the foreseeable future, a significant recurring expense in ourbusiness and an important part of our compens ation strategy;
• Adjusted EBITDA and non-GAAP income before income taxes do not reflect tax payments that reduce cash available to us;
• Non-GAAP net income reflects an estimate of taxes calculated in accordance with the SEC’s Non-GAAP Financial MeasuresCompliance and Disclosure Interpretation, not actual taxes due or payable;
• Adjusted EBITDA excludes depreciation and amortization expense and although these are non-cash charges, the property andequipment being depreciated and amortized may have to be replaced in the future; and
• The expenses that we exclude in our calculation of these non-GAAP financial measures may differ from the expenses, if any, that ourpeer companies may exclude from similarly-titled non-GAAP measures when they report their results of operations.
Results of Operations
The following tables set forth our consolidated statement of operations data for each of the periods presented (in thousands): Three Months Ended September 30, Nine Months Ended
September 30,
2017 2016 2017 2016 Revenue
Advertising services $ 502,802 $ 544,966 $ 1,465,730 $ 1,610,231 Data licensing and other 86,831 70,968 246,009 202,182
Total Revenue 589,633 615,934 1,711,739 1,812,413 Costs and expenses (1)
Cost of revenue 210,016 225,159 643,263 626,530 Research and development 136,115 177,049 408,014 511,354 Sales and marketing 172,957 224,436 527,847 697,226 General and administrative 63,266 67,379 203,973 200,884
Total costs and expenses 582,354 694,023 1,783,097 2,035,994 Income (loss) from operations 7,279 (78,089) (71,358) (223,581)
Interest expense (26,732) (24,860) (78,537) (74,687)Other income (expense), net 1,922 6,640 (39,076) 19,680 Loss before income taxes (17,531) (96,309) (188,971) (278,588)Provision for income taxes 3,564 6,562 10,171 11,231 Net loss $ (21,095) $ (102,871) $ (199,142) $ (289,819)
(1) Costs and expenses include stock-based compensation expense as follows (in thousands): Three Months Ended September 30, Nine Months Ended September 30, 2017 2016 2017 2016 Cost of revenue $ 5,625 $ 7,165 $ 17,830 $ 22,991 Research and development 57,174 87,163 185,185 253,658 Sales and marketing 22,433 41,227 68,216 133,184 General and administrative 15,727 22,972 60,121 67,305
Total stock-based compensation expense $ 100,959 $ 158,527 $ 331,352 $ 477,138
30

The following table sets forth our consolidated statement of operations data for each of the periods presented as a percentage of revenue: Three Months Ended September 30, Nine Months Ended September 30,
2017 2016 2017 2016 Revenue
Advertising services 85% 88% 86% 89%Data licensing and other 15 12 14 11
Total Revenue 100 100 100 100 Costs and expenses
Cost of revenue 36 37 38 35 Research and development 23 29 24 28 Sales and marketing 29 36 31 38 General and administrative 11 11 12 11
Total costs and expenses 99 113 104 112 Income (loss) from operations 1 (13) (4) (12)
Interest expense (5) (4) (5) (4)Other income (expense), net 0 1 (2) 1 Loss before income taxes (3) (16) (11) (15)Provision for income taxes 1 1 1 1 Net loss (4)% (17)% (12)% (16)%
Revenue
We generate the substantial majority of our revenue from the sale of advertising services. We also generate revenue by licensing our data tothird parties and providing mobile advertising exchange services.
Advertising Services
We generate most of our advertising revenue by selling our Promoted Products. Currently, our Promoted Products consist of the following:
• Promoted Tweets . Promoted Tweets, which are labeled as “promoted,” appear within a user’s timeline, search results or profile pagesjust like an ordinary Tweet regardless of device, whether it be desktop or mobile. Using our proprietary algorithms and understanding ofthe interests of each user, we can deliver Promoted Tweets that are intended to be relevant to a particular user. We enable ouradvertisers to target an audience based on our users’ Interest Graphs. Our Promoted Tweets are pay-for-performance advertising thatis priced through an auction. Our Promoted Tweets include objective-based features that allow advertisers to pay only for the types ofengagement selected by the advertisers, such as Tweet engagements (e.g., Retweets, replies and likes), website clicks or conversions,mobile application installs or engagements, obtaining new followers, or video views.
• Promoted Accounts . Promoted Accounts, which are labeled as “promoted,” provide a way for our advertisers to grow a community ofusers who are interested in their business, products or services. Our Promoted Accounts are pay-for-performance advertising that ispriced through an auction.
• Promoted Trends . Promoted Trends, which are labeled as “promoted,” appear at the top of the list of trending topics for an entire dayin a particular country or on a global basis. We sell our Promoted Trends on a fixed-fee-per-day basis.
While the majority of the Promoted Products we sell to our advertisers are placed on Twitter, we also generate advertising revenue by placingadvertising products that we sell to advertisers on third-party publishers’ websites, applications or other offerings.
31

Data Licensing and Other
We generate data licensing and other revenue by (i) offering data products and data licenses that allow our data partners to access, searchand analyze historical and real-time data on our platform, which data consists of public Tweets and their content, and (ii) providing mobile advertisingexchange services through our MoPub exchange. Our data partners generally purchase licenses to access all or a portion of our data for a fixedperiod. We recognize data licensing revenue as the licensed data is made available to our data partners. In addition, we operate a mobile adexchange and receive service fees from transactions completed on the exchange. Our mobile ad exchange enables buyers and sellers to purchaseand sell advertising inventory and matches buyers and sellers. We have determined we are not the principal in the purchase and sale of advertisinginventory in transactions between third party buyers and sellers on the exchange. Therefore we report revenue related to our ad exchange serviceson a net basis.
Three Months Ended
September 30, Nine Months Ended
September 30,
2017 2016 % Change 2017 2016 % Change (in thousands) (in thousands) Advertising services $ 502,802 $ 544,966 (8)% $ 1,465,730 $ 1,610,231 (9)%Data licensing and other 86,831 70,968 22% 246,009 202,182 22%
Total revenue $ 589,633 $ 615,934 (4)% $ 1,711,739 $ 1,812,413 (6)%
Revenue in the three and nine months ended September 30, 2017 decreased by $26.3 million and $100.7 million, respectively, compared to
the three and nine months ended September 30, 2016.
In the three and nine months ended September 30, 2017, advertising revenue decreased by 8% and 9%, respectively, compared to the threeand nine months ended September 30, 2016. The substantial majority of our advertising revenue was generated from our owned and operatedplatform. Advertising revenue generated from the sale of our advertising products on our owned and operated platform in the three and nine monthsended September 30, 2017 was $454.6 million and $1.31 billion, respectively, as compared to $487.2 million and $1.43 billion in the three and ninemonths ended September 30, 2016, respectively. Advertising revenue generated from the sale of our advertising products placed on third partypublishers’ websites, applications and other offerings in the three and nine months ended September 30, 2017 was $48.2 million and $159.9 million,respectively, as compared to $57.8 million and $175.0 million in the three and nine months ended September 30, 2016, respectively. The decreasein advertising revenue from the sale of our advertising products placed on third party publishers’ websites, applications and other offerings in thethree and nine months ended September 30, 2017 was driven by significantly lower contribution from TellApart (which was deprecated in the thirdquarter of 2017) , which was offset by strong performance from Twitter Audience Platform. TellApart revenue decreased by $19.9 million and $42.9million in the three and nine months ended September 30, 2017, respectively, compared to the same periods in the prior year.
The overall decrease in advertising revenue was primarily attributable to 54% and 56% decreases in average cost per ad engagement offsetby 99% and 108% increases in the number of ad engagements in the three and nine months ended September 30, 2017, respectively, compared tothe same periods in 2016. The increase in ad engagements was driven by a continuing mix shift toward video ad impressions as well as higher click-through rates across all ad formats on a like-for-like basis. The decrease in average cost per ad engagement reflects a higher mix of video adengagements and lower cost per ad engagement across the majority of ad formats compared to the third quarter of 2016.
Advertising revenue continued to be driven by strong growth in our video ad formats offset by declines in traditional Promoted Tweet anddirect response ad formats. Although we believe the potential to increase our revenue grows with growth in our user base and the level ofengagement of our users, we expect revenue growth to continue to lag audience growth on a year-over-year basis in, and possibly beyond, 2017due to lead time for sales cycles, ongoing competition and the impact from revenue products and features that we have deprecated (includingTellApart). More specifically, in the fourth quarter of 2016, we had approximately $40 million of revenue from TellApart that we will not have in thefourth quarter of 2017 as we have fully deprecated TellApart.
In the three and nine months ended September 30, 2017, data licensing and other revenue increased by 22% and 22%, respectively,compared to the three and nine months ended September 30, 2016. A majority of the increase was attributable to growth in data licensing fees fromthe offering of data products. We expect to continue to grow our data revenue with a new product and channel segmented go-to-market approach.
32

Cost of Revenue
Cost of revenue includes infrastructure costs, other direct costs including content costs, amortization of acquired intangible assets andcapitalized labor costs, allocated facilities costs, as well as traffic acquisition costs, or TAC. Infrastructure costs consist primarily of data center costsrelated to our co-located facilities, which include lease and hosting costs, related support and maintenance costs and energy and bandwidth costs;as well as depreciation of our internally developed software, servers and networking equipment; and personnel-related costs, including salaries,benefits and stock-based compensation, for our operations teams. TAC consists of costs we incur with third parties in connection with the sale toadvertisers of our advertising products that we place on third-party publishers’ websites, applications or other offerings collectively resulting fromacquisitions, and from our organically-built advertising network, Twitter Audience Platform. Many of the elements of our cost of revenue are fixed,and cannot be reduced in the near term.
Three Months Ended
September 30, Nine Months Ended
September 30,
2017 2016 % Change 2017 2016 % Change (in thousands) (in thousands) Cost of revenue $ 210,016 $ 225,159 (7)% $ 643,263 $ 626,530 3%Cost of revenue as a percentage of revenue 36% 37% 38% 35%
In the three months ended September 30, 2017, cost of revenue, which included TAC of $22.9 million, decreased by $15.1 million compared
to the three months ended September 30, 2016. The decrease was attributable to a $19.0 million decrease in infrastructure costs, a $9.7 milliondecrease in TAC substantially due to the decrease in advertising revenue generated from TellApart , a $1.3 million decrease in depreciation andamortization expense and a $0.6 million decrease in other costs, offset by a $15.5 million increase in other direct costs that is primarily driven by anincrease in content costs .
In the nine months ended September 30, 2017, cost of revenue, which included TAC of $78.8 million, increased by $16.7 million compared to
the nine months ended September 30, 2016. The increase was attributable to a $43.1 million increase in other direct costs that is primarily driven byan increase in content costs, and a $19.9 million increase in depreciation and amortization expense primarily related to additional internallydeveloped software, server and networking equipment. These increases were offset by a $25.9 million decrease in infrastructure costs, an $18.1million decrease in TAC substantially due to the decrease in advertising revenue generated from TellApart , and a $2.3 million decrease inpersonnel-related costs.
Cost of revenue typically increases in absolute dollars in the fourth quarter. Cost of revenue varies as a result of infrastructure costs, content
costs, and off network advertising costs. We expect historical fourth-quarter trends for cost of revenue to continue in the fourth quarter of 2017.
Research and Development
Research and development expenses consist primarily of personnel-related costs, including salaries, benefits and stock-based compensation,for our engineers and other employees engaged in the research and development of our products and services. In addition, research anddevelopment expenses include amortization of acquired intangible assets, allocated facilities and other supporting overhead costs.
Three Months Ended
September 30, Nine Months Ended
September 30,
2017 2016 % Change 2017 2016 % Change (in thousands) (in thousands) Research and development $ 136,115 $ 177,049 (23)% $ 408,014 $ 511,354 (20)%Research and development as a percentageof revenue
23% 29% 24% 28%
In the three months ended September 30, 2017, research and development expenses decreased by $40.9 million compared to the three
months ended September 30, 2016. The decrease was attributable to a $45.9 million decrease in personnel-related costs, mainly driven by adecrease in recognition of stock-based compensation expense, and a $6.6 million decrease in allocated facilities and other supporting overheadexpenses due to a decrease in overall total expenses, offset by an $11.6 million decrease in the capitalization of costs associated with developingsoftware for internal use.
33

In the nine months ended September 30, 2017 , research and development expenses de creased by $ 103.3 million compared to the ninemonths ended September 30, 2016 . The decrease was attributable to a $ 97.1 million decrease in personnel-related costs, mainly driven by a decrease in recognition of stock-based compensation expense , a $14.8 million decrease in allocated facilities and other supporting overheadexpenses due to a decrease in overall total expenses, an $ 11.1 million one-time nonrecurring gain net of restructuring charges in the quarter endedMarch 31, 2017 , and a $ 1.6 million decrease in depreciation and amortization expense , offset by a $ 21.3 million decrease in the capitalization ofcosts associated with developing software for internal use .
We plan to continue to invest in key areas of our business to ensure that we have the right level of engineering, product management anddesign teams to support our research and development efforts. We expect that both research and development headcount and costs in absolutedollars will increase in the near term but will vary from period to period as a percentage of revenue.
Sales and Marketing
Sales and marketing expenses consist primarily of personnel-related costs, including salaries, commissions, benefits and stock-basedcompensation for our employees engaged in sales, sales support, business development and media, marketing, corporate communications andcustomer service functions. In addition, marketing and sales-related expenses also include advertising costs, market research, tradeshows,branding, marketing, public relations costs, amortization of acquired intangible assets, as well as allocated facilities and other supporting overheadcosts.
Three Months Ended
September 30, Nine Months Ended
September 30,
2017 2016 % Change 2017 2016 % Change (in thousands) (in thousands) Sales and marketing $ 172,957 $ 224,436 (23)% $ 527,847 $ 697,226 (24)%Sales and marketing as a percentage ofrevenue
29% 36% 31% 38%
In the three months ended September 30, 2017, sales and marketing expenses decreased by $51.5 million compared to the three months
ended September 30, 2016. The decrease was attributable to a $34.0 million decrease in personnel-related costs, driven by a decrease in averageemployee headcount mainly as a result of our 2016 restructuring plan, an $8.7 million decrease in marketing and sales-related expenses, a$7.7 million decrease in allocated facilities and other supporting overhead expenses due to a decrease in overall total expenses, and a $1.6 milliondecrease in amortization of acquired intangible assets, offset by a $0.5 million increase in other expenses.
In the nine months ended September 30, 2017, sales and marketing expenses decreased by $169.4 million compared to the nine months
ended September 30, 2016. The decrease was attributable to a $110.2 million decrease in personnel-related costs, driven by a decrease in averageemployee headcount mainly as a result of our 2016 restructuring plan, a $40.1 million decrease in marketing and sales-related expenses, and a$24.5 million decrease in allocated facilities and other supporting overhead expenses due to a decrease in overall total expenses. These decreaseswere offset by a $3.6 million increase in amortization of acquired intangible assets and a $1.8 million increase in restructuring expenses.
We continue to evaluate key areas in our business to ensure we have the right level of sales and marketing to execute on our key prioritiesand objectives. We expect that both sales and marketing headcount and costs in absolute dollars will increase in the near term but will vary fromperiod to period as a percentage of revenue.
34

General and Administrative
General and administrative expenses consist primarily of personnel-related costs, including salaries, benefits and stock-based compensation,for our executive, finance, legal, information technology, human resources and other administrative employees. In addition, general andadministrative expenses include fees and costs for professional services, including consulting, third-party legal and accounting services and facilitiesand other supporting overhead costs that are not allocated to other departments.
Three Months Ended
September 30, Nine Months Ended
September 30,
2017 2016 % Change 2017 2016 % Change (in thousands) (in thousands) General and administrative $ 63,266 $ 67,379 (6)% $ 203,973 $ 200,884 2%General and administrative as a percentage ofrevenue
11% 11% 12% 11%
In the three months ended September 30, 2017, general and administrative expense decreased by $4.1 million compared to the three months
ended September 30, 2016. The decrease was attributable to a $4.3 million decrease in personnel-related costs, mainly driven by a decrease inrecognition of stock-based compensation expense, offset by a $0.2 million increase in other expenses.
In the nine months ended September 30, 2017, general and administrative expense increased by $3.1 million compared to the nine months
ended September 30, 2016. The increase was attributable to a $3.5 million increase in fees and costs for professional services, a $3.1 millionincrease in personnel-related costs, mainly driven by an increase in average employee headcount, and a $1.3 million increase in other expenses,offset by a $4.8 million decrease in facilities and supporting costs.
We plan to continue to invest in key areas of our business and ensure that we have the right level of general and administrative support onour key priorities and objectives. We expect that general and administrative expenses will vary in the near term from period to period as apercentage of revenue.
Interest Expense
Interest expense consists primarily of interest expense incurred in connection with the $935.0 million principal amount of 0.25% convertiblesenior notes due 2019, or the 2019 Notes, and $954.0 million principal amount of 1.00% convertible senior notes due 2021, or the 2021 Notes andtogether with the 2019 Notes, the Notes, and interest expense related to capital leases and other financing facilities.
Three Months Ended
September 30, Nine Months Ended
September 30,
2017 2016 % Change 2017 2016 % Change (in thousands) (in thousands) Interest expense $ 26,732 $ 24,860 8% $ 78,537 $ 74,687 5%
In the three and nine months ended September 30, 2017, interest expense increased by $1.9 million and $3.9 million, respectively, comparedto the three and nine months ended September 30, 2016. Interest expense in the three and nine months ended September 30, 2017 was comprisedof $25.2 million and $74.3 million, respectively, of total interest expense related to the Notes as well as the credit facility and $1.5 million and $4.2million, respectively, related to capital leases of equipment.
35

Other Income (Expense), Net
Other income (expense), net, consists primarily of interest income resulting from our short-term investments net of the related amortization ofpremium paid on such investments, and unrealized foreign exchange gains and losses due to re-measurement of monetary assets and liabilitiesdenominated in non-functional currencies as well as realized foreign exchange gains and losses on foreign exchange transactions. We expect ourforeign exchange gains and losses will vary depending upon movements in the underlying exchange rates.
Three Months Ended
September 30, Nine Months Ended
September 30,
2017 2016 % Change 2017 2016 % Change (in thousands) (in thousands) Other income (expense), net $ 1,922 $ 6,640 (71)% $ (39,076) $ 19,680 (299)%
Other income, net, decreased by $4.7 million in the three months ended September 30, 2017 compared to the three months endedSeptember 30, 2016. The change was primarily attributable to the recording of other-than-temporary impairment on a cost-method investment of$7.4 million during the three months ended September 30, 2017 and less favorable foreign currency exchange impacts from foreign currency-denominated assets and liabilities as well as derivative financial instruments, offset by an increase in interest income on our short term investments.
Other expense, net, was $39.1 million in the nine months ended September 30, 2017 compared to other income, net of $19.7 million in the
nine months ended September 30, 2016. The change was primarily attributable to the recording of other-than-temporary impairment on a cost-method investment of $62.4 million during the nine months ended September 30, 2017 and less favorable foreign currency exchange impacts fromforeign currency-denominated assets and liabilities as well as derivative financial instruments, offset by an increase in interest income on our shortterm investments.
Other income, net in the three months ended September 30, 2017 was comprised of $11.7 million of interest and other income, offset by $7.4
million of other-than-temporary impairment on a cost-method investment, $2.1 million of foreign currency exchange net loss and $0.3 million of otherexpense. Other expense, net in the nine months ended September 30, 2017 was comprised of $62.4 million of other-than-temporary impairment ona cost-method investment, $6.2 million of foreign currency exchange net loss and $0.7 million of other expense, offset by $30.2 million of interestand other income.
Provision (Benefit) for Income Taxes
Provision (benefit) for income taxes consists of federal and state income taxes in the United States and income taxes in certain foreignjurisdictions which are expected to fluctuate based on the pre-tax results within and outside of the United States and will also be impacted by ourallocation of centrally incurred costs to foreign jurisdictions. Our future effective tax rate will also be affected by the changes in tax rates and taxregulations, the impact of tax examinations, the impact of business combinations, and changes in valuation allowance. In addition, the provision isimpacted by deferred income taxes and changes in the related valuation allowance reflecting the net tax effects of temporary differences betweenthe carrying amounts of assets and liabilities for financial reporting purposes and the amounts used for income tax purposes.
Three Months Ended September 30, Nine Months Ended September 30, 2017 2016 2017 2016
(in thousands) (in thousands) Provision for income taxes $ 3,564 $ 6,562 $ 10,171 $ 11,231
Our provision for income taxes in the three and nine months ended September 30, 2017 decreased by $3.0 million and $1.1 million,
respectively, compared to the three and nine months ended September 30, 2016, primarily due to increased deferred tax benefits resulting fromintraperiod allocation, partially offset by increased foreign income taxes.
Upon adoption of the stock-based compensation expense simplification rule including the income tax consequences as of January 1, 2017,
we had approximately $1.18 billion of federal and $0.17 billion of state net deferred tax assets and concurrently we set up a full valuation allowanceagainst these deferred tax assets. As of the fiscal year ending December 31, 2016 and for each of the interim periods through September 30, 2017,management completed its reassessment of the realizability of this asset and has concluded that a full valuation allowance was still required.
36

Evaluating the need for and the amount of a valuation allowance for deferred tax assets often requires significant judgment and extensiveanalysis of all available evidence to determine whether it is more likely than not (a probability level of more than 5 0%) that these assets will berealized. In completing this assessment management must consider both objective and subjective factors in its assessment. These factors include,but are not limited to:
• Future reversal of existing temporary differences • Tax-planning strategies • Future taxable income exclusive of reversing temporary differences and loss carryforwards
As we continue to make significant strides in optimizing operations resulting in improved financial results, our future reassessment is likely toresult in the determination that a valuation allowance is no longer required. This would result in such future financial reporting period in a significantreversal of the valuation allowance and a corresponding material non-cash income tax benefit and the recording of a deferred tax asset on ourbalance sheet.
Liquidity and Capital Resources
Nine Months Ended September 30, 2017 2016 (in thousands) Consolidated Statements of Cash Flows Data: Net loss $ (199,142) $ (289,819)Net cash provided by operating activities 633,102 566,512 Net cash provided by (used in) investing activities 21,963 (410,436)Net cash used in financing activities (65,843) (61,534)
Our principal sources of liquidity are our cash, cash equivalents, and short-term investments in marketable securities. Our cash equivalents
and marketable securities are invested primarily in short-term fixed income securities, including government and investment-grade debt securitiesand money market funds. In addition, we have access to funds under our credit facility (as described below) and have, in the past, accessed thecapital markets.
As of September 30, 2017, we had $4.26 billion of cash, cash equivalents and short-term investments in marketable securities, of which$217.5 million was held by our foreign subsidiaries. Under the current tax laws, if these funds are needed for our operations in the U.S., we would berequired to accrue and pay U.S. taxes to repatriate certain of these funds. However, our intent is to indefinitely reinvest these funds outside of theU.S. and our current plans do not demonstrate a need to repatriate them to fund our U.S. operations. In addition, we have a revolving unsecuredcredit facility (described below) available to borrow up to $1.0 billion. We believe that our existing cash, cash equivalents and short-term investmentbalance, and our credit facility, together with cash generated from operations will be sufficient to meet our working capital and capital expenditurerequirements for at least the next 12 months.
Credit FacilityIn October 2013, we entered into a revolving credit agreement with certain lenders which provides for a $1.0 billion revolving unsecured credit
facility maturing on October 22, 2018. We are obligated to pay interest on loans under the credit facility and other customary fees for a credit facilityof this size and type, including an upfront fee and an unused commitment fee. Our obligations under the credit facility are guaranteed by one of ourwholly-owned subsidiaries. In addition, the credit facility contains restrictions on payments including cash payment of dividends. As of September 30,2017, no amounts had been drawn under the credit facility.
Operating Activities
Cash provided by operating activities consists of net loss adjusted for certain non-cash items including depreciation and amortization, stock-based compensation, amortization of discount on our Notes, deferred income taxes, impairment of investments in privately-held companies, non-cash restructuring charges, as well as the effect of changes in working capital and other activities. We expect that cash provided by operatingactivities will fluctuate in future periods as a result of a number of factors, including fluctuations in our revenue, increases in operating expenses andcosts related to acquisitions. For additional discussion, see “Part II—Other Information, Item 1A. Risk Factors.”
37

Cash provided by operating activities in the nine months ended September 30 , 2017 was $ 633.1 million, an increase in cash inflow of $ 66.6 million compared to the nine months ended September 30 , 2016 . Cash provided by operating activities was driven by a net loss of $ 199.1 million, as adjusted for the exclusion of non-cash expenses totaling $ 754.2 million, of which $ 331.4 million was related to stock-basedcompensation expense , $303.3 million was related to depreciation and amortization expense and $ 62. 4 million was related to other-than-temporary impairment on a cost-method investment , and the effect of changes in working capital and other carrying balances that resulted in cash inflow s of $ 78.0 million.
Cash provided by operating activities in the nine months ended September 30, 2016 was $566.5 million. Cash provided by operating activitieswas driven by a net loss of $289.8 million, as adjusted for the exclusion of non-cash expenses totaling $827.2 million, of which $477.1 million wasrelated to stock-based compensation expense, and the effect of changes in working capital and other carrying balances that resulted in cash inflowsof $29.1 million.
Investing Activities
Our primary investing activities consist of purchases of property and equipment, particularly purchases of servers and networking equipment,leasehold improvements for our facilities, purchases and disposal of marketable securities, strategic investments in privately-held companies,acquisitions of businesses and other activities.
Cash provided by investing activities in the nine months ended September 30, 2017 was $22.0 million, compared to $410.4 million cash usedin investing activities in the nine months ended September 30, 2016. The change was primarily due to a $257.6 million decrease in the purchases ofmarketable securities, an $80.7 million decrease in purchases of investments in privately-held companies, a net $80.1 million decrease in cash usedin business combinations, a $52.8 million decrease in purchases of property and equipment, a $35.0 million increase in proceeds from sale of long-lived assets and a $0.9 million decrease in expenditures on other investing activities, offset by $74.7 million decrease in proceeds from sales andmaturities of marketable securities.
We anticipate making capital expenditures of no more than $110 million in the fourth quarter of 2017, a portion of which we may financethrough capital leases, as we continue to expand our co-located data centers.
Financing Activities
Our primary financing activities consist of issuances of securities, capital lease financing and stock option exercises by employees.
Cash used in financing activities in the nine months ended September 30, 2017 was $65.8 million, an increase in cash outflow of $4.3 millioncompared to the nine months ended September 30, 2016. The increase in cash outflow was due to a $6.8 million increase in payments of capitallease obligations and a $1.8 million decrease in proceeds from the issuance of shares of stock from the ESPP. These increases were offset by a net$3.5 million decrease in tax payments related to net share settlements of equity awards and other activities and a net $0.8 million increase inproceeds from option exercises.
Off Balance Sheet ArrangementsWe do not have any off-balance sheet arrangements and did not have any such arrangements as of September 30, 2017.
Contractual ObligationsThere were no material changes in our commitments under contractual obligations except for scheduled payments from the ongoing business,
as disclosed in our Annual Report on Form 10-K for the fiscal year ended December 31, 2016.
38

Critical Accounting Policies and EstimatesWe prepare our consolidated financial statements in accordance with GAAP. In doing so, we make estimates and assumptions that affect our
reported amounts of assets, liabilities, revenue and expenses, as well as related disclosure of contingent assets and liabilities. To the extent thatthere are material differences between these estimates and actual results, our financial condition or operating results would be affected. We baseour estimates on past experience and other assumptions that we believe are reasonable under the circumstances, and we evaluate these estimateson an ongoing basis. We refer to accounting estimates of this type as critical accounting policies and estimates. Please refer to “Management’sDiscussion and Analysis of Financial Condition and Results of Operations” contained in Part II, Item 7 of our Annual Report on Form 10-K for thefiscal year ended December 31, 2016 for a more complete discussion of our critical accounting policies and estimates.
There have been no material changes to our critical accounting policies and estimates as compared to the critical accounting policies andestimates described in our Annual Report on Form 10-K for the fiscal year ended December 31, 2016.
Recent Accounting Pronouncements
For information with respect to recent accounting pronouncements and the impact of these pronouncements on our consolidated financialstatements, see Note 1 – “Description of Business and Summary of Significant Accounting Policies” in the notes to the consolidated financialstatements included in Part I of this Quarterly Report on Form 10-Q.
39

I tem 3. QUANTITATIVE AND QUALITATIVE DISCLOSURES ABOUT MARKET RISKWe have operations both within the United States and internationally, and we are exposed to market risks in the ordinary course of our
business. These risks include primarily interest rate and foreign exchange risks.
Interest Rate Fluctuation Risk
Our investment portfolio mainly consists of short-term fixed income securities, including government and investment-grade debt securities andmoney market funds. These securities are classified as available-for-sale and, consequently, are recorded in the consolidated balance sheets at fairvalue with unrealized gains or losses, net of tax reported as a separate component of accumulated other comprehensive loss. Our investment policyand strategy is focused on the preservation of capital and supporting our liquidity requirements. We do not enter into investments for trading orspeculative purposes.
A rise in interest rates could have a material adverse impact on the fair value of our investment portfolio. Based on our investment portfoliobalance as of September 30, 2017, a hypothetical increase in interest rates of 100 basis points would result in a decrease of approximately$13.4 million in the fair value of our available-for-sale securities. We currently do not hedge these interest rate exposures.
In 2014, we issued Notes with an aggregate principal amount of $1.89 billion. We carry the Notes at face value less amortized discount on theconsolidated balance sheet. Since the Notes bear interest at fixed rates, we have no financial statement risk associated with changes in interestrates. However, the fair value of the Notes changes when the market price of our stock fluctuates or interest rates change.
Foreign Currency Exchange Risk
Transaction Exposure
We transact business in various foreign currencies and have international revenue, as well as costs denominated in foreign currencies,primarily the Euro, British Pound, Singapore Dollar and Japanese Yen. This exposes us to the risk of fluctuations in foreign currency exchange rates.Accordingly, changes in exchange rates, and in particular a continuing strengthening of the U.S. dollar, would negatively affect our revenue andother operating results as expressed in U.S. dollars.
We have experienced and will continue to experience fluctuations in our net loss as a result of transaction gains or losses related to revaluingand ultimately settling certain asset and liability balances that are denominated in currencies other than the functional currency of the entities inwhich they are recorded. Net realized and unrealized foreign currency gains were immaterial for the three and nine months ended September 30,2017 and 2016. We currently utilize foreign currency forward contracts with financial institutions to reduce the risk that our earnings may beadversely affected by the impact of exchange rate fluctuations on monetary assets or liabilities denominated in currencies other than the localcurrency of a subsidiary. These contracts are not designated as hedging instruments. We may in the future enter into other derivative financialinstruments if it is determined that such hedging activities are appropriate to further reduce our foreign currency exchange risk. Based on our foreigncurrency exposures from monetary assets and liabilities net of our open hedge position, we estimated that a 10% change in exchange rates againstthe U.S. dollars would have resulted in a gain or loss of approximately $9.6 million as of September 30, 2017.
Translation Exposure
We are also exposed to foreign exchange rate fluctuations as we translate the financial statements of our foreign subsidiaries into U.S. dollarsin consolidation. If there is a change in foreign currency exchange rates, the translating adjustments resulting from the conversion of our foreignsubsidiaries’ financial statements into U.S. dollars would result in a gain or loss recorded as a component of accumulated other comprehensive losswhich is part of stockholders’ equity.
40

I tem 4. CONTROLS AND PROCEDURESEvaluation of Disclosure Controls and Procedures
Our management, with the participation of our Chief Executive Officer and our Chief Financial Officer, has evaluated the effectiveness of ourdisclosure controls and procedures as of the end of the period covered by this Quarterly Report on Form 10-Q. The term “disclosure controls andprocedures,” as defined in Rules 13a-15(e) and 15d-15(e) under the Securities Exchange Act of 1934, as amended (the “Exchange Act”), meanscontrols and other procedures of a company that are designed to ensure that information required to be disclosed by a company in the reports that itfiles or submits under the Exchange Act is recorded, processed, summarized and reported, within the time periods specified in the Securities andExchange Commission’s rules and forms. Disclosure controls and procedures include, without limitation, controls and procedures designed toensure that information required to be disclosed by a company in the reports that it files or submits under the Exchange Act is accumulated andcommunicated to the company’s management, including its principal executive and principal financial officers, or persons performing similarfunctions, as appropriate to allow timely decisions regarding required disclosure. Management recognizes that any controls and procedures, nomatter how well designed and operated, can provide only reasonable assurance of achieving their objectives and management necessarily appliesits judgment in evaluating the cost-benefit relationship of possible controls and procedures. The design of disclosure controls and procedures andinternal control over financial reporting must reflect the fact that there are resource constraints and that management is required to apply judgment inevaluating the benefits of possible controls and procedures relative to their costs. Based on such evaluation, our Chief Executive Officer and ChiefFinancial Officer have concluded that, as of September 30, 2017, our disclosure controls and procedures were designed at a reasonable assurancelevel and were effective to provide reasonable assurance.
Changes in Internal Control over Financial Reporting
There was no change in our internal control over financial reporting identified in connection with the evaluation required by Rule 13a-15(d) or15d-15(d) of the Exchange Act that occurred during the period covered by this Quarterly Report on Form 10-Q that has materially affected, or isreasonably likely to materially affect, our internal control over financial reporting.
41

P ART II – OTHER INFORMATION Item 1. LEGAL PROCEEDINGS
We are currently involved in, and may in the future be involved in, legal proceedings, claims, investigations, and government inquiries arisingin the ordinary course of business. These proceedings, in the form of both individual and class action litigation, have included, but are not limited tomatters involving intellectual property, defamation, privacy, securities, employment and contractual rights. For example, we currently have pendingshareholder class action lawsuits alleging violations of securities laws filed in the U.S. District Court for the Northern District of California and theSuperior Court for San Mateo County in California, naming current and former officers as defendants. Legal risk is enhanced in certain jurisdictionsoutside the United States where our protection from liability for content published on our platform by third parties may be unclear and where we maybe less protected under local laws than we are in the United States. Future litigation may be necessary, among other things, to defend ourselves,and our users, by determining the scope, enforceability, and validity of third-party rights or to establish our rights.
Although the results of the legal proceedings, claims, investigations, and government inquiries in which we are involved cannot be predictedwith certainty, we do not believe that there is a reasonable possibility that the final outcome of these matters will have a material adverse effect onour business, financial condition, operating results, or prospects. However, the final results of any current or future proceeding cannot be predictedwith certainty, and until there is final resolution on any such matter that we may be required to accrue for, we may be exposed to loss in excess ofthe amount accrued. Regardless of the outcome, litigation can have an adverse impact on us because of defense and settlement costs, diversion ofmanagement resources, and other factors.
Item 1A. RISK FACTORS
Investing in our common stock involves a high degree of risk. You should carefully consider the risks and uncertainties described below,together with all of the other information in this Quarterly Report on Form 10-Q, including the section titled “Management’s Discussion and Analysisof Financial Condition and Results of Operations” and our consolidated financial statements and related notes, before making a decision to invest inour common stock. The risks and uncertainties described below may not be the only ones we face. If any of the risks actually occurs, our business,financial condition, operating results, cash flows and prospects could be materially and adversely affected. In that event, the market price of ourcommon stock could decline, and you could lose part or all of your investment.
42

Risks Related to Our Business and Ou r IndustryIf we fail to grow our user base, or if user engagement or ad engagement on our platform decline, our revenue, business and operatingresults may be harmed.
The size of our user base and our users’ level of engagement are critical to our success. We had 330 million average MAUs in the threemonths ended September 30, 2017, representing approximately a 4% increase from 317 million average MAUs in the three months endedSeptember 30, 2016 (see “Management’s Discussion and Analysis of Financial Condition and Results of Operations – Note About Our MAUAdjustment” above). DAUs for the three months ended September 30, 2017 increased 14% year over year. Our financial performance has been andwill continue to be significantly determined by our success in growing the number of users and increasing their overall level of engagement on ourplatform as well as the number of ad engagements. We anticipate that our user growth rate will continue to slow over time as the size of our userbase increases. For example, in general, a higher proportion of Internet users in the United States uses Twitter than Internet users in other countriesand, in the future, we expect our user growth rate in certain international markets, such as Germany, India, Japan, Saudi Arabia, South Korea andThailand, to continue to be higher than our user growth rate in the United States. To the extent our logged-in user growth rate slows, our success willbecome increasingly dependent on our ability to increase levels of ad engagement on Twitter and monetizing our total audience on logged-out usageand syndicated properties as well as increasing revenue growth from the sale to advertisers of our advertising products which we place on Twitterproperties and third party publishers’ websites, applications and other offerings. We generate a substantial majority of our revenue based uponengagement by our users with the ads that we display. If people do not perceive our products and services to be useful, reliable and trustworthy, wemay not be able to attract users or increase the frequency of their engagement with our platform and the ads that we display. A number ofconsumer-oriented websites that achieved early popularity have seen their user bases or levels of engagement decline, in some cases precipitously.There is no guarantee that we will not experience a similar erosion of our user base or engagement levels. A number of factors could potentiallynegatively affect user growth and engagement, including if:
• users, including influential users, such as world leaders, government officials, celebrities, athletes, journalists, sports teams, mediaoutlets and brands or certain age demographics, engage with other products, services or activities as an alternative to ours;
• we are unable to convince potential or new users of the value and usefulness of our products and services;
• there is a decrease in the perceived quantity, quality, usefulness or relevance of the content generated by our users or contentpartners;
• our content partners terminate their relationships with us or do not renew their agreements on economic or other terms that arefavorable to us;
• there are user concerns related to privacy and communication, safety, security, spam or other hostile or inappropriate usage or otherfactors;
• we fail to introduce new and improved products or services or if we introduce new or improved products or services that are notfavorably received or that negatively affect user engagement;
• technical or other problems prevent us from delivering our products or services in a rapid and reliable manner or otherwise affect theuser experience, including issues with connecting to the Internet;
• users have difficulty installing, updating, or otherwise accessing our products or services on mobile devices as a result of actions by usor third parties that we rely on to distribute our products and deliver our services;
• we are unable to manage and prioritize information to ensure users are presented with content that is interesting, useful and relevant tothem;
• users believe that their experience is diminished as a result of the decisions we make with respect to the frequency, format, relevanceand prominence of ads that we display;
• there are adverse changes in our products or services that are mandated by, or that we elect to make to address, laws, legislation,inquiries from legislative bodies, regulatory authorities or litigation, including settlements or consent decrees;
• we fail to provide adequate customer service to users; or
• we do not maintain our brand image or our reputation is damaged.
43

We believe that returning to meaningful MAU growth is dependent on improving our product and feat ure offerings to demonstrate our valueproposition to a larger audience. If we are unable to increase our user base, user growth rate or user engagement, or if these metrics decline, ourproducts and services could be less attractive to potential or new us ers, as well as to advertisers , content partners and platform partners , whichwould have a material and adverse impact on our business, financial condition and operating results.
If our users or content partners do not continue to contribute content or such content is not viewed as unique or engaging by other users,we may experience a decline in the number of users accessing our products and services and user engagement, which could result in theloss of content partners, advertisers, platform partners and revenue.
Our success depends on our ability to provide users of our products and services with unique and engaging content, which in turn depends onthe content contributed by our users. We believe that one of our competitive advantages is the quality, quantity and real-time nature of the contenton Twitter, and that access to unique or real-time content is one of the main reasons users visit Twitter. We seek to foster a broad and engaged usercommunity, and we encourage world leaders, government officials, celebrities, athletes, journalists, sports teams, media outlets and brands to useour products and services to express their views to broad audiences. We also encourage media outlets to use our products and services to distributetheir content. In addition, we license our premium live streaming video content from a variety of content providers. If these content providers are nolonger willing or able to license us content upon economic and other terms that are acceptable to us, our ability to stream such content will beadversely affected and/or our costs could increase. If users, including influential users, do not continue to contribute content or content providers donot license content to Twitter, and we are unable to provide users with unique, engaging and timely content, our user base and user engagementmay decline. Additionally, if we are not able to address user concerns regarding the safety and security of our products and services or if we areunable to successfully prevent abusive or other hostile behavior on our platform, the size of our user base and user engagement may decline. Werely on the sale of advertising services for the substantial majority of our revenue and a decline in the number of users, user growth rate, or userengagement, including as a result of the loss of world leaders, government officials, celebrities, athletes, journalists, sports teams, media outlets andbrands who generate content on Twitter, advertisers may deter new advertisers from using our products or services or cause current advertisers toreduce their spending with us or cease doing business with us, which would harm our business and operating results.
We generate the substantial majority of our revenue from advertising. The loss of advertising revenue could harm our business.
The substantial majority of our revenue is currently generated from third parties advertising on Twitter. We generated approximately 89% and86% of our revenue from advertising in the fiscal year ended December 31, 2016 and the nine months ended September 30, 2017, respectively. Wegenerate substantially all of our advertising revenue through the sale of our three Promoted Products: Promoted Tweets, Promoted Accounts andPromoted Trends. As is common in our industry, our advertisers do not have long-term advertising commitments with us. In addition, many of ouradvertisers purchase our advertising services through one of several large advertising agency holding companies. To sustain or increase ourrevenue, we must add new advertisers and encourage existing advertisers to maintain or increase the amount of advertising inventory purchasedthrough our platform and adopt new features and functionalities that we add to our platform. However, advertising agencies and potential newadvertisers may view our Promoted Products or any new products or services we offer as experimental and unproven, and we may need to devoteadditional time and resources to educate them about our products and services. Advertisers also may choose to reach users through our freeproducts and services, instead of our Promoted Products. Advertisers will not continue to do business with us, or they will reduce the prices they arewilling to pay to advertise with us, if we do not deliver ads in an effective manner, or if they do not believe that their investment in advertising with uswill generate a competitive return on investment relative to alternatives, including online, mobile and traditional advertising platforms. In addition,competition for advertising is becoming increasingly more intense and our advertising revenue could be further impacted by escalating competitionfor digital ad spending as well as the re-evaluation of our revenue product feature portfolio, which could result in the de-emphasis of certain productfeatures. Since our initial public offering, our revenue growth has been primarily driven by increases in the number of our users and increases in ourad load driven by strong advertiser demand as well as other factors. To date, our available advertising inventory has been greater than demand. Ourfuture revenue growth, however, may be limited by available advertising inventory for specific ad types on certain days if we do not increase thenumber of our users, their engagement or monetize our larger global audience. Our advertising revenue also could be adversely affected by anumber of other factors, including:
• decreases in user engagement with the ads on our platform and those that we serve off of our platform;
• decreases in the size of our user base or user growth rate;
44

• if we are unable to demonstrate the value of our Promoted Products to advertisers and advertising agencies or if we are unable tomeasure the value of our Promoted Products in a manner which advertisers and advertising agencies find us eful;
• if we are unable to demonstrate the value of, or attract video and video advertisements on, our platform;
• decreases in the perceived quantity, quality, usefulness or relevance of the content generated by our users or content partners;
• if our Promoted Products are not cost effective or not valued by certain types of advertisers or if we are unable to develop cost effectiveor valuable advertising services for different types of advertisers;
• if we are unable to convince advertisers and brands to invest resources in learning to use our products and services and maintaining abrand presence on Twitter;
• our advertisers’ ability to optimize their campaigns or effectively and reliably measure the results of their campaigns;
• product or service changes we may make that change the frequency or relative prominence of ads displayed on Twitter or thatdetrimentally impact revenue in the near term with the goal of achieving long term benefits;
• our inability to increase advertiser demand and spend from new and existing advertisers as well as advertising inventory;
• our inability to increase the relevance of ads shown to users;
• our inability to help advertisers effectively target ads, including as a result of the fact that we do not collect extensive personalinformation from our users and that we do not have real-time geographic information for all of our users particularly for ads servedthrough our app mobile-focused advertising exchange;
• decreases in the cost per ad engagement;
• failure to effectively monetize our growing international user base, our logged-out audience or our syndicated audience;
• loss of advertising market share to our competitors;
• the degree to which users access Twitter content through applications that do not contain our ads;
• any arrangements or other partnerships with third parties to share our revenue;
• if our new advertising strategies do not gain traction;
• the impact of new technologies that could block or obscure the display of our ads;
• adverse legal developments relating to advertising or measurement tools related to our metrics or the effectiveness of advertising,including legislative and regulatory developments, and developments in litigation;
• our inability to create new products, product features and services that sustain or increase the value of our advertising services to bothour advertisers and our users;
• changes to our products or development of new products or product features that decrease users’ ad engagements or limit the types ofuser interactions that we count as ad engagements;
• the impact of fraudulent clicks or spam on our Promoted Products and our users;
• changes in the way our advertising is priced; and
• the impact of macroeconomic conditions and conditions in the advertising industry in general.
The occurrence of any of these or other factors could result in a reduction in demand for our ads, which may reduce the prices we receive forour ads, either of which would negatively affect our revenue and operating results.
45

If we are unable to compete effe ctively for users and advertiser spend, our business and operating results could be harmed.
Competition for users of our products and services is intense. Although we have developed a global platform that we believe is the best andfastest place to see what’s happening and what people are talking about all around the world, we face strong competition in our business. Wecompete against many companies to attract and engage users, including companies which have greater financial resources and substantially largeruser bases, such as Facebook (including Instagram and WhatsApp), Alphabet (including YouTube), Microsoft (including LinkedIn), Snap and Oath(formerly known as Yahoo), which offer a variety of Internet and mobile device-based products, services and content. For example, Facebookoperates a social networking site with significantly more users than Twitter and has been introducing features similar to those of Twitter. In addition,Alphabet may use its strong position in one or more markets to gain a competitive advantage over us in areas in which we operate, including byintegrating competing features into products or services they control. As a result, our competitors may draw users towards their products or servicesand away from ours. This could decrease the growth or engagement of our user base, which, in turn, would negatively affect our business. We alsocompete against largely regional social media and messaging companies that have strong positions in particular countries such as Kakao and Line.
We believe that our ability to compete effectively for users depends upon many factors both within and beyond our control, including:
• the popularity, usefulness, ease of use, performance and reliability of our products and services compared to those of our competitors;
• the amount, quality and timeliness of content generated by our users and content partners;
• the timing and market acceptance of our products and services;
• our ability, in and of itself and in comparison to the ability of our competitors, to develop new products and services and enhancementsto existing products and services;
• the frequency and relative prominence of the ads displayed by us or our competitors;
• our ability to establish and maintain relationships with content partners;
• our ability to develop a reliable, scalable, secure, high-performance technology infrastructure that can efficiently handle increasedusage globally;
• changes mandated by, or that we elect to make to address, legislation, regulatory authorities or litigation, including settlements andconsent decrees, some of which may have a disproportionate effect on us;
• the application of antitrust laws both in the United States and internationally;
• the continued adoption of our products and services internationally;
• our ability to establish and maintain relationships with platform partners that integrate with our platform;
• acquisitions or consolidation within our industry, which may result in more formidable competitors; and
• our reputation and brand strength relative to our competitors.
We also face significant competition for advertiser spend. The substantial majority of our revenue is currently generated through third partiesadvertising on Twitter, and we compete against online and mobile businesses, including those referenced above, and traditional media outlets, suchas television, radio and print, for advertising budgets. In addition, many advertisers, particularly branded advertisers, use marketing mix analyses todetermine how to allocate their advertising budgets on an annual or bi-annual basis. Accordingly, if we fail to demonstrate to such advertisers duringthe appropriate time period that we provide a better return on investment than our competitors do, we may lose the opportunity to secure, increase orsustain our share of the advertising budget allocated for a significant portion of the year until the next budget cycle.
We also compete with advertising networks, exchanges, demand side platforms and other platforms, such as Google AdSense, DoubleClickAd Exchange, Nexage and Brightroll Ad Exchanges, AOL’s Ad.com and Microsoft Media Network, for marketing budgets and in the development ofthe tools and systems for managing and optimizing advertising campaigns. In order to grow our revenue and improve our operating results, we mustincrease our share of spending on advertising relative to our competitors, many of which are larger companies that offer more traditional and widelyaccepted advertising products. In addition, some of our larger competitors have substantially broader product or service offerings and leverage theirrelationships based on other products or services to gain additional share of advertising budgets.
46

We believe that our ability to compete effectively for advertiser spend depends upon many factors both within and beyond our control,including:
• the size and composition of our user base relative to those of our competitors;
• our ad targeting and measurement capabilities, and those of our competitors;
• the timing and market acceptance of our advertising services, and those of our competitors;
• our marketing and selling efforts, and those of our competitors;
• the pricing of our Promoted Products relative to the advertising products and services of our competitors;
• the actual or perceived return our advertisers receive from our advertising services, and those of our competitors; and
• our reputation and the strength of our brand relative to our competitors.
In recent years, there have been significant acquisitions and consolidation by and among our actual and potential competitors. We anticipatethis trend of consolidation will continue, which will present heightened competitive challenges for our business. Acquisitions by our competitors mayresult in reduced functionality of our products and services. For example, following Facebook’s acquisition of Instagram, Facebook disabledInstagram’s photo integration with Twitter such that Instagram photos were no longer viewable within Tweets and users are instead re-directed toInstagram to view Instagram photos through a link within a Tweet. As a result, our users may be less likely to click on links to Instagram photos inTweets, and Instagram users may be less likely to Tweet or remain active users of Twitter. Any similar elimination of integration with Twitter in thefuture, whether by Facebook or others, may adversely impact our business and operating results.
Consolidation may also enable our larger competitors to offer bundled or integrated products that feature alternatives to our platform.Reduced functionality of our products and services, or our competitors’ ability to offer bundled or integrated products that compete directly with us,may cause our user growth, user engagement and ad engagement to decline and advertisers to reduce their spend with us.
If we are not able to compete effectively for users and advertiser spend our business and operating results would be materially and adverselyaffected.
Our operating results may fluctuate from quarter to quarter, which makes them difficult to predict.
Our quarterly operating results have fluctuated in the past and will fluctuate in the future. As a result, our past quarterly operating results arenot necessarily indicators of future performance. Our operating results in any given quarter can be influenced by numerous factors, many of whichwe are unable to predict or are outside of our control, including:
• our ability to grow our user base and user engagement;
• our ability to attract and retain advertisers, content partners and platform partners;
• the occurrence of planned significant events, such as the World Cup, Super Bowl, Champions League Final, World Series, Olympicsand the Oscars, or unplanned significant events, such as natural disasters and political revolutions;
• the pricing of our products and services;
• the development and introduction of new products or services, changes in features of existing products or services or de-emphasis ortermination of existing products, product features or services;
• the impact of competitors or competitive products and services;
• our ability to maintain or increase revenue;
• our ability to maintain or improve gross margins and operating margins;
• increases in research and development, marketing and sales and other operating expenses that we may incur to grow and expand ouroperations and to remain competitive;
• stock-based compensation expense;
• costs related to the acquisition of businesses, talent, technologies or intellectual property, including potentially significant amortizationcosts;
47

• system failures resulting in the inaccessibility of our products and services;
• breaches of security or privacy, and the costs associated with remediating any such breaches;
• adverse litigation judgments, settlements or other litigation-related costs, and the fees associated with investigating and defendingclaims;
• changes in the legislative or regulatory environment, including with respect to security, privacy or enforcement by governmentregulators, including fines, orders or consent decrees;
• fluctuations in currency exchange rates and changes in the proportion of our revenue and expenses denominated in foreign currencies;
• changes in U.S. generally accepted accounting principles; and
• changes in global business or macroeconomic conditions.
Given our limited operating history and the rapidly evolving markets in which we compete, our historical operating results may not be useful toyou in predicting our future operating results. As our revenue growth rate slows, we expect that the seasonality in our business may become morepronounced and may in the future cause our operating results to fluctuate. For example, advertising spending is traditionally seasonally strong in thefourth quarter of each year and we believe that this seasonality affects our quarterly results, which generally reflect higher sequential advertisingrevenue growth from the third to fourth quarter compared to sequential advertising revenue growth from the fourth quarter to the subsequent firstquarter. In addition, global economic concerns continue to create uncertainty and unpredictability and add risk to our future outlook. An economicdownturn in any particular region in which we do business or globally could result in reductions in advertising revenue, as our advertisers reducetheir advertising budgets, and other adverse effects that could harm our operating results.
We depend on highly skilled personnel to grow and operate our business, and have seen high levels of attrition. If we are unable to hire,retain and motivate our personnel, we may not be able to grow effectively.
Our future success and strategy will depend upon our continued ability to identify, hire, develop, motivate and retain highly skilled personnel,including senior management, engineers, designers and product managers. We depend on contributions from our employees, and in particular oursenior management team, to execute efficiently and effectively. We do not have employment agreements other than offer letters with any member ofour senior management or other key employee, and we do not maintain key person life insurance for any employee. We also face significantcompetition for employees, particularly in the San Francisco Bay Area (where our headquarters is located), for engineers, designers and productmanagers from other Internet and high-growth companies, which include both publicly-traded and privately-held companies. As a result, we may notbe able to retain our existing employees or hire new employees quickly enough to meet our needs. At the same time, we are also experiencing highvoluntary attrition, and the resulting influx of new leaders and other employees requires that we expend the time and resources necessary to recruitand retain talent, restructure our organizations, and train new employees. In addition, to attract highly and retain skilled personnel, we have had tooffer, and believe we will need to continue to offer, highly competitive compensation packages. Identifying, recruiting, training and integratingqualified individuals will require significant time, expense and attention. We may need to invest significant amounts of cash and equity to attract andretain new employees and we may never realize returns on these investments. In addition, changes to U.S. immigration and work authorization lawsand regulations can be significantly affected by political forces and levels of economic activity. Our business may be materially adversely affected iflegislative or administrative changes to immigration or visa laws and regulations impair our hiring processes or projects involving personnel who arenot citizens of the country where the work is to be performed. If we are not able to effectively attract and retain employees, we may not be able toinnovate or execute quickly on our strategy and our ability to achieve our strategic objectives will be adversely impacted, and our business will beharmed.
We also believe that our culture and core values have been and will continue to be a key contributor to our success and our ability to fosterthe innovation, creativity and teamwork we believe we need to support our operations. As we continue to evolve, however, we are subject to therisks of over-hiring and over-compensating our employees, and to the challenges of integrating, developing and motivating an employee base that islocated in various countries around the world. If we fail to effectively manage our hiring needs and successfully integrate our new hires, our efficiencyand ability to meet our forecasts and our culture, employee morale, productivity and retention could suffer, and our business and operating resultscould be adversely affected.
48

If we fail to monetize effectively in international markets, our revenue and our business will be harmed.
We may not be able to monetize our products and services internationally as effectively as in the United States as a result of competition,advertiser demand, differences in the digital advertising market and digital advertising conventions, as well as differences in the way that users indifferent countries access or utilize our products and services. For example, a significant portion of users in emerging markets like India andPakistan use feature phones and communicate via SMS messaging, both of which have limited functionality and neither of which may be able totake full advantage of our products and services offered on smartphone or our website or desktop applications. Users who access Twitter throughSMS messaging may monetize at lower rates than other users. Differences in the competitive landscape in international markets may impact ourability to monetize our products and services. For example, in South Korea we face intense competition from a messaging service offered by Kakao,which offers some of the same communication features as Twitter. The existence of a well-established competitor in an international market mayadversely affect our ability to increase our user base, attract content partners, advertisers and platform partners and monetize our products in suchmarket. We may also experience differences in advertiser demand in international markets. For example, during times of political upheaval,advertisers may choose not to advertise on Twitter. Certain international markets are also not as familiar with digital advertising in general, or in newforms of digital advertising such as our Promoted Products. Further, we face challenges in providing certain advertising products, features oranalytics in certain international markets, such as the European Union, due to government regulation. Our products and services may also be useddifferently abroad than in the United States. In particular, in certain international markets where Internet access is not as rapid or reliable as in theUnited States, users tend not to take advantage of certain features of our products and services, such as rich media included in Tweets, video or livestreaming video. The limitation of mobile devices of users in emerging and other markets limits our ability to deliver certain features to those usersand may limit the ability of advertisers to deliver compelling advertisements to users in these markets which may result in reduced ad engagementswhich would adversely affect our business and operating results.
If our revenue from our international operations, and particularly from our operations in the countries and regions where we have focused ourspending, does not exceed the expense of establishing and maintaining these operations, our business and operating results will suffer. In addition,our user base may expand more rapidly in international regions where we are less successful in monetizing our products and services. As our userbase continues to expand internationally, we will need to increase revenue from the activity generated by our international users in order to grow ourbusiness. For example, users outside the United States constituted 79% of our average MAUs in the three months ended September 30, 2017, butour international revenue, as determined based on the billing location of our advertisers, was only 44% of our consolidated revenue in the threemonths ended September 30, 2017. Our inability to successfully expand our business internationally could adversely affect our business, financialcondition and operating results.
User growth and engagement depend upon effective interoperation with operating systems, networks, devices, web browsers andstandards that we do not control.
We make our products and services available across a variety of operating systems and through websites. We are dependent on theinteroperability of our products and services with popular devices, desktop and mobile operating systems and web browsers that we do not control,such as Mac OS, Windows, Android, iOS, Chrome and Firefox. Any changes, bugs or technical issues in such systems, devices or web browsersthat degrade the functionality of our products and services, make it difficult for our users to access our content, limit our ability to target or measurethe effectiveness of ads, impose fees related to our products or services or give preferential treatment to competitive products or services couldadversely affect usage of our products and services. Further, if the number of platforms for which we develop our product expands, it will result in anincrease in our operating expenses. In order to deliver high quality products and services, it is important that our products and services work wellwith a range of operating systems, networks, devices, web browsers and standards that we do not control. In addition, because a majority of ourusers access our products and services through mobile devices, we are particularly dependent on the interoperability of our products and serviceswith mobile devices and operating systems. For example, there is a change to the Safari interface that may affect some third-party apps, includingTwitter. Any impact of the change to Twitter, however, would be to our third-party auto-polling MAU, which are not served ads and as a result, norevenue is generated from such MAUs. We may not be successful in developing relationships with key participants in the mobile industry or indeveloping products or services that operate effectively with these operating systems, networks, devices, web browsers and standards. In the eventthat it is difficult for our users to access and use our products and services, particularly on their mobile devices, our user growth and engagementcould be harmed, and our business and operating results could be adversely affected.
49

Our ability to convince potential and new users of the value of our products and servic es is critical to increasing our user base and to thesuccess of our business.
We have developed a global platform that we believe is the best and fastest place to see what’s happening and what people are talking aboutall around the world, but the market for our products and services is relatively new and may not develop as expected, if at all. Despite our efforts toreduce barriers to consumption, people who are not our users may not understand the value of our products and services and new users mayinitially find our product confusing, which may make retention of such users more difficult. There may be a perception that our products and servicesare only useful to users who Tweet, or to influential users with large audiences. Convincing potential and new users of the value of our products andservices is critical to increasing our user base and to the success of our business.
If we fail to educate potential users and potential advertisers about the value of our products and services, if the market for our platform doesnot develop as we expect or if we fail to address the needs of this market, our business will be harmed. We may not be able to successfully addressthese risks and challenges or others. Failure to adequately address these risks and challenges could harm our business and cause our operatingresults to suffer.
We have incurred significant operating losses in the past, and we may not be able to achieve or subsequently maintain profitability.
Since our inception, we have incurred significant operating losses, and, as of September 30, 2017, we had an accumulated deficit of$2.76 billion. Although our revenue has grown rapidly, increasing from $664.9 million in 2013 to $2.53 billion in 2016, our revenue growth rate hasslowed as a result of a variety of factors. We believe that our future revenue growth will depend on, among other factors, our ability to attract newusers, increase user engagement and ad engagement, increase our brand awareness, compete effectively, maximize our sales efforts, demonstratea positive return on investment for advertisers, and successfully develop new products and services. Accordingly, you should not rely on the revenuegrowth of any prior quarterly or annual period as an indication of our future performance. Our costs may increase in future periods as we continue toexpend substantial financial resources on:
• our technology infrastructure;
• research and development for our products and services;
• sales and marketing;
• attracting and retaining talented employees;
• strategic opportunities, including commercial relationships and acquisitions; and
• general administration, including personnel costs and legal and accounting expenses related to being a public company.
These investments may not result in increased revenue or growth in our business. Additionally, certain new revenue products or productfeatures may carry higher costs relative to our other products, which may decrease our margins. If we are unable to generate adequate revenuegrowth and to manage our expenses, we may continue to incur significant losses in the future and may not be able to achieve or maintainprofitability.
50

Our business depends on continued and unimpeded access to our products and services on the Internet by our users, content partners, advertisers, and platform partners. If we or our users experience disruptions in Internet service or if Internet service providers are able toblock, degrade or charge for access to our products and services, we could incur additional expenses and the loss of users andadvertisers.
We depend on the ability of our users, content partners, advertisers and platform partners to access the Internet. Currently, this access is
provided by companies that have significant market power in the broadband and Internet access marketplace, including incumbent telephonecompanies, cable companies, mobile communications companies, government-owned service providers, device manufacturers and operatingsystem providers, any of whom could take actions that degrade, disrupt or increase the cost of user access to our products or services, which would,in turn, negatively impact our business. The adoption of any laws or regulations that adversely affect the growth, popularity or use of the Internet,including laws or practices limiting Internet neutrality, could decrease the demand for, or the usage of, our products and services, increase our costof doing business and adversely affect our operating results. For example, access to Twitter is blocked in China and has been intermittently blockedin Turkey in the last three years. We also rely on other companies to maintain reliable network systems that provide adequate speed, data capacityand security to us and our users. As the Internet continues to experience growth in the number of users, frequency of use and amount of datatransmitted, the Internet infrastructure that we and our users rely on may be unable to support the demands placed upon it. The failure of the Internetinfrastructure that we or our users rely on, even for a short period of time, could undermine our operations and harm our operating results.
Our new products, product features, services and initiatives and changes to existing products, services and initiatives could fail to attractusers, content partners, advertisers and platform partners or generate revenue.
Our industry is subject to rapid and frequent changes in technology, evolving customer needs and the frequent introduction by our competitorsof new and enhanced offerings. We must constantly assess the playing field and determine whether we need to improve or re-allocate resourcesamongst our existing products and services or create new ones (independently or in conjunction with third parties). Our ability to increase the sizeand engagement of our user base, attract content partners, advertisers and platform partners and generate revenue will depend on those decisions.We may introduce significant changes to our existing products and services or develop and introduce new and unproven products and services,including technologies with which we have little or no prior development or operating experience. For example, in 2015, we introduced Periscope, amobile application that lets users share and experience live video from their mobile phones and in 2013, we introduced Vine, a mobile applicationthat enables users to create and distribute videos that are up to six seconds in length, which we discontinued in January 2017 but transitionedcertain product features to the Vine Camera app. Also, we introduced new features to Twitter such as “Moments”, a curated collection of Tweets,photos, videos, and Periscope broadcasts about current news stories or events; “In Case You Missed It,” which surfaces Tweets a logged-in usermay have missed since last accessing Twitter; and Instant Timeline, which helps create a timeline for new users as well as new features to ourPromoted Tweets like promoted video ads. If new or enhanced products, product features or services fail to engage users, content partners andadvertisers, we may fail to attract or retain users or to generate sufficient revenue or operating profit to justify our investments, and our business andoperating results could be adversely affected. In addition, we have launched and expect to continue to launch strategic initiatives that do not directlygenerate revenue but which we believe will enhance our attractiveness to users, content partners and advertisers. In the future, we may invest innew products, product features, services and initiatives to generate revenue, but there is no guarantee these approaches will be successful. We maynot be successful in future efforts to generate revenue from our new products or services. If our strategic initiatives do not enhance our ability tomonetize our existing products and services, enable us to develop new approaches to monetization or meet the expectations of our users or third-party business partners, we may not be able to maintain or grow our revenue or recover any associated development costs and our operating resultscould be adversely affected.
51

If we fail to effectively manage changes to our business and operations, our business and operating results could be harmed.
Providing our products and services to our users is costly and we expect certain of our expenses to continue to increase in the future as webroaden our user base and increase user engagement, as users increase the amount of content they contribute, and as we develop and implementnew features, products and services that require more infrastructure, in particular our video product features. In addition, our operating expenses,such as our research and development expenses and sales and marketing expenses, have grown rapidly as we have expanded our business.Historically, our costs have increased each year due to these factors and we expect to continue to incur increasing costs to support our operations.We expect to continue to invest in our infrastructure so that we can provide our products and services rapidly and reliably to users around the world,including in countries where we do not expect significant near-term monetization.
We intend to fully invest in our highest priorities, while eliminating investment in noncore areas. Finding and maintaining the appropriatebalance will require significant expenditures and allocation of valuable management resources. If we fail to achieve the necessary level of efficiencyin our organization, our business, operating results and financial condition would be harmed.
We focus on product innovation and user engagement rather than short-term operating results.
We encourage employees to quickly develop and help us launch new and innovative features. We focus on improving the user experience forour products and services, which includes protecting user privacy, and on developing new and improved products and services for the advertisers onour platform. We prioritize innovation and the experience for users and advertisers on our platform over short-term operating results. We frequentlymake product, product feature and service decisions that may reduce our short-term operating results if we believe that the decisions are consistentwith our goals to improve the user experience and performance for advertisers, which we believe will improve our operating results over the longterm. For example, we are investing in our new live-streaming video experiences, and we may not successfully monetize such experiences. Thesedecisions may not be consistent with the short-term expectations of investors and may not produce the long-term benefits that we expect, in whichcase our user growth and user engagement, our relationships with advertisers and our business and operating results could be harmed. In addition,our focus on the user experience may negatively impact our relationships with our existing or prospective advertisers. This could result in a loss ofadvertisers, which could harm our revenue and operating results.
Our business and operating results may be harmed by a disruption in our service, or by our failure to timely and effectively scale andadapt our existing technology and infrastructure.
One of the reasons people come to Twitter is for real-time information. We have experienced, and may in the future experience, servicedisruptions, outages and other performance problems due to a variety of factors, including infrastructure changes, human or software errors,hardware failure, capacity constraints due to an overwhelming number of people accessing our products and services simultaneously, computerviruses and denial of service or fraud or security attacks. For instance, in January 2016, we experienced a brief service outage during whichTwitter.com and Twitter mobile clients were inaccessible as a result, in part, of a software misconfiguration in one of our infrastructure components.Additionally, although we are investing significantly to improve the capacity, capability and reliability of our infrastructure, we are not currently servingtraffic equally through our co-located data centers that support our platform. Accordingly, in the event of a significant issue at the data centersupporting most of our network traffic, some of our products and services may become inaccessible to the public or the public may experiencedifficulties accessing our products and services. Any disruption or failure in our infrastructure could hinder our ability to handle existing or increasedtraffic on our platform, which could significantly harm our business.
52

As the number of our users increases and our users generate more content, including photos and videos hosted by Twitter, we may berequired to expand and adapt our technology and infrastructure to continue to reliably store, serve and ana lyze this content. It may becomeincreasingly difficult to maintain and improve the performance of our products and services, especially during peak usage times, as our products andservices become more complex and our user traffic increases. In addition, because we lease our data center facilities, we cannot be assured that wewill be able to expand our data center infrastructure to meet user demand in a timely manner, or on favorable economic terms. If our users areunable to access Twitter or we are not able to make information available rapidly on Twitter, users may seek other channels to obtain theinformation, and may not return to Twitter or use Twitter as often in the future, or at all. This would negatively impact our ability to attract users ,content partners and advertisers and increase engagement of our users. We expect to continue to make significant investments to maintain andimprove the capacity, capability and reliability of our infrastructure. To the extent that we do not effectively ad dress capacity constraints, upgrade oursystems as needed and continually develop our technology and infrastructure to accommodate actual and anticipated changes in technology, ourbusiness and operating results may be harmed.
If we are unable to maintain and promote our brand, our business and operating results may be harmed.
We believe that maintaining and promoting our brand is critical to expanding our base of users, content partners and advertisers. Maintainingand promoting our brand will depend largely on our ability to continue to provide useful, reliable and innovative products and services with a focus ona positive user experience, which we may not do successfully. We may introduce new features, products, services or terms of service that users,content partners, advertisers or platform partners do not like, which may negatively affect our brand. Additionally, the actions of content partners mayaffect our brand if users do not have a positive experience using third-party applications or websites integrated with Twitter or that make use ofTwitter content. We will also continue to experience media, legislative or regulatory scrutiny of our decisions regarding user privacy, content andother issues, which may adversely affect our reputation and brand. Our brand may also be negatively affected by the actions of users that are hostileor inappropriate to other people, by users impersonating other people, by users identified as spam, by use of our products or services to disseminateinformation that may be viewed as misleading (or intended to manipulate the opinions of our users), by users introducing excessive amounts ofspam on our platform or by third parties obtaining control over users’ accounts. For example, in the past, attackers obtained the credentials to Twitteraccounts through a “phishing” attack. Maintaining and enhancing our brand may require us to make substantial investments and these investmentsmay not achieve the desired goals. If we fail to successfully promote and maintain our brand or if we incur excessive expenses in this effort, ourbusiness and operating results could be adversely affected.
Negative publicity could adversely affect our business and operating results.
We receive a high degree of media coverage around the world. Negative publicity about our company, including about quality and reliability ofour products or of content shared on our platform, changes to our products and services, privacy and security practices (including actions taken withrespect to certain users or accounts or reports regarding government surveillance), litigation, regulatory activity, the actions of our users (includingactions taken by prominent users on our platform or the dissemination of information that may be viewed as misleading or as intended to manipulatethe opinions of our users) or user experience with our products and services, even if inaccurate, could adversely affect our reputation and theconfidence in and the use of our products and services. Such negative publicity could also have an adverse effect on the size, engagement andloyalty of our user base and result in decreased revenue, which could adversely affect our business and operating results.
Action by governments to restrict access to our products and services or censor Twitter content could harm our business and operatingresults.
Governments have sought, and may in the future seek, to censor content available through our products and services, restrict access to ourproducts and services from their country entirely or impose other restrictions that may affect the accessibility of our products and services for anextended period of time or indefinitely. For example, domestic Internet service providers in China have blocked access to Twitter, and othercountries, including Iran, Libya, Pakistan, Turkey and Syria, have intermittently restricted access to Twitter, and we believe that access to Twitter hasbeen blocked in these countries primarily for political reasons. In addition, governments in these or other countries may seek to restrict access to ourproducts and services based on our decisions around user content, providing user information in response to governmental requests, or othermatters. In the event that access to our products and services is restricted, in whole or in part, in one or more countries or our competitors are ableto successfully penetrate geographic markets that we cannot access, our ability to retain or increase our user base and user engagement may beadversely affected, and our operating results may be harmed.
53

Our future performance depends in part on support from our content partners and data partners.
We believe user engagement with our products and services depends in part on the availability of applications and content generated by ourcontent or platform partners. For instance, in July 2016, we partnered with the Major League Baseball Advanced Media to deliver a free live digitalvideo stream of weekly MLB baseball games on Twitter. If our content or platform partners focus their efforts on other platforms, the availability andquality of applications and content for our products and services may suffer. There is no assurance that our content or platform partners will continueto develop and maintain applications and content for our products and services. If our content or platform partners cease to develop and maintainapplications and content for our products and services, user engagement may decline. In addition, we generate revenue from licensing our historicaland real-time data to third parties. If any of these relationships are terminated or not renewed on economic and other terms that are acceptable tous, or if we are unable to enter into similar relationships in the future, our operating results could be adversely affected.
Our international operations are subject to increased challenges and risks.
We have offices around the world and our products and services are available in multiple languages. However, our ability to manage ourbusiness and conduct our operations internationally requires considerable management attention and resources and is subject to the particularchallenges of supporting a rapidly growing business in an environment of multiple languages, cultures, customs, legal and regulatory systems,alternative dispute systems and commercial markets. Our international operations have required and will continue to require us to invest significantfunds and other resources. Operating internationally subjects us to new risks and may increase risks that we currently face, including risksassociated with:
• recruiting and retaining talented and capable employees in foreign countries and maintaining our company culture across all of ouroffices;
• providing our products and services and operating across a significant distance, in different languages and among different cultures,including the potential need to modify our products, services, content and features to ensure that they are culturally relevant in differentcountries;
• increased competition from largely regional websites, mobile applications and services that provide real-time communications and havestrong positions in particular countries, which have expanded and may continue to expand their geographic footprint;
• differing and potentially lower levels of user growth, user engagement and ad engagement in new and emerging geographies;
• different levels of advertiser demand;
• greater difficulty in monetizing our products and services;
• compliance with applicable foreign laws and regulations, including laws and regulations with respect to privacy, data security, consumerprotection, spam and content, and the risk of penalties to our users and individual members of management if our practices aredeemed to be out of compliance;
• longer payment cycles in some countries;
• credit risk and higher levels of payment fraud;
• operating in jurisdictions that do not protect intellectual property rights to the same extent as the United States;
• compliance with anti-bribery laws including, without limitation, compliance with the Foreign Corrupt Practices Act and the U.K. BriberyAct, including by our business partners;
• currency exchange rate fluctuations;
• foreign exchange controls that might require significant lead time in setting up operations in certain geographic territories and mightprevent us from repatriating cash earned outside the United States;
• political and economic instability in some countries;
• double taxation of our international earnings and potentially adverse tax consequences due to changes in the tax laws of the UnitedStates or the foreign jurisdictions in which we operate; and
• higher costs of doing business internationally, including increased accounting, travel, infrastructure and legal compliance costs.
54

If we are unable to manage the complexity of our global operations successfully, our business, financial condition and operating results couldbe adversely affected.
Our products and services may contain undetected software errors, which could harm our business and operating results.
Our products and services incorporate complex software and we encourage employees to quickly develop and help us launch new andinnovative features. Our software, including any open source software that is incorporated into our code, has contained, and may now or in the futurecontain, errors, bugs or vulnerabilities. For example, in February 2016, we discovered, and corrected, a bug that affected our password recoverysystems for about 24 hours. Although this issue did not expose passwords or information that could be used directly to access an account, it had thepotential to expose the email address and phone number associated with a small number of accounts (less than 10,000 active accounts). Someerrors in our software code may only be discovered after the product or service has been released. Errors, vulnerabilities, or other design defectswithin the software on which we rely may result in a negative experience for users and advertisers who use our products, delay product introductionsor enhancements, result in targeting, measurement, or billing errors, compromise our ability to protect the data of our users and/or our intellectualproperty or lead to reductions in our ability to provide some or all of our services. For example, in December 2016, we discovered and corrected atechnical error in our Android application that resulted in incorrect reporting of certain video advertisement metrics for approximately one month. Anyerrors, bugs or vulnerabilities discovered in our code after release could result in damage to our reputation, loss of users, loss of content or platformpartners, loss of advertisers or advertising revenue or liability for damages or other relief sought in lawsuits, regulatory inquiries or otherproceedings, any of which could adversely affect our business and operating results.
Our business is subject to complex and evolving U.S. and foreign laws and regulations. These laws and regulations are subject to changeand uncertain interpretation, and could result in claims, changes to our business practices, monetary penalties, increased cost ofoperations or declines in user growth, user engagement or ad engagement, or otherwise harm our business.
We are subject to a variety of laws and regulations in the United States and abroad that involve matters central to our business, includingprivacy, security, rights of publicity, data protection, content regulation, intellectual property, competition, protection of minors, consumer protection,credit card processing and taxation. Many of these laws and regulations are still evolving and being tested in courts. As a result, it is possible thatthese laws and regulations may be interpreted and applied in a manner that is inconsistent from country to country and inconsistent with our currentpolicies and practices and in ways that could harm our business, particularly in the new and rapidly evolving industry in which we operate.Additionally, the introduction of new products or services may subject us to additional laws and regulations.
From time to time, governments, regulators and others have expressed concerns about whether our products, services or practicescompromise the privacy of users and others. While we strive to comply with applicable data protection laws and regulations, as well as our ownposted privacy policies and other obligations we may have with respect to privacy and data protection, the failure or perceived failure to so complymay result, and in some cases has resulted, in inquiries and other proceedings or actions against us by governments, regulators or others.Moreover, foreign data protection, privacy, consumer protection, content regulation and other laws and regulations are often more restrictive thanthose in the United States. In particular, the European Union and its member states traditionally have taken broader views as to types of data thatare subject to privacy and data protection, and have imposed greater legal obligations on companies in this regard. A number of proposals haverecently been adopted or are currently pending before federal, state and foreign legislative and regulatory bodies that could significantly affect ourbusiness. For example, in April 2016, European legislative bodies adopted the General Data Protection Regulation to replace European Union andnational data protection legislation effective May 2018, which includes more stringent operational requirements for entities processing personalinformation and significant penalties for non-compliance, including fines of up to €20 million or 4% of total worldwide revenue, whichever is higher.Additionally, we rely on a variety of legal bases to transfer certain personal information outside of the European Economic Area, including the EU-USPrivacy Shield Framework, or Privacy Shield, and EU Standard Contractual Clauses, or SCCs. The Privacy Shield is currently under review byregulatory authorities and it and the SCCs are both subject of legal challenges in European courts, and the absence of successor legal bases forcontinued data transfer could require us to create duplicative, and potentially expensive, information technology infrastructure and businessoperations in Europe or limit our ability to collect and use personal information collected in Europe. Any of these changes to EU data protection lawcould disrupt our business.
55

Further, following a referendum in June 2016 in which voters in the United Kingdom approved an exit from the EU, it is expected that theUnited Kingdom government will initiate a process to leave the E U (often referred to as “Brexit”). Brexit has created uncertainty with regard to theregulation of data protection in the United Kingdom. In particular, it is unclear whether the United Kingdom will enact data protection laws orregulations designed to be consistent with the pending EU General Data Protection Regulation and how data transfers to and from the UnitedKingdom will be regulated.
Similarly, there have been a number of recent legislative proposals in the United States, at both the federal and state level, that could imposenew obligations in areas such as privacy and liability for copyright infringement by third parties. The U.S. government, including the FTC and theDepartment of Commerce, has announced that it is reviewing the need for greater regulation for the collection of information concerning userbehavior on the Internet, including regulation aimed at restricting certain online tracking and targeted advertising practices. Additionally, recentamendments to U.S. patent laws may affect the ability of companies, including us, to protect their innovations and defend against claims of patentinfringement.
Additionally, we have relationships with third parties that perform a variety of functions such as payments processing, tokenization, vaulting,currency conversion, fraud prevention and data security audits. The laws and regulations related to online payments are complex, subject to change,and vary across different jurisdictions in the United States and globally. As a result, we may be required to spend significant time, effort and expenseto comply with applicable laws and regulations. Any failure or claim of our failure to comply, or any failure or claim of failure by the above-mentionedthird parties to comply, could increase our costs or could result in liabilities. Additionally, because Twitter accepts payment via credit cards and iscertified as a PCI Level 1 service provider, we are subject to payment card association operating rules and certification requirements, including thePayment Card Industry Data Security Standard.
We currently allow use of our platform without the collection of extensive personal information, such as age. We may experience additionalpressure to expand our collection of personal information in order to comply with new and additional regulatory demands or we may independentlydecide to do so. If we obtain such additional personal information, we may be subject to additional regulation.
Regulatory investigations and settlements could cause us to incur additional expenses or change our business practices in a mannermaterially adverse to our business.
We have been subject to regulatory investigations in the past, and expect to continue to be subject to regulatory scrutiny as our businessgrows and awareness of our brand increases. In March 2011, to resolve an investigation into various incidents, we entered into a settlementagreement with the FTC that, among other things, required us to establish an information security program designed to protect non-public consumerinformation and also requires that we obtain biennial independent security assessments. The obligations under the settlement agreement remain ineffect until the later of March 2, 2031, or the date 20 years after the date, if any, on which the U.S. government or the FTC files a complaint in federalcourt alleging any violation of the order. We expect to continue to be the subject of regulatory inquiries, investigations and audits in the future by theFTC and other regulators around the world.
It is possible that a regulatory inquiry, investigation or audit might result in changes to our policies or practices, and may cause us to incursubstantial costs or could result in reputational harm, prevent us from offering certain products, services, features or functionalities, cause us to incursubstantial costs or require us to change our business practices in a manner materially adverse to our business. Violation of existing or futureregulatory orders, settlements or consent decrees could subject us to substantial monetary fines and other penalties that could negatively affect ourfinancial condition and operating results.
56

If our security measures are breached, or if our products and services are subject to attacks that degrade or deny the ability of u sers toaccess our products and services, our products and services may be perceived as not being secure, users and advertisers may curtail orstop using our products and services and our business and operating results could be harmed.
Our products and services involve the storage and transmission of users’ and advertisers’ information, and security breaches expose us to arisk of loss of this information, litigation, increased security costs and potential liability. We also work with third-party vendors to process credit cardpayments by our customers and are subject to payment card association operating rules. We and our third-party service providers experience cyber-attacks of varying degrees on a regular basis. For example, in October 2016, we experienced a service outage as a result of several distributeddenial of service attacks on our domain name service provider, Dyn. Third parties may also gain access to Twitter user names and passwordswithout attacking Twitter directly by combining credential information from other recent breaches, using malware on victim machines that are stealingpasswords for all sites, or a combination of both. In addition, some of our developers or other partners, such as third party applications to which ourusers have given permission to Tweet on their behalf, may receive or store information provided by us or by our users through mobile or webapplications integrated with us. If these third parties or developers fail to adopt or adhere to adequate data security practices, or in the event of abreach of their networks, our data or our users' data may be improperly accessed, used, or disclosed.
As a result, unauthorized parties have obtained, and may in the future obtain, access to our data or our users’ or advertisers’ data. Forexample, we have previously disclosed that sophisticated unknown third parties had attacked our systems and may have had access to limitedinformation for small subset of our users. Any systems failure or actual or perceived compromise of our security that results in the unauthorizedaccess to or release of our users’ or advertisers’ data, such as credit card data, could significantly limit the adoption of our products and services, aswell as harm our reputation and brand and, therefore, our business.
Our security measures may also be breached due to employee error, malfeasance or otherwise. Additionally, outside parties may attempt tofraudulently induce employees, users or advertisers to disclose sensitive information in order to gain access to our data or our users’ or advertisers’data or accounts, or may otherwise obtain access to such data or accounts. Since our users and advertisers may use their Twitter accounts toestablish and maintain online identities, unauthorized communications from Twitter accounts that have been compromised may damage theirreputations and brands as well as ours. Because the techniques used to obtain unauthorized access, disable or degrade service or sabotagesystems change frequently and often are not recognized until launched against a target, we may be unable to anticipate these techniques or toimplement adequate preventative measures. If an actual or perceived breach of our security occurs, the market perception of the effectiveness of oursecurity measures could be harmed, our users and advertisers may be harmed, lose trust and confidence in us, decrease the use of our productsand services or stop using our products and services in their entirety. We may also incur significant legal and financial exposure, including legalclaims, higher transaction fees and regulatory fines and penalties. Any of these actions could have a material and adverse effect on our business,reputation and operating results.
We may face lawsuits or incur liability as a result of content published or made available through our products and services.
We have faced and will continue to face claims relating to content that is published or made available through our products and services orthird party products or services. In particular, the nature of our business exposes us to claims related to defamation, intellectual property rights, rightsof publicity and privacy, illegal content, misinformation, content regulation and personal injury torts. The laws relating to the liability of providers ofonline products or services for activities of their users remains somewhat unsettled, both within the United States and internationally. This risk maybe enhanced in certain jurisdictions outside the United States where we may be less protected under local laws than we are in the United States. Forexample, we will be subject to recently enacted legislation in Germany that may impose significant fines for failure to comply with certain contentremoval and disclosure obligations. In addition, the public nature of communications on our network exposes us to risks arising from the creation ofimpersonation accounts intended to be attributed to our users or advertisers. We could incur significant costs investigating and defending theseclaims. If we incur material costs or liability as a result of these occurrences, our business, financial condition and operating results could beadversely affected.
57

Our intellectual property rights are valuable, and any inability to protect them could reduce the value of our products, services and brand.
Our trade secrets, trademarks, copyrights, patents and other intellectual property rights are important assets. We rely on, and expect tocontinue to rely on, a combination of confidentiality and license agreements with our employees, consultants and third parties with whom we haverelationships, as well as trademark, trade dress, domain name, copyright, trade secret and patent laws, to protect our brand and other intellectualproperty rights. However, various events outside of our control pose a threat to our intellectual property rights, as well as to our products, servicesand technologies. For example, we may fail to obtain effective intellectual property protection, or effective intellectual property protection may not beavailable in every country in which our products and services are available. Also, the efforts we have taken to protect our intellectual property rightsmay not be sufficient or effective, and any of our intellectual property rights may be challenged, which could result in them being narrowed in scopeor declared invalid or unenforceable. There can be no assurance our intellectual property rights will be sufficient to protect against others offeringproducts or services that are substantially similar to ours and compete with our business.
We rely on non-patented proprietary information and technology, such as trade secrets, confidential information, know-how and technicalinformation. While in certain cases we have agreements in place with employees and third parties that place restrictions on the use and disclosure ofthis intellectual property, these agreements may be breached, or this intellectual property may otherwise be disclosed or become known to ourcompetitors, which could cause us to lose any competitive advantage resulting from this intellectual property.
We are pursuing registration of trademarks and domain names in the United States and in certain jurisdictions outside of the United States.Effective protection of trademarks and domain names is expensive and difficult to maintain, both in terms of application and registration costs as wellas the costs of defending and enforcing those rights. We may be required to protect our rights in an increasing number of countries, a process that isexpensive and may not be successful or which we may not pursue in every country in which our products and services are distributed or madeavailable.
We are party to numerous agreements that grant licenses to third parties to use our intellectual property, including our trademarks. Forexample, many third parties distribute their content through Twitter, or embed Twitter content in their applications or on their websites, and make useof our trademarks in connection with their services. If the licensees of our trademarks are not using our trademarks properly, it may limit our ability toprotect our trademarks and could ultimately result in our trademarks being declared invalid or unenforceable. We have a policy designed to assistthird parties in the proper use of our brand, trademarks and other assets, and we have an internal team dedicated to enforcing our policy andprotecting our brand. Our brand protection team routinely receives and reviews reports of improper and unauthorized use of the Twitter brand,trademarks or assets and issues takedown notices or initiates discussions with the third parties to correct the issues. However, there can be noassurance that we will be able to protect against the unauthorized use of our brand, trademarks or other assets. If we fail to maintain and enforce ourtrademark rights, the value of our brand could be diminished. There is also a risk that one or more of our trademarks could become generic, whichcould result in them being declared invalid or unenforceable. For example, there is a risk that the word “Tweet” could become so commonly usedthat it becomes synonymous with any short comment posted publicly on the Internet, and if this happens, we could lose protection of this trademark.
We also seek to obtain patent protection for some of our technology and as of September 30, 2017, we had 1,041 issued U.S. patents. Wemay be unable to obtain patent protection for our technologies, and our existing patents, and any patents that may be issued in the future, may notprovide us with competitive advantages or distinguish our products and services from those of our competitors. In addition, any patents may becontested, circumvented, or found unenforceable or invalid, and we may not be able to prevent third parties from infringing or otherwise violatingthem. Effective protection of patent rights is expensive and difficult to maintain, both in terms of application and maintenance costs, as well as thecosts of defending and enforcing those rights.
58

Our Innova tor’s Patent Agreement, or IPA, also limits our ability to prevent infringement of our patents. In May 2013, we implemented theIPA, which we enter into with our employees and consultants, including our founders. The IPA, which applies to our current and f uture patents,allows us to assert our patents defensively. The IPA also allows us to assert our patents offensively with the permission of the inventors of theapplicable patent. Under the IPA, an assertion of claims is considered for a defensive purpose if the claims are asserted: (i) against an entity that hasfiled, maintained, threatened or voluntarily participated in a patent infringement lawsuit against us or any of our users, affiliates, customers, suppliersor distributors; (ii) against an entity t hat has used its patents offensively against any other party in the past ten years, so long as the entity has notinstituted the patent infringement lawsuit defensively in response to a patent litigation threat against the entity; or (iii) otherwise to det er a patentlitigation threat against us or our users, affiliates, customers, suppliers or distributors. In addition, the IPA provides that the above limitations apply toany future owner or exclusive licensee of any of our patents, which could limit our a bility to sell or license our patents to third parties. While we maybe able to claim protection of our intellectual property under other rights, such as trade secrets or contractual obligations with our employees not todisclose or use confidential inform ation, we may be unable to assert our patent rights against third parties that we believe are infringing our patents,even if such third parties are developing products and services that compete with our products and services. For example, in the event tha t aninventor of one of our patents leaves us for another company and uses our patented technology to compete with us, we would not be able to assertthat patent against such other company unless the assertion of the patent right is for a defensive purpose . In such event, we may be limited in ourability to assert a patent right against another company, and instead would need to rely on trade secret protection or the contractual obligation of theinventor to us not to disclose or use our confidential inform ation. In addition, the terms of the IPA could affect our ability to monetize our intellectualproperty portfolio.
Significant impairments of our intellectual property rights, and limitations on our ability to assert our intellectual property rights against others,could harm our business and our ability to compete.
Also, obtaining, maintaining and enforcing our intellectual property rights is costly and time consuming. Any increase in the unauthorized useof our intellectual property could make it more expensive to do business and harm our operating results.
We are currently, and expect to be in the future, party to intellectual property rights claims that are expensive and time consuming todefend, and, if resolved adversely, could have a significant impact on our business, financial condition or operating results.
Companies in the internet, technology and media industries are subject to litigation based on allegations of infringement, misappropriation orother violations of intellectual property or other rights. Many companies in these industries, including many of our competitors, have substantiallylarger patent and intellectual property portfolios than we do, which could make us a target for litigation as we may not be able to assert counterclaimsagainst parties that sue us for patent, or other intellectual property infringement. In addition, various “non-practicing entities” that own patents andother intellectual property rights often attempt to assert claims in order to extract value from technology companies. From time to time we receiveclaims from third parties which allege that we have infringed upon their intellectual property rights. Further, from time to time we may introduce newproducts, product features and services, including in areas where we currently do not have an offering, which could increase our exposure to patentand other intellectual property claims from competitors and non-practicing entities. In addition, although our standard terms and conditions for ourPromoted Products and public APIs do not provide advertisers and platform partners with indemnification for intellectual property claims againstthem, some of our agreements with advertisers, content partners, platform partners and data partners require us to indemnify them for certainintellectual property claims against them, which could require us to incur considerable costs in defending such claims, and may require us to paysignificant damages in the event of an adverse ruling. Such advertisers, content partners, platform partners and data partners may also discontinueuse of our products, services and technologies as a result of injunctions or otherwise, which could result in loss of revenue and adversely impact ourbusiness.
59

We presently are involved in a number of intellectual property lawsuits, and as we face increasing competition and gain an increasingly highprofile and develop new products , we expect the number of patent and other intellectual property claims against us to grow. There may beintellectual proper ty or other rights held by others, including issued or pending patents, that cover significant aspects of our products and services,and we cannot be sure that we are not infringing or violating, and have not infringed or violated, any third-party intellec tual property rights or that wewill not be held to have done so or be accused of doing so in the future. Any claim or litigation alleging that we have infringed or otherwise violatedintellectual property or other rights of third parties, with or without merit, and whether or not settled out of court or determined in our favor, could betime-consuming and costly to address and resolve, and could divert the time and attention of our management and technical personnel. Some of ourcompetitors have substantia lly greater resources than we do and are able to sustain the costs of complex intellectual property litigation to a greaterdegree and for longer periods of time than we could. The outcome of any litigation is inherently uncertain, and there can be no assu rances thatfavorable final outcomes will be obtained in all cases. In addition, plaintiffs may seek, and we may become subject to, preliminary or provisionalrulings in the course of any such litigation, including potential preliminary injunctions requiri ng us to cease some or all of our operations. We maydecide to settle such lawsuits and disputes on terms that are unfavorable to us. Similarly, if any litigation to which we are a party is resolvedadversely, we may be subject to an unfavorable judgment t hat may not be reversed upon appeal. The terms of such a settlement or judgment mayrequire us to cease some or all of our operations or pay substantial amounts to the other party. In addition, we may have to seek a license tocontinue practices found to b e in violation of a third - party’s rights. If we are required, or choose to enter into royalty or licensing arrangements,such arrangements may not be available on reasonable terms, or at all, and may significantly increase our operating costs and expenses. As aresult, we may also be required to develop or procure alternative non-infringing technology , which could require significant effort and expense ordiscontinue use of the technology . An unfavorable resolution of the disputes and litigation referred to above could adversely affect our business,financial condition and operating results.
Many of our products and services contain open source software, and we license some of our software through open source projects,which may pose particular risks to our proprietary software, products, and services in a manner that could have a negative effect on ourbusiness.
We use open source software in our products and services and will use open source software in the future. In addition, we regularly contributesoftware source code to open source projects under open source licenses or release internal software projects under open source licenses, andanticipate doing so in the future. The terms of many open source licenses to which we are subject have not been interpreted by U.S. or foreigncourts, and there is a risk that open source software licenses could be construed in a manner that imposes unanticipated conditions or restrictions onour ability to provide or distribute our products or services. Additionally, we may from time to time face claims from third parties claiming ownershipof, or demanding release of, the open source software or derivative works that we developed using such software, which could include ourproprietary source code, or otherwise seeking to enforce the terms of the applicable open source license. These claims could result in litigation andcould require us to make our software source code freely available, purchase a costly license or cease offering the implicated products or servicesunless and until we can re-engineer them to avoid infringement. This re-engineering process could require significant additional research anddevelopment resources, and we may not be able to complete it successfully. In addition to risks related to license requirements, use of certain opensource software may pose greater risks than use of third-party commercial software, as open source licensors generally do not provide warranties orcontrols on the origin of software. Any of these risks could be difficult to eliminate or manage, and, if not addressed, could have a negative effect onour business, financial condition and operating results.
We may require additional capital to support our operations or the growth of our business, and we cannot be certain that this capital willbe available on reasonable terms when required, or at all.
From time to time, we may need additional financing to operate or grow our business. Our ability to obtain additional financing, if and whenrequired, will depend on investor and lender demand, our operating performance, the condition of the capital markets and other factors, and wecannot assure you that additional financing will be available to us on favorable terms when required, or at all. If we raise additional funds through theissuance of equity, equity-linked or debt securities, those securities may have rights, preferences or privileges senior to the rights of our commonstock, and our existing stockholders may experience dilution. If we are unable to obtain adequate financing or financing on terms satisfactory to uswhen we require it, our ability to continue to support the operation or growth of our business could be significantly impaired and our operating resultsmay be harmed.
60

We rely on assumptions and estimates to ca lculate certain of our key metrics, and real or perceived inaccuracies in such metrics mayharm our reputation and negatively affect our business.
The number of our active users is calculated using internal company data that has not been independently verified. While these numbers arebased on what we believe to be reasonable calculations for the applicable period of measurement, there are inherent challenges in measuring usageand user engagement across our large user base around the world. For example, there are a number of false or spam accounts in existence on ourplatform. We estimate that false or spam accounts represent less than 5% of our MAUs as of December 31, 2016. However, this estimate is basedon an internal review of a sample of accounts and we apply significant judgment in making this determination. As such, our estimation of false orspam accounts may not accurately represent the actual number of such accounts, and the actual number of false or spam accounts could be higherthan we have currently estimated. We are continually seeking to improve our ability to estimate the total number of spam accounts and eliminatethem from the calculation of our active users, but we otherwise treat multiple accounts held by a single person or organization as multiple users forpurposes of calculating our active users because we permit people and organizations to have more than one account. Additionally, some accountsused by organizations are used by many people within the organization. As such, the calculations of our active users may not accurately reflect theactual number of people or organizations using our platform. We may also discover unexpected errors in our internal data that resulted fromtechnical or other errors. For example, we discovered that since the fourth quarter of 2014 we had included users of certain third-party applicationsas Twitter MAUs that should not have been considered MAUs. These third-party applications used Digits, a software development kit of our now-divested Fabric platform, that allowed third-party applications to send authentication messages via SMS through our systems, which did not relate toactivity on the Twitter platform. Although the change in the MAUs was relatively small in relation to our overall MAU numbers, we may face increasedscrutiny as a result of the error.
Our metrics are also affected by mobile applications that automatically contact our servers for regular updates with no discernable user-initiated action involved, and this activity can cause our system to count the user associated with such a device as an active user on the day suchcontact occurs. The calculations of MAUs and DAUs presented in this Quarterly Report on Form 10-Q may be affected by this activity. The impact ofthis automatic activity on our metrics varies by geography because mobile application usage varies in different regions of the world. In addition, ourdata regarding user geographic location is based on the IP address or phone number associated with the account when a user initially registered theaccount on Twitter. That IP address or phone number may not always accurately reflect a user’s actual location at the time of such user’sengagement on our platform.
We regularly review and may adjust our processes for calculating our internal metrics to improve their accuracy. We present and discuss ourtotal audience based on both internal metrics and data from Google Analytics, which measures unique visitors to our properties. Our measures ofuser growth and user engagement may differ from estimates published by third parties or from similarly-titled metrics of our competitors due todifferences in methodology. If advertisers, content or platform partners or investors do not perceive our user metrics to be accurate representationsof our user base or user engagement, or if we discover material inaccuracies in our user metrics, our reputation may be harmed and contentpartners, advertisers and platform partners may be less willing to allocate their budgets or resources to our products and services, which couldnegatively affect our business and operating results. Further, as our business develops, we may revise or cease reporting metrics if we determinethat such metrics are no longer accurate or appropriate measures of our performance. For example, we stopped disclosing timeline views as we nolonger believed that metric was helpful in measuring engagement on our platform. If investors, analysts or customers do not believe our reportedmeasures of user engagement are sufficient or accurately reflect our business, we may receive negative publicity and our operating results may beharmed.
61

Spam could diminish the user experience on our platform, which could damage our reputation and deter our current and potential usersfrom using our products and services.
“Spam” on Twitter refers to a range of abusive activities that are prohibited by our terms of service and is generally defined as unsolicited,repeated actions that negatively impact other users with the general goal of drawing user attention to a given account, site, product or idea. Thisincludes posting large numbers of unsolicited mentions of a user, duplicate Tweets, misleading links (e.g., to malware or “click-jacking” pages) orother false or misleading content, and aggressively following and un-following accounts, adding users to lists, sending invitations, Retweeting andliking Tweets to inappropriately attract attention. Our terms of service also prohibit the creation of serial or bulk accounts, both manually or usingautomation, for disruptive or abusive purposes, such as to tweet spam or to artificially inflate the popularity of users seeking to promote themselveson Twitter. Although we continue to invest resources to reduce spam on Twitter, we expect spammers will continue to seek ways to actinappropriately on our platform. In addition, we expect that increases in the number of users on our platform will result in increased efforts byspammers to misuse our platform. We continuously combat spam, including by suspending or terminating accounts we believe to be spammers andlaunching algorithmic changes focused on curbing abusive activities. Our actions to combat spam require the diversion of significant time and focusof our engineering team from improving our products and services. If spam increases on Twitter, this could hurt our reputation for delivering relevantcontent or reduce user growth and user engagement and result in continuing operational cost to us.
We rely in part on application marketplaces and Internet search engines to drive traffic to our products and services, and if we fail toappear high up in the search results or rankings, traffic to our platform could decline and our business and operating results could beadversely affected.
We rely on application marketplaces, such as Apple’s App Store and Google’s Play, to drive downloads of our mobile applications. In thefuture, Apple, Google or other operators of application marketplaces may make changes to their marketplaces which make access to our productsand services more difficult or limit our use of data to provide targeted advertising. We also depend in part on Internet search engines, such asGoogle, Apple Spotlight, Bing and Yahoo, to drive traffic to our website. For example, when a user types an inquiry into a search engine, we rely ona high organic search result ranking of our webpages in these search results to refer the user to our website. However, our ability to maintain highorganic search result rankings is not within our control. Our competitors’ search engine optimization, or SEO, efforts may result in their websitesreceiving a higher search result page ranking than ours, or Internet search engines could revise their methodologies in a way that would adverselyaffect our search result rankings. If Internet search engines modify their search algorithms in ways that are detrimental to us, or if our competitors’SEO efforts are more successful than ours, the growth in our user base could slow. Our website has experienced fluctuations in search resultrankings in the past, and we anticipate similar fluctuations in the future. Any reduction in the number of users directed to our mobile applications orwebsite through application marketplaces and search engines could harm our business and operating results.
More people are using devices other than personal computers to access the Internet and new platforms to produce and consume content,and we need to continue to promote the adoption of our mobile applications, and our business and operating results may be harmed if weare unable to do so.
The number of people who access the Internet through devices other than personal computers, including mobile phones, tablets, video gameconsoles and television set-top devices, has increased dramatically in the past few years. In the nine months ended September 30, 2017, 92% of ouradvertising revenue was generated from mobile devices. Since we generate a majority of our advertising revenue through users on mobile devices,we must continue to drive adoption of our mobile applications. However, in emerging markets like India and Pakistan, a significant portion of usersuse feature phones and communicate via SMS messaging, both of which have limited functionality and neither of which may be able to take fulladvantage of our products and services offered on smartphone or our website or desktop applications. In addition, mobile users frequently change orupgrade their mobile devices. Our business and operating results may be harmed if our users do not install our mobile application when they changeor upgrade their mobile device. Although we generate the majority of our advertising revenue from ad engagements on mobile devices, certain of ourproducts and services, including Promoted Trends and Promoted Accounts, receive less prominence on our mobile applications than they do on ourdesktop applications. This has in the past reduced, and may in the future continue to reduce, the amount of revenue we are able to generate fromthese products and services as users increasingly access our products and services through mobile and alternative devices. In addition, as newdevices and platforms are continually being released, users may consume content in a manner that is more difficult to monetize. If we are unable todevelop products and services that are compatible with new devices and platforms, or if we are unable to drive continued adoption of our mobileapplications, our business and operating results may be harmed.
62

A cquisitions , divestitures and investments could disrupt our business and harm our financial condition and operating res ults.
Our success will depend, in part, on our ability to expand our products, product features and services, and grow our business in response tochanging technologies, user and advertiser demands, and competitive pressures. In some circumstances, we may determine to do so through theacquisition of complementary businesses and technologies rather than through internal development, including, for example, our acquisitions ofPeriscope, a live-streaming video mobile application, MoPub, a mobile-focused advertising exchange; and TellApart, Inc., a marketing technologycompany providing retailers and e-commerce advertisers with unique retargeting capabilities. The identification of suitable acquisition candidates canbe difficult, time-consuming and costly, and we may not be able to successfully complete identified acquisitions. The risks we face in connection withacquisitions include:
• diversion of management time and focus from operating our business to addressing acquisition integration challenges;
• retention of key employees from the acquired company;
• cultural challenges associated with integrating employees from the acquired company into our organization;
• integration of the acquired company’s accounting, management information, human resources and other administrative systems andprocesses;
• the need to implement or improve controls, procedures, and policies at a business that prior to the acquisition may have lackedeffective controls, procedures and policies;
• liability for activities of the acquired company before the acquisition, including intellectual property infringement claims, violations oflaws, commercial disputes, tax liabilities and other known and unknown liabilities;
• unanticipated write-offs or charges; and
• litigation or other claims in connection with the acquired company, including claims from terminated employees, users, formerstockholders or other third parties.
Our failure to address these risks or other problems encountered in connection with our past or future acquisitions and investments couldcause us to fail to realize the anticipated benefits of these acquisitions or investments, cause us to incur unanticipated liabilities, and harm ourbusiness generally. Future acquisitions could also result in dilutive issuances of our equity securities, the incurrence of debt, contingent liabilities,amortization expenses, incremental operating expenses or the impairment of goodwill, any of which could harm our financial condition or operatingresults.
We also make investments in privately-held companies in furtherance of our strategic objectives. We may not realize a return and mayrecognize a loss on such investments. Many of the instruments in which we invest are non-marketable at the time of our initial investment.Companies in which we invest range from early-stage companies still defining their strategic direction to more mature companies with establishedrevenue streams and business models. The success of our investment in any company is typically dependent on the availability to the company ofadditional funding on favorable terms, or a liquidity event, such as a public offering or acquisition. If any of the companies in which we investdecrease in value, we could lose all or part of our investment. For example, in the nine months ended September 30, 2017, we recorded a $62.4million cost-method investment impairment charge relating to an investment in a privately-held company.
In certain cases, we have also divested or stopped investing in certain products. For instance, in January 2017, we divested certain assetsrelated to our Fabric platform. In 2017, we also de-emphasized certain of our revenue products, including TellApart. In these cases, we have neededto and may, in the future, need to restructure operations, terminate employees and/or incur other expenses. We may not realize the expectedbenefits and cost savings of these actions and our results may be harmed.
63

If we fail to maintain an effective system of disclosure controls and internal control ove r financial reporting, our ability to produce timelyand accurate financial statements or comply with applicable regulations could be impaired.
As a public company, we are subject to the reporting requirements of the Securities Exchange Act of 1934, as amended, or the Exchange Act,the Sarbanes-Oxley Act of 2002, as amended, or the Sarbanes-Oxley Act, and the listing standards of the New York Stock Exchange. TheSarbanes-Oxley Act requires, among other things, that we maintain effective disclosure controls and procedures and internal control over financialreporting. In order to maintain and improve the effectiveness of our disclosure controls and procedures and internal control over financial reporting,we have expended, and anticipate that we will continue to expend, significant resources, including accounting-related costs and significantmanagement oversight.
Any failure to develop or maintain effective controls, or any difficulties encountered in their implementation or improvement, could cause us tobe subject to one or more investigations or enforcement actions by state or federal regulatory agencies, stockholder lawsuits or other adverseactions requiring us to incur defense costs, pay fines, settlements or judgments. Any such failures could also cause investors to lose confidence inour reported financial and other information, which would likely have a negative effect on the trading price of our common stock. In addition, if we areunable to continue to meet these requirements, we may not be able to remain listed on the New York Stock Exchange.
If currency exchange rates fluctuate substantially in the future, our operating results, which are reported in U.S. dollars, could beadversely affected.
Our international operations expose us to the effects of fluctuations in currency exchange rates. We incur expenses for employeecompensation and other operating expenses at our international locations in the local currency, and accept payment from advertisers or datapartners in currencies other than the U.S. dollar. Since we conduct business in currencies other than U.S. dollars but report our operating results inU.S. dollars, we face exposure to fluctuations in currency exchange rates. While we enter into foreign currency forward contracts with financialinstitutions to reduce the risk that our earnings may be adversely affected by the impact of exchange rate fluctuations on monetary assets orliabilities denominated in currencies other than the functional currency of a subsidiary, exchange rate fluctuations between the U.S. dollar and othercurrencies could have a material impact on our operating results.
Servicing our convertible senior notes may require a significant amount of cash, and we may not have sufficient cash flow or the ability toraise the funds necessary to satisfy our obligations under such notes, and our future debt may contain limitations on our ability to paycash upon conversion or repurchase of such notes.
In 2014, we issued $935.0 million in aggregate principal amount of 0.25% convertible senior notes due 2019, or the 2019 Notes, and$954.0 million in aggregate principal amount of 1.00% convertible senior notes due 2021, or the 2021 Notes and together with the 2019 Notes, theNotes, in private placements to qualified institutional buyers. As of September 30, 2017, we had a total par value of $1.89 billion of outstandingNotes.
Holders of the Notes will have the right under the indenture for the Notes to require us to repurchase all or a portion of their notes upon theoccurrence of a fundamental change before the relevant maturity date, in each case at a repurchase price equal to 100% of the principal amount ofthe Notes, plus accrued and unpaid interest, if any, to the fundamental change repurchase date. In addition, upon conversion of the Notes, unlesswe elect to deliver solely shares of our common stock to settle such conversion (other than paying cash in lieu of delivering any fractional shares),we will be required to make cash payments in respect of the Notes being converted. Moreover, we will be required to repay the notes in cash at theirmaturity, unless earlier converted or repurchased.
64

Our ability to refinance the N otes, make cash payments in connection with conversions of the N otes or repurchas e the Notes in the event ofa fundamental change will depend on market conditions and our future performance, which is subject to economic, financial, competitive and otherfactors beyond our control. We also may not use the cash we have raised through the issuance of the N otes in an optimally productive andprofitable manner. However, since inception we have incurred significa nt operating losses and we historically had not been cash flow positive andmay not be in the futur e. As a result, we may not have e nough available cash or be able to obtain financing on commercially reasonable terms or atall, at the time we a re required to make repurchases of notes surrendered therefor or pay cash with respect to notes being converted or at theirmaturity and our lev el of indebtedness could adversely affect our future operations by increasing our vulnerability to adverse changes in generaleconomic and industry conditions and by limiting or prohibiting our ability to obtain additional financing for future capital expe nditures, acquisitionsand general corporate and other purposes. In addition, if we are unable to make cash payments upon conversion of the N otes we would be requiredto issue significant amounts of our common stock, which would be dilutive to existing sto ckholders. If we do not have sufficient cash to repurchasethe N otes following a fundamental change , we would be in default under the terms of the N otes, which could seriously harm our business. Inaddition, the terms of the N otes do not limit the amount o f future indebtedness we may incur. If we incur significantly more debt, this could intensifythe risks described above.
Our business is subject to the risks of earthquakes, fire, power outages, floods and other catastrophic events, and to interruption by man-made problems such as terrorism.
A significant natural disaster, such as an earthquake, fire, flood or significant power outage could have a material adverse impact on ourbusiness, operating results, and financial condition. Our headquarters and certain of our co-located data center facilities are located in the SanFrancisco Bay Area, a region known for seismic activity. Despite any precautions we may take, the occurrence of a natural disaster or otherunanticipated problems at our data centers could result in lengthy interruptions in our services. In addition, acts of terrorism and other geo-politicalunrest could cause disruptions in our business. All of the aforementioned risks may be further increased if our disaster recovery plans prove to beinadequate. We have implemented a disaster recovery program, which allows us to move production to a back-up data center in the event of acatastrophe. Although this program is functional, we do not currently serve network traffic equally from each data center, so if our primary datacenter shuts down, there will be a period of time that our products or services, or certain of our products or services, will remain inaccessible to ourusers or our users may experience severe issues accessing our products and services.
We do not carry business interruption insurance sufficient to compensate us for the potentially significant losses, including the potential harmto our business that may result from interruptions in our ability to provide our products and services.
65

We may have exposure to greater than anticipated tax liabilities, which could adversely impact our operating results.
Our income tax obligations are based in part on our corporate operating structure, including the manner in which we develop, value and useour intellectual property and the scope of our international operations. The tax laws applicable to our international business activities, including thelaws of the United States and other jurisdictions, are subject to interpretation. The taxing authorities of the jurisdictions in which we operate maychallenge our methodologies for valuing developed technology (or other intangible assets) or intercompany arrangements, which could increase ourworldwide effective tax rate and harm our financial condition and operating results. On October 5, 2015, the Organization for Economic Cooperationand Development (OECD), an international association of thirty four countries, including the U.S. and UK, released the final reports from its BaseErosion and Profit Shifting (BEPS) Action Plans. The BEPS recommendations covered a number of issues, including country-by-country reporting,permanent establishment rules, transfer pricing rules and tax treaties. Future tax reform resulting from this development may result in changes tolong-standing tax principles, which could adversely affect our effective tax rate or result in higher cash tax liabilities. We are subject to review andaudit by U.S. federal and state and foreign tax authorities. Tax authorities may disagree with certain positions we have taken and any adverseoutcome of such a review or audit could have a negative effect on our financial position and operating results. In addition, our future income taxescould be adversely affected by earnings being lower than anticipated in jurisdictions that have lower statutory tax rates and higher than anticipated injurisdictions that have higher statutory tax rates, by changes in the valuation of our deferred tax assets and liabilities, or by changes in tax laws,regulations or accounting principles, as well as certain discrete items. Greater than anticipated tax expenses, or disputes with tax authorities, couldadversely impact our operating results.
If our goodwill or intangible assets become impaired, we may be required to record a significant charge to earnings.
Under generally accepted accounting principles in the United States, or GAAP, we review our intangible assets for impairment when events orchanges in circumstances indicate the carrying value may not be recoverable. Goodwill is required to be tested for impairment at least annually. Asof September 30, 2017, we had recorded a total of $1.24 billion of goodwill and intangible assets. An adverse change in market conditions orfinancial results, particularly if such change has the effect of changing one of our critical assumptions or estimates, could result in a change to theestimation of fair value that could result in an impairment charge to our goodwill or intangible assets. Any such material charges may have a materialnegative impact on our operating results.
Our ability to use our net operating loss carryforwards and certain other tax attributes may be limited.
As of December 31, 2016, we had U.S. federal net operating loss carryforwards of approximately $3.47 billion and state net operating losscarryforwards of approximately $1.41 billion. Under Sections 382 and 383 of the Internal Revenue Code of 1986, as amended, or the Code, if acorporation undergoes an “ownership change,” the corporation’s ability to use its pre-change net operating loss carryforwards and other pre-changetax attributes, such as research tax credits, to offset its post-change income and taxes may be limited. In general, an “ownership change” occurs ifthere is a cumulative change in our ownership by “5% shareholders” that exceeds 50 percentage points over a rolling three-year period. Similar rulesmay apply under state tax laws. In the event that it is determined that we have in the past experienced an ownership change, or if we experience oneor more ownership changes as a result of future transactions in our stock, then we may be limited in our ability to use our net operating losscarryforwards and other tax assets to reduce taxes owed on the net taxable income that we earn. Any such limitations on the ability to use our netoperating loss carryforwards and other tax assets could adversely impact our business, financial condition and operating results.
Risks Related to Ownership of Our Common StockAnti-takeover provisions contained in our amended and restated certificate of incorporation and amended and restated bylaws, as well asprovisions of Delaware law, could impair a takeover attempt.
Our amended and restated certificate of incorporation, amended and restated bylaws and Delaware law contain provisions which could havethe effect of rendering more difficult, delaying, or preventing an acquisition deemed undesirable by our board of directors. Among other things, ouramended and restated certificate of incorporation and amended and restated bylaws include provisions:
• creating a classified board of directors whose members serve staggered three-year terms;
• authorizing “blank check” preferred stock, which could be issued by our board of directors without stockholder approval and maycontain voting, liquidation, dividend and other rights superior to our common stock;
• limiting the liability of, and providing indemnification to, our directors and officers;
66
• limiting the ability of our stockholders to call and bring business before special meetings;
• requiring advance notice of stockholder proposals for business to be conducted at meetings of our stockholders and for nominations ofcandidates for election to our board of directors; and
• controlling the procedures for the conduct and scheduling of board of directors and stockholder meetings.
These provisions, alone or together, could delay or prevent hostile takeovers and changes in control or changes in our management.
As a Delaware corporation, we are also subject to provisions of Delaware law, including Section 203 of the Delaware General Corporationlaw, which prevents certain stockholders holding more than 15% of our outstanding common stock from engaging in certain business combinationswithout approval of the holders of at least two-thirds of our outstanding common stock not held by such 15% or greater stockholder.
Any provision of our amended and restated certificate of incorporation, amended and restated bylaws or Delaware law that has the effect ofdelaying, preventing or deterring a change in control could limit the opportunity for our stockholders to receive a premium for their shares of ourcommon stock, and could also affect the price that some investors are willing to pay for our common stock.
The market price of our common stock has been and will likely continue to be volatile, and you could lose all or part of your investment.
The market price of our common stock has been and may continue to be highly volatile in response to various factors, some of which arebeyond our control. Since shares of our common stock were sold in our initial public offering in November 2013 at a price of $26.00 per share, thereported high and low sales prices of our common stock has ranged from $74.73 to $13.72, through September 30, 2017. In addition to the factorsdiscussed in this “Risk Factors” section and elsewhere in this Quarterly Report on Form 10-Q, factors that could cause fluctuations in the marketprice of our common stock include the following:
• price and volume fluctuations in the overall stock market from time to time;
• volatility in the market prices and trading volumes of technology stocks;
• changes in operating performance and stock market valuations of other technology companies generally, or those in our industry inparticular;
• sales of shares of our common stock by us or our stockholders;
• rumors and market speculation involving us or other companies in our industry;
• failure of securities analysts to maintain coverage of us, changes in financial estimates by securities analysts who follow our company,or our failure to meet these estimates or the expectations of investors;
• the financial or non-financial metric projections we may provide to the public, any changes in those projections or our failure to meetthose projections;
• announcements by us or our competitors of new products or services;
• the public’s reaction to our press releases, other public announcements and filings with the SEC;
• actual or anticipated changes in our operating results or fluctuations in our operating results;
• actual or anticipated developments in our business, our competitors’ businesses or the competitive landscape generally;
• our issuance of shares of our common stock, whether in connection with an acquisition or upon conversion of some or all of ouroutstanding Notes;
• litigation involving us, our industry or both, or investigations by regulators into our operations or those of our competitors;
• developments or disputes concerning our intellectual property or other proprietary rights;
• announced or completed acquisitions of businesses or technologies by us or our competitors;
• new laws or regulations or new interpretations of existing laws or regulations applicable to our business;
• changes in accounting standards, policies, guidelines, interpretations or principles;
67

• any significant change in our management; and
• general economic conditions and slow or negative growth of our markets.
In addition, in the past, following periods of volatility in the overall market and the market price of a particular company’s securities, securitiesclass action litigation has often been instituted against these companies. Any securities litigation can result in substantial costs and a diversion of ourmanagement’s attention and resources. We are currently subject to securities litigation and may experience more such litigation following any futureperiods of volatility.
The note hedge and warrant transactions may affect the value of our common stock.
Concurrently with the issuance of the Notes, we entered into note hedge transactions with certain financial institutions, which we refer to asthe option counterparties. The note hedge transactions are generally expected to reduce the potential dilution upon any conversion of the Notesand/or offset any cash payments we are required to make in excess of the principal amount of converted Notes, as the case may be. We alsoentered into warrant transactions with the option counterparties. However, the warrant transactions could separately have a dilutive effect to theextent that the market price of our common stock exceeds the applicable strike price of the warrants.
The option counterparties or their respective affiliates may modify their initial hedge positions by entering into or unwinding various derivativescontracts with respect to our common stock and/or purchasing or selling our common stock or other securities of ours in secondary markettransactions prior to the maturity of the Notes (and are likely to do so during any observation period related to a conversion of Notes or following anyrepurchase of Notes by us on any fundamental change repurchase date or otherwise). This activity could cause or avoid an increase or a decreasein the market price of our common stock.
In addition, if any such convertible note hedge and warrant transactions fail to become effective, the option counterparties or their respectiveaffiliates may unwind their hedge positions with respect to our common stock, which could adversely affect the value of our common stock.
If securities or industry analysts do not publish or cease publishing research or reports about us, our business or our market, or if theychange their recommendations regarding our common stock adversely, the price of our common stock and trading volume could decline.
The trading market for our common stock is influenced, to some extent, by the research and reports that securities or industry analysts publishabout us, our business, our industry, our market or our competitors. If any of the analysts who cover us change their recommendation regarding ourcommon stock adversely, or provide more favorable relative recommendations about our competitors, the price of our common stock would likelydecline. If any analysts who cover us were to cease coverage of our company or fail to regularly publish reports on us, we could lose visibility in thefinancial markets, which in turn could cause the price of our common stock or trading volume to decline.
We do not expect to declare any dividends in the foreseeable future.
We do not anticipate declaring any cash dividends to holders of our common stock in the foreseeable future. In addition, our credit facilitycontains restrictions on payments including payments of cash dividends. Consequently, investors may need to rely on sales of our common stockafter price appreciation, which may never occur, as the only way to realize any future gains on their investment.
68

I tem 6. EXHIBITSThe documents listed in the Exhibit Index of this Quarterly Report on Form 10-Q are incorporated by reference or are filed with this Quarterly
Report on Form 10-Q, in each case as indicated therein (numbered in accordance with Item 601 of Regulation S-K).
69

EXHIBIT INDEX Exhibit Incorporated by ReferenceNumber Exhibit Description Form File No. Exhibit Filing Date
10.1
Offer Letter between Twitter and Ned D. Segal, dated as of July 11, 2017
8-K
001-36164
10.1
July 11, 2017
31.1
Certification of Chief Executive Officer pursuant to Exchange Act Rules 13a-14(a) and 15d-14(a), as adopted pursuant to Section 302 of the Sarbanes-OxleyAct of 2002.
31.2
Certification of Chief Financial Officer pursuant to Exchange Act Rules 13a-14(a)and 15d-14(a), as adopted pursuant to Section 302 of the Sarbanes-Oxley Act of2002.
32.1†
Certifications of Chief Executive Officer and Chief Financial Officer pursuant to18 U.S.C. Section 1350, as adopted pursuant to Section 906 of the Sarbanes-Oxley Act of 2002.
101.INS
XBRL Instance Document.
101.SCH
XBRL Taxonomy Schema Linkbase Document.
101.CAL
XBRL Taxonomy Calculation Linkbase Document.
101.DEF
XBRL Taxonomy Definition Linkbase Document.
101.LAB
XBRL Taxonomy Labels Linkbase Document.
101.PRE
XBRL Taxonomy Presentation Linkbase Document.
† The certifications attached as Exhibit 32.1 that accompany this Quarterly Report on Form 10-Q, are deemed furnished and not filed with theSecurities and Exchange Commission and are not to be incorporated by reference into any filing of Twitter, Inc. under the Securities Act of1933, as amended, or the Securities Exchange Act of 1934, as amended, whether made before or after the date of this Quarterly Report onForm 10-Q, irrespective of any general incorporation language contained in such filing.
70

S IGNATURES
Pursuant to the requirements of Section 13 or 15(d) of the Securities Exchange Act of 1934, the registrant has duly caused this QuarterlyReport on Form 10-Q to be signed on its behalf by the undersigned, thereunto duly authorized. TWITTER, INC. Date: November 1, 2017 By: /s/ Jack Dorsey Jack Dorsey Chief Executive Officer (Principal Executive Officer) Date: November 1, 2017 By: /s/ Ned Segal Ned Segal Chief Financial Officer (Principal Financial Officer)
71

Exhibit 31.1
CERTIFICATION OF PERIODIC REPORT UNDER SECTION 302 OFTHE SARBANES-OXLEY ACT OF 2002
I, Jack Dorsey, certify that:
1. I have reviewed this Quarterly Report on Form 10-Q of Twitter, Inc.;
2. Based on my knowledge, this report does not contain any untrue statement of a material fact or omit to state a material fact necessary to make the statementsmade, in light of the circumstances under which such statements were made, not misleading with respect to the period covered by this report;
3. Based on my knowledge, the financial statements, and other financial information included in this report, fairly present in all material respects the financialcondition, results of operations and cash flows of the registrant as of, and for, the periods presented in this report;
4. The registrant's other certifying officer and I are responsible for establishing and maintaining disclosure controls and procedures (as defined in Exchange ActRules 13a–15(e) and 15d–15(e)) and internal control over financial reporting (as defined in Exchange Act Rules 13a-15(f) and 15d-15(f)) for the registrant andhave:
(a) Designed such disclosure controls and procedures, or caused such disclosure controls and procedures to be designed under our supervision, to ensure thatmaterial information relating to the registrant, including its consolidated subsidiaries, is made known to us by others within those entities, particularly during theperiod in which this report is being prepared;
(b) Designed such internal control over financial reporting, or caused such internal control over financial reporting to be designed under our supervision, to providereasonable assurance regarding the reliability of financial reporting and the preparation of financial statements for external purposes in accordance with generallyaccepted accounting principles;
(c) Evaluated the effectiveness of the registrant's disclosure controls and procedures and presented in this report our conclusions about the effectiveness of thedisclosure controls and procedures, as of the end of the period covered by this report based on such evaluation; and
(d) Disclosed in this report any change in the registrant's internal control over financial reporting that occurred during the registrant's most recent fiscal quarter (theregistrant's fourth fiscal quarter in the case of an annual report) that has materially affected, or is reasonably likely to materially affect, the registrant's internalcontrol over financial reporting; and;
5. The registrant's other certifying officer and I have disclosed, based on our most recent evaluation of internal control over financial reporting, to the registrant'sauditors and the audit committee of the registrant's board of directors (or persons performing the equivalent functions):
(a) All significant deficiencies and material weaknesses in the design or operation of internal control over financial reporting which are reasonably likely toadversely affect the registrant's ability to record, process, summarize and report financial information; and
(b) Any fraud, whether or not material, that involves management or other employees who have a significant role in the registrant's internal control over financialreporting.
Date: November 1, 2017 /s/ Jack DorseyJack DorseyChief Executive Officer(Principal Executive Officer)

Exhibit 31.2
CERTIFICATION OF PERIODIC REPORT UNDER SECTION 302 OFTHE SARBANES-OXLEY ACT OF 2002
I, Ned Segal, certify that:
1. I have reviewed this Quarterly Report on Form 10-Q of Twitter, Inc.;
2. Based on my knowledge, this report does not contain any untrue statement of a material fact or omit to state a material fact necessary to make the statementsmade, in light of the circumstances under which such statements were made, not misleading with respect to the period covered by this report;
3. Based on my knowledge, the financial statements, and other financial information included in this report, fairly present in all material respects the financialcondition, results of operations and cash flows of the registrant as of, and for, the periods presented in this report;
4. The registrant’s other certifying officer and I are responsible for establishing and maintaining disclosure controls and procedures (as defined in Exchange ActRules 13a–15(e) and 15d–15(e)) and internal control over financial reporting (as defined in Exchange Act Rules 13a-15(f) and 15d-15(f)) for the registrant andhave:
(a) Designed such disclosure controls and procedures, or caused such disclosure controls and procedures to be designed under our supervision, to ensure thatmaterial information relating to the registrant, including its consolidated subsidiaries, is made known to us by others within those entities, particularly during theperiod in which this report is being prepared;
(b) Designed such internal control over financial reporting, or caused such internal control over financial reporting to be designed under our supervision, to providereasonable assurance regarding the reliability of financial reporting and the preparation of financial statements for external purposes in accordance with generallyaccepted accounting principles;
(c) Evaluated the effectiveness of the registrant's disclosure controls and procedures and presented in this report our conclusions about the effectiveness of thedisclosure controls and procedures, as of the end of the period covered by this report based on such evaluation; and
(d) Disclosed in this report any change in the registrant’s internal control over financial reporting that occurred during the registrant’s most recent fiscal quarter (theregistrant’s fourth fiscal quarter in the case of an annual report) that has materially affected, or is reasonably likely to materially affect, the registrant's internalcontrol over financial reporting; and
5. The registrant’s other certifying officer and I have disclosed, based on our most recent evaluation of internal control over financial reporting, to the registrant'sauditors and the audit committee of the registrant's board of directors (or persons performing the equivalent functions):
(a) All significant deficiencies and material weaknesses in the design or operation of internal control over financial reporting which are reasonably likely toadversely affect the registrant’s ability to record, process, summarize and report financial information; and
(b) Any fraud, whether or not material, that involves management or other employees who have a significant role in the registrant’s internal control over financialreporting.
Date: November 1, 2017 /s/ Ned SegalNed SegalChief Financial Officer(Principal Financial Officer)

Exhibit 32.1
CERTIFICATIONS OF CHIEF EXECUTIVE OFFICER AND CHIEF FINANCIAL OFFICERPURSUANT TO
18 U.S.C. SECTION 1350,AS ADOPTED PURSUANT TO
SECTION 906 OF THE SARBANES-OXLEY ACT OF 2002
I, Jack Dorsey, certify, pursuant to 18 U.S.C. Section 1350, as adopted pursuant to Section 906 of the Sarbanes-Oxley Act of 2002, that the Quarterly Report onForm 10-Q of Twitter, Inc. for the fiscal quarter ended September 30, 2017 fully complies with the requirements of Section 13(a) or 15(d) of the SecuritiesExchange Act of 1934 and that information contained in such Quarterly Report on Form 10-Q fairly presents, in all material respects, the financial condition andresults of operations of Twitter, Inc. Date: November 1, 2017 By: /s/ Jack Dorsey Name: Jack Dorsey Title: Chief Executive Officer
I, Ned Segal, certify, pursuant to 18 U.S.C. Section 1350, as adopted pursuant to Section 906 of the Sarbanes-Oxley Act of 2002, that the Quarterly Report on Form10-Q of Twitter, Inc. for the fiscal quarter ended September 30, 2017 fully complies with the requirements of Section 13(a) or 15(d) of the Securities Exchange Actof 1934 and that information contained in such Quarterly Report on Form 10-Q fairly presents, in all material respects, the financial condition and results ofoperations of Twitter, Inc. Date: November 1, 2017 By: /s/ Ned Segal Name: Ned Segal Title: Chief Financial Officer