canadian natural resources limited announces 2018 first ...
68
CANADIAN NATURAL RESOURCES LIMITED ANNOUNCES 2018 FIRST QUARTER RESULTS Commenting on first quarter 2018 results, Steve Laut, Executive Vice-Chairman of Canadian Natural stated, "The strength of our well balanced and diverse portfolio, combined with our long life low decline asset base, delivered a strong first quarter for Canadian Natural. Our balanced production mix is a key component of our strategy to create shareholder value throughout the commodity price cycle. In 2018, the Company remains focused on delivering on its capital allocation program through disciplined economic resource development, strengthening the balance sheet, and increasing returns to shareholders. The Company continues to maximize value while operating with a top tier safety record and an ongoing commitment to reduce its environmental footprint in all aspects of its operations." Canadian Natural's President, Tim McKay, added, "In the first quarter of 2018, Canadian Natural achieved record quarterly production of 1,123,546 BOE/d, growth of 10% over fourth quarter 2017 levels, primarily as a result of strong production performance at our Oil Sands Mining and Upgrading assets. A full quarter of production from the successful Phase 3 expansion at Horizon and strong operational performance at the Athabasca Oil Sands Project ("AOSP") resulted in record production of approximately 456,000 bbl/d of Synthetic Crude Oil ("SCO"). Our focus on cost control and efficiencies, high utilization rates and safe, reliable operations resulted in record low quarterly operating costs of $21.37/bbl (US $16.89/bbl) of SCO. As a result of our industry leading operations at both Horizon and the AOSP, the Company reduced the midpoint of annual Oil Sands Mining and Upgrading operating cost guidance by $2.00/bbl to $22.50/bbl of SCO. Canadian Natural continues to focus on effective and efficient operations, continuous improvement and leveraging technology, while maintaining its capital discipline, as a result the 2018 capital expenditure program remains unchanged." Canadian Natural's Chief Financial Officer, Corey Bieber, continued, "The Company had a solid first quarter, achieving funds flow from operations of $2,323 million and net earnings of $583 million demonstrating the value of our diverse asset base as we remain on track to deliver strong financial results in 2018. As a result, free cash flow was significant at approximately $1,220 million before dividends and approximately $880 million after dividend commitments. Our continued focus on balance sheet strength has resulted in the decrease of long term net debt and the retirement of the deferred AOSP acquisition liability, a total reduction of approximately $1.9 billion since Q2/17. Debt to adjusted EBITDA strengthened to 2.5x at quarter end and debt to book capitalization improved to 40.5%, within our targeted range. As previously announced, the Company increased its quarterly dividend by 22% to $0.335 per common share and renewed and increased its Normal Course Issuer Bid ("NCIB") program. Subsequent to quarter end, Canadian Natural initiated share purchases as part of its NCIB program, evidence of our commitment to deliver returns to our shareholders. The Company will look to continue share purchases throughout the year on an opportunistic basis, if it makes economic sense to do so.”
-
Upload
khangminh22 -
Category
Documents
-
view
4 -
download
0
Transcript of canadian natural resources limited announces 2018 first ...
CANADIAN NATURAL RESOURCES LIMITED ANNOUNCES 2018 FIRST QUARTER RESULTS
Commenting on first quarter 2018 results, Steve Laut, Executive Vice-Chairman of Canadian Natural stated, "The strength of our well balanced and diverse portfolio, combined with our long life low decline asset base, delivered a strong first quarter for Canadian Natural. Our balanced production mix is a key component of our strategy to create shareholder value throughout the commodity price cycle. In 2018, the Company remains focused on delivering on its capital allocation program through disciplined economic resource development, strengthening the balance sheet, and increasing returns to shareholders. The Company continues to maximize value while operating with a top tier safety record and an ongoing commitment to reduce its environmental footprint in all aspects of its operations."
Canadian Natural's President, Tim McKay, added, "In the first quarter of 2018, Canadian Natural achieved record quarterly production of 1,123,546 BOE/d, growth of 10% over fourth quarter 2017 levels, primarily as a result of strong production performance at our Oil Sands Mining and Upgrading assets. A full quarter of production from the successful Phase 3 expansion at Horizon and strong operational performance at the Athabasca Oil Sands Project ("AOSP") resulted in record production of approximately 456,000 bbl/d of Synthetic Crude Oil ("SCO"). Our focus on cost control and efficiencies, high utilization rates and safe, reliable operations resulted in record low quarterly operating costs of $21.37/bbl (US$16.89/bbl) of SCO. As a result of our industry leading operations at both Horizon and the AOSP, the Company reduced the midpoint of annual Oil Sands Mining and Upgrading operating cost guidance by $2.00/bbl to $22.50/bbl of SCO. Canadian Natural continues to focus on effective and efficient operations, continuous improvement and leveraging technology, while maintaining its capital discipline, as a result the 2018 capital expenditure program remains unchanged."
Canadian Natural's Chief Financial Officer, Corey Bieber, continued, "The Company had a solid first quarter, achieving funds flow from operations of $2,323 million and net earnings of $583 million demonstrating the value of our diverse asset base as we remain on track to deliver strong financial results in 2018. As a result, free cash flow was significant at approximately $1,220 million before dividends and approximately $880 million after dividend commitments.
Our continued focus on balance sheet strength has resulted in the decrease of long term net debt and the retirement of the deferred AOSP acquisition liability, a total reduction of approximately $1.9 billion since Q2/17. Debt to adjusted EBITDA strengthened to 2.5x at quarter end and debt to book capitalization improved to 40.5%, within our targeted range.
As previously announced, the Company increased its quarterly dividend by 22% to $0.335 per common share and renewed and increased its Normal Course Issuer Bid ("NCIB") program. Subsequent to quarter end, Canadian Natural initiated share purchases as part of its NCIB program, evidence of our commitment to deliver returns to our shareholders. The Company will look to continue share purchases throughout the year on an opportunistic basis, if it makes economic sense to do so.”
Canadian Natural Resources Limited 2 Three Months Ended March 31, 2018
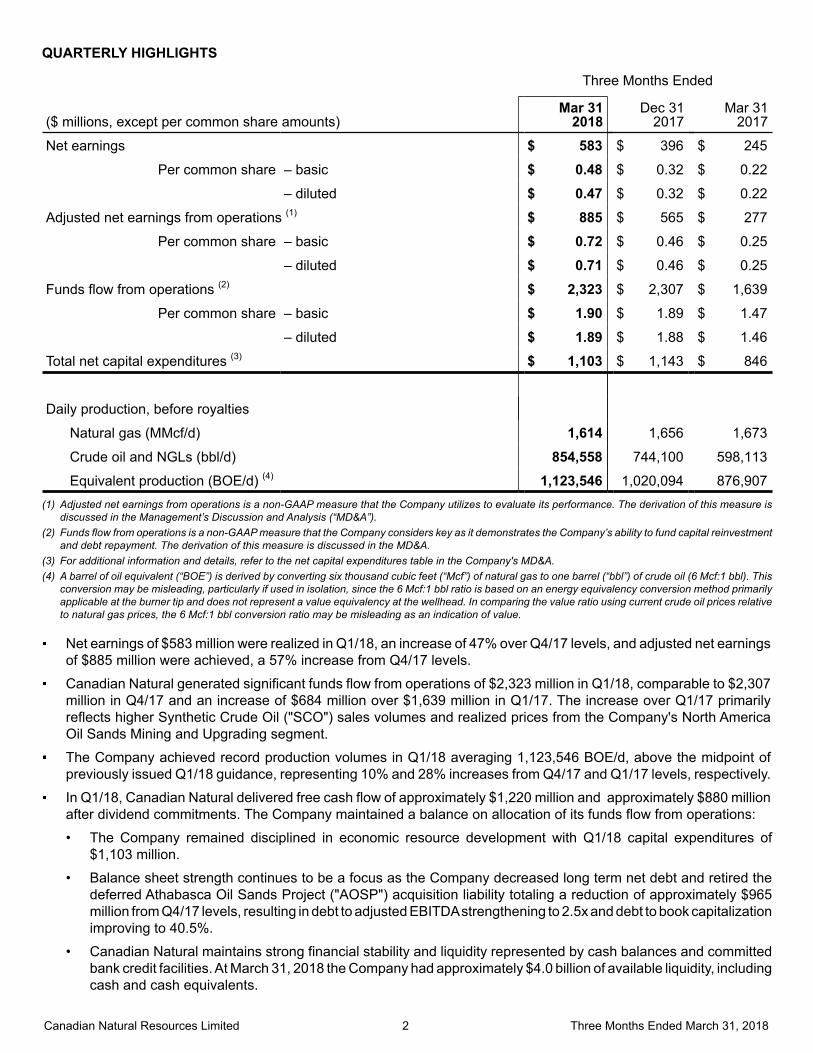
QUARTERLY HIGHLIGHTS
Three Months Ended
($ millions, except per common share amounts)Mar 31
2018Dec 31
2017Mar 31
2017
Net earnings $ 583 $ 396 $ 245
Per common share – basic $ 0.48 $ 0.32 $ 0.22
– diluted $ 0.47 $ 0.32 $ 0.22
Adjusted net earnings from operations (1) $ 885 $ 565 $ 277
Per common share – basic $ 0.72 $ 0.46 $ 0.25
– diluted $ 0.71 $ 0.46 $ 0.25
Funds flow from operations (2) $ 2,323 $ 2,307 $ 1,639
Per common share – basic $ 1.90 $ 1.89 $ 1.47
– diluted $ 1.89 $ 1.88 $ 1.46
Total net capital expenditures (3) $ 1,103 $ 1,143 $ 846
Daily production, before royalties
Natural gas (MMcf/d) 1,614 1,656 1,673
Crude oil and NGLs (bbl/d) 854,558 744,100 598,113
Equivalent production (BOE/d) (4) 1,123,546 1,020,094 876,907(1) Adjusted net earnings from operations is a non-GAAP measure that the Company utilizes to evaluate its performance. The derivation of this measure is
discussed in the Management’s Discussion and Analysis (“MD&A”).(2) Funds flow from operations is a non-GAAP measure that the Company considers key as it demonstrates the Company’s ability to fund capital reinvestment
and debt repayment. The derivation of this measure is discussed in the MD&A.(3) For additional information and details, refer to the net capital expenditures table in the Company's MD&A.(4) A barrel of oil equivalent (“BOE”) is derived by converting six thousand cubic feet (“Mcf”) of natural gas to one barrel (“bbl”) of crude oil (6 Mcf:1 bbl). This
conversion may be misleading, particularly if used in isolation, since the 6 Mcf:1 bbl ratio is based on an energy equivalency conversion method primarily applicable at the burner tip and does not represent a value equivalency at the wellhead. In comparing the value ratio using current crude oil prices relative to natural gas prices, the 6 Mcf:1 bbl conversion ratio may be misleading as an indication of value.
Net earnings of $583 million were realized in Q1/18, an increase of 47% over Q4/17 levels, and adjusted net earnings of $885 million were achieved, a 57% increase from Q4/17 levels.
Canadian Natural generated significant funds flow from operations of $2,323 million in Q1/18, comparable to $2,307 million in Q4/17 and an increase of $684 million over $1,639 million in Q1/17. The increase over Q1/17 primarily reflects higher Synthetic Crude Oil ("SCO") sales volumes and realized prices from the Company's North America Oil Sands Mining and Upgrading segment.
The Company achieved record production volumes in Q1/18 averaging 1,123,546 BOE/d, above the midpoint of previously issued Q1/18 guidance, representing 10% and 28% increases from Q4/17 and Q1/17 levels, respectively.
In Q1/18, Canadian Natural delivered free cash flow of approximately $1,220 million and approximately $880 million after dividend commitments. The Company maintained a balance on allocation of its funds flow from operations:
• The Company remained disciplined in economic resource development with Q1/18 capital expenditures of $1,103 million.
• Balance sheet strength continues to be a focus as the Company decreased long term net debt and retired the deferred Athabasca Oil Sands Project ("AOSP") acquisition liability totaling a reduction of approximately $965 million from Q4/17 levels, resulting in debt to adjusted EBITDA strengthening to 2.5x and debt to book capitalization improving to 40.5%.
• Canadian Natural maintains strong financial stability and liquidity represented by cash balances and committed bank credit facilities. At March 31, 2018 the Company had approximately $4.0 billion of available liquidity, including cash and cash equivalents.
Canadian Natural Resources Limited 3 Three Months Ended March 31, 2018
• Returns to shareholders remain a key focus for Canadian Natural and as previously announced on March 1, 2018, the Company increased its quarterly dividend by 22% to $0.335 per common share.
• Subsequent to quarter end, the Company initiated share buybacks and purchased 700,000 common shares for cancellation at a weighted average price of $41.95 per common share.
Canadian Natural’s corporate crude oil and NGL production volumes averaged 854,558 bbl/d, increases of 15% and 43% from Q4/17 and Q1/17 levels respectively, primarily as a result of a full quarter of production from the Horizon Phase 3 expansion, as well as high reliability and strong production from acquisitions completed in 2017.
At the Company's world class Oil Sands Mining and Upgrading assets, operations were strong in Q1/18 with quarterly production reaching a record 456,076 bbl/d of SCO. Through safe, steady and reliable operations, a strong focus on cost control and efficiencies, and high utilization rates, the Company realized industry leading, record low operating costs of $21.37/bbl (US$16.89/bbl) of SCO in Q1/18, a 14% decrease from Q4/17 levels.
• As a result of the Oil Sands Mining and Upgrading segment's strong operational performance and cost savings, the Company reduced annual operating cost guidance by $2.00/bbl of SCO, with annual operating costs now targeted between $20.50/bbl and $24.50/bbl (approximately US$16.25/bbl - US$19.50/bbl).
• At Horizon, following the successful completion of the Phase 3 expansion, the Company is evaluating Horizon Upgrader reliability enhancements and potential creep capacity improvements.
Stage 1 detailed engineering for reliability improvement which involves pump and piping modification is targeted to be completed by the end of 2018, with most of the activity taking place during the planned 21 day turnaround targeted later this year.
Stage 2 design based memorandum activities related to capacity increases within the Upgrader is targeted to add 5,000 bbl/d to15,000 bbl/d of potential creep capacity.
• At Horizon, work continues on the potential Paraffinic Froth Treatment and Vacuum Gas Oil ("VGO") expansions.
The engineering and design specification work on the potential Paraffinic Froth Treatment expansion at Horizon is underway and has the ability to produce high quality diluted bitumen, targeting to add approximately 30,000 bbl/d to 40,000 bbl/d.
The proposed VGO expansion at Horizon is in early scoping and is targeted to add approximately 10,000 bbl/d to 15,000 bbl/d.
At Kirby North, the Company's targeted 40,000 bbl/d Steam Assisted Gravity Drainage ("SAGD") project is targeting first oil in Q1/20. Over the quarter, top tier execution and strong productivity was achieved and as a result, the project is trending ahead of schedule and cost performance is on budget. Currently, over 75% of the Central Processing Facility equipment has been delivered to site and SAGD drilling is nearing 25% completion.
Canadian Natural continues to focus on safe, reliable, effective and efficient operations while minimizing its environmental footprint.
• Canadian Natural has invested significant capital to capture and sequester CO2. The Company has carbon capture and sequestration facilities at Horizon, a 70% working interest in the Quest Carbon Capture and Storage project at Scotford and has carbon capture facilities at its 50% interest in the North West Redwater ("NWR") refinery. As a result, Canadian Natural targets capacity to capture and sequester 2.7 million tonnes of CO2 annually, equivalent to taking 570,000 vehicles off the road, making the Company the 5th largest capturer and sequester of CO2 globally once the NWR refinery is fully running.
• At Canadian Natural's Oil Sands operations, which represent approximately 66% of the Company's liquids production, the Company's emissions intensity is only approximately 5% higher than the average intensity for all global crude oils. By investing in and leveraging technology, specifically carbon capture initiatives, Canadian Natural has developed a pathway to reduce the Company's greenhouse gas ("GHG") emissions intensity to be below the average for global crude oils.
• Canadian Natural's commitment to leverage technology, adopting innovation and continuous improvement is evidenced by its In Pit Extraction Process ("IPEP") pilot at Horizon, which will test the possibility to produce stackable dry tailings. The project has the potential to reduce the Company's carbon emissions and environmental footprint by reducing the usage of haul trucks, the size and need for tailings ponds and accelerating site reclamation. In addition this has the potential to significantly reduce capital and operating costs.
• The Company's GHG emissions intensity has decreased materially since 2013 as GHG emissions intensity has decreased by 18% from 2013 to 2017.
Canadian Natural Resources Limited 4 Three Months Ended March 31, 2018
• Methane emissions have decreased 71% from 2013 to 2017 from the Company's primary heavy crude oil operations.
Balance sheet strength continues to be a focus of the Company and strong financial performance was demonstrated in Q1/18 through the retirement of US$ denominated notes and early retirement of certain credit facilities as detailed in the Company's financial statements.
• Since the AOSP acquisition in Q2/17 Canadian Natural has decreased long term net debt and retired the deferred AOSP acquisition liability, totaling a reduction of approximately $1.9 billion.
• In Q1/18, the Company has decreased long term net debt and retired the deferred AOSP acquisition liability, totaling a reduction of approximately $965 million, since Q4/17.
Subsequent to quarter end, Canadian Natural declared a quarterly cash dividend on common shares of $0.335 per share payable on July 1, 2018.
Canadian Natural Resources Limited 5 Three Months Ended March 31, 2018
OPERATIONS REVIEW AND CAPITAL ALLOCATIONCanadian Natural has a balanced and diverse portfolio of assets, primarily Canadian-based, with international exposure in the UK section of the North Sea and Offshore Africa. Canadian Natural’s production is well balanced between light and medium crude oil, primary heavy crude oil, Pelican Lake heavy crude oil, bitumen and SCO (herein collectively referred to as “crude oil”), natural gas and NGLs. This balance provides optionality for capital investments, facilitating improved value for the Company’s shareholders.
Underpinning this asset base is long life low decline production from the Company's Oil Sands Mining and Upgrading, thermal in situ oil sands and Pelican Lake heavy crude oil assets. The combination of low decline, low reserves replacement costs, and effective and efficient operations means these assets provide substantial and sustainable cash flow throughout the commodity price cycle.
Augmenting this, Canadian Natural maintains a substantial inventory of low capital exposure projects within its conventional asset base. These projects can be executed quickly and with the right economic conditions, can provide excellent returns and maximize value for shareholders. Supporting these projects is the Company’s undeveloped land base which enables large, repeatable drilling programs which can be optimized over time. Additionally, by owning and operating most of the related infrastructure, Canadian Natural is able to control a major component of its operating cost and minimize production commitments. Low capital exposure projects can be quickly stopped or started depending upon success, market conditions, or corporate needs.
Canadian Natural’s balanced portfolio, built with both long life low decline assets and low capital exposure assets, enables effective capital allocation, production growth and value creation.
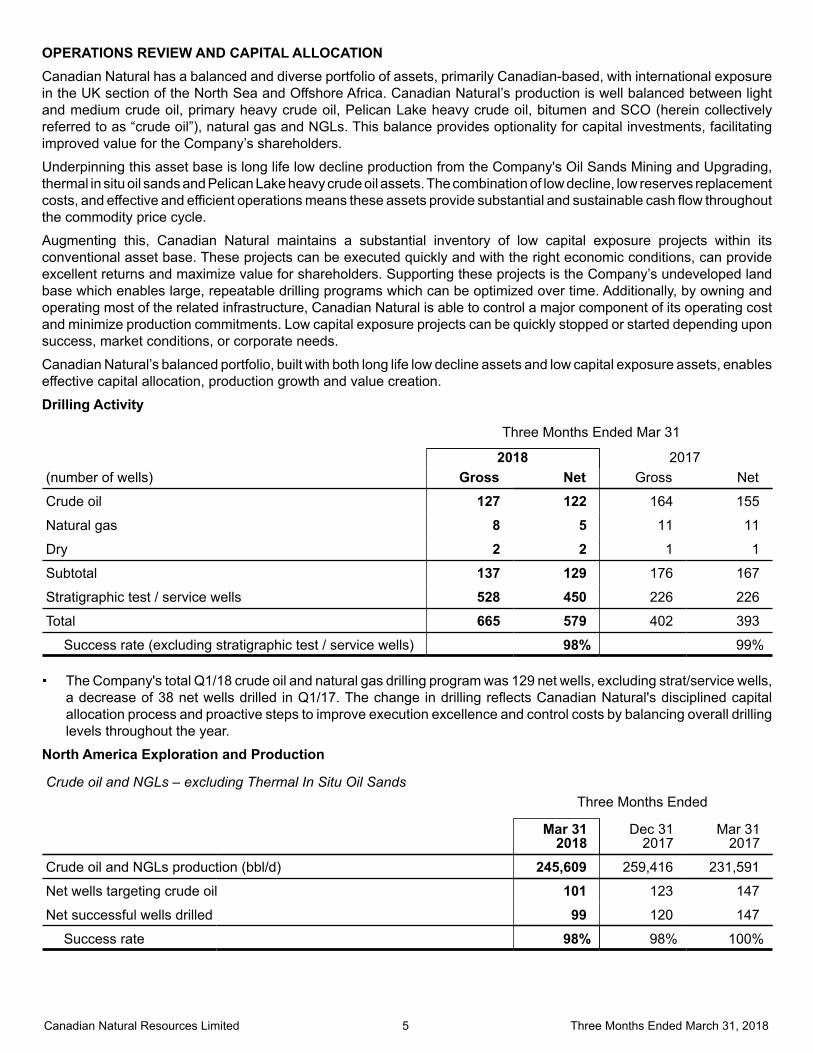
Drilling Activity
Three Months Ended Mar 31
2018 2017(number of wells) Gross Net Gross Net
Crude oil 127 122 164 155
Natural gas 8 5 11 11
Dry 2 2 1 1
Subtotal 137 129 176 167
Stratigraphic test / service wells 528 450 226 226
Total 665 579 402 393
Success rate (excluding stratigraphic test / service wells) 98% 99%
The Company's total Q1/18 crude oil and natural gas drilling program was 129 net wells, excluding strat/service wells, a decrease of 38 net wells drilled in Q1/17. The change in drilling reflects Canadian Natural's disciplined capital allocation process and proactive steps to improve execution excellence and control costs by balancing overall drilling levels throughout the year.
North America Exploration and Production
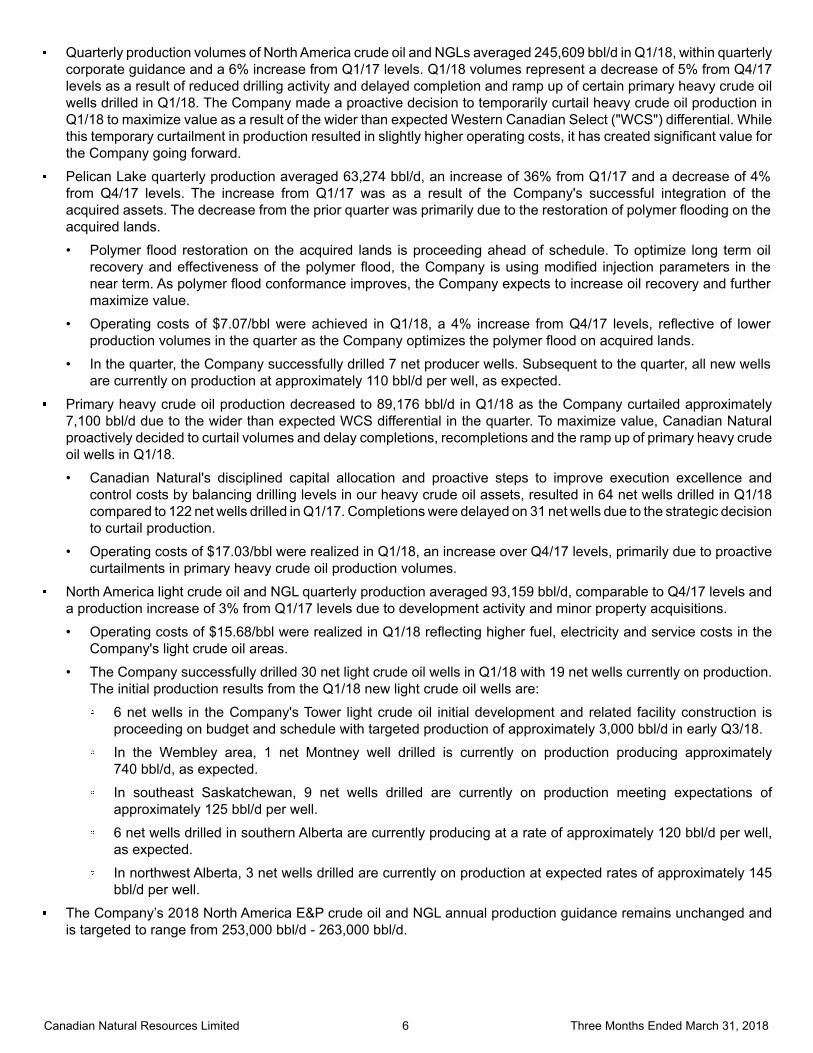
Crude oil and NGLs – excluding Thermal In Situ Oil SandsThree Months Ended
Mar 312018
Dec 312017
Mar 312017
Crude oil and NGLs production (bbl/d) 245,609 259,416 231,591
Net wells targeting crude oil 101 123 147
Net successful wells drilled 99 120 147
Success rate 98% 98% 100%
Canadian Natural Resources Limited 6 Three Months Ended March 31, 2018
Quarterly production volumes of North America crude oil and NGLs averaged 245,609 bbl/d in Q1/18, within quarterly corporate guidance and a 6% increase from Q1/17 levels. Q1/18 volumes represent a decrease of 5% from Q4/17 levels as a result of reduced drilling activity and delayed completion and ramp up of certain primary heavy crude oil wells drilled in Q1/18. The Company made a proactive decision to temporarily curtail heavy crude oil production in Q1/18 to maximize value as a result of the wider than expected Western Canadian Select ("WCS") differential. While this temporary curtailment in production resulted in slightly higher operating costs, it has created significant value for the Company going forward.
Pelican Lake quarterly production averaged 63,274 bbl/d, an increase of 36% from Q1/17 and a decrease of 4% from Q4/17 levels. The increase from Q1/17 was as a result of the Company's successful integration of the acquired assets. The decrease from the prior quarter was primarily due to the restoration of polymer flooding on the acquired lands.
• Polymer flood restoration on the acquired lands is proceeding ahead of schedule. To optimize long term oil recovery and effectiveness of the polymer flood, the Company is using modified injection parameters in the near term. As polymer flood conformance improves, the Company expects to increase oil recovery and further maximize value.
• Operating costs of $7.07/bbl were achieved in Q1/18, a 4% increase from Q4/17 levels, reflective of lower production volumes in the quarter as the Company optimizes the polymer flood on acquired lands.
• In the quarter, the Company successfully drilled 7 net producer wells. Subsequent to the quarter, all new wells are currently on production at approximately 110 bbl/d per well, as expected.
Primary heavy crude oil production decreased to 89,176 bbl/d in Q1/18 as the Company curtailed approximately 7,100 bbl/d due to the wider than expected WCS differential in the quarter. To maximize value, Canadian Natural proactively decided to curtail volumes and delay completions, recompletions and the ramp up of primary heavy crude oil wells in Q1/18.
• Canadian Natural's disciplined capital allocation and proactive steps to improve execution excellence and control costs by balancing drilling levels in our heavy crude oil assets, resulted in 64 net wells drilled in Q1/18 compared to 122 net wells drilled in Q1/17. Completions were delayed on 31 net wells due to the strategic decision to curtail production.
• Operating costs of $17.03/bbl were realized in Q1/18, an increase over Q4/17 levels, primarily due to proactive curtailments in primary heavy crude oil production volumes.
North America light crude oil and NGL quarterly production averaged 93,159 bbl/d, comparable to Q4/17 levels and a production increase of 3% from Q1/17 levels due to development activity and minor property acquisitions.
• Operating costs of $15.68/bbl were realized in Q1/18 reflecting higher fuel, electricity and service costs in the Company's light crude oil areas.
• The Company successfully drilled 30 net light crude oil wells in Q1/18 with 19 net wells currently on production. The initial production results from the Q1/18 new light crude oil wells are:
6 net wells in the Company's Tower light crude oil initial development and related facility construction is proceeding on budget and schedule with targeted production of approximately 3,000 bbl/d in early Q3/18.
In the Wembley area, 1 net Montney well drilled is currently on production producing approximately 740 bbl/d, as expected.
In southeast Saskatchewan, 9 net wells drilled are currently on production meeting expectations of approximately 125 bbl/d per well.
6 net wells drilled in southern Alberta are currently producing at a rate of approximately 120 bbl/d per well, as expected.
In northwest Alberta, 3 net wells drilled are currently on production at expected rates of approximately 145 bbl/d per well.
The Company’s 2018 North America E&P crude oil and NGL annual production guidance remains unchanged and is targeted to range from 253,000 bbl/d - 263,000 bbl/d.
Canadian Natural Resources Limited 7 Three Months Ended March 31, 2018
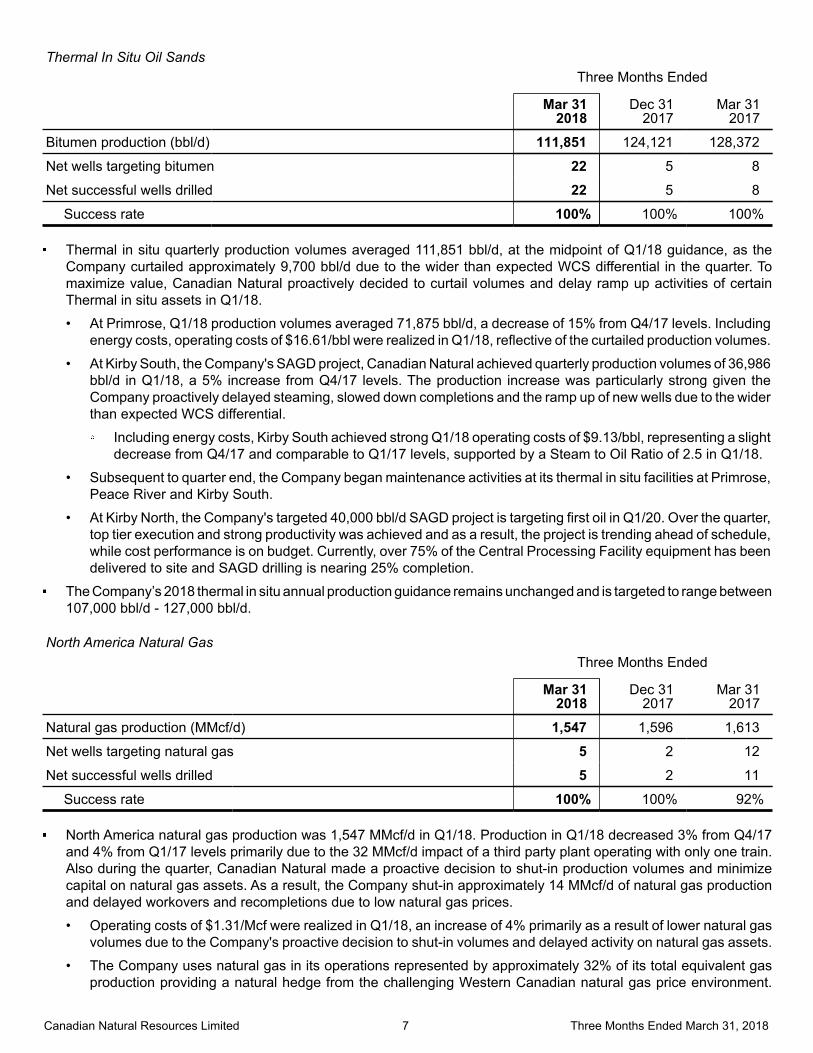
Thermal In Situ Oil SandsThree Months Ended
Mar 31 2018
Dec 312017
Mar 312017
Bitumen production (bbl/d) 111,851 124,121 128,372
Net wells targeting bitumen 22 5 8
Net successful wells drilled 22 5 8
Success rate 100% 100% 100%
Thermal in situ quarterly production volumes averaged 111,851 bbl/d, at the midpoint of Q1/18 guidance, as the Company curtailed approximately 9,700 bbl/d due to the wider than expected WCS differential in the quarter. To maximize value, Canadian Natural proactively decided to curtail volumes and delay ramp up activities of certain Thermal in situ assets in Q1/18.
• At Primrose, Q1/18 production volumes averaged 71,875 bbl/d, a decrease of 15% from Q4/17 levels. Including energy costs, operating costs of $16.61/bbl were realized in Q1/18, reflective of the curtailed production volumes.
• At Kirby South, the Company's SAGD project, Canadian Natural achieved quarterly production volumes of 36,986 bbl/d in Q1/18, a 5% increase from Q4/17 levels. The production increase was particularly strong given the Company proactively delayed steaming, slowed down completions and the ramp up of new wells due to the wider than expected WCS differential.
Including energy costs, Kirby South achieved strong Q1/18 operating costs of $9.13/bbl, representing a slight decrease from Q4/17 and comparable to Q1/17 levels, supported by a Steam to Oil Ratio of 2.5 in Q1/18.
• Subsequent to quarter end, the Company began maintenance activities at its thermal in situ facilities at Primrose, Peace River and Kirby South.
• At Kirby North, the Company's targeted 40,000 bbl/d SAGD project is targeting first oil in Q1/20. Over the quarter, top tier execution and strong productivity was achieved and as a result, the project is trending ahead of schedule, while cost performance is on budget. Currently, over 75% of the Central Processing Facility equipment has been delivered to site and SAGD drilling is nearing 25% completion.
The Company’s 2018 thermal in situ annual production guidance remains unchanged and is targeted to range between 107,000 bbl/d - 127,000 bbl/d.
North America Natural GasThree Months Ended
Mar 31 2018
Dec 312017
Mar 312017
Natural gas production (MMcf/d) 1,547 1,596 1,613
Net wells targeting natural gas 5 2 12
Net successful wells drilled 5 2 11
Success rate 100% 100% 92%
North America natural gas production was 1,547 MMcf/d in Q1/18. Production in Q1/18 decreased 3% from Q4/17 and 4% from Q1/17 levels primarily due to the 32 MMcf/d impact of a third party plant operating with only one train. Also during the quarter, Canadian Natural made a proactive decision to shut-in production volumes and minimize capital on natural gas assets. As a result, the Company shut-in approximately 14 MMcf/d of natural gas production and delayed workovers and recompletions due to low natural gas prices.
• Operating costs of $1.31/Mcf were realized in Q1/18, an increase of 4% primarily as a result of lower natural gas volumes due to the Company's proactive decision to shut-in volumes and delayed activity on natural gas assets.
• The Company uses natural gas in its operations represented by approximately 32% of its total equivalent gas production providing a natural hedge from the challenging Western Canadian natural gas price environment.
Canadian Natural Resources Limited 8 Three Months Ended March 31, 2018
Approximately 29% of the natural gas production is exported to other North American markets or sold internationally, with the remaining 39% of the Company's production being exposed to AECO/Station 2 pricing.
The Company’s 2018 corporate natural gas annual production guidance remains unchanged and is targeted to range from 1,650 MMcf/d - 1,710 MMcf/d.
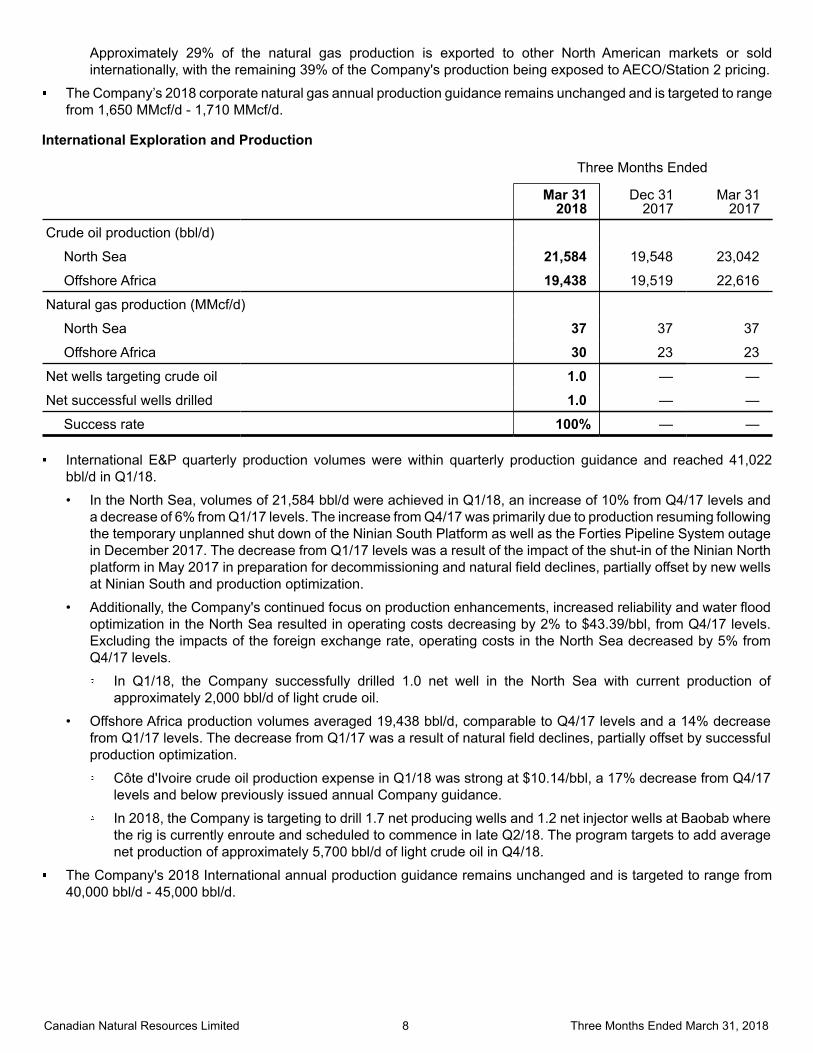
International Exploration and Production
Three Months Ended
Mar 31 2018
Dec 312017
Mar 312017
Crude oil production (bbl/d)
North Sea 21,584 19,548 23,042
Offshore Africa 19,438 19,519 22,616
Natural gas production (MMcf/d)
North Sea 37 37 37
Offshore Africa 30 23 23
Net wells targeting crude oil 1.0 — —
Net successful wells drilled 1.0 — —
Success rate 100% — —
International E&P quarterly production volumes were within quarterly production guidance and reached 41,022bbl/d in Q1/18.
• In the North Sea, volumes of 21,584 bbl/d were achieved in Q1/18, an increase of 10% from Q4/17 levels and a decrease of 6% from Q1/17 levels. The increase from Q4/17 was primarily due to production resuming following the temporary unplanned shut down of the Ninian South Platform as well as the Forties Pipeline System outage in December 2017. The decrease from Q1/17 levels was a result of the impact of the shut-in of the Ninian North platform in May 2017 in preparation for decommissioning and natural field declines, partially offset by new wells at Ninian South and production optimization.
• Additionally, the Company's continued focus on production enhancements, increased reliability and water flood optimization in the North Sea resulted in operating costs decreasing by 2% to $43.39/bbl, from Q4/17 levels. Excluding the impacts of the foreign exchange rate, operating costs in the North Sea decreased by 5% from Q4/17 levels.
In Q1/18, the Company successfully drilled 1.0 net well in the North Sea with current production of approximately 2,000 bbl/d of light crude oil.
• Offshore Africa production volumes averaged 19,438 bbl/d, comparable to Q4/17 levels and a 14% decrease from Q1/17 levels. The decrease from Q1/17 was a result of natural field declines, partially offset by successful production optimization.
Côte d'Ivoire crude oil production expense in Q1/18 was strong at $10.14/bbl, a 17% decrease from Q4/17 levels and below previously issued annual Company guidance.
In 2018, the Company is targeting to drill 1.7 net producing wells and 1.2 net injector wells at Baobab where the rig is currently enroute and scheduled to commence in late Q2/18. The program targets to add average net production of approximately 5,700 bbl/d of light crude oil in Q4/18.
The Company's 2018 International annual production guidance remains unchanged and is targeted to range from 40,000 bbl/d - 45,000 bbl/d.
Canadian Natural Resources Limited 9 Three Months Ended March 31, 2018
North America Oil Sands Mining and Upgrading
Three Months Ended
Mar 31 2018
Dec 312017
Mar 312017
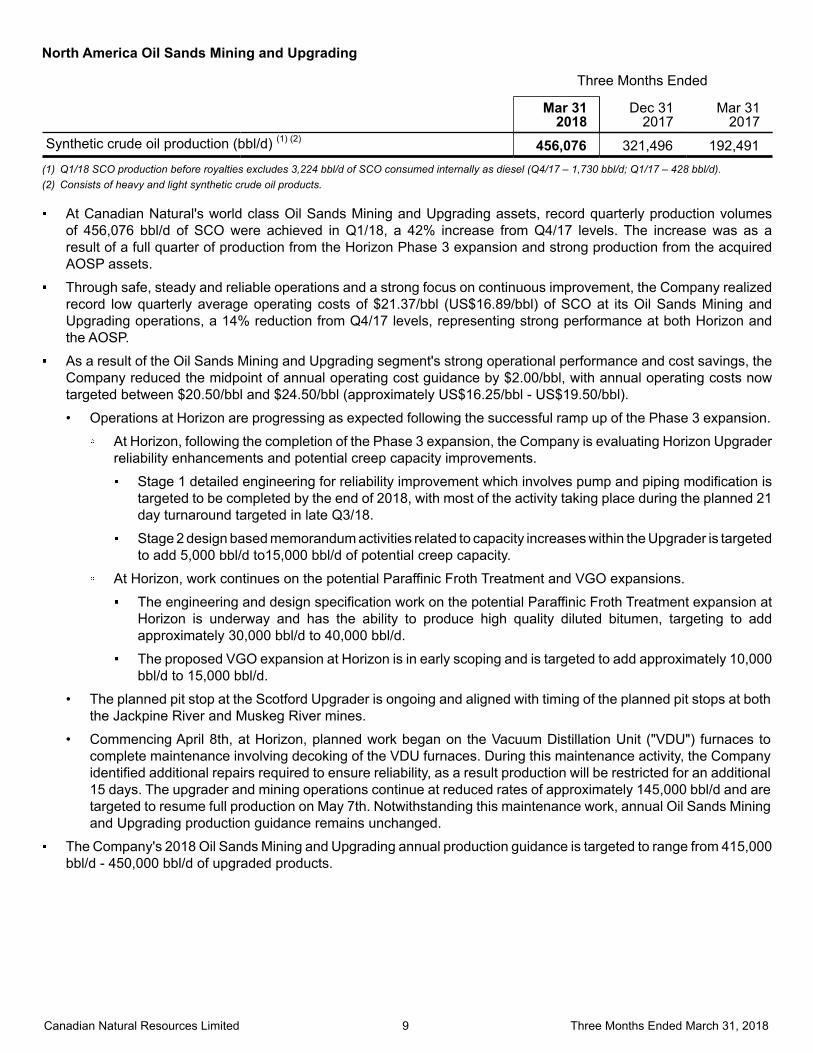
Synthetic crude oil production (bbl/d) (1) (2) 456,076 321,496 192,491(1) Q1/18 SCO production before royalties excludes 3,224 bbl/d of SCO consumed internally as diesel (Q4/17 – 1,730 bbl/d; Q1/17 – 428 bbl/d).(2) Consists of heavy and light synthetic crude oil products.
At Canadian Natural's world class Oil Sands Mining and Upgrading assets, record quarterly production volumes of 456,076 bbl/d of SCO were achieved in Q1/18, a 42% increase from Q4/17 levels. The increase was as a result of a full quarter of production from the Horizon Phase 3 expansion and strong production from the acquired AOSP assets.
Through safe, steady and reliable operations and a strong focus on continuous improvement, the Company realized record low quarterly average operating costs of $21.37/bbl (US$16.89/bbl) of SCO at its Oil Sands Mining and Upgrading operations, a 14% reduction from Q4/17 levels, representing strong performance at both Horizon and the AOSP.
As a result of the Oil Sands Mining and Upgrading segment's strong operational performance and cost savings, the Company reduced the midpoint of annual operating cost guidance by $2.00/bbl, with annual operating costs now targeted between $20.50/bbl and $24.50/bbl (approximately US$16.25/bbl - US$19.50/bbl).
• Operations at Horizon are progressing as expected following the successful ramp up of the Phase 3 expansion.
At Horizon, following the completion of the Phase 3 expansion, the Company is evaluating Horizon Upgrader reliability enhancements and potential creep capacity improvements.
Stage 1 detailed engineering for reliability improvement which involves pump and piping modification is targeted to be completed by the end of 2018, with most of the activity taking place during the planned 21 day turnaround targeted in late Q3/18.
Stage 2 design based memorandum activities related to capacity increases within the Upgrader is targeted to add 5,000 bbl/d to15,000 bbl/d of potential creep capacity.
At Horizon, work continues on the potential Paraffinic Froth Treatment and VGO expansions.
The engineering and design specification work on the potential Paraffinic Froth Treatment expansion at Horizon is underway and has the ability to produce high quality diluted bitumen, targeting to add approximately 30,000 bbl/d to 40,000 bbl/d.
The proposed VGO expansion at Horizon is in early scoping and is targeted to add approximately 10,000 bbl/d to 15,000 bbl/d.
• The planned pit stop at the Scotford Upgrader is ongoing and aligned with timing of the planned pit stops at both the Jackpine River and Muskeg River mines.
• Commencing April 8th, at Horizon, planned work began on the Vacuum Distillation Unit ("VDU") furnaces to complete maintenance involving decoking of the VDU furnaces. During this maintenance activity, the Company identified additional repairs required to ensure reliability, as a result production will be restricted for an additional 15 days. The upgrader and mining operations continue at reduced rates of approximately 145,000 bbl/d and are targeted to resume full production on May 7th. Notwithstanding this maintenance work, annual Oil Sands Mining and Upgrading production guidance remains unchanged.
The Company's 2018 Oil Sands Mining and Upgrading annual production guidance is targeted to range from 415,000 bbl/d - 450,000 bbl/d of upgraded products.
Canadian Natural Resources Limited 10 Three Months Ended March 31, 2018
MARKETING
Three Months Ended
Mar 312018
Dec 312017
Mar 312017
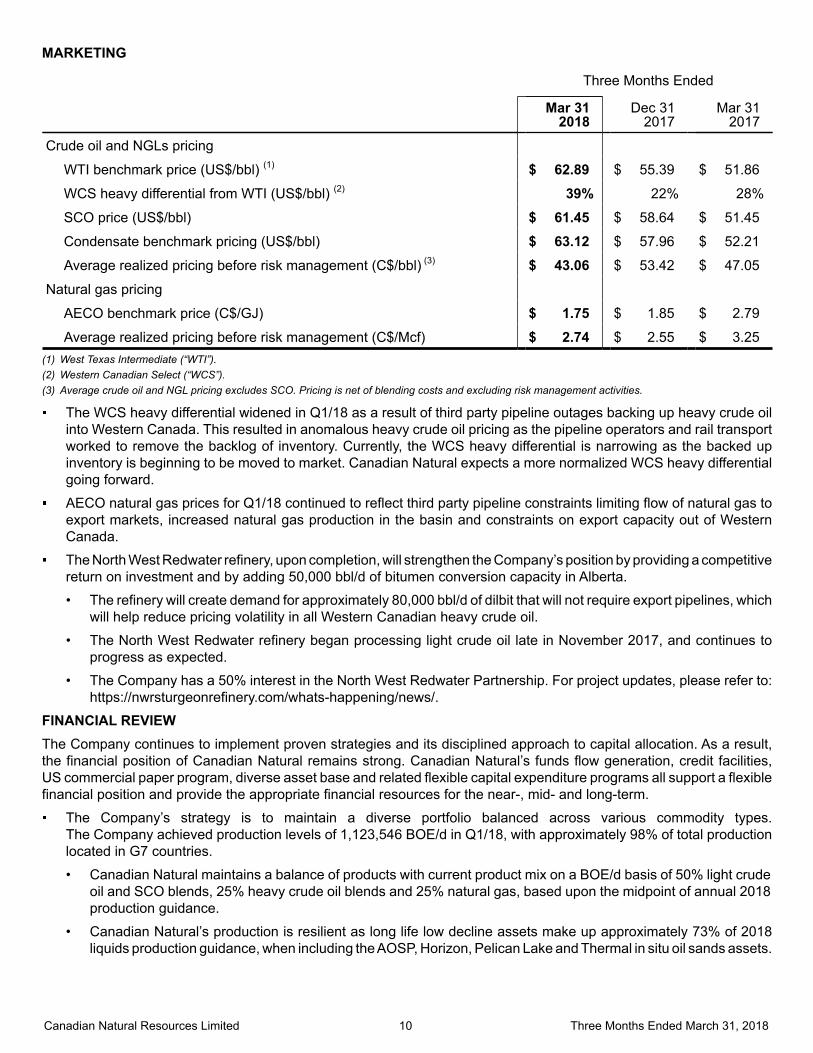
Crude oil and NGLs pricing
WTI benchmark price (US$/bbl) (1) $ 62.89 $ 55.39 $ 51.86
WCS heavy differential from WTI (US$/bbl) (2) 39% 22% 28%
SCO price (US$/bbl) $ 61.45 $ 58.64 $ 51.45
Condensate benchmark pricing (US$/bbl) $ 63.12 $ 57.96 $ 52.21
Average realized pricing before risk management (C$/bbl) (3) $ 43.06 $ 53.42 $ 47.05
Natural gas pricing
AECO benchmark price (C$/GJ) $ 1.75 $ 1.85 $ 2.79
Average realized pricing before risk management (C$/Mcf) $ 2.74 $ 2.55 $ 3.25(1) West Texas Intermediate (“WTI”).(2) Western Canadian Select (“WCS”).(3) Average crude oil and NGL pricing excludes SCO. Pricing is net of blending costs and excluding risk management activities.
The WCS heavy differential widened in Q1/18 as a result of third party pipeline outages backing up heavy crude oil into Western Canada. This resulted in anomalous heavy crude oil pricing as the pipeline operators and rail transport worked to remove the backlog of inventory. Currently, the WCS heavy differential is narrowing as the backed up inventory is beginning to be moved to market. Canadian Natural expects a more normalized WCS heavy differential going forward.
AECO natural gas prices for Q1/18 continued to reflect third party pipeline constraints limiting flow of natural gas to export markets, increased natural gas production in the basin and constraints on export capacity out of Western Canada.
The North West Redwater refinery, upon completion, will strengthen the Company’s position by providing a competitive return on investment and by adding 50,000 bbl/d of bitumen conversion capacity in Alberta.
• The refinery will create demand for approximately 80,000 bbl/d of dilbit that will not require export pipelines, which will help reduce pricing volatility in all Western Canadian heavy crude oil.
• The North West Redwater refinery began processing light crude oil late in November 2017, and continues to progress as expected.
• The Company has a 50% interest in the North West Redwater Partnership. For project updates, please refer to: https://nwrsturgeonrefinery.com/whats-happening/news/.
FINANCIAL REVIEW The Company continues to implement proven strategies and its disciplined approach to capital allocation. As a result, the financial position of Canadian Natural remains strong. Canadian Natural’s funds flow generation, credit facilities, US commercial paper program, diverse asset base and related flexible capital expenditure programs all support a flexible financial position and provide the appropriate financial resources for the near-, mid- and long-term.
The Company’s strategy is to maintain a diverse portfolio balanced across various commodity types. The Company achieved production levels of 1,123,546 BOE/d in Q1/18, with approximately 98% of total production located in G7 countries.
• Canadian Natural maintains a balance of products with current product mix on a BOE/d basis of 50% light crude oil and SCO blends, 25% heavy crude oil blends and 25% natural gas, based upon the midpoint of annual 2018 production guidance.
• Canadian Natural’s production is resilient as long life low decline assets make up approximately 73% of 2018 liquids production guidance, when including the AOSP, Horizon, Pelican Lake and Thermal in situ oil sands assets.
Canadian Natural Resources Limited 11 Three Months Ended March 31, 2018
• The Company generated significant free cash flow of approximately $1,220 million in Q1/18 after net capital expenditures. Including dividend commitments, approximately $880 million of free cash flow was realized in the quarter, which was largely used to reduce the Company's debt levels.
• Balance sheet strength continues to be a focus of the Company and strong financial performance was demonstrated in Q1/18 through the retirement of US$ denominated notes and early retirement of certain credit facilities as detailed in the Company's financial statements.
• Since the AOSP acquisition in Q2/17 Canadian Natural has decreased long term net debt and retired the deferred AOSP acquisition liability, totaling a reduction of approximately $1.9 billion.
• In Q1/18, the Company decreased long term net debt and retired the deferred AOSP acquisition liability, totaling a reduction of approximately $965 million from Q4/17.
• Canadian Natural maintains financial stability and liquidity represented by cash balances and committed bank credit facilities. At March 31, 2018 the Company had approximately $4.0 billion of available liquidity, including cash and cash equivalents.
• Debt to book capitalization improved to 40.5% from 41.4% in Q4/17 and debt to adjusted EBITDA strengthened to 2.5x, as at March 31, 2018.
In addition to its strong funds flow, capital flexibility and access to debt capital markets, Canadian Natural has additional financial levers at its disposal to effectively manage its liquidity. As at March 31, 2018, these financial levers include the Company’s third party equity investments of approximately $781 million.
Subsequent to March 31, 2018, under the Company's Normal Course Issuer Bid, Canadian Natural purchased and canceled 700,000 common shares at a weighted average price of $41.95 per common share.
Subsequent to quarter end, Canadian Natural declared a quarterly cash dividend on common shares of $0.335 per share payable on July 1, 2018.
OUTLOOKThe Company forecasts annual 2018 production levels to average between 815,000 and 885,000 bbl/d of crude oil and NGLs and between 1,650 and 1,710 MMcf/d of natural gas, before royalties. Q2/18 production guidance before royalties is forecast to average between 773,000 and 821,000 bbl/d of crude oil and NGLs and between 1,515 and 1,565 MMcf/d of natural gas. Detailed guidance on production levels, capital allocation and operating costs can be found on the Company’s website at www.cnrl.com.
Canadian Natural's annual 2018 capital expenditures are targeted to be approximately $4.3 billion.
Canadian Natural Resources Limited 12 Three Months Ended March 31, 2018
MANAGEMENT’S DISCUSSION AND ANALYSISForward-Looking StatementsCertain statements relating to Canadian Natural Resources Limited (the “Company”) in this document or documents incorporated herein by reference constitute forward-looking statements or information (collectively referred to herein as “forward-looking statements”) within the meaning of applicable securities legislation. Forward-looking statements can be identified by the words “believe”, “anticipate”, “expect”, “plan”, “estimate”, “target”, “continue”, “could”, “intend”, “may”, “potential”, “predict”, “should”, “will”, “objective”, “project”, “forecast”, “goal”, “guidance”, “outlook”, “effort”, “seeks”, “schedule”, “proposed” or expressions of a similar nature suggesting future outcome or statements regarding an outlook. Disclosure related to expected future commodity pricing, forecast or anticipated production volumes, royalties, production expenses, capital expenditures, income tax expenses and other guidance provided throughout this Management’s Discussion and Analysis (“MD&A”), constitute forward-looking statements. Disclosure of plans relating to and expected results of existing and future developments, including but not limited to the Horizon Oil Sands operations and future expansions, the Athabasca Oil Sands Project ("AOSP"), Primrose thermal projects, the Pelican Lake water and polymer flood project, the Kirby Thermal Oil Sands Project, the cost of construction and future operations of the North West Redwater bitumen upgrader and refinery, and construction by third parties of new or expansion of existing pipeline capacity or other means of transportation of bitumen, crude oil, natural gas or synthetic crude oil (“SCO”) that the Company may be reliant upon to transport its products to market also constitute forward-looking statements. This forward-looking information is based on annual budgets and multi-year forecasts, and is reviewed and revised throughout the year as necessary in the context of targeted financial ratios, project returns, product pricing expectations and balance in project risk and time horizons. These statements are not guarantees of future performance and are subject to certain risks. The reader should not place undue reliance on these forward-looking statements as there can be no assurances that the plans, initiatives or expectations upon which they are based will occur.In addition, statements relating to “reserves” are deemed to be forward-looking statements as they involve the implied assessment based on certain estimates and assumptions that the reserves described can be profitably produced in the future. There are numerous uncertainties inherent in estimating quantities of proved and proved plus probable crude oil, natural gas and natural gas liquids (“NGLs”) reserves and in projecting future rates of production and the timing of development expenditures. The total amount or timing of actual future production may vary significantly from reserve and production estimates.The forward-looking statements are based on current expectations, estimates and projections about the Company and the industry in which the Company operates, which speak only as of the date such statements were made or as of the date of the report or document in which they are contained, and are subject to known and unknown risks and uncertainties that could cause the actual results, performance or achievements of the Company to be materially different from any future results, performance or achievements expressed or implied by such forward-looking statements. Such risks and uncertainties include, among others: general economic and business conditions which will, among other things, impact demand for and market prices of the Company’s products; volatility of and assumptions regarding crude oil and natural gas prices; fluctuations in currency and interest rates; assumptions on which the Company’s current guidance is based; economic conditions in the countries and regions in which the Company conducts business; political uncertainty, including actions of or against terrorists, insurgent groups or other conflict including conflict between states; industry capacity; ability of the Company to implement its business strategy, including exploration and development activities; impact of competition; the Company’s defense of lawsuits; availability and cost of seismic, drilling and other equipment; ability of the Company and its subsidiaries to complete capital programs; the Company’s and its subsidiaries’ ability to secure adequate transportation for its products; unexpected disruptions or delays in the resumption of the mining, extracting or upgrading of the Company’s bitumen products; potential delays or changes in plans with respect to exploration or development projects or capital expenditures; ability of the Company to attract the necessary labour required to build its thermal and oil sands mining projects; operating hazards and other difficulties inherent in the exploration for and production and sale of crude oil and natural gas and in mining, extracting or upgrading the Company’s bitumen products; availability and cost of financing; the Company’s and its subsidiaries’ success of exploration and development activities and its ability to replace and expand crude oil and natural gas reserves; timing and success of integrating the business and operations of acquired companies and assets; production levels; imprecision of reserve estimates and estimates of recoverable quantities of crude oil, natural gas and NGLs not currently classified as proved; actions by governmental authorities; government regulations and the expenditures required to comply with them (especially safety and environmental laws and regulations and the impact of climate change initiatives on capital expenditures and production expenses); asset retirement obligations; the adequacy of the Company’s provision for taxes; and other circumstances affecting revenues and expenses.

Canadian Natural Resources Limited 13 Three Months Ended March 31, 2018
The Company’s operations have been, and in the future may be, affected by political developments and by national, federal, provincial and local laws and regulations such as restrictions on production, changes in taxes, royalties and other amounts payable to governments or governmental agencies, price or gathering rate controls and environmental protection regulations. Should one or more of these risks or uncertainties materialize, or should any of the Company’s assumptions prove incorrect, actual results may vary in material respects from those projected in the forward-looking statements. The impact of any one factor on a particular forward-looking statement is not determinable with certainty as such factors are dependent upon other factors, and the Company’s course of action would depend upon its assessment of the future considering all information then available. Readers are cautioned that the foregoing list of factors is not exhaustive. Unpredictable or unknown factors not discussed in this report could also have material adverse effects on forward-looking statements. Although the Company believes that the expectations conveyed by the forward-looking statements are reasonable based on information available to it on the date such forward-looking statements are made, no assurances can be given as to future results, levels of activity and achievements. All subsequent forward-looking statements, whether written or oral, attributable to the Company or persons acting on its behalf are expressly qualified in their entirety by these cautionary statements. Except as required by law, the Company assumes no obligation to update forward-looking statements, whether as a result of new information, future events or other factors, or the foregoing factors affecting this information, should circumstances or the Company's estimates or opinions change.Management’s Discussion and AnalysisThis MD&A of the financial condition and results of operations of the Company should be read in conjunction with the unaudited interim consolidated financial statements for the three months ended March 31, 2018 and the MD&A and the audited consolidated financial statements for the year ended December 31, 2017.All dollar amounts are referenced in millions of Canadian dollars, except where noted otherwise. The Company’s unaudited interim consolidated financial statements for the period ended March 31, 2018 and this MD&A have been prepared in accordance with International Financial Reporting Standards (“IFRS”) as issued by the International Accounting Standards Board. This MD&A includes references to financial measures commonly used in the crude oil and natural gas industry, such as adjusted net earnings from operations, funds flow from operations, adjusted cash production costs and adjusted depreciation, depletion and amortization. These financial measures are not defined by IFRS and therefore are referred to as non-GAAP measures. The non-GAAP measures used by the Company may not be comparable to similar measures presented by other companies. The Company uses these non-GAAP measures to evaluate its performance. The non-GAAP measures should not be considered an alternative to or more meaningful than net earnings and cash flows from operating activities, as determined in accordance with IFRS, as an indication of the Company's performance. The non-GAAP measures adjusted net earnings from operations and funds flow from operations are reconciled to net earnings, as determined in accordance with IFRS, in the “Financial Highlights” section of this MD&A. The non-GAAP measure funds flow from operations is also reconciled to cash flows from operating activities in this section. The derivation of adjusted cash production costs and adjusted depreciation, depletion and amortization are included in the “Operating Highlights – Oil Sands Mining and Upgrading” section of this MD&A. The Company also presents certain non-GAAP financial ratios and their derivation in the “Liquidity and Capital Resources” section of this MD&A.A Barrel of Oil Equivalent (“BOE”) is derived by converting six thousand cubic feet (“Mcf”) of natural gas to one barrel (“bbl”) of crude oil (6 Mcf:1 bbl). This conversion may be misleading, particularly if used in isolation, since the 6 Mcf:1 bbl ratio is based on an energy equivalency conversion method primarily applicable at the burner tip and does not represent a value equivalency at the wellhead. In comparing the value ratio using current crude oil prices relative to natural gas prices, the 6 Mcf:1 bbl conversion ratio may be misleading as an indication of value. In addition, for the purposes of this MD&A, crude oil is defined to include the following commodities: light and medium crude oil, primary heavy crude oil, Pelican Lake heavy crude oil, bitumen (thermal oil), and SCO.Production volumes and per unit statistics are presented throughout this MD&A on a “before royalty” or “gross” basis, and realized prices are net of blending costs and exclude the effect of risk management activities. Production on an “after royalty” or “net” basis is also presented for information purposes only. Results from operations for the three months ended March 31, 2017 presented in this MD&A exclude the impact of the acquisition of interests in AOSP on May 31, 2017.The following discussion and analysis refers primarily to the Company’s financial results for the three months endedMarch 31, 2018 in relation to the first quarter of 2017 and the fourth quarter of 2017. The accompanying tables form an integral part of this MD&A. Additional information relating to the Company, including its Annual Information Form for the year ended December 31, 2017, is available on SEDAR at www.sedar.com, and on EDGAR at www.sec.gov. This MD&A is dated May 2, 2018.
Canadian Natural Resources Limited 14 Three Months Ended March 31, 2018
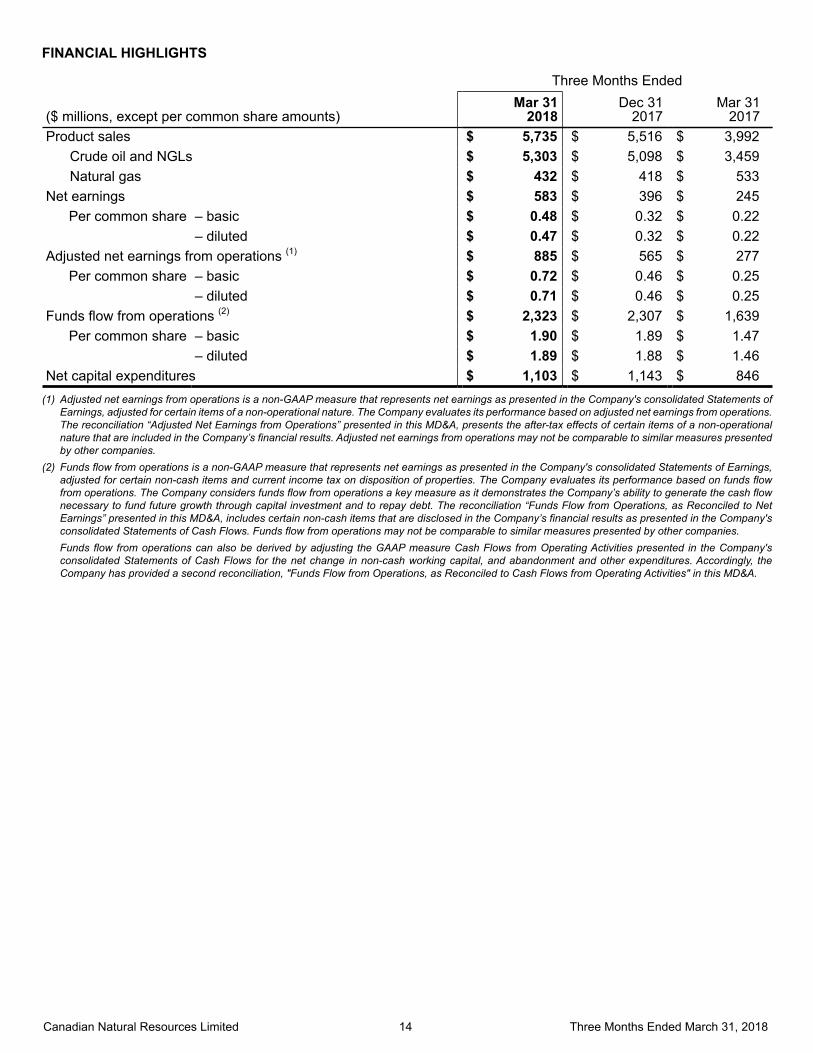
FINANCIAL HIGHLIGHTS
Three Months Ended
($ millions, except per common share amounts)Mar 31
2018Dec 31
2017Mar 31
2017Product sales $ 5,735 $ 5,516 $ 3,992
Crude oil and NGLs $ 5,303 $ 5,098 $ 3,459Natural gas $ 432 $ 418 $ 533
Net earnings $ 583 $ 396 $ 245Per common share – basic $ 0.48 $ 0.32 $ 0.22
– diluted $ 0.47 $ 0.32 $ 0.22Adjusted net earnings from operations (1) $ 885 $ 565 $ 277
Per common share – basic $ 0.72 $ 0.46 $ 0.25 – diluted $ 0.71 $ 0.46 $ 0.25Funds flow from operations (2) $ 2,323 $ 2,307 $ 1,639
Per common share – basic $ 1.90 $ 1.89 $ 1.47 – diluted $ 1.89 $ 1.88 $ 1.46Net capital expenditures $ 1,103 $ 1,143 $ 846
(1) Adjusted net earnings from operations is a non-GAAP measure that represents net earnings as presented in the Company's consolidated Statements of Earnings, adjusted for certain items of a non-operational nature. The Company evaluates its performance based on adjusted net earnings from operations. The reconciliation “Adjusted Net Earnings from Operations” presented in this MD&A, presents the after-tax effects of certain items of a non-operational nature that are included in the Company’s financial results. Adjusted net earnings from operations may not be comparable to similar measures presented by other companies.
(2) Funds flow from operations is a non-GAAP measure that represents net earnings as presented in the Company's consolidated Statements of Earnings, adjusted for certain non-cash items and current income tax on disposition of properties. The Company evaluates its performance based on funds flow from operations. The Company considers funds flow from operations a key measure as it demonstrates the Company’s ability to generate the cash flow necessary to fund future growth through capital investment and to repay debt. The reconciliation “Funds Flow from Operations, as Reconciled to Net Earnings” presented in this MD&A, includes certain non-cash items that are disclosed in the Company’s financial results as presented in the Company's consolidated Statements of Cash Flows. Funds flow from operations may not be comparable to similar measures presented by other companies.Funds flow from operations can also be derived by adjusting the GAAP measure Cash Flows from Operating Activities presented in the Company's consolidated Statements of Cash Flows for the net change in non-cash working capital, and abandonment and other expenditures. Accordingly, the Company has provided a second reconciliation, "Funds Flow from Operations, as Reconciled to Cash Flows from Operating Activities" in this MD&A.
Canadian Natural Resources Limited 15 Three Months Ended March 31, 2018
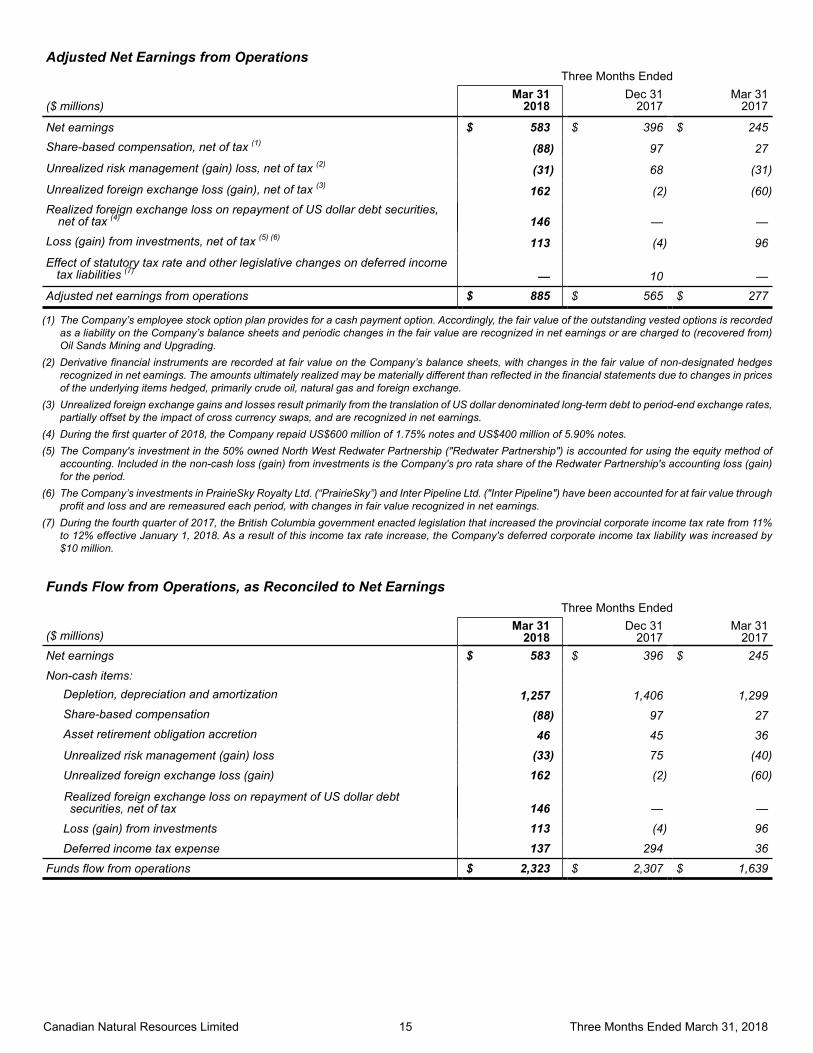
Adjusted Net Earnings from OperationsThree Months Ended
($ millions)Mar 31
2018Dec 31
2017Mar 31
2017
Net earnings $ 583 $ 396 $ 245Share-based compensation, net of tax (1) (88) 97 27Unrealized risk management (gain) loss, net of tax (2) (31) 68 (31)Unrealized foreign exchange loss (gain), net of tax (3) 162 (2) (60)Realized foreign exchange loss on repayment of US dollar debt securities,
net of tax (4) 146 — —Loss (gain) from investments, net of tax (5) (6) 113 (4) 96Effect of statutory tax rate and other legislative changes on deferred income
tax liabilities (7) — 10 —Adjusted net earnings from operations $ 885 $ 565 $ 277
(1) The Company’s employee stock option plan provides for a cash payment option. Accordingly, the fair value of the outstanding vested options is recorded as a liability on the Company’s balance sheets and periodic changes in the fair value are recognized in net earnings or are charged to (recovered from) Oil Sands Mining and Upgrading.
(2) Derivative financial instruments are recorded at fair value on the Company’s balance sheets, with changes in the fair value of non-designated hedges recognized in net earnings. The amounts ultimately realized may be materially different than reflected in the financial statements due to changes in prices of the underlying items hedged, primarily crude oil, natural gas and foreign exchange.
(3) Unrealized foreign exchange gains and losses result primarily from the translation of US dollar denominated long-term debt to period-end exchange rates, partially offset by the impact of cross currency swaps, and are recognized in net earnings.
(4) During the first quarter of 2018, the Company repaid US$600 million of 1.75% notes and US$400 million of 5.90% notes.(5) The Company's investment in the 50% owned North West Redwater Partnership ("Redwater Partnership") is accounted for using the equity method of
accounting. Included in the non-cash loss (gain) from investments is the Company's pro rata share of the Redwater Partnership's accounting loss (gain) for the period.
(6) The Company’s investments in PrairieSky Royalty Ltd. (“PrairieSky”) and Inter Pipeline Ltd. ("Inter Pipeline") have been accounted for at fair value through profit and loss and are remeasured each period, with changes in fair value recognized in net earnings.
(7) During the fourth quarter of 2017, the British Columbia government enacted legislation that increased the provincial corporate income tax rate from 11% to 12% effective January 1, 2018. As a result of this income tax rate increase, the Company's deferred corporate income tax liability was increased by $10 million.
Funds Flow from Operations, as Reconciled to Net EarningsThree Months Ended
($ millions)Mar 31
2018Dec 31
2017Mar 31
2017Net earnings $ 583 $ 396 $ 245
Non-cash items: Depletion, depreciation and amortization 1,257 1,406 1,299Share-based compensation (88) 97 27Asset retirement obligation accretion 46 45 36
Unrealized risk management (gain) loss (33) 75 (40)
Unrealized foreign exchange loss (gain) 162 (2) (60)
Realized foreign exchange loss on repayment of US dollar debtsecurities, net of tax 146 — —
Loss (gain) from investments 113 (4) 96
Deferred income tax expense 137 294 36
Funds flow from operations $ 2,323 $ 2,307 $ 1,639

Canadian Natural Resources Limited 16 Three Months Ended March 31, 2018
Funds Flow from Operations, as Reconciled to Cash Flows from Operating ActivitiesThree Months Ended
($ millions)Mar 31
2018Dec 31
2017Mar 31
2017Cash flows from operating activities $ 2,469 $ 1,438 $ 1,671
Net change in non-cash working capital (235) 709 (51)Abandonment expenditures 90 63 41Other (1) 97 (22)
Funds flow from operations $ 2,323 $ 2,307 $ 1,639
SUMMARY OF CONSOLIDATED NET EARNINGS AND FUNDS FLOW FROM OPERATIONS
Net earnings for the first quarter of 2018 were $583 million compared with net earnings of $245 million for the first quarter of 2017 and net earnings of $396 million for the fourth quarter of 2017. Net earnings for the first quarter of 2018 included net after-tax expenses of $302 million compared with net after-tax expenses of $32 million for the first quarter of 2017 and net after-tax expenses of $169 million for the fourth quarter of 2017 related to the effects of share-based compensation, risk management activities, fluctuations in foreign exchange rates including the impact of realized foreign exchange losses on repayments of long-term debt, loss (gain) from investments and the impact of statutory tax rate and other legislative changes on deferred income tax liabilities. Excluding these items, adjusted net earnings from operations for the first quarter of 2018 were $885 million compared with adjusted net earnings of $277 million for the first quarter of 2017 and adjusted net earnings of $565 million for the fourth quarter of 2017.
The increase in adjusted net earnings for the first quarter of 2018 from the first quarter of 2017 was primarily due to: higher SCO sales volumes in the Oil Sands Mining and Upgrading segment associated with both the acquisition of
AOSP and new Phase 3 volumes at Horizon; and higher realized SCO prices in the Oil Sands Mining and Upgrading segment;
partially offset by: lower crude oil and NGLs and natural gas netbacks in the Exploration and Production segments; higher interest and other financing expense; lower crude oil and NGLs sales volumes in the Exploration and Production segments; and the strengthening of the Canadian dollar relative to the US dollar.
The increase in adjusted net earnings for the first quarter of 2018 from the fourth quarter of 2017 was primarily due to: higher SCO sales volumes in the Oil Sands Mining and Upgrading segment associated with new Phase 3 volumes
at Horizon; and lower depletion, depreciation and amortization;
partially offset by: lower crude oil and NGLs netbacks in the Exploration and Production segments; lower crude oil and NGLs sales volumes in the Exploration and Production segments; and lower realized risk management gains.
The impacts of share-based compensation, risk management activities and fluctuations in foreign exchange rates are expected to continue to contribute to significant volatility in consolidated net earnings and are discussed in detail in the relevant sections of this MD&A.
Funds flow from operations for the first quarter of 2018 was $2,323 million compared with $1,639 million for the first quarter of 2017 and $2,307 million for the fourth quarter of 2017. The fluctuations in funds flow from operations from the comparable periods were primarily due to the factors noted above relating to the fluctuations in adjusted net earnings, as well as due to the impact of fluctuations in cash taxes.
Total production before royalties for the first quarter of 2018 increased 28% to 1,123,546 BOE/d from 876,907 BOE/d for the first quarter of 2017 and increased 10% from 1,020,094 BOE/d for the fourth quarter of 2017.
Canadian Natural Resources Limited 17 Three Months Ended March 31, 2018
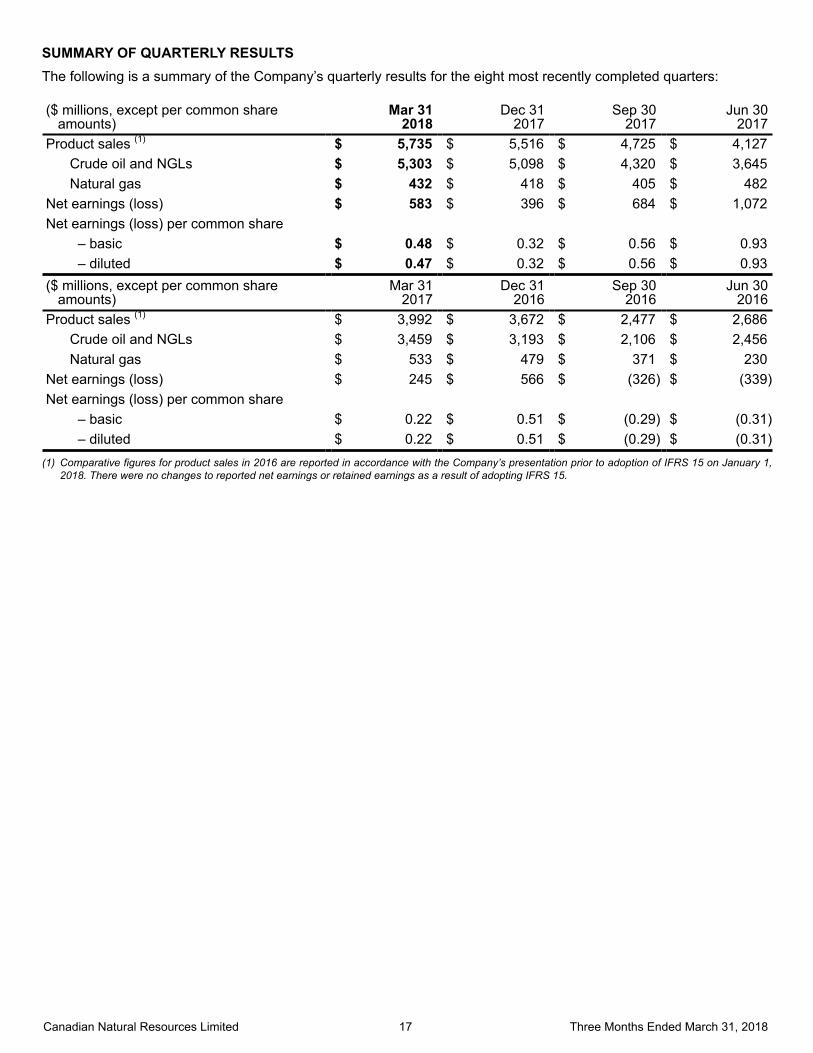
SUMMARY OF QUARTERLY RESULTSThe following is a summary of the Company’s quarterly results for the eight most recently completed quarters:
($ millions, except per common shareamounts)
Mar 312018
Dec 312017
Sep 302017
Jun 302017
Product sales (1) $ 5,735 $ 5,516 $ 4,725 $ 4,127Crude oil and NGLs $ 5,303 $ 5,098 $ 4,320 $ 3,645Natural gas $ 432 $ 418 $ 405 $ 482
Net earnings (loss) $ 583 $ 396 $ 684 $ 1,072Net earnings (loss) per common share
– basic $ 0.48 $ 0.32 $ 0.56 $ 0.93– diluted $ 0.47 $ 0.32 $ 0.56 $ 0.93
($ millions, except per common shareamounts)
Mar 312017
Dec 312016
Sep 302016
Jun 302016
Product sales (1) $ 3,992 $ 3,672 $ 2,477 $ 2,686Crude oil and NGLs $ 3,459 $ 3,193 $ 2,106 $ 2,456Natural gas $ 533 $ 479 $ 371 $ 230
Net earnings (loss) $ 245 $ 566 $ (326) $ (339)Net earnings (loss) per common share
– basic $ 0.22 $ 0.51 $ (0.29) $ (0.31)– diluted $ 0.22 $ 0.51 $ (0.29) $ (0.31)
(1) Comparative figures for product sales in 2016 are reported in accordance with the Company’s presentation prior to adoption of IFRS 15 on January 1, 2018. There were no changes to reported net earnings or retained earnings as a result of adopting IFRS 15.
Canadian Natural Resources Limited 18 Three Months Ended March 31, 2018
Volatility in the quarterly net earnings over the eight most recently completed quarters was primarily due to: Crude oil pricing – Fluctuating global supply/demand including crude oil production levels from the Organization of
the Petroleum Exporting Countries (“OPEC”) and its impact on world supply, the impact of geopolitical uncertainties on worldwide benchmark pricing, the impact of shale oil production in North America, the impact of the Western Canadian Select ("WCS") Heavy Differential from the West Texas Intermediate reference location at Cushing, Oklahoma ("WTI") in North America and the impact of the differential between WTI and Dated Brent ("Brent") benchmark pricing in the North Sea and Offshore Africa.
Natural gas pricing – The impact of fluctuations in both the demand for natural gas and inventory storage levels, third party pipeline maintenance and the impact of shale gas production in the US.
Crude oil and NGLs sales volumes – Fluctuations in production due to the cyclic nature of the Company’s Primrosethermal projects, production from Kirby South, the results from the Pelican Lake water and polymer flood projects, fluctuations in the Company’s drilling program in North America, the impact and timing of acquisitions, including the acquisition of AOSP and other assets, new production from Horizon Phase 2B and Phase 3, the impact of turnarounds and pitstops in the Oil Sands Mining and Upgrading segment, shut-in production due to low commodity prices, and the impact of the drilling program in Côte d’Ivoire in Offshore Africa. Sales volumes also reflected fluctuations due to timing of liftings and maintenance activities in the International segments.
Natural gas sales volumes – Fluctuations in production due to the Company’s allocation of capital to higher return crude oil projects, natural decline rates, fluctuating capacity at a third party processing facility, shut-in production due to third party pipeline restrictions and related pricing impacts, shut-in production due to low commodity prices, and the impact and timing of acquisitions.
Production expense – Fluctuations primarily due to the impact of the demand and cost for services, fluctuations in product mix and production, the impact of seasonal costs that are dependent on weather, cost optimizations across all segments, the impact and timing of acquisitions, including the acquisition of AOSP and other assets, turnarounds and pitstops in the Oil Sands Mining and Upgrading segment, and maintenance activities in the International segments.
Depletion, depreciation and amortization – Fluctuations due to changes in sales volumes including the impact and timing of acquisitions and dispositions, proved reserves, asset retirement obligations, finding and development costs associated with crude oil and natural gas exploration, estimated future costs to develop the Company’s proved undeveloped reserves, fluctuations in International sales volumes subject to higher depletion rates, fluctuations in depletion, depreciation and amortization expense in the North Sea due to the cessation of production at the Ninian North platform in the second quarter of 2017, and the impact of turnarounds at Horizon.
Share-based compensation – Fluctuations due to the determination of fair market value based on the Black-Scholes valuation model of the Company’s share-based compensation liability.
Risk management – Fluctuations due to the recognition of gains and losses from the mark - to - market and subsequent settlement of the Company’s risk management activities.
Foreign exchange rates – Fluctuations in the Canadian dollar relative to the US dollar, which impacted the realized price the Company received for its crude oil and natural gas sales, as sales prices are based predominantly on US dollar denominated benchmarks. Fluctuations in realized and unrealized foreign exchange gains and losses were also recorded with respect to US dollar denominated debt, partially offset by the impact of cross currency swap hedges.
Income tax expense – Fluctuations in income tax expense include statutory tax rate and other legislative changes substantively enacted in the various periods.
Gains on acquisition, disposition and revaluation of properties and gains/losses on investments – Fluctuations due to the recognition of gains on the acquisition of AOSP and other assets, the disposition and revaluation of properties in the various periods, fair value changes in the investments in PrairieSky and Inter Pipeline shares, and the equity (gain) loss in Redwater Partnership.
Canadian Natural Resources Limited 19 Three Months Ended March 31, 2018
BUSINESS ENVIRONMENT
Three Months Ended
(Average for the period)Mar 31
2018Dec 31
2017Mar 31
2017WTI benchmark price (US$/bbl) $ 62.89 $ 55.39 $ 51.86Dated Brent benchmark price (US$/bbl) $ 66.99 $ 61.46 $ 54.05WCS heavy differential from WTI (US$/bbl) $ 24.27 $ 12.28 $ 14.58SCO price (US$/bbl) $ 61.45 $ 58.64 $ 51.45Condensate benchmark price (US$/bbl) $ 63.12 $ 57.96 $ 52.21NYMEX benchmark price (US$/MMBtu) $ 2.98 $ 2.94 $ 3.31AECO benchmark price (C$/GJ) $ 1.75 $ 1.85 $ 2.79US/Canadian dollar average exchange rate (US$) $ 0.7905 $ 0.7865 $ 0.7554
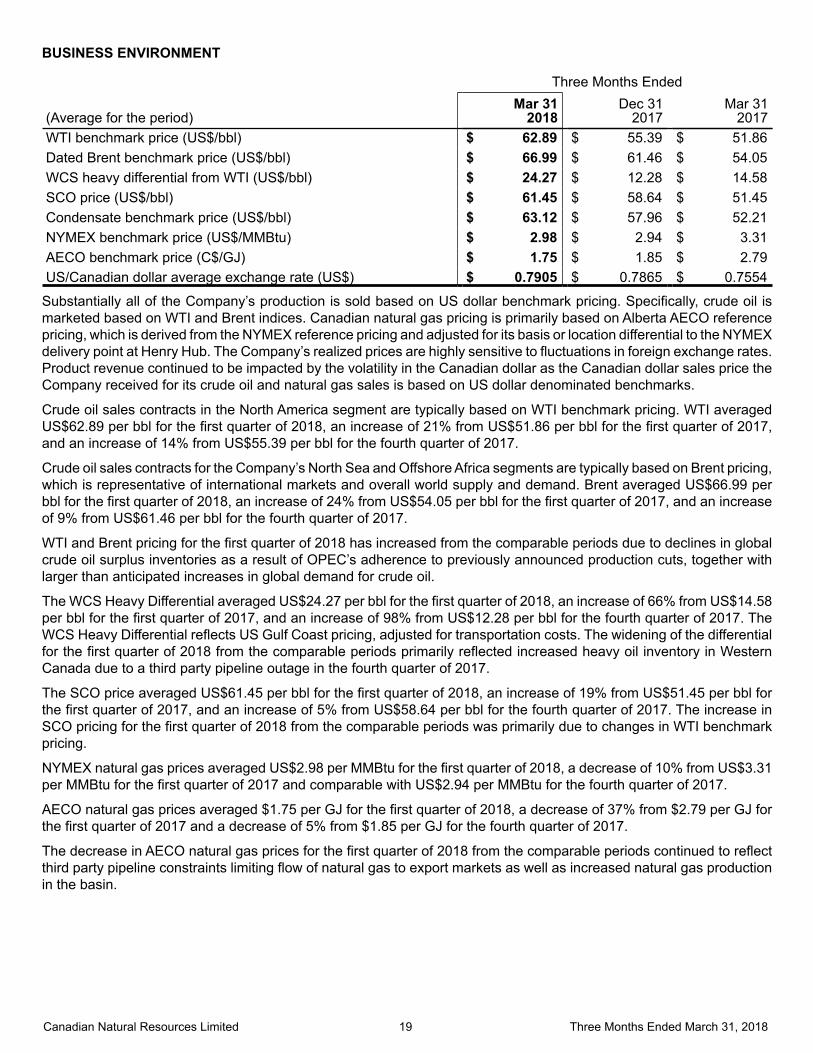
Substantially all of the Company’s production is sold based on US dollar benchmark pricing. Specifically, crude oil is marketed based on WTI and Brent indices. Canadian natural gas pricing is primarily based on Alberta AECO reference pricing, which is derived from the NYMEX reference pricing and adjusted for its basis or location differential to the NYMEX delivery point at Henry Hub. The Company’s realized prices are highly sensitive to fluctuations in foreign exchange rates. Product revenue continued to be impacted by the volatility in the Canadian dollar as the Canadian dollar sales price the Company received for its crude oil and natural gas sales is based on US dollar denominated benchmarks.
Crude oil sales contracts in the North America segment are typically based on WTI benchmark pricing. WTI averaged US$62.89 per bbl for the first quarter of 2018, an increase of 21% from US$51.86 per bbl for the first quarter of 2017, and an increase of 14% from US$55.39 per bbl for the fourth quarter of 2017.
Crude oil sales contracts for the Company’s North Sea and Offshore Africa segments are typically based on Brent pricing, which is representative of international markets and overall world supply and demand. Brent averaged US$66.99 per bbl for the first quarter of 2018, an increase of 24% from US$54.05 per bbl for the first quarter of 2017, and an increase of 9% from US$61.46 per bbl for the fourth quarter of 2017.
WTI and Brent pricing for the first quarter of 2018 has increased from the comparable periods due to declines in global crude oil surplus inventories as a result of OPEC’s adherence to previously announced production cuts, together with larger than anticipated increases in global demand for crude oil.
The WCS Heavy Differential averaged US$24.27 per bbl for the first quarter of 2018, an increase of 66% from US$14.58per bbl for the first quarter of 2017, and an increase of 98% from US$12.28 per bbl for the fourth quarter of 2017. The WCS Heavy Differential reflects US Gulf Coast pricing, adjusted for transportation costs. The widening of the differential for the first quarter of 2018 from the comparable periods primarily reflected increased heavy oil inventory in Western Canada due to a third party pipeline outage in the fourth quarter of 2017.
The SCO price averaged US$61.45 per bbl for the first quarter of 2018, an increase of 19% from US$51.45 per bbl for the first quarter of 2017, and an increase of 5% from US$58.64 per bbl for the fourth quarter of 2017. The increase in SCO pricing for the first quarter of 2018 from the comparable periods was primarily due to changes in WTI benchmark pricing.
NYMEX natural gas prices averaged US$2.98 per MMBtu for the first quarter of 2018, a decrease of 10% from US$3.31per MMBtu for the first quarter of 2017 and comparable with US$2.94 per MMBtu for the fourth quarter of 2017.
AECO natural gas prices averaged $1.75 per GJ for the first quarter of 2018, a decrease of 37% from $2.79 per GJ for the first quarter of 2017 and a decrease of 5% from $1.85 per GJ for the fourth quarter of 2017.
The decrease in AECO natural gas prices for the first quarter of 2018 from the comparable periods continued to reflect third party pipeline constraints limiting flow of natural gas to export markets as well as increased natural gas production in the basin.
Canadian Natural Resources Limited 20 Three Months Ended March 31, 2018
DAILY PRODUCTION, before royalties
Three Months Ended
Mar 31
2018Dec 31
2017Mar 31
2017Crude oil and NGLs (bbl/d)
North America – Exploration and Production 357,460 383,537 359,964North America – Oil Sands Mining and Upgrading (1) 456,076 321,496 192,491North Sea 21,584 19,548 23,042Offshore Africa 19,438 19,519 22,616 854,558 744,100 598,113Natural gas (MMcf/d)
North America 1,547 1,596 1,613North Sea 37 37 37Offshore Africa 30 23 23 1,614 1,656 1,673Total barrels of oil equivalent (BOE/d) 1,123,546 1,020,094 876,907Product mix
Light and medium crude oil and NGLs 12% 13% 15%Pelican Lake heavy crude oil 6% 6% 5%Primary heavy crude oil 8% 10% 11%Bitumen (thermal oil) 10% 12% 15%Synthetic crude oil (1) 40% 32% 22%Natural gas 24% 27% 32%Percentage of gross revenue (1) (2)
(excluding Midstream revenue)
Crude oil and NGLs 92% 92% 86%Natural gas 8% 8% 14%
(1) First quarter 2018 SCO production before royalties excludes 3,224 bbl/d of SCO consumed internally as diesel (fourth quarter 2017 – 1,730 bbl/d; first quarter 2017 – 428 bbl/d).
(2) Net of blending costs and excluding risk management activities.
Canadian Natural Resources Limited 21 Three Months Ended March 31, 2018
DAILY PRODUCTION, net of royalties
Three Months Ended
Mar 31
2018Dec 31
2017Mar 31
2017Crude oil and NGLs (bbl/d)
North America – Exploration and Production 310,783 333,698 313,070North America – Oil Sands Mining and Upgrading 443,606 309,777 189,182
North Sea 21,521 19,518 23,001Offshore Africa 18,652 17,885 21,702 794,562 680,878 546,955Natural gas (MMcf/d)
North America 1,473 1,538 1,503North Sea 37 37 37Offshore Africa 27 20 21 1,537 1,595 1,561Total barrels of oil equivalent (BOE/d) 1,050,702 946,731 807,045
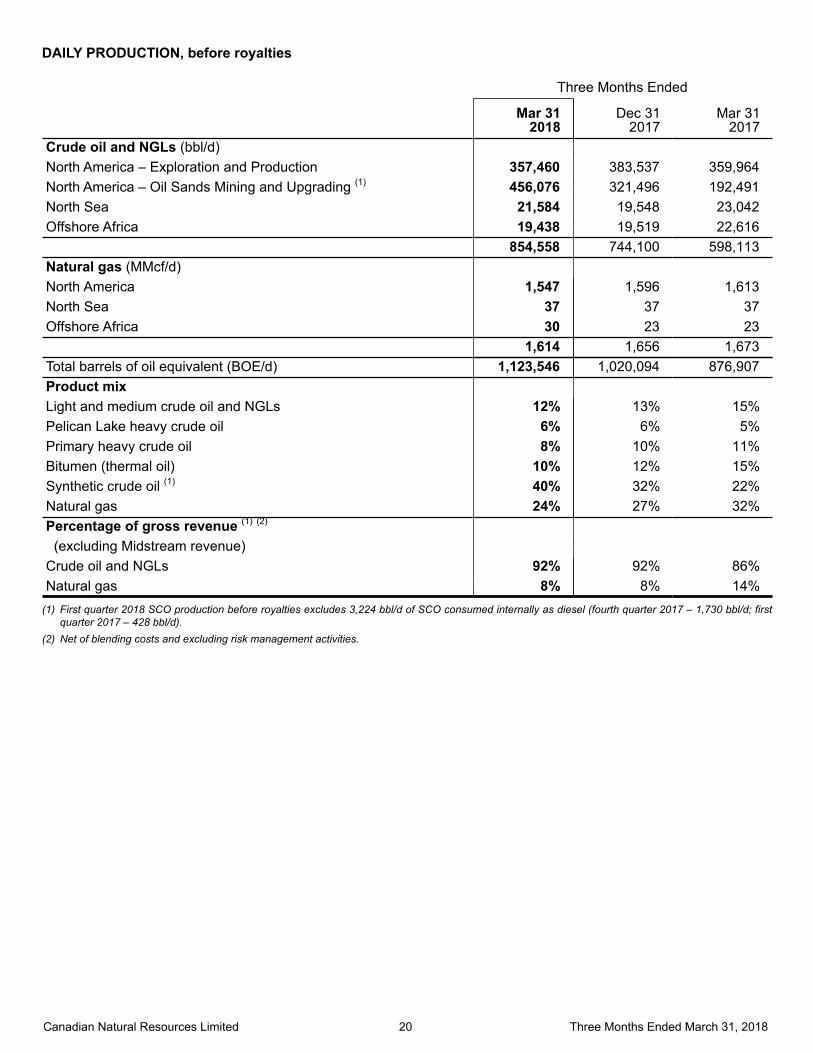
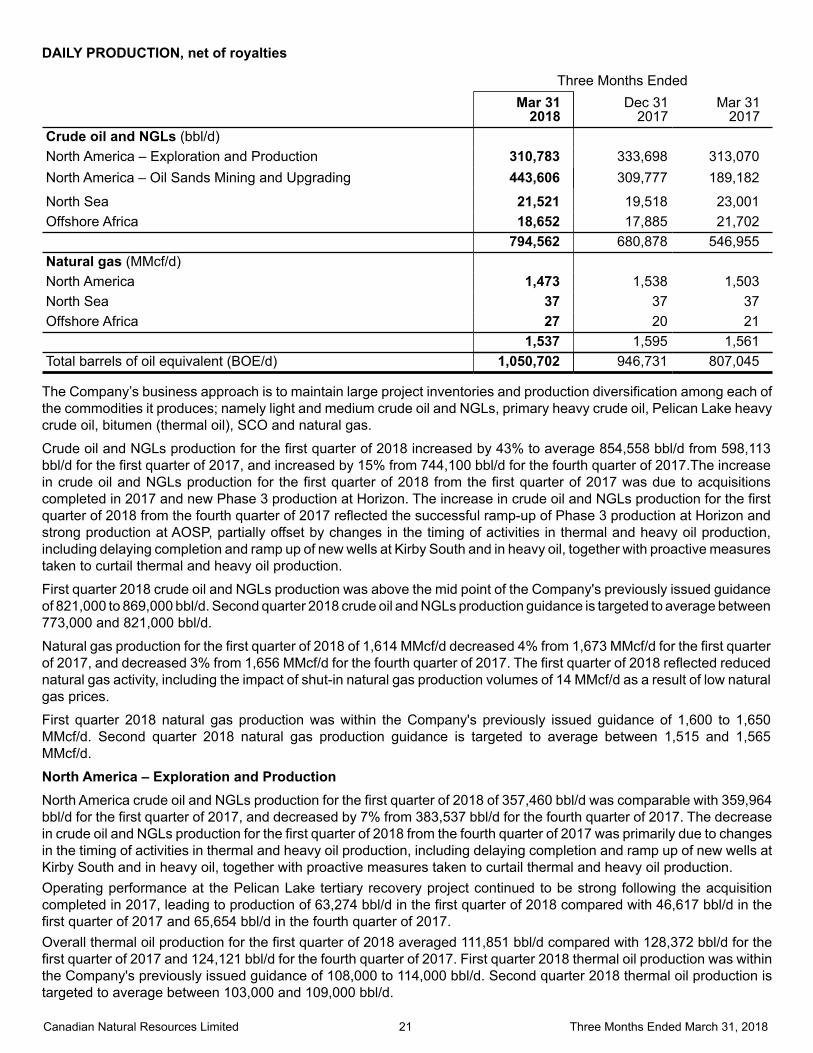
The Company’s business approach is to maintain large project inventories and production diversification among each of the commodities it produces; namely light and medium crude oil and NGLs, primary heavy crude oil, Pelican Lake heavy crude oil, bitumen (thermal oil), SCO and natural gas.
Crude oil and NGLs production for the first quarter of 2018 increased by 43% to average 854,558 bbl/d from 598,113 bbl/d for the first quarter of 2017, and increased by 15% from 744,100 bbl/d for the fourth quarter of 2017.The increase in crude oil and NGLs production for the first quarter of 2018 from the first quarter of 2017 was due to acquisitions completed in 2017 and new Phase 3 production at Horizon. The increase in crude oil and NGLs production for the first quarter of 2018 from the fourth quarter of 2017 reflected the successful ramp-up of Phase 3 production at Horizon and strong production at AOSP, partially offset by changes in the timing of activities in thermal and heavy oil production, including delaying completion and ramp up of new wells at Kirby South and in heavy oil, together with proactive measures taken to curtail thermal and heavy oil production.
First quarter 2018 crude oil and NGLs production was above the mid point of the Company's previously issued guidance of 821,000 to 869,000 bbl/d. Second quarter 2018 crude oil and NGLs production guidance is targeted to average between 773,000 and 821,000 bbl/d.
Natural gas production for the first quarter of 2018 of 1,614 MMcf/d decreased 4% from 1,673 MMcf/d for the first quarter of 2017, and decreased 3% from 1,656 MMcf/d for the fourth quarter of 2017. The first quarter of 2018 reflected reduced natural gas activity, including the impact of shut-in natural gas production volumes of 14 MMcf/d as a result of low natural gas prices.
First quarter 2018 natural gas production was within the Company's previously issued guidance of 1,600 to 1,650 MMcf/d. Second quarter 2018 natural gas production guidance is targeted to average between 1,515 and 1,565 MMcf/d.
North America – Exploration and ProductionNorth America crude oil and NGLs production for the first quarter of 2018 of 357,460 bbl/d was comparable with 359,964bbl/d for the first quarter of 2017, and decreased by 7% from 383,537 bbl/d for the fourth quarter of 2017. The decreasein crude oil and NGLs production for the first quarter of 2018 from the fourth quarter of 2017 was primarily due to changes in the timing of activities in thermal and heavy oil production, including delaying completion and ramp up of new wells at Kirby South and in heavy oil, together with proactive measures taken to curtail thermal and heavy oil production. Operating performance at the Pelican Lake tertiary recovery project continued to be strong following the acquisition completed in 2017, leading to production of 63,274 bbl/d in the first quarter of 2018 compared with 46,617 bbl/d in the first quarter of 2017 and 65,654 bbl/d in the fourth quarter of 2017. Overall thermal oil production for the first quarter of 2018 averaged 111,851 bbl/d compared with 128,372 bbl/d for the first quarter of 2017 and 124,121 bbl/d for the fourth quarter of 2017. First quarter 2018 thermal oil production was within the Company's previously issued guidance of 108,000 to 114,000 bbl/d. Second quarter 2018 thermal oil production is targeted to average between 103,000 and 109,000 bbl/d.
Canadian Natural Resources Limited 22 Three Months Ended March 31, 2018
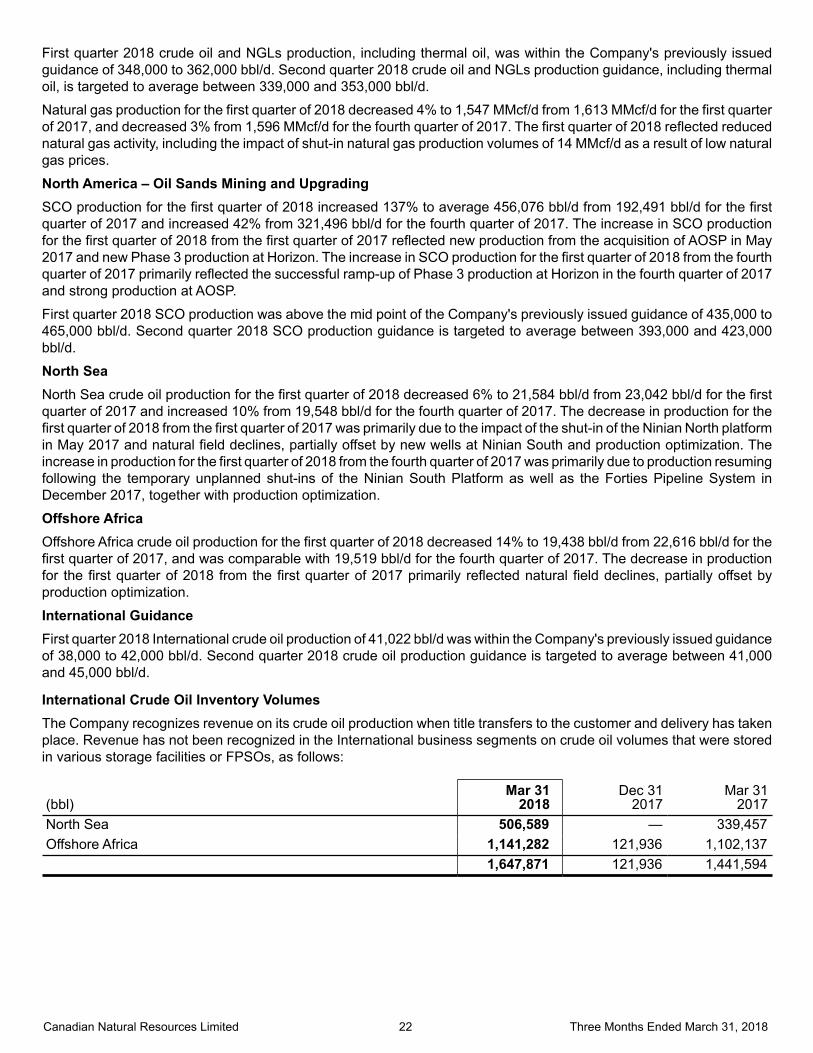
First quarter 2018 crude oil and NGLs production, including thermal oil, was within the Company's previously issued guidance of 348,000 to 362,000 bbl/d. Second quarter 2018 crude oil and NGLs production guidance, including thermal oil, is targeted to average between 339,000 and 353,000 bbl/d.
Natural gas production for the first quarter of 2018 decreased 4% to 1,547 MMcf/d from 1,613 MMcf/d for the first quarterof 2017, and decreased 3% from 1,596 MMcf/d for the fourth quarter of 2017. The first quarter of 2018 reflected reduced natural gas activity, including the impact of shut-in natural gas production volumes of 14 MMcf/d as a result of low natural gas prices.
North America – Oil Sands Mining and UpgradingSCO production for the first quarter of 2018 increased 137% to average 456,076 bbl/d from 192,491 bbl/d for the first quarter of 2017 and increased 42% from 321,496 bbl/d for the fourth quarter of 2017. The increase in SCO production for the first quarter of 2018 from the first quarter of 2017 reflected new production from the acquisition of AOSP in May 2017 and new Phase 3 production at Horizon. The increase in SCO production for the first quarter of 2018 from the fourth quarter of 2017 primarily reflected the successful ramp-up of Phase 3 production at Horizon in the fourth quarter of 2017and strong production at AOSP.
First quarter 2018 SCO production was above the mid point of the Company's previously issued guidance of 435,000 to 465,000 bbl/d. Second quarter 2018 SCO production guidance is targeted to average between 393,000 and 423,000bbl/d.
North SeaNorth Sea crude oil production for the first quarter of 2018 decreased 6% to 21,584 bbl/d from 23,042 bbl/d for the first quarter of 2017 and increased 10% from 19,548 bbl/d for the fourth quarter of 2017. The decrease in production for the first quarter of 2018 from the first quarter of 2017 was primarily due to the impact of the shut-in of the Ninian North platform in May 2017 and natural field declines, partially offset by new wells at Ninian South and production optimization. The increase in production for the first quarter of 2018 from the fourth quarter of 2017 was primarily due to production resuming following the temporary unplanned shut-ins of the Ninian South Platform as well as the Forties Pipeline System in December 2017, together with production optimization.
Offshore AfricaOffshore Africa crude oil production for the first quarter of 2018 decreased 14% to 19,438 bbl/d from 22,616 bbl/d for the first quarter of 2017, and was comparable with 19,519 bbl/d for the fourth quarter of 2017. The decrease in production for the first quarter of 2018 from the first quarter of 2017 primarily reflected natural field declines, partially offset by production optimization.
International GuidanceFirst quarter 2018 International crude oil production of 41,022 bbl/d was within the Company's previously issued guidance of 38,000 to 42,000 bbl/d. Second quarter 2018 crude oil production guidance is targeted to average between 41,000 and 45,000 bbl/d.
International Crude Oil Inventory VolumesThe Company recognizes revenue on its crude oil production when title transfers to the customer and delivery has taken place. Revenue has not been recognized in the International business segments on crude oil volumes that were stored in various storage facilities or FPSOs, as follows:
(bbl)Mar 31
2018Dec 31
2017Mar 31
2017North Sea 506,589 — 339,457Offshore Africa 1,141,282 121,936 1,102,137 1,647,871 121,936 1,441,594
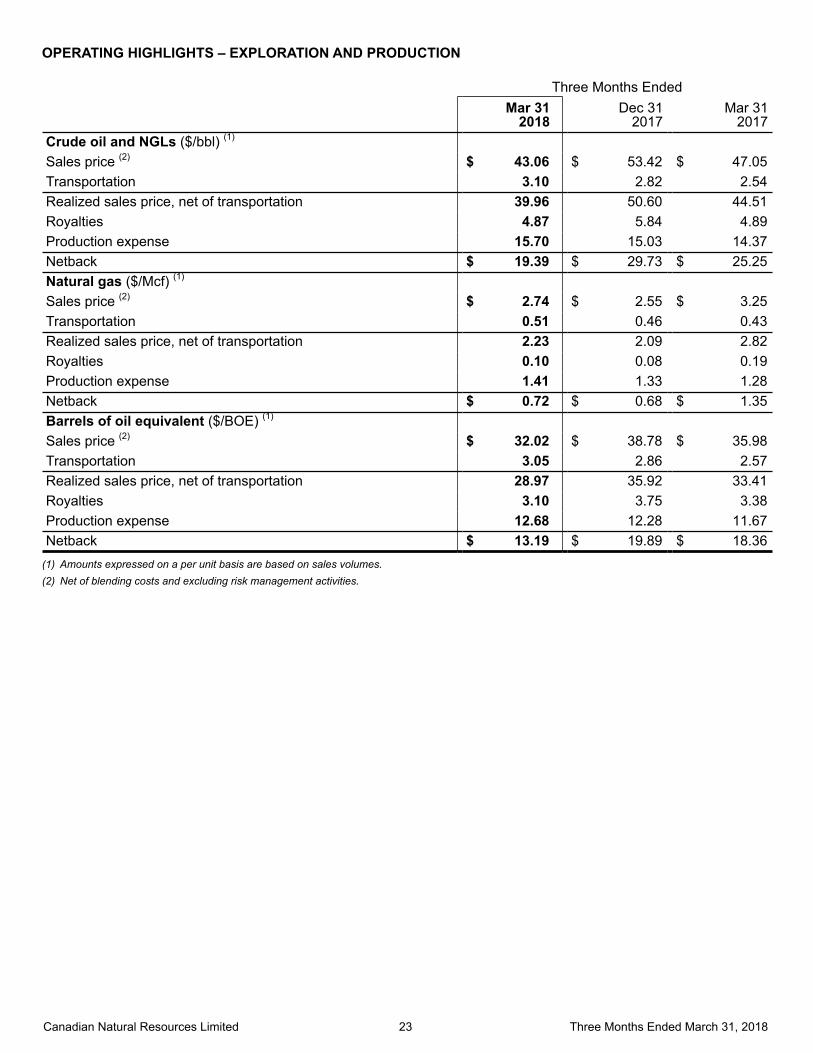
Canadian Natural Resources Limited 23 Three Months Ended March 31, 2018
OPERATING HIGHLIGHTS – EXPLORATION AND PRODUCTION
Three Months Ended
Mar 31
2018Dec 31
2017Mar 31
2017Crude oil and NGLs ($/bbl) (1)
Sales price (2) $ 43.06 $ 53.42 $ 47.05Transportation 3.10 2.82 2.54Realized sales price, net of transportation 39.96 50.60 44.51Royalties 4.87 5.84 4.89Production expense 15.70 15.03 14.37Netback $ 19.39 $ 29.73 $ 25.25Natural gas ($/Mcf) (1)
Sales price (2) $ 2.74 $ 2.55 $ 3.25Transportation 0.51 0.46 0.43Realized sales price, net of transportation 2.23 2.09 2.82Royalties 0.10 0.08 0.19Production expense 1.41 1.33 1.28Netback $ 0.72 $ 0.68 $ 1.35Barrels of oil equivalent ($/BOE) (1)
Sales price (2) $ 32.02 $ 38.78 $ 35.98Transportation 3.05 2.86 2.57Realized sales price, net of transportation 28.97 35.92 33.41Royalties 3.10 3.75 3.38Production expense 12.68 12.28 11.67Netback $ 13.19 $ 19.89 $ 18.36
(1) Amounts expressed on a per unit basis are based on sales volumes.(2) Net of blending costs and excluding risk management activities.
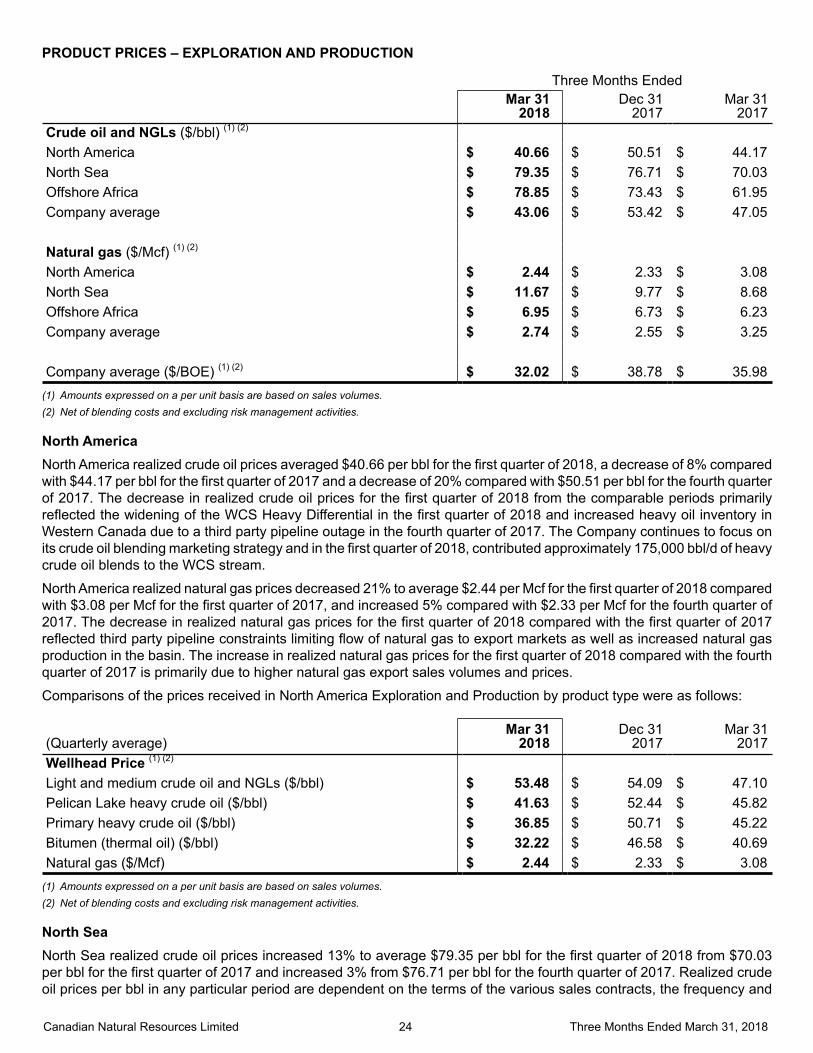
Canadian Natural Resources Limited 24 Three Months Ended March 31, 2018
PRODUCT PRICES – EXPLORATION AND PRODUCTION
Three Months Ended
Mar 31
2018Dec 31
2017Mar 31
2017Crude oil and NGLs ($/bbl) (1) (2) North America $ 40.66 $ 50.51 $ 44.17North Sea $ 79.35 $ 76.71 $ 70.03Offshore Africa $ 78.85 $ 73.43 $ 61.95Company average $ 43.06 $ 53.42 $ 47.05
Natural gas ($/Mcf) (1) (2) North America $ 2.44 $ 2.33 $ 3.08North Sea $ 11.67 $ 9.77 $ 8.68Offshore Africa $ 6.95 $ 6.73 $ 6.23Company average $ 2.74 $ 2.55 $ 3.25
Company average ($/BOE) (1) (2) $ 32.02 $ 38.78 $ 35.98(1) Amounts expressed on a per unit basis are based on sales volumes.(2) Net of blending costs and excluding risk management activities.
North AmericaNorth America realized crude oil prices averaged $40.66 per bbl for the first quarter of 2018, a decrease of 8% compared with $44.17 per bbl for the first quarter of 2017 and a decrease of 20% compared with $50.51 per bbl for the fourth quarter of 2017. The decrease in realized crude oil prices for the first quarter of 2018 from the comparable periods primarily reflected the widening of the WCS Heavy Differential in the first quarter of 2018 and increased heavy oil inventory in Western Canada due to a third party pipeline outage in the fourth quarter of 2017. The Company continues to focus on its crude oil blending marketing strategy and in the first quarter of 2018, contributed approximately 175,000 bbl/d of heavy crude oil blends to the WCS stream.
North America realized natural gas prices decreased 21% to average $2.44 per Mcf for the first quarter of 2018 compared with $3.08 per Mcf for the first quarter of 2017, and increased 5% compared with $2.33 per Mcf for the fourth quarter of 2017. The decrease in realized natural gas prices for the first quarter of 2018 compared with the first quarter of 2017reflected third party pipeline constraints limiting flow of natural gas to export markets as well as increased natural gas production in the basin. The increase in realized natural gas prices for the first quarter of 2018 compared with the fourthquarter of 2017 is primarily due to higher natural gas export sales volumes and prices.
Comparisons of the prices received in North America Exploration and Production by product type were as follows:
(Quarterly average)Mar 31
2018Dec 31
2017Mar 31
2017Wellhead Price (1) (2) Light and medium crude oil and NGLs ($/bbl) $ 53.48 $ 54.09 $ 47.10Pelican Lake heavy crude oil ($/bbl) $ 41.63 $ 52.44 $ 45.82Primary heavy crude oil ($/bbl) $ 36.85 $ 50.71 $ 45.22Bitumen (thermal oil) ($/bbl) $ 32.22 $ 46.58 $ 40.69Natural gas ($/Mcf) $ 2.44 $ 2.33 $ 3.08
(1) Amounts expressed on a per unit basis are based on sales volumes.(2) Net of blending costs and excluding risk management activities.
North SeaNorth Sea realized crude oil prices increased 13% to average $79.35 per bbl for the first quarter of 2018 from $70.03per bbl for the first quarter of 2017 and increased 3% from $76.71 per bbl for the fourth quarter of 2017. Realized crude oil prices per bbl in any particular period are dependent on the terms of the various sales contracts, the frequency and
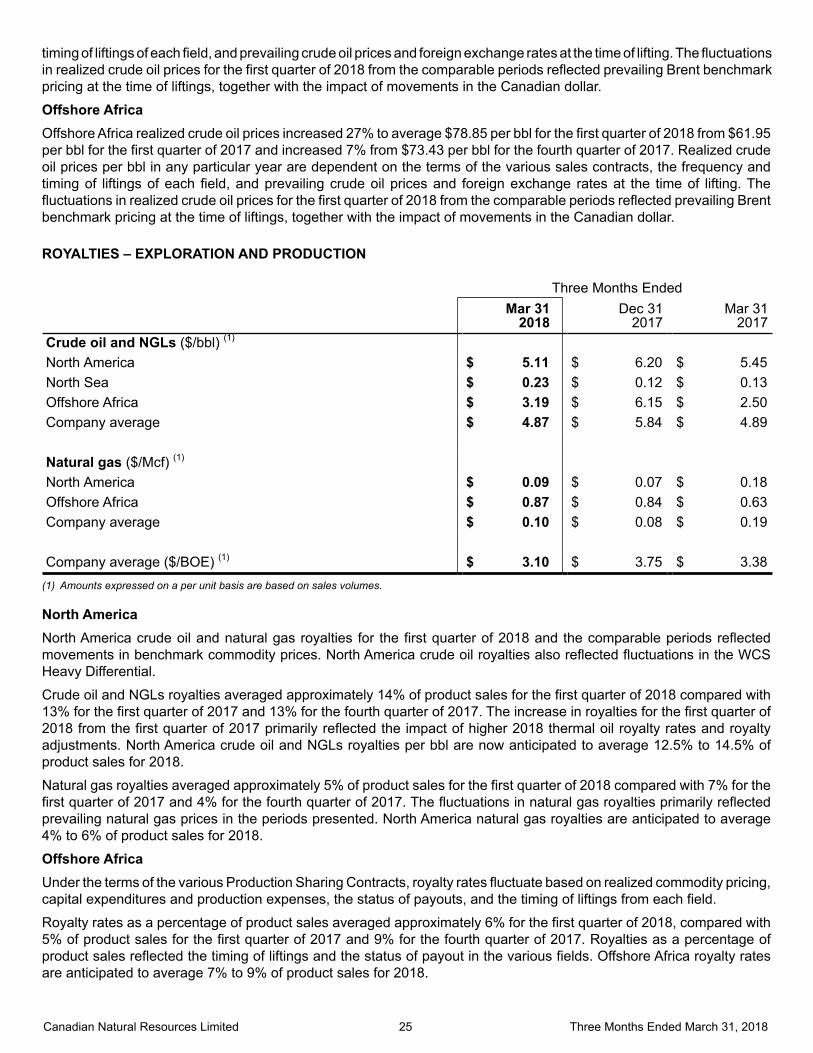
Canadian Natural Resources Limited 25 Three Months Ended March 31, 2018
timing of liftings of each field, and prevailing crude oil prices and foreign exchange rates at the time of lifting. The fluctuations in realized crude oil prices for the first quarter of 2018 from the comparable periods reflected prevailing Brent benchmark pricing at the time of liftings, together with the impact of movements in the Canadian dollar.
Offshore AfricaOffshore Africa realized crude oil prices increased 27% to average $78.85 per bbl for the first quarter of 2018 from $61.95 per bbl for the first quarter of 2017 and increased 7% from $73.43 per bbl for the fourth quarter of 2017. Realized crude oil prices per bbl in any particular year are dependent on the terms of the various sales contracts, the frequency and timing of liftings of each field, and prevailing crude oil prices and foreign exchange rates at the time of lifting. The fluctuations in realized crude oil prices for the first quarter of 2018 from the comparable periods reflected prevailing Brent benchmark pricing at the time of liftings, together with the impact of movements in the Canadian dollar.
ROYALTIES – EXPLORATION AND PRODUCTION
Three Months Ended
Mar 31
2018Dec 31
2017Mar 31
2017Crude oil and NGLs ($/bbl) (1)
North America $ 5.11 $ 6.20 $ 5.45North Sea $ 0.23 $ 0.12 $ 0.13Offshore Africa $ 3.19 $ 6.15 $ 2.50Company average $ 4.87 $ 5.84 $ 4.89
Natural gas ($/Mcf) (1)
North America $ 0.09 $ 0.07 $ 0.18Offshore Africa $ 0.87 $ 0.84 $ 0.63Company average $ 0.10 $ 0.08 $ 0.19
Company average ($/BOE) (1) $ 3.10 $ 3.75 $ 3.38(1) Amounts expressed on a per unit basis are based on sales volumes.
North AmericaNorth America crude oil and natural gas royalties for the first quarter of 2018 and the comparable periods reflected movements in benchmark commodity prices. North America crude oil royalties also reflected fluctuations in the WCS Heavy Differential.
Crude oil and NGLs royalties averaged approximately 14% of product sales for the first quarter of 2018 compared with 13% for the first quarter of 2017 and 13% for the fourth quarter of 2017. The increase in royalties for the first quarter of 2018 from the first quarter of 2017 primarily reflected the impact of higher 2018 thermal oil royalty rates and royalty adjustments. North America crude oil and NGLs royalties per bbl are now anticipated to average 12.5% to 14.5% of product sales for 2018.
Natural gas royalties averaged approximately 5% of product sales for the first quarter of 2018 compared with 7% for the first quarter of 2017 and 4% for the fourth quarter of 2017. The fluctuations in natural gas royalties primarily reflected prevailing natural gas prices in the periods presented. North America natural gas royalties are anticipated to average 4% to 6% of product sales for 2018.
Offshore AfricaUnder the terms of the various Production Sharing Contracts, royalty rates fluctuate based on realized commodity pricing, capital expenditures and production expenses, the status of payouts, and the timing of liftings from each field.
Royalty rates as a percentage of product sales averaged approximately 6% for the first quarter of 2018, compared with 5% of product sales for the first quarter of 2017 and 9% for the fourth quarter of 2017. Royalties as a percentage of product sales reflected the timing of liftings and the status of payout in the various fields. Offshore Africa royalty rates are anticipated to average 7% to 9% of product sales for 2018.

Canadian Natural Resources Limited 26 Three Months Ended March 31, 2018
PRODUCTION EXPENSE – EXPLORATION AND PRODUCTION
Three Months Ended
Mar 31
2018Dec 31
2017Mar 31
2017Crude oil and NGLs ($/bbl) (1)
North America $ 14.15 $ 12.84 $ 12.22North Sea $ 43.39 $ 44.37 $ 36.86Offshore Africa $ 30.99 $ 17.96 $ 18.54Company average $ 15.70 $ 15.03 $ 14.37
Natural gas ($/Mcf) (1)
North America $ 1.31 $ 1.26 $ 1.20North Sea $ 4.67 $ 3.98 $ 3.07Offshore Africa $ 2.44 $ 2.26 $ 3.50Company average $ 1.41 $ 1.33 $ 1.28
Company average ($/BOE) (1) $ 12.68 $ 12.28 $ 11.67(1) Amounts expressed on a per unit basis are based on sales volumes.
North AmericaNorth America crude oil and NGLs production expense for the first quarter of 2018 of $14.15 per bbl increased 16% from $12.22 per bbl for the first quarter of 2017 and increased 10% from $12.84 per bbl for the fourth quarter of 2017. The increase in production expense per barrel for the first quarter of 2018 from the comparable periods was primarily due to increased energy and carbon tax costs along with the impact of proactive measures taken to curtail thermal and heavy oil production volumes relative to mainly fixed expenses. The Company continues to focus on cost control and achieving efficiencies on acquired assets and across the entire asset base. North America crude oil and NGLs production expense is anticipated to average $11.50 to $13.50 per bbl for 2018.
North America natural gas production expense for the first quarter of 2018 of $1.31 per Mcf increased 9% from $1.20per Mcf for the first quarter of 2017 and increased 4% from $1.26 per Mcf for the fourth quarter of 2017. The increase in production expense for the first quarter of 2018 from the comparable periods primarily reflected proactive measures taken to curtail natural gas production volumes and address processing reliability issues, together with the impact of seasonal conditions in the first quarter of 2018. The Company continues to focus on cost control and achieving efficiencies on acquired assets and across the entire asset base. North America natural gas production expense is anticipated to average $1.00 to $1.20 per Mcf for 2018.
North SeaNorth Sea crude oil production expense for the first quarter of 2018 increased 18% to $43.39 per bbl from $36.86 per bbl for the first quarter of 2017 and was comparable with $44.37 per bbl in the fourth quarter of 2017. The increase in production expense for the first quarter of 2018 from the first quarter of 2017 primarily reflected the strengthening of the UK pound sterling compared to the Canadian dollar. The decrease in production expense for the first quarter of 2018 from the fourth quarter of 2017 reflected the impact of temporary unplanned shut-ins in December 2017. North Sea crude oil production expense is anticipated to average $36.00 to $39.00 per bbl for 2018.
Offshore AfricaCrude oil production expense for the Baobab and Espoir fields in Côte d'Ivoire was $10.14 per bbl, while total crude oil production expense for the Offshore Africa segment, including the Olowi field in Gabon, was $30.99 per bbl. Total Offshore Africa crude oil production expense for the first quarter of 2018 from the comparable periods primarily reflected the timing of liftings from various fields, including the Olowi field, which have different cost structures, fluctuating production volumes on a relatively fixed cost base and fluctuations in the Canadian dollar.
On a standalone basis, Offshore Africa production expense related to Côte d'Ivoire is anticipated to average $11.00 to $13.00 per bbl for 2018.

Canadian Natural Resources Limited 27 Three Months Ended March 31, 2018
DEPLETION, DEPRECIATION AND AMORTIZATION – EXPLORATION AND PRODUCTION
Three Months Ended
($ millions, except per BOE amounts)Mar 31
2018Dec 31
2017Mar 31
2017Expense $ 850 $ 939 $ 1,102
$/BOE (1) $ 14.66 $ 14.46 $ 17.68(1) Amounts expressed on a per unit basis are based on sales volumes.
Depletion, depreciation and amortization expense per BOE for the first quarter of 2018 decreased 17% to $14.66 per BOE from $17.68 per BOE for the first quarter of 2017 and was comparable with $14.46 per BOE for the fourth quarter of 2017. The decrease in depletion, depreciation and amortization expense per BOE for the first quarter of 2018 from the first quarter of 2017 was due to additional depletion, depreciation and amortization expense in the first quarter of 2017 related to the abandonment of the Ninian North platform in the North Sea.
ASSET RETIREMENT OBLIGATION ACCRETION – EXPLORATION AND PRODUCTION
Three Months Ended
($ millions, except per BOE amounts)Mar 31
2018Dec 31
2017Mar 31
2017Expense $ 31 $ 30 $ 28
$/BOE (1) $ 0.53 $ 0.45 $ 0.45(1) Amounts expressed on a per unit basis are based on sales volumes.
Asset retirement obligation accretion expense represents the increase in the carrying amount of the asset retirement obligation due to the passage of time.
Asset retirement obligation accretion expense for the first quarter of 2018 of $0.53 per BOE increased 18% from $0.45 per BOE for the first quarter of 2017 and the fourth quarter of 2017. The increase in asset retirement obligation accretion expense per BOE for the first quarter of 2018 from the comparable periods primarily reflected lower sales volumes during the first quarter of 2018.
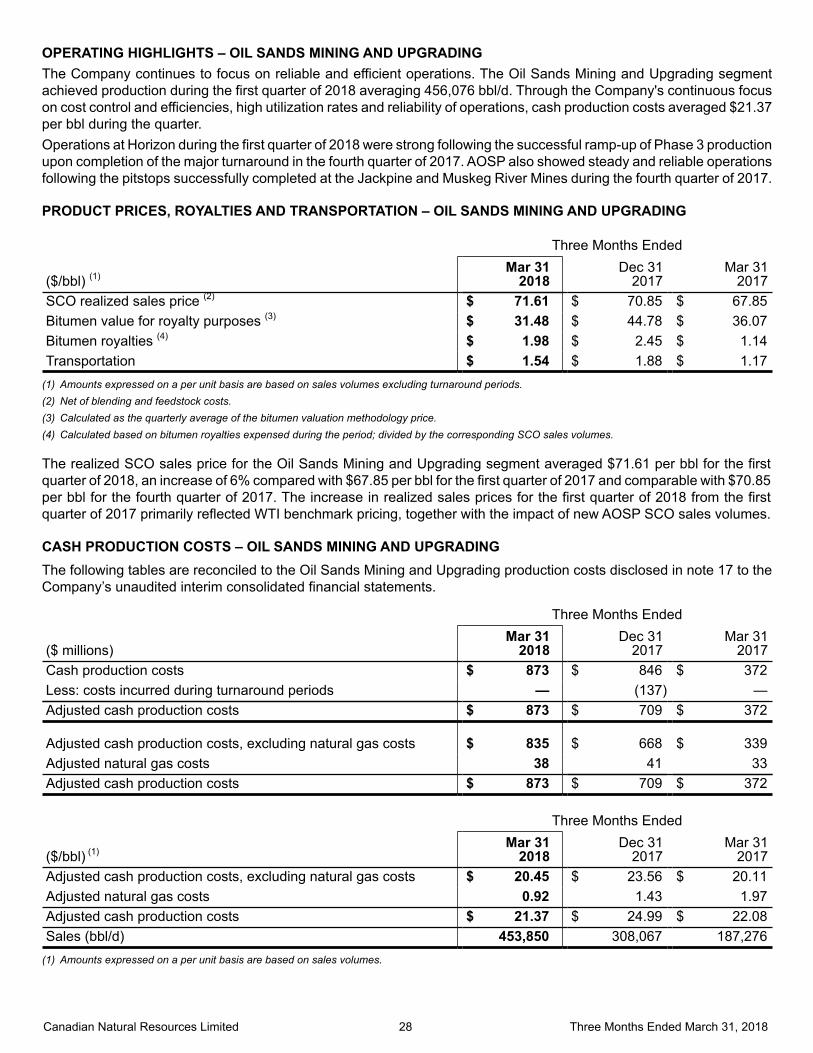
Canadian Natural Resources Limited 28 Three Months Ended March 31, 2018
OPERATING HIGHLIGHTS – OIL SANDS MINING AND UPGRADING The Company continues to focus on reliable and efficient operations. The Oil Sands Mining and Upgrading segment achieved production during the first quarter of 2018 averaging 456,076 bbl/d. Through the Company's continuous focus on cost control and efficiencies, high utilization rates and reliability of operations, cash production costs averaged $21.37per bbl during the quarter. Operations at Horizon during the first quarter of 2018 were strong following the successful ramp-up of Phase 3 production upon completion of the major turnaround in the fourth quarter of 2017. AOSP also showed steady and reliable operations following the pitstops successfully completed at the Jackpine and Muskeg River Mines during the fourth quarter of 2017.
PRODUCT PRICES, ROYALTIES AND TRANSPORTATION – OIL SANDS MINING AND UPGRADING
Three Months Ended
($/bbl) (1)Mar 31
2018Dec 31
2017Mar 31
2017SCO realized sales price (2) $ 71.61 $ 70.85 $ 67.85Bitumen value for royalty purposes (3) $ 31.48 $ 44.78 $ 36.07Bitumen royalties (4) $ 1.98 $ 2.45 $ 1.14Transportation $ 1.54 $ 1.88 $ 1.17
(1) Amounts expressed on a per unit basis are based on sales volumes excluding turnaround periods.(2) Net of blending and feedstock costs.(3) Calculated as the quarterly average of the bitumen valuation methodology price.(4) Calculated based on bitumen royalties expensed during the period; divided by the corresponding SCO sales volumes.
The realized SCO sales price for the Oil Sands Mining and Upgrading segment averaged $71.61 per bbl for the first quarter of 2018, an increase of 6% compared with $67.85 per bbl for the first quarter of 2017 and comparable with $70.85 per bbl for the fourth quarter of 2017. The increase in realized sales prices for the first quarter of 2018 from the first quarter of 2017 primarily reflected WTI benchmark pricing, together with the impact of new AOSP SCO sales volumes.
CASH PRODUCTION COSTS – OIL SANDS MINING AND UPGRADINGThe following tables are reconciled to the Oil Sands Mining and Upgrading production costs disclosed in note 17 to the Company’s unaudited interim consolidated financial statements.
Three Months Ended
($ millions)Mar 31
2018Dec 31
2017Mar 31
2017Cash production costs $ 873 $ 846 $ 372Less: costs incurred during turnaround periods — (137) —Adjusted cash production costs $ 873 $ 709 $ 372
Adjusted cash production costs, excluding natural gas costs $ 835 $ 668 $ 339Adjusted natural gas costs 38 41 33Adjusted cash production costs $ 873 $ 709 $ 372
Three Months Ended
($/bbl) (1)Mar 31
2018Dec 31
2017Mar 31
2017Adjusted cash production costs, excluding natural gas costs $ 20.45 $ 23.56 $ 20.11Adjusted natural gas costs 0.92 1.43 1.97Adjusted cash production costs $ 21.37 $ 24.99 $ 22.08Sales (bbl/d) 453,850 308,067 187,276
(1) Amounts expressed on a per unit basis are based on sales volumes.
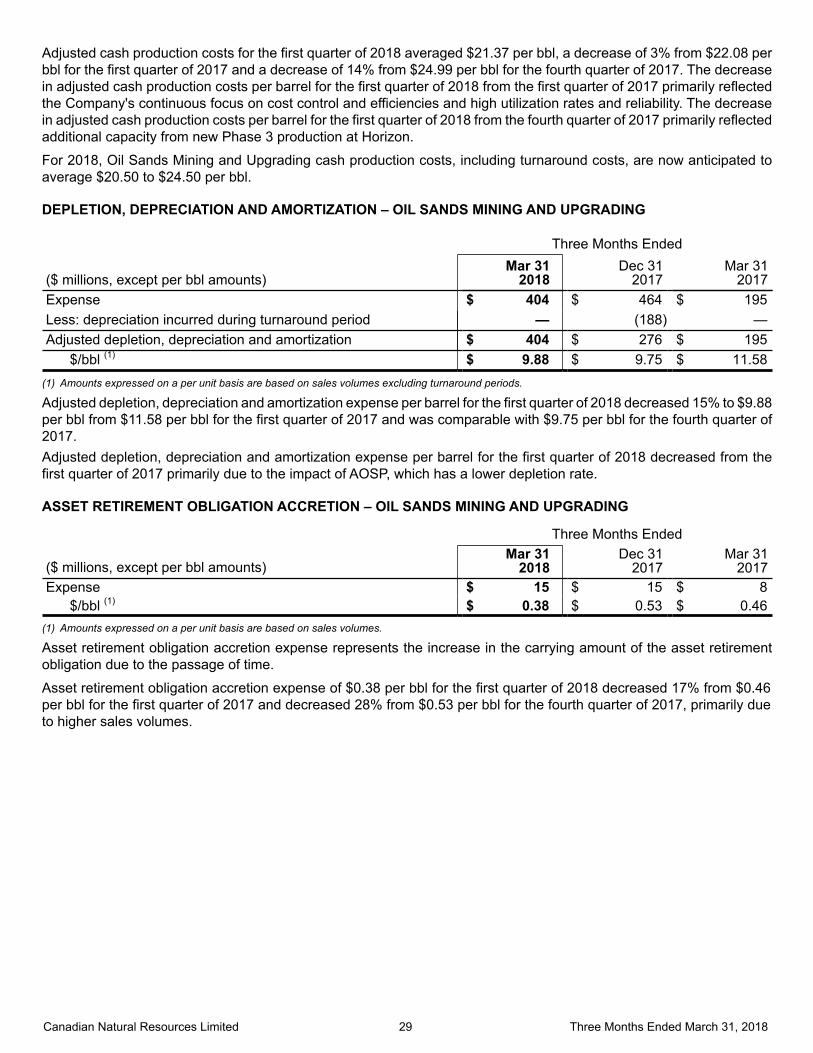
Canadian Natural Resources Limited 29 Three Months Ended March 31, 2018
Adjusted cash production costs for the first quarter of 2018 averaged $21.37 per bbl, a decrease of 3% from $22.08 per bbl for the first quarter of 2017 and a decrease of 14% from $24.99 per bbl for the fourth quarter of 2017. The decreasein adjusted cash production costs per barrel for the first quarter of 2018 from the first quarter of 2017 primarily reflected the Company's continuous focus on cost control and efficiencies and high utilization rates and reliability. The decrease in adjusted cash production costs per barrel for the first quarter of 2018 from the fourth quarter of 2017 primarily reflected additional capacity from new Phase 3 production at Horizon.
For 2018, Oil Sands Mining and Upgrading cash production costs, including turnaround costs, are now anticipated to average $20.50 to $24.50 per bbl.
DEPLETION, DEPRECIATION AND AMORTIZATION – OIL SANDS MINING AND UPGRADING
Three Months Ended
($ millions, except per bbl amounts)Mar 31
2018Dec 31
2017Mar 31
2017Expense $ 404 $ 464 $ 195Less: depreciation incurred during turnaround period — (188) —Adjusted depletion, depreciation and amortization $ 404 $ 276 $ 195
$/bbl (1) $ 9.88 $ 9.75 $ 11.58(1) Amounts expressed on a per unit basis are based on sales volumes excluding turnaround periods.
Adjusted depletion, depreciation and amortization expense per barrel for the first quarter of 2018 decreased 15% to $9.88per bbl from $11.58 per bbl for the first quarter of 2017 and was comparable with $9.75 per bbl for the fourth quarter of 2017.Adjusted depletion, depreciation and amortization expense per barrel for the first quarter of 2018 decreased from the first quarter of 2017 primarily due to the impact of AOSP, which has a lower depletion rate.
ASSET RETIREMENT OBLIGATION ACCRETION – OIL SANDS MINING AND UPGRADING
Three Months Ended
($ millions, except per bbl amounts)Mar 31
2018Dec 31
2017Mar 31
2017Expense $ 15 $ 15 $ 8
$/bbl (1) $ 0.38 $ 0.53 $ 0.46(1) Amounts expressed on a per unit basis are based on sales volumes.
Asset retirement obligation accretion expense represents the increase in the carrying amount of the asset retirement obligation due to the passage of time.
Asset retirement obligation accretion expense of $0.38 per bbl for the first quarter of 2018 decreased 17% from $0.46 per bbl for the first quarter of 2017 and decreased 28% from $0.53 per bbl for the fourth quarter of 2017, primarily due to higher sales volumes.
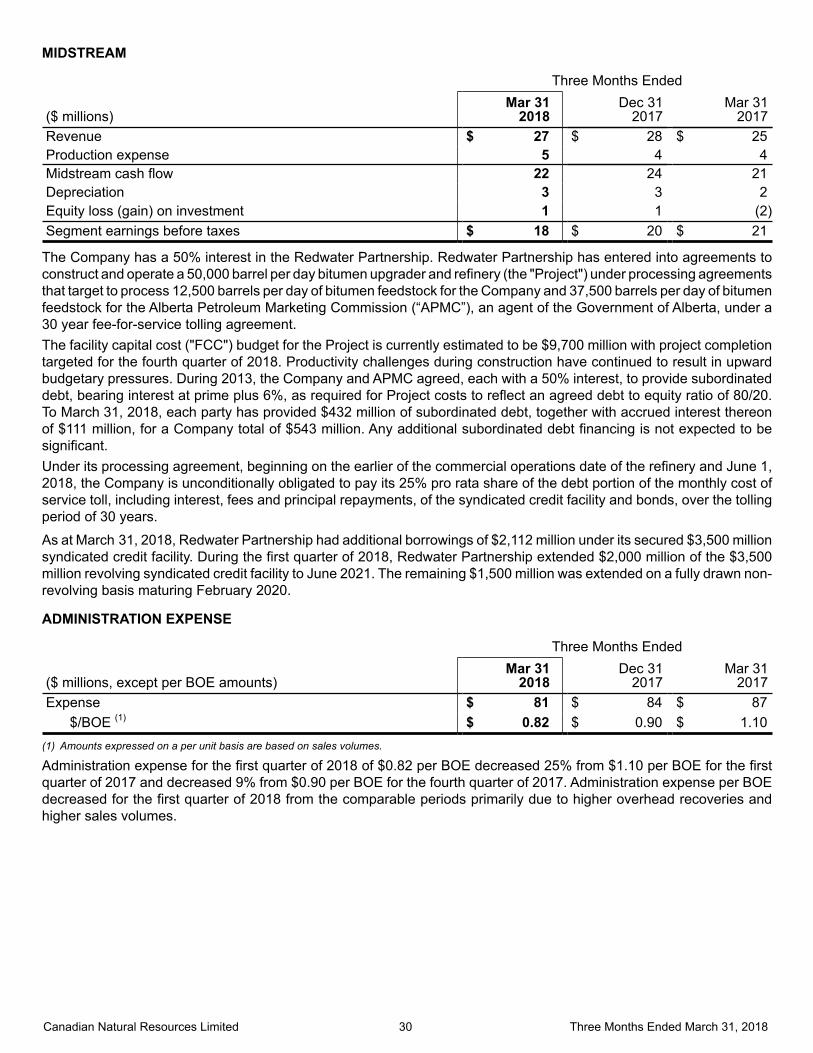
Canadian Natural Resources Limited 30 Three Months Ended March 31, 2018
MIDSTREAM
Three Months Ended
($ millions)Mar 31
2018Dec 31
2017Mar 31
2017Revenue $ 27 $ 28 $ 25Production expense 5 4 4Midstream cash flow 22 24 21Depreciation 3 3 2Equity loss (gain) on investment 1 1 (2)Segment earnings before taxes $ 18 $ 20 $ 21
The Company has a 50% interest in the Redwater Partnership. Redwater Partnership has entered into agreements to construct and operate a 50,000 barrel per day bitumen upgrader and refinery (the "Project") under processing agreements that target to process 12,500 barrels per day of bitumen feedstock for the Company and 37,500 barrels per day of bitumen feedstock for the Alberta Petroleum Marketing Commission (“APMC”), an agent of the Government of Alberta, under a 30 year fee-for-service tolling agreement.The facility capital cost ("FCC") budget for the Project is currently estimated to be $9,700 million with project completion targeted for the fourth quarter of 2018. Productivity challenges during construction have continued to result in upward budgetary pressures. During 2013, the Company and APMC agreed, each with a 50% interest, to provide subordinated debt, bearing interest at prime plus 6%, as required for Project costs to reflect an agreed debt to equity ratio of 80/20. To March 31, 2018, each party has provided $432 million of subordinated debt, together with accrued interest thereon of $111 million, for a Company total of $543 million. Any additional subordinated debt financing is not expected to be significant.Under its processing agreement, beginning on the earlier of the commercial operations date of the refinery and June 1, 2018, the Company is unconditionally obligated to pay its 25% pro rata share of the debt portion of the monthly cost of service toll, including interest, fees and principal repayments, of the syndicated credit facility and bonds, over the tolling period of 30 years.
As at March 31, 2018, Redwater Partnership had additional borrowings of $2,112 million under its secured $3,500 million syndicated credit facility. During the first quarter of 2018, Redwater Partnership extended $2,000 million of the $3,500 million revolving syndicated credit facility to June 2021. The remaining $1,500 million was extended on a fully drawn non-revolving basis maturing February 2020.
ADMINISTRATION EXPENSE
Three Months Ended
($ millions, except per BOE amounts)Mar 31
2018Dec 31
2017Mar 31
2017Expense $ 81 $ 84 $ 87
$/BOE (1) $ 0.82 $ 0.90 $ 1.10(1) Amounts expressed on a per unit basis are based on sales volumes.
Administration expense for the first quarter of 2018 of $0.82 per BOE decreased 25% from $1.10 per BOE for the first quarter of 2017 and decreased 9% from $0.90 per BOE for the fourth quarter of 2017. Administration expense per BOE decreased for the first quarter of 2018 from the comparable periods primarily due to higher overhead recoveries and higher sales volumes.
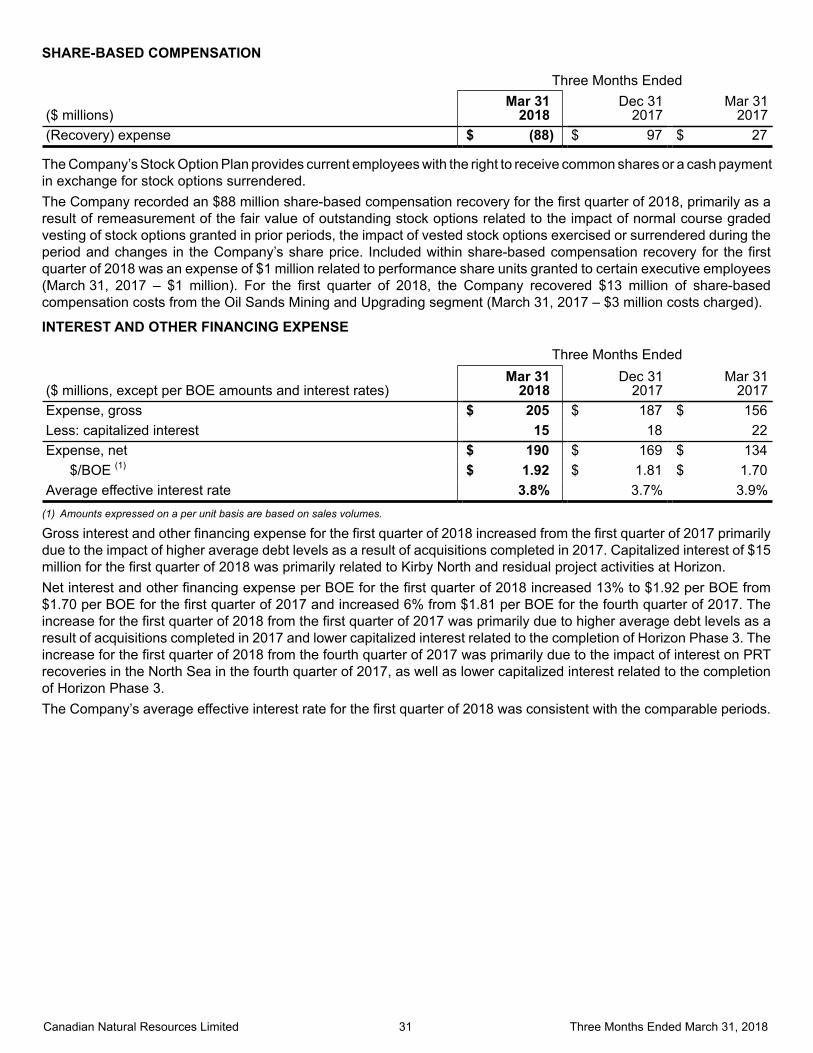
Canadian Natural Resources Limited 31 Three Months Ended March 31, 2018
SHARE-BASED COMPENSATION
Three Months Ended
($ millions)Mar 31
2018Dec 31
2017Mar 31
2017(Recovery) expense $ (88) $ 97 $ 27
The Company’s Stock Option Plan provides current employees with the right to receive common shares or a cash payment in exchange for stock options surrendered.The Company recorded an $88 million share-based compensation recovery for the first quarter of 2018, primarily as a result of remeasurement of the fair value of outstanding stock options related to the impact of normal course graded vesting of stock options granted in prior periods, the impact of vested stock options exercised or surrendered during the period and changes in the Company’s share price. Included within share-based compensation recovery for the first quarter of 2018 was an expense of $1 million related to performance share units granted to certain executive employees (March 31, 2017 – $1 million). For the first quarter of 2018, the Company recovered $13 million of share-based compensation costs from the Oil Sands Mining and Upgrading segment (March 31, 2017 – $3 million costs charged).
INTEREST AND OTHER FINANCING EXPENSE
Three Months Ended
($ millions, except per BOE amounts and interest rates)Mar 31
2018Dec 31
2017Mar 31
2017Expense, gross $ 205 $ 187 $ 156Less: capitalized interest 15 18 22Expense, net $ 190 $ 169 $ 134
$/BOE (1) $ 1.92 $ 1.81 $ 1.70Average effective interest rate 3.8% 3.7% 3.9%
(1) Amounts expressed on a per unit basis are based on sales volumes.
Gross interest and other financing expense for the first quarter of 2018 increased from the first quarter of 2017 primarily due to the impact of higher average debt levels as a result of acquisitions completed in 2017. Capitalized interest of $15 million for the first quarter of 2018 was primarily related to Kirby North and residual project activities at Horizon.Net interest and other financing expense per BOE for the first quarter of 2018 increased 13% to $1.92 per BOE from $1.70 per BOE for the first quarter of 2017 and increased 6% from $1.81 per BOE for the fourth quarter of 2017. The increase for the first quarter of 2018 from the first quarter of 2017 was primarily due to higher average debt levels as a result of acquisitions completed in 2017 and lower capitalized interest related to the completion of Horizon Phase 3. The increase for the first quarter of 2018 from the fourth quarter of 2017 was primarily due to the impact of interest on PRT recoveries in the North Sea in the fourth quarter of 2017, as well as lower capitalized interest related to the completion of Horizon Phase 3.The Company’s average effective interest rate for the first quarter of 2018 was consistent with the comparable periods.

Canadian Natural Resources Limited 32 Three Months Ended March 31, 2018
RISK MANAGEMENT ACTIVITIESThe Company utilizes various derivative financial instruments to manage its commodity price, interest rate and foreign currency exposures. These derivative financial instruments are not intended for trading or speculative purposes.
Three Months Ended
($ millions)Mar 31
2018Dec 31
2017Mar 31
2017Crude oil and NGLs financial instruments $ — $ — $ (1)Natural gas financial instruments — (2) —Foreign currency contracts (19) (71) (11)Realized gain (19) (73) (12)
Crude oil and NGLs financial instruments — 7 (43)Natural gas financial instruments — 2 (8)Foreign currency contracts (33) 66 11Unrealized (gain) loss (33) 75 (40)Net (gain) loss $ (52) $ 2 $ (52)
During the first quarter of 2018, net realized risk management gains were related to the settlement of foreign currency contracts. The Company recorded a net unrealized gain of $33 million ($31 million after-tax) on its risk management activities for the first quarter of 2018 (December 31, 2017 - unrealized loss of $75 million; $68 million after-tax; March 31, 2017 – unrealized gain of $40 million; $31 million after-tax).Further details related to outstanding derivative financial instruments at March 31, 2018 are disclosed in note 15 to the Company’s unaudited interim consolidated financial statements.
FOREIGN EXCHANGE
Three Months Ended
($ millions)Mar 31
2018Dec 31
2017Mar 31
2017Net realized loss (gain) $ 116 $ (15) $ 4Net unrealized loss (gain) 162 (2) (60)Net loss (gain) (1) $ 278 $ (17) $ (56)
(1) Amounts are reported net of the hedging effect of cross currency swaps.
The net realized foreign exchange loss for the first quarter of 2018 was primarily due to foreign exchange rate fluctuations on settlement of working capital items denominated in US dollars or UK pounds sterling and the repayment of US$600 million of 1.75% notes and US$400 million of 5.90% notes. The net unrealized foreign exchange loss for the first quarterof 2018 was primarily related to the impact of the weakening Canadian dollar with respect to outstanding US dollar debt, partially offset by the reversal of the net unrealized foreign exchange loss on the repayment of US$600 million of 1.75% notes and US$400 million of 5.90% notes. The net unrealized loss (gain) for each of the periods presented included the impact of cross currency swaps (three months ended March 31, 2018 – unrealized gain of $40 million, December 31, 2017 – unrealized gain of $1 million, March 31, 2017 – unrealized loss of $23 million). The US/Canadian dollar exchange rate at March 31, 2018 was US$0.7751 (December 31, 2017 – US$0.7988, March 31, 2017 – US$0.7506).
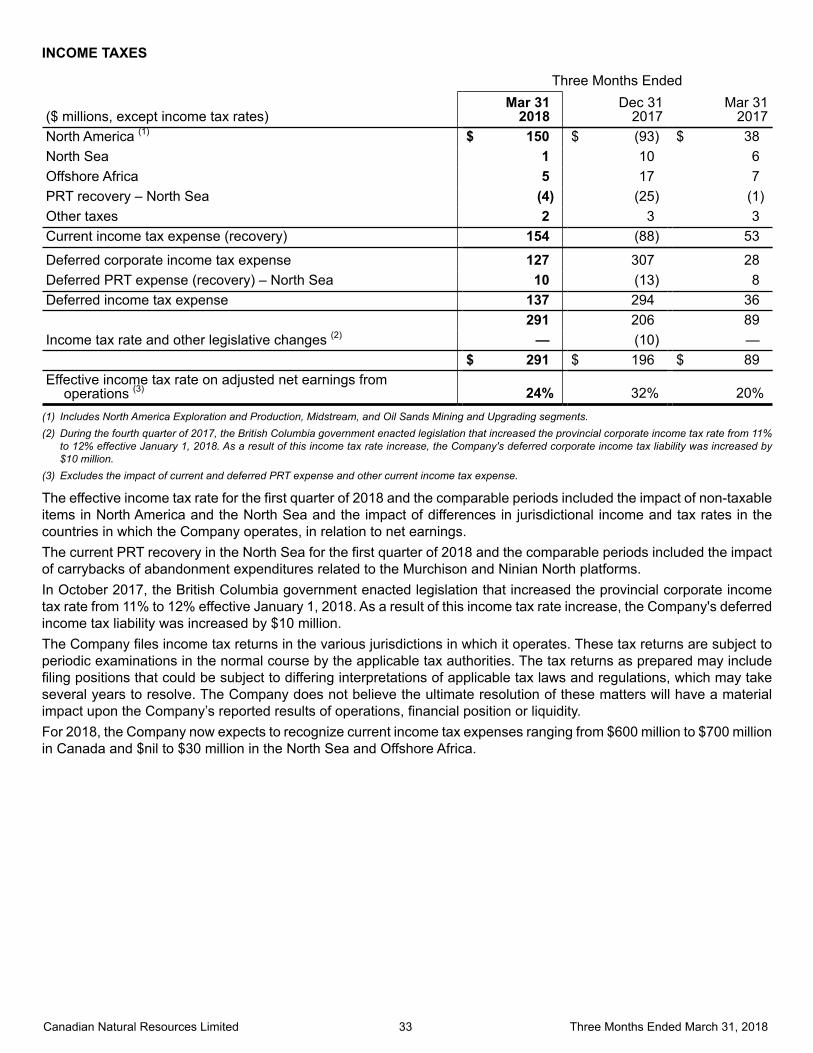
Canadian Natural Resources Limited 33 Three Months Ended March 31, 2018
INCOME TAXES
Three Months Ended
($ millions, except income tax rates)Mar 31
2018Dec 31
2017Mar 31
2017North America (1) $ 150 $ (93) $ 38North Sea 1 10 6Offshore Africa 5 17 7PRT recovery – North Sea (4) (25) (1)Other taxes 2 3 3Current income tax expense (recovery) 154 (88) 53
Deferred corporate income tax expense 127 307 28Deferred PRT expense (recovery) – North Sea 10 (13) 8Deferred income tax expense 137 294 36
291 206 89Income tax rate and other legislative changes (2) — (10) —
$ 291 $ 196 $ 89Effective income tax rate on adjusted net earnings from
operations (3) 24% 32% 20%(1) Includes North America Exploration and Production, Midstream, and Oil Sands Mining and Upgrading segments.(2) During the fourth quarter of 2017, the British Columbia government enacted legislation that increased the provincial corporate income tax rate from 11%
to 12% effective January 1, 2018. As a result of this income tax rate increase, the Company's deferred corporate income tax liability was increased by $10 million.
(3) Excludes the impact of current and deferred PRT expense and other current income tax expense.
The effective income tax rate for the first quarter of 2018 and the comparable periods included the impact of non-taxable items in North America and the North Sea and the impact of differences in jurisdictional income and tax rates in the countries in which the Company operates, in relation to net earnings. The current PRT recovery in the North Sea for the first quarter of 2018 and the comparable periods included the impact of carrybacks of abandonment expenditures related to the Murchison and Ninian North platforms.In October 2017, the British Columbia government enacted legislation that increased the provincial corporate income tax rate from 11% to 12% effective January 1, 2018. As a result of this income tax rate increase, the Company's deferred income tax liability was increased by $10 million.The Company files income tax returns in the various jurisdictions in which it operates. These tax returns are subject to periodic examinations in the normal course by the applicable tax authorities. The tax returns as prepared may include filing positions that could be subject to differing interpretations of applicable tax laws and regulations, which may take several years to resolve. The Company does not believe the ultimate resolution of these matters will have a material impact upon the Company’s reported results of operations, financial position or liquidity.For 2018, the Company now expects to recognize current income tax expenses ranging from $600 million to $700 millionin Canada and $nil to $30 million in the North Sea and Offshore Africa.
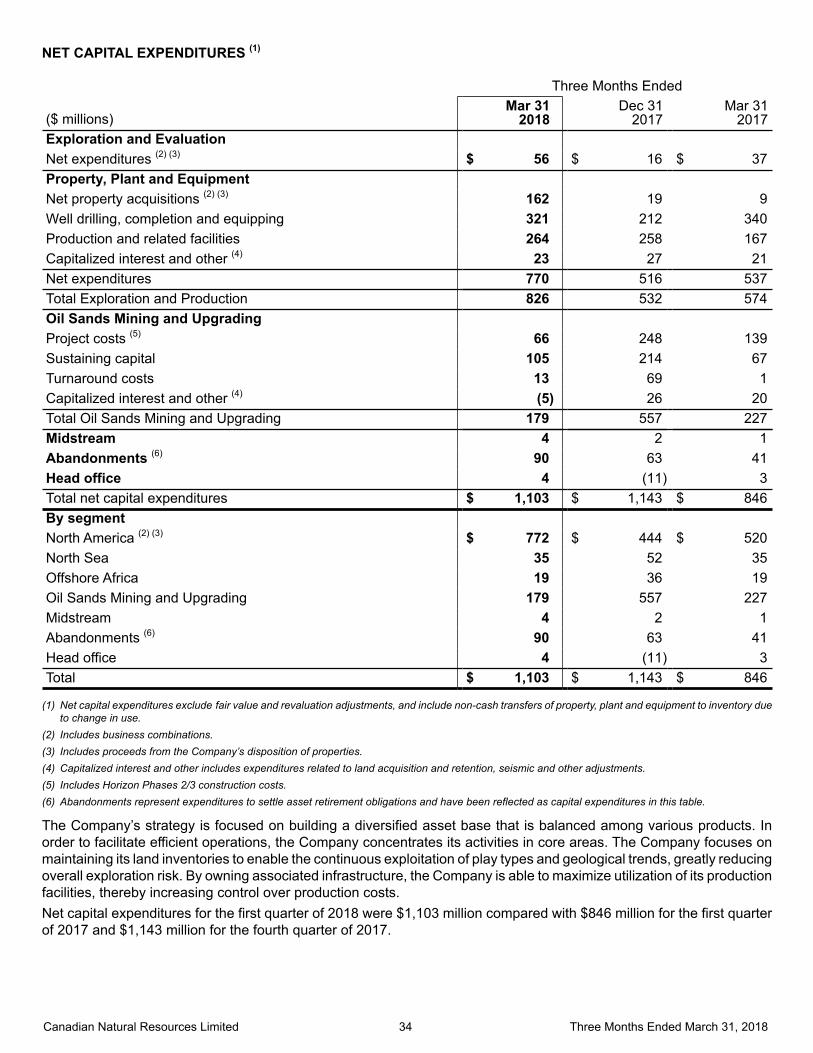
Canadian Natural Resources Limited 34 Three Months Ended March 31, 2018
NET CAPITAL EXPENDITURES (1)
Three Months Ended
($ millions)Mar 31
2018Dec 31
2017Mar 31
2017Exploration and EvaluationNet expenditures (2) (3) $ 56 $ 16 $ 37Property, Plant and Equipment
Net property acquisitions (2) (3) 162 19 9Well drilling, completion and equipping 321 212 340Production and related facilities 264 258 167Capitalized interest and other (4) 23 27 21Net expenditures 770 516 537Total Exploration and Production 826 532 574Oil Sands Mining and Upgrading
Project costs (5) 66 248 139Sustaining capital 105 214 67Turnaround costs 13 69 1Capitalized interest and other (4) (5) 26 20Total Oil Sands Mining and Upgrading 179 557 227Midstream 4 2 1Abandonments (6) 90 63 41Head office 4 (11) 3Total net capital expenditures $ 1,103 $ 1,143 $ 846By segment
North America (2) (3) $ 772 $ 444 $ 520North Sea 35 52 35Offshore Africa 19 36 19Oil Sands Mining and Upgrading 179 557 227Midstream 4 2 1Abandonments (6) 90 63 41Head office 4 (11) 3Total $ 1,103 $ 1,143 $ 846
(1) Net capital expenditures exclude fair value and revaluation adjustments, and include non-cash transfers of property, plant and equipment to inventory due to change in use.
(2) Includes business combinations.(3) Includes proceeds from the Company’s disposition of properties.(4) Capitalized interest and other includes expenditures related to land acquisition and retention, seismic and other adjustments.(5) Includes Horizon Phases 2/3 construction costs.(6) Abandonments represent expenditures to settle asset retirement obligations and have been reflected as capital expenditures in this table.
The Company’s strategy is focused on building a diversified asset base that is balanced among various products. In order to facilitate efficient operations, the Company concentrates its activities in core areas. The Company focuses on maintaining its land inventories to enable the continuous exploitation of play types and geological trends, greatly reducing overall exploration risk. By owning associated infrastructure, the Company is able to maximize utilization of its production facilities, thereby increasing control over production costs.Net capital expenditures for the first quarter of 2018 were $1,103 million compared with $846 million for the first quarterof 2017 and $1,143 million for the fourth quarter of 2017.
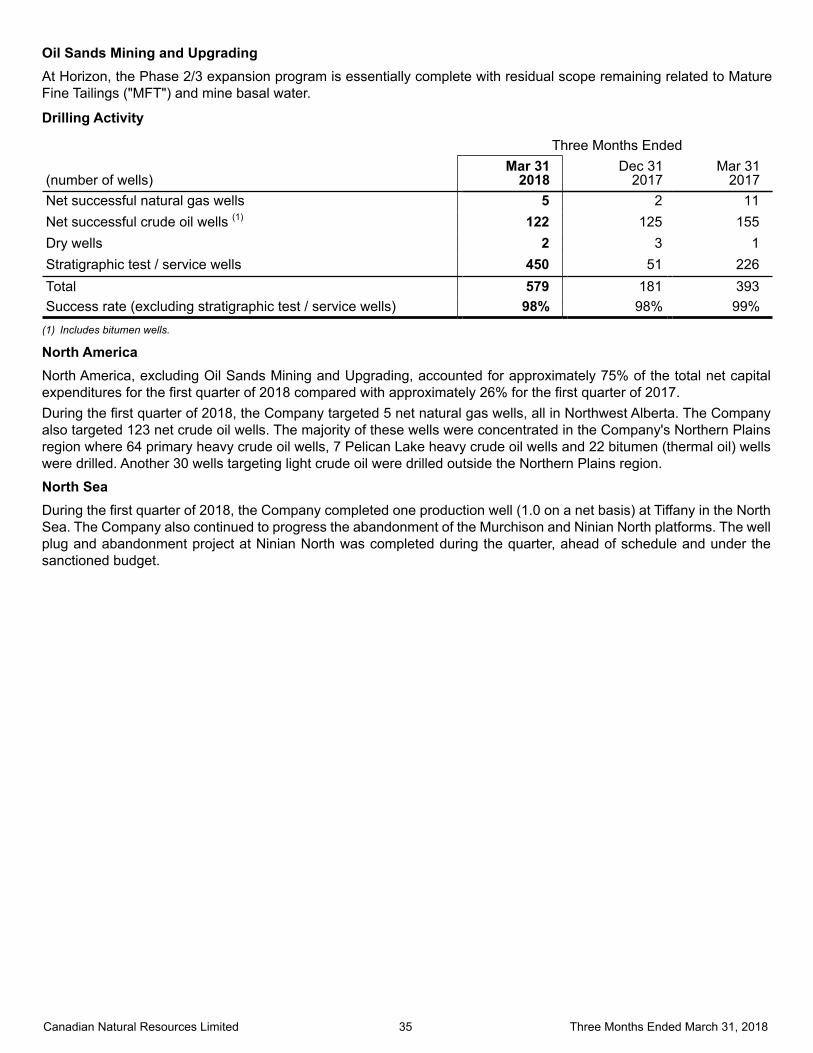
Canadian Natural Resources Limited 35 Three Months Ended March 31, 2018
Oil Sands Mining and UpgradingAt Horizon, the Phase 2/3 expansion program is essentially complete with residual scope remaining related to Mature Fine Tailings ("MFT") and mine basal water.
Drilling Activity
Three Months Ended
(number of wells)Mar 31
2018Dec 31
2017Mar 31
2017Net successful natural gas wells 5 2 11Net successful crude oil wells (1) 122 125 155Dry wells 2 3 1Stratigraphic test / service wells 450 51 226Total 579 181 393Success rate (excluding stratigraphic test / service wells) 98% 98% 99%
(1) Includes bitumen wells.
North AmericaNorth America, excluding Oil Sands Mining and Upgrading, accounted for approximately 75% of the total net capital expenditures for the first quarter of 2018 compared with approximately 26% for the first quarter of 2017.During the first quarter of 2018, the Company targeted 5 net natural gas wells, all in Northwest Alberta. The Company also targeted 123 net crude oil wells. The majority of these wells were concentrated in the Company's Northern Plains region where 64 primary heavy crude oil wells, 7 Pelican Lake heavy crude oil wells and 22 bitumen (thermal oil) wells were drilled. Another 30 wells targeting light crude oil were drilled outside the Northern Plains region.
North SeaDuring the first quarter of 2018, the Company completed one production well (1.0 on a net basis) at Tiffany in the North Sea. The Company also continued to progress the abandonment of the Murchison and Ninian North platforms. The well plug and abandonment project at Ninian North was completed during the quarter, ahead of schedule and under the sanctioned budget.
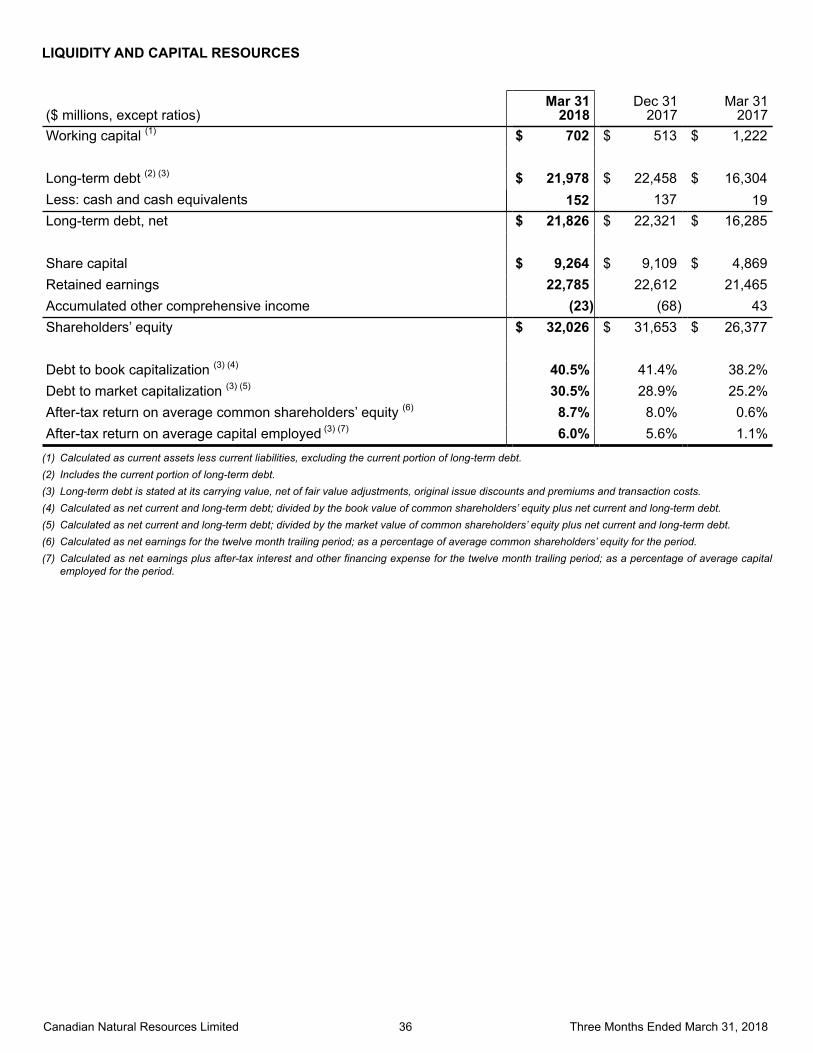
Canadian Natural Resources Limited 36 Three Months Ended March 31, 2018
LIQUIDITY AND CAPITAL RESOURCES
($ millions, except ratios)Mar 31
2018Dec 31
2017Mar 31
2017Working capital (1) $ 702 $ 513 $ 1,222
Long-term debt (2) (3) $ 21,978 $ 22,458 $ 16,304Less: cash and cash equivalents 152 137 19Long-term debt, net $ 21,826 $ 22,321 $ 16,285
Share capital $ 9,264 $ 9,109 $ 4,869Retained earnings 22,785 22,612 21,465Accumulated other comprehensive income (23) (68) 43Shareholders’ equity $ 32,026 $ 31,653 $ 26,377
Debt to book capitalization (3) (4) 40.5% 41.4% 38.2%Debt to market capitalization (3) (5) 30.5% 28.9% 25.2%After-tax return on average common shareholders’ equity (6) 8.7% 8.0% 0.6%After-tax return on average capital employed (3) (7) 6.0% 5.6% 1.1%
(1) Calculated as current assets less current liabilities, excluding the current portion of long-term debt.(2) Includes the current portion of long-term debt.(3) Long-term debt is stated at its carrying value, net of fair value adjustments, original issue discounts and premiums and transaction costs.(4) Calculated as net current and long-term debt; divided by the book value of common shareholders’ equity plus net current and long-term debt.(5) Calculated as net current and long-term debt; divided by the market value of common shareholders’ equity plus net current and long-term debt.(6) Calculated as net earnings for the twelve month trailing period; as a percentage of average common shareholders’ equity for the period.(7) Calculated as net earnings plus after-tax interest and other financing expense for the twelve month trailing period; as a percentage of average capital
employed for the period.
Canadian Natural Resources Limited 37 Three Months Ended March 31, 2018
At March 31, 2018, the Company’s capital resources consisted primarily of funds flow from operations, available bank credit facilities and access to debt capital markets. Funds flow from operations and the Company’s ability to renew existing bank credit facilities and raise new debt is dependent on factors discussed in the “Risks and Uncertainties” section of the Company's annual MD&A for the year ended December 31, 2017. In addition, the Company’s ability to renew existing bank credit facilities and raise new debt reflects current credit ratings as determined by independent rating agencies, and the conditions of the market. The Company continues to believe that its internally generated funds flow from operations supported by the implementation of its ongoing hedge policy, the flexibility of its capital expenditure programs and multi-year financial plans, its existing bank credit facilities, and its ability to raise new debt on commercially acceptable terms will provide sufficient liquidity to sustain its operations in the short, medium and long term and support its growth strategy.On an ongoing basis the Company continues to focus on its balance sheet strength and available liquidity by:
Monitoring funds flow from operations, which is the primary source of funds; Actively managing the allocation of maintenance and growth capital to ensure it is expended in a prudent and
appropriate manner with flexibility to adjust to market conditions. The Company continues to exercise its capital flexibility to address commodity price volatility and its impact on operating expenditures, capital commitments and long-term debt;
During the first quarter of 2018, the Company utilized funds flow from operations to facilitate net repayment of bank credit facilities and US dollar debt securities of $1,336 million, excluding the impact of foreign exchange on debt balances, including: repayment and cancellation of the $125 million non-revolving credit facility; repayment and cancellation of $150 million of the $3,000 million non-revolving term loan facility; and repayment of US$600 million of 1.75% notes and US$400 million of 5.90% notes.
Additionally, the Company utilized available liquidity to settle the deferred payment to Marathon Oil Corporation for $481 million, resulting in total net repayments of debt of $855 million.
Reviewing the Company's borrowing capacity: Borrowings under the $2,200 million non-revolving credit facility may be made by way of pricing referenced
to Canadian dollar bankers’ acceptances, US dollar bankers’ acceptances, LIBOR, US base rate or Canadian prime rate. As at March 31, 2018, the $2,200 million facility was fully drawn.
Borrowings under the $2,850 million non-revolving term loan facility may be made by way of pricing referenced to Canadian dollar bankers’ acceptances, US dollar bankers’ acceptances, LIBOR, US base rate or Canadian prime rate. As at March 31, 2018, the $2,850 million facility was fully drawn.
Borrowings under the $750 million non-revolving credit facility may be made by way of pricing referenced to Canadian dollar bankers’ acceptances, US dollar bankers’ acceptances, LIBOR, US base rate or Canadian prime rate. As at March 31, 2018, the $750 million facility was fully drawn.
The Company’s borrowings under its US commercial paper program are authorized up to a maximum of US$2,500 million. The Company reserves capacity under its bank credit facilities for amounts outstanding under this program.
In July 2017, the Company filed base shelf prospectuses that allow for the offer for sale from time to time of up to $3,000 million of medium-term notes in Canada and US$3,000 million of debt securities in the United States, which expires in August 2019. If issued, these securities may be offered in amounts and at prices, including interest rates, to be determined based on market conditions at the time of issuance.
Reviewing bank credit facilities and public debt indentures to ensure they are in compliance with applicable covenant packages; and
Monitoring exposure to individual customers, contractors, suppliers and joint venture partners on a regular basis and when appropriate, ensuring parental guarantees or letters of credit are in place, and as applicable, taking other mitigating actions to minimize the impact in the event of a default.
At March 31, 2018, the Company had in place bank credit facilities of $10,777 million, of which approximately $3,835 million was available, resulting in liquidity of $3,987 million, including cash and cash equivalents. This excludes certain other dedicated credit facilities supporting letters of credit.At March 31, 2018, the Company had total US dollar denominated debt with a carrying amount of $14,377 million (US$11,147 million), before transaction costs and original issue discounts. This included $5,863 million (US$4,547 million) hedged by way of cross currency swaps (US$1,050 million) and foreign currency forwards (US$3,497 million). The fixed repayment amount of these hedging instruments is $5,639 million, resulting in a notional reduction of the carrying amount of the Company’s US dollar denominated debt by approximately $224 million to $14,153 million as at March 31, 2018.
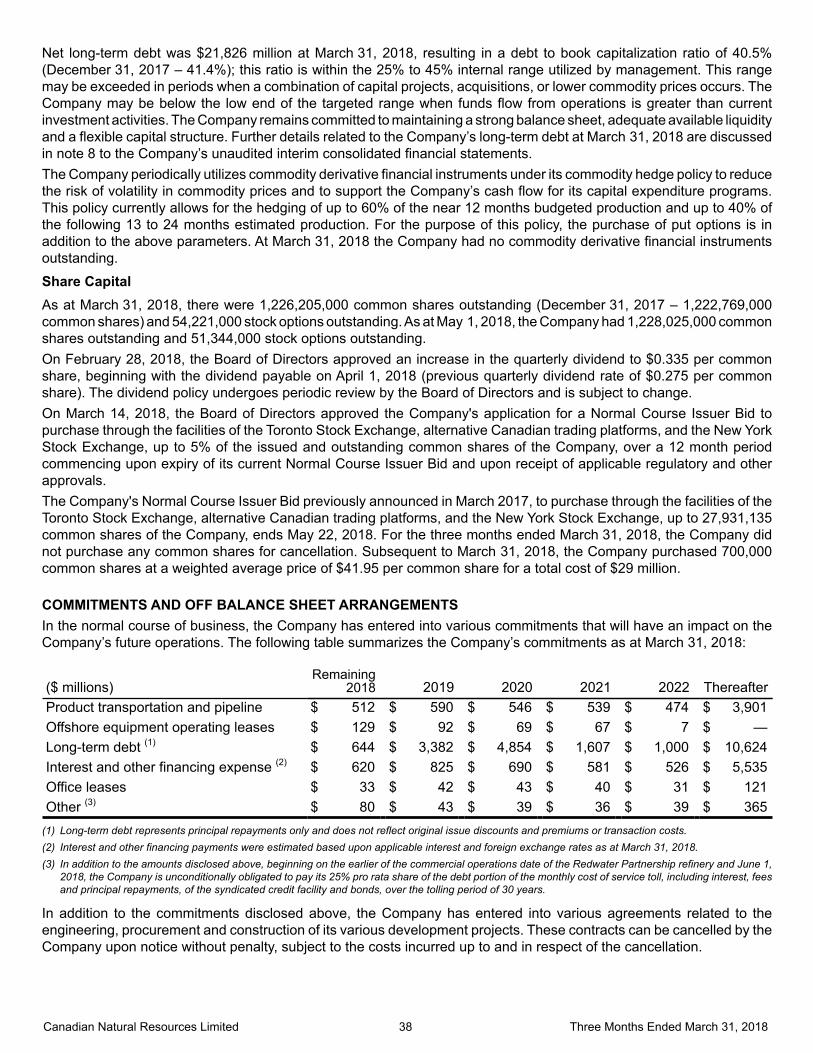
Canadian Natural Resources Limited 38 Three Months Ended March 31, 2018
Net long-term debt was $21,826 million at March 31, 2018, resulting in a debt to book capitalization ratio of 40.5%(December 31, 2017 – 41.4%); this ratio is within the 25% to 45% internal range utilized by management. This range may be exceeded in periods when a combination of capital projects, acquisitions, or lower commodity prices occurs. The Company may be below the low end of the targeted range when funds flow from operations is greater than current investment activities. The Company remains committed to maintaining a strong balance sheet, adequate available liquidity and a flexible capital structure. Further details related to the Company’s long-term debt at March 31, 2018 are discussed in note 8 to the Company’s unaudited interim consolidated financial statements.The Company periodically utilizes commodity derivative financial instruments under its commodity hedge policy to reduce the risk of volatility in commodity prices and to support the Company’s cash flow for its capital expenditure programs. This policy currently allows for the hedging of up to 60% of the near 12 months budgeted production and up to 40% of the following 13 to 24 months estimated production. For the purpose of this policy, the purchase of put options is in addition to the above parameters. At March 31, 2018 the Company had no commodity derivative financial instruments outstanding.
Share CapitalAs at March 31, 2018, there were 1,226,205,000 common shares outstanding (December 31, 2017 – 1,222,769,000common shares) and 54,221,000 stock options outstanding. As at May 1, 2018, the Company had 1,228,025,000 common shares outstanding and 51,344,000 stock options outstanding.On February 28, 2018, the Board of Directors approved an increase in the quarterly dividend to $0.335 per common share, beginning with the dividend payable on April 1, 2018 (previous quarterly dividend rate of $0.275 per common share). The dividend policy undergoes periodic review by the Board of Directors and is subject to change.On March 14, 2018, the Board of Directors approved the Company's application for a Normal Course Issuer Bid to purchase through the facilities of the Toronto Stock Exchange, alternative Canadian trading platforms, and the New York Stock Exchange, up to 5% of the issued and outstanding common shares of the Company, over a 12 month period commencing upon expiry of its current Normal Course Issuer Bid and upon receipt of applicable regulatory and other approvals.The Company's Normal Course Issuer Bid previously announced in March 2017, to purchase through the facilities of the Toronto Stock Exchange, alternative Canadian trading platforms, and the New York Stock Exchange, up to 27,931,135 common shares of the Company, ends May 22, 2018. For the three months ended March 31, 2018, the Company did not purchase any common shares for cancellation. Subsequent to March 31, 2018, the Company purchased 700,000 common shares at a weighted average price of $41.95 per common share for a total cost of $29 million.
COMMITMENTS AND OFF BALANCE SHEET ARRANGEMENTSIn the normal course of business, the Company has entered into various commitments that will have an impact on the Company’s future operations. The following table summarizes the Company’s commitments as at March 31, 2018:
($ millions)Remaining
2018 2019 2020 2021 2022 ThereafterProduct transportation and pipeline $ 512 $ 590 $ 546 $ 539 $ 474 $ 3,901Offshore equipment operating leases $ 129 $ 92 $ 69 $ 67 $ 7 $ —Long-term debt (1) $ 644 $ 3,382 $ 4,854 $ 1,607 $ 1,000 $ 10,624Interest and other financing expense (2) $ 620 $ 825 $ 690 $ 581 $ 526 $ 5,535Office leases $ 33 $ 42 $ 43 $ 40 $ 31 $ 121Other (3) $ 80 $ 43 $ 39 $ 36 $ 39 $ 365
(1) Long-term debt represents principal repayments only and does not reflect original issue discounts and premiums or transaction costs.(2) Interest and other financing payments were estimated based upon applicable interest and foreign exchange rates as at March 31, 2018.(3) In addition to the amounts disclosed above, beginning on the earlier of the commercial operations date of the Redwater Partnership refinery and June 1,
2018, the Company is unconditionally obligated to pay its 25% pro rata share of the debt portion of the monthly cost of service toll, including interest, fees and principal repayments, of the syndicated credit facility and bonds, over the tolling period of 30 years.
In addition to the commitments disclosed above, the Company has entered into various agreements related to the engineering, procurement and construction of its various development projects. These contracts can be cancelled by the Company upon notice without penalty, subject to the costs incurred up to and in respect of the cancellation.
Canadian Natural Resources Limited 39 Three Months Ended March 31, 2018
LEGAL PROCEEDINGS AND OTHER CONTINGENCIESThe Company is defendant and plaintiff in a number of legal actions arising in the normal course of business. In addition, the Company is subject to certain contractor construction claims. The Company believes that any liabilities that might arise pertaining to any such matters would not have a material effect on its consolidated financial position.
CHANGES IN ACCOUNTING POLICIESFor the impact of new accounting standards, refer to the audited consolidated financial statements for the year ended December 31, 2017 and the unaudited interim financial statements for the three months ended March 31, 2018.
CRITICAL ACCOUNTING POLICIES AND ESTIMATES The preparation of financial statements requires the Company to make estimates, assumptions and judgements in the application of IFRS that have a significant impact on the financial results of the Company. Actual results could differ from estimated amounts, and those differences may be material. A comprehensive discussion of the Company's significant accounting estimates is contained in the MD&A and the audited consolidated financial statements for the year ended December 31, 2017.
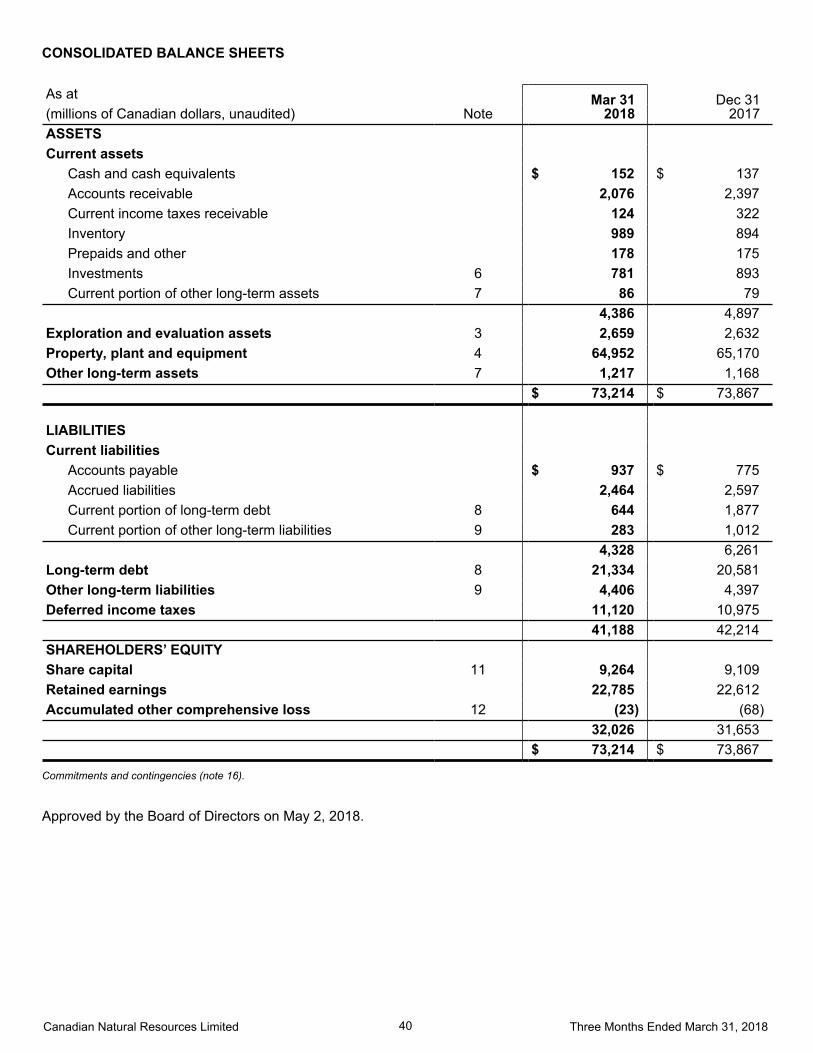
Canadian Natural Resources Limited 40 Three Months Ended March 31, 2018
CONSOLIDATED BALANCE SHEETS
As atNote
Mar 312018
Dec 312017(millions of Canadian dollars, unaudited)
ASSETS
Current assets
Cash and cash equivalents $ 152 $ 137Accounts receivable 2,076 2,397Current income taxes receivable 124 322Inventory 989 894Prepaids and other 178 175Investments 6 781 893Current portion of other long-term assets 7 86 79
4,386 4,897Exploration and evaluation assets 3 2,659 2,632Property, plant and equipment 4 64,952 65,170Other long-term assets 7 1,217 1,168 $ 73,214 $ 73,867
LIABILITIES Current liabilities
Accounts payable $ 937 $ 775Accrued liabilities 2,464 2,597Current portion of long-term debt 8 644 1,877Current portion of other long-term liabilities 9 283 1,012
4,328 6,261Long-term debt 8 21,334 20,581Other long-term liabilities 9 4,406 4,397Deferred income taxes 11,120 10,975 41,188 42,214SHAREHOLDERS’ EQUITY Share capital 11 9,264 9,109Retained earnings 22,785 22,612Accumulated other comprehensive loss 12 (23) (68) 32,026 31,653 $ 73,214 $ 73,867
Commitments and contingencies (note 16).
Approved by the Board of Directors on May 2, 2018.
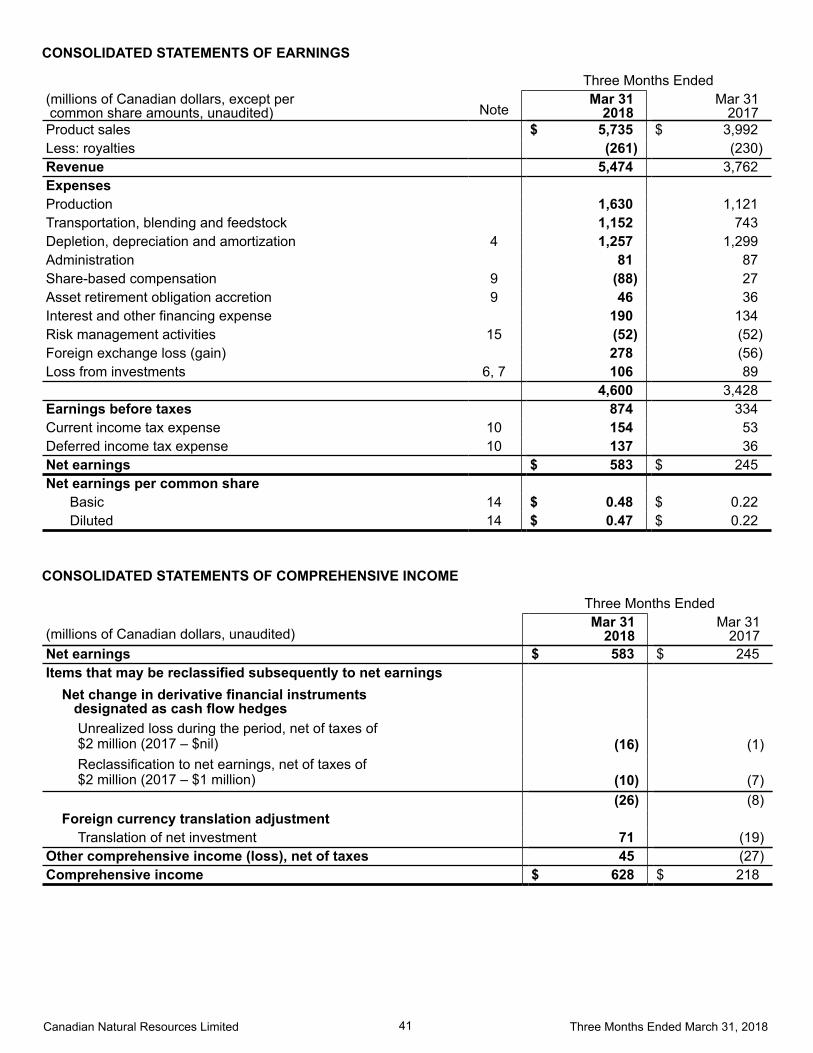
Canadian Natural Resources Limited 41 Three Months Ended March 31, 2018
CONSOLIDATED STATEMENTS OF EARNINGS
Three Months Ended(millions of Canadian dollars, except per common share amounts, unaudited) Note
Mar 312018
Mar 312017
Product sales $ 5,735 $ 3,992Less: royalties (261) (230)Revenue 5,474 3,762ExpensesProduction 1,630 1,121Transportation, blending and feedstock 1,152 743Depletion, depreciation and amortization 4 1,257 1,299Administration 81 87Share-based compensation 9 (88) 27Asset retirement obligation accretion 9 46 36Interest and other financing expense 190 134Risk management activities 15 (52) (52)Foreign exchange loss (gain) 278 (56)Loss from investments 6, 7 106 89 4,600 3,428Earnings before taxes 874 334Current income tax expense 10 154 53Deferred income tax expense 10 137 36Net earnings $ 583 $ 245Net earnings per common share
Basic 14 $ 0.48 $ 0.22Diluted 14 $ 0.47 $ 0.22
CONSOLIDATED STATEMENTS OF COMPREHENSIVE INCOME
Three Months Ended
(millions of Canadian dollars, unaudited)Mar 31
2018Mar 31
2017Net earnings $ 583 $ 245Items that may be reclassified subsequently to net earnings
Net change in derivative financial instrumentsdesignated as cash flow hedgesUnrealized loss during the period, net of taxes of $2 million (2017 – $nil) (16) (1)Reclassification to net earnings, net of taxes of $2 million (2017 – $1 million) (10) (7)
(26) (8)Foreign currency translation adjustment
Translation of net investment 71 (19)Other comprehensive income (loss), net of taxes 45 (27)Comprehensive income $ 628 $ 218
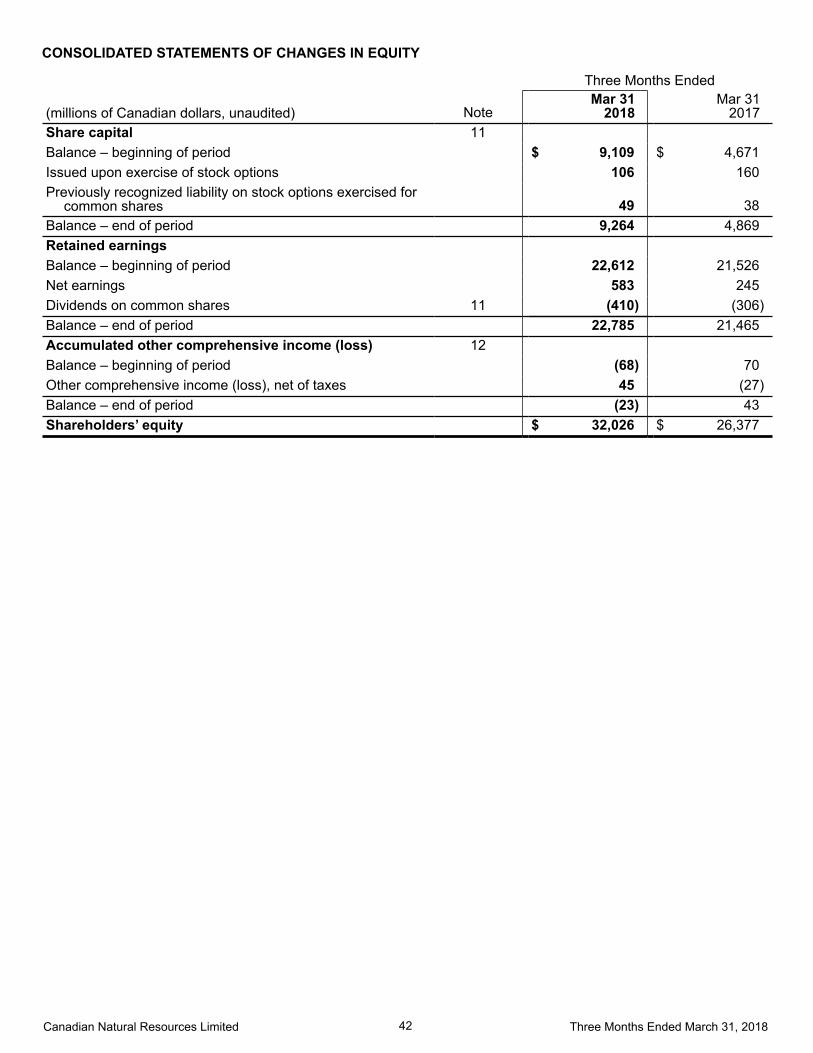
Canadian Natural Resources Limited 42 Three Months Ended March 31, 2018
CONSOLIDATED STATEMENTS OF CHANGES IN EQUITY
Three Months Ended
(millions of Canadian dollars, unaudited) NoteMar 31
2018Mar 31
2017Share capital 11
Balance – beginning of period $ 9,109 $ 4,671Issued upon exercise of stock options 106 160Previously recognized liability on stock options exercised for
common shares 49 38Balance – end of period 9,264 4,869Retained earnings Balance – beginning of period 22,612 21,526Net earnings 583 245Dividends on common shares 11 (410) (306)Balance – end of period 22,785 21,465Accumulated other comprehensive income (loss) 12 Balance – beginning of period (68) 70Other comprehensive income (loss), net of taxes 45 (27)Balance – end of period (23) 43Shareholders’ equity $ 32,026 $ 26,377
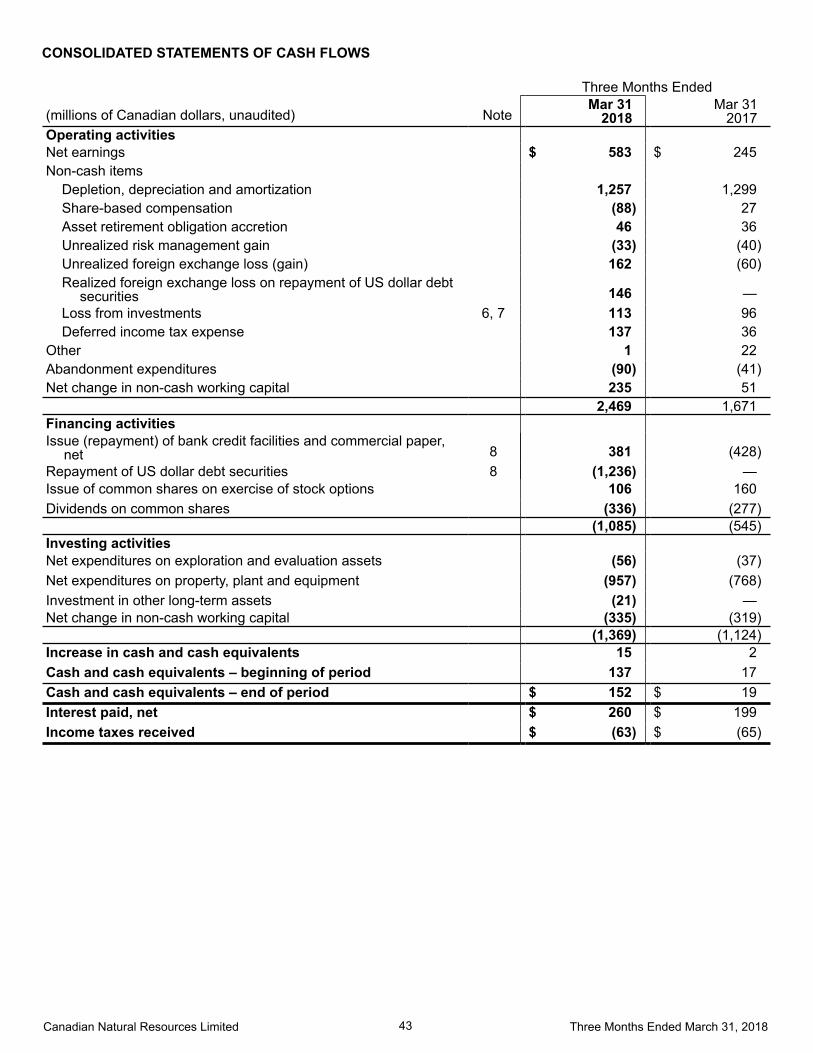
Canadian Natural Resources Limited 43 Three Months Ended March 31, 2018
CONSOLIDATED STATEMENTS OF CASH FLOWS
Three Months Ended
(millions of Canadian dollars, unaudited) NoteMar 31
2018Mar 31
2017Operating activities Net earnings $ 583 $ 245Non-cash items
Depletion, depreciation and amortization 1,257 1,299Share-based compensation (88) 27Asset retirement obligation accretion 46 36Unrealized risk management gain (33) (40)Unrealized foreign exchange loss (gain) 162 (60)Realized foreign exchange loss on repayment of US dollar debt
securities 146 —Loss from investments 6, 7 113 96Deferred income tax expense 137 36
Other 1 22Abandonment expenditures (90) (41)Net change in non-cash working capital 235 51 2,469 1,671Financing activities Issue (repayment) of bank credit facilities and commercial paper,
net 8 381 (428)Repayment of US dollar debt securities 8 (1,236) —Issue of common shares on exercise of stock options 106 160Dividends on common shares (336) (277) (1,085) (545)Investing activities Net expenditures on exploration and evaluation assets (56) (37)Net expenditures on property, plant and equipment (957) (768)Investment in other long-term assets (21) —Net change in non-cash working capital (335) (319) (1,369) (1,124)Increase in cash and cash equivalents 15 2Cash and cash equivalents – beginning of period 137 17Cash and cash equivalents – end of period $ 152 $ 19Interest paid, net $ 260 $ 199Income taxes received $ (63) $ (65)
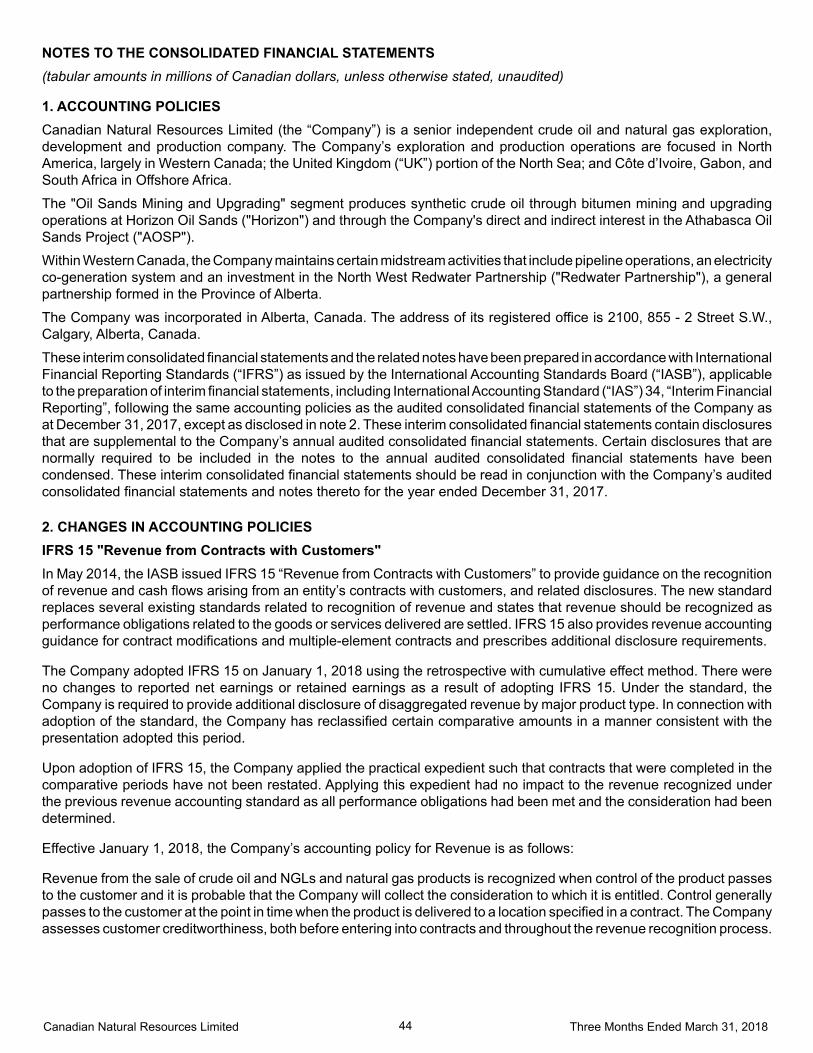
Canadian Natural Resources Limited 44 Three Months Ended March 31, 2018
NOTES TO THE CONSOLIDATED FINANCIAL STATEMENTS(tabular amounts in millions of Canadian dollars, unless otherwise stated, unaudited)
1. ACCOUNTING POLICIESCanadian Natural Resources Limited (the “Company”) is a senior independent crude oil and natural gas exploration, development and production company. The Company’s exploration and production operations are focused in North America, largely in Western Canada; the United Kingdom (“UK”) portion of the North Sea; and Côte d’Ivoire, Gabon, and South Africa in Offshore Africa.
The "Oil Sands Mining and Upgrading" segment produces synthetic crude oil through bitumen mining and upgrading operations at Horizon Oil Sands ("Horizon") and through the Company's direct and indirect interest in the Athabasca Oil Sands Project ("AOSP").
Within Western Canada, the Company maintains certain midstream activities that include pipeline operations, an electricity co-generation system and an investment in the North West Redwater Partnership ("Redwater Partnership"), a general partnership formed in the Province of Alberta.
The Company was incorporated in Alberta, Canada. The address of its registered office is 2100, 855 - 2 Street S.W., Calgary, Alberta, Canada.
These interim consolidated financial statements and the related notes have been prepared in accordance with International Financial Reporting Standards (“IFRS”) as issued by the International Accounting Standards Board (“IASB”), applicable to the preparation of interim financial statements, including International Accounting Standard (“IAS”) 34, “Interim Financial Reporting”, following the same accounting policies as the audited consolidated financial statements of the Company as at December 31, 2017, except as disclosed in note 2. These interim consolidated financial statements contain disclosures that are supplemental to the Company’s annual audited consolidated financial statements. Certain disclosures that are normally required to be included in the notes to the annual audited consolidated financial statements have been condensed. These interim consolidated financial statements should be read in conjunction with the Company’s audited consolidated financial statements and notes thereto for the year ended December 31, 2017.
2. CHANGES IN ACCOUNTING POLICIESIFRS 15 "Revenue from Contracts with Customers"In May 2014, the IASB issued IFRS 15 “Revenue from Contracts with Customers” to provide guidance on the recognition of revenue and cash flows arising from an entity’s contracts with customers, and related disclosures. The new standard replaces several existing standards related to recognition of revenue and states that revenue should be recognized as performance obligations related to the goods or services delivered are settled. IFRS 15 also provides revenue accounting guidance for contract modifications and multiple-element contracts and prescribes additional disclosure requirements.
The Company adopted IFRS 15 on January 1, 2018 using the retrospective with cumulative effect method. There were no changes to reported net earnings or retained earnings as a result of adopting IFRS 15. Under the standard, the Company is required to provide additional disclosure of disaggregated revenue by major product type. In connection with adoption of the standard, the Company has reclassified certain comparative amounts in a manner consistent with the presentation adopted this period.
Upon adoption of IFRS 15, the Company applied the practical expedient such that contracts that were completed in the comparative periods have not been restated. Applying this expedient had no impact to the revenue recognized under the previous revenue accounting standard as all performance obligations had been met and the consideration had been determined.
Effective January 1, 2018, the Company’s accounting policy for Revenue is as follows:
Revenue from the sale of crude oil and NGLs and natural gas products is recognized when control of the product passes to the customer and it is probable that the Company will collect the consideration to which it is entitled. Control generally passes to the customer at the point in time when the product is delivered to a location specified in a contract. The Company assesses customer creditworthiness, both before entering into contracts and throughout the revenue recognition process.
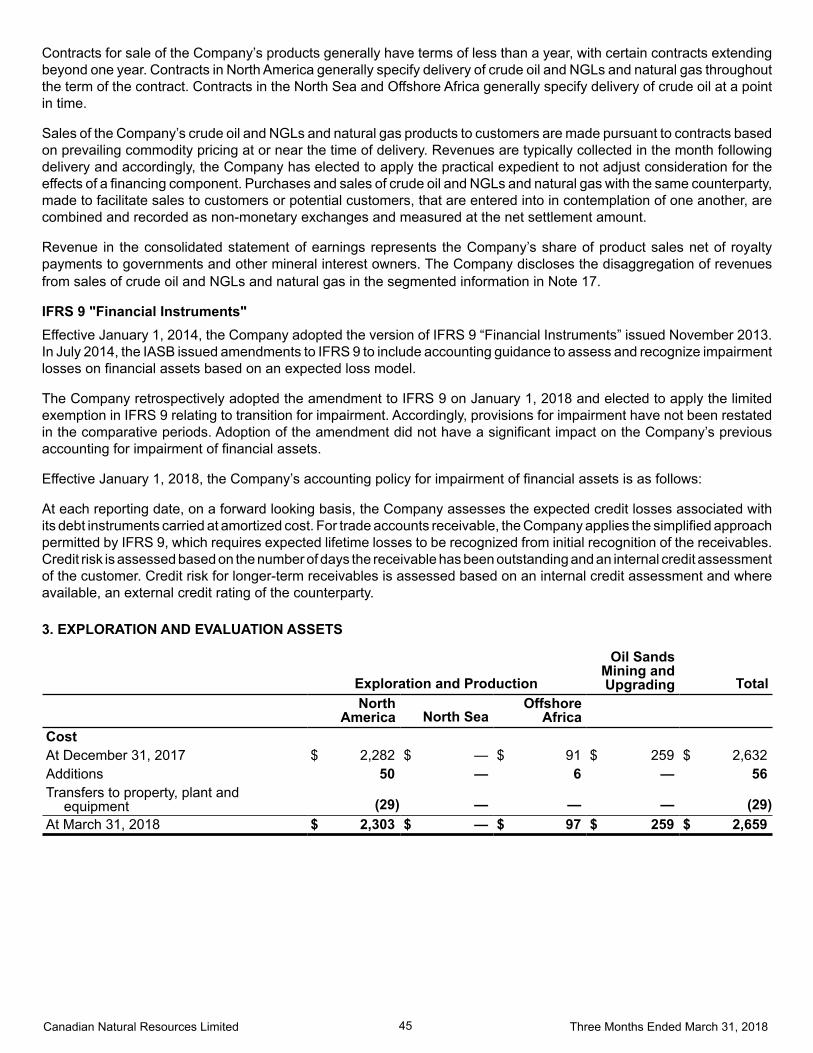
Canadian Natural Resources Limited 45 Three Months Ended March 31, 2018
Contracts for sale of the Company’s products generally have terms of less than a year, with certain contracts extending beyond one year. Contracts in North America generally specify delivery of crude oil and NGLs and natural gas throughout the term of the contract. Contracts in the North Sea and Offshore Africa generally specify delivery of crude oil at a point in time.
Sales of the Company’s crude oil and NGLs and natural gas products to customers are made pursuant to contracts based on prevailing commodity pricing at or near the time of delivery. Revenues are typically collected in the month following delivery and accordingly, the Company has elected to apply the practical expedient to not adjust consideration for the effects of a financing component. Purchases and sales of crude oil and NGLs and natural gas with the same counterparty, made to facilitate sales to customers or potential customers, that are entered into in contemplation of one another, are combined and recorded as non-monetary exchanges and measured at the net settlement amount.
Revenue in the consolidated statement of earnings represents the Company’s share of product sales net of royalty payments to governments and other mineral interest owners. The Company discloses the disaggregation of revenues from sales of crude oil and NGLs and natural gas in the segmented information in Note 17.
IFRS 9 "Financial Instruments"Effective January 1, 2014, the Company adopted the version of IFRS 9 “Financial Instruments” issued November 2013. In July 2014, the IASB issued amendments to IFRS 9 to include accounting guidance to assess and recognize impairment losses on financial assets based on an expected loss model.
The Company retrospectively adopted the amendment to IFRS 9 on January 1, 2018 and elected to apply the limited exemption in IFRS 9 relating to transition for impairment. Accordingly, provisions for impairment have not been restated in the comparative periods. Adoption of the amendment did not have a significant impact on the Company’s previous accounting for impairment of financial assets.
Effective January 1, 2018, the Company’s accounting policy for impairment of financial assets is as follows:
At each reporting date, on a forward looking basis, the Company assesses the expected credit losses associated with its debt instruments carried at amortized cost. For trade accounts receivable, the Company applies the simplified approach permitted by IFRS 9, which requires expected lifetime losses to be recognized from initial recognition of the receivables. Credit risk is assessed based on the number of days the receivable has been outstanding and an internal credit assessment of the customer. Credit risk for longer-term receivables is assessed based on an internal credit assessment and where available, an external credit rating of the counterparty.
3. EXPLORATION AND EVALUATION ASSETS
Exploration and Production
Oil SandsMining and Upgrading Total
North
America North SeaOffshore
Africa
Cost
At December 31, 2017 $ 2,282 $ — $ 91 $ 259 $ 2,632Additions 50 — 6 — 56Transfers to property, plant and
equipment (29) — — — (29)At March 31, 2018 $ 2,303 $ — $ 97 $ 259 $ 2,659
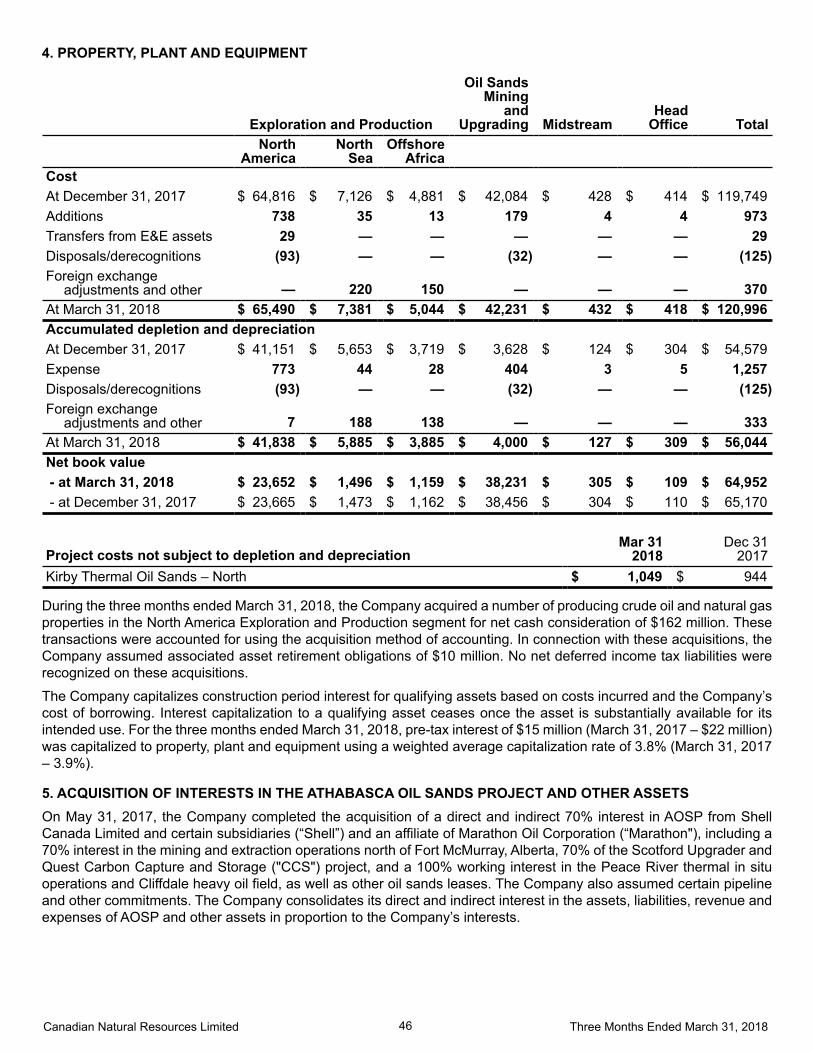
Canadian Natural Resources Limited 46 Three Months Ended March 31, 2018
4. PROPERTY, PLANT AND EQUIPMENT
Exploration and Production
Oil Sands Mining
and Upgrading Midstream
HeadOffice Total
North
AmericaNorth
SeaOffshore
Africa Cost
At December 31, 2017 $ 64,816 $ 7,126 $ 4,881 $ 42,084 $ 428 $ 414 $ 119,749Additions 738 35 13 179 4 4 973Transfers from E&E assets 29 — — — — — 29Disposals/derecognitions (93) — — (32) — — (125)Foreign exchange
adjustments and other — 220 150 — — — 370At March 31, 2018 $ 65,490 $ 7,381 $ 5,044 $ 42,231 $ 432 $ 418 $ 120,996Accumulated depletion and depreciation
At December 31, 2017 $ 41,151 $ 5,653 $ 3,719 $ 3,628 $ 124 $ 304 $ 54,579Expense 773 44 28 404 3 5 1,257Disposals/derecognitions (93) — — (32) — — (125)Foreign exchange
adjustments and other 7 188 138 — — — 333At March 31, 2018 $ 41,838 $ 5,885 $ 3,885 $ 4,000 $ 127 $ 309 $ 56,044Net book value - at March 31, 2018 $ 23,652 $ 1,496 $ 1,159 $ 38,231 $ 305 $ 109 $ 64,952 - at December 31, 2017 $ 23,665 $ 1,473 $ 1,162 $ 38,456 $ 304 $ 110 $ 65,170
Project costs not subject to depletion and depreciationMar 31
2018Dec 31
2017Kirby Thermal Oil Sands – North $ 1,049 $ 944
During the three months ended March 31, 2018, the Company acquired a number of producing crude oil and natural gas properties in the North America Exploration and Production segment for net cash consideration of $162 million. These transactions were accounted for using the acquisition method of accounting. In connection with these acquisitions, the Company assumed associated asset retirement obligations of $10 million. No net deferred income tax liabilities were recognized on these acquisitions.
The Company capitalizes construction period interest for qualifying assets based on costs incurred and the Company’s cost of borrowing. Interest capitalization to a qualifying asset ceases once the asset is substantially available for its intended use. For the three months ended March 31, 2018, pre-tax interest of $15 million (March 31, 2017 – $22 million) was capitalized to property, plant and equipment using a weighted average capitalization rate of 3.8% (March 31, 2017– 3.9%).
5. ACQUISITION OF INTERESTS IN THE ATHABASCA OIL SANDS PROJECT AND OTHER ASSETSOn May 31, 2017, the Company completed the acquisition of a direct and indirect 70% interest in AOSP from Shell Canada Limited and certain subsidiaries (“Shell”) and an affiliate of Marathon Oil Corporation (“Marathon"), including a 70% interest in the mining and extraction operations north of Fort McMurray, Alberta, 70% of the Scotford Upgrader and Quest Carbon Capture and Storage ("CCS") project, and a 100% working interest in the Peace River thermal in situ operations and Cliffdale heavy oil field, as well as other oil sands leases. The Company also assumed certain pipeline and other commitments. The Company consolidates its direct and indirect interest in the assets, liabilities, revenue and expenses of AOSP and other assets in proportion to the Company’s interests.
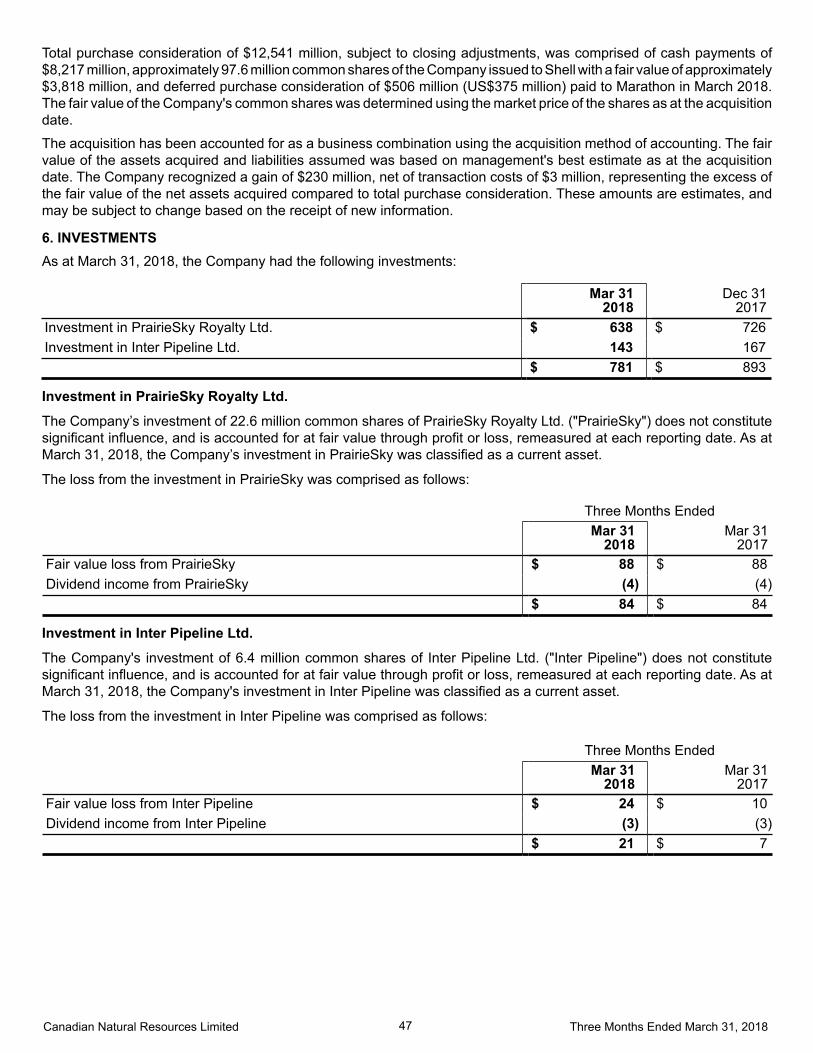
Canadian Natural Resources Limited 47 Three Months Ended March 31, 2018
Total purchase consideration of $12,541 million, subject to closing adjustments, was comprised of cash payments of $8,217 million, approximately 97.6 million common shares of the Company issued to Shell with a fair value of approximately $3,818 million, and deferred purchase consideration of $506 million (US$375 million) paid to Marathon in March 2018. The fair value of the Company's common shares was determined using the market price of the shares as at the acquisition date.
The acquisition has been accounted for as a business combination using the acquisition method of accounting. The fair value of the assets acquired and liabilities assumed was based on management's best estimate as at the acquisition date. The Company recognized a gain of $230 million, net of transaction costs of $3 million, representing the excess of the fair value of the net assets acquired compared to total purchase consideration. These amounts are estimates, and may be subject to change based on the receipt of new information.
6. INVESTMENTSAs at March 31, 2018, the Company had the following investments:
Mar 312018
Dec 312017
Investment in PrairieSky Royalty Ltd. $ 638 $ 726Investment in Inter Pipeline Ltd. 143 167
$ 781 $ 893
Investment in PrairieSky Royalty Ltd.
The Company’s investment of 22.6 million common shares of PrairieSky Royalty Ltd. ("PrairieSky") does not constitute significant influence, and is accounted for at fair value through profit or loss, remeasured at each reporting date. As at March 31, 2018, the Company’s investment in PrairieSky was classified as a current asset.
The loss from the investment in PrairieSky was comprised as follows:
Three Months EndedMar 31
2018Mar 31
2017Fair value loss from PrairieSky $ 88 $ 88Dividend income from PrairieSky (4) (4)
$ 84 $ 84
Investment in Inter Pipeline Ltd.
The Company's investment of 6.4 million common shares of Inter Pipeline Ltd. ("Inter Pipeline") does not constitute significant influence, and is accounted for at fair value through profit or loss, remeasured at each reporting date. As at March 31, 2018, the Company's investment in Inter Pipeline was classified as a current asset.
The loss from the investment in Inter Pipeline was comprised as follows:
Three Months EndedMar 31
2018Mar 31
2017Fair value loss from Inter Pipeline $ 24 $ 10Dividend income from Inter Pipeline (3) (3)
$ 21 $ 7
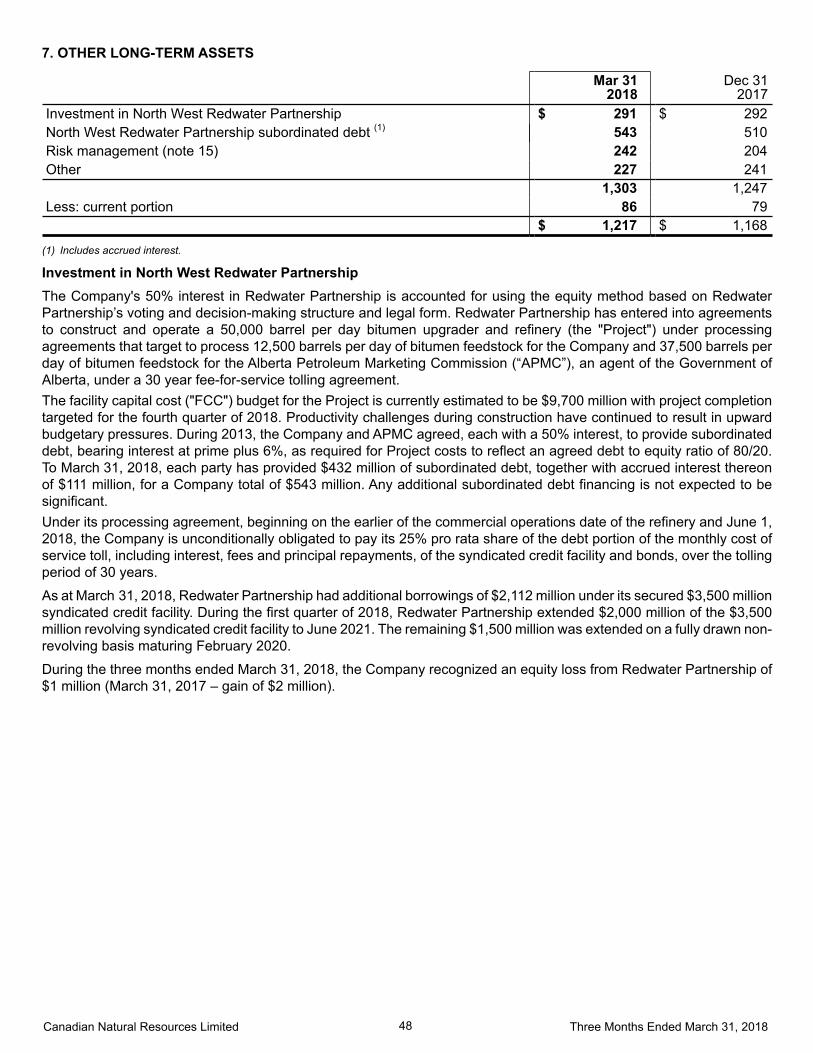
Canadian Natural Resources Limited 48 Three Months Ended March 31, 2018
7. OTHER LONG-TERM ASSETS
Mar 31
2018Dec 31
2017Investment in North West Redwater Partnership $ 291 $ 292North West Redwater Partnership subordinated debt (1) 543 510Risk management (note 15) 242 204Other 227 241 1,303 1,247Less: current portion 86 79 $ 1,217 $ 1,168
(1) Includes accrued interest.
Investment in North West Redwater PartnershipThe Company's 50% interest in Redwater Partnership is accounted for using the equity method based on Redwater Partnership’s voting and decision-making structure and legal form. Redwater Partnership has entered into agreements to construct and operate a 50,000 barrel per day bitumen upgrader and refinery (the "Project") under processing agreements that target to process 12,500 barrels per day of bitumen feedstock for the Company and 37,500 barrels per day of bitumen feedstock for the Alberta Petroleum Marketing Commission (“APMC”), an agent of the Government of Alberta, under a 30 year fee-for-service tolling agreement.The facility capital cost ("FCC") budget for the Project is currently estimated to be $9,700 million with project completion targeted for the fourth quarter of 2018. Productivity challenges during construction have continued to result in upward budgetary pressures. During 2013, the Company and APMC agreed, each with a 50% interest, to provide subordinated debt, bearing interest at prime plus 6%, as required for Project costs to reflect an agreed debt to equity ratio of 80/20. To March 31, 2018, each party has provided $432 million of subordinated debt, together with accrued interest thereon of $111 million, for a Company total of $543 million. Any additional subordinated debt financing is not expected to be significant.Under its processing agreement, beginning on the earlier of the commercial operations date of the refinery and June 1, 2018, the Company is unconditionally obligated to pay its 25% pro rata share of the debt portion of the monthly cost of service toll, including interest, fees and principal repayments, of the syndicated credit facility and bonds, over the tolling period of 30 years.
As at March 31, 2018, Redwater Partnership had additional borrowings of $2,112 million under its secured $3,500 million syndicated credit facility. During the first quarter of 2018, Redwater Partnership extended $2,000 million of the $3,500 million revolving syndicated credit facility to June 2021. The remaining $1,500 million was extended on a fully drawn non-revolving basis maturing February 2020.
During the three months ended March 31, 2018, the Company recognized an equity loss from Redwater Partnership of $1 million (March 31, 2017 – gain of $2 million).
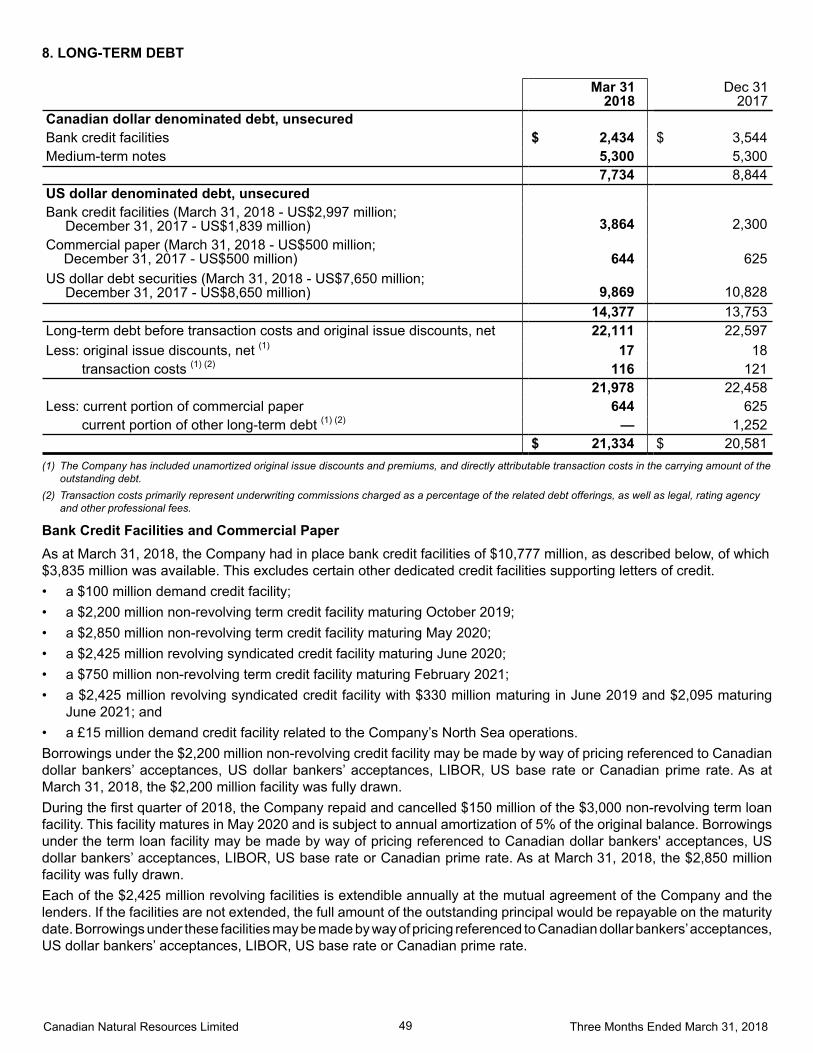
Canadian Natural Resources Limited 49 Three Months Ended March 31, 2018
8. LONG-TERM DEBT
Mar 31
2018Dec 31
2017Canadian dollar denominated debt, unsecured Bank credit facilities $ 2,434 $ 3,544Medium-term notes 5,300 5,300 7,734 8,844US dollar denominated debt, unsecured Bank credit facilities (March 31, 2018 - US$2,997 million; December 31, 2017 - US$1,839 million) 3,864 2,300Commercial paper (March 31, 2018 - US$500 million;
December 31, 2017 - US$500 million) 644 625US dollar debt securities (March 31, 2018 - US$7,650 million; December 31, 2017 - US$8,650 million) 9,869 10,828 14,377 13,753Long-term debt before transaction costs and original issue discounts, net 22,111 22,597Less: original issue discounts, net (1) 17 18
transaction costs (1) (2) 116 121 21,978 22,458Less: current portion of commercial paper 644 625
current portion of other long-term debt (1) (2) — 1,252 $ 21,334 $ 20,581
(1) The Company has included unamortized original issue discounts and premiums, and directly attributable transaction costs in the carrying amount of the outstanding debt.
(2) Transaction costs primarily represent underwriting commissions charged as a percentage of the related debt offerings, as well as legal, rating agency and other professional fees.
Bank Credit Facilities and Commercial PaperAs at March 31, 2018, the Company had in place bank credit facilities of $10,777 million, as described below, of which $3,835 million was available. This excludes certain other dedicated credit facilities supporting letters of credit. • a $100 million demand credit facility;• a $2,200 million non-revolving term credit facility maturing October 2019;• a $2,850 million non-revolving term credit facility maturing May 2020;• a $2,425 million revolving syndicated credit facility maturing June 2020;• a $750 million non-revolving term credit facility maturing February 2021;• a $2,425 million revolving syndicated credit facility with $330 million maturing in June 2019 and $2,095 maturing
June 2021; and• a £15 million demand credit facility related to the Company’s North Sea operations.Borrowings under the $2,200 million non-revolving credit facility may be made by way of pricing referenced to Canadian dollar bankers’ acceptances, US dollar bankers’ acceptances, LIBOR, US base rate or Canadian prime rate. As at March 31, 2018, the $2,200 million facility was fully drawn.During the first quarter of 2018, the Company repaid and cancelled $150 million of the $3,000 non-revolving term loan facility. This facility matures in May 2020 and is subject to annual amortization of 5% of the original balance. Borrowings under the term loan facility may be made by way of pricing referenced to Canadian dollar bankers' acceptances, US dollar bankers’ acceptances, LIBOR, US base rate or Canadian prime rate. As at March 31, 2018, the $2,850 million facility was fully drawn.Each of the $2,425 million revolving facilities is extendible annually at the mutual agreement of the Company and the lenders. If the facilities are not extended, the full amount of the outstanding principal would be repayable on the maturity date. Borrowings under these facilities may be made by way of pricing referenced to Canadian dollar bankers’ acceptances, US dollar bankers’ acceptances, LIBOR, US base rate or Canadian prime rate.
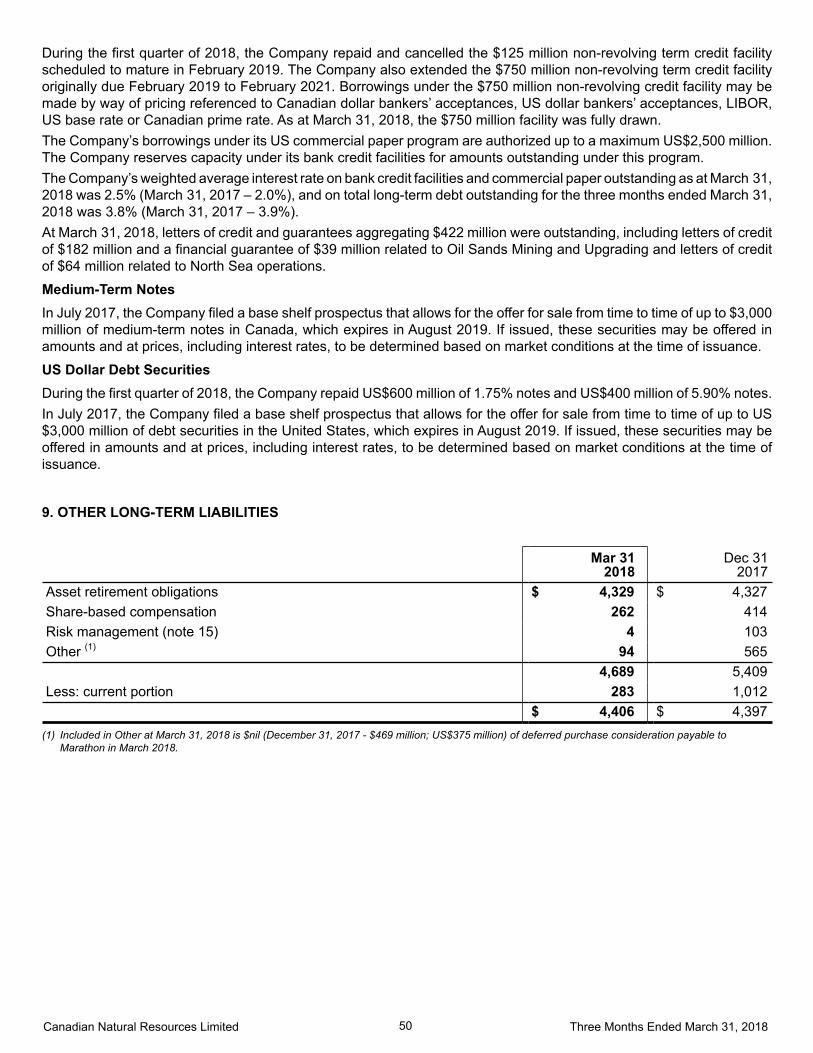
Canadian Natural Resources Limited 50 Three Months Ended March 31, 2018
During the first quarter of 2018, the Company repaid and cancelled the $125 million non-revolving term credit facility scheduled to mature in February 2019. The Company also extended the $750 million non-revolving term credit facility originally due February 2019 to February 2021. Borrowings under the $750 million non-revolving credit facility may be made by way of pricing referenced to Canadian dollar bankers’ acceptances, US dollar bankers’ acceptances, LIBOR, US base rate or Canadian prime rate. As at March 31, 2018, the $750 million facility was fully drawn.The Company’s borrowings under its US commercial paper program are authorized up to a maximum US$2,500 million. The Company reserves capacity under its bank credit facilities for amounts outstanding under this program.The Company’s weighted average interest rate on bank credit facilities and commercial paper outstanding as at March 31, 2018 was 2.5% (March 31, 2017 – 2.0%), and on total long-term debt outstanding for the three months ended March 31, 2018 was 3.8% (March 31, 2017 – 3.9%).At March 31, 2018, letters of credit and guarantees aggregating $422 million were outstanding, including letters of credit of $182 million and a financial guarantee of $39 million related to Oil Sands Mining and Upgrading and letters of credit of $64 million related to North Sea operations.
Medium-Term NotesIn July 2017, the Company filed a base shelf prospectus that allows for the offer for sale from time to time of up to $3,000 million of medium-term notes in Canada, which expires in August 2019. If issued, these securities may be offered in amounts and at prices, including interest rates, to be determined based on market conditions at the time of issuance.
US Dollar Debt SecuritiesDuring the first quarter of 2018, the Company repaid US$600 million of 1.75% notes and US$400 million of 5.90% notes. In July 2017, the Company filed a base shelf prospectus that allows for the offer for sale from time to time of up to US$3,000 million of debt securities in the United States, which expires in August 2019. If issued, these securities may be offered in amounts and at prices, including interest rates, to be determined based on market conditions at the time of issuance.
9. OTHER LONG-TERM LIABILITIES
Mar 31
2018Dec 31
2017Asset retirement obligations $ 4,329 $ 4,327Share-based compensation 262 414Risk management (note 15) 4 103Other (1) 94 565 4,689 5,409Less: current portion 283 1,012 $ 4,406 $ 4,397
(1) Included in Other at March 31, 2018 is $nil (December 31, 2017 - $469 million; US$375 million) of deferred purchase consideration payable to Marathon in March 2018.

Canadian Natural Resources Limited 51 Three Months Ended March 31, 2018
Asset Retirement ObligationsThe Company’s asset retirement obligations are expected to be settled on an ongoing basis over a period of approximately 60 years and have been discounted using a weighted average discount rate of 4.7% (December 31, 2017 – 4.7%). Reconciliations of the discounted asset retirement obligations were as follows:
Mar 31
2018Dec 31
2017Balance – beginning of period $ 4,327 $ 3,243
Liabilities incurred 6 12Liabilities acquired, net 10 784Liabilities settled (90) (274)Asset retirement obligation accretion 46 164Revision of cost, inflation rates and timing estimates — (40)Change in discount rate — 509Foreign exchange adjustments 30 (71)
Balance – end of period 4,329 4,327Less: current portion 78 92 $ 4,251 $ 4,235
Share-Based CompensationAs the Company’s Option Plan provides current employees with the right to elect to receive common shares or a cash payment in exchange for stock options surrendered, a liability for potential cash settlements is recognized. The current portion of the liability represents the maximum amount of the liability payable within the next twelve month period if all vested stock options are surrendered.
Mar 31
2018Dec 31
2017Balance – beginning of period $ 414 $ 426
Share-based compensation (recovery) expense (88) 134Cash payment for stock options surrendered (2) (6)Transferred to common shares (49) (154)(Recovered from) charged to Oil Sands Mining and Upgrading, net (13) 14
Balance – end of period 262 414Less: current portion 201 348 $ 61 $ 66
Included within share-based compensation recovery at March 31, 2018 was an expense of $1 million (March 31, 2017- $1 million) related to performance share units granted to certain executive employees.
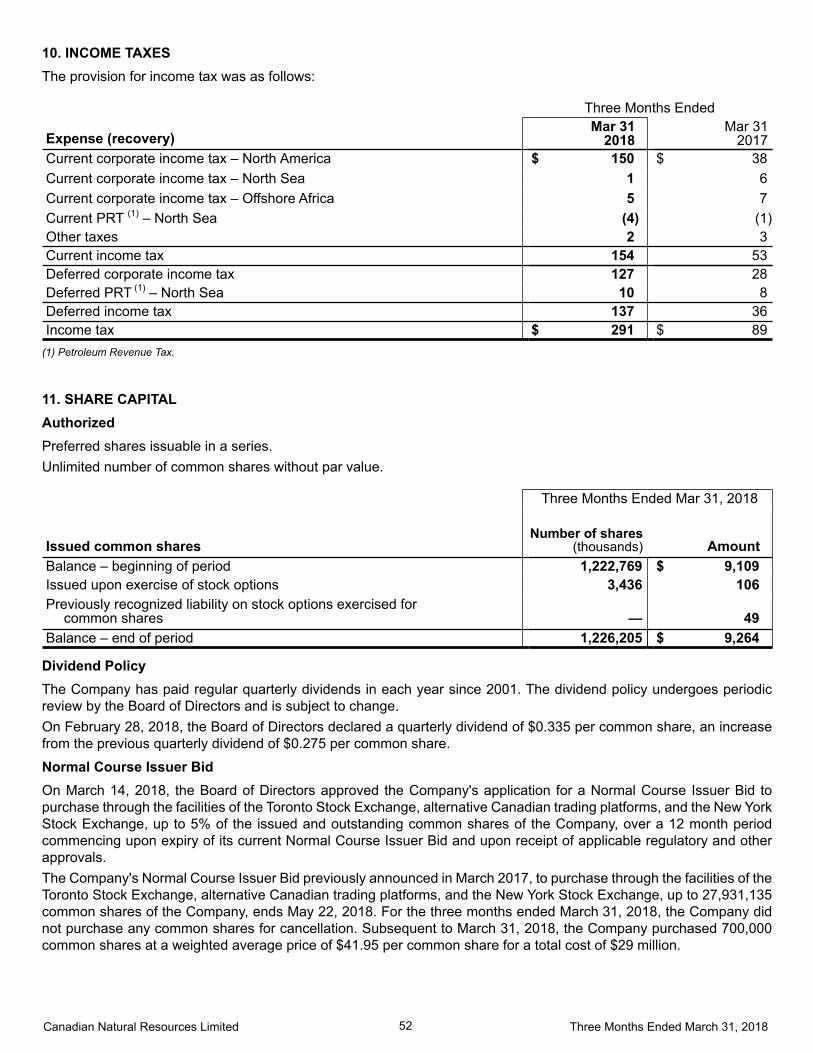
Canadian Natural Resources Limited 52 Three Months Ended March 31, 2018
10. INCOME TAXESThe provision for income tax was as follows:
Three Months Ended
Expense (recovery)Mar 31
2018Mar 31
2017Current corporate income tax – North America $ 150 $ 38Current corporate income tax – North Sea 1 6Current corporate income tax – Offshore Africa 5 7Current PRT (1) – North Sea (4) (1)Other taxes 2 3Current income tax 154 53Deferred corporate income tax 127 28Deferred PRT (1) – North Sea 10 8Deferred income tax 137 36Income tax $ 291 $ 89
(1) Petroleum Revenue Tax.
11. SHARE CAPITALAuthorizedPreferred shares issuable in a series.Unlimited number of common shares without par value.
Three Months Ended Mar 31, 2018
Issued common sharesNumber of shares
(thousands) AmountBalance – beginning of period 1,222,769 $ 9,109Issued upon exercise of stock options 3,436 106Previously recognized liability on stock options exercised for
common shares — 49Balance – end of period 1,226,205 $ 9,264
Dividend PolicyThe Company has paid regular quarterly dividends in each year since 2001. The dividend policy undergoes periodic review by the Board of Directors and is subject to change.On February 28, 2018, the Board of Directors declared a quarterly dividend of $0.335 per common share, an increase from the previous quarterly dividend of $0.275 per common share.
Normal Course Issuer BidOn March 14, 2018, the Board of Directors approved the Company's application for a Normal Course Issuer Bid to purchase through the facilities of the Toronto Stock Exchange, alternative Canadian trading platforms, and the New York Stock Exchange, up to 5% of the issued and outstanding common shares of the Company, over a 12 month period commencing upon expiry of its current Normal Course Issuer Bid and upon receipt of applicable regulatory and other approvals.The Company's Normal Course Issuer Bid previously announced in March 2017, to purchase through the facilities of the Toronto Stock Exchange, alternative Canadian trading platforms, and the New York Stock Exchange, up to 27,931,135 common shares of the Company, ends May 22, 2018. For the three months ended March 31, 2018, the Company did not purchase any common shares for cancellation. Subsequent to March 31, 2018, the Company purchased 700,000 common shares at a weighted average price of $41.95 per common share for a total cost of $29 million.
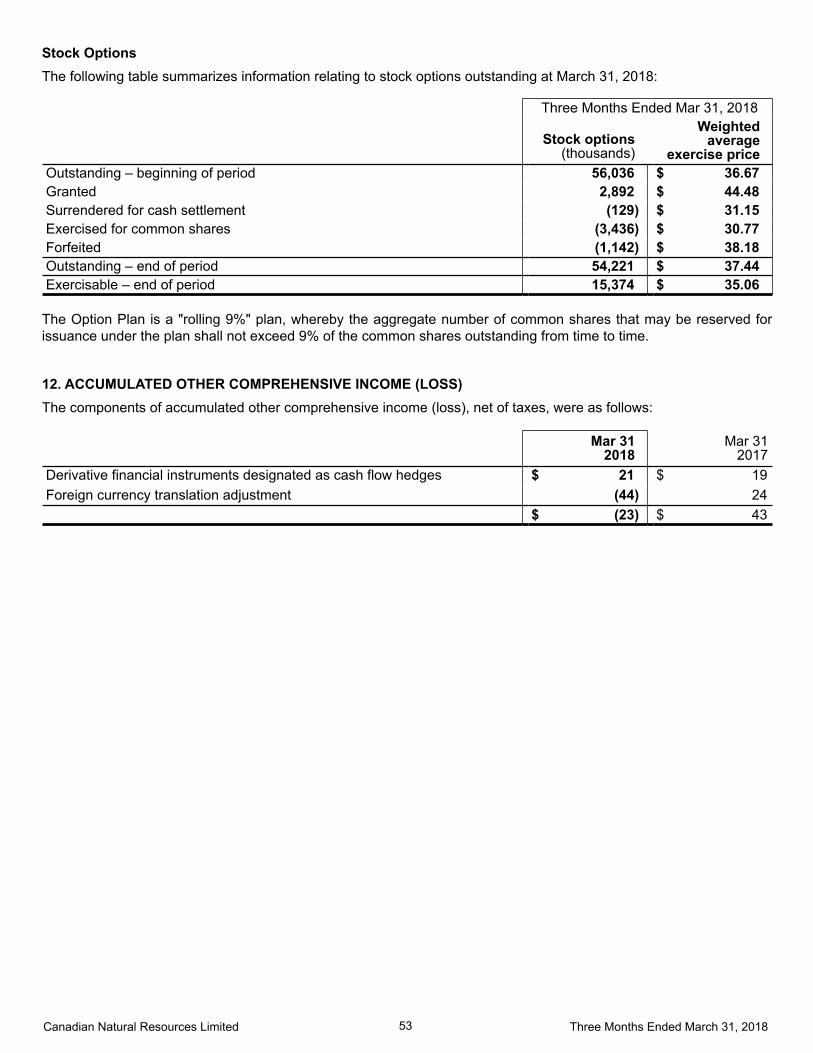
Canadian Natural Resources Limited 53 Three Months Ended March 31, 2018
Stock OptionsThe following table summarizes information relating to stock options outstanding at March 31, 2018:
Three Months Ended Mar 31, 2018
Stock options
(thousands)
Weighted average
exercise priceOutstanding – beginning of period 56,036 $ 36.67Granted 2,892 $ 44.48Surrendered for cash settlement (129) $ 31.15Exercised for common shares (3,436) $ 30.77Forfeited (1,142) $ 38.18Outstanding – end of period 54,221 $ 37.44Exercisable – end of period 15,374 $ 35.06
The Option Plan is a "rolling 9%" plan, whereby the aggregate number of common shares that may be reserved for issuance under the plan shall not exceed 9% of the common shares outstanding from time to time.
12. ACCUMULATED OTHER COMPREHENSIVE INCOME (LOSS)The components of accumulated other comprehensive income (loss), net of taxes, were as follows:
Mar 31
2018Mar 31
2017Derivative financial instruments designated as cash flow hedges $ 21 $ 19Foreign currency translation adjustment (44) 24 $ (23) $ 43

Canadian Natural Resources Limited 54 Three Months Ended March 31, 2018
13. CAPITAL DISCLOSURESThe Company does not have any externally imposed regulatory capital requirements for managing capital. The Company has defined its capital to mean its long-term debt and consolidated shareholders’ equity, as determined at each reporting date.The Company’s objectives when managing its capital structure are to maintain financial flexibility and balance to enable the Company to access capital markets to sustain its on-going operations and to support its growth strategies. The Company primarily monitors capital on the basis of an internally derived financial measure referred to as its "debt to book capitalization ratio", which is the arithmetic ratio of net current and long-term debt divided by the sum of the carrying value of shareholders’ equity plus net current and long-term debt. The Company’s internal targeted range for its debt to book capitalization ratio is 25% to 45%. This range may be exceeded in periods when a combination of capital projects, acquisitions, or lower commodity prices occurs. The Company may be below the low end of the targeted range when cash flow from operating activities is greater than current investment activities. At March 31, 2018, the ratio was within the target range at 40.5%.Readers are cautioned that the debt to book capitalization ratio is not defined by IFRS and this financial measure may not be comparable to similar measures presented by other companies. Further, there are no assurances that the Company will continue to use this measure to monitor capital or will not alter the method of calculation of this measure in the future.
Mar 31
2018Dec 31
2017Long-term debt, net (1) $ 21,826 $ 22,321Total shareholders’ equity $ 32,026 $ 31,653Debt to book capitalization 40.5% 41.4%
(1) Includes the current portion of long-term debt, net of cash and cash equivalents.
14. NET EARNINGS PER COMMON SHARE
Three Months Ended
Mar 31
2018Mar 31
2017Weighted average common shares outstanding
– basic (thousands of shares) 1,225,618 1,112,939Effect of dilutive stock options (thousands of shares) 5,718 8,337Weighted average common shares outstanding
– diluted (thousands of shares) 1,231,336 1,121,276Net earnings $ 583 $ 245Net earnings per common share – basic $ 0.48 $ 0.22 – diluted $ 0.47 $ 0.22
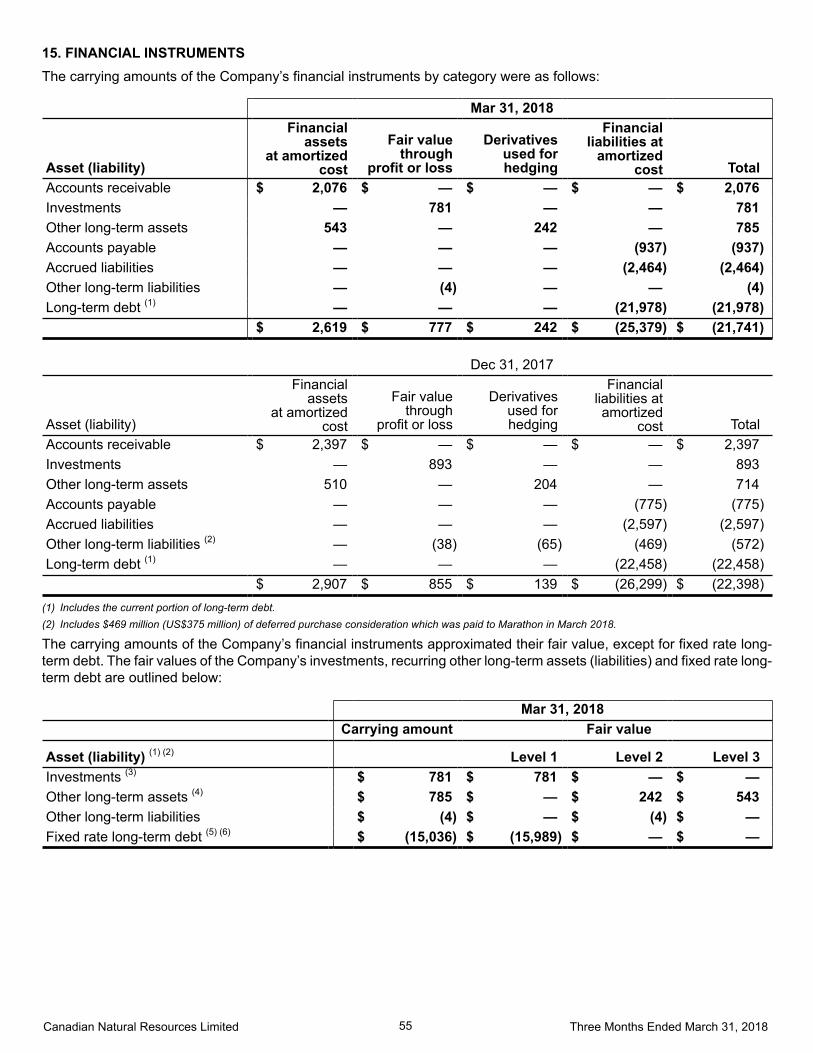
Canadian Natural Resources Limited 55 Three Months Ended March 31, 2018
15. FINANCIAL INSTRUMENTSThe carrying amounts of the Company’s financial instruments by category were as follows:
Mar 31, 2018
Asset (liability)
Financial assets
at amortized cost
Fair value through
profit or loss
Derivatives used for hedging
Financial liabilities at
amortizedcost Total
Accounts receivable $ 2,076 $ — $ — $ — $ 2,076Investments — 781 — — 781Other long-term assets 543 — 242 — 785Accounts payable — — — (937) (937)Accrued liabilities — — — (2,464) (2,464)Other long-term liabilities — (4) — — (4)Long-term debt (1) — — — (21,978) (21,978) $ 2,619 $ 777 $ 242 $ (25,379) $ (21,741)
Dec 31, 2017
Asset (liability)
Financial assets
at amortized cost
Fair value through
profit or loss
Derivatives used for hedging
Financial liabilities at amortized
cost TotalAccounts receivable $ 2,397 $ — $ — $ — $ 2,397Investments — 893 — — 893Other long-term assets 510 — 204 — 714Accounts payable — — — (775) (775)Accrued liabilities — — — (2,597) (2,597)Other long-term liabilities (2) — (38) (65) (469) (572)Long-term debt (1) — — — (22,458) (22,458) $ 2,907 $ 855 $ 139 $ (26,299) $ (22,398)
(1) Includes the current portion of long-term debt.(2) Includes $469 million (US$375 million) of deferred purchase consideration which was paid to Marathon in March 2018.
The carrying amounts of the Company’s financial instruments approximated their fair value, except for fixed rate long-term debt. The fair values of the Company’s investments, recurring other long-term assets (liabilities) and fixed rate long-term debt are outlined below:
Mar 31, 2018 Carrying amount Fair value
Asset (liability) (1) (2) Level 1 Level 2 Level 3Investments (3) $ 781 $ 781 $ — $ —Other long-term assets (4) $ 785 $ — $ 242 $ 543Other long-term liabilities $ (4) $ — $ (4) $ —Fixed rate long-term debt (5) (6) $ (15,036) $ (15,989) $ — $ —
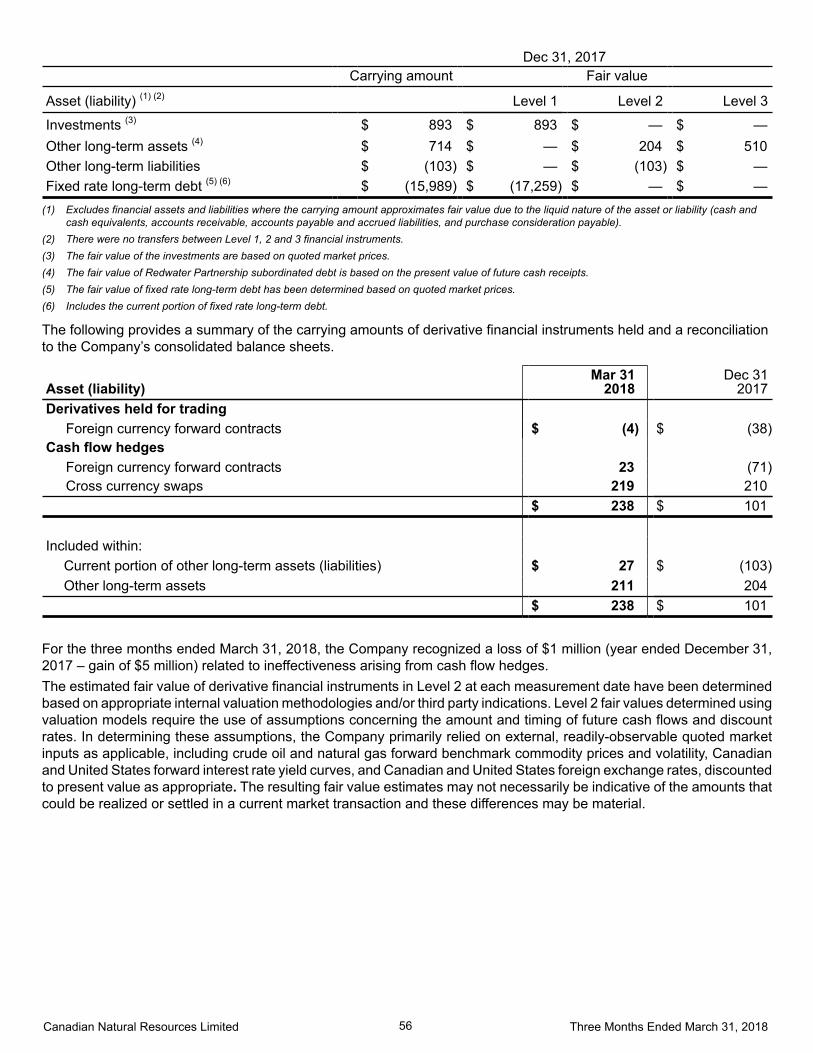
Canadian Natural Resources Limited 56 Three Months Ended March 31, 2018
Dec 31, 2017 Carrying amount Fair value
Asset (liability) (1) (2) Level 1 Level 2 Level 3
Investments (3) $ 893 $ 893 $ — $ —Other long-term assets (4) $ 714 $ — $ 204 $ 510Other long-term liabilities $ (103) $ — $ (103) $ —Fixed rate long-term debt (5) (6) $ (15,989) $ (17,259) $ — $ —
(1) Excludes financial assets and liabilities where the carrying amount approximates fair value due to the liquid nature of the asset or liability (cash and cash equivalents, accounts receivable, accounts payable and accrued liabilities, and purchase consideration payable).
(2) There were no transfers between Level 1, 2 and 3 financial instruments.(3) The fair value of the investments are based on quoted market prices.(4) The fair value of Redwater Partnership subordinated debt is based on the present value of future cash receipts.(5) The fair value of fixed rate long-term debt has been determined based on quoted market prices.(6) Includes the current portion of fixed rate long-term debt.
The following provides a summary of the carrying amounts of derivative financial instruments held and a reconciliation to the Company’s consolidated balance sheets.
Asset (liability)Mar 31
2018Dec 31
2017Derivatives held for trading
Foreign currency forward contracts $ (4) $ (38)Cash flow hedges
Foreign currency forward contracts 23 (71)Cross currency swaps 219 210
$ 238 $ 101
Included within:
Current portion of other long-term assets (liabilities) $ 27 $ (103)Other long-term assets 211 204
$ 238 $ 101
For the three months ended March 31, 2018, the Company recognized a loss of $1 million (year ended December 31, 2017 – gain of $5 million) related to ineffectiveness arising from cash flow hedges.The estimated fair value of derivative financial instruments in Level 2 at each measurement date have been determined based on appropriate internal valuation methodologies and/or third party indications. Level 2 fair values determined using valuation models require the use of assumptions concerning the amount and timing of future cash flows and discount rates. In determining these assumptions, the Company primarily relied on external, readily-observable quoted market inputs as applicable, including crude oil and natural gas forward benchmark commodity prices and volatility, Canadian and United States forward interest rate yield curves, and Canadian and United States foreign exchange rates, discounted to present value as appropriate. The resulting fair value estimates may not necessarily be indicative of the amounts that could be realized or settled in a current market transaction and these differences may be material.
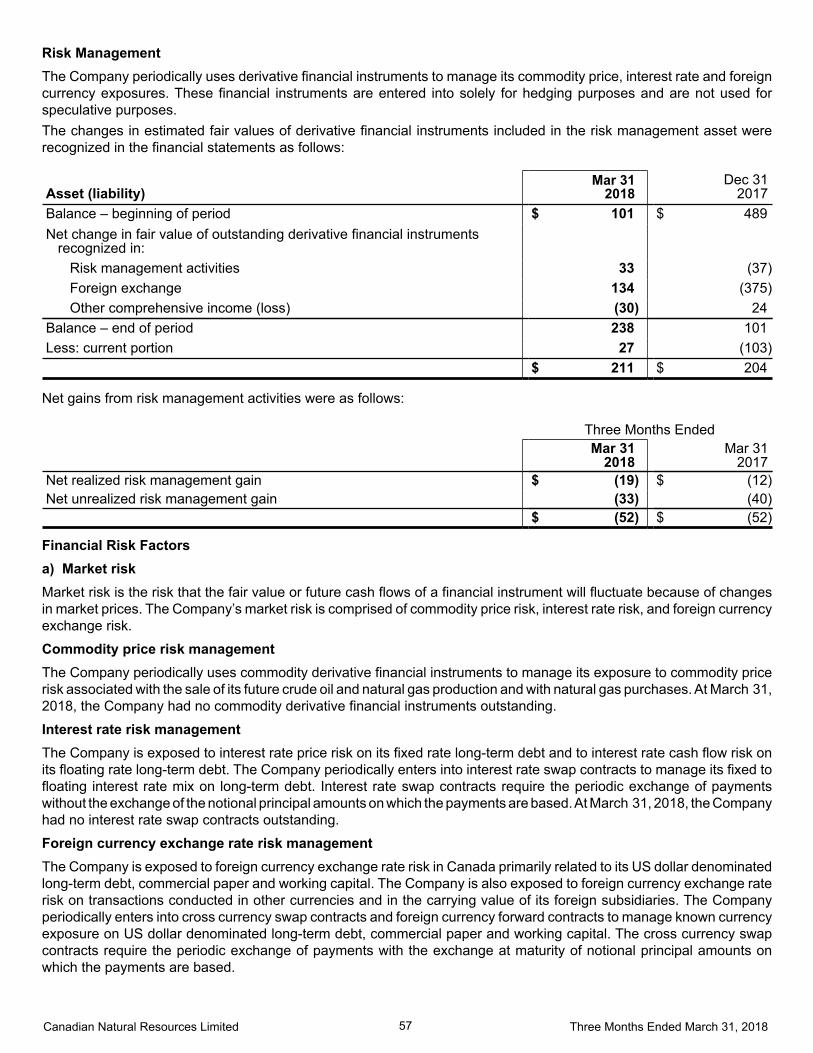
Canadian Natural Resources Limited 57 Three Months Ended March 31, 2018
Risk ManagementThe Company periodically uses derivative financial instruments to manage its commodity price, interest rate and foreign currency exposures. These financial instruments are entered into solely for hedging purposes and are not used for speculative purposes.The changes in estimated fair values of derivative financial instruments included in the risk management asset were recognized in the financial statements as follows:
Asset (liability)Mar 31
2018Dec 31
2017Balance – beginning of period $ 101 $ 489Net change in fair value of outstanding derivative financial instruments
recognized in:
Risk management activities 33 (37)Foreign exchange 134 (375)Other comprehensive income (loss) (30) 24
Balance – end of period 238 101Less: current portion 27 (103) $ 211 $ 204
Net gains from risk management activities were as follows:
Three Months Ended
Mar 31
2018Mar 31
2017Net realized risk management gain $ (19) $ (12)Net unrealized risk management gain (33) (40) $ (52) $ (52)
Financial Risk Factorsa) Market risk Market risk is the risk that the fair value or future cash flows of a financial instrument will fluctuate because of changes in market prices. The Company’s market risk is comprised of commodity price risk, interest rate risk, and foreign currency exchange risk.
Commodity price risk managementThe Company periodically uses commodity derivative financial instruments to manage its exposure to commodity price risk associated with the sale of its future crude oil and natural gas production and with natural gas purchases. At March 31, 2018, the Company had no commodity derivative financial instruments outstanding.
Interest rate risk managementThe Company is exposed to interest rate price risk on its fixed rate long-term debt and to interest rate cash flow risk on its floating rate long-term debt. The Company periodically enters into interest rate swap contracts to manage its fixed to floating interest rate mix on long-term debt. Interest rate swap contracts require the periodic exchange of payments without the exchange of the notional principal amounts on which the payments are based. At March 31, 2018, the Company had no interest rate swap contracts outstanding.
Foreign currency exchange rate risk managementThe Company is exposed to foreign currency exchange rate risk in Canada primarily related to its US dollar denominated long-term debt, commercial paper and working capital. The Company is also exposed to foreign currency exchange rate risk on transactions conducted in other currencies and in the carrying value of its foreign subsidiaries. The Company periodically enters into cross currency swap contracts and foreign currency forward contracts to manage known currency exposure on US dollar denominated long-term debt, commercial paper and working capital. The cross currency swap contracts require the periodic exchange of payments with the exchange at maturity of notional principal amounts on which the payments are based.
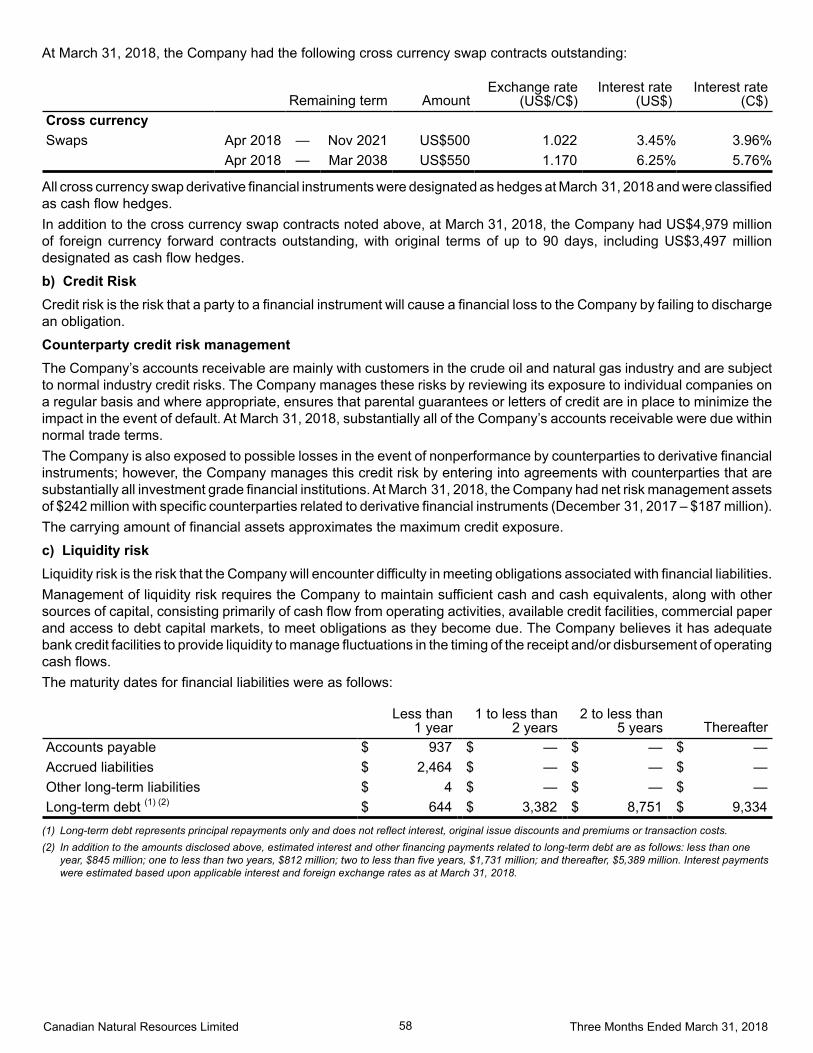
Canadian Natural Resources Limited 58 Three Months Ended March 31, 2018
At March 31, 2018, the Company had the following cross currency swap contracts outstanding:
Remaining term Amount
Exchange rate(US$/C$)
Interest rate(US$)
Interest rate(C$)
Cross currency
Swaps Apr 2018 — Nov 2021 US$500 1.022 3.45% 3.96% Apr 2018 — Mar 2038 US$550 1.170 6.25% 5.76%
All cross currency swap derivative financial instruments were designated as hedges at March 31, 2018 and were classified as cash flow hedges.In addition to the cross currency swap contracts noted above, at March 31, 2018, the Company had US$4,979 millionof foreign currency forward contracts outstanding, with original terms of up to 90 days, including US$3,497 million designated as cash flow hedges.
b) Credit RiskCredit risk is the risk that a party to a financial instrument will cause a financial loss to the Company by failing to discharge an obligation.
Counterparty credit risk management The Company’s accounts receivable are mainly with customers in the crude oil and natural gas industry and are subject to normal industry credit risks. The Company manages these risks by reviewing its exposure to individual companies on a regular basis and where appropriate, ensures that parental guarantees or letters of credit are in place to minimize the impact in the event of default. At March 31, 2018, substantially all of the Company’s accounts receivable were due within normal trade terms.The Company is also exposed to possible losses in the event of nonperformance by counterparties to derivative financial instruments; however, the Company manages this credit risk by entering into agreements with counterparties that are substantially all investment grade financial institutions. At March 31, 2018, the Company had net risk management assets of $242 million with specific counterparties related to derivative financial instruments (December 31, 2017 – $187 million).The carrying amount of financial assets approximates the maximum credit exposure.
c) Liquidity risk Liquidity risk is the risk that the Company will encounter difficulty in meeting obligations associated with financial liabilities.Management of liquidity risk requires the Company to maintain sufficient cash and cash equivalents, along with other sources of capital, consisting primarily of cash flow from operating activities, available credit facilities, commercial paper and access to debt capital markets, to meet obligations as they become due. The Company believes it has adequate bank credit facilities to provide liquidity to manage fluctuations in the timing of the receipt and/or disbursement of operating cash flows.The maturity dates for financial liabilities were as follows:
Less than
1 year1 to less than
2 years2 to less than
5 years ThereafterAccounts payable $ 937 $ — $ — $ —Accrued liabilities $ 2,464 $ — $ — $ —Other long-term liabilities $ 4 $ — $ — $ —Long-term debt (1) (2) $ 644 $ 3,382 $ 8,751 $ 9,334
(1) Long-term debt represents principal repayments only and does not reflect interest, original issue discounts and premiums or transaction costs.(2) In addition to the amounts disclosed above, estimated interest and other financing payments related to long-term debt are as follows: less than one
year, $845 million; one to less than two years, $812 million; two to less than five years, $1,731 million; and thereafter, $5,389 million. Interest payments were estimated based upon applicable interest and foreign exchange rates as at March 31, 2018.
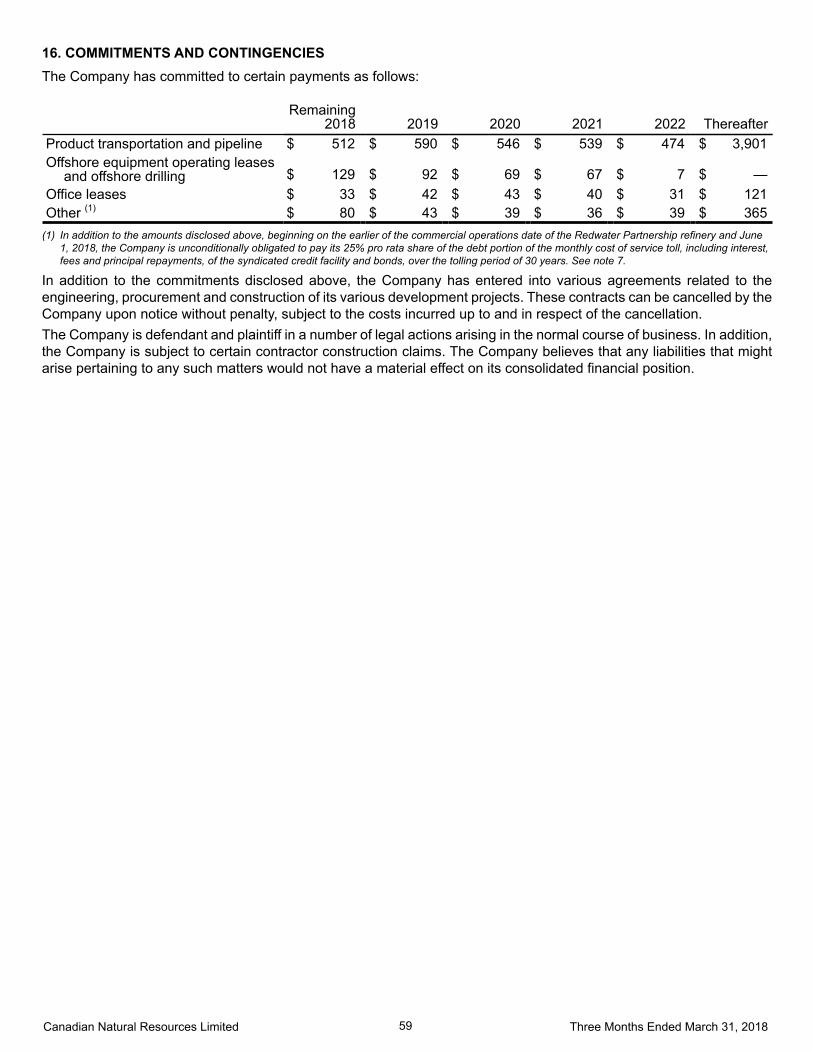
Canadian Natural Resources Limited 59 Three Months Ended March 31, 2018
16. COMMITMENTS AND CONTINGENCIESThe Company has committed to certain payments as follows:
Remaining
2018 2019 2020 2021 2022 ThereafterProduct transportation and pipeline $ 512 $ 590 $ 546 $ 539 $ 474 $ 3,901Offshore equipment operating leases
and offshore drilling $ 129 $ 92 $ 69 $ 67 $ 7 $ —Office leases $ 33 $ 42 $ 43 $ 40 $ 31 $ 121Other (1) $ 80 $ 43 $ 39 $ 36 $ 39 $ 365
(1) In addition to the amounts disclosed above, beginning on the earlier of the commercial operations date of the Redwater Partnership refinery and June 1, 2018, the Company is unconditionally obligated to pay its 25% pro rata share of the debt portion of the monthly cost of service toll, including interest, fees and principal repayments, of the syndicated credit facility and bonds, over the tolling period of 30 years. See note 7.
In addition to the commitments disclosed above, the Company has entered into various agreements related to the engineering, procurement and construction of its various development projects. These contracts can be cancelled by the Company upon notice without penalty, subject to the costs incurred up to and in respect of the cancellation.The Company is defendant and plaintiff in a number of legal actions arising in the normal course of business. In addition, the Company is subject to certain contractor construction claims. The Company believes that any liabilities that might arise pertaining to any such matters would not have a material effect on its consolidated financial position.
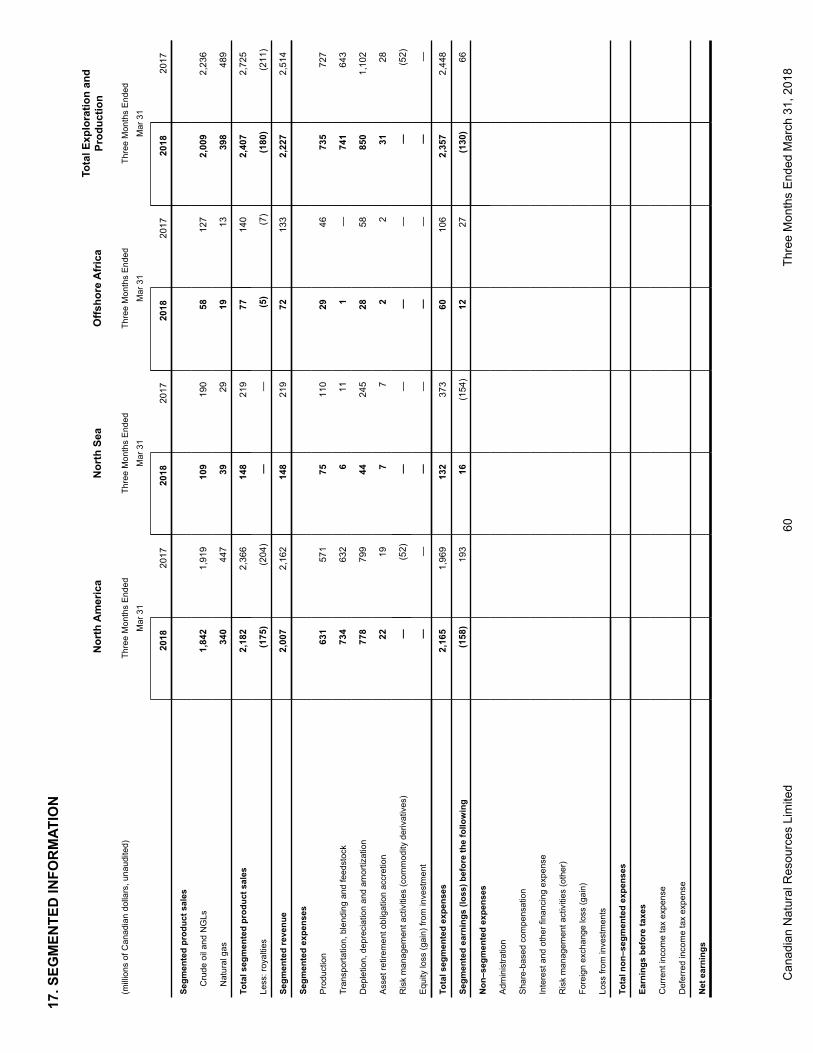
Can
adia
n N
atur
al R
esou
rces
Lim
ited
60Th
ree
Mon
ths
End
ed M
arch
31,
201
8
17. S
EGM
ENTE
D IN
FOR
MAT
ION
Nor
th A
mer
ica
Nor
th S
eaO
ffsho
re A
fric
aTo
tal E
xplo
ratio
n an
dPr
oduc
tion
(mill
ions
of C
anad
ian
dolla
rs, u
naud
ited)
Thre
e M
onth
s E
nded
Thre
e M
onth
s E
nded
Thre
e M
onth
s E
nded
Thre
e M
onth
s E
nded
Mar
31
Mar
31
Mar
31
Mar
31
20
1820
1720
1820
1720
1820
1720
1820
17
Segm
ente
d pr
oduc
t sal
es
Cru
de o
il an
d N
GLs
1,84
21,
919
109
190
5812
72,
009
2,23
6
Nat
ural
gas
340
447
3929
1913
398
489
Tota
l seg
men
ted
prod
uct s
ales
2,18
22,
366
148
219
7714
02,
407
2,72
5
Less
: roy
altie
s(1
75)
(204
)—
—(5
)(7
)(1
80)
(211
)
Segm
ente
d re
venu
e2,
007
2,16
214
821
972
133
2,22
72,
514
Segm
ente
d ex
pens
es
Pro
duct
ion
631
571
7511
029
4673
572
7
Tran
spor
tatio
n, b
lend
ing
and
feed
stoc
k73
463
26
111
—74
164
3
Dep
letio
n, d
epre
ciat
ion
and
amor
tizat
ion
778
799
4424
528
5885
01,
102
Ass
et re
tirem
ent o
blig
atio
n ac
cret
ion
2219
77
22
3128
Ris
k m
anag
emen
t act
iviti
es (c
omm
odity
der
ivat
ives
)—
(52)
——
——
—(5
2)
Equ
ity lo
ss (g
ain)
from
inve
stm
ent
——
——
——
——
Tota
l seg
men
ted
expe
nses
2,16
51,
969
132
373
6010
62,
357
2,44
8
Segm
ente
d ea
rnin
gs (l
oss)
bef
ore
the
follo
win
g(1
58)
193
16(1
54)
1227
(130
)66
Non
–seg
men
ted
expe
nses
Adm
inis
tratio
n
Sha
re-b
ased
com
pens
atio
n
Inte
rest
and
oth
er fi
nanc
ing
expe
nse
Ris
k m
anag
emen
t act
iviti
es (o
ther
)
Fore
ign
exch
ange
loss
(gai
n)
Loss
from
inve
stm
ents
Tota
l non
–seg
men
ted
expe
nses
Earn
ings
bef
ore
taxe
s
Cur
rent
inco
me
tax
expe
nse
Def
erre
d in
com
e ta
x ex
pens
e
Net
ear
ning
s
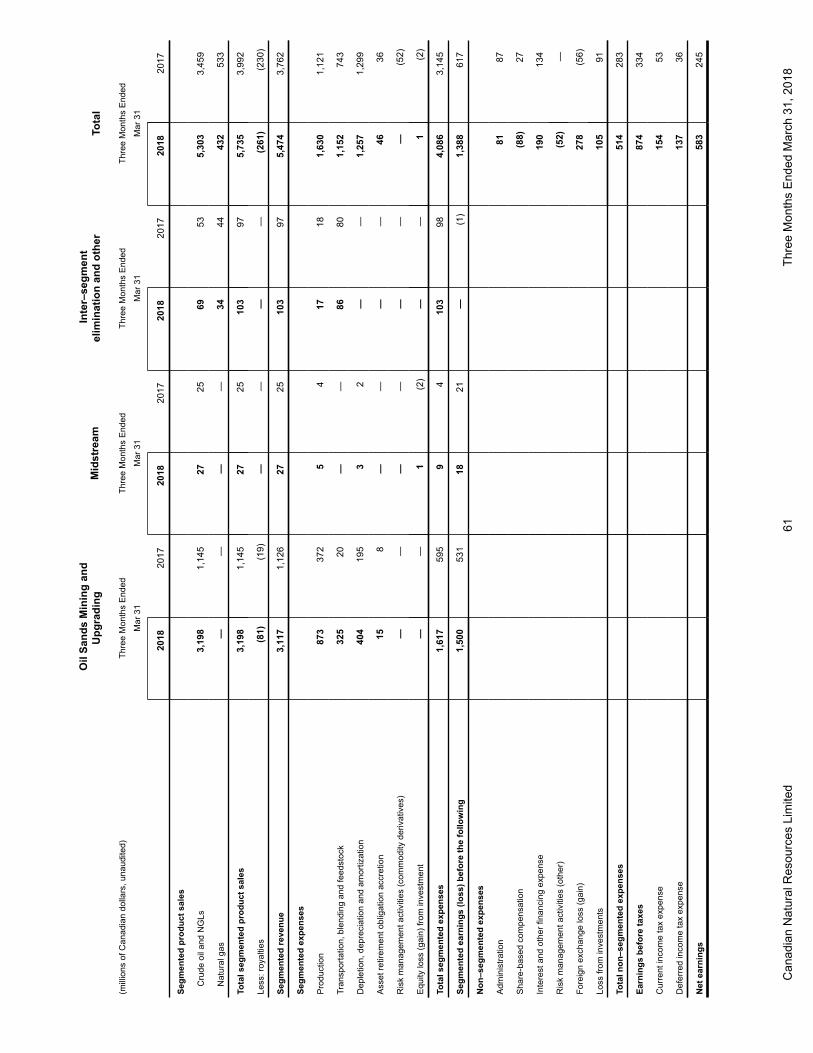
Can
adia
n N
atur
al R
esou
rces
Lim
ited
61Th
ree
Mon
ths
End
ed M
arch
31,
201
8
Oil
Sand
s M
inin
g an
dU
pgra
ding
Mid
stre
am In
ter–
segm
ent
elim
inat
ion
and
othe
r
Tota
l
(mill
ions
of C
anad
ian
dolla
rs, u
naud
ited)
Thre
e M
onth
s E
nded
Thre
e M
onth
s E
nded
Thre
e M
onth
s E
nded
Thre
e M
onth
s E
nded
Mar
31
Mar
31
Mar
31
Mar
31
20
1820
1720
1820
1720
1820
1720
1820
17
Segm
ente
d pr
oduc
t sal
es
Cru
de o
il an
d N
GLs
3,19
81,
145
2725
6953
5,30
33,
459
Nat
ural
gas
——
——
3444
432
533
Tota
l seg
men
ted
prod
uct s
ales
3,19
81,
145
2725
103
975,
735
3,99
2
Less
: roy
altie
s(8
1)(1
9)—
——
—(2
61)
(230
)
Segm
ente
d re
venu
e3,
117
1,12
627
2510
397
5,47
43,
762
Segm
ente
d ex
pens
es
Pro
duct
ion
873
372
54
1718
1,63
01,
121
Tran
spor
tatio
n, b
lend
ing
and
feed
stoc
k32
520
——
8680
1,15
274
3
Dep
letio
n, d
epre
ciat
ion
and
amor
tizat
ion
404
195
32
——
1,25
71,
299
Ass
et re
tirem
ent o
blig
atio
n ac
cret
ion
158
——
——
4636
Ris
k m
anag
emen
t act
iviti
es (c
omm
odity
der
ivat
ives
)—
——
——
——
(52)
Equ
ity lo
ss (g
ain)
from
inve
stm
ent
——
1(2
)—
—1
(2)
Tota
l seg
men
ted
expe
nses
1,61
759
59
410
398
4,08
63,
145
Segm
ente
d ea
rnin
gs (l
oss)
bef
ore
the
follo
win
g1,
500
531
1821
—(1
)1,
388
617
Non
–seg
men
ted
expe
nses
Adm
inis
tratio
n81
87
Sha
re-b
ased
com
pens
atio
n(8
8)27
Inte
rest
and
oth
er fi
nanc
ing
expe
nse
190
134
Ris
k m
anag
emen
t act
iviti
es (o
ther
)(5
2)—
Fore
ign
exch
ange
loss
(gai
n)27
8(5
6)
Loss
from
inve
stm
ents
105
91
Tota
l non
–seg
men
ted
expe
nses
514
283
Earn
ings
bef
ore
taxe
s87
433
4
Cur
rent
inco
me
tax
expe
nse
154
53
Def
erre
d in
com
e ta
x ex
pens
e 13
736
Net
ear
ning
s58
324
5
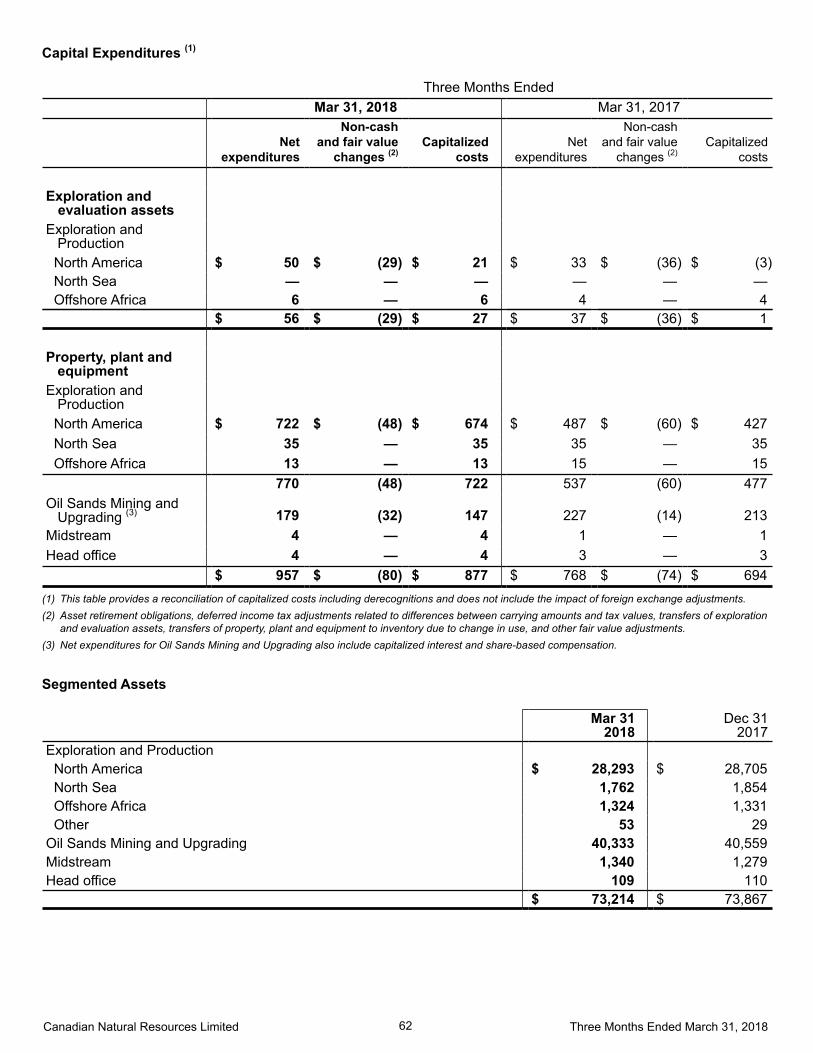
Canadian Natural Resources Limited 62 Three Months Ended March 31, 2018
Capital Expenditures (1)
Three Months Ended Mar 31, 2018 Mar 31, 2017
Net
expenditures
Non-cashand fair value
changes (2)Capitalized
costsNet
expenditures
Non-cashand fair value
changes (2)Capitalized
costs
Exploration andevaluation assets
Exploration and Production
North America $ 50 $ (29) $ 21 $ 33 $ (36) $ (3)North Sea — — — — — —Offshore Africa 6 — 6 4 — 4
$ 56 $ (29) $ 27 $ 37 $ (36) $ 1
Property, plant and equipment
Exploration and Production
North America $ 722 $ (48) $ 674 $ 487 $ (60) $ 427North Sea 35 — 35 35 — 35Offshore Africa 13 — 13 15 — 15
770 (48) 722 537 (60) 477Oil Sands Mining and Upgrading (3) 179 (32) 147 227 (14) 213Midstream 4 — 4 1 — 1Head office 4 — 4 3 — 3 $ 957 $ (80) $ 877 $ 768 $ (74) $ 694
(1) This table provides a reconciliation of capitalized costs including derecognitions and does not include the impact of foreign exchange adjustments.(2) Asset retirement obligations, deferred income tax adjustments related to differences between carrying amounts and tax values, transfers of exploration
and evaluation assets, transfers of property, plant and equipment to inventory due to change in use, and other fair value adjustments.(3) Net expenditures for Oil Sands Mining and Upgrading also include capitalized interest and share-based compensation.
Segmented Assets
Mar 31
2018Dec 31
2017Exploration and Production
North America $ 28,293 $ 28,705North Sea 1,762 1,854Offshore Africa 1,324 1,331Other 53 29
Oil Sands Mining and Upgrading 40,333 40,559Midstream 1,340 1,279Head office 109 110 $ 73,214 $ 73,867
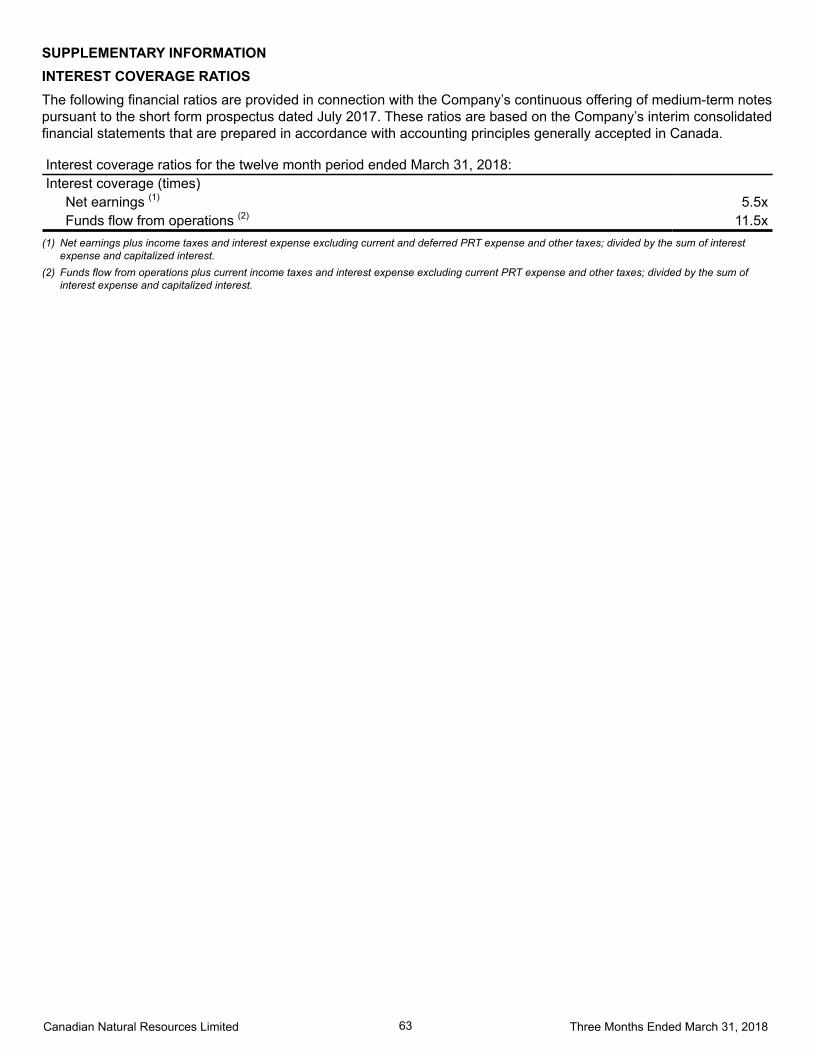
Canadian Natural Resources Limited 63 Three Months Ended March 31, 2018
SUPPLEMENTARY INFORMATIONINTEREST COVERAGE RATIOSThe following financial ratios are provided in connection with the Company’s continuous offering of medium-term notes pursuant to the short form prospectus dated July 2017. These ratios are based on the Company’s interim consolidated financial statements that are prepared in accordance with accounting principles generally accepted in Canada.
Interest coverage ratios for the twelve month period ended March 31, 2018:Interest coverage (times)
Net earnings (1) 5.5x Funds flow from operations (2) 11.5x
(1) Net earnings plus income taxes and interest expense excluding current and deferred PRT expense and other taxes; divided by the sum of interest expense and capitalized interest.
(2) Funds flow from operations plus current income taxes and interest expense excluding current PRT expense and other taxes; divided by the sum of interest expense and capitalized interest.

Canadian Natural Resources Limited 64 Three Months Ended March 31, 2018
This Page Left Intentionally Blank

Canadian Natural Resources Limited 65 Three Months Ended March 31, 2018
This Page Left Intentionally Blank

Canadian Natural Resources Limited 66 Three Months Ended March 31, 2018
This Page Left Intentionally Blank

Canadian Natural Resources Limited 67 Three Months Ended March 31, 2018
Corporate Information
Board of Directors
Catherine M. Best, FCA, ICD.D
N. Murray Edwards, O.C.
Timothy W. Faithful
Christopher L. Fong
Ambassador Gordon D. Giffin
Wilfred A. Gobert
Steve W. Laut
Tim S. McKay
Honourable Frank J. McKenna, P.C., O.C., O.N.B., Q.C.
David A. Tuer
Annette Verschuren, O.C.
OfficersN. Murray EdwardsExecutive Chairman of the Board of Directors
Steve W. LautExecutive Vice-Chairman
Tim S. McKayPresident
Darren M. FichterChief Operating Officer, Exploration and Production
Scott G. StauthChief Operating Officer, Oil Sands
Corey B. BieberChief Financial Officer and Senior Vice-President, Finance
Troy J.P. AndersenSenior Vice-President, Canadian Conventional Field Operations
Trevor J. CassidySenior Vice-President, Thermal
Réal M. CussonSenior Vice-President, Marketing
Allan E. FrankiwSenior Vice-President, Production
Jay E. FrocSenior Vice-President, Oil Sands Mining and Upgrading
Ron K. LaingSenior Vice-President, Corporate Development and Land
Pamela A. McIntyreSenior Vice-President, Safety, Risk Management & Innovation
Bill R. PetersonSenior Vice-President, Development Operations
Ken W. StaggSenior Vice-President, Exploration
Robin S. ZabekSenior Vice-President, Exploitation
Paul M. MendesVice-President, Legal, General Counsel and Corporate Secretary
Betty YeeVice-President, Land
CNR International (U.K.) LimitedAberdeen, Scotland
David. B. WhitehouseVice-President and Managing Director, International
Barry DuncanVice-President, Finance, International
Andrew M. McBoyleVice-President, Exploitation, International
Stock ListingToronto Stock Exchange
Trading Symbol - CNQNew York Stock Exchange
Trading Symbol - CNQ
Registrar and Transfer Agent
Computershare Trust Company of CanadaCalgary, AlbertaToronto, Ontario
Computershare Investor Services LLCNew York, New York
Investor Relations
Telephone: (403) 514-7777Email: [email protected]

CANADIAN NATURAL RESOURCES LIMITED2100, 855 - 2nd Street S.W., Calgary, Alberta T2P 4J8
Telephone: (403) 517-6700 Facsimile: (403) 517-7350Website: www.cnrl.com
Printed in Canada