Alibaba Group Announces March Quarter and Full Fiscal Year ...
48
1 Alibaba Group Announces March Quarter and Full Fiscal Year 2022 Results Hangzhou, China, May 26, 2022 – Alibaba Group Holding Limited (NYSE: BABA and HKEX: 9988, “Alibaba” or “Alibaba Group”) today announced its financial results for the quarter and fiscal year ended March 31, 2022. “Alibaba delivered on the goal of serving one billion annual active consumers in China this past quarter and achieved a record RMB 8,317 billion in global GMV for the fiscal year. Despite macro challenges that impacted supply chains and consumer sentiment, we continued to focus on customer value proposition and building the capabilities to deliver value. We saw tangible progress across our businesses, especially in operational improvements in key strategic areas,” said Daniel Zhang, Chairman and Chief Executive Officer of Alibaba Group. “Looking ahead, we will continue to execute on our multi-engine growth strategy by strengthening our digital infrastructure and focusing on quality growth to create long-term value for our customers, shareholders and other stakeholders across our ecosystem.” “We delivered healthy results this quarter with revenue growth of 9% year-over-year. Total revenue for the fiscal year grew 19% year-over-year, despite a challenging macro environment. Our continued investments in strategic initiatives have generated promising growth momentum and improved operating efficiency,” said Toby Xu, Chief Financial Officer of Alibaba Group. “Looking ahead to fiscal year 2023, we will firmly focus on generating sustainable, high-quality revenue growth and optimizing our operating cost structure to enhance overall return amidst these uncertain times.” BUSINESS HIGHLIGHTS In the quarter ended March 31, 2022: • Revenue was RMB204,052 million (US$32,188 million), an increase of 9% year-over-year that was primarily driven by the revenue growth of the China commerce segment by 8% year-over-year to RMB140,330 million (US$22,137 million), Local consumer services segment by 29% year-over- year to RMB10,445 million (US$1,647 million) and Cloud segment by 12% year-over-year to RMB18,971 million (US$2,993 million). • Annual active consumers of Alibaba Group across the world reached approximately 1.31 billion for the twelve months ended March 31, 2022, an increase of 28.3 million from the twelve months ended December 31, 2021. This included over 1 billion consumers in China, a historic milestone, and 305 million consumers overseas, representing quarterly net increases of approximately 24.6 million and 3.7 million, respectively, and annual net increases of 113 million and 64 million, respectively. • Income from operations was RMB16,717 million (US$2,637 million), compared to a loss from operations of RMB7,663 million in the same quarter of 2021. Excluding one-off and certain other items as identified in “March Quarter Operational and Financial Results” below, income from operations would have decreased by RMB6,894 million year-over-year primarily due to our increased investments in Taocaicai and Taobao Deals, the continued impact of COVID-19 as well as asset impairment and special provisions made by Sun Art. Adjusted EBITA, a non-GAAP measurement, decreased 30% or RMB6,801 million year-over-year to RMB15,811 million (US$2,494 million).
-
Upload
khangminh22 -
Category
Documents
-
view
1 -
download
0
Transcript of Alibaba Group Announces March Quarter and Full Fiscal Year ...
1
Alibaba Group Announces March Quarter and Full Fiscal Year 2022 Results
Hangzhou, China, May 26, 2022 – Alibaba Group Holding Limited (NYSE: BABA and HKEX: 9988,
“Alibaba” or “Alibaba Group”) today announced its financial results for the quarter and fiscal year ended
March 31, 2022.
“Alibaba delivered on the goal of serving one billion annual active consumers in China this past quarter and
achieved a record RMB 8,317 billion in global GMV for the fiscal year. Despite macro challenges that
impacted supply chains and consumer sentiment, we continued to focus on customer value proposition and
building the capabilities to deliver value. We saw tangible progress across our businesses, especially in
operational improvements in key strategic areas,” said Daniel Zhang, Chairman and Chief Executive Officer
of Alibaba Group. “Looking ahead, we will continue to execute on our multi-engine growth strategy by
strengthening our digital infrastructure and focusing on quality growth to create long-term value for our
customers, shareholders and other stakeholders across our ecosystem.”
“We delivered healthy results this quarter with revenue growth of 9% year-over-year. Total revenue for the
fiscal year grew 19% year-over-year, despite a challenging macro environment. Our continued investments
in strategic initiatives have generated promising growth momentum and improved operating efficiency,”
said Toby Xu, Chief Financial Officer of Alibaba Group. “Looking ahead to fiscal year 2023, we will firmly
focus on generating sustainable, high-quality revenue growth and optimizing our operating cost structure to
enhance overall return amidst these uncertain times.”
BUSINESS HIGHLIGHTS
In the quarter ended March 31, 2022:
• Revenue was RMB204,052 million (US$32,188 million), an increase of 9% year-over-year that was
primarily driven by the revenue growth of the China commerce segment by 8% year-over-year to
RMB140,330 million (US$22,137 million), Local consumer services segment by 29% year-over-
year to RMB10,445 million (US$1,647 million) and Cloud segment by 12% year-over-year to
RMB18,971 million (US$2,993 million).
• Annual active consumers of Alibaba Group across the world reached approximately 1.31 billion for
the twelve months ended March 31, 2022, an increase of 28.3 million from the twelve months ended
December 31, 2021. This included over 1 billion consumers in China, a historic milestone, and 305
million consumers overseas, representing quarterly net increases of approximately 24.6 million and
3.7 million, respectively, and annual net increases of 113 million and 64 million, respectively.
• Income from operations was RMB16,717 million (US$2,637 million), compared to a loss from
operations of RMB7,663 million in the same quarter of 2021. Excluding one-off and certain other
items as identified in “March Quarter Operational and Financial Results” below, income from
operations would have decreased by RMB6,894 million year-over-year primarily due to our
increased investments in Taocaicai and Taobao Deals, the continued impact of COVID-19 as well as
asset impairment and special provisions made by Sun Art. Adjusted EBITA, a non-GAAP
measurement, decreased 30% or RMB6,801 million year-over-year to RMB15,811 million
(US$2,494 million).

2
• Net loss attributable to ordinary shareholders was RMB16,241 million (US$2,562 million) and
net loss was RMB18,357 million (US$2,896 million), primarily due to decreases in the market prices
of our equity investments in publicly-traded companies, which we excluded from our non-GAAP
measures, partly offset by income from operations. Non-GAAP net income was RMB19,799
million (US$3,123 million), a decrease of 24% year-over-year.
• Diluted loss per ADS was RMB6.07 (US$0.96) and diluted loss per share was RMB0.76 (US$0.12
or HK$0.94). Non-GAAP diluted earnings per ADS was RMB7.95 (US$1.25), a decrease of 23%
year-over-year and non-GAAP diluted earnings per share was RMB0.99 (US$0.16 or HK$1.22), a
decrease of 23% year-over-year.
• Net cash used in operating activities was RMB7,040 million (US$1,111 million). Free cash flow,
a non-GAAP measurement of liquidity, was an outflow of RMB15,070 million (US$2,377 million),
compared to an outflow of RMB658 million in the same quarter of 2021, mainly due to the payment
of the final installment of RMB9,114 million (US$1,438 million) of the RMB18,228 million fine
levied by China’s State Administration for Market Regulation pursuant to China’s Anti-monopoly
Law (the “Anti-monopoly Fine”), and a decrease in profit.
In the fiscal year ended March 31, 2022:
• Revenue was RMB853,062 million (US$134,567 million), an increase of 19% year-over-year that
was primarily driven by the revenue growth of the China commerce segment by 18% year-over-year
to RMB592,705 million (US$93,497 million), Cloud segment by 23% year-over-year to RMB74,568
million (US$11,763 million) and International commerce segment by 25% year-over-year to
RMB61,078 million (US$9,635 million). Excluding the consolidation of Sun Art, our revenue would
have grown 14% year-over-year to RMB770,734 million (US$121,580 million).
• Income from operations was RMB69,638 million (US$10,985 million), a decrease of 22% year-
over-year. Excluding one-off and certain other items as identified in “Full Fiscal Year Operational
and Financial Results” below, income from operations would have decreased by RMB41,683 million
year-over-year, primarily due to our increased investments in Taobao Deals and Taocaicai, our
increased spending for user growth, as well as our support to merchants. Adjusted EBITA, a non-
GAAP measurement, decreased 23% or RMB40,056 million year-over-year to RMB130,397 million
(US$20,570 million).
• Net income attributable to ordinary shareholders was RMB61,959 million (US$9,774 million) and net income was RMB47,079 million (US$7,427 million), showing year-over-year decreases of
59% and 67%, respectively, primarily due to the net losses arising from decreases in the market
prices of our equity investments in publicly-traded companies, compared to net gains from these
investments in last year, which we excluded from our non-GAAP measures. Non-GAAP net income
was RMB136,388 million (US$21,515 million), a decrease of 21% year-over-year.
• Diluted earnings per ADS was RMB22.74 (US$3.59) and diluted earnings per share was
RMB2.84 (US$0.45 or HK$3.50). Non-GAAP diluted earnings per ADS was RMB52.69
(US$8.31), a decrease of 19% year-over-year and non-GAAP diluted earnings per share was
RMB6.59 (US$1.04 or HK$8.13), a decrease of 19% year-over-year.
• Net cash provided by operating activities was RMB142,759 million (US$22,520 million), a
decrease of 38% compared to RMB231,786 million in fiscal year 2021. Free cash flow, a non-
GAAP measurement, was RMB98,874 million (US$15,597 million), a decrease of 43% year-over-
year from RMB172,662 million in fiscal year 2021, mainly due to a decrease in profit and the full
payment in the amount of RMB18,228 million of the Anti-monopoly Fine.

3
Reconciliations of GAAP measures to non-GAAP measures presented above are included at the end of this
results announcement.
BUSINESS AND STRATEGIC UPDATES
Alibaba Group
For the twelve months ended March 31, 2022, our global consumer-facing businesses served approximately
1.31 billion annual active consumers and generated RMB8,317 billion (US$1,312 billion) in GMV. Our
China consumer-facing businesses, including those in China commerce, Local consumer services and
Digital media and entertainment segments, generated GMV of approximately RMB7,976 billion (US$1,258
billion). The combined annual active consumers, after de-duplication, of our consumer-facing businesses in
China reached a historic milestone of over 1 billion, up approximately 113 million year-over-year and
slightly exceeded our target for fiscal year 2022. Our International commerce retail business, which mainly
include Lazada, AliExpress, Trendyol and Daraz, generated GMV of approximately US$54 billion
(RMB341 billion) and served 305 million annual active consumers in the twelve months ended March 31,
2022.
Our digital infrastructure, such as smart logistics and cloud computing, which enables and underpins our
major commerce, local services and entertainment businesses, equips us with unique technology-driven
capabilities to meet changing consumer demand and help our enterprise customers and partners achieve
digital transformation in China and internationally. We are committed to investing and developing these
digital infrastructure businesses, which we believe will support sustainable growth and yield attractive
returns on investment over the long term.
China Commerce
For the twelve months ended March 31, 2022, our China commerce segment had a combined 903 million
annual active consumers, representing annual and quarterly net increases of 89 million and 21 million,
respectively. The solid consumer growth for the segment reflected the successful execution of our multi-app
strategy to create personalized, immersive and engaging experiences for different consumption scenarios
and formats, which help attract and retain users of different demographics and shopping behaviors to our
commerce ecosystem. The percentage of new annual active consumers from less developed areas continued
to be over 70% in fiscal year 2022 and was higher compared to fiscal year 2021.
Taobao and Tmall are an important part of Chinese consumers’ everyday lives and continue to achieve high
consumer retention. In fiscal year 2022, more than 124 million annual active consumers each spent over
RMB10,000 on Taobao and Tmall. Approximately 98% of annual active consumers who spent over
RMB10,000 on Taobao and Tmall in fiscal year 2021 continued to be active in fiscal year 2022. During the
year ended March 31, 2022, online physical goods GMV of Taobao and Tmall, excluding unpaid orders,
recorded year-over-year low single-digit growth. In the March quarter, the combined GMV growth of
January and February was flat, and the overall GMV of the quarter had a low single-digit decline, mainly
due to disruptions in supply chain and logistics, as well as demand softening, as a result of the impact of
COVID-19 in March.
Taobao Deals (淘特), our value-for-money platform, helped us drive more first-time shoppers into our e-
commerce ecosystem. For the twelve months ended March 31, 2022, annual active consumers on Taobao
Deals reached a milestone of over 300 million, a quarterly net increase of over 20 million. More than 20% of
these annual active consumers using Taobao Deals had not shopped on Taobao or Tmall in fiscal year 2022.
Importantly, Taobao Deals has successfully launched and executed several initiatives to optimize logistics
costs and improve delivery experience for consumers. During the fiscal year and quarter ended March 31,
2022, the number of paid orders on Taobao Deals grew rapidly at over 100% and 35% year-over-year,
respectively. The meaningful slowdown in order growth in the March 2022 quarter was due to the impact of
COVID-19.

4
In March 2021, we launched Taocaicai offering consumers next day pick-up service for grocery and daily
necessity products at neighborhood pick-up points. In fiscal year 2022, we successfully completed the
development of our core regional distribution centers and warehouse network for the Taocaicai business in
targeted regions and cities throughout China. For the twelve months ended March 31, 2022, Taocaicai had
over 90 million annual active consumers, of which more than 50% were first-time fresh produce buyers on
our various platforms. At the same time, Taocaicai’s unit economics continued to improve quarter-over-
quarter during the fiscal year, benefitting from higher order density and improving gross margin from
enhanced supply chain capabilities. In the March quarter, Taocaicai GMV continued to grow quarter-over-
quarter, primarily driven by improving average order value.
In fiscal year 2022, our direct sales and others revenue grew 43% year-over-year to RMB260,955 million
(US$41,165 million), primarily driven by Sun Art and robust growth of our Tmall Supermarket and
Freshippo businesses. Excluding the consolidation of Sun Art, direct sales and others revenue would have
grown 28% year-over-year in fiscal year 2022. These direct sales businesses enhance our product supply and
improve our service capabilities in various verticals, including fast-moving consumer goods (FMCG), fresh
produce and electronics and home appliances.
By leveraging our multiple direct sales businesses, we have developed diversified fulfillment networks and
are able to offer time-guaranteed delivery, same-day delivery, and next-day delivery in China. We have
significantly invested in same-city logistics and developed on-demand instant delivery capabilities for food,
grocery and other general merchandise. In fiscal year 2022, we added a next-day pick-up option for
customers who purchase grocery and FMCG products through our Taocaicai business. These logistics and
fulfilment models meeting various consumer needs form a comprehensive network that serves our self-
operated businesses and external merchants in multiple verticals. By leveraging our on-demand instant
delivery capability, the online portion of Sun Art’s revenue increased by five percentage points to 29%,
while Freshippo’s online GMV contribution remained at over 60% in fiscal year 2022. We believe that
continued investment in these fulfillment and logistics capabilities will better serve our e-commerce
platforms and our customers.
International Commerce
For the twelve months ended March 31, 2022, our International commerce segment had a combined 305
million annual active consumers, representing annual net increases of 64 million and quarterly net increase
of 4 million, respectively.
International Retail
Our International commerce retail businesses, mainly including the Lazada, AliExpress, Trendyol and Daraz
platforms, empower brands and merchants with localized market insights and serve local consumers through
wide product selection and improving delivery experience. In fiscal year 2022, the combined order growth
of these businesses was around 34% year-over-year. This reflected robust order growth of Lazada of 60%
and Trendyol of 68%, which was partially offset by flat order growth of AliExpress due to the European
Union’s removal of the value-added tax (“VAT”) exemption for cross-border parcels below €22, which took
effect in July 2021, as well as supply chain and logistics disruptions due to the Russia-Ukraine conflict.
Lazada continues to execute its localization strategy by increasing the assortment of local and global product
supply as well as offering value-added services, such as free shipping, which has resulted in strong order
growth as well as improved consumer mindshare.
During the March quarter, the combined order growth of these businesses was around 7% year-over-year,
driven by solid growth in Lazada of 32% and Trendyol of 48%, which was partially offset by order decline
of AliExpress due to the ongoing impact from the change in the European Union’s VAT rules as well as
supply chain and logistics disruptions due to the Russia-Ukraine conflict.
International Wholesale

5
In fiscal year 2022, our International commerce wholesale business exhibited robust growth of 46% year-
over-year in value of transactions completed on Alibaba.com, driven by solid export growth of goods from
China as well as increasing adoption of value-added services, such as global logistics and trade assurance,
by global buyers and sellers. The robust transaction value growth resulted in strong revenue growth of 28%
year-over-year, with value-added service revenue growing even faster at 38% year-over-year. During the
March quarter, transaction value growth on Alibaba.com slowed to 22% year-over-year primarily due to
slowing export growth in China as well as supply chain disruptions as a result of the impact of COVID-19.
Local Consumer Services
For the twelve months ended March 31, 2022, Local consumer services segment had approximately 376
million annual active consumers, representing a yearly net increase of 64 million and a quarterly net increase
of 4 million. For the fiscal year and quarter ended March 31, 2022, Local consumer services segment
generated year-over-year order volume growth of over 25% and approximately 9%, respectively. The slower
order volume growth for the March quarter was due to the impact of COVID-19 that started in March 2022.
To Home
In the first half of fiscal year 2022, Ele.me continued its investments in growing paying members and
enhancing consumer experience, which resulted in strong growth in annual active consumers and orders.
Building on this progress, starting from December quarter 2021, Ele.me has focused on improving user
retention and operating efficiency in strategic cities, which resulted in improving average order value during
the second half of fiscal year 2022. As part of our strategic initiative to diversify the category mix, non-
restaurant orders of Ele.me, such as grocery and pharmacy orders, grew strongly during fiscal year 2022
through situational marketing during various festivals and holidays. For the quarter ended March 31, 2022,
Ele.me enjoyed resilient GMV growth driven by higher average order value, partially offset by declining
orders in March due to the impact of COVID-19. During the quarter, Ele.me’s unit economics continued to
improve year-over-year, driven by optimized user acquisition spending and reduction in delivery cost per
order.
To Destination
In fiscal year 2022, order volume of “To Destination” businesses, which include Amap and Fliggy, grew
rapidly, primarily driven by the increasing number of transacting Amap users and increased usage
frequency. In fiscal year 2022, Amap continued to be successful in developing content and services that
resulted in higher user engagement and loyalty from consumers that sought to discover, connect with and
visit local merchants using the Amap app. For the quarter ended March 31, 2022, year-over-year order
growth decelerated for Amap and declined for Fliggy due to the impact of COVID-19.
Cainiao
In fiscal year 2022, revenue from Cainiao, before inter-segment elimination, grew 27% year-over-year to
RMB66,808 million (US$10,539 million), primarily driven by the increase in revenue from third-party
merchants of our cross-border e-commerce retail businesses as well as the growth of fulfillment solutions
and value-added services provided to our China commerce retail businesses. During the fiscal year, 69% of
Cainiao’s total revenue was generated from external customers. Revenue from Cainiao, after inter-segment
elimination, grew 24% year-over-year to RMB46,107 million (US$7,273 million).
Cainiao continues to expand its international logistics network by strengthening its end-to-end logistics
capabilities, including eHubs, line-haul, sorting centers and last-mile network. For the fiscal year ended
March 31, 2022, Cainiao’s daily average cross-border and international package volume exceeded 4.5
million. During the quarter ended March 31, 2022, Cainiao commenced operation of two new international
sorting centers, making a total of nine overseas sorting centers in operation. International eHubs in Kuala
Lumpur and Liege, which function as the customs clearance, warehousing and fulfilment centers for their
6
respective regions, officially commenced operation in November 2021 and were already running at near full
capacity in March 2022.
In China, Cainiao continues to scale its consumer logistics business by expanding its Cainiao Post network
to improve consumer experience and delivery efficiency, and penetrate into less developed areas, which
complements our China commerce businesses. For example, during the fiscal year, in partnership with
Taobao and Tmall businesses, Cainiao Post introduced additional value-added services (such as home
delivery options for consumers) which have gained rapid adoption throughout China. Additionally, Cainiao
continued to improve its end-to-end smart supply chain solutions for different industry verticals. For
example, in March 2022 quarter, the adoption of Cainiao’s end-to-end smart supply chain solutions for the
FMCG category in China continued to gain traction with revenue growth from external merchants
accelerating to over 30% year-over-year.
Cainiao also collaborates with DAMO Academy to research and develop advanced technologies to be
deployed in products and services to digitalize and enhance the efficiency of the logistics industry. For
example, Cainiao has been driving the adoption of our proprietary L4 self-driving vehicle Xiaomanlv (小蛮
驴) for unmanned delivery of parcels within gated communities and campuses. From inception through
March 31, 2022, Xiaomanlv had delivered over 10 million parcels, leading the industry of unmanned
neighborhood delivery.
Cloud
Our Cloud segment is comprised of Alibaba Cloud and DingTalk. For the twelve months ended March 31,
2022, total revenue from our Cloud segment before inter-segment elimination, which includes revenue from
services provided to other Alibaba businesses, was RMB100,180 million (US$15,803 million), an increase
of 21% year-over-year. Revenue after inter-segment elimination was approximately RMB74,568 million
(US$11,763 million) for fiscal year 2022, an increase of 23% year-over-year. Year-over-year revenue
growth moderated in fiscal year 2022 primarily because a top customer in the Internet industry gradually
phased out using our cloud services for its international business due to non-product related reasons as well
as slowing demand from customers in China’s Internet industry. Excluding revenue generated from this top
customer, our Cloud segment revenue after inter-segment elimination would have grown strongly at 29%
year-over-year during the twelve months ended March 31, 2022.
In the quarter ended March 31, 2022, revenue from our Cloud segment, after inter-segment elimination, was
RMB18,971 million (US$2,993 million), an increase of 12% year-over-year. Year-over-year revenue growth
of our Cloud segment was slower in March quarter compared to prior quarters, reflecting slowing economic
activities, softening demand from customers in China’s Internet industry and delays in delivery of hybrid
cloud projects due to the impact of COVID-19.
Importantly, our Cloud segment revenue is becoming more diversified with revenue contribution from non-
Internet industries steadily increasing. For fiscal year and quarter ended March 31, 2022, contribution of
Cloud revenue after inter-segment elimination from non-Internet industries was 50% and 52% , respectively.
Alibaba Cloud
Alibaba Cloud offers a comprehensive suite of cloud services to customers worldwide, including proprietary
servers, chips, elastic computing, storage, network, security, database and big data. We leverage these
capabilities and technologies to support businesses within Alibaba Group and provide our customers across
various verticals with industry-specific solutions, including those for financial services, telecommunications,
retail, and industrial applications. Alibaba Cloud continues to expand internationally with strong customer
growth. As of March 31, 2022, Alibaba Cloud offers computing services in 27 regions globally, adding new
Internet data centers in Indonesia, Philippines, South Korea, Thailand and Germany in fiscal year 2022.

7
Alibaba Cloud’s advantages are its proprietary technology and Alibaba Group’s continued commitment to
investing in research and development in new product offerings and industry-specific solutions for our
customers and partners. Highlights of our proprietary technologies in fiscal year 2022 include:
Data Centers and Hardware:
• Proprietary server technology: Alibaba Cloud possesses full-stack cloud infrastructure design
capabilities, covering data centers, network technologies and proprietary hardware. In fiscal year
2022, we unveiled our proprietary server series Panjiu (磐久), including high-performance
computing series, large-scale storage series, and high-performance storage series. Our server
series adopts a flexible modular design that allows separation of compute and storage, which
provides our customers the flexibility to meet varying demands of different business scenarios.
Our Panjiu server series integrates software and hardware to achieve outstanding performance in
computing, storage, and security to help our customers succeed in the cloud-native era.
Infrastructure as a Service (IaaS)
� IaaS leadership: According to the 2021 Gartner Solution Scorecard for integrated IaaS+PaaS
published in November 2021, Alibaba Cloud was recognized as the third highest scored solution
among all the global vendors evaluated. In a Gartner report published in April 2022, Alibaba
Cloud was ranked the biggest IaaS player in Asia Pacific and the third largest globally as
measured by revenue market share in 2021. Over the last four years, Alibaba Cloud has retained
its leadership position in Asia Pacific.
Platform as a Service (PaaS) and Solutions:
• Database: In fiscal year 2022, our Cloud business upgraded PolarDB to next-generation cloud
native technology, which meets our customers’ increasing demands and requirements for on-
demand storage, transaction processing and computation, elasticity and scalability.
DingTalk
DingTalk, our digital collaboration workplace and application development platform that offers new ways of
working, sharing and collaboration for modern enterprises and organizations, announced its strategy to help
our customers accelerate organization and business digitalization in fiscal year 2022.
As of March 31, 2022, DingTalk powered users from over 21 million organizations to stay connected and
work remotely. DingTalk is also committed to accelerating the digital transformation of enterprises by
serving as a platform to third parties to offer more digital products, solutions and services. As of March 31,
2022, over 3.5 million DingTalk applications had been developed and adopted by businesses and users.
Digital Media and Entertainment
In the March quarter, Youku’s daily average paying subscriber base increased 14% year-over-year, primarily
driven by quality content and continued contribution from our 88VIP membership program. Youku
continues to improve operational efficiency through disciplined investment in content and production
capability, which resulted in narrowing of losses year-over-year during the quarter.
ESG Updates
Collaboration in green technologies
We believe in an open and collaborative model that empowers the adoption of green technology and fosters
cooperative innovation among technology companies. We joined the Low Carbon Patent Pledge, an initiative
launched by a consortium of global technology companies that encourages the sharing of low carbon

8
technology patents, and have made nine key patents of green data center technology freely available to external
parties, including a unique “soaking server” cooling system that could lead to energy savings of over 70%
compared to traditional mechanical cooling.
Responding to the COVID-19 pandemic
Supporting the provisions of essential supplies to local communities
In the past quarter, as COVID-19 resurged in many cities in China, including Shanghai, we leveraged
our supply and logistics capabilities to help those in need.
• Increased manpower to support Shanghai: In April 2022, Sun Art, Freshippo and other
business units launched initiatives to support the supply and delivery of essential goods to
residents in Shanghai and dispatched thousands of couriers and frontline workers to Shanghai
from nearby cities.
• Ele.me: Ele.me launched the “group purchase + designated point delivery” service to meet
communities’ demand for daily necessities. Ele.me also offered special emergency delivery
services to vulnerable groups such as the elderly living alone, families with infants and young
children, the disabled and patients with acute illnesses. In Beijing, Ele.me strived to ensure 24-
hour delivery capability of key supermarkets.
• Freshippo: In Shanghai, Freshippo offered an emergency channel for group-purchase and self-
pickup orders and built large temporary warehouses to support local supply operations. With
each group order, Freshippo provided free supplies to the elderly in need or living alone.
• Sun Art: One RT-Mart store in Shanghai was temporarily converted into a fresh produce
warehouse, serving as a hub for other RT-Mart stores in the city. Sun Art also launched late
shopping services from 10:00 p.m. to 12:00 a.m. in Beijing.
• Cainiao: Cainiao built a logistics system that encompassed disaster preparedness management,
emergency transportation, and transit and distribution to deal with emergencies. Cainiao also
launched designated channels to facilitate delivery of daily necessities to senior care centers and
the elderly in Shanghai.
• Amap: Amap launched the “Map of PCR Test Sites” (核酸地图) function at the end of April,
2022. With this function, users can easily search for the locations and operating hours of nearby
test sites.
• Taobao and Tmall: Many small and medium enterprises have faced challenges during the
COVID-19 resurgence. Taobao and Tmall launched a series of targeted relief measures to help
merchants in Shanghai ease cash flow pressure, reduce operating costs and speed up resumption
of work and production.
Safeguarding employees and frontline workers
• Employees: The health and safety of our employees have always been our top priorities. We
provided care packages with food and daily necessities to employees and their families in
Shanghai, and set up online channels to offer physical and psychological health counselling.
9
• Frontline workers: Since March 2022, we have provided COVID-19 care packages, medical
coverage, quarantine allowances as well as 24/7 support to Ele.me delivery couriers and many
other frontline workers.
• Voluntary services: During the pandemic in Shanghai, approximately 4,500 of our employees
volunteered to participate in community services.
Share Repurchases
During the quarter ended March 31, 2022, we repurchased approximately 17.8 million of our ADSs (the
equivalent of approximately 142.8 million of our ordinary shares) for approximately US$2.0 billion under
our share repurchase program. In fiscal year 2022, we repurchased approximately 60.0 million of our ADSs
(the equivalent of approximately 480.3 million of our ordinary shares) for approximately US$9.6 billion
under our share repurchase program. In March 2022, we expanded our current share repurchase program
from US$15billion to US$25 billion, which is effective through March 2024. As of March 31, 2022, we had
approximately 21.4 billion ordinary shares (the equivalent of approximately 2.7 billion ADSs) outstanding.
Guidance
Since mid-March 2022, our domestic businesses have been significantly affected by the COVID-19
resurgence in China, particularly in Shanghai. Considering the risks and uncertainties arising from COVID-
19, which we are not able to control and are difficult for us to predict, we believe it is prudent at this time
not to give financial guidance as we typically do at the start of the fiscal year. However, we believe our
Company will continue to generate strong operating cash flow to maintain strategic flexibility as we
calibrate our operations against changing economic and competitive circumstances. In fiscal year 2023, our
operating principles include focusing on sustainable, high-quality revenue growth and optimizing our cost
structure to enhance overall return.

10
MARCH QUARTER SUMMARY FINANCIAL RESULTS Three months ended March 31, 2021 2022
RMB RMB US$ YoY %
Change(7) (in millions, except percentages and per share amounts) Revenue 187,395 204,052 32,188 9% (Loss) Income from operations (7,663) (2) 16,717(2) 2,637 N/A Operating margin (4)% 8% Adjusted EBITDA(1) 29,898 23,373 3,687 (22)%(3) Adjusted EBITDA margin(1) 16% 11% Adjusted EBITA(1) 22,612 15,811 2,494 (30)%(3) Adjusted EBITA margin(1) 12% 8% Net loss (7,654) (18,357) (2,896) (140)% (4) Net loss attributable to ordinary
shareholders (5,479) (16,241) (2,562) (196)%(4) Non-GAAP net income(1) 26,216 19,799 3,123 (24)%(3) Diluted loss per share(5) (0.25) (0.76) (0.12) (205)%(4) (6) Diluted loss per ADS(5) (1.99) (6.07) (0.96) (205)%(4) (6) Non-GAAP diluted earnings per share(1) (5) 1.29 0.99 0.16 (23)% (3) (6) Non-GAAP diluted earnings per ADS(1) (5) 10.32 7.95 1.25 (23)% (3) (6)
(1) See the sections entitled “Information about Segments,” “Non-GAAP Financial Measures” and “Reconciliations of Non-GAAP Measures to the Nearest Comparable U.S. GAAP Measures” for more information about the non-GAAP measures referred to within this results announcement.
(2) Excluding one-off and certain other items, our income from operations would have decreased by RMB6,894 million year-over-year, primarily due to our increased investments in Taocaicai and Taobao Deals, the continued impact of COVID-19, as well as asset impairment and special provisions made by Sun Art. Please refer to “March Quarter Operational and Financial Results” section below for details.
(3) The year-over-year decreases were primarily due to our increased investments in Taocaicai and Taobao Deals, the continued impact of COVID-19, as well as asset impairment and special provisions made by Sun Art.
(4) The year-over-year increases in net loss were primarily attributable to the increase in net losses arising from the decrease in market prices of our equity investments in publicly-traded companies, partly offset by the increase in income from operations.
(5) Each ADS represents eight ordinary shares.
(6) The year-over-year percentages as stated are calculated based on the exact amount and there may be minor differences from the year-over-year percentages calculated based on the RMB amounts after rounding.
(7) For a more intuitive presentation, widening of loss in YoY% is shown in terms of negative growth rate, and narrowing of loss in YoY% is shown in terms of positive growth rate.

11
MARCH QUARTER INFORMATION BY SEGMENTS The table below sets forth selected financial information of our operating segments for the periods indicated: Three months ended March 31, 2022
China
commerce International
commerce
Local consumer services Cainiao Cloud
Digital media and
entertainment
Innovation initiatives and others Unallocated(1) Consolidated
RMB RMB RMB RMB RMB RMB RMB RMB RMB US$
(in millions, except percentages) Revenue 140,330 14,335 10,445 11,582 18,971 8,005 384 — 204,052 32,188 YoY% change 8% 7% 29% 16% 12% (1)% (35)% — 9% Income (Loss) from operations 32,471 (1,918) (6,503) (1,081) 598 (2,170) (2,727) (1,953) 16,717 2,637 Add: Share-based compensation expense (902) (664) (479) (85) (326) 5 64 (1,350) (3,737) (590) Add: Amortization of intangible assets 580 19 1,499 254 4 199 211 65 2,831 447 Adjusted EBITA 32,149 (2,563) (5,483) (912) 276 (1,966) (2,452) (3,238) 15,811 2,494
Adjusted EBITA YoY% change(2) (19)% (3)% 17% (56)% N/A 27% (49)% (30)% (30)% Adjusted EBITA margin 23% (18)% (52)% (8)% 1% (25)% (639)% — 8% Three months ended March 31, 2021
China
commerce International
commerce
Local consumer services Cainiao Cloud
Digital media and
entertainment
Innovation initiatives and others Unallocated(1) Consolidated
RMB RMB RMB RMB RMB RMB RMB RMB RMB
(in millions, except percentages) Revenue 130,391 13,416 8,123 9,959 16,865 8,047 594 — 187,395 Income (Loss) from operations 36,165 (3,416) (9,443) (1,089) (2,337) (3,565) (2,135) (21,843) (7,663) Add: Share-based compensation expense 2,500 884 850 229 1,989 646 471 1,063 8,632 Add: Amortization of intangible assets 835 49 1,960 275 6 221 16 53 3,415 Add: Fine imposed pursuant to China’s
Anti-monopoly Law — — — — — — — 18,228 18,228
Adjusted EBITA 39,500 (2,483) (6,633) (585) (342) (2,698) (1,648) (2,499) 22,612
Adjusted EBITA margin 30% (19)% (82)% (6)% (2)% (34)% (277)% — 12%
Starting from the quarter ended December 31, 2021, our chief operating decision maker (“CODM”) started to review information under a new reporting structure, and segment reporting has been updated to conform to this change, which also provides greater transparency in our business progress and financial performance. Our updated segments comprise:
12
• China commerce, which mainly includes retail businesses such as Taobao, Tmall, Taobao Deals, Taocaicai, Tmall Supermarket, Tmall Global, Freshippo, Alibaba Health, and Sun Art, as well as wholesale business including 1688.com;
• International commerce, which mainly includes our international retail and wholesale businesses such as Lazada, AliExpress, Trendyol, Daraz and Alibaba.com; • Local consumer services, which mainly includes location-based services, such as Ele.me, Amap (previously reported under the Innovation initiatives and others segment), Fliggy
and Taoxianda; • Cainiao, which mainly includes our domestic and international one-stop-shop logistics services and supply chain management solutions; • Cloud, which comprises Alibaba Cloud and DingTalk; • Digital media and entertainment, which comprises Youku and Alibaba Pictures, as well as other content platforms and online games business; and • Innovation initiatives and others, which includes businesses such as Tmall Genie and DAMO Academy.
Comparative figures were reclassified to conform to this presentation.
(1) Unallocated expenses primarily relate to corporate administrative costs and other miscellaneous items that are not allocated to individual segments.
(2) For a more intuitive presentation, widening of adjusted EBITA loss in YoY% is shown in terms of negative growth rate, and narrowing of adjusted EBITA loss in YoY% is shown in terms of positive growth rate.

13
MARCH QUARTER OPERATIONAL AND FINANCIAL RESULTS
Revenue
Revenue for the quarter ended March 31, 2022 was RMB204,052 million (US$32,188 million), an increase
of 9% compared to RMB187,395 million in the same quarter of 2021. The increase was mainly driven by
the revenue growth of China commerce, Local consumer services and Cloud segments.
The following table sets forth a breakdown of our revenue by segment for the periods indicated:
Three months ended March 31, 2021 2022
RMB % of
Revenue RMB US$ % of
Revenue YoY % Change
(in millions, except percentages) China commerce:
China commerce retail - Customer management 63,224 34% 63,421 10,004 31% 0% - Direct sales and others(1) 63,797 34% 72,526 11,441 36% 14%
127,021 68% 135,947 21,445 67% 7% China commerce wholesale 3,370 2% 4,383 692 2% 30%
Total China commerce 130,391 70% 140,330 22,137 69% 8% International commerce:
International commerce retail 9,496 5% 9,887 1,560 5% 4% International commerce wholesale 3,920 2% 4,448 701 2% 13%
Total International commerce 13,416 7% 14,335 2,261 7% 7%
Local consumer services 8,123 4% 10,445 1,647 5% 29% Cainiao 9,959 5% 11,582 1,827 6% 16% Cloud 16,865 9% 18,971 2,993 9% 12% Digital media and entertainment 8,047 4% 8,005 1,263 4% (1)% Innovation initiatives and others 594 1% 384 60 0% (35)% Total 187,395 100% 204,052 32,188 100% 9%
Starting from the quarter ended December 31, 2021, our CODM started to review information under a new reporting structure, and segment
reporting has been updated to conform to this change, which also provides greater transparency in our business progress and financial
performance (see “March Quarter Information by Segments” above). Comparative figures were reclassified to conform to this presentation.
(1) “Direct sales and others” revenue under China commerce retail primarily represents our direct sales businesses, comprising mainly Sun Art,
Tmall Supermarket and Freshippo, where revenue and the cost of inventory are recorded on a gross basis.
China Commerce
• China Commerce Retail Business
Revenue from our China commerce retail business in the quarter ended March 31, 2022 was
RMB135,947 million (US$21,445 million), an increase of 7% compared to RMB127,021 million in
the same quarter of 2021. Customer management revenue remained stable year-over-year, primarily
due to a low single-digit decline year-over-year in online physical goods GMV of Taobao and Tmall,
excluding unpaid orders. For the March quarter, the combined GMV growth of January and February
was flat and GMV declined in March due to the impact of COVID-19.
“Direct sales and others” revenue under China commerce retail business in the quarter ended March
31, 2022 was RMB72,526 million (US$11,441 million), an increase of 14% compared to

14
RMB63,797 million in the same quarter of 2021, primarily due to the revenue contributed by our
direct sales businesses, such as Freshippo and Tmall Supermarket.
• China Commerce Wholesale Business
Revenue from our China commerce wholesale business in the quarter ended March 31, 2022 was
RMB4,383 million (US$692 million), an increase of 30% compared to RMB3,370 million in the
same quarter of 2021, primarily due to an increase in revenue from value-added services to
wholesale buyers and paying members.
International Commerce
• International Commerce Retail Business
Revenue from our International commerce retail business in the quarter ended March 31, 2022 was
RMB9,887 million (US$1,560 million), an increase of 4% compared to RMB9,496 million in the
same quarter of 2021. The increase was primarily due to the growth in revenue generated by Lazada.
The slower year-over-year growth rate as compared to prior quarters was mainly due to a decrease in
revenue of Trendyol that was negatively impacted by the depreciation of Turkish lira against
Renminbi, and a decline in orders of AliExpress which was due to the ongoing impact from the
change in the European Union’s VAT rules as well as supply chain and logistics disruptions due to
the Russia-Ukraine conflict .
• International Commerce Wholesale Business
Revenue from our International commerce wholesale business in the quarter ended March 31, 2022
was RMB4,448 million (US$701 million), an increase of 13% compared to RMB3,920 million in the
same quarter of 2021. The increase was primarily due to an increase in revenue generated by cross-
border related value-added services, as well as an increase in the number of paying members on
Alibaba.com. The slower year-over-year growth rate as compared to prior quarters was primarily due
to slowing export growth in China as well as supply chain disruptions as a result of the impact of
COVID-19.
Local Consumer Services
Revenue from Local consumer services, which mainly includes location-based services, such as Ele.me,
Amap, Fliggy and Taoxianda, was RMB10,445 million (US$1,647 million) in the quarter ended March 31,
2022, an increase of 29% compared to RMB8,123 million in the same quarter of 2021, primarily due to
more efficient use of subsidies that were contra revenue as well as resilient GMV growth. The resilient
GMV growth was driven by higher average order value but was partially offset by declining orders in March
due to the impact of COVID-19.
Cainiao
Revenue from Cainiao, which represents revenue from its domestic and international one-stop-shop logistics
services and supply chain management solutions, after inter-segment elimination, was RMB11,582 million
(US$1,827 million) in the quarter ended March 31, 2022, an increase of 16% compared to RMB9,959
million in the same quarter of 2021, primarily contributed by the increase in revenue from consumer
logistics services as a result of service upgrade to enhance consumer experience, partly offset by the
decrease in international orders that was mainly impacted by the supply chain and logistics disruptions due
to the Russia-Ukraine conflict. Total revenue generated by Cainiao, before inter-segment elimination, which
includes revenue from services provided to other Alibaba businesses, was RMB16,451 million (US$2,595
million), an increase of 19% compared to RMB13,866 million in the same quarter of 2021. The year-over-
year increase, in addition to the growth from external revenue, also reflected the growth of fulfillment

15
solutions and value-added services provided to our China commerce retail businesses, such as Tmall,
Taobao and Taobao Deals.
Cloud
Revenue from our Cloud segment, after inter-segment elimination, was RMB18,971 million (US$2,993
million) in the quarter ended March 31, 2022, an increase of 12% compared to RMB16,865 million in the
same quarter of 2021. Year-over-year revenue growth, which moderated during the quarter, was primarily
driven by strong growth in telecommunications, financial services, and retail industries that was partially
offset by declining revenue in certain other industries, such as select Internet verticals including online
education and entertainment. Excluding revenue generated from a top customer in the Internet industry that
has gradually stopped using our overseas cloud services for its international business due to non-product
related requirements, our Cloud segment revenue, after inter-segment elimination, would have grown 15%
year-over-year during the quarter ended March 31, 2022. Year-over-year revenue growth was slower
compared to prior quarters, reflecting slowing economic activities, softening demand from customers in
China’s Internet industry and delays in completing hybrid cloud projects due to the impact of COVID-19.
Total revenue from our Cloud business before inter-segment elimination, which includes revenue from
services provided to other Alibaba businesses, was RMB25,230 million (US$3,980 million), an increase of
12% compared to RMB22,624 million in the same quarter of 2021.
Digital Media and Entertainment
Revenue from our Digital media and entertainment segment in the quarter ended March 31, 2022 was
RMB8,005 million (US$1,263 million), a decrease of 1%, compared to RMB8,047 million in the same
quarter of 2021.
Innovation Initiatives and Others
Revenue from Innovation initiatives and others was RMB384 million (US$60 million) in the quarter ended
March 31, 2022, a decrease of 35% compared to RMB594 million in the same quarter of 2021.
Costs and Expenses
The following tables set forth a breakdown of our costs and expenses, share-based compensation expense
and costs and expenses excluding share-based compensation expense by function for the periods indicated.
Three months ended March 31, % of
Revenue YoY
change
2021 2022
RMB
% of Revenue RMB US$
% of Revenue
(in millions, except percentages) Costs and expenses: Cost of revenue 125,454 67% 138,945 21,918 68% 1% Product development expenses 13,302 7% 10,944 1,726 5% (2)% Sales and marketing expenses 25,153 14% 27,200 4,291 13% (1)% General and administrative
expenses
27,734 14% 7,415 1,169 4% (10)% Amortization of intangible assets 3,415 2% 2,831 447 2% 0% Total costs and expenses 195,058 104% 187,335 29,551 92% (12)% Share-based compensation
expense:
Cost of revenue 1,750 1% (692) (109) 0% (1)% Product development expenses 3,785 2% (1,407) (222) (1)% (3)%

16
Sales and marketing expenses 1,001 1% (199) (32) 0% (1)% General and administrative
expenses 2,096 1% (1,439) (227) (1)% (2)%
Total share-based compensation expense
8,632 5% (3,737) (590) (2)% (7)%
Costs and expenses excluding
share-based compensation expense:
Cost of revenue 123,704 66% 139,637 22,027 68% 2% Product development expenses 9,517 5% 12,351 1,948 6% 1% Sales and marketing expenses 24,152 13% 27,399 4,323 13% 0% General and administrative
expenses 25,638 13% 8,854 1,396 5% (8)% Amortization of intangible assets 3,415 2% 2,831 447 2% 0% Total costs and expenses excluding
share-based compensation expense
186,426 99% 191,072 30,141 94% (5)%
Cost of revenue – Cost of revenue in the quarter ended March 31, 2022 was RMB138,945 million
(US$21,918 million), or 68% of revenue, compared to RMB125,454 million, or 67% of revenue, in the same
quarter of 2021. Without the effect of share-based compensation expense, cost of revenue as a percentage of
revenue would have increased from 66% in the quarter ended March 31, 2021 to 68% in the quarter ended
March 31, 2022. The increase was primarily attributable to (i) the higher proportion of our direct sales
businesses, such as Freshippo and Tmall Supermarket, that resulted in increased cost of inventory as a
percentage of revenue, and (ii) the growth of Taocaicai and Cainiao businesses that led to an increase in
logistics costs as a percentage of revenue, which is partly offset by the reduction in delivery cost per order of
Local consumer services.
Product development expenses – Product development expenses in the quarter ended March 31, 2022 were
RMB10,944 million (US$1,726 million), or 5% of revenue, compared to RMB13,302 million, or 7% of
revenue, in the same quarter of 2021. Without the effect of share-based compensation expense, product
development expenses as a percentage of revenue would have increased from 5% in the quarter ended
March 31, 2021 to 6% in the quarter ended March 31, 2022.
Sales and marketing expenses – Sales and marketing expenses in the quarter ended March 31, 2022 were
RMB27,200 million (US$4,291 million), or 13% of revenue, compared to RMB25,153 million, or 14% of
revenue, in the same quarter of 2021. Without the effect of share-based compensation expense, sales and
marketing expenses as a percentage of revenue would have remained stable at 13% in the quarter ended
March 31, 2022 compared to the same quarter of 2021.
General and administrative expenses – General and administrative expenses in the quarter ended March
31, 2022 were RMB7,415 million (US$1,169 million), or 4% of revenue, compared to RMB27,734 million,
or 14% of revenue, in the same quarter of 2021, primarily due to the Anti-monopoly Fine in the amount of
RMB18,228 million in the quarter ended March 31, 2021. Without the effect of this fine and share-based
compensation expense, general and administrative expenses as a percentage of revenue would have
increased from 4% in the quarter ended March 31, 2021 to 5% in the quarter ended March 31, 2022.
Share-based compensation expense – Total share-based compensation expense included in the cost and
expense items above in the quarter ended March 31, 2022 was a net reversal of RMB3,737 million (US$590
million), compared to an expense of RMB8,632 million in the same quarter of 2021.
The following table sets forth our analysis of share-based compensation expense for the quarters indicated
by type of share-based awards:

17
Three months ended March 31, 2021 2022 % Change
RMB % of
Revenue RMB US$ % of
Revenue YoY (in millions, except percentages)
By type of awards:
Alibaba Group share-based awards(1) 7,162 4% 7,597 1,198 4% 6%
Ant Group share-based awards(2) 444 0% (12,683) (2,001) (6)% N/A Others(3) 1,026 1% 1,349 213 0% 31% Total share-based compensation
expense 8,632 5% (3,737) (590) (2)% N/A
(1) This represents Alibaba Group share-based awards granted to our employees.
(2) This represents Ant Group share-based awards granted to our employees, which is subject to mark-to-market accounting
treatment.
(3) This represents share-based awards of our subsidiaries
Share-based compensation expense related to Alibaba Group share-based awards remained stable in the
quarter ended March 31, 2022 compared to the same quarter of 2021.
Share-based compensation expense related to Ant Group share-based awards was a net reversal for the
quarter ended March 31, 2022 compared to the same quarter of 2021, as a result of our on-going evaluation
of Ant Group. During the quarter, we recognized a decrease in the value of the awards after considering
existing circumstances.
We expect that our share-based compensation expense will continue to be affected by changes in the fair
value of the underlying awards and the quantity of awards we grant in the future.
Amortization of intangible assets – Amortization of intangible assets in the quarter ended March 31, 2022
was RMB2,831 million (US$447 million), a decrease of 17% from RMB3,415 million in the same quarter of
2021.
Income (loss) from operations and operating margin
Income from operations in the quarter ended March 31, 2022 was RMB16,717 million (US$2,637 million),
or 8% of revenue, compared to loss from operations of RMB7,663 million, or negative 4% of revenue, in the
same quarter of 2021. During the quarter ended March 31, 2022, we recognized a reversal of share-based
compensation expense of RMB13,046 million (US$2,058 million) related to the mark-to-market adjustment
of Ant Group share-based awards granted to our employees. During the quarter ended March 31, 2021, we
recorded a RMB18,228 million Anti-monopoly Fine. Both these impacts were excluded from our non-
GAAP measures of profitability. Excluding these impacts, our income from operations would have
decreased by RMB6,894 million year-over-year, from RMB10,565 million in the quarter ended March 31,
2021 to RMB3,671 million (US$579 million) in the quarter ended March 31, 2022, primarily due to our
increased investments in Taocaicai and Taobao Deals, the continued impact of COVID-19, as well as asset
impairment and special provisions made by Sun Art.
Adjusted EBITDA and Adjusted EBITA
Adjusted EBITDA decreased 22% year-over-year to RMB23,373 million (US$3,687 million) in the quarter
ended March 31, 2022, compared to RMB29,898 million in the same quarter of 2021. Adjusted EBITA
decreased 30% or RMB6,801 million year-over-year to RMB15,811 million (US$2,494 million) in the
quarter ended March 31, 2022, compared to RMB22,612 million in the same quarter of 2021. The year-over-
year decreases were primarily due to our increased investments in Taocaicai and Taobao Deals, the
continued impact of COVID-19, as well as asset impairment and special provisions made by Sun Art. A

18
reconciliation of net income to adjusted EBITDA and adjusted EBITA is included at the end of this results
announcement.
Adjusted EBITA and adjusted EBITA margin by segments
Adjusted EBITA and adjusted EBITA margin by segments are set forth in the table below. See the section
entitled “March Quarter Information by Segments” above for a reconciliation of income (loss) from
operations to adjusted EBITA.
Three months ended March 31, 2021 2022
RMB
% of Segment Revenue RMB US$
% of Segment Revenue
(in millions, except percentages) China commerce 39,500 30% 32,149 5,071 23% International commerce (2,483) (19)% (2,563) (404) (18)% Local consumer services (6,633) (82)% (5,483) (865) (52)% Cainiao (585) (6)% (912) (144) (8)% Cloud (342) (2)% 276 44 1% Digital media and entertainment (2,698) (34)% (1,966) (310) (25)% Innovation initiatives and others (1,648) (277)% (2,452) (387) (639)% Unallocated(1) (2,499) — (3,238) (511) — Total 22,612 12% 15,811 2,494 8%
Starting from the quarter ended December 31, 2021, our CODM started to review information under a new reporting structure, and segment
reporting has been updated to conform to this change, which also provides greater transparency in our business progress and financial
performance (see “March Quarter Information by Segments” above). Comparative figures were reclassified to conform to this presentation.
(1) Unallocated expenses primarily relate to corporate administrative costs and other miscellaneous items that are not allocated to individual
segments.
China commerce segment – Adjusted EBITA decreased by 19% to RMB32,149 million (US$5,071
million) in the quarter ended March 31, 2022, compared to RMB39,500 million in the same quarter of 2021.
The decrease was primarily due to our increased investments in Taocaicai and Taobao Deals, the continued
impact of COVID-19 as well as asset impairment and special provisions made by Sun Art. These factors
also led to a decrease in adjusted EBITA margin from 30% in the quarter ended March 31, 2021 to 23% in
the quarter ended March 31, 2022.
We expect that our China commerce adjusted EBITA margin will continue to be affected by the growth of
our direct sales businesses.
International commerce segment – Adjusted EBITA was a loss of RMB2,563 million (US$404 million) in
the quarter ended March 31, 2022, compared to a loss of RMB2,483 million in the same quarter of 2021.
The slight increase in loss year-over-year was primarily due to increase in loss of Trendyol resulted from its
investments in new businesses, such as international business and local consumer services in Turkey, offset
by the increase in profit contributed by our International wholesale businesses.
Local consumer services segment –Adjusted EBITA was a loss of RMB5,483 million (US$865 million) in
the quarter ended March 31, 2022, compared to a loss of RMB6,633 million in the same quarter of 2021,
primarily due to the narrowed losses of our “To Home” businesses, driven by optimized user acquisition
spending and reduction in delivery cost per order.
Cainiao segment – Adjusted EBITA was a loss of RMB912 million (US$144 million) in the quarter ended
March 31, 2022, compared to a loss of RMB585 million in the same quarter of 2021. The year-over-year

19
increase in loss was primarily due to increase in operating cost as a result of our investment in expanding the
global smart logistics infrastructure, as well as the impact from COVID-19 and the Russia-Ukraine conflict.
Cloud segment– Adjusted EBITA of Cloud segment, which comprises Alibaba Cloud and DingTalk, was a
profit of RMB276 million (US$44 million) in the quarter ended March 31, 2022, compared to a loss of
RMB342 million in the same quarter of 2021, primarily attributable to the realization of economies of scale,
partly offset by our increased investments in DingTalk.
Digital media and entertainment segment – Adjusted EBITA in the quarter ended March 31, 2022 was a
loss of RMB1,966 million (US$310 million), compared to a loss of RMB2,698 million in the same quarter
of 2021, primarily due to our disciplined investment in content and production capability, which resulted in
narrowing of losses of Youku year-over-year.
Innovation initiatives and others segment – Adjusted EBITA in the quarter ended March 31, 2022 was a
loss of RMB2,452 million (US$387 million), compared to a loss of RMB1,648 million in the same quarter
of 2021, primarily due to our investments in technology and innovation.
Interest and investment income, net
Interest and investment income, net in the quarter ended March 31, 2022 was a loss of RMB36,708 million
(US$5,791 million), compared to a gain of RMB111 million in the quarter ended March 31, 2021, primarily
due to the increase in net losses arising from the decreases in market prices of our equity investments in
publicly-traded companies.
The above-mentioned losses were excluded from our non-GAAP net income.
Other income, net
Other income, net in the quarter ended March 31, 2022 was RMB1,620 million (US$256 million), compared
to RMB2,115 million in the same quarter of 2021.
Income tax expenses
Income tax expenses in the quarter ended March 31, 2022 were RMB2,079 million (US$328 million),
compared to RMB7,049 million in the same quarter of 2021.
Excluding share-based compensation expense, revaluation and disposal gains/losses of investments,
impairment of investments, as well as the deferred tax effects on basis differences arising from our equity
method investees, our effective tax rate would have been 23% in the quarter ended March 31, 2022.
Share of results of equity method investees
Share of results of equity method investees in the quarter ended March 31, 2022 was RMB3,282 million
(US$518 million), compared to RMB5,992 million in the same quarter of 2021. Share of results of equity
method investees in the quarter ended March 31, 2022 and the same quarter in the prior year consisted of the
following:
Three months ended March 31, 2021 2022 RMB RMB US$ (in millions)
Share of profit (loss) of equity method investees - Ant Group 7,182 7,275 1,148 - Others (432) (973) (153)

20
Impairment loss (55) (2,624) (414) Others(1) (703) (396) (63) Total 5,992 3,282 518
(1) “Others” mainly include amortization of intangible assets of equity method investees, share-based compensation expense related to share-
based awards granted to employees of our equity method investees, as well as gain or loss arising from the dilution of our investments in
equity method investees.
We record our share of results of all equity method investees one quarter in arrears. Our share of profit of
Ant Group was essentially flat year-over-year whereby an increase in Ant Group’s recognition during the
three months ended December 31, 2021 of net gains attributable to increases in the fair values of certain
overseas investments that Ant Group previously made was offset by a decrease in its operating profit.
Net loss and Non-GAAP net income
Our net loss in the quarter ended March 31, 2022 was RMB18,357 million (US$2,896 million), compared to
RMB7,654 million in the same quarter of 2021. The year-over-year increase in net loss was primarily
attributable to the increase in net losses arising from the decreases in market prices of our equity investments
in publicly-traded companies, partly offset by the increase in income from operations.
Excluding the Anti-monopoly Fine, share-based compensation expense, revaluation and disposal
gains/losses of investments, impairment of investments and certain other items, non-GAAP net income in
the quarter ended March 31, 2022 was RMB19,799 million (US$3,123 million), a decrease of 24%
compared to RMB26,216 million in the same quarter of 2021. A reconciliation of net income to non-GAAP
net income is included at the end of this results announcement.
Net loss attributable to ordinary shareholders
Net loss attributable to ordinary shareholders in the quarter ended March 31, 2022 was RMB16,241 million
(US$2,562 million), compared to RMB5,479 million in the same quarter of 2021. The year-over-year
increase was primarily attributable to the increase in net losses arising from the decrease in market prices of
our equity investments in publicly-traded companies, partly offset by the increase in income from
operations.
Diluted loss per ADS/share and non-GAAP diluted earnings per ADS/share
Diluted loss per ADS in the quarter ended March 31, 2022 was RMB6.07 (US$0.96), compared to diluted
loss per ADS of RMB1.99 in the same quarter in 2021. Excluding the Anti-monopoly Fine, share-based
compensation expense, revaluation and disposal gains/losses of investments, impairment of investments and
certain other items, non-GAAP diluted earnings per ADS in the quarter ended March 31, 2022 was
RMB7.95 (US$1.25), a decrease of 23% compared to RMB10.32 in the same quarter of 2021.
Diluted loss per share in the quarter ended March 31, 2022 was RMB0.76 (US$0.12 or HK$0.94), compared
to diluted loss per share of RMB0.25 in the same quarter of 2021. Excluding the Anti-monopoly Fine, share-
based compensation expense, revaluation and disposal gains/losses of investments, impairment of
investments and certain other items, non-GAAP diluted earnings per share in the quarter ended March 31,
2022 was RMB0.99 (US$0.16 or HK$1.22), a decrease of 23% compared to RMB1.29 in the same quarter
of 2021.
A reconciliation of diluted loss per ADS/share to non-GAAP diluted earnings per ADS/share is included at
the end of this results announcement. Each ADS represents eight ordinary shares.
Net cash from operating activities and free cash flow

21
Net cash from operating activities in the quarter ended March 31, 2022 was an outflow of RMB7,040
million (US$1,111 million), compared to an inflow of RMB24,183 million in the same quarter of 2021,
which includes a net cash inflow of RMB18,796 million in connection with the consumer protection fund
deposits received primarily from Tmall merchants during the quarter ended March 31, 2021. Excluding
these deposits and certain other items, free cash flow, a non-GAAP measurement of liquidity, was an
outflow of RMB15,070 million (US$2,377 million), compared to an outflow of RMB658 million in the
same quarter of 2021, mainly due to the payment of the final installment in the amount of RMB9,114
million (US$1,438 million) of the RMB18,228 million Anti-monopoly Fine and a decrease in profit. A
reconciliation of net cash provided by operating activities to free cash flow is included at the end of this
results announcement.
Net cash used in investing activities
During the quarter ended March 31, 2022, net cash used in investing activities of RMB87,254 million
(US$13,764 million) primarily reflected (i) an increase in short-term investments by RMB71,670 million
(US$11,306 million), (ii) capital expenditures of RMB11,502 million (US$1,814 million), which included
cash outflow for acquisition of land use rights and construction in progress relating to office campuses of
RMB2,301 million (US$363 million), as well as (iii) cash outflow of RMB6,291 million (US$992 million)
for investment and acquisition activities.
Net cash used in financing activities
During the quarter ended March 31, 2022, net cash used in financing activities of RMB10,614 million
(US$1,675 million) primarily reflected cash used in repurchase of ordinary shares of RMB12,132 million
(US$1,914 million), partially offset by net proceeds from bank borrowings of RMB2,189 million (US$345
million).
Employees
As of March 31, 2022, we had a total of 254,941 employees, compared to 259,316 as of December 31, 2021.
22
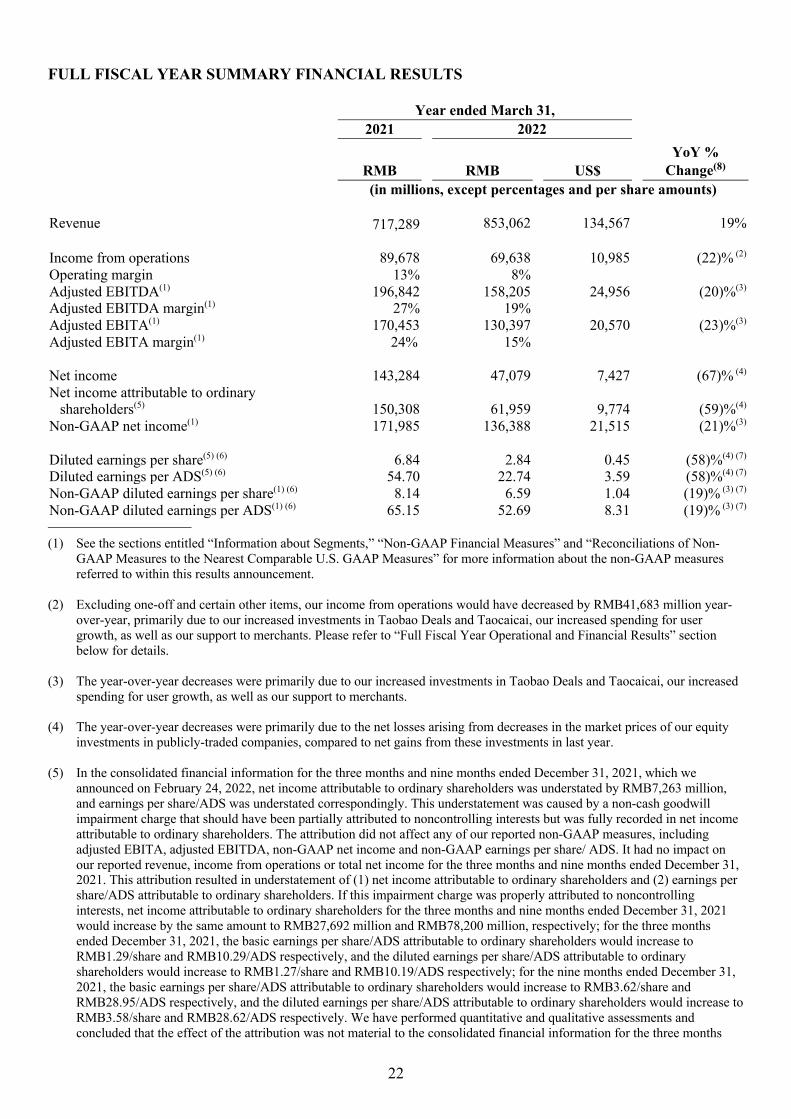
FULL FISCAL YEAR SUMMARY FINANCIAL RESULTS Year ended March 31, 2021 2022
RMB RMB US$ YoY %
Change(8) (in millions, except percentages and per share amounts) Revenue 717,289 853,062 134,567 19% Income from operations 89,678 69,638 10,985 (22)% (2) Operating margin 13% 8% Adjusted EBITDA(1) 196,842 158,205 24,956 (20)%(3) Adjusted EBITDA margin(1) 27% 19% Adjusted EBITA(1) 170,453 130,397 20,570 (23)%(3) Adjusted EBITA margin(1) 24% 15% Net income 143,284 47,079 7,427 (67)% (4) Net income attributable to ordinary
shareholders(5) 150,308 61,959 9,774 (59)%(4) Non-GAAP net income(1) 171,985 136,388 21,515 (21)%(3) Diluted earnings per share(5) (6) 6.84 2.84 0.45 (58)%(4) (7) Diluted earnings per ADS(5) (6) 54.70 22.74 3.59 (58)%(4) (7) Non-GAAP diluted earnings per share(1) (6) 8.14 6.59 1.04 (19)% (3) (7) Non-GAAP diluted earnings per ADS(1) (6) 65.15 52.69 8.31 (19)% (3) (7)
(1) See the sections entitled “Information about Segments,” “Non-GAAP Financial Measures” and “Reconciliations of Non-GAAP Measures to the Nearest Comparable U.S. GAAP Measures” for more information about the non-GAAP measures referred to within this results announcement.
(2) Excluding one-off and certain other items, our income from operations would have decreased by RMB41,683 million year-
over-year, primarily due to our increased investments in Taobao Deals and Taocaicai, our increased spending for user growth, as well as our support to merchants. Please refer to “Full Fiscal Year Operational and Financial Results” section below for details.
(3) The year-over-year decreases were primarily due to our increased investments in Taobao Deals and Taocaicai, our increased
spending for user growth, as well as our support to merchants. (4) The year-over-year decreases were primarily due to the net losses arising from decreases in the market prices of our equity
investments in publicly-traded companies, compared to net gains from these investments in last year. (5) In the consolidated financial information for the three months and nine months ended December 31, 2021, which we
announced on February 24, 2022, net income attributable to ordinary shareholders was understated by RMB7,263 million, and earnings per share/ADS was understated correspondingly. This understatement was caused by a non-cash goodwill impairment charge that should have been partially attributed to noncontrolling interests but was fully recorded in net income attributable to ordinary shareholders. The attribution did not affect any of our reported non-GAAP measures, including adjusted EBITA, adjusted EBITDA, non-GAAP net income and non-GAAP earnings per share/ ADS. It had no impact on our reported revenue, income from operations or total net income for the three months and nine months ended December 31, 2021. This attribution resulted in understatement of (1) net income attributable to ordinary shareholders and (2) earnings per share/ADS attributable to ordinary shareholders. If this impairment charge was properly attributed to noncontrolling interests, net income attributable to ordinary shareholders for the three months and nine months ended December 31, 2021 would increase by the same amount to RMB27,692 million and RMB78,200 million, respectively; for the three months ended December 31, 2021, the basic earnings per share/ADS attributable to ordinary shareholders would increase to RMB1.29/share and RMB10.29/ADS respectively, and the diluted earnings per share/ADS attributable to ordinary shareholders would increase to RMB1.27/share and RMB10.19/ADS respectively; for the nine months ended December 31, 2021, the basic earnings per share/ADS attributable to ordinary shareholders would increase to RMB3.62/share and RMB28.95/ADS respectively, and the diluted earnings per share/ADS attributable to ordinary shareholders would increase to RMB3.58/share and RMB28.62/ADS respectively. We have performed quantitative and qualitative assessments and concluded that the effect of the attribution was not material to the consolidated financial information for the three months

23
and nine months ended December 31, 2021. When we announce our financial results for the three months and nine months ending December 31, 2022, we will present revised consolidated financial information for the three months and nine months ended December 31, 2021 that reflects the above attribution. The above attribution has no impact on the consolidated financial information for the three months ended March 31, 2022 contained in this announcement. The consolidated financial information for the year ended March 31, 2022 contained in this announcement reflects the correct attribution of the aforementioned impairment charge to noncontrolling interests.
(6) Each ADS represents eight ordinary shares. (7) The year-over-year percentages as stated are calculated based on the exact amount and there may be minor differences from
the year-over-year percentages calculated based on the RMB amounts after rounding. (8) For a more intuitive presentation, widening of loss in YoY% is shown in terms of negative growth rate, and narrowing of
loss in YoY% is shown in terms of positive growth rate.

24
FULL FISCAL YEAR INFORMATION BY SEGMENTS The table below sets forth selected financial information of our operating segments for the fiscal year 2022: Year ended March 31, 2022
China
commerce International
commerce
Local consumer services Cainiao Cloud
Digital media and
entertainment
Innovation initiatives and others Unallocated(1) Consolidated
RMB RMB RMB RMB RMB RMB RMB RMB RMB US$
(in millions, except percentages) Revenue 592,705 61,078 43,491 46,107 74,568 32,272 2,841 — 853,062 134,567 YoY% change 18% 25% 23% 24% 23% 3% 23% — 19% Income (Loss) from operations 172,219 (10,655) (30,485) (3,920) (5,167) (7,019) (9,424) (35,911) 69,638 10,985 Add: Share-based compensation expense 7,078 1,569 2,556 1,396 6,297 1,520 1,839 1,716 23,971 3,782 Add: Amortization of intangible assets 2,817 95 6,154 1,059 16 809 456 241 11,647 1,837 Add: Impairment of goodwill — — — — — — — 25,141 25,141 3,966 Adjusted EBITA 182,114 (8,991) (21,775) (1,465) 1,146 (4,690) (7,129) (8,813) 130,397 20,570
Adjusted EBITA YoY% change(2) (15)% (82)% (34)% (80)% N/A 23% (37)% (17)% (23)% Adjusted EBITA margin 31% (15)% (50)% (3)% 2% (15)% (251)% — 15% Year ended March 31, 2021
China
commerce International
commerce
Local consumer services Cainiao Cloud
Digital media and
entertainment
Innovation initiatives and others Unallocated(1) Consolidated
RMB RMB RMB RMB RMB RMB RMB RMB RMB
(in millions, except percentages) Revenue 501,683 48,851 35,442 37,258 60,558 31,186 2,311 — 717,289 Income (Loss) from operations 197,135 (9,361) (29,100) (3,964) (12,479) (10,321) (7,802) (34,430) 89,678 Add: Share-based compensation expense 14,505 4,223 4,972 1,956 10,205 3,281 2,518 8,460 50,120 Add: Amortization of intangible assets 1,922 206 7,852 1,195 23 922 83 224 12,427 Add: Fine imposed pursuant to China’s Anti-
monopoly Law — — — — — — — 18,228 18,228 Adjusted EBITA 213,562 (4,932) (16,276) (813) (2,251) (6,118) (5,201) (7,518) 170,453
Adjusted EBITA margin 43% (10)% (46)% (2)% (4)% (20)% (225)% — 24%
Starting from the quarter ended December 31, 2021, our CODM started to review information under a new reporting structure, and segment reporting has been updated to conform to this change, which also provides greater transparency in our business progress and financial performance. Our updated segments comprise:
25
• China commerce, which mainly includes retail businesses such as Taobao, Tmall, Taobao Deals, Taocaicai, Tmall Supermarket, Tmall Global, Freshippo, Alibaba Health, and Sun
Art, as well as wholesale business including 1688.com; • International commerce, which mainly includes our international retail and wholesale businesses such as Lazada, AliExpress, Trendyol, Daraz and Alibaba.com; • Local consumer services, which mainly includes location-based services, such as Ele.me, Amap (previously reported under the Innovation initiatives and others segment), Fliggy and
Taoxianda; • Cainiao, which mainly includes our domestic and international one-stop-shop logistics services and supply chain management solutions; • Cloud, which comprises Alibaba Cloud and DingTalk; • Digital media and entertainment, which comprises Youku and Alibaba Pictures, as well as other content platforms and online games business; and • Innovation initiatives and others, which includes businesses such as Tmall Genie and DAMO Academy.
Comparative figures were reclassified to conform to this presentation.
(1) Unallocated expenses primarily relate to corporate administrative costs and other miscellaneous items that are not allocated to individual segments. The goodwill impairment is presented as an unallocated item in the segment information because our management does not consider this as part of the segment operating performance measure.
(2) For a more intuitive presentation, widening of adjusted EBITA loss in YoY% is shown in terms of negative growth rate, and narrowing of adjusted EBITA loss in YoY% is shown in terms of positive growth rate.

26
FULL FISCAL YEAR OPERATIONAL AND FINANCIAL RESULTS
Revenue
Revenue in fiscal year 2022 was RMB853,062 million (US$134,567 million), an increase of 19% compared
to RMB717,289 million in fiscal year 2021. The increase was mainly driven by the segment revenue growth
of China commerce, Cloud and International commerce. Excluding the consolidation of Sun Art, our
revenue would have grown 14% year-over-year to RMB770,734 million (US$121,580 million).
The following table sets forth a breakdown of our revenue by segment for the periods indicated:
Year ended March 31, 2021 2022
RMB % of
Revenue RMB US$ % of
Revenue YoY % Change
(in millions, except percentages) China commerce:
China commerce retail - Customer management 304,543 43% 315,038 49,696 37% 3% - Direct sales and others(1) 182,818 25% 260,955 41,165 30% 43%
487,361 68% 575,993 90,861 67% 18% China commerce wholesale 14,322 2% 16,712 2,636 2% 17%
Total China commerce 501,683 70% 592,705 93,497 69% 18% International commerce:
International commerce retail 34,455 5% 42,668 6,731 5% 24% International commerce wholesale 14,396 2% 18,410 2,904 2% 28%
Total International commerce 48,851 7% 61,078 9,635 7% 25%
Local consumer services 35,442 5% 43,491 6,861 5% 23% Cainiao 37,258 5% 46,107 7,273 5% 24% Cloud 60,558 8% 74,568 11,763 9% 23% Digital media and entertainment 31,186 4% 32,272 5,091 4% 3% Innovation initiatives and others 2,311 1% 2,841 447 1% 23% Total 717,289 100% 853,062 134,567 100% 19%
Starting from the quarter ended December 31, 2021, our CODM started to review information under a new reporting structure, and segment reporting is updated to conform to this change, which also provides greater transparency in our business progress and financial performance (see “Full Fiscal Year Information by Segments” above). Comparative figures were reclassified to conform to this presentation.
(1) “Direct sales and others” revenue under China commerce retail primarily represents our direct sales businesses, comprising mainly Sun Art,
Tmall Supermarket and Freshippo, where revenue and the cost of inventory are recorded on a gross basis.
China Commerce
• China Commerce Retail Business
Revenue from our China commerce retail business in fiscal year 2022 was RMB575,993 million
(US$90,861 million), an increase of 18% compared to RMB487,361 million in fiscal year 2021.
Customer management revenue increased by 3% year-over-year, primarily due to single-digit year-
over-year growth in online physical goods GMV of Taobao and Tmall, excluding unpaid orders, that
resulted from slowing market conditions and increased competition, as well as our support to
merchants.
“Direct sales and others” revenue under China commerce retail business in fiscal year 2022 was
RMB260,955 million (US$41,165 million), an increase of 43% compared to RMB182,818 million in

27
fiscal year 2021, primarily due to the revenue contributed by our direct sales businesses, such as Sun
Art (which we started to consolidate in October 2020), Tmall Supermarket and Freshippo.
• China Commerce Wholesale Business
Revenue from our China commerce wholesale business in fiscal year 2022 was RMB16,712 million
(US$2,636 million), an increase of 17% compared to RMB14,322 million in fiscal year 2021. The
increase was primarily due to the increase in revenue from value-added services to paying members
and wholesale buyers.
International Commerce
• International Commerce Retail Business
Revenue from our International commerce retail business in fiscal year 2022 was RMB42,668
million (US$6,731 million), an increase of 24% compared to RMB34,455 million in fiscal year 2021.
The increase was mainly attributable to the growth in revenue generated by Lazada. Revenue growth
of Trendyol and AliExpress were slower than the overall International commerce retail revenue
growth, primarily due to the negative impact by the depreciation of Turkish lira against Renminbi on
Trendyol, and weakening order growth of AliExpress that was affected by the change in the
European Union’s VAT rules as well as supply chain and logistics disruptions due to the Russia-
Ukraine conflict.
• International Commerce Wholesale Business
Revenue from our International commerce wholesale business in fiscal year 2022 was RMB18,410
million (US$2,904 million), an increase of 28% compared to RMB14,396 million in fiscal year 2021.
The increase was primarily due to increases in both the average revenue from paying members and
the number of paying members on Alibaba.com, as well as an increase in revenue generated by
cross-border related value-added services.
Local Consumer Services
Revenue from Local consumer services, which mainly includes location-based services, such as Ele.me,
Amap, Fliggy and Taoxianda, was RMB43,491 million (US$6,861 million) in fiscal year 2022, an increase
of 23% compared to RMB35,442 million in fiscal year 2021, primarily driven by the growth in GMV.
Cainiao
Revenue from Cainiao, which represents revenue from its domestic and international one-stop-shop logistics
services and supply chain management solutions, after inter-segment elimination, was RMB46,107 million
(US$7,273 million) in fiscal year 2022, an increase of 24% compared to RMB37,258 million in fiscal year
2021, primarily due to the increases in both volume of orders fulfilled and penetration of cross-border and
International commerce retail businesses, the increase in revenue from value-added services provided to
external merchants, as well as increase in revenue from consumer logistics services as a result of service
upgrade to enhance consumer experience. Total revenue generated by Cainiao, before inter-segment
elimination, which includes revenue from services provided to other Alibaba businesses, was RMB66,808
million (US$10,539 million), an increase of 27% compared to RMB52,735 million in fiscal year 2021. The
year-over-year increase, in addition to the growth from external revenue, also reflected the growth of
fulfillment solutions and value-added services provided to our China commerce retail businesses, such as
Tmall, Taobao and Taobao Deals.

28
Cloud
Revenue from our Cloud segment (comprised of Alibaba Cloud and DingTalk), after inter-segment
elimination, was RMB74,568 million (US$11,763 million) in fiscal year 2022, an increase of 23% year-
over-year compared to RMB60,558 million in fiscal year 2021. Year-over-year revenue growth moderated
in fiscal year 2022 primarily because of revenue decline from a top cloud customer in the Internet industry
that has gradually stopped using our overseas cloud services for its international business due to non-product
related requirements as well as slowing demand from customers in China’s Internet industry. Excluding the
revenue generated from this top customer, our Cloud segment revenue, after inter-segment elimination,
would have grown strongly at 29% year-over-year during the twelve months ended March 31, 2022. Total
revenue from our Cloud business, before inter-segment elimination, which includes revenue from services
provided to other Alibaba businesses, was RMB100,180 million (US$15,803 million), an increase of 21%
compared to RMB82,971 million in the fiscal year 2021.
Digital Media and Entertainment
Revenue from our Digital media and entertainment segment in fiscal year 2022 was RMB32,272 million
(US$5,091 million), an increase of 3%, compared to RMB31,186 million in fiscal year 2021.
Innovation Initiatives and Others
Revenue from Innovation initiatives and others was RMB2,841 million (US$447 million) in fiscal year
2022, an increase of 23% compared to RMB2,311 million in fiscal year 2021.
Costs and Expenses
The following tables set forth a breakdown of our costs and expenses, share-based compensation expense
and costs and expenses excluding share-based compensation expense by function for the periods indicated.
Year ended March 31, % of
Revenue YoY
change
2021 2022
RMB
% of Revenue RMB US$
% of Revenue
(in millions, except percentages) Costs and expenses: Cost of revenue 421,205 59% 539,450 85,096 63% 4% Product development expenses 57,236 8% 55,465 8,749 7% (1)% Sales and marketing expenses 81,519 11% 119,799 18,898 14% 3% General and administrative
expenses
55,224 8% 31,922 5,036 4% (4)% Amortization of intangible assets 12,427 1% 11,647 1,837 1% 0% Impairment of goodwill — — 25,141 3,966 3% 3% Total costs and expenses 627,611 87% 783,424 123,582 92% 5% Share-based compensation
expense:
Cost of revenue 11,224 2% 5,725 903 1% (1)% Product development expenses 21,474 3% 11,035 1,741 1% (2)% Sales and marketing expenses 5,323 0% 3,050 481 0% 0% General and administrative
expenses 12,099 2% 4,161 657 1% (1)%
Total share-based compensation expense
50,120 7% 23,971 3,782 3% (4)%

29
Costs and expenses excluding share-based compensation expense:
Cost of revenue 409,981 57% 533,725 84,193 62% 5% Product development expenses 35,762 5% 44,430 7,008 6% 1% Sales and marketing expenses 76,196 11% 116,749 18,417 14% 3% General and administrative
expenses 43,125 6% 27,761 4,379 3% (3)% Amortization of intangible assets 12,427 1% 11,647 1,837 1% 0% Impairment of goodwill — — 25,141 3,966 3% 3% Total costs and expenses excluding
share-based compensation expense
577,491 80% 759,453 119,800 89% 9%
Cost of revenue – Cost of revenue in fiscal year 2022 was RMB539,450 million (US$85,096 million), or
63% of revenue, compared to RMB421,205 million, or 59% of revenue, in fiscal year 2021. Without the
effect of share-based compensation expense, cost of revenue as a percentage of revenue would have
increased from 57% in fiscal year 2021 to 62% in fiscal year 2022. The increase was primarily attributable
to (i) the higher proportion of our direct sales businesses, such as Sun Art, which we started to consolidate in
October 2020, that resulted in increased cost of inventory as a percentage of revenue, and (ii) the growth of
Taocaicai businesses that led to an increase in logistics costs as a percentage of revenue.
Product development expenses – Product development expenses in fiscal year 2022 were RMB55,465
million (US$8,749 million), or 7% of revenue, compared to RMB57,236 million, or 8% of revenue, in fiscal
year 2021. Without the effect of share-based compensation expense, product development expenses as a
percentage of revenue would have increased from 5% in fiscal year 2021 to 6% in fiscal year 2022.
Sales and marketing expenses – Sales and marketing expenses in fiscal year 2022 were RMB119,799
million (US$18,898 million), or 14% of revenue, compared to RMB81,519 million, or 11% of revenue, in
fiscal year 2021. Without the effect of share-based compensation expense, sales and marketing expenses as a
percentage of revenue would have increased from 11% in fiscal year 2021 to 14% in fiscal year 2022. The
increase was primarily due to an increase in marketing and promotional spending for user acquisition and
engagement for our mobile commerce apps, such as Taobao Deals, Taobao, Lazada and Ele.me.
General and administrative expenses – General and administrative expenses in fiscal year 2022 were
RMB31,922 million (US$5,036 million), or 4% of revenue, compared to RMB55,224 million, or 8% of
revenue, in fiscal year 2021, primarily due to the Anti-monopoly Fine in the amount of RMB18,228 million
recorded in fiscal year 2021. Without the effect of this fine and share-based compensation expense, general
and administrative expenses as a percentage of revenue would have remained stable at 3% in fiscal year
2022 compared to fiscal year 2021.
Share-based compensation expense – Total share-based compensation expense included in the cost and
expense items above in fiscal year 2022 was RMB23,971 million (US$3,782 million), a decrease of 52%
compared to RMB50,120 million in fiscal year 2021. Share-based compensation expense as a percentage of
revenue decreased to 3% in fiscal year 2022, as compared to 7% in fiscal year 2021.
The following table sets forth our analysis of share-based compensation expense for the periods indicated by
type of share-based awards:
Year ended March 31, 2021 2022 % Change
RMB % of
Revenue RMB US$ % of
Revenue YoY (in millions, except percentages)

30
By type of awards:
Alibaba Group share-based awards(1) 29,317 4% 30,576 4,823 4% 4%
Ant Group share-based awards(2) 17,315 2% (11,585) (1,827) (1)% N/A Others(3) 3,488 1% 4,980 786 0% 43% Total share-based compensation
expense 50,120 7% 23,971 3,782 3% (52)%
(1) This represents Alibaba Group share-based awards granted to our employees. (2) This represents Ant Group share-based awards granted to our employees, which is subject to mark-to-market accounting
treatment. (3) This represents share-based awards of our subsidiaries
Share-based compensation expense related to Alibaba Group share-based awards remained stable in fiscal
year 2022 compared to fiscal year 2021.
Share-based compensation expense related to Ant Group share-based awards was a net reversal in fiscal year
2022 compared to fiscal year 2021, as a result of our on-going evaluation of Ant Group. During fiscal year
2022, we recognized a decrease in the value of the awards after considering existing circumstances.
We expect that our share-based compensation expense will continue to be affected by changes in the fair
value of the underlying awards and the quantity of awards we grant in the future.
Amortization of intangible assets – Amortization of intangible assets in fiscal year 2022 was RMB11,647
million (US$1,837 million), a decrease of 6% from RMB12,427 million in fiscal year 2021.
Impairment of goodwill - Impairment of goodwill of RMB25,141 million (US$3,966 million) was recorded
in fiscal year 2022, representing the amount by which the carrying value of certain reporting units within the
Digital media and entertainment segment exceeds their fair value, based on an annual goodwill impairment
assessment.
Income from operations and operating margin
Income from operations in fiscal year ended March 31, 2022 was RMB69,638 million (US$10,985 million),
or 8% of revenue, a decrease of 22% compared to RMB89,678 million, or 13% of revenue, in fiscal year
2021. During fiscal year 2022, we recorded a RMB25,141 million (US$3,966 million) impairment of
goodwill in relation to the Digital media and entertainment segment and a reversal of share-based
compensation expense of RMB13,046 million (US$2,058 million) related to the mark-to-market adjustment
of Ant Group share-based awards granted to our employees. During fiscal year 2021, we recorded a
RMB18,228 million Anti-monopoly Fine and a RMB15,510 million share-based compensation expense
related to the mark-to-market adjustment of Ant Group share-based awards granted to our employees. All of
these impacts were excluded from our non-GAAP measures of profitability. Excluding these impacts,
income from operations would have decreased by RMB41,683 million year-over-year, from RMB123,416
million in fiscal year 2021 to RMB81,733 million (US$12,893 million) in fiscal year 2022, primarily due to
our increased investments in Taobao Deals and Taocaicai, our increased spending for user growth, as well as
our support to merchants.
Adjusted EBITDA and Adjusted EBITA
Adjusted EBITDA decreased 20% year-over-year to RMB158,205 million (US$24,956 million) in fiscal
year 2022, compared to RMB196,842 million in fiscal year 2021. Adjusted EBITA decreased 23% or
RMB40,056 million year-over-year to RMB130,397 million (US$20,570 million) in fiscal year 2022,
compared to RMB170,453 million in fiscal year 2021. The year-over-year decreases were primarily due to
our increased investments in Taobao Deals and Taocaicai, our increased spending for user growth, as well as
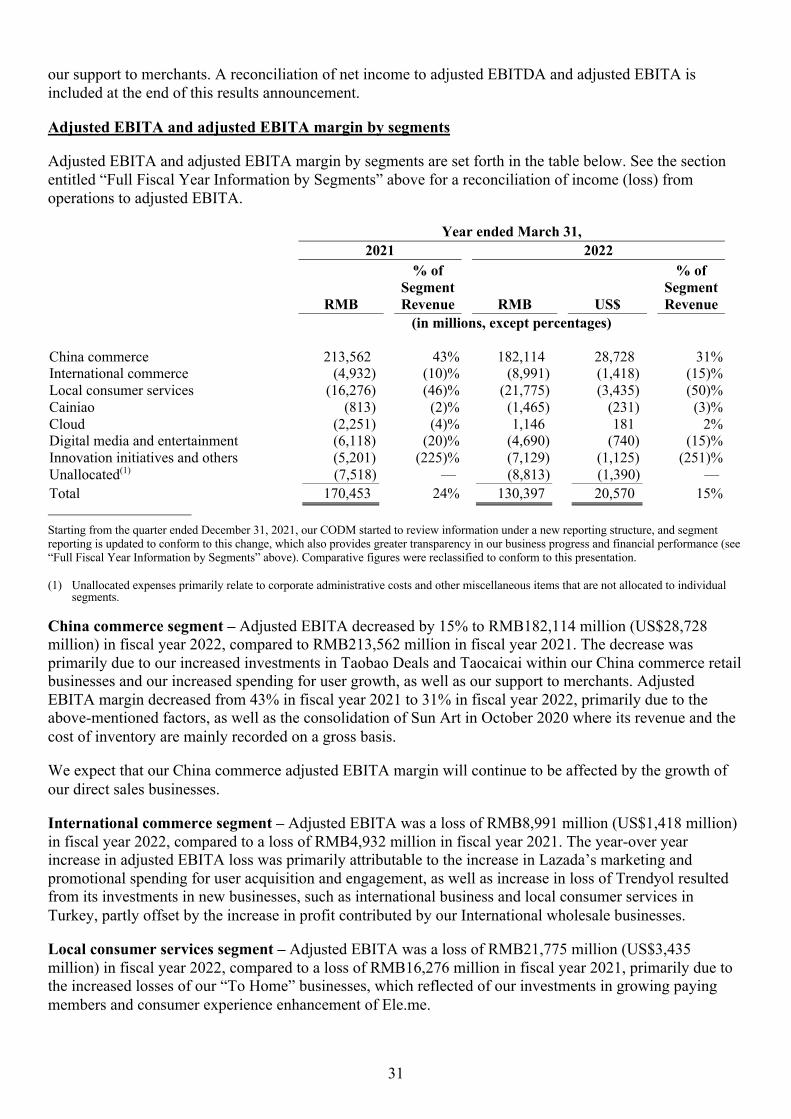
31
our support to merchants. A reconciliation of net income to adjusted EBITDA and adjusted EBITA is
included at the end of this results announcement.
Adjusted EBITA and adjusted EBITA margin by segments
Adjusted EBITA and adjusted EBITA margin by segments are set forth in the table below. See the section
entitled “Full Fiscal Year Information by Segments” above for a reconciliation of income (loss) from
operations to adjusted EBITA.
Year ended March 31, 2021 2022
RMB
% of Segment Revenue RMB US$
% of Segment Revenue
(in millions, except percentages) China commerce 213,562 43% 182,114 28,728 31% International commerce (4,932) (10)% (8,991) (1,418) (15)% Local consumer services (16,276) (46)% (21,775) (3,435) (50)% Cainiao (813) (2)% (1,465) (231) (3)% Cloud (2,251) (4)% 1,146 181 2% Digital media and entertainment (6,118) (20)% (4,690) (740) (15)% Innovation initiatives and others (5,201) (225)% (7,129) (1,125) (251)% Unallocated(1) (7,518) — (8,813) (1,390) — Total 170,453 24% 130,397 20,570 15%
Starting from the quarter ended December 31, 2021, our CODM started to review information under a new reporting structure, and segment reporting is updated to conform to this change, which also provides greater transparency in our business progress and financial performance (see “Full Fiscal Year Information by Segments” above). Comparative figures were reclassified to conform to this presentation. (1) Unallocated expenses primarily relate to corporate administrative costs and other miscellaneous items that are not allocated to individual
segments.
China commerce segment – Adjusted EBITA decreased by 15% to RMB182,114 million (US$28,728
million) in fiscal year 2022, compared to RMB213,562 million in fiscal year 2021. The decrease was
primarily due to our increased investments in Taobao Deals and Taocaicai within our China commerce retail
businesses and our increased spending for user growth, as well as our support to merchants. Adjusted
EBITA margin decreased from 43% in fiscal year 2021 to 31% in fiscal year 2022, primarily due to the
above-mentioned factors, as well as the consolidation of Sun Art in October 2020 where its revenue and the
cost of inventory are mainly recorded on a gross basis.
We expect that our China commerce adjusted EBITA margin will continue to be affected by the growth of
our direct sales businesses.
International commerce segment – Adjusted EBITA was a loss of RMB8,991 million (US$1,418 million)
in fiscal year 2022, compared to a loss of RMB4,932 million in fiscal year 2021. The year-over year
increase in adjusted EBITA loss was primarily attributable to the increase in Lazada’s marketing and
promotional spending for user acquisition and engagement, as well as increase in loss of Trendyol resulted
from its investments in new businesses, such as international business and local consumer services in
Turkey, partly offset by the increase in profit contributed by our International wholesale businesses.
Local consumer services segment – Adjusted EBITA was a loss of RMB21,775 million (US$3,435
million) in fiscal year 2022, compared to a loss of RMB16,276 million in fiscal year 2021, primarily due to
the increased losses of our “To Home” businesses, which reflected of our investments in growing paying
members and consumer experience enhancement of Ele.me.

32
Cainiao segment – Adjusted EBITA was a loss of RMB1,465 million (US$231 million) in fiscal year 2022,
compared to a loss of RMB813 million in fiscal year 2021. The year-over-year increase in loss was
primarily due to increase in operating cost as a result of our investment in expanding the global smart
logistics infrastructure, as well as the impact from COVID-19 and the Russia-Ukraine conflict.
Cloud segment (comprised of Alibaba Cloud and DingTalk) – Adjusted EBITA of Cloud segment, which
comprised of Alibaba Cloud and DingTalk, was a profit of RMB1,146 million (US$181 million) in fiscal
year 2022, compared to a loss of RMB2,251 million in fiscal year 2021, primarily attributable to the
realization of economies of scale, partly offset by our increased investments in DingTalk.
Digital media and entertainment segment – Adjusted EBITA in fiscal year 2022 was a loss of RMB4,690
million (US$740 million), compared to a loss of RMB6,118 million in fiscal year 2021, primarily due to our
disciplined investment in content and production capability, which resulted in narrowing of losses of Youku
year-over-year.
Innovation initiatives and others segment – Adjusted EBITA in fiscal year 2022 was a loss of RMB7,129
million (US$1,125 million), compared to a loss of RMB5,201 million in fiscal year 2021, primarily due to
our investments in technology and innovation.
Interest and investment income, net
Interest and investment income, net in fiscal year 2022 was a loss of RMB15,702 million (US$2,477
million), compared to a gain of RMB72,794 million in fiscal year 2021, primarily due to the net losses
arising from decrease in market prices of our listed equity investments in publicly-traded companies,
compared to net gains from these investments in fiscal year 2021.
The above-mentioned gains and losses were excluded from our non-GAAP net income.
Other income, net
Other income, net in fiscal year 2022 was RMB10,523 million (US$1,660 million), compared to RMB7,582
million in fiscal year 2021, primarily due to the increase in net exchange gain.
Income tax expenses
Income tax expenses in fiscal year 2022 were RMB26,815 million (US$4,230 million), compared to
RMB29,278 million in fiscal year 2021.
Excluding share-based compensation expense, revaluation and disposal gains/losses of investments,
impairment of goodwill and investments, as well as the deferred tax effects on basis differences arising from
equity method investees, our effective tax rate would have been 21% in fiscal year 2022.
Share of results of equity method investees
Share of results of equity method investees in fiscal year 2022 was RMB14,344 million (US$2,263 million),
compared to RMB6,984 million in fiscal year 2021. Share of results of equity method investees in fiscal
year 2022 and prior year consisted of the following:
Year ended March 31, 2021 2022 RMB RMB US$ (in millions)
Share of profit (loss) of equity method investees - Ant Group 19,693 24,084 3,799 - Others (1,016) (89) (14)

33
Impairment loss (7,256) (6,201) (978) Others(1) (4,437) (3,450) (544) Total 6,984 14,344 2,263
(1) “Others” mainly include amortization of intangible assets of equity method investees, share-based compensation expense related to share-based awards granted to employees of our equity method investees, as well as gain or loss arising from the dilution of our investment in equity method investees.
We record our share of results of all equity method investees one quarter in arrears. In connection with our
share of profit of Ant Group, although Ant Group’s operating profit decreased year-over-year, our share of
profit of Ant Group was still an increase year-over-year, mainly due to Ant Group’s recognition during the
twelve months ended December 31, 2021 of net gains attributable to the increases in fair values of certain
overseas investments it previously made. The increase in share of results of other equity method investees
was mainly due to the overall improvement in financial performance of our equity method investees.
Net income and Non-GAAP net income
Our net income in fiscal year 2022 was RMB47,079 million (US$7,427 million), compared to RMB143,284
million in fiscal year 2021. The year-over-year decrease was primarily due to the net losses arising from
decreases in the market prices of our equity investments in publicly-traded companies, compared to net
gains from these investments in last year.
Excluding the Anti-monopoly Fine, share-based compensation expense, revaluation and disposal
gains/losses of investments, impairment of goodwill and investments and certain other items, non-GAAP net
income in fiscal year 2022 was RMB136,388 million (US$21,515 million), a decrease of 21% compared to
RMB171,985 million in fiscal year 2021. A reconciliation of net income to non-GAAP net income is
included at the end of this results announcement.
Net income attributable to ordinary shareholders
Net income attributable to ordinary shareholders in fiscal year 2022 was RMB61,959 million (US$9,774
million), compared to RMB150,308 million in fiscal year 2021. The year-over-year decrease was primarily
due to the net losses arising from decreases in the market prices of our equity investments in publicly-traded
companies, compared to net gains from these investments in last year.
Diluted earnings per ADS/share and non-GAAP diluted earnings per ADS/share
Diluted earnings per ADS in fiscal year 2022 was RMB22.74 (US$3.59), a decrease of 58% compared to
RMB54.70 in fiscal year 2021. Excluding the Anti-monopoly Fine, share-based compensation expense,
revaluation and disposal gains/losses of investments, impairment of goodwill and investments and certain
other items, non-GAAP diluted earnings per ADS in fiscal year 2022 was RMB52.69 (US$8.31), a decrease
of 19% compared to RMB65.15 in fiscal year 2021.
Diluted earnings per share in fiscal year 2022 was RMB2.84 (US$0.45 or HK$3.50), a decrease of 58%
compared to RMB6.84 in fiscal year 2021. Excluding the Anti-monopoly Fine, share-based compensation
expense, revaluation and disposal gains/losses of investments, impairment of goodwill and investments and
certain other items, non-GAAP diluted earnings per share in fiscal year 2022 was RMB6.59 (US$1.04 or
HK$8.13), a decrease of 19%, compared to RMB8.14 in the fiscal year 2021.
A reconciliation of diluted earnings per ADS/share to non-GAAP diluted earnings per ADS/share is
included at the end of this results announcement. Each ADS represents eight ordinary shares.

34
Cash, cash equivalents and short-term investments
As of March 31, 2022, cash, cash equivalents and short-term investments were RMB446,412 million
(US$70,420 million), compared to RMB473,638 million as of March 31, 2021. The decrease in cash, cash
equivalents and short-term investments during the year ended March 31, 2022 was primarily due to cash
used in repurchase of ordinary shares of RMB61,225 million (US$9,658 million), cash used in investment
and acquisition activities of RMB52,848 million (US$8,337 million) and repayment of unsecured senior
notes of US$1,500 million, partly offset by the free cash flow generated from operations of RMB98,874
million (US$15,597 million).
Net cash from operating activities and free cash flow
Net cash provided by operating activities in fiscal year 2022 was RMB142,759 million (US$22,520 million),
a decrease of 38% compared to RMB231,786 million in the fiscal year 2021. Free cash flow decreased by
43% in fiscal year 2022 to RMB98,874 million (US$15,597 million), from RMB172,662 million in fiscal
year 2021, mainly due to a decrease in profit and the full payment in the amount of RMB18,228 million of
the Anti-monopoly Fine. A reconciliation of net cash provided by operating activities to free cash flow is
included at the end of this results announcement.
Net cash used in investing activities
During fiscal year 2022, net cash used in investing activities of RMB198,592 million (US$31,327 million)
primarily reflected (i) an increase in short-term investments by RMB106,984 million (US$16,876 million),
(ii) capital expenditures of RMB53,309 million (US$8,409 million), which included cash outflow for
acquisition of land use rights and construction in progress relating to office campuses of RMB11,281 million
(US$1,780 million), as well as (iii) cash outflow of RMB52,848 million (US$8,337 million) for investment
and acquisition activities. These cash outflows were partially offset by cash inflow of RMB15,468 million
(US$2,440 million) from disposal of investments.
Net cash used in financing activities
During fiscal year 2022, net cash used in financing activities of RMB64,449 million (US$10,167 million)
primarily reflected cash used in repurchase of ordinary shares of RMB61,225 million (US$9,658 million)
and repayment of unsecured senior notes of US$1,500 million, partially offset by the net cash inflow from
transactions with noncontrolling interests of RMB3,953 million (US$624 million).

35
WEBCAST AND CONFERENCE CALL INFORMATION
Alibaba Group’s management will hold a conference call to discuss the financial results at 7:30 a.m. U.S.
Eastern Time (7:30 p.m. Hong Kong Time) on May 26, 2022.
Details of the conference call are as follows:
International: +65 6780 1201
U.S.: +1 332 208 9458
U.K.: +44 20 3692 8123
Hong Kong SAR: +852 3018 8307
China Landline: 800 820 2079
China Mobile: 400 820 6895
Conference ID: 1388446 (English)
Conference ID: 5973677 (simultaneous interpretation in Chinese, listen only mode)
A live webcast of the earnings conference call can be accessed at
https://www.alibabagroup.com/en/ir/earnings. An archived webcast will be available through the same link
following the call. A replay of the conference call will be available for one week (dial-in number: +61 2
8199 0299; same conference ID as shown above).
Please visit Alibaba Group’s Investor Relations website at https://www.alibabagroup.com/en/ir/home on
May 26, 2022 to view the earnings release and accompanying slides prior to the conference call.
About Alibaba Group
Alibaba Group’s mission is to make it easy to do business anywhere. The company aims to build the future
infrastructure of commerce. It envisions that its customers will meet, work and live at Alibaba, and that it
will be a good company that lasts for 102 years.
Investor Relations Contact
Rob Lin
Investor Relations
Alibaba Group Holding Limited
Media Contacts:
Cathy Yan
Ivy Ke
EXCHANGE RATE INFORMATION
This results announcement contains translations of certain Renminbi (“RMB”) amounts into U.S. dollars
(“US$”) and Hong Kong dollars (“HK$”) for the convenience of the reader. Unless otherwise stated, all
translations of RMB into US$ were made at RMB6.3393 to US$1.00, the exchange rate on March 31, 2022
as set forth in the H.10 statistical release of the Federal Reserve Board, and all translations of RMB into
HK$ were made at RMB0.81101 to HK$1.00, the middle rate on March 31, 2022 as published by the
People’s Bank of China. The percentages stated in this announcement are calculated based on the RMB
amounts and there may be minor differences due to rounding.
SAFE HARBOR STATEMENTS

36
This announcement contains forward-looking statements. These statements are made under the “safe harbor”
provisions of the U.S. Private Securities Litigation Reform Act of 1995. These forward-looking statements
can be identified by terminology such as “may,” “will,” “expect,” “anticipate,” “future,” “aim,” “estimate,”
“intend,” “seek, ” “plan,” “believe,” “potential,” “continue,” “ongoing,” “target,” “guidance,” “is/are likely
to” and similar statements. In addition, statements that are not historical facts, including statements about
Alibaba’s strategies and business plans, Alibaba’s beliefs, expectations and guidance regarding the growth
of its business and its revenue, the business outlook and quotations from management in this announcement,
as well as Alibaba’s strategic and operational plans, are or contain forward-looking statements. Alibaba may
also make forward-looking statements in its periodic reports to the U.S. Securities and Exchange
Commission (the “SEC”), in announcements made on the website of The Stock Exchange of Hong Kong
Limited (the “Hong Kong Stock Exchange”), in press releases and other written materials and in oral
statements made by its officers, directors or employees to third parties. Forward-looking statements involve
inherent risks and uncertainties. A number of factors could cause actual results to differ materially from
those contained in any forward-looking statement, including but not limited to the following: Alibaba’s
ability to maintain the trusted status of its ecosystem; risks associated with sustained investments in
Alibaba’s business, strategic acquisitions and investments; Alibaba’s ability to maintain or grow its revenue
or business; Alibaba’s ability to continue to compete effectively and maintain and improve the network
effects of its ecosystem; company culture; Alibaba’s ability to continue to innovate; risks and challenges
associated with operating a complex and large-scale company; risks associated with our acquisitions,
investments and alliances; risks associated with expanding our international and cross-border businesses and
operations; uncertainties arising from competition among countries and geopolitical tensions, including
protectionist or national security policies; changes in laws, regulations and regulatory environment that
affect Alibaba’s business operations (including in the areas of anti-monopoly and unfair competition); risks
associated with the performance and regulatory environment of our business partners, including but not
limited to Ant Group; privacy and data protection regulations and concerns; security breaches; fluctuations
in general economic and business conditions in China and globally; impacts of the COVID-19 pandemic and
assumptions underlying or related to any of the foregoing. Further information regarding these and other
risks is included in Alibaba’s filings with the SEC and announcements on the website of the Hong Kong
Stock Exchange. All information provided in this results announcement is as of the date of this results
announcement and are based on assumptions that we believe to be reasonable as of this date, and Alibaba
does not undertake any obligation to update any forward-looking statement, except as required under
applicable law.
NON-GAAP FINANCIAL MEASURES
To supplement our consolidated financial statements, which are prepared and presented in accordance with
GAAP, we use the following non-GAAP financial measures: for our consolidated results, adjusted EBITDA
(including adjusted EBITDA margin), adjusted EBITA (including adjusted EBITA margin), non-GAAP net
income, non-GAAP diluted earnings per share/ADS and free cash flow. For more information on these non-
GAAP financial measures, please refer to the section entitled “Information about Segments” and the table
captioned “Reconciliations of Non-GAAP Measures to the Nearest Comparable U.S. GAAP Measures” in
this results announcement.
We believe that adjusted EBITDA, adjusted EBITA, non-GAAP net income and non-GAAP diluted
earnings per share/ADS help identify underlying trends in our business that could otherwise be distorted by
the effect of certain income or expenses that we include in income from operations, net income and diluted
earnings per share/ADS. We believe that these non-GAAP measures provide useful information about our
core operating results, enhance the overall understanding of our past performance and future prospects and
allow for greater visibility with respect to key metrics used by our management in its financial and
operational decision-making. We present three different income measures, namely adjusted EBITDA,
adjusted EBITA and non-GAAP net income in order to provide more information and greater transparency
to investors about our operating results.

37
We consider free cash flow to be a liquidity measure that provides useful information to management and
investors about the amount of cash generated by our business that can be used for strategic corporate
transactions, including investing in our new business initiatives, making strategic investments and
acquisitions and strengthening our balance sheet.
Adjusted EBITDA, adjusted EBITA, non-GAAP net income, non-GAAP diluted earnings per share/ADS
and free cash flow should not be considered in isolation or construed as an alternative to income from
operations, net income, diluted earnings per share/ADS, cash flows or any other measure of performance or
as an indicator of our operating performance. These non-GAAP financial measures presented here do not
have standardized meanings prescribed by U.S. GAAP and may not be comparable to similarly titled
measures presented by other companies. Other companies may calculate similarly titled measures
differently, limiting their usefulness as comparative measures to our data.
Adjusted EBITDA represents net income before (i) interest and investment income, net, interest expense,
other income, net, income tax expenses and share of results of equity method investees, (ii) certain non-cash
expenses, consisting of share-based compensation expense, amortization of intangible assets, depreciation
and impairment of property and equipment, operating lease cost relating to land use rights and impairment
of goodwill, and iii) a fine imposed pursuant to China’s Anti-monopoly Law, which we do not believe are
reflective of our core operating performance during the periods presented.
Adjusted EBITA represents net income before (i) interest and investment income, net, interest expense,
other income, net, income tax expenses and share of results of equity method investees, (ii) certain non-cash
expenses, consisting of share-based compensation expense, amortization of intangible assets and impairment
of goodwill, and iii) a fine imposed pursuant to China’s Anti-monopoly Law, which we do not believe are
reflective of our core operating performance during the periods presented.
Non-GAAP net income represents net income before share-based compensation expense, amortization of
intangible assets, impairment of goodwill and investments, a fine imposed pursuant to China’s Anti-
monopoly Law, gain or loss on deemed disposals/disposals/revaluation of investments and others, as
adjusted for the tax effects.
Non-GAAP diluted earnings per share represents non-GAAP net income attributable to ordinary
shareholders divided by the weighted average number of shares outstanding during the periods on a diluted
basis for computing non-GAAP diluted earnings per share. Non-GAAP diluted earnings per ADS
represents non-GAAP diluted earnings per share after adjustment to the ordinary share-to-ADS ratio.
Free cash flow represents net cash provided by operating activities as presented in our consolidated cash
flow statement less purchases of property and equipment (excluding acquisition of land use rights and
construction in progress relating to office campuses) and intangible assets, as well as adjustments to exclude
from net cash provided by operating activities the consumer protection fund deposits from merchants on our
marketplaces. We deduct certain items of cash flows from investing activities in order to provide greater
transparency into cash flow from our revenue-generating business operations. We exclude “acquisition of
land use rights and construction in progress relating to office campuses” because the office campuses are
used by us for corporate and administrative purposes and are not directly related to our revenue-generating
business operations. We also exclude consumer protection fund deposits from merchants on our
marketplaces because these deposits are restricted for the purpose of compensating consumers for claims
against merchants.
The section entitled “Information about Segments” and the table captioned “Reconciliations of Non-GAAP
Measures to the Nearest Comparable U.S. GAAP Measures” in this results announcement have more details
on the non-GAAP financial measures that are most directly comparable to GAAP financial measures and the
related reconciliations between these financial measures.

38
ALIBABA GROUP HOLDING LIMITED
UNAUDITED CONSOLIDATED INCOME STATEMENTS
Three months ended March 31, Year ended March 31, 2021 2022 2021 2022
RMB RMB US$ RMB RMB US$
(in millions, except per share data) (in millions, except per share data) Revenue 187,395 204,052 32,188 717,289 853,062 134,567 Cost of revenue (125,454) (138,945) (21,918) (421,205) (539,450) (85,096) Product development expenses (13,302) (10,944) (1,726) (57,236) (55,465) (8,749) Sales and marketing expenses (25,153) (27,200) (4,291) (81,519) (119,799) (18,898) General and administrative expenses (27,734) (7,415) (1,169) (55,224) (31,922) (5,036) Amortization of intangible assets (3,415) (2,831) (447) (12,427) (11,647) (1,837) Impairment of goodwill — — — — (25,141) (3,966)
(Loss) Income from operations (7,663) 16,717 2,637 89,678 69,638 10,985 Interest and investment income, net 111 (36,708) (5,791) 72,794 (15,702) (2,477) Interest expense (1,160) (1,189) (188) (4,476) (4,909) (774) Other income, net 2,115 1,620 256 7,582 10,523 1,660
(Loss) Income before income tax and share of results of equity method investees (6,597) (19,560) (3,086) 165,578 59,550 9,394
Income tax expenses (7,049) (2,079) (328) (29,278) (26,815) (4,230) Share of results of equity method
investees 5,992 3,282 518 6,984 14,344 2,263
Net (loss) income (7,654) (18,357) (2,896) 143,284 47,079 7,427 Net loss attributable to noncontrolling
interests(1) 2,288 2,241 354 7,294 15,170 2,393
Net (loss) income attributable to Alibaba Group Holding Limited(1)
(5,366) (16,116) (2,542) 150,578 62,249 9,820
Accretion of mezzanine equity (113) (125) (20) (270) (290) (46)
Net (loss) income attributable to ordinary shareholders(1)
(5,479) (16,241) (2,562) 150,308 61,959 9,774
(Loss) Earnings per share
attributable to ordinary shareholders(1) (2)
Basic (0.25) (0.76) (0.12) 6.95 2.87 0.45 Diluted (0.25) (0.76) (0.12) 6.84 2.84 0.45 (Loss) Earnings per ADS
attributable to ordinary shareholders(1) (2)
Basic (2.02) (6.07) (0.96) 55.63 22.99 3.63 Diluted (1.99) (6.07) (0.96) 54.70 22.74 3.59 Weighted average number of shares
used in calculating earnings per ordinary share (million shares)(2)
Basic 21,652 21,401 21,619 21,558 Diluted 22,024 21,401 21,982 21,787
(1) See "Full Fiscal Year Summary Financial Results" within this results announcement for more information about the attribution of a goodwill impairment charge to noncontrolling interests.

39
(2) Each ADS represents eight ordinary shares.

40
ALIBABA GROUP HOLDING LIMITED
REVENUE
The following table sets forth our revenue by segments for the periods indicated:
Three months ended March 31, Year ended March 31, 2021 2022 2021 2022
RMB RMB US$ RMB RMB US$
(in millions) (in millions) China commerce(1) 130,391 140,330 22,137 501,683 592,705 93,497 International commerce(2) 13,416 14,335 2,261 48,851 61,078 9,635 Local consumer services(3) 8,123 10,445 1,647 35,442 43,491 6,861 Cainiao(4) 9,959 11,582 1,827 37,258 46,107 7,273 Cloud(5) 16,865 18,971 2,993 60,558 74,568 11,763 Digital media and entertainment(6) 8,047 8,005 1,263 31,186 32,272 5,091 Innovation initiatives and others(7) 594 384 60 2,311 2,841 447
Total 187,395 204,052 32,188 717,289 853,062 134,567
Starting from the quarter ended December 31, 2021, our CODM started to review information under a new reporting structure, and segment reporting is updated to conform to this change, which also provides greater transparency in our business progress and financial performance (see “March Quarter Information by Segments” and “Full Fiscal Year Information by Segments” above). Comparative figures were reclassified to conform to this presentation.
(1) Revenue from China commerce is primarily generated from our China commerce retail business, including Taobao, Tmall, Sun Art,
Tmall Supermarket and Freshippo, as well as China commerce wholesale business including 1688.com.
(2) Revenue from International commerce is primarily generated from our international commerce retail business, including Lazada and AliExpress, as well as our international commerce wholesale business including Alibaba.com.
(3) Revenue from Local consumer services is primarily generated from Ele.me.
(4) Revenue from Cainiao is primarily generated from our domestic and international one-stop-shop logistics services and supply chain management solutions.
(5) Revenue from Cloud is primarily generated from the provision of services, such as elastic computing, database, storage, network virtualization services, large scale computing, security, management and application services, big data analytics, a machine learning platform and IoT services.
(6) Revenue from Digital media and entertainment is primarily generated from Youku and other content platforms, as well as online games business.
(7) Revenue from Innovation initiatives and others is primarily generated from businesses such as Tmall Genie and other innovation initiatives. Other revenue also includes SME annual fee received from Ant Group and its affiliates.

41
ALIBABA GROUP HOLDING LIMITED
INFORMATION ABOUT SEGMENTS
The following table sets forth our income (loss) from operations by segments for the periods indicated:
Three months ended March 31, Year ended March 31, 2021 2022 2021 2022 RMB RMB US$ RMB RMB US$
(in millions) (in millions) China commerce 36,165 32,471 5,123 197,135 172,219 27,167 International commerce (3,416) (1,918) (303) (9,361) (10,655) (1,681) Local consumer services (9,443) (6,503) (1,026) (29,100) (30,485) (4,809) Cainiao (1,089) (1,081) (171) (3,964) (3,920) (618) Cloud (2,337) 598 94 (12,479) (5,167) (815) Digital media and entertainment (3,565) (2,170) (342) (10,321) (7,019) (1,107) Innovation initiatives and others (2,135) (2,727) (430) (7,802) (9,424) (1,487) Unallocated (21,843) (1,953) (308) (34,430) (35,911) (5,665) Total (7,663) 16,717 2,637 89,678 69,638 10,985
Starting from the quarter ended December 31, 2021, our CODM started to review information under a new reporting structure, and segment reporting is updated to conform to this change, which also provides greater transparency in our business progress and financial performance (see “March Quarter Information by Segments” and “Full Fiscal Year Information by Segments” above). Comparative figures were reclassified to conform to this presentation.
The following table sets forth our adjusted EBITA by segments for the periods indicated:
Three months ended March 31, Year ended March 31,
2021 2022 2021 2022
RMB RMB US$ RMB RMB US$ (in millions) (in millions) China commerce 39,500 32,149 5,071 213,562 182,114 28,728 International commerce (2,483) (2,563) (404) (4,932) (8,991) (1,418) Local consumer services (6,633) (5,483) (865) (16,276) (21,775) (3,435) Cainiao (585) (912) (144) (813) (1,465) (231) Cloud (342) 276 44 (2,251) 1,146 181 Digital media and entertainment (2,698) (1,966) (310) (6,118) (4,690) (740) Innovation initiatives and others (1,648) (2,452) (387) (5,201) (7,129) (1,125) Unallocated (2,499) (3,238) (511) (7,518) (8,813) (1,390) Total 22,612 15,811 2,494 170,453 130,397 20,570
Starting from the quarter ended December 31, 2021, our CODM started to review information under a new reporting structure, and segment reporting is updated to conform to this change, which also provides greater transparency in our business progress and financial performance, (see “March Quarter Information by Segments” and “Full Fiscal Year Information by Segments” above). Comparative figures were reclassified to conform to this presentation.

CONFIDENTIAL
42
ALIBABA GROUP HOLDING LIMITED
UNAUDITED CONSOLIDATED BALANCE SHEETS
As of March 31, As of March 31,
2021 2022
RMB RMB US$ (in millions) Assets Current assets:
Cash and cash equivalents 321,262 189,898 29,956 Short-term investments 152,376 256,514 40,464 Restricted cash and escrow receivables 35,207 37,455 5,908 Equity securities and other investments 9,807 8,673 1,368 Prepayments, receivables and other assets(1) 124,708 145,995 23,030
Total current assets 643,360 638,535 100,726
Equity securities and other investments 237,221 223,611 35,274 Prepayments, receivables and other assets 98,432 113,147 17,849 Investment in equity method investees 200,189 219,642 34,648 Property and equipment, net 147,412 171,806 27,102 Intangible assets, net 70,833 59,231 9,343 Goodwill 292,771 269,581 42,525 Total assets 1,690,218 1,695,553 267,467
Liabilities, Mezzanine Equity and Shareholders’ Equity
Current liabilities: Current bank borrowings 3,606 8,841 1,395 Current unsecured senior notes 9,831 — — Income tax payable 25,275 21,753 3,431 Accrued expenses, accounts payable and other
liabilities 261,140 271,460 42,822 Merchant deposits 15,017 14,747 2,326 Deferred revenue and customer advances 62,489 66,983 10,566
Total current liabilities 377,358 383,784 60,540
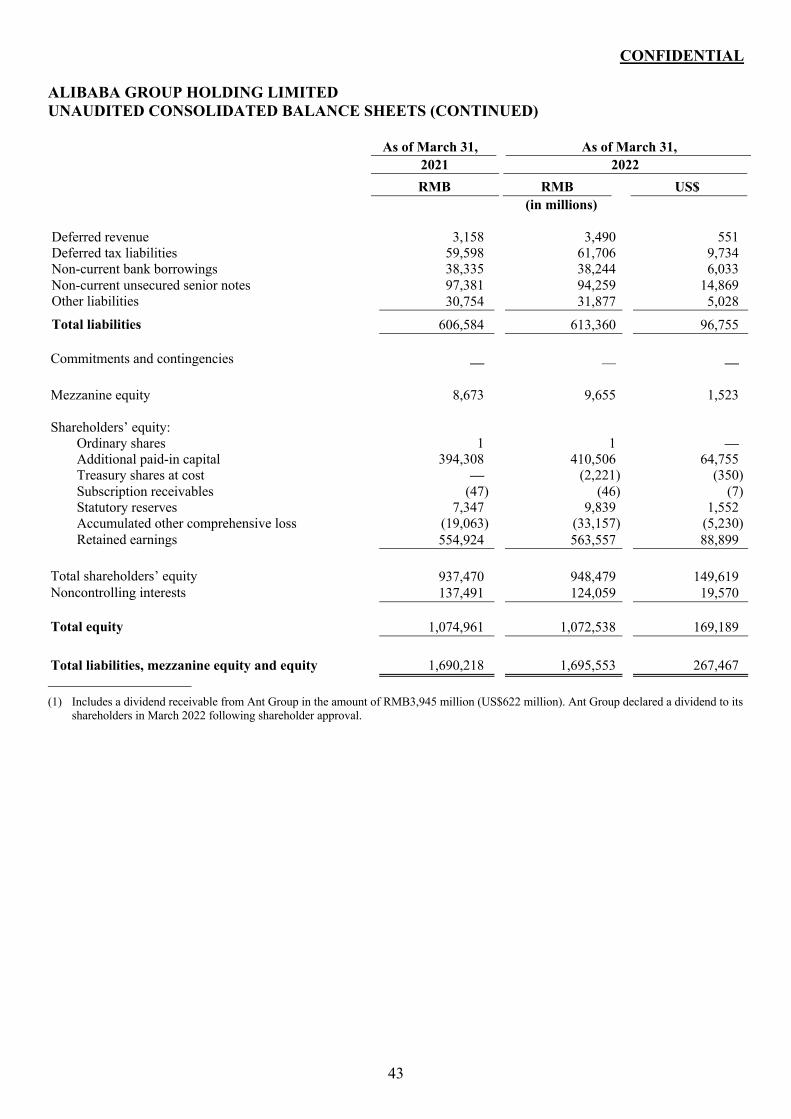
CONFIDENTIAL
43
ALIBABA GROUP HOLDING LIMITED
UNAUDITED CONSOLIDATED BALANCE SHEETS (CONTINUED)
As of March 31, As of March 31,
2021 2022
RMB RMB US$ (in millions) Deferred revenue 3,158 3,490 551 Deferred tax liabilities 59,598 61,706 9,734 Non-current bank borrowings 38,335 38,244 6,033 Non-current unsecured senior notes 97,381 94,259 14,869 Other liabilities 30,754 31,877 5,028
Total liabilities 606,584 613,360 96,755 Commitments and contingencies — — —
Mezzanine equity 8,673 9,655 1,523
Shareholders’ equity:
Ordinary shares 1 1 — Additional paid-in capital 394,308 410,506 64,755 Treasury shares at cost — (2,221) (350) Subscription receivables (47) (46) (7) Statutory reserves 7,347 9,839 1,552 Accumulated other comprehensive loss (19,063) (33,157) (5,230) Retained earnings 554,924 563,557 88,899
Total shareholders’ equity 937,470 948,479 149,619 Noncontrolling interests 137,491 124,059 19,570 Total equity 1,074,961 1,072,538 169,189
s Total liabilities, mezzanine equity and equity 1,690,218 1,695,553 267,467
(1) Includes a dividend receivable from Ant Group in the amount of RMB3,945 million (US$622 million). Ant Group declared a dividend to its shareholders in March 2022 following shareholder approval.

CONFIDENTIAL
44
ALIBABA GROUP HOLDING LIMITED
UNAUDITED CONDENSED CONSOLIDATED STATEMENTS OF CASH FLOWS
Three months ended March 31, Year ended March 31, 2021 2022 2021 2022
RMB RMB US$ RMB RMB US$ (in millions) (in millions) Net cash provided by (used in)
operating activities 24,183 (7,040) (1,111) 231,786 142,759 22,520 Net cash used in investing activities (27,701) (87,254) (13,764) (244,194) (198,592) (31,327) Net cash provided by (used in)
financing activities 30,270 (10,614) (1,675) 30,082 (64,449) (10,167) Effect of exchange rate changes on
cash and cash equivalents, restricted cash and escrow receivables 1,149 (913) (143) (7,187) (8,834) (1,394)
Increase (decrease) in cash and cash
equivalents, restricted cash and escrow receivables 27,901 (105,821) (16,693) 10,487 (129,116) (20,368)
Cash and cash equivalents, restricted cash and escrow receivables at beginning of period 328,568 333,174 52,557 345,982 356,469 56,232
Cash and cash equivalents, restricted
cash and escrow receivables at end of period 356,469 227,353 35,864 356,469 227,353 35,864

CONFIDENTIAL
45
ALIBABA GROUP HOLDING LIMITED
RECONCILIATIONS OF NON-GAAP MEASURES TO THE NEAREST COMPARABLE U.S.
GAAP MEASURES
The table below sets forth a reconciliation of our net income to adjusted EBITA and adjusted EBITDA
for the periods indicated:
Three months ended March 31, Year ended March 31, 2021 2022 2021 2022
RMB RMB US$ RMB RMB US$ (in millions) (in millions)
Net (loss) income (7,654) (18,357) (2,896) 143,284 47,079 7,427 Adjustments to reconcile net
(loss) income to adjusted EBITA and adjusted EBITDA:
Interest and investment
income, net (111) 36,708 5,791 (72,794) 15,702 2,477 Interest expense 1,160 1,189 188 4,476 4,909 774 Other income, net (2,115) (1,620) (256) (7,582) (10,523) (1,660) Income tax expenses 7,049 2,079 328 29,278 26,815 4,230 Share of results of equity
method investees (5,992) (3,282) (518) (6,984) (14,344) (2,263)
(Loss) Income from operations (7,663) 16,717 2,637 89,678 69,638 10,985 Share-based compensation
expense 8,632 (3,737) (590) 50,120 23,971 3,782 Amortization of intangible
assets 3,415 2,831 447 12,427 11,647 1,837 Fine imposed pursuant to
China’s Anti-monopoly Law 18,228 — — 18,228 — —
Impairment of goodwill — — — — 25,141 3,966
Adjusted EBITA 22,612 15,811 2,494 170,453 130,397 20,570 Depreciation and impairment
of property and equipment, and operating lease cost relating to land use rights 7,286 7,562 1,193 26,389 27,808 4,386
Adjusted EBITDA 29,898 23,373 3,687 196,842 158,205 24,956

CONFIDENTIAL
46
ALIBABA GROUP HOLDING LIMITED
RECONCILIATIONS OF NON-GAAP MEASURES TO THE NEAREST COMPARABLE U.S.
GAAP MEASURES (CONTINUED)
The table below sets forth a reconciliation of our net (loss) income to non-GAAP net income for the
periods indicated:
Three months ended March 31, Year ended March 31, 2021 2022 2021 2022
RMB RMB US$ RMB RMB US$ (in millions) (in millions)
Net (loss) income (7,654) (18,357) (2,896) 143,284 47,079 7,427 Adjustments to reconcile net
(loss) income to non-GAAP net income: Share-based compensation
expense 8,632 (3,737) (590) 50,120 23,971 3,782 Amortization of intangible
assets 3,415 2,831 447 12,427 11,647 1,837 Impairment of goodwill and
investments 532 5,303 837 14,737 40,264 6,351 Loss (Gain) on deemed
disposals/disposals/ revaluation of investments and others 3,085 37,845 5,970 (66,305) 21,671 3,419
Fine imposed pursuant to China’s Anti-monopoly Law 18,228 — — 18,228 — —
Tax effects (1) (22) (4,086) (645) (506) (8,244) (1,301) Non-GAAP net income 26,216 19,799 3,123 171,985 136,388 21,515
(1) Tax effects primarily comprises tax effects relating to share-based compensation expense, amortization of intangible assets and certain gains and losses from investments, and others.

CONFIDENTIAL
47
ALIBABA GROUP HOLDING LIMITED
RECONCILIATIONS OF NON-GAAP MEASURES TO THE NEAREST COMPARABLE U.S.
GAAP MEASURES (CONTINUED)
The table below sets forth a reconciliation of our diluted (loss) earnings per share/ADS to non-GAAP diluted earnings per share/ADS for the periods indicated:
Three months ended March 31, Year ended March 31, 2021 2022 2021 2022 RMB RMB US$ RMB RMB US$ (in millions, except per share data) (in millions, except per share data)
Net (loss) income attributable
to ordinary shareholders – basic (5,479) (16,241) (2,562) 150,308 61,959 9,774
Dilution effect on earnings arising from option plans operated by equity method investees and subsidiaries (2) (8) (1) (55) (37) (6)
Net (loss) income attributable to ordinary shareholders – diluted (5,481) (16,249) (2,563) 150,253 61,922 9,768
Non-GAAP adjustments to net income attributable to ordinary shareholders(1) 33,870 37,703 5,948
28,701 81,593 12,871
Non-GAAP net income
attributable to ordinary shareholders for computing non-GAAP diluted earnings per share/ADS 28,389 21,454 3,385 178,954 143,515 22,639
Weighted average number of
shares on a diluted basis for computing non-GAAP diluted earnings per share/ADS (million shares)(4) 22,024 21,599 21,982 21,787
Diluted (loss) earnings per
share(2)(4) (0.25) (0.76) (0.12) 6.84 2.84 0.45
Non-GAAP diluted earnings
per share(3)(4) 1.29 0.99 0.16 8.14 6.59 1.04 Diluted (loss) earnings per
ADS(2)(4) (1.99) (6.07) (0.96) 54.70 22.74 3.59
Non-GAAP diluted earnings
per ADS(3)(4) 10.32 7.95 1.25 65.15 52.69 8.31
(1) See the table above for the reconciliation of net (loss) income to non-GAAP net income for more information of these non-GAAP adjustments.
(2) Diluted (loss) earnings per share is derived from net (loss) income attributable to ordinary shareholders for computing diluted (loss) earnings per share divided by weighted average number of shares on a diluted basis. Diluted (loss) earnings per ADS is derived from the diluted (loss) earnings per share after adjustment to the ordinary share-to-ADS ratio.
(3) Non-GAAP diluted earnings per share is derived from non-GAAP net income attributable to ordinary shareholders for computing non-GAAP diluted earnings per share divided by weighted average number of shares on a diluted basis for computing non-GAAP diluted earnings per share. Non-GAAP diluted earnings per ADS is derived from the non-GAAP diluted earnings per share after adjustment to the ordinary share-to-ADS ratio.
(4) Each ADS represents eight ordinary shares.

CONFIDENTIAL
48
ALIBABA GROUP HOLDING LIMITED
RECONCILIATIONS OF NON-GAAP MEASURES TO THE NEAREST COMPARABLE U.S.
GAAP MEASURES (CONTINUED)
The table below sets forth a reconciliation of net cash provided by operating activities to free cash flow
for the periods indicated:
Three months ended March 31, Year ended March 31, 2021 2022 2021 2022
RMB RMB US$ RMB RMB US$ (in millions) (in millions)
Net cash provided by (used in) operating activities 24,183 (7,040) (1,111) 231,786 142,759 22,520
Less: Purchase of property and equipment (excluding land use rights and construction in progress relating to office campuses) (6,043) (9,201) (1,451) (36,160) (42,028) (6,630)
Less: Acquisition of intangible assets (2) — — (1,735) (15) (2)
Less: Changes in the consumer protection fund deposits (18,796) 1,171 185 (21,229) (1,842) (291)
Free cash flow (658) (15,070) (2,377) 172,662 98,874 15,597