
THE ANALYST
98
THE ANALYST THE JOURNAL OF The Society for Analytical Chemistry A MONTHLY JOURNAL DEVOTED TO THE ADVANCEMENT OF ANALYTICAL CHEMISTRY VOL. 91 1966 PUBLISHED FOR THE SOCIFT 'i W. HEl"FEP. & LTD. 4 PETTY CURY. CAMBRIDCE. ENGLAND
-
Upload
khangminh22 -
Category
Documents
-
view
4 -
download
0
Transcript of THE ANALYST

THE ANALYSTTHE JOURNAL OF
The Society for Analytical Chemistry
A MONTHLY JOURNAL DEVOTED
TO THE ADVANCEMENT OF
ANALYTICAL CHEMISTRY
VOL. 911966
PUBLISHED FOR THE SOCIFT 'i '~y
W. HEl"FEP. & ~ONS.· LTD.
4 PETTY CURY. CAMBRIDCE. ENGLAND

THE ANALYST
EDITORIAL COMMITTEE
Chairman: K. A. WILLIAMS, B.Se., Ph.D., F.RI.e., A.lnst.P., M.Inst.Pet.
B. BAGSHAWE, A.Met., F.1.M., M.Inst.F.E. BISHOP, B.Se., A.Re.S.T., F.RI.e.H. E. BROOKES, B.Se., F.RI.e.H. ]. CLULEY, M.Sc., Ph.D., F.RI.C.D. 1. COOMBER, B.Se., Ph.D., A.RI.e.W. T. ELWELL, F.RI.e.P. S. HALL, B.Sc., F.RI.C.J. F. HERRINGSHAW, B.Sc., Ph.D., A.R.e.S.,
D.I.C., F.RI.e.
A. G. HILL, F.RI.C.E. A. HONTOIR, B.Sc., A.I.M.H. M. N. H. IRVING, M.A., D.Phil., D.Sc.,
F.RI.e.D. MOORE
G. NICKLESS, B.Sc., Ph.D.
W. H. C. SHAW, F.P.S., F.R.I.C.
T. S. WEST, B.Sc., Ph.D., D.Sc., F.R.I.C.
The Chairman of the Analytical Abstracts Committee(A. G. JONES, B.Sc., F.RI.C.)
The Chairman of the Analytical Methods Committee(D. C. GARRATT, Ph.D., D.Se., F.RI.e., Hon.M.P.S.)
AND THE PRESIDENT AND HONORARY OFFICERS
President of the Society
A. A. SMALES, O.B.E., D.Sc., F.R.I.C.
Hon. Secretary of the Society
S. A. PRICE, B.Sc., F.RI.C.Hon. Treasurer of the Society
D. T. LEWIS, e.B., Ph.D., D.Sc., M.R.S.H., F.RI.C.
Hon Assistant Secretaries of the Society
B. S. COOPER, B.Sc., F.Inst.P.; D. W. WILSON, M.Sc., F.RI.C.
Editor
J. B. ATTRILL, M.A., F.RI.e.
Assistant Editor
Miss C. M. RICHARDS, B.Sc.

INDEX TO VOLUME 91INDEX TO AUTHORS
AAbbott, D. C., Bunting, J. A., and Thomson, J.
Determination of residues of dimethoate withmulti-band chromatoplates, 94.
Abel, E. Review of Larsen's Transitional Elements296. '
Abresch, X., and Claasen, I. Coulometric Analysis.Translated by L. L. Leveson. (Review). 58.
Adams, D. B. Determination of total availableoxygen in di-tertiary butyl peroxide, 397.
Adkins, J. E., jun. See Dean, J. A.Allinger, N. L.. See Eliel, E. L.Amas, S. A. H., and Yallop, H. J. Detection of
dinitro and trinitro aromatic bodies in industrialblasting explosives, 336.
Anderson, D. M. W. Review of Belcher's SubmicroMethods of Organic Analysis, 823.
Anderson, J. H. Oxidation of hydroxylamine in~~~~um hydroxide in the presence of copper(II),
Andrew, T. R., and Nichols, P. N. R. Direct photometric determination of boron in nickel, 664.
Angell, F. G. Review of Buchachenko's StableRadicals, 542. Review of Willemsens and Vander Kerk's Investigations in the Field of OrganoleadChemistry, 750.
Anger, V. See Feigl, F.Angyal, S. J. See Eliel, E. L.Ashmore, P. G. Principles of Reaction Kinetics.
(Review),60.Aspinal, M. L. Vacuum fusion analysis with a
mass spectrometer, 33.Assenheim, H. M. Review of Bersohn and Baird's
Introduction to Electron Paramagnetic Resonance681. '
Athavale, V. T., Desai, H. B., Gangadharan, S.,Pendharkar, M. S., and Das, M. S. Activationanalysis for titanium and niobium with fastneutrons, 638.
BBaar, S. Micro-determination of cyanide: applica-
tion to whole blood, 268.Baev, A. A. See Venkstern, T. V.Baird, J. C. See Bersohn, M.Baker, A. J., and Cairns, T. Spectroscopy in
Education. Vol. 2. (Review), 218.Bakes, J. M., and Jeffery, P. G. Determination of
fluorine by neutron activation, 216.Banham, M. F., Fudge, A. J., and Howes, J. H.
Use of lithium-drifted germanium diodes for')I-spectrometric determination of radioactivefission-product nuclides, 180.
Barakat, M. Z., and Shaker, M. Micro-determination of isoniazid by N-bromosuccinimide, 466.
Bark, L. S. Review of Macek and Hais' Stationary:t;.se in Paper and Thin-layer Chromatography,
Barker, N. T. See Xhattak, M. N.Barnard, J. A., and Chayen, R. Modern Methods of
Chemical Analysis. (Review), 60.Barua,.R. K., a~d Rao, M. V. X. Spectrophoto
metrIC determmation of vitamin D in freshwater fish liver oils, 567.
Bassett, J.., a~d Jones, J. C. H. Spectrophotometric~etermmatlOnof 0·01 to 0·1 per cent. of antimonym lead, 176. Polarographic determination of0·01 to 0·10 per cent. of bismuth in lead, 591.
Bastings, L. See Claassen, A.Bates, R. G. Electrochemical Analysis: Studies of
Acids, Bases and Salts by E.M.F., Conductance,Optical and Kinetic Methods. (Review), 403.
Bauminger, B. B., and Walters, G. Micro-determination of inorganic phosphorus in plasma, 205.
Beaven, G. H. Review of Baker and Cairns'Spectroscopy in Education. Vol. 2, 218. Reviewof Developments in Applied Spectroscopy. Vol. 4,606. Review of Venkstern and Baev's AbsorptionSpectra of Minor Bases, 607.
Beckmann, T. J. See Hamilton, D. 1.Belcher, R. Review of Cheronis, Entrikin and
Hodnett's Semimicro Qualitative Organic Analysis.3rd Edn., 220. Review of Microchemical Techniques, 679. Submicro Methods of OrganicAnalysis. (Review), 823.
Belkas, E. P., and Souliotis, A. G. Simultaneousdetermination of iodine and bromine in urine byneutron-activation analysis, 199.
Bell, G. J. See Lloyd, G. A.Bell, R. X. Methods for the Chemical Analysis of
NBS Copper-Base Spectrochemical Standards.(Review),473.
Berka, A., Vulterin, J., and Zyka, J. Newer RedoxTitrants. Translated by H. Weisz. (Review),338.
Ber~heim, R. Optical Pumping. (Review), 471.Bersls, D., and Vassiliou, E. Chemiluminescence
method for determining ozone, 499.Bersohn, M., and Baird, J. C. Introduction to
Electron Paramagnetic Resonance. (Review),681.
Beynon, X. I., and Elgar, X. E. Analysis forresidues of chlorinated insecticides and acaricides:review, 143.
Bible, R. H., jun. Interpretation of NMR Spectra:Empirical Approach. (Review), 58.
Biraben Scott, B. See Scott, B. B.Birnie, A. C. See Mitchell, B. D.Bishop, E. Review of Abresch and Claasen's
Coulo~etric Analysis, 58. Review of Topp'sChemtstry of the Rare-Earth Elements, 61. Reviewof Turney's Oxidation Mechanism, 61. Reviewof Colorimeters with Flow-through Cells, 62.Review of Rich's Periodic Correlations, 62.Review of Delahay's Double Layer and ElectrodeKinetics, 294. Review of Berka, Vulterin andZyka's Newer Redox Titrants, 338. Review ofWiberg's Computer Programming for Chemists,339. Review of Bates' Electrochemical Analysis,403. Review of Cumper's Wave Mechanics forChemists, 403. Review of Fowler, Harmon andRoe's Analysis Instrumentation-1965, 824.
Bradstreet, R. B. Kjeldahl Method for OrganicNitrogen. (Review), 470.
Braid, P., Hunter, J. A., Massie, W. H. S., Nicholson,1. D., and Pearce, B. E. Factors affecting thedetermination of carbon dioxide by non-aqueoustitrimetry, 439.
Browett, E. V. See Moss, R.Buchachenko, A. L. Stable Radicals. (Review),
542.Bundy, J. X. See Goode, G. C.Bunting, J. A. See Abbott, D. C.Burgess, A. E., and Latham, J. L. Determination
of phenol, o-cresol and p-cresol in aqueous solutionby a kinetic method, 343; Erratum, 546.

vi INDEX TO VOLUME 91
Burt, M. W. G., and Kaye, B. H. Comparison ofparticle-size analysis results obtained by using acentrifugal photosedimentometer with thoseobtained with centrifugal pipette equipment, 547.
Burton, J. D., Love, R. M., and Mercer, E. R.Use of 8-hydroxyquinoline for separation ofyttrium-90 in determination of strontium-90 inbiological materials, 739.
Butt, J. B. See savage, H. R.Buzas, I. Editor of Erdey's Gravimetric Analysis.
Part II. (Review), 64; Part III, 676.
CCairns, T. See Baker, A. J.Caldas, A. See Feigl, F.Calderbank, A., and Yuen, S. H. Determining
residues of diquat, 625.Campion, P. See Walker, J. A. J.Carr-Brion, K. G. Effect of particle size on back
scattered X-ray correction methods in on-streamX-ray fluorescence analysis, 289.
Carritt, D. E. See Green, E. ;YoCartwright, M., and Heywood, A. Use of molecular
sieve 5A for collecting fractions from a gaschromatograph, 337.
Catanzaro, G. See Marten, J. F.Oelap, M. B. See Pejkovic-Tadic, I.cerrai, E., and Ghersini, G. Organic-phase spectro
photometric determination of iron with thiocyanate, 662.
Chalmers, R. A. Review of Duval's L'AnalyseChimique Quantitative, 472.
Chapman, H. See Melhuish, K. R.Chaudhry, I. A., and Cornfield, A. H. Determina
tion of total sulphur in soil and plant material,528.
Chayen, R. See Barnard, J. A.Cheronis, N. D., Entrikin, J. B., and Hodnett, E. M.
Semimicro Qualitative Organic Analysis. 3rdEdn. (Review), 220.
C!aasen, I. See Abresch, K.Claassen, A., and Bastings, L. Determination of
nickel with dimethylglyoxime in iron and steelcontaining cobalt and copper, 725.
Clark, M. L. See Jennison, W.Cluley, H. J. Review of Moses' Nuclear Techniques
in Analytical Chemistry, 403.Cobb, W. D. See Harrison, T. S.Conacher, H. B. S., and Rees,. D. I. Detection and
estimation of ethylene glycol in propylene glycolby thin-layer chromatography, 55.
Cooke, J. R. See Wilson, A. D.Cooper, F. A., and Quayle,;Y. C. Precise coulometry:
titration of pure sodium carbonate, 363.- See also Quayle, ;Yo C.Corbett, J. A., and Guerin, B. D. Determination of
aluminium in iron and steel, 490; Erratum, 610.Cornfield, A. H. See Chaudhry, I. A.Coutts, R. T., and Smail, G. A. Polysaccharides,
Peptides and Proteins. Vol. 4. (Review), 822.COli:, J. D. Review of Perry and Weissberger's
Distillation. 2nd Edn., 221.Crawford, R. See Hine, R. A.Crompton, T. R. Iodimetric determination of
organo-aluminium compounds, 374.Cumper, C. W. N. Wave Mechanics for Chemists.
(Review), 403.Curry, A. S., Walker, G. W., and SimpSOn, G. S.
Determination of ethanol in blood by gas chromatography, 742.
Curthoys, G., and Simpson, J. R. Determination ofzinc in trace-element superphosphate by a.c.polarography, 195.
Cuypers, II. Y. See Wyk, ;Yo M. van.
DDalziel, ;Yo A. W., and Thompson, M. Solvent
extraction and absorptiometric determination ofiron with 2-mercaptopyridine-I-oxide, 98.
Damokos, T. Translator of Pungor's Oscillometryand Conductometry. (Review), 339.
Das, II. S. See Athavale, V. T.Davies, D. I. Editor of Savidan's Chromatography,
471.Davis, E. N. Developments in Applied Spectro
scopy. Vol. 4. (Review). 606.Dean, G. A. Colorimetric finish for the Johnson
Nishita micro-distillation of sulphur, 530.Dean, J. A., and Adkins, J. E., jun. Excitation
gradients in acetylene - oxygen flames, 709.de Koning. A. J. See Koning, A. J. de.Delahay, P. Double Layer and Electrode Kinetics.
(Review), 294.Delves, R. B., and Williams, V. P. Analysis of
fenitrothion by infrared method, 779.Denton, C. L., and Whitehead, ;Yo Automatic
apparatus for determination of titanium, 224.Desai, H. B. See Athavale, V. T.Deutschman, ;Yo E. See Hine, R. A.Dicker, D. W. G., and Newlove, T. H. Colorimetric
determination of sodium isethionate by means ofammonium ceric nitrate, 563.
Dickinson, D. Determination of thiourea in sewageand industrial effluents, 809.
Djurkin, V., Kirkbright, G. F., and West, T. S.Spectrophotometric determination of phosphorus,89.
Drummond, J. L. See Sinclair, V. M.Duval, C. L' Analyse Chimique Quantitative.
(Review), 472.
EEdmundson, I. C. Calibration of a Fisher air
permeability apparatus for determining specificsurface, 306.
Elgar, K. E. See Beynon, K. I.Eliel, E. L., Allinger, N. L., Angyal, S. J., and Morri
sion, G. A. Conformational Analysis. (Review),136.
Elinson, S. V., and Petrov, K. L Analytical Chemistry of Zirc':mium and Hafnium. (Review), 680.
Elvidge, D. A. Review of Szymanski's InfraredBand Handbook Supplements 3 and 4,823.
Elwell, W. T. Review of Reilley's Advances inAnalytical Chemistry and Instrumentation, Vol. 4,61. Review of Moshier and Sievers' Gas Chromatography of Metal Chelates, 219. Review ofBell's Methods for the Chemical Analysis ofNBS Copper-Base Spectrochemical Standards,473. Review of Nemodruk and Karalova'sAnalytical Chemistry of Boron, 545. Review ofElinson and Petrov's Analytical Chemistry ofZirconium and Hafnium, 680.
- and Wood, D. F. Analysis of the New MetalsTitanium, Zirconium, Hafnium, Niobium, Tantalum, Tungsten and their Alloys. (Review), 821.
Emmott, P., and Law, G. Flame-photometricdetermination of traces of calcium in lithiumchloride, 383.
Emsley, J. W., Feeney, J., and Sutcliffe, L. H.High Resolution Nuclear Magnetic ResonanceSpectroscopy. Vol. I. (Review), 678; Vol. II,820.
Entrikin, J. B. See Cheronis, N. D.Erdey, L. Gravimetric Analysis. Part II. Trans
lated by G. Svehla. Edited by I. Buzas. (Review), 64; Part 111,676.
Evers, N. Review of Enzyme Nomenclatul'e, 142.

INDEX TO VOLUME 91 vii
FFeeney, J. See Emsley, J. W.Feigl, F., and Anger, V. Replacement of benzidine
by copper ethylacetoacetate and tetra base asspot-test reagent for hydrogen cyanide andcyanogen, 282.
- and Caldas, A. Specific spot tests for silvercyanide, 654.
Feinberg, J. G. See Smith, I.Field, K., and Godly, E. W. Determination of
quinizarin in hydrocarbon oil, 287.Fite, L. E. See Wyk, J. M. van.Flaschka, H. See 8chwarzenbach, G.Fleck, A. See Munro, H. H.Flynn, L. R. See Hall, R. J.Foner, H. A. Preserving thin-layer chromato
grams, 400.Ford, M. A. Determination of benzoic acid in soft
drinks by ion-exchange chromatography, 15;Erratum, 222.
Fowler, L., Harmon, R. G., and Roe, D. K. AnalysisInstrumentation-1965. (Review), 824.
Franke, G. Review of GCittner and Weber'sUbbelohde's Zur Vishosimetrie mit Umwandlungsund Rechentabellen. 7th Edn., 681.
Fudge, A. J. See Banham, M. F.
GGage, J. C. Review of Stolman's Progress in
Chemical Toxicology. Vol. 2, 218.Gale, P. See lones, R. F.Galloway, L. D. Review of Kondrat'eva's Photo
synthetic Bacteria, 296.Gangadharan, 8. See Athavale, V. T.Garton, F. I. Review of Krugers and Keulemans'
Practical Instrumental Analysis, 472.Gautier, I.-A., and Malangeau, P. Mises au Point
de Chimie Analytique Organique, Pharmaceutiqueet Bromatologique. 12th and 13th Series.(Review), 341.
Gawienowski, A. M. See Risacher, R. L.Ghersini, G. See Cerrai, E.Gidley. I. A. F. Review of Thieson's Quantitative
Electron 111icroprobe Analysis, 341.Ginestra, A. lao See Incitti, S.Girgis, P. See Said, F.Glick, D. Methods of Biochemical Analysis. Vol.
13. (Review), 136.Godly, E. W. See Field, K.Goldup, A. Gas Chromatography 1964. (Review),
474.Goldwasser, E. L. Optics, Waves, Atoms, and
Nuclei: An Introduction. (Review), 60.Goode, G. C., Herrington, J., and Bundy, J. K.
Determination of impurities in high purityberyllium by differential cathode-ray polarography,719.
GottDer, G. H., and Weber, W. Ubbelohde's ZurViskosimetrie mit Umwandlungs- und Rechentabellen. 7th Edn. (Review), 681.
Grant, J. Review of Mark, McKetta, Othmer andStanden's Hirh-Dtllmer Encyclopedia oj ChemicalTechnology. Vol. 5. 2nd Edn., 65; Vol. 6, 140;Vol. 7, 543; Vol. 8, 752.
Gray, C. H. Review of Standard Methods ojClinical Chemistry. Vol. 5, 138. Review ofKernan's Cell K, 543. Review of Kekwick'sSeparation oj Biological Materials, 822.
Gray, G. A. See Hall, R. J.Green, E. J., and Carritt, D. E. Iodine determina
tion flask for whole-bottle titrations, 207.Green. I. H. See Khattak, M. H.
Greenfield, 8., Moule, H. A•• and Perry, R. Conductimetric determination of microgram amounts ofphosphine in air, 10.
Gregory, G. R. E. C. Determination of residualanionic surface-active reagents in mineral flotation liquors, 251.
Grimshaw, J., and Quigg, R. K. Modified potentiostat for controlled potential analysis, 667.
Gross, D. Review of Sargent's Methods in ZoneElectrophoresis, 221.
Gruverman, I. J. Mossbauer Effect Methodology.Vol. 1. (Review), 608.
Guerin, B. D. See Corbett, J. A.Gunther, F. A., and Ott. D. E. Rapid automated
determination of biphenyl in citrus fruit rind, 475.
HHais, I. M. See Macek, K.Ball, R. J., Gray, G. A., and Flynn, L. R. Use of
titan yellow for determination of magnesium withspecial reference to soil extracts, 102; Erratum,222.
Halliday, J. H., and Wood, F. W. Determination ofsalt in bacon by using a sodium-ion responsiveglass electrode, 802.
Hamilton, D. I.. and Beckmann. T. I. Rapidinfrared spectrophotometric analysis of pp'-DDTin formulations of technical DDT, 817.
Hammonds, T. W. Detection of cashew-nut shellliquid by thin-layer chromatography, 401.
- and Shone. G. G. Analysis of fats containingcyclopropenoid fatty acids, 455.
Hamza, A. G., and Headridge, J. B. Polarographicdetermination of lead after cation-exchangeseparation, 237.
Hancock, W., Rose. B. A., and Singer, D. D. Determination of diethyl phthalate in cosmetic preparations, 449.
Hand, T. G. See Priscott, B. H.Harmon, R. G. See Fowler, L.Harrison, T. 8•• and Cobb, W. D. Determination of
boron in mild steel, 576.Haslam, J. Review of Smith's Mechanising Labora-
tories, 222.Headridge, J. B. See Hamza, A. G.Helfterich, F. Ion Exchange. (Review), 64.Henning, H. II. See Strohecker, R.Henriksen, A. Interference from silica in phosphate
analysis, 290. Automatic, modified formaldoximedetermination of low concentrations of manganesein water containing iron, 647. Automatic determination of orthophosphate in sewage and highlypolluted waters, 652.
Hercules. D. M. Fluorescence and Phosphor.escence Analysis. (Review), 751.
Herington. E. F. G. Review of Schildknecht'sZone Melting, 749.
Herringshaw. 1. F. Review of Stock's Amperometric Titrations, 135. Review of Smith andFeinberg's Paper and Thin Layer Chromatographyand Electrophoresis. 2nd Edn., 342. Reviewof Wallis's Analytical Microscopy, 749.
Herrington, 1. See Goode. G. C.Heywood, A. See Cartwright, 1'11.Hill, 1. II. Spectrophotometric determination of
traces of tantalum, 659.Hill, T. L. Lectures on Matter Equilibrium.
(Review), 682.Hills, G. 1. Review of Samoilov's Structure of
Aqueous Electrolyte Solutions and the Hydration.oj Ions, 340.
Bilton, C. L. See Snell, F. D.

viii INDEX TO VOLUME 91
Bine, B. A., Crawford, B., Deutschman, I. E., andTipton. P. I. Determination of sodium in aluminium alloys by flame spectrophotometry withfuel-rich flames to reduce interference, 241.
Hodnett, E. M. See Cheronis, N. D.Bolmes, G. M. Review of Koch and Kolbe-Rohde's
M etallkundliche Analyse, 608.Boodless, R. A. Assay of neomycin, 333.Hopkins, P. See lones, R. F.Horwitz, W. Official Methods of Analysis of the
Association of Official Agricultural Chemists.10th Edn. (Review), 404.
Howell, M. G., Kende, A. S., and Webb, 1. S.Formula Index to NMR Literature Data. Vol. 1.(Review), 60.
Bowes, I. B. See Banham, M. F.Bowlett, M. D. D., and Welti, D. Collection of
fractions separated by gas - liquid chromatography, 291.
Bugo, W. B. See Whittett, T. D.Bunter, 1. A. See Braid, P.Burley, P. W. See lenkins, R.
IIncitti, S., and Ginestra, A. lao Determination of
spectrophotometric complexed dibenzoylmethane,814.
Ilackson. P. F. S., and Whitehead, I. Analysis of
titanium dioxide pigments by spark-source massspectrography, 418.
lames, G. V. Water Treatment. 3rd Edn.(Review), 141.
lanardhan, P. B. Physico-Chemical Techniques ofAnalysis. Vol. I. (Review), 473.
lanji6, T. I. See Peikovic-Tallic, I.lefteries, I. P. See Simmons, D. I.leftery, P. G. See Bakes, 1. M.lenkins, R., Burley, P. W., and Shorrocks, V. M.
Plant mineral analysis by X-ray fluorescencespectrometry, 395.
lenkins, S. B. Review of James's Water Treatment.3rd Edn., 141. Review of Rodier's L'AnalyseChimique et Physico-Chimique de L' Eau. 3rdEdn.,609.
lennings, V. I. Review of Pungor's Oscillometryand Conductometry, 339.
lennison, W., and Clark, M. L. Multi-purposetitrimeter, 598.
lones, I. C. B. See Bassett, 1.lones, J. G., and Thomas, I. D. R. Flame-spectro
photometric determination of calcium in humansaliva, 559.
lones, I. I. M. Review of King's Practical ClinicalEnzymology, 63. Review of Smith's Chemistryof Open-Chain Organic Nitrogen Compounds.Vols. I and II, 677.
lones, P. D. See Newman, E.I.lones, R. F., Gale, P., Hopkins. P., and Powell, L. N.
Modified titrimetric determination of carbon iniron and steel, 399.
lones, R. T. Rapid determination of moisturecontent of gelatin and animal glue, 210.
KKalvoda, R. Techniques of Oscillographic Polaro
graphy. 2nd Edn. (Review), 608.Kaner, N. Translator of Konstantinova-Shlez
inger's Fluorimetric Analysis. (Review), 676.Karalova. Z. K. See Nemodruk, A. A.Kaye, B. H. See Burt, M. W. G.
Keattch. C. I. Review of Thermal Analysis, 1965,471.
Kekwick, B. A. Separation of Biological Materials.British Medical Bull., Vol. 22, No.2, May, 1966.(Review), 822.
Kendall, C. E. Projection method for inspection ofampoules, 284.
- See also Vessey, I.Kendall, D. R. Applied Infrared Spectroscopy.
(Review), 754.Kende, A. S. See Bowell, M. G.Kenney, C. N. See Ruthven, D. M.; Sugden, T. M.Kernan, B. P. Cell K. (Review),543.Keulemans, A. I. M. See Krugers, I.Khattat, M. N., Barker, N. T., and Green. I. H.
Paper chromatography of purines, pyrimidinesand imidazoles, 526.
Kind, B. B., and Summerscales, L. Determinationof specific gravity of glass particles by a densitygradient method, 669.
Kiug, G. B. See Nyman, C. I.King, I. Practical Clinical Enzymology. (Review),
63.Kirkbright, G. F., Peters, M. K., and West, T. S.
Determination of traces of copper in niobium andtantalum by atomic-absorption spectroscopy, 411.Determination of small amounts of molybdenumin niobium and tantalum by atomic-absorptionspectroscopy in a nitrous oxide - acetylene flame,705.
- Smith, A. M., and West, T. S. Rapid determin·ation of molybdenum in alloy steels by atomicabsorption spectroscopy in a nitrous oxideacetylene flame, 700
- West, T. S., and Woodward, C. Spectrofluorimetric determination of microgram amounts ofscandium. II. Separation by solvent extraction,23.
- See also Djurkin, V.Kirsten, W. I. Determination of diquat residues in
potato tubers, 732.Koch, W., and Kolbe-Rohde, H. Metallkundliche
Analyse: Zusammensetzung, Struktur und Habitus der Phasen in heterogen Legierungen.(Review), 608.
Kolbe-Rohde, H. See Koch, W.Kondrat'eva, E. N. Photosynthetic Bacteria.
(Review), 296.Koning, A. I. de. Determination of ethanolamine
and serine in phospholipids, 523.Konstantinova-8hlezinger, M. A. Fluorimetric
Analysis. Translated by N. Kaner. (Review),676.
Krugers, I., and Keulemans, A. I. M. PracticalInstrumental Analysis. (Review), 472.
LLaug, L. Absorption Spectra in the Ultraviolet and
Visible Region. Vol. VI. (Review), 472.Larsen, E. M. Transitional Elements. (Review),
296.Latham, I. B. See Burgess, A. E.Law, G. See Emmott, P.Leane, 1. B. Translator of Neudert and Ropka's
Steroid-Spektrenatlas. (Review). 295.Lederer, M. Chromatographic Reviews. Vol. 7.
(Review), 139.Leithe, W. Analytische Chemie in der Industriellen
Praxis. No.2. (Review), 545.Lester Smith, E. See Smith, E. L.Leveson. L. L. Translator of Abresch and Claasen's
Coulometric Analysis. (Review), 58.

INDEX TO VOLUME 91 ix
Libman, D. D. Translator of Strohecker andHenning's Vitamin Assay. (Review), 294.
Lilburne, M. T. Gas-chromatographic analysis ofgases extracted from metals by vacuum fusion,571.
Lingane, J. 1. Analytical aspects of chronopotentiometry, 1. Analytical Chemistry of SelectedMetallic Elements. (Review), 825.
Lloyd, G. A., and Bell, G. 1. Mobile laboratorymethods for determination of pesticides in air.I. Phosphorothiolothionates, 806; II. Thionazin, 808.
Louwerse, W. Apparatus for the equal distributionof colour reagent on chromatograms used forquantitative work, 56.
Love, R. M. See Burton, J. D.Luton, P. E. See Richardson, M. L.
MMcDonald, A. 1. See Stanton, R. E.Macek, K., and Hais, I. M. Stationary Phase in
Paper and Thin-layer Chromatography. (Review), 217.
McGillivray, R., and Woodger, S. C. Application ofoxygen-flask technique in determination oftraces of chlorine and sulphur in organic compounds, 611.
McKetta, J. J., jun. See Mark, H. F.McLean, J. R., and Pearson, G. S. Refractive
index of aqueous perchloric acid, 594.Maclennan, G. W. G. Review of Russell's Chemical
Analysis in Photography, 750.Malaugeau, P. See Gautier, J.-A.Mark, H. F., McKetta, 1. J., jun., Othmer, D. F..
and Standen, A. Kirk-Othmer Encyclopedia ofChemical Technology. Vol. 5. 2nd Edn. (Review), 65; Vol. 6, 140; Vol. 7, 543; Vol. 8, 752.
Marten, J. F., and Catanzaro, G. Fundamentalstudies in automatic nitrogen digestion, 42.
Mason, S. F. Review of Skobel'tsyn's Research inMolecular Spectroscopy, 219. Review of Hill'sLectures on Matter Equilibrium, 682.
Massie, W. H. S. See Braid, P.Mattick, L. R., and Szymanski, H. A. Lectures on
Gas Chromatography, 1964. (Review), 220.Means, R. E. See Mold, J. D.Meites, L. Polarographic Techniques. 2nd Edn.
(Review), 607.Meites, S. Standard Methods of Clinical Chemistry.
Vol. 5. (Review), 138.Melhuish, K. R., and Chapman, H. Determination
of helium-3 in argon at levels of 10-12, 350.Menzies, A. C. Review of Bernheim's Optical
Pumping, 471.Mercer, E. R. See Burton, J. D.Messiha, N. N. See Selim, A. S. M.Miller, G. L. Review of Elwell and Wood's
Analysis of the New Metals, 821.Miller, R. G. J. Laboratory Methods in Infrared
Spectroscopy. (Review), 295.Milton, R. F. Review of Strohecker and Henning's
Vitamin Assay, 294.Miner, F. J. Primary analytical standards for
plutonium: quantitative separation of plutoniumfrom dicaesium plutonium hexachloride, 464.
Mitchell, B. D., Birnie, A. C., and Syers, J. K.Thermal analysis of lichens growing on limestone,783.
Mohacsi, E. Characteristic nuclear magneticresonance spectral positions for hydrogen inorganic structures, 57.
Mold, J. D., Peyton, M. P., Means, R. E., and Walker,T. B. Determination of catechol in cigarettesmoke, 189.
Monk, R. G. Comments on .. The effect of nitrilotriacetic acid impurity on the standardisation ofsolutions of EDTA," 597.
Marries, P. Review of Gautier and Malangeau'sMises au Point de Chimie Analytique Organique,Pharmace~ltique et Bromatologique. 12th and13th Series, 341.
Morrision, G. A. See Eliel, E. L.Morton, R. A. Review of Glick's Methods of
Biochemical Analysis. Vol. 13, 136. Review ofLang's Absorption Spectra in the Ultraviolet andVisible Region. Vol. VI, 472.
Moses, A. J. Nuclear Techniques in Analytical. Chemistry. (Review), 403.
Moshier, R. W., and Sievers, R. E. Gas Chromatography of Metal Chelates. (Review),219.
Moss, R., and Browett, E. V. Determination oftetra-alkyl lead vapour and inorganic lead dust inair, 428; Erratum, 546.
Maule, H. A. See Greenfield, S.Munro, H. N., and Fleck, A. Measurement of
nucleic acids in biological materials: supplementary review, 78.
NNemodruk, A. A., and Karalova, Z. K. Analytical
Chemistry of Boron. (Review), 545.Nery, R. Colorimetric determination of hydrox
amic acids, 388.Neudert, W., and Ropka, H. Steroid-Spektrenatlas.
Translated by J. B. Leane. (Review), 295.Newlove, T. H. See Dicker, D. W. G.Newman, E. J., and Jones, P. D. Separation and
determination of small amounts of tin, 406.Nichols, P. N. R. See Andrew, T. R.Nicholson, J. D. See Braid, P.Nickless, G. Review of Samsonov's High-Temper
ature Compounds of Rare Earth Metals withNonmetals, 59. Review of Gas Chromatography1964, 474. Review of Chemistry of OrganicSulfur Compounds in Petroleum and PetroleumProducts, 546. Review of Gruverman's Mossbauer Effect Methodology. Vol. 1, 608. Reviewof Nobel Lectures: Chemistry, 1922-1941, 824.Review of Nyman and King's Problems· forGeneral Chemistry and Qualitative Analysis, 825.
Norman, 0., and Vaughan, G. A. Determinationof 4-aminobiphenyl in aromatic amines, 653.
Norman, V. J. Photometric determination ofexcess of cadmium in cadmium oxide, 593.
Norwitz, G. Colorimetric determination of oxides ofnitrogen, 553.
Nyman, C. J., and King, G. B. Problems for GeneralChemistry and Qualitative Analysis. (Review),825.
oObolentsev, R. D. Chemistry of Organic Sulfur
Compounds in Petroleum and Petroleum Products. (Review), 546.
Oliver, F. H. Determination of fluorine or phosphorus in organic compounds by microtitrimetricmethod, 771.
Orrell, K. G. Review of Bible's Interpretation ofN M R Spectra, 58. Review of Howell, Kende andWebb's Formula Index to NMR Literature Data.Vol. I, 60. Review of Emsley, Feeney andSutcliffe's High Resolution Nuclear MagneticResonance Spectroscopy. Vol. I, 678; Vol. II, 820.
Othmer, D. F. See Mark, H. F.Ott, D. E. See Gunther, F. A.

QQuayle. 1. C., and Cooper, F. A. Precise coulo
meter, 356.- See also Cooper, F. A.Quigg, R. K. See Grimshaw, J.
RBaa, II. V. K. See Barna, R. K.Rawson, R. A. G. Improved performance of an
atomic absorptiometer by using pre-heated airand town gas, 630.
Redfern, 1. P. Thermal Analysis, 1965. (Review),471.
Rees, D. I. See Conacher, H. B.8.Reilley, C. N. Advances in Analytical Chemistry
and Instrumentation. Vol. 4. (Review), 61.Rhodes, 1. R. Radioisotope X-ray spectrometry:
review, 683.
Page, 1. E. Review of Meites' PolarographicTechniques. 2nd Edn., 607.
Parker, C. A. Review of Goldwasser's Optics,Waves, Atoms, and Nuclei, 60. Review of Hercules' Fluorescence and Phosphorescence Analysis,751.
Parsons, A. M. Quantitative microanalysis ofcarbonyl compounds, 297.
Partridge. 8. II. Review of Coutts and Smail'sPolysaccharides, Peptides and Proteins. Vol. 4,822.
Peake. D. 1lL Review of Scribner's SpectrochemicalAnalysis, 340.
Pearce. B. E. See Braid, P.Pearson, B. D. Determination of water in lubri
cating oils by near-infrared spectrophotometricmethod, 247.
Pearson. G. 8. See McLean, 1. R.Pejkovic-Tadic. I., ~elap, M. B., lanjic, T. 1., and
Vitorovic,8. Lj. Semi-quantitative determinationof organophosphorus insecticides by ring-oventechnique with preliminary thin-layer chromatography, 595.
Pendharkar. M. S. See Athavale, V. T.Penketh, G. E. Review of Mattick and Szymanski's
Lectures on Gas Chromatography, 1964, 220.Review of Savidan's Chromatography, 471.
Perera, B. P. 1lL See Sanderson, G. W.Perrin, D. D. Organic Complexing Agents: Struc
ture, Behaviour, and Application to InorganicAnalysis. (Review),57.
Perry, E. 8., and Weinberger, A. Distillation.2nd Edn. (Review), 221.
Perry, R. See Greenfield, S.Peters, M. K. See Kirkbright, G. F.Petrov, K. I. See Ellnson, 8. V.Peyton, M. P. See Mold. J. D.Philpotts, A. R. Review of Miller's Laboratory
Methods in Infrared Spectroscopy, 295.Pickering, W. F. Fundamental Principles of
Chemical Analysis. (Review), 677.PieUic, II. G. See SuJic. M. V.Powell, L. N. See Jones. R. F.Priscott, B. B., Band. T. G., and Young, E. J.
Analysis of electrolytic capacitor electrolyte:determination of chloride and sulphate in thep.p.m. range, 48.
Pugh, B. Review of Janardhan's Physico-ChemicalTechniques of Analysis. Vol. I, 473. .
Pungor, E. Oscillometry and Conductometry.Translated by T. Damokos. Edited by A. Townshend. (Review), 339.
x
P
INDEX TO VOLUME 91
~ch, R. Periodic Correlations. (Review), 62.Richardson. II. L" and Luton, P. E. Determination
of cyclamate in soft drinks by gas chromatography, 520. Determination of cyclamate in
.soft drinks by titration with sodium nitrite, 522.Rldyard, B. N. Determination of thiamine in
breakfast cereals, 328.Risacher, R. L., and Gawienowski, A. M. Detection
of 2-hy:droxy and 2-methoxy estrogens and otherphenohc compounds by modified Folin - Ciocalteutest, 816.
Rodier, 1. L'Analyse Chimique et Physico-Chimique de L'Eau. Eaux Naturelles - Eaux Usees.3rd Edn. (Review), 609.
Roe, D. K. See Fowler, L.Rooney, R. C. Review of Kalvoda's Techniques of
Oscillographic Polarography. 2nd Edn., 608.!Wpka, B. See Neuded, W.Rose, B. A. See Hancock, W.Russell, B. G. Flame-photometric determination of
sodium and potassium in manganese ores, 511.Russell, G. Chemical Analysis in Photography.
(Review), 750.Ruthven, D. M., and Kenney, C. N. Chromato
graph for analysis of air, chlorine and hydrogenchloride, 603.
SSaid, F., Salah, M. K., and Girgis, P. Determination
of vitamin D in the presence of vitamin A, 459.Salah, 1lL K. See Said, F.Salmon, 1. E. Review of Helffcrich's Ion Exchanne
64. b ,
Samoilo:v, O. Ya. Structure .of Aqueous ElectrolyteSolutions and the HydratIOn of Ions. (Review)340. '
Samsonov, G. V. High-Temperature Compounds ofRare Earth Metals with Nonmetals. (Review),59.
Sanderson, G. W., and Perera. B. P.lII. Removal ofpolyphenolic compounds interfering with carbohydrate determinations in plant extracts with aninsoluble polyphenol adsorbent, 335.
Sankar DaB, M. See Das, M. S.Sargent, 1. R. Methods in Zone Electrophoresis.
(Review), 221.Savage, B: R., Butt, 1. B., and Tallmadge, 1. A.
Absorption spectra and determination of hexanitrodipheny.lamine complexes of potassium,sodIUm, calcIUm and magnesium, 714.
Savidan, L. Chromatography. Edited by D. I.Davies. (Review), 471.
Sc~af~r! B. N. S. Determination of iron(II) oxidem sthcate and refractory materials. 1. Review,755; 2. Semi-micro titrimetric determination of
. iron(Il) oxide in silicate materials, 763.Schildknecht, B. Zone Melting. (Review), 749.Schofield, K. Review of Eliel, Allinger, Angyal and
Morrision's Conformational Analysis, 136.Scholes, P. B. See White, G.Schw~n~, G... and Flaschka, B. Komplexo
metrische Tttration. 5th Edn. (Review), 64.Scott, B. B. Determination of tantalum by solvent
~~~~action of a tantalum - pyrogallol complex,
Scribner, B. F. Spectrochemical Analysis: OpticalSpectrometry, X-Ray Fluorescence Spectro~etry, and Electron Probe Microanalysis Techmques, June 1964 to June 1965. (Review), 340.
Sellm, A. S. M., and Messiha. N. N. Chromatographic determination of basic amino-acids inprotein hydrolysates, 261.
§evkovic, N. See Stojanovic, N.

INDEX TO VOLUME,lll, xi
Seymour, R. C. Review of Kendall's AppliedInfrared Spectroscopy, 754.
Shaker, M. See Barakat, M. Z.Sharp, L. K. Review of Veibel's Identification of
Organic Compounds. 6th Edn. (3rd EnglishEdn.),609.
Sharp, R. B. Determination of copper compoundspresent on leaf surfaces, 212.
Sheppard, W. L. Review of White's Handbook ofUltraviolet Methods, 295.
Shone, G. G. See Hammonds, T. W.Shorrocks, V. M. See lenkins, R.Sievers, R. E. See Moshier, R. W.Simmons, D. I., and lefferies, I. P. Determination
of benzylpenicillin traces in Propyliodone Injection B.P., 656.
Simpson, G. S. See Curry, A. S.Simpson, I. R. See Curthoys, G.Sinclair, V. M., Drummond, I. L., and Smith, A. W,
Distillation method for determining total carbonin sodium, 582.
Singer, D. D. Analysis and composition of potablespirits: determination of Ca, C. and C5 alcoholsin whisky and brandy by direct gas chromatography, 127. Proportion of 2-methylbutanoland 3-methylbutanol in brandies and whiskies asdetermined by direct gas chromatography, 790.
- See also Hancock, W.Skobel'tsyn, D. V. Research in Molecular Spectro
scopy. (Review), 219.Smail, G. A. See Coutts, R. T.Smart, N. A. Analysis for dimethoate residues in
fruit and vegetables, 621.Smith, A. M. See Kirkbright, G. F.Smith, A. W. See Sinclair, V. M.Smith, D. M. Review of Sventitskii's Visual
Methods of Emission Spectroscopy, 751.Smith, E. A. Mechanising Laboratories. (Re
view), 222.Smith, E. L. Review of Lederer's Chromatographic
Reviews. Vol. 7, 139.Smith, I., and Feinberg, I. G. Paper and Thin
Layer Chromatography and Electrophoresis.2nd Edn. (Review), 342.
Smith, P. A. S. Chemistry of Open-Chain OrganicNitrogen Compounds. Vols. I and II. (Review), 677.
Smythe, L. E., and Whateley, T. L. Determinationof water in beryllium oxide, 285.
Snell, F. D., and Hilton, C. L. Encyclopedia ofIndustrial Chemical Analysis. Vol. 1. (Review),753.
Sodergren, A. Automatic determination of anionicsurface-active material in water, 113.
Souliotis, A. G. See Belkas, E. P.Spence, I. A., and Vahrman, M. Quasi-quantitative
separation of paraffins and olefins, 324.Standen, A. See Mark, H. F.Stanford, F. G. Injection tap for gaseous samples
in gas chromatography, 671.Stanton, R. E., and McDonald, A. I. Colorimetric
determination of boron in soils, sediments androcks with methylene blue, 775.
Stephen, W. I. Review of Perrin's Organic Complexing Reagents, 57. Review of Wilson's Approach to Chemical Analysis, 748.
Stevens, H. M. Detection of nitrate in presence ofinterfering substances, 743.
Stock, I. T. Amperometric titration of submillinormal concentrations of copper(II) with mercury(I) perchlorate, 27; Erratum, 610. Amperometric Titrations. (Review), 135. Amperometric titration of submillinormal concentrationsof iodine with mercury(I) perchlorate, 280.
Stojanovie, N., Veselinovie, D., and Sevkovic, N.Polarographic determination of zinc in plantmaterials, 746.
Stolman, A. Progress in Chemical Toxicology.Vol. 2. (Review), 218.
Strohecker, R., and Henning, H. M. Vitamin Assay:Tested Methods. Translated by D. D. Libman.(Review), 294.
Stuart, W. A. Automatic determination of thoria inthoria - urania mixtures, 208.
Stuckey, R. E. Review of Bradstreet's KjeldahlMethod for Organic Nitrogen, 470.
Sturton, I. M. Review of Pickering's FundamentalPrinciples of Chemical Analysis, 677.
Sugden, T. M., and Kenney, C. N. MicrowaveSpectroscopy of Gases. (Review), 677.
Summerscales, L. See Kind, S. S.Susie, M. V., and Pjesme, M. G. Polarographic
determination of arsenic in steel, 258.Sutcliffe, L. H. See Emsley, I. W.Svehla, G. Translator of Erdey's Gravimetric
Analysis. Part II. (Review), 64; Part III, 676.Sventitskii, N. S. Visual Methods of Emission
Spectroscopy. (Review), 751.Syers, I. K. See Mitchell, B. D.Sykes, G. Review of Whittett, Hugo and Wilkin
son's Sterilisation and Disinfection, 681.Szymanski, H. A. Infrared Band Handbook Supple
ments 3 and 4. (Review),823.See also Mattick, L. R.
TTallmadge, I. A. See Savage, H. R.Thieson, R. Quantitative Electron Micropro!>e
Analysis. (Review), 341.Thomas, I. D. R. See lones, I. G.Thompson, M. See Dalziel, I. A. W.Thomson, I. See Abbott, D. C.Tipton, P. I. See Hine, R. A.Topp, N. E. Chemistry of the Rare-Earth Elements.
(Review), 61.Toussaint, C. I., and Vos, G. Limits of sensitivity
of detection of aluminium in amorphous andcrystalline aluminium oxide by X-ray diffracto-metry, 535. .
Townshend, A. Editor of Pungor's Oscillometryand Conductometry. (Review), 339.
Trinder, N. Use of diphenylcarbazone for thedetermination of microgram amounts of lead, 587.
Turney, T. A. Oxidation Mechanism. (Review),61.
VVahrman, M. See Spence, I. A.Van der Kerk, G. I. M. See Willemsens, L. C.Van Praagh, G. Review of Ashmore's Principles
of Reaction Kinetics, 60.van Wyk, I. M. See Wyk, I. M. vanVarley, I. A. Automatic determination of nitrogen,
phosphorus and potassium in plant material,119; Erratum, 342.
Vassiliou, E. See Bersis, D.Vaughan, G. A. See Norman, O.Veibel, S. Identification of Organic Compounds.
6th Edn. (3rd English Edn.). (Review), 609.Venkstern, T. V., and Baev, A. A. Absorption
Spectra of Minor Bases. Their Nucleosides,Nucleotides and Selected Oligonucleotides. (Review), 607.
Veselinovie, D. See Stojanovie, N.Vessey, I., and Kendall, C. E. Determination of
particulate matter in intravenous fluids, 273.

ZSee Berka, A.
YYallop, H.l. See Amas, S. A. H.Young, E. 1. See Priscott, B. H.Young, R. 8. Analytical Chemistry of Cobalt.
(Review), 754.Yuen, S. H. Absorptiometric determination of
fenitrothion residues in cocoa beans, 811.See also Calderbank, A.
ZYka,l.
INDEX TO VOLUME 91
Wilkinson, 1. V., and Wragg, 1. S. Anomalousresults given by phase-solubility analysis, 600.
Willemsens, L. C., and Van der Kerk, G. 1. M.Investigations in the Field of Organolead Chemistry. (Review). 750.
Williams, V. P. See Delves, R. B.Wills, B. D. Ultraviolet spectrophotometric deter
mination of 3-amino-lH-l,2,4-triazole, 468.Continuous Wilson, A. D., and Cooke, 1. R. Detection of
nanogram amounts of fluoride ion, 135.Wilson, H. N. Recipient of Gold Medal of Society
for Analytical Chemistry, 223. Review ofOfficial Methods of Analysis of the Association ofOfficial Agricultural Chemists. lOth Edn., 404.Review of Leithe's Analytische Chemie in derIndustriellen Praxis. No.2, 545. Approach toChemical Analysis. (Review), 748. Review ofSnell and Hilton's Encyclopedia of IndustrialChemical Analysis. Vol. I, 753.
Wolfenden, G. Review of Barnard and Chayen'sModern Methods of Chemical Analysis, 60.
Wood, D. F. Review of Young's AnalyticalChemistry of Cobalt, 754.
- See also Elwell, W. T.Wood, F. W. See Halliday, 1. H.Woodger, 8. C. See McGillivray, R.Woodward, C. See Kirkbright, G. F.Wragg, 1. 8. See Wilkinson, 1. V.Wronski, 111. Determination of thiol esters with
o-hydroxymercuribenzoic acid, 745.Wyk, 1. M. van, Cuypers, 111. Y., Fite, L. E., and
Wainerdi, R. E. Study of macroscopic distribution of oxygen in a steel rod by neutron-activationand vacuum fusion techniques, 316.
WWainerdi, R. E. See Wyk, 1. 111. van.Walker, G. W. See Curry, A. S.Walker, 1. A. 1., and Campion, P.
monitor for hydrogen in gases, 347.Walker, T. B. See Mold, 1. D.Wall, K. H. Instrument for continuous determina
tion of carbon dioxide in high purity water, 795.Wallis, T. E. Analytical Microscopy. (Review),
749.Walters, G. See Bauminger, B. B.Weatherhead, R. G. Thin-layer chromatography of
epoxide resins, 445.Webb, 1. S. See Howell, M. G.Weber, W. See GOttner, G. H.Weissberger, A. See Perry, E. S.Weisz, H. Translator of Berka, Vulterin and Zyka's
Newer Redox Titrants. (Review), 338.Welti, D. See Howlett, M. D. D.West, T. S. Review of Erdey's Gravimetric
Analysis. Part II, 64: Part III, 676. Reviewof Schwarzenbach and Flaschka's I<omplexometrische Titration. 5th Edn., 64. Sensitive andselective reactions in inorganic spectroscopicanalysis, 69. Review of Konstantinova-Shlezinger's Fluorimetric Analysis, 676. Review ofSugden and Kenney's Microwave Spectroscopy ofGases, 677. Review of Lingane's AnalyticalChemistry of Selected Metallic Elements, 825.
- See also Djurkin, V.; Kirkbright, G. F.Whateley, T. L. See Smythe, L. E.White, G., and Scholes, P. H. Determination of
carbon in steel by a dynamic infrared system, 482.White, B. G. Handbook of Ultraviolet Methods.
(Review), 295.Whitehead, 1. See Denton, C. L.; lackson, P. F. S.Whitehurst, 1. S. Review of Neudert and Ropka's
Steroid-Spektrenatlas, 295.Whittett, T. D., Hugo, W. B., and Wilkinson, G. R.
Sterilisation and Disinfection. (Review), 681.Wiberg, K. B. Computer Programming for Chem
ists. (Review), 339.Wilkinson, G. R. See Whittett, T. D.
xii
Vitoroviil, S. Lj. See Peikoviil-Tadiil, I.VOS, G. See Toussaint, C. 1.Vulterin, 1. See Berka, A.

INDEX TO VOLUME 91
INDEX TO SUBJECTS
xiii
A
Acaricides: Analysis for residues of chlorinatedinsecticides and --: review. Beynon andElgar, 143.
See also Pesticides.2-Acetamid0-5-nitrothiazole: See AciDitrazole.Acetylene - oxygen flames: Excitation gradients in
. Dean and Adkins, 709.Acinitrazole: Determination of --. Society for
Analytical Chemistry, Analytical MethodsCommittee, Prophylactics in Animal FeedsSub-Committee, 672.
Air: Chromatograph for analysis of --, chlorineand hydrogen chloride. Ruthven and Kenney,603.
Conductimetric determination of microgramamounts of phosphine in Greenfield,Moule and Perry, 10.
Determination of tetra-alkyl lead vapour andinorganic lead dust in --. Moss and Browett,428; Erratum, 546.
Mobile laboratory methods for determination ofpesticides in --. I. Phosphorothiolothionates. Lloyd and Bell, 806; II. Thionazin,808.
Alcohol: See Ethanol.Alcohols: Analysis and composition of potable
spirits: determination of c" C. and C. -- inwhisky and brandy by .direct gas chromatography. Singer, 127.
Aldehydes: Quantitative microanalysis of carbonylcompounds. Parsons, 297.
Aldrin: Analysis for residues of chlorinated insecticides and acaricides: review. Beynon andElgar, 143.
Alkyl-aluminium compounds: Iodimetric determination of organo-aluminium compounds. Crompton, 374.
Alkylbenzenesulphonates: Automatic determinationof anionic surface-active material in water.Sodergren, 113.
Alloya: Metallkundliche Analyse. Koch and KolbeRohde. (Review), 608.
Aluminium: Determination of -- in iron andsteel. Corbett and Guerin, 490; Erratum, 610.
Determination of sodium in -- alloys by flamespectrophotometry with fuel-rich flames toreduce interference. Hine, Crawford, Deutschman and Tipton, 241.
Iodimetric determination of organo-aluminiumcompounds. Crompton, 374.
Limits of sensitivity of detection of -- inamorphous and crystalline aluminium oxide byX-ray diffractometry. Toussaint and Vos, 535.
Aluminium oxide: Limits of sensitivity of detectionof aluminium in amorphous and crystalline-- by X-ray diffractometry. Toussaint andVos, 535.
American Association 01 Clinical Chemists. StandardMethods of Clinical Chemistry. Vol. 5. (Review), 138.
Amines: Determination of 4-aminobiphenyl inaromatic --. Norman and Vaughan, 653.
Amino-acids: Chromatographic determination ofbasic -- in protein hydrolysates. Selim andMessiha, 261.
4-Aminobiphenyl: Determination of -- in aromatic amines. Norman and Vaughan, 653.
2-Amino-4-chlorobenzenethiol: Sensitive andselective spectrophotometric determination ofphosphorus (using --). Djurkin, Kirkbrightand West, 89.
4-Amin0-5-imidazole carboxamide: Paper chromatography of purines, pyrimidines and imidazoles.Khattak, Barker and Green, 526.
4-Amino-5-imidazole carboxamidiDe: Paper chromatography of purines, pyrimidines andimidazoles. Khattak, Barker and Green, 526.
3-Amino-1H-l,2,4-triazole: Ultraviolet spectro-photometric determination of--. W\Hs, 468.
Ammonium eerie nitrate: Colorimetric determination of sodium isethionate by means of --.Dicker and Newlove, 563.
Ampoules: Projection method for inspection ofKendall, 284.
Analysis: Advances in Analytical Chemistry andInstrumentation. Vol. 4. Reilley. (Review),61.
Amperometric Titrations. Stock. (Review), 135.Analytical Chemistry of Selected Metallic Ele
ments. Lingane. (Review), 825.Analytical Microscopy. Wallis. (Review), 749.Analytische Chemie in der Industriellen Praxis.
No.2. Leithe. (Review), 545.Anomalous results given by phase-solubility --.
Wilkinson and Wragg, 600.Approach to Chemical --. Wilson. (Review),
748.Chemical -- in Photography. Russell. (Re
view),750.Conformational--. Eliel, Allinger, Angyal and
Morrision. (Review), 136.Electrochemical --: Studies of Acids, Bases
and Salts by E.M.F., Conductance, Opticaland Kinetic Methods. July 1964 to June1965. Bates. (Review), 403.
Encyclopedia of Industrial Chemical --.Vol. 1. Snell and Hilton. (Review), 753.
Fluorescence and Phosphorescence --. Hercules. (Review), 751.
Fluorimetric --. Konstantinova-Shlezinger.Translated by Kaner. (Review), 676.
Fundamental Principles of ChemicalPickering. (Review), 677.
Gravimetric --. Part II. Erdey. Translatedby Svehla. Edited by Buzas. (Review), 64;Part III, 676.
Handbook of Ultraviolet Methods. White.(Review), 295.
Identification of Organic Compounds. Veibel.6th Edn. (3rd English Edn.). (Review), 609.
Instrumentation-1965. Fowler, Harmon andRoe. (Review), 824.
Kjeldahl Method for Organic Nitrogen. Bradstreet. (Review), 470.
Komplexometrische Titration. Schwarzenbachand Flaschka. 5th Edn. (Review), 64.
Laboratory Methods in Infrared Spectroscopy.Miller. (Review), 295.
L'Analyse Chimique Quantitative. Duval. (Review), 472.
Methods for the Chemical -- of NBS Copper-Base Spectrochemical Standards. Bell.(Review), 473.
Methods of Biochemical --. Vol. 13. Glick.(Review), 136.
Microchemical Techniques. (Review), 679.
xiv INDEX TO VOLUME 91
Analysis-eontinuedMises au Point de Chimie Analytique Organique,
Pharmaceutique et Bromatologique. 12th and13th Series. Gautier and Malangeau. (Review), 341.
Modern Methods of Chemical --. Barnard andChayen. (Review), 60.
Newer Redox Titrants. Berka, Vulterin andZYka. Translated by Weisz. (Review), 338.
Nuclear Techniques in Analytical Chemistry.Moses. (Review), 403.
of the New Metals-Titanium, Zirconium, Hafnium, Niobium, Tantalum, Tungsten and theirAlloys. Elwell and Wood. (Review), 821.
Official Methods of -- of the Association ofOfficial Agricultural Chemists. Horwitz. lOthEdn. (Review),404.
Organic Complexing Reagents: Structure, Behaviour, and Application to Inorganic --.Perrin. (Review), 57.
Physico-Chemical Techniques of --. Vol. 1.Janardhan. (Review), 473.
Plant mineral-- by X-ray fluorescence spectrometry. Jenkins, Hurley and Shorrocks, 395.
Practical Instrumental --. Krugers andKeulemans. (Review), 472.
Problems for General Chemistry and QualitativeNyman and King. (Review), 825.
Semimicro Qualitative Organic --. Cheronis,Entrikin and Hodnett. 3rd Edn. (Review),220.
Sensitive and selective reactions in inorganicspectroscopic --. West, 69.
Separation of Biological Materials. BritishMedical Bull. Vol. 22, No.2, May, 1966.Kekwick. (Review), 822.
Standard Methods of Clinical Chemistry. Vol. 5.(Review), 138.
Submicro Methods of Organic --. Belcher.(Review), 823.
Thermal--, 1965. Redfern. (Review), 471.Aniline: Determination of 4-aminobiphenyl in
aromatic amines. Norman and Vaughan, 653.Antimony: Excitation gradients in acetylene
oxygen flames. Dean and Adkins, 709.Spectrophotometric determination of 0·01 to
0·1 per cent. of -- in lead. Bassett andJones, 176.
Apparatus: Advances in Analytical Chemistry andInstrumentation. Vol. 4. Reilley. (Review),61.
Analysis Instrumentation-1965. Fowler, Harmon and Roe. (Review),824.
Analytical aspects of chronopotentiometry (circuitand cell). Lingane, 1.
Application of oxygen flask combustion techniqueto determination of traces of chlorine andsulphur in organic compounds. McGillivrayand Woodger, 611.
Automatic -- for determination of titanium.Denton and Whitehead, 224.
Automatic determination of thoria in thoriaurania mixtures. Stuart, 208.
Calibration of Fisher air-permeability -- fordetermining specific surface. Edmundson, 306.
Chemiluminescence method for determining ozone(automatic -- for). Bersis and Vassiliou,499.
Chromatograph for analysis of air, chlorine andhydrogen chloride. Ruthven and Kenney, 603.
Collection of fractions separated by gas - liquidchromatography (-- for column packing,
Apparatus-continuedtotal-trapping technique). Howlett and Welti,291.
Colorimeters with Flow-through Cells. (Review),62.
Colorimetric determination of oxides of nitrogen(-- for). Norwitz, 553.
Comparison of particle-size analysis resultsobtained by using a centrifugal photosedimentometer with those obtained with centrifugal pipette equipment. Burt and Kaye, 547.
Conductimetric determination of microgramamounts of phosphine in air (conductance cell).Greenfield, Moule and Perry, 10.
Continuous monitor for hydrogen in gases.Walker and Campion, 347.
Determination of benzoic acid in soft drinks byion-exchange chromatography (chromato-graphic --). Ford, 15; Erratum, 222.
Determination of carbon in steel by a dynamicinfrared system (automatic --; Dynacarb).White and Scholes, 482.
Determination of diquat residues in potatotubers (vacuum regulator for suction throughion-exchange columns). Kirsten, 732.
Determination of helium-3 in argon at levels of10-12 (helium concentration --). Melhuishand Chapman, 350.
Determination of iron(II) oxide in silicate andrefractory materials. 2. Semimicro titrimetricdetermination of iron(II) oxide in silicatematerials (sample decomposition --; platinum electrode and salt bridge). Schafer, 763.
Determination of particulate matter in intravenous fluids (sample vessel for Coulter Counter).Vessey and Kendall, 273.
Determination of salt in bacon by using sodiumion responsive glass electrode (six-bladedcutter). Halliday and Wood, 802.
Determination of tetra-alkyl lead vapour andinorganic lead dust in air (-- for preparingstandard atmospheres; Dreschel-type scrubber).Moss and Browett, 428; Erratum, 546.
Distillation method for determining total carbonin sodium (transfer glove-box and combustion--). Sinclair, Drummond and Smith, 582.
Factors affecting the determination of carbondioxide by non-aqueous titrimetry (titratiov.cell for spectrophotometric examination (. findicators). Braid, Hunter, Massie, Nicholf;Jnand Pearce, 439.
for equal distribution of colour reagent on ch~'om
atograms used for quantitative work. Louwerse, 56.
Fundamental studies in automatic '.litrogendigestion (digestor - AutoAnalyzer system).Marten and Catanzaro, 42.
Gas-chromatographic analysis of gase.; extractedfrom metals by vacuum fusion (Lovel.-.ck microionisation detector). Lilburne, 571.
Improvement in performance of atomic ahorptiometer by using pre-heated air and tm'n gas.Rawson, 630.
Injection tap for gaseous samples in gas chron.atography. Stanford, 671.
Instrument for continuous determination .'fcarbon dioxide in high purity water. \Vall,795.
Iodimetric determination of organo-aluminiumcompounds (-- for determining iodinenumber). Crompton, 374.
Iodine determination flask for whole-bottletitrations. Green and Carritt, 207.

INDEX TO VOLUME 91 xvApparatus-continued
Macroscopic distribution of oxygen in steel rodby neutron-activation and vacuum fusiontechniques (-- for). Wyk, Cuypers, Fiteand Wainerdi, 316.
Micro-determination of cyanide: application toanalysis of whole blood (modified Cavett flask).Baar, 268.
Modified potentiostat for controlled potentialanalysis. Grimshaw and Quigg, 667.
Multi-purpose titrimeter. Jennison and Clark,598.
Precise coulometer. Quayle and Cooper, 355.Precise coulometry: titration of pure sodium
carbonate. Cooper and Quayle, 363.Radioisotope X-ray spectrometry: review.
Rhodes, 683.Rapid automated determination of biphenyl in
citrus fruit rind (evacuated separator). Gunther and Ott, 475.
Rapid determination of molybdenum in alloysteels by atomic-absorption spectroscopy innitrous oxide - acetylene flame. Kirkbright,Smith and West, 700.
Simultaneous determination of iodine and bromine in urine by neutron-activation analysis(target for irradiation; Pyrex distillationapparatus; Plexi-glass filter funnel). Belkasand Souliotis, 199.
Titrimetric determination of carbon in iron andsteel. J ones, Gale, Hopkins and Powell, 399.
Use of lithium-drifted germanium diodes fory-spectrometric determination of radioactivefission-product nuclides. Banham, Fudge andHowes, 180.
Vacuum fusion analysis with a mass spectrometer(furnace). Aspinal, 33.
ArgOn: Determination of helium-3 in -- atlevels of 10-12• Melhuish and Chapman, 350.
Arsenic: Polarographic determination of -- insteel. Susie and Pjescic, 258.
Association of Clinical Biochemists: Colorimeterswith Flow-through Cells. (Review), 62.
Association of Ofll.cial Agricultural Chemists :Official Methods of Analvsis of --. Horwitz.10th Edn. (Review), 404.
Atmosphere: See Air.Atomic absorptiometer: Improvement in per
formance of -- by using pre-heated air andtown gas. Rawson, 630.
AutoAnalyzer: Automatic determination of anionicsurface-activematerial in water. Sodergren, 113.
Automatic determination of nitrogen, phosphorusand potassium in plant material. Varley, 119.
Automatic determination of orthophosphate insewage and highly polluted waters. Henriksen,652.
Automatic determination of thoria in thoriaurania mixtures. Stuart, 208.
Automatic, modified formaldoxime method fordetermining low concentrations of manganesein water containing iron. Henriksen, 647.
Fundamental studies in automatic nitrogendigestion. Marten and Catanzaro, 42.
AziDphosmethyl: See Guthion.
BBacon: Determination of salt in -- by using
sodium-ion responsive glass electrode. Hallidayand Wood, 802.
Bacteria: Photosynthetic Kondrat'eva.(Review), 296.
Barium: Excitation gradients in acetylene - oxygenflames. Dean and Adkins, 709.
Bases: Absorption Spectra of Minor --. Venkstern and Baev. (Review), 607.
Baytex: Semi-quantitative determination of organophosphorus insecticides by ring-oven techniquewith preliminary thin-layer chromatography.Pejkovic-Tadie, Celap, Janjie and Vitorovic,595.
Benzidine: Replacement of -- by copper ethylacetoacetate and tetra base as spot-testreagent for hydrogen cyanide and cyanogen.Feigl and Anger, 282.
Benzoic acid: Determination of -- in soft drinksby ion-exchange chromatography. Ford, 15;Erratum, 222.
Benzylpenicillin: Determination of -- traces inPropyliodone Injection B.P. Simmons andJ efleries, 656.
Beryllium: Determination of impurities in highpurity -- by differential cathode-ray polarography. Goode, Herrington and Bundy, 719.
Beryllium oxide: Determination of water in --.Smythe and Whateley, 285.
Beverages: See Drinks.BHC: See Hexachlorocyclohexane.Biochemistry: Methods of Biochemical Analysis.
Vol. 13. Glick. (Review), 136.Biphenyl: Rapid automated determination of -
in citrus fruit rind. Gunther and Ott, 475.Bismuth: Polarographic determination of 0·01 to
0·10 per cent. of -- in lead. Bassett andJones, 591.
Blasting explosives: Detection of dinitro and trinitro aromatic bodies in industrial --.Amas and Yallop, 336.
Blood: Determination of ethanol in -- by gaschromatography. Curry, Walker and Simpson,742.
Micro-determination of cyanide: application toanalysis of whole --. Baar, 268.
Blood plasma: Micro-determination of inorganicphosphorus in --. Bauminger and Walters,205.
Bombacopsisglabra seed oil: Analysis of fats containing cyclopropenoid fatty acids. Hammondsand Shone, 455.
Book reviews:Abresch and Claasen. Coulometric Analysis, 58.American Association of Clinical Chemists.
Standard Methods of Clinical Chemistry.Vol. 5, 138.
Ashmore. Principles of Reaction Kinetics, 60.Association of Official Agricultural Chemists.
Official Methods of Analysis of the A.O.A.C.,404.
Baker and Cairns. Spectroscopy in Education.Vol. 2, 218.
Barnard and Chayen. Modern Methods ofChemical Analysis, 60.
Bates. Electrochemical Analysis, 403.Belcher. Submicro Methods of Organic Analysis,
823.Bell. Methods for the Chemical Analysis of
NBS Copper-Base Spectrochemical Standards,473.
Berka, Vulterin and ZYka. Newer Redox Ti-trants, 338.
Bernheim. Optical Pumping, 471.Bersohn and Baird. Introduction to Electron
Paramagnetic Resonance, 681.Bible. Interpretation of NMR Spectra, 58.Bradstreet. Kjeldahl Method for Organic Nitro
gen, 470.Buchachenko. Stable Radicals, 542.

xvi INDEX TO VOLUME 91
Book reviews-continuedCheronis, Entrikin and Hodnett. Semimicro
Qualitative Organic Analysis. 3rd Edn., 220.Coutts and Smail. Polysaccharides, Peptides
and Proteins. Vol. 4, 822.Cumper. Wave Mechanics for Chemists, 403.Delahay. Double Layer and Electrode Kinetics,
294.Duval. L' Analyse Chimique Quantitative, 472.Eliel, Allinger, Angyal and Morrision. Conforma
tional Analysis, 136.Elinson and Petrov. Analytical Chemistry of
Zirconium and Hafnium, 680.Elwell and Wood. Analysis of the New Metals,
821.Emsley, Feeney and Sutcliffe. High Resolution
Nuclear Magnetic Resonance Spectroscopy.Vol. I, 678; Vol. II, 820.
Erdey. Gravimetric Analysis. Part II, 64; PartIII, 676.
Gautier and Malangeau. Mises au Point de ChimieAnalytique Organique, Pharmaceutique etBromatologique. 12th and 13th Series, 341.
Glick. Methods of Biochemical Analysis. Vol.13, 136.
Goldwasser. Optics, Waves, Atoms, and Nuclei,60.
G6ttner and Weber. Ubbelohde's Zur Viskosimetrie mit Umwandlungs- und Rechentabellen. 7th Edn., 681.
Helfferich. Ion Exchange, 64.Hercules. Fluorescence and Phosphorescence
Analysis, 751.Hill. Lectures on Matter Equilibrium, 682.Howell, Kende and Webb. Formula Index to
NMR Literature Data, 60.International Union of Biochemistry. Enzyme
Nomenclature, 142.James. Water Treatment. 3rd Edn., 141.Janardhan. Physico-Chemical Techniques of
Analysis. Vol. I, 473.Kalvoda. Techniques of Oscillographic Polaro
graphy. 2nd Edn., 608.Kekwick. Separation of Biological Materials,
822.Kendall. Applied Infrared Spectroscopy, 754.Kernan. Cell K, 543.King. Practical Clinical Enzymology, 63.Koch and Kolbe-Rohde. Metallkundliche
Analyse, 608.Kondrat'eva. Photosynthetic Bacteria, 296.Konstantinova-Shlezinger. Fluorimetric Analysis,
676.Krugers and Keulemans. Practical Instrumental
Analysis, 472.Lang. Absorption Spectra in the Ultraviolet
and Visible Region. Vol. VI, 472.Larsen. Transitional Elements, 296.Lederer. Chromatographic Reviews. Vol. 7, 139.Leithe. Analytische Chemie in der Industriellen
Praxis. No.2, 545.Lingane. Analytical Chemistry of Selected
Metallic Elements, 825.:\Iacek and Hais. Stationary Phase in Paper and
Thin-layer Chromatography, 217.:\1ark, McKetta, Othmer and Standen. Kirk
Othmer Encyclopedia of Chemical Technology.Vol. 5. 2nd Edn., 65; Vol. 6, 140; Vol. 7,543; Vol. 8, 752.
Mattick and Szymanski. Lectures on GasChromatography, 1964, 220.
:\-Ieites. Polarographic Techniques. 2nd Edn.,607.
Book reviews-continuedMiller. Laboratory Methods in Infrared Spectro
scopy, 295.Moses. Nuclear Techniques in Analytical Chem
istry, 403.Moshier and Sievers. Gas Chromatography of
Metal Chelates, 219.Nemodruk and Karalova. Analytical Chemistry
of Boron, 545.Neudert and Ropka. Steroid-Spektrenatlas, 295.Nyman and King. Problems for General Chem
istry and Qualitative Analysis, 825.Obolentsev. Chemistry of Organic Sulfur Com
pounds in Petroleum and Petroleum Products,546.
Perrin. Organic Complexing Reagents, 57.Perry and Weissberger. Distillation. 2nd Edn.,
221.Pickering. Fundamental Principles of Chemical
Analysis, 677.Fungor. Oscillometry and Conductometry, 339.Reilley. Advances in Analytical Chemistry and
Instrumentation. Vol. 4, 61.Rich. Periodic Correlations, 62.Rodier. L'Analyse Chimique et Physico-
Chimique de l'Eau. 3rd Edn., 609.Russell. Chemical Analysis in Photography, 750.Samoilov. Structure of Aqueous Electrolyte
Solutions and the Hydration of Ions, 340.Samsonov. High-Temperature Compounds of
Rare Earth Metals with Nonmetals, 59.Sargent. Methods in Zone Electrophoresis, 221.Savidan. Chromatography, 471.Schildknecht. Zone Melting, 749.Schwarzenbach and Flaschka. Komplexomet-
rische Titration. 5th Edn., 64.Scribner. Spectrochemical Analysis, 340.Skobel'tsyn. Research in Molecular Spectro
scopy, 219.Smith. Chemistry of Open-Chain Organic
Nitrogen Compounds. Vols. I and II, 677.Smith. Mechanising Laboratories, 222.Smith and Feinberg. Paper and Thin Layer
Chromatography and Electrophoresis. 2ndEdn., 342.
Snell and Hilton. Encyclopedia of IndustrialChemical Analysis. Vol. I, 753.
Stock. Amperometric Titrations, 135.Stolman. Progress in Chemical Toxicology.
Vol. 2, 218.Strohecker and Henning. Vitamin Assay, 294.Sugden and Kenney. Microwave Spectroscopy
of Gases, 677.Sventitskii. Visual Methods of Emission Spectro
scopy, 751.Szymanski. Infrared Band Handbook Supple
ments 3 and 4, 823.Thieson. Quantitative Elect.ron Microprobe
Analysis, 341.Topp. Chemistry of the Rare-Earth Elements,
61.Turney. Oxidation Mechanism, 61.Veibel. Identification of Organic Compounds.
6th Edn. (3rd English Edn.), 609.Venkstern and Baev. Absorption Spectra of
Minor Bases, 607.Wallis. Analytical Microscopy, 749.White. Handbook of Ultraviolet Methods, 295.Whittett, Hugo and Wilkinson. Sterilisation and
Disinfection, 681.Wiberg. Computer Programming for Chemists,
339.Willemsens and Van der Kerk. Investigations
in the Field of Organolead Chemistry, 750.

INDEX TO VOLUME 91 xvii
Book reviews-continuedWilson. Approach to Chemical Analysis, 748.Young. Analytical Chemistry of Cobalt, 754.Analysis Instrumentation-1965, 824.Colorimeters with Flow-through Cells, 62.Developments in Applied Spectroscopy. Vol. 4,
606.Gas Chromatography 1964, 474.Microchemical Techniques, 679.Mossbauer Effect Methodology. Vol. I, 608.Nobel Lectures: Chemistry, 1922-1941, 824.Thermal Analysis, 1965, 471.
Boron: Analytical Chemistry of --. Nemodrukand Karalova. (Review), 545.
Colorimetric determination of -- in soils, sediments and rocks with methylene blue. Stantonand McDonald, 775.
Determination of -- in mild steel. Harrisonand Cobb, 576.
Direct photometric determination of -- innickel. Andrew and Nichols, 664.
Excitation gradients in acetylene - oxygen flames.Dean and Adkins, 709.
Brandy: . Analysis and composition of potablespirits: determination of C.' C. and C. alcoholsin whisky and -- by direct gas chromatography. Singcr, 127.
Proportion of 2-methylbutanol and 3-methylbutanol in -- and whiskies as determined bydirect gas chromatography. Singer, 790.
Bromine: Simultaneous determination of iodineand -- in urine by neutron-activationanalysis. Belkas and Souliotis, 199.
N-Bromosuccinimide: Micro-determination of isoniazid by --. Barakat and Shaker, 466.
Bureau 01 Standards: See United States Bureau 01Standards.
Butacarb: Anomalous results given by phasesolubility analysis (mixtures containing --).Wilkinson and Wragg, 600.
Butanol: Analysis and composition of potablespirits: determination of C., C. and C. alcoholsin whisky and brandy by direct gas chromatography (sec. --). Singer, 127.
Butter fat: Quantitative microanalysis of carbonylcompounds (analysis of --). Parsons, 297.
3-t-Butylphenyl methylcarbamate: Anomalous results given by phase-solubility analysis (mixtures of Butacarb and --). Wilkinson andWragg, 600.
CCadmium: Determination of impurities in high
purity beryllium by differential cathode-raypolarography. Goode, Herrington and Bundy,719.
Photometric determination of excess of -- incadmium oxide. Norman, 593.
Cadminm oxide: Photometric determination ofexcess of cadmium in --. Norman, 593.
caesium: Primary analytical standards for plutonium: quantitative separation of plutoniumfrom dicaesium plutonium hexachloride.Miner, 464.
Caesium-l34: Use of lithium-drifted germaniumdiodes for y-spectrometric determination ofradioactive fission-product nuclides (caesium137 in presence of --). Banham, Fudge andHowes, 180.
C&esium-137: Use of lithium-drifted germaniumdiodes for y-spectrometric determination ofradioactive fission-product nuclides (-- inpresence of caesium-I 34). Banham, Fudge andHowes, 180.
Calcium: Absorption spectra and determination ofhexanitrodiphenylamine complexes of potassium, sodium, -- and magnesium. Savage,Butt and Tallmadge, 714.
Flame-photometric determination of traces of-- in lithium chloride. Emmott and Law,383.
Flame-spectrophotometric determination of -in human saliva. Jones and Thomas, 559.
Calcium oxalate: Thermal analysis of lichens growing on limestone (identifying and determining--). Mitchell, Birnie and Sy.ers, 783.
Carbohydrate: Removal of polyphenolic compoundsinterfering with -- determinations in plantextracts with an insoluble polyphenol adsorbent. Sanderson and Perera, 335.
Carbon: Determination of-- in steel by a dynamicinfrared system. White and Scholes, 482.
Distillation method for determining total -- insodium. Sinclair, Drummond and Smith, 582.
Titrimetric determination of -- in iron andsteel. J ones, Gale, Hopkins and Powell, 399.
Carbon dioxide: Factors affecting the determinationof -- by non-aqueous titrimetry. Braid,Hunter, Massie, Nicholson and Pearce, 439.
Instrument for continuous determination of -in high purity water. Wall, 795.
Carbon monoxide: Gas-chromatographic analysis ofgases extracted from metals by vacuum fusion.Lilburne, 571.
Carbonyl compounds: Quantitative microanalysisof --. Parsons. 297.
Cashew-nut shell liquid: Detection of -- by thinlayer chromatography. Hammonds, 401.
catalysts: Iodimetric determination of organoaluminium compounds (determination of polymerisation --). Crompton, 374.
Catechol: Determination of -- in cigarette smoke.Mold, Peyton, Means and Walker, 189.
Cereals: Det~rmination of thiamine in breakfastRidyard, 328.
Cerium-141: Use of lithium-drifted germaniumdiodes for y-spectrometric determination ofradioactive fission-product nuclides (cerium-144in presence of --). Banham, Fudge andHowes, 180.
Cerium-l44: Use of lithium-drifted germaniumdiodes for y-spectrometric determination ofradioactive fission-product nuclides (-- inpresence of cerium-141). Banham, Fudge andHowes, 180.
Chelates: See Complexes.Chemistry: Kirk-Othmer Encyclopedia of Chemical
Technology. Vol. 5. Mark, McKetta, Othmerand Standen. 2nd Edn. (Review), 65; Vol. 6,140; Vol. 7, 543; Vol. 8, 752.
Nobel Lectures: --,1922-1941. (Review),824.Optics, Waves, Atoms, and Nuclei: Introduction.
Goldwasser. (Review), 60.Oxidation Mechanism. Turney. (Review), 61.Periodic Correlations. Rich. (Review), 62.Problems for General -- and Qualitative
Analysis. Nyman and King. (Review), 825.ChIorbenside: Analysis for residues of chlorinated
insecticides and acaricides. Beynon and Elgar.143.
Chlordane: Analysis for residues of chlorinatedinsecticides and acaricides: review. Beynonand Elgar, 143.
ChIorlenson: Analysis for residues of chlorinatedinsecticides and acaricides: review. Beynonand Elgar, 143.
xviii INDEX TO VOLUME 91
Chloride: Analysis of electrolytic capacitor electrolyte: determination of -- and sulphate inthe p.p.m. range. Priscott, Hand and Young,48.
Chlorine: Application of oxygen-flask combustiontechnique to determination of traces of -and sulphur in organic compounds. McGillivray and Woodger, 611.
Chromatograph for analysis of air, -- andhydrogen cWoride. Ruthven and Kenney, 603.
Chlorobenzilate: Analysis for residues of chlorinatedinsecticides and acaricides: review. Beynonand Elgar, 143.
Chromatography. Savidan. Edited by Davies.(Review), 471.
Apparatus for equal distribution of colour reagenton chromatograms used for quantitative work.Louwerse, 56.
Chromatographic Reviews. Vol. 7. Lederer.(Review), 139.
Collection of fractions separated by gas - liquidHowlett and Welti, 291.
Gas -- 1964. Goldup. (Review), 474.Gas -- of Metal Chelates. Moshier and Sievers.
(Review), 219.Injection tap for gaseous samples in gas --.
Stanford, 671.Lectures on Gas --, 1964: Agricultural and
Biological Applications. Mattick and Szymanski. (Review),220.
Paper and Thin Layer -- and Electrophoresis.Smith and Feinberg. 2nd Edn. (Review),342.
Preserving thin-layer chromatograms. Foner,400.
Stationary Phase in Paper and Thin-layer --.Macek and Hais. (Review), 217.
Use of molecular sieve 5A for collecting fractionsfrom a gas chromatograph. Cartwright andHeywood, 337.
Chronopotentiometry: Analytical aspects of --.Lingane, I.
Cigarette smoke: Determination of catechol in --.Mold, Peyton, Means and Walker, 189.
Citrus fruit: Rapid automated determination ofbiphenyl in -- rind. Gunther and Ott, 475.
Coal tar: Quasi-quantitative separation of paraffinsand olefins (of --). Spence and Vahrman,324.
Cobalt. Analytical Chemistry of --. Young.(Review), 754.
Determination of impurities in high purityberyllium by differential cathode-ray polarography. Goode, Herrington and Bundy, 719.
Determination of nickel with dimethylglyoximein iron and steel containing -- and copper.Claassen and Bastings, 725.
Excitation gradients in acetylene - oxygen flames.Dean and Adkins, 709.
Coooa beans: Absorptiometric determination offenitrothion residues in --. Yuen, 811.
.cod flesh: Nitrogen factor for --. Society forAnalytical Chemistry, Analytical MethodsCommittee, Fish Products Sub-Committee, 540.
Colorimeters with Flow-through Cells. (Review), 62..complexes: Gas Chromatography of Metal Chelates.
Moshier and Sievers. (Review), 219..complexing Reagents: Organic --: Structure,
Behaviour, and Application to InorganicAnalysis. Perrin. (Review), 57.
oComplexometry: Komplexometrische Titration.Schwarzenbach and Flaschka. 5th Edn.(Review), 64.
Computer Programming for Chemists. Wiberg.(Review), 339.
Conduotometry: Oscillometry and --. Pungor.Translated by Damokos. Edited by Townshend. (Review), 339.
Conformational Analysis. Eliel, Allinger, Angyaland Morrision. (Review), 136.
Copper: Amperometric titration of submillinormalconcentrations of --(II) with mercury(I)perchlorate. Stock, 27.
Determination of -- compounds present onleaf surfaces. Sharp, 212.
Determination of impurities in high purityberyllium by differential cathode-ray polarography. Goode, Herrington and Bundy, 719.
Determination of nickel with dimethylglyoximein iron and steel containing cobalt and --.Claassen and Bastings, 725.
Determination of traces of -- in niobium andtantalum by atomic-absorption spectroscopy.Kirkbright, Peters and West, 4ll.
Improvement in performance of atomic absorptiometer by using pre-heated air and town gas(determining --). Rawson, 630.
Oxidation of hydroxylamine in sodium hydroxidein presence of --(II). Anderson, 532.
Copper ethylaoetoaoetate: Replacement of benzidine by -- and tetra base as spot-testreagent for hydrogen cyanide and cyanogen.Feigl and Anger, 282.
Cosmetics: Determination of diethyl phthalate in--. Hancock, Rose and Singer, 449.
Coulometer: Precise --. Quayle and Cooper, 355.Precise coulometry: titration of pure sodium
carbonate. Cooper and Quayle, 363.Coulometry: Coulometric Analysis. Abresch and
Claasen. Translated by Leveson. (Review),58.
Cresol: Determination of phenol, 0--- and p-- in aqueous solution by kinetic method.Burgess and Latham, 343; Erratum, 546.
Crops: See Plants.Cyanide: Micro-determination of --: application
to analysis of whole blood. Baar, 268.Cyanogen: Replacement of benzidine by copper
ethylacetoacetate and tetra base as spot-testreagent for hydrogen cyanide and --.Feigl and Anger, 282.
Cyclamate: Determination of -- in soft drinks bygas chromatography. Richardson and Luton,520.
Determination of -- in soft drinks by titrationwith sodium nitrite. Richardson and Luton,522.
Cyclopropenoid fatty acids: Analysis of fats containing --. Hammonds and Shone, 455.
DDDE: Analysis for residues of chlorinated insecti
cides and acaricides: review. Beynon andElgar, 143.
DDT: Analysis for residues of chlorinated insecticides and acaricides: review. Beynon andElgar, 143.
Rapid infrared spectrophotometric analysis ofPP'- -- in formulations of technical --.Hamilton and Beckmann, 817.
Demeton-8-methyl: Mobile laboratory methods fordetermination of pesticides in air. 1. Phosphorothiolothionates. Lloyd and Bell, 806.
Denaturant: Determination of diethyl phthalate incosmetic preparations. Hancock, Rose andSinger, 449.

INDEX TO VOLUME 91 xix
Detergents: See Surface-active agents.Diamino-hydroxypyrimidines: Paper chromato
graphy of purines, pyrimidines and imidazoles.Khattak, Barker and Green, 526.
Diazinon: Semi-quantitative determination oforganophosphorus insecticides by ring-oventechnique with preliminary thin-layer chromatography. Pejkovic-Tadic, Celap, Janjic andVitorovic, 595.
Dibenzoylmethane: Determination of spectrophotometric complexed --. Incitti and Ginestra,814.
Di-t-butyl peroxide: Determination of availableoxygen in --. Adams, 397.
3,5-Di-t-butylphenol: Anomalous results given byphase-solubility analysis (mixtures of Butacarband --). Wilkinson and Wragg, 600.
2,5-Di-t-butylphenyl methylcarbamate: Anomalousresults given by phase-solubility analysis(mixtures of Butacarb and --). 'Wilkinsonand Wragg, 600.
3,5-Di-t-butylphenyl methylcarbamate: See Butacarbo
Dicaesium plutonium hexachloride: Primary analytical standards for plutonium: quantitativeseparation of plutonium from --. Miner,464.
Dicofol: Analysis for residues of chlorinated insecticides and acaricides: review. Beynon andElgar, 143.
Dieldrin: Analysis for residues of chlorinatedinsecticides and acaricides: review. Beynonand Elgar, 143.
Diethyl phthalate: Determination of -- in cos-metic preparations. Hancock, Rose andSinger, 449.
1,4-Dihydroxyanthraquinone: See Quinizarin.Dihydroxypurines: Paper chromatography of
purines, pyrimidines and imidazoles. Khattak,Barker and Green, 526.
Di-hydroxyureas: Colorimetric determination ofhydroxamic acids (and --). Nery, 388.
Dimethoate: Determination of residues of -- withmulti-band chromatoplates. Abbott, Buntingand Thomson, 94.
Methods of analysis for -- residues in fruit andvegetables. Smart, 621.
Mobile laboratory methods for determination ofpesticides in air. I. Phosphorothiolothionatp.s.Lloyd and Bell, 806.
Dimethylglyoxime: Determination of nickel with-- in iron and steel containing cobalt andcopper. Claassen and Bastings, 725.
m-Dinitrobenzene: Detection of dinitro and trinitroaromatic bodies in industrial blasting explosives. Amas and Yallop, 336.
2,4-Dinitrophenylhydrazones: Quantitative micro-analysis of carbonyl compounds. Parsons, 297.
2,4-Dinitrotoluene: Detection of dinitro and trinitroaromatic bodies in industrial blasting explosives. Amas and Yailop, 336.
Diphenylamine: Determination of 4-aminobiphenylin aromatic amines. Norman and Vaughan,653.
Diphenylcarbazone: Use of -- for determinationof microgram amounts of lead. Trinder, 587.
Dipicrylamine: See Hexanitrodiphenylamine.Diquat: Determination of residues of --. Calder
bank and Yuen, 625.Determination of -- residues in potato tubers.
Kirsten, 732.Disinfection: Sterilisation and --. Whittett,
Hugo and \Vilkinson. (Review), 681.
Distillation. Perry and Weissberger. 2nd Edn.(Review), 221.
Disulfoton: Mobile laboratory methods for determination of pesticides in air. I. Phosphorothiolothionates. Lloyd and Bell, 806.
Double Layer and Electrode Kinetics. Delahay.(Review), 294.
Drinks, soft: Determination of benzoic acid in -by ion-exchange chromatography. Ford, 15;Erratum, 222.
soft: Determination of cyclamate in -- by gaschromatography. Richardson and Luton, 520.
soft: Determination of cyclamate in -- bytitration with sodium nitrite. Richardson andLuton, 522.
Dynacarb: Determination of carbon in steel by adynamic infrared system. White and Scholes,482.
EEditorial: Increase in subscription rates, 405.EDTA: See Ethylenediaminetetra-acetic acid.EfIluents: Determination of thiourea in sewage and
industrial --. Dickinson, 809.Water Treatment: Guide to Treatment of Water
and -- Purification. James. 3rd Edn.(Review), 141.
Electrochemical Analysis: Studies of Acids, Basesand Salts by E.M.F., Conductance, Optical andKinetic Methods. July 1964 to June 1965.Bates. (Review), 403.
Electrochemistry: Double Layer and ElectrodeKinetics. Delahay. (Review), 294.
Electrode Kinetics: Double Layer and --.Delahay. (Review), 294.
Electrolyte: Analysis of electrolytic capacitor --:determination of chloride and sulphate inp.p.m. range. Priscott, Hand and Young, 48.
Structure of Aqueous -- Solutions and theHydration of Ions. Samoilov. (Review), 340.
Electrolytic capacitor: Analysis of -- electrolyte:determination of chloride and sulphate inp.p.m. range. Priscott, Hand and Young, 48.
Electron Paramagnetic Resonance: Introduction to--. Bersohn and Baird.. (Review), 681.
Electron probe microanalysis: Quantitative ElectronMicroprobe Analysis. Thieson. (Review), 341.
Spectrochemical Analysis: Optical Spectrometry,X-Ray Fluorescence Spectrometry, and -Techniques, June 1964 to June 1965. Scribner.(Review), 340.
Electrophoresis: Chromatographic Reviews. Vol.7. Lederer. (Review), 139.
Methods in Zone --. Sargent. (Review),221.Paper and Thin Layer Chromatography and --.
Smith and Feinberg. 2nd Edn. (Review), 342.Encyclopedia: Kirk-Othmer -- of Chemical
Technology. Vol. 5. Mark, McKetta, Othmerand Standen. 2nd Edn. (Review), 65; Vol. 6,140; Vol. 7, 543; Vol. 8, 752.
of Industrial Chemical Analysis. Vol. 1. Snelland Hilton. (Review), 753.
Endosulfan: Analysis for residues of chlorinatedinsecticides and acaricides: review. Beynonand Elgar, 143.
Endrin: Analysis for residues of chlorinated insecticides and acaricides: review. Beynon andElgar, 143.
Enzyme Nomenclature. (Review), 142.Enzymology: Practical Clinical --. King. (Re
view), 63.Epoxide resins: Thin-layer chromatography of --.
Weatherhead, 445.

xx INDEX TO VOLUME 91
Estrogens: Detection of 2-hydroxy and 2-methoxy-- and other phenolic compounds by modifiedFolin - Ciocalteu test. Risacher and Gawienowski,8l6.
Ethanol: Determination of -- in blood by gaschromatography. Curry, Walker and Simpson,742.
Ethanolamine: Determination of -- and serine inphospholipids. Koning, 523.
Ethyl alcohol: See Ethanol.Ethylenediaminetetra-acetic acid: Comments on
.. Effect of nitrilotriacetic acid impurity onstandardisation of solutions of --". Monk,597.
Ethylene glycol: Detection and estimation of -in propylene glycol by thin-layer chromatography. Conacher and Rees, 55.
Eugenol: Spectral characteristics of --. Societyfor Analytical Chemistry, Analytical MethodsCommittee, Essential Oils Sub-Committee, 214.
Explosives: Detection of dinitro and trinitro aromatic bodies in industrial blastingAmas and Yallop, 336.
FFat(s): Analysis of -- containing cyclopropenoid
fatty acids. Hammonds and Shone, 455.Fatty acids: Analysis of fats containing cyclo
propenoid --. Hammonds and Shone, 455.Feeding-stuffs: Determination of acinitrazole (in
--). Society for Analytical Chemistry,Analytical Methods Committee, Prophylacticsin Animal Feeds Sub-Committee, 672.
Fenitrothion: Absorptiometric determination of-- residues in cocoa beans. Yuen, 811.
Analysis of -- by infrared method. Delves andWilliams, 779.
Fenthion: See Baytex.Fish: Nitrogen factor for cod flesh. Society for
Analytical Chemistry, Analytical MethodsCommittee, Fish Products Sub-Committee, 540.
Fisher apparatus: Calibration of a Fisher air-permeability apparatus for determining specificsurface. Edmundson, 306.
Fish liver oils: Spectrophotometric determinationof vitamin D in fresh-water --. Barua andRao, 567.
Flames: Excitation gradients in acetylene - oxygenDean and Adkins, 709.
.Flotation liquors: Determination of residual anionicsurface-active reagents in mineralGregory, 251.
Fluorescence and Phosphorescence Analysis. Hercules. (Review), 751.
Fluoride: Detection of nanogram amounts of -ion. Wilson and Cooke, 135.
Fluorine: Determination of -- by neutron activation. Bakes and Jeffery, 216.
Determination of -- or phosphorus in organiccompounds by micro-titrimetric method.Oliver, 771.
Folin - Ciocalteu test: Detection of 2-hydroxy and2-methoxy estrogens and other phenolic compounds by modified --. Risacher andGawienowski, 816.
Formaldoxime: Automatic modified -- methodfor determining low concentrations of man~anese in water containing iron. Henriksen,647.
Fruit basf's: Determination of benzoic acid in softdrinks (and --) by ion-exchange chromatography. Ford, 15; Erratum, 222.
Fruit-continuedcitrus: Rapid automated determination of bi
phenyl in -- rind. Gunther and Ott, 475.Methods of analysis for dimethoate residues in-- and vegetables. Smart, 621.
GGas oil: Determination of quinizarin in hydrocarbon
oil. Field and Godly, 287.Gelatin: Determining moisture content of -- and
animal glue. Jones, 210.Germanium diodes: Use of lithium-drifted -- for
y-spectrometric determination of radioactivefission-product nuclides. Banham. Fudge andHowes, 180.
Glass: Determination of specific gravity of -particles by density gradient method. Kindand Summerscales, 669.
Glue: Determining moisture content of gelatin andanimal --. Jones, 210.
Glycerol: Detection and estimation of ethylene glycol(and detection of --) in propylene glycol bythin-layer chromatography. Conacher andRees, 55.
Grapefruit: Rapid automated determination ofbiphenyl in citrus fruit rind. Gunther andOtt, 475.
Guthion: Semi-quantitative determination oforganophosphorus insecticides by ring-oventechnique with preliminary thin-layer chromatography. Pejkovic-Tadic, Celap, Janjic andVitorovic, 595.
HHafnium: Analysis of the New Metals-Titanium,
Zirconium, --, Niobium, Tantalum, Tungsten and their Alloys. Elwell and Wood.(Review), 821. .
Analytical Chemistry of Zirconium and --.Elinson and Petrov. (Review), 680.
Helium-3: Determination of -- in argon at levelsof 10-12• Melhuish and Chapman, 350.
Heptachlor: Analysis for residues of chlorinatedinsecticides and acaricides: review. Beynonand Elgar, 143.
Heptachlor epoxide: Analysis for residues ofchlorinated insecticides and acaricides: review.Beynon and Elgar, 143.
Hexachlorocyclohexane: Analysis for residues ofchlorinated insecticides and acaricides: review.Beynon and Elgar, 143.
Hexanitrodiphenylamine: Absorption spectra anddetermination of -- complexes of potassium,sodium, calcium and magnesium. Savage,Butt and Tallmadge, 714.
Histidine: Chromatographic determination of basicamino-acids in protein hydrolysates (determining -- in presence of other imidazolederivatives). Selim and Messiha, 261.
Hydration: Structure of Aqueous ElectrolyteSolutions and the -- of Ions. Samoilov.(Review), 340.
Hydrocarbon(s) oil: Determination of quinizarinin --. Field and Godly, 287.
Quasi-quantitative separation of paraffins andolefins. Spence and Vahrman, 324.
Hydrogen: Characteristic nuclear magnetic resonance spectral positions for -- in organicstructures. Mohacsi, 57.
Continuous monitor for -- in gases. \Valkerand Campion, 347.
Gas-chromatographic analysis of gases extractedfrom metals by vacuum fusion. Lileburn,571.

INDEX TO VOLUME 91 xxi
Hydrogen chloride: Chromatograph for analysis ofair, chlorine and --. Ruthven and Kenney,603.
Hydrogen cyanide: Replacement of benzidine bycopper ethylacetoacetate and tetra base asspot-test reagent for -- and cyanogen.Feigl and Anger, 282.
Bydroxamic acids: Colorimetric determination ofNery, 388.
N-Hydroxycarbamates: Colorimetric determinationof hydroxamic acids (and --). Nery, 388.
2-Bydroxy-estrogens: Detection of -- and 2methoxy-estrogens and other phenolic compounds by modified Folin - Ciocalteu test.Risacher and Gawienowski, 816.
Hydroxylamine: Colorimetric determination ofhydroxamic acids (and --). Nery, 388.
Oxidation of -- in sodium hydroxide inpresence of copper (II). Anderson, 532.
o-Bydroxymercuribenzoic acid: Determination ofthiol esters with --. Wronski, 745.
Bydroxypurines: Paper chromatography of purines,pyrimidines and imidazoles. Khattak, Barkerand Green, 526.
8-Bydroxyquinoline: Use of -- for separation ofyttrium-90 in determination of strontium-90 inbiological materials. Burton, Love and Mercer,739.
Hydroxyureas: Colorimetric determination of hydroxamic acids (and --). Nery, 388.
IImidazoles: Paper chromatography of purines,
pyrimidines and --. Khattak, Barker andGreen, 526.
Industrial wastes: See Eftluent8.Inlrared Band Handbook Supplements 3 and 4.
Szymanski. (Review), 823.Injection tap for gaseous samples in gas chromato
graphy. Stanford, 671.Insecticides: Analysis for residues of chlorinated
-- and acaricides: review. Beynon andElgar, 143.
Semi-quantitative determination of organophosphorus -- by ring-oven technique withpreliminary thin-layer chromatography. Pejkovic-Tadic, Celap, Janjic and Vitorovic, 595.
See also Pesticides.Institute of Petroleum: Gas Chromatography 1964.
Goldup. (Review),474.Instruments: See Apparatus.International Union 01 Biochemistry: Enzyme
Nomenclature. (Review), 142.Intravenous fluids: Determination of particulate
matter in --. Vessey and Kendall, 273.Iodine: Amperometric titration of submillinormal
concentrations of with mercury(I)perchlorate. Stock, 280.
determination flask for whole-bottle titrations.Green and Carritt, 207.
Simultaneous determination of -- and brominein urine by neutron-activation analysis. Belkasand Souliotis, 199.
Ion(s): Structure of Aqueous Electrolyte Solutionsand the Hydration of --. Samoilov. (Review),340.
Ion Exchange. Helfferich. (Review), 64.Iron: Automatic, modified formaldoxime method
for determining low concentrations of manganese in water containing --. Henriksen, 647.
Determination of aluminium in -- and steel.Corbett and Guerin, 490; Erratum, 610.
Iron-continuedDetermination of impurities in high purity
beryllium by differential cathode-ray polarography. Goode, Herrington and Bundy, 719.
Determination of nickel with dimethylglyoximein-- and steel containing cobalt and copper.Claassen and Bastings, 725.
Excitation gradients in acetylene - oxygen flames.Dean and Adkins, 709.
Metallkundliche Analyse. Koch and KolbeRohde. (Review), 608.
Organic-phase spectrophotometric determinationof -- with thiocyanate. Cerrai and Ghersini,662.
Solvent-extraction and absorptiometric determination of -- with 2-mercaptopyridine-loxide. Dalziel and Thompson, 98.
Titrimetric determination of carbon in -- andsteel. Jones, Gale, Hopkins and Powell, 399.
Iron(n) oxide: Determination of -- in silicate andrefractory materials. 1. Review. Schafer,755; 2. Semimicro titrimetric determinationof -- in silicate materials, 763.
IsobutanoI: Analysis and composition of potablespirits: determination of Ca, C4 and C. alcoholsin whisky and brandy by direct gas chromatography. Singer, 127.
Isoniazid: Micro-determination of-- by N-bromosuccinimide. Barakat and Shaker, 466.
IsopentanoI: Analysis and composition of potablespirits: determination of Ca, C4 and C. alcoholsin whisky and brandy by direct gas chromatography. Singer, 127.
Proportion of 2-methylbutanol and 3-methylbutanol in brandies and whiskies as determined by direct gas chromatography. Singer,790.
;1
lohnson - Nishita micro-distillation: Colorimetricfinish for -- of sulphur. Dean, 530.
KKeithane: See Dicolol.Ketones: Quantitative microanalysis of carbonyl
compounds. Parsons, 297.Kidney: Nitrogen factor for --. Society for
Analytical Chemistry, Analytical MethodsCommittee, Meat Products Sub-Committee,538.
Kinetics: Principles of Reaction --. Ashmore.(Review), 60.
Kjeldahl Method for Organic Nitrogen. Bradstreet.(Review), 470.
LLaboratories: Mechanising --. Smith. (Review).
222.Lasers: Optical Pumping. Bernheim. (Review),
471.Lead: Determination of impurities in high purity
beryllium by differential cathode-ray polarography. Goode, Herrington and Bundy, 719.
Determination of tetra-alkyl lead vapour andinorganic -- dust in air. Moss and Browett,428; Erratum, 546.
Investigations in the Field of Organolead Chemistry. Willemsens and Van der Kerk. (Review),750.
Polarographic determination of -- after cationexchange separation. Hamza and Headridge,237.

xxii INDEX TO VOLUME 91
Lead-continuedPolarographic determination of 0·01 to 0·10 per
cent. of bismuth in --. Bassett and Jones,591.
Spectrophotometric determination of 0·01 to 0·1per cent. of antimony in --. Bassett andJones, 176.
Use of diphenylcarbazone for determination ofmicrogram amounts of --. Trinder, 587.
Leaf: Determining copper compounds present on-- surfaces. Sharp, 212.
Lemon: Rapid automated determination of biphenyl in citrus fruit rind. Gunther and Ott,475.
Lichens: Thermal analysis of -- growing onlimestone. Mitchell, Birnie and Syers, 783.
Limestone: Thermal analysis of flchens growing on--. Mitchell, Birnie and Syers, 783.
Lindane: See Bezachlorocyclohe:rane.Lithium chloride: Flame-photometric determination
of traces of calcium in --. Emmott andLaw, 383.
Liver oils: Spectrophotometric determination ofvitamin D in fresh-water fish --. Baruaand Rao, 567.
Lovelock ionisation detector: Gas-chromatographicanalysis of gases extracted from metals byvacuum fusion (using --). Lilburne, 571.
Lubricating oils: Determination of water in -- bynear-infrared spectrophotometric method.Pearson, 247.
MMagnesium: Absorption spectra and determination
of hexanitrodiphenylamine complexes of potassium, sodium, calcium and --. Savage,Butt and Tallmadge, 714.
Improvement in performance of atomic absorptiometer by using pre-heated air and town gas(determining --). Rawson, 630.
Use of titan yellow for determination of --withspecial reference to soil extracts. Hall, Grayand Flynn, 102; Erratum, 222.
Malathion: Semi-quantitative determination oforganophosphorus insecticides by ring-oventechnique with preliminary thin-layer chromatography. Pejkovic-Tadic, Celap, Janjic andVitorovic, 595.
Malvalic acid: Analysis of fats containing cyclopropenoid fatty acids. Hammonds and Shone,455.
Manganese: Automatic, modified formaldoximemethod for determining low concentrations of-- in water containing iron. Henriksen, 647.
Determination of impurities in high purityberyllium by differential cathode-ray polarography. Goode, Herrington and Bundy, 719.
Flame-photometric determination of sodium andpotassium in -- ores. Russell, 511.
Masers: Optical Pumping. Bernheim. (Review),471.
Mass spectrometer: Vacuum fusion analysis with aAspinal, 33.
Matter Eqnilibrium: Lectures on --. Hill.(Review), 682.
Meat products: Determination of salt in bacon byusing sodium-ion responsive glass electrode.Halliday and Wood, 802.
Mecarbam: Mobile laboratory methods for determination of pesticides in air. I. Phosphorothiolothionates. Lloyd and Bell, 806.
Medicine: Standard Methods of Clinical Chemistry.Vol. 5. (Review). 138.
2-lIIlercaptopyridine-l-oxide: Solvent-extraction andabsorptiometric determination of iron with
Dalziel and Thompson, 98.Mercury(I) perchlorate: Amperometric titration of
submillinormal concentrations of copper(II)with --. Stock, 27.
Amperometric titration of submillinormal concentrations of iodine with --. Stock, 280.
Metals: Analysis of the New --. Elwell andWood. (Review), 821.
Gas-chromatographic analysis of gases extractedfrom -- by vacuum fusion. Lilburne, 571.
Metallkundliche Analyse. Koch and KolbeRohde. (Review), 608.
Methane: Gas-chromatographic analysis of gasesextracted from metals by vacuum fusion.Lilburne, 571.
Methoxychlor: Analysis for residues of chlorinatedinsecticides and acaricides: review. Beynonand Elgar, 143.
2-Methaxy-estrogens: Detection of 2-hydroxy and--and other phenolic compounds by modifiedFolin - Ciocalteu test. Risacher and Gawienowski, 816.
Methylbenzothiazole(1,3) - 4,4' - diazoaminobenzene(2,2')-disulphonic acid, sodium salt: See Titanyellow.
Methylbutsnol: Proportion of 2--- and 3---in brandies and whiskies as determined bydirect gas chromatography. Singer, 790.
Methylene blue: Colorimetric determination ofboron in soils, sediments and rocks with --.Stanton and McDonald, 775.
Methyl sterculate: Analysis of fats containingcyclopropenoid fatty acids. Hammonds andShone, 455.
Methylthymol blue: Detection of nanogram amountsof fluoride ion (with --I. Wilson and Cooke,135.
Microscopy: Analytical --. Wallis. (Review).749.
Microwave Spectroscopy of Gases. Sugden andKenney. (Review), 677.
Mitox: See Cblorbenside.Moisture: Determining -- content of gelatin and
animal glue. Jones, 210.See also Water.
Molecular sieve 5A: Use of -- for collectingfractions from a gas chromatograph. Cartwright and Heywood, 337.
Molybdenum: Determination of small amounts of-- in niobium and tantalum by atomicabsorption spectroscopy in nitrous oxideacetylene flame. Kirkbright, Peters and West,705.
Rapid determination of -- in alloy steels byatomic-absorption spectroscopy in nitrousoxide - acetylene flame. Kirkbright, Smithand West, 700.
Morphothion: Mobile laboratory methods for determination of pesticides in air. I. Phosphorothiolothionates. Lloyd and Bell, 806.
JlUissbauer Effect Methodology. Vol. 1. Gruverman. (Review), 608.
NNeomycin: Assay of --. Hoodless, 333.Neotran: See Oxythane.Nickel: Determination of impurities in high purity
beryllium by differential cathode-ray polarography. Goode, Herrington and Bundy, 719.

INDEX TO VOLUME 91 xxiii
Nickel-continuedDetermination of -- with dimethylglyoxime in
iron and steel containing cobalt and copper.Claassen and Bastings, 725.
Direct photometric determination of boron inAndrew and Nichols, 664.
Niobium: Activation analysis for titanium and -with fast neutrons. Athavale, Desai, Gangadharan, Pendharkar and Das, 638.
Analysis of the New Metals-Titanium, Zirconium, Hafnium, --, Tantalum, Tungstenand their Alloys. Elwell and Wood. (Review), 821.
Determination of small amounts of molybdenumin -- and tantalum by atomic-absorptionspectroscopy in nitrous oxide - acetylene flame.Kirkbright, Peters and West, 705.
Determination of traces of copper in -- andtantalum by atomic-absorption spectroscopy.Kirkbright, Peters and West, 411.
Excitation gradients in acetylene - oxygen flames.Dean and Adkins, 709.
Niobium-95: Use of lithium-drifted germaniumdiodes for y-spectrometric determination ofradioactive fission-product nuclides (zirconium95 in presence of --i. Banham, Fudge andHowes, 180.
Nitrate: Detection of -- in presence of interferingsubstances. Stevens, 743.
Nitric oxide: Colorimetric determination of oxides ofnitrogen. Norwitz, 553.
Nitrilotriacetic acid: Comments on "Effect of -impurity on standardisation of solutions ofEDTA." Monk,597.
Nitro compounds: Detection of dinitro and trinitroaromatic bodies in industrial blasting explosives.Amas and Yallop, 336.
Nitrogen: Automatic determination of --, phosphorus and potassium in plant material.Varley, 119.
Chemistry of Open-Chain -- Compounds.Vols. I and II. Smith. (Review), 677.
factor for cod flesh. Society for AnalyticalChemistry, Analytical Methods Committee,Fish Products Sub-Committee, 540.
factor for kidney. Society for Analytical Chemistry, Analytical Methods Committee, MeatProducts Sub-Committee, 538.
Fundamental studies in automatic -- digestion.Marten and Catanzaro, 42.
Gas-chromatographic analysis of gases extractedfrom metals by vacuum fusion. Lilburne, 571.
Kjeldahl Method for Organic --. Bradstreet.(Review),470.
oxides: Colorimetric determination of --.Norwitz, 553.
Nitrogen dioxide: Colorimetric determination ofoxides of nitrogen. Norwitz, 553.
Nitrogen tetroxide: Colorimetric determination ofoxides of nitrogen. Norwitz, 553.
Nitrogen trioxide: Colorimetric determination ofoxides of nitrogen. Norwitz, 553.
Nobel Foundation: Nobel Lectures: Chemistry,1922-1941. (Review), 824.
Nuclear magnetic resonance: Characteristic -spectral positions for hydrogen in organicstructures. Mohacsi, 57.
Formula Index to NMR Literature Data. Vol. 1.Howell, Kende and Webb. (Review), 60.
Interpretation of NMR Spectra: EmpiricalApproach. Bible. (Review), 58.
Spectroscopy: High Resolution Vol. I.Emsley, Feeney and Sutcliffe. (Review), 678;Vol. II, 820.
Nucleic acids: Measurement of -- in biologicalmaterials: supplementary review. Munro andFleck, 78.
Nuclides: Use of lithium-drifted germanium diodesfor the y-spectrometric determination ofradioactive fission-product Banham,Fudge and Howes, 180.
oOil(s): Determination of quinizarin in hydrocarbon
Field and Godly, 287.Determination of water in lubricating -- by
near-infrared spectrophotometric method.Pearson, 247.
Olefins: Quasi-quantitative separation of paraffinsand --. Spence and Vahrman, 324.
Optical Pumping: Introduction. Bernheim. (Review), 471.
Orange: Rapid automated determination of biphenyl in citrus fruit rind. Gunther and Ott,475.
Organo-aluminium compounds: lodimetric determination of --. Crompton, 374.
Organolead: Investigations in the Field of -Chemistry. Willemsens and Van der Kerk.(Review), 750.
Orthophosphate: Automatic determination of -in sewage and highly polluted waters. Henriksen, 652.
Oscillometry and Conductometry. Pungor. Translated by Damokos. Edited by Townshend.(Review), 339.
Ovex: See Chlorlenson.Oxalate: Thermal analysis of lichens growing on
limestone (identifying and determining calcium --i. Mitchell, Birnie and Syers, 783.
Oxidation Mechanism. Turney. (Review),61.Oxine: See 8-Hydroxyquinoline.Oxydemeton-methyl: Mobile laboratory methods
for determination of pesticides in air. I.Phosphorothiolothionates. Lloyd and Bell,808,
Oxygen: Determination of total available -- indi-tertiary butyl peroxide. Adams, 397.
Excitation gradients in acetylene - -- flames.Dean and Adkins, 709.
Study of macroscopic distribution of -- insteel rod by neutron-activation and vacuumfusion techniques. Wyk, Cuypers, Fite andWainerdi, 316.
Oxythane: Analysis for residues of chlorinatedinsecticides and acaricides: review. Beynonand Elgar, 143.
Ozone: Chemiluminescence method for determining --. Bersis and Vassiliou, 499.
PParaffins: Quasi-quantitative separation of-- and
olefins. Spence and Vahrman, 324.Particles: Determination of particulate matter in
intravenous fluids. Vessey and Kendall, 273.Projection method for inspection of ampoules
(detection of --i. Kendall, 284.Particle-size: Comparison of -- analysis results
obtained by using a centrifugal photosedimentometer with those obtained with centrifugal pipette equipment. Burt and Kaye, 547.
Pentanol: Analysis and composition of potablespirits: determination of Ca, C. and C6 alcoholsin whisky and brandy by gas chromatography.Singer, 127.

xxiv INDEX TO VOLUME 91
Pentanol-continuedProportion of 2-methylbutanol and 3-methyl
butanol in brandies and whiskies as determinedby direct gas chromatography. Singer, 790.
Peptides: Polysaccharides, -- and Proteins.Vol. 4. Coutts and Smail. (Review), 822.
Perchloric acid: Refractive index of aqueous --.McLean and Pearson, 594.
Pesticides: Mobile laboratory methods for determination of -- in air. I. Phosphorothiolothionates. Lloyd and Bell, 806; II. Thionazin,808.
See also Insecticides.Petroleum: Chemistry of Organic Sulfur Compounds
in -- and -- Products. Obolentsev.(Review},546.
Phase-solubility analysis: Anomalous results givenby --. Wilkinson and Wragg, 600.
Phenol: Determination of --, o-cresol and p-cresolin aqueous solution by kinetic method. Burgess and Latham, 343; Erratum, 546.
Phenolic compounds: Detection of 2-hydroxy and2-methoxy estrogens and other -- bymodified Folin - Ciocalteu test. Risacher andGawienowski, 816.
Removal of poly-- interfering with carbohydrate determinations in plant extracts withan insoluble polyphenol adsorbent. Sandersonand Perera, 335.
Phorate: Mobile laboratory methods for determination of pesticides in air. I. Phosphorothiolothionates. Lloyd and Bell, 806.
Phosphate: Interference from silica in-- analysis.Henriksen, 290.
Phosphine: Conductimetric determination of microgram amounts of -- in air. Greenfield,Moule and Perry, 10.
Phospholipids: Determination of ethanolamine andserine in --. Koning, 523.
Phosphorescence: Fluorescence and -- Analysis.Hercules. (Review), 751.
Phosphorothiolothionates: Mobile laboratorymethods for determination of pesticides in air.I. --. Lloyd and Bell, 806.
Phosphorus: Automatic determination of nitrogen,-- and potassium in plant material. Varley,119.
Determination of fluorine or -- in organiccompounds by micro-titrimetric method.Oliver, 771.
Micro-determination of inorganic -- in plasma.Bauminger and Walters, 205.
Sensitive and selective spectrophotometric determination of --. Djurkin, Kirkbright andWest, 89.
Photography: Chemical Analysis in --. Russell.(Review), 750.
Photosedimentometer: Comparison of particle-sizeanalysis results obtained by using a centrifugal-- with those obtained with centrifugalpipette equipment. Burt and Kaye, 547.
Physics: Optics, Waves, Atoms, and Nuclei:Introduction. Goldwasser. (Review), 60.
Plant(s): Automatic determination of nitrogen,phosphorus and potassium in -- material.Varley, 119.
Colorimetric finish for Johnson - Nishita microdistillation of sulphur (in --). Dean, 530.
Determination of copper compounds present onleaf surfaces. Sharp, 212.
Determination of residues of diquat. Calderbankand Yuen, 625.
Determination of total sulphur in soil and -material. Chaudhry and Cornfield, 528.
Plant(s)-continuedMethods of analysis for dimethoate residues in
fruit and vegetables. Smart, 621.mineral analysis by X-ray fluorescence spectro
metry. Jenkins, Hurley and Shorrocks, 395.Polarographic determination of zinc in -
materials. Stojanovic, Veselinovic and ~evkovic, 746.
Removal of polyphenolic compounds interferingwith carbohydrate determinations in -extracts with an insoluble polyphenol adsorbent. Sanderson and Perera, 335.
Thermal analysis of lichens growing on limestone.Mitchell, Birnie and Syers, 783.
Plasma: See Blood plasma.Plutonium: Primary analytical standards for --:
quantitative separation of -- from dicaesiumplutonium hexachloride. Miner, 464.
Polarography: Polarographic Techniques. Meites.2nd Edn. (Review), 607.
Techniques of Oscillographic --. Kalvoda.2nd Edn. (Review),608.
Polyclar AT: Removal of polyphenolic compoundsinterfering with carbohydrate determinationsin plant extracts with an insoluble polyphenoladsorbent (--). Sanderson and Perera, 335.
Polyphenolic compounds: Removal of -- interfering with carbohydrate determinations inplant extracts with an insoluble polyphenoladsorbent. Sanderson and Perera, 335.
Polysaccharides, Peptides and Proteins. Vol. 4.Coutts and Smail. (Review), 822.
Potable spirits: Analysis and composition of --:determination of Ca, C, and C6 alcohols inwhisky and brandy by direct gas chromatography. Singer, 127.
Proportion of 2-methylbutanol and 3-methylbutanol in brandies and whiskies as determinedby direct gas chromatography. Singer, 790.
Potassium: Absorption spectra and determinationof hexanitrodiphenylamine complexes of --,sodium, calcium and magnesium. Savage, Buttand Tallmadge, 714.
Automatic determination of nitrogen, phosphorus and-- in plant material. Varley, 119.
Cell K. Kernan. (Review), 543.Flame-photometric determination of sodium and-- in manganese ores. Russell, 511.
Potato: Determination of diquat residues in -tubers. Kirsten, 732.
Determining residues of diquat (in -- tubers).Calderbank and Yuen, 625.
Potentiostat: Modified -- for controlled potentialanalysis. Grimshaw and Quigg, 667.
Programming: Computer for Chemists.Wiberg. (Review), 339.
Propanol: Analysis and composition of potablespirits: determination of Ca, C, and C6 alcoholsin whisky and brandy by direct gas chromatography. Singer, 127.
Propylene glycol: Detection and estimation ofethylene glycol in -- by thin-layer chromatography. Conacher and Rees, 55.
Propyliodone Injection B.P.: Determination ofbenzylpenicillin traces in --. Simmons andJefferies, 656.
Protein(s} hydrolysates: Chromatographic determination of basic amino-acids in --. Selimand Messiha, 261.
Polysaccharides, Peptides and --. Vol. 4.Coutts and Smail. (Review), 822.
Purines: Paper chromatography of --, pyrimidines and imidazoles. Khattak, Barker andGreen, 526.

INDEX TO VOLUME 91 xxv
Pyrimidines: Paper chromatography of purines, -and imidazoles. Khattak, Barker and Green,526.
Pyrogallol: Determination of tantalum by solventextraction of a tantalum - -- complex.Scott, 506.
QQuinizarin: Determination of -- in hydrocarbon
oil. Field and Godly, 287.
RRadicals: Stable --. Buchachenko. (Review),
542.Radioactive fission-product: Use of lithium
drifted germanium diodes for the y-spectrometric determination of -- nuclides. Banham, Fudge and Howes, 180.
Radioisotope X-ray spectrometry: review. Rhodes,683.
Rare Earth: Chemistry of the -- Elements.Topp. (Review), 61.
High-Temperature Compounds of -- Metalswith Nonmetals. Samsonov. (Review), 59.
Reaction Kinetics: Principles of --. Ashmore.(Review), 60.
Redox Titrants: Newer --. Berka, Vulterin andZYka. Translated by Weisz. (Review), 338.
Refractive index of aqueous perchloric acid. McLeanand Pearson, 594.
Refractory materials: Determination of iron(II)oxide in silicate and --. 1. Review.Schafer, 755; 2. Semimicro titrimetric determination of iron (II) oxide in silicate materials,763.
River water: See Water.Rocks: Colorimetric determination of boron in
soils, sediments and -- with methylene blue.Stanton and McDonald, 775.
Ruthenium-103: Use of lithium-drifted germaniumdiodes for y-spectrometric determination ofradioactive fission-product nuclides (ruthenium106 in presence of --). Banham, Fudge andHowes, 180.
Ruthenium-106: Use of lithium-drifted germaniumdiodes for y-spectrometric determination ofradioactive fission-product nuclides (-- inpresence of ruthenium-l03). Banham, Fudgeand Howes, 180.
SSalicylaldehyde semicarbazone: Spectrofluorimetric
determination of microgram amounts ofscandium (with --). II. Separation bysolvent extraction. Kirkbright, West andWoodward,23.
Saliva: Flame-spectrophotometric determination ofcalcium in human --. Jones and Thomas,559.
Salt: Determination of -- in bacon by usingsodium-ion responsive glass electrode. Hallidayand Wood, 802.
Scandium: Spectrofluorimetric determination ofmicrogram amounts of --. II. Separationby solvent extraction. Kirkbright, West andWoodward, 23.
Sea water: Interference from silica in phosphateanalysis (in --). Henriksen, 290.
Sediments: Colorimetric determination of boron insoils, -- and rocks with methylene blue.Stanton and McDonald, 775.
Serine: Determination of ethanolamine and -- inphospholipids. Koning, 523.
Sewage: Automatic determination of orthophosphate in -- and highly polluted waters.Henriksen, 652.
Determination of thiourea in -- and industrialeffluents. Dickinson, 809.
Silica: Interference from -- in phosphate analysis.Henriksen, 290.
Silicate(s): Determination of iron(lI) oxide in -and refractory materials. 1. Review. Schafer,755; 2. Semimicro titrimetric determination ofiron(II) oxide in -- materials, 763.
Silver cyanide: Specific spot tests for --. Feigland Caldas, 654.
Size analysis: Comparison of particle-size analysisresults obtained by using a centrifugal photosedimentometer with those obtained withcentrifugal pipette equipment. Burt andKaye, 547.
Slater - Oohen disc centrifuge: Comparison ofparticle-size analysis results obtained by usinga centrifugal photosedimentometer with thoseobtained with centrifugal pipette equipment.Burt and Kaye, 547.
Smoke: Determination of catechol in cigarette --.Mold, Peyton, Means and Walker, 189.
Society for Analytical Ohemistry: Analytical MethodsCommittee, Essential Oils Sub-Committee.Spectral characteristics of eugenol, 214.
Analytical Methods Committee, Fish ProductsSub-Committee. Nitrogen factor for codflesh, 540.
Analytical Methods Committee, Meat ProductsSub-Committee. Nitrogen factor for kidney,538.
Analytical Methods Committee, Metallic Impurities in Organic Matter Sub-Committee.Separation and determination of small amountsof tin. Newman and Jones, 406.
Analytical Methods Committee, Prophylactics inAnimal Feeds Sub-Committee. Determinationof acinitrazole, 672.
Award of First Gold Medal to H. N. Wilson, 223.Subscription rates, increase in. Editorial, 405.
Sodium: Absorption spectra and determination ofhexanitrodiphenylamine complexes of potassium, --, calcium and magnesium. Savage,Butt and Tallmadge, 714.
Determination of -- in aluminium alloys byflame spectrophotometry with fuel-rich flamesto reduce interference. Hine, Crawford,Deutschman and Tipton, 241.
Distillation method for determining total carbonin --. Sinclair, Drummond and Smith, 582.
Flame-photometric determination of -- andpotassium in manganese ores. Russell, 511.
Sodium carbonate: Precise coulometry: titration ofpure --. Cooper and Quayle, 363.
Sodium chloride: See Salt.Sodium cyclamate: See Cyclamate.Sodium hydroxide: Oxidation of hydroxylamine in
-- in presence of copper (II). Anderson, 532.Sodium 2-hydroxyethane sulphonate: See Sodium
isethionate.Sodium isethionate: Colorimetric determination of
-- by means of ammonium eerie nitrate.Dicker and Newlove. 563.
Sodium nitrite: Determination of cyclamate in softdrinks by titration with --. Richardson andLuton, 522.

xxvi INDEX TO VOLUME 91
Soft drinks: See Drinks, soft.Soil(s) : Colorimetric determination of boron in --,
sediments and rocks with methylene blue.Stanton and McDonald, 775.
Colorimetric finish for Johnson - Nishita microdistillation of sulphur (in --). Dean, 530.
Determination of total sulphur in -- and plantmaterial. Chaudhry and Cornfield, 528.
extracts: Use of titan yellow for determinationof magnesium with special reference to --.Hall, Gray and Flynn, 102; Erratum, 222.
Specific gravity: Determination of -- of glassparticles by density gradient method. Kindand Summerscales, 669.
Specific surface:. Calibration of Fisher air-permeability apparatus for determining --. Edmundson, 306.
Spectra: Absorption -- in the Ultraviolet andVisible Region. Vol. VI. Lang. (Review),472.
Absorption -- of Minor Bases. Venkstern andBaev. (Review), 607.
Infrared Band Handbook Supplements 3 and 4.Szymanski. (Review), 823.
Spectrochemical Standards: Methods for the Chemical Analysis of NBS Copper-Base --. Bell.(Review), 473.
Spectrometry: Excitation gradients in acetyleneoxygen flames. Dean and Adkins, 709.
Spectrochemical Analysis: Optical --, X-RayFluorescence --, and Electron Probe Microanalysis Techniques, June 1964 to June 1965.Scribner. (Review), 340.
Spectroscopy: Applied Infrared --. Kendall.(Review), 754.
Developments in Applied --. Vol. 4. Davis.(Review), 606.
Handbook of Ultraviolet Methods. White.(Review), 295.
in Education. Vol. 2. Baker and Cairns.(Review), 218.
Laboratory Methods in Infrared --. Miller.(Review), 295.
Microwave -- of Gases. Sugden and Kenney.(Review), 677.
Research in Molecular Skobel'tsyn.(Review), 219.
Sensitive and selective reactions in inorganicspectroscopic analysis. West, 69.
Visual Methods of Emission --. Sventitskii.(Review), 751.
Spirits: Analysis and composition of potable --:determination of C., C. and C. alcohols inwhisky and brandy by direct gas chromato-graphy. Singer, 127. ,
Proportion of 2-methylbutanol and 3-methylbutanol in brandies and whiskies as determinedby direct gas chromatography. Singer, 790.
Steel: Determination of aluminium in iron and --.Corbett and Guerin, 490; Erratum, 610.
Determination of boron in mild --. Harrisonand Cobb, 576.
Determination of carbon in -- by a dynamicinfrared system. White and Scholes, 482.
Determination of nickel with dimethylglyoximein iron and -- containing cobalt and copper.Claassen and Bastings, 725.
Metallkundliche Analyse. Koch and KolbeRohde. (Review), 608.
Polarographic determination of arsenic in --.Susie and Pjescie, 258.
Polarographic determination of lead (in --)after cation-exchange separation. Hamza andHeadridge, 237.
Steel-continuedRapid determination of molybdenum in alloy-- by atomic-absorption spectroscopy innitrous oxide - acetylene flame. Kirkbright,Smith and West, 700.
Study of macroscopic distribution of oxygen in a-- rod by neutron-activation and vacuumfusion techniques. Wyk, Cuypers, Fite andWainerdi, 316.
Titrimetric determination of carbon in iron andJones, Gale, Hopkins and Powell, 399.
Sterculic acid: Analysis of fats 'containing cyclopropenoid fatty acids. Hammonds and Shone,455.
Sterilisation and Disinfection. Whittett, Hugo andWilkinson. (Review), 681.
Steroids: Steroid-Spektrenatlas. N eudert andRopka. Translated by Leane. (Review), 295.
Strontium-90: Use of 8-hydroxyquinoline forseparation of yttrium-90 in determination of-- in biological materials. Burton, Love andMercer, 739.
Sulphate: Analysis of electrolytic capacitor electrolyte: determination of chloride and -- inp.p.m. range. Priscott, Hand and Young, 48.
Sulphur: Application of oxygen-flask combustiontechnique to determination of traces of chlorineand -- in organic compounds. McGillivrayand Woodger, 611.
Chemistry of Organic Sulfur Compounds inPetroleum and Petroleum Products. Obolentsev. (Review), 546.
Colorimetric finish for Johnson - Nishita microdistillation of --. Dean, 530.
compounds: Determination of thiol esters witho-hydroxymercuribenzoic acid. Wronski, 745.
Determination of total -- in soil and plantmaterial. Chaudhry and Cornfield, 528.
Sumithion: See Fenitrothion.Superphosphate: Determination of zinc in trace
element -- by a.c. polarography. Curthoysand Simpson, 195.
Surface-active agents: Automatic determination ofanionic surface-active material in water.Sodergren, 113.
Determination of residual anionic -- in mineralflotation liquors. Gregory, 251.
TTantalum: Analysis of the New Metals-Titanium,
Zirconium, Hafnium, Niobium, --, Tungstenand their Alloys. Elwell and Wood. (Review),821.
Determination of small amounts of molybdenumin niobium and -- by atomic-absorptionspectroscopy in nitrous oxide - acetylene flame.Kirkbright, Peters and West, 705.
Determination of -- by solvent extraction ofa -- - pyrogallol complex. Scott, 506.
Determination of traces of copper in niobium andtantalum by atomic-absorption spectroscopy.Kirkbright, Peters and West, 411.
Spectrophotometric determination of traceamounts of --. Hill, 659.
Tap: Injection -- for gaseous samples in gaschromatography. Stanford, 671.
Tar: See Coal tar.TDE: Analysis for residues of chlorinated insecti
cides and acaricides: review. Beynon andElgar, 143.
Tedion: See Tetradifon.

INDEX TO VOLUME 91 xxvii
Tetra-alkyl lead : Determination of~- vapour andinorganic lead dust in air. Moss and Browett,428; Erratum, 546.
Tetra base: Replacement of benzidine by copperethylacetoacetate and -- as spot-test reagentfor hydrogen cyanide and cyanogen. Feigl andAnger, 282.
Tetradifon: Analysis for residues of chlorinatedinsecticides and acaricides: review. Beynonand Elgar, 143.
4,4'-Tetramethyldianrlnodiphenylmethane: See Tetrabase.
Thermal Analysis, 1965. Redfern. (Review), 471.Thianrlne : Determination of -- in breakfast
cereals. Ridyard, 328.Thiocyanate: Organic-phase spectrophotometric de-
termination of iron with Cerrai andGhersini, 662.
Thiodan: See EndosuUan.Thiol esters: Determination of-- with o-hydroxy
mercuribenzoic acid. Wronski, 745.Thionazin: Mobile laboratory methods for deter
mination of pesticides in air. II.Lloyd and Bell, 808.
Thione: See 2-Mercaptopyridine-l-oxide.Thiourea: Determination of -- in sewage and
industrial effluents. Dickinson, 809.Thoria: Automatic determination of -- in --
urania mixtures. Stuart, 208.Tin: Excitation gradients in acetylene - oxygen
flames. Dean and Adkins, 709.Separation and determination of small amounts
of --. Newman and Jones, 406.Titanium: Activation analysis for -- and niobium
with fast neutrons. Athavale, Desai, Gangadharan, Pendharkar and Das, 638.
Analysis of the New Metals- --, Zirconium,Hafnium, Niobium, Tantalum, Tungsten andtheir Alloys. Elwell and Wood. (Review), 821.
Automatic apparatus for determination of --.Denton and Whitehead, 224.
Titanium dioxide: Analysis of ~- pigments byspark-source mass spectrography. Jacksonand Whitehead, 418.
Titan yellow: Use of -- for determination ofmagnesium with special reference to soilextracts. Hall, Gray and Flynn, 102; Erratum,222.
Titrimeter: Multi-purpose --. Jennison andClark, 598.
Toxaphene: Analysis for residues of chlorinatedinsecticides and acaricides: review. Beynonand Elgar, 143.
TOxicology: Progress in Chemical ~-. Vol. 2.Stolman. (Review), 218.
Transitional Elements. Larsen. (Review), 296.Trianrlnopyrimidine: Paper chromatography of
purines, pyrimidines and imidazoles. Khattak,Barker and Green, 526.
TrihydroxYPurine: Paper chromatography of purines, pyrimidines and imidazoles. Khattak,Barker and Green, 526.
2,4,6-Trinitrotoluene: Detection of dinitro andtrinitro aromatic bodies in industrial blastingexplosives. Amas and Yallop, 336.
Tungsten: Analysis of the New Metals-Titanium,Zirconium, Hafnium, Niobium, Tantalum,-- and their Alloys. Elwell and Wood.(Review), 821.
UUnited States Bureau of Standards: Methods for the
Chemical Analysis of NBS Copper Base Spectrochemical Standards. Bell. (Review), 473.
Urania: Automatic determination of thoria inthoria - -- mixtures. Stuart, 208.
Urine: Simultaneous determination of iodine andbromine in-- by neutron-activation analysis.Belkas and Souliotis, 199.
VVacuum fusion analysis with a mass spectrometer.
Aspinal, 33.Gas-chromatographic analysis of gases extracted
from metals by --. Lilburne, 571.Vanadium: Excitation gradients in acetylene
oxygen flames. Dean and Adkins, 709.Vegetables: Methods of analysis for dimethoate
residues in fruit and --. Smart, 621.Viscosity: Ubbelohde's Zur Viskosimetrie mit
Umwandlungs- und Rechentabellen. GOttnerand Weber. 7th Edn. (Review), 681.
Vitanrln Assay: Tested Methods. Strohecker andHenning. Translated by Libman. (Review),294.
Vitamin A: Determination of vitamin D in presenceof ~-. Said, Salah and Girgis, 459.
Vitanrln D: Determination of -- in presence ofvitamin A. Said, Salah and Girgis, 459.
Spectrophotometric determination of -- infresh-water fish liver oils. Barua and Rao, 567.
WWastes, industrial: See EfBuents.Water(s): Automatic determination of anionic
surface-active material in Sodergren,113.
Automatic determination of orthophosphate insewage and highly polluted --. Henriksen,652.
Automatic, modified formaldoxime method fordetermining low concentrations of manganesein -- containing iron. Henriksen, 647.
Determination of -- in beryllium oxide.Smythe and Whateley, 285.
Determination of -- in lubricating oils bynear-infrared spectrophotometric method,Pearson, 247.
Instrument for continuous determination ofcarbon dioxide in high purity ~-. Wall, 795.
Interference from silica in phosphate analysis(in --). Henriksen, 290.
L'Analyse Chimique et Physico-Chimique deL'Eau. Rodier. 3rd Edn. (Review), 609.
~-, sea: See Sea water.Treatment. James. 3rd Edn. (Review), 141.
Wave Mechanics for Chemists. Cumper. (Review),403.
Whisky(ies): Analysis and composition of potablespirits: determination of Ca, Cc and C5 alcoholsin -- and brandy by direct gas chromatography. Singer, 127.
Proportion of 2-methylbutanol and 3-methylbutanol in brandies and -- as determinedby direct gas chromatography. Singer, 790.
XX-ray fluorescence analysis: Effect of particle size
on back-scattered X-ray correction methods inon-stream --. Carr-Brion, 289.
fluorescence spectrometry: Plant mineral analysisby --. Jenkins, Hurley and Shorrocks, 395.

xxviii INDEX TO VOLUME 91
X-ray- continuedFluorescence Spectrometry: Spectrochemical
Analysis: Optical Spectrometry, --, andElectron Probe Microanalysis Techniques,June 1964 to June 1965. Scribner. (Review),340.
spectrometry: Radioisotope review.Rhodes, 683.
Xylenol orange: Detection of nanogram amountsof fluoride ion (with --). Wilson and Cooke,135.
y
Yttrium-90: Use of 8-hydroxyquinoline for separation of -- in determination of strontium-90in biological materials. Burton, Love andMercer, 739.
ZZinc: Determination of impurities in high purity
beryllium by differential cathode-ray polarography. Goode, Herrington and Bundy, 719.
Zinc-continuedDetermination of -- in trace-element super
phosphate by a.c. polarography. Curthoys andSimpson, 195.
Improvement in performance of atomic absorptiometer by using pre-heated air and town gas(determining --). Rawson, 630.
Polarographic determination of -- in plantmaterials. Stojanovic, Veselinovic and Sevkovic, 746.
Zirconium: Analysis of the New Metals-Titanium,--, Hafnium, Niobium, Tantalum, Tungstenand their Alloys. Elwell and Wood. (Review),821.
Analytical Chemistry of -- and Hafnium.Elinson and Petrov. (Review). 680.
Zirconium-95: Use of lithium-drifted germaniumdiodes for y-spectrometric determination ofradioactive fission-product nuclides (-- inpresence of niobium-95). Banham, Fudge andHowes, 180.
Zone Melting. Schildknecht. (Review), 749.
ERRATA:
VOL. 90, 1965:p. 79, 1st line under REAGENTS. For "NN'-Dimethylformamide" read "N-Dimethylformamide."p. 479, heading in middle of page. For "ESTABLISHED I.C.U.M.S.A. STANDARD METHOD I"
read "TENTATIVE I.C.U.M.S.A. METHOD I".p. 707, Fig. 4. Transistors TR" TR" and TR3 are shown wrongly connected. Replace the circuit
diagram between the secondary of transformer T. and capacitor Cs by-
03
R27
VOL. 91,1966:
p. 17. Replace the right hand side of equation 1 by-Emu - [K(E1 - E 2) + E.]
p. 28, 6th line. For "approximately 0'6N (Procedure A)" read "appro_fimately 0·04 ~ (Procedure A)".p. 104, 7th line under Table 1. For "0·2 per cent. gelatin solution" read "0·1 per cent. gelatin solution".p. 108, 6th line under Table VIII. For "manganese(n) ions" read "magnesium(n) ions".p. 124, 4th line. For "123 ml" read "123 g."
p. 343, 4th line of synopsis. For "of the indicator" read "of the phenol".p. 431, 10th line under Fig. 4. For "for tetramethyllead and 86 to 89 per cent. for tetramethyllead"
read "for tetraethyllead and 86 to 89 per cent. for tetramethyl lead". .p. 496, 3rd line. For "tin(n) thiocyanate" read "sodium thiocyanate".
Printed by W Hefter & Sons Ltd Cambridge England

JANUARY, 1966
THE ANALYST
Vol. 91. No. 1078
Analytical Aspects of Chronopotentiometry*By JAMES J. LINGANE
(Department of Chemistry, Harvard University, Cambridge, Massachusetts, 02138, U.S.A.)
CHRONOPOTENTIOMETRY, one of the newest developments in electroanalytical chemistry, isbased on the observation of the change in potential of a working electrode as a functionof time during electrolysis. Usually the electrolysis is performed with a constant currentin a quiescent solution. Ultimately, the exhaustion of the electroactive substance at thesurface of the electrode causes a more or less rapid change of potential. The time at whichthis inflection occurs in the potential- time curve (the "transition time") depends, undercertain conditions, on the concentration of the electroactive substance, and this is the basisof analytical applications of chronopotentiometry.
With some substances the transition time is governed not by the gross concentrationbut rather by the slowest step in the sequence of reactions which constitutes the "reactionmechanism." Under this condition chronopotentiometry is a fruitful means of studyingelectrode kinetics. However, this discussion is confined chiefly to its analytical aspects.
Although the fundamental principles of chronopotentiometry have been known for along time (e.g., Henry J. S. Sand's pioneering studies in 1901), it is to Gierst and Juliard1
that credit is due for recognising the potentialities of the technique both as an analyticalmethod and as a powerful means of studying electrode kinetics.
135 volts
III
a.c.
Auxiliaryelectrode
Workingelectrode
Recorder orpotentiometer
Fig. 1. Fundamental chronopotentiometric circuit
The circuitry and instrumentation for analytical applications need not be complicated.As shown in Fig. 1, it comprises essentially a constant-current source, a potentiometer orrecorder for observing the potential of the working electrode against an external referenceelectrode, and an electric clock or equivalent device for timing the electrolysis. The monographs of Delahay2 or Lingane3 may be consulted for details.
• Special lecture given at the meeting of the Society on Wednesday, May 19th, 1965.
1

2 LINGANE: ANALYTICAL ASPECTS OF CHRONOPOTENTIOMETRY [Analyst, Vol. 91
Although various metals appropriate to particular situations may be used as workingelectrodes, the most common choice is mercury or platinum. A typical cell employing aplatinum wire working electrode (area about 0·25 cm2) is shown in Fig. 2. Provision is madefor stirring the solution between trials. Before each trial the stirring is stopped and the solution is allowed to become quiescent to favour the production of a discrete diffusion layer atthe electrode surface, because interpretation is simplest when the transition time is diffusioncontrolled. Because oxygen is readily reducible, it is usually necessary to remove dissolvedair from the test solution with nitrogen when studying cathodic reactions at potentials morereducing than about -0,2 volt versus the saturated calomel electrode (S.c.E.).
S.C.E.
Bridge tube
Auxiliary electrode
Working electrode
111I1111I1111111111I
Fig. 2. Chronopotentiometric cell. Solution volume is about100 cm3 • S.C.E. is a small commercial type (Beckman) saturatedcalomel electrode, and the bridge tube into which it dips contains thesame solution as in the cell. The central tube holding the auxiliaryplatinum-foil electrode (area about 4 cm') contains the same solution asin the main compartment of the cell, and its bottom is closed by asintered-glass disc. The cell cover is of Teflon, machined to give aclose fit
The constant-current density is selected so that the transition time will be less thanabout 30 seconds, as otherwise the convective stirring produced by the density gradient atthe electrode disrupts the diffusion layer at unshielded electrodes. By shielding the electrode,and orienting it in such a way that the density gradient preserves rather than disturbs thediffusion layer, it is possible to use larger transition times, but this has no advantage inanalytical applications.3 For analytical purposes an unshielded platinum wire or mercurydrop electrode is most convenient. By using relatively large current densities, and an oscillo-
. scope for potential measurement, transition times as small as about 0·1 second can be used.With still shorter transition times, the current resulting from charging the electrical doublelayer at the electrode surface becomes significant, and requires an inconvenient correction.2
Fig. 3 shows a chronopotentiogram for the reduction of +3 iron to +2 iron at a platinumcathode in a dilute hydrochloric acid medium. This is a typical reversible reaction, in thesense that all steps involved in it proceed more rapidly than the rates of diffusive transfer

January, 1966] LINGANE: ANALYTICAL ASPECTS OF CHRONOPOTENTIOMETRY 3
of +3 iron to, and +2 iron from, the electrode surface. Consequently both the potential ofthe electrode and the transition time are diffusion-controlled. At any instant the potentialof the platinum cathode obeys the Nemst relationship, i.e., at 25° C-
° (I'e2+)E = E - 0·05915 log (I'e3+) (1)
where (I'e2+) and (I'e3+) are the activities (approximately equal to concentrations) at theelectrode surface, as distinct from the bulk concentrations. With constant current, the rateof change of (I'e2+)/(I'e3+) increases more and more rapidly as electrolysis proceeds, untilfinally this ratio becomes so large that the potential rapidly shifts cathodically to the potentialof hydrogen ion reduction, to define the transition time.
I'or this kind of symmetrical, reversible reaction the potential of the electrode as afunction of the time t obeys the relationship (at 25° C)-
E = € _ 0.05915 log _tl_ (2)
n 'T1 - tlwhere 'T is the transition time, and € (which is identical with the polarographic half-wavepotential, E j ) is very nearly equal to the standard potential of the electrode reaction. Thepotential becomes equal to € when t = 'T/4. I'requently the observed potential is greaterthan that which corresponds to equation (2) (the difference being termed "overpotential"),and this is one definition of an irreversible reaction.
As first shown by Sand,· with linear diffusion to a plane electrode, and when diffusionis the controlling factor, the transition time (seconds) is given by
'T1 = 7T1nFADiC (3)
2iwhere C is the concentration of the electroactive species in the body of the solution (molescm-3), i is the constant current (amp), D is the diffusion coefficient of the diffusing species(cm2 sec-I), F is the I'araday constant (96,493 coulombs), A is the electrode area (cm2) ,
and n is the number of faradays per molar unit of reaction. As long as diffusion controls thesupply of electroactive species to the plane electrode surface this relation is valid, regardlessof whether or not the electrode reaction proceeds with thermodynamic reversibility.
0'6
.. 0'1w
"0>
u.i 0'2U [Tn,,;,;."vi t.me..:> 0~.,>v
W
o 10 20 30 40 50 60
Time. seconds
Fig. 3. Chronopotentiogram for reductionof 0·02 M ferric iron in M hydrochloric acid at aplatinum cathode
In analytical practice this Sand equation is seldom used directly, because D usuallywill not be known with sufficient accuracy in the variety of supporting electrolytes that areencountered. Instead, and just as in polarography, the electrode is calibrated empiricallyunder a given set of conditions with known concentrations of the substance being determined. Chiefly because of the change of D with temperature (about +2 per cent. deg-l) ,temperature control is important. Also, because of their effect on D, the nature and concentrations of the supporting electrolytes influence 'T. In short, conditions extant in chronopotentiometry are exactly similar to those in polarography.
The square root relationship between 'T and C is a minor inconvenience. As shown byHurwitz and Gierst,li.6 and others quoted by these authors, if, instead of using a constant

4 LINGANE: ANALYTICAL ASPECTS OF CHRONOPOTENTIOMETRY [Analyst, Vol. 91
current, the current is made to increase with time according to a function appropriate tothe particular electrode geometry then a direct, first-order dependence of T on C can beobtained. For instance, with a plane electrode, if i = kt l , then 7 becomes directly proportional to C. One must, of course, pay a high price in terms of increased instrumental complexity for this minor convenience.
u.i -0'4Uvi'"~ 0~u
w -0'4
100
Time, secol)d~
Fig. 4. Chronopotentiogram of a mixture of 5 millimolareach of +3 iron and +2 copper in M hydrochloric acid (uppercurve), and of {) millimolar +2 copper alone (bottom curve).Platinum:cathode
(6)
(4)(Tl + T2) = 7T~:12 (n1D11C1 + n2D21C2 )2
where the subscripts 1 and 2 refer to the first and second substances. From equations (3)and (4) it follows that the second transition time is given by-
72 = 7T~:12 (2nln2DIID2IClC2 + n22D2C22) .. (5)
The enhancement of the second transition time is thus directly proportional to the concentration of the first substance. Among the few examples in the literature of the analysisof mixtures is the analysis of mixtures of hydrazine and hydroxylamine by oxidation at aplatinum anode,9 and the transition times were in accord with the foregoing relationships.
In the two-stage reduction or oxidation of a single substance C and D are identical foreach stage, and only the two n-values differ. From the foregoing relationships, with C1 = C2and D1 = D 2 , it follows that the ratio of the individual transition times is-
~ = 2n2+ (n2)271 ~ n1
If the test solution contains several electroactive substances that are reduced (oroxidised) at sufficiently different potentials (0,2 volt or more), the chronopotentiogram willshow a succession of transition times or waves. The same is true in the stepwise reductionor oxidation of a single substance. Examples are shown in Fig. 4. In the stepwise reductionof the chloro complex of +2 copper (lower curve) the second Cu+ ---+ Cu wave is nearly threetimes longer than the first Cu2+ ---+ Cu+ wave, although both stages involve 1 electron. Theupper curve demonstrates how the addition of an equal concentration of +3 iron to theoriginal copper solution increases the transition times of both the subsequent copper waves,and also renders them more nearly equal. This non-additivity of chronopotentiometric transition times contrasts sharply with the additivity of polarographic diffusion currents, andit complicates the chronopotentiometric analysis of mixtures. After the first inflection,when reaction of the second (or subsequent, substance begins, the first substance (or priorsubstances) still continues to diffuse to, and react at, the electrode. Consequently, thecurrent results from both reactions at points on the second wave, and with a constant totalcurrent, the current from the second reaction is smaller than it would have been in theabsence of the first substance, and the transition time is increased.
From the studies of Berzins and Delahay7 and Reilley, Everett and Johns,8 the totaltransition time with a mixture of two substances, under conditions of diffusion control toa plane electrode, is-

January,I966J LINGANE: ANALYTICAL ASPECTS OF CHRONOPOTENTIOMETRY 5
where n1 and n 2 are the separate numbers of electrons for each stage. When nl = n 2 thenT2 ~ 3Tl' This is represented by the reduction of oxygen at a mercury cathode via twosuccessive 2-electron steps, as demonstrated by Berzins and Delahay.7 These authors alsoobserve, in agreement with equation (6) for n1 = 1 and n2 = 2, in the reduction of+6 uranium to +5 uranium, and finally to +3 uranium, that T2 = 8TI' I noted that theoxidation of iodide ion «0'0025 M) at a platinum anode in dilute sulphuric acid proceedsstepwise,3 and the ratio of the two transition times was close to 35. This is the value expectedfrom equation (6) for successive I-electron and 5-electron reactions, and the two wavesthus correspond to 1- ---* tI2 and lI2 ---* 10-3.
The foregoing relationships apply only to restricted linear diffusion to a plane electrode.With a cylindrical (wire) electrode, or a spherical electrode (mercury-drop), the transitiontime is greater than with a plane electrode of the same area, and under otherwise identicalconditions. When the electrode surface is curved, the area of the diffusion field increasesas the diffusion layer grows outward from the electrode. This enhances the supply of electroactive substance to the electrode, and consequently a longer time is required for the concentration at the electrode surface to become sufficiently depleted to produce a rapid potentialchange. Because a wire electrode is much more convenient in practical applications than aplane electrode, the transition-time relationship with cylindrical symmetry is important.
Peters and LinganelO derived and verified the following relationshp for the diffusioncontrolled transition time with a wire electrode (cylindrical symmetry) of radius r-
n!nFADtC
2i~= m
[ _~ eDT)! ! eDT) _3n! eDT»'> ]1 4 r2 + 4 r2 32 r2 + ...
The numerator is the Sand equation for linear diffusion to a plane electrode, equation (3),and the denominator accounts for the enhancement of the transition time resulting from thecylindricity of the diffusion field. The effect of the cylindrical field becomes greater as thetransition time, T, increases, and as the radius, 'T, of the wire is decreased. With r = 0·025 cmthe cylindricity effect amounts to about 10 per cent. even when T is as small as 1 second,and it does not become negligible unless T is smaller than about 0·05 second.
In practical work it is desirable to keep the cylindricity correction small by using anelectrode of relatively large radius but of relatively small area. This can be achieved bycoating a thick wire with an insulating film (e.g., Tygon paint), and then cutting away anarrow band around the wire.
Evans and Pricell computed the cylindricity correction for a wide range of values ofD, T and r, and collected the results in a table for convenient use.
The transition-time relationship for a spherical electrode has the same form as equation (7),except that the coefficients before each of the DT/r2 terms in the denominator are largerthan for a cylindrical electrode.
In sharp contrast with the rather complex theoretical equation (7), I found empiricallylSthat the observed transition time with a wire electrode obeys accurately the simplerelationship-
Tobs. = Tplane (1 + kT!) (8) .where Tplane is the transition time with a plane electrode of equal area, and the constant kdepends on the diffusion coefficient of the electroactive species and the radius of the wireelectrode. Since observed transition times correspond well to both equations (7) and (8),presumably equation (7) reduces to the much simpler form of equation (8) when enoughterms are included in the infinite series in the denominator of equation (7).
With cylindrical and spherical electrodes the theoretical expressions for the successivetransition times with mixtures of electroactive substances become complex, and inconvenientto use. IO In practical analytical work it is more expeditious to calibrate empirically, in amanner appropriate to the particular kind of sample.
In addition to the physics and algebra of chronopotentiometry, some phenomena areconsidered that are encountered in anodic chronopotentiometry with platinum electrodes.A platinum electrode is uniquely useful as an anode in the potential range from about+0·2 volt versus S.C.E. up to the potential at which water is oxidised (about 1·5 volts versusS.c.E.), because less "noble" metals are too easily oxidised (and anodically dissolved) in

6 LINGANE: ANALYTICAL ASPECTS OF CHRONOPOTENTIOMETRY [Analyst, Vol. 91
this potential region to permit their use as working electrodes. However, platinum is by nomeans completely "noble." It suffers oxidation when polarised anodically, but, becausethe several oxides of platinum happen to be very insoluble, and are produced as a thin,invisible film on the electrode surface, this oxidation is less obvious than with other metals.
1'5
n0 1'0>
WUvi 0'5'"::>~Cl>>-
u.o 0
Time, seconds
Fig. 5. Oxidation and reductionof a platinum electrode in air-freeM sulphuric acid.
Curve 1 in Fig. 5 is the anodic chronopotentiogram of a platinum-wire electrode in apure solution of dilute sulphuric acid. The ill defined, but definite, potential halt or waveprior to the oxidation of water results from the oxidation of the platinum to produce a verythin (approximately monomolecular) film of platinum oxides on its surface. After curve 1,the solution was stirred with nitrogen for an hour to remove the oxygen previously produced,and the well defined cathodic curve 2 was then recorded. Curve 2 corresponds to thereduction of the platinum oxides back to metallic platinum.
By direct chemical analysis, Anson and Lingane13 demonstrated that the film on oxidisedl'latinum electrodes contains both pta and Pt02, in an approximately 1 to 3 ratio, independently of whether the electrode is oxidised electrolytically or by chemical agents. Higheroxides (e.g., PtOs) that would be reduced in the chemical stripping experiments may also bepresent. The study of Peters and Lingane14 (direct determinations of +2 platinum and+4 platinum, of chloride, and of oxide) has shown that the films formed by anodicallypolarising platinum electrodes in chloride media are predominantly PtCl2 in strongly acidicmedium, mixtures of +2 platinum and +4 platinum oxychlorides at intermediate pH values,and chiefly platinum oxides in alkaline media.
The formation of the platinum oxide films has two important consequences in anodicchronopotentiometry with platinum electrodes. First, the transition time is increased becausepart of the current results from oxidation of the platinum. Secondly, the platinum oxidefilm strongly inhibits the oxidation of some substances (e.g., oxalic acid, iodine).
Curve 1 in Fig. 6 is the anodic chronopotentiogram for the oxidation of oxalic acid(to carbon dioxide and hydrogen ions) in dilute sulphuric acid on a previously reduced platinum
n "5!=0>
u.i 1'0Uvi..::>~ 0'5OJ,.
W
010 20 30 40 50
Time. seconds
Fig. 6. Anodic chronopotentiograms of oxalic acid at a platinumelectrode in M sulphuric acid

January, 1966] LINGANE: ANALYTICAL ASPECTS OF CHRONOPOTENTIOMETRY 7
wire electrode at 25° C. The excellently defined transition time is diffusion-eontrolled.Curves 2 and 3 were obtained seriatim after curve 1, after brief stirring of the solution betweentrials. Once the electrode has been oxidised by the first trial the oxidation of oxalic acidis strongly inhibited, and after the second trial no wave at all is observed (curve 3).
When the oxidised electrode (corresponding to curve 3 in Fig. 6) is allowed to standfor 24 hours in the oxalic acid solution, it regains its activity and a normal oxalic acid waveis again observed. On long standing, the platinum oxide £ibn is finally reduced by theoxalic acid.
When these experiments are repeated at 60° C, instead of 25° C, a larger number ofprior anodic trials is needed for complete disappearance of the oxalic acid wave. Furthermore, at 60° C the electrode regains its activity after standing in the oxalic acid solutionfor a period of minutes rather than hours. At the higher temperature the platinum oxidefilm is reduced more rapidly by the oxalic acid.
If, in successive trials with an originally reduced electrode, the circuit is opened assoon as the inflection potential is reached at 1·25 volt, rather than allowing the potentialto increase all the way to oxygen evolution at 1·5 volt, then there is no inhibition. Thisoccurs in spite of the fact13 that after anodisation to 1·25 volt the electrode acquires morethan half as much oxide film (and with the same proportions of PtO and PtOz) as afteranodisation to 1·5 volt.
No inhibition by repeated anodisation is observed with substances such as +2 iron,hydroquinone, iodide ion or hydrazine, which are known to reduce the platinum oxidesquickly.
From these and other observations, I believe that the primary, electron-transfer stepin the oxidation of any substance at a platinum electrode must be oxidation of the platinumitself to form either one of the several platinum ions, or oxides or other compounds ofplatinum, depending on the potential and solution composition. The platinum species then"chemically" oxidise the substance in question, and are of course, reduced to metallicplatinum.
The inhibition of the oxidation of a substance such as oxalic acid by a fully formedplatinum oxide film, but not by a partially formed one (e.g., at 1·25 volt), suggests a muchsmaller rate of reaction of the fully formed £ibn with the oxalic acid.
I.,oE~E
u~.-u~
ci.EcoU 300~-..j
200
o 0 •CQ:=
B'
100,;;-_~_~_*_~_~:--~~,0 5 10 15 20 25 30
Transition time. seconds
Fig. 7. Enhancement of apparent transition time ofoxalic acid due to oxidation of the platinum anode.Curve A, 4 X 10-& M; curve B, 0·001 M; curve C, 0·01 M;curve D, 0·05 M
The increase in the transition time due to formation of the platinum oxide £ibn is demonstrated in Fig. 7. In these experiments, with oxalic acid concentrations from 4 X 10⁻⁴ to

8 LINGANE: ANALYTICAL ASPECTS OF CHRONOPOTENTIOMETRY [Analyst, Vol. 91
0·05 M in M sulphuric acid, the platinum-wire electrode was previously reduced before eachtrial. With each concentration of oxalic acid the current was varied to produce a wide rangeof transition times. Because of the concomitant oxidation of the electrode, which correspondsto a constant quantity of electricity of about 800 microcoulombs cm-2, the apparent transition time is enhanced to a relatively greater extent, the smaller the transition time itself,and the smaller the concentration of oxalic acid. With 4 X 10⁻⁴ M oxalic acid the quantityiT'le is five times larger than with 0·05 M oxalic acid, at the smallest transition times.
I discovered empirically15 that correction for the oxidation of the platinum electrodecan be made remarkably accurately by computing a corrected current, i corr., from the observedconstant current, iobs., by means of the relationship-
icorr. = iobs. _!l. (9)T
where T is the observed transition time (seconds), and Q is the constant quantity of electricity(about 800 microcoulombs cm-2) resulting from oxidation of the electrode. The value ofQ is easily found by blank trials with the supporting electrolyte alone (e.g., curve 2 in Fig. 5).This correction is seemingly illogical, because it implies that the fraction of the currentresulting from the oxidation of the electrode is constant during the entire time of electrolysis,which is hard to believe. However, it is fully justified by experience, as shown in Fig. 8.
'T.,0E
MEu
S-ue:
)20ci.Eco
110
~ +.0.... 100f:
,.§90
80
'"70
Transition time. seconds!
Fig. 8. Transition-time constants of oxalic acid aftercorrection for electrode oxidation by equation 9
Keyt" 4 X 10⁻⁴ M
+ 0·001 Mo 0·01 M• 0'05M
In Fig. 8 the same results as in Fig. 7 have been re-plotted after correcting the currentfor electrode oxidation by equation (9). All the corrected results for all concentrations ofoxalic acid now fall on the same curve. This same method of correction has been found tobe valid for other substances, and with gold as well as platinum electrodes.10
Although this discussion is primarily concerned with the analytical capabilities ofchronopotentiometry, the cardinal principles involved in its applications to the study ofelectrode kinetics may be briefly mentioned. Suppose, for example, that a substance A,not itself electroactive, is in equilibrium with some other substance B, that is electroactive,and that chronopotentiograms are recorded seriatim, starting with a relatively small current

January, 1966J LINGANE: ANALYTICAL ASPECTS OF CHRONOPOTENTIOMETRY 9
and then gradually increasing the current to larger values. With the smaller currents therate of shift of the equilibrium A =B at the electrode surface may be large enough so thatB is produced as fast as it is consumed by the electrode reaction. Under these conditionsthe transition time will be "normal," in the sense that it will be governed by the rate ofdiffusion of A from the solution to the electrode. However, if the current is large enoughcompared to the rate of A -+ B, the transition time will be governed by the rate of this priorreaction, and will be smaller than for diffusion control. In other words, as the current isincreased the quantity iT! IC will decrease at a rate that depends on the specific rate constantof A -+ B. When the current is finally made very large compared to the rate of A -+ B, thetransition time will be governed by the original equilibrium concentration of B, and iTi ICwill no longer decrease. This ability of chronopotentiometry to provide information aboutthe rates of electrode processes is more impressive than its analytical capabilities.
Because they rest on similar principles, it is pertinent to conclude by comparing theanalytical capabilities of chronopotentiometry and polarography. Under optimum conditionsthe accuracy and possible scope of both methods are about the same. However, becausechronopotentiometry is more sensitive to the rates of the various steps that may be involvedin an over-all electrode process, chronopotentiograms often tend to be less well defined thanpolarograms, especially at small concentrations. In general, chronopotentiometry is disappointing at concentrations below about 5 X 10⁻⁴ 1\1, whereas classical polarography isapplicable to 100-fold smaller concentrations, and some modem polarographic techniquesare even more sensitive. Chronopotentiometry is also less readily applicable than polarography for the analysis of mixtures. Although predictions can be risky, it does seem thatchronopotentiometry as ar. analytical method will remain quite restricted.
REFERENCES
1. Gierst, L., and Juliard, A., "Proceedings, International Committee of Electrochemical Thermodynamics and Kinetics, 2nd Meeting," Milan, 1950; ]. Phys. Chem., 1953, 57, 701.
2. Delahay, P., "New Instrumental Methods in Electrochemistry," Interscience Publishers Inc.,New York, 1954, Chapter 8.
3. Lingane, J. J., "Electroanalytical Chemistry," Interscience Publishers Inc., New York, 1958,p. 617 et seq.
4. Sand, H. J. 5., Phil. Mag., 1901, 1, 45.5. Hurwitz, H., and Gierst, L., ]. Electroanal. Chem., 1961, 2, 128.6. --, --, 1964, Ibid., 1964,7, 368.7. Berzins, T., and Delahay, P., ]. Amer. Chem. Soc., 1953,75, 4205.8. Reilley, C. N., and Everett, G. W., and Johns, R. H., Analyt. Chem., 1955, 27, 483.9. Morris, M. J., and Lingane, J. J., ]. Electroanal. Chem., 1964, 8, 85.
10. Peters, D. G., and Lingane, J. J., Ibid., 1961, 2, 1.11. Evans, D. H., and Price, J. E., Ibid., 1963, 5, 77.12. Lingane, J. J., Ibid., 1961, 2, 46.13. Anson, F. C., and Lingane, J. J., ]. Amer. Chem. Soc., 1957, 79, 4901.14. Peters, D. G., and Lingane, J. J., ]. Electroanal. Chem., 1962,4, 193.15. Lingane, J. J., Ibid., 1960, 1, 379.
Received August 5th, 1965

10 GREENFIELD, MOULE AND PERRY: CONDUCTIMETRIC [Analyst, Vol. 91
The Conductimetric Determination of MicrogramAmounts of Phosphine in Air*
By S. GREENFIELD, H. A. MOULE AND R. PERRY(Albright &- Wilson (Mfg.) Ltd., Research Department, Oldbury, Birmingham)
A conductance cell is proposed as a sensitive means of detecting anddetermining phosphine in air at the part-per-million level. The contaminatedair is passed through mercuric cWoride solution in the cell, where reactionoccurs between the phosphine and the mercuric chloride, liberating hydrogenchloride. This causes a rise in conductance proportional to the amount ofhydrogen cWoride, and hence to the amount of phosphine.
Suggestions are made for the determination of phosphine in discretesamples of air, and for the continuous monitoring of contaminated air.
VARIOUS methods have been proposed for detecting and determining phosphine. For example,a known volume of air can be passed through a standard silver nitrate solution, the residualsilver nitrate then being titrated with standard potassium thiocyanate.1 For determiningphosphine in acetylene, the gas has been passed through a solution containing mercuricsulphate and potassium chloride. The acetylene is passed until the solution is exhausted,as indicated by a strip of silver nitrate paper at the gas exit; the phosphine content canthen be calculated.2
A sensitive detector consists of a glass tube containing either a paper strip impregnatedwith silver nitrate,3,4 or silica-gel particles, with silver nitrate,5 a copper salt and a mercurycomplex,6 or a mercury salt and auric chloride? as impregnant. A known volume of contaminated air is pumped through the tube, and the length of stain is compared with standards.It is claimed that such tubes will detect phosphine down to 0·01 p.p.m.
It has also been claimed that phosphine can be determined spectrophotometrically bythe colour produced by reaction with silver diethyldithiocarbamate.8
In any process in which phosphine is used there is always present the possibility ofa leakage, with the accompanying toxicity hazard, and it was considered that some formof continuous monitoring of the atmosphere near the plant was desirable. None of theabove methods lends itself to automation, or to continuous recording, whereas the conductancecell to be described can be used, not only to examine discrete samples of air, but also, inconjunction with a suitable self-balancing bridge and recorder, for monitoring purposes. Thecell contains mercuric chloride solution through which the air is passed. Hydrogen chlorideis liberated by reaction of the phosphine with the mercuric chloride, causing a sharp rise inconductance, proportional to the amount of phosphine absorbed.
EXPERIMENTALTHE CELL-
The design of the conductance cell is similar to those already described9 ,10,l1 for thedetermination of carbon and hydrogen in organic compounds, except that the electrodesare much larger, and the working volume is 11 m!. The electrode system consists of acylindrical inner electrode of platinum gauze, surrounded by two half-cylindrical outerelectrodes, also of platinum gauze. Possible leakage round the sealed-in wires is preventedby a coating of Araldite resin. The cell is illustrated in Fig. 1.
A steady flow of air is essential in order to give a uniform circulation of solution andhence a steady conductance reading. (The conductance of a flowing solution is not thesame as that of a stationary one.) To achieve this steady flow the jet size must be carefullychosen, since if it is too large the bubbles will emerge in bursts. This not only causes intermittent circulation of the solution, but also allows the solution to rise up inside the jet. Thismust be avoided, since this solution is absorbing phosphine but not contributing to theconductance. On the other hand, too small a jet can cause considerable back-pressure inthe air-inlet system, which can give rise to loss of phosphine by leakage through the joints.
• Presented at the meeting of the Society on Wednesday, November 4th, 1964.

January, 1966J DETERMINATION OF MICROGRAM AMOUNTS OF PHOSPHINE IN AIR II
The optimum size of jet is best found by trial and error, but as a guide the jet usedin these investigations was approximately 0·1 mm in diameter. The easiest way to obtainsuch a jet is to draw a capillary with a slow taper and then to cut or grind this back untilthe desired results are obtained.
Fig. 1. Conductance cell
THE MEASURING APPARATUS AND TEMPERATURE COMPENSATION-The conductance meter was made to a Guest, Keen and Nettlefold design,12,13 and is
similar to those already described. 9 ,lo,ll Temperature compensation is again by thermistor,but since mercuric cWoride solutions, being non-electrolytes, do not have the necessarytemperature characteristics, a small amount of hydrochloric acid solution has to be added.
Fig. 2 shows the degree of compensation achieved for an unused solution of mercuriccWoride with 0·00046 per cent. of added hydrogen chloride, and for a solution with 0·00053 percent. of added hydrogen chloride, with a particular value of shunt resistor. The graphs areof the percentage change in conductance as the temperature is changed by 0'5° C aboveand below the mean temperature of 25° C. _.
-0'5 -0'1 0'1 'STemperature change, °C
(Mean temperature. 25°C)
Fig. 2. Degree of compensation for part-used (curve A) andfresh (curve B) solutions

12 GREENFIELD, MaULE AND PERRY; CONDUCTIMETRIC [Analyst, Vol. 91
Since the thermostatically-controlled bath holds the temperature constant to ± 0·03° C,reference to Fig. 2 will show that the variation in meter reading over this range is ±0·0007 percent. (±0·0l ohm in 1500) for unused solution and ±O·006 per cent. (±0·09 ohm in 1500)for partially used solution. Both these are obviously within the limits of accuracy of readingthe meter.
CHOICE OF ELECTROLYTE-The requirements of a satisfactory electrolyte are (a) that it shall absorb all the phosphine
from the sample; (b) that it shall react with the phosphine to give a product that will changethe conductance of the solution, and (c) that this change shall be as large as possible.
A number of possible reagents, including copper sulphate, cuprous chloride, silver nitrate,mercuric and mercurous nitrate solutions, has been tried, but each failed to satisfy one ormore of these requirements. Mercuric chloride, however, absorbs phosphine well, even atlow concentrations, e.g., 0·1 per cent. At the same time, being virtually un-ionised, it hasa very low conductance. This entails the use of large electrodes to give conductances withinthe optimum working range of the meter, which in turn gives high sensitivity.
In addition, the reaction with phosphine yields hydrogen and chloride ions in solution,which gives a large change in conductance for a small amount of phosphine.
A disadvantage of mercuric chloride is that solutions of it do not have the desirednegative coefficient of resistance, but this can be conferred by addition of a trace of hydrochloric acid to make, say, a 0·00046 per cent. solution.
The question arises of the reaction between phosphine and mercuric chloride. Threereactions at least are possible, all giving rise to hydrogen chloride, but one giving phosphorousacid in addition-
PHa + 3HgC12 -~ P(HgCl)a + 3HCl (I)
2PHa + 3HgC12 -~ PzHga + 6HCl (2)
PHa + 6HgCl2 + 3H20 -~ HaPOa + 3HgzClz + 6HCl (3)
Reactions (I) and (2) both have the same yield of hydrogen chloride per mole of phosphine, but reaction (3) not only gives twice as much hydrogen chloride, but also gives I moleof phosphorous acid. The conductance under these conditions would be much greater thanfor reactions (I) or (2).
The reaction that in fact takes place was found by the following technique. Smallincrements of 0·002 N hydrochloric acid were added to the cell, and the conductance changewas noted each time. A graph was plotted of conductance change against weight of addedhydrogen chloride, after correction for dilution of the absorbing solution. A sample ofphosphine was diluted suitably with air and a known volume of this was injected by meansof a gas-tight syringe into the carrier gas at such a rate that the concentration of phosphinein the gas entering the cell was 2·5 p.p.m. The conductance change was noted and comparedwith the calibration graph to give the weight of hydrogen chloride released in the solution.This was then converted to weight of phosphine according to each of the three equations.By this means the recovery of phosphine was 88 per cent. if equation (1) or (2) held, butonly 33 per cent. if equation (3) held. From this it was concluded that equation (I) held,since the mercuric chloride was present in large excess. From previous experience, 88 percent. purity was regarded as a reasonable figure; it does not represent low recovery, sincea silver nitrate detector on the exit tube of the cell indicated no loss of phosphine over manydeterminations.
CALIBRATION PROCEDURE-
Since the reaction between phosphine and mercuric chloride gives only hydrogen chloride,the cell can be calibrated by adding small known amounts of a suitable dilute hydrochloricacid solution and measuring the resulting conductance changes. It is obviously a simplerand more accurate procedure to add hydrochloric acid for calibration purposes than to usephosphine. A graph is then drawn of conductance change against weight of hydrogen chlorideused; this should be a straight line. This permits a factor to be calculated for weight ofhydrogen chloride in /Lg per ohm and hence weight of phosphine in ~ per ohm from theequation-
PHa + 3HgClz -~ P(HgCl)a + 3HCl.
January, 1966J DETERMINATION OF MICROGRAM AMOUNTS OF PHOSPHINE IN AIR 13
It must be noted that the addition of hydrochloric acid not only increases the concentration of the hydrogen chloride, but also increases the volume of the solution. In practice.when phosphine is being determined, the solution volume is not increased, so the effectiveaddition of hydrogen chloride, with respect to the original solution volume, must be calculatedfor each addition. It is this effective addition-
XLyx + Ly X C,
where x initial volume of solution in rnl;Ly = sum of the increments of hydrochloric acid solutions in ml; andC = concentration of the added hydrochloric acid solution in p,g per ml,
that is plotted against conductance meter-readings.The graph should be a straight line, and has been found to be so up to 12 p,g of added
hydrogen chloride. Some slight curvature may be apparent at higher concentrations.
DRIFT-As substantially dry gas (e.g., air or nitrogen) is passed through the cell, the conductance
is found to increase at a constant rate. Most of the time this conductance drift is attributableto the slow reduction in volume of the solution as water is removed by the gas, but thereremain occasions when the drift is somewhat higher owing to factors at present unknown.
Correction is made for the drift by noting the change in conductance over a knownperiod, with air or nitrogen passing through the cell at the normal rate (20 ml per minute).This permits a figure for drift in ohms per minute to be calculated, usually less than 0·1 ohmper minute. By timing the sample determinations, corrections for drift can be made.
SENSITIVITY-The factors that might be expected to influence the sensitivity include (a) the initial
concentration of the hydrogen chloride in the mercuric chloride solution, (b) the volumeof the solution, (c) the electrode configuration, and (d) the measuring apparatus.
The initial concentration of the hydrogen chloride can be shown theoretically to haveno effect on the conductance change for a given amount of phosphine. Since, however, themeasuring apparatus is at its most sensitive when working between 1000 and 3000 ohms,the initial concentration of hydrogen chloride must be chosen, having regard also to theelectrode configuration, so as to give an initial conductance within this range.
The volume of solution is, on the other hand, critically important, since, for a givenamount of phosphine and a given electrode assembly, the conductance change is greater thesmaller the solution volume. It follows, therefore, that the initial volume of solution mustalways be measured as accurately as possible, so as to be identical with the volume usedin the calibration.
As regards the electrode configuration, the electrodes should be as large as possible,and as close together as possible, since this gives the maximum conductance change for agiven amount of phosphine.
The steady drift at any time can be calculated from the conductance-bridge readingsover a suitable period. These readings have an uncertainty at the 95 per cent. confidencelevel of ±0·3 ohm, which corresponds in our particular cell to 0·005 p,g of phosphine.
Since an upward displacement by 0·3 ohm of the drift due to phosphine can be detected,it follows that an air sample containing, say, 0·05 p.p.m. of phosphine could be analysedby taking a discrete sample of 66·6 ml. A continuously monitored sample of the samephosphine level would be detected, at 20 ml per minute, after 3 minutes 20 seconds.
INTERFERENCES FROM OTHER GASES-Any gas that reacts with mercuric chloride to give hydrogen chloride, or which dissolves
in water to give ions, or which reacts with the hydrogen chloride, will give a conductancechange and thereby interfere.
For instance, ammonia causes a drop in conductance, but can be removed from thesample gas by passing it through granular calcium chloride. Sulphur dioxide, hydrogensulphide, arsine and stibine cause increases in conductance; all these can be removed, withoutaffecting the phosphine, by passage through a tube of potassium hydroxide pellets.

14 GREENFIELD, MOULE AND PERRY [Analyst, Vol. 91
METHODThe first time the cell is used, set the temperature compensation as previously described. 9
Also linearise the conductance meter by the following technique. Substitute a decade boxfor the electrode assembly, and note conductance readings,S, for various values of resistance,R, on the decade box. Plot R values against 1/5 values, when it will be found that the graphcuts the R axis close to, and below, the origin, at a point that may be called RL. This represents the resistance of a choke in the cell arm of the bridge, which can be compensated forby a suitable shunt, Sf, across the measuring arm of the bridge. To calculate the value of Sf,substitute the value of RL in the formula: Sf = PQ/ RL, where P and Q are the fixed armsof the bridge.
Empty the cell and wash it well with water until the conductance is less than 50 ohms.Again empty the cell and blow it dry with filtered air; do not attempt to dry it with organicsolvents. Fill the cell with exactly 11 ml of absorbing solution, with nitrogen flowing at20 ml per minute. Note the conductance when the temperature has stabilised, as denotedby a steady drift.
Add successive 20-pJ portions of 0·002 N hydrochloric acid, preferably by means of aMicrocap disposable capillary, and note the steady conductance readings after each addition.Correct the conductance readings for drift and plot the conductance change for each effectiveaddition against the weight of hydrogen chloride added. From the graph calculate a factorfor the conductance change per p,g of phosphine from the equation- .
PHa + 3HgCl2 --3>- P(HgCl}a + 3HCl.The cell is now ready for use.
USE OF THE CELL-
Discrete samples of air containing small amounts of Phosphine-A pressure sample container, as used by the National Coal Board, is suitable. Ensure that the two absorber tubesare not exhausted. Pass purified nitrogen at 20 ml per minute and note conductances overa period until a steady drift is indicated. Calculate the value of the drift in ohms per minute.Pass the contaminated air through the cell via a pressure-reducing valve and a flowmeterat 20 ml per minute for a timed period and note the conductance change. Correct for driftand find the weight of phosphine from the calculated factor.
Discrete samples of air containing higher concentrations of phosphine-Fit aT-tube,having a serum cap on the leg of the T, into the line before the two absorber tubes. Passpurified nitrogen through the cell at 20 ml per minute and note conductances over a perioduntil a steady drift is indicated. Calculate the value of the drift in ohms per minute. Injecta suitable volume of sample in small increments from a gas-tight syringe into the nitrogenstream via the serum cap, and note the conductance change. Correct for drift and find theweight of phosphine from the calculated factor as before.
Continuous monitoring of contaminated air-The cell can be used as it stands for thispurpose, but the conductivity bridge needs constant attention. One of us (S.G.), however,has used the bridge in a continuously recording form, which permits the cell to be used forcontinuous-monitoring purposes, although the cell must be recharged periodically withabsorbing solution. Alternatively, a flow-through cell can be designed, which will give thephosphine content of the sample as a conductance reading, rather than as a change in conductance. Such a cell, however, would have a reduced sensitivity, and calibration withhydrochloric acid would be difficult.
REFERENCES
1. Filz, W., Mitt. chem. Forsch.Inst. Wirt. Ost., i954, 8, 61.2. Strizhevskii, 1. 1., and Zaitseva, V. P., Zav. Lab., 1956, 22, 546.3. Lugg, G. A., Commonwealth of Australia Department of Supply, Defence Standards Laboratory,
Report No. 258 (1962).4. Hughes, J. G., and Jones, A. T., A mer. Ind. Hyg. Assoc. J., 1963,24, 164.5. Nelson, J. P., and Milun, A. J., Analyt. Chem., 1957, 29, 1665.6. Kitagawa, T., and Ogawa, T., J. Electrochem. Soc. Japan, 1951, 19, 258.7. German Patent 1,129,731, 1962; Chem. Abstr., 1962, 57, 3142.8. Vasa.k, V., Chemicktf Listy, 1956, 50, 1116.9. Greenfield, S., Analyst, 1960, 85, 486.
10. Greenfield, S., and Smith, R. D., Ibid., 1962, 87, 875.11. --, --, Ibid., 1963,88,886.12. Moneypenny, H. K., J. Scient. Instrum., 1949, 26, 10.13. --, G.K.N. Group Research Report No. 261. Received February 12th, 1965

The Quantitative Determination of Benzoic AcidSoft Drinks by Ion-Exchange Chromatography*
January, 1966] FORD
.In
15
By M. A. FORD(Product Research Department, Beecham Food and Drink Division, Coleford, Gloucestershire)
A quantitative method for the determination of benzoic acid in softdrinks and their associated bases and compounds is described. The methodconsists essentially in the isolation of benzoic acid from the sample by meansof ion-exchange chromatography on De-Acidite FF anion-exchange resin,and the subsequent estimation of the isolated preservative by ultravioletspectrophotometry. The separation of benzoic acid from other constituentsis discussed and a simple three-point correction formula is proposed to correctfor non-specific background absorbance. Recovery of benzoic acid wassatisfactory when the method was applied to a wide range of ready-to-drinkbeverages, concentrated soft drinks, and fruit bases and compounds.
THE analysis of foodstuffs for benzoic acid has been the subject of many papers. The firstauthoritative monograph was published by Monier-Williams in 1927,1 and has long beenaccepted as the standard and recommended method of analysis2 for this preservative.
Succeeding workers have omitted the initial "clean-up" stages recommended by MonierWilliams, and have simply extracted the benzoic acid with immiscible solvents.3,4,5,6 Determination of the isolated acid has been made gravimetrically, after sublimation,I,7 titrimetrically with a standard base4 and colorimetrically.8,9
Ultraviolet spectrophotometry was preferred by some workers,G,6,IO since it was morespecific than simple titrimetric methods. However, this technique is vitiated when saccharinis present and diethyl ether has been used as the extractant.
Recently, newer analytical techniques have been applied to the problem, and papershave appeared in which column chromatography,11 paper chromatography and electrophoresisI2 ,13,14,15 and gas chromatographyl6,17 have been used. Since immiscible solventstend to extract interfering materials and both Monier-Williams's method and the morerecent chromatographic techniques did not lend themselves to the type of rapid routineestimation envisaged, a suitable alternative was sought.
In 1956, Davies and Owenl8 reported the separation of benzoic acid from acetic andphenylacetic acids on a strongly basic anion-exchange resin, and 0·1 N hydrochloric acid inaqueous dioxan as the eluting solution. Preliminary experiments with a similar type ofresin, De-Acidite FF, yielded promising results, and therefore a more detailed investigationwas made with this resin.
EXPERIMENTALCHOICE OF ION-EXCHANGE RESIN-
Two ion-exchange resins were examined during the investigation, namely, De-Acidite FFand Dowex 1 - X1O. The former resin was preferred because of the slow flow-rate throughthe Dowex resin, apparently due to the high proportion of fine particles present, and becauseof an artifact that was eluted from this resin, causing an error in the spectrophotometricdetermination of benzoic acid. As Davies and Owen did not specify the degree of crosslinking in the resin that they used, it was necessary to experiment with the 3 grades thatwere available, viz., 2 to 3 per cent., 3 to 5 per cent. and 7 to 9 per cent. of cross-linking.It was found that none of these variants affected the position at which benzoic acid waseluted, although cross-linking has a more pronounced effect on larger molecules. It was therefore decided to adopt De-Acidite FF resin with 3 to 5 per cent. cross-linking and of 100 to
.200 mesh, the latter being an acceptable compromise yielding maximum flow-rate forminimum tailing of the eluted peaks.
Early experiments were conducted in the conventional manner, in which the resin wasconverted to the free-base form and the column developed with solutions of chloride ionseither as hydrochloric acid or as sodium chloride. It was found that the use of the resinin the free-base form necessitated the use of reagents free from carbon dioxide because of
* Presented at the meeting of the Society on Wednesday, March 31st, 1965.

16 FORD: QUANTITATIVE DETERMINATION OF BENZOIC ACID [Analyst, Vol. 91
its rapid absorption by strongly basic resins to yield the carbonate form of the resin. Inaddition to proving inconvenient, use of solutions of sodium chloride for elution led to theformation of a precipitate of sodium carbonate if the effluent from the column was allowedto stand for a short period.
Strongly basic ion-exchange resins have the following ionic affinities in dilutesolution19 ,20_
Sulphate> citrate> bisulphite > chloride> carbonate> hydroxide.Exchange will only occur if the ion on the resin has a lower affinity for the resin than
the ion in solution. If the resin is used in the free-base form, i.e., the hydroxide form, allanions will be exchanged. If however, the resin is used in the chloride form, then all anionsexcept the carbonate and the hydroxide ions will be exchanged. The use of the resin in thechloride form also obviates the need for reagents free from carbon dioxide and the lengthyregeneration procedure that was previously necessary.
CHOICE OF ELUTING SOLUTION-The preliminary experiments were carried out with Davies and Owen's eluting solution,
i.e., 0·1 N hydrochloric acid - 35 per cent. dioxan. This proved unsatisfactory for two reasonshowever, first dioxan is unsuitable as a spectrophotometric solvent as it absorbs light stronglyat all wavelengths below 260 nm, and secondly, the use of 0·1 N hydrochloric acid causedmarked disturbance of the resin bed owing to the formation of pockets of vapour.
Reduction in the strength of the hydrochloric acid solution and elimination of the dioxanovercame these objections and recoveries of benzoic acid were satisfactory. However, whenelution curves of the major constituents of soft drinks were prepared, it was found that,while most of the compounds were separated from benzoic acid, citric acid and malic acidfailed to separate completely. Although neither of these acids possesses any appreciableabsorption in the ultraviolet region, both are potential sources of error and should be excludedif possible.
Early work had shown that sodium chloride solutions could also be used to developthe column. Satisfactory separation could be achieved with a 0·1 M solution of sodiumchloride, but was accompanied by considerable tailing of the benzoic acid peak and a reductionin the amount of benzoic acid recovered. I t was thought that the low recoveries could beattributed to molecular adsorption effects, since the inclusion of an aromatic substituentin a molecule causes an acid to be retained more strongly than its aliphatic analogue. Daviesand Owen found that the use of mixed solvents considerably reduced this effect, and as ethanolis a more suitable spectrophotometric solvent than most, the effect of adding this solventto the sodium chloride solution was investigated.
In addition to the improvement in the average recovery of benzoic acid, shown in Table I,the tailing of the benzoic acid peak was reduced.
TABLE ITHE EFFECT OF ETHANOL CONCENTRATION ON THE RECOVERY OF BENZOIC ACIDEthanol added, per cent. 0 10 20 40 50 75Benzoic acid recovered, per cent. 91·3 92·8 96·1 95·4 99·0 99·4
It was also found that the position at which benzoic acid emerged was altered, the acidappearing earlier with progressively increasing concentrations of ethanol. This is becausesolubility also has an effect and those acids that are more soluble in alcohol will emergeearlier, while the emergence of those that are more soluble in water will be retarded. It wasfound necessary therefore to adjust the ethanol concentration of the sodium chloride solution,not only to yield satisfactory recoveries of benzoic acid, but also to achieve optimum separationfrom interfering compounds, and while a concentration of 50 per cent. ethanol gave satisfactory recoveries of benzoic acid, a concentration of 75 per cent. ethanol was necessary toeffect complete separation from the other acids.
CHOICE OF CONDITIONS FOR THE COLUMN-If amounts of citric acid of the same order as those found in soft drinks were added to
the ion-exchange column, the breakthrough capacity of the resin was exceeded and citrateions appeared in the early fractions of the effluent. In order to separate the relatively largeamounts of citric acid from benzoic acid, a large column would be necessary with the resultant

January, 1966] IN SOFT DRINKS BY ION-EXCHANGE CHROMATOGRAPHY 17
decrease in flow-rate and increased time of analysis. This could be avoided by the priorremoval of the bulk of the citrate ions, by making use of the fact that the calcium salts ofcitric and malic acids are insoluble in alcoholic solution while that of benzoic acid is soluble.Addition of calcium carbonate to a solution containing both citric acid and benzoic acid,and subsequent addition of ethanol to yield a final ethanolic concentration of 50 per cent.,resulted in the precipitation of approximately 80 to 90 per cent. of the interfering acids, whilean average of only 2·4 per cent. of the benzoic acid was lost. This loss is due to the cumulativeerrors caused by molecular-adsorption effects, sorption on the calcium citrate precipitateand manipulative losses. It is therefore recommended that the calibration graph shouldbe prepared under the same conditions.
By using the calcium precipitation technique, the size of the column could be reduced,and a column formed by transferring 5 g of moist resin to a chromatography column 1 emin internal diameter gave satisfactory results. Under these conditions, with a constant-headreservoir of the type described by the author,21 a flow-rate of 1 inl per minute was readilyattainable.
The exchange capacity of De-Acidite FF is largely independent of pH, and although thepH of the sample is raised from about 3 to between 7 and 8 by the calcium precipitationtechnique, this has no effect on the exchange capacity of the resin.
SPECTROPHOTOMETRY--
The benzoic acid is eluted from the column in the form of its sodium salt, and it wasdecided to acidify the solutions of sodium benzoate in order to utilise the bathochromicdisplacement of the position of the peak into the region in which the background absorbanceis linear. The difference in the positions of Amax. of sodium benzoate solutions in neutraland in acid solutions is shown in Fig.I. The use of acid concentrations from 0·2 N to 2 Nfor spectrophotometry had little effect on the spectrum of benzoic acid, but an increasein the hydrochloric acid concentration to 5 N caused a further shift in the position of Amax. witha concomitant decrease in intensity. A final concentration of 1 N was therefore used inthe method.
0'6 ,---------------------------------------------------,
0'5
0'4..uc..
.<:l
~0'3.<:l«
0'2
0')
oL-L------L----l_---l.----==~=§~~~200 220 240 260 280 300
Wavelength. nm
Fig. 1. Ultraviolet spectra of solutions of sodium benzoate in neutral andacid media: curve A, acidified to N with hydrochloric acid; curve B, acidified to5N with hydrochloric acid; curve C, neutral solution
The presence of variable background absorbance gave insufficiently precise results.Since the irrelevant absorbance was found to be linear over that portion of the spectrumin which the benzoic acid peak occurred, it was found possible to use a correction of thetype proposed by Morton and Stubbs,22 and expanded by Allen.23
The general equation is--
E::·. = {Em• x • -[K(E1 - E 2) + E 2J (1)
K = ;\2 - .\na..A2 - Al

18 FORD: QUANTITATIVE DETERMINATION OF BENZOIC ACID [Analyst, Vol. 91
For the proposed method the wavelengths of 220 and 245 nm were chosen, togetherwith Amax. of 230 nm, since this is the range over which the background absorbance isvirtually linear.
Therefore-K=245-230=0.6
245 - 220and substituting this value in equation (I) and re-arranging, it becomes
E;';' = E 230 - (0·6 E 220 + 0·4 E:m) (2)where E 211O, Ezso and EMIi represent the observed absorbances at these wavelengths.
Because of the necessity for the background absorbance to be linear, it is recommendedthat the "blank" spectrum should be determined initially, wherever practicable, although theirrelevant absorbance of a wide range of fruit products is in fact linear over this narrow range.
During a study of product blanks it was found that certain of them exhibited selectiveabsorbance at 245 nm, found to be due to ascorbic acid, part of which is eluted in the samefraction as benzoic acid. When the ion-exchange resin had been used in the free-base form,the ascorbic acid was broken down on the column and could not be detected in the effiuent.However, with the use of the resin in the chloride form, this no longer occurred and, sinceascorbic acid has a high molecular extinction coefficient (log E = 4,03), its potential interference was great. Although the correction formula given above would eliminate most ofthe interference from the ascorbic acid, it would be more satisfactory if this interferencecould be eliminated entirely. If ascorbic acid is oxidised to dehydroascorbic acid, the absorbance at 245 nm disappears. This oxidation is readily accomplished by the addition of asmall amount of copper ions to the solution, to catalyse the aerial oxidation of ascorbic acid.With this technique, the interference from this source was completely eliminated and therecovery of benzoic acid from products containing ascorbic acid improved.
METHODApPARATUS-
Chromatography columns-An-glass chromatography columns, 1 cm in internal diameter,30 cm in length, provided with a sintered-glass disc and a stopcock at the lower end, anda B14 standard ground-glass joint at the upper end.
Constant-head reservoir-Details of the construction and use have been described byFord.21 The reservoir should have a capacity of about 250 ml and be provided with a B14standard ground-glass joint.
Sintered-glass discs-l cm in diameter, porosity O.For a diagram of the complete apparatus, see Fig. 2.Spectrophotometer-A Unicam SP500 spectrophotometer was used throughout this
investigation.
REAGENTS-Analytical-grade reagents should be used wherever practicable.Ion-exchange resins-Permutit De-Acidite FF ion-exchange resin"', chromatographic grade,
chloride form, 100 to 200 mesh, 3 to 5 per cent. average cross-linking. Prepare the resinby transferring it to a large sintered-glass funnel and washing it with distilled water untilany foreign matter, which may be present, is removed. Remove the bulk of the water bysuction and store the resin in a moist state.
Calcium carbonate.Ethanol, absolute, B.P. quality.Ethanol, 75 per cent. vIv.Eluting solution-Dissolve 5·85 g of sodium chloride in 250 ml of water, and when
dissolved dilute to I litre with absolute alcohol and mix.Hydrochloric acid, 5 N.
Cupric sulphate, 0·2 per cent. wIv.Standard benzoic acid solution-Dissolve 100 mg of benzoic acid in water and dilute
the solution to 100 ml with water.
* The Permutit Company Ltd. now produce De-acidite FF resin in an isoporous form in addition to thepreviously available macroporous type that was used for the investigation. The isoporous form of theresin is now denoted by the letters 'I.P: after the code number, and it is necessary to specify De-aciditeFF anion exchange resin 'old type' when ordering this material for use with this method.

January, 1966] IN SOFT DRINKS BY ION-EXCHANGE CHROMATOGRAPHY 19
Chromatograph)'column tem Ld.
Constant ~eadreservoir
lon·exc,hangeresin
Sintered,glassdiscs
Fig. 2. Chromatographic apparatus
PREPARATION OF ION-EXCHANGE COLUMN-
Transfer 5 g of the moist resin to the chromatography column, and allow to settle.Then back-flush the resin bed with distilled water, stirring the resin with a glass rod to disperseany air bubbles that may be present. Again allow the resin bed to settle and pass 50 mlof distilled water through the resin. When the level of the water has almost reached theresin, place a sintered-glass disc on the top of the resin bed.to prevent disturbance of thecolumn during additions. Finally allow the level of the water to drain to the top of the resinbed, and the column is then ready for use. The resin must be kept moist at all times, anda fresh column of resin must be used for each test.
PREPARATION OF CALIBRATION GRAPH
Transfer 0,5, 1,0, 2,0, 3,0, 4·0 and 5'0-ml aliquots of the standard benzoic acid solution(1,0 mg per ml), to 15-ml graduated centrifuge tubes containing 0·2 g calcium carbonate.Add water as necessary to adjust the volume of each to 5 ml, mix, then dilute to 9·6 to 9·8 mlwith ethanol and again mix thoroughly with a small stirring rod. Wash the stirring rodand the sides of the tube with a small amount of 75 per cent. ethanol and adjust the finalvolume to about 10 ml. Spin the sample in a centrifuge at 3000 r.p.m. for 2 to 3 minutes.
Place a 25-ml measuring cylinder under the column and transfer the supernatant liquidfrom the centrifuge tube to the ion-exchange column prepared as detailed above, by meansof a dropping pipette. Wash the precipitate successively with two 4-ml portions of 75 percent. ethanol. Wash the stirring rod and sides of the tube with the diluted ethanol as before;ensure that the final volume is about 5 ml on each occasion. Transfer the supernatantliquid from each washing, obtained by centrifuging the suspensions, to the column. Whenthe final wash solution has drained to the level of the resin, elute the benzoic acid by adding75 ml of the eluting solution to the column, using the constant-head reservoir, and at aflow-rate of about 1 ml per minute. Continue until 25 ml of the effluent are collected, thenreplace the cylinder with a 5O-ml graduated flask containing 15 ml of eluting solution, andcontinue collecting until the graduation is reached; in this way the succeeding 35 ml ofeffluent are collected, and retained for analysis.
Mix this portion of the eluate; transfer a 5-ml aliquot to a 5O-ml graduated flask, andadd 10 ml of 5 N hydrochloric acid and 1 ml of 0·2 per cent. cupric sulphate solution. Mix,and allow it to stand for 10 minutes, then dilute to 50 ml with water; simultaneously, preparea blank by mixing 5 ml of eluting solution, 10 ml of 5 N hydrochloric acid, 1 ml of 0·2 per centcupric sulphate solution and dilute the whole to 50 ml with water. Measure the absorbance

20 FORD: QUANTITATIVE DETERMINATION OF BENZOIC ACID [Analyst, Vol. 91
of the solutions at 220, 230 and 245 nm, in l-cm fused-silica cells and with the blank as areference solution. Substitute the observed absorbances in equation (2), i.e.,
E:: = E 230 - (0,6 E 220 + 0·4 E 2(5)
From the corrected readings construct a calibration graph relating corrected absorbanceat 230 nm to concentration of benzoic acid in fLg per 50 ml of solution. Calibration graphsprepared as described above have been found to be remarkably constant and only needchecking at infrequent intervals.
PROCEDURE-
For soft drinks containing 100 to 800 p.p.m. of benzoic acid, transfer a 5-g aliquot ofa well mixed sample to a 15-ml graduated centrifuge tube containing 0·2 g calcium carbonateand continue as described above, under "Preparation of Calibration Graph."
For bases and compounds containing 800 to 2000 p.p.m. of benzoic acid, dilute 20 gto 40 g of a well mixed sample to 100 g with water, and mix thoroughly. Then transfer a5-g aliquot of the diluted base or compound to a 15-ml graduated centrifuge tube containing0·2 g of calcium carbonate and continue as described above, under "Preparation of Calibration Graph."
Similarly, correct the absorbance of the sample solutions as described above by usingequation (2), and by reference to the calibration graph, determine the concentration ofbenzoic acid in the measured solution. Designate this concentration A p,g per 50 ml ofsolution.
CALCULATION-
For soft drinks containing 100 to 800 p.p.m. of benzoic acid,Benzoic acid content of sample in parts per million
A X Volume of eluate X 106
= Aliquot of eluate X Weight of sample X 106
A X 50 X 106
5 X Weight of sample X 106
10 AWeight of sample
For bases and compounds containing 800 to 2000 p.p.m. of benzoic acid,Benzoic acid content of sample in parts per million
A X Volume of eluate X Weight of diluted base X 106
= Aliquot of eluate X Weight of aliquot of diluted base X Weight of base X 106
A X 50 X Weight of diluted base X 106
= 5 X Weight of aliquot of diluted base X Weight of base X 106
10 A X Weight of diluted baseWeight of aliquot of diluted base X Weight of base
RESULTS AND DISCUSSION
In order to test the accuracy and precision of the proposed method, recovery experimentswere carried out on 12 differing types of fruit juice products and the results of those analysesare summarised in Table II.
For the method to be viable it is necessary for most of the principal constituents of fruitjuice products to be separated from the benzoic acid, because the background absorbancemust be linear. A study of the ultraviolet absorption spectra of citric acid, malic acid,lactic acid, ascorbic acid, saccharin, cyclohexylsulphamic acid (cyclamate), sugars, quinine,naringin, artificial and natural colours and inorganic ions, revealed that all except cyclohexylsulphamic acid, the sugars and inorganic ions possessed appreciable absorbance in theregion under examination. Reference to Table III shows that the substances that wouldcause the most serious interference are ascorbic acid, saccharin, quinine and naringin, whilecitric acid, malic acid and, to a lesser extent, lactic acid would cause slight disproportionateerrors at 220 and 230 nm.

January, 1966J IN SOFT DRINKS BY ION-EXCHANGE CHROMATOGRAPHY 21
TABLE IITHE RECOVERY OF BENZOIC ACID ADDED TO SOFT DRINKS, FRUIT BASES AND COMPOUNDS
Benzoic Benzoicacid acid Number Average Standard
added, recovered, of deter- recovery, deviation,Product p.p.m. p.p.m. minations per cent. p.p.m.
Orange base 1796 1779-1807 12 99·7 9·7Orange drink 558 548-562 12 99·6 4·0Orange drink 154 141-160 6 100 4·0Carbonated orange drink 100 90-96 12 93 1·8Lemon base 1799 1768-1817 6 99·6 19·8Lemon drink 441 428-432 6 97·6 2·1Bitter lemon drink 425 405-414 6 96·3 3·5Lemon barley drink 423 405-413 6 96·9 3'()Carbonated bitter lemon drink 100 90-94 6 92 2·()Glucose drink 216 210-214 6 98·5 1·5Apple compound .. 601 593-600 6 99·1 2·5Blackcurrant juice drink .. 160 150-152 6 94·3 0·8
TABLE IIIMOLECULAR EXTINCTION COEFFICIENTS OF THE PRINCIPAL CONSTITUENTS OF SOFT DRINKS
SubstanceBenzoic acidCitric acidMalic acidLactic acid ..Ascorbic acidSaccharinQuinine
Naringin
,Molecular extinction
coefficientII350
20016070
106402967031540299202682016350
Wavelength,nm230209209209245205208250212286
The elution diagrams of these principal constituents were determined and are as shownin Fig. 3. Most of the compounds were separated satisfactorily with the exception of lacticacid and naringin, while malic acid and ascorbic acid were incompletely separated.
200'
100
(e)
(h)
O'
100
(d\
(g) 1·0
(b)
0'-------"'------'--=-=200 OI'------'----===----:2..:!OO
ULJI'O
j >0 I') J
~ \~ 0 I00 ()L--'----'----;I~O·O...0.
~ 1-0,----------;-;(("")5·0
eo°E...c...uc
8Volume of eluate, ml
Fig. 3. Elution curves of the principal constituents of soft drinks: (a) benzoic acid; (b) lactic acid;(c) ascorbic acid; (d) quinine; (e) naringin; (f) citric acid; (g) malic acid; (h) saccharin
The interference from ascorbic acid is overcome by oxidising this compound to dehydroascorbic acid, and since both malic acid and lactic acid have low molecular extinction coefficients, concentrations of these two acids several times higher than those encountered inpractice can be tolerated without causing interference. Similarly, in the case of naringin,

22 FORD [Analyst, Vol. 91
those concentrations which are normally present in grapefruit drinks do not cause any errorin the spectrophotometric estimation of benzoic acid, although it is possible that samplescontaining an inordinately high concentration of this flavonoid may be subject to erratic results.
CONCLUSIONS
It has been shown that the use of ion-exchange chromatography with mixed solvents,together with the use of ultraviolet spectrophotometry provides a rapid and precise methodof analysis for benzoic acid, the time required being approximately 2 to 21 hours. Theaccuracy and precision that is obtainable is considered satisfactory for the routine type ofanalysis required, and the basic method can be used for the estimation of benzoic acid insoft drinks and their associated products in the range of 100 to 2000 p.p.m.
I thank the Directors of Beecham Food and Drink Division for permission to publishthis paper, and also my colleagues, Mr. A. G. Wells for his advice and encouragement, andMr. D. C. Cook for his valuable technical assistance.
REFERENCES
1. Monier-Williams, G. W., "The Determination of Benzoic Acid in Foodstuffs," H.M. StationeryOffice, London, 1927.
2. Jolly, S., Editor, "Official, Standardised and Recommended Methods of Analysis," The AnalyticalMethods Committee of the Society for Analytical Chemistry, London, 1963.
3. Horwicz, W., Editor, "Official Methods of Analysis of the Association of Official AgriculturalChemists," Ninth Edition, The Association of Official Agricultural Chemists, Washington,D.C., 1960, p. 384.
4. Hadorn, H., Mitt. Lebensml Hyg., Bern., 1951, 42, 226; Chem. Abstr., 1951, 45, 9195a.5. Englis, D. T., Burnett, B. B., Schreiber, R. A., and Miles, J. W., J. Agric. Fd Chem., 1955,3,964.6. Stanley, R. L., ]. Ass. Off. Agric. Chem., 1960, 43, 587.7. Rathenasinkam, E., Analyst, 1962, 87, 298.8. Davey, W., and Gwilt, J. R., J. Appl. Chem., 1954,4, 413.9. Spanyar, P., Kevei, E., and Kiszel, M., Z. LebensmittUntersuch., 1958, 107, 118; J. Sci. Fd
Agric., 1958, 9, ii-202.10. Jaulmes, P., Mestres, R., and Mandrou, B., Ann. FalsiJ., 1961,54, 84; Anal. Abstr., 1961,8,3942.11. Van Dame, H. C., ]. Ass. Off. Agric. Chem., 1960, 43, 593.12. Komoda, T., and Takeshita, R., Shokuhin Eiseigaku Zasshi, 1961, 2, 72; Chem. Abstr., 1962,57,
6369g.13. --, --, Ibid., 1962, 3, 374; Chem. Abstr., 1964, 60, 6130d.14. Goddijn, J. P., Z. LebensmittUntersuch., 1961, 115, 534; Anal. Abstr., 1962, 9, 3446.15. Fellegiova, M., Ibid., 1963, 120, 17; ]. Brit. Fd Mig Inds. Res. Ass. Abstr., 1963, 16, 1087.16. Kovacs, A. S., Denke, P., Wolf, H. 0., Ind. Obst-Gemueseverwert, 1962, 47, 547; Chem. Abstr.,
1963, 59, 3256c.17. Goddijn, J. P., van Praag, M., and Hardorn, H. J., Z. LebensmittUntersuch., 1963,123, 300;
J. Brit. Fd Mig Inds. Res. Ass. Abstr., 1964, 17, 553.18. Davies, C. W., and Owen, D. R., J. Chem. Soc., 1956, 1681.19. Samuelson, 0., "Ion Exchangers in Analytical Chemistry," John Wiley and Sons Inc., New York,
1953.20. "Properties of, and Instructions for using Zeo-Karb 225 and De-Acidite FF," The Permutit Co.
Ltd., London, 1961.21. Ford, M. A., Lab. Practice, 1963, 12, 1093.22. Morton, R. A., and Stubbs, A. L., Analyst, 1946,71, 348.23. Allen, W. M., ]. Clin. Endocrinol., 1950, 10, 71.
Received June 30th, 1965

January, 1966J KIRKBRIGHT, WEST AND WOODWARD 23
Spectrofluorimetric Determination of MicrogramAmounts of Scandium
Part II. Separation by Solvent Extraction
By G. F. KIRKBRIGHT, T. S. WEST AND C. WOODWARD(Chemistry Department, Imperial College, London, S.W. 7)
The spectrofluorimetric method previously described for determiningscandium and based on the use of salicylaldehyde semicarbazone as reagenthas been modified by incorporation of a solvent extraction separation procedure to permit the determination of scandium in the presence of the fewother ions that also produce fluorescent species, i.e., aluminium, yttrium,etc. Chromium(m), titanium(Iv) and zirconium produce low results, whiletellurium(IV) and tin (IV) completely suppress the fluorescence of the scandium complex.
IN a previous communication to this Society! we have described the spectrofluorimetricdetermination of microgram amounts of scandium by the use of salicylaldehyde semicarbazone.This reagent forms a blue fluorescent complex with scandium (excitation maximum, 370 mf';fluorescence maximum 455 mf'); the reagent shows a less intense blue-green fluorescence(325 mf'; 470 mf'). At pH 6·0 this reagent may be applied to the determination of scandiumin test solutions down to 0·002 p.p.m. (0,2 f'g). Maximum complex fluorescence is developedwithin a few minutes, and is then constant for more than 24 hours. Continuous variations,mole-ratio and slope-ratio studies indicate the formation of a 1 to 1 metal-to-reagent complexwith a conditional stability constant of 105•
Although the sensitivity of this method cannot be compared directly with that of othermethods unless similar instrumentation is used, the determination of scandium with thisreagent appears to be as sensitive as with morin,2 the most widely used fluorimetric reagentfor scandium, and considerably more sensitive than any available absorptiometricmethods.3 ,4,5
The method, as described previously, was subject to several interferences that could notbe eliminated by the use of common masking agents. It was, therefore, necessary to devisea procedure for separating scandium from the more important of these interfering ions andfor getting it into a state suitable for determination by the proposed method. Separationprocedures involving co-precipitation of scandium hydroxide on cadmium hydroxide orextraction of the thiocyanate into ether were investigated, but were found to be unsatisfactory.The double-extraction procedure finally adopted is based on the work of Eberle and Lerner3and can be used for microgram amounts with a recovery of about 90 per cent. in the range4·5 to 22·5 f'g of scandium. Removal of iron(m), vanadium(v), etc., by extraction of theircupferrates from 10 per cent. hydrochloric acid into chloroform is followed by extractionof scandium from concentrated hydrochloric acid into tri-n-butyl orthophosphate and backextraction into water. This procedure provides an efficient separation of scandium fromaluminium and yttrium which, like scandium, form blue fluorescent complexes with salicylaldehyde semicarbazone.
METHODApPARATUS-
Fluorescence measurements were made with a Farrand spectrofluorimeter, provided witha 150-W Xenon lamp, in which grating monochromators were used to isolate both the excitingand fluorescent radiation. Slits of 20-mf' and lO-mf' bandwidth were used in the excitationand analysing monochromators, respectively, and fused-quartz cells (10 X 20 X 50 mm)were used throughout. A 7-54 filter (transmittance greater than 75 per cent. over the range275 to 375 mf') was used for the excitation radiation. The adsorption of scandium on thecalibrated flasks used in these experiments was inhibited by treatment with Repelcote asdescribed previously.!

24 KIRKBRIGHT, WEST AND WOODWARD: SPECTROFLUORIMETRIC [Analyst, Vol. 91
REAGENTS-Standard scandium solution-Boil 0·0690 g of scandium oxide, SczOs, (high purity grade,
Johnson, Matthey and Co. Ltd.) with 30 ml of concentrated hydrochloric acid, analyticalreagent grade, until fully dissolved. Cool and dilute to 1 litre with distilled water. Thisstock solution is 10-3 M in scandium and may be diluted to 10-4 M when required.
1 ml 10-4 M solution == 4·50 pog of scandium.Solutions may be standardised by EDTA titration at pH 3 to 5 with xylenol orange
as indicator.6 Solutions of scandium more dilute than 10-4 M should not be stored becauseof losses due to adsorption on the glass-ware.
Reagent solution-To prepare a 10-3 M solution, dissolve 0·1788 g of salicylaldehydesemicarbazone (prepared by condensation of salicylaldehyde with semicarbazide hydrochloridel ) in 1 litre of analytical-reagent grade ethanol.
Buffer solution, pH 6·Q-Dissolve 100 g of hexamine (general-purpose reagent grade) in800 ml of water and add hydrochloric acid until the pH reaches 6·0. Dilute to 1 litre withwater.
Diverse ions-lO-z M solutions of analytical-reagent grade salts.Cupferron (analytical-reagent gradel-Freshly prepared 1 per cent. WIv aqueous solution.Hydrochloric acid (analytical-reagent grade), sp.gr. 1·18.Chloroform (analytical-reagent grade).Tri-n-butyl orthophosphate (general-purpose reagent grade).Ammonia solution (analytical-reagent grade), sp.gr. 0·88.
PROCEDURE-To an aliquot of solution containing 4·5 to 22·5 p.g of scandium in a 250-ml separating
funnel, add 2·5 ml of concentrated hydrochloric acid and 5 ml of 1 per cent. aqueous cupferronsolution. Dilute to 25 m1 with water, extract twice by shaking the funnel for 1 minute with25 m1 of chloroform and discard the organic extracts. Transfer the aqueous phase to a loo-mlbeaker, rinse the funnel with distilled water, add the washings to the beaker and then evaporateto a volume of approximately 5 ml. Cool the solution and transfer it to a 250-ml separatingfunnel containing 25 ml of tri-n-butyl orthophosphate. Rinse the beaker with 25 ml ofconcentrated hydrochloric acid and put this into the separating funnel. Shake the funnelfor 1 minute, allow the phases to separate and discard the aqueous layer. Wash the organicphase twice with 25 ml of concentrated hydrochloric acid and discard the washings. Backextract the scandium into 25 ml of water containing 1 ml of ammonia solution (see Note 1).Separate the phases and shake the aqueous phase twice with 25 ml of chloroform to removeany tri-n-butyl orthophosphate that remains; discard the chloroform extracts. Transferthe aqueous layer to a loo-ml beaker, add the washings from the funnel and 10 ml of ammonia,cover the beaker with a watch-glass and evaporate the contents to approximately 20 ml.Cool, re-dissolve the crystalline ammonium chloride in water and transfer it to a loo-mlcalibrated flask containing 2 ml of 10 per cent. hexamine buffer (see Note 2). Add 25 mlof 10-3 M reagent solution, dilute to 100 ml with water, and measure the fluorescence intensityafter 30 minutes at 455 mpo, with an excitation wavelength of 370 mpo.
The graph of fluorescence intensity against the amount of scandium is linear from4·5 to 22·5 pog of scandium and passes slightly above the origin (see Fig. 1). Prepare andmeasure two standards with each group of samples, by taking 0 and 22·5 p.g (5 ml of 10-4 Msolution) of scandium through the procedure described above.
The complete separation and determination of a set of 8 samples takes 6 to 7 hours.
NOTE 1. The aqueous extract should still be acid to litmus at this stage.NOTE 2. pH adjustment is extremely critical in this method. This combination of ammonium
chloride and hexamine consistently produces pH 6·00 ± 0·02. The pH tolerance as establishedpreviously' is ±0·05 units.
DISCUSSIONThe more important interfering cations found previouslyl were taken, normally in
lOO-fold molar excess over 22·5 pog of scandium, through the recommended extraction procedure. Results are shown in Table I. This investigation showed that the following ionsdo not interfere appreciably under the conditions described previously: AI, Bi, Ce(Iv), Cu(n),Fe(m), Ga, U(VI), V(v) and Y. The only ions investigated that still interfere are Cr(III),

January, 1966J DETERMINATION OF MICROGRAM AMOUNTS OF SCANDIUM 25
Sn(Iv), Te(Iv), Ti(Iv) and Zr. It has already been shownl that Ba, Be, Ca, Cd, Ce(nr), Hg(n),K, Li, Mg, Mn(n), Na, NH 4, Pb, Pt(IV), Sr and TI(I) do not interfere, and the interference ofAg, Cu(n) and Ni can be eliminated by masking with cyanide, and that of Zn by masking witho-phenanthroline.
.~80
C~ •c'(1)
uc
~ 40~0:J
u:::
OL------'---~-----'---~-------'
Scandium, )Jg
Fig. 1. Calibration graph of fluorescenceintensity (scale reading) against weight of scandium,after extraction procedure
TABLE IDETERMINATION OF 22·5 fLg OF SCANDIUM AFTER SEPARATION FROM
VARIOUS IONS
Foreign ions present,p.g
Iron(m) (2,790)Iron(m) (2,790) + Ce(Iv) (7,000)Yttrium (890) ..Yttrium (890) ..Aluminium (270)Aluminium (270)Bismuth (10,400)Copper(n) (3,170)Uranium(vI) (11,900)Vanadium(v) (2,550)Gallium (3,500)Chromium(m) (2,600)Titanium (IV) (2,400) ..Zirconium (4,500)Tellurium (IV) (6,400) ..Tin(Iv) (5,900) ..
Scandium found,p.g
21·423·123·122·821·422·721·722·121·721·822·218·219·112·6oo
Error,per cent.
-4,8+2·7+2·7+1·3-5·0+1-1-3·5-1,8-3,5-3·0-0·7-19-15-44-100-100
PRECISION-The standard deviation of the combined separation and determination procedures was
determined by taking 8 solutions, each containing 22·5 fLg of scandium without any foreignions, through the proposed method. It was found to be equivalent to ±6·2 per cent. ofthe response due to the scandium complex. The standard deviation calculated from thefirst 11 results in Table I is ±3·1 per cent. However, all of these determinations were carriedout in duplicate and compared with standards prepared simultaneously, and sometimes anobviously discrepant result was rejected.
MAGNITUDE AND ORIGIN OF BLANK FLUORESCENCE-It can be seen from Fig. 1 that the fluorescence of the blank is approximately equivalent
to that of 4 fLg of scandium. This blank result is caused by pick-Up of an unidentified substance during the extraction procedure, leading to the production of a purple fluorescenceon addition of the reagent (excitation maximum, 350 mfL; fluorescence maximum, 440 mfL),which is unlike that produced by any metal ion investigated. The magnitude of this blank

26 KIRKBRIGHT, WEST AND WOODWARD [Analyst, Vol. 91
fluorescence governs the range of concentrations over which scandium can be determinedwith a satisfactory signal-to-blank fluorescence ratio. Below 4·5 fLg of scandium the relativeintensity of this blank vitiates results. The most likely source of this impurity is the trin-butyl orthophosphate, which cannot be obtained in analytical-reagent grade purity, and isnot readily purified by redistillation. The final aqueous solution was also found to containa small amount of phosphate ion, probably from hydrolysis of the solvent during the extractionprocedure, but the amount was not enough to produce significant interference in the determination of scandium.
We are grateful to the Science Research Council for the provision of a research studentship for one of us (C.W.) and also for the award of a special research grant (to T.S.W.)for the purchase of the spectrofluorimeter.
REFERENCES
1. Kirkbright, G. F., West, T. S., and Woodward, C., "Proceedings of the SAC Conference, Nottingham," W. Hefler & Sons Ltd., Cambridge, 1965, p. 474.
2. Sandell, E. B., "Colorimetric Determination of Traces of Metals," Third Edition, IntersciencePublishers Inc., New York, 1959, p. 800.
3. Eberle, A. R., and Lerner, M. W., Analyt. Chem., 1955, 27, 1551.4. Umland, F., and Puchelt, H., Analytica Chim. Acta, 1957, 16, 334.5. Macdonald, J. C., and Yoe, J. H., Ibid., 1963, 28, 264.6. Korbl, J., and Pfibil, R., Chemist-Analyst, 1956, 45, 102.
Received June 14th, 1965

January, 1966] STOCK 27
The Amperometric Titration of SubmillinormalConcentrations of Copper(U) with Mercury(I)
PerchlorateBy JOHN T. STOCK
(Department of Chemistry, The University of Connecticut, Storrs, Connecticut, U.S.A.)
Although quite precise under rigidly controlled conditions, the mercurY(I)amperometric titration, at a rotating platinum electrode, of submillinormalconcentrations of copper(n) in potassium thiocyanate - perchloric acid mediumgives results that vary with the concentrations of thiocyanate and of copper(n).When this variation is eliminated by the addition of potassium iodide, thetitration of 10-6 N to 10-4 N copper(n) is precise and accurate to within± 1·5 per cent. The titration of 10-6 N copper(n) is precise to about 5 per cent.
CENTIGRAM amounts of copper(n) have been determined by titration in acidified thiocyanatemedium with mercury(I) nitrate to a visual1 ,2,3,4 or a potentiometric1 ,2,4 end-point. Iron(m)at a concentration as low as 10-5N can be determined by mercury(I) amperometric titrationat a rotating platinum electrode.5 The present work concerns the titration by this amperometric method of submillinormal concentrations of copper(n).
EXPERIMENTALVOLTAMMETRY-
A deoxygenated 0·3 N potassium thiocyanate - 0·02 N perchloric acid medium that hadbeen freshly made by mixing solutions of these reagents gave a residual current of less than0·1 /LA at a new rotating electrode held at a potential of zero (unless otherwise stated, allpotentials are with respect to the saturated calomel electrode, S.C.E.). The introduction ofpotassium iodide up to a concentration of approximately 0·06 N had no significant effecton this current. Both in the presence and absence of potassium iodide, the limiting currentof copper(n), measured at zero potential, was found to be proportional to the concentrationof this ion.
The small anodic current given by mercurY(I) in acid thiocyanate medium5 was alsoobtained in the presence of potassium iodide. Fig. 1 shows current - voltage curves obtainedat various stages in the amperometric titration of 5·8 X 10-5 N copper(n) in acid thiocyanateiodide medium with mercurY(I) perchlorate solution. The anodic current due to an excessof titrant often increased markedly with time. However, when observations were completedwithin a few minutes, the anodic current was usually almost unaffected by increasing themercury(I) concentration.
AMPEROMETRIC TITRATIONS-All titrations were carried out at zero potential. Initially, the platinum electrode was
stored overnight in concentrated nitric acid and then pre-conditioned by immersing in deoxygenated 0·1 N perchloric acid and short-circuiting to a saturated calomel electrode.6
After some weeks, a low residual current became difficult to attain. When the daily treatmentof a new electrode with nitric acid was reduced to a brief immersion, the residual currentremained low and was essentially unchanged after 4 months.
Preliminary titrations of 10-5 to 10-4N copper(n) in acid thiocyanate medium by thepre-addition technique, similar to that used in the titration of iron(m),5 gave results thatwere precise to within about 3 per cent. However, the stoicheiometry of the titration reactionappeared to change when the concentration of either copper(n) or thiocyanate was altered.Such a change was not observed when potassium iodide, up to a concentration of about0·05 N, was introduced into the titration medium.
METHODREAGENTS-
Use analytical-grade reagents and distilled or demineralised water throughout.MercurY(I) perchlorate, approximately 0·01 N in N perchloric acid-Prepare this as des
cribed by Berka, Vulterin and Zyka,4 but dilute 1O-fold with N perchloric acid. Store over

28 STOCK: AMPEROMETRIC TITRATION OF SUBMILLINORMAL [Analyst, Vol. 91
metallic mercury. Standardise by titration with copper(ll) sulphate solution as describedin the Procedure.
Copper(ll) sulphate, O·OlOOO N (=0·01000 M) in 0-1 N sulphuric acid. Prepare this fromthe metal by dissolution in the minimum amount of nitric acid, elimination of nitrogen oxides,and suitable dilution with appro~tely 0·1 N sulphuric acid.
Perchloric acid, approximately-1Ft! N (Procedure A) or N (Procedure B).Potassium thiocyanate, approximately 0·6 N (Procedure A) or saturated (Procedure B).Potassium iodide, approximately N in boiled-out water.
ApPARATUS-
Except for an agar - potassium nitrate salt bridge, use conventional apparatus foramperometric titration at a rotating platinum electrode.5 ,7 At the end of each day, rinsethe platinum electrode with water, rotate it in concentrated nitric acid for approximately1 minute, rinse it again, then remove most of the water with a filter-paper strip and leaveto dry. At the beginning of the day, pre-condition the electrode by running a preliminarytitration of copper(lI) until the titrant is present in slight excess.
In the present work, the platinum electrode was rotated at 500 r.p.m. It then had asensitivity of 146 p,A per millimole of silver(l) per litre, measured at zero potential in deoxygenated 0·1 N perchloric acid at 23° C. Titrations were carried out at room temperature(in the range 23° to 25° C). Electrical measurements were made with a Cambridge Voltamoscope. Since all titrations are carried out at zero potential, this instrument can be replacedby a Cambridge Spot galvanometer or similar instrument.
Fig. 1. Current - voltage curves at stages in thetitration of 58 p.N copper(n) in 0·3 N potassium thiocyanate - 0·02 N perchloric acid - 0·02 N potassium iodide.Percentage equivalent of mercury(I) perchlorate added:curve A, 0; curve B, 50; curve C. approximately 100;curve D. 150
PROCEDURE-
(A) Transfer 25 ml each of 0·04 N perchloric acid and 0·6 N potassium thiocyanate tothe titration cell, then add 1 ml of N potassium iodide. Insert the platinum electrode andsalt bridge, set the applied e.m.f. at zero, deoxygenate with a stream of nitrogen, then stopthe gas stream. Inject O·OlOOO N copper(lI) sulphate so that the amount of copper(lI) introduced is about 20 per cent. of that contained in the sample solution. After 2 minutes,note the current reading, P, then inject the sample solution. Read the current after a

January, 1966J CONCENTRATIONS OF COPPER(n) WITH MERCURY(I) PERCHLORATE 29
further 2 minutes, then titrate with 0·01 N mercurY(I) perchlorate until the current hasfallen nearly to zero. Allow an interval of 1 minute between a titrant addition and thereading of the current. Find the end-point graphically as the intersection of the linearportion of the titration curve and the line: current = P.
(B) Transfer the sample. solution to the titration cell and make it approximately 0-3 Nin potassium thiocyanate and 0·02 N in perchloric acid by adding saturated and N reagentsolutions respectively. Insert the platinum electrode and salt bridge, but do not close thecircuit until the solution has been deoxygenated. Then stop the gas stream and at oncemake the solution 0-02 N in potassium iodide by adding to it a N solution of this reagent.Read the current after 2 minutes, then titrate as in (A). Determine the residual current,R, in a deoxygenated 0·3 N potassium thiocyanate - 0·02 N perchloric acid - 0·02 N potassiumiodide medium freshly made from the concentrated solutions. Find the end-point graphicallyas the intersection of the linear portion of the titration curve and the line: current = R.
RESULTSA systematic examination of the titration of 10-5 N copper(n) ion in a given iodide-free
potassium thiocyanate - perchloric acid medium showed that Procedure A gave results thatwere precise to within ±2 per cent. Results obtained by a conventional method involvingextrapolation of the arms of an L-shaped titration curves were less precise than, and significantly different from, those given by Procedure A. Since current readings in the postequivalence region were time-dependent, all observations within this region were completedwithin a total time of about 4 minutes. Under conditions of small and essentially constantresidual current, end-point determination, by producing the linear portion of the titrationcurve to cut the residual-current line,9 gave results similar to, but slightly less precise than,those of Procedure A. Typical sets of 6 results, here expressed as the average apparentnormality and standard deviation of the mercurY(I) titrant solution, obtained at thiocyanateand perchloric acid concentrations of 0·3 and 0·02 N, respectively, were 0·0129 ± 0·00014by Procedure A, 0·0127 ± 0·00019 by the L-curve method, and 0·0128 ± 0-00016 by theresidual-current method. At this concentration of thiocyanate, titrations at various aciditiesup to 0·08 N gave similar results.
Although the results were insensitive to changes in acidity, they were markedly dependentupon the concentration of thiocyanate_ This is illustrated by the average results of the titration of 5 X 10⁻⁵ N copper(n) that are listed in Table 1. Titrations at high thiocyanate concentration were run at low acidity to avoid rapid decomposition of the medium. As deter-
TABLE IEFFECT OF THIOCYANATE CONCENTRATION IN THE TITRATION OF
5 X 10⁻⁵ N COPPER(n)
Apparent mercury(I) normalityThiocyanate Perchloric acid ,- A ,
concentration, concentration, Number L-curve Residual-currentN N of runs method A method method
0·2 0,02-0·16 7 0·0122 0·OII5 0·01200-3 0'02-0-08 5 0·0123 0·0118 0·01230·4 0,02-0,06 3 0·0125 0·0119 0·01230·5 0'02-0-05 2 0-0127 0·0121 0-01270·6 0·02-0·05 3 0·0133 0·0124 0·01310·7 0·02-0-05 3 0·0135 0·0129 0·01340·8 0·02-0-05 3 0·0138 0·0132 0·01370·9 0·01-0·03 3 0·0150 0·0141 0·01471·0 0·01-0·03 3 0·0153 0·0143 0·01491·5 0·01 1 0-0195 0·0180 0·0187
mined by the dichromate - iodide method described by Berka, Vulterin and Zyka,4 thenormality of this batch of titrant was 0.01242 , Sets of six titrations of 10-4 N copper(n)in 0·3 N potassium thiocyanate - 0·02 N perchloric acid medium gave, as average apparentnormalities of this same batch of titrant, 0,0129, 0·0127 and 0-0128, by Procedure A, l-curveand residual-current methods, respectively. Precise titration is therefore impossible unlessthe concentrations of both copper(n) and thiocyanate are essentially constant.

30 STOCK: AMPEROMETRIC TITRATION OF SUBMILLINORMAL [Analyst, Vol. 91
«'"...c:~.. 2:::l
U
R
o
Fig. 2. Titration of 50 ml of 50 p.Ncopper(n) with 0·0131 N mercury(r) perchlorate after arbitrary pre-addition of 0·5microequivalents of copper(n). P and Rare pre-addition and residual-current lines,respectively
The titrations were repeated and extended in acid thiocyanate media that also containedpotassium iodide. Fig. 2 shows a typical composite titration curve. The results, all obtainedat a perchloric acid concentration of 0·02 N, are summarised in Table II. In each set of3 experiments, the successive titrations were carried out at potassium iodide concentrationsof 0·02 N, 0·04 Nand 0·06 N, respectively. At least within these limits, the concentrationof this halide is obviously unimportant. As determined by the method described by Berka,Vulterin and Zyka,4 the normality of the titrant solution was 0.0131 2 , The results are essentially unaffected by lO-fold changes in the concentrations of either thiocyanate or copper(n)ion, or by the presence of chloride or bromide. In the concentration range 10-5 to 10-4 N
copper(n) and in the presence of iodide ion, end-point location by Procedure A is thereforeprecise and accurate to within ±1·5 per cent. Although less precise, the residual-currentmethod gives acceptable results. The conventional L-curve methodS is not to be recommended for this titration, nor is it applicable at the lower end of the copper(n) concentrationrange.
12,6, 13,3, 13·113,3, 13,3, 13·113,1, 12,9, 12·9
13,3, 13,0, 13·313,5, 13,0, 12·813·5, 13,3, 13·3
13.14 ± 0·25
Residual-currentmethodL-curve method
12,3, 12,8, 12·6Failed
12,9, 12,7, 12·5
13,1, 13,2, 12·913,3, 12,9, 12·613·0, 13·0, 13·1
12.86 ± 0·28
method A13,0, 13,4, 13·213,1, 13'3, 13·313,1, 13,1, 13·013,2,* 13,0, t 13·2t13,3, 13·2, 13·313,5, 13,2, 13·013,3, 13,2, 13·2
13.20 ± 0·14
TABLE IITITRATION OF COPPER(n) IN THE PRESENCE OF IODIDE ION
Apparent mercury(r) millinormalityAThiocyanate Copper(n)
concentration, concentration,N p.N
0·1 500·3 100·3 500·3 500·3 1000·8 501·4 50
Average millinormality and standarddeviation
* 0·02 N chloride present.t 0·02 N bromide present.t 0·02 N each chloride and bromide present.

January, 1966] CONCENTRATIONS OF COPPER{n) WITH MERCURY{I) PERCHLORATE 31
End-point location by Procedure A or, less satisfactorily, by the residual-current method,was found to be applicable in the titration of micronormal concentrations of copper{n).Fig. 3 shows some typical titration curves obtained with the titrant diluted 1O-fold withN perchloric acid. At a concentration of approximately /LN, copper{n) can be titrated witha precision of about 5 per cent. An end-point is recognisable at a copper(n) concentrationof 0·6 fLN (curve D); in this titration, the residual current accounted for more than 60 percent. of the initial current. Standardisation of the titrant against known amounts of copper{n),at concentrations similar to those to be determined, is recommended for submillinormaltitrations and is essential when the concentration of copper{n) is in the micronormal range.
Method B can be used when the copper sample is presented as a highly dilute solution.Further dilution is minimised by the use of concentrated reagents and the end-point is locatedby the residual-current method. Results obtained with a 10 /LN copper{n) solution wereprecise to within 5 per cent.
~ 03..;c
t::J
U
o0.\----...,,0'-;-·,-------:!0·c:-2 -----'
Volume of titrant, ml
Fig. 3. Pre-addition titration of 50 mlof highly dilute copper(n) solution withapproximately 0·0013 N mercurY(I) perchlorate. The upper and lower bars acrosseach titration curve are the pre-addition andresidual-current lines, respectively. Copper(n)concentration: curve A, 5 p,N; curve B, 2·4p,N; curve C, 1·2 p,N; curve D, 0·6 p,N
DISCUSSIONIn this titration, the underlying reaction is
Cu{n) + Hg(I) ---+ CU{I) + Hg(n).The marked depression of the formal potential of the mercury{n) - mercurY{I) couple bythiocyanate and the voltammetry of this couple in thiocyanate medium have been discussedelsewhere.s Initially, complexation by thiocyanate will tend to lower the formal potentialof the copper(n) - copper(I) couple. However, if the reaction proceeds normally, copper{I)will be produced as soon as the titration is started. Although the solubility productlO ofcopper(I) thiocyanate is only about 10-14, this compound is appreciably soluble when theexcess of thiocyanate ion is large. On the assumption that the solubility equation givenby Fridman and Sarbaevll holds approximately outside the stated range of 0·7 to 5 Nthiocyanate, the solubilities of copper(I) thiocyanate at 25° C are calculated to be 4 X 10⁻⁴,N, 2 X 10⁻³ Nand 8 X 10⁻³ N, in 0·1 N, 0·3 Nand N potassium thiocyanate solutions,

32 STOCK [Analyst, Vol. 91
respectively. Since the total copper concentration in the present work was always lessthan 2 X 10⁻⁴ N, copper(I) will remain in solution. A consideration of the values of theformation constantslO of the various thiocyanate complexes of copper(II) and copper(I) leadsto the conclusion that the formal potential of the copper(II) - copper(I) couple will be raisedby the presence of an excess of thiocyanate ion. At 25° C, a potential shift of from +0·47to +0·49 volt is calculated for thiocyanate concentrations of 0·1 N to N. The approximateformal potential under the titration conditions should therefore be +0·63 volt (hydrogenscale) or +0·39 volt (with respect to the S.c.E.). The calculated formal potential (25° C)of the mercury(II) - mercurY(I) couple in 0·1 N to N thiocyanate ranges from -0,09 to -0,35volt (hydrogen scale). Since the formal potential of the copper couple is at least 0·7 voltmore positive than the formal potential of the mercury couple, the titration reaction shouldgo to analytical completion unless the kinetics are unfavourable.
Although quick and quite precise under rigidly controlled conditions, the titrationexhibits stoicheiometry that is dependent upon the concentrations of thiocyanate and ofcopper(II) ions. High titrant normalities, obtained at high concentrations of thiocyanate,are almost certainly due to the partial reduction of copper(II) by the medium-
2Cu2+ + (2n + 2)SCN- ~ 2Cu(SCN)<;:-1}- + (SCN)2 (1)3(SCN)2 + 4H20 -+ 5SCN- + S042- + 7H+ + HCN (2)
where n has integral values of 1 to 4. This reduction has been recently studied by Kolthoffand Okinaka,12 who observed a large hydrogen wave even in freshly prepared 0·001 N copper(II)in N potassium thiocyanate solution. No copper(n) remained in the solution after overnightstanding. However, the reduction is much slower in 0·1 N potassium thiocyanate; about55 per cent. of the original copper(II) remained after 2 days.
Since thiocyanogen oxidises iodide,13 the addition of an excess of this ion suppressesreaction (2) and may suppress reaction (1). Any iodine produced will be titrated4 withmercurY(I) along with the remaining copper(II), so that the apparent normality of the titrantshould become independent of the concentrations of both thiocyanate and copper(n) ions.
Although iodide can form complexes with both copper(II) and copper(I) ions,14 theseeffects, and the resulting change in the formal potential of the copper(n) - copper(r) couple,are likely to be small in the presence of an excess of thiocyanate ion. However, iodide complexes mercury(n) ion very strongly,IS and should cause the formal potential of the mercurY(II)mercury(I) couple to become more negative than in an iodide-free thiocyanate medium.
This work was carried out with the partial support of the United States Atomic EnergyCommission (Contract AT(30-1) - 1977) and was completed at the Imperial College of Scienceand Technology, London. The facilities afforded by the College authorities, in particularby Professors R. M. Barrer and T. S. West, are gratefully acknowledged.
REFERENCES
1. Tarayan, V. M., and Arutyunyan, A. A., Zavod. Lab., 1953, 19, 900.2. Tarayan, V. M., "Merkuroreduktrometriya," Izdatel'stro Erevanskogo Universiteta, Erevan,
U.S.S.R., 1958, p. 144.3. Matsuo, T., ]. Chem. Soc. Japan, Ind. Chem. Sect., 1955,58, 962.4. Berka, A., Vulterin, J., and Zyka, J., Chemist-Analyst, 1963, 52, 122.5. Stock, J. T., and Heath, P., Analyst, 1965, 90, 403.6. Kolthoff, 1. M., and Tanaka, N., Analyt. Chem., 1954, 26, 632.7. Stock, J. T., "Amperometric Titrations," Interscience Publishers, a division of John Wiley and
Sons Inc., New York, 1965, chapters 7, 9 and 10.8. Stock, J. T., op. cit., chapter 1.9. --, op. cit., pp. 520 and 558.
10. Sillen, L. G., and Martell, A. E., "Stability Constants of Metal-Ion Complexes," The ChemicalSociety, London, 1964, p. 121.
11. Fridman, Ya. D., and Sarbaev, Dzh. S., Russian]. Inorg. Chem., 1959, 4, 835.12. Kolthoff, 1. M., and Okinaka, Y., Rec. Trav. Chim. Pays-Bas., 1960, 79, 551.13. Kaufmann, H. P., and Gaertner, P., Ber. dtsch. chem. Ces., 1924, 57, 928.14. Sillen, L. G., and Martell, A. E., op. cit., p. 338.15. --, --, op. cit., p. 341.
Received June 24th. 1965

January, 1966] ASPINAL 33
Vacuum Fusion Analysis with a Mass SpectrometerBy M. L. ASPINAL
(Associated Electrical Industries Limited, Central Research Laboratory, Rugby)
The suitability of a mass spectrometer for vacuum fusion analysis isdiscussed; the equipment and its mode of operation and calibration aredescribed. The objections to using an oil pump for extracting the gasesliberated from the metal samples have been overcome with this apparatus.
Results for oxygen determination in steels, molybdenum and zirconiumhave been independently checked by using a fast neutron-activation technique, and the results of two methods are shown to be in good agreement.
Oxygen levels of 116 p.p.m. have a standard deviation of 6 p.p.m. andcoefficient of variation of 5 per cent. Although most of the work has beencarried out on oxygen determinations, nitrogen results are quoted for twostandard iron samples showing that the method is also acceptable for nitrogendeterminations. Nitrogen levels of 31 p.p.m. have a standard deviation of3 p.p.m. and a coefficient of variation of 10 per cent.
The limits of detection for the equipment are 0·1 P-g of oxygen, 0·1 P-gof nitrogen and 0·01 P-g of hydrogen.
VACUUM fusion analysis is a well known method for the determination of oxygen, nitrogenand hydrogen in metals, and a comprehensive, up-to-date review of the literature has beengiven by James.1 Most papers, however, describe equipment capable of determining oxygendown to 10 p.p.m. This is no longer adequate as the metallurgical requirements for metalssuch as copper, molybdenum, tantalum and tungsten may be below this level; for example,copper that is to be used in vacuum devices is required to have an oxygen content of lessthan 0·5 p.p.m. The detection limit of some equipments could be lowered by increasing thesample weights, but large samples are not always available, and an equipment capable ofdetermining gas contents on small samples, in particular oxygen contents below 10 p.p.m.,was required. Techniques for the analysis of small amounts of gas were considered, suchas gas chromatography and mass spectrometry, and mass spectrometry was thought tobe most suitable for vacuum fusion analysis.
Mass spectrometers have been used by Taylor2 for the analysis of gas obtained by vacuumfusion; in this method the gas was collected in a bottle and then transferred to the spectrometer. Martin et at.3 used a mass spectrometer directly coupled to their vacuum fusionequipment. This equipment, however, required large sample weights, 6 to 14 g, and blankshad to be carried out for 1 hour so that sufficient blank gas was present for analysis.
The object of the work described in this paper was to produce an equipment suitablefor routine analysis of materials with high gas contents, and in particular capable of analysingmaterial with low gas contents for specialised purposes.
EXPERIMENTAL DISCUSSION(a) THE SUITABILITY OF A MASS SPECTROMETER FOR VACUUM FUSION ANALYSIS
There are three main reasons why a mass spectrometer was chosen for this work. First,because it is capable of measuring small amounts of gas quantitatively. Secondly, becauseit allows positive identification of each gas, whereas some of the earlier equipments couldonly label the residue gas as nitrogen after the extraction of carbon monoxide and hydrogen.The spectrometer, for example, would give differentiation between argon and nitrogen ifthis was required. Thirdly (an important advance on some earlier equipments), by couplingthe output from the spectrometer to a recorder, a complete record of the rate at which onegaseous component is liberated from the sample, and also the time needed to restore theoriginal blank rate can be observed. The gas liberated from the sample therefore appearsas a step on the blank rate, the height of which can be measured from the trace, so makingit unnecessary to carry out blanks at regular intervals between sample additions.
One difficulty that arises from using a mass spectrometer is caused because nitrogenand carbon monoxide both have the same mass number. Gregory, Mapper and Woodward4
suggested that this problem could be overcome, but with considerable loss of accuracy, bymeasuring the mass 29 peak that is principally the monoxide of 13C, and multiplying this

34 ASPINAL: VACUUM FUSION ANALYSIS WITH A MASS SPECTROMETER [Analyst, Vol. 91
by the 12Cj13C ratio to obtain an estimate of the total monoxide present in the mass 28 peak.The presence of organic compounds that also produce a peak at mass 29 made this methodunsatisfactory.
If the spectrum of a gas is studied it is found that it consists of a parent peak at themass equivalent of the molecule, a major peak that may be the parent peak and some smallpeaks that bear fixed ratios for a particular instrument and source condition to the majorpeak.
The characteristic cracking patterns of carbon monoxide and nitrogen are shown inTable I, in which it is seen that the parent peak is also the major peak. It will also be seen
TABLE ICHARACTERISTIC CRACKING PATTERNS
Carbon monoxide-mle 12 13 14 14·5 15 16 28 29 30
Relative intensity 4·49 0·048 0·61 0·007 0·001 0·95 100·00 1-13 0·21Nitrogen-
mle 14 15 28 29 30Relative intensity 7·18 0·021 100·00 0'77 0·002
that mass 12, the second largest peak, could be used to measure carbon monoxide, andsimilarly mass 14 could be used to measure nitrogen. Carbon monoxide also produces asignificant mass 14 peak due to the presence of (CO)2+, but allowance is made for this bycalibrating the spectrometer with carbon monoxide and measuring the mass 12 and 14 peaks.The amount of mass 14 coming from the carbon monoxide can be deducted from the "total"mass 14 peak before calculating the amount of nitrogen present.
Bottles of "Specpure" carbon monoxide, nitrogen and hydrogen are used for calibratingthe spectrometer. Small amounts of these gases are introduced into the gas-handlingsection, their pressure is measured by a McLeod gauge and the appropriate peak height bythe spectrometer. The calibration of the spectrometer does not change by more than 2 percent. over several months of continuous operation, and a calibration check once a weekis satisfactory. The filaments of the spectrometer, which are replaceable, have a life of6 months under normal operating conditions. Replacement of these filaments can be accomplished with no appreciable change to the calibration.
In order to check that mixtures of carbon monoxide and nitrogen could be satisfactorilyseparated with the spectrometer, varying amounts of the two gases were mixed in thegas-handling section and then analysed with the spectrometer. Table II shows the amountsadded and found. from which it can be seen that satisfactory separation has taken place.
TABLE IISEPARATION OF CARBON MONOXIDE AND NITROGEN
Analysis of mixtureGas mixture added with M.S.lO
A , A ,Carbon Carbon
Nitrogen, monoxide, Nitrogen, monoxide, N. added CO addedper cent. per cent. per cent. per cent. N. found CO found
15·4 84·6 15·5 84·5 0·99 0·999·4 90·6 9·8 90·2 0·96 1·01
13·0 87·0 12·7 87·3 1·02 0·9953·2 47·8 49·5 50·5 0·96 1·0880·0 20·0 79·0 21·0 1'02 0·9571·0 29·0 70·0 30·0 1·02 0·97
(b) THE USE OF OIL-DIFFUSION PUMPS FOR VACUUM FUSION ANALYSIS-
One criterion for good vacuum fusion is that a high-speed pump is used to extract thegases from the furnace section. This is to remove the gases quickly so they are less likelyto be "gettered" by the metal films that form around the cooler parts of the furnace walls.A pumping speed of 30 litres second-1 at the mouth of the crucible is usually acceptable.
Many vacuum fusion equipments use a mercury-diffusion pump to transfer the gasesfrom the furnace section to the analysing section. When a mercury-diffusion pump is used,the pressure in the furnace section is limited by the vapour pressure of mercury, which is

January, 1966] ASPINAL: VACUUM FUSION ANALYSIS WITH A MASS SPECTROMETER 35
3 X 10⁻³ mm (of mercury) at room temperature. At this pressure the mean free path inthe furnace section will be about 1 cm and there is a greater chance that "gettering" will occur.
A cold trap could be introduced between the diffusion pump and furnace section to reducethe pressure in the furnace section, but this is not desirable as it will also reduce the pumpingspeed at the crucible.
rioo.=-------------,
I..::Jo
J::::>...
.., !I'xoc:oEc:o
.<:l..eu
U
.2200 1800 I'!OO i!9QOTemperature,OC
Fig. 1. Comparison of carbon monoxideblanks against temperature; curve A = Mercury pump and low-pressure analyser(Palladium thimble and "Hopcalite"); curveB = Oil pump and mass spectrometer
One commercial equipment manufactured by Balzers incorporates an oil-diffusion pump.1iThis is claimed to produce a pressure of 10-8 mm of mercury above the crucible, and reduce"gettering" of the liberated gas as the films formed around the cooler parts of the furnacewalls are now less porous than those formed with a mercury system.
The main objections to the use of an oil pump are that any back-streaming of the oilcould increase the blank rate by being cracked on the hot graphite crucible, and also thatsome of the gas liberated from the sample might be absorbed in the pump oil.
Neither of these objections has been found to apply in this investigation, and the use ofan oil pump has in fact provided significantly lower blank rates. This is shown in Fig. 1,which compares carbon monoxide blank rates when using an 033C oil-diffusion pump withvalues obtained over several years with a mercury pump and a low-pressure analyser. Therehas also been no evidence for "gettering."
THE VACUUM FUSION EQUIPMENTThe general arrangement of the equipment is shown in Fig. 2 and can be divided into
three parts (a) furnace, (b) gas-handling and (c) mass spectrometer sections.
(a) FURNACE SECTION-This is shown in Fig. 3. A small silica crucible and pedestal are supported by the silica
furnace tube. The graphite crucible (It in. X tin. o.d., wall thickness -h in.) is placed inthe silica crucible and the space between the two crucibles is packed with graphite powderthat has passed through a Ioo-mesh sieve. A slotted graphite funnel is placed on top of thegraphite crucible. All the graphite parts and powder are made from Morganite EY9A graphite.The top rim of the silica crucible is turned in so that there is the minimum gap between thesilica and graphite funnel that prevents graphite powder from being blown out of the crucibleduring evacuation or outgassing. The silica furnace tube is joined to a stainless-steel manifoldby means of a viton O-ring fitting into a tapered groove and compressed with a screwed ring.
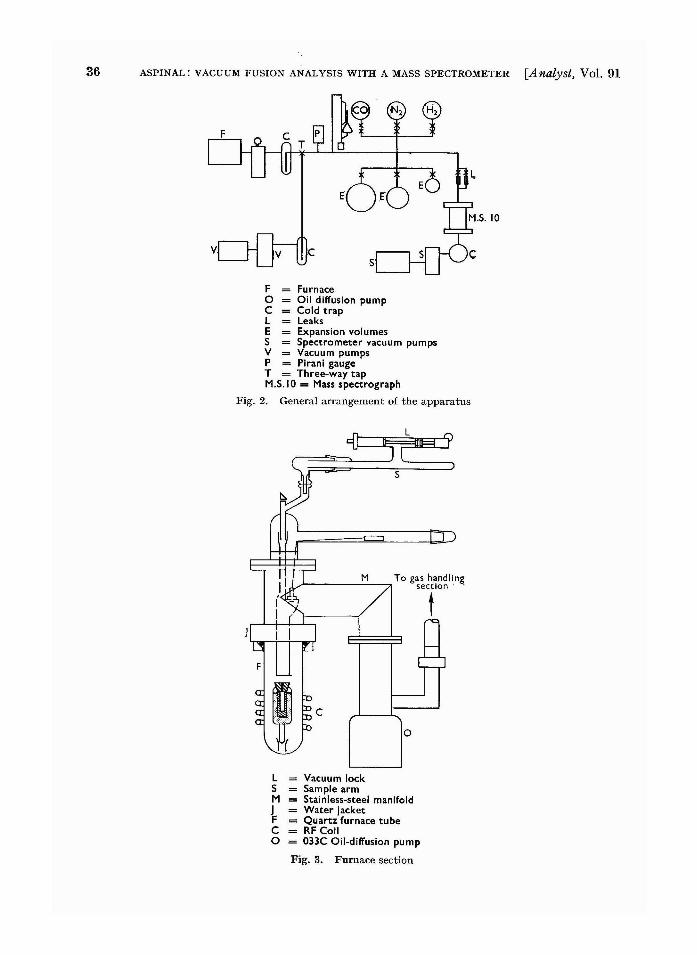
36 ASPINAL: VACUUM FUSION ANALYSIS WITH A MASS SPECTROMETER [Analyst, Vol. 91
F Furnaceo Oil diffusion pumpC Cold trapL LeaksE Expansion volumesS Spectrometer vacuum pumpsV Vacuum pumpsP Pirani gaugeT = Three-way tapM.S.I 0 = Mass spectrograph
Fig. 2. General arrangement of the apparatus
L
s
L. ---'-'----., To gas handling./ section' .
t
o
LSMJFCo
Vacuum lockSample armStainless-steel manifoldWater jacketQuartz furnace tubeRFCoil033C Oil-diffusion pump
Fig. 3. Furnace section

January, 1966J ASPINAL: VACUUM FUSION ANALYSIS WITH A MASS SPECTROMETER 37
A Pye 3-kW, 2-Mc second-l induction heater is used to heat the graphite assembly,and the bottom of the stainless-steel manifold is cooled by water to reduce the temperatureof the O-ring seal during operation. The 2i-in. bore stainless-steel manifold connects togetherthe furnace tube, sample-handling system and an A.E.!. 033C oil-diffusion pump, that hasan unbaffied speed of 130 litres second-I. The pump uses 704 silicone oil as the pump fluid,and has a simple copper-foil baffle inserted on top of it to prevent back-streaming. Themanifold also supports the funnel for guiding samples into the crucible.
The top flange of the manifold supports the mechanism for operating the stopper. Thisconsists of a graphite stopper connected to an iron slug with fine molybdenum wire. Theslug is moved along the side arm with a magnet, so raising or lowering the stopper whichis guided on to the crucible by means of the sample-guide tube. During sample additionsand temperature measurements the stopper can be drawn out to one side of the guide tubeto give an unobstructed view of the crucible. The temperature is measured with the opticalflat on top of the glass-ware, a prism and optical pyrometer.
A vacuum lock is fitted to the sample side arm to allow samples to be introduced whilethe system is under vacuum.(b) GAS-HANDLING SECTION-
The gas-handling section is connected through a liquid-nitrogen cold trap to the backingside of the oil-diffusion pump, and also to the mass spectrometer by capillary leaks. Thetrap is used to remove small amounts of unwanted condensable gases such as water andorganic compounds that complicate the mass spectrum, and are liberated from the graphiteand the cooler parts of the furnace section.
The section is pumped by a cold-trapped glass - mercury diffusion pump and A.E.!.,D.R.l rotary pump. These pumps can either be connected in series with the oil-diffusionpump during outgassing, isolated from the gas-handling section during analysis or can beused to evacuate the gas-handling section. The three-way tap T provides the necessarycontrol.
In addition the section consists of three expansion volumes used to adjust the pressureof the extracted gases to a suitable value and a McLeod gauge that is used during calibration.Litre bottles of "Specpure" carbon monoxide, nitrogen and hydrogen that are obtainedfrom the British Oxygen Company Ltd., are used during calibration, and connected to thesystem through double ~-in. A.E.!. polyethylene-diaphragm valves so that small amountsof gas can be introduced for calibration.
There are two capillary leaks in parallel connecting this section to the mass spectrometer.The leaks are made from precision-bore glass tubing and have conductances of 1·7 X 1O-4 litressecond-I and 0·5 X 1O-4 litres second-I. The leak with the lower conductance is used for thehydrogen determinations. Greased taps are always a possible source of leaks and only onetap, T, is used in this equipment, the remainder are either metal- polyethylene diaphragmvalves or greaseless glass taps with a viton diaphragm. These latter taps have a higherconductance than the i-in. metal valves and are to be preferred where a high conductanceis required.(c) MASS SPECTROMETER SECTION-
The mass spectrometer used is a small gas mass-spectrometer, type M.S.I0, manufacturedby A.E.!. Instrumentation Division, and has mass ranges 2 to 4, 12 to 45 and 18 to 200.The output from the analyser tube is passed through electronic circuits where it is amplifiedand displayed either on the output meter or pen recorder. The spectrum can be scannedby varying the accelerating voltage.
The spectrometer tube is mounted horizontally and pumped by its own vacuum pumps,which consist of a cold-trapped A.E.!. 033C oil-diffusion pump backed by an A.E.!.,D.R.l rotary pump. The oil used in the diffusion pump is Apiezon B.W. as there is somedanger of coating the source unit with silica if silicone oils are used.
Provision is made for baking the analyser tube while outgassing by using band heatersclamped around the flanges. These raise the temperature to 200° C with an unlagged system.Higher baking temperatures up to 400° C can be achieved with an oven, but for this particularapplication of the spectrometer baking at 200° C is adequate. The magnet, which weighs35lb, is easily removed during baking and can be replaced in the same position after bakingby using guides. The spectrometer is connected to the capillary leaks by a small inlet flangemounted on the side of the spectrometer away from the source unit.

38 ASPINAL: VACUUM FUSION ANALYSIS WITH A MASS SPECTROMETER [Analyst, Vol. 91
METHOD OF OPERATION-
The graphite crucible is placed in the silica crucible and the space between the twocrucibles is loosely packed with graphite powder. The assembly is placed on its support inthe furnace tube that is fitted to the furnace manifold. All the taps in the gas-handling section,which has been under vacuum from the previous analysis, are closed. The three-way tap, T,is turned so that the whole system can be slowly evacuated to avoid graphite powder frombeing blown out of the crucible. When the Pirani gauge, P, shows that the pressure has fallento below 100 microns the oil-diffusion pump can be switched on. Pressure continues to fallin the gas-handling section until it has reached a few microns. Outgassing of the cruciblecan now start by raising the temperature in about ten steps within half an hour up to amaximum of 2100° C; at higher temperatures there is a tendency for the stopper to stick tothe crucible. When the temperature has reached the maximum of 2100°C it is maintainedfor 1 hour. This has been found to be sufficient to outgas the crucible to a suitably lowlevel for use with samples with oxygen contents greater than 50 p.p.m.
If, however, the sample is expected to have a lower gas content, the outgassing procedureis continued for a second hour. This produces slightly lower blank rates; typical valuesare 19 p.! hour-1 at 1900° C (carbon monoxide, 32·5 per cent.; nitrogen, 13·5 per cent.;hydrogen, 54 per cent.), and 8 p.! hour-1 at 1700° C (carbon monoxide, 23·7 per cent.;nitrogen, 25·7 per cent.; hydrogen, 50·6 per cent.). The outgassing rate can be monitoredwith the spectrometer set at mass 12, and the minimum outgassing time can be determined.Once this has been determined it is usual to allow the spectrometer to cool from its overnightbake, and prepare the samples while the outgassing of the crucible is taking place.
The sample weights can vary in the range 4 g to 80 mg depending on whether theexpected oxygen content is below 1 p.p.m. of oxygen or above 1000 p.p.m. of oxygen,respectively.
The preparation of the sample's surface is usually carried out by abrading it with a fileand then by vapour de-greasing it with carbon tetrachloride. The optimum size of samplefor low gas contents and ease of manipulation is one, or more, 4-mm cubes. If a suitableetch is available this is preferred to the abrasion, for example, copper samples can be etchedin 1 to 1 nitric acid, then by I to 1 hydrochloric acid, washed with distilled water and driedwith acetone and ether. After the samples have been weighed, they are placed as quickly aspossible in the sample arm of the furnace section via the vacuum lock. If a bath materialis being used, such as iron for molybdenum or platinum for zirconium, this is also storedin the sample arm.
Liquid nitrogen is placed around the cold traps and the blank rate is checked for theequipment. This should be less than 20 iLl hour-1 at 1900° C. The temperature is loweredto the operating temperature, for example, 1900° C for materials such as zirconium requiringa platinum bath, 1750° C for materials requiring an iron bath. If a bath material is to beused it is introduced and outgassed.
Tap T is turned to connect the gas-handling section to the furnace section and a sampleis introduced to the crucible. The extracted gases are collected in the gas-handling sectionand adjusted to a suitable pressure with the expansion volumes. These are used to keep thespectrometer reading on scale when large amounts of gas are collected. The gas is monitoredduring collection by the spectrometer set either at mass 12 for carbon monoxide or mass 14for nitrogen. The rate at which the gas leaks from the gas-handling section into the spectrometer does not have any appreciable effect on the total volume of gas collected. The massspectrometer is coupled to the recorder which shows one of the extracted gases as a stepon the blank rate, Fig. 4. The collection is continued until the blank rate has returnedto its original rate shown by the recorder. This usually takes between 2 to 8 minutes. Thestep height is measured and converted to pressure with the appropriate calibration graphand hence to oxygen, nitrogen or hydrogen depending on whether mass 12, 14 or 2 has beenrecorded. The gases which are not recorded are measured after completion of the extractionby scanning the spectrum manually.
DISCUSSION
Peaks at masses 12, 13, 14, 15, 27, 43, 44 and 2 were measured manually on the earlyanalyses for both samples and blanks.
It was found that in addition to the peaks at masses 12, 14 and 2, corresponding to carbonmonoxide, nitrogen and hydrogen, only mass 15 (which is derived from methane) is produced

January, 1966) ASPINAL: VACUUM FUSION ANALYSIS WITH A MASS SPECTROMETER
100 25(a) \b\
N'II 80 20t- ~
t>O "- ~c
~ 60 "- .........is .........~ =18'2}Jg oxyge:0. '-~ '-::J =3'0 }Jg oxygen0-
'"::Jo 40 10
0
vi "- .........i "'-20 "'- 5 .........
"'-.........
6 0
39
Time, minutes
Fig. 4. Typical extractions of carbon monoxide: (a) sample weight2·27 g, expansion volume 1170 ml; (b) sample weight 2·96 g, expansion volume740 ml
in significant amounts by the sample. The other peaks 27, 43 and 44 were all present inthe blank and sample to an equal extent and are attributed to the presence of hydrocarbons.All of the mass 13 could be attributed to the methane.
As a result for routine analysis only masses 12, 14, 15 and 2 are measured.With samples containing large amounts of oxygen the mass 12 correction from mass 15
is small, but for samples with low oxygen contents it becomes significant.For nitrogen calculations two correction factors are applied, one is the mass 14 contri
bution from carbon monoxide determined during calibration, and the other is the mass 14contribution from mt;thane. Both correction factors for masses 12 and 14 from methaneare taken from the manufacturer's results and correspond to 2·8 per cent. and 18·2 per cent.of the mass 15 peak, respectively. Although the correction factors obtained from the crackingpatterns of methane will vary slightly between spectrometers, no appreciable error will occurin the results unless the variation is greater than 20 per cent. of the quoted results. A runof twelve steel samples can be analysed in 8 hours, including assembly and outgassing times.
RESULTS
Most of this work has been carried out on oxygen determinations only, as it is difficultto obtain material with a known nitrogen content. There is also some doubt expressed inthe literature as to whether nitrogen from certain materials, for example, zirconium, is liberatedquantitatively.
The standard iron samples BOL 16, BPL 8 and CRL 17 were obtained from the BritishIron and Steel Research Association.
Sa:npleBOL '.6
(lO'J p.p.m.)BPL 8
(40 p.p.m.)CRi:..17
(35p.p.m.)
,Number
ofdeter
minations
29
8
8
TABLE IIIOXYGEN RESULTS ON STANDARD IRON
M.S. 10 Radiochemical, A
Mean Number Meanoxygen Standard of oxygencontent, deviation, deter- content,p.p.m. p.p.m. minations p.p.m.116 6 6 119
52 6 6 62
54 3 6 64
• BPL 15 B.I.S.R.A. quote 30 p.p.m.
Standarddeviation,
p.p.m.4
6
5
Coleman,Meanoxygencontent,p.p.m.
120(BOL 25)
37(BPL 15)·
54(CRL 15)

40 ASPINAL: VACUUM FUSION ANALYSIS WITH A MASS SPECTROMETER [Analyst, Vol. 91.
They had also been analysed by Coleman,s who used a fast-neutron activation technique.The numbers on these samples denote the bar used. It will be seen that Coleman used differentbars of the iron, but all the bars are supplied with the same nominal gas content, except BPL 15.
Analysis was also carried out on three samples of stainless steel, one sample of molybdenumrequiring the use of an iron bath and four samples of zirconium that required the use of aplatinum bath. The results for these materials are shown in Tables III and IV.
TABLE IVOXYGEN RESULTS ON OTHER MATERIALS
M.S. 10 Radiochemicalr- "-- r A
Number Mean Number Meanof oxygen Standard of oxygen Standard
deter- content, deviation, deter- content, deviation,Sample minations p.p.m. p.p.ro. minations p.p.m. p.p.m.
Molybdenum-disc B 6 32 2 4 38 3Stainless steel-C2 2 36 2 34
Ca 2 44 2 39C. 5 58 4 2 48
Zirconium-Zr 66 2 850 2 870Zr 83 2 780 2 770Zr 92 2 720 2 750Zr 1I5 2 1440 2 1350
An independent check has also been carried out by this laboratory's radiochemistrydepartment on these samples by using the fast-neutron source at Wantage. The resultsobtained by use of this method have been quoted for comparison, and it can be seen thatin general the agreement between the two methods is good.
TABLE VLow OXYGEN LEVELS IN COPPER ALLOYS
Sample
O.F.H.C. copperCopper - I per cent. silverCopper - iron alloy ..Vacuum-melted copper
Number ofdeterminations
6446
Mean oxygencontent,p.p.m.
1·270·380·240·07
Standarddeviation,
p.p.m.0·1260·0480·0420·013
Coefficientof variationper cent.
9·912·517·518·6
One main advantage of this method lies in the determination of oxygen contents below2 p.p.m. in metals. Table V shows oxygen levels found in a number of copper and copperalloy samples. Fig. 5 shows the trace obtained for the lowest of these materials, from whichit can be seen that the step that represents 0·15 fLg of oxygen is still well above the background.
1'00,-----------,------------,
IIf; 0'75.,.c
"U
~ 0'50
Blank
-Copper sample 3g
16 14 12 10 B 6 4 2 oTime, minutes
Fig. 5. Trace for copper sample containing 0·05 p.p.m. oxygen by weight

January, 1966] ASPINAL: VACUUM FUSION ANALYSIS WITH A MASS SPECTROMETER 41
Nitrogen results are quoted for two standard iron samples (Table VI). These showa greater variation in the reproducibility, and although little work has been carried out atpresent on nitrogen determinations the results show that this method can be used for itsdetermination.
No standard samples for the determination of hydrogen were available. However,Table VII shows a range of hydrogen results obtained for various materials with this equipment.
TABLE VINITROGEN RESULTS
Sample
BNL 15(160 p.p.m.)
BOL 16(45 p.p.m.)
Number ofdeterminations
15
29
Meannitrogen content,
p.p.m.180
31
Standard deviation,p.p.m.
30
3
Sample
O.F.H.C. copperTantalum sheetZirconiumVacuum-melted copper
TABLE VIIHYDROGEN RESULTS
Number of Mean hydrogendeterminations content,
p.p.m.6 0·713 86·62 3466 0·01
Standarddeviation,
p.p.m.0·101·550·01
Coefficient ofvariation,per cent.
141·71·4
100
CONCLUSIONSThe method of vacuum fusion with a mass spectrometer, M.S.I0, as the analyser has
been used in this laboratory for the past 12 months. During this time the method has beencompletely reliable and the operation of the equipment is simple and rapid.
The method can be applied satisfactorily over a large range of gas contents, rangingfrom 1400 to 0·05 p.p.m. of oxygen, 150 to 20 p.p.m. of nitrogen and 400 to 0·02 p.p.m.of hydrogen.
The main advantage of this method is in determining oxygen contents of metals below2 p.p.m., and the display of the gas-evolution rate on a recorder.
The limits of detection of this equipment are at present 0·1 p,g of oxygen, 0·1 p,g ofnitrogen and 0·01 p,g of hydrogen. These limits can be improved if necessary by reducingthe pumping speed of the spectrometer, but a major source of error will be surface contamination in the form of surface films, which must be removed before any lowering of thedetection limit is justified.
I am indebted to Mr. P. Jones, who carried out the fast neutron-activation analysis andto Mr. J. A. James for reading the manuscript and making helpful suggestions and criticisms.
REFERENCES1. James, J. A., Metall. Rev., 1964, 9, 93.2. Taylor, R. E., Analytica Chim. Acta, 1959, 21, 6, 549.3. Martin, J. F., Friedline, J. E., Melnick, L. M., and Pellissier, G. E., Trans. Metall. Soc. A.I.M.E.,
1958, 212, 514.4. Gregory, J. N., Mapper, D., and Woodward, J. A., Analyst, 1953,78, 414.5. Kraus, T., Arch. Eisenhiittenw., 1962, 33, 527.6. Coleman, R. F., Analyst, 1962, 87, 590.
Received January 1st, 1965

42 MARTEN AND CATANZARO: FUNDAMENTAL STUDIES [Analyst, Vol. 91
Fundamental Studies in Automatic Nitrogen Digestiont. #.1.
By J. F. MARTEN AND e. CATANZARO(Technicon Instruments Corporation Inc., Chauncey, New York, U.S.A.)
Little work has been reported on the inter-relationship between digestiontemperature, media and catalysts in the AutoAnalyzer digestor system.
Although classical results could be used to some extent, many phenomenaobserved could not be explained by means of current theory. The volumeof acid in the digestor helix has been found to be critical, and failure torealise this has resulted in loss of nitrogen. Hypotheses are advanced toexplain where this nitrogen loss takes place, and subsidiary investigationsof catalyst and digestion-media systems were undertaken. The final digestorsystem is shown to give 99·5 per cent. recovery for ring compounds such asnicotinamide, when compared with ammonium sulphate standards takenthrough the same system. Theories are also elucidated that point to thereasons for the short digestion times, normally minutes, in which digestionis completed.
THEJAutoAnalyzer digestor is now probably sufficiently well known to warrant only a briefintroduction.
Samples are taken in turn from a sampler unit, mixed with a digestion acid and segmentedwith air, before being introduced into a helically-grooved heated glass cylinder in whichdigestion takes place. This is illustrated in Fig. 1. Fully digested samples are diluted, and
GloSS mixing chamber_ Diluent woter
Time-delay coil
~I~ Sample
Pomp NO.2, -l I~~~.I~~" LJd L2J S,mpl.'
Colori mete r Recorde r
Reagents
Woste bottles
Fig. 1.
Vacuumpump IDrain
Schematic diagram of the digestor - AutoAnalyzer system
passed On to a mlXmg chamber from which portions are continually aspirated into theanalytical system, the remainder being rejected as waste. Fig. 2 shows the digestor in detail,digestion being carried out in a glass vessel that rotates about its axis over a series of barheaters. One of the most striking features of the digestor is the speed with which it completesits task. Even the fact that rates of digestion are increased 2-fold for an increase in temperature of 10° C does not provide the complete answer. Rather, it is because much of thebreakdown occurs in thin films moving over the surface of the helix, which is quickly removedfrom the direct source of heat. Also, the acid volume is relatively large compared with thesample volume. The increased rate of digestion observed from macro to micro Kjeldahldeterminations is extended by means of this technique, use being made of the fact that anincrease in acid volume over sample volume accelerates charring and the final breakdownof the nitrogenous compounds. When digestions are carried out in a helical tube, many ofthe problems that arise in manual digestion are avoided. For example, it is well known that

Fig. 2. Digestor assembled ready for operation....,SQ>~
~t
Digested samples out -~)1\ !
Temperature controlfor second stage
Temperature controlfor first stage
Thermocouple meter(indicator)
- Samples and digestion fluid In
I:...----+-Meter indicating first or secondstage temperature
Switch for selecting first or secondstage temperature reading
Power switch(starts helix rotating)
Heater switch(controls bothheating stages)

January, 1966] IN AUTOMATIC NITROGEN DIGESTION 43
loss of ammonia may occur owing to local over-heating in macro determinations. In thisinstance, however, the rotation of the digestion tube prevents the formation of so-called"hot-spots," even at temperatures exceeding 3700 C. Also, the by-products of the breakdown,such as carbon dioxide and water, are removed as soon as they are formed.
Since Ferraril described the new concept of continuous nitrogen determination, investigations have been under way on the optimum operating conditions for this technique.
Certain parameters were described last year,2 but little work has been reported on thecomplex inter-relationship between digestion temperature, media and catalysts.
Although literally hundreds of papers have been published, and in fact are still beingpublished, on the classical Kjeldahl technique, since it was first described in 1883,3 much ofthis information could not be directly applied. We had, therefore, but a relatively short timein which to establish the parameters of what is surely a much more complex set of conditions,having multiphase and, probably, multi-order characteristics (see Fig. 3).
Flow~rate:. ml/,;,in
25
r';l;;r=::j~~~~~trl;~:.-1t-"C~=B:8=~:::J--Sample~ Air
)l-,""",,-::-K}i-~':"T'"-~Digest
Mh<er
625 mp;4 ·mm I/c
Fig. 3. Flow diagram for the continuous determination of nitrogen
The manifold shown here is generally accepted for routine use for amounts in the range100 to 1000 JLg of nitrogen per ml, the input volume being 0·9 ml per minute. Thus, for20 samples per hour 1·8 ml of liquid sample are used, giving 180 to 1800 JLg of nitrogen fordigestion. The amount of acid used for this digestion is 14 ml. On the other hand, for solids,with the AutoAnalyzer solid preparative techniques, 3 to 5 g of, for example, barley, are homogenised in 200 ml of liquid, and the same amount of suspension is used for the analysis.
It was recognised that a limitation of the digestion temperature was necessary to achievequantitative results. Certain refractory compounds, including nicotinamide, were therefore,not amenable to this technique (see Fig. 4).
Three standard materials were chosen for a thorough examination of the effects of temperature on the recovery of nitrogen. They were ammonium sulphate, urea and nicotinamide,and represented extremes of resistance to breakdown. Each was run on the digestor atfour temperature settings, the optical densities of the solutions being then plotted againstenergy input. These standards contained 800 /Lg of nitrogen per ml.
From the cold state, ammonium sulphate gave a gradually decreasing final optical densityup to approximately 2700 C in the first heat stage, which is run at the higher temperatureto clarify the sample. From then on, what appeared to be a rapid loss of ammonia was observeduntil the temperature reached 4750 C, the loss being approximately 50 per cent.
The relationship between energy input and temperature in the two stages of the digestoris shown below.
Energy input, watts 720 960 1210 1310 1440Temperature { First zone, °C .. 100 200 360 350 350
Second zone, °C 200 270 350 415 475
The curve for urea increased initially to a maximum at 2700 C, then paralleled theammonium sulphate curve. The nicotinamide curve increased in value over a wide

44 MARTEN AND CATANZARO: FUNDAMENTAL STUDIES
0·11
.~.<:OJ
"G 0·09o&.-o
0-07
O-oS!;;700M' ,...--'--900"*"--'----;1-71OO=----'--.1~30;;;;0~.L-4I~Energy, watts
Fig. 4. Effect of temperature on the recoveryof nitrogen (flow-rate, 2·5 ml per minute) from:curve A, ammonium sulphate; curve B, urea;curve C, nicotinamide
[Analyst, Vol. 91
temperature range, most closely approaching the other two curves at approximately 4150 C,and subsequently running parallel to them.
Neither urea nor nicotinamide reached the maximum shown by ammonium sulphateat lower temperatures. It is also interesting to note the near coincidence of the three curvesbeyond the nicotinamide maximum, the recovery as compared with that of ammoniumsulphate or urea being approximately 96 per cent. This is the reason for the satisfactoryperformance of the digestor, even at temperatures of 4150 C, and in spite of what appearto be nitrogen losses.
Obviously, at this stage it was necessary to ascertain whether this nitrogen loss wasapparent or real. In other words, it was necessary to establish whether the analysis ofammonium sulphate by the indo-phenol reaction was affected by the digestion temperatureor media.
Ammonium sulphate was continuously introduced directly into the colorimetric systemvia the diluent line, no sample being taken in the normal manner. No change was noted inthe final optical density obtained with the indo-phenol reaction under these conditions withincreasing temperatures of digestion. These results were further substantiated by collectingdigestant at different digestion temperatures, and quantitating the ammonium sulphate bythe indo-phenol reaction and the ninhydrin reaction of ]acobs.4
The cause of the nitrogen loss still had to be established, and several possibilities wereconsidered-
(i) Physical carry-over of the sample and digestion mixture into the vapour phase.(ii) Volatilisation of an ammonium salt, possibly a perchlorate.
(iii) Oxidation of ammonia to nitrogen.(iv) Oxidation to nitrogen oxides.
Accordingly, the system was modified to allow scrubbing of the vapour phase. Neitherammonia nor nitrogen oxides were found to be present in the scrubbing solutions.
The remaining possibility was thus the direct conversion of ammonium salts to nitrogen.As may be imagined, this phenomenon is difficult to verify experimentally. Grunbaum5 ,6
has found, however, that ammonia is lost in sealed-tube digestions at high temperatures,oxidation of ammonia to nitrogen by SUlphur trioxide and oxygen being postulated.
(NH4)2S04 --+ 2NHa + H2S04H2S04 --+ Hp + SOs
2S0a --+ S02 + O2302 + 6S0a + 4NHa --+ 2N2+ 6H2S04
12NHa + 902 --+ 6N2+ 18H20

January, 1966] IN AUTOMATIC NITROGEN DIGESTION 45
There still remained the problem of how to eliminate, or at least reduce, the nitrogen loss.Increased pressure, which created a partly closed system, had no effect, except for somediscomfort to the onlookers. It was thought that it might be possible to use more efficientcatalysts or different digestion media, so that comparable results could be obtained at alower temperature.
Baker7 has investigated several catalyst combinations, and has concluded that mercuryis the most effective. Selenium, he found, caused decomposition of ammonia above approximately 387 0 C. However, Baker is not supported by many others, and there are considerablediscrepancies in the observations from one paper to another.
OJo......._----.....:.A
~.~ (no.,..,~°io
.0010
ol:7"'"'OO,-.L-----:::900±-:--.l..-----,-,1I~OO:;;-----'---;-:13~OO~--'-----'
Energy, watts
Fig. 5. Effect of temperature on the recoveryof nitrogen (flow-rate, 9 ml per minute) from:curve A, ammonium sulphate; curve B, nicotinamide
Our results have shown that there is no significant difference in the nitrogen lossesobtained in the presence of mercury or selenium catalysts, although it must be rememberedthat the conditions used were different from those of the classical method for decomposingnitrogenous compounds. It was, however, established that a mixed mercury - seleniumcatalyst was most efficient. Differences in the perchloric and sulphuric acid contents andin the addition of potassium sulphate had little or no effect,
During the experiments at the highest temperature used, it was noted that evaporationalmost to dryness of the digestant at the exit of the digestor resulted in the evolution ofsulphur trioxide fumes.
If these extreme conditions reflected a deficiency in the technique as a whole, then,conceivably, a shortage of digestion fluid would be conducive to the formation of sulphurtrioxide, and the subsequent loss of ammonia by oxidation. The delivery of the digestionmixture was therefore increased from the accepted 2·5 ml per minute in steps to 9 ml perminute (see Fig. 5).
Also, a graph of the effect of the digestion temperature on the optical density was plotted,and gave a different curve. It shows that after an initial drop of approximately 10 per cent.there is no further decrease in the optical density over the remainder of the temperaturerange, i.e., up to 4750 C, in the first heating zone. Also, the curves of all standards so farexamined have, after having reached a maximum, levelled-off close to the curve of theammonium salt.
Thus, severe temperature conditions may now be used for cracking the most refractoryof compounds rapidly, without the necessity of the results being based on the steeplydescending portion of the curve, with a subsequent loss in accuracy.
These results were obtained with the standard selenium-catalyst digestion mixture.Under these conditions, nicotinamide gave recoveries of 96 per cent., when compared withammonium sulphate standards treated similarly (see Fig. 6).

46 MARTEN AND CATANZARO: FUNDAMENTAL STUDIES [Analyst, Vol. 91
*Acidflex tubing
Digested sample
WaterAir
Sodium hydroxideAlkaline phenolSodium hypochlorite
Debubbler
SampleAir
Digestant
7·0% HgS04 in10% H2S04
Water
GO
: I DO
Flow-rate.mil min
..------~rol 06I I 3.9
T/DcOil••~
8 mmtub. f/c;630 m~
Fig. 6. Modified flow diagram for the determination of nitrogen in compounds not readilydigested
TABLE IRECOVERIES OF NITROGEN FROM AMMONIUM SULPHATE AND
NICOTINAMIDE STANDARDS
Temperature conditions: first stage, 3500 C; second stage, 4750 C. Flow-rate:1·3 ml per minute. Digestant: 90 per cent. of sulphuric acid, 2 per cent. ofperchloric acid, 0·5 per cent. of mercuric sulphate and 0·02 per cent. of selenium
dioxide
Nitrogen present,p.g per ml
200400600800
1000
Nitrogen recovered from-,,-- "'A ----..,
ammonium sulphate, nicotinamide,% %
99·9 100·299·1 99·6
99,1, 99·5 99·199·1 98·699·9 99·9
0·2
'"....;;;cQ)
-uc;;v
RO·Io
200 400 600 800 1000·Nitrogen present, p.p.m.
Fig. 7. Calibration curves for the determination of nitrogen in: curve A, ammoniumsulphate; curve E, nicotinamide

January, 1966] IN AUTOMATIC NITROGEN DIGESTION 47
The manifold was then modified in the light of the work done on catalyst systems tointroduce not only an increased volume of acid but also the required concentration ofmercury catalyst.
The digestion mixture finally used was 90 per cent. of sulphuric acid, 2 per cent. ofperchloric acid, 0·5 per cent. of mercuric sulphate and 0·02 per cent. of selenium dioxide.Since mercuric sulphate is insoluble in concentrated acid, it was introduced separately. Thedigestion efficiency was improved such that the nicotinamide recoveries obtained over awide temperature range were 98·6 to 100·2 per cent. This is aptly illustrated in Fig. 7,which shows the coincidence of the two calibration plots. The results used for plotting thesecurves are shown in Table 1.
Obviously, the techniques must be modified to suit the sample to be digested, e.g.,when the organic content of a sample is high, the perchloric acid content of the digestantmust be increased. Experiments have shown, however, that up to 50 per cent. of perchloricacid can be used without invalidation of the principles discussed here, e.g., when digestionof 8 per cent. solutions of sucrose has been successfully accomplished.
This work, therefore, has provided a basis on which these modifications can be made.
REFERENCES
1. Ferrari, A., Ann. N. Y. A cad. Sci., 1960, 87, 792.2. Marten, J. F., and Ferrari, A., "Proceedings of the 1963 Technicon Symposium on Automatic
Analytical Chemistry," Technicon Instruments Co. Ltd., 1964, p. 20.3. Kjeldahl, J., Z. anal. Chern., 1883, 22, 366.4. Jacobs, S., Analyst, 1964, 89, 489.5. Grunbaum, B. W., Kirk, P. L., Green, L. G., and Koch, C. W., Analyt. Chern., 1955,27, 384.6. Grunbaum, B. W., Schaffer, F. L., and Kirk, P. L., Ibid., 1952, 24, 1487.7. Baker, P. R. W., Talanta, 1961, 8, 57.
Received January 4th, 1965

48 PRISCOTT, HAND AND YOUNG: ANALYSIS OF [Analyst, Vol. 91
The Analysis of Electrolytic Capacitor ElectrolyteThe Determination of Chloride and Sulphate
in the p.p.m. RangeBy B. H. PRISCOTT, T. G. HAND AND E. J. YOUNG
(Birmingham Materials Section, Test and Inspection Branch, Post Office Engineering Department,Fordrough Lane. Birmingham. 9)
A method is described for the determination of chloride and sulphateions in ethylene glycol- ammonium borate based electrolytes from electrolyticcapacitors. The electrolyte is extracted with 80 per cent. ethanol. Thechloride concentration is determined by titration with electrogenerated silverions by differential electrolytic potentiometry. and the sulphate concentrationby titration with barium in the presence of Thorin with a photoelectrictitrator. Concentrations of 0·3 p.p.m. of chloride and 0·5 p.p.m. of sulphatein the final solution have been satisfactorily determined. Both procedureshave applications in a wide range of analyses.
MODERN telecommunications practice makes high demands on the complex equipment used.and high-reliability, long-life components are therefore imperative for inaccessible equipmentsuch as submerged repeaters in transoceanic cables.
The electrolytic capacitors used in such systems are of the conventional type in whichaluminium-foil electrodes are separated by paper impregnated with a solution of ammoniumborate in ethylene glycol,l,2 It is known that sUlphate and chloride ions seriously reducethe reliability of such capacitors when present in concentrations exceeding 10 to 20 p.p.m.As the amount of electrolyte in one capacitor may be quite small (about 1 g) a procedurecapable of determining 3 ftg or less of each ion is therefore required.
The use of barium and mercurous chloranilates3 ,4 was found to give high blanks anderratic results at these low levels. although they were found satisfactory for other applicationsin which higher concentrations were encountered. A procedure based on the chloridemercury - diphenylcarbazone system has been proposed by Kemula,5 but was not studiedin detail. Gravimetric and nephelometric procedures are not applicable as the solubilitiesof the usual precipitates of silver chloride (Iftg ml-I ) and barium sulphate (2 ftg ml-I ) aretoo high, and the procedures presented here rely on ion association in solution rather thanin a precipitate.
EXPERIMENTALDETERMINATION OF SULPHATE-
For this determination the procedure due to Fritz and Yamamura6 was studied, in whichthe sulphate ions are titrated with barium ions in 80 per cent. ethanolic solution with Thorinas a visual indicator. An E.E.L. photoelectric titrator is used to detect the end-point.Initial trials with 0·01 N barium chloride solution in an Agla micrometer syringe showed thatthe maximum response was obtained with an !lford 604 green filter (with peak transmissionat 520 mft). During the titration the added barium ions first associated with the sulphateions and when all of the sulphate had reacted, the barium ions formed a coloured complex withthe indicator, producing a change in instrument reading, the end-point being the point ofinflection of the curve of instrument reading plotted against volume added shown in Fig. 1(a) and (b).
When aliquots of standard sodium sulphate solution were added to 80 per cent. ethanolit was possible to make reproducible titrations down to concentrations of 0·5 p.p.m. in eachof the two vessels supplied with the instrument, representing total sulphate contents of1·5 and 10 ftg in the small and large vessels, respectively. At the lower concentration levelsthere was considerable delay before equilibrium was reached and in order to prevent thetitration from becoming too lengthy, readings were taken at 60-second intervals followedimmediately by an addition of a further aliquot of titrant to the solution. With similartitrations made in methanol solutions no end-point was detected.
Titrations were next made with sulphate added to a synthetic capacitor electrolyteconsisting of 20 g of ammonium borate, 45 ml of ethylene glycol and 15 ml of distilled water.

January, 1966] ELECTROLYTIC CAPACITOR ELECTROLYTE 49
The ammonium borate was prepared by distilling analytical-reagent grade ammoniumhydroxide into a solution of analytical-reagent grade boric acid until strongly alkaline, andthen evaporating and crystallising it. Aliquots of sulphate-containing electrolyte weremade 80 per cent. with respect to ethanol, and cations were removed by passage througha small column of Amberlite IR 120 resin in the hydrogen form when it was found possibleto make titrations down to 0·5 p.p.m. of sulphate. When, however, attempts were madeto cover smaller total contents by concentrating the solution by evaporation, poor resultswere obtained, as shown in Fig. 1 (c) because of the high glycol content that was obtained.This was overcome by evaporating the solution nearly to dryness (after the addition of afew milligrams of potassium carbonate) to remove the bulk of the glycol and taking up theresidue in 80 per cent. ethanoL It was then found possible to titrate down to a total contentof 1 to 2 /Lg as shown in Fig. 1 (b) and Table I.
80·.-----------~-.:...-------,
60be.::..,..f 4Q...-;;;v
V> ..- ..20 •••••
Q o·oisolution, ml
Fig. 1. Titration of 0·01 ml of 0·01 N sulphate ionswith barium chloride: curve A, in 80 per cent. ethanol;curve B, after the removal of glycol; curve C, in thepresence of glycol
THE DETERMINATION OF CHLORIDE-
For the determination of chloride, the application of the technique of differential electrolytic potentiometry (D.E.P.) due to Bishop7,8,9,lo was studied, in which he has shownthat titrations are feasible several orders below the levels concerned here. The theory andpractice of this technique have been adequately described7,8 and only the basis of theprocedure will be given here.
If in the titration of chloride ion in a suitable solvent by silver ions, two silver electrodesare immersed in the solution and a small current is passed between them from a constantcurrent high-impedance source, only a small potential difference exists between them, beforeand after, the end-point. At the end-point, however, potentials of several hundred millivoltscan be developed and the curve obtained, by plotting titrant added against potential difference,resembles the first derivative of a normal titration curve. This technique has been satisfactorily used for the determination of chloride ions of much lower concentrations than thoseat which a normal potentiometric titration would give an erratic response, and Bishop hasshown that the electrode equilibrium is attained more rapidly when the titrant is electrogenerated than when discrete additions are made from a microburette.
The electrodes were prepared from 16-s.w.g. silver wires cast in pairs in epoxy resin,cut off square, ground and polished flat so that only the cross-sectional area of the wire wasexposed. Silver and silver chloride electrodes were used in the initial trials and both werefound to give satisfactory titration curves, the silver chloride electrode giving the higherresponse. Under the conditions required in the presence of ammonium salts the chloridecoating spalled off fairly rapidly and plain silver electrodes were adopted as the standard.These electrodes require activating before use and cleaning with fine ~ery, only immersingthen in 50 per cent. nitric acid for 30 seconds, washing and storing them in distilled wateruntil required for use was found satisfactory.

50 PRISCOTT, HAND AND YOUNG: ANALYSIS OF [Analyst, Vol. 91
The silver ions were electrogenerated from a ring anode of 16-s.w.g. silver wire placedsyrrunetrically around the indicating electrodes. The cathode was a copper wire - coppernitrate half-cell separated from the analytical solution by an agar bridge. A current of45·3 p.A, equivalent to 1·0 p.g minute-I, was used. As there is no common point betweenthe generation and measuring circuits, high insulation of the generator battery and control
. equipment from the measuring circuits is imperative, and the battery was placed on rubberbungs to meet this requirement. The electrical circuits are shown in Fig. 2.
A = Copper nitrate half-cellB = Indicator electrodesC = Silver anodeM = Meter, 0 to 50 p.AR1 = 5000-megohm resistorR2 = I-megohm resistorVR = I-megohm variable resistor
Fig. 2. Differential electrolytic potentiometry circuits
Trials showed that the optimum differentiating conditions were obtained by usinga 112·5 volt supply with a ballast resistor of 5 X 10⁹ ohms giving a current density of1·08 X 10-6 amp cm-2. The electrode potentials were measured wit~ a Pye Dynacap pHmeter and recorded on an Evershed and Vignoles recording milliammeter with a 3t-inchwide scale and a chart speed of 0·1 inch per minute.
With this procedure it was found that good results were obtained down to at least0·3 p.p.m. in 80 per cent. ethanol made 0·001 N in nitric acid, and that a greater electroderesponse was given in methanol, as reported by Bishop. In order to obtain a procedurecompatible with that for the sulphate determination, the use of ethanol was adopted for thework reported here. It is possible to determine smaller concentrations of chloride by varyingthe differentiating current, but the level reached was adequate for the present purpose.
Additions of boric acid and ethylene glycol in the amounts expected from capacitorswere found to have no measurable effect on the titration. With ammonium borate, however,the nitric acid concentration had to be increased to 0·1 N before satisfactory curves wereobtained. Under these conditions spalling of the surface of one electrode was found tooccur, but this was minimised by reversing the polarity of the electrodes after each determination.
EXTRACTION OF SAMPLE FROM CAPACITOR-
As the concentration of sulphate and chloride ions in the electrolyte is required, thecomplete extraction of the liquid material from the capacitor is not essential as long asno selective extraction occurs. It was found that 80 per cent. ethanol was a satisfactorysolvent and that three extractions removed substantially all the titratable ions. Sulphatedeterminations on each of three extracts were found to give concentrations of 2'80, 3·00and 3·03 p.p.m., the electrolyte extracts being 4,0, 3·0 and 1·95 g, respectively.

January, 1966] ELECTROLYTIC CAPACITOR ELECTROLYTE 51
CONSECUTIVE DETERMINATION OF CHLORIDE AND SULPHATE-
While large capacitors yield sufficient material for the two determinations to be carriedout in duplicate on separate aliquots of the extract, small capacitors require that both thedeterminations be made on a single aliquot, the silver that was added during the chloridetitration having been removed with other cations by the ion-exchange step prior to thesulphate determination. A solution containing 2·0 fLmoles of sulphate gave a titre of 0·0195 mlof 0·01 N barium chloride and a similar solution after a chloride titration corresponding to50 fLg of chloride gave a titre of 0·0197 ml, showing the consecutive determination of thetwo ions to be satisfactory.
METHODREAGENTS-
Ethanol, 80 per cent.Barium chloride, 0·01 N-Dissolve 1·2215 g of analytical-reagent grade barium chloride
in distilled water and make up the volume to 1000 ml.Thorin indicator-A 0·05 per cent. wIv solution of Thorin [2(Hydroxy-3,6-disulpho
I-naphthylazo) - phenylarsonic acid sodium salt] in distilled water. This solution is unstableand should be prepared daily.
Sitric acid-B.D.H. transistor grade or equivalent.Amberlite IR120 resin-Analytical-reagent grade.
ApPARATUS-
Photoelectric titrator-That supplied by Evans Electroselenium Ltd. was found to besatisfactory. The glass vessels supplied have working volumes of 3 and 20 ml.
pH meter-A Pye Dynacap meter was found satisfactory but, any pH meter or valvevoltmeter with an input impedance of more than 1012 ohms may be used.
Chart recorder-An Evershed and Vignoles Murday recorder with a range of 1 rnA fullscale deflection, 3000-ohms resistance and a chart speed of 0·1 inch minute-1 was satisfactory.
Agla micrometer syringe or similar equipment.Ion-exchange column-A glass tube approximately 5 inches long by t inch diameter
with a tap at the lower end is suitable for this column. A small piece of quartz wool placedabove the tap retains the resin within the column, and a suspension of Amberlite IR120Hanalytical-grade resin in water is poured in to a depth of about! inch. Wash the resintwice with water, twice with 80 per cent. ethanol and allow to drain. With care in constructionthe bed volume and dead space can be kept to a minimum so that washing volumes canbe small. The resin is re-activated by stirring it with N hydrochloric acid for 5 minutes,then filtering and washing it until it is free from chloride. Store it under water until required.
Differentiating circuit-A battery of approximately 100 volts and stable resistance of5 X 109 ohms are used. Megistors obtained from the Morgan Crucible Co. are suitable. Thecircuit is built into a metal screening container and all external connections are made withco-axial cable, the outer conductor being used as a screen. Insulation of the ballast resistor,from the core is critical as many materials regarded as insulators are of the same order ofconductivity as the ballast resistors. Similarly, the insulation of the change-over switchmust be good. The circuit is shown in Fig. 2.
Electrogenerative circuit-Any battery - resistance combination giving a constant electrogenerative current may be used. A high potential and a high resistance provide more stableconditions. The effective insulation of all parts of this circuit (except the electrodes in thesolution with the indicator electrodes) from the differential circuit is essential to preventspurious potentials from being indicated on the pH meter. The circuit is shown in Fig. 2.
Differential electrodes-Two I-inch lengths of 16-s.w.g. silver wire are soldered on tolengths of tinned-copper wire, and cemented by means of Araldite AVl00 resin into twoshallow grooves cut longitudinally in a 3 X ! X i-inch piece of Perspex such that the freeend of the silver wire slightly projects past the edge of the strip. When the resin is cured,the wires are covered with a layer of resin i-inch deep, free from air bubbles, and the resinis allowed to cure fully. The end of the assembly is then ground-off square and polished wet,up to 500-mesh carborundum paper. The copper wires at the other end of the strip are usedto make connection to the differentiating circuit through coaxial cable. The electrodes areactivated by immersing them in 50 per cent. nitric acid for 30 seconds, then washing andstoring them in distilled water until required. When the electrodes become inactive in usethey are polished on fine abrasive paper and re-activated as described.

52 PRISCOTT, HAND AND YOUNG: ANALYSIS OF [Analyst, Vol. 91
Electrogenerative electrodes-A glass tube 3 X ilr inches is half filled with a hot 10 percent. solution of agar containing 5 per cent. of analytical-reagent grade potassium nitrate.When the agar is cold and set, a 20 per cent. solution of analytical-reagent grade coppernitrate is placed in the empty end until this is two-thirds full. A copper wire is immersedin the copper nitrate solution, and the whole mounted vertically in a suitable holder. Thisforms the cathode half-cell with its connecting agar - salt bridge. The anode is made bybending a length of 16-s.w.g. silver wire into the form of a horizontal loop with a verticalconnecting length.
Electrode stand-The electrodes are mounted on a suitable stand constructed fromPerspex sheet. A symmetrical arrangement is essential to minimise any potential inducedin the measuring circuit by the generating current.
PROCEDURE-Extraction of electrolyte-Cut, or grind away the metal case of the capacitor, carefully
extract the inner coil and weigh it on a watch glass. The coil is then loosened to allow readyingress of solvent, and the capacitor coil is extracted with the minimum amount of 80 percent. ethanol in a suitable vessel. Three extractions are generally sufficient, after which thecoil is dried on the watch-glass in an air oven at a temperature of 105° C, cooled and re-weighed.The loss in weight is taken as the weight of the electrolyte.
Determination of chloride-A suitable portion of the capacitor electrolyte in 80 per cent.ethanol is placed in a small squat beaker together with a stirrer magnet. Sufficient N nitricacid is added to the solution to make it 0·1 Nwith respect to nitric acid. The electrode assemblyis introduced, the stirrer started and the differential circuit switched on. After about oneminute, during which the potential settles down, the electrogenerative circuit is switchedon at 45·3 JLA and the chart recorder is started simultaneously. The recorder now plots thecourse of the titration and a characteristic peaked curve is produced, as shown in Fig. 3.
200.--------.,.--:-.,....-..,--,
>E
"iii
~ 100
&...gu..
W
Time. minutes
Fig. 3. Differential electrolyticpotentiometry titration curve (titration of 9 p.g chloride ions at 45·3 p.A)
The comparatively high nitric acid concentration used causes spalling-off of the surface filmon one electrode after prolonged use, which gives rise to a high differential-electrolytic potentiometric base potential. This can be avoided by reversing the indicator electrode polaritybetween determinations. The time taken to reach the peak of the curve is measured. Thepeak is rather rounded and the best value is obtained by considering the mean position ofthe comparatively flat portion at the top. At 45·3 JLA, each minute represents 1 JLg ofchloride ion.
Determination of sulphate-A suitable volume of the extracted electrolyte obtained istaken and a few milligrams of potassium carbonate are added. The solution is carefullyevaporated nearly to dryness in a small squat beaker and then cooled. A small amountof water is added to the solid and boiled to dissolve the residue and to rinse the sides of the

January, 1966] ELECTROLYTIC CAPACITOR ELECTROLYTE 53
beaker. When the solid is dissolved, the solution is cooled and made 80 per cent. ethanolic.The solution is then passed through the cation-exchange column, the effluent being collectedin the small titration vessel. The column is washed twice with 80 per cent. ethanol. Sincethe column is not working as a true chromatographic column it can be drained before thesample is introduced and after each washing. The solution is then placed in the titratorand an Ilford No. 604 filter is inserted in the instrument; the stirrer is started and Thorinindicator is added to the solution until the instrument, with the sensitivity turned to maximumand the zero control turned almost fully clockwise (i.e., the condition of maximum sensitivityof the instrument), reads 20 divisions on the upper red logarithmic scale. The microburetteis filled with 0·01 N barium chloride solution and fitted so that the tip of the jet is just abovethe surface and can be just dipped into the surface to introduce each increment of titrant.Titration is carried out by introducing equal increments, usually 0·001 ml, at fixed-timeintervals, normally of one minute, and reading the galvanometer at the end of each minuteuntil the reading has risen to a high value (about 50 to 80). A graph is then constructed ofgalvanometer reading against titration, and the end-point is determined from the point ofinflection of the curve.
Consecutive determination of chloride and sulphate-The chloride concentration is determined by the method described, and after completion of the titration the electrodes andmagnetic stirrer are removed, washed down into the vessel with 80 per cent. ethanol and thesolution is used for the determination of sulphate as described before.
REPRODUCIBILITY
A synthetic capacitor electrolyte was prepared containing 20 g of ammonium boratein 100 ml of ethylene glycol. Additions of chloride or sulphate were made to lO-ml aliquotsof the electrolyte which were then diluted to 100 ml with 80 per cent. ethanol and the additionswere determined by the procedures described above. The results obtained are shownin Table I.
TABLE IDETERMINATION OF CHLORIDE AND SULPHATE IN A SYNTHETIC CAPACITOR ELECTROLYTE
Concentration, p.p.m. Coefficient of, A variation,
Addition Added Found mean per cent.Sulphate 1·88 1·68, 1·78, 1,94, 1·94 1·84 6·8Sulphate 0·94 1,019,0,966,0,966,0,815, 0·938 9·4
0,815,0,966, 1·019Chloride 0·70 0·98,0·95,0·97,1·04, 0·99 3·2
0·99, 1·01Chloride 0·35 0,60, 0,68, 0,64, 0,62, 0·62 6·1
0·60,0·57
The results show that the reproducibility is adequate for the present application, thedifference between the two chloride figures of 0·37 p.p.m. agreeing with the difference of0·35 p.p.m. in the amounts added.
CONCLUSIONS
It has been shown that the electrolyte can be extracted from capacitors with 80 percent. ethanol and good yields were obtained by three extractions, the contaminant-to-electrolyte ratio remaining constant.
The sulphate can be satisfactorily titrated in 80 per cent. ethanol by barium chloridewith Thorin indicator on a photoelectric titrator. In methanol solutions or in ethanol solutionscontaining more than 5 per cent. ethylene glycol, poor results are obtained.
The interference from glycol can be removed by evaporating the solution nearly todryness in the presence of a few milligrams of potassium carbonate and taking up the residuein 80 per cent. ethanol. The interference from the cations is removed by passage throughAmberlite IR120 resin in the hydrogen form.
The chloride can be determined by differential electrolytic potentiometry titration byelectrogenerated silver, by using the electrical conditions described above. Ethylene glycoland boric acid have no effect on the titration but in the presence of ammonium salts thenitric acid concentration must be increased from 0·001 to 0·1 N. This higher acidity causesspalling of silver chloride electrodes and plain silver electrodes are to be preferred. The

54 PRISCOTT, HAND AND YOUNG [Analyst, Vol. 91
slight surface spalling encountered was obviated by reversing the electrode polarity betweeneach determination.
The consecutive determination of chloride and sulphate has been achieved with goodresults and the reproducibility is found adequate for the present purpose.
These procedures are of general application and have been used for other determinationsof halides and sulphate at low concentration levels (the latter preferably in solutions halfsaturated with boric acid) such as sulphur in nickel alloys, residues on printed-circuit boardsand water analysis.
Acknowledgement is made to the Engineer-in-Chief of the General Post Office and tothe Controller of Her Majesty's Stationery Office for permission to publish this paper.
REFERENCES
1. Dummer, G. W. A., "Fixed Capacitors," Pitman, 1956, p. 125.2. McKnight Deely, P., "Electrolytic Capacitors," Cornell- Dubilier Electric Corpn., New Jersey,
1938, p. 68.3. Bertaloccini, R. J., and Barney, J. E., Analyt. Chem., 1958,30, 202.4. Klipp, R. W., and Barney, J. E., Ibid., 1959,31,596.5. Kemula, W., Hulanicki, A., and Janowski, A., Talanta, 1960, 7, 65.6. Fritz, J. S., and Yamamura, J. S., Analyt. Chem., 1955, 27, 1461.7. Bishop, E., and Dhaneshwar, R. G., Analyst, 1962, 87, 207.8. --, --, Ibid., 1962, 87, 845.9. Bishop, E., Dhaneshwar, R. G., and Short, G. D., in West, P. W., Macdonald, A. M. G., and
\Vest, T. S., "Analytical Chemistry 1962: The Proceedings of the International Symposium,Birmingham, in Honour of Fritz Feigl," Elsevier Publishing Company, Amsterdam, Londonand New York, 1963, p. 236.
10. Bishop, E., and Dhaneshwar, R. G., Analyt. Chem., 1964, 36, 726.Received March 2nd, 1965

SecondarySolventfront
PropyleneGlycol
EthyleneGlycol
Origin
.o,L....•••...•,. •
0'1 0'2 0'3 0'4 0'6 0'8 1'0Ethylene glycol, per cent.
Fig. 1. Chromatogram of propylene glycol containing 0 to 1 per cent. of ethylene glycol on alumina,after It hours' development.
[to face poge 55

January, 1966] SHORT PAPERS 55
SHORT PAPERS
Detection and Estimation of Ethylene Glycol in PropyleneGlycol by Thin-layer Chromatography
By H. B. S. CONACHER* AND D. 1. REES(The Lyons Laboratories, Hammersmith Road, London, W.14)
PROPYLENE glycol is used widely as a solvent for pharmaceutical purposes and flavour formulations. The limitations in the number of published specifications and their deficiencies in testingfor impurities of a glycol character have already been reviewed. l A test based on the determinationof the critical-solution temperature of propylene glycol and ether, that detects 0·1 per cent. ofethylene glycol or similar amounts of water in propylene glycol has been described. l However,as ultra-dry ether must be used, the test is not appropriate as a routine method for detecting traceamounts of ethylene glycol in propylene glycol.
Thin-layer chromatography was considered to be the most suitable technique, but the varioussystems described in the literature that claimed to separate the two glycols proved to be unsuitable. This was due either to streaking of the spots2 or to the too low R F values obtained thatresulted in little or no separation.3 A clear separation was finally obtained by modifying Knappe'ssolvent,3 by using acetic acid in place of formic acid and increasing the acid content from 3 to 6 percent. Of the various reagents recommended for detecting glycols, 2 none proved to be as sensitiveas a modification of the periodate - rosaniline hydrochloride reagent,4 that could detect 0·5 ,..gof ethylene glycol.
The method described can detect 0·1 per cent. of ethylene glycol in propylene glycol; the samelevels of glycerol can also be detected. Visual comparison of spots affords an estimation of theethylene glycol content to the nearest 0·1 per cent. (see Fig. 1).
METHODREAGENTS-
Rosaniline hydrochloride solution-Dissolve 1 g of rosaniline hydrochloride in water, and makethe solution up to 100 ml. Bubble sulphur dioxide through it for 5 minutes, and allow the solutionto stand for 30 minutes. Add some active carbon, then shake and filter the mixture. A palestraw-coloured filtrate is collected.
Periodate solution-Dissolve 2 g of sodium metaperiodate in 100 ml of water.
PREPARATION OF PLATES-
Shake 70 g of aluminium oxide G (E. Merck, obtainable from Anderman & Co. Ltd., London)with 100 ml of water for about 3 minutes, and apply the resulting slurry to glass plates (20 cmX 20 em) at an applicator setting of 500,... Allow the plates to dry in air overnight, and usedirectly.
PROCEDURE-
Prepare standard 10 per cent. w Iv ethanolic solutions of propylene glycol containing 0 to 1per cent. wIw ethylene glycol with respect to propylene glycol, and also a 10 per cent. wIv ethanolicsolution of the propylene glycol sample whose ethylene glycol content is to be determined. Spot5-,..1 aliquots of these solutions 1·5 cm from one edge of the plate, and develop with a mixtureof chloroform, toluene and acetic acid (77 to 17 to 6) for It hours in a tank lined with filter-papersoaked with the solvent mixture.
Allow the plate to dry for a few seconds, spray it lightly with the periodate reagent andafter allowing the plate to stand for about 1 minute, spray it with the rosaniline hydrochloridereagent. Propylene glycol, ethylene glycol and glycerol appear as dark purple spots about 50 mm,27 mm and 5 mm from the origin, respectively, on a pink background that slowly darkens onstanding. Examine the plate for the presence or absence of a purple spot from the sample slightlybelow the large purple spot due to propylene glycol. If a purple spot is visible, compare it visuallywith the ethylene glycol spots from the standard and estimate the amount present in the former.If a spot is also observed near the origin, this is an indication that glycerol is present.
* Present address: Department of Chemistry, St. Salvator's College, St. Andrews, Scotland.

56 SHORT PAPERS [Analyst, Vol. 91
REFERENCES
1. Middleton, G., and Stuckey, R. E., Analyst, 1950, 75, 406.2. Wright, J., Chem. &- Ind., 1963, 1125.3. Knappe, E., Peteri, D., and Rohdewald, I., Z. anal. Chem., 1963, 199, (4), 270.4. Baddiley, J., Buchanan, J. G., Handschumacher, R. E., and Prescott, J. F., ]. Chem. Soc., 1956,
2820.Received July 16th, 1965
Apparatus for the Equal Distribution of Colour Reagenton Chromatograms Used for Quantitative Work
By w. LOUWERSE
(Institute for Biological and Chemical Research on Field Crops and Herbage,Wageningen, The Netherlands)
IN order to develop a colour on paper chromatograms the paper is usually sprayed with thereagent. This method is not very useful in quantitative work, as it is difficult to distribute thesubstance uniformly. In quantitative work on amino-acid chromatograms this method gaveirregular results. To overcome the difficulty Toennies and Kolb1 pulled the amino-acid chromatogram through a solution of ninhydrin in acetone. As amino-acids are insoluble in acetone, runningis prevented. In testing this method it appeared that the colouring of the amino-acids was irregularand some amino-acids such as y-amino-n-butyric acid gave no colour at all. A better reagent is a0·5 per cent. solution of ninhydrin in a water-saturated mixture of butanol - acetic acid, 93 to 7, asused by Linskens,2 but this has the disadvantage that the amino-acids are slightly soluble in it andstart to run when the paper is too wet. This is common with the so-called "dipping" technique,in which the paper is pulled quickly through the solution.
A method for using this reagent was developed in which a uniform distribution of the reagentis achieved without running of the amino-acids. As the technique proved to be successful a briefdescription is given.
METHOD
The chromatogram is pulled between two glass rollers, about 70 cm long and 2 cm in diameter.Both rollers are covered with "tubegauz" bandage.* The lower one, C, dips in a trough, A, filled
-,.------------670----------------I7!
=====================;~}
;.
A = Glass troughB = Bearing for roller CC = Roller with bandage
Fig. 1. Diagram of the apparatus.
* The Scholl Mfg. Co. Ltd., London, E.C.1.
D = Bearing for roller EE = Roller with bandageF = Wooden frame
All dimensions are given in millimetres

lOT00
9I
82
73
64
55
46
37
28
I9
o10
-III
,H,C?O. H,OO •<,0
I.CH,. MeC-OCH,
0" -CH,NO" ~CHNO, -~CHOH, -~C-oH
,-X±~N, OR, CI, BrH-X OCOR, -CH,OHCH-oR, CH,CH(OR)" CH,(OR)" CH(OR), .....C=CH, I
C=CHCH, I
=CH':" conjugatedolefin' -..=CH- non.conjugated
=C_ terminal •X CI, Br, I, CI, CI •Y CI, Br, I, Br, IHH
'(XH -C=CH-Xt CH" CHO, COCH" CO,~H,•-C(CH,)-X OCOCH" Br, Ph, CN, C~C
C(CH,), I
·0: I I
, Q-H I.0
0,),. CH(NO,), -....CHX CI, Br ...
-CHX, CI, Br
C~~ ... ~)C=C~~ _ COOR _Ii
C,H H,C C,Ph •'Ph"'Ph' = 'H
.~~,Q ·0H
=CHXt. COOH, COCH" CHO -=CHX COCH" Br .-=CH),CO=CH),COH=CH-XtCOOH
=CH-X CHOI
x NO" CHO, COCI, CO,CH" OH, CH" CH,CI - -C=C, CI, Br, I, OCH" CH,OH_CI, Br •
pCH,-+- HC - N(CH,),0
IH
40 1'0 ,"0 ---,C'H -+- CH,Oe'H ___CH,CH=CH-C"H
1'0 I.'H - CI, CH,O, N(CH,),
P -H___ PhC-OH, __ PhSO,H ..
C(HH
(CH,),CH,=CH,=
(J(Ho H
();~
CHX,
1'0HC-O
H,C(!
HC-~CH,NROH.PhCH
Ph-C(CH,),
CH,=(CH,),-CH-CH
CH,
CH,~
1'0RC-O
RSO,H
X-PhC
CH,(NCHX=CHX,
H,C_X' -
H~=Ph
Q::PhCHPhCH(PhCH(PhCHCH,CCH,CH
OHHo-
CH,~
Fig. I. continued.

.SIH,).CH,,(CH,),CH,,(CH,),CH,(CH,).C II
H,),OR, (CH,),C(ORj" CH,C(OR), •CH,SH, (CH,j,CHSH •H,). n = 2, 3, 4, 5, 6 --C-X }_ ~ N, NOR, COOR, NR, 1-
-Lx - COel, C=C, Ph, OR ....I
I,CH
-<-xl•
-1-X _CI, Br, I I.
•-c-x1 •,CH-X _ cr, Br, I
N, R,NH
-c=c-xtCOR, CO,R •,-C=~-X _OCOR, OR •-C=C-X _C=C •
:====t HtC-<H t •, ,H1C~Hl~ ~
C(CH,j, I
,C=CH-X }_ C~O, COR; CO,R~ OCOR •••C(CH,)-X _ C=C, CN, Ph, C-C
,-X }_ CHO, COR, COPh -,-X _ COOH, COOR •-X _ CONH" SR I.0),0 I
(CH,). •j_n = 3,4,5CH, I
,N-X CH,Ph, CH,OH, CHO, Ph l-,0, (CH,),N, (CH,),S .'-
H,H-Q-H ,H-Q-H ---X}_ ~N (acyclic), ~N (cyclic sec.) •--X -iN (cyclic tert.), NHCOCH" • •
X _ NHSO,Ph, Quart. saits,NH" )CHNH, -h - I
H,Ph, PhCH, CH,Ph, (CH,),CHPh -c- I0iI
1--X CCH,=CH" CH,Br, CH,OH, CH,C
,.~~', O~'. j)H" ~CH, OH, I.H H H H
X SOR, SO,R, SO,CI, OSO,OR, SCN - ..-X } _ OH, OR, OPh --X _ OCOR, OCOPh •-X _ OCOCF; II
I
",QH" ~tH, I
0/0OH ...CH,-X_ C=C, -C'H' Br,
H,-X_ COOCH" COCH, •1 I,
-; }_ F, CI, Br, 1 • II.
•
CH,-CH,
~CH
-CHCH,PCH,CHC",
(CH,)(CH,)
H-Q-
O=C"
(CH,)CH,CRNH,
CH,
-CH
~CH
E5)CH,=(CH,)
CH,=CH
-CH
~CH
(CH,C
(CH,)
CH,
(CH,)CH,(CCH,(C
RSH.@C
CH,
-CH,
)CH
-CH,
CH,-
CH,-CH,
~CH
PhSH
QH=C
o"CH,CC
PhNHCH,
-CH,)CH-
-III
o10
I9
28
37
46
55
64
73
82
9I
lOT0'0
Fig. I.

January, 1966J BOOK REVIEWS 57
with the reagent (see Fig. 1); the upper roller, E, is filled with water, to make it heavier and sopress more tightly against the other. Both rollers are suspended on horse-shoe shaped glassbearings, Band D, so that they are free to move in a vertical direction. When the bearings andthe rollers are placed in a wooden frame, F, the two rollers, covered with the bandage, just toucheach other, while each rests in its own bearings. Further details and the exact dimensions (in mm)are given in Fig. 1. The bandages around the two rollers are evenly wetted with the reagentby a few turns and the chromatogram is pulled through. The chromatogram becomes uniformlywetted, but the amount of reagent in the paper is so small that no running occurs and the spotscan be located exactly. If the upper roller, E, is not filled with water its weight (150 g) is insufficientto ensure uniform wetting of the paper. When filled with water it weighs 250 g and gives goodresults. An extra loading up to 450 g does not affect the results. Papers other than Whatman
.No. I have not been examined for colouring and wet strength. The amount of reagent dispensedmay depend on the roller weight. but is not critical as long as the paper becomes uniformly wetted.
REFERENCES1. Toennies, G., and Kolb, J. J., Analyt. Chem., 1951,23, 823.2. Linskens, H. F., "Papierchromatographie in der Botanik," Springer-Verlag, Berlin, 1955.
Received April 27th, 1965
Characteristic Nuclear Magnetic Resonance Spectral Positionsfor Hydrogen in Organic Structures
By E. MOHACSI(Department of Chemistry, Harvard University, Cambridge 38, Massachusetts, U.S.A.)
THE table reproduced as Fig. I is proposed for quick qualitative interpretations of chemical shifts(T) relative to tetramethylsilane (u = 10 - r).
Received March 17th, 1965
Book Reviews
ORGANIC COMPLEXING REAGENTS: STRUCTURE, BEHAVIOUR, AND ApPLICATION TO INORGANICANALYSIS. By D. D. PERRIN. Pp. xii + 365. New York, London and Sydney: IntersciencePublishers, a division of John Wiley & Sons Inc. 1964. Price 90s.
Few books have provided a greater stimulus to research in the field of organic analyticalreagents than Feigl's "Chemistry of Specific, Selective and Sensitive Reactions." Published in1949, this book retains a considerable value to the research worker, but is becoming unavoidablydated, and all the subsequent, extremely interesting developments in this subject remain scatteredthroughout the literature. In commissioning Dr. Perrin to write a volume on organic complexingreagents, the editors of 'the Interscience "Chemical Analysis" series have recognised this greatdeficiency in the literature of analytical chemistry. The result is a well integrated text describingthe structure, behaviour and application to inorganic analysis of most of the significant reagentsdeveloped over the past 15 to 20 years.
In presenting the basic principles on which the application of organic analytical' reagentsdepends, the author has drawn freely on his knowledge of modern theoretical inorganic chemistryand has successfully indicated how reasoned empiricism can lead to the development of analyticallyuseful reagents. As with Feigl's classic text, the present book makes no attempt to providepractical details, but rather indicates the nature and types of reagents available for particularpurposes. To some this may prove a disappointment, but the value of the book to the analyticalchemist lies much more in its presentation of the philosophy underlying the development andapplication of organic reagents, than in any provision of procedural details of actual methods.All too often, the analyst makes use of organic reagents without fully appreciating the reactionsinvolved, and this book does much to eliminate this empirical approach to reagent chemistry.

58 BOOK REVIEWS [Analyst, Vol. 91
This interesting and stimulating book must prove indispensable not only to the seekers ofnew and more useful reagents, but also to the users of these reagents who so often are bewilderedand confused by the immense variety of apparently complex organic compounds now at theirdisposal. The recent literature has been thoroughly covered to make this a very comprehensivetext worthy of the most careful attention. Although one cannot imagine it supplanting Feigl'sbook-with its intense projection of the author's experience and personal philosophy-nevertheless, the present book goes a very long way towards providing a thoughtful and up-to-dateaccount of the subject.
In warmly commending this book to all analytical chemists, the reviewer sympathises withDr. Perrin in the concluding paragraph of his text, and offers a further quotation to stimulatethe researchers: "There is something in this more than natural, if philosophy could find it out."The perfect reagent, perhaps? WILLIAM 1. STEPHEN
COULOMETRIC ANALYSIS. By Dr.phil. KARL ABRESCH and Dipl.-Chem. INGEBORG CLAASEN.Translated by L. L. LEVESON. Pp. xii + 275. London: Chapman & Hall Ltd. 1965.Price 36s.
This is a translation of the German text of 1961 (Monographien zu "Angewandte Chemie"und "Chemie-Ingenieur-Technik" No. 71, Verlag Chemie). As there is no significant alteration,there is little to add to the review of the original edition (J. Roy. Inst. Chem., 1961,85, 365). Nomore than a dozen of the five hundred odd references are of 1959 vintage, so that the prolificliterature of the past seven years escapes attention. One additional reference (from 1959, withouta title) has been included, although this is in the form of a correction which is already coveredin the citations. One citation from a book has been replaced by the new edition, but otherwisethe bibliography is untouched, having the same abbreviations, capitalisation and non-standardjournal titles. Many English papers retain German titles, and some errors have crept in. Theappendix on historical development has been transferred to the beginning and incorporated inthe introduction. A circuit diagram of the, now classical, Booman potentiostat-integrator hasbeen inserted, without any textual explanation, and acknowledged to Verlag Chemie, althoughit is reprinted from a U.S.A.E.C. report. Many of the diagrams have been reduced in size, andsome turned sideways, because of the smaller page size, and German annotations have beentranslated, although symbols remain unaltered. The reproduction has thickened the lines of thedrawings, but is good. The tabulation of the symbols used in the text has been removed withoutdisadvantage, and some symbols have been replaced by more familiar ones. Some explanationof the LU.P.A.C. sign convention and of formal potentials (which are not further pursued) hasbeen inserted, and there are a few minor insertions and omissions, as on p. 173 where a useful,if obvious, corollary is omitted, and some changes, as on p. 11 where "polarisable" has become"polarised."
This book, therefore, gives a reasonable account of the state of the art in early 1959, whengeneration and titration efficiencies were beginning to be sorted out, background currents werebeginning to be understood, and operational amplifiers were beginning to emerge from analoguecomputers into wider fields of application. Much of it is still relevant and accurate, but much,particularly on the instrumentation side, is obsolete. As a guide to the earlier literature and tothe simpler methodology it still has undoubted value, and will be welcomed as such, but thesevere limitation of its coverage is a defect that could be overcome only by complete re-writingand a great expansion in size. As it is, it offers a careful and successful translation of a usefulshort introductory monograph on an important subject. The book is produced by photo-lithofrom a Vari-type manuscript, which no doubt accounts for its very reasonable price. E. BISHOP
INTERPRETATION OF NMR SPECTRA: AN EMPIRICAL ApPROACH. By Roy H. BIBLE, JUN., Ph.D.pp. x + 150 + folder. New York: Plenum Press. 1965. Price $12.50.
The advent of high-resolution nuclear magnetic resonance spectroscopy in the last 10 yearsas an invaluable spectroscopic technique for chemists has brought with it a steadily growinglibrary of text-books on the subject. This latest book is different in many ways from similarbooks. .As its title implies, it deals with the interpretation of high-resolution nuclear magnetic

January, 1966] BOOK REVIEWS 59
resonance spectra from a completely empirical standpoint with scarcely a mention of the theoryof the nuclear magnetic resonance phenomenon. The preface to the book states that its twomain objectives are to guide organic chemists in the interpretation of proton magnetic resonancespectra and to provide reference data to aid such a task. Within these rather limited terms ofreference the book fulfils a most useful purpose.
The book commences with a very brief discussion of the scope, limitations and applicationsof nuclear magnetic resonance and then goes on to consider in more detail the various fundamentalfeatures of proton resonance spectra. The relationship of chemical-shift values of absorption linesto electronic screening effects is dealt with, and a chart correlating characteristic chemical-shiftvalues with nuclear environments is discussed. A useful feature of the book is that a larger versionof this correlation chart is housed in a pocket on the inside back cover, thus enabling the chartto be put to everyday use. The spin-spin interaction phenomenon is discussed in very simpleterms, together with tables showing characteristic spin-coupling constant values for protons onsaturated systems, multiple bonds and aromatic systems as well as some examples of long-rangespin-spin interactions. The relationship of the coupling constant of protons on adjacent carbonatoms to the dihedral angle is also mentioned. The author then goes on to discuss the origin offirst-order spin patterns and warns against confusing bands split by spin-spin interaction withthose split by an internal chemical shift due to non-equivalence of the protons in question. Theinterpretation of some higher-order spin systems (e.g., AB and ABX types) is then dealt with.The treatment here is fairly detailed, but again quite empirical, with no mention whatsoever ofthe quantum-mechanical origins of the observed spectral patterns of such systems. The treatmentis thus necessarily superficial, but consistent with the aim of the book. It is a pity, however,that space was not found for dealing with two other commonly occurring higher-order systems,namely the AB2 and A;X; types. The book does include a brief mention of techniques useful insimplifying spectra, such as multiple resonance methods, and ends by suggesting a systematicapproach to the interpretation of all types of nuclear magnetic resonance spectra.
The book is written in a clear and lucid style and there are numerous summaries in eachchapter of the essential points in the text. This will be particularly suitable for the preparativechemist who is concerned with the essential facts of spectral analysis rather than their theoreticalorigin. Unfortunately, however, the high price of such a small book will strongly deter the organicchemist with only a slight interest in nuclear magnetic resonance from purchasing it. As thebook is specifically aimed at such people, this rather defeats its object. The book also contains.an appendix giving a suggested operating procedure for the Varian A-60 spectrometer, which is.rather out of place in a general text-book. K. G. ORRELL
HIGH-TEMPERATURE COMPOUNDS OF RARE EARTH METALS WITH NONMETALS. By GRIGORIrVALENTINOVICH SAMSONOV. Pp. xiv + 280. New York: Consultants Bureau. 1965.Price $17.50.
In this book the author discusses the data that have been assembled on the properties andpotential fields of application of these compounds which so far have received limited attention.Investigations of the solid-state reactions leading to methods of preparation are extensively covered..It is useful to find a monograph where physical properties, chemical properties and electronicand crystal structures are featured together.
The delay involved in translating the work from the Russian (and presumably for the Russianauthor's translation of Western papers) has made one or two sections out of date--particularlythat on the carbides. The author does not mention certain papers published in the period from1961 to 1964-including those conflicting with his own work.
In view of the difficulties in obtaining pure compounds of these types, a more critical approachto the early work would have been desirable. Frequent spelling mistakes and omissions (bothin the text and the references) indicate inadequate editing of the translation, whose often stiltedstyle could have been improved simply by re-phrasing the English.
The abundant data on physical properties make this work of particular interest to thetechnologist-reports in unfamiliar Soviet journals are well represented. Spedding and Daane's"The Rare Earths," 1961, and Orchneidnev's "Rare Earth Alloys," 1961, cover some of this.field, but do not attempt to be so comprehensive.
This book can therefore be recommended, mainly because there is no adequate counterpartin the Western literature. G. NICKLESS

60 BOOK REVIEWS [Analyst, Vol. 91
FORMULA INDEX TO NMR LITERATURE DATA. Volume 1: REFERENCES PRIOR TO 1961. Editedby M. GERTRUDE HOWELL, ANDREW S. KENDE and JOHN S. WEBB. Pp. xiv + 206. NewYork: Plenum Press. 1965. $17.50.
This volume contains literature references to the nuclear magnetic resonance spectra ofover 2000 chemical compounds. Compounds are arranged in order of empirical molecular formula,but structural formulae (where known) are also included. Each compound is fully referencedfor every occurrence noted in the literature. Despite the high price of the book, it can be recommended as a useful addition to the reference library of any chemistry department's nuclearmagnetic resonance spectroscopic service. K. G. ORRELL
PRDICIPLES OF REACTION KINETICS. By P. G. ASHMORE, M.A., Ph.D. Monographs for Teachers,No. IX. Pp. iv + 78. London: The Royal Institute of Chemistry. 1965. Price 7s. 6<1.
This latest addition to the RLC. Monographs for Teachers is most welcome. The serieshas been very helpful in general, although some of the volumes are "strong meat." Dr. Ashmorehas taken great trouble to make his exposition clear and lucid.
His introductory survey covers the dissociation of simple molecules and the recombinationof free atoms. The concept of activation energy is discussed in terms of the dissociation of bromineand the reaction between hydrogen and deuterium. The "transition complex" theory of Polanyiand Eyring is explained. Complex reactions are then discussed, and the difference between anintermediate species and a transition complex is emphasised. In Chapter II methods are givenfor the experimental measurements of rates, and the rate laws are established from these. Thirdorder reactions are treated in Chapter III. Examples discussed include the hydrolysis of alkylhalides, the Harcourt and Esson reaction, the reaction between bromine and bromate ions, thermaldissociation of gases, reactions between ions in aqueous solutions, and reactions catalysed bysurfaces. General reactions, for example, the photochemical hydrogenation of the halogens, areexplained in Chapter IV, and a most useful resume in Chapter V concludes the monograph.
G. VAN PRAAGH
OPTICS, WAVES, ATOMS, AND NUCLEI: AN INTRODUCTION. By EDWIN L. GOLDWASSER. Pp. xviii+ 265. New York and Amsterdam: W. A. Benjamin Inc. 1965. Price (cloth) $6.60;(paper) $4.35.
A surprisingly wide range of subject matter is collected within the scope of this book. It isintended primarily for undergraduate students in physics and engineering, and assumes a familiaritywith the principles of mechanics, electricity, heat and elementary calculus.
The book starts with a brief but effective presentation of the fundamentals of the propagationof light and geometric optics. There follows a treatment of the properties of wave motion, whichis developed through the study of waves in ropes, interference effects and resonant vibrationsin sound and water waves, to the concept of light as a transverse electromagnetic wave disturbanceand the phenomena of polarisation, interference and diffraction. A brief review of atomic structureand atomic spectra makes clear the failure of classical mechanics in atomic problems, and thisleads on naturally to the consideration of the particle nature of light, the wave properties of matter,wave mechanics, and finally nuclear structure and nuclear energy.
The book thus provides a broad view of the relationships between radiation and matter,and will be of value to students of physics and chemistry alike. C. A. PARKER
MODERN METHODS OF CHEMICAL ANALYSIS. By J. A. BARNARD and R. CHAYEN. Pp. xiv + 273.London, New York, Toronto and Sydney: McGraw-Hill Publishing Company Ltd. 1965.Price 42s. 6d.
To anyone wishing to acquire a general introduction to a selection of relatively new, andsome not-so-new analytical techniques, this book should have a special appeal.
The six main headings are Volumetric Methods, Polarography, Spectroscopic Analysis, MassSpectrometry, Radiochemical Methods and Separation Techniques, with a comprehensive list ofreferences at the end of each section. Almost half of the book, comprising the last section, dealswith chromatography, ion exchange, gel filtration and zone electrophoresis.
The book is primarily intended for students at undergraduate level; it is easy to read andis well produced. G. WOLFENDEN

January, 1966] BOOK REVIEWS 61
ADVANCES IN ANALYTICAL CHEMISTRY AND INSTRUMENTATION. Edited by CHARLES N. REILLEY.Volume 4. Pp. viii + 513. New York, London and Sydney: Interscience Publishers, adivision of John Wiley & Sons Inc. 1965. Price 120s.
Volume 3 of this series was reviewed in The Analyst (1965,90,61) and the features of Volume 4are similar to those of the preceding volume.
This latest volume, like the earlier publications in this continuing series, contains contributionsby universally recognised specialists. The subjects covered are: Recent Advances in Precipitationfrom Homogeneous Solution, Differential Dialysis, the Oxygen-flask Method, Phase-solubilityTechniques, the Electrochemistry of Cation-sensitive Glass Electrodes, Recent Advances inTime-of-flight Mass Spectrometry, and Organic Analysis with Ultraviolet - Visible AbsorptionSpectroscopy; an additional index covers the four volumes now published.
Volume 4 is up to the high technical standard of the earlier volumes, and the reviewer'sfavourable comments are equally applicable, including: "This is a book that the progressive analystshould read, but the price is likely to deter the average reader from wishing to make it a personalpossession." W. T. ELWELL
OXIDATION MECHANISM. By T. A. TURNEY, M.Sc.(N.Z.). Pp. viii + 208. London: Butterworth& Co. (Publishers) Ltd. 1965. Price 35s.
In this book, Turney gives an illustrated general account of oxidation mechanisms using asa framework a classification of reacting species rather than any of the conventional divisions ofchemistry. After a brief introduction, there are chapters on cation - cation oxidations, cationsubstrate oxidations, oxidations by cation-prOducing species, anion - anion, anion - complex andcomplex - complex oxidations, anion - substrate and complex - substrate oxidations, esterificationtype oxidations, homolytic oxidation in solution, homogeneous oxidation in the gas phase, andheterogeneous oxidations. Each class is further subdivided as required and profusely illustratedby discussion of particular reactions. In this way, if a reaction is not specifically dealt with inthe text, a pattern is provided that can be extrapolated to new situations. The coverage is comprehensive for homogeneous reactions: for heterogeneous reactions, the treatment is restrictedto reactions involving molecular oxygen, oxygen carriers, ozone and manganese dioxide, so thatelectrolytic and corrosion processes are excluded. The majority of the many references fall inthe period 1950 to 1963; none is later, but important earlier studies are not neglected. The relevanceof all this to analytical chemistry is not difficult to discover. Most of the reactions and reactiontypes considered are analytically important, and information on the actual pathway that thereactions follow cannot be other than valuable. A reaction, for example, that proceeds throughthe intermediate formation of a hydroxo complex cannot be expected to proceed in acidic mediawherein the formation of the complex is inhibited, although the over-all reaction may involveneither hydrogen nor hydroxyl ion. In such conditions, the inhibiting effect of hydrogen ion mayhave been the subject of an empirical experimental observation, but the effect cannot be appreciated without a proper mechanistic investigation, nor can proper limits be placed on the experimental conditions in the analysis unless the situation has been investigated quantitatively, that is,by the determination of rate constants. The equilibrium situation and over-all stoicheiometryof a reaction afford essential information to the analyst, but do not completely define the situation,because the mechanism and speed of the processes leading to the final equilibrium often involvefactors of even greater importance, and it is only by an appreciation of the total situation thatthe analyst can bring his processes completely under his control. Turney has provided a readysource of reference for a great many oxidation - reduction processes, in which each reaction istreated clearly, simply, non-mathematically yet quantitatively, in.a way that will be understandable even by those with no detailed knowledge of reaction kinetics. Argument is eschewed;the author gives a simple statement of the current state of knowledge of each process, and if somepoints are debatable, the unsettled issues are unlikely to affect the application to analyticalprocesses. It is, however, most unfortunate that the author adhered to the old-fashioned Americansign convention for electrode potentials. Certain other peculiarities of definition and of symbolism(not always consistent) also require an effort for assimilation, but at the very reasonable pricethis is a book that should appear on the bench or desk of all analytical chemists. E. BISHOP
THE CHEMISTRY OF THE RARE-EARTH ELEMENTS. By N. E. Topp, Ph.D., F.R.I.C. Pp. xii + 164.Amsterdam, London and New York: Elsevier Publishing Company. 1965. Price 55s.
Dr. Topp's death occurred before he had an opportunity of scrutinising the page proofs of thiswork. To quote the words of Professor P. L. Robinson, general editor of this series, "For a number

62 BOOK REVIEWS [Analyst, Vol. 91
of years the rare-earth elements had been Dr. Topp's major scientific preoccupation and perhapsthis monograph is an appropriate memorial to a life too soon brought to a close." Those who,like th.e reviewer, enjoyed the privilege of association with this gentle scientist with an acute mindwill recognise his quiet authority in his writing and be grateful to the anonymous friends who haveseen the text through the final stages. While paying due tribute to the heroic labours of the earlierworkers in this field, the author addresses himself to the task of critically appraising the currentstate of knowledge of the chemistry of elements 57 to 71 and yttrium, largely on the basis of workinitially stimulated by the occurrence of these elements in fission products and facilitated by modernseparation and purification processes. The treatment is predominantly practical and is informedthroughout by the author's own experience. Of particular interest to analytical chemists arethe chapters on separation methods-Topp's special field of work-and analytical methods, whichare excellent. The practical complexion lightens the emphasis on periodic relations within thegroup. For example, the contention that the solution chemistry of the ions is a function of increasein hydration of the ions with increasing atomic number is not argued in the text. However, asa clear, concise, up-to-date and authoritative account of the subject, this book will find a warmwelcome from all who teach, read or practise in this field. E. BISHOP
PERIODIC CORRELATIONS. By RONALD RICH. Pp. xvi + 159. New York and Amsterdam:W. A. Benjamin Inc. 1965. Price (cloth) $8.80; (paper) $4.35.
This is one of the volumes in the series of undergraduate texts presently being issued byBenjamins under the general title of "Physical InorganicChemistry." All are available in the paperback form convenient for students. The series emphasises the new systematic and fundamentalapproach to inorganic chemistry and is a valuable contribution to the literature. The presentvolume is one of the more provocative ones, and offers stimulative reading for the lecturer andthe more intelligent undergraduate who is capable of weighing things up for himself. However,lecturers should hesitate to recommend it to the moderate or dull student without concurrentexposition, lest it confuse him. The series deals with the materials under daily requisition andexamination by the analyst, and does so in a way that can only illuminate his understanding ofthem. The older chemist who came up through the old-fashioned inorganic and general chemistrygrind, and who seeks to put himself in touch with the modern approach will find profitable,interesting and entertaining reading in this series of volumes, and in this one in particular, whichare good and sound examples of the newer type of text-book. E. BISHOP
SCIENTIFIC REPORT No.1. COLORIMETERS WITH FLOW-THROUGH CELLS. A CRITICAL ASSESSMENTOF FOUR INSTRUMENTS. pp. 54. The Association of Clinical Biochemists. 1965. Price13s. 6d.
This report presents the results of a "which" hunt on four colorimeters fitted with "flowthrough" cells such as are in popular demand for clinical testing in hospital laboratories. It shouldbe noted that "flow-through" does not mean a continuous flow of sample solution, but a cell thatcan be filled (by hand) and emptied (by suction) without having to remove the sample cell from theinstrument. The instruments tested are the E.E.L. Flowthrough Spectra, the GallenkampColorimeter, the Linson 3 Photometer (Swedish) and the Unicam SPI300 Colorimeter. Twosamples of each instrument were examined, and showed surprising differences in certain respects.Within the terms of reference of the project (self-emptying cells and general applicability) theinstruments are comparable, but as colorimeters the E.E.L. is a stranger being provided with aninterference-wedge dispersive element whereas the others are filter photometers. The E.E.L.colorimeter is instrumentally similar to the others tested, but the E.E.L. spectra is perhaps morecomparable to the Bausch and Lomb Spectronic 20. However, the two testers have made amost thorough, competent, comprehensive and well planned job of the comparison and evaluationand have packed 50 pages with terse relevant and valuable information. Your reviewer has hadto conduct "which" hunts of varying complexity and depth in collaboration with his colleaguesinto the whole gamut of items from corks, bark, to stills, pilot, and balances, rough, to spectrometers, nuclear magnetic resonance, that go to equip a large research and teaching department,and his life would have been much simpler had reports of this nature been available. The contentsof the report are worth recording: List of instruments tested (with prices and specifications);Description of the instruments (a comprehensive tabulation); Operation and critical testing ofinstruments-design and appearance, infinity optical-density setting, zero optical-density setting,galvanometer (and scales), the lamp, cell carriage, wavelength selection, reserve sensitivity,Unicam light-limiting stop; Flow-through cells-critical evaluation of the different cells, possible
January, 1966] BOOK REVIEWS 63
errors in the use of cylindrical cells, criticisms, features of a good flow-through cell; Photometricerror; Reproducibility; Sensitivity and linearity-evaluated on oxyhaemoglobin, biuret protein,ammonia (Nessler), phenol, salicylate, summary; Choice of reference solution; Comparison of twosamples of the same instrument; Maintenance; Instruction booklets (oh, when will manufacturersmaster the art of writing instructions?); Faults developing during testing; Discussion and conclusions; Summary; Modifications. This does not mention the considerable amount of wisdomand experience relevant to colorimetry and colorimeters in general that ornament the reportand make it profitable reading for those who are not concerned with the primary question of"which?" Members of the Consumers' Association will notice one omission-electrical safety.There is another-the "best buy." However, with their own needs in mind, readers should havelittle difficulty in making this decision on the basis of the wealth of information provided. Theconstructive criticisms will, it is to be hoped, be duly noted by manufacturers of photometricinstruments to our future gain. E. BISHOP
PRACTICAL CLINICAL ENZYMOLOGY. By J. KING. Pp. viii + 363. London, Princeton (NewJersey), Toronto and New York: D. Van Nostrand Company Ltd. 1965. Price 75s.
As one who worshipped devotedly at the shrine of Organic Chemistry some significant fractionof a century ago, the reviewer tended to regard the biochemists' numerous calls on enzymes toexplain reactions as facile inventions to be treated with scepticism. But "tempora mutantur,nos et mutamur in illis" and a closer contact with biochemistry in later years has dissipated thescepticism. The biochemists were right-possibly more so than they themselves believed. In'the last three or four decades the reality of enzymes has been reinforced by the multiplicity oftheir isolation and have not a number of them even been crystallised, which should satisfy theorganic chemist! And apart from being the bases of hypotheses they have become practical toolsin the service of mankind, both in controlling the health of its body and to some degree also thewealth of its manufactures. This has inevitably brought enzymes within the ambit of the analyticalchemist, though from this point of view, their involvement is mostly with the clinical chemist.For the analyst, there are two aspects of interest in enzymes-their determination and their useas reagents for the determination of substrates. This volume is restricted to the former and tothe more common enzymes with clinical diagnostic value, but the methods, chosen on the basisof experience, naturally have a wider applicability.
After initial lucid chapters on the nature and kinetics of enzyme activity in which the International Union of Biochemistry classification of enzymes is summarised, there follows a separateconsideration of the measurement of enzyme activity, which, since enzyme reactions are reversibleand tend to equilibrium mixtures unless the product is removed, forms a very useful backgroundto the methods described in five subsequent chapters. The selectivity in these chapters will beunderstood when it is realised that the above classification includes 114 groups with as manyas 50 enzymes in some groups. Actually, 31 enzymes are dealt with in detail, viz., 9 dehydrogenases,6 transferases, 14 hydrolases, 1 lysase and 1 isomerase. Each chapter opens with a discussionof those characteristics of the group that have a bearing on the assay. Then follow the occurrenceand characteristics of the reactions catalysed by certain specific enzymes and a general consideration of assay methods with a detailed description of the methods preferred. This is followedby the range of normal human values, the clinical interpretation of results and a bibliography.In most instances two methods of assay are described-a rate of reaction method followed spectrophotometrically, and a colorimetric method with a fixed period of reaction.
The final chapter consists firstly of a review of the work, mostly of the last 6 or 7 years, onthe heterogeneity of enzymes and secondly, of practical electrophoretic methods of separating theconstituents of an enzyme. This gives point to the complexity of the problem of enzyme identityand consequently of its determination. Just as it was originally thought that vitamin activitybelonged to a single unique substance but was later found to be exhibited to varying degrees byrelated substances, so it has been shown that the same reaction can be catalysed by many enzymeson many substrates. Thus lactic acid dehydrogenase is separable into five components and unlessthese are separated, what is determined in an assay is not an amount of a specific substance butan amount of enzyme activity. This is a particularly valuable chapter in bringing out possiblepitfalls in interpretation.
For the clinical biochemist this volume is much more than a compendium of methods; themethods are illumined by clear expositions of their raisons d'etre. Apart from a very few typographical errors, the reviewer notes a reversal of captions to the graphs on p. 51; and erroneousformulae for glucose-6-phosphate (p. 56) and fumarate (Krehs cycle, p. 15). J. I. M. JONES
64 BOOK REVIEWS [Analyst, VOl. 91
DIE KOMPLEXOMETRISCHE TITRATION. Fifth Edition. By DR. GEROLD SCHWARZENBACH andDR. HERMANN FLASCHKA. Pp. xvi + 339. Stuttgart: Ferdinand Enke Verlag. 1965.Price (cloth) DM 53; (paper) DM 48.
The value of complexometric titration in modern inorganic analysis is well recognised, and thesubstances that were formerly known as Schwarzenbach's complexes are now commonplace andhave found a prominent place on most laboratory shelves. Although many analytical chemistsin many countries have contributed to the development of the technique, few indeed have madesuch major contributions as the authors of this new, entirely re-written edition of Schwarzenbach'soriginal book on the topic. This text bears the stamp of the excellent blend of Schwarzenbach'stheory and Flaschka's practicality, not that anyone would dispute that both authors also possessthe complementary quality in full measure. The text presents a sweeping panoramic view of thetheory and practice of the technique and reveals many new facets of the subject that will be ofinterest to most readers.
In Part I, the introductory four sections treat the essential principles of titration with complexforming substances, the nature of aminopolycarboxylic acids, the formation of complexes andtheir stability and the essential features of complexometric titration curves. The text then getsdown to business with detailed treatments of colorimetric and fluorimetric indicators and thereaction mechanism of metallochromic indicator functioning. The section on instrumental methodsof end-point detectiori is full and detailed, although one notes with some amusement that even thesedistinguished authors make the student's mistake of classifying coulometric titration (a techniqueof titration not using a burette) as an end-point detection method. An extensive survey is nextgiven of titration techniques (direct-, back-, substitution, etc.) and, finally in this first part, achapter on selectivity which deals with masking, demasking, indirect methods, etc.
Part II, consituting over 120 pages of the text, gives a monographic treatment of experimentalprocedures for each of over fifty metals and non-metals. The state of development of the techniqueis such that selected procedures of the authors' choice only are given and most readers will bepleased to have such an authoritative and definitive review of procedures and recommendationof methods for individual metals and non-metals. Undoubtedly this book is of vital importanceto all analytical chemists. It is a rare blend of theory and practice which can only enhance thereputation of analytical chemistry. The cost is moderate; the value is excellent.
English readers may be sorely tempted to buy this excellent German edition despite the factthat Professor Irving is understood to be preparing an English translation for publication in thenear future. T. S. WEST
GRAVIMETRIC ANALYSIS. Part II. By LASZLO ERDEY. Translated by GYULA SVEHLA. Editedby ILONA BUZAS. pp. xvi + 796. Oxford, London, Edinburgh, New York, Paris andFrankfurt: Pergamon Press. 1965. 120s.
This is an English translation of the original German edition previously reviewed in TheAnalyst, 1965, 90, 510.
The sub-title of the former edition, "The Determination of Metals," is missing from the titlepage and there are a few other other minor changes in the text, but none to warrant special mention.This is, as I have remarked before, a very worthwhile book, which can be recommended in thehighest terms. It will undoubtedly receive very heavy usage in all laboratories where it isfound.
Once more it is necessary to report that the binding of this Pergamon edition is very muchinferior to the original Hungarian production. It would appear to be a very short-sighted policyfor the publishers to have put such an excellent and weighty text in so flimsy a spine.
T. S. WEST
ION EXCHANGE. By FRIEDRICH HELFFERICH. pp. X + 624. New York, San Francisco, Torontoand London; McGraw-Hill Book Company Inc. 1962. Price 136s.; $17.
Those who have not already obtained a copy of this book and are likely to make an extensiveuse or study of ion-exchange reactions, would be well advised to do so. It is a most useful sourceof information on the theoretical aspects of ion exchange, and has been translated from the originalGerman by the author himself. In his preface the author mentions that there was some slightcriticism of the German edition, in that practical chemists and chemical engineers found that thebook required too great a background knowledge of mathematics and theoretical chemistry,whilst those who were interested in the theoretical aspects found that some of the explanations.
January, 1966] BOOK REVIEWS 65
of complex phenomena were too facile. As a result, Dr. Helfferich has now separated the qualitative and quantitative treatments more sharply than in the original edition. The mathematicallydisinclined reader may now omit all mathematical equations and deductions without loss ofcontinuity. The result is not entirely satisfactory, however. The main part of the text stillcovers too wide a range of theoretical aspects (even though these are not treated in great depth),without providing sufficient details of practical operation and application to satisfy those interestedprimarily in the use of ion exchangers. Those who are more concerned with the theoretical aspectsof ion exchange will find that the more theoretical sections in smaller type taken on their owndo not necessarily give them all the information that they require. They will have to consultthe sections in larger type as well, only to find, in addition, a change from a precise to a moresuperficial style of presentation.
It is therefore, unfortunately, not a book that is easy to read, but, for the research worker it isa valuable source of information on the properties of ion-exchange materials, and the theoreticalaspects of ion-exchange systems. It is to be hoped that, if future editions are being considered,the author will concentrate on presenting the theoretical aspects of ion exchange in a more uniformstyle. Those whose interest in ion exchange is relatively slight and of a strictly practical naturewould be better advised to consult other shorter monographs that are directly aimed at their needs.
The book is divided into twelve chapters of which the first four deal with the more practicalaspects of ion exchange. These chapters are entitled: Elementary Principles, Structure andProperties of Ion Exchangers, Preparation, and Capacity. The division into two levels of approachreferred to above has been kept to a minimum here, and as a consequence these are the mostreadable chapters of the whole book. Since this part could be read with profit by the beginner,it is unfortunate that in the section on Mineral Ion Exchangers in Chapter 2, the reader could bemisled into believing that the ionic sieve effect and the molecular-sieve properties of zeolites wereone and the same thing. The fifth, sixth and seventh chapters deal with fundamental propertiesof ion-exchange systems, and are entitled: Equilibria, Kinetics and Electrochemical Properties,respectively. It is these chapters that would benefit most by a more uniform style of presentation.The eighth chapter deals with the special characteristics of ion-exchange membranes, whilst inchapters nine and ten, dealing with Ion-exchange Columns and Behaviour in Nonaqueous andMixed Solvents, respectively, there is a return to a more practical aspect of ion exchange, butthe approach is still largely theoretical, and the reader will look in vain for details of operation.
The last two chapters deal with the more specialised subjects of Catalysis by Ion Exchangers,and with Electron Exchangers and Redox Ion Exchangers, respectively.
Each chapter has a fairly extensive list of references amounting sometimes to well over200 entries, and these can easily be supplemented and brought up to date by annual reviewspublished on ion exchange and from other sources. There are three useful appendices and anauthor and subject index. There is no doubt that Dr. Helfferich's knowledge of the field is extensive, as is indicated by his many contributions to it. He has done a useful job for the researchworker, and the only criticism of the book is really that he is trying to satisfy both the advancedresearch worker and the beginner in the field at the same time. J. E. SALMON
KIRK-OTHMER ENCYCLOPEDIA OF CHEMICAL TECHNOLOGY. Volume 5. CHLORINE TO COLORSFOR FOODS, DRUGS, AND COSMETICS. Edited by HERMAN F. MARK, JOHN J. McKETTA, jun.,DONALD F. OTHMER and ANTHONY STANDEN. Second Edition. Pp. xiv + 884. NewYork, London and Sydney: Interscience Publishers, a division of John Wiley & Sons Inc.1964. Price £16 ISs.; price per volume for subscribers to the complete set of 18 volumes £13.
The fifth volume of this encyclopedia follows the general pattern that is starting to emerge,following the publication of its predecessors (see Analyst, 1963, 88, 899; 1964, 89, 502, 752;1965, 90, 375). It has, however, certain distinguishing features that will appeal to British readersand to analysts in particular. The former will be glad to find more contributions from Britishauthors than. have occurred in previous volumes, because these reflect the practice and currentopinions on this side of the Atlantic. Thus, Shell Development Company and Imperial ChemicalIndustries Ltd., have provided contributors dealing with chlorocarbons and chlorohydrocarbons;and Dr. B. D. Powell of Cadbury Brothers Ltd., deals with chocolate and cocoa. Analysts willwelcome the rather more detailed and frequent analytical sections that occur in some of the presentarticles; further reference is made to certain of these below. Whether the above two features areaccidental and peculiar to this volume only, it is not possible to say, but to the present reviewerthey give it an enhanced value.

66 BOOK REVIEWS [Analyst, Vol. 91
C is an important initial letter in the chemical alphabet and consequently there are severallong articles in this volume. Chlorine (the manufacture of which was dealt with in Volume 1,under Alkali and Chlorine Industries) together with its oxyacids, salts, carbon tetrachloride,chlorohydrin and chlorophenols, occupies 338 pages, i.e., nearly 40 per cent. of the volume; it istherefore possible to give full treatment to the subject in a space of this magnitude, and fulladvantage has been taken. Coal accounts for a further 72 pages, and the various ramificationsof colour (colour and constitution of organic dyes, colorimetry, colour measurement, colour photography and food, drug and ceramic colours) occupy a further 120 pages.
The article on chlorophyll may, perhaps, be singled out for comment as of special importance,because it also covers compounds such as the rhodins and chlorins, about which there is a dearthof readily available, published information, Its scope and modernity of treatment are evidentfrom the fact that it deals with deodorising (described as "a multifaceted and growing, yet controversial field of application"); and food for space travel (interesting but speculative, since it refersto the, as yet unaccomplished, feat of reducing carbon dioxide with extracted chlorophyHs).Analysis receives 2 pages, in the course of which it is stated that in every commercial sampleexamined by the author, part of the copper content was present as the CuH ion, which could beseparated by dialysis and determined electrolytically.
Chocolate and cocoa are the subject of an excellent article (40 pages) treated with a markedmanufacturing bias. There is a section on quality control in which the pH value is recommendedas a method for evaluating the degree of alkalisation; however, in certain circumstances thismethod can prove unreliable. Chromatography is dealt with in approximately 40 pages, andanalysts will find this article useful as an introduction, particularly to the theory of the subject.However, it is developing so rapidly that most workers will probably prefer the more practicalmonographs that have been published in recent years. The principal methods are describedbriefly, including thin-layer methods, but naturally gas - liquid chromatography receives themost attention,
Chromium and its compounds are dealt with in 63 pages. An article on clays is sub-dividedinto Survey and Uses, the former being mainly mineralogical and geological in character. Thelatter includes a number of important industries, ranging from bricks to catalysts and radioactivewaste disposal. The use of kaolin to improve the quality of paper receives due attention, though,its economically more important use in the paper industry, namely as a filler to cheapen theproduction cost, is not mentioned.
Two successive articles deal with Coated Fabrics and Coatings Industrial: another exampleof the somewhat indiscriminate alphabetical use in this work of adjectives and nouns. The formercovers rubber compounds, cellulose derivatives and vinyl compounds, and briefly describes theimpregnation and surface methods. The procedure is so similar to that used for paper coatingthat the two could have been covered together, especially as the latter is dealt with in CoatingIndustrial superficially, the reader being referred to Paper Converting.
Coffee takes 15 pages, most of which refer to instant coffee and decaffeinated coffee, signs ofthe times, indeed. The economicS', technology and chemistry of the subject are summarisedusefully, and there is an imposing table of some 60 chemical compounds that have been detected
. in coffee aroma; surprisingly, they include carbon disulphide, mercaptans, and phenols.The section on colorimetry includes fluorimetry, and again, the treatment tends to be on the
theoretical side, analytical methods being referred to through the bibliography, though not dealtwith in detail. Analysts will, nevertheless, find this article a useful, if brief, survey of the fundamentals of the subject, Colour measurement is discussed in a separate article and is followed byColor Photography, Colors for Ceramics and Colors for Foods, Drugs and Cosmetics (83 pages in all).The last article is based wholly on the F.D. & C. regulations; these are given and discussed in detail.All the currently listed, certified colours are tabulated, with their chemical and trade names,manufacturing process, shade, uses, solubilities and fastness data. As the Colour Index referencenumbers are also included, this should prove useful to chemists in other countries, particularlyin Britain.
It is once again apparent that this volume maintains the high standard of those issuedpreviously and, if anything, has rather more to offer the analyst than some of its predecessors.It may be recommended with confidence and in the same terms as those of the earlier reviews.
JULIUS GRANT
January, 1966] NOTICE TO AUTHORS
Notice to Authors
67
THE Society publishes papers on all aspects of the theory and practice of analytical chemistry.fundamental and applied. inorganic and organic, including chemical, physical and biologicalmethods. Such papers may describe original work or may present in review form a criticalevaluation of the existing state of knowledge on a particular facet of analytical chemistry. Papersmay be submitted for publication by members of the Society or by non-members.
Papers and all correspondence relating thereto should be sent to the Editor of The Analyst,14 Belgrave Square, London, S.W.I.
Every paper will be submitted to at least two referees, by whose advice the Editorial Committeeof The Analyst will be guided as to its acceptance or rejection. Papers that are accepted mustnot be published elsewhere except by permission of the Committee. Submission of a manuscriptwill be regarded as an undertaking that the same material is not being considered for publicationby another journal.
Manuscript.-Papers should be typewritten in double spacing on one side only of the paper.Three copies (top and two carbon copies) should be sent to the Editor, and a further copy retainedby the author.
Title and synopsis-The title should be brief but descriptive, and must pin-point the originalfeatures of the work. All papers must be accompanied by a short synopsis of about 100 to 250words; this should give the principle of the method, draw attention to its novel features andindicate its scope and sensitivity. Contributions to the Short Papers section do not require synopses.
Proofs-The address to which proofs are to be sent should accompany the paper. Proofsshould be carefully checked and returned within 48 hours of receipt.
Reprints-Twenty-five reprints. or a maximum of fifty if there is more than one author, aresupplied gratis. Additional reprints may be obtained at cost if ordered directly from the printers,W. Hefler & Sons Ltd., Hills Road, Cambridge, at the time of publication. Details are sent toauthors with the proofs.
NOTES ON THE WRITING OF PAPERS FOR The Analyst
Manuscripts should be in accordance with the style and usages shown in recent copies ofThe Analyst.* Conciseness of expression should be aimed at: clarity is increased by adopting alogical order of presentation, with suitable paragraph or section headings.
Descriptions of new methods should be supported by experimental results showing accuracy,precision and selectivity.
The recommended order of presentation is as indicated below
(a) Synopsis.
(b) Statement of object of investigation and, if necessary, historical introduction and accountof preliminary experimental work; these need be no longer than is necessary for theunderstanding of the new material.
(c) Description of method. When working details are given, they should, if possible, be givenin the imperative mood. Well known procedures must not be described in detail.
(dl Presentation of results.
(e) Statistical analysis of results. Any statistical evaluation of results should be in accordancewith accepted practice.
(f) Discussion of scope and validity.
(g) Summary and conclusions.
Tables, diagrams, etc.-The number of tables should be kept to a minimum. Column headingsshould be brief. Tables consisting of only two columns may often be arranged horizontally. Nolines should be ruled in tables in the manuscript. Tables must be supplied with titles and be soset out as to be understandable without reference to the text.
* Rules for nomenclature in "Handbook for Chemical Society Authors 1961" (price 21s. from theChemical Society. Burlington House. London. W.l) are followed. The Shorter Oxford English Dictionaryis followed for spelling, but some words are given that Dictionary's secondary alternative spelling.

68 NOTICE TO AUTHORS [Analyst, Vol. 91
Tables or graphs may be used, but not both for the same set of results, unless importantadditional information is given by so doing.
In general, graphs should have a reasonable number of co-ordinate lines, and not only the twomain axes. The information given by a straight-line calibration graph can usually be conveyedadequately as an equation in the text.
Diagrams and graphs should be drawn in Indian ink on Bristol board, stout paper or tracingcloth, not larger than foolscap size and with at least I-inch margins all round. The use of squaredpaper should be avoided. All lettering should be inserted lightly in black lead pencil at theappropriate place in the diagram, and will be replaced by type in block-making. All lines inIndian ink should be firmly drawn and sufficiently thick to stand reduction.
Drawings should be specially prepared for submission to The A nalyst, as they cannot normallybe returned and may be modified or cut in the course of block-making.
Three sets of illustrations should be provided, two sets of which may be photographic ordyeline copies of the originals, or pencil sketches, for transmission to the referee; there is no needto prepare Indian-ink duplicates.
Photographs-Photographs should only be submitted if they convey essential information thatcannot be shown in any other way. They should be submitted as glossy prints made to give themaximum detail. Colour photographs can only be accepted when a black-and-white photographfails to show some vital feature.
Abbreviations-Normality and molarity are generally expressed as decimal fractions (e.g.,0·02 N, 0·375 M). Abbreviational full stops are omitted after the common contractions of metricunits (e.g., ml, g, JLg, mm) and after DC, OF, JL' Aand other units represented by symbols; litre andmetre, when without prefixes, are printed in full.
Abbreviations other than those of recognised units should be avoided in the text;- symbolsand formulae are not used instead of the names of elements and compounds in the text, but maybe used in addition to names when they are necessary to avoid ambiguity, e.g., to specify crystallinecomposition, as in CuSO•.5H20, to show structure or in equations.
Percentage concentrations of solutions should be stated as "per cent. wIw" (alternatively"g per 100 g"), as "per cent. wIv" (alternatively "g per 100 ml") or as "per cent. v Iv." Concentrations of solutions of the common acids, however, are often conveniently given as dilutions ofthe concentrated acids, such as "diluted hydrochloric acid (1 + 4)," which signifies 1 volumeof the concentrated acid mixed with 4 volumes of water. This avoids the ambiguity of 1: 4, whichmight be equivalent to either 1 + 4 or 1 + 3.
References-References should be numbered serially in the text by means of superscriptfigures, e.g., Mackenzie and Mitchell! or Furman,2 and collected in numerical order under"REFERENCES" and the end of the paper. They should be listed, with the authors' initials, in thefollowing form (double-spaced typing)-
1. Mackenzie, R. C., and Mitchell, B. D., Analyst, 1962, 87, 420.
2. Furman, N. H., Editor, "Standard Methods of Chemical Analysis," Sixth Edition, D. VanNostrand Co. Inc., New York and London, 1962, Volume I, p. 863.
For books, the edition (if not the first), the publisher and the place and date of publication shouldbe given, followed by the volume or page number, or both if required.
The entry of "personal communications" in the reference list is not justified; full acknowledgment of such unpublished sources should be made in the text or in the acknowledgments at theend of the paper.
Authors must, in their own interest, check their lists of references against the original papers;second-hand references are a frequent source of error. The number of references must be keptto a minimum; .