The Analyst 1961 Vol.86 No.1018
110
THE ANALYST THE JOURNAL OF The Society for Analytical Chemistry A MONTHLY JOURNAL DEVOTED TO THE ADVANCEMENT OF ANALYTICAL CHEMISTRY ..,-VOL. 86 1961 PUBLISH-Eli ·FOR ri'l BY w. HIEFFER 8t SONS, LITD. CAMRRJDGE, ENG:::..AND
-
Upload
khangminh22 -
Category
Documents
-
view
0 -
download
0
Transcript of The Analyst 1961 Vol.86 No.1018

THE ANALYST THE JOURNAL OF
The Society for Analytical Chemistry
A MONTHLY JOURNAL DEVOTED
TO THE ADVANCEMENT OF
ANALYTICAL CHEMISTRY
..,-VOL. 86 1961
PUBLISH-Eli ·FOR ri'l ~C'CI'l:').'Y BY
w. HIEFFER 8t SONS, LITD.
CAMRRJDGE, ENG:::..AND

THE ANALYST
PUBLICATION COMMITT~E
Chairman: K. A. WILLIAMS, B.Sc., Ph.D., A.Inst~P., F.R.I.C.
N. L. ALLPORT, F.R.l.C. A. L. BACHARACH, M.A., F.R.l.C. B. BAGSHAWE, A.Met., F.I.M., M.Inst.F. H. E. BROOKES, B.Sc., F.R.l.C. R. A. CHALMERS, B.Sc., Ph.D. R. C. CHIRNSIDE, F.R.l.C. B. A. ELLIS, O.B.E., M.A., F.R.I.C. W. T. ELWELL, F.R.l.C. D. C. GARRATT, Ph.D., D.Sc., F.R.l.C. C. H. R. GENTRY, B.Sc., F.R.I.C.
J. H. HA¥ENCE, M.Sc., Ph.D., F.R.I.C.
H. M. N. H. IRVING, M.A., D.Phil., D.Sc., F.R.I.C.
w. c. jOHNSON, M.B.E., F.R.I.C. J. I. M. JoNES, D.Sc., F.R.l.C. E. Q. LAWS, B.Sc., F.R.I.C. R. F. MILTON, B.Sc., Ph.D., F.R.l.C. J. G. SHERRATT, B.Sc.Tech., F.R.I.C. L. S. THEOBALD, M.Sc., A.R.C.S., F.R.l.C. D. W. WILSON, M.Sc., F.R.l.C.
AND THE PRESIDENT AND HONORARY OFFICERS
President of the Society A. J. AMos, B.Sc., Ph.D., F.R.l.C.
Ron. Secretary of the Society R. E. STUCKEY, Ph.D., D.Sc., F.P.S., F.R.I.C.
Ron. Treasurer of the Society D. T. LEWIS, Ph.D., D.Sc., F.R.I.C.
Ron. Assistant Secretaries of the Society C. A. joHNSON, B.Phann., B.Sc., F.P.S., F.R.I.C.; S. A. PRICE, B.Sc., F.R.I.C.
Editor J. B. ATTRILL, M.A., F.R.l.C.
Assistant Editor P. W. SHALLIS

THE ANALYST THE JOURNAL OF THE SOCIETY FOR ANALYTICAL CHEMISTRY
N. L. Allport A. L. Bacharach B. Bagshawe H. E. Brookes B. A. Ellis, O .B.E. W. T. Elwell
PUBLICATION COMMITIEE
Chairman : K. A. Williams
Members:
D. C. Garratt <;:. H. R. Gentry hH. Hamence J. Haslam H. M. N. H. Irving W. C. Johnson, M.B.E.
and the President and Honorary Officers
President of the Society : R. C. Chirnside
J. I. M. Jones E. Q. Laws R. F. Milton J. G. Sherratt L. S. Theobald D. W . Wilson
Han . Secretary of the Society : Han. Treasurer of the Society : R. E. Stuckey A. J. Amos
Han. Assistant Secretaries of the Society : L. Brealey; S. A. Price
Editor:
J. B. Attrill, M.A. , F.R.I.C.
14 BELGRAVE SQUARE, LONDON, S.W.I Telephone : BELcnvia 3258
Assistant Editor :
P. W. Shallis
NOTICE TO SUBSCRIBERS (Other than Members of the Society)
All subscriptions to The Analyst, including Analytical Abstracts should be sent through a Bookseller or direct to
W. HEFFER & SONS LTD., CAMBRIDGE, ENGLAND
Subscriptions are NOT accepted for The Analyst alone
Subscriptions to The Analyst, together with Analytical Abstracts printed on one side of the paper (without index), can be accepted at £8 ISs. per annum.
Subscriptions to The Analyst, together with Analytical Abstracts printed on one side of the paper (with index), can be accepted at £9 12s. 6d. per annum.
N.B .- Members send their subscr iptions to the Hon. Treasurer
Subscript ion. ~ate , inclusive of Analytic.~: Abstracts and indexes, £8 Ss. per annum, post free
Volume 86, No. 1018 •• -So - • ~ • • January 1961
2 3 .. ii;EJ. 2504

J a nuary , J!)()l ] THE ANALY ST iii
Incidental inforntation 8 Items of interest
from our laboratory notebooks
~ Simplified milk phosphatase test p-Nitrophcnylphosphoric acid, disodium salt (di-sodium p-nitrophenyl phosphate) is used as a substrate in the milk phosphatase test of Aschaffenburg and Mullen now gaining in popularity and recognition because of its s implicity and speed. (See J. Dairy Res., 16, 58 ( 1949), a nd Dairy Ind., 18, 316 (1953)). We make the reagent and can supply from stock. A suita ble Lovibond Comparator for this test is obtainable from Baird & Tatlock (London) Ltd.
~ Karl Fischer catalyst This well known method for the determination of water is widened in scope and increasedinprecision by the use of Karl Fischer Catalyst (N-ethylpiperidine)-ava ilable with instructions from Hopkin & Willia ms Ltd . Please write for instruction leaflet.
~ Uranium by spectrophotometry Our 1-(2-pyridylazo)-2-naphthol (PAN for short), already known as a metal indicator for com-plexometric titrations. (H . Flaschka and H.
Abdine, Mikrochim. Acta, 770 (1956); Anal. Abs., 4, 794 (1957)) is now described as a spectrophotometric reagent of high specificity for uranium (H . Shibata, Anal. Chim . Acta, 22, 479 (1960)).
~ Sensitive reagent for Calcium We also make di-(o-hydroxyphenylimino) ethane
(glyoxal-bis-(2-hydroxy anil)), a specific colour reagent for microgram quantities of calcium in solution. In the solid state calcium oxide can be detected in mixtures of magnesium, strontium and barium oxides.
(D. Goldstein and C. Stark-Meyers, Anal. Chim. Acta, 19, 437 ( 1958)). Its use as a complexometric indicator is described by Goldstein in Anal. Chim. Acta, 21, 339
( 1959).
The above are further examples of the great range of up-to-date reagents made available by Hopkin & Williams Ltd.
FINE CHEMICALS for research, analysis and industry
HOPKIN & WILLIAMS LTD., CHADWELL HEATH , ESSEX, ENGLAND Branches: London, Manchester, Glasgow Agents throughout U.K. and all over the world TA.~/ HW.I3

iv
LAOI/2-40
TH E AN ALY ST
Wherever platinum apparatus is usedor likely to be used-a copy of the Johnson Matthey Catalogue 1700 should be ready to hand. In it you will find details of the recognised patterns of platinum equipment for virtually every class of volumetric, gravimetric or electro-chemical operation, both macro and micro--indispensable tools, in fact, for the analyst's work.
Copies will gladly be sent free of charge, on request.
)obnson +Matthey JOHNSON, MATTHEY & CO., LTD., 73-83 Hatton Garden, LONDON , E.C.l Telephone Holborn 6989.
Vittorio Street. 8irmintham, I. Telephone: Central 800., 75-79 Eyre Street, Sheffield, I. Telephone : 29212.
[J anuary, 1061

January, 1961] THE ANALYST
Atomic-absorption Spectroscopy
Atomic-absorption spectroscopy, originally developed by Dr A. Walsh of the C.S.I.R.O., Melbourne, Australia, has certainly made its mark on the literature. We give here, as a matter of interest, some of the bibliography on the subject. We regret that we are unable to give a complete bibliography in this space or to supply reprints of these papers.
ANALYST:
Atomic-Absorption Spectrophotometry with Special Reference to the Determination of Magnesium. Allan, J. E. 83, 466 (1958)
Determination of Zinc and Other Elements in Plants by Atomic-Absorption Spectroscopy. David, D. J. 83, 655 (1958)
The Quantitative Determination of Some Noble Metals by Atomic-Absorption Spectroscopy. Lockyer, R., Hames, G. E. 84, 385 (1959)
Determination of Calcium in Plant Material by Atomic-Absorption Spectrophotometry. David, D. J. 84, 536 (1959)
Determination of Zinc in Metallurgical Materials by Atomic-Absorption Spectroscopy. Gidley, J. A. F., Jones, J. T. 85, 249 (196o)
SPECTROCHIMICA ACTA:
The Applications of Atomic-Absorption Spectra to Chemical Analysis. Walsh, A. 7, 108 (1955)
An Atomic-Absorption Spectrophotometer and its Applications to the Analysis of Solutions. Russell, B. J., Shelton, J. P., Walsh, A. 8, 317 (1957)
The Determination of Iron and Manganese by Atomic Absorption. Allan, J. E. ·Io, 8oo (1959)
A Simple Atomic-Absorption Spectrophotometer. Box, G. F., Walsh, A. 16, 255 (196o)
The Determination of Metals in Blood Serum by Atomic-Absorption Spectroscopy. 1-Calcium. 11-Magnesium. Willis, J. B. 16, 259 and 273 (196o)
NATURE:
Determination of Magnesium in Blood Serum by Atomic-Absorption Spectroscopy. Willis, J. B. 184, (4681), 187 (1959)
Some Atomic Reactions by Absorption Spectroscopy. Broida, H. P., Schiff, H. I., Sugden, T. M. 185, 759 (1960)
Determination of Calcium in Blood Serum by Atomic-Absorption Spectroscopy. Willis, J. B. I86 (4720), 249 (196o)
ANALYTICAL CHEMISTRY:
A Study of Atomic-Absorption Spectroscopy. Menzies, A. C. 33, 898 (196o)
For details of Hilger and Watts atomic-absorption equipment, please write for catalogue CH4o7fyg.
HILGER AND WATTS LTD · 98 ST PANCRAS WAY ·LONDON NW1
v

vi THE ANALYST [January, 1961
ZONE MELTING
The B.T.L. Zone Melting Apparatus, Semi-Micro Model -is developed from the original N.C.L. model
and handles quantities from 0.15g. up to about lOg.
It can be used for refining organic compounds to a very high degree of accuracy, or for concentrating impurities in samples for
analysis. Three interchangeable metal guide sleeves with heating elements are provided, to
accommodate glass tubes of 12mm, 8mm and 5mm diameter, giving maximum
temperatures of 210"C, 250 ·c and 310 uC respectively.
The apparatus is compact and easily transportable; overall size 9" x 9" x 15" high
Cat. No. C14/510. £49. 17. 6
A Macro Model handling quantities of the order of !kg. is also available,
Cat. No. C14/500. £197. 10. 0
Please send for full details of each model.
complete
laboratory
service
BAIRD & TATLOCK (LONDON) LTD., CHADWELL HEATH, ESSEX, ENGLAND.
Branches in London, Manchester and Glasgow. Agents throughout U.K. and all over the world. TAS/ BT.6S

J an uary, l!:l6 l l THE ANALYST vii
Water Analysis
SP .600 Spectrophotometer
To all laboratories whose concern is the quality control of a product where the use of water is a vital part of the process- in Brewing & Distilling, Dyeing, the Manufacture of Foodstuffs, or where the impurities in boiler feed water or effluent must be accurately assessed - the analysis of the many organic and inorganic compounds m water is essential.
The Unicam SP.6oo Spectrophotometer is a precise economical means of maintaining a rigid standard and of avoiding needless waste. The SP.6oo will give accurate information quickly; it is simple to operate and its cost is comparatively low.
UNICAM SP.600 For full inf ormation on the SP.6oo please write ro
UNICAM INSTRUMENTS LTD ARBURY WORKS CAMBRIDGE

Vlll THE .-\Ni\LYST [January, 1961
DE R R IT RO~l.:?c!!uil/{~ ROUP BEME TELECOMMUNICATIONS LTD BEULAH ELECTRON ICS LTD
CHAPMAN ULTRASONICS LTD DORAN INSTRUMENT CO. LTD ELECTRONIC VIBRATORS LTD L.S.B. COMPONENTS LTD RESLOSOUND LTD
FOR T.V. MICROSCOPY with NEW
low priced
light weight
T.V. camera
using ordinary
T.V. Receivers 0.800 Even the smallest laboratory, as well as the largest, m ay now have the advantage of T.V. Microscopy with the Beulah 0 .800. The Beulah D .SOO Camera can be used with any standard T .V . Receiver; its sensitivity is such that just ordinary room lighting is all that is needed to obtain excellent pictures. For special applications, the camera can be supplied with ultra-violet or infra-red sensitive tubes. A further important feature of the Beulah D.800 is the facility to feed up to 20 T.V. receivers,
THE BEULAH CAMERA 0 .800 will be demonstrated on
Doran Instrument
STAND No. 110 at the Physical Society Exhibition
and to cover distances up to 4,000 feet. The Beulah Camera D.800 measures only 12" x 7" x 6" and weighs approximately 14 lbs . Write for an illustrated brochure which gives full details and specifications. * Demonstrations
gladly arranged price 225 gns.
BEULAH ELECTRONICS L TO <ales enqumcs for all compame< 24 UPPER BROOK ST · MAYFAIR LONDON WI PHONE HYDE PARK 2291
Oal61A

J anuary, 1961] THE ANALYST
Electrolytic
Conductivity
Supervision
The RC4 controller and
measuring bridge continu-
ously monitors the quality of refined waters and
aqueous solutions. It automatically actuates alarms,
or other electrical devices, when the concentration
deviates beyond a prescribed level, which may
be readily preselected within a wide range of
conductance.
The instrument is used with a measuring cell
from the ELECTRONIC SWITCHGEAR patented
range of indestructible cells which
have precise electrical constants
and require no maintenance.
Literature upon request
ix
THE .-\ ~ALYST [January, 1961
Second
Conference on
X-Ray Analytical methods
A conference will be held on X-Ray Analytical Methods
in conjunction with the Department of Geology at The
University, Manchester, from Monday, 2oth March to
l~riday, 24th March, I g6 I, inclusive. This year the con
feren:e will discuss and evaluate the latest techniques and
instrumentation of X-Ray Fluorescence Analysis. An ex
tensive range of modern equipment will be available lor
demonstrating the principles of these methods over a wide
field of applications.
Full information concerning the conference together with
details of registration fees etc. may be obtained from the
Conference Secretary at Research & Control Instruments
Limited, Instrument House, 207 King's Cross Road, W.C.1,
to whom all enquiries and applications shou ld be addressed .
RESEARCH & CONTROL INSTRUMENTS L TO
INS7RL'MENT HOUSE· ""7 KIN G'S CIWS.\' /WAD · LON DON W.C.r l'llONE: Tli RMINU.\' 2877

January, l!Wl ] THE ANALYST
• .. . ••• • • • •
• But my dear chap, • • • • • • • •
• all the best people •
•
•
use Oertling
nolNadays
• • • • • • • •
•
0
• •
For speed, precision
and long life, Oertling
riderless micro-balances
are to-day the world standard
by which others are judged. They are backed by
a maintenance service which is also the finest
available. In the complete range,
sensitivities run from 0.02 mg.
to 0.002 mg. per division,
direct reading.
Have you sent for the latest catalogue?
Cfll@lliD MICRO-BALANCES
L. Oertling Ltd., Cray Valley Works, Orpington, Kent
Telephone: Orplngton 25771
• •
Overseas agents in Australia , Brazil , Canada, Holland, India, Pakistan, Union of S. A( rica and U.S.A. provide sales and service. Enquir ies should be sent in the first place to Head Office at the address above.
TAS/OR4::1
Xl
Xll
T E L E
TH E ANAL YST
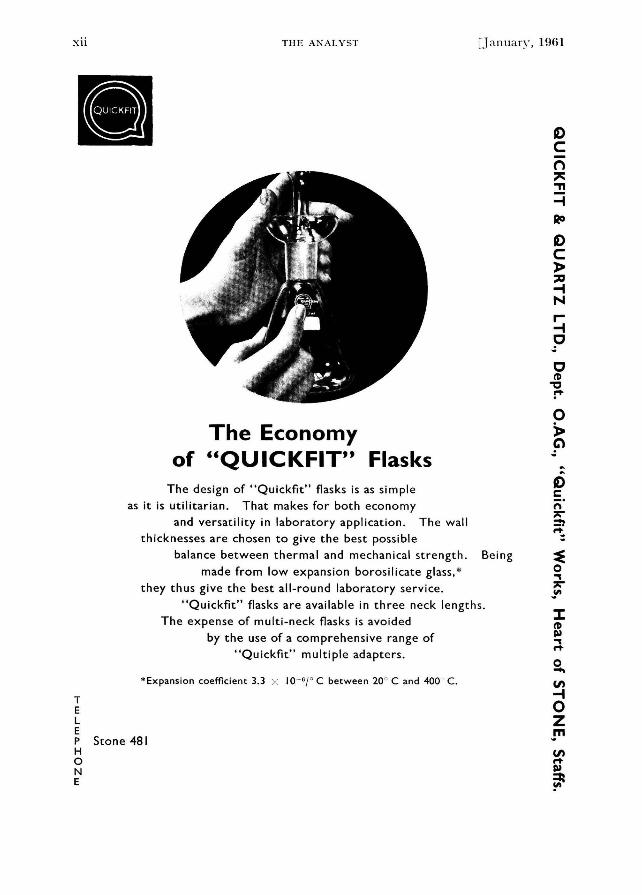
The Economy of "QU ICKFIT" Flasks
The design of "Quickfit" flasks is as simple as it is utilitarian. That makes for both economy
and versatility in laboratory application. The wall thicknesses are chosen to give the best possible
[Ja nuary , 1961
balance between thermal and mechanical strength . Being
made from low expansion borosilicate glass, * they thus give the best all-round laboratory service.
"Quickfit" flasks are available in three neck lengths. The expense of multi-neck flasks is avoided
by the use of a comprehensive range of " Quickfit" multiple adapters .
*Expansion coefficient 3.3 >; I 0- 6 / ° C between 20° C and 400 · C.
P Stone 481 H 0 N E

January , l!Wl ] THE ANALYST
ELECTRODES FOR
xiii
EMISSION SPECTROGRAPHY
High purity
Rods- in 6 grades
Preformed electrodes
Silver and iron comparison electrodes
Discs · Powder
Catalogue on request
* IMMEDIATE DELIVERY
from
Mining & Chemical Products Limited 86 STRAND, LONDON, W.C.2 Tel: COVent Garden 3393
and
70-76 ALCESTER ROAD SOUTH, KINGS HEATH,
BIRMINGHAM 14 Tel: HIGH BURY 2281

xiv THE ,\NALYST i.January, 1 !lfil
For critical analytical work, do you
prefer your reagents to a strict
specification, or with an actual analysis~
We can often provide a choice. The
specifications are stl'ingent and the actual
analyses independently confirmed.
• Further information and quotations from:
THE GENERAL CHEMICAL & PHARMACEUTICAL CO. LTD.
Judex Works, Sudhury, Wembley, Middlesex

JANUARY, 1961 Vol. 86, No. 1018
THE ANALYST PROCEEDINGS OF THE SOCIETY FOR ANALYTICAL CHEMISTRY
NEW MEMBERS
ORDINARY MEMBERS
George David Adams; Charles Barry Chilton; Robert Barrie Christie, M.P.S.; John Davenport Cox, M.B.A.C.; Fran~ois Custot, lng.Chim., E.S.P.C.I.; Joseph John Dickerson; Jean Pickering Dixon, A.R.I.C.; Peter John Grey; Mohammed Hasan, B.Sc. (Lucknow), M.Sc. (Sind); Bernard Illingworth, A.R.I.C.; Gordon Frank Kirkbright, B.Sc. (Birm.); Ian McLauchlin, B.Sc. (Lond.); WoHgang Moser, B.Sc .. (Lond.), A.R.I.C.; RudoH Pfibil, D.Nat.Sci., D.Chem.Sci.; Ronald Charles Rooney, A.R.I.C., A.C.T. (Birm.); Philip Arthur Tice, B.Sc. (Lond.), A.R.I.C.; David Ian Williams; Vejdet Oktekin Yahya.
JUNIOR MEMBERS
Douglas Brian Adams, B.A. (Oxon.); Ramesh Gopal Dhaneshwar, M.Sc. (Poona); Brian Kipling; Glyn David Short.
DEATHS
WE record with regret the deaths of Arnold Lees James Whitson Paterson Hans Baggesgaard-Rasmussen William Herbert Simmons Thomas Tickle.
NORTH OF ENGLAND SECTION
A JOINT Meeting of the North of England Section and the Newcastle upon Tyne ancl North East Coast Section of the Royal Institute of Chemistry was held at 6.30 p.m. on Wednesday, November 23rd, 1960, in the Chemistry Department, King's College, Newcastle upon T)'ne, l. The Chair was taken by the Chairman of the Newcastle upon Tyne and North East Coast Section, Dr. K. H. Jack, M.Sc., F .R.I.C.
The following paper was presented and discussed: "The Changing Aspect of Chemical Analysis," by H . N. Wilson, F.R.I.C.
AN Ordinary Meeting of the. Section was held at 2.15 p.m. on Saturday, December 3:rd, 1960, at the City Laboratories, Mount Pleasant, Liverpool, 3. The Chair was taken by the Chairman of the Section, Dr. J. R. Edisbury.
The following paper was presented and discussed: "Experiences in the Estimation of Some Elements in Foodstuffs," by H. Pritchard, M.Sc., F.R.I.C.
1

2 PROCEEDINGS [Vol. 86
WESTERN SECTION A jOINT Meeting of the Western Section and the Cardiff and District Section of the Royal Institute of Chemistry was held at 7 p.m. on Wednesday, December 7th, 1960, at the College of Technology, Allt-yr-yn, Newport. The Chair was taken by the Chairman of the Western Section, Dr. G. V. James, M.B.E., M.Sc., F.R.I.C.
The following paper was presented and discussed: "Radioactivity in Relation to Water Supplies," by F. P. Hornby, B.Sc., F.R.I.C.
MIDLANDS SECTION AN Ordinary Meeting of the Section was held at 6.30 p.m. on Tuesday, December 13th, 1960, in the Sale Room, Regent House, St. Philip's Place, Birmingham, 3. The Chair was taken by the Chairman of the Section, Dr. S. H. Jenkins, F.R.I.C., F.Inst.S.P.
The following paper was presented and discussed: "The Analysis of Waters Used in Industry," by K. B. Coates.
An Ordinary Meeting of the Section was held at 7 p.m. on Thursday, December 15th, 1960, at the College of Technology, Burton Street, Nottingham. The Chair was taken by the Chairman of the Section, Dr. S. H. Jenkins, F.R.I.C., F.Inst.S.P.
The following paper was presented and discussed: "The Development of the Analytical Balance," by K. M. Ogden.
MICROCHEMISTRY GROUP THE twenty~seventh London Discussion Meeting of the Group was held at 6.30 p.m. on Wednesday, December 14th, 1960, at "The Feathers," Tudor Street, London, E.C.4. The Chair was taken by the Vice-Chairman of the Group, Mr. C. Whalley, B.Sc., F.R.I.C.
The discussion took the form of a Review of Topics in Organic Micro-Analysis.
PHYSICAL METHODS GROUP THE Sixteenth Annual General Meeting of the Group was held at 6.30 p.m. on Tuesday, November 22nd, 1960, in the Meeting Room of the Chemical Society, Burlington House, London, W.l. The·Chair was taken by the Chairman of the Group, Dr. G. W. C. Milner, F.R.I.C., A.Inst.P. The following ,appointments were made for the ensuing year: Chairman -Dr. G. W. C. Milner. Vice-Chairman-Dr. W. Cule Davies. Hon. Secretary and Treasurer -Dr. T. L. Parkinson, Product Research Division, Beecham Foods Ltd., Beecham House, Great West Road, Brentford, Middlesex. Members of Committee-Messrs. ]. Allen, T. R. Andrew, A. T. S. Babb, D. R. Curry and H. Liebmann. Dr. D. C. Garratt and Mr. C. A. Bassett were re-appointed as Honorary Auditors.
The Annual General Meeting was followed at 6.45 p.m. by the Seventy-fourth Ordinary Meeting of the Group. Dr. G. W. C. Milner, F.R.I.C., A.Inst.P., was in the Chair and the subject of the meeting was ''Atomic Absorption Spectroscopy." The following papers were presented and discussed: "Some Factors Affecting Performance in Atomic Absorption Spectroscopy," by R. Lockyer, B.Sc., F.R.I.C.; "The Flame as a Source of Atoms," by C. A. Baker, M.A., D.Phil.; "The Application of Atomic Absorption Spectrophotometry to Metallurgical Analysis," by W. T. Elwell, F.R.I.C., and J. A. F. Gidley, B.Sc., A.Inst.P. (for summaries of these papers see Analyst, 1960, 85, 461).

January, 1961) MACDONALD: THE OXYGEN FLASK METHOD. A REVIEW
The Oxygen Flask Method A Review*
BY A. M. G. MACDONALD (Department of Chemistry, The University of Birmingham, Edgbaston, Birmingham 15)
SUMMARY OF CONTENTS
Introduction History of the method Apparatus and general method Absorption solutions and methods of completion
Chlorine Bromine Iodine Sulphur Fluorine Phosphorus Arsenic Boron Metals Carbon
Conclusions
ORGANIC elemental analysis has been virtually revolutionised in the past 5 years by the application of the oxygen flask method of decomposing organic materials. For rapidity and simplicity the method could scarcely be bettered, and one of its principal attractions for routine work is that untrained technicians can obtain ex~ellent results after little practice. The technique has had a rather chequered history in that it was examined on several occasions at the tum of the century, but was then almost forgotten until its revival in 1955. Since then, a large and in some respects unnecessary amount of literature has accumulated until, at the present time, numerous procedures are available for determining halogens, sulphur, phosphorus, arsenic, carbon, boron and several metals ! in organic materials.
HISTORY OF THE METHOD In 1892, Hempel1 introduced the technique for the macro-determination of sulphur in
coals and organic materials as an improvement on the Berthelot bomb method. . The sample was placed in a platinum-gauze basket suspended from the stopper of a 10-litre flask and was ignited by means of an electrical current after the flask had been filled with oxygen; eventually, the sulphate formed by oxidation with bromine water was determined gravimetrically as the barium salt. Graefe' modified Hempel's method slightly and seems to have been the first to realise that filter-paper or cotton thread provides an excellent fuse, whether ignition is initiated electrically after the flask has been sealed or in a flame before the stopper is inserted. In 1910, the technique was used for determining halogens by Marcusson and Dascher,1 who applied a gravimetric finish as silver halide. Twelve years later, Votoce~ suggested that, for the determination of chlorine, a titrimetric finish with mercuric nitrate solution in presence of sodium nitroprusside indicator would be more suitable, and there the matter_ rested for 30 years~ / Other early applications included determinations of fluorine in gases (see p. 8) and traces of sulphur in liquids (see p. 7).
Mikl and Pech11 resuscitated the procedure for the semi-micro determination of halogens and sulphur for routine control purposes with a mercurimetric or alkalimetric finish. Pra.Zak, Bene and Bartusek8 used a polarographic finish for the routine semi-micro analysis of vinyl chloride polymers.
Schoniger7 then examined the combustion method for micro-analysis and showed that results as accurate as those of the conventional methods could be obtained. His procedures are described, together with later developments, in the subsequent sections. The combustion procedure has become known, particularly in American papers, as the Schoniger method, but the earlier history outlined above indicates that it is more rightly called the oxygen flask method; the latter designation is therefore used here.
• Reprints of this review paper will be available shortly. For details, please seep. 80.

4: MACDONALD: THE OXYGEN FLASK METHOD. A :REVIEW [Vol. 86
APPARATUS AND GENERAL METHOD
The simplest apparatus7 consists of a conical flask fitted with a ground-glass stopper or air-leak, into which is sealed a length of platinum wire. To the end of the wire is attached an oblong of platinum gauze, which acts as a hinge to clamp the sample container (see Fig. 1 a). The sample is weighed on to a piece of filter-paper (Fig. 1 b), which is carefully folded and then clamped, with the fuse protruding, into the gauze, which has been previously heated to ensure complete dryness and then cooled. The flask is then charged with a suitable absorption solution and flushed with a fast flow of oxygen for a few seconds. The fuse is ignited in a flame, and the stopper is immediately inserted into the flask, which is simultaneously inverted so that the absorption solution forms a seal round the stopper. Combustion is complete in a few seconds, and the pressure exerted makes it essential to hold
(b)
Fig. I. (a) Combustion flask; (b) filter-paper used for wrapping sample
the stopper and flask firmly together. The flask is then shaken for about 10 minutes, or for 3 or 4: minutes after the cloud of combustion products seems to have disappeared (alternatively, it can be left on the bench for upwards of 1 hour) to ensure complete absorption. After the combustion, the pressure in the flask rapidly drops, owing to absorption of carbon dioxide. The stopper is removed and rinsed, together with the gauze and wire; the solution is then ready for analysis by some suitable method.
The shape of the flask or bottle does not matter very much so long as combustion can proceed without the flame touching glass. The size used depends on the amount of sample taken for the analysis. A 250- or 300-ml Erlenmeyer flask is satisfactory for the combustion of up to 25 mg of sample, a 500-ml flask for up to 50 or 60 mg7 and a 1-litre flask for up to about 150 mg.8 The larger the flask, the larger the amount of material that can be completely burned. Some workers prefer to use an iodine flask instead of an ordinary Erlenmeyer flask. Combustion may also be carried out in a separating funnel, which is advantageous if the solution has to be transferred for the final determination (personal communication from Mr. G. Ingram).
The length of the platinum wire depends on the size of the flask and should be adjusted so that the sample is situated at or near the centre of the flask during combustion. The simplest arrangement can be constructed from a standard-joint air-leak cut to the appropriate length, into which 4 to 5 em of platinum wire are sealed. This economises in platinum and gives to the assembly a rigidity not obtained when a longer piece of wire is fused into a flask stopper. The wire should be strong enough to withstand much shaking and heating; wire of 0·5 to 1 mm diameter is suitable.
The mesh of the platinum gauze should be such that oxygen is allowed free access to the sample, although no unburned particles can drop through it; the wire of the mesh should not be so thick that much heat is removed from the combustion zone. Commercially available

January, 1961] MACDONALD: THE OXYGEN FLASK METHOD. A REVIEW 5
36-mesh gauze is suitable for general purposes. For micro-analysis, an oblong of gauze, 1·5 em x 3 em, spot welded to the wire along the central line suffices for the sample support; slightly larger oblongs are desirable for larger samples. A platinum-wire spiral may replace the gauze hinge,9 but much more trouble is then caused by sample losses during ignition. Other metals are not recommended for use in place of platinum, which seems to exert a catalytic effect on the combustion.8 A platinum cup of depth linch and diameter y\ inch has been used as sample support in the analysis of oils.10 Archer11 places the sample on a platinum-foil platform supported by glass rods, but has ocasionally obtained residues of carbon, which indicate incomplete decomposition. Such residues (and low results) often occur when the hot flames touch cold glass surfaces.
Filter-paper is generally used to contain the sample and is satisfactory for all solid materials. Suitable papers of low ash content are Schleicher and Schull No. 58!}6 or 15757
or Whatman No. 44 or 54. For micro-analyses, a square of side 2·5 to 3 em with a fuse of length about 2·5 em is sufficient. Cigarette paper may be used,8 •12 and consumes less oxygen in its ignition, but it has a smaller effect as a combustion accelerator and a higher ash content than filter-paper, and variable blanks are obtained in some methods; Rizla rice-paper seems to have the smallest ash content and the most consistent blank values.8 Very thin polythene sheeting8 or cellulose sheeting11 is an excellent substitute for filter-paper, which is, however, satisfactory for routine work. A cup with tabs cut from a Whatman 10-mm x 50-mm extraction thimble is suitable for holding about 100 mg of oils.10
Containers for liquid samples have been a source of controversy. Schoniger7 weighed liquids of boiling-point greater than 100° C in glass capillaries blown out to a thin-walled bulb in the middle, which were then wrapped in paper and crushed just before the ignition. Bennewitz18 claims that the heat of combustion serves to burst the thin bulb and that volatile liquids of boiling-point 63° C can be analysed in this way, However, there is some danger of unburnt material remaining in the capillary, hence most workers have preferred an organic container. Gelatin capsules are suitable for most liquids boiling abov~;: 100° C, and those made by Parke, Davis and Co. Ltd. (size No. 5) give small and constant, or negligible, .blanks in all determinations. Methylcellulose capsules are also useful.
Liquids of lower boiling-point, e.g., carbon tetrachloride or disulphide, can be burned effectively in containers made from a.dhesive cellulose tape with a filter-paper lining12·u; the tape is formed into a small pocket, the sample is injected on to the inner paper, and the pocket is then sealed and re-weighed. Kirsten15 analysed similar liquids in capillaries made from polyethylene surgical tubing of outer diameter 1·14 mm containing a little cottonwool; after the sample has been injected, the tube is sealed with the aid of a soldering iron lightly greased with silicone grease. In both these methods, a paper fuse is attached to the container.
A few workers have preferred to use electrical ignition systems, in which the paper fuse of the sample container is ignited by means of a small heating coil8 •18 or a firing spark from an H.F. Tester17 after the apparatus has been put together. This is reputed to have the advantages that thermally unstable compounds can be ignited in an enclosed system and that combustion can be initiated by remote control from behind a safety screen. However, if the ignition is properly begun by the usual method, no heat reaches the sample until the stopper has been inserted; and, although several authors have recommended the use of a safety screen, any report of an actual explosion has yet to appear, despite the fact that a very large number of these combustions must have been done by now. The combustion of samples can certainly be spectacular,' but the operation is quite safe, even in wholly inexperienced hands. It seems that the einly real utility of electrical ignition lies in the determination of carbon (seep. 10), for which it is essential to ignite the sample alone; otherwise it seems a needless complication.
ABSORPTION SOLUTIONS AND METHODS OF COMPLETION
In the subsequent paragraphs, any difficulties encountered in the combustion, the methods of absorption of the products of combustion and the multitudinous procedures for completion are reviewed for each of the elements so far determined.
CHLORINE-
No peculiar difficulty is found in the combustion of chlorinated materials. Mikl and Pech5 suggest that compounds containing little hydrogen can be advantageously mixed

6 MACDONALD: THE OXYGEN FLASK METHOD. A RJ£VIEW [Vol. 86
with some paraffin wax before combustion. For micro work in particular it is essential to observe scrupulous precautions against the introduction of chloride from the fingers, and blanks must always be determined.
In early semi-micro methods'·6 •6 water alone was used as absorbent, but Schoniger7
found it necessary to use 10 ml of approximately 0·2 N potassium or sodium hydroxide with 3 drops of hydrogen peroxide for complete absorption on the micro scale. Most workers have followed these recommendations, but others11 •17 have preferred an alkaline bisulphite solution; an ammoniacal peroxide solution has also been used.18 A wide variety of materials can be analysed satisfactorily on the micro scale after absorption of the products of combustion in dilute hydrogen peroxide (4 to 5 drops of 100-volume solution in 10 ml of water); a proportional increase in amounts is necessary for semi-micro work.8 This has the advantages that an alkalimet!ic titration is applicable if no other acid-forming element is present and that it is much simpler to neutralise the solution or remove carbon dioxide if such steps are required in the subsequent analysis. It seems unnecessary even to have peroxide present; its purpose is to reduce any chlorine or hypochlorite formed, but such formation is improbable because of the large amount of hydrogen available for forming hydrogen chloride from the combustion of the paper. Satisfactory results are readily obtained on the micro scale after absorption in water alone (personal communication from Mr. P. Gouverneur, Koninklijke- Shell Laboratorium, Amsterdam, The Netherlands). Corner finds it necessary to add carbon to the alkaline absorption solution.12 Kirsten15 recommends absorption in 4 ml of water, 1 ml of 5 N acetic acid and 1 ml of 2·5 per cent. sodium nitrite solution for semi-micro work.
Many methods of completion have been proposed in the literature. Schoniger7 uses the Viebock titration involving mercuric oxycyanide; a modified comparison titration19 based on the same reaction gives more successful results. Direct argentimetric titrations with Variamine blue B20 or dichlorofluorescein21 as indicator and the indirect Volhard method22
have been applied. Titration with 0·004 N silver nitrate in non-aqueous media in presence of dithizone as indicator has been reported.11 Potentiometric end-point detection has been recommended,12 •15 and this procedure lends itself well to automatic titraticSn in the analysis of polymers and plasticisers.17 •23 Coulometric titration with electrolytically generated silver ions is also possible.24 A polarographic method has been suggested for the routine control of vinyl chloride polymers.6 Lysyj18 has applied a spectrophotometric method based on the reaction of chloride with mercuric chloranilate.
Instrumental finishes involving transference of the absorption solution, as do all the procedures mentioned above, remove one of the attractions of the original oxygen flask method, i.e., the absolute exclusion of possible losses by transference of solutions. It will remain a matter of opinion whether greater personal error arises from transference or from the detection of visual titration end-points. The visual argentimetric end-points are poor on the micro scale, and there has been a revived interest in direct mercurimetric titrations. Diphenylcarbazide25 and diphenylcarbazone26 have been used as indicators with 0·05 N and 0·01 N mercuric nitrate or perchlorate as titrant in aqueous media. Cheng27 suggests that the titration in the presence of diphenylcarbazone can beneficially be carried out in 80 per cent. alcoholic media; this results in a striking improvement in the end-point. This method, which is to be recommended, involves absorption in alkaline peroxide solution, rinsing with 10 ml of water, removal of peroxide by boiling, addition of 80 to 100 ml of ethanol or isopropanol, neutralisation with 0·5 N nitric acid to bromophenol blue indicator and addition of 1 ml of acid in excess to give a pH of 3·5; 15 drops of ethanolic 0·5 per cent. diphenylcarbazone solution are added, and the solution is titrated with 0·01 M mercuric nitrate in aqueous 0·005 N nitric acid. A shorter and also satisfactory procedure is to absorb in aqueous peroxide solution, ·rinse the stopper and gauze, add 40 ml of alcohol and then indicator and titrate immediately8 ; removal of peroxide is not necessary in mercurimetric methods, and the amount of acid formed in the combustion of most organic compounds is sufficient to give a suitable pH. Both these titrations are non-stoicheiometric, but are satisfactory over .a sufficiently wide range with an empirical standardisation. They can be used in the presence of nitrogen, sulphur, phosphorus and fluorine; neither is suitable for semi-micro work.
In conclusion, the mercurimetric titration in alcoholic medium is excellent for micro work, but, if a wider range is essential or if transference errors are considered the lesser evil, the potentiometric argentimetric titration is ·to be preferred.

January, 1961]
BROMINE-
MACDONALD: THE OXYGEN FLASK METHOD. A REVIEW 7
The products of combustion are usually absorbed in the alkaline peroxide mixture mentioned above. Practically all the methods of completion used for chlorine can also be applied to bromine. Again, Cheng's method is useful, but the conversion factor is less satisfactory than that for chlorine. Probably the best method for bromine is that based on oxidation with hypochlorite,28 in which the six-fold amplification factor assists accuracy. Sch0niger7 applies this procedure, absorbing in the phosphate-buffered hypochlorite solution and titrating iodimetrically after boiling carefully and removing the excess of oxidant with sodium formate. Nitrogen, phosphorus, sulphur, fluorine and chlorine do not interfere, but iodine is determined simultaneously.
IoDINE-
The products of combustion (mainly iodine with some iodate) are best absorbed in 5 to 10 ml of 1 or 2 N sodium hydroxide, and the Leipert bromine-oxidation method is then applied.7 The end-point of the final iodimetric titration is better if no acetate buffer is added for the bromine-oxidation stage.19 There is unexpected unanimity in the literature on the basic merits of this virtually specific method for iodine.
SULPHUR-
The oxygen flask method is remarkably well suited to the determination of sulphur and is capable of decomposing materials, such as cysteine and methionine, that are difficult to decompose by classical techniques. The products of combustion are absorbed in aqueous peroxide solution. For micro-determinations, 3 to 5 drops of 100-volume hydrogen peroxide in 5 to 10 ml of water is the optimum amount; use of less causes incomplete oxidation of sulphur oxides to sulphate, whereas more may cause some formation of persulpl}ate.29 The amounts are simply doubled for semi-micro work.
If no other acid-forming element is present, direct alkalimetric titration is satisfactory,6 •7
and chlorine and sulphur can be determined simultaneously if the titration of total acidity is followed by a mercurimetric titration6 or the Viebock method7 for chloride.
Alternative procedures that have been superseded by better methods or are generally unattractive involve gravimetric determination as barium sulphate,1 •9 conductimetric titration with barium chloride,30 amperometric titration with 0·01 N lead nitrate,31 titration with 0·01 N barium chloride in presence of tetrahydroxyquinone indicator32 and visual7 or potentiometric33 methods involving use of barium and ethylenediaminetetra-acetic acid (EDTA). Several of these procedures9 •81 ,32,ss require prolonged evaporation of the absorption solution. Schoniger originally used a barium - EDT A method, 7 but later preferred titration with barium perchlorate in presence of thorin indicator,34 a procedure first applied after the oxygen flask method of decomposition by Wagner29 and which has since attracted much attention.
In this method, sufficient ethanol or isopropanol to give an 80 per cent. solution is added to the absorption solution, together with thorin indicator lightly screened with methylene blue, and the mixture is titrated with a suitable solution of barium perchlorate in 80 per cent. ethanol adjusted to pH 2·5 to 4. It is not necessary to remove peroxide, and the solution should not be neutralised before the titration because the sodium ions thus introduced would interfere. The end-point is indicated by a sharp change from pale yellow to pale pink; this change is not very distinct, and some workers prefer to evaporate the aqueous absorbent to 5 ml before adding alcohol to avoid dilution effects.35
The titration can be used without modification in the presence of chloride and bromide in the amounts arising from organic compounds. Sulphur and chlorine have been determined simultaneously by titrating the chloride argentimetrically after evaporation of the alcohol.20 The latter step can be eliminated if dichlorofluorescein indicator is used in conjunction with silver perchlorate for the second titration.21 Iodine should be at least partly removed by boiling before the addition of alcohol because of its screening effect. Interference from fluoride is avoided simply by adding about 100 mg of boric acid to the absorbent. a Contrary to published results,35 the method is not satisfactory in the presence of phosphates (previously mentioned personal communication from Mr. P. Gouverneur). Alkali metals in the amounts arising from organic compounds do not interfere.
It is mainly from this titrimetric method that information on the behaviour of organic

8 MACDONALD: THE OXYGEN FLASK METHOD. A REVIEW [Vol. 86
nitrogen in the combustion can be derived. It has been repeatedly confirmed that the titration is satisfactory for nitrogenous materials when used with this method of combustion14·29·86; even thiourea, phenylthiourea and dinitro-derivatives can be accurately analysed. a However, the titration is not suitable for nitrogenous materials if they are decomposed by the rapid "empty-tube" method of combustion,8 and it is known that even moderate amounts of nitrate interfere.34 The conversion of organic nitrogen to nitrogen oxides is known to be low in the "empty tube" method,36 hence it must be assumed that the conversion is extremely small in the oxygen flask method. Soep and Demoen14 tested the absorption solutions for ammonia, cyanide, nitrite and nitrate after combustion of several types of organic material by the oxygen flask method; no ammonia or cyanide and little nitrite were found, but nitrate was always present if the solution contained peroxide, even when only filter-paper was burned. However, the only materials that could not be properly analysed were certain aromatic sulphonamides and chlorothiazide; with the latter substance an additive interference of chloride and nitrate caused results to be high by 0·34 to 1·2 per cent.
Wagner29 examined several analogues of thorin as indicators in the titration with barium perchlorate, but found none to be an improvement. Boetius, Gutbier and Reith22 preferred titration with 0·02 M barium nitrate in the presence of alizarin sulphonate indicator37; this end-point is less satisfactory than that of thorin. s,u Boetius, Gut bier and Reith simultaneously determined sulphur and a halogen by applying either the Volhard or Leipert method after the titration with barium solution.
Soep and Demoen14 made a comparative study of the above-mentioned two titrations with barium solution and a titration with lead solution. They preferred the last-named method, which was initially proposed by Archer.38 The alkaline peroxide absorption solution is evaporated to dryness below 100° C with a little nitric acid to destroy halogens, then with water and finally with urea solution to remove nitrogen oxides. The residue is dissolved in 4 ml of water and neutralised with 0·02 N ammonia or nitric acid to bromophenol blue indicator; 1 ml of 20 per cent. v jv acetic acid, 25 ml of acetone and dithizone indicator are then added, and the mixture is titrated slowly with 0·02 N lead nitrate (previously standardised against ammonium sulphate) until the colour changes from green, through grey, to mauve-red. With sulphonamides, it is recommended that an amount of sodium peroxide (1 to 2 times the weight of sample) be mixed with the sample before the combustion. No similar report of difficulties with sulphonamides has appeared. · The repeated evaporations involved in the above method detract from its utility in rapid analyses; it seems likely that the procedure could be considerably shortened for most materials.
The ordinary titrimetric procedures for sulphate are tedious when phosphate is present. A spectrophotometric method based on'barium chloranilate is, however, said to give sufficiently accurate results when samples containing 0·3 to 10 mg of sulphur are bumed.311
An interesting example of the versatility of the oxygen flask method is given by Roth,40
who determines traces of organic sulphur in liquids by soaking filter-paper in the liquid, drying and igniting in a flask filled with oxygen by means of a paper fuse treated with potassium nitrate; the sulphate is eventually reduced to sulphide and determined by the photometric methylene blue method.
FLUORINE-
Few papers have so far been published on the determination of fluorine by this method, and there is little concordance between the different results. Schoniger7 absorbs the products of combustion in water and titrates the fluoride with cerous nitrate in the presence of murexide indicator. Samples weighing 10 to 15 mg are used because the end-points are not sharp. Rogers and Yasuda41 also report no difficulties with the decomposition method, with which they use a colorimetric finish with ferric salicylate. However, neither Senkowski, Wollish and Shafer,42 who determine the fluoride colorimetrically by means of zirconyl Eriochrome cyanine R, nor Steyermark, Kaup, Petras and Bass,43 who apply a photometric titration with thorium nitrate, have been able to obtain complete combustion unless about 20 mg of sodium peroxide are mixed with the sample before the combustion. This is said to be necessary both on the semi-micro42 and micro43 scales, although most of the compounds quoted are only monofluorinated; such compounds are relatively easy to decompose.
Belcher, Leonard and West" determine fluorine ·by the oxygen flask method on the sub-micro scale and use a new colour reaction of fluoride with cerous alizarin complexan

january, 1961] MACDONALD: THE OXYGEN FLASK METHOD. A REVIEW 9
for the final step. These workers found difficulty only in the decomposition of trifluoromethyl groups and recommend that potassium chlorate should be added to such a sample; sodium peroxide did not prove very effective.
A direct automatic titration (personal communication from Miss A. L. Conrad, Standard Oil Co., Cleveland, Ohio) and a visual comparison titration8 •46 with thorium nitrate solution have been used for routine work. The only difficulties encountered in my laboratory have been with very stable, highly fluorinated volatile materials, for which it seems likely that the substance partly volatilises away from the combustion zone before it decomposes. One or two trifluoromethyl groups and single C-F bonds seem to decompose readily. Further work is obviously needed to clarify these contradictory reports.
In 1893, Meslans46 analysed gaseous alkyl fluorides by a type of oxygen flask method. Essentially, a 500-ml bulb is fitted with a stopper through which are sealed a narrow platinum tube and two platinum electrodes; a fine mesh of platinum spirals is attached between the electrodes over the exit of the tube. The bulb is charged with a standard solution of alkali and evacuated, and about 400 ml of oxygen are introduced so that a partial vacuum remains. The platinum mesh is heated to bright redness, and the gas to be analysed is measured into the bulb, where it ignites instantaneously at the mesh. More oxygen is used to sweep the last traces of sample gas into the bulb. After some time, the excess of alkali is titrated or the fluoride is determined gravimetrically. This elegant procedure is one of the earliest applications of the flask combustion method and would probably solve a number of presentday difficulties in the analysis of highly volatile materials.
PHOSPHORU5-
Fleischer, Southworth, Hodecker and Tuckerman47 were the first to determine organic phosphorus by the oxygen flask method. In their method, the products of combustion are absorbed in nitric acid (1 + 2), and the phosphate is precipitated on j:he semi-micro scale as ammonium magnesium phosphate, which is finally titrated with EDTA, or is determined colorimetrically on the micro scale by the molybdenum-blue method. Sulphuric acid (1 to 2 N) has also been suggested as the absorbent.'8·'9 but prolonged boiling is necessary to ensure that the phosphate is converted to the ortho form. An alkaline hypobromite solution is very satisfactory as absorbent.60,61
The molybdenum-blue finish is usually preferred for routine work48,49 ,61 and has been applied to the semi-micro determination of phosphorus in flame-proofed cloths62. Merz49
determined phosphorus and halogens simultaneously on aliquots of the absorption solution by this method in conjunction with the ViebOck and Leipert titrations.
Barney, Bergmann and Tuskan10 prefer the colorimetric or difference-spectrophotometric molybdovanadate procedure for determining 0·1 to 8 per cent. of phosphorus in motor oils and additives. A procedure involving the precipitation and titration of quinoline molybdophosphate is excellent for routine work when many analyses are required.60 A rate of four determinations per hour can be readily achieved, and the accuracy is good; none of the elements commonly found in organic materials interferes.
The semi-micro method based on precipitation of ammonium magnesium phosphate and its subsequent titration with EDT A is tedious and requires an empirical correction factor.47 Bennewitz and Tanzer63 obtained rapid and satisfactory results for the determination of 1 to 6 mg of phosphorus by a simpler process. After the absorption, the nitric acid absorbent is boiled, cooled and adjusted to pH 10 with ammonia - ammonium chloride buffer; cyanide (to mask traces of heavy metals), Eriochrome black T indicator, a small excess of 0·02 M magnesium chloride and then sufficient ethanol to give a 50 per cent. solution are added, and the mixture is titrated with 0·01 M EDTA. These workers recommend a platinum spiral for the sample holder, because their gauze rapidly became corroded and gave rise to interferences. No similar troubles arising from the use of platinum gauze in the determination of organic phosphorus have been reported.
ARSENIC-
Comer12 was the first to recommend the determination of arsenic by this method of decomposition. Arsenic attacks the usual platinum holder, hence a silica spiral is used; after the combustion, the arsenate and arsenite formed are absorbed in a solution of sodium hydroxide, and eventually arsenic trichloride is distilled into a bicarbonate solution and is

10 MACDONALD: THE OXYGEN FLASK METHOD. A REVIEW [Vol. 86
titrated iodimetrically. Merz54 found that "phosphorus-resistant" platinum can be used as the sample holder for certain materials, but recommends a silica spiral for general analysis of arsenic-containing samples. He uses a dilute solution of iodine as absorbent to ensure total oxidation to arsenicV, and applies the molybdenum blue colorimetric finish. A modified silica holder said to be less prone to dropping the sample has been described.66
Belcher, Macdonald and West56 have shown that most of the arsenic is present in the tervalent form after the combustion; they found that direct titration with bromate solution in the presence of p-ethoxychrysoidine indicator is the best of the several possible finishes. However, these workers were forced to the conclusion that the oxygen flask method is not well suited to arsenical materials and that decomposition by the older wet-combustion method is to be preferred. Spectrographic analysis has shown that arsenic forms alloys with platinum even under the strongly oxidising conditions obtaining when paper impregnated with potassium nitrate is burned.66 When a silica spiral is used, combustion is never as satisfactory as with platinum. For example, Corner12 has been unable to achieve proper and immediate combustion of resinous materials. Tuckerman, Hodecker, Southworth and Fleischer67 have confirmed that wet combustion is preferable to the oxygen flask method for determining organic arsenic.
BoRoN-To avoid any CQntamination from the usual borosilicate-glass flasks, it is advisable
to use soda glass66 or to coat ordinary flasks with a silicone, e.g., Beckman Desicote.68 The boric acid formed on absorption in water is readily determined by the straightforward mannitol method, which can be utilised with a visual66 or coulometric titration.68 Many boron-containing materials are difficult to decompose, but complete combustion is attained if powdered sucrose68 or potassium hydroxide12 is added to the sample; this has proved satisfactory for substituted borazoles and silylbenzene - boronic acid derivatives.
METALs-
Zinc, cadmium and magnesium in organic complexes can be determined on the micro scale without difficulty by absorbing the products of combustion in 1 N hydrochloric acid and then applying an EDTA titration66 ; barium has also been determined.1o Lead and bismuth form alloys with the platinum holder, and some metals, e.g., nickel and gallium, form insoluble oxides that are not conveniently dissolved if an EDTA titration is to follow.6e
The oxygen flask method is excellent for determining mercury on the micro or semi-micro scale.69 .Mercury, mercury! and mercuryii are formed in the combustion, so that concentrated nitric acid is used as an oxidising absorbent to ensure that all the mercury is eventually present in the bivalent form. If the material contains chlorine, the absorption solution must be heated under reflux, with an efficient condenser, to decompose mercurous chloride. Visual titration with EDTA is not applicable because nitrogen oxides destroy the indicator, but an amperometric titration with 0·01 or O·OOI N EDTA is satisfactory.
CARBON-
Gotte, Krete and Baddenhausen60 have shown that carbon-I4 can be determined by means of the oxygen flask method. The products of combustion are absorbed in I N sodium hydroxide; the carbonate is precipitated as the barium salt and analysed in the usual way for carbon-I4. Carbon from the sample container is naturally of no importance in this method.
It is difficult to obtain complete combustion of a small sample by means of an electrical coil ignition. This is why the filter-paper wrapper is retained by those who advocate electrical ignition for determinations of elements other than carbon. In the absence of the wrapper, the substance tends to volatilise or melt away from the coil before the coil has reached the ignition temperature of the sample. Even when ignition is satisfactory, there are often smears of carbon left on the sample support. Juvet and Chiu61 attempt to overcome these difficulties by folding the sample in a loose glass-wool mat wrapped round a heating coil (I mm diameter) made from I5 em of Nichrome resistance wire; the coil is placed between two platinum wires fused into glass tubing. After absorption of the products of combustion in 0·5 N sodium hydroxide, the carbonate is determined by titration with O·I N hydrochloric acid from the phenolphthalein end-point to the methyl orange end-point. The accuracy of the method is not very good. It has not been possible to confirm the satisfactory nature of this combustion; carbon "fluff" often appears on the outer surfaces of the mat.s

January, 1961] MACDONALD : THE OXYGEN FLASK METHOD. A REVIEW 11
A more promising approach to the problem has been described by Cheng and Smullin. 112
The sample is placed in a small porcelain boat and closely covered with a piece of fine platinum gauze; the boat is then inserted into a platinum heating coil, and combustion is begun by heating the coil with a current from a 6-volt battery. The carbonate formed is precipitated as barium carbonate, which is then determined titrimetrically. Further information on this procedure and on the determination of hydrogen is promised. 62
CONCLUSIONS
The benefits of the oxygen flask method are most clearly seen in the determinations of sulphur, iodine and phosphorus. The method for sulphur gained greatly from the fact that an excellent titrimetric determination of sulphate was discovered almost simultaneously with the wide-spread adoption of the oxygen flask method. The methods for iodine and phosphorus are also much simpler than any of their predecessors. The method is excellent for chlorine and bromine, but there is less unanimity on the optimum conditions in the literature. There is considerable conflict in the published results for the analysis of fluorinated materials, and further elucidation is also needed on the determinations of carbon, hydrogen, arsenic and several metals. The versatility of the oxygen flask method is apparent from the list of possible determinations. Everything from very stable solids to gases has been analysed by the same basic technique.
The simplicity of the method is probably its greatest virtue, and attempts to complicate it unnecessarily by electrical ignition, with a return to the era of mechanical break-down, must be deprecated. This type of ignition is essential only in the determination of carbon and/or hydrogen, for which organic sample containers cannot be used; a suitable inorganic wrapper, which will ignite and allow free access for oxygen without loss of sample, has yet to be found.
The personal preference of the analyst with regard to the final determination is given freer play than is the case in most earlier methods of decomposition, because the absorption solution is usually simple and the only interferences are those arising from the sample itself. It should now be clear that practically any method satisfactory for pure solutions of the ion concerned is suitable for application to flask absorption solutions. Therefore, unless some new facet of the method of combustion comes to light, papers describing known methods of completion seem to be unnecessary. The torrent of papers now appearing shows no sign of abating, but it should be stressed that only those describing methods of final determination that match the decomposition procedure in rapidity and simplicity are likely to bring renown to the investigator.
REFERENCES
l. Hempel, W ., Z . angew. Chem., 1892, 13, 393. 2. Graefe, E ., Ibid. , 1904, 26, 616. 3. Marcusson, J., and DC>scher, H ., Chem. Ztg., 1910, 34, 417. 4. Votocek, E ., Chem. L i sty, 1922, 16, 248. 5. Mikl, 0 ., and Pech, J ., Ibid., 1952, 46, 382 ; 1953, 47, 904. 6. PraM.k, M., Bene, J., and Bartu5ek, Z., Chem. Prllmy sl, 1953, 3 , 297 . 7. SchC>niger, W ., Mikrochim. Acta, 1955, 123 ; 1966, 869. 8. Macdonald, A. M. G., Unpublished work. 9. Lysyj, 1., and Zarembo, J. E ., Anal. Chem., 1958, 30, 428.
10. Barney, J. E ., II, Bergmann, J. G., and Tuskan, W . G ., Anal. Chem., 1959, 31 , 1394; cf. Gedansky, S. J., Bowen, J. E., and Milner , 0 . 1., Anal. Chem., 1960, 32, 1447.
11. Archer, E . E ., Analy st, 1958, 83, 571. 12. Corner, M., Ibid., 1959, 84, 41. 13. Bennewitz, R.. Mikrochim . Acta, 1960, 54. 14. Soep, H., and Demoen, P ., Microchem. ] ., 1960, 4, 77. 15. Kirsten , W . J., in "Proceedings of the International Symposium on Microchemistry, 1958," Per-
gamon Press, Oxford, London, New York and Paris, 1960, p. 132 ; M i krochim. Acta, 1960, 272. 16. Martin, A. J., and Deveraux, H ., Anal. Chem., 1959, 31, 1932. 17. Haslam, J., H amilton, J. B., and Squirrell, D . C. M., Analy st, 1960, 85, 556. 18. Lysyj , 1., M icrochem. ] ., 1959, 3 , 529. 19. Belcher, R., Macdonald, A. M. G ., and Nutten , A. J ., Mikrochim. Acta, 1954, 104. 20. Erdey, L ., Mazor, L ., and Meisel, T ., Ibid., 1958, 140. 21. Gieselmann, G., and Hagedorn, 1., Ibid., 1960, 390. 22. Boetius, M., Gutbier, G., and Reith, H., Ibid., 1958, 321. 23. Haslam, J ., Hamilton, J. B ., and Squirrell, D . C. M., ] . Appl. Chem. , 1960, 10, 97. 24. Olson, E . C., and Krivis, A. F ., Microchem. ]., 1960, 4 , 181. 25. Praeger, K. , and Furst, H ., Chem. Tech. , Berlin , 1958, 10, 537.
12 26. 27. 28. 29. 30. 31. 32. 33. 34. 35. 36. 37. 38. 39. 40.
41. 42. 43. 44. 45. 46. 47.
48. 49. 50. 51. 52. 53. 54. 55. 56. 57.
58. 59. 60. 61. 62.
PARKE: THE DETERMINATION OF [Vol. 86
Sokolova, N. V., Orestova, V. A., and Nikolaeva, N. A., Zhur. Anal. Khim., 1959, 14, 472. Cheng, F. W., Microchem. ]., 1959, 3, 537. Kolthoff, I. M., and Yutzy, H., Ind. Eng. Chem., Anal. Ed., 1937, 9, 75. Wagner, H., Mikrochim. Acta, 1957, 19. Ottosson, R., and Snellman, 0., Acta Chem. Scand., 1957, 11, 185. Gildenberg, L., Microchem. ] .• 1959, 3, 167. Steyermark, A., Bass, E. A., Johnson, C. C., and Dell, J. C., Ibid., 1960, 4, 55. Boos, R. N., Analyst, 1959, 84, 633. Fritz, J. S., and Yamamura, S. S., Anal. Chem., 1955, 27, 1461. Alicino, J. F ., Microchem. ]., 1958, 2, 83. Ingram, G., Mikrochim. Acta, 1953, 71. Geyer, R., Z. anal. Chem., 1955, 146, 174. Archer, E. E., Analyst, 1957, 82, 208. Lysyj, I., and Zarembo, J. E., Microchem. ]., 1959, 3, 173. Roth, H., Mikrochemie, 1953,36/37, 379; the oxygen flask method seems to have been described
by 0. Wehner, "Verband deutscher Landw. Versuchsanstalten Methodenbuch, Band IV," J. Neumann, Neudamm and Berlin, 1941, but this text has so far proved unobtainable.
Rogers, R. N., and Yasuda, S. K ., Anal. Chem., 1959, 31, 616. Senkowski, B. Z., Wollish, E. G., and Shafer, E. G. E., Ibid., 1959, 31, 1574. Steyerniark, A., Kaup, R. R ., Petras, D. A., and Bass, E. A., Microchem. ] .• 1959, 3, 523. Belcher, R., Leonard, M. A., and West, T. S., ]. Chem. Soc., 1959, 3577. Belcher, R., Caldas, E. F., Clark, S. J., and Macdonald, A.M. G., Mikrochim. Acta, 1953, 283. Meslans, M., Bull. Soc. Chim., Paris, 1893, 9, 109. Fleischer, K. D., Southworth, B. C., Hodecker, J. H., and Tuckerman, M. M., Anal. Chem., 1958,
30, 152. Cohen, L. E., and Czech, F. W., Chemist Analyst, 1958, 47, 86. Merz, W., Mikrochim. Acta, 1959, 456. Belcher, R., and Macdonald, A. M. G., Talanta, 1958, 1, 185. Cf. Kirsten, W. J., Microchem. ] .• 1960, 4, 3. Bartels, U., and Hoyme, H., Chem. Tech., Berlin, 1959, 11, 156. Bennewitz, R., and Tanzer, I., Mikrochim. Acta, 1959, 835. Merz, W., Ibid., 1959, 640. Eder, K., Ibid., 1960, 471. Belcher, R., Macdonald, A. M. G., and West, T. S., Talanta, 1958, 1, 408. Tuckerman, M. M., Hodecker, J. H ., Southworth, B. C., and Fleischer, K . D., Anal. Chim. Acta,
1959, 21, 463. Yasuda, S. K., and Rogers, R. N., Microchem. ]., 1960, 4, 155. Southworth, B. C., Hodecker, J. H., and Fleischer, K. D., Anal. Chem., 1958, 30, l152. GOtte, H., Krete, R., and Baddenhausen, H., Angew. Chem., 1957, 69, 561. Juvet, R. S., and Chiu, J., Anal. Chem., 1960, 32, 130. Cheng, F . W., and Smullin, C. F., Microchem. ]., 1960, 4, 213.
Received October lOth, 1960
The Determination of 2,4-Diaminophenol and its Salts Bv D. V. PARKE
(Biochemistry Department, St. Mary's Hospital Medical~School, London,~W.2)
A method is described for the accurate quantitative determination of 2,4-diaminophenol and its salts (Amidol). The method is based on the oxidation of 2,4-diaminophenol by potassium persulphate to the redcoloured 2-amino-4-quinoneimine, which is then determined spectrophotometrically from its absorption at 500 mp. The oxidation is dependent on pH and is best carried out at pH 4·5, at which the colour is most stable. The method is sensitive to 10 p.g of diaminophenol, and amines and aminophenols do not greatly interfere. With little reduction in accuracy the method has been applied to the determination of conjugates of diaminophenol in urine.
2,4-DIAMINOPHENOL is best known as its dihydrochloride (Amidol), which is widely used as a photographic developer and as a dye for fur and hair. Two methods have been described for determining 2,4-diaminophenol. The first! is based on the conversion of diaminophenol into a mixture of the di- and tri-benzoyl derivatives, which is then determined gravimetrically. The sec~nd is based on the light absorption of the azo dyes formed by diazotisation of the diaminophenol and coupling with resorcinol2 or 4-n-hexylresorcinol.3 The first method is empirical because of the variable mixture of products of the benzoylation, is non-specific and is limited to amounts of 100 mg or more. The second method, although sensitive to

January, 1961] 2,4-DIAMINOPHENOL AND ITS SALTS 13
10 p.g of diaminophenol, lacks specificity, since other ortko-aminophenols, and to a lesser extent other amines, interfere.
2,4-Diaminophenol is formed biologically by the reduction of 2,4-dinitrophenol by rabbits' and in rat-liver homogenates5 and is the principal metabolite of m-dinitrobenzene in the rabbit. 6 The work described was undertaken to devise a method for determining 2,4-diaminophenol and its conjugates in the urines of animals dosed with m-dinitrobenzene, 2,4-dinitrophenol and other compounds metabolised to the diaminophenol. It was particularly desirable to develop a method in which m-nitroaniline, m-phenylenediamine and aminonitrophenols would not interfere. The colorimetric methods previously described2 •3 give strong colours with the aminonitrophenols, and the colours with 2-amino-4-nitrophenol, another major metabolite of m-dinitrobenzene, are even more intense than those given by 2,4-diaminophenol. Moreover, 2,4-diaminophenol gives "muddy" colours in these methods, due probably to the formation of insoluble brown oxidation products.
DEVELOPMENT OF THE METHOD The great facility with which 2,4-diaminophenol and its salts are oxidised atmospherically
invalidated several of the possible methods investigated; ultimately, this facile oxidation was made the basis of a method. Solutions of 2,4-diaminophenol and its salts darken on exposure to air and ultimately form ,an insoluble brown polymeric oxidation product. In contrast to this, if the solutions are oxidised by the addition of aqueous ferric chloride, potassium dichromate or bromine water, a deep red colour is produced owing to the formation of salts of 2-amino-4-quinoneimine. 7 ,a
The oxidant chosen for the proposed method was potassium persulphate, since it is as effective as the oxidants used by previous workers and has the advantage of being colourless. A considerable excess of potassium persulphate was needed to ensure rapid development of the colour, and at pH values of 4 to 7 a final concentration of 200 p.g per ml was found to be optimal for final concentrations of diaminophenol dihydrochloride up to 50 p.g per ml. The amount of persulphate did not affect the colour intensity, but at concentrations of less than 200 p.g per ml a longer time was necessary for maximum colour development.
The salts of 2-amino-4-quinoneimine are holoquinoid and exhibit a general light absorption in the violet region. a The spectral absorption curve for a solution of 2,4-diaminophenol dihydrochloride oxidised with potassium persulphate showed this general absorption, which was maximal at 480 to 500 mp.; 500 mp. was chosen as the wavelength in the proposed procedure.
EFFECT OF pH-The development of the red colour is dependent on pH. Below pH 0 no colour develops,
above pH 0 the rate of colour development increases with rise in pH and in neutral solutions it is almost instantaneous. Above pH 7 the red colour is immediately formed, but quickly fades to brown. Even between pH 5 and 7 the red colour begins to fade slightly after 15 to 30 minutes. The variation in optical density with pH and development time is shown in Table I. At pH 4·5 the colour is stable, showing no deterioration after 1 hour, and the time for maximal colour development (10 minutes) is convenient.
METHOD REAGENTs-
2,4-Diaminophenol dihydrochloride-Purify by boiling a solution of 50 g of diaminophenol dihydrochloride in 150 ml of 0·2 N hydrochloric acid with 2 g of charcoal, filter, and precipitate by adding 25 ml of concentrated hydrochloric acid. Collect the precipitate on a filter-paper, and dry in vacuo over anhydrous potassium carbonate. Solutions in 0·5 N hydrochloric acid are stable for several hours.
Potassium persulphate solution, 0·2 per cent. wjv, aqueous-Prepare from analyticalreagent grade material.
Sodium acetate solution, molar, aqueous. Prepare from analytical-reagent grade material.
PROCEDURE-To 2·0 ml of a solution of 2,4-diaminophenol dihydrochloride in 0·5 N hydrochloric acid
10 to 250 p.g per ml) add 1·0 ml of potassium persulphate solution and 2·0 ml of sodium

14 PARKE: THE DETERMINATION OF [Vol. 86
acetate solution. After 10 minutes, dilute with water to 10·0 ml, and measure the optical density at 500 mp. against water in 1-cm glass cells.
TABLE I
OPTICAL DENSITIES OF SOLUTIONS OF 2,4-DIAMINOPHENOL OXIDISED WITH POTASSIUM PERSULPHATE
Two-millilitre portions of a 0·0005 M aqueous solution of 2,4-d.iaminophenol dihydrochloride in the presence of 6 ml of 0·2 M Britton and Robinson's buffer solution at different pH values were treated with 1·0 ml of a 0·2 per cent. w jv aqueous solution of potassium persulphate, diluted to 10·0 ml, and the optical densities measured at 500 mp. against water in 1-cm glass
cells
Optical density at pH-Development time, minutes 2·0 3·0 4·0 4·5 5·0 6·0 7·0 8·0 9·0
2 0·03 0·07 0·11 0·18 0·22 0·35 0·37 0·24 0·18 5 0·05 0·14 0·20 0·31 0·36 0·40 0·37 0·23 0·16
10 0·06 0·19 0·28 0·40 0·41 0·39 0·37 0·22 0·16 15 0·08 0·26 0·36 0·41 0·41 0·38 0·36 0·22 0·15 20 0·10 0 ·34 0·41 0·41 0·40 0·38 0·36 0·21 0·15 30 0·12 0·37 0·41 0·41 0·39 0·37 0·36 0·21 0·15 60 0·41 0·41 0·38
RESULTS
All results were obtained with a Unicam SP600 spectrophotometer. Beer's law was always strictly obeyed over the range 0 to 250 p.g of 2,4-diaminophenol dihydrochloride per ml of solution, and 2·0 ml of a solution containing 100 p.g per ml treated as described under "Procedure" gave an optical density of 0·41. Recoveries of 5 to 1000 mg of 2,4-diaminophenol dihydrochloride from aqueous solutions were 100 ± 2 per cent. The method is sensitive to 10 p.g of 2,4-diaminophenol, and other related amines and phenols do not appreciably interfere (see Table II).
TABLE II
OPTICAL DENSITIES OF SOLUTIONS OF SOME AMINES AND PHENOLS OXIDISED WITH POTASSIUM PERSULPHATE
Two-millilitre portions of 0·0005 M aqueous solutions of various amines and phenols in 0·5 N hydrochloric acid were oxidised with potassium persulphate by the proposed procedure
Amine or phenol Phenol .. o-Aminophenol p-Aminophenol 2-Amino-4-nitrophenol 4-Amino-2-nitrophenol m-Phenylenediamine .. 2,4-Diaminophenol dihydrochloride . .
Optical density 0·00 0·05 0·02 0·01 0·02 0·06 0·40
APPLICATION OF THE METHOD TO URINE
The 2,4-d.iaminophenol excreted by animals as a metabolite of 2,4-dinitrophenol and other compounds occurs in the urine as conjugates of acetic, sulphuric and glucuronic acids, which are hydrolysed to diaminophenol by boiling under reflux for 3 hours with 5 N hydrochloric acid. Recoveries of diaminophenol dihydrochloride (50 to 100 mg) boiled under reflux for 3 hours with 50 ml of 5 N hydrochloric acid and diluted ten-fold before the determination were 100 ± 2 per cent. Similar recoveries were obtained with normal rabbit urine in place of pure aqueous solutions. Diaminophenol dihydrochloride (50 to 100 mg) was boiled under reflux for 3 hours with a mixture of 50 ml of urine from normal rabbits and 50 ml of concentrated hydrochloric acid. The hydrolysed solution was cooled, diluted ten-fold, and filtered to remove a black precipitate arising from the action of the acid on glucuronides and other normal constituents of urine. Determinations by the proposed procedure gave recoveries

January, 1961] 2,4- DIAMINOPHENOL AND ITS SALTS us of 101 ± 3 per cent. (see Table III). The blank solution was prepared by adding 2 mi of 2 N hydrochloric acid to 2·0 ml of the filtered diluted urine solution and diluting to 10·0 ml.
The effects of other metabolites of 2,4-dinitrophenol occurring in the urine in addition to 2,4-diaminophenol were studied. By the same procedure as used for normal rabbit urine, the mean recoveries of diaminophenol dihydrochloride (100 mg) added to urine in the presence of m-phenylenediamine, m-nitroaniline, 2-amino-4-nitrophenol or n-glucuronolactone (100 mg of each) were Ill, 90, 93 and 102 per cent., respectively (see Table III).
TABLE III
RECOVERY OF 2,4-DIAMINOPHENOL FROM URINE IN THE PRESENCE OF OTHER METABOLITES OF m-DINITROBENZENE
Amount of Diaminophenol Diaminophenol metabolite dihydrochloride Optical dihydrochloride
Metabolite added added, added, density found, Recovery, mg mg mg %
106·4 0·45 109·8 103 . ~one .. 49·7 0·20 48·8 98
53·2 0·22 53·7 101 o-Glucuronolactone 100 107·9 0·45 109·8 102
93·5 0·39 95·1 102 2-Amino-4-nitrophenol 100 102·0 0·39 95·1 93
102·3 0·40* 97·6 95 107·9 0·40 97·6 90
m-Nitroaniline 100 103·2 0·38 92·7 90 107·8 0·39* 95·1 89 109·1 0·49 119·5 110
m-Phenylenediamine 100 103·3 0·47 114·6 111 93·5 0·44* 107·3 115
106·2 0·48* 1f7·1 110 • Solution adjusted to pH 1·0 after formation of the colour.
The high values obtained in the presence of m-phenylenediamine were due to an increase in optical density contributed by the oxidation of m-phenylenediamine itself (see Table II). The low values obtained in the presence of m-nitroaniline and 2-amino-4-nitrophenol were due to these substances decreasing the colour stability. Attempts were made to reduce these errors by acidifying the solution after formation of the colour. In this way it was hoped to stabilise the red colour of 2-amino-4-quinoneimine and reduce the colour contribution of m-phenylenediamine. Addition of 1 ml of 2 N hydrochloric acid lowered the pH of the solution to about 1·0, at which value the red colour of 2-amino-4-quinoneimine is stable, but recoveries were not improved (see Table III).
CONCLUSIONS
2,4-Diaminophenol and its salts may be accurately determined by the proposed method in pure aqueous solution and in urine. In the presence of similar amounts of m-nitroaniline or m-phenylenediamine errors of the order of 5 or 10 per cent., respectively, are incurred. Occasionally, when it is necessary to determine 2,4-diaminophenol in the presence of such large amounts of m-nitroaniline or m-phenylenediamine, corrections for these substances should be made, since the instability of the diaminophenol makes preliminary separation exceedingly difficult.
I thank Professor R. T. Williams for his interest in this work.
REFERENCES
l. Shupe, I. S. , ] . A ss. Off. AgYic. Chem., 1943, 26, 123. 2. Allan, Z. J ., and Mu!fk, F ., Chem. Listy, 1953, 47, 380. 3. Maren, T . H ., ] . PhaYmacol., 1949, 96, 251. 4. Ogino, S., and Yasukura, K., A mel'.]. Ophthal., 1957, 43, 936. 5. Parker, V. H ., Biochem. ] ., 1952, 51 , 363. 6. Parke, D . V ., and Williams, R . T., Ibid., 1957, 67, 7P. 7. Kehrmann, F ., and Prager, H., BeY., 1906, 39, 3438. 8. Piccard, J., and Larsen, L . M., ]. Amer. Chem. Soc., 1918, 40, 1085.
Received August 29th, 1960
,-U-H_U_fl_'H-,t)-~-('(-lJ-.-fl-fl-llJ-~-'lll-tJ-lfl-'Rf-.. -,-.1 fl1tYI11~6ftri'Utfl1UJ

16 HODGKINSON AND ZAREMBSKI: THE DETERMINATION
The Determination of Oxalic Acid in Urine BY A. HODGKINSON AND P. M. ZAREMBSKI
[Vol. 86
Medical ReseaYch Council Unit for Metabolic DisluYbances in SuYgeYy, The GeneYal Infirmary, Great George SIYeet, Leeds 1)
A modified extraction with ether and colorimetric procedure are described for the determination of oxalic acid in urine; the method has increased accuracy and sensitivity compared with previous methods. Urine is acidified with hydrochloric acid and "half-saturated" with ammonium sulphate. The gelatinous precipitate formed after standing is removed by filtration, and the filtrate is continuously extracted with peroxide-free ether. The extracted oxalic acid is precipitated as the calcium salt, reduced to glycollic acid by boiling with zinc and sulphuric acid and determined colorimetrically with chromotropic acid. Recovery of oxalic acid from urine was 98 ± 2 per cent. The daily excretion of oxalic acid by normal adults ranged from 9·0 to 23·8 mg.
THE method most commonly used for determining oxalic acid in urine involves preliminary heating of the sample with hydrochloric acid to convert any oxaluric acid present to oxalic acid.1 •2 The urine is extracted with diethyl ether, and the extracted oxalic acid is precipitated as the calcium salt and determined with a standard solution of potassium permanganate.1 •2 •3 ·'·6
More recently, attempts have been made to increase the sensitivity and specificity of the . method by reducing the precipitated oxalic acid to glycollic acid and determining this
substance colorimetrically with 2,7-dihydroxynaphthalene6 •7 •8 or 2,7-dihydroxynaphthalene-3,6-disulphonic acid (chromotropic acid).D,lo
The procedures recommended by Powers and Levatin2 and Dempsey, Forbes, Melick and Henneman10 have been re-examined, and the modifications listed below have been made.
(i) Preliminary heating of the urine with hydrochloric acid, which results in the partial conversion of a number of urinary constituents to oxalic acid, has been omitted.
(ii) An improved apparatus is used for the extraction with ether. (iii) Improved conditions for the quantitative reduction of oxalic acid to glycollic acid
and for m~um colour development with chromotropic acid are introduced.
The method described has been used extensively for determining oxalic acid in normal and pathological urines.11
•12
•13
EXPERIMENTAL According to Eegriwe9 and MacFadyen,14 the reaction between formaldehyde and chromo
tropic acid is specific for formaldehyde. The procedures used for colour development are, in general, based on observations by MacFadyen,14 who recommended the use of 50 mg of chromotropic acid in 0·5 ml of water. This amount of chromotropic acid was found to be approximately ten times greater than the minimum required and so gave rise to unnecessarily high readings for the reagent blank value. Purification of the commercially available chromotropic acid resulted in further decrease in the optical density of the reagent blank solution. Purification also resulted in increased sensitivity of the colorimetric reaction and in greater stability of the aqueous chromotropic acid reagent solution.
Maximum colour development of the chromotropic acid - formaldehyde complex was attained after heating the reaction mixture in a boiling-water bath for 25 minutes, and a period of 30 minutes was adopted. Final dilution of the coloured complex with water has been used,16 but this leads to an appreciable loss of sensitivity. The final concentration of acid should be not less than 16 N.8 •14 According to MacFadyen,14 maximum optical density of the coloured complex is at 570 mft; we have confirmed this.
Reduction of oxalic acid to glycollic acid by magnesium and sulphuric acid, as recommended by Pereira,8 gave a satisfactory calibration graph (see Fig. 1, curve D), but greater sensitivity was attained by using zinc in place of magnesium. After heating with zinc for 2 hours at 35° C,2 •10 reduction was incomplete at higher concentrations (see Fig. 1, curve C). A more linear relationship was obtained after heating with zinc for 16 hours at 35° C (see Fig. 1, curve B), but the most satisfactory result was obtained after heating with zinc for 30

January, 1961] OF OXALIC ACID IN URINE 17
minutes in a boiling-water bath (see Fig. 1, curve A). Calibration graphs plotted from the results obtained when oxalic acid and equivalent amounts of glycollic acid were used were almost identical, and it was concluded that reduction of oxalic acid to glycollic acid was complete under the conditions used.
The isolation of oxalic acid from interfering substances present in urine is an essential preliminary step with the analytical methods available; extraction with ether and then precipitation of oxalic acid as the calcium salt appeared to be adequate for this purpose. In view of the greater specificity of the formaldehyde - chromotropic acid colour re~ction compared with titration against permanganate, the possibility was considered that precipitation of oxalic acid after the extraction might be omitted, but this resulted in appreciably higher values being found for urine.
eR "'
1·0
0·8
~ o:6 ~ ... c::: ... ..., ... -~ 0·4 0..
0
0·2
Fig. 1. Relationship between concentration of anhydrous oxalic acid present and optical density: curve A, reduction by zinc after heating for 30 minutes in a boiling-water bath; curve B, reduction by zinc after heating for 16 hours at 35° C; curve C, reduction by zinc after heating for 2 hours at 35° C; curve D, reduction by magnesium
Conditions for the quantitative extraction of oxalic acid with ether are relatively critical. The efficiencies of three types of liquid - liquid extractor were compared by measuring the recovery of oxalic acid from aqueous solution. Recovery was 94 per cent. for the apparatus recommended by Powers and Levatin2 and 72 to 78 per cent. for a standard Quickfit & Quartz assembly with a sintered distributor. Recovery from aqueous solution was 98 ± 1 per cent. when the apparatus shown in Fig. 2 was used.
With laboratory-grade ether, maximum recovery of oxalic acid was 92 per cent. after 4 hours and recovery decreased progressively with longer periods of extraction. With peroxidefree ether, recovery was 94 per cent. after 6 hours and 95 per cent. after 10 hours. Recovery was 97 per cent. after "half-saturation" of the aqueous phase with ammonium chloride and extraction with peroxide-free ether for 6 hours. When the ammonium chloride was replaced by ammonium sulphate, the recovery on replicate determination was 98 ± 1 per cent.
The optimum temperature of the bath for the extraction with ether was 70° C, longer extraction periods being required below 65° C. Loss of ether and oxalic acid occurred at temperatures above 70° C because of the limitations of the condenser.

18
APPARATUs-
HODGKINSON AND ZARE:MBSKI: THE DETERMINATION
METHOD
[Vol. 86
Extraction apparatus-The apparatus used is shown in Fig. 2. Standard Quickfit & Quartz glassware was used when possible. The inner assembly, A, was constructed from Pyrex-glass tubing of diameter 0·8, 1·8 and 2·5 em; it consists of a collecting funnel terminating in a perforated bulb, and an outer tube of capacity approximately 35 ml. The upper end of this tube is slightly constricted so that assembly A is a single unit. An extractor tube (Quickfit & Quartz No. FC6/23A}, a jacketed coil condenser (No. CX6/05) and a 250-ml conical flask (No. FE250/3) complete the assembly.
Conical centrifuge tubes-These tubes were made from Exelo stoppered 25-ml test-tubes by drawing the closed end out to obtain a tip of internal diameter approximately 1 mm. The external tip of the tube was flattened to prevent it penetrating the rubber lining of the centrifuge buckets.
To condenser
t
Extractor tube -
Inner. assembly( A)
Perforations Septum ("-' 0·4 mm diameter)
Scale em
Conical flask-0 5 10
Fig. 2. Extraction apparatus
REAGENT5-
Allantoin-Prepare as described by Hawk, Oser and Summerson.18
Ammonium urate-Dissolve 4 g of uric acid in 100 ml of water to which has been added a few drops of 40 per cent. w jv potassium hydroxide solution. Cool, and add 20 g of ammonium chloride and then 3 ml. of ammonia solution, sp.gr. 0·880. Set aside overnight, filter, wash the precipitate with dilute ammonia solution, and dry in a vacuum desiccator.
Calcium chloride solution-Dissolve 90 g of analytical-reagent grade calcium carbonate in 450 ml of 4 N hydrochloric acid, and dilute to 500 ml with water.
Chromotropic acid solution-Twice recrystallise the sodium salt of chromotropic acid from aqueous ethanol, and dissolve 1 g in 100 ml of water. Store this solution in the cold, and prepare freshly every 3 days. ·
Ethanol - acetic acid mixture~__ Mix 2 per cent. v jv acetic acid, 95 per cent. v jv ethanol and water in the ratio 1 : 6: 2.
Diethyl ether, peroxide-free-Pass anaesthetic-grade ether slowly through a 22-cm X 3-cm column of "aluminium oxide for chromatographic analysis" (obtainable from the British Drug Houses Ltd.). Store the product in the cold in a dark bottle containing a few pieces of copper wire, and prepare freshly every 10 days.
Oxalic acid standard-Dissolve 1·0231 g of potassium oxalate monohydrate in 100 ml of water. Prepare a working standard by mixing 1 volume of this solution with 4 volumes of water; this solution contains 1 mg of anhydrous oxalic acid per mi.

January, 1961] OF OXALIC ACID IN URINE 19
Oxaluric acid-The sample used was purchased from Nutritional Biochemicals Corporation, Cleveland 28, Ohio, U.S.A., and contained less than 0·05 mg of oxalic acid per 100 g.
PROCEDURE-
Collect the urine at 4° C, without preservatives, and analyse as soon as possible after completion of collection. Mix a 50-ml sample of urine with 19 g of ammonium sulphate, and add 5 ml of concentrated hydrochloric acid. Note the change in volume, set the mixture aside at room temperature for 30 minutes, and filter through a Whatman No. 11ilter-paper. (Full saturation of urine with ammonium sulphate is recommended if an appreciable amount of heat-coagulable protein is present). Extract 20 ml of filtrate for 6 hours with 100 ml of ether, maintaining the temperature of the water bath at 65° to 70° C. Add 4 ml of water to the extract, and remove the ether by evaporation on a boiling-water bath; stop the evaporation at the first appearance of condensed water vapour. Transfer the aqueous liquor to a conical centrifuge tube with three 2-ml portions of 95 per cent. ethanol, and wash the apparatus with 2 ml of water. Add 50 per cent. v jv ammonia solution until the contents of the tube are alkaline to bromocresol green (3 to 4 drops will be needed), and then add 0·5 ml each of glacial acetic acid and 20 per cent. w jv calcium chloride solution. The fil\,al pH should be within the range 3·6 to 4·5. Cover the mixture with 2 ml of ethanol - acetic acid mixture, and set aside overnight at room temperature. Spin in a centrifuge at 1200 g for 20 minutes, remove the supernatant liquid with a Pasteur pipette, and allow the inverted tube to drain. Wash the precipitate once with 4 ml of ethanol - acetic acid mixture, remove the supernatant liquid, and dry the precipitate at 100° to 110° C. Dissolve the precipitate in 2 ml of 2 N sulphuric acid, add 100 to 150 mg of powdered zinc, and heat in a boiling-water bath for 30 minutes. Spin in the centrifuge to separate the excess of zinc from the solution, and transfer 0·2 ml of the supernatant liquid to a glass-stoppered 25-ml test-tube containing 0·5 ml of chromotropic acid solution. Add 5 ml of concentrated sulphuric acid, and heat in a boiling-water bath for 30 minutes. Cool, dilute to 20 ml with 9 N sulphuric acid, and measure the optical density at 570 mp. in a 10-mm fused-glass cell. The colour is stable for at least 2 hours.
PREPARATION OF CALIBRATION GRAPH-
Place 0, 0·2, 0·4, 0·6, 0·8 and 1·0 ml of working standard oxalic acid solution in separate test-tubes. Adjust the volumes to 1 ml with water, and add 1 ml of 4 N sulphuric acid and then 100 to 150 mg of powdered zinc to the contents of each tube. Treat the solutions as described above, and express the result in milligrams of anhydrous oxalic acid. The coloured complex obeys Beer's law closely (see Fig. I, curve A); variations in the slope of the graph are small and are due mainly to differences between batches of chromotropic acid reagent.
RESULTS
RECOVERY OF OXALIC ACID FROM URINE-
The recovery of oxalic acid added to three different samples of urine was determined in duplicate; the results are shown in Table I.
TABLE I RECOVERY OF OXALIC ACID ADDED TO URINE
Oxallc acid found Oxalic acid after addition of
Sample found in control, 0·5 mg of oxalic Recovery, No. mg per 50 ml acid, mg per 50 ml %
1
{ 1·056 1·540 97·0 1·054 1·549 99·0
2 0·840 1·320 96·0 0·843 1·330 97·5
3 0·398 0·898 100·0 0·400 0·895 99·0
Mean .. 98·1 ± 2·0
COMPARISON BETWEEN "FREE" AND "TOTAL" OXALIC ACID VALUES FOR URINE-
Twenty-four-hour samples of urine from normal adults and from patients with renal calculus were collected in the cold, without preservatives, and the oxalic acid contents were determined (a) as described above and (b) after heating with hydrochloric acid, as recommended by Powers and Levatin2 ; the results are shown in Table II. The value (B- A) was

20 HODGKINSON AND ZAREMBSKI: THE DETERMINATION [Vol. 86
found to vary considerably from individual to individual and, moreover, was not a constant fraction of the "free" or "total" oxalic acid.
TABLE II COMPARISON BETWEEN "FREE" AND "TOTAL" OXALIC ACID VALUES FOR URINE
Oxalic acid found when-
Sample No.
urine was acidified, but not heated (A),
mg per 24 hours
Urin~ from noYmal adults-1 10·4 2 23·2 3 19·5 4 19·7 5 19·2 6 22·0
Urine fyom patients-1 2 3 4 5 6
SPECIFICITY OF METHOD-
28·6 54·6 15·0 18·9 10·5
348·0
urine was acidified and heated (B), mg per 24 hours
16·6 34·0 31·0 25·5 24·3 24·4
38·4 61·9 17·0 22·6 26·5
404·0
Value of (B -A)
6·2 10·8 11·5
5·8 5·1 2·4
9·8 7·3 2·0 3·7
16·0 56·0
The recovery of oxalic acid from aqueous solution and from normal urine was determined after the addition of various compounds known to give rise to oxalic acid under suitable conditions. Recoveries were determined before and after heating the mixtures on a boiling-water bath for 30 minutes.
Glycine, alanine, ammonium urate, allantoin and creatinine were added in amounts approximately twice those normally found in urine. The amounts of glucose added corresponded to that found in mild and moderate glycosuria, and the amounts of ribose and oxaluric acid were appreciably higher than would be encountered in most normal or pathological urines. · Of the compounds added, only oxaluric acid, ribose and glucose caused interference in aqueous solution when preliminary heating was omitted. Ammonium urate, oxaluric acid, ribose, glucose and allantoin caused some interference in urine under the same corrditions, but all the compounds examined caused appreciable interference when the urine was heated (see Table III).
TABLE III EFFECT OF VARIOUS COMPOUNDS ON RECOVERY OF OXALIC ACID FROM WATER AND URINE
Addition to 50 ml of sample
None Glycine (9 mg) Alanine (3 mg) Ammonium urate (40 mg) Allantoin (3 mg) Creatinine (80 mg) Alloxan (50 mg) .. Oxaluric acid (1 mg) Ribose (200 mg) .. Glucose (250 mg) Glucose (1·5 g)
Recovery of oxalic acid from water when sample was-
acidified, but acidified not heated, and heated,
% % 99 99 99 111 99 104 99 104 99 102 99 99 99 117
107 107 108 114 108 123 129 142
DAILY EXCRETION OF OXALIC ACID BY NORMAL INDIVIDUALS-
Recovery of oxalic acid from urine when sample was--
acidified, but acidified not heated, and heated,
% % 100 100 100 115 100 109 104 115 102 106 100 108 100 125 111 138 102 107 102 112 111 133
The urinary excretion of oxalic acid by thirty-nine adults on a normal diet containing approximately 70 mg of oxalic acid per day ranged from 9·0 to 23·8 mg per 24 hours. Values for two normal children aged 2 and 5 years were 4·9 and 12·3 mg per 24 hours, respectively. For comparison, values reported by other workers are shown in Table IV.

January, 1961] OF OXALIC ACID IN URINE
TABLE IV DAILY EXCRETION OF OXALIC ACID BY NORMAL ADULTS ON NORMAL DIET
Reference* Widmark, E . M. P.U Barrett, J. F.'' Powers, H . H ., et al.2
Lamden, M. P ., et al.10
Archer , H. E ., et al.20
Dempsey, D. F. , et al. 10
This paper ..
Oxalic acid excretion p er 24 hours
No. of adults ~-----'"--------, in series
34 14
7 51
6 20 39
• See reference list below.
CONCLUSIONS
Range, mg 14·0 to 56·0 20·0 to 47·5 14·3 to 35·8 16·0 to 64·0
6·4 to 27·8 15·0 to 50·0 9·0 to 23·8
Mean, mg
33·6 25·3 38·3 16·4 31·0 17·0
21
The preliminary heating of urine with hydrochloric acid is not recommended, as it results in erroneously high values for oxalic acid; this effect is apparently caused by the partial conversion of several urinary constituents to oxalic acid or to compounds yielding formaldehyde under the experimental conditions used. The increase in the measured amount of oxalic acid found after urine had been heated, shown as (B - A) in Table II, can largely be accounted for on the basis of the results in Table III.
Some interference by ribose, glucose, uric acid, allantoin and oxaluric acid occurred even when preliminary heating was omitted; this is probably a consequence of heating during extraction with ether.21 According to Flaschentrager and Miiller,21 urine contains only very small amounts of oxaluric acid, and errors from this source are probably negligible. With the proposed procedure, the value found for oxalic acid in normal urine is probably about 5 per cent. too high as a result of interference by uric acid, allantoin and reducing sugars, and the error may exceed 10 per cent. if the urine contains greatly increased amounts of these compounds.
The range of values found for the daily excretion of oxalic acid by normal adults agrees well with that reported by Archer, Dormer, Scowen and Watts20• Preliminary heating of urine was omitted by these workers, and this probably accounts for the absence of higher values reported by other workers (see Table IV).
The proposed procedure, after modification of the initial stages, can be used for determining oxalic acid in food, when the problem of "oxalogenic" compounds is also encountered. The application of the method to the determination of oxalic acid in blood is being studied.
We thank Dr. J. Dawson, Director of Research, Runwell Hospital, Essex, for his advice in the initial stages of this investigation.
REFERENCES
I. Dakin, H . D., ]. B ioi. Chem ., 1907,3, 57. 2. Powers, H. H., and Levatin, P., Ibid., 1944, 154, 207. 3. Salkowski, E. , Z. physiol. Chem., 1900, 29, 437. 4. Holmberg, C. G ., Biochem. Z., 1927, 182, 463. 5. Merz, W. , and Maugeri, S., Z. phy siol. Chem., 1931, 201, 31. 6. Eegriwe, E ., Z . anal. Chem., 1932, 89, 121. 7. Calkins, V. P ., Ind. Eng. Chem. , Anal. Ed., 1943, 15, 762. 8. Pereira, R. S., M ikt-ochemie, 1951, 36, 398. 9. Eegriwe, E ., Z . anal. Chem., 1937, 110, ~2.
10. Dempsey , D . F ., Forbes, A. P. , Melick, R . A., and H enneman, P. H., M etabolism, 1960,9, 5!. 11. Hodgkinson, A., Proc. Roy. Soc. Med. 1958 51 , 970. 12. Hodgkinson, A., and Zarembski, P. M.,]. Clin. Path ., 1958, 11, 553. 13. Pyrah, L. N., Anderson, C. K., Hodgkinson, A., and Zarembski, P.M., B rit. ]. Urol., 1939,31, 236. 14. MacFadyen, D. A .,]. B iol. Chem., 1945, 158, 107. 15. Dagley, S., and Rodgers, A., Biochim . Biophys. Acta, 1953, 12, 591. 16. Hawk, P. B., Oser, B. L ., and Summerson, W . H ., " Practical Physiological Chemistry," Thirteenth
Edition, J . & A. Churchill Ltd., London, 1954, p . 808. 17. Widmark, E . M.P. , Skand. Arch. Physiol., 1926, 48, 61. 18. Barrett, J . F ., Lancet, 1942, ii, 574. 19. Lamden, M. P. , and Chrystowski, G. A., Proc. Soc. Exp . Biol. Med., 1954, 85, 190. 20. Archer, H. E ., Dormer, A. E ., Scowen, E . F ., and Watts, R. W. E. , Clin. Sci. , 1957, 16,405. 21. Flaschentrll.ger, B ., and Miiller, B. P., Z. physiol. Chem., 1938, 251, 61.
Received july 5th, 1960

22 OGDEN, WEBSTER AND HALLIDAY: DETERMINATION OF· [Vol. 86
Determination of Biologically Soft and Hard Alkylbenzenesulphonates in Detergents and Sewage
BY C. P. OGDEN, H. L. WEBSTER AND J. HALLIDAY
(Chemical Division, Thomas Hedley & Co. Ltd., P.O. Box 155, City Road, Newcastle upon Tyne 1)
An infra-red method is described for the quantitative determination of biologically "soft" (straight-chain) and "hard" (branched-chain) alkylbenzenesulphonates in detergents and sewage. Manufactured detergents are hydrolysed with acid and extracted with light petroleum to remove fatty material, perfumes, etc. The alkylbenzenesulphonate is then converted to the heptylammonium salt and selectively extracted from an acid - ethanol -water solution with light petroleum. After removal of the solvent, the optical density is measured in carbon disulphide at 9·9 i.J. (total alkylbenzenesulphonate) and in carbon tetrachloride at 7·31 i.J. (biologically hard alkylbenzenesulphonate); biologically soft alkylbenzenesulphonate is obtained by difference. For sewage, the detergent is adsorbed on carbon; after desorption, the procedure outlined above is applied.
IN recent years the widespread use of synthetic detergents containing tetrapropylenebenzenesulphonates has posed difficulties for sewage works and water authorities and there have been many reports of persistent foaming in the works and at weirs on rivers. The Minister of Housing and Local Government set up a Standing Technical Committee on Synthetic Detergents to look into the problem, and, under the auspices of this Committee, the possible use of an alkylbenzenesulphonate of a type more readily decomposable biologically has been investigated.
The new material is essentially a straight-chain alkylbenzenesulphonate, whereas the tetrapropylene material had a branched side-chain. Experiments have been carried out with the new material, both on pilot plantl and full scale (the Luton Experiment). In order properly to evaluate the course of the Luton Experiment, it was essential to be able to determine analytically the proportions of the two materials present in any given sample. Since none of the methods previously described for determining detergent in waters and sewage distinguishes between. the two materials, there was need for a new method.
EXPERIMENTAL
Development of the method was in two stages: (a) purification of the alkylbenzenesulphonate and (b) determination of the proportion of each type present.
SAMPLING-
To arrest the biological decomposition of synthetic detergent before analysis it was necessary to add a bactericide; 10 p.p.m. of mercuric chloride were found to be satisfactory. For sewage, the bactericide should be added immediately after the sample has been taken.
RECOVERY OF DETERGENT FROM SEWAGE-
The method used for recovery of alkylbenzenesulphonate was based on that described by Sallee and his co-workers.2 This involves concentration of the detergent by adsorption on carbon, drying of the carbon and desorption by boiling with alkaline benzene -methanol mixture.
Experiments showed that, for the recovery of up to 200 mg of alkylbenzenesulphonate, the amount of carbon could be reduced from 100 to 25 g, the bore of the glass column being halved. With the desorption mixture used by Sallee and his co-workers, the recovery of "hard" detergent was 95 per cent., but recovery of the "soft" type was only 85 per cent. Improvement was obtained by increasing the proportion of methanol and substituting chloroform for benzene. Ammonia solution. was more effective than alcoholic potassium hydroxide and, as it needed no special preparation, was simpler to use.
With a mixture of 2000 ml of methanol, 500 ml of chloroform and 25 ml of ammonia solution, sp.gr. 0·880, it was possible to obtain essentially complete desorption of both types of alkylbenzenesulphonate. The desorption mixture worked efficiently when passed down the

january, 1961] BIOLOGICALLY SOFT AND HARD ALKYLBENZENESULPHONATES 23
column at room temperature, pre-drying of the carbon and boiling with solvent being unnecessary. This revised procedure needed only one-quarter of the volume of solvent used in the original method and much reduced the time of analysis. PURIFICATION OF DETERGENT-
Detergent products may contain anionic detergents other than alkylbenzenesulphonates, as well as foaming agents, perfumes, etc. In sewage there is a highly complex mixture of organic compounds, many of which are liable to interfere with infra-red determination.
After removal of the desorbing solvent, Sallee and his co-workers11 effected purification by acid hydrolysis, neutralisation and extraction with light petroleum to remove some of the
t c:: 0
·e. 0 1: <
7 9- II Wavelength, jJ
IS
Fig. l. Absorption spectra of capillary films of 1-methylheptylammonium salts of alkylbenzenesulphonate : curve A, extract from sewage effluent treated by original method1 ; curve B, extract from sewage effluent treated by proposed method; curve C, pure alkylbenzenesulphonate
impurities. Next, the alkylbenzenesulphonate was allowed to react with 1-methylheptylamine, the heptylammonium salt was extracted with chloroform, and infra-red measurement was finally made in carbon disulphide, the characteristic bands at 9·6 and 9·9 1-' being utilised.
This method gave no difficulty with manufactured detergents, but, when it was applied to settled sewage, the final solution was darkly coloured and contaminated by compounds that interfered with the infra-red determination. Investigations were therefore carried out to improve the purification and, if possible, to simplify the procedure.
After evaporation of the desorption solvent the residue was hydrolysed. The acid solution was extracted with light petroleum to remove fatty acids and other impurities, ethanol being added to the aqueous phase to retain the detergent in solution and prevent formation of troublesome emulsions. After washing the light petroleum extract, the ratio of ethanol to water was adjusted to 1 to 4 and 1-methylheptylamine was added. The heptylammonium salt was then extracted with light petroleum to give an almost colourless solution. This extraction was shown to be quantitative, provided that the ethanol content did not exceed 25 per cent.
It had been shown8·' that extraction of the heptylammonium salt with light petroleum was selective and separated the detergent from all known interferences. The extent of this improvement was shown by examination of the carbonyl bands at 5·85 1-' and methyl bands at 7·251-' on recovered alkylbenzenesulphonate. By the original method/a the optical density of the carbonyl band was three to four times greater than that of the methyl band. By the

24 OGDEN, WEBSTER AND HALLIDAY: DETERMINATION OF [Vol. 86
proposed procedure (see Fig. 1) the carbonyl band was reduced to approximately one-tenth of the methyl band and the background interference in the 9·5- to 10·5-f£ region was also removed.
t <: 0
·;:;
e-o ll <
Fig. 2. Absorption spectra of 1-methy1heptylammonium salts of alkylbenzenesulphonates in carbon tetrachloride: curve A, biologically hard alkylbenzenesulphonate; curve B, 90 per cent. of hard and 10 per cent. of soft alkylbenzene sulphonate; curve C, 60 per cent. of soft and 40 per cent. of hard alkylbenzenesulphonate; curve D, biologically soft alkylbenzenesulphonate; curve E, Luton final effiuent; curve F, Luton final effiuent plus 10 per cent. of soft alkylbenzenesulphonate; curve G, Luton settled sewage; curve H, Felling settled sewage. Peaks for soft and hard detergents shown at 7·08 and 7·31 p., respectively
Several other amines-cyclohexylamine, NN'-diethyldiaminoethane, n-heptylamine, n-nonylamine, n-decylamine and n-dodecylamine-have recently been investigated for extraction of the alkylbenzenesulphonate. Of these amines, only n-heptylamine is satisfactory and its use improves the sensitivity of the infra-red measurement.
INFRA-RED MEASUREMENT-
In the method described by Sallee and his co-workers,2 total detergent is calculated from the optical densities at 9·6 and 9·9 1-'· It was found, however, that equal weights of the two types of alkylbenzenesulphonate, although giving the same optical density at 9·9 I-'• showed a 4 per cent. difference at 9·6f£. Consequently, only the band at 9·91-' was used to measure total detergent.

:January, 1961) BIOLOGICALLY SOFT AND HARD ALKYLBENZENESULPHONATES 25
Following the experimental use of the soft alkylbenzenesulphonate, the Department of the Government Chemist reported to the Standing Technical Committee that the two types of detergent showed different frequencies for the overtone sulphonate band in the 7·0- to
7·000 7·125 7·250 7·375 7·000 7·125 7·250 7·375
Wavelength, }.J
Fig. 3. Absorption spectra of hard and soft alkylbenzenes and their heptylammonium sulphonates in carbon tetrachloride: curve A, soft alkylbenzene; curve B, 1-methylammonium soft alkylbenzenesulphonate; curve C, n-heptylammonium soft alkylbenzenesulphonate; curve D, 1-methylheptylamine; curve E, hard alkylbenzene; curve F, 1-methylheptylammonium hard alkylbenzenesulphonate; curve G, n-heptylammonium hard alkylbenzenesulphonate; curve H, n-heptylamine
7·5-J.t region and that quantitative determination of a mixture of the two sodium alkylbenzenesulphonates was possible at 7 ·08 and 7 ·13 J.t, with reasonable precision, down to at least 10 per cent., provided that no interfering materials were present.
The soft and hard alkylbenzenes also exhibit differences in the 7·0- to 7·5-J.t region of the spectrum. The hard type has bands at 7·20, 7·24 and 7·31 J.l-• but the soft type has a band only at 7·24 J.l-· The presence of a band at 7·31 J.l- in alkylate shows that hard material is present. In practice, the soft alkylbenzene produced commercially has been shown to contain up to 10 per cent. of the hard type. The heptylammonium salts of the alkylbenzenesulphonates show two new peaks-Qne at 7 ·08 J.l- for soft and one at 7 ·13 J.l- for hard detergents; also, there is an increase in the intensity of the peak at 7·24 J.l- for the heptylammonium salts.
Thus there are three bands that could be used for identifying and determining soft and hard detergents in the presence of each other-7·08 J.l- for the soft and 7·13 or 7·31 J.tfor the
26 OGDEN, WEBSTER AND HALLIDAY: DETERMINATION OF [Vol. 86
hard type. The peaks at 7·08 and 7·13p. are in close proximity and cause background interference, but the change in background for the peak at 7·3lp. due to the peak at 7·24p. is small, because the intensity of the band at 7 ·24 p. is approximately the same for both soft and hard detergent - heptylammonium salts. It was therefore found better for quantitative determination to measure the hard-detergent content at 7·3lp. and the total detergent at 9·90 p. and to obtain the soft-detergent content by difference. Confirmation of the results for soft detergent may be obtained by comparing the peak at 7·08p. with known standard curves. Carbon tetrachloride is used for readings in the 7·0- to 7·5-p. region and carbon disulphide at 9·90 p.. The peak at 9·90 p. has been attributed to a sulphonate band and that at 7·3lp. to a gem-dimethyl band; the peaks at 7·08 and 7·13p. are believed to be due to overtone sulphonate bands. The use of n-heptylamine instead of 1-methylheptylamine causes a relative increase in intensity of the peaks at 7·08 and 7·13p. and hence increases the sensitivity of the method.
Figs. 2 and 3 show typical infra-red curves in the 7 ·0- to 7 ·5-JL region of the spectrum. In Fig. 2, curves A, B, C and D are absorption spectra of heptylammonium salts of pure alkylbenzenesulphonates, and the change from hard (curve A) to soft (curve D) can be clearly seen. Spectra of heptylammonium salts of alkylbenzenesulphonates recovered from settled sewage and eflluent are also shown in Fig. 2 (curves E, F, G and H). Curve E is for Luton final eflluent and, as expected, shows no peak for soft detergent at 7·08p.. Curve F is the spectrum of the same sample after the addition of 10 per cent. of soft detergent and shows the same relative absorption at 7·08p. to curve E as curve B does to curve A. Curve G is the spectrum of a typical Luton settled sewage of the period November, 1959; analysis gave 60 per cent. of soft detergent, and it can be seen that the curve is similar to the calibration curve for a solution containing 60 per cent. of soft detergent (curve C). Curve H is for Felling settled sewage before soft detergent became available in the area and shows no peak for soft detergent at 7·08p..
The spectra in Fig. 3 show the improvement in sensitivity attained by using n-heptylamine instead of 1-methylheptylamine for extracting the alkylbenzenesulphonate. The peak at 7·081-' on curve C (n-heptylamine) shows an increase in optical density of 25 per cent. over the corresponding peak on curve B (1-methylheptylamine).
METHOD
APPARATUs-
Adsorption colum1tr-A glass tube 50 em long and 2·5 em internal diameter. The tube is constricted at the lower end.
Infra-red spectrophotometer-Grubb- Parsons, type GS2, or an instrument of equivalent resolution.
REAGENTS-
All materials should be of recognised analytical grade. Activated carbon-Use the fraction of Nuchar Cl90 carbon retained on a 30-mesh sieve. Desorption solvent-Mix 2000 ml of methanol with 500 ml of chloroform, and add 25 ml
of ammonia solution, sp.gr. 0·880. Light petroleum, boiling range 40° to 60° C. n-Heptylamine or 1-methylheptylamine. Mercuric chloride solution, 5 per cent. wjv, aqueous.
PREPARATION OF COLUMN-
Place 25 g of carbon on a 30-mesh sieve, and wash with detergent-free water until free from carbon "fines." Insert a cotton-wool plug into the column, and introduce the carbon via a large funnel by means of a jet of water. Insert a cotton-wool plug on top of the carbon, fill the column with water, and apply suction to the bottom or pressure to the top of the column to remove excess of water and to settle the carbon.
PROCEDURE FOR MANUFACTURED DETERGENT-
Weigh a representative portion of sample containing approximately l g of alkylbenzenesulphonate, dissolve it in water, and dilute to !litre. Measure 100 ml of the solution into a 600-ml beaker, add 25 ml of concentrated hydrochloric acid, and boil gently for l hour,

january, 1961] BIOLOGICALLY SOFT AND HARD ALKYLBENZENESULPHONATES 27
reducing the volume to about 90 ml. Continue as described under "Procedure for Sewage/' beginning at "Transfer with water to a 500-ml separating funnel. ... "
PROCEDURE FOR SEWAGE-Immediately after collection, add to the sample, as bactericide, mercuric chloridesolution
in the ratio of 2 ml per 10 litres. Place a portion of sample containing approximately 100 mg of alkylbenzenesulphonate into an aspirator bottle of suitable size, and pass the sewage through the carbon column at approximately 2 litres per hour. Then pass through the column 2·5litres of desorption solvent at 25 to 30 ml per minute, and collect the eluate in two 2-litre beakers; maintain a head of solvent above the carbon during desorption. If traces of carbon are carried through, remove them by filtering the eluate through a sintered-glass filter of porosity 4. Evaporate the solvent on a steam-bath, and combine the solutions in a 600-ml beaker when their volumes have been sufficiently reduced. Dissolve the residue in approximately 100 ml of distilled water, add 25 ml of concentrated hydrochloric acid, and boil gently for 1 hour on a hot-plate so that the volume is reduced to about 90 ml.
Transfer with water to a 500-ml separating funnel previously calibrated at 100 ml, and dilute to this volume. Rinse the beaker and transfer funnel with two 10-ml portions of ethanol, and reserve the beaker for the subsequent amine - light petroleum extract. Cool the separating funnel, and add 50 ml of light petroleum to its contents. Shake for 2 minutes, allow to settle, and run the aqueous layer into a second separating funnel, leaving interfacial solids in the light petroleum layer. To the light petroleum extract add 15 ml of ethanol, shake to dissolve the interfacial solids, add 15 ml of water, and shake for 1 minute. Run the wash layer into the main aqueous layer, and repeat the washing once more with further 15-ml portions of ethanol and water, adding the wash layer to the main aqueous layer. Discard the light petroleum extract.
To the main aqueous layer and washings add 1 ml · of heptylamine and then 70 ml of water to bring the ratio of ethanol to water to 1 to 4. Extract with a 1()()..ml portion and then with four 50-ml portions of light petroleum, shaking the funnel for 2 minutes at each extraction. Filter the extracts through a small plug of cotton-wool into the 600-ml beaker previously reserved, and evaporate the solvent on the steam-bath.
Dissolve the residue in methanol, transfer to a 50-ml calibrated flask, dilute to the mark, and mix. By pipette, place a 5-ml and a 25-ml aliquot in separate 50-ml beakers, and evaporate them to dryness on the steam-bath. Dissolve the residue from the 5-ml aliquot in 2 to 3 ml of carbon disulphide, transfer the solution completely to a 5-ml calibrated flask, dilute to the mark, and mix. Scan the spectrum of this solution from 9·0 to 10·5 p.; use 0·8-mm reference and blank balanced cells at a scanning speed of 1 p. in 4 minutes. Measure the optical density of the band at about 9·9 p.; use a suitable base-line tangent to overcome background interference. From a calibration graph determine the equivalent amount of total alkylbenzenesulphonate in the aliquot (A mg).
Dissolve the residue from the 25-ml aliquot in 1 ml of carbon tetrachloride, and transfer the solution completely, by pipette, to a 2-ml calibrated flask. Dilute to the mark, and mix. Scan the spectrum of this solution from 7·0 to 7·5p.; use 0·8-mm reference and blank balanced cells at a scanning speed of 1p. in 16 minutes. Measure the optical density of the band at about 7·31p.; use a suitable base-line tangent, as shown in Fig. 2 (curve A) . From a calibration graph calculate the equivalent amount of hard alkylbenzenesulphonate in the aliquot (B mg).
Calculate the hard-detergent content of the alkylbenzenesulphonate from the equation-20B
Hard-detergent content, % = A and the soft-detergent content from the equation-
Soft-detergent content, % = 100 - Hard-detergent content.
NoTE-All samples of sewage effiuent analysed showed little or no soft alkylbenzenesulphonate. However, it was found that the ratio of the optical densities at 9·9 I" (total alkylbenzenesulphonate) and 7·31 I" (hard alkylbenzenesulphonate) was not the same as that for manufactured detergents and settled sewage. This difference was attributed to partial break-down of the detergent, thereby lowering the molecular weight. When applied to effiuents, the calculation gave high values for soft-detergent content; for such samples it was preferable to determine the proportion of soft detergent by visually evaluating the peak at 7·08 I" (soft detergent) in relation to that of known mixtures.

28 OGDEN, WEBSTER AND HALLIDAY: DETERMINATION OF [Vol. 86
CALIBRATION-
Prepare aqueous solutions of the types of soft and hard alkylbenzenesulphonates in current use and known mixtures containing 1 g of detergent per litre, and use appropriate aliquots. The soft alkylbenzenesulphonate should show little or no absorption at 7·31p.. For sewage, dilute the aliquots to 5 litres, and adsorb on carbon, etc., as detailed under "Procedure for Sewage."
REsuLTS CALIBRATION-
Mixtures of the two types of alkylbenzenesulphonate were prepared. The infra-red spectra of solutions treated by the full procedure were compared with those of solutions extracted directly with heptylamine and light petroleum, i.e., omitting adsorption on carbon, desorption, hydrolysis and extraction with light petroleum. The recovery of total detergent by the full procedure was quantitative and the ratios of soft to hard detergent agreed closely with the theoretical values. Typical optical densities obtained during calibration with both 1-methyl- and n-heptylamine are shown in Table I.
TABLE I CALIBRATION RESULTS
With 1-methylheptylamine With n-heptylamine -.
Weight of Weight of alkyl benzene Optical density (0·8-mm &lkylbenzene Optical density (0·8-mm sulphonate in cell) at- sulphonate in cell) at-
50 ml of 50 ml of -. solvent,* 9·9 f't 7·08 ,..: 7·31 ,..: solvent,* 9·9 f't 7·08 ,..: 7·31 p!
mg mg 50(S) 0·102 0·069 0·009 100(S) 0·203 0·176 0·012
100(S) 0·208 0·140 O·Oll 70(S) + 30(H) 0·204 0·092 0·077 150(S) 0·305 0·204 0·013 60(S) + 40(H) 0·195 0·077 0·107
80(S) + 20(H) 0·201 0·103 0·057 50(S) + 50(H) 0·199 0·065 0·138 60(S) + 40(H) 0·201 0·066 0·106 40(S) + 60(H) 0·198 0·045 0·157 40(S) + 60(H) 0·207 0·043 0·159 30(S) + 70(H) 0·192 0·031 0·188 20(S) + 80(H) 0·205 0·029 0·215 20(S) + 80(H) 0·198 0·020 0·223
50(H) 0·105 0·005 0·132 10(S) + 90(H) 0·199 0·013 0·247 100(H) 0·208 0·006 0·261 100(H) 0·199 Nil 0·267 150(H) 0·301 0·008 0·396
• (H) =hard alkylbenzenesulphonate; (S) =soft alkylbenzenesulphonate. t A 5-m1 aliquot evaporated to dryness; residue dissolved in 5 ml of carbon disulphide. t A 25-m1 aliquot evaporated to dryness; residue dissolved in 2 ml of carbon tetrachloride.
MANUFACTURED DETERGENT-
Production samples from plants making the two types of detergent have been analysed. Results for the 'product from a plant making only hard detergent have invariably been 100 per cent.; typical results for soft-detergent contents for samples from a plant making mostly product of this type ranged from 92 to 98 per cent.
The method was usefully applied when the latter plant began production of soft alkylbenzenesulphonate, which was only a small fraction of the total output of detergent. The method was used successfully to monitor the production of soft detergent when changing from hard to soft alkylbenzene.
To check the distribution of the product frequent retail purchases were made in the Luton area. Composite samples were analysed and the results were compared with an evaluation by carton codes. After the initial plant problems had been overcome, it was found that results by the two methods agreed to within 5 per cent.
SEWAGE-
When soft alkylbenzenesulphonate was introduced into the Luton area, the appearance of soft detergent was monitored in Luton settled sewage. As the new detergent became available to consumers, the amount of soft detergent in the settled sewage slowly increased, over a period of several months, from 47 to almost 75 per cent. A check on manufactured detergent on sale in Luton shops in November, 1959, showed that 70 per cent. was of the soft type, and the comparative analysis of the settled sewage showed 63 per cent. The latter figure is always expected to be slightly lower, because of the delay between stocking in the shops and

January, 1961] BIOLOGICALLY SOFT AND HARD ALKYLBENZENESULPHONATES 29
use by consumers and possible decomposition during passage of the sewage to the sewage works.
Known additions of soft alkylbenzenesulphonate were made to samples of settled sewage and effluent, and the soft-detergent contents were determined before and after the additions. The results are shown in Table II and indicate close agreement with the theoretical. Felling settled sewage A was sampled when no soft detergent was on sale in the area, and sample B was taken some weeks later when soft detergent was becoming available.
TABLE II
RECOVERY OF ALKYLBENZENESULPHONATE ADDED TO SEWAGE SAMPLES
Soft-detergent content of alkylbenzenesulphonate-
Sample
Felling settled sewage A . . Felling settled sewage B . . Luton settled sewage Prudhoe settled sewage• Luton effluent Felling effluent Prudhoe effluent•
found initially,
% Nil 11 63 11 5t 3t 3t
expected after addition,
% 70 63 78 46 30 20 18
• n-Heptylamine used for extraction of alkylbenzenesulphonate.
found after addition,
% 68 61 74 48 28 18 14
t Estimated from band at 7·08 p. by comparison with standard curves.
CONCLUSIONS The proposed method is satisfactory for determining biologically soft detergent in manu
factured detergents and sewage. It has been found most useful in the evaluation of the Luton Experiment and should" be of value to sewage works arid water authorities. The method is accurate to within ±3 per cent. for manufactured detergents and to within ±5 per cent. for sewage.
REFERENCES l. Truesdale, G. A., Jones, K ., and Vandyke, K. G., Water Waste Treatment]., 1959, 7, 441. 2. Sallee, E. M., Fairing, J. D ., Hess, R. W., House, R ., Maxwell, P. M., Melpolder, F. W., Middleton,
F. M., Ross, J., Woelfel, W. C., and Weaver, P. J., Anal. Chem., 1956, 28, 1822. 3. Fairing, J.D., and Short, F. R., Ibid., 1956, 28, 1827. 4. Webster, H . L., and Halliday, J ., Analyst, 1959, 84, 552.
Received August 22nd, 1960
A Simple Titrimetric Method for the Assay of Thiols BY B. SA VILLE
(The British Rubber Prod·ucers' Research Association, 48-56 Tewin Road, Welwyn Garden City, Herts.)
Aliphatic saturated and unsaturated thiols can be determined by their reaction with silver nitrate in aqueous pyridine. The pyridinium nitrate formed in direct equivalence to the -SH groups of the sample is then determined by titrating with standard alkali. Provisional details of the accuracy and validity of this procedure are discussed.
NuMEROUS methods are available for determining thiols either at the microgram level or for highly accurate determinations of purity on relatively large samples. Emmet Reid's1 review of this general topic permits an appreciation of the various improvements that have been made in the main classical analytical approaches. Iodine-titration methods, based on the reaction-
2RSH + I. -+ RSSR + 2HI
are of limited general applicability, since, although reaction with some thiols, e.g., benzenethiol,2 is virtually instantaneous and complete (especially in the presence of pyridine3), the

30 SAVILLE: A SIMPLE TITRIMETRIC METHOD [Vol. 86
reactions of hlgher aliphatic thiols with iodine in benzene are slow,' and it may be several hours before the excess of iodine can be confidently titrated. Further, iodine titration gives abnormal results with tertiary aliphatic thiols.1
Determinations based on reaction of the thiol with mercuric or silver salts, the excesses of which are noted by amperometric,6 potentiometric6 or chemical methods, do not suffer from the selectivity shown by the iodine methods. However, these methods are subject to interference from ions, such as CN- and Br, that form insoluble precipitates or stable complexes with silver ions.6 Further, other organic sulphur compounds present in the thiol may form complexes with silver ions and so give results for thiol that are too high. Nevertheless, the reaction of thiols with silver ions provides a less ambiguous procedure for determination if we consider the protons released according to the equation-
RSH + Ag+ ~ RSAg + H+ .. (1)
Determination of the acid liberated in this reaction rather than of the excess of silver salt left in solution (a procedure doubtful in neutral or acid solution, in which RSH is precipitated, usually, as AgSR.nAgN03 , where n is non-integral when silver nitrate is the precipitant) gives a direct measure of the -SH group, since it is only this group that can supply protons. Provided, therefore, that excess of silver salt is present after the silver mercaptide (AgSR) has been formed, there can be no interference by precipitable anions from neutral salts.
Methods based on this theoretically more mature principle have been proposed by Sampey and Emmet Reid' and by Mapstone. 7 The former workers' utilised the related reaction involving mercuric chloride and titrated the liberated hydrochloric acid to a methyl red or methyl orange end-point; the disadvantage mentioned was that the rather acidic solution at the equivalence point in the titration led to slightly low results. Titration to a higher pH was impossible, since mercuric oxide or hydroxide would have been formed, thereby invalidating the titration. Mapstone7 used silver sulphate and titrated the liberated sulphuric acid.
A simple procedure, suitable for determining the purities of higher aliphatic unsaturated and tertiary thiols, is proposed in this paper. A weighed amount of the thiol is added to an excess of silver nitrate dissolved in aqueous pyridine, the mixture is diluted with water, and the pyridinium nitrate formed is titrated with standard alkali to a phenolphthalein end-point. The reaction, involving co-ordinated silver ions (Py,.Ag+), is-
Py,.Ag+ + RSH ~ (n- 1)Py + PyH+ + AgSR (2
The use of the aqueous pyridine solvent has several advantages: (i) The thiol is soluble in this medium, so that the mercaptide precipitate does not
occlude unreacted thiol. (ii) Since the silver ions are co-ordinated, there is little possibility of the phenol
phthalein end-point being in error. (iii) Decomposition of the silver salts of certain unsaturated thiols to silver sulphide, a
reaction occurring in the presence of excess of free silver ions, is avoided. (iv) The removal of free protons, as PyH+, ensures that the mercaptide-forming reaction
is quantitative and that the reverse of equation (1) is avoided.
REAGENTs
Pyridine-AnalaR.
METHOD
Silver nitrate, approximately 0·4 M, aqueous. Sodium hydroxide, 0·1 N, aqueous-Standardise this solution with pure potassium
hydrogen phthalate.
PROCEDURE-
To 15 ml of pyridine in a stoppered 250-ml conical flask add from a dropper an accurately weighed amount (0·0010 to 0·0018 mole) of the thiol. As soon as possible, gradually add from a pipette 5 ml of the silver nitrate solution. Insert the stopper, and set the flask aside for 5 minutes. Add about 100 ml of distilled water and 3 to 4 drops of phenolphthalein indicator solution, and titrate with 0·1 N sodium hydroxide to a light-pink end-point. Note that the end-point is often recognised as a change in the colour of the yellow silver mercaptide to white,

January, 1961) FOR THE ASSAY OF THIOLS 31
as the pink tint of the supernatant aqueous phase is almost complementary to the yellow of the precipitate.
A simple mixture of the silver nitrate solution and AnalaR pyridine was found to be neutral to phenolphthalein and sensitive to 1 drop of added 0·1 N sodium hydroxide; hence, no blank correction is necessary.
CALCULATION-
10 ml of 0·1 N sodium hydroxide == 0·001 group equivalent of -SH.
The percentage purity of the thiol is given by the expression-
Titre of 0·1 N sodium hydroxide X Equivalent weight of thiol Weight of thiol taken, g x 100
RESULTS
The proposed method was applied to a range of thiols. Ethanethiol and 2-methylpropane-2-thiol (practical grade) were Eastman Kodak products. The others were synthesised by myself and by Messrs. D. Lee and B. R. Trego of these laboratories; details of the methods used will be published elsewhere.
The results are shown in Table I and indicate that the method can be applied to the assay of both saturated and unsaturated primary and secondary thiols and to tertiary aliphatic thiols. The validity of the method is shown particularly by the results for 2-methylpentane-2-thiol, 8 since this compound was shown to be pure by careful gas -liquid chroma:tographic examination. It is therefore considered that the purities found for the other thiols can be accepted with confidence.
Sample
Ethanethiol•
But-2-ene-1-thiol
2-Methylpropane-2-thiol
2-Methylpent-2-ene-1-thiol§
4-Methylpent-3-ene-2-thiol ..
2-Methylpentane-2-thiol
2-Methylpentane-3-thiol Heptane-4-thiol
3-Methylhexane-3-thiol
Dodecane-1-thiol
TABLE I PURITIES OF VARIOUS THIOLS
Molecular weight
62·08
88·11
90·18
116·2
116·2
118·2
118·2 132·3
132·3
202·4
Weight of sample used,
g 0·0906 0·1097 0·1224 0·2209f 0·1221 0·1249 0·1177 0·1249 0·0893 0·1637t 0·1660t 0·1828 0·2488f 0·1347 0·1345 0·2010 0·1486 0·1737 0·1481 0·1719 0·1546 0·1917 0·1972 0·1498 0·1296 0·2063 0·2079
Titre of "0·1 N sodium
hydroxide, ml
14·65 17·85 13·45 24·25 13·40 13·70 12·95 11·60
8·20 18·25 18·40 15·50 2HO 11·60 11·50 17·20 12·80 14·95 12·55 14·55 12·80 14·10 14·45 11·25
9·75 10·00 10·10
Calculated purity,
% 100·4 101·0
96·8 96·7 96·7 96·6 96·9 83·8 82·8
100·6 100·0 98·5 98·6
100·1 100·1 99·5
100·0 100·1 100·2 100·1
97·9 97·3 96·9 99·3 99·5 98·1 98·3
• Results for this thiol refer to the contents of commercially supplied ampoules immediately after being opened.
t Extra silver nitrate solution used because of high weight of sample. t Commercial sample after re-fractionation. § Other isomeric thiols present in sample.
The reproducibility of results by the technique can be judged from the results for but-2-ene-1-thiol and 4-methylpent-3-ene-2-thiol. These two sets of results suggest that a mean

32 FOSTER AND MURFIN; USE OF ALGINIC ACID IN [Vol. 86
deviation of 0·14 per cent. and a maximum deviation of 0·37 per cent. might be accepted as a provisional description of the consistency of the method.
I am grateful to Mr. F. H. Devitt for experimental assistance in this work, which forms part of a programme of research undertaken by the Board of the British Rubber Producers' Research Association.
REFERENCES
1. Emmet Reid, E ., "Organic Chemistry of Bivalent Sulphur," Chemical Publishing Co. Inc., New York, 1958, Volume I.
2. Saville, B., ]. Chem. Soc., 1960, 1730. 3. Hamish, D.P., and Tarbell, D. S., Anal. Chem., 1949, 21, 968. 4. Sampey, J. R., and Emmet Reid, E.,]. Amer. Chem. Soc., 1932, 54, 3404. 5. Kolthofi, I. M., and Harris, W. E., Ind. Eng. Chem., Anal. Ed., 1946, 18, 161. 6. Cecil, R., and McPhee, J. R., Biochem. ]., 1955, 59, 234. 7. Mapstone, G. E ., Austral. Chem. Inst., ] . & Proc. , 1946, 13, 232 and 373. 8. Lee, D. F., Saville, B., and Trego, B. R., Chem. & Ind., 1960, 868.
Received july 18th, 1960
The Use of Formaldehyde-treated Alginic Acid in the Chromatographic Determination of Organic Bases
BY J. S. FOSTER AND J. W. MURFIN
(Standards Department, Boots Pure Drug Co. Ltd., Airdrie Works, Airdrie, Scotland)
Alginic acid, after suitable treatment with formaldehyde, can be used as a carboxylic cation-exchange medium for the quantitative separation of organic bases from solution. The adsorption from aqueous solution and subsequent elution and spectroscopic determination of fourteen organic bases, and also the determinations of codeine phosphate in Compound Tablets of Codeine B.P. and strychnine in Prepared Nux Vomica B.P.C., 1954, and Tincture of Nux Vomica B.P. are described.
Recovery-experiments were satisfactory, and the assay results for codeine and strychnine in the pharmaceutical preparations agreed with those found by the official methods.
THE chemical structure of alginic acid differs only slightly from that of oxycellulose. The use of oxycellulose as a carboxylic cation-exchange medium was described by Freeman1 and enlarged upon by Elvidge, Proctor and Baines2 and Elvidge and Proctor.8 However, oxycellulose is somewhat expensive and at present is not readily available in Britain, whereas alginic acid is cheap and easily obtainable. Both alginic acid and oxycellulose are practically insoluble in water; unfortunately, commercial alginic acid swells on contact with water and in this condition is useless as an ion-exchange medium, as no liquid will pass through a column of it. It has been stated that the "gelling power" of alginic acid and its salts is a function of molecular weight, so it was thought that if commercial alginic acid could be broken down to less polymerised molecules, so that it lost the property of swelling in water, but at the same time retained its insolubility, it might also serve as a medium for adsorbing organic bases from solution. Several treatments, e.g., heating under reflux with water and with various concentrations of hydrochloric and sulphuric acids, were tried without success.
Specker and Hartkamp4 devised a method of minimising this adsorption of water and consequent swelling and used alginic acid for separating certain metallic ions from aqueous solution. Their method of preparation was to precipitate alginic acid from a solution of sodium alginate, separate the precipitate, steep it in methanol for several hours, wash it with acetone and dry it at a temperature not exceed,ing 50° C. Alginic acid so prepared did not immediately "gel" when treated with water and was found quantitatively to remove some organic bases from neutral solutions of their salts--we obtained excellent recoveries of quinine and strychnine by the method described later. However, with certain bases having low extinction coefficients, e.g., atropine and methylamphetamine, when relatively large amounts were adsorbed on the column it was found that the top layer "gelled," completelystopping

January, 1961) CHROMATOGRAPHIC DETERMINATION OF ORGANIC BASES 33
any flow of liquid. Further, after being set aside for several days under water, the columns of alginic acid prepared by Specker and Hartkamp's method became impervious to water or, at best, allowed a much diminished and inconveniently slow rate of flow, even after being stirred and then allowed to settle. Alginic acid prepared as described below was found to be free from these defects.
It is known that heating with formaldehyde prevents "gelling" of starch, and, because alginic acid and starch have molecules of the same general type, it was thought that such treatment might have a similar effect on alginic acid. Deuel,6 while investigating the reaction of pectic acid with formaldehyde, mentioned that alginic acid reacted similarly and noted that the resulting product was insoluble in water. He also indicated that the pectic acid - formaldehyde complex could be used as a cation-exchange medium and mentioned the removal of copper and nicotine from aqueous solution, without giving any quantitative details. The product obtained by us did not form a gel when treated with water, was practically insoluble in water and was found quantitatively to adsorb organic bases from aqueous solutions of their salts. On elution with dilute sulphuric acid, a solution of the base suitable for spectrophotometric assay was obtained. Alginic acid, grade HA/LE, obtainable from Alginate Industries Ltd., Bedford Street, London, W.C.2, was used in this investigation.
METHOD
PREPARATION OF "NON-GELLING" ALGINIC ACID-
A suitable amount of alginic acid was well mixed to a damp paste with formaldehyde solution (40 per cent.). This paste was heated in a loosely closed screw-capped jar at 80° C for 8 hours and was then transferred to a clock-glass and dried at 100° C. (Overheating should be avoided or the product will tum dark brown; this does not appear to be detrimental to the base-exchange properties, but the alginic acid is difficult to wash clean for use.) The resulting cake was broken up and sifted through 22- and 100-mesh B.S. sieves, the granular powder remaining between the sieves being reserved for use.
PREPARATION OF COLUMN-
Pyrex-glass tubes of internal diameter about 1·5 to 2 em were used. Three grams of prepared alginic acid were made into a slurry with about 50 ml of 10 per cent. w jw sulphuric acid and transferred to the tube, which had been previously plugged with cotton- or glasswool. The alginic acid was allowed to settle, and a second plug was placed on top to avoid disturbance of the upper surface of the column. The column was washed with N sulphuric acid until the washings had no measurable extinction between 220 and 350 ml-' and then with water until the effluent was no longer acid. A rate of flow of upwards of 5 ml per minute could be obtained without applying air pressure to the top of the column; in fact, pressure tended to compact the column material and so reduce the rate of flow. A rate of about I ml per minute was used to obtain the results in Table I, but results were similar when some of the experiments were repeated with a rate of 3 ml per minute. When not in use the column was left submerged in water.
GENERAL PROCEDURE-
The optical densities of nicotinamide and thirteen salts of different organic bases, dissolved in N sulphuric acid, were measured at their wavelengths of maximum absorption; 1-cm cuvettes were used, with N sulphuric acid in the comparison cuvette. Aqueous solutions of suitable concentration were then prepared, each of which was treated as described below.
An aliquot was transferred to the column, which was then .washed with two 25-ml portions of water, and the base was eluted with a suitable volume of N sulphuric acid, the optical density being measured at the pea:k wavelength, as before. Recoveries were based on comparison of optical densities before and after passage of the base through the column.
All recoveries reported in this paper were calculated in this manner; details are shown in Table I.
After elution of the base, the column was washed with water until free from acid, when it was ready for further use.

34 FOSTER AND MURFIN: USE OF ALGINIC ACID IN [Vol. 86
APPLICATIONS OF THE METHOD Procedures for determining codeine phosphate in Compound Tablets of Codeine B.P.
and of strychnine in Prepared Nux Vomica B.P.C., 1954, and in Tincture of Nux Vomica B.P. were adapted from existing methods involving use of oxycellulose columns.3
TABLE I RECOVERY OF ORGANIC BASES FROM AQUEOUS SOLUTIONS
Volume of Weight of Volume of solution compound sulphuric Wavelength
placed on placed on acid of optical-density Recovery Compound used column, column, eluate, measurement, of base,
ml mg ml mp. % Adrenaline acid tartrate 10 5 100 279 99·3
99·3 99·3
Atropine sulphate .. 50 40 50 275 99·5 100·4 100·8
Cocaine hydrochloride 20 15 100 275 99·4 99·8
100·7 Codeine phosphate 10 8 50 284 99·4
99·5 Diamorphine hydrochloride 20 10 100 279 99·1
99·3 99·6
Ethylmorphine hydrochloride 20 10 100 284 99·8 100·0 100·7
Hyoscine hydrochloride 10 40 50 257 100·0 100·0 100·8
Lobeline hydrochloride 10 3 200 249 100·4 100·4 100·4
Methylamphetamine hydrochloride 25 20 50 257 98·5 100·0 100·5
Morphine sulphate 10 10 100 285 100·0 100·2 100·9
Nicotinamide 10 1 100 261 99·3 99·6 99·8
Procaine hydrochloride 5 100 228 98·7 98·7 99·1
Quinine hydrochloride 10 3 50 347 99·8 99·9 99·9
Strychnine hydrochloride 10 2 100 254 100·0 100·0 100·5
COMPOUND TABLETS OF CODEINE B.P.-Elvidge has used oxycellulose to separate codeine from the other ingredients. His
procedure was applied in this laboratory and later modified slightly in order to use alginic acid as base-exchange material. The method described below is based on Elvidge's pro-cedure.
To twenty tablets in a dry, stoppered flask add 200 ml of water by pipette, and shake the flask for 20 minutes. Filter the contents through a Whatman No. 30 filterpaper, and reject the first few millilitres of filtrate. Pass 10 ml of filtrate through the column, and wash with two successive 25-ml portions of water. Elute the codeine to volume into a 100-ml calibrated flask with N sulphuric acid, and measure the optical density of the eluate at 284 mp. in a 1-cm cuvette; use N sulphuric acid in the comparison cuvette.
January, 1961] CHROMATOGRAPHIC DETERMINATION OF ORGANIC BASES 35
Low recovery of codeine phosphate might be expected, since the alkaloid has to be adsorbed from a solution more acid than that used in the simple recovery experiment already detailed. A standard solution of codeine phosphate in saturated acetylsalicylic acid solution was prepared, the concentration of codeine phosphate being that calculated to be present when the method was applied to the tablets. Recoveries of 100·0, 99·7, 99·0 and 99·7 per cent. were obtained; these were calculated as previously described.
In further recovery experiments, two mixtures were prepared (each equivalent to twenty tablets) from 'accurately weighed amounts of codeine phosphate, aspirin, phenacetin and tablet excipient. These mixtures were examined by the proposed method. Four aliquots of each filtrate were assayed for codeine phosphate; the results were-
Recovery of codeine phosphate from mixture No. 1, % 100·0, 100·0, 100·0, 99·7 Recovery of codeine phosphate from mixture No. 2, % 99·5, 99·5, 99·8, 99·8
To examine the precision of the method further, determinations were made on aliquots of a filtrate obtained from twenty tablets. Weights of codeine phosphate found per tablet were 0·00771, 0·00771, 0·00766, 0·00769 and 0·00766 g.
To compare the method with that described in the British Pharmacopoeia the results, taken at random, of a hundred determinations on production samples were examined. By the B.P. method, the range was 7·52 to 8·30 mg of codeine phosphate per tablet, with a standard deviation of 0·13 mg per tablet. The proposed method gave a range of 7 ·49 to 8·32 mg per tablet, with a standard deviation 0·13 mg per tablet. In these experiments, the optical density was compared with that of a batch of codeine phosphate used in preparing the tablets.
TABLE II EXTINCTION VALUES FOR STRYCHNINE AND BRUCINE
The solvent used was N sulphuric acid Measurements at 262 ml-' Measurep1ents at 300 ml-'
No. of Average value Coefficient of Average value Coefficient of Alkaloid samples ofE~~ variation, ofE~~ variation,
% % Strychnine .. 5 318 0·71 4·59 4·0 Brucine 4 314 0·43 216 1·9
PREPARATIONS CONTAINING NUX VOMICA-
Nux vomica contains strychnine and brucine in approximately equal proportions. The strychnine content is given by the equation-
Strychnine content,% wjv = 0·00321A - 0·00467B,
in which A and B are the optical densities (1-cm cell) of the solution at 262 and 300 mp., respectively. This equation was derived3 from the values of E}~ for the two alkaloids at these wavelengths (see Table II); it was later emended in a personal communication from Mr. K. A. Proctor. These wavelengths were selected as being the most suitable because the composite absorption curve has a maximum at 262 mp. and a point of inflexion at 300 mp..
For nine different preparations, Elvidge and ProctorS found that strychnine and brucine could be quantitatively adsorbed on oxycellulose, washed free from impurities, eluted with acid and then determined by the two-point method. We have examined two of these preparations and have found that alginic acid can replace oxycellulose as column material. We see no reason to suppose that it would not be suitable for the others.
TINCTURE OF Nux VoMICA B.P.-
Five millilitres of sample were diluted to 100 ml with 95 per cent. ethanol. A 10-ml portion of this solution was placed on a column consisting of 3 g of alginic acid, washed with 25 ml of ethanol and then with 50 ml of water, and the alkaloids were finally eluted to volume into a 50-ml calibrated flask with N sulphuric acid. Optical densities were measured at 262 and 300 mp. in a 1-cm cuvette.
Nine aliquots of the diluted tincture were treated in this way. Six results of 0·125 per cent. and three of 0·126 per cent. of strychnine were obtained; the official chemical assay gave 0·125 per cent. of strychnine.

36 REID AND TURNER: THE DETERMINATION [Vol. 86
PREPARED Nux VoMICA B.P.C.-Two grams of the finely powdered sample were extracted continuously with 150 ml of
70 per cent. ethanol for 2 hours. When cool, the extract was transferred to a 200-ml calibrated flask and diluted to volume with 70 per cent. ethanol. A 5-ml portion of this solution was placed on a column consisting of 3 g of alginic acid. The column was washed successively with 10 ml of ethanol, 50 ml of chloroform, 10 ml of ethanol and 50 ml of water. The alkaloids were eluted to volume with N sulphuric acid into a 50-ml calibrated flask, and the optical densities of the eluate were measured at 262 and 300 mp..
The assay was carried out in duplicate on two separate portions of the original sample, each of the two ethanolic extracts being assayed in quadruplicate. Strychnine contents of 1·24, 1·24, 1·25 and 1·25 per cent. and 1·27, 1·27, 1·27 and 1·27 per cent. were obtained. These results agreed well with the figure of 1·25 per cent. by the B.P. method.
DISCUSSION OF THE METHOD Formaldehyde-treated alginic acid has been shown to act as an ion-exchange medium
for the separation of organic bases from their solutions. It is similar in activity to oxycellulose and is superior to it in a number of ways. Alginic acid is much cheaper and is readily available in this country, but it requires treatment with formaldehyde before it can be used with aqueous solutions, whereas oxycellulose can be used directly as received. Formaldehyde-treated alginic acid is more stable and does not need to be stored in a refrigerator (as does oxycellulose). In our hands, after a few weeks of use, columns of oxycellulose have compacted so tightly as to give an inconveniently slow rate of flow, which could not be improved by stirring the column and allowing it to settle. By contrast, columns of formaldehyde-treated alginic acid (3 g) have been in daily use for more than 6 months with no more treatment than occasional stirring and settling and then decantation of fines, without any noticeable decrease in the rate of flow.
In experiments to check the adsorbing power of formaldehyde-treated alginic acid, a 3-g column adsorbed 100 mg of strychnine (as 5-ml aliquots of a 0·1 per cent. solution, washing with 50 ml of water after each aliquot at a flow rate of 4 ml per minute); the liquid leaving the column was free from strychnine during the experiment.
The carboxylic acid content of the dried powder after treatment with formaldehyde, calculated from a potentiometric titration of the acidity, was about 25 per cent. for the HA/LE grade of alginic acid.
REFERENCES 1. Freeman, F. M., ]. Pharm. Pharmacal., 1956,8, 42. 2. Elvidge, D. A., Proctor, K. A., and Baines, C. B., Analyst, 1957, 82, 367. 3. Elvidge, D . A., and Proctor, K. A.,]. Pharm. Pharmacal., 1957, 9, 974. 4. Specker, H., and Hartkamp, H., Z. anal. Chem., 1953, 140, 167. 5. Deuel, H., Helv. Chim. Acta, 1947, 30, 1269.
Received August 19th, 1960
The Determination of Water in Plastic Materials BY V. W. REID AND L. TURNER
(Petrochemicals Limited, Carrington Research LaboratOf'y, Urmston, Manchester)
A Karl Fischer titration procedure has been developed for the direct determination of water in plastic materials. The method has proved particularly useful for the determination of water in black polyethylene.
THE presence of water in plastics may be deleterious for a number of reasons. For instance. it is well known that pol~ethylene containing carbon black may absorb moisture, which will give rise to extrusion problems, such as bubbling, during subsequent processing. It is therefore desirable to be able to determine trace amounts of water in plastic materials.
Methods involving use of drying procedures for determining water in plastics are unsatisfactory, as they do not distinguish between water and any other volatile material that may be present. Water present on the surface of polymer granules may be determined readily by
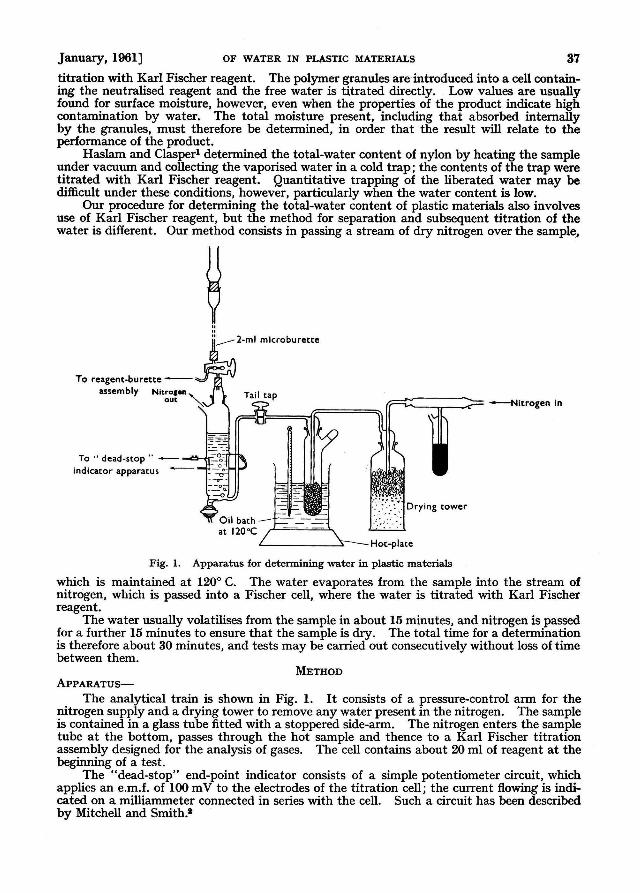
january, 1961) OF WATER IN PL4\STIC MATERIALS 37
titration with Karl Fischer reagent. The polymer granules are introduced into a cell containing the neutralised reagent and the free water is titrated directly. Low values are usually found for surface moisture, however, even when the properties of the product indicate high contamination by water. The total moisture present, including that absorbed internally by the granules, must therefore be determined, in order that the result will relate to the performance of the product.
Haslam and Clasper1 determined the total-water content of nylon by heating the sample under vacuum and collecting the vaporised water in a cold trap; the contents of the trap were titrated with Karl Fischer reagent. Quantitative trapping of the liberated water may be difficult under these conditions, however, particularly when the water content is low.
Our procedure for determining the total-water content of plastic materials also involves use of Karl Fischer reagent, but the method for separation and subsequent titration of the water is different. Our method consists in passing a stream of dry nitrogen over the sample,
To reagent-buretteassembly
To " dead-stop " -indicator apparatus -
~ " " 2-ml microburette
Hot-plate
Fig. 1. Apparatus for determining water in plastic materials
which is maintained at 120° C. The water evaporates from the sample into the stream of nitrogen, which is passed into a Fischer cell, where the water is titrated with Karl Fischer reagent.
The water usually volatilises from the sample in about 15 minutes, and nitrogen is passed for a further 15 minutes to ensure that the sample is dry. The total time for a determination is therefore about 30 minutes, and tests may be carried out consecutively without loss of time between them.
METHOD APPARATUS-
The analytical train is shown in Fig. 1. It consists of a pressure-control arm for the nitrogen supply and a drying tower to remove any water present in the nitrogen. The sample is contained in a glass tube fitted with a stoppered side-arm. The nitrogen enters the sample tube at the bottom, passes through the hot sample and thence to a Karl Fischer titration assembly designed for the analysis of gases. The cell contains about 20 ml of reagent at the beginning of a test.
The "dead-stop" end-point indicator consists of a simple potentiometer circuit, which applies an e.m.f. of 100 mV to the electrodes of the titration cell; the current flowing is indicated on a milliammeter connected in series with the cell. Such a circuit has been described by Mitchell and Smith.2

38
REAGENTs-
REID AND TURNER: TilE DETERMINATION [Vol. 86
Karl Fischer reagent-Prepare the reagent as described by Peters and Jungnickel.8 This solution has low volatility and will not volatilise into the stream of nitrogen. Adjust the concentration of the reagent so that 1 ml is equivalent to approximately 3 mg of water, and standardise daily.
Drying agent-Use anhydrous magnesium perchlorate for drying the nitrogen.
PROCEDURE-
Switch on the hot-plate, and adjust it so that the oil bath maintains a temperature of 120° C. Adjust the cell to the "dead-stop" end-point by titrating with reagent, and start a steady flow of nitrogen through the apparatus, which is assembled as shown in Fig. 1, the glass tube immersed in the oil bath being empty at this stage. Adjust the flow of nitrogen to about 0·5 litre per minute.
Add 0·1 ml of Karl Fischer reagent to the contents of the cell; the "dead-stop" indicator will swing to the "dry" side. As the apparatus dries, traces of water will enter the cell and the indicator will slowly move back to the reference point. As the indicator reaches the reference point, add a further 0·1-ml portion of reagent. Repeat additions of reagent in this way until nitrogen passes for 15 minutes without causing the "dead-stop" indicator to move from the "dry" side back to the reference point. The apparatus is now dry.
The indicator will slowly reach the reference point, and, when this happens, remove the stopper from the side-arm of the glass tube immersed in the oil bath. Rapidly transfer a weighed amount of polymer (about 20 g) to the tube, and replace the stopper in the side-arm. Note the volume of reagent in the burette, and add a 0·1-ml portion to the contents of the cell. Water liberated from the polymer passes to the cell and causes the indicator to move back to the reference point. Each time the indicator moves to the reference point, add a further 0·1 ml of reagent.
When all the water has vaporised from the polymer, the nitrogen will pass for a long time while the "dead-stop" indicator remains on the "dry" side of the reference point. Take the end-point as being when a 0·1-ml portion of reagent keeps the indicator on the "dry" side of the reference point for 15 minutes. Record the volume of reagent added from the time that the sample was introduced, and calculate the water content of the polymer from the expression-
Water content,% wjw = ~ ~ io where Vis the volume of reagent used, in millilitres, W is the weight of sample, in grams, and F is the concentration of the Karl Fischer reagent, in milligrams per millilitre.
ACCURACY AND REPRODUCIBILITY
The method has been found particularly useful for determining water in polyethylene stabilised with carbon black. To check the accuracy of the method in this particular application, we stored several weighed dishes, containing accurately weighed amounts of a sample of black polyethylene moulding nibs, in a desiccator over water. Water was determined on the original sample and a daily note was made of the increase in weight of each dish. We calculated the increase in water content occurring each day through pick-up of moisture and added this to the determined water content of the original sample. This gave a daily value for the total water content of the nibs, the only assumption being that the original water determination was correct.
Each dish contained sufficient black polyethylene to allow us to carry out a water determination, and parallel comparative water determinations by the proposed method were carried out over 7 days. The results were-
Water content by weight increase, % wfw .. Water content by proposed method, % wfw. . 0·05
0·071 0·084 0·090 0·100 0·113 0·080 0·090 0·096 0·106 0·126
from which it can be seen that the direct determinations gave values in close agreement with the water contents obtained by measuring the increase in weight.
At the end of the 7-day period the surface moisture on the two remaining dishes was determined by the direct Fischer titration method. The low values obtained for surface

January, 1961] OF WATER IN PLASTIC MATERIALS 39
water (0·013 and 0·014 per cent. w jw) indicated that most of the water had permeated into the interior of the nibs and been adsorbed on the charcoal black.
The method has_ now been regularly applied for some 2 years, during which time several hundred determinations have been made on a variety of plastic materials. The results obtained over this period indicate the reproducibility of the method to be of the order of ± 10 per cent. of the water content determined when this is in the region of 0·0 to 0·5 per cent.
We thank the Directors of Shell Chemical Company Limited for permission to publish this paper.
REFERENCES I. Haslam, J., and Clasper, M., Analyst, 1952,77, 413. 2. Mitchell, J ., jun., and Smith, D. M., "Aquametry," Interscience Publishers Inc., New York,1948,
p. 86. 3. Peters, E. D., and Jungnickel, J. L., Anal. Chem., 1955,27, 450.
Received July 18th, 1960
The Determination of Trace Elements by Fast-neutron
Activation Analysis BY R. F. COLEMAN
(U.K. Atomic Energy Authority, Atomic Weapons Research Establishment, Aldermaston, Berks.)
The use of fast neutrons in trace analysis is des~ribed. Details are given of a method of producing a large flux of 14·5-MeV neutrons suitable for activation analysis; the cost is about £20,000. Suitable reactions, together with cross-sections and probable limits of detection, are quoted for nearly all the elements of the periodic table.
THE determination of trace elements by activation with thermal neutrons is now a well established technique1 •2 and the sensitivity of this method for many elements is higher than that of any other conventional physical or chemical method. The chief disadvantage is the scarcity of reactors having suitable neutron fluxes and containing facilities for irradiation; also, when the nuclear products are short they can only be examined in the vicinity of the reactor. To overcome these difficulties De and Meinke3 used a 1- to 5-curie antimonyberyllium source emitting about 106 neutrons per second, but for most elements a higher neutron flux is required to attain the necessary sensitivity.
In this paper the use of fast neutrons in analysis is discussed. One of the chief aims is to show that an adequate flux of fast neutrons for trace analysis can be obtained at comparatively low capital cost. Neutrons of 14 MeV are produced by bombarding a tritium target with deuterons from a suitable high-voltage generator, usually a Cockroft- Walton machine, and these are used to activate the samples for analysis. Many elements can be determined in this way with high sensitivity, and several common elements difficult or impossible to detect with slow neutrons can be readily determined by activation with fast neutrons.
Fast neutrons have been little used in trace analysis, with the exception of the determination of oxygen in beryllium.' Turner6 used fast neutrons in analysis, but to determine macro amounts of aluminium and silicon.
NUCLEAR REACTIONS WITH 14-MeV NEUTRONS With slow neutrons, there is mostly only one possible neutron reaction, i.e., radiative
capture, but with fast neutrons many reactions are possible, the most useful being (n,p), (n,at) and (n,2n). With 14-MeV neutrons, the first two predominate for the lighter elements, but decrease with increasing atomic number; the (n,2n) cross-section increases with atomic number and for elements having atomic numbers greater than 50 is usually 1 to 2 barns. The cross-section for the (n,y) reaction is usually too small for analytical purposes. It has been measured by Perkin, O'Connor and Coleman6 and for most elements is about 5 millibarns, but much less for light elements.

40 COLEMAN: THE DETERMINATION OF TRACE [Vol. 86
This multiplicity of reactions widens the scope of the method, but it has one disadvantage. Sometimes the nuclide formed from one element may also be formed by another reaction from an element differing in atomic number by one or two. For example, &9Co(n,oc)66Mn and 66Fe(n,p)66Mn have the same final product. Whenever possible, one should choose a reaction in which the· nuclide produced cannot be formed from any other element. If this is not possible, and other reactions contribute significantly to the nuclide produced, the contribution must be calculated and subtracted.
PRODUCTION OF FAST NEUTRONS
A large flux of fast neutrons is most conveniently produced by the deuterium - tritium reaction, i.e., 2H + 8H -+'He + ln. The cross-section for the deuterium - tritium reaction has a resonance at 107 KeV, so that, for maximum production of neutrons, the deuteron energy must be 107 KeV at some point in the target.
In most of my work the deuterons were accelerated by a Cockroft- Walton machine to energies of about 300 to 600 KeV. The tritium was usually in the form of a titanium or zirconium tritide target, 8 mm in diameter, and the deuterons were completely stopped in the target. When a target of about 5 mg of titanium per sq. em and a titanium to tritium atom ratio of l was used with a 50-J.LA beam of D+ ions, outputs of 3 x 10¹⁰ neutrons per second were achieved, giving a flux of about 1010 neutrons per second per sq. em through a sample placed close to the back of the target. Other workers have produced larger yields of neutrons, e.g., Bronner and his co-workers7 claimed 1011 to 1012 neutrons per second from the Arkansas machine spread over a target 3·2 em in diameter, but, because of the cooling system, only 7 per cent. of the neutrons will pass through l sq. em of sample close to the back of the target.
Gunnersen and James8 have shown that it is possible to produce 108 neutrons per JLA per second with 125-KeV deuterons, provided that the amount of oxide and carbon on the surface of the target is very small. As ion sources capable of supplying as much as 10 rnA of current are obtainable, it should be possible to produce 1012 neutrons per second from a high-voltage power pack, provided that the target does not overheat. Above 230° C, the tritium targets begin to lose tritium, and a beam of 10 rnA per sq. em will rapidly exceed this temperature if special cooling is not applied. In addition to cooling the target area, the heat generated per sq. em should be reduced. This is best achieved by having a large target, say, 50 sq. em, and rotating it rather than by spreading the deuteron beam over a large area. By careful design it would still be possible to get one third of the neutron output through l sq. em of sample close to the target.
The cost of a high-voltage generator and ancillary equipment to give a 10-mA beam of 150-KeV deuterons would be about £8000 to £10,000. A source of 1012 neutrons would require careful shielding (about 8 feet of concrete would be necessary). For activation analysis it is unnecessary to have a large scatter-free space around the neutron source and so the shielded volume could be small. It has been estimated that a building large enough to house the accelerator and controls and shield a target room 7 feet square and 7 feet high with concrete would cost £6000 to £10,000. A fairly versatile source of 1012 neutrons could therefore be made for a capital cost of £20,000. For the purposes of this paper, however, a flux of 1010 neutrons through the sample will be assumed, as this is readily available in many laboratories.
EXPERIMENTAL TECHNIQUES
The sample to be irradiated must be placed as close to the neutron source as possible in order to get a maximum number of neutrons through it. Samples must also have a well defined shape so that the irradiation geometry is reproducible; this can be achieved by using a machined sample, as in the determination of oxygen in beryllium,' or, alternatively, a powdered sample supported in a plastic holder. The sample would normally be irradiated for a time similar to the half-life of the reaction product or for a few hours, whichever is shorter.
The output of neutrons from the target is monitored by a "long counter," the pulses being fed via a ratemeter into a fast recorder. The neutron output and the time of irradiation are measured on the recorder chart. At the end of the irradiation, the samples are counted directly or, more usually, treated by conventional chemical techniques to separate the desired nuclide from the impurities and then counted. For a residual nucleus having a half-life of the order of a few seconds, special techniques, such as those described by Coleman and Perkin,9 for the precise timing of the irradiation and rapid transfer of the target to a counter or chemical-separation apparatus ate necessary.

January, 1961] ELEMENTS BY FAST-NEUTRON ACTIVATION ANALYSIS 41
To determine trace amounts of any element in a sample, both the sample and a standard of the same size containing a known, weighed and evenly distributed amount of the element being determined are irradiated, processed and counted in the same way. The activity of the trace element is normalised to a fixed neutron flux, and the amount of impurity in the sample can then be inferred from the standard. This method overcomes most of the difficulties in obtaining accurate results by eliminating errors in counter calibration and in variation of neutron flux through the sample.
SENSITIVITY
The sensitivity of the method for all the stable elements and uranium and thorium has been calculated, cross-sections taken from several sources10 •11 •12 •13 being used; the results are shown in Table I. For these calculations, a final activity of 100 disintegrations per minute was required when irradiated in a flux of 1010 neutrons per second per sq. em. The sensitivity has been calculated for irradiations of 4 hours and to saturation. (Generally, 4 hours would be as long as one would want to spend on the irradiation, particularly if the chemical separations and counting had to be completed during the same day.) Some reactions have been included in Table I when the cross-sections are unknown, but the sensitivity for these elements would usually be at least I p.g. No correction has been made for radioactive decay. As suggested above, it should be possible to produce fluxes of fast neutrons considerably larger than 1010 and this would increase the sensitivity and make the method even more attractive for extremely small traces of elements.
The intefering elements listed in Table I are those elements capable of producing the same nuclide by another reaction with fast neutrons. The (n,y) products are not listed, as these would normally be lower in intensity by a factor of 100 and could only interfere if present in considerable excess.
Element
Hydrogen Helium . .
Lithium
Beryllium
Boron ..
Carbon .. Nitrogen Oxygen .. Fluorine
Neon
Sodium . .
Magnesium
Aluminium
Silicon ..
Phosphorus
Sulphur
Chlorine ..
Argon ..
Potassium
Calcium Scandium
TABLE I
REACTIONS SUITABLE FOR FAST-NEUTRON ACTIVATION ANALYSIS
Sensitivity after irradiation-
Cross-section, Half-life of for 4 to Interfering
Possible reaction millibarns product
{'Li(n,p)'He 6 0·8 second • • 7Li(n,d)'He 10 0·8 second . . 0Be(n,«)'He ? 0·8 second
{ 11B(n,«)8Li 30 0·8 second . . 11B(n,p)11Be ? 14 seconds
"N(n,2n)18N 5 10 minutes uo(n,p)UN 80 7·4 seconds 10F(n,2n)18F 61 112 minutes
{""Ne(n,2n)11Ne ? 18 seconds • • 10Ne(n,p)1°F ? 11 seconds • • 18Na(n,p)13Ne 34 40 seconds rMg(n,p)•No 190 15 hours • • 16Mg(n,p)15Na 60 1 minute
17Al(n,«)"'Na 114 15 hours • • 17 Al(n,p)17Mg 80 9 minutes
18Si(n,p)18Al 200 2 minutes • • 10Si(n,p)10Al 100 6 minutes
81P(n,2n)80P 8 2·5 minutes . . SlP(n,p)nSi 80 2·6 hours •• 31S(n,p)82P 370 14 days
r'Cl(·.··)"Cl 4 32 minutes . . 87Cl(n,p)87S 28 5 minutes
' 0A(n,p)'°Cl ? 1·4 minutes . . •• A(n,«)87S ? 5 minutes
01K(n,p)01A 80 110 minutes • • 01 K(n,«)88Cl 50 37 minutes
"Ca(n,p)"K ? 37 minutes ••Sc(n,2n)"Sc 4 hours and
2·4 days
hours, saturation, elements p.g p.g
4 4 0·2 0·2 ? ?
0·1 0·1 ? ?
0·8 0·8 0·06 0·06 0·1 0·08 ? ? ? ?
0·2 0·2 0·2 0·05 1·0 1·0 0·1 0·02 0·1 0·1 0·04 0·04 2·0 2·0 1·0 1·0 0·2 0·1 3·0 0·02 3·0 3·0 1·0 1·0 ? ? ? ?
3 2 4 4 ? ?
Be Be Li
F
Na Mg AI
Mg Si p
s Cl
A
Cl Ca A

42 COLEMAN: THE DETERMINATION OF TRACE [Vol. 86
TABLE I (continued)
Sensitivity after irradiation-
Cross-section, Half-life for 4 to Interfering
Element Possible reaction millibarns of product hours, saturation, elements p.g p.g
Titanium .. {"Ti(n.2n)"T; 50 3 hours 4 3 ' 8Ti(n,p)08Sc 58 44 hours 0·5 0·03 v
Vanadium . . 61V(n,p)61Ti 27 6 minutes 0·5 0·5 Cr 61V(n,ot)'8Sc 30 44 hours 7 0·5 Ti
Chromium • • 51Cr(n,p)51V 78 3·7 m inutes 0·2 0·2 Mn &OCr(n,2n)"Cr ? 42 minutes ? ?
Manganese • • 615Mn(n,ot)51V 30 3·7 minutes 0·5 0·5 v Iron . . { 68Fe(n,p)60Mn 110 2·5 hours 0·2 0·1 Co
60Fe(n,2n) .. Fe ? 9 minutes ? ? Cobalt . . 61Co(n,ot)68Mn 31 2·5 hours 0·8 0·6 Fe Nickel 81Ni(n,p)81Co 180 99 minutes 12 10
68Ni(n,2n)"Ni 52 36 hours 4 0·3 "'Cu(n,2n)81Cu 600 10 minutes 0·04 0·04
Copper 86Cu(n,2n)MCu 954 13 hours 0·2 0·06 Zn 86Cu(n,p)86Ni 27 2·5 hours 3 2 Zn
Zinc MZn(n ,2n)uzn 200 38 minutes 0·2 0·2 MZn(n,p)MCu 390 73 hours 0·4 0·1 Cu 81Ga(n,2n)88Ga 530 68 minutes 0·06 0·06
Gallium 71Ga(n,2n)7°Ga 700 21 minutes 0·07 0·07 Ge ••Ga(n,p)••zn 24 13 hours 7 1·0 Zn,Ge ••Ga(n,ot) 88Cu 39 5 minutes 0·5 0·5 Zn 70Ge(n,2n)81Ge 700 40 hours 2 0·1
Germanium 78Ge(n,2n) 76Ge 1800 86 minutes 0·2 0·1 As, Se 78Ge(n,p)'8Ga 140 5 hours 5 2 71 As(n,2n)"As 540 17 days 7 0·05 Se
Arsenic . . 76 As(n,p)'"Ge 12 86 minutes 2 2 Ge, Se 7•As(n,ot)71Ga 12 8 minutes 2 2 Ge
Selenium 81Se(n,2n)11Se 1500 57 minutes 0·2 0·2 Br, Kr aose(n,ot)77Ge 40 57 seconds < 5 1·0
and 12 hours 71Br(n,2n)'8Br 1100 6 minutes 0·04 0·04 Kr
Bromine 81Br(n,2n)80Br 800 44 hours 0·1 0·05 Kr B1 Br( n ,ot}'" As 100 90 minutes 0·5 0·5 Se
Krypton ••Kr(n,'2n)86Kr 4·4 hours ? ? Rb, Sr MKr(n ,p)MBr 32 minutes Rb
Rubidium 87Rb(n,p)87Kr ? 78 minutes ? 87Rb(n,ot)MBr 40 32 minutes 2 2 Kr
Strontium 88Sr(n,p)88Rb 18 18 minutes 2 2 88Sr(n,ot) 86Kr 60 4·4 hours 1 0·5 Rb, Kr
Yttrium . .
Zirconium . . rZ<(n.2n)"Z' 80 4 minutes 0·6 0·6 Mo and 79 hours
MZr(n,p)11Y 11 16 minutes 14 14 Niobium • • 18Nb(n,ot)10Y 10 64 hours 50 2 Zr
tsNb(n ,2n)t2Nb ? 13 hours ? Mo and 11 days
Molybdenum {'"Mo(n,2n)11Mo 200 15 minutes 1 1
· · 100Mo(n,2n)"Mo 4000 66 hours 2 0·07 Ru
Ruthenium 17Mo(n,p)17Nb llO 73 minutes 3 2
Rhodium 11Ru(n,2n)NRu 480 98 minutes 1 1
Palladium . . f'Pd(•.2•J-Pd 2000 13 hours 0·4 0·1 Cd, Ag 106Pd(n,p)106Rh 700 36 hours 2 0·2
Silver . . 107 Ag(n,2n)10• Ag 550 24 minutes 0·1 0·1 Cd
Cadmium 101 Ag(n ,2n)10B Ag 800 2·3 minutes 0·08 0·08 Cd
• • 111Cd(n,2n)116Cd ? 55 hours ? ? In, Sn Indium . . ~mln(n.p)"'Cd 15 55 hours 50 2 Cd, Sn
u•In(n,2n)ll•Jn ? 20 minutes ? ? Sn Antimony • • 111Sb(n,2n)110Sb 750 16 m inutes 0·08 0·08 Te
Tin 111Sb(n,2n)1"Sb 1200 2·8 days 2 0·07 Te
· · 111Sn(n,2n)111Sn ? 27 hours ? ? Sb,Te Tellurium .. { 118Te(n,2n)117Te 800 9 hours 0·5 0·1 I, Xe
110Te(n,2n)li'Te 600 72 minutes ? 0·2 Xe
Iodine 127I(n,2n)118I and 33 days
.. 1350 13 days 3 0·03 Xe

January, 1961] ELEMENTS BY FAST-NEUTRON ACTIVATION ANALYSIS 43
TABLE I (continued)
Sensitivity after irradiation-
Cross-section, Half-life for 4 to Interfering
Element Possible reaction millibarns of product hours, saturation, elements p.g p.g
Xenon 00
111Xe(n,2n)1"Xe 9 hours ? ? Ba Caesium .. 1UCs(n,2n)11'Cs ? 6·2 days ? ? Ba
{1aaBa(n,2n)117Ba 1200 2·6 minutes 0·03 0·03 Ce Barium . . . . 1aeBa(n,2n)116Ba 700 28 hours 7 0·07
la•Ba(n,p)u•cs 2·2 32 minutes 22 22 Lanthanum u•La(n,p)111Ba 2·3 85 minutes 18 17 Ce, Ba Cerium .. uaee(n,2n)1&1Ce 1600 33 days 50 0·2 Pr, Nd Praseodymium 1nPr(n,2n)160Pr 2100 3·4 m inutes 0·02 0·02
i~Nd(n,2n)~Nd 2600 2·5 hours 0·08 0·08 Neodymium • • U 8Nd(n,2n)147Nd 2160 11 days 30 0·3 Sm
160Nd(n,2n)101Nd 2200 1·8 hours 0·4 0·3 Sm
Samarium u•Sm(n,2n)l"Sm 1200 8·5 minutes 1 1 · · 160Sm(n,2n)161Sm 1500 45 hours 2 0·1 Eu, Gd
Europium 161Eu(n,2n)160Eu 500 15 hours 0·8 0·2 · · 161Eu(n,2n)u•Eu 750 9 hours 0·4 0·1 Gd
Gadolinium 18°Gd(n,2n)161Gd 1450 18 hours 0·8 0·1 Yb, Dy Terbium 161Tb(n,p)101Gd ? 18 hours ? Gd Dysprosium 111Dy(n,p)u'Tb 14 minutes Ho Holmium 166Ho(n,2n)1"'Ho ? 36 minutes ? ? Er
Erbium . . { 118Er( n, 2n)166Er 1000 HI hours 0·7 0·1 Yb · · 170Er(n,2n)11'Er 1200 9·8 days 25 0·3 Tm, Yb
Thulium . . 111Tm(n,a;)188Ho ? 27 hours ? ? Er Ytterbium . . 178Yb(n,2n)176Yb 430 4·2 days 5 0·1 Lu, Hf
Lutecium { 176Lu(n,p)176Yb 3·4 4·2 days 1000 20 Yb · · mLu(n,2n)mLu 1600 160 days 50 0·03 Hf
Hafnium 178Hf(n,p)178Lu ? 22 minutes ? ? Ta Tantalum . . U1Ta(n,2n)1B0Ta 900 8 hours 0·2 0·06 w Tungsten {1"'W(n,p)1"'Ta 4·7 8·7 hours 120 30 Re
· · 111W(n,p)1BITa 2·9 10 minutes 50 50 Rhenium 187Re(n,2n)1&1Re ? 91 hours ? ? Os Osmium . . U1Qs(n,2n)111Qs 14 hours and ? Ir, Pt
Iridium . . 111Jr(n,2n)110Ir 16 days
3 hours and Pt 11 days
Platinum 118Pt(n ,2n)117Pt 2800 18 hours 2 0·3 Hg,Au Gold U7Au(n, 2n)u•Au 2600 5·5 days and <I 0·02 Hg
14 hours Mercury .. u•Hg(n,2n)111Hg 24 hours and
65 hours Thallium 101Tl(n,2n)101Tl ? 12 days ? ? Lead •••Pb(n,a;)*Hg 1·5 5 minutes 80 80 Tl, Hg Bismuth . . 101Bi(n,p)101Pb 1·3 3·3 hours 90 50 Pb
Thorium r'Th(n, .. )"'Th 1200 25 hours 0·5 0·06 · · 131Th(n,f)111Ba or ••sr 17 85 minutes 4 4 u
Uranium 138U(n,2n)111U 700 6·7 days 5 0·1
· · aaau(n,f)111Ba or "Sr 60 85 minutes I 1 Th
CONCLUSIONS This method of analysis has most of the advantages of thermal-neutron radioadivation
analysis. Often the sensitivity is not so great, but for a few important light elements it is better with a flux of 1010 neutrons per sq. em per second. The sensitivity for half the elements in the periodic table is 1 J.Lg or better; this would obviously be improved by increasing the neutron output of the accelerator. For the comparatively small capital outlay of about £20,000 it should be possible to obtain a large and adequate flux of fast neutrons.
REFERENCES 1. Jenkins, E. N., and Smales, A. A., Quart. Rev., 1956, 10, 83. 2. Atkins, D . H . F., and Smales, A. A.,. in Emeleus, H. ] ., and Sharpe, A. G., Editors, "Advances in
Inorganic Chemistry and Radiochemistry," Academic Press Inc., New York, Volume I , 1959, p. 315.
3. De, A. K. , and Meinke, W. W ., Anal. Chem., 1958, 30, 1474. 4 . Coleman, R . F ., and Perkin, J. L., Analyst, 1959,84,233.
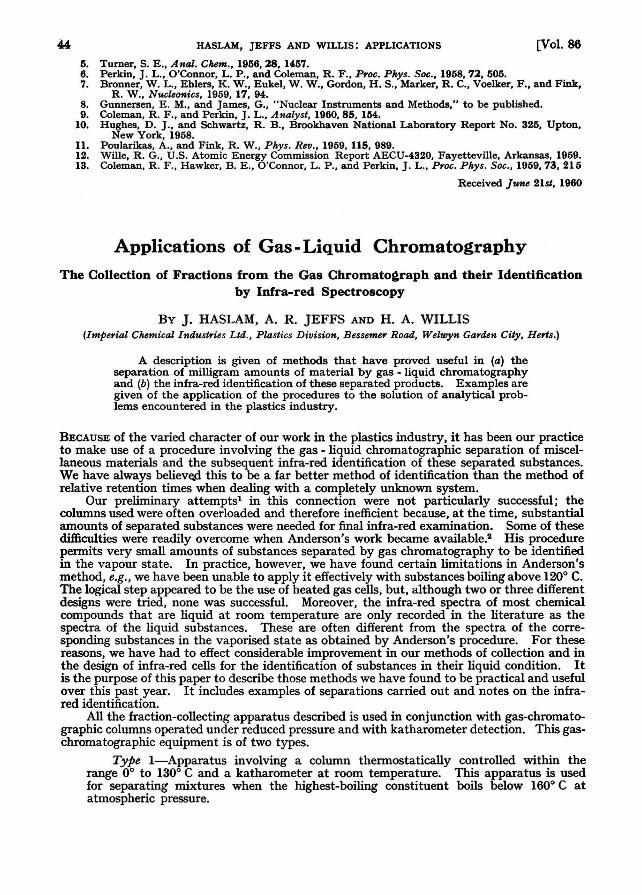
44 HASLAM, JEFFS AND WILLIS: APPLICATIONS (Vol, 86
6. Turner, S. E., Anal. Chem., 1966, 28, 1457. 6. Perkin, J . L., O'Connor, L. P., and Coleman, R . F ., Proc. Phys. Soc., 1968,72,605. 7. Bronner, W. L., Ehlers, K. W., Eukel, W . W., Gordon, H. S., Marker, R. C., Voelker, F., and Fink,
R. W., Nucleonics, 1959, 17, 94. 8. Gunnersen, E . M., and James, G., " Nuclear Instruments and Methods," to be published. 9. Coleman, R. F ., and Perkin, J. L., Analyst, 1960,85, 1M.
10. Hughes, D. J ., and Schwartz, R. B., Brookhaven National Laboratory Report No. 325, Upton, New York, 1958.
ll. Poularikas, A., and Fink, R. W., Phys. Rev., 1959, 115, 989. 12. Wille, R. G., U.S. Atomic Energy Commission Report AECU-4320, Fayetteville, Arkansas, 1959. 13. Coleman, R . F ., Hawker, B. E., O'Connor, L. P ., and Perkin, J . L., Proc. Phys. Soc., 1959,73, 215
Received June 21st, 1960
Applications of Gas- Liquid Chromatography
The Collection of Fractions from the Gas Chromatograph and their Identification by Infra-red Spectroscopy
BY J. HASLAM, A. R. JEFFS AND H. A. WILLIS (Imperial Chemical Industries Ltd., Plastics Division, Bessemer Road, Wela.,n Garden City, Herls.)
A description is given of methods that have proved useful in (a) the separation of milligram amounts of material by gas -liquid chromatography and (b) the infra-red identification of these separated products. Examples are given of the application of the procedures to the solution of analytical problems encountered in the plastics industry.
BECAUSE of the varied character of our work in the plastics industry, it has been our practice to make use of a procedure involving the gas -liquid chromatographic separation of miscellaneous materials and the subsequent infra-red identification of these separated substances. We have always believE:.<~ this to be a far better method of identification than the method of relative retention times when dealing with a completely unknown system.
Our preliminary attempts1 in this connection were not particularly successful; the columns used were often overloaded and therefore inefficient because, at the time, substantial amounts of separated substances were needed for final infra-red examination. Some of these difficulties were readily overcome when Anderson's work became available.2 His procedure permits very small amounts of substances separated by gas chromatography to be identified in the vapour state. In practice, however, we have found certain limitations in Anderson's method, e.g., we have been unable to apply it effectively with substances boiling above 120° C. The logical step appeared to be the use of heated gas cells, but, although two or three different designs were tried, none was successful. Moreover, the infra-red spectra of most chemical compounds that are liquid at room temperature are only recorded in the literature as the spectra of the liquid substances. These are often different from the spectra of the corresponding substances in the vaporised state as obtained by Anderson's procedure. For these reasons, we have had to effect considerable improvement in our methods of collection and in the design of infra-red cells for the identification of substances in their liquid condition. It is the purpose of this paper to describe those methods we have found to be practical and useful over this past year. It includes examples of separations carried out and notes on the infrared identification.
All the fraction-collecting apparatus described is used in conjunction with gas-chromatographic columns operated under reduced pressure and with katharometer detection. This gaschromatographic equipment is of two types.
Type !-Apparatus involving a column thermostatically controlled within the range 0° to 130° C and a katharometer at room temperature. This apparatus is used for separating mixtures when the highest-boiling constituent boils below 160° C at atmospheric pressure.
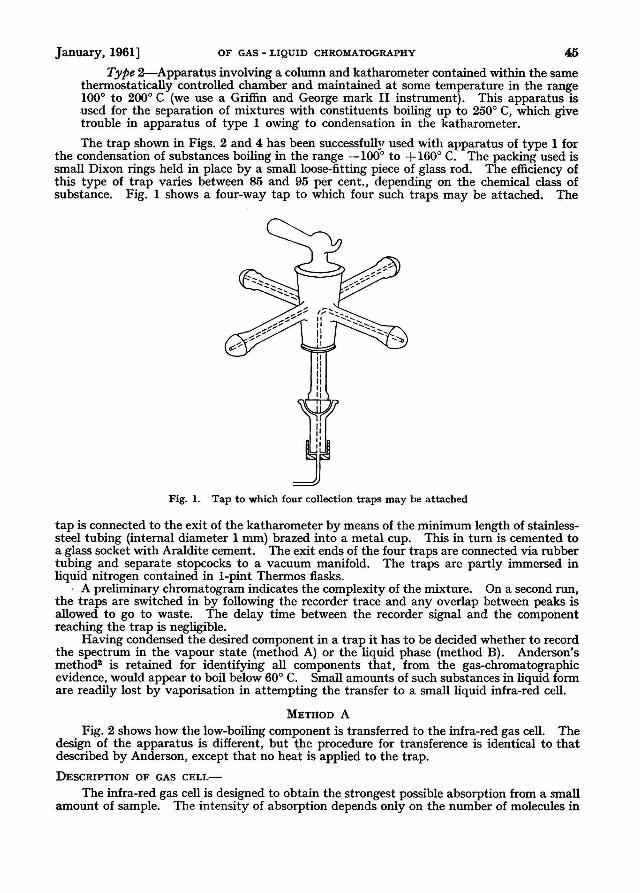
January, 1961] OF GAS- LIQUID CHROMATOGRAPHY 45
Type 2-Apparatl,Is involving a column and katharometer contained within the same thermostatically controlled chamber and maintained at some temperature in the range 100° to 200° C (we use a Griffin and George mark II instrument). This apparatus is used for the separation of mixtures with constituents boiling up to 250° C, which give trouble in apparatus of type 1 owing to condensation in the katharometer.
The trap shown in Figs. 2 and 4 has been successfully used with apparatus of type 1 for the condensation of substances boiling in the range -100° to +160° C. The packing used is small Dixon rings held in place by a small loose-fitting piece of glass rod. The efficiency of this type of trap varies between 85 and 95 per cent., depending on the chemical class of substance. Fig. 1 shows a four-way tap to which four such traps may be attached. The
Fig. 1. Tap to which four collection traps may be attached
tap is connected to the exit of the katharometer by means of the minimum length of stainlesssteel tubing (internal diameter 1 mm) brazed into a metal cup. This in turn is cemented to a glass socket with Araldite cement. The exit ends of the four traps are connected via rubber tubing and separate stopcocks to a vacuum manifold. The traps are partly immersed in liquid nitrogen contained in 1-pint Thermos flasks.
, A preliminary chromatogram indicates the complexity of the mixture. On a second run, the traps are switched in by following the recorder trace and any overlap between peaks is allowed to go to waste. The delay time between the recorder signal and the component reaching the trap is negligible.
Having condensed the desired component in a trap it has to be decided whether to record the spectrum in the vapour state (method A) or the liquid phase (method B). Anderson's method2 is retained for identifying all components that, from the gas-chromatographic evidence, would appear to boil below 60° C. Small amounts of such substances in liquid form are readily lost by vaporisation in attempting the transfer to a small liquid infra-red cell.
METHOD A Fig. 2 shows how the low-boiling component is transferred to the infra-red gas cell. The
design of the apparatus is different, but the procedure for transference is identical to that described by Anderson, except that no heat is applied to the trap.
DESCRIPTION OF GAS CELL-The infra-red gas cell is designed to obtain the strongest possible absorption from a small
amount of sample. The intensity of absorption depends only on the number of molecules in

46 HASLAM, JEFFS AND WILLIS: APPLICATIONS [Vol. 86
the path of the radiation beam; this is increased by reducing the cross-sectional area of the cell, which, however, must not be reduced to an extent such that the energy transmitted is insufficient to record the spectrum. The intensity may also be increased by passing the beam
c 0
R. j c(
Glass rod
Dixon rings
Fig. 2. Apparatus for trausfer of volatile component from trap to infra-red gas cell
6 7 8 9 10 II 12 13 14 Wavelength. ~
Fig. 3. Infra-red spectrum of pure component (methylallene) isolated from 1,3-butadiene
several times through the same volume of gas, as in reflecting cells of the type described by White, Alpert, Ward and Gallaway.3 Unfortunately, these cells are difficult to construct and must be specially designed for a particular instrument. We have therefore concentrated on an efficient straight single-pass cell.

January, 1961] OF GAS- LIQUID CHROMATOGRAPHY 47
In order to attain optimum light transmission, such a cell is inserted at a point where the area of the spectrometer beam is least ; this will be where a focus of the beam is formed in the centre of the cell. At a few centimetres on either side of the focal position the beam is rectangular; this, therefore, is the most economical shape for the cell. To decide the dimensions of the cell, we have assumed that 1 ml of gas at N.T.P. would be available. Condensation of liquids boiling up to 100° C may occur on the walls of the cell at pressures above 80 mm; the cell must therefore be of capacity about 9 ml.
The image to be found in the centre of the cell should normally have the length and width of the entrance slit of the spectrometer. Knowing the f number of the instrument it is possible to calculate the size of the rectangular aperture required to admit the radiation cone in terms of the length of the cell. For the instrument used (Hilger H800, aperture f 11) the dimensions for a 9-ml cell are: length, 10 em; height, 1·5 em; width, 0·6 em. Fig. 2 shows a cell of this form. The body consists of rectangular brass tube (1 mm thick) cut from wave-guide tubing and has the internal dimensions stated above. A flat brass flange is brazed on each end of the tube, and a short side-arm (stainless-steel capillary tubing) is brazed in one side of the body. A glass capillary tap that will just slide over the side-arm is cemented in place by filling the space between the two tubes with Araldite resin; by this means, the volume of the side-arm is rendered negligible. Two rock-salt windows are attached to the flanges with Picene wax. Although the cell is designed for an f 11 system, it will give acceptable performance, although with some loss of energy, on an f 7 spectrometer. EXAMPLE OF METHOD A-
The value of method A was recently shown when a sample of 1,3-butadiene was examined by gas chromatography and found to contain approximately 0·4 per cent. of a component whose retention time did not match that of any of the expected impurities (normal and isobutanes, butene-1, isobutylene, cis- and trans-butene-2 and vinylacetylene). The gas (50 to 60 ml) was crudely fractionated through a gas-chromatographic column in three separate aliquots, and re-examination of the trapped material on the ~olumn showed that the concentration of the unknown had increased to approximately 25 per cent. in the 1,3-butadiene.
Further fractionation yielded a pure sample of the unknown, which was transferred to the 10-cm gas cell and gave an estimated pressure of 15 mm in this cell. The spectrum of this component is shown in Fig. 3. From its origin, it seemed likely that the material would be a hydrocarbon. The absence of structure beyond 12 p, suggests that it is aliphatic. The intense band at 11·7 p, indicates the presence of carbon - carbon unsaturation, since it lies
R' R' R between the bands due to the groups Rw)c = CH2 ("-'11·3p,) and Rw)c = c(H ("-'12·0 p,).•
The band at 5·8 p, is likely to be the first overtone of this, since the first overtone bands of these C-H deformation frequencies are usually strong. The next band of interest is that at 5·1 p,; in an unsaturated-hydrocarbon system it suggests an allenic structure.5 Thus, we had an unsaturated aliphatic hydrocarbon of low molecular weight, probably an allenic compound. This indicated allene or methylallene. Reference to the infra-red catalogue of the American Petroleum Institute, Research Project 44 (serial No. 41) showed that the unknown was methylallene (1,2-butadiene).
METHOD B If the gas-chromatographic evidence indicates that the substance boils above 60° C, the
fraction condensed in the trap is treated as shown in Fig. 4. The trap and contents are held in liquid nitrogen while the apparatus is completely evacuated. After testing the system for leaks, the source of vacuum is cut off. The flask containing the liquid nitrogen is removed from the trap and placed over the side-arm so that the bulb is just immersed in the refrigerant. As the trap attains room temperature, the small amount of liquid in it distils through the desiccant and is condensed round the sides of the bulb of the side-arm. The liquid is encouraged into the capillary tip by lowering the vacuum flask containing the liquid nitrogen until only the last ! inch of the tip is immersed. The bulb is then warmed with the fingers. During this distillation the trap is not warmed, as this may cause some of the liquid to distil in the wrong direction. The apparatus may be left for 1 or 2 hours in order to achieve complete distillation of higher-boiling liquids. Having obtained the liquid in the capillary tip, this tip is broken off at the constriction just below the bulb. Fig. 5 shows a piece of

48 HASLAM, JEFFS AND WILLIS: APPLICATIONS (Vol. 86
apparatus similar to that described by Zehden, 8 which may be used to transfer the liquid to the micro infra-red cell. It has a robber teat and a very fine internal capillary. The device has a detachable tip, which is discarded after use and is made by drawing out a piece of
Glass rod
Dixon rings
Fig. 4. Apparatus for transfer of liquid component from trap to tip of side-arm
Fig. 5. Pipette for transferring liquid to micro cell
1 mm internal diameter glass tubing. The tip is held in position by a piece of ordinary cycle-valve robber. Use of this pipette permits close control over the transfer operation.
DESCRIPTION OF MICRO LIQUID CELL-
In the design of a small liquid cell, first consideration must be given to reducing the crosssectional area, the precise area required for a particular spectrometer being found by trial and error. The radiation beam of the instrument is obstructed at the cell,-mounting position

january, 1961] OF GAS- LIQUID CHROMATOGRAPHY 49
to find the least dimensions at which workable energy transmission is retained. A crosssection of 5 mm x 1·5 mm was found to be suitable for the Hilger H800 spectrometer, although the resulting cell could be used satisfactorily on otb,er instruments, namely, the Perkin- Elmer 21, the Perkin- Elmer 137 (Infracord) and the Grubb- Parsons GS2A.
Most of the sample placed in a normal infra-red liquid cell is used in the filling tubes rather than in the area exposed to the beam. Consideration was therefore given to a cell in which the filling tubes need not be occupied with liquid, and the current design is shown in Fig. 6. The two rock-salt plates are about 20 mm x 10 mm x 3 mm in size. Two holes are drilled in one plate with a No. 86 drill; these holes taper inwards, as shown, being 7 mm apart on the inside and 12 mm apart on the outside of the plate. A gold-foil washer (25 p. thick) is cut, the inner space being 1·5 mm wide and approximately 7 mm in length (just
I
• Fig. 6. Micro infra-red cell for liquid samples
sufficient to clear the edges of the filling holes); the width of this washer is about 2 mm. The cell is first stuck together with gold amalgam. The washer is immersed in mercury for a short period and withdrawn after a layer of amalgam has formed on its surface. The cell is then carefully assembled in a small clamp and left under pressure for 24 hours for the amalgam to set. The space between the plates outside the washer is then filled with Araldite 700 resin and a reasonable surplus of resin is allowed to bridge the edges of the plates on all four sides. The resin was found to be necessary, as the gold amalgam is a poor adhesive and the cell tends to open up and channel; the amalgam joint acts as a barrier to prevent the resin from contaminating the cell window.
The cell is filled by inserting a capillary needle containing the liquid into one filling hole. Provided that the thickness of the cell is less than the diameter of the needle, the liquid will run in to fill the cell area. It is essential that no free space be left in the cell behind the filling holes; such space will not immediately fill by capillary action and air bubbles trapped here may subsequently run into the useful part of the cell and are most difficult to remove. When the cell is filled, the outer ends of the filling tubes are covered by two small squares of nitrilerubber sheet, held in position by "butterfly" spring clips. This method forms an excellent seal without displacing the contents of the cell by air pressure, as may occur with stoppers that are pushed or screwed into the filling tubes.
The amount of liquid required to fill the cell by the method described above (as opposed to the theoretical capacity of the cell calculated from the dimensions) was determined experimentally by weighing the cell on a microbalance before and after filling. For six fillings with n-dodecane (density 0·766) the weights recorded were 0·53, 0·36, 0·27, 0·29, 0·67 and 0·31 mg. This compares with the calculated capacity of 0·20 mg of n-dodecane (7 x 1·5 x 0·025 X 0·766).

50 HASLAM, JEFFS AND WILLIS: APPLICATIONS [Vol. 86
With this cell, infra-red spectra have been obtained from 0·5- to 1·0-~£1 portions of liquid samples, but practice is required in the transfer of these small volumes. On the other hand, 2 to 31£1 of liquid present no difficulty.
EXAMPLE OF METHOD B-The value of the procedure outlined in method B was emphasised recently in the isolation
and identification of trans-1,2-divinylcyclobutane in the high-boiling residues obtained from a sample of butadiene.
The successive steps by which this conclusion was reached are given in detail, because they illustrate the kind of information that can, in favourable instances, be obtained even when the relevant infra-red spectra for comparison are not available in the literature.
9 Wavelength, IJ
Fig. 7. Infra-red spectrum of liquid {t,.ans-1,2-divinylcyclobutane) separated from butadiene residues
In this instance, samples of butadiene residues, i.e., the residue after evaporation of 1,3-butadiene at 20° C, were being examined. This material, commonly known as butadiene dimer, has always been said to consist of 4-vinylcyclohexene-1. Gas-chromatographic examination of these residues on a 12-foot (! inch diameter) column of 30 per cent. w jw of ,8,8-oxydipropionitrile on Celite at 80° C revealed the presence of another constituent in every sample examined, although the amount varied between 1 and 5 per cent. of the residue.
The infra-red spectrum of the small amount of liquid separated was obtained in the manner described and is shown in Fig. 7. Preliminary examination of this spectrum suggested that the sample was an aliphatic olefin. Reference to the available infra-red data, using the A.S.T.M. punched-card index, revealed no spectra matching that of our sample. In these circumstances, it was decided that more of the substance should be separated by gas chromatography in order that chemical and physical measurements could be made. Finally L
approximately 50 mg of the substance were isolated and the figures recorded were-
Boiling-point Refractive index at 20° C Density, 20°/4° Carbon content Hydrogen content
115° to 115·5° Cat 747 mm of mercury 1·4460 0·782 88·5 per cent. 11·3 per cent.
The figures for carbon and hydrogen are equivalent to a formula of (C2H 3),., where n must be an even integer. From the proximity of the retention time of the compound to that of 4-vinylcyclohexene-1, it seemed most probable that it was a C8 compound rather than C8 or <;o, i.e., CaHI2·
With this evidence in mind the infra-red spectrum was re-examined. The absence of bands between ll·5 and 15 1-' suggested that the compound was aliphatic in nature. Bands at 3·3 and 6·11£ showed the presence of C=C groups, the latter band indicating that these

January, 1961] OF GAS- LIQUID CHROMATOGRAPHY 51
were not conjugated. Intense bands at ll·O and 10·2,_, were clearly associated with the grouping -CH=CH2 ; this assignment is supported by the appearance of bands at 7·1, 7·8 and 5·6,..,.7 There was no evidence that C=:C groups were present or that there was any other type of unsaturation.
A quantitative determination of vinyl unsaturation was made by utilising the absorption band at 5·6 1-' and making comparison with a reference sample of octene-1. Assuming that both compounds had the same molecular weight, the unknown contained two vinyl groups per molecule.
It was then considered that useful information would be obtained by quantitative hydrogenation, with palladium on barium sulphate as catalyst, and this was carried out in ethanol
c 0
-~
] <
l 5 6 7 Wavelength, JJ
Fig. 8. Infra-red spectrum of hydrogenated material (trans-1,2-diethylcyclobutane) isolated from butadiene residues
on 25 mg of substance. The hydrogenated product was recovered from the ethanol solution by gas -liquid chromatography, and its infra-red spectrum was recorded. The hydrogen uptake was equivalent to 2·04 olefinic double bonds per eight carbon atoms, a result in excellent agreement with the spectral evidence.
The spectrum of the hydrogenated material was then examined (see Fig. 8) . The bands noted above (at 3·3, 5·6, 6·1, 7·1, 7·8, 10·2 and ll·O 1-') had all virtually disappeared, thereby demonstrating that these had been correctly assigned to vinyl groups. Had the original been a straight- or branched-chain hydrocarbon terminated by two vinyl groups, the hydrogenation product would have been n-octane or an isomeric octane. Reference to the A.P.I. catalogue showed that this was not so; nevertheless, the spectrum had the appearance of that of a saturated hydrocarbon. This seemed to leave only the possibility that it was cyclic and possessed structure I, II or III.
(I) (II)
C2H 6-CH-CH----CsH6
"'-/ CH I CH1
(III)
A cyclopropane structure should be recognised by a band near 9·9 ,_,, 8 where our spectrum had no prominent feature; on the other hand, absorption occurred at 10·9 and ll·2 ,_,, stated by Wilson9 to be due to -CH2 groups in the cyclobutane ring. The balance of evidence thus favoured structure I or II, either of which can exist in cis or trans form.
Reed10 has reported a substance formed by heating 1,3-butadiene under pressure in the presence of quinol, which he characterised as trans-1,2-divinylcyclobutane because, on ozonolysis, it gave trans-cyclobutane-1,2-dicarboxylic acid. The infra-red spectrum (7 to 14,_,) reproduced in Reed's paper is similar to the relevant portion of Fig. 7, but, unfortunately, this

52 HASLAM, JEFFS AND WILLIS: APPLICATIONS [Vol. 86
region is characteristic only of vinyl groups. We were unable to repeat Reed's ozonolysis, having too little sample available; however, the other properties quoted (density, boiling point and refractive index) are sufficiently similar to those of our compound to suggest that our material is the same as that prepared by Reed, i.e., trans-1,2-divinylcyclobutane, and that the hydrogenated product is trans-1,2-diethylcyclobutane. The spectrum of the latter compound has not been recorded in the literature.
The two methods described below have been used for collecting components boiling above 160° C, i.e., from an apparatus of type 2.
METHOD C This is an extremely simple, but effective, method that has been used in conjunction with
a Griffin and George mark II instrument. The back plate of the oven is removed and the copper pipe (linch internal diameter) from the katharometer is cut, leaving approximately ! inch protruding beyond the oven wall. An Agla syringe barrel containing a tiny piece of cotton-wool (2 to 3 mg) is connected into the exit-gas stream by sleeving one end of the barrel over the copper pipe with silicone-rubber tubing. This entails running a preliminary chromatogram and "breaking into" the gas stream at the appropriate point in the chromatogram on a second run. The piece of cotton-wool, although not particularly efficient, has the effect of stopping "vapour fog" from passing straight through the barrel. The syringe barrel is cooled during this operation by packing solid carbon dioxide round the outside. Having wetted the cotton-wool with the unidentified component, the syringe barrel is removed from the gas stream and a specially adapted nozzle is inserted. This nozzle consists of a fine piece of hypodermic tubing sleeved and cemented into the normal Agla glass nozzle and filed flush with the glass at one end. This has the effect of cutting down the "dead" volume of the syringe to the minimum. The syringe is held nozzle uppermost, the piston is inserted and the air expelled. The sample is then expressed from the cotton-wool by pressure of the piston directly irito the micro infra-red liquid cell.
Unfortunately, it has been found that 10 to 12f1-l of sample are needed in order to express sufficient liquid to fill the cell. However, if insufficient liquid is available, a drop of carbon disulphide is placed on the cotton-wool from a second syringe and the carbon disulphide solution of the sample is expressed into the cell.
EXAMPLE OF METHOD£-
This method proved valuable in the examination of a sample of acrylic sheet known from elemental analysis to contain phosphorus. Dry vacuum distillation of the polymer and solvent extraction both yielded a liquid, which, on direct infra-red examination, proved to be an impure material containing phosphate or phosphite. The vacuum distillate at 200° C was submitted to gas -liquid chromatographic examination on a 6-foot ·(!-inch diameter) column packed with 30 per cent. w jw of silicone E301 on Celite maintained at 130° C. A sample of the main component was taken by method C and the infra-red spectrum obtained was readily identified as that of triethyl phosphate.
METHOD D Because of the relatively large amounts of material needed for method C, this method
has more recently been used with the Griffin and George mark II instrument. The method consists in fitting a heated outlet pipe to the back of the katharometer and condensing the vapour in the trap shown in Fig. 9. The outlet pipe consists of a stainless-steel tube (1 mm internal diameter) approximately 9 inches long and terminates in a brass plug tapered to fit a B7 cone. The opposite end is joined to the copper exit pipe of the katharometer with silicone-rubber tubing. The pipe is heated directly by passing approximately 0·5 volt, 10 amps through it from a variable transformer. The lagging is of asbestos string and fireclay cement covered by a second layer of asbestos string.
As in method C, the trap is connected into the gas stream at the appropriate point in the chromatogram. The lower part of the trap is immersed in liquid nitrogen and the fraction is condensed . . The subsequent procedure is similar to that described for method B, the small amount of substance being vacuum-distilled into the tip, which is then broken off, and the liquid is transferred to the micro infra-red cell.

January, 1961] OF GAS- LIQUID CHROMATOGRAPHY 53
EXAMPLE OF METHOD D-In the examination of a solvent said to be used in printing on plastic sheet, the main
constituent was found to be white spirit. This was recognised from the characteristic pattern of the chromatogram.11 There was, however, a peak on the chromatogram not due to any component in the white spirit. Accordingly, this particular peak was condensed from the gas stream by method D, and the component was identified from its spectrum as n-butyl lactate (boiling point 188° C).
The trapping system used in methods A and B was originally devised by Mr. N. Payne and Dr. B. D. Stead, of our Research Department, to whom we are indebted for details. We also acknowledge valuable discussions with Mr. R. G. J. Miller.
Brass plug
Glass rod
-Break-off point
Fig. 9. Trap used in method D
REFERENCES
1. Haslam, J., and Jeffs, A. R., ]. Appl. Chem., 1957, 7, 24. 2. Anderson, D. M. W., Analyst, 1959, 84, 50. 3. White, J. U ., Alpert, N . L., Ward, W. M., and Gallaway, W. S., Anal. Chem., 1959,31, 1267. 4. Bellamy, L. J., "Infra-red Spectra of Complex Molecules," Second Edition, Methuen & Co. Ltd.,
London, 1958, p. 34. 5. Rasmussen, R. S., and Brattain, R. R., ]. Chem. Phys., 1947, 15, 120. 6. Zehden, W., Lecture to Infra Red Discussion Group, London, December, 1959. 7. Bellamy, L. J., op. cit., p. 53. 8. Derfer, J. M., Pickett, E. E., and Boord, C. E.,]. A mer. Chem. Soc., 1949,71, 2482. 9. Wilson, T . P ., ]. Chem. Phys., 1943, 11, 369.
10. Reed, H. W. B.,]. Chem. Soc., 1951, 685. 11. Haslam, J ., and Jeffs, A. R., Analyst, 1958,83, 455.
Received August llth, 1960

54 PARKER AND HARVEY: FLUORIMETRIC DETERMINATION [Vol. 86
Fluorimetric Determination of Sub-microgram Amounts of Selenium
BY C. A. PARKER AND L. G. HARVEY (Admiralty Materials Laboratory, Holton Heath, Poole, Dorset)
The reaction of traces of selenous acid with an excess of 3,3'-diaminobenzidine has been investigated, and it has been shown that the coloured reaction product is the monopiazselenol (3,4-diaminophenylpiazselenol) and not the dipiazselenol, as previously assumed by Cheng and Hoste and Gillis.
The absorption and fluorescence spectra of the monopiazselenol have been measured, and Cheng's colorimetric procedure has been adapted to the fiuorimetric determination of traces of selenium in pure arsenic. The limit of detection is about 0·02 p.p.m. when a 2-g sample is used.
IN gallium arsenide used for semi-conductor research, selenium contents of 0·1 p.p.m. or less are significant. Selenium is a common impurity in commercial grades of arsenic, and Cheng1
0·8
E u
~0·6 1::;·;;; c: "' , ~ 0·4 ... a. 0
0·2
oL-~--~~~==~~~==~~
Wavenumber, ,..-•
Fig. l. Absorption spectra of selenium compounds in toluene: curve A, pure dipiazselenol of 3,3'-diaminobenzidine (3·3 1-'g per ml); curve B, pure monopiazselenol of 3, 3 '-diamino benzidine (5·2 1-'g per ml); curve C, 4·6 1-'g of selenium treated by Cheng's procedure1 in 10 ml of toluene; curve D, reagent blank corresponding to curve C
has described an absorptiometric method for its determination in elemental arsenic; the method is based on the reaction with 3,3' -diaminobenzidine, as originally proposed by Hoste2
and Hoste and Gillis.3 Investigation of Cheng's procedure showed that the sensitivity was limited by the magnitude of the absorption of the reagent blank solution-which has an optical density of 0·02 per 3 em at 2·38 p,-1 (420 mp,), corresponding to 0·6 p,g of selenium in 10 ml of toluene-to about 0·3 p,g of selenium, and, in order to obtain high sensitivity, Cheng used 10- to 20-g samples of elemental arsenic. In our work the amount of sample available for determining selenium was limited to 1 to 2 g and the minimum selenium content detectable by the absorptiometric method was thus about 0·3 p.p.m.
Preliminary measurements showed that the toluene solution of the selenium compound gave a fluorescence emission band in the orange region, whereas the corresponding reagent
January, I96I] OF SUB-MICROGRAM AMOUNTS OF SELENIUM 55
blank did not, and this suggested that a fluorimetric method might be capable of greater sensitivity than was the absorptiometric procedure. The reaction of selenium with 3,3'-diaminobenzidine was therefore investigated in detail.
After this investigation had been completed, a fluorimetric method for selenium, based on the same reagent, was described by Watkinson,' who used a filter fluorimeter to measure amounts of selenium up to 0·5 p.g in plant materials. He obtained a sensitivity of the same order as that reported here, but did not investigate the nature of the fluorescent compound.
REACTION OF SELENOUS ACID WITH 3,3'-DIAMINOBENZIDINE
The reaction of selenous acid with ortho-diamines is a general one and results in the formation of the piazselenol five-membered ring system. By reaction of one molecular proportion of 3,3' -diaminobenzidine with two molecular proportions of selenous acid, Hostel' isolated a pure, yellow crystalline compound, melting-point 292° C (uncorrected), which he identified by analysis as the dipiazselenol; the reaction is represented by the equation-
H,N--o--o-NH1 + 2H2Se08 N=O-O=N + 6~20 /"' -I/ "I H 1N NH0 Se-N N-Se
Both Hoste and Gillisa and Cheng1 have assumed that the dipiazselenol is formed in their respective colorimetric procedures for selenium. In fact, there are good reasons to believe that this is not so. First, the dipiazselenol is almost completely insoluble in water and dilute acid. Its basicity is extremely weak, and, unlike the compound produced in the colorimetric procedures, it can be extracted into toluene from dilute hydrochloric acid. Secondly, its absorption spectrum in toluene (see Fig. I, curve A) is different from that of the compound produced in Cheng's colorimetric procedure (see Fig. I, curve C). Thirdly .. by allowing a small amount of selenium to react with a large excess of the diaminobenzidine, as in the colorimetric procedure, one would expect to obtain not the dipiazselenol, but the mono-selenium compound, in accordance with the equation-
HoN-y-q--NH1 + H 1Se08
H 1N NH1 -
The latter compound, containing two free amino groups, would be much more strongly basic and would therefore not be extracted by toluene from acid solution. This theory was investigated by allowing 0·05 g of selenium, as selenous acid, to react with an excess of 3,3'-diaminobenzidine as described under "Preparation of Piazselenols." The product showed an intense absorption peak at 2·39 p,-1 (4I8 mp,) in toluene solution, but was contaminated with the dipiazselenol. After purification it was isolated as a deep-red crystalline compound, meltingpoint 202° C (corrected), with a selenium content corresponding to 3,4-diaminophenylpiazselenol; it was readily soluble in dilute hydrochloric acid. In toluene, it showed two absorption bands, one at 2·95 f.L-1 (339 mp,) and the other at 2·39 p,-1 (4I8 mp,) (see Fig. I, curve B), the latter band being similar to that of the compound obtained by Cheng's colorimetric procedure (curve C). Being a comparatively strong base, the compound shows indicator properties in aqueous solution (see Fig. 2). In neutral or alkaline solutions, the absorption spectrum shows two peaks at 2·93 p,-1 (34I mp,) and 2·43 p,-1 (411 mp,); it is similar to the spectrum in toluene and is assumed to be that of the free base. As the pH falls below 7, the spectrum changes progressively; the peak at 2·43 p,-1 disappears and that at 2·93 p,-1 increases in intensity and moves to slightly lower· frequencies, until, in I·O N acid, a single peak at 2·87 p,-1 (348 mp,} is obtained. This spectrum is probably due mainly to the dihydrochloride of the compound. In more concentrated acid, the maximum moves to still lower frequencies and the intensity increases further. The latter change is probably due to the partial formation of a trihydrochloride, the piazselenol ring probably being sufficiently basic to take up a proton at these high acidities. The inflexion in the region of 2·6 p,-1 (385 mp,} at pH values of I to 3 (see Fig. 2, curves D and E) may be due to the presence of some monohydrochloride at these pH values. The spectrum in O·I N hydrochloric acid (see Fig. 2, curve E) is similar to that observed by Hote and Gillis,3 who made measurements directly on the acid aqueous solution

56 PARKER AND HARVEY: FLUORIMETRIC DETERMINATION [Vol. 86
after colorimetric reaction. The increased sensitivity observed by Hoste and Gillis as they increased the concentration of hydrochloric acid is readily explained in terms of the indicator properties of the monoselenium compound as shown in Fig. 2.
FLUORESCENCE OF 3,4-DIAMINOPHENYLPIAZSELENOL IN TOLUENE The corrected fluorescence emission spectrum of the monopiazselenol (see Fig. 3, curve B)
consists of a single broad band with a peak at 1·65 p,-1 (606 mp,) and is identical with the fluorescence band from a solution obtained by allowing trace amounts of selenium to react with diaminobenzidine by Cheng's procedure. The corresponding excitation spectrum (see Fig. 3, curve A) is almost identical with the absorption spectrum, showing peaks at 2·94 p,-1
0·8
0·2
0 Wavenumber, jJ- '
Fig. 2. Absorption spectra of the monopiazselenol in aqueous solution (12 ~g per ml) at different acidities: curve A, pH 9·0; curve B, pH 5·1 ; curve C, pH 4·1 ; curve D, pH 2·9; curve E, 0·1 N hydrochloric acid; curve F, 1·0 N hydrochloric acid; curve G, 5 N hydrochloric acid
(340 mp,) and 2·38 p,-1 (420 mp,). The latter frequency is best for excitation because the fluorescence from impurities produced by decomposition of the reagent is less than at 2·94 p,-1 •
If a mercury lamp is used for excitation, both the 2·47 p,-1 (405 mp,) and the 2·29 p,-1 (436 mp,) lines are favourably situated on either side of the peak and give approximately equal excitation efficiencies. The latter line is preferred because it is emitted by most mercury lamps at higher intensity.
EXPERIMENTAL APPARATUS-
For measurement of the fluorescence emission and excitation spectra (see Figs. 3 and 4), the sensitive recording spectrofluorimeter,5 fitted with an E.M.I. 9558 red-sensitive photomultiplier, was used. For the determination of selenium in arsenic, an instrument of somewhat lower sensitivity was set up. The light source was a Hanovia 500-watt mercury lamp (type 509). This was placed in the position of the entrance slit of a Hilger D96 monochromator. By using an exit slit of 1 mm, the mercury line at 2·29 p,-1 (436 mp,) could be isolated at reasonable purity. To improve the purity and in particular to cut out stray light in the

January, I96I] OF SUB-MICROGRAM AMOUNTS OF SELENIUM 57
frequency band corresponding to the fluorescence band of the selenium compound, the beam of exciting light was passed through a composite liquid filter consisting of I·O em of a 50 per cent. w jv solution of sodium nitrite and 0·5 em of a IO per cent. w jv solution of copper sulphate in 6 N ammonium hydroxide.
The sample was contained in a cuvette (optical depths both I em) and measurements could be carried out on 5 ml of solution. The fluorescence was isolated by a small double monochromator (Hilger D222/D205) and was deteoted by an E.M.I. 6256B photomultiplier. Owing to the rapidly falling sensitivity of this photomultiplier in the yellow region, maximum output was attained at a frequency setting of about I·75p,-1 (570 mp,) and not at I·65p,-1
(606 mp,), the peak of the true fluorescence spectrum. All measurements were therefore made at the former frequency, a monochromator half-band width of 0·04 p,-1 (0·4 mm slits) being used. The photomultiplier output was amplified by means of a Vibron electrometer. Readings could be taken directly on a meter or the output could be passed to a single-point recorder for the semi-automatic plotting of fluorescence spectra. Full-scale deflection corresponded to about 0·8 p,g of selenium in 5 ml of toluene. The minimum signal detectable corresponded to about I per cent. of full-scale deflection.
<if < ..
> ., .. ~
:::J
:::J ~
~ .... ~
> .. ... ·c::;;.., ... "' ~ -~ c ... ·;..·c
-~ :::J v :J .... c .... ., .. ., .. v .. "'C! ~ -~ g-.~ V.&l J:-f "' .. e .. ... .. 0 ·;:; :::J :J
<;:: .. .. .. > ~ ...
~ .. "ii c
"' .. :::J
0
1·5 Wavenumber. f!-'
Fig. 3. Corrected fluorescence spectra of the monopiazselenol in toluene: curve A, fluorescence excitation spectrum; curve B, fluorescence emission spectrum
PREPARATION OF PIAZSELENOLS-
The dipiazselenol was prepared by Hoste's method2 ; after crystallisation from glacial acetic acid, it was obtained as a fine yellow powder, melting-point 3I4o C (corrected). The monopiazselenol was prepared as follows. A 0·5-g portion of 3,3'-diaminobenzidine hydrochloride was dissolved in 250 ml of water, and a solution of 0·05 g of selenium (as selenous acid) in 250 ml of water was slowly added, with vigorous stirring. The solution was adjusted to a pH of about 7 with ammonium hydroxide and extracted with two 75-ml portions of toluene. The combined toluene extracts were shaken with 200 ml of O·I N hydrochloric acid. The acid solution was washed once with toluene, the pH was then increased again to 7, and the monopiazselenol was extracted with two 50-ml portions of toluene. The combined toluene extracts were dried with anhydrous sodium sulphate and evaporated under high vacuum. The monopiazselenol was thus obtained as dark-red crystals, melting-point 202° C (corrected~.
SELENIUM CONTENT OF PIAZSELENOLS-
About 0·01 g of the sample was wrapped in a small piece of ashless filter-paper (about I inch square) and was burned in oxygen as described by Schoniger.6 The apparatus consisted

58 PARKER AND HARVEY: FLUORIMETRIC DETERMINATION [Vol. 86
of a Pyrex-glass 250-ml conical flask fitted with a B24 ground-glass joint and a B24 stopper. To the inside of the stopper was fused a short piece of platinum wire, to the end of which was fixed a small platinum-gauze holder. A 25-ml portion of 0·1 N hydrochloric acid was placed in the flask, which was then filled with oxygen. The filter-paper containing the sample was placed in the platinum-gauze holder, a comer of the paper was ignited, and the holder was
Fig. 4. Uncorrected fluorescence emission spectra of reagent blank solutions (all solutions extracted with 5 ml of toluene): curve A, dry toluene; curve B, reagent blank with 3,3 '-diaminobenzidine omitted; curve C, reagent blank with 2 ml of 0·5 per cent. wfv solution of 3,3'-diaminobenzidine and exposure to diffuse daylight; curve D, as for curve C, but without exposure to light; curve E, as for curve C, but with exposure to sunlight; curve F, reagent blank- with 0·5 ml of 0·5 per cent. wfv solution of 3,3'-diaminobenzidine and storage in darkness at 50° C for 45 minutes; curve G, as for curve F, but with 0·5 p.g of selenium added
immediately plunged into the oxygen-filled flask. The stopper was held firmly in place until combustion was complete, and the flask was then vigorously shaken for a few minutes. The solution was diluted with water and aliquots were taken for the colorimetric determination of the selenium with 3,3' -diaminobenzidine. The results obtained from three separately treated portions of the materials were-
Sample Monopiazselenol Dipiazselenol
Selenium found, % 26·4, 27·1, 27·0 40·5, 40·1, 41-1
Seleniumicalculated, % 27·2 43·5
DETERMINATION OF SELENIUM IN ARSENIC REAGENTs--
Commercial 3,3'-diaminobenzidine hydrochloride was recrystallised from 3 N hydrochloric acid, the entire operation being carried out in a dark room by yellow safe light. The

January, 1961] OF SUB-MICROGRAM AMOUNTS OF SELENIUM 59
compound was thus obtained in the form of its tetrahydrochloride, as colourless needles, which were separated by filtration, dried in vacuo over silica gel and stored in a stoppered tube in the dark. The reagent solution was prepared by dissolving 0·5 g of the crystals in 100 ml of water previously de-aerated by passage of nitrogen. The solution was stored under nitrogen in a refrigerator and was prepared freshly every 2 days. The hydrochloric and nitric acids used were of the grade intended for foodstuffs analysis. Other reagents were prepared from materials of recognised analytical grade.
PREPARATION OF CALIBRATION GRAPH-
The entire procedure was carried out in a dark room by yellow safe light. Volumes of standard selenous acid solution covering the range 0·0 to 0·8 p..g of selenium were transferred to 100-ml beakers. Two millilitres each of 2·5 M formic acid, 0·1 M EDTA (ethylenediaminetetra-acetic acid, disodium salt) solution and diaminobenzidine reagent were added, and each solution was diluted to 50 ml with water; after mixing, the solutions were set aside at 20° C for 45 minutes. The pH was then adjusted to 6·8 with 7 N ammonium hydroxide, and each solution was transferred to a 125-ml separating funnel and vigorously shaken with 5 ml of toluene for I minute. The toluene layer was separated and spun in a centrifuge for 2 to 3 minutes, and its fluorescence was measured at 570 mp.. in a 1-cm cuvette. The fluorimeter was calibrated immediately before measurement by means of a standard solution of rhodamine B in ethanol. Full-scale deflection (100 divisions) corresponded to about 0·8 p..g of selenium per 5 ml of toluene when the instrument was set to give a deflection of 60 divisions with the standard rhodamine B solution (0·092 p..g per ml).
PROCEDURE-
Up to 2·5 g of sample were weighed into a 100-ml beaker, 5 ml each of concentrated hydrochloric and nitric acids were added, and the beaker was immediately covered with a watchglass. When solution was complete, the watch-glass was raised and the ~olution evaporated just to dryness (baking was avoided). The white residue was dissolved in 30 to 35 ml of water, with gentle warming. The solution was .;:ooled to room temperature, and 2 ml each of 2·5 M formic acid, 0·1 M EDTA solution and diaminobenzidine reagent solution were added (in that order). The pH was then adjusted to 2·5 with 7 N ammonium hydroxide, and colour was allowed to develop in the dark for 45 minutes. The pH was then adjusted to 6·8 with ammonium hydroxide, the total volume being finally about 50 ml. The selenium compound was then extracted with 5 ml of toluene, as described under "Preparation of Calibration Graph," and its fluorescence was measured. At the same time as the determination, a blank test (see below) was carried out, to which no arsenic was added. The difference between the fluorescence intensities of the test and blank solutions was converted to micrograms of selenium by reference to the calibration graph.
NOTE ON BLANK TEST-
It was found that, in the absence of arsenic, appreciable loss of selenium could occur during evaporation of the mixed acid. Thus, if comparatively large amounts of selenium were present in the acids, the blank correction could be too low. In this work, tests were carried out on 0·25 g of arsenic with 10- and 20-ml portions of mixed acid. The difference between the two fluorescence intensities corresponded to the selenium content of 10 ml of mixed acid, which was found to be 0·02 to 0·03 p..g. With acids of this purity losses during the evaporation of the blank were thus negligible. This was also confirmed by carrying out several analyses with 0·25- and 2·25-g portions of sample No. 24 (see Table II). The difference between the fluorescence intensities with these two weights of sample corresponded 'to the selenium in 2·0 g of sample. The results were-
Weight of sample, g . . 0·25 Total fluorescence (calculated as
selenium), p.g 0·14 Selenium content of sample, p .p .m ...
0·25
0·14
2·25
0·28 0·07
2·25
0·29 0·07
2·25
0·26 0·06
2·25
0·28 0·07
2·25
0·24 0·05
i.e., they gave the same selenium content as that sietermined by the direct blank procedure (see Table II), thereby confirming that the blank correction in the latter technique was not appreciably in error.

60 PARKER AND HARVEY: FLUORIMETRIC DETERMINATION [Vol. 86
APPLICATION TO SAMPLES OF ARSENIC
To confirm that the presence of arsenic did not interfere, several 2-g portions of a pure sample of arsenic were treated by the procedure described above, different amounts of selenium being added to the solution of the sample before evaporation. At the same time, some tests were carried out in which no selenium was added. The differences between the fluorescence intensities observed in the presence and absence of added selenium were converted to parts per million of selenium in the samples by reference to the calibration graph. The results are shown in Table I and indicate that recovery was satisfactory.
TABLE I
RECOVERY OF SELENIUM ADDED TO ARSENIC
A 2-g portion of sample No. 24 (see Table II) was taken for each test. The total fluorescence observed was corrected for the fluorescence observed in tests on the same sample to which
no selenium had been added
Selenium added, p.p.m.
0·05 0·10 0·15 0·20 0·25 0·30
Selenium recovered,
0·05, 0·09, 0·15, 0·19, 0·24, 0·28,
TABLE II
p.p.m.
0•06, 0·11 0·14 0·21 0·23, 0·27
0·07
0·24
APPLICATION TO SAMPLES OF ELEMENTAL ARSENIC
Samples No. 24 and 36 were obtained from the same source; the remainder were from different sources
Blank Fluorescence fluorescence of test Selenium
Weight (calculated (calculated content of Sample No. and description taken, as Se). as Se) , sample,
g p.g p.g p.p.m.
24 ("Five nines") .. 1·86 0·11 0·22 0·06 2·29 0·11 0·27 0·07 1·97 0·09 0·18 0·05
36 ("Five nines") . . 1·51 0·11 0·19 0·05 2·12 0·11 0·22 0·05
31 ("Five nines") . . 1·76 0·12 0·24 0·07 1·76 0·11 0·22 0·06
37 ("Four nines") 0·335 0·11 0·62 1·53 0•334 0·11 0·62 1·53
37 (Once sublimed) 1·07 0·11 0·37 0·24 1·11 0·11 0·37 0·23
19 ("Four nines") 0·324 0·09 0·72 1·95 19 (After treatment with lead and sublimation) 0·76 0·09 0·15 0·08
0·50 0·09 0·12 0·06
The procedure was then applied to a variety of samples of arsenic ; the results indicated satisfactory reproducibility (see Table II). It is of interest to note that treatment with lead and sublimation effected considerable reduction in selenium content.
INTERFERING ELEMENTS
Hoste and Gillis3 showed that the presence of most common ions, even in amounts one hundred times as great as that of the selenium, did not interfere with the absorptiometric determination, except by formation of their own colours (e.g., CtJ+). Coloured ions are not extracted into the toluene layer in the proposed procedure. Tellurium does not react, and, although sulphur dioxide gives a colourless precipitate, its interference can be avoided by prior oxidation to sulphate. Strong oxidising agents interfere by forming coloured oxidation

January, 1961] OF SUB-MICROGRAM AMOUNTS OF SELENIUM 61
products of the reagent and must be removed. Interference by Fe3+ and Cu2+ is completely suppressed by the addition of EDT A, as recommended. Of the remaining interfering ions mentioned by Hoste and Gillis, Cheng1 found that 5-mg amounts of Cr3+, MoH and Ni2+ and 1 mg of Te4+ did not interfere. He also found that, although VIi+ oxidised the reagent, the presence of 0·5 mg of this ion could be tolerated, or more if the amount of reagent used was increased.
SENSITIVITY
In the proposed procedure, the minimum detectable amount of selenium was limited to about 0·04 JLg by the magnitude of the reagent blank value, and it was therefore of interest to determine the cause of this blank and to try to reduce it. It had already been noted that, with the approach of summer, the blank value had shown a slow but definite increase, and tests were therefore carried out to determine the effect of light. For this and subsequent experiments the highly sensitive recording spectrofluorimeter was used.5 The emission spectrum of a typical normal blank in which the reaction was carried out with exposure to diffuse daylight is compared in Fig. 4 (curve C) with the spectrum obtained in a similar test in which the reaction was carried out with exposure to only a yellow safe light (curve D) and with exposure to direct sunlight (curve E). It is obvious that exposure, even to diffuse daylight, produces an appreciable increase in the fluorescence and that sunlight causes a considerable increase. However, even in darkness, the fluorescence was appreciably higher than that of the test solution to which no diaminobenzidine was added (curve B). To determine whether or not this fluorescence was due to selenium in the reagents, a further test was carried out in which the pH value was increased to 6·8 and the solution extracted with toluene immediately after the addition of the diaminobenzidine. Under these conditions selenium does not react appreciably. Nevertheless, a fluorescence emission curve identical with Fig. 4, curve D, was obtained, showing that the fluorescence in the region of 1·7 JL-1 on this curve was not due to selenium and was therefore due to traces of other impurities in the reagent. In an attempt to reduce this fluorescence, tests were carried out with smaller amounts of reagent. By using only 0·5 ml of a 0·5 per cent. w /v solution instead of 2 ml and by heating the solution for 45 minutes at 50° C it was found that the full fluorescence from 0·5 JLg of selenium was developed (see Fig. 4, curve G) and that the blank had been reduced to less than one-half (see Fig. 4, curve F). Several determinations of the selenium content of sample No. 24 were made by the modified procedure and these gave results similar to those in Table II. Detailed tests of the modified procedure were postponed, however, pending the results of experiments with alternative fluorimetric reagents for selenium.
The fluorescence efficiency, q,, of the monoselenium compound, determined by comparison with rhodamine B by the method described earlier,? is 5·5 per cent. The optical density per em at 2·29 JL-1 (436 mJL) for a concentration of 1 JLg of the compound per ml is 0·026, and the half-band width of the fluorescence band, H, is 0·445 JL-1• The absolute
fluorescence sensitivity7 of the compound, given by the expression 4>.J:. is therefore 0·0032 at
2·29 JL-1• This sensitivity is comparatively low, and, if a different selenium compound could be found having a fluorescence efficiency of, say, 50 per cent., a ten-fold increase in fluorescence sensitivity could be attained. With the present compound, the over-all sensitivity is limited, not by the instrumental sensitivity (about 0·01 JLg of selenium), but by the magnitude of the reagent blank (0·07 to 0·12 JLg of selenium). However, much of this blank value is due to impurities in the reagent and decomposition products, the effect of which would be correspondingly less if the fluorescence sensitivity of the selenium compound were greater. The search for an alternative fluorimetric reagent for selenium is thus well worth while if sensitivity better than 0·02 p.p.m. of selenium is required.
CONCLUSIONS
(a) With 2 ml of 3,3' -diaminobenzidine reagent and reaction at room temperature, amounts of selenium between 0·04 and 0·8 JLg can be determined by the proposed procedure. Applied to a 2-g sample of arsenic, the minimum selenium content detectable is about 0·02 p.p.m.
(b) By using a modified procedure, in which only 0·5 ml of diaminobenzidine reagent is added and the reaction is carried out at 50° C, the magnitude of the blank value is reduced and a somewhat lower limit of detection could probably be attained.

62 ELLIOTT AND RADLEY: INVESTIGATION OF BENZOIN [Vol. 86
(c) The absolute fluorescence sensitivity of the selenium compound produced with 3,3'-diaminobenzidine is low, and a search for more efficient fluorimetric reagents is worth while if contents less than 0·02 p.p.m. of selenium have to be determined.
We thank the Superintendent, Admiralty Materials Laboratory, for permission to publish this paper.
REFERENCES
1:)i Cheng, K. L., Anal. _Chem., 1956,28, 1738. 2.x Hoste, J., ,Anal. Ch~m. Acta, 1948, 2, 402. 3:_.1(Hoste; J., and Gillis, J., Ibid., 1955, 12, 158. 4~Watkinson, J. H., Anal. Chem., 1960, 32, 981. 5.. Parker, C. A., Natu'Ye, 1958, 182, 1002. 6. Schoniger, W., Mik'Yochim. Acta, 1955, 123; 1956, 867. ·7,5( Parker, C. A., and Rees, W. T., Analyst, 1960, 85, 587.
Received August 12th, 1960
An Investigation of the Benzoin Method for the Fluorimetric Determination of Boron
BY G. ELLIOTT AND J. A. RADLEY
(Radley Industyial Resea'Ych ~Development Laboyato'Yies, 220 Elga'Y Road, Reading, BeYks.)
The development of the boron- benzoin fluorescence at microgram concentrations of boron has been investigated; a simple, but sensitive, fluorimeter was used. The development and decay of fluorescence intensity with time was observed in various solvents in the presence of different basic compounds.
The fluorescence produced when formamide and its N-derivatives are used as the solvent media is stronger than that found when ethanol is used. A glycine buffer solution of pH 12·8 is effective in producing the correct conditions for developing fluorescence with ethanol as solvent, but is not effective in the formamide series of solvents. lsopropylamine and isobutylamine are effective bases in both ethanol and the formamide series. For a series of solvents of a given chemical type, e.g., the formamides, there may be an increase in fluorescence intensity with dielectric constant, although this is not true for the alcohols.
Oxygen has a pronounced inhibiting action on the development of fluorescence in ethanol, but has much less effect in formamide. There is a linear relationship between fluorescence intensity and amount of boron present in the range studied (0·05 to 0·5p,g).
THE fluorescence of the boron- benzoin complex was first noted and later used by White and his co-workers1 •2 •3 to develop a sensitive quantitative method for determining amounts of boron from 1 p,g upwards. More recently, Parker and Barnes4 have demonstrated the quenching effect of oxygen on this fluorescence. Since this effect was not mentioned by the earlier workers, it was decided to study the development and stability of the boron - benzoin complex in ethanol, bearing in mind the possible de-activating effects of oxygen, and to examine other solvents in the hope of increasing the sensitivity of the reaction.
APPARATUS
A simple direct-reading fluorimeter was constructed in the laboratory. A Siemens -Ediswan MB/D 125-watt mercury lamp was used as light source, with two Spekker H556 {Chance OX1 glass) filters to isolate the 366-mp, radiation. A shutter was interposed between the lamp and the sample, so that exposure of the sample to ultra-violet light could be restricted to a few seconds while a reading was taken. The sample cells were standard closed fluorimeter cells (Spekker H578) of internal dimensions 4 em high, 3·5 em wide and 1·5 em deep, provided with two small stoppers for excluding air from the solution.

January, 1961) METHOD FOR FLUORIMETRIC DETERMINATION OF BORON 63
The secondary filter was a combination of a Chance OB2 and a Wratten 2B filter plate. A 9-stage photomul~iplier cell, R.C.A. type 931A (Siemens- Ediswan equivalent, 27M1), was used to detect the fluorescence output, and readings were made on a commercial d. c. millivoltmeter, which recorded the voltage developed across switched load resistors.
The a.c. supply to the mercury lamp was stabilised by a 150-watt constant-voltage transformer, and the d.c. supply (900 volts) to the 931A photomultiplier was stabilised by six VR150/30 gas-filled regulator valves in series. The sensitivity of the instrument could be adjusted by varying the voltage applied to the photomultiplier, a switched voltage-divider network being used, with a series variable resistor for fine control. A stabilised backing-off voltage was available for returning the meter to zero in order to cancel readings due to the dark current of the photocell or to the fluorescence of blank samples.
EXPERIMENTAL
The method adopted was similar to that described by White and Hoffman3 ; aqueous solutions containing either 5 or 0·5 1-'g of boron (as boric acid) per ml were used. When investigating the original method and using glycine buffer (pH 12·8) as base, the procedure was to add, in this order, 1 ml of the boron solution, 0·5 ml of water, 0·5 ml of glycine buffer, 15 ml of ethanol and 3 ml of a 0·5 per cent. solution of benzoin in ethanol and then to dilute with ethanol to 25 ml in a calibrated flask. Later, to study the effects of oxygen on the development of fluorescence, de-oxygenated hydrogen was bubbled through both test and benzoin solutions for 10 minutes before mixing. With de-oxygenation, it was found preferable to add 20 ml of ethanol after the buffer solution to allow for slight evaporation and to ensure that little ethanol was needed for the final dilution to 25 ml. Commercial 95 per cent. ethanol was found to be unsuitable and apparently contained about 20 1-'g of boron per ml; AnalaR ethanol (99 per cent.) was therefore used in the first experiments.
After the addition of benzoin solution and dilution to 25 ml, the solution was always mixed gently by inverting the flask several times, and a 20-ml portion. was transferred by pipette to the fluorimeter cell. It was possible to make the first reading on the fluorimeter 3 -minutes after mixing, and fluorescence-intensity readings were taken at intervals until the maximum fluorescence was passed. The shutter was always opened for a few seconds only at each reading to minimise the exposure of the test solution to ultra-violet light.
In setting the fluorimeter, the photomultiplier voltage was first adjusted to give a reasonably low noise output. For our particular 931A photomultiplier, the application of 800 volts was suitable. The sensitivity was adjusted, with use of a standard solution of quinine sulphate, to some convenient scale reading, which was checked from time to time to guard against possible fluctuations in lamp intensity or photomultiplier sensitivity. Normally, only slight adjustments were required over a period of 1! hours. To prepare the quinine standard, 0·25 ml of the standard quinine sulphate solution (0·01 g per litre) was diluted to 25 ml with 0·1 N sulphuric acid, and a 20-ml portion of this solution was placed, by pipette, in the fluorimeter cell. The sensitivity was adjusted to give a convenient half-scale reading on the x 25 range.
Experiments were made with isopropylamine, isobutylamine or pentylamine in place of the glycine buffer. In these experiments, the procedure was to add, in this order, 1 rnl of aqueous boron solution, 1 ml of water, 2 ml of primary amine and 18 ml of solvent and then to de-oxygenate with hydrogen for 10 minutes, subsequently adding 3 ml of a de-oxygenated 0·5 per cent. solution of benzoin in methanol and then diluting to 25 ml with de-oxygenated solvent if necessary. Various solvents were used, including methanol, ethanol, isobutanol. ethylene glycol, glycerol, formamide, N-methylformamide, NN-dimethylformamide, pyridine and ethyl methyl ketone. In every instance, blank tests were performed on the reagents without the addition of boron.
Many of the reagents used in these experiments contained fluorescent impurities when received from the supplier, and it was necessary to purify them by recrystallisation or distillation. AnalaR reagents were found to be satisfactory, and it was possible to use AnalaR ethanol, methanol, isobutanol, pyridine, glycine and sodium chloride without further purification. It 'was necessary to purify benzoin by three recrystallisations from AnalaR benzene and to purify isopropylamine, isobutylamine, pentylamine, ethylene glycol and N-methylformamide by distillation. Laboratory-reagent grade formamide, NN-dimethylformamide and ethyl methyl ketone showed little fluorescence and were used as received.

64 ELLIOTT AND RADLEY: INVESTIGATION OF BENZOIN [Vol. 86
Reagents were stored in polythene bottles as far as possible in order (a) to avoid contamination by boron from glassware and (b), for extremely dilute standard solutions of boron, to avoid any loss of boron by adsorption on the walls of the bottle. However, several workers6
have reported little detectable pick-up or adsorption when solutions containing microgram concentrations of boron are stored in polythene. It was necessary to keep some solvents, particularly the formamides and primary amines, in high-purity quartz vessels, because of their solvent action on polythene.
During the experiments, the test solutions were in contact with normal analytical glassware, e.g., calibrated flasks, pipettes and fluorimeter cells, but we found no evidence of any significant contamination by boron at these stages. When not actually in use, the apparatus and reagent bottles were protected from accidental contamination by boron from the atmosphere by enclosing them in a Perspex box or in closed polythene tubes. Repeated rinsing of apparatus and fluorimeter cells with water and AnalaR methanol was found to be effective in removing all traces of boron from a previous experiment, as shown by repeated blank determinations. The water used for preparing solutions and for rinsing was double-distilled, first in an all-glass apparatus and then in an all-quartz apparatus; it was stored in polythene bottles.
REAGENTs-
Boron solutions-AnalaR boric acid was dissolved in water to give concentrations of 0·5 and 5 p.g of boron per ml; these solutions were stored in polythene bottles.
Benzoin reagent solution-Laboratory-reagent grade benzoin was recrystallised three times from AnalaR benzene and then used to prepare a 0·5 per cent. solution in AnalaR methanol. Such solutions were stored in polythene and discarded after 14 days to reduce possible errors caused by oxidation of the benzoin.
Glycine buffer solution, pH 12·8-A 50-ml portion of a stock solution containing 7 ·505 g of AnalaR glycine and 5·85 g of AnalaR sodium chloride per litre was mixed with 450 ml of a stock solution containing 4 g of sodium hydroxide per litre (prepared as described below). All solutions were stored in polythene and renewed after 14 days.
Sodium hydroxide-To minimise the boron content, the sodium hydroxide was specially prepared from sodium metal. Clean pieces of sodium were dropped into a layer of water, covered by a deep layer of AnalaR ether, in a polythene bottle fitted with a reflux condenser. After some time, fresh ,pieces of sodium became very slow to react, as the solution reached saturation. The mixture was then transferred to a platinum dish and warmed gently to evaporate the ether. This yielded an approximately 50 per cent. solution of sodium hydroxide, which was stored in a polythene bottle.
Ethanol, 99 per cent., methanol and isobutanol-All of AnalaR grade and used as supplied. I sopropylamine, isobutylamine and pentylamine-All of laboratory-reagent grade and all
redistilled to remove fluorescent impurities. Formamide and NN-dimethylformamide-Both of laboratory-reagent grade and used as
supplied. N-Methylformamide-Laboratory-reagent grade. Redistilled under reduced pressure
at 85° C to remove volatile impurities and non-volatile fluorescent impurities. Ethylene glycol-Laboratory-reagent grade; redistilled to remove fluorescent impurities. Pyridine-AnalaR; used as supplied. Ethyl methyl ketone-Laboratory-reagent grade; used as supplied. Hydrogen-From a cylinder and passed through a catalytic de-oxygenating unit.
DEVELOPMENT OF BORON - BENZOIN FLUORESCENCE IN ETHANOL AND OTHER ALCOHOLS-
White and Hoffman's experiments3 with ethanol as solvent were repeated, glycine buffer solution, isopropylamine or isobutylamine being used as base, and closely similar fluorescencedevelopment curves were obtained. Stable readings over periods of 30 to 40 minutes were observed, but only if the test solutions were de-oxygenated. When glycine buffer solution was used without de-oxygenation, there was an induction period of 20 minutes before any fluorescence developed; this period could be shortened by the addition of more buffer solution. The fluorescence maximum was always less and always followed by a gradual decay in intensity when de-oxygenation was not used.

January, 1961] METHOD FOR FLUORIMETRIC DETERMINATION OF BORON
Methanol and isobutanol gave much lower values for fluorescence, and use of ethylene ,glycol as solvent produced no significant reading for boron. For comparison, ethyl methyl ketone and pyridine were tested as solvents, but were found to be unsuitable.
~ ~
·;:
" ... !! ., E ·;: 0
" u::
~00
200
l.......-;:c x-r-x ~
A( I -1-
r
1- v 100 - X / . co-..-- -+--._E
-~ ~~ -)< (T::_ 1<-C
~-.--+--
~D f-~-,.---><- -x--
/
-x--x--x-- / ___ ........ -• -•--F I 0
0 20 60 80
Time, minutes
Fig. 1. Fluorescence developed by 0·5 p.g of boron: curve A, in formamide; curve B, in N-methylformamide; curve C in NNdimethylformamide; curves D, E and F, blank fluorescence corresponding to curves A, B and C, respectively
B
90
~200f------~~-+----------4---------~----------~--~ ·;:
" ... ~ ., E -~
£ 100 ~~~~---+----------~--------~----------~--~
Time, minutes
Fig. 2, Effect of different bases on fluorescence developed by 0·5 p.g of boron in formamide: curve A, isopropylamine; curve B, isobutylamine; curve C, n-pentylamine
DEVELOPMENT OF BORON - BENZOIN FLUORESCENCE IN FORMAMIDE5-
Effect of substitution in amino group-The fluorescence developed in formamide and its N-methyl-derivatives was more intense for a given concentration of boron; test solutions containing 0·5 p.g of boron were therefore used. Fig. I shows the curves obtained for formamide, N-methylformamide and NN-dimethylformamide when isobutylamine was used as base and the solution was de-oxygenated with hydrogen. Once again, we observed considerable variations in the maximum fluorescence intensity attainable in solvents having-closely related chemical structures. ·

66 ELLIOTT AND RADLEY: INVESTIGATION OF BENZOIN [Vol. 86
Effect of different bases-When glycine buffer solution was used with the formamides, even in amounts up to 2 ml, no boron fluorescence was developed; this is in contrast to the behaviour in ethanol, which gave the strongest fluorescence with glycine buffer solution. There were small variations in the fluorescence intensities attainable when different primary amines were used. This is shown in Fig. 2, which gives the curves for 0·5-JLg samples of boron in formamide, with isopropylamine, isobutylamine and pentylamine as base.
Measurements of pH were made on the samples in formamide with the addition of isopropylamine or isobutylamine. It was assumed that the formamide was a strongly ionising
- ~=====~=Blank values
Time, minutes
Fig. 3. Effect of oxygen on fluorescence developed by 0·5 p.g of boron in formamide: curve A, isopropylamine as base and solution de-oxygenated; curve B, isopropylamine as base and solution not de-oxygenated; curve C, isobutylamine as base and solution deoxygenated; curve D, isobutylamine as base and solution not deoxygeifated
solvent and that the glass electrode of the pH meter would give reasonably correct readings under these conditions. Formamide has a high dielectric constant; it will conduct by means of free ions when inorganic compounds, such as hydrogen chloride or potassium chloride, are dissolved in it. 6 Readings of pH 13 were obtained on our solutions. This value is close to the pH of the glycine buffer solution (12·8), which suggests that the conditions of alkalinity produced by the primary amines in formamide are similar to those produced by the glycine buffer in ethanol.
Effect of oxygen-Fig. 3 shows the curves obtained with formamide as solvent and isopropylamine as base, both with and without de-oxygenation; curves with isobutylamine as base under similar conditions are also shown. Apart from the longer time needed to develop maximum fluorescence, the effect of oxygen in the formamide does not appear to be marked; when isobutylamine was used there was little decrease in the maximum fluorescence attained when de-oxygenation was omitted.
The relative values of fluorescence intensity for 0·5 jLg of boron in the various solvents under the most favourable conditions are shown in Table I (seep. 67). These results indicate that, in formamide with isobutylamine as base, the fluorescence intensity was 250 units, on an arbitrary scale, whereas that attained in ethanol with glycine buffer solution as base was only 50 units; i.e., formamide has a five-fold advantage over ethanol.
FLUORESCENCE AND BORON CONTENT-
The relationship between fluorescence intensity and the boron content between 0·05 and 0·5 jLg of boron was determined with formamide as solvent and isobutylamine as base. All samples were kept in the dark after mixing and de-oxygenation, and fluorescence was read 40 minutes after mixing. A linear relationship was found.

january, 1961] METHOD FOR FLUORIMETRIC DETERMINATION OF BORON 67
Colour of fluorescence-In ethanol the fluorescence was blue, but in formamide it was predominantly green.
TEMPERATURE OF SOLUTIONS-In all experiments the temperature of the sample was 20° ± 2° C. No significant
variations attributable to temperature were noted, but no specific study of temperature effects was made.
DISCUSSION OF THE METHOD We have confirmed that oxygen has a considerable effect on the intensity of the fluor
escence of the boron - benzoin complex in ethanol, as reported by Parker and Barnes.4 The effect of oxygen is to produce an induction period during which little fluorescence is developed and a decrease in the maximum intensity attained. It is strange that White and Hoffman3
did not report the effects of oxygen, as their curves for ethanol (with glycine buffer solution or isopropylamine as base) are similar in shape to those found by us for de-oxygenated solutions and show no induction period. Possibly, White and Hoffman's solvents were freshly distilled immediately before use and thus already de-oxygenated. On the other hand, we have not observed the serious errors of up to 50 per cent. reported by Parker and Barnes for experiments in which the solution was not continuously de-oxygenated by an inert gas. Undoubtedly, their solutions (72 percent. wjw aqueous ethanol 0·005 N in sodium carbonate) were much more sensitive to oxygen than were the solutions containing glycine buffer or a primary amine investigated by White and Hoffman and ourselves.
Once the solution has been de-oxygenated and placed in a stoppered cell there appears to be no necessity for a continued flow of gas through it, and steady readings can be obtained for up to 60 or 70 minutes after mixing. The quenching of fluorescence in hydrocarbons, due to dissolved oxygen, has been described by Bowen.7
The suppression of the induction period by adding more glycine buffer solution suggests that the glycine removes oxygen from the solution in addition to controlling the pH. It is interesting to note that, although glycine buffer solution produced the strongest fluorescence when ethanol was used as solvent, it was ineffective in the formamides, whereas the primary amines were able to induce strong fluorescence in these solvents.
The fluorescence intensities found in formamide and its N-derivatives were much higher than those attainable in ethanol. Here, our findings differ from those of White and Hoffman,3
who stated that the intensity attainable in formamide with isopropylamine as base was similar to that in ethanol for Identical concentrations of boron. Our results show that we obtained a five-fold increase in intensity by using formamide instead of ethanol; this represents a considerable increase in the sensitivity of the method.
INFLUENCE OF STRUCTURE AND DIELECTRIC CONSTANT OF SOLVENT-In considering the effects of the different solvents used, it appeared that the two most
important differences between the alcohols and the formamides were (a) molecular structure and (b) dielectric constant. The dielectric constant and the maximum fluorescence (in arbitrary units) attainable for 0·5 ,.,_g of boron are shown in Table I for the solvents used.
TABLE I DIELECTRIC CONSTANTS AND FLUORESCENCE ATTAINED WITH VARIOUS SOLVENTS
Fluorescence intensity for
Dielectric 0·5 p.g of constant boron, arbitrary
Solvent Structure at 20° C units Methanol CH8·0H 32·6 4 Ethanol CH8·CH1•0H 24·3 50 Isobutanol (CH1 ) 1CH·CH1·0H 15·8 8 Ethylene glycol HO·CH1·CH1·0H 37·7 0 Formamide NH1CO·H 115 250 N-Methylformamide CH1·NH·CO·H 190·5 170 NN-Dimethylformamide (CH8)1N·CO·H 37·7 80 Ethyl methyl ketone CH8·CO·CH1·CH8 18·5 3 Pyridine . . CaHaN 12·5 0
The effects of both structure and dielectric constant are apparent. The structure of formamide appears to be more favourable to the development of fluorescence than do those

68 ELLIOTT AND RADLEY: INVESTIGATION OF BENZOIN (Vol. 86
of the alcohols, e.g., the use of NN-dimethylformamide leads to a much higher intensity than does that of methanol or ethylene glycol (in which there is no fluorescence), although the dielectric constants of these solvents are similar in magnitude.
With the formamides, there is a tendency for fluorescence intensity to increase with dielectric constant; for example, with a given amount of boron, formamide, which has a dielectric constant approximately three tiines that of NN-dimethylformamide, gives approximately three times the fluorescence intensity. However, this relationship did not appear to hold for N-methylformamide, which has the highest dielectric constant (190·5), but gave less fluorescence than did formamide. There was a long induction period when N-methylformamide was used as solvent, in spite of de-oxygenation, and there may have been some inter-ference from unknown impurities. ·
There appears to be no relationship between dielectric constant and fluorescence in the alcohols, since methanol and ethylene glycol, which have the highest dielectric constants of the series, yielded the lowest fluorescence intensities. Here, the influence of structure is obviously more important. The solvents ethyl methyl ketone and pyridine are probably unsuitable for fluorescence development from both structural and dielectric constant considerations.
The fluorescence in ethanol was blue and that in formamide was predominantly green. The curve of the emission spectrum in formamide has not yet been measured, but the colour indicates that the peak of the spectrum has shifted to a longer wavelength with the increase in dielectric constant from 24·3 for ethanol to 115 for formamide. This effect of dielectric constant is well knoWn and has been described for solutions of dimethylnaphtheurhodine8
and for anthracene.9 De Ment10 has discussed the subject of interaction between solvent and fluorescent solute and has suggested the formation of solvates. In this system, increased solvation should provide greater possibilities of energy transfer, and therefore a lower fluorescence intensity, with a shift towards longer wavelengths (corresponding to lower energy quanta) as the dielectric constant increases. Although this wavelength shift has been observed when comparing formamide with ethanol, we have found a considerable increase, not a decrease, in fluorescence intensity.
The development of the boron - benzoin fluorescence is, therefore, a complicated process, involving interaction between the boron - benzoin complex and molecules of a suitable solvent medium (preferably having a high dielectric constant). The basic compounds present also have a considerable _effect on the development of fluorescence. The strong hydrogenbonding and dimerisation in ethylene glycol apparently prevent the molecule from interacting with the benzoin complex, but hydrogen-bonding in formamide and N-methylformamide, giving rise to association into chain polymers and so to a high dielectric constant, as described by Leader and Gormley,ll is helpful in increasing fluorescence and apparently does not interfere with the interaction. A more detailed investigation is required to determine the exact mechanism of the development of fluorescence.
We have borne in mind the various sources of error discussed by Parker and Barnes' for their boron - benzoin preparations. The inner-filter effect has not been studied for our solutions, but at the low concentration of benzoin used (about 0·06 per cent. w jv) this effect is probably small, and the fact that a linear relationship is obtained in the range 0·05 to 0·5 p.g of boron indicates that no serious interference is being experienced. The concentration of benzoin is in a thousand-fold excess over the required equimolecular concentration for boron at the 0·5-p.g level, and this assists in maintaining constant conditions.
With regard to photodecomposition of the benzoin during measurement, with a dose rate of about 2·0 micro-einsteins per minute at 366 miL from the MB/D mercury lamp, the error produced in our experiments is small. In the plotting of a typical fluorescence curve the total exposure of the sample to irradiation was no more than 15 or 20 seconds.
This work has been approached more from the empirical standpoint of obtaining a practical and sensitive method for determining boron. However, as our solutions differ radically in composition from those used by Parker and Barnes, it would be valuable to extend the investigation to determine the rate of oxidation of benzoin and the inner-filter effect in formamide - isobutylamine solutions under various conditions of irradiation.
CONCLUSIONS
Of the methods investigated, the use of benzoin with formamide as solvent and isopropylamine or isobutylamine as base offers the most convenient and accurate method of determining

January, 1961] METHOD FOR FLUORIMETRIC DETERMINATION OF BORON 69
amounts less than 0·5 p,g of boron by fluorimetry. A linear relationship between amount of boron, down to 0·05 p,g, and fluorescence is attainable by using the apparatus and method described.
This work was part of a programme for the analysis of high-purity silicon made on behalf of Standard Telecommunication Laboratories Ltd., and we acknowledge their permission to publish this paper. We also thank Mrs. M. King, who carried out most of the sample preparations and fluorimetric measurements.
REFERENCES
1. White, C. E., and Neustadt, M. H., Ind. Eng. Chem., Anal. Ed., 1943, 15, 599. 2. White, C. E., Weissler, A., and Busker, D., Anal. Ckem., 1947, 19, 802. 3. White, C. E., and Hoffman, D. E., Ibid., 1957,29, 1105. 4. Parker, C. A., and Barnes, W. J., Analyst, 1957, 82, 606. 5. Unpublished work, quoted by Yoe, J. H., and Koch, H. J., jun., Editors, "Trace Analysis," John
Wiley & Sons Inc., New York, 1957. 6. Dawson, L. R., Newell, T. M., and McCreary, W. J.~f· Amer. Ckem. Soc., 1954,76, 6024. 7. Bowen, E. J., Analyst, 1947, 72, 379. 8. Pincussen, L., "Biologiscke Licktwirkungen, Ikre Pkysikaliscken und Chemiscken wundlagen,"
J. F. Bergman, Munich and Wiesbaden, 1920. 9. Radley, J. A., and Grant, J ., "Fluorescence Analysis in Ultra-violet Light,'' Chapman & Hall Ltd.,
London, 1954, p. 388. 10. DeMent, J., "Fluorochemistry," Chemical Publishing Co. Inc., New York, 1945, p. 99. 11. Leader, G. R., and Gormley, J. F.,]. Amer. Ckem. Soc., 1951, 73, 5731.
Received june 3rd, 1960
Notes THE DETERMINATION OF MICROGRAM AMOUNTS OF SULPHUR-CONTAINING
COMPOUNDS
MICROGRAM amounts of sulphates, sulphides and organic sulphur have been determined by methods1 •1 •8 ·' depending on the formation of hydrogen sulphide and its conversion to methylene blue by treatment with p-amino-NN-dimethylaniline. Anomalous results were obtained in the determination of lime-sulphur deposits on plants, and a more detailed study of the reaction conditions was therefore made in an attempt to eliminate the causes of variation.
The relatively large amounts of sulphur present in the hydriodic acid - formic acid - red phosphorus reagent were conveniently removed from bulk amounts of the mixture by bubbling nitrogen through the stirred boiling mixture for 30 minutes daily. Most of the sulphur (75 per cent.) was present in the red phosphorus and the last traces were only slowly removed, as shown by the results below.
Boiling No ... Sulphur removed, ,..g
1 2 1820 8·6
3 6·0
4 1·4
5 2·0
6 0·3
7 0·0
Some old samples of the p-amino-NN-dimethylaniline salts gave brownish solutions that resulted in significant blank values, one specimen giving a blank equivalent to 0·30 ftg of sulphur. Treatment with active carbon and activated alumina removed the coloured material and reduced the blank value to the equivalent of 0·05ftg of sulphur.
On several occasions a solution of the amine salt in 7·2 N sulphuric acid1 gave blank values equivalent to about 50 ftg of sulphur. This was due to the action of some volatile reducing agent (but not phosphine), which interacted with the sulphate in the final mixture to yield hydrogen sulphide, which then reacted to form methylene blue. These high blank values appeared to be associated with the presence of free iodine in the reducing mixture, and boiling the mixture for 15 minutes immediately before use eliminated any further interference. To avoid the reduction of sulphate a solution of the amine dihydrochloride in hydrochloric acid was eventually used.
Several workers8 ·' have stated that the shade of the methylene blue colour was dependent on the concentration of acid in the final mixture. The effect of the volume of amine reagent added is shown in Table I, the resultant colours varying from pink at 0·6 ml through blue at 1·0 to 2·0 ml to distinctly greenish at 4·0 ml. To allow for the additional effect of the small amount of formic acid always carried over in the stream of nitrogen, it was decided to use 3 ml of the reagent. Pure methylene blue showed negligible visual variation in colour in various concentrations of acid,
70 NOTES [Vol. 86
although there were significant difierences when the solutions were examined spectroscopically, as shown by the results below.
Concentration of acid, N
Absorption at 670 mp. . . Absorption at 750 mp. ..
0 0·768 0·002
0·2 0·688 0·069
0·4 0·647 0·117
0·6 0·631 0·192
0·8 0·617 0·261
1·0 0·587 0·324
Slow rates of nitrogen flow resulted in incomplete recovery; too high a rate of flow also gave low results, as hydrogen iodide was carried over into the graduated cylinder. The hydrogen iodide not only decreased the pH during formation of the methylene blue, but later reacted with the added ferric chloride to give iodine, thereby interfering with colour development. Interference by hydrogen iodide was overcome by using a double-surface condenser in place of the usual Liebig condenser. The optimum rate of nitrogen flow was found to be about 40 ml per minute.
Standard solutions of sodium sulphide are convenient for preparing standard colours.8 However, the concentration of one such standard solution deteriorated from 9·1 to 7·8 and then to 6·2 p.g of sulphur per ml in 1 and 3 days, respectively. Budd and Bewick6 have also mentioned the
TABLE I
EFFECT OF VOLUME OF AMINE REAGENT ADDED
Volume of reagent added, ml
0·6 1·0 2·0 2·7 3·0 3·3 3·6 3·9 4·2
Absorption at-
670 mp. 0·058, 0·056 0·185, 0·184 0·248, 0·251 0·260, 0·262 0·282, 0·270 0·274, 0·285 0·266, 0·275 0·274, 0·274 0·266, 0·261
750 mp. 0·002, 0·002 0·018, 0·017 0·077, 0·076 0·119, 0·121 0·158, 0·139 0·166, 0·174 0·178, 0·184 0·203, 0·203 0·215, 0·214
deterioration of sodium sulphide solutions. For this reason a solution of potassium sulphate (dried at 105° C for 24 hours) was used in the preparation of the standard graph, which was linear up to 15 p.g of sulphur and conformed with the expression A = 2·03 X I0-1B, where A is the absorption at 670 mp. in a 5-mm cell and B is the number of micrograms of sulphur present. (This corresponds to a 64·7 per cent. yield of methylene blue from sulphur.) Owing to the adsorption of methylene blue on glass cells, it is necessary to clean the cells with chromic acid after use. It was found that the presence of up to 1 g of water in the sample did not interfere with the conversion of sulphur to methylene blue.
METHOD
REAGENTs--
Reducing mixture-Heat to boiling-point a stirred mixture of 114 ml of formic acid (98 to 100 per cent.), 150 ml of hydriodic acid, sp.gr. 1·7, and 22·5 g of red phosphorus, and bubble a gentle stream of nitrogen through the boiling liquid for 30 minutes. Continue to stir and maintain the flow of nitrogen while the solution is allowed to cool. Repeat this procedure on successive days until no further hydrogen sulphide is detected.
Zinc acetate mixture-Dissolve 5 g of analytical-reagent grade zinc acetate dihydrate in 100 ml of distilled water, and add 1·25 g of analytical-reagent grade sodium acetate trihydrate and 0·05 ml of glacial acetic acid.
p-Amino-NN-dimethylaniline solution-Dissolve 0·5 g of p-amino-NN-dimethylaniline dihydrochloride in a mixture of 250 ml each of concentrated hydrochloric acid and distilled water. Add 2·5 g of activated charcoal, and swirl for 10 minutes. Pour the mixture on to a column (14 mm internal diameter) packed with 10 g of activated alumina. The first portion of the eluate has a pH greater than 1 and should be discarded.
Ferric chloride solution-Dissolve 2 g of anhydrous ferric chloride in 100 ml of distilled water, and add 0·9 ml of concentrated hydrochloric acid. Filter if necessary.
PROCEDURE-
Place the sample containing not more than 15 p.g of sulphur and 1 g of water in the flask of the apparatus shown in Fig. 1. Add 10 ml of reducing mixture, taking care that the red phosphorus is evenly suspended throughout the mixture. By pipette, place 5 ml of zinc acetate mixture

January, 1961] NOTES 71
in a 25-ml graduated cylinder, and dilute to 18 ml with water. Pass a stream of nitrogen at about 40 ml per minute through a bubbler containing 4 N sodium hydroxide, into the flask and finally into the zinc acetate solution through a delivery tube immersed to a depth of io em. Heat the
II
Scale em 0 5 I I
Fig. 1. Apparatus for determining microgram amounts of sulphur-containing compounds
contents of the flask to gentle boiling during 5 minutes, and continue heating for a further 15 minutes. Disconnect the delivery tube from the apparatus, and drop it into the graduated cylinder, Add 3·0 ml of p-amino-NN-dimethylaniline solution, insert a stopper into the neck of the cylinder and carefully invert several times to ensure efficient removal of any precipitated zinc sulphide inside the delivery tube. Set aside for 10 minutes, add 0·2 ml of ferric chloride solution, and mix thoroughly. After 15 minutes, remove the delivery tube, wash it with water, add the rinsings to the contents of the cylinder, and add water to give a total volume of 25 ml. Measure the absorption of the solution at 670 miL after 15 minutes. Rinse the inside of the double-surface condenser immediately after use, first with water and then with a little sulphur-free acetone to remove traces of hydriodic acid.
REFERENCES
1. Fogo, J . K., and Popowsky, M., Anal. Chem., 1949,21, 734. 2. Johnson, C. M., and Nishita, H., Ibid., 1952,24, 736. 3. Fogo, J. K., and Popowsky, M., Ibid., 1949, 21, 732. 4. Lorant, I. S., Z. physiol. Chem., 1929, 185, 245. 5. Budd, M. S., and Bewick, H. A., Anal. Chem., 1952, 24, 1536.
RESEARCH STATION LONG ASHTON
BRISTOL
E. jOHN S~ERRETT G. ]. DICKES
Received July 11th, 1960

'7! NOTES [Vol. 86
RADIOCHEMICAL DETERMINATION OF MICROGRAM AMOUNTS OF CHLORIDE
CHLORIDE has been determined radiochemically in drinking-water by titration with radioactive silver as described by Langer1 and by Moeller, Terrill and Seal.2 I have evolved a modified isotopic-dilution technique in which chlorine-36 is used to determine microgram amounts of chloride ion with considerable accuracy. If to a solution containing chloride is added a known amount of labelled chloride and then sufficient silver nitrate to precipitate a known amount of silver chloride, then the original concentration of chloride is inversely proportional to the activity of the precipitate.
METHOD PRocEDURE-
To 10 ml of a slightly acidified solution containing from 30 to 300 p,g of chloride add exactly 1·00 ml of a solution containing 190 p,g of chloride labelled with chlorine-36. Mix thoroughly, add exactly 0·50 ml of 0·01 N silver nitrate, spin the mixture in a centrifuge, and carefully remove the supernatant liquid by suction through a fine capillary. Dissolve the precipitate in concentrated ammonia, transfer the ammoniacal solution to stainless-steel planchets, evaporate to dryness, and count under a thin end-window Geiger- Muller tube.
Carry out a blank determination at the same time, and calculate the amount of chloride originally present from the expression-
Weight of chloride originally present, p.g = Weight of labelled chloride added, p.g x A ; B
where A and B are the activities of the blank and sample precipitates, respectively, measured in counts per minute.
RESULTS
Some typical results by the proposed method were-
Chloride present in 10 ml of solution, p.g Activity, counts per minute Chloride found, p.g
0 4680
35·5 3960 34·4
71·0 3393 72·0
178 2420 177
355 1620 358
from which it can be seen that, considering the small amount of chloride present, the recovery was of high precision. A preparation of higher specific activity would permit accurate determination of much smaller amounts of chloride ion.
REFERENCES 1. Langer, A., Anal. Chem., 1950,22, 1288. 2. Moeller, D. W ., Terrill, J. G., jun., and Seal, M.S., "Peaceful Uses of Atomic Energy," Proceedings
of International Conference in Geneva, 1955, United Nations, 1956, Volume XV, p. 49.
WELLINGTON CITY COUNCIL LABORATORY WELLINGTON, NEW ZEALAND
J. K. }OHANNESSON Received August 5th, 1960
THE PRECISION AND LIMIT OF DETECTION OF ANALYTICAL METHODS
THE large and ever-increasing volume of analytical literature makes it desirable to be able to compare the performances of reported methods without having to make detailed experimental studies of them. Two of the most important parameters for defining performance are precision and limit of detection. To facilitate comparisons, it is preferable that these two parameters should be defined on a sound and uniform basis. The purpose of this Note is to consider possible methods of definition.
PRECISION
Analysts have become increasingly aware that statistical techniques provide a sound and uniform basis for interpreting and presenting experimental results. The standard deviation of a particular method is a most valuable statistic for defining precision, and to-day most papers quote this parameter. The usual, although not invariable, procedure adopted appears to be to analyse a series of identical samples, to subtract an appropriate blank value from each result and then to calculate the standard deviation of the corrected results. This standard deviation is often quoted as the precision of the method. However, this procedure does not generally give the true standard deviation because no account is taken of the variability of the blank.

January, 1961] NOTES 73
If the amounts of impurity found in the sample and the blank are A and B, respectively, the true impurity content of the sample, C, is given by C = A - B. Assuming that the results for sample and blank have normal distributions (in the statistical sense), then the standard deviation of the corrected results is given by the expression-
ScJ=IVSA1 + Ss• where SA, Ss and Sc are the standard deviations of A, B and C. It is the standard deviation of C that is of interest and therefore, in general, the standard deviations of sample and blank should both be determined. The relative values of A and'B in no way affect this argument; it is only their standard deviations that are of importance. '
When SA1 is much larger than S82 the effect of the blank variability is negligible, but, when
SA• is approximately equal to Ss1, the true standard deviation will be about 40 per cent. (i.e., a factor of y2) greater than the standard deviation calculated from the sample results only. The latter instance will frequently arise when the sample values are close to the blank value or when the standard deviation of the method used is independent of concentration. It is suggested, therefore, that results showing the standard deviation of the blank should be published whenever possible. This would also be of use in indicating whether or not the standard deviation depends on concentration. Finally, the results would be of value in connection with the limit of detection (see below).
The standard deviation of a set of results may depend on whether they were obtained by one analyst in one laboratory, by several analysts in one laboratory, by an analyst in each of several laboratories, etc. From the above argument, it follows that the standard deviation of the blank should be determined by exactly the same procedure as is used for the samples. In reporting results, the method used to obtain them should also be made clear. It is not sufficient merely to say that replicate analyses were made to determine the standard deviation; factors such as the number of analysts and laboratories involved and the period during which the results were obtained should be defined.
LIMIT OF DETECTION
Several suggestions have been made for defining the limit of detection. Statements in terms of the smallest amount or concentration that can just be detected are dependent on subjective interpretation of the word "smallest"; th~ smallest detectable amount (when sufficient determinations are made) may be very different from the smallest amount that can always be detected. Statements related to the smallest observable reading that can be made on the scale of an instrument are meaningless unless we know the sensitivity and precision of that instrument and also the precision associated with any pre-treatment of the sample before the instrument is used. Others have suggested a given multiple of the blank result or of its standard deviation. General considerations indicate that, if the blank has a large variability, it is not possible to detect such small amounts in the sample as when the blank is constant. For this reason, I think that the standard deviation of the blank is, in general, of fundamental importance in defining the limit of detection. Again, it is suggested that the standard deviation of the blank should be reported whenever possible.
A definition can be made quantitative by considering the probability of detection of different amounts of impurity. As above, Sc = ySA2 + Ss2, and, assuming that SA= Ss, then Sc = y2Ss. This implies that, even if the sample contains an amount of impurity, C, there is a finite chance that the analytical result will be zero or less, i.e., the impurity will not be detected. Clearly, as C increases, the probability of obtaining a value "(0 decreases. By choosing different values for C, one can calculate the probability of detection from the known properties of the normal distribution. Similarly, the probability of detecting an amount, C, of impurity when the sample contains none can also be calculated. For this purpose the Tables of normal distribution given by Davies1 have been used. The results are shown in Table I, which indicates that the probability of detection is reasonably high when the limit of detection is set at values ;;;.2Ss. If the standard deviation of the blank is quoted, the appropriate detection limit may be set depending on the certainty required in any particular analysis. The blank value may depend on many factors, which vary from one batch of analyses to another. For detecting very small amounts of impurity, at least one blank value should be determined together with the samples in order to avoid between-batch variability. Thus, the standard deviation of the blank of importance to the limit of detection is that corresponding to the within-batch variability.
The above discussion has rested on the assumption that the standard deviations of the sample and blank are equal. Provided that the same significant sources of error apply to both, this assumption appears to be reasonable when the value for the sample is very close to that for the blank.

74 NOTES [Vol. 86
Sometimes, e.g~. when the sample is dissolved before analysis of the solution, errors may be introduced by operations not replicated with the blank. For such examples, the limits of detection calculated as above will be falsely low. However, if these additional errors exist, the analyst will usually know of them and will therefore be able to make an estimate of their effect. This
TABLE I
PROBABILITY OF DETECTING DIFFERENT AMOUNTS OF IMPURITY
Limit of detection (C)
SB .y2 SB 2SB 2y2SB 3SB
Probability of detection of-
impurity present in amount C
0·760 0·841 0·921 0·977 0·983
an amount ;;loC when none is
present 0·240
.0·159 0·079 0·023 0·017
method of defining the limit of detection can also fail with methods in which the analytical response is zero for finite concentrations, e.g., in a gravimetric method for which the lower limit is set by the solubility of the precipitate.
This method of defining the limit of detection was suggested to me by A. Liddle; this suggestion is gratefully acknowledged. This Note is published by permission of Dr. J. S. Forrest, Director of the Central Electricity Research Laboratories.
REFERENCE
1. Davies, 0. L., Editor, "The Design and Analysis of Industrial Experiments," Oliver & Boyd Ltd., London and Edinburgh, 1954, p. 594.
CENTRAL ELECTRICITY RESEARCH LABORATORIES KINGSTON ROAD .
LEATHERHEAD,SURREY A. L. WILSON
Received August 17th, 1960
CHROMATOGRAPHIC BEHAVIOUR OF 2,4-DINITROPHENYLHYDRAZONES ON CHROMA TO PLATES
IN an investigation of volatile carbonyl compounds from foods, a rapid method was needed for separating the 2,4-dinitrophenylhydrazones of aromatic aldehydes. The most convenient method seemed to be the "chromatostrip" or "chromatoplate" technique described by Kirchner, Miller and Keller,1 which involves use of strips or plates of adsorbent-coated glass. To prepare layers of good mechanical strength, a substance such as pectin or gypsum is added to the adsorbent, together with enough water to form a thin slurry; much experience is needed in order to cover the plates with an adsorbent layer having reproducible properties. Stahl2 devised a simple apparatus that produces homogeneous layers of thickness about 200 1-'- without much skill on the part of the operator. The most essential part of Stahl's apparatus is a small tank, which contains the adsorbent suspended in water. The tank is provided with a narrow slit so that, when it is moved over the glass plate, the surface is covered with a thin layer of the adsorbent, the thickness of which is defined by the width of the slit and the amount of water used to prepare the slurry.
METHOD
PROCEDURE-
Chromatoplates were prepared by using Stahl's apparatus (obtainable from C. DesagaG.m.b.H., Heidelberg, Germany), with silica gel G as adsorbent. (Silica gel G, a standardised mixture of silicic acid and gypsum, is obtainable from E. Merck A. G., Darmstadt, Germany.) The plates were stored in a metal rack open to the air and were activated before use; activation was carried out at ll0° C for 15 minutes. The plates were then cooled by setting them aside on a glass plate for about 5 minutes. The compound or mixture being investigated was dissolved in chloroform, and spots of the solution were placed on the plates with a 10-ftl pipette. The solubility of 2,4-dinitrophenylhydrazones in chloroform was sometimes poor; for such compounds dioxan was used

January, 1961] NOTES 76
instead. The spots were applied 2 em from the bottom of the plate and 1 em apart. Eighteen spots could be chromatographed on one plate when an ascending-solvent technique was used.
The activity of the adsorbent layer was calibrated by using the test mixture described by Stahl,• a solution of butter yellow (p-dimethylaminoazobenzene), indophenol blue and Sudan red G in a volatile solvent. The treated plates were developed in ordinary glass tanks, the solvent generally being allowed to rise 10 em. In the first experiments, results were not reproducible, but good reproducibility was attained when the atmosphere in the tank was saturated with the vapour of the solvent used to develop the chromatogram. T}lis was done by covering the walls of the tank with filter-paper dipping into the solvent.
After development of the chromatograms, the positions of the 2,4-dinitrophenylhydrazones were measured against that of the butter yellow, the RB value being defined by the expression-
Movement of 2,4-dinitrophenylhydrazone from start, mm RB =
Movement of butter yellow from start, mm
RESULTS AND DISCUSSION OF THE METHOD
The RB values were independent of the time of development and of the rates at which the spots moved. With a (3 + 1) mixture of benzene and light petroleum (boiling range 60° to 80° C) as solvent, some typical RB values after different times of development were-
Movement of butter yellow from start, mm RB value of 2,4-dinitrophenylhydrazone of ot-ionone RB value of 2,4-dinitrophenylhydrazone of benzaldehyde
40 1·43 1·10
80 1·39 HO
110 1·40 1·08
The reproducibility of the RB values was determined in a series of experiments with the 2,4-dinitrophenylhydrazones of acetaldehyde, benzaldehyde and , ot-ionone; the results are shown in Table I. Spots were separate when their RB values differed by 0·10 to 0·15.
TABLE I
REPRODUCIBILITY OF RB VALUES
Compound, as 2,4-dinitrophenylhydrazone
Acetaldehyde Benzaldehyde ot-Ionone ..
Number of experiments
6 10 10
TABLE II
Mean RB value 0·55 1·08 1·40
Standard deviation of a single observation
0•044 0·033 0·028
RB VALUES OF SOME 2,4-DINITROPHENYLHYDRAZONES IN SOLVENTS A AND B
RB value in-Compound, as
2,4-dinitrophenylhydrazone Vanillin .. Veratraldehyde .. Ethyl vanillin Salicylaldehyde .. Cinnamaldehyde Benzaldehyde ot-Ionone ,8-Ionone Anisaldehyde
DEVELOPING SOLVENTs-
r------A------~ solvent A
0·06 0·0 0·0 0·50 0·83 1·06 1·40 1·41
solvent B 0·17 0·45
Streaks 0•85 1·04 1·03 1-14 1·14 0·88
From a number of solvents tested, two were chosen for developing the chromatograms. These were a (3 + 1) mixture of benzene and light petroleum, boiling range 60° to 80° C (solvent A), and benzene containing 5 per cent. of ethyl acetate (solvent B). As a measure of the resolving power of a solvent, the RB values of the normal saturated aliphatic aldehydes were determined as a function of their chain length. The results for solvents A and B are shown in Fig. 1, from which it is clear that solvent A is the most suitable for the aliphatic series. Solvent B is of value for separating more polar aromatic dinitrophenylhydrazones.

76 NOTES [Vol. 86
Mixtures containing vanillin, veratraldehyde and ethylvanillin are not separated by solvent A, but can be readily resolved by using solvent B. Mixtures of the vanillins with other carbonyl compounds are best separated by using two-dimensional chromatography with solvents A and B. Some RB values for these two solvents are shown in Table II.
1·30
B
., 1·10 "' ~ 0! 0·90
0·70
0·50 '------,2.!-----4-r--~6---,1:8---n, 0.----7.12..--'
Number of carbon atoms In chain
Fig. 1. RB values for 2,4-dinitrophenylhydrazones as a function of chain length : curve A, benzene - light petroleum mixture (3 + 1) as solvent; curve B, benzene containing 5 per cent. of ethyl acetate as solvent
The method is suitable when mixtures of aliphatic and aromatic carbonyl compounds have to be separated. The spots can be scraped from the plates into centrifuge tubes, and the 2,4-dinitrophenylhydrazones can then be extracted with chloroform and subjected to ultra-violet spectrophotometry, melting-point determination and flash-exchange chromatography.•
REFERENCES
1. Kirchner, J. G., Miller, J. M., and Keller, G. J., Anal. Chem., 1951,23, 420. 2. Stahl, E., Phamzazie, 1956, 11, 633. 3. Ralls, J. W., Anal. Chem., 1960,32, 332.
CENTRAL INSTITUTE FOR NUTRITION AND FooD RESEARCH T.N.O. UTRECHT, THE NETHERLANDS
Apparatus
J. H. DHONT C. DE Roov
Received August lith, 1960
A DEVICE FOR INCREASING THE SENSITIVITY OF A pH METER
CERTAIN titrations to a fixed pH end-point show only a small increase in pH for increase in titrant added at the equivalence point, e.g., the titration of aluminium in sodium aluminate solutions (when the aluminium is determined by titration of hydroxyl ions released by adding potassium fluoride solution1) and the determination of boron by titration of its complex with mannitol. Because of the inherent stability of the Pye Universal pH meter, a sensitivity of pH reading above that provided by the instrument can be attained by use of the external socket fitted to the instrument, which gives an output of 100 /LA per unit of pH. An eight-fold increase can be attained by means of a simple adapter and auxiliary meter.
The instrument normally covers two ranges of pH, viz., 0 to 8 and 6 to 14, over a scale length of 4! inches; with the adapter described below, provision has been made to give variable sensitivity up to a maximum of 1 unit of pH for full-scale deflection on the auxiliary meter. To allow full flexibility of this increased sensitivity, a backing-off device provided by a small adjustable voltage in series with the electrode system permits the meter to be set for any required range in a suitable buffer solution.
A further 'efinement is provided, giving fixed increases or decreases in pH by means of a selector sWitch.

January, 1961] APPARATUS 77
DESCRIPTION OF ADAPTER
The adapter is designed round a 0 to 100 f.LA meter having a scale length of 5 inches (1 division == 1f.LA), and provision is made for variable sensitivity or a maximum sensitivity of 1 unit of pH full-scale. Since the auxiliary meter can only be used over a pH range of 0 to 1, 0 to 2, etc., as recorded on the main meter, the adapter must have a means of shifting the reading up or down to cover the required range, since the controls fitted to the instrument do not have sufficient movement. This is done by using a 1·5-volt cell (Every Ready No. U2) and a potential divider; the circuit is shown in Fig. 1.
To" Ext" socket on pH meter
Meter, 0 to IOOfJA
~ ~------ ......
-pr-, I I
R2 I --·- _J
To "Rer" on ~c:::jo----~---~ pH meter
5000-ohm potentiometer 10,000-ohm potentiometer 10,000-ohm resistor
1\eference- electrode socket
Switch positions-A Auxiliary meter shorted; battery off 8 Auxiliary meter shorted; battery on C = Variable sensitivity; battery on D = Maximum sensitivity (full-scale, I unit of pH); battery on
Fig. 1. Auxiliary meter and potential-divider circuit
To provide fixed changes in pH a series o£ resistors is incorporated in the potential-divider network; these are carefully adjusted 1-watt carbon resistors filed to the correct values, in this instance to give changes of 2, 4 and 6 units of pH. For this modification it is necessary to provide an adjustment of the output voltage from the unit cell to permit the correct increments to be maintained; the modification is shown in Fig. 2.
METHOD OF OPERATION
For certain pH titrations we have found that a sensitivity of 2 units of pH (full-scale) is most convenient, i.e., 1 division == 0·02 unit of pH. With such a setting, the zero of the main instrument can be adjusted to read pH 2·0, which can be used to set up the auxiliary meter; this permits a rapid check on the sensitivity of the auxiliary meter to be made during a titration.
The instrument is set to the required sensitivity, e.g., 2 units of pH, with the switch in position C and the main meter reading 2·0, by adjustment of potentiometer P 1 to give full-scale deflection on the auxiliary meter. The range is then set by using a suitable buffer solution, e.g., in the aluminium titration a 0·05 M sodium tetraborate buffer of pH 9·18 is used. With a sensitivity of 2 units of pH for full-scale deflection, the meter is set to read 9 scale divisions ( 1 division == 0·02 unit of pH) by means of the backing-off potentiometer, P1 ; the main meter will then read 0·18. Thus the auxiliary meter covers the pH range 9 to 11; the titration is carried out to pH 10·4 (70 divisions on the auxiliary meter).

78 BOOK REVIEWS [Vol. 86
By means of the fixed-pH-increment switch, the course of pH titrations can be followed at any required sensitivity without re-setting the instrument.
The stability of the instrument is so high that there is no detectable drift of the auxiliary meter during a titration; it is usually less than 0·02 unit of pH between titrations. The adapter has been in use for more than 12 months with satisfactory results.
R•Ji o-.fV'VV11 .,...,,~ RSI ~vv• R61
_o ___ j
R3 = 1000-ohm variable resistor R-4 = 22,000-ohm 1-watt carbon resistor ilncrement 2 unlu of pH) Rs = 10,000-ohm 1-watt carbon resistor Increment .of uniu of pH) R6 = .of700-ohm 1-watt carbon resistor Increment 6 uniu of pH)
Fig. 2. Modification to potential-divider network
The adapter can be used with any pH meter fitted with an external high-sensitivity socket and can be suitably modified when the sensitivity is different from that of the Pye instrument.
I thank Mr. G. P. King, of W. G. Pye & Co. Ltd., for helpful advice in designing the adapter and The British Aluminium Co. Ltd. for permission to publish.
REFERENCE 1. Watts, H. L., Anal. Chem., 1958, 30, 967.
REsEARCH LABoRATORIES THE BRITISH ALUMINIUM Co. LTD.
CHALFONT PARK GERRARDS CROSS, BuCKS.
Book Reviews
H. JACKSON Received August 18th, 1960
Dnt QUANTITATIVE BESTIMMUNG DER ALKALOIDE IN DROGEN UND DROGENZUBREREITUNGEN. By Prof. Dr. rer. nat. OTTO-ERICH ScHULTZ and Prof. Dr. rer. nat. FELix ZYMALKOWSKI. Pp. x + 295. Stuttgart: Ferdinand Enke Verlag. 1960. Price (paper) DM 73; (cloth boards) DM 77.
The first part of this book, dealing with general principles, starts with a section of 63 pages describing methods of isolating alkaloids, and, in addition to accounts of classical methods, there are discourses on the application of both column and paper chromatography. A further 40 pages are devoted to the general principles of determination. After this there follow the working methods for 26 groups of alkaloids, for example, ipecacuanha alkaloids, opium alkaloids, rauwolfia alkaloids, and so on. This portion, occupying 181 pages, is the book itself and it is excellent. Working details for carrying out the assays are presented in small print, and full descriptions for effecting separations of associated alkaloids, usually by chromatographic methods, are included, references to the literature being quoted at every step. The useful monograph of 31 pages on the ergot alkaloids well illustrates the thorough manner in which the authors have dealt with their subjeCt.

January, 1961] BOOK REVIEWS 79
In this connection it is somewhat disappointing that, in the account of the colorimetric determination of the solanaceous alkaloids, the important improvement in technique developed by F. M. Freeman (Analyst, 1955, 80, 520) is not described or even mentioned.
This book will be welcome to those few who practise in this difficult branch of chemistry, because, although they know that alkaloidal analyses rarely proceed according to the written word, they will have ready to hand a helpful account of most of the important work published on the subject up to 1958. NOEL L. ALLPORT
ELEMENTARY TITRIMETRIC ANALYSIS. By A.M. G . MACDONALD, Ph.D ., A .R .I.C. Pp. viii+ 133. London : Butterworths Scientific Publications. 1960. Price 12s. 6d.
The teaching of practical inorganic chemistry in schools and technical colleges usually involves some aspects of titrimetric analysis, and it is in these early exercises that the student acquires a sense of achievement and a practical appreciation of the fact that molecules do react in accordance with the known laws of theoretical chemistry.
For these reasons, too much importance cannot be placed on the teaching of fundamental titrimetric analysis and in the choice of supporting practical exercises. In this publication, the author has established a judicious balance between theoretical and practical aspects of the subject, keeping each simple and well within the comprehension of the average student.
The practical exercises, beginning with simple acid - base reactions and concluding with complexometric titrations, are representative of everyday laboratory practice, and each is prefaced by a brief, though adequate, account of the underlying principles involved.
This small inexpensive book is remarkable in its coverage, and the author is to be congratulated on presenting the information so precisely. In its class the book fulfils an outstanding need.
W. T. ELWELL
INSTABILITY CONSTANTS OF COMPLEX COMPOUNDS. By K. B. YATSIMIRSKII and V. P . VASIL'EV. Translated from the Russian by D. A . PATERSON. Pp. viii + 218: Oxford, London, New York and Paris: Pergamon Press Ltd. 1960. Price 42s.
This book falls clearly into two parts. The first half (chapters I to IV) describes the mathematical functions characterising the step-wise formation of metal complexes in solution (19 pages) and then summarises the experimental methods used for determining stability constants (48 pages) and the thermodynamics of complex formation (8 pages). It concludes with an account (17 pages) of factors determining the stability of complex compounds in solution.
The second half of the book (120 pages) is a collection of data on the stability constants of 1381 compounds. The literature is said to have been covered up to 1954 and to include some of the work published in 1955-56. However, the data are rather arbitrarily selected, and there are many serious omissions; in this respect the compilation cannot bear comparison with the comprehensive and authoritative Tables of Stability Constants, Part I (Organic Ligands) and Part II (Inorganic Ligands) published by the Chemical Society and already reviewed in The Analyst, 1958, 83, 381, and 1959, 84, 120.
The translation is good throughout, but there are many errors in the spelling of names in the bibliographies and all accents have been omitted. H . IRVING
CHEMICAL PLANT INSTRUMENTATION: SOME NOTES ON THE USE OF MEASURING INSTRUMENTS. Pp. viii + 55. London: The Association of British Chemical Manufacturers. Price (members) 6s.; (non-members) 7s. 6d.
The contents of this book are best described by its sub-title. It is a series of brief articles, rather variable in length, content and outlook, on some of the instruments used on chemical plants. The stated aim of the book is to stimulate interest, and it is intended for the managements of firms having little or no instrumentation. It must therefore be judged accordingly.
In general, these short notes achieve their purpose of stimulating interest, but I think that they might have been rather more useful to the intended reader if some information about the practical uses of the instruments had been given, with examples of their application to specific problems. The names of the manufacturers of the instruments described, with the approximate costs, would also have been useful additional information.
Although adding nothing new to the subject of instrumentation, the book does sum up in a simple manner the uses of some of the commoner instruments and, as such, should be useful.
J. F. BROWN

80 PUBLICATIONS RECEIVED
TRACE TECHNIQUES UsiNG THE KIOOO CATHODE RAY PoLAROGRAPH. Reviewed, Analyst, 1960, 85, 611.
Our attention has been drawn to the fact that the remarks of our reviewer could be construed as a refiection upon the professional ability and reputation of Mr. Hetman.
It was the reviewer's intention only to suggest that it would have been worth while to obtain a second opinion prior to publication as to the possible limitations of the methods in general application. EDITOR
Publications Received MEDICINE, SciENCE AND THE LAw. Vol. I, No. 1, October, 1960. Editor: FRANCIS E. CAMPS,
M.D., D.T.M. & H. Pp. iv + 132. London: Sweet & Maxwell Ltd. Annual Subscription (4 parts per year) 63s.; $10.00. Single numbers 17s. 6d.
A new journal; official journal of The British Academy of Forensic Sciences. RADIOACTIVE IsOTOPES IN BIOCHEMISTRY. By ENGELBERT BRODA. Pp. x + 376. Amsterdam,
London, New York and Princeton: Elsevier Publishing Co.; London: D. Van Nostrand Co. Ltd. 1960. Price 57s.
CoRsi DI ANALISI CHIMICA SEMIMICROQUALITATIVA. By Professor MARIO GIORDANI. Pp. X + 270. Rome: Editrice Studium. 1960. Price Lire 4000.
OFFICIAL METHODS OF ANALYSIS OF THE ASSOCIATION OF OFFICIAL AGRICULTURAL CHEMISTS. Edited by WILLIAM HORWITZ. Ninth Edition. Pp. xx + 832. Washington, D.C.: The Association of Official Agricultural Chemists. 1960. Price $17.50 (in U.S.A.); $18.00 (elsewhere).
PROCEEDINGS OF THE SYMPOSIUM ON THE CHEMISTRY OF CO-ORDINATION COMPOUNDS, AGRA, INDIA, FEBRUARY 7TH & 8TH, 1959. Part 1 : pp. vi+ 148; Part 2: pp. iv + 203; Part 3: pp. vi+ 302 +vi. Allahabad, India: National Academy of Sciences. 1960. Price (Part 1) .Rs. 15.00; (Part 2) Rs. 25.00; (Part 3) Rs. 35.00; (all three Parts) Rs. 75.00.
ORGANIC ANALYSIS. Volume IV. Edited by J. MITCHELL, jun., I. M. KoLTHOFF, E. S. PRosKAUER and A. WEISSBERGER. Pp. viii+ 429. New York and London : Interscience Publishers Inc. 1960. Price $13.50; 102s.
TITRATION IN NoN-AQUEOUS SOLVENTS. By A. H. BECKETT and E. H . TINLEY. Third Edition. Pp. iv + 56. Poole, Dorset: The British Drug Houses Ltd. 1960. Gratis
RADIOACTIVATION ANALYSIS: PROCEEDINGS OF THE RADIOACTIVATION ANALYSIS SYMPOSIUM HELD IN VIENNA, AUSTRIA, }UNE, 1959. Scientific Editor: BRYAN R. PAYNE. Pp. 141. London: Butterworths Publications Ltd. 1960. Price 30s.
Symposium organised by the joint Commission on Applied Radioactivity (I.C.S.U.), International Atomic Energy Agency. Reprinted from Pure and Applied Chemistry, Vol. l, No. 1.
HANDBUCH FUR DAS EISENHUTTENLABORATORIUM. Band I. DIE UNTERSUCHUNG DER NICHTMETALLISCHEN STOFFE. Edited by the Chemikerausschuss des Vereins Deutscher Eisenhiittenleute. Pp. xviii + 322. Dusseldorf: Verlag Stahleisen M.B.H. 1960. Price DM 43.
GAS CHROMATOGRAPHY 1960. Edited by R. P. W. SCOTT. Pp. xviii + 466. London: Butterworths Publications Ltd. 1960. Price 95s.
Proceedings of the third symposium organised by the Society for Analytical Chemistry and the Gas Chromatography Discussion Group of the Hydrocarbon Research Group of the Institute of Petroleum, held at The Assembly Rooms, Edinburgh, S-lOth june, 1960.
REPRINTS FROM THE ANALYST REPRINTS of the following papers published in The Analyst are now available from the Assistant Secretary, The Society for Analytical Chemistry, 14 Belgrave Square, London, S.W.l (not through Trade Agents). Orders must be accompanied by a remittance for the correct amount made out to The Society for Analytical Chemistry. Recommended Methods of Assay of Crude Dru~s: Prepared by the Joint Com
mittee of the Pharmaceutical Society and the Society for Analytical Chemistry. "Assay of Rauwolfia" (October, 1960). Price (members of the Society for Analytical
Chemistry) ls. 6d. (non-members) 2s. 6d. Review Paper.
"The Oxygen Flask Method," by A. M. G. Macdonald (this issue; available shortly). Price 5s.

January, 1961] THE ANALYST XV
CLASSIFIED ADVERTISEMENTS Tile rate for classified advertisnnrnts is !is." line (or space eqztiva.lenl of a line), with an extra cllarl!e of Is. for the use of a Box f\:umber. ::;emi-displayed classified advertisements are 60s. fJer single-coh4-ml~ inch.
ANALYTICAL ABSTRACTS. A few more abstractors arc requin.'<l. Ability to abstract foreign papers, ("Specially in P o!isb, Czech, H.omanian, Italian and the Scandinavian lan~uages would be valuable. Apply to the Editor, ANALYTICAL ABSTRACTS, 14, Belgrave Square, Lon· don, S.W.l.
ANALYTICAL ABSTRACTS
The Editor wishes to purchase copies of the numbers for February and March, 1960. Copies should be sent to Analytical Abstracts, 14, Belgrave Square, London, S .\V.l .
EDITORIAL ASSISTANT required for Anatvtical Abstracts. A d egree in chemis try and some <.~xpcricncc of ch emical analysis is desirable. Five -day week. Hours 9.ao to 5. Apply in writing to the Editor, Analytical Abstracts, 14 Belgrave Square, London, S. W .1 .
i i
I
I I
Chelllist Qualified chemist (male) aged 35-45 to assist Chief Chemist. Experience in Food, Beverage, Pharmaceutical, or allied industries required. Pension scheme. Salary according to experience.
Apply with details of experience by letter to:
Works Director, Vine Products Ltd. (VP Wines), Villiers Road,
KINGSTON, SURREY
or by telephone: Kingston 5641
HOWARDS OF ILFORJ> LTD. IIford, Essex
require assistants, male or fcHI<lle, in their A11alytical Control Laboratories. The worl.- , which is vari('cl in charact<'r, is concerned with process control l <$ting ami quality control t esting of raw ma terials and a wiclc range of finished products. Minimum qualification is <~.C.E. "0" level in chemistry but higher qualification, up to H.N.C., would be aclvantagrous. Age prderably I 7-~4 y<.'ars. Salary according t o ag<~ and qualification . Apply in writing to- The Pcrsomwl Managt>r, Howards of IIford Ltd., IIford, Ess<:x.
WORCESTERSHIRE COUNTY COUNCil. County Analyst's Department
A Senior Assistant, with A.R.I.C., or cquivaknt honours dcgrt>e to start April , l061. Practical experience in cxamina· tion of wat.er, sewage and trade wastes desirable. Salary within £961!- £1:110 A.P .T . (;rade lii·IV; starting point according to qualifica tions and experience. Five-day week.
Form of application from County Analyst, County Buildings, Worcester.
t:::::h, She II ~Chemicals
A vacancy occurs at the
CARRI~GTON RESEARCH LABORATORY
(NEAR MANCHESTER) for a
SPECTROSCOPIST Candidates should be graduates iu chemistry with some additional skill in physics and/or electronics and should have several years post-graduate experience in an industrial spectroscopic laboratory (lnfra-redtUltra· violet/Emission). Candidates' first interest should be in analytical research and development rather than instrument development. Age bracket 25-a5.
This is an important career appointment in which keeness and ability to act on personal initiative are major requirements.
Salary will be commensurate with age, qualifications and experience. Generous pension scheme and other benefit~.
Applications (quoting Reference CRL 124) to-
SHELL CHEMICAL COMPANY LIMITED, Penonnel Department, 28/30 Old Burlinpon street, London, W.1.
COUNTY OF HEREFORD
Applications arc invited from applicants possessing the qualifications prescribed by the Fertilisers and Feeding Stuffs Regulations, 1 SJI);j, and the Public Analysts' Regulations, 1957 ,for the part-time appointments of:
Agricultural Analyst and Public Analyst
for the County of Hereford. Remuneration in accordance with the recommendations of the Joint Negotiating Commit tee for Public Analysts.
Applications should be sent to the Clerk of the Hereford· shire County Council, Shirehal1, H ereford, by january 31st, 1961.
A~nJ~~~~~~~~T!~:Si~~::d r:~~~~i~!t~ FR~~~~~ Scientist for the Research Team of its English Cannery. The salary will be over £2000 and there are valuabh~ other benefits such as non-contributory pension scheme and free life assurance.
Candidates should be under 30 years old and should be specialists in one of the experimental sciences. While knowledge of the food industry is not essential, some ability in chemistry or biology will be an advantage.
Write giving full de tails of educa tion and experience to Box No. 4H2:~, The Analyst, 4i, Gresham StrN't, London, E.C. 2.

xvi THE ANALYST [January, 1961
A
MATERIALS RESEARCH ESTABLISHMENT
situated in NORTHANTS
requires an
ANALYST with some experience, for work on general inorganic analysis. Appli
cants should preferably possess a degree or G.R.I.C., and some knowledge of organic chemistry would be
an advantage.
Please send full details to Box 4024, The Analyst, 47, Gresham Street, London, E.C.2.
,-·----·-
"Shell" Research Limited require a
Senior Technician for the
Chemistry Division
at their Tunstall Laboratory, near Sittingbourm~, Kent.
The work of the Chemistry Division is extremely diverse and includes the formulation of chemicals for biological tests, the design and operation of inhalation chambers, and the development of microanalytical techniques for the determination of biologically active compounds in tissues and body fluids. The laboratory has an extensive programme and there are wide opportunities for development in all these fields.
Applications arc invited from candidates with Higher National Certificate in Chemistry, or equivalent, and some 10-10 years' laboratory experience.
Salaty will be based entirely on qualifications and experience. There is an attractive P('nsion Scheme together with other staff benefits.
Please apply by letter, tlviDt full details to:PERSONNEL RECRUITMENTJT.C.,
"SHELL" RESEARCH LIMITED, ST. HELEN'S COURT,
LONDON, E.C.3.
STAFFORDSHIRE COUNTY COUNCIL HEALTH DEPARTMENT
APPOINTMENT OF ASSISTANT ANALYST Applications arc invited for the above-mentioned appoint
ment in the County Chemical Laboratory, Stafford, from candidates having a University Degree and/or the Associate· ship of the Royal Institute of Chemistry. Previous <·xpcriencc in a Public Analyst's Laboratory will be an ad vantage. The appointment will be subject to the appropriate Superannuation Acts and R<!gulations, and the successful candidate must pass a medical examination and submit his/her birth c<.•rtificat<•.
The salary will he in accordance with A.P.T. IV of thcj.N.C. scah,g (£1140 X £oo (2) X £6ft- £!310).
Assistance is given towards removal expenses and tht.·n• is a lodging aJiowanc<.~ where a married man cannot transf<.·r his home immediately.
Applications, giving ag<.~, qualifications and cxpcri('nct·, accompanied by copies of two recent te-stimonials, and stating whether or not the applicant is relatt.od to any memb('r or senior official of the County Council, should be forwardt-d to the County Medical Officer of Health, County Buildings, Stafford, by not later than january 30th, 1961.
County Buildings, Stafford.
T. H. EVANS, Clerk to tile County Council.
----- -------·----------------------CHEMIST REQUIRED
Applications arc invit<.'<l to fill vacancy of works analyst in a factory in Northern Ireland. Successful applicant will be interested in all facets of works and analytical control and particularly quality control. He! will be a capable leader havin~ held a position of responsibility in the analytical field for a numb<>r of years. A degree in chemistry or the C'<)Uivalent is rc~quirc'<l. Age up to:~:; yf'ars.
This is a progressive position. There is a contributory pc:msion schetn£' and assistance with housing if rcquin'fl.
Apply to Nox No. 4022, The Analyst, 47, Gr(>sham StrC'ct Lonrlon, E.C.2.
------------- -··---
CHEMICAL ENI;tNEERS and
INDUSTRIAL CHEMISTS Applications are invitt.'<l for vacancies in a large: ch(.'rnical
factory in Northern Ireland. Successful applicants will have at least 5 years industrial experience either in research and devdopmcnt or production clc~partmcnts and a good knowledge of unit prOC<$SCS, production control combined with lt!adership. Preferable age 2!;-!U) years.
The positions arc! progrt>ssivc! and there is a contributory pension scheme.
Please write in confidence! stating agt~ and experience· to Box No. 4H21, The Analyst, 47, (ircsham Street, London, E.C.2.
THE BRITISH CERAMIC RESEARCH ASSOCIATION A graduate or A. R.I. C. required for post of Scientific
Officer for the Analytical D<.~partment. Work wi11 combine research into analytical methods, routine and non-routine analysis of ceramic mat<'rials. Some experience of this work would be an advantage, but candidates with experience in other fields of analysis would b<.~ considered. The post is pensionable under F.S.S.U.
All applications should be addressed to the Director of Research, The British Ceramic Rt.-scarch Association, Qu<'cns Road, Penkhull, Stokc~on-Tr~nt.
AA~!~:~~ ~:a~~~~t i~f':'t'~:~~/~;;:;~~~~ i~ ~~~ manufacture of fine organic chemicals. Good academic qualifications anrl experience arc essential. The salary offered will reflect to the special responsibilities involved. The factory is situated in the North West and applicants will initially be interviewed in London. Apply Box 4025, The Analyst, 47 (j,n'Sham Street, London, E.C.2.
January, 1961 J THE ANALYST
ANALYSTS
The Standards Department is responsible for quality control of the Company's Pharmaceutical, Fine Chemical and Horticultural products aud Toilet Preparations. Vacancies exist with this department for men with honours degrees and/or membership of the Royal Institute of Chemistry, preferably with some experience in analytical work.
The vacancies are in:-
(a) THE PHYSICAL ASSAY DIVISION, which is concerned both with quality control work and the development and application of industrial methods of analysis including ultra-violet and infra-red spectrophotometry, emission spectrography and gas chromatography.
(b) THE CHEMICAL CONTROL DIVISION, which is concerned with the analysis of a wide range of raw materials, fine chemicals and sterile medical products.
(c) THE ANALYTICAL DEVELOPMENT GROUP, where research is carried out on the development and adaptation of new analytical methods.
In addition, a vacancy exists within our Fine Chemical Department for an analytical Chemist, particularly concerned with the analysis of intermediate stages of chemical manufacture.
Applications giving full details of qualifications and career to date, should be addressed to the Personnel Manager, Boots Pure Drug Co., Ltd., Station Street, Nottingham, quoting reference No. T.A.I.
xvii
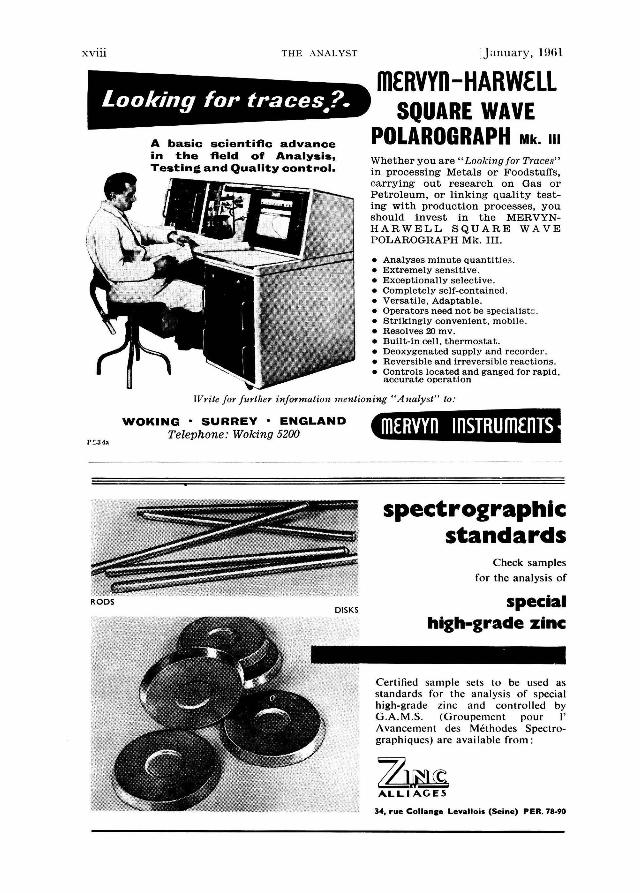
XVlll
P~34a
RODS
THE ,\NALY ST
A basic scientific advance in the field of Analysis, Testing and Quality control.
[Jan nary, l Hfi l
ffiE:RVYn-HARWEll SQUARE WAVE
POLAROGRAPH Mk. m Whether you are "Looking [or Traces' ' in processing Metals or Foodstuffs, carrying out research on Gas or Petroleum, or linking quality testing with production processes, you should invest in the MERVYNHARWELL SQUARE WAVE POLAROGRAPH Mk. III.
• Analyses minute quanti tie~ .
• Extremely sensitive. • Exceptionally selective. • Completely self-contained. • Versatile. Adaptable. • Operators need not be specialist~ .
• Strikingly convenient. mobile . • Resolves 20 mv. • Built-In cell, thermostat. • Deoxygenated supply and recorder. • Reversible and Irreversible reactions. • Controls located and ganged for rapid.
accurate operation
IV1·ite for further information mentioning "Analyst" to :
WOKING • SURREY • ENGLAND Telephone: Waking 5200
DISKS
ffiERVYn InSTRUmEnTS
spectrographic standards
Check samples
for the analysis of
special high-grade zinc
Certified sample sets to be used as standards for the analysis of special high-grade zinc and controlled by G .A.M .S. (Groupement pour I' Avancement des Methodes Spectrographiques) are available from:
~~cc ALL I AGES
34, rue Collance Levallois (Seine) PER. 78-90
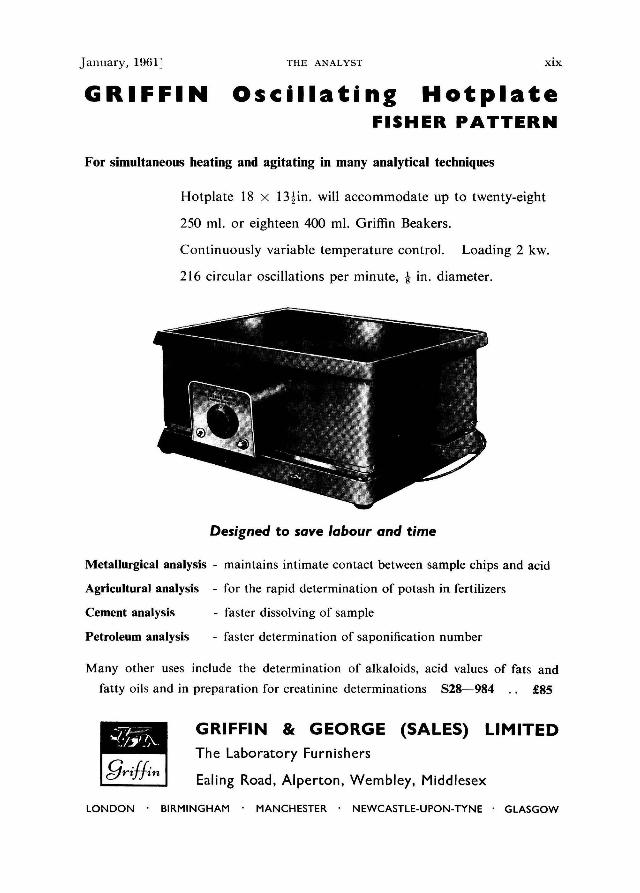
J anuary, 1961 ~ THE ANALYST xix
GRIFFIN Oscillating Hotplate FISHER PATTERN
For simultaneous heating and agitating in many analytical techniques
Hotplate 18 x 13 ~ in. will accommodate up to twenty-eight
250 ml. or eighteen 400 ml. Griffin Beakers.
Continuously variable temperature control. Loading 2 kw.
216 circular oscillations per minute, c~ in. diameter.
Designed to save labour and time
Metallurgical analysis - maintains intimate contact between sample chips and acid
Agricultural analysis - for the rapid determination of potash in fertilizers
Cement analysis - faster dissolving of sample
Petroleum analysis - faster determination of saponification number
Many other uses include the determination of alkaloids, acid values of fats and
fatty oils and in preparation for creatinine determinations 828-984 . . £85
GRIFFIN & GEORGE (SALES) LIMITED The Laboratory Furnishers
Ealing Road, Alperton, Wembley, Middlesex
LONDON • BIRMINGHAM · MANCHESTER · NEWCASTLE-UPON-TYNE · GLASGOW

XX THE .\:\.\LYST 1J anuary, l H61
1 SECOND IN 6 YEARS corresponds to a Standard Deviation
of 1 micro gramme on a 200g balance. Such is the remarkable accuracy
attained on a Stanton High Precision balance. That's why
Reg d.
the laboratories in 5 continents, charged with maintaining the
world standards of mass, turn to Stanton for their precision
balances and weights.
That is why the
~jt.;.1~il•1~1
THERMO RECORDING BALANCE has achieved its success The THERMO-BALANCE automatically records weight, time and temperature changes. Air-damped, suitable for total load of 50g; may be supplied with sensitivity of lmg or 1/lOmg. Standard furnace (illustrated) suitable for l000°C, but alternative furnaces for both high and low temperatures can be made. Once set, the Thermo-Balance will reproduce and record weight changes, time and temperature for periods up to several days.
FULLY DESCRIPTIVE LEAFLET AVAILABLE
STANTON Thermo-recording Balances
Trade Mark
STANTON INSTRUMENTS LTD· 119 OXFORD STREET· LONDON W.l
Telephone: Gerrard 7633 • Cables: Stanbal London

January, l!Hil ] THE ANALYST XXI
ANALYSIS
INFRACORD Model t37
Spectrophotometer
Vct·:-mti lc, ca:-ty tu u:-te
Only thr(~e contrub
M antw I ::sc tti11~ 1..> f clruJu
No l'U 11-h:wk tilue
Wavel c n:-;-th ran;..: c: 2.f"> - lf">P
<Also available fur 12. f>-2G,Ul
Rcpr(Jclu.cihility: O.Oltl
Doublc -bean1, n:-tph c ricn. l op t in~
Fully autu1untic operation
Full rnng-e uf acec:-tsori1·~
Size: 27!" X 17' X 8c\"
(70X4:JX22cm)
Macl(J iu Great Britain
Bcacon::stield, Buek:-:, "Englnud
Perkin-Elmer's Infracord Spectrophotometer is precisely the kind of instrument needed for analytical work. It is robust, reliable, and accurate; quick and simple to operate. It takes up little space, and its price is reasonable.
The Infracord Spectrophotometer is rapidly becoming part of the standard equipment of every up-to-date laboratory-over a hundred are in use in the U.K. alone (the world total exceeds a thousand). We should like to send yon, too, full details of this interesting instrument.
Perkin-El~ner
Telep h o n e B•·"'"'u~tie!<l2020 A N A L y T I C A L INSTRUMENTS
xxii THE A!'<AI.YST [.J anu :try, I !lUI
PETRI DISHES eliminate time-wasting washing, sterilizing
The Oxoid Disposable Petri Dish is ready for instant use and can afterwards be discarded. Made of clear, moulded polystyrene, it is sterile and biologically inert as well as light in weight and virtually unbreakable.
Because of its low cost and the elimination of washing and sterilizing, Oxoid Disposable Petri Dishes offer considerable economy in use. The dishes are
FOR PROGRESSIVE LABORATORIES
supplied in cartons of 200 or 500. Fun details, prices and quantity rates will gladly be sent on application.
NEW Oxoid Disposable Plastic Precipitin • Tubes are now available-made [rom •
• crystal-clear polystyrene, they are chemi- • cally clean and ready f or immediate use. •
• Further details supplied on request
.............................
BACTERIOLOGICAL SERVICES
Made for the Oxoid Division of Oxo Ltd. Thames House, Queen Street Place, Lo!l!lcn E.C.4. Telephone: CENtral9781

January, 1961] THE ANALYST
Mt. MAKALU--one ot the objectives ol the 1961 Himalayan
Mountaineering and Scientific ExpeditionLeader Sir Edmund Hillary--
who are using a special portable model
xxiii
of the LOUGHBOROUGH WATER DEIONISER to assist their physiologica l experiments.
POB. HIGH PUB.ITY WATEB. by
DISTILLATION or DEIONISATIOJf Consult:
LOUGHBOB.OUGH GLASS COMPANY Ltd. ,
LOUGHBOB.OUGH, LEICESTEB.SHIB.E, ENGLAND
f. • l"' '' ''"'l"""'" '" I ' " ' " '" 1.-"h.,m•~- •• (f •po r1 ) 1.M , r toon fin~- or; "" " ""' ,,. s .. .,.,, l.•>tocl<m . w I.
U1 /3

xxiv THE ANALYST
• Dlicro Hammer Mill
for rapid
analytieal grinding
[January, 1961
This compact mill will pulverise samples of a few grammes with prac tically complete recovery for analytical work. Only 30 to 120 seconds required for disintegration of majority of substances. Crushes stone, coke, bone, chemicals, fertilizers, wood, grain, wool, cotton, roots, hay, straw, etc. Stainless steel grinding mechanism. Variable speed motor for better grinding control. Quickly interchangeable slide-in screens for accurate particle size adjustment. Dust-proof closure. Mill swings wide open with a mere turn of a thumb-nut allowing thorough cleaning. Maximum charge is 120 cc.
Also available:
Micro Mixer Mill-:"fo r.,.very rapid ultra-fine grinding, mixing, and homogenizing of samples under I gramme, for analytical chemistry. spectroscopy. X-ray diffraction, etc. Larger Mixer Mill with
s imilar applications for sa mples up to 25 cc. Analytical Micro Pulverizer with cooling jacket. Small laboratory sample mill for £9 18s. Od. Other small scale laboratory mills.
GLENcRESTON LTD. The Redhouse, 37 Broadway, Stanmore, Middlesex. Telephone: Grimsdyke 4218
the new, cheap routine Spectrophotometer
Very simple and quick operation Direct reading High accuracy Many complementary accessories to be supplied separately make this apparatus universal DETAILED DESCRIPTION SENT ON REQUEST
Exporter M E T R I M P E X Hungarian Trading Company for Instruments Letters: Budapest 62. POB 202. Hungary Telegrams : INSTRUMENT BUDAPEST
Representatives: .METRI.MP.EX c. R. BRA YBROOKE & co. LTD. DASHWOOD HOUSE,
69, OLD BROAD ST., LONDON, E.C.2

January, 1 !)61 ] THE ANALYST XXV
IF YOU COMPARE VALUES YOU WILL CHOOSE A PYE pH METER I
for
pH
Convenience in operation; precision ; reliability; a wide choice of laboratory meters, electrodes and accessories-these factors and many more combine to make Pye pH meters the most widely used in Britain today.
DYNACAP pH METER & MILLIVOLTMETER Cat. No. II 072
Exceptional stabi lity , linearity and accuracy are due to use of dynamic capacitor. Seven extended ranges give eq uivalent sca le length of 35"' and discrimination to at least 0.01 pH o r I mY. Temperature compensation, fully automatic and manual, provided on all ranges. Sufllcient output to feed external devices totallin g I 0000!.1.
Cat. No. 11067
Cat. No. 11602
AUTOTITRATOR-CONTROLLER UNIVERSAL pH METER & MILLIVOLTMETER
A precision instrument, incorpo ra ting two independent d ifference amplifiers, which rapidly pays for itself as a speedy routine titrator, or as a controller in pH or conductivity pilot-scale processes.
The standard pH meter in thousands of laboratories a ll over the world, this instrument is renowned for its stability, accuracy and reliability.
and Conductivity CONDUCTANCE BRIDGE A precision instrument for general laboratory work, including analytical and quality control determinations. 0.1 micromho to 10 mhos is covered in four switched ranges with automatic frequency adjustment. Null point indication by cathode ray oscilloscope is fool-proof and speedy. Accuracy 0.2%-
~
SCIENTIFIC~~ rgiNSTRUMENTS
W. G. PYE & CO. LIMITED GRANTA WORKS, P.O. BOX 60, CAMBRIDGE, ENGLAND
Telephone: Cambridge 58866 (5 lines). Telegrams: Pye, Cambridae

xxvi THE ANALYST rJanuary, 1961
KETALS and ACETALS I I I
Eastman list a group of Ketals and Acetals amongst their 3,800 organic research chemicals.
Here are a few:
831 CHLOROACETALDEHYDE DIETHYLACET AL
748 DIETHOXYMETHANE
472 1,1-DIMETHOXYETHANE
525 DIMETHOXYMETHANE
7846 2,2-DIMETHOXYPROPANE
5030 1 ,3,3-TRIMETHOXYPROPENE
These and other chemic:J.!s v:J.luable to the research worker are ob:ainab!e from :
Kodak Simonswood 2977
LIMITED, KIRKBY LIVERPOOL
ANALOID REAGENTS
FOR
METALLURGICAL ANALYSIS
A range of compressed chemicals specially prepared for the Analoid System of Analysis .
Price -List No. 399 detailing all Analoids and their principal uses available on request from
RIDSDALE & CO. LTD. NEWHAM HALL, MIDDLESBROUGH
NEW
SPECTROGRAPHIC STANDARDS Samples Nos. 41 - 46
NODULAR CAST IRONS Containing increments of
MAGNESIUM & NICKEL
Full details given in our List No. 400R available on request from:
BUREAU OF ANALYSED SAMPLES LTD NEWHAM HALL, MIDDLESBROUGH
YDII t:AN DEPEND ON IN PH READINGS
Johnson Universal and Comparator Test papers are universally accepted for their accuracy. Universal Test Papers will give the pH value of any solution to within 0.5 pH in the range of I to 10. Comparator Test Papers give even greater accuracy. They indicate values from 3.6 to 10 pH in steps of 0.3 pH. Comparator Paper No. 1035 determines pH values from 1.0 to 3.5 in steps of 0.5 pH. Johnsons also supply LITMUS paper and an extensive range of other Indicator papers for specific uses in Science and Industry.
JOHNSON
INIJICATDR PAPERS Write for Leaflet
~OHNSONS OF HENDON, LIMITED, LONDON, N.W.4
BINDING Have your back numbers
of The Analyst bound in
the standard binding case
Send the parts together
with a remittance for 14/6
to:
W. Hefler & Sons Ltd Hills Road Cambridge
THE ANALYST
I TYP;: AI65:J
MANUAL POLAROGRAPH An economically priced first step in Polarography.
Fast and accurate, reproducible plotting comparable in speed with recording types, but free from superimposed oscillations.
Compensation for effects due to large interfering
reductions and cell capacity. Click-stop voltage change
in multiples of IOmV. Complete with stand, and galvo
if required. Demonstrations daily at Camberley.
BDU!fi~ SOUTHERN ANALYTICAL LIMITED Camberley, Surrey, England.
Telephone: Camberley 340/.
B.D.ll. Laboratory Cl1en1icals in education, research & production In innumerable laboratory applications B.D.H. reagents play a vital part in healing, teaching, research and every productive activity from agriculture to atomic energy. Analytical reagents manufactured by B.D.H. to the published "AnalaR" specifications have an international reputation as materials for use in analytical work of the most respons ible character; and over a thousand other B.D.H. laboratory products arc labelled with specifications of minimum purity.
Recent B.D. H. booklets. iss t1cd free, include Titration in I"on-Aqueous Solnnts, Biologkal St:tins and Stainin~ Melhods,
'l1nion Carbide' Molecular Sien·s, ion Exchange Resins, Sugar PhOSJ)hales and ~ebted Suhstan<.'es. We shall be h:q1py to s1.:nd yt) U c.:opic..,.
@ THE BRITISH DRUG HOUSES LTD.
B.D.H. Laboratory Chnmicals Division. Poole . Dor~et
xxvii