Alternative Investment Analyst Review - CAIA Association
67
Alternative Investment Analyst Review Editor's Letter: Recency Bias and The Death of Value Aaron Filbeck, CAIA, CAIA Association Artificial Intelligence Frank Benham, CAIA, Roberto Obregon, CAIA, Timur Kaya Yontar, Meketa Group Outcome-Oriented Alternative Investments Masao Matsuda, CAIA, Cross Gates Investment and Risk Management Pension Fund ALM with Longevity Hedging: Can Pension Funds Stabilize Funding Levels and Improve Long-Term Return by Hedging Longevity Risk? David Schrager, Longitude Solutions Tokenizing Real Assets Jeroen van Orele, Robeco Factor Investment in the China A-Share Market: Revelations from a Contextual Alpha Model Rohit Shrivastava, Jaime Lee, George D. Mussalli, PanAgora What, Exactly, Is a Factor? Melissa R. Brown, Dieter Vandenbussche, Esther Mezey, Ipek Onat, Axioma Direct Investments Paul R. Kenny, Jr., NEPC The CAIA Endowment Investable Index Hossein Kazemi, CAIA Association, and Kathryn Wilkens, CAIA, Pearl Quest The List: Alternative Indices CAIA Association Chartered Alternative Investment Analyst Association ® Q3 2019, Volume 8, Issue 3
-
Upload
khangminh22 -
Category
Documents
-
view
3 -
download
0
Transcript of Alternative Investment Analyst Review - CAIA Association

Alternative Investment Analyst Review
Editor's Letter: Recency Bias and The Death of Value Aaron Filbeck, CAIA, CAIA AssociationArtificial Intelligence Frank Benham, CAIA, Roberto Obregon, CAIA, Timur Kaya Yontar, Meketa GroupOutcome-Oriented Alternative Investments Masao Matsuda, CAIA, Cross Gates Investment and Risk ManagementPension Fund ALM with Longevity Hedging: Can Pension Funds Stabilize Funding Levels and Improve Long-Term Return by Hedging Longevity Risk? David Schrager, Longitude SolutionsTokenizing Real Assets Jeroen van Orele, RobecoFactor Investment in the China A-Share Market: Revelations from a Contextual Alpha Model Rohit Shrivastava, Jaime Lee, George D. Mussalli, PanAgoraWhat, Exactly, Is a Factor? Melissa R. Brown, Dieter Vandenbussche, Esther Mezey, Ipek Onat, AxiomaDirect Investments Paul R. Kenny, Jr., NEPCThe CAIA Endowment Investable Index Hossein Kazemi, CAIA Association, and Kathryn Wilkens, CAIA, Pearl QuestThe List: Alternative Indices CAIA Association
Chartered Alternative Investment Analyst Association®Q3 2019, Volume 8, Issue 3

Call for ArticlesArticle submissions for future issues of Alternative Investment Analyst Review (AIAR) are always welcome. Articles should cover a topic of interest to CAIA members and should be single-spaced. Additional information on submissions can be found at the end of this issue. Please e-mail your submission or any questions to: [email protected] pieces will be featured in future issues of AIAR, archived on CAIA.org, and promoted throughout the CAIA community.
Alternative Investment Analyst ReviewQuarter 3 • 2019

Quarter 3 • 2019 Editor's Letter
1
Editor’s LetterThe Death of Value and Recency Bias – What's Your Time Horizon?Have you heard the news? The value factor is apparently dead!
As most of us know, buying cheap and selling expensive stocks, or “buying low and selling high,” has been a well-documented strategy for many investors. This belief is supported by empirical evidence, which displays the tendency for relatively cheap stocks to outperform relatively expensive stocks. Academics and practitioners measure the relatively “cheapness” of a stock by comparing the relationship between a stock price and fundamental inputs of the underlying company. This style of investing was pursued by famous investors such as Benjamin Graham, and is still pursued by many investors today.
A more systematic approach to this investment strategy, otherwise known as the value factor, was first made popular by Eugene Fama and Kenneth French1 when they discovered that simply buying high book-to-market stocks and shorting low book-to-market stocks created a unique premium uncorrelated to other market factors. Additionally, the long side of this portfolio actually helped them explain the risk and return characteristics of many actively managed mutual fund strategies.
Since Fama and French’s seminal paper, other measures of the value factor have been tested in academic literature and practice, including measures such as a company’s price-to-earnings ratio (P/E), price-to-free-cash flow ratio (P/CF), and dividend yield (D/P). As factor investment strategies became a more prominent tool in practitioner portfolios, these different value measures may be combined or even independently applied to different sectors (e.g., price-to-book may be best applied to bank stocks, while it may not be the best measure for technology stocks).
Despite longstanding support of the value factor from empirical studies, value stocks have struggled relative to growth stocks in recent years. Recency bias has caused some to claim that value investing is dead because of this recent underperformance. But is the value factor really dead, or has it just not worked recently? The answer really depends on 1) how far back one is willing to look and 2) how one actually measures value.
Exhibit 1 shows the four measures of value previously mentioned, each of which is measured as equally weighted portfolios of the most attractive 30% of stocks for the following factors: “Earnings Yield,” “Book Value,” “Cash Flow,” and “Dividend Yield.” In other words, “Earnings Yield” is an equally weighted portfolio of the cheapest 30% of stocks, as measured by their P/E ratios, “Book Value” is an equally weighted portfolio of the cheapest 30% of stocks, as measured by their P/B ratios, and so on.
From January 1, 2009 to June 30, 2019, $1 invested in each of these portfolios would have resulted in a portfolio value of $4.38, $4.50, $4.17, and $4.54, respectively. By comparison, the broader market, measured by the Center for Research in Security Prices (CRSP) Total Market, would have resulted in a portfolio value of $4.16 over that same period of time. Notice all four of these measures of value outperformed the broader market over this time period.
Exhibit 1
0.00
1.00
2.00
3.00
4.00
5.00
6.00
2009
01
2009
04
2009
07
2009
10
2010
01
2010
04
2010
07
2010
10
2011
01
2011
04
2011
07
2011
10
2012
01
2012
04
2012
07
2012
10
2013
01
2013
04
2013
07
2013
10
2014
01
2014
04
2014
07
2014
10
2015
01
2015
04
2015
07
2015
10
2016
01
2016
04
2016
07
2016
10
2017
01
2017
04
2017
07
2017
10
2018
01
2018
04
2018
07
2018
10
2019
01
2019
04
VALUE MEASURES 2009 - 2019
Earnings Yield Book Value Cash Flow Dividend Yield Market

2Editor’s Letter
Now, let’s subject ourselves to some recency bias. Exhibit 2 shows the performance of the same value factors through June 30, 2019, but with a starting point of January 1, 2014. In this scenario, $1 invested would have resulted in a portfolio value of $1.50, $1.29, $1.44, and $1.78, respectively. The broader market over this time period would have resulted in $1.74. Only one value factor, high dividend yields, outperformed the broader market. The rest lagging significantly – the worst of which was Book Value, Fama and French’s original value measure.
Exhibit 2
Is value really dead then? Maybe for the time being. The last five years have been tough for value investors, and even more recent performance has exacerbated the gap between cheap and expensive stocks.
Why are these two examples important?
First, investment styles are cyclical, meaning they go in and out of favor over time. Keep in mind, factors are measures of risk premium, meaning it rewards those who hold it through the bad times and/or periods of underperformance.2 It can be tempting to abandon ship when a style is underperforming, but that’s exactly why it works! It’s supposed to be painful – an investor in any particular factor would do well to remember this cyclicality, however.
Second, it’s easy to get caught up in short-term performance, but broadening your time horizon and understanding one’s exposures can help create a sense of patience when things aren’t working. Sometimes, a successful investment strategy can take years to pay off and selling at the wrong moment can cause one to miss it. The value factor performed very poorly in the 1990s during the Technology Bubble, but those who stuck by it were eventually rewarded.
Third, style diversification is just as important as asset class diversification, for the same reasons. Factors, just like asset classes, don’t always work, so having exposure to multiple empirically supported factors (e.g., value, momentum, size) can help smooth out the ride over market cycles, while still providing wanted exposures.
Endnotes1. Fama, Eugene F.; French, Kenneth R. (1992). "The Cross-Section of Expected Stock Returns," The Journal of Finance. 47 (2): 427–465.
2. Ang, Andrew, Factor Investing (June 10, 2013). Columbia Business School Research Paper No. 13-42. Available at SSRN: https://ssrn.com/abstract=2277397 or http://dx.doi.org/10.2139/ssrn.2277397
0.00
0.20
0.40
0.60
0.80
1.00
1.20
1.40
1.60
1.80
2.00
VALUES MEASURES 2014-2019
Earnings Yield Book Value Cash Flow Dividend Yield Market

Quarter 3 • 2019 Editor's Letter
3
Author BioAaron Filbeck, CAIA, CFA, CIPM CAIA Association
Aaron Filbeck is the Associate Director of Financial Research at CAIA Association. In his role, Aaron is involved with the development of the CAIA program's curriculum, supports the Association’s academic partnership program, and serves as Content Director and Assistant Editor
of Alternative Investment Analyst Review, a practitioner focused journal published by the Association. Prior to his role at CAIA, Aaron was a portfolio manager for a registered investment adviser where he oversaw portfolio construction and manager research efforts for high net worth individuals. Aaron holds the Chartered Financial Analyst (CFA), Chartered Alternative Investment Analyst (CAIA), and Certificate in Performance Measurement (CIPM) designations. He is a member of the CFA Institute and Vice President of CFA Society Columbus.

Table of Contents
Table of ContentsQuarter 3 • 2019
5
Artificial Intelligence . . . . . . . . . . . . . . . . . . . . . . . . . . . . . . . . . . . . . . . . . . . . . . . . . . . . . . . . . . . .7 Frank Benham, CAIA, Roberto Obregon, CAIA, Timur Kaya Yontar Mekteta GroupIn this paper, the authors discuss some of the public misconceptions around artificial intelligence (A.I) and provide suggestions to investment practitioners for incorporating A.I. into their investment strategies. Topics include an introduction to and the basics of A.I., how A.I. impacts the manager selection process, and how investors can incorporate A.I. into their portfolios.
Outcome-Oriented Alternative Investments . . . . . . . . . . . . . . . . . . . . . . . . . . . . . . . . . . . . . . .16 Masao Matsuda, CAIA Cross Gates Investment and Risk Management Outcome-orientation signals a major shift from the traditional strategic asset allocation approach to more flexible and diverse approaches tailored to meet investors’ needs. Often being asset class agnostic and risk-driven, alternative investments are naturally well suited to outcome-oriented investments. In this paper, the author identifies four types of outcomes and classifies various alternative strategies into these relevant types of outcomes. This paper also discusses risk management considerations that can improve the probability of attaining certain investment outcomes.
Pension Fund ALM with Longevity Hedging Can Longevity Hedging Help Pension Funds Improve Their Asset Liability Management . . . . . . . . . . . . . . . . 23 David Schrager Longitude SolutionsIn this paper, the author analyzes how hedging longevity risk can impact a pension fund’s funding ratio volatility and asset-liability management strategy. The author introduces how they jointly model longevity and investment risks in a stochastic framework and formulates the ALM problem of a pension fund in the context of this framework. He then discusses the impact of hedging longevity risk on the pension fund’s funding level volatility and provides an outlook for future research.
Tokenizing Real Assets . . . . . . . . . . . . . . . . . . . . . . . . . . . . . . . . . . . . . . . . . . . . . . . . . . . . . . . . . 30 Jeroen van Orele RobecoThe tokenization of real assets offers a next step in electronic trading. It expands the investible opportunity set by adding real assets – such as real estate or art – to a list of traded asset classes. However, before tokenization can be implemented, a few hurdles need to be cleared, such as regulation, protection of ownership rights, and the taxation of tokens. The author specifically explores how tokenization and blockchain technology will create liquid markets in traditionally illiquid real assets, such as real estate and intangible assets. Additionally, the author explores the challenges to tokenization.
CONTACT USU.S. +1 413 253 7373Hong Kong +852 3655 0568Singapore +65 6536 424190Geneva +41 (0)22 347 45 India +91 90043 23075E-mail [email protected]
CAIA.org
AIAR STAFFHossein Kazemi Keith Black, CAIA Editors
Aaron Filbeck, CAIA Content Director and Assistant Editor
Melissa Ricardi Creative and Design
Nancy Perry Publication Coordinator
FOLLOW US

Table of Contents
6Table of Contents
Factor Investment in the China A-Share Market: Revelations from a Contextual Alpha Model . . . . . . . . . . . . . . . . . . . .36 Rohit Shrivastava, Jaime Lee, George D. Mussalli PanAgoraDue to its unique nature, unpredictable investment landscape and burdensome regulatory requirements, equity investment in the China A-share market has proven to be difficult to navigate. For quantitative investors who prefer to invest in a diversified, liquid investment strategy and need easy access to market data and information, building a strategy for China A-shares has been a formidable task. The authors of this paper seek to simplify this perception by displaying the relationship between publicly-available fundamental data and its impact on future returns.
What, Exactly, Is a Factor? . . . . . . . . . . . . . . . . . . . . . . . . . . . . . . . . . . . . . . . . . . . . . . . . . . . . . . . . . . . . . . . . . . . . . . . . . . . . . . 46 Melissa R. Brown, Dieter Vandenbussche, Esther Mezey, Ipek Onat AxiomaAs of June 2018, $1.9 trillion was invested in factor-based strategies – a figure expected to grow to $3.4 trillion in 2022. The authors explore the definition of a “factor”, how factor performance can differ depending on its underlying definition and practical application, and argue that a standard “off-the-shelf” factor portfolio may not necessarily provide the exposure expected by the investor.
Direct Investments . . . . . . . . . . . . . . . . . . . . . . . . . . . . . . . . . . . . . . . . . . . . . . . . . . . . . . . . . . . . . . . . . . . . . . . . . . . . . . . . . . . . . 54 Paul R. Kenney, Jr. NEPCHigh-net-worth clients are increasingly looking to direct investments, a strategy gaining popularity with institutional investors. Direct investments appeal to wealthy individuals and family offices because they not only eliminate the management fees charged by investment firms, but also because the investments can align more closely with the values and mindset of the investor. In this paper, the author explores the trends in direct investing and the motivations for private wealth clients, as well as the performance of direct investments relative to public markets and private fund structures.
The CAIA Endowment Investable Index . . . . . . . . . . . . . . . . . . . . . . . . . . . . . . . . . . . . . . . . . . . . . . . . . . . . . . . . . . . . . . . . . . .60 Hossein Kazemi, CAIA Association Kathryn Wilkens, CAIA, PearlQuest
The List: Alternative Indices . . . . . . . . . . . . . . . . . . . . . . . . . . . . . . . . . . . . . . . . . . . . . . . . . . . . . . . . . . . . . . . . . . . . . . . . . . . . . .62 The CAIA Association

Artificial IntelligenceFrank Benham, CAIA Meketa Investment Group
Roberto Obregon, CAIA Meketa Investment Group
Timur Kaya Yontar Meketa Investment Group
Artificial IntelligenceQuarter 3 • 2019
7
What A.I. is and What it is NotWhat A.I. Is NotIn popular media, A.I. is sometimes portrayed as a seemingly ‘all-knowing’ machine with super-human powers that is continually self-upgrading. This idea is called the technological singularity. In truth, not only is this not representative of A.I. today, but such an outcome is nowhere in sight. Worrying about the technological singularity (while entertaining) is about as productive as concerning oneself with the fact that in billions of years the Sun will engulf the Earth.
Successful A.I. – A Combination of ToolsA.I. as it exists today can still be exciting, but it can also sometimes be quite mundane. This is true because any successful A.I. implementation will comprise a set of solutions and tools that combine complexity and elegance with rote task automation. Those seeking to incorporate A.I. solutions are faced with a significant problem-since many different components exist but not all may be a truly valuable addition on a standalone basis.
To illustrate the point above, consider an application in one subset of Artificial Intelligence called Machine Learning. Machine Learning is a generic term for an algorithm that allows a computer to “learn.” While that may sound fancy, the strict definition could be satisfied quite simply. For example, arguably the most canonical model in finance is the Capital Asset Pricing Model (CAPM), which uses linear regression to estimate the sensitivity of an asset’s price to changes in the price of the broader market. Linear regression is a traditional statistical modelling technique, but if new

8Artificial Intelligence
market information (e.g., returns) were added to that model each day and the regression re-run in an automated way, then that traditional technique could be considered a machine learning approach. While obviously not a large value-add, it does meet the strict definition.
The takeaway is that artificial intelligence is a field of study with a wide spectrum of tools. A successful implementation of A.I. will use several components from that spectrum together. Classification of these components will fall into three general pillars (categories) shown in Exhibit 1 below, and in some cases will fall into multiple pillars at once:
1. Data Generation – Any informed decision requires high quality data. This pillar supports getting quality-checked data into a pipeline. The process can also include generating new data; the two most common examples would be (i) data from text1 and (ii) generation of ‘hidden’ layers or ‘states.2, 3
2. Measurement – After data has been collected, some type of measurement process will take place. This pillar helps quantify how much any change or expected change will affect the world around us. While the focus is on making this quantifiable, it is important to point out that these insights can also be what may traditionally be thought of as qualitative in nature.
3. Decision Making – While possessing vast quantities of data and measurements is important, perhaps the most valuable impact of A.I. is the ability to make informed decisions from that information. A.I. brings the ability to simultaneously “think” about many more aspects of an investment problem than would be possible to do so in a timely fashion otherwise. Working in tandem with human insight and interpretation, the simple value-add of A.I. is the ability to take more information into account with a more holistic perspective. As a result, a successful implementation of A.I. leads to more informed decision-making.
What Are A.I. Tools?The tools used in a successful implementation of A.I. can range across each of the pillars in Exhibit 2 as well as across levels of complexity from traditional techniques to the most recent advancements. Later in this paper we will discuss some of the most widely-adopted and exciting success stories in A.I.
When thinking about applying A.I., specifically in an investment process, a higher bar must be set. In contrast to playing games, recognizing images, or suggesting ads, when it comes to using A.I. in the investment process, interpretability plays an important role. That is, investors will need to understand the ‘why’ in the process, rather than just accepting a black-box outcome.4 Even if an A.I. algorithm resulted in a successful investment process most of the time, it is simply unacceptable to lose money with the
Exhibit 1
Exhibit 2
Technique What Is It? Is It Interpretable?Reinforcement Learning
Essentially a reward is given each time the computer "wins"
Probably Not - While the computer understands what worked in the past, it doesn't necessarily understand why
Generative Adversarial Networks The computer plays against itself No - Works well for two-player games but not for market-based systems
Genetic Algorithms Extended optimization No - While good at finding extended optimal trade-offs it can't understand "why" more of X is better than Y
Ensemble Learning Running many models comparing hypotheses
Maybe - While good at comparing different theories it often suggests multiple models and chooses the best general model which can lead to being very wrong in the non-general cases
State Space Models and Neural Networks
Input -> "finds hidden states" -> output
Maybe - Adding more "hidden layers" or "states" will make a model more predictive backward-looking, including more states, therefore needs strong rationale
Generalized Additive Models
Search through factors for model inclusion and test robustness
Yes - This is an extension of current modelling practices but can examine more possible models and incorporate robustness testing which avoids overfitting
Stochastic Gradient Descent and Variants
Extended optimization with underlying theory
Yes - Can find extended optimal trade-offs and include the underlying theory for why more X is better than Y
Exhibit 3

Artificial IntelligenceQuarter 3 • 2019
9
only explanation being that that “the A.I. said so,” as this hints at the possibility of larger risks that may not be understood by the algorithm.
In Exhibit 3 we briefly cover some of the most widely-adopted techniques in recent A.I. advancements and discuss whether they meet the interpretability threshold.
Exhibit 4
Exhibit 5
0
20
40
60
80
100
2008
-01
2008
-06
2008
-11
2009
-04
2009
-09
2010
-02
2010
-07
2010
-12
2011
-05
2011
-10
2012
-03
2012
-08
2013
-01
2013
-06
2013
-11
2014
-04
2014
-09
2015
-02
2015
-07
2015
-12
2016
-05
2016
-10
2017
-03
2017
-08
2018
-01
2018
-06
2018
-11
Sear
ch In
dex
News Searches For Artificial Intelligence
Artificial Intelligence: (Worldwide)
Artificial Intelligence + Financial Markets: (Worldwide)
The Increase In News Searches for A.I. Lags Other Areas
Exhibit 6
Deepening Areas of ResearchArtificial Intelligence is currently a booming area of research. As was illustrated earlier, A.I. methods can represent one or more of the three pillars that can be combined for successful implementation. It is common for some methods to overlap. This is often the case as research in A.I. progresses. Exhibit 4 demonstrates how machine learning grew as a subset of research into more general artificial intelligence, and that more recently Deep Learning has grown out of that subset.
Popular Examples (Non-Finance)Most people are probably familiar with the fact that computers beat humans at chess. DeepMind5, 6 was able to “look-ahead” at every conceivable move out to a number of moves that is about the same as the average number of moves in a game. Combining foresight with reinforced learning based on a massive history of previous chess games played led to this success. Perhaps less well known is the game Go, in which Google’s Deepmind and the AlphaGo7 program now consistently defeats the top human players. In contrast to chess, where each possible move can be known for most games, this is not possible in the game Go. This is where a Deep Learning approach can excel, by combining large datasets, massive computing power, and cutting edge A.I. approaches.
Another interesting example is from the ImageNet Large Scale Visual Recognition Challenge, which tests a computer program’s ability to recognize the contents of a photo. Exhibit 5 shows that not only are the competing teams getting better each year, but that in 2017, 29 of 38 teams were below the 5% misclassification level, which is roughly the accuracy of a human in the same competition.8
Adoption in Finance and Economics
Turning our attention to finance and economics, the examples tend to be less well known. In general, when comparing the penetration of A.I. into finance and economics with other fields, the sector has arguably lagged. There are a few metrics9, 10 that support this finding, but one simple measure is just comparing the amount11 of news searches that are focused on A.I. by industry category, as seen in Exhibit 6. We show this chart as a proxy for level of interest around A.I. in the financial sector relative to other sectors.
While it is hard to know exactly why artificial intelligence adoption and interest in finance and economics has lagged other areas, it is likely that the higher bar for interpretation is at

10Artificial Intelligence
Exhibit 7
Company A.I. Use Today
BlackRock18 "Integrated into [the] investment process" across "nearly everything we do"
BarclayHedge 56% rate of adoption for institutional analytics in 201819
Government Pension Investment Fund - Japan Active Manager analysis20
Natixis Uses machine learning for robustness checking of stress-test models21
Securities Exchange Commission Word detection for regulatory compliance22
Ontario Teachers Pension Plan
A.I. is a blanket theme [across] investment, risk, and enablement23
Exhibit 8
least one important contributing factor. That said, as Exhibit 7 indicates, interest has grown in the past three years as this barrier is being gradually overcome. Despite lagging other sectors, A.I. adoption is widespread across finance and investing. A 2017 survey showed that 30% of financial services companies are already incorporating A.I. at the enterprise level and 52% are currently making ‘substantial investments’.12 In the next section, we highlight some more specific examples of current uses and their impact.
Does A.I. Impact My Investments Today?Evidence suggests that A.I. in the investment process does impact investment performance. This is true because the adoption of A.I. in capital markets is now wide enough that it is having an observable impact on manager performance. The fundamental improvements that A.I. can bring to the table are quite clear. Any investor who can more easily compare broader and deeper perspectives should benefit from improved insights and outcomes.13
While A.I. is still relatively new, it already appears to be producing superior performance in some segments of the market.14 For example, the chart below compares the Eurekahedge A.I. hedge fund index15 with the broader hedge fund universe and a
Commodity Trading Advisor (CTA) index.16 The composite of A.I.-driven hedge funds has outperformed the broader hedge fund universe since the inception of the Eurekahedge index.
While not shown in Exhibit 7, the A.I.-driven hedge fund subset has also outperformed for each available rolling three-year period. The extent to which each of these hedge funds incorporates A.I. into their process - and the value it adds - varies. For example, The Man Group uses artificial intelligence in one of its largest funds and that process contributed roughly half of the profits for that fund in 2015.17
Beyond hedge funds, A.I. impacts investment outcomes across a myriad of organizations and in different ways. A comprehensive list is beyond the scope of this paper, but a quick list of examples can be found in Exhibit 8 (a larger list can be found in the appendix).
How much value A.I. can add remains open for debate, and incorporating A.I. is no guarantee of success. To be clear, incorporating A.I. into an investment process does not mean that less emphasis should be put on human-led fundamental insights. It is also likely that as an A.I. technique spreads, the additional value add it is able to produce in a competitive environment will diminish. That said, as this space continues to evolve, it will put more pressure on other investors to keep up. Successfully implementing A.I. carries its own risks and must be done with care, but those that do not attempt to incorporate the benefits that A.I. bring to their investment process run a risk of falling behind.
$0.80
$1.00
$1.20
$1.40
$1.60
$1.80
$2.00
$2.20
Eurekahedge Artificial Intelligence Hedge Fund Research HFRI Fund Weighted IndexSociete Generale CTA Index Hedge Fund Research HFRX Equal Weighted Index
Artificial Intelligence Driven Hedge Funds vs. Hedge Fund Universe

Artificial IntelligenceQuarter 3 • 2019
11
Fama-French Enhancements A.I. EnhancementsShowed combining the value and size factors with the market factor for U.S. equities could explain roughly 90% of their returns. This led to investors hiring specialized value / growth and small cap equity managers in an attempt to "harvest" more of the fundamental factors that were driving returns.
-
Enhancements from Fama-French were focused on a single market and two specific factors.
A.I. has shown its ability to make improvements by searching across every known factor to get the best from existing best practices and by adding its own insights through new data/factor creation. Not only has this been shown to work across different markets but also throughout the investment process.
-
Enhancements from A.I. are applied across every market, every factor, and many applications.
Exhibit 9
In short, what this contrast highlights is that A.I. potentially has much more far-reaching implications. Following this rationale, while hiring a manager utilizing A.I. may add value, this will fall short of realizing the full potential of A.I. for an institutional investor. This is true for two simple reasons:
1. As we alluded to when comparing A.I. managers to the broader hedge fund manager universe, history has shown that the market is a quick learner and other market participants will soon incorporate A.I. into their investment process. In 2015, 47% of new hedge funds used technology including A.I. and machine learning; in 2018 that grew to 70% of the new entrants into this market.25 While adoption rates vary, this is true across the institutional investment industry. For example, a 2018 survey by Greenwich Associates found that 56% of institutional investors were incorporating A.I. integration planning into their investment process.26
2. Most investors limit the size of the allocation they are willing to make to a single manager in order to avoid over-concentration of risk. The implication is that any investment made via a single A.I. manager will add a relatively small amount of value at the total fund level. In contrast, the total potential the investor has if they incorporate A.I. into the investment process across their entire portfolio is substantial.
For institutional investors seeking to integrate A.I. into their investment process, Nicole Musicco27 of Ontario Teachers’ Pension Plan offers a helpful structure for thinking about implementation, by breaking it into three sections based on where the technology aids their process: (i) Investment, (ii)
Risk, and (iii) Enablement. Of these three areas, it is our view that ‘Enablement’ has the most sweeping reach and therefore impact across the investment process. As the word suggests, it enables the investment team to get more out of their investment process from end-to-end.
Manager Selection and Implementation When choosing between investment managers that use A.I. as part of their strategy, the selection process and due diligence is the same as selecting any fundamental manager. In short, an A.I. manager should meet all of the criteria that an investment with any other manager would be subject to, with a few additional areas to focus on:
1. While an investor need not be an A.I. algorithm specialist, they should understand how the manager implements A.I. insights into their investment process and, more importantly, why they implement each step with the tools they have chosen.
2. An investor should seek a manager that is benefiting from the major areas where A.I. has brought improvements: (i) Data Generation, (ii) Measurement, and (iii) Decision Making.
3. As complexity is a risk in its own right, the bar for interpretability in all of the previous points is high. A.I. benefits from fundamental improvements in information usage and perspective, but that in no way indicates that an investor should accept a black box approach or process that they cannot understand.
Total Portfolio ImplementationThe selection of a manager utilizing A.I. is a good way to take a small step into the realm of A.I., but most of the value-add that A.I. can bring to an institutional investor cuts across multiple aspects of the investment process. For this reason, the greatest amount of value added is likely to result from an adoption that is less dependent on manager selection or a specific asset class, but rather a broad implementation that can encompass the entire investment process of the organization. Exhibit 10 (on the next page) is a high level ‘roadmap’ that breaks this process into three stages.
Beginning at the bottom, the foundation of incorporating A.I. into the investment process is good data. Of course, this is true for any investment process, but building an infrastructure with the needs and goals of A.I. in mind should lead to a more flexible, holistic, and insightful system. As this is already best practice for institutional investors, it may be that little additional work is needed here, but a review of data infrastructure is still a good first step.
Building on that foundation, the natural place to begin using A.I. tools is within risk management. A.I. can search across more risks than were previously possible and be utilized as a simple extension to the current process. Risk review combines quantitative and qualitative insight and already has a strong focus on interpretation which make it a natural place to begin incorporating A.I. insights into the day-to-day operations of the investment process. This step also allows close integration with the people currently involved in the process so that an
Implementing A.I. in the Investment ProcessA Slow, Steady, and Sweeping Approach Artificial Intelligence has momentum, widespread adoption, and investment backing supported by extremely promising results. For these reasons, it looks as though the technology is poised to be transformational in many respects. Due to its transformational nature, incorporating A.I. requires a more extensive approach than other investment innovations have in the past. To make clear why this is the case, Exhibit 9 contrasts the impact of A.I. with the famous Fama-French three factor model24 at the time each was introduced into the market.

12Artificial Intelligence
Type Description Potential Problems Process Synopsis Time of Use Example First Step
Fundamental Human Intelligence Only
Limited Ability to Use/Process All Information
Consistent but Susceptible to Human Folly (Greed/Fear/Emotion)
Since the Advent of Markets NA
Guided Learning
A Combination of Human Intelligence and Artificial Intelligence
Requires Close Integration of Both Intelligence Types So One Cannot Dominate the Other
Humans Guide Machines to Learn Based on Models/Insights Driven by Humans
Since the 1950s, Successful Across All Fields
Utilizing Generalized Additive Approach to Risk Analysis
Unsupervised Learning
Artificial Intelligence without Human Intervention
Highly Correlated Market Information Finds False Positives
Machines Learn and Guide Human Understanding Relying on a Human-Level Check for Reasonability and Bias
Since the 2010s, Successful Examples but Not Yet Fully Adopted in Finance and Economics
Expanded Risk Management and Optimization with Stochastic Gradient Descent
Exhibit 11
integrated solution can be crafted that achieves the most from all available resources.
Finally, now that the data infrastructure is in place and the tools have been tested and integrated into the risk management process, A.I. can be more fully incorporated into the investment process. Similar to integration with risk management, the A.I. tools will combine qualitative and quantitative information and work closely with the human team and their insights. Luckily, most of the tools used in the risk management process can be repurposed to investment monitoring, scenario analysis, portfolio optimization, as well as many other core functions.
Any investor should only invest in areas or use tools in their process that they understand and feel comfortable with, and this remains true with artificial intelligence. For this reason, it is best practice to gradually adopt A.I. technologies – but to start doing
so as soon as possible. Eventually this could (and arguably should) lead to incorporating machine learning into the asset allocation and risk management process. Keeping a steady pace of evolution with an understanding of the potential value added is the best way to harness the power of A.I.
The Human and A.I. Interaction Spectrum A successful implementation of A.I. represents an extension of current and well-understood processes while keeping a human intimately involved in the process. Exhibit 11 shows how investors can move towards artificial intelligence coordination with the human team in steps. The path(s) suggested effectively boils down to continuous refinement of the investment process using best practices.
Exhibit 10

Artificial IntelligenceQuarter 3 • 2019
13
Common ConcernsWhen thinking about implementing A.I. within the investment process or considering investing in a fund manager that utilizes the technology, there are several concerns that are common. While we surely cannot address every potential concern, we can address the most common broad categories that these concerns fall into.
Reliance on Historical Data
The largest problem with any backward-looking analysis is that it can only rely on historical data. That is, it is taken from what happened, and not what could have happened. This is a potential problem because the period from which the data was drawn may or may not reflect the environment(s) that will transpire in the future.
The concern with A.I. is to what extent it is subject to the same challenges. There is no evidence to support that machine-led algorithms are more susceptible to this issue than a human team. That said, our recommendation as laid out above is to pair A.I. with human interaction, to create a best of both worlds approach, as each has its own advantages.
Overfitting
We touch on overfitting a few times above as this is a legitimate risk. That said, newer A.I. methods have the power to perform robustness checks in a much more rigorous way than human teams could in a timely fashion. Again, using a combination of machine and human-led insight should be beneficial in mitigating this concern.
Not Intuitive
A.I. is undeniably complex, and the vast majority of people are not going to be as comfortable with it as they are with traditional techniques with which they have more experience. Any approach that resembles a “black box” deserves to be met with skepticism.
This paper emphasizes interpretability in large part to address this concern. Tackling this concern should be the major focus of the first integration step when applying A.I. to the investment process.
ConclusionIn this paper we have shown several examples of A.I.’s use. We have laid out the tools used by A.I. and suggest that a successful implementation will include a wide spectrum of tools across data generation, measurement, and decision making.
In implementing this technology, a slow and steady approach that is well understood and is an extension of current processes is the best practice. It includes a process whereby A.I. works closely with human team members for a combined result that gets the most from all available resources. We have presented a broad ‘roadmap’ for implementation and laid out how this is closely aligned with best practices.
While implementing a new technology is often a risk, in this case not implementing A.I. also represents a risk, namely of falling behind. At the end of the day, while A.I. may sound intimidating, fanciful, or overwhelming, the advantages it brings are fundamental.
1. A.I. automates mundane tasks, which improves efficiency of current resources.
2. A.I. broadens the scope of considered risks and opportunities.
3. A.I. deepens the analytical level that those risks and opportunities can be evaluated in a timely fashion.
4. A.I. provides a more holistic perspective across operations and the interaction between the myriad risks and opportunities an institutional investor must evaluate.
5. A.I. works alongside, not in replacement of, human insight, the latter of which crafts a “best of both worlds” solution.
The impact of Artificial Intelligence is already upon us. The transformational nature of this technology suggests that while hiring a manager that utilizes A.I. may be a good small step to take advantage of the changing landscape, the bulk of the potential value added comes from incorporating these tools into the investment process at the portfolio level. Disclaimers
This document is for general information and educational purposes only, and must not be considered investment advice or a recommendation that the reader is to engage in, or refrain from taking, a particular investment-related course of action. Any such advice or recommendation must be tailored to your situation and objectives. You should consult all available information, investment, legal, tax and accounting professionals, before making or executing any investment strategy. You must exercise your own independent judgment when making any investment decision.
All information contained in this document is provided “as is,” without any representations or warranties of any kind. We disclaim all express and implied warranties including those with respect to accuracy, completeness, timeliness, or fitness for a particular purpose. We assume no responsibility for any losses, whether direct, indirect, special or consequential, which arise out of the use of this presentation.
Nothing in this document should be interpreted to state or imply that past results are an indication of future performance. Investing involves substantial risk. It is highly unlikely that the past will repeat itself. Selecting an advisor, fund, or strategy based solely on past returns is a poor investment strategy. Past performance does not guarantee future results.

14Artificial Intelligence
AppendixExample List of Managers Using A.I.
Company A.I. Use Today
Cerebellum Capital Equity market neutral strategy utilizing Machine Learning.
Trinnacle Equity market neutral strategy utilizing A.I. and Machine Learning.
FORT Machine Learning in trend selection and memory.
AlphaSimplex Machine Learning in trend selection and memory.
Lynx Machine Learning in trend selection and memory.
P/E Investments Automated Bayesian analysis for dynamic allocation between models and states.
AQR Large investments into A.I. through data and human resources. Full application not specified.
D.E. Shaw Large investments into A.I. through data and human resources. Full application not specified.
Two Sigma Large investments into A.I. through data and human resources. Full application not specified.
Eurekahedge A.I. Hedge Fund Index
Total Constituents (historic) 29
Live 16
Actively Reporting Constituents 14
Average Fund Size (live) U.S. $60 million
Range of Fund Size (live) U.S. $547 million
http://www.eurekahedge.com/Indices/IndexView/Eurekahedge/683/Eurekahedge_AI_Hedge_fund_Index

Artificial IntelligenceQuarter 3 • 2019
15
Endnotes1. This includes another subfield of Artificial Intelligence call
Natural Language Processing (NLP).
2. Common to neural nets or state-space modelling, this activity finds hidden or underlying states or processes that are not directly observable.
3. For example, Economic Regime Management describes ‘states’ when forecast surprises (positive or negative) are more likely as well as when uncertainty is higher than normal. https://papers.ssrn.com/sol3/papers.cfm?abstract_id=2663609
4. For example, a computer could describe what has worked best in the past via a “best fit” model without understanding “why” that is the case. Whereas an A.I. approach may use a preference-based objective, which means everything is a trade-off. Therefore, it “understands” it is willing to trade some units of X for some units of Y to meet those preferences. The result may (and likely will) look different than a best fit model.
5. http://www.chessgames.com/chessstats.html
6. https://www.wired.com/2016/03/googles-ai-viewed-move-no-human-understand/
7. https://deepmind.com/research/alphago/
8. https://qz.com/1034972/the-data-that-changed-the-direction-of-ai-research-and-possibly-the-world/
9. https://www.cnbc.com/2017/06/06/machine-learning-transforms-investment-strategies-for-asset-managers.html
10. https://www.mckinsey.com/mgi_notes-from-ai-frontier_discussion-paper.ashx
11. Google’s search index is a normalized value for number of searches for time period and location meaning that 100 indicates the largest search amount for the topics shown. Data and definitions are available here: https://trends.google.com/trends/explore?date=all_2008&gprop=news&q=%2Fm%2F0mkz,Artificial%20intelligence%20%2B%20Financial%20Markets
12. https://www.pwc.com/us/en/financial-services/research-institute/assets/pwc-fsi-top-issues-2018.pdf
13. It should be noted that details of implementation and execution will have important implications for outcomes.
14. This finding was confirmed in a separate research piece based on Preqin Data: https://www.wired.com/2016/01/the-rise-of-the-artificially-intelligent-hedge-fund/
15. The Eurekahedge AI Hedge Fund Index is an equally-weighted index of 13 constituent funds. The index is designed to provide a broad measure of the performance of underlying hedge fund managers who utilize artificial intelligence and machine learning theory in their trading processes.
16. Proxied by the Société Générale CTA index.
17. https://www.bloomberg.com/news/features/2017-09-27/the-massive-hedge-fund-betting-on-ai
18. https://www.blackrockblog.com/2017/08/03/artificial-intelligence-evolution/
19. https://www.barclayhedge.com/about-us/
20. https://www.top1000funds.com/2018/10/ai-to-transform-gpif-manager-selection/
21. https://www.risk.net/risk-management/4646956/model-risk-managers-eye-benefits-of-machine-learning
22. https://www.sec.gov/news/speech/bauguess-big-data-ai
23. http://www.milkeninstitute.org/videos/view/how-will-technology-trends-impact-your-portfolio
24. https://rady.ucsd.edu/faculty/directory/valkanov/pub/classes/mfe/docs/fama_french_jfe_1993.pdf
25. https://www.opalesque.com/666981/of_new_hedge_funds_to_use_computer698.html
26. https://www.institutionalinvestor.com/article/b18ts4fwfg53c0/Asset-Managers-Plan-to-Boost-AI-Spending-a-Greenwich-Survey-Shows
27. http://www.milkeninstitute.org/videos/view/how-will-technology-trends-impact-your-portfolio

16Artificial Intelligence
Authors Bios'
Roberto Obregon, CAIA, CFA Meketa Investment Group
Mr. Obregon joined Meketa Investment Group in 2014. A Research Analyst for the firm, his responsibilities include asset allocation, risk management, and macro-economic research, and investment manager research. Mr. Obregon works directly with the public markets manager research
team and the Director of Research to develop and communicate research and guidance to our consultants and clients.
Prior to joining Meketa Investment Group, Mr. Obregon was employed by Agrega Partners in Caracas, Venezuela, a financial and strategic consulting firm. In addition, he served as an Analyst for Core Global Management, an actuarial consulting firm in Caracas.
He received a Master of Finance from the MIT Sloan School of Management, and a Bachelor of Science degree, cum laude, in Applied Mathematics from the Universidad Metropolitana in Caracas, Venezuela. Mr. Obregon holds the Chartered Financial Analyst designation, and is a member of the CFA Institute. He also holds the Chartered Alternative Investment Analyst (CAIA) designation and is a Member of the CAIA Association®.
Frank E. Benham, CAIA, CFA Meketa Investment Group
Mr. Benham joined Meketa Investment Group in 1999. As Director of Research, Mr. Benham oversees all research projects, including white papers and the firm’s annual asset study. Mr. Benham leads the design of the firm’s portfolio construction initiatives and he is key in constructing
customized investment programs. Mr. Benham is a member of the firm’s Board of Directors and chairs the firm's Investment Policy and Strategic Asset Allocation/Risk Management committees. Additionally, he is a member of the Private Markets Investment Committee.
Mr. Benham received an undergraduate degree in Finance from Bentley College. He holds the Chartered Financial Analyst designation, and he is a member of the CFA Institute and the Boston Security Analysts Society. Mr. Benham also holds the Chartered Alternative Investment Analyst (CAIA) designation and is a Member of the CAIA Association®. Prior to joining Meketa Investment Group, Mr. Benham was employed at State Street Bank, performing operations analysis and developing process improvements.
Mr. Benham has served as a frequent speaker at industry events, including: the International Foundation of Employee Benefit Plans Annual Conference, the NCPERS Annual Conference, the Investment Forum for Endowments, Foundations and Pension Funds, the Endowment and Foundation Forum, the Made in America Conference, the Institutional Investor Public Funds Roundtable, the Boston Security Analysts Society Asset Allocation Seminar, the Institutional Investor Global Real Assets Forum, the Institutional Investor Infrastructure Investment Forum, the SuperReturn Latin America conference, the Institutional Real Estate VIP conference, and the Investing in Infrastructure Assets Europe and Americas conferences.
Timur Kaya Yontar, PhD Meketa Investment Group
Dr. Yontar joined Meketa Investment Group in 2015 and has been in the financial services industry for eight years. A Senior Vice President of the firm, Dr. Yontar serves as a consultant for a variety of clients on their endowments, foundations, and pension plans. His areas of expertise include
investment policy design, modeling of asset and risk allocations, derivatives-based strategies, and analysis of manager and fund performance.
Prior to joining the firm, Dr. Yontar was Managing Director, Investments and Derivatives, at Cambridge Associates. While there, he advised endowment, foundation, and high-net-worth private clients on asset allocation and manager selection, while also serving as a research specialist on portfolio construction, risk management, and derivatives.
Prior to this, he led the analytic services department at Upromise where he was responsible for marketing strategy analysis, reporting, and research. Previously, he was a management consultant, serving as a project and team leader at Monitor Group and as an analyst at Dean & Company.
Dr. Yontar graduated from Harvard University with a PhD and MA in Political Science, and a BA, magna cum laude, in Government. He serves as the Treasurer for the Harvard Band Foundation, where he is responsible for supervising endowment investments and capital grants.

Outcome-Oriented Alternative Investments
Outcome-Oriented Alternative InvestmentsQuarter 3 • 2019
17
Masao Matsuda, CAIA Crossgates Investment and Risk Management
“Outcome-orientation” is an important maxim in today’s investment management community. This maxim signifies that financial assets ought to be managed in such a way as to generate outcomes desired by investors. On the surface, it seems to merely emphasize the quintessential mission of the investment management business. In reality, it also underscores an important shift from a strategic asset allocation-oriented approach to more flexible and diverse investment approaches tailored to meet investors’ needs. Many types of alternative investments are inherently outcome-oriented. In this paper, we will discuss different types of outcomes that investors can pursue through an array of alternative strategies. We will also address a set of risk management considerations that can improve the probability of attaining one’s desired investment outcome.
Characteristics of Outcome-Oriented InvestmentsSome financial services organizations, including investment managers, use the expression “outcome-oriented investments” as a convenient marketing tool to re-classify existing funds and investment strategies. Add a word or two to traditional classification schemes such as “income” or “growth” and one seems to have created a fresh investment platform which purportedly addresses the needs of today’s discerning investors. As a matter of fact, for many large organizations with a number of legacy products, this may be a rational and self-justifying course of action.
In order to improve the probability of attaining the desired outcome, however, each outcome needs to be defined more precisely than is done in the currently accepted practices in the industry. The shape of a return distribution suitable to each outcome may deviate from a normal or other elliptical distribution, and investors’ unique needs can materialize in the values of skewness

18Outcome-Oriented Alternative Investments
and kurtosis. In addition, the timing of cash flow matters to investors depending on the desired outcome. Although the multifariousness of addressing the third and fourth moments of distribution, along with the time series property of cash flow, may render it difficult to express a desirable distribution in a mathematically tractable form, it is imperative to pay attention to these parameters. It is worth noting that having a non-normal distribution by itself should not pose a problem for investors unless potentially significant losses are implied. In fact, many investors would pursue a strategy with an expected leptokurtic distribution with a reasonable level of a mean return and a very small value of standard deviation around its mean, if such a strategy can be found.
Underpinning the trend toward an outcome-oriented approach and away from the traditional strategic asset allocation (SAA) approach based on a mean-variance optimization, is a growing recognition that a static decision framework based on parameters such as expected return, risk, and correlation will not always lead to satisfactory outcomes. The financial markets are simply too dynamic to be represented in a static framework when investors have specific future cash flow needs to fill within a given time horizon.
With the traditional SAA approach, investors first determine a policy asset mix and then evaluate performance of a particular investment relative to a relevant benchmark for each asset class. Thus, the decisions of investment managers become “relative return oriented.” In addition, in estimating and calculating returns, typically no distinction is made between income gains and capital gains. The distinction can be critical for both institutional and individual investors. Moreover, since the mean-variance optimization by definition relies on the first and second moments of return distribution (mean and variance), the third and fourth moments (skewness and kurtosis) are inevitably disregarded.1 Nevertheless, the shape of return distribution matters when focusing on a certain outcome in investment decision making, as was mentioned previously.
By contrast, a true outcome-oriented investment should be managed with the objective of improving the probability of meeting future cash flow needs of investors, including capital gains, in accordance with the particular outcome being sought.2 To illustrate, certain investors may wish to receive a steady flow of current income without inflation causing an erosion of purchasing power, as well as to realize some growth of principal. On the other hand, other investors may be more focused on controlling overall portfolio volatility to avoid major losses at any point within the relevant investment horizon.
For this reason, outcome-oriented investments need to have the following two characteristics at minimum. First, an outcome-oriented investment should be essentially agnostic of asset classes or investment opportunities.3 In fact, an allocation within each strategy’s investment universe is typically managed dynamically. This means the responsibility for identifying and exploiting sources of returns is left in the hands of an investment manager. This is in contrast to the manager’s investment decisions being constrained by a benchmark as a result of strategic asset allocation decisions.
Second, the risk management skills of an investment manager are an integral part of outcome generation. The investment manager should be able to adjust dynamically to diverse investment opportunities based on known or inherent risk factors within each strategy. Security selection alone cannot deliver investors’ desired outcomes. What is more, attaining an outcome means providing the desired series of future cash flows. Thus, the time series property of investment products cannot be treated as path-independent, as is often presumed in traditional SAA.
The two characteristics just mentioned aptly apply to alternative investments. These investments are by no means relative return products, and an innumerable number of alternative investment managers enjoy a substantial degree of freedom in pursuing sources of returns. In addition, alternative managers are often considered to pursue absolute returns. In their effort to generate returns irrespective of market conditions, these managers frequently deal with more complex risk challenges than managers of traditional investments, to the degree that these investments involve long and short exposures, as well as the use of leverage and derivatives. Thus alternative investments can be viewed as inherently outcome-oriented.
Outcomes for Investors in Alternatives There are different ways to classify outcomes desired by investors. The frequently claimed outcomes for traditional investments such as stable income and diversified growth tend not to be sufficiently investor-centric. In analyzing what kind of benefits investors in alternatives are seeking and why some investors choose a particular alternative investment over others, the four major categories of outcomes can be identified.
The four categories of outcomes for alternative investments are: (1) inflation protection and real return, (2) volatility and risk management, (3) equity risk diversification and market neutrality, and (4) alpha opportunities from expanded sources of returns.4 Each category of outcome has a unique expected value of returns along with a variable degree of return dispersion.5 In addition, time series property of each outcome can differ markedly.
It is also crucial to keep in mind that these outcomes are by no means mutually exclusive; by achieving one outcome, another outcome may be simultaneously attained at least in part. For instance, a certain strategy can contribute to reduction in portfolio volatility through its effect on equity risk diversification. Such a strategy, if successful, is likely to generate returns that comfortably exceed inflation rates.
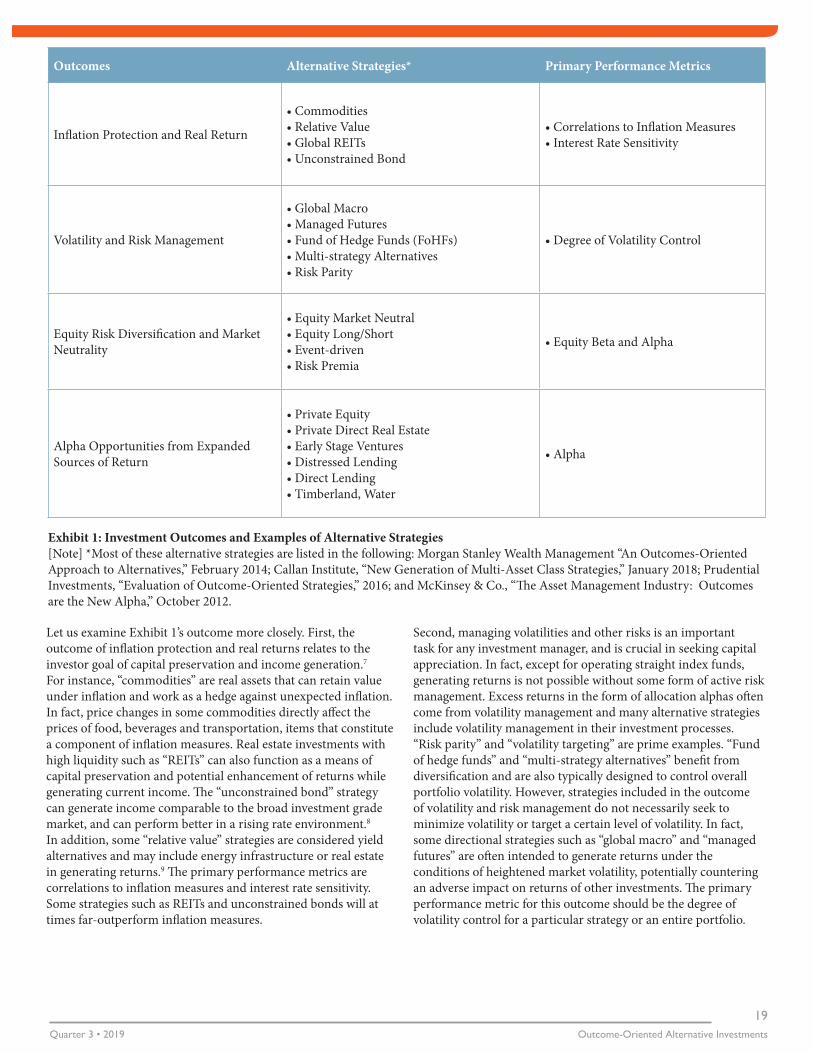
Exhibit 1 (on the following page) lists four archetypal outcomes along with examples of alternative strategies and primary performance metrics corresponding to each outcome. The list of strategies is compiled from various papers published by diverse organizations including a major financial services firm, a pension consultant, an investment management company and a management consultant.6 The list is by no means exhaustive as there are myriad other alternative strategies. Some organizations may classify strategies differently from what is shown in the table. Also, many alternative strategies potentially deliver multiple outcomes. In those cases, an attempt has been made in Exhibit 1 to classify each strategy into what seems to be its primary outcome and avoid double listings under another outcome.
Outcome-Oriented Alternative InvestmentsQuarter 3 • 2019
19
Let us examine Exhibit 1’s outcome more closely. First, the outcome of inflation protection and real returns relates to the investor goal of capital preservation and income generation.7 For instance, “commodities” are real assets that can retain value under inflation and work as a hedge against unexpected inflation. In fact, price changes in some commodities directly affect the prices of food, beverages and transportation, items that constitute a component of inflation measures. Real estate investments with high liquidity such as “REITs” can also function as a means of capital preservation and potential enhancement of returns while generating current income. The “unconstrained bond” strategy can generate income comparable to the broad investment grade market, and can perform better in a rising rate environment.8 In addition, some “relative value” strategies are considered yield alternatives and may include energy infrastructure or real estate in generating returns.9 The primary performance metrics are correlations to inflation measures and interest rate sensitivity. Some strategies such as REITs and unconstrained bonds will at times far-outperform inflation measures.
Second, managing volatilities and other risks is an important task for any investment manager, and is crucial in seeking capital appreciation. In fact, except for operating straight index funds, generating returns is not possible without some form of active risk management. Excess returns in the form of allocation alphas often come from volatility management and many alternative strategies include volatility management in their investment processes. “Risk parity” and “volatility targeting” are prime examples. “Fund of hedge funds” and “multi-strategy alternatives” benefit from diversification and are also typically designed to control overall portfolio volatility. However, strategies included in the outcome of volatility and risk management do not necessarily seek to minimize volatility or target a certain level of volatility. In fact, some directional strategies such as “global macro” and “managed futures” are often intended to generate returns under the conditions of heightened market volatility, potentially countering an adverse impact on returns of other investments. The primary performance metric for this outcome should be the degree of volatility control for a particular strategy or an entire portfolio.
Outcomes Alternative Strategies* Primary Performance Metrics
Inflation Protection and Real Return
• Commodities• Relative Value• Global REITs• Unconstrained Bond
• Correlations to Inflation Measures• Interest Rate Sensitivity
Volatility and Risk Management
• Global Macro• Managed Futures• Fund of Hedge Funds (FoHFs)• Multi-strategy Alternatives• Risk Parity
• Degree of Volatility Control
Equity Risk Diversification and Market Neutrality
• Equity Market Neutral• Equity Long/Short• Event-driven• Risk Premia
• Equity Beta and Alpha
Alpha Opportunities from Expanded Sources of Return
• Private Equity• Private Direct Real Estate• Early Stage Ventures• Distressed Lending• Direct Lending• Timberland, Water
• Alpha
Exhibit 1: Investment Outcomes and Examples of Alternative Strategies [Note] *Most of these alternative strategies are listed in the following: Morgan Stanley Wealth Management “An Outcomes-Oriented Approach to Alternatives,” February 2014; Callan Institute, “New Generation of Multi-Asset Class Strategies,” January 2018; Prudential Investments, “Evaluation of Outcome-Oriented Strategies,” 2016; and McKinsey & Co., “The Asset Management Industry: Outcomes are the New Alpha,” October 2012.

20Outcome-Oriented Alternative Investments
Third, it is well-known that traditional investments have a high level of equity risk even within a typical asset class diversification.10 When an inclusion of alternative investments is considered, the principal role of those alternative investments is often to further diversify an existing traditional portfolio. Therefore, it makes sense for investors to seek outcomes to neutralize extreme market movements, underpinning the need for the outcome of equity risk diversification and market neutrality. For this purpose, an uncorrelated or low beta strategy such as “equity market neutral” and “equity long/short” makes sense. In addition, “event driven” strategies such as merger arbitrage tend to have a payoff pattern similar to a dynamically managed short position on the stock market.11 These strategies bring diversification effects on equity risk. Moreover, the “risk premia” strategy combines risk factors that are uncorrelated to each other and to equity market risk. The strategy is ideally suited to seek performance in a market neutral fashion. For many strategies belonging to this outcome, it is only natural to use equity beta as the primary performance metric. For truly market neutral strategies, however, alphas beyond risk free rate or another hurdle rate are an appropriate performance metric.
Fourth, there are a variety of private capital investments that attempt to exploit alpha opportunities from expanded sources of returns. Beyond harvesting true alphas due to the selection capabilities of an investment manager, private capital strategies typically contain illiquidity risk and its attendant risk premium. Extracting illiquidity premia requires time and skill, as well as the active involvement of an investment manager. These investment opportunities include “private equity,” private credit (“distressed lending” and “direct lending”), “direct real estate” and “early stage ventures.” The shape of a return distribution is likely to be unique because of the illiquid nature of these investments. For instance, it is known that senior debt strategy, a major type of direct lending, tends to have a negatively skewed distribution with a few larger than expected gains.12 In addition, some natural resources such as “timberland” and “water” also belong to this category of investment, though they may fulfill the outcome of inflation protection as well. For the strategies supporting this outcome, alpha over a certain hurdle rate is the relevant performance metric when investment managers are involved.
Strategy and Manager Selection While Exhibit 1 points out which type of alternative investment products one may wish to explore in order to seek a particular investment outcome, examining a specific manager or fund’s risk-return characteristics is essential in bringing success. For outcome-oriented investments, as the expression indicates, what matters ultimately is the end outcome delivered through a risk-driven investment process, i.e., how well cash flow needs can be fulfilled. In this section, how a suitable selection of an alternative strategy or a combination of strategies can contribute to raising the probability of receiving desired cash flows will be discussed.
Being unconstrained by a relative performance benchmark, many alternative strategies have the freedom of dynamically pursuing long and short investment opportunities while often using derivatives for return enhancement. Due to significant differences in manager skills, this tends to result in wide performance differences among investment products in the same category of alternative strategies. A study shows, for instance, that the
difference in performance of the top decile return and the bottom decile return among global macro funds for the period 2000 through 2013 was 17.1% per year. Among real estate funds, the same measure was 13.8%.13 Thus, manager skills are critical in attaining an intended investment outcome.
Given the available investment opportunity set, it may make sense to invest in multiple funds in the same category of strategies instead of attempting to fill each type of strategy with a pre-determined number of funds. For instance, when combined with an existing portfolio, one may find multiple managers with excellent skills to deliver the outcome of equity risk diversification in the event driven strategy, but only marginally satisfactory managers in the equity long/short strategy. In those cases, adding an equity long/short fund will not contribute to realizing the outcome. Moreover, a manager with the right set of investment skills to complement a particular portfolio may not be the right match for another investor’s portfolio even if the desired outcome is the same, as each portfolio’s expected return distribution and future cash flow pattern vary.
It is often the case that an alternative investment is not treated as a complement to a portfolio consisting of traditional securities. Instead, a majority of assets may be allocated to a variety of alternative investments. The endowment style of investment embodies such an investment philosophy. Exhibit 2 compares the cumulative performance over the 20 year period ending in 2017 between the Yale endowment and the S&P 500 with dividends.
0
2
4
6
8
10
12
1997
1998
1999
2000
2001
2002
2003
2004
2005
2006
2007
2008
2009
2010
2011
2012
2013
2014
2015
2016
2017
YaleEndowment
S&P 500 TotalReturn
Cum
ulat
ive
Retu
rns
(199
7=1.
0)
Exhibit 2: Cumulative Returns in the Past 20 Years: Yale vs. S&P 500 Source: Yale Investments Office, "Endowment Report," various years.
While the S&P 500 has quadrupled in value (including dividends) since the end of 1997 to 2017, the Yale Endowment grew tenfold over the same period of time.14 In other words the cumulative return of the Yale endowment was 579% greater than the cumulative return of the S&P 500 over the same period. The endowment has certainly generated an extremely impressive investment result.
The Yale Endowment’s allocation as of June 2017 is shown in Exhibit 3. At that point in time, over three-quarters of the endowment's assets are dedicated to alternative investments. Combined with the outsized returns shown in Exhibit 2, this provides e prima facie evidence that alternatives can outperform traditional investments alone. In addition, it is noteworthy that 50% of Yale’s endowment assets (private equity, natural resources, real estate, and venture capital) were of an illiquid nature. As a long-term investor, the endowment can take advantage of the

Outcome-Oriented Alternative InvestmentsQuarter 3 • 2019
21
risk premia harvested through illiquid investments. Skillfully combining alternative investments can result in an extraordinary result.
It is also noteworthy that the Yale Endowment’s alternative allocation included strategies classified as inflation protection and real return (e.g., “commodities” such as oil and gas), equity risk diversification and market neutrality (e.g., “event driven”) and alpha opportunities from expanded sources of returns (e.g., “leveraged buyout,” “real estate,” “venture capital,” and “timberland”). With such a phenomenal performance, the endowment seems to have attained three different outcomes simultaneously. The endowment also accomplished this success while contributing substantially to Yale University’s operating budget each year.
Outcome-Oriented Risk Management for Investors As described at the outset, an emphasis on risk management is a key component of successful outcome oriented investments. Alternative strategies have highly divergent risk characteristics, and understanding and managing risks of a particular alternative product or of the entire portfolio which includes alternatives is a critical component of attaining desired outcomes. Unlike the traditional strategic asset allocation (SAA) approach, investing in alternatives can address skewness and kurtosis of a return distribution, as well as the time series property of cash flow. From an investor's perspective, there are at least five ways to pursue risk management to generate a better outcome during the process of selecting and monitoring investment products. In the paragraphs below, these five ways will be discussed.
First, one method of selecting and monitoring investment products is through portfolio replication. Replicating a certain hedge fund performance to a reasonable degree can be surprisingly easy. Replication allows an insight into what type of exposure is taken by an investment manager. If a reasonably
Allocation
Alternative Investments: 75.10%
Absolute Return (Event-driven and Value-driven)
25.10%
Private Equity (Leveraged Buyout) 14.20%
Natural Resources 7.80%
Real Estate 10.90%
Venture Capital 17.10%
Traditional Investments: 23.70%
Domestic Equity 3.90%
Fixed Income 4.60%
Foreign Equity 15.20%
Cash 1.20%
Exhibit 3: The Yale Endowment's Allocation as of June 2017 Source: Yale Investments Office, "Endowment Report," 2017.
good approximation can be attained with the use of indices and/or liquid financial instruments, one can budget his/her risk accordingly. Performance information of alternative products is usually disclosed with some delays. With a replicating portfolio, one can observe its proxy indices on a real time basis. This can be an extremely powerful tool in risk budgeting and monitoring of investments.
Second, another risk management method, which may or may not involve replication, is identifying and potentially implementing hedges. If the future shape of distribution for a particular strategy can be reasonably estimated based on repeatable historical performance or through replication, one may be able to devise an effective hedging strategy for unwanted risks. In addition, many alternative strategies have a non-linear payoff distribution, which poses a challenge to risk management. A decomposition of non-linear distribution often allows mitigation of at least a part of investment risks. Moreover, one can also focus on the downside aspect of a strategy by using analytical concepts such as the Extreme Value Theory (EVT), if a left tail distribution of the strategy poses serious concerns. This is especially important when dependency of risk factors among different strategies is expected to manifest at a time of market challenges.
Third, rather than focusing on risk return characteristics of an individual strategy, an investor may wish to examine the marginal impact of adding an alternative strategy to an existing portfolio. Depending on the co-variance structure a particular strategy has with a given portfolio, its effect on the entire portfolio may be suitable to reaching the desired outcome. Suppose that an institutional portfolio appears to be reasonably diversified in terms of exposure to various types of risks. Upon conducting a rigorous stress test, however, the portfolio is found to be vulnerable to large movements in currencies. Adding a global macro hedge fund that generates higher than average returns at the times of extreme currency moves can be highly accretive in terms of creating a probability distribution for the entire portfolio that matches the desired outcomes. Viewed individually, however, the global macro fund may have a comparatively low Sharpe ratio given its level of volatility.
Fourth, some investors pursue alternative investments largely independently from traditional asset classes. In the case of the Yale Endowment described in the previous section, while the entire allocation is carefully constructed, alternative investments dominate its allocation and clearly have contributed to long-term out-performance over US equity.15 Various alternative strategies can be combined to improve the chances of attaining outcomes such as the ones in Exhibit 1. In most cases, one is likely to combine multiple strategies listed for the same outcome. However, under some circumstances, it may make sense to combine a strategy belonging to another outcome. In the end, the capability of a specific investment product to generate a desired outcome, either standalone or in combination with other products or an existing portfolio is what matters.
Finally, it is also critical to examine the time-series property of an investment opportunity, to the degree that an outcome-oriented investment addresses the future cash flow needs of an investor. For instance, the return distribution for the outcome of inflation protection and real return may embody a serial correlation if a periodic and fixed amount of cash flow is expected. Depending

22Outcome-Oriented Alternative Investments
Endnotes1. In other words, a return distribution is assumed to be
Gaussian, which can be described by only a mean and a standard deviation.
2. CaseyQuirk (2013), page 3.
3. See Callan Institute, (2018). While most outcome-oriented investments are asset class agnostic, certain alternative strategies are pursued with a narrow group of investment opportunities. These strategies, however, still maintain flexibility in pursuing specific investment opportunities.
4. Some of these outcomes are similar to the ones described in Morgan Stanley Wealth Management (2014).
on the sources of the stable cash flow, the investment opportunity can be equivalent to writing out-of-the-money (OTM) put options.16 It is well-known that occasional but substantial losses often accompany such a strategy after a long succession of positive returns. The presence of serial correlations will also affect the shape of return distribution including skewness and kurtosis. Risk management for investors in alternatives should address all of these statistical properties. Applying varied means of risk management to deliver successful outcomes is what distinguishes investment in alternatives from implementation of the traditional SAA.
Conclusion The maxim “outcome-orientation” has an implication well beyond its apparent investor-centricity as to how professional investment management should be pursued. It signals a major shift from the traditional strategic asset allocation approach to the asset class agnostic and risk-driven approach. Alternatives are naturally suited to outcome-oriented investments. Such investments should be measured with proper performance metrics.
By analyzing the reasons that investors seek alternatives, four types of outcomes from engaging in alternative investments can be identified. They are: (1) inflation protection and real return, (2) volatility and risk management, (3) equity risk diversification and market neutrality, and (4) alpha opportunities from expanded sources of returns. Various alternative strategies are classified into a relevant type of outcome. Performance metrics that suit each objective should be utilized.
Each outcome is expected to have a unique return distribution in terms of its mean (or its median), its standard deviation, its skewness, and its kurtosis. Each outcome also has different cash flow expectations. There are alternative products that contribute to delivering each outcome, or a combination thereof. While investors cannot directly engage in risk management of these investment products, there are a set of activities in which investors can engage. With the right selection of alternative products and a judicious engagement of risk management, an investor can pursue the outcomes that raise the probability of meeting his/her needs for future cash flow, including capital gains.
5. This also means that a return distribution may deviate away from Gaussian, and has the values of skewness and kurtosis that differs from those of normal distribution.
6. The organizations are Morgan Stanley Wealth Management, Callan Institutes, Prudential Investments, and McKinsey & Co. Some of these organizations’ studies also discuss traditional investment products such as target date funds. Such traditional investment products are not included in the table.
7. Morgan Stanley makes a distinction between capital preservation and income. It also lists “balanced growth,” “market neutral,” and “opportunistic growth” as other categories of investment outcomes. See Morgan Stanley Wealth Management (2014).
8. Prudential Investors (2016). The unconstrained bond strategy also clearly has an element of another outcome: volatility and risk management.
9. See Hedge Fund Research, https://www.hedgefundresearch.com/hfr-hedge-fund-strategy-classification-system.
10. For instance, a study shows that a portfolio consisting of 36% US equity, 24% non-US global equity, and 40% US fixed income (in other words, a conventional 60-40 portfolio) has an over 90% concentration of equity risk. This example shows that a fixed income allocation in reality does not function as a diversifier to an equity allocation. See Callan Institute (2018).
11. Fung and Hsieh (2013).
12. See Cambridge Associates (2017).
13. Morgan Stanley Wealth Management (2014).
14. Note that the growth of assets in Exhibit 2 is based purely on investment returns and does not include “contributions” to the endowment.
15. In the 10 year period leading up to June 2017, foreign equity also contributed substantially given its high level of returns and relatively high allocation.
16. For instance, a study shows that between 1991 and 1997, 6% OTM puts on the S&P 500 index had losses every month. Therefore, writing such put options would have generated profits every month for 8 years consecutively. See Brodie et al. (2009), pages 4493-4529.

Outcome-Oriented Alternative InvestmentsQuarter 3 • 2019
23
Masao Matsuda, PhD, CAIA, FRM Crossgates Investment and Risk Management
Masao Matsuda is President and CEO of Crossgates Investment and Risk Management. He has nearly three decades of experience in the global financial services industry. He has acted as CEO of a US broker-dealer and CEO/CIO of a number of investment management firms. In addition
to his broad knowledge of alternative investments and traditional investments, he also possesses a technical expertise in financial modeling and risk management. He is experienced as a corporate director for operating and holding companies, and as a fund director for offshore investment vehicles.
Prior to founding Crossgates Investment and Risk Management, Masao spent 18 years with the Nikko group of companies of Japan. For the last seven years of his career at Nikko, he served as President/CEO of various Nikko entities in the US, and as a director of Nikko Securities Global Holdings. He received his Ph.D. in International Relations from Claremont Graduate University. He holds CAIA and FRM designation. He is a member of the Steering Committee of CAIA’s New York Chapter.
ReferencesBrodie, Mark, Mikhail Chernov and Michael Johannes (November 2009). “Understanding Index Option Returns,” The Review of Financial Studies. Volume 22, Issue 11, Pages 4493–4529.
Callan Institute (January 2018). “New Generation of Multi-Asset Class Strategies.”
Cambridge Associates (2017). “Private Credit Strategies: An Introduction.”
CaseyQuirk (November 2013). “Life After Benchmark: Retooling Active Asset Management.”
Fung, William and David A. Hsieh (2013). Chapter 16 “Hedge Funds,” Handbook of the Economics of Finance, Volume 2B, George M. Constantinides, Milton Harris, and Rene M. Stulz [editors].
Hedge Fund Research. https://www.hedgefundresearch.com/hfr-hedge-fund-strategy-classification-system.
McKinsey & Co., (October 2012). “The Asset Management Industry: Outcomes are the New Alpha.”
Morgan Stanley Wealth Management (February 2014). “An Outcomes-Oriented Approach to Alternatives.”
Prudential Investors (2016). “Evaluation of Outcome-Oriented Strategies.”
Author Bio

Pension Fund ALM with Longevity Hedging Can Longevity Hedging Help Pension Funds Improve Their Asset Liability Management?David Schrager Longitude Solutions
24Pension Fund ALM with Longevity Hedging Can Longevity Hedging Help Pension Funds Improve Their Asset Liability Management
In this paper we analyze the impact hedging longevity risk can have on a pension fund’s funding ratio volatility and asset liability management (ALM) strategy. Our model captures all relevant aspects of the ALM problem and is calibrated to industry statistics; however, we’ve sacrificed model complexity to make the solution more intuitive and presentable. Our main conclusion is that hedging longevity risk creates an additional risk budget to be put towards more rewarding asset allocation strategies, thereby improving the overall ALM outcome of the modelled pension fund.
We show that at representative parameters for the risk and return on the balance sheet, and a range of realistic hedge prices, executing longevity hedges elevates the Efficient Frontier across all reasonable risk budgets. Therefore, implementing a longevity hedging strategy can improve the fund’s Sharpe Ratio and ALM outlook considerably. This is especially true for funds with a low risk budget, e.g. when the funding ratio is close to 105%.
Our results are consistent with earlier work on this topic by Cocco and Gomes (2012), who demonstrate the benefits of financial assets designed to hedge shocks to the survival probabilities in a life cycle model with longevity risk. Our analysis differs since we focus on the pension fund rather than the household balance sheet, use a more extensive model for the financial market, explicitly define the hedge instrument, and use market information on the pricing of longevity hedges.1
The remainder of the paper is organized as follows. First, we discuss how we jointly model longevity risk and investment risk stochastic framework. Second, we formulate the ALM problem of a pension fund in the context of our framework. Third, we discuss the impact of hedging

Pension Fund ALM with Longevity Hedging Can Longevity Hedging Help Pension Funds Improve Their Asset Liability ManagementQuarter 3 • 2019
25
longevity risk on the pension fund’s funding level volatility and the optimal asset allocation. Finally, we explain our conclusions and provide an outlook for future research.
Joint Stochastic Model for Longevity and Investment RiskThe mortality model chosen for this analysis is the Gaussian Makeham Model defined in Schrager (2006). The force of mortality of an x-year old, is modeled as an affine function of a 2-vector of stochastic processes,
follows an Ornstein-Uhlenbeck process (which is the continuous time equivalent of an AR(1)-process),
For simplicity we assume,
The -year survival probability of an -year old at time t in this model is given by,
The benefit of this model is that all mortality and survival probabilities are completely tractable. The analytical expressions for and can be found in (Schrager, 2006).
The best-estimate mortality path is implied by the expected value of the stochastic factor
Mortality trend risk is quantified by the application of a shock to the factor . We use these expressions to calibrate the model parameters to public mortality data published by the CBS.2,3 The results are displayed in Exhibits 1 and 2.
Life Expectancy 65 Year Unisex Current 2027 2037
CBS 2017 19.88 20.92 22.09
CBS 2017 90% quantile (*) - 22.18 23.87
Affine Makeham Model 19.88 20.94 22.01
Affine Makeham 90% - 21.83 24.13
Exhibit 1: Life expectancy of 60-year male from different mortality models. Both current and projected life expectancies in the Affine Makeham Model match the output of the two main Dutch mortality models closely. (*) 90% quantile is derived based on Gaussian distribution assumption for the life expectancy.
Parameter Value
α1 4.83e-7
α2 0.0150
θ1 0
ρ 0
σ1 1.52e-5
σ2 2.00e-8
c 1.13003
Y1(0) 3.79e-10
Y2(0) 2.48e-6
Exhibit 2: Parameters of the Affine Makeham Model.
The model gives a very satisfactory fit to the CBS data. We conclude the Affine Makeham Model at the fitted parameters provides a good representation of longevity risk over the long run. We will use these parameters to derive the volatility of an annuity in the next section.
We now turn to modelling the asset side of the balance sheet. Our model of the financial markets assumes the fund invests in three investment categories,
• “Return” investments: an optimized combination of equity, direct and indirect real estate, private equity and, hedge fund investments
• “Spread” investments: a fixed income portfolio optimized for credit risk and duration;
• “Safe” investments: a portfolio of high credit quality fixed income instruments and collateralized derivative positions optimized for interest rate risk management.
A duration gap, , between assets and liabilities is explicitly modeled with the yield of the duration strategy assumed to follow a Geometric Brownian Motion process with zero drift and volatility equal to . These asset classes follow correlated Geometric Brownian Motion processes, with drift vector and volatility matrix for the Return, Spread, Safe investments, and the (long-term) interest rate level respectively. Asset allocation is given by a weight vector
The market value of the assets can be described by the following equation,
Assumptions for the expected excess-return as well as the volatility of those excess-returns are in line with historical averages (return) and the correlation matrix, P , which is taken

26Pension Fund ALM with Longevity Hedging Can Longevity Hedging Help Pension Funds Improve Their Asset Liability Management
from the DNB (“De Nederlandsche Bank”, the Dutch regulator) standard model for pension funds.4 We also calibrate interest rate volatility to be in line with an absolute downward shock of 1.25%, as proposed by Noorman5 and assume this corresponds to a 1-in-50 scenario under a Gaussian distribution for interest rates:
. These assumptions are displayed in Exhibit 3.
Volatility & Correlation Volatility (*) Correlation
"Return" investment 20% 1 50% 0% 40%
"Spread" investment 8.5% 50% 1 0% 40%
"Safe" investment 0% 0% 0% 1 0%
Interest Rate 0.6378% 40% 40% 0% 1
Duration Gap 3 years - - - -
Exhibit 3a: Financial markets parameters. Volatility and correlation of main ALM drivers. (*) Volatility of “Return”, “Spread,” and “Safe” investment categories is measured relative to the market value of the liability.
With respect to sensitivity of the liabilities to inflation, we assume 0% indexation during the horizon of the ALM optimization given current indexation policies and low nominal funding levels of pension funds.
Expected Excess Return
"Return" investment 3.5%
"Spread" investments 2%
"Safe" investments 0%
Interest Rate (*) 0%
Exhibit 3b: Financial markets parameters. Expected excess return of different asset categories. (*) Interest Rate assumption shows the expected change in the value of the interest rate level. The interaction with the duration gap determines the impact on the return. We assume no expected change in the interest rate level.6
The ALM Problem of the Pension FundFor simplicity, we model the pension fund liability using a single model point consisting of a 60-year male with a constant pension benefit of 1 starting at age 60.
The pension liability at time t, for an individual that is x -year old at time zero, with a pension age of equals,
Where is the discount factor at time t for payment at time We assume a flat interest rate curve at 1% and the Affine Makeham parameters in Exhibit 2. Liability volatility due to longevity risk, , then equals 6.1% which is simplified using the “freezing of the weights” approximation.7,8
Liability duration at time , equals,
The pension fund’s funding level measures the degree to which the market value of the assets is expected to cover the liability,
Optimization without Longevity HedgeIn our joint model of longevity and investment risk the excess-return of the funding level without longevity hedging equals,
and the volatility of the funding level without longevity hedging equals,
the fund’s ALM problem can be formulated as the optimization of the return of the funding level subject to a risk-budget constraint,
Longevity Hedge InstrumentsDifferent types of longevity hedge instruments exist in the market for longevity risk. Simple quota-share reinsurance that hedges only longevity risk can be achieved by a longevity swap. Alternative covers exist, either in index or indemnity format, including finite stop-loss cover for the first-loss of the risk distribution, as well as finite or infinite tail-risk covers. Index-based hedges reference general population mortality rates (e.g., those published by the Central Bureau of Statistics, CBS, in The

Pension Fund ALM with Longevity Hedging Can Longevity Hedging Help Pension Funds Improve Their Asset Liability ManagementQuarter 3 • 2019
27
Netherlands) and therefore include some elements of basis risk. Indemnity contracts, such as the longevity swap which we use as a hedge instrument in our analysis below, reference actual portfolio cash-flows, and hence contain no basis risk.10
Longevity swaps feature a pre-agreed stream of cash-flows paid by the hedger to the risk taker representing the expected pension payments plus an additional premium charge (usually expressed as a percentage of the expected payments). In return, the risk taker agrees to pay the hedger the actual total pension benefits it ultimately pays to the pensioners. See Exhibit 4.
The payments between the hedger and risk taker are typically netted on a monthly basis so that a smaller amount of cash is exchanged, and only in one direction. If longevity turns out exactly as expected, then only the fixed premium charge would be paid.
In our analysis we use a longevity swap as the hedge instrument for simplicity, and assume a premium range of which is consistent with observed market prices. In practice, the price depends on the specific pension fund mortality risk experience, market dynamics, and the Terms & Conditions of the swap contract. The optimal choice of hedge instrument will be explored further in a future publication.
Optimization with Longevity HedgeThe longevity swap premium, , is a percentage of the expected liability cash-flow each year. Given a liability duration, , the average impact on the fund’s return from hedging a proportion, of the longevity exposure is .
Hedging a portion of the fund’s longevity risk using a longevity swap changes the expressions for the funding level return and volatility to,
The optimization problem now contains an additional decision variable but is the same in principle,
Exhibit 4: Structural diagram of longevity swap. A collateral arrangement is usually part of the contract.
Impact of Hedging Longevity Risk on a Pension Fund's ALMIn this section we present and discuss the results of the optimization problem at representative parameters. Whereas the previous section introduced the optimization problem with a generic hedge ratio , in this section we simplify by determining the Efficient Frontier assuming no hedging and full hedging .
In practice, selective hedging is possible (either in terms of instrument, risk-layer, sub-portfolio, and hedge ratio) which should further extend the potential impact of longevity hedging on the pension fund’s ALM. Before explaining the results of the optimization, we display some of the risk-return outcomes from our model under the asset allocations defined in Exhibit 5 on the next page.
The results in the third and the last column of Exhibit 5 show that hedging longevity risk significantly reduces funding ratio volatility at a given asset allocation thereby reducing the worst-case outcome. We propose that the reduction in volatility created by the hedge allows for a higher allocation to Return or Spread assets, thereby achieving higher total returns at the same level of overall risk. Hedging is therefore expected to generally improve the Sharpe Ratio because risk is hedged at a cost that is lower than the available risk-return in the market.
Considering the impact of the hedge’s cost on expected return, a 5% swap premium (as a percentage of the liability) should be divided by duration to derive an annual cost of hedging. In the optimization process, this annual cost is measured against extra return that can be achieved, per unit of risk, by investing in risky assets. The resulting cost of hedging is therefore 5% / 20 year duration = 25bps on the liability. It is important to then determine how much the risk budget increases due to the longevity hedge, and what is the resulting improvement in the overall return of the portfolio.
In Exhibit 6a we display the result of the ALM problem (i.e., the Efficient Frontier) in terms of funding level volatility, given a defined risk budget. We compare the Efficient Frontier with and without hedging. In Exhibit 6b we display the same results at a higher duration gap, and witness that introducing more risk in the balance sheet slightly mutes the effect of longevity hedging, however the benefits are still present.

28Pension Fund ALM with Longevity Hedging Can Longevity Hedging Help Pension Funds Improve Their Asset Liability Management
Asset Allocation Funding Ratio Excess Return Funding Ratio Volatility Funding Ratio Sharpe-
Ratio1-Yr 99.5% - VaR
Scenario F(0) = 110%
Risk Minimization, 100% Safe Investments 0.00% 6.4% 0.0 93.5%
Return Maximization, 100% Return Investments
3.50% 21.7% 15.6 54.1%
Equal Weights, 33.3% in each Asset Class, No Hedging H=0
1.83% 11.3% 16.3 81.0%
Equal Weights, 33.3% in each Asset Class, Full Hedging H=100%
1.58% 9.5% 16.7 85.6%
Traditional Allocation Weights, 20% Return, 30% Spread, No Hedging H=0
1.30% 9.2% 14.2 86.4%
Traditional Allocation Weights, 20% Return, 30% Spread, Full Hedging H=1
1.05% 6.8% 15.4 92.5%
Exhibit 5: Numerical results for example allocation rules. Hedging reduces return but also risk, eventually increasing Sharpe Ratio for a simple equal weight strategy and a traditional allocation strategy.
Exhibit 6a: Efficient Frontier (optimal asset allocation given a volatility budget) for a pension fund with and without longevity hedge. Parameters are taken from Exhibits 2 and 3. Introducing a longevity hedge significantly improves the optimal return outcome. This can be further improved by allowing for optimization over the hedge ratio.
Exhibit 6b: Efficient Frontier with and without longevity hedge. Duration gap is increased to 5 years. Introducing a longevity hedge still improves the optimal return outcome. Although the impact is less pronounced than in exhibit 6a. A lower longevity hedge premium makes the impact of hedging more pronounced.
0.0%
1.0%
2.0%
3.0%
7 % 9 % 1 1 % 1 3 % 1 5 %FUND
ING
LEVE
L RET
URN
FUNDING LEVEL VOLATILITY BUDGET
EFF I CI ENT FRONTI ER
No hedge Hedge 5% Hedge 3%
0.0%
1.0%
2.0%
3.0%
7 % 9 % 1 1 % 1 3 % 1 5 %FUND
ING
LEVE
L RET
URN
FUNDING LEVEL VOLATILITY BUDGET
EFF I CI ENT FRONTI ER
No hedge Hedge 5% Hedge 3%

Pension Fund ALM with Longevity Hedging Can Longevity Hedging Help Pension Funds Improve Their Asset Liability ManagementQuarter 3 • 2019
29
It is clear from both graphs the introduction of longevity hedging has a positive impact on the Efficient Frontier as it improves the optimal expected return at a given level of risk. We show the results under a premium charge ranging from 3% to 5%. As would be expected, a change in the longevity swap premium shifts the Efficient Frontier in a parallel way.
In both scenarios, there is very interesting potential for improvement where the risk budget is limited. Without longevity hedge the minimum risk level the fund can achieve equals . This implies full allocation to Safe (i.e. high-quality duration matching) investments. However, this doesn’t make sense as a Strategic Asset Allocation because it destroys the return potential of the fund.
With a longevity hedge in place the fund can achieve the same amount of risk with a much higher expected return. This implies that hedging longevity risk should be an interesting option to include in ALM studies of funds that have limited buffers, since their risk budget should be limited.
Exhibit 7 shows the optimal asset allocation, with and without longevity hedges, at different levels of risk budget.
We see that the shift to more risky assets is reasonably pronounced, especially at lower risk budgets. However, the shift to more risky assets doesn’t imply a widening of the duration gap as the interest rate gap strategy is not affected by the shift in optimal asset allocation.
When a pension fund needs to reduce its funding level volatility it now has two options. The traditional choice for most pension funds is to reduce the exposure in risky assets, i.e. reduce the volatility of the numerator of the funding ratio. Although this reduces the funding level volatility, it also reduces the investment return potential of the investment portfolio. The other choice is to reduce the volatility in the denominator of the funding ratio, by reducing the exposure to longevity risk. This second alternative leaves the investment return intact, which enhances the recovery potential for pension funds.
Without Hedge With Hedge
Allocation / Vol budget 7.5% 10% 12% 7.5% 10% 12%
"Return" Investment 4% 33% 47% 28% 41% 51%
"Spread" Investments 19% 6% 2% 9% 16% 20%
"Safe" Investments 77% 61% 51% 63% 43% 29%
Exhibit 7: Optimal asset allocation given a risk budget, with and without logevity hedge.
ConclusionWe’ve analyzed a pension fund’s ALM optimization including the introduction of longevity risk hedges in a stylized model of the balance sheet. We conclude that, at representative parameters, hedging longevity risk enables a pension fund to allocate a higher proportion of return seeking assets, thereby improving the Sharpe Ratio for a given risk budget. This outcome is not impacted by the duration gap or the price of hedging.
The following avenues for future analysis are envisioned:
1. We can apply the same approach of creating risk-budget through longevity hedging to life-cycle funds. Currently, life-cycle funds in defined contribution schemes apply allocation rules to traditional asset classes like fixed-income and equity, however, this grossly overlooks the pensioner’s needs to manage the risks of living longer than expected, and hence requiring additional income. We plan to analyze the problem of optimal asset allocation on a fixed horizon (with the horizon linked to the desired retirement age), based on an updated liability definition of an individual accumulating assets for retirement, in a pure risk/return framework.
2. The model in this paper is purposefully simplistic because the focus is on concepts. Future work could allow for parameter uncertainty in the asset returns, a more sophisticated measure of downward risk and more sophisticated stochastic modelling of the assets and liabilities.
3. Analyze the inconsistency of the market price of risk implied by index-based hedges and observed indemnity longevity swap quotes.

30Pension Fund ALM with Longevity Hedging Can Longevity Hedging Help Pension Funds Improve Their Asset Liability Management
Endnotes1. Cocco, J.F. and Gomes F.J. (2012) “Longevity Risk,
Retirement Savings, and Financial Innovation,” Journal of Financial Economics, vol. 103, pp. 507-529.
2. CBS, Prognose levensverwachting 65 jarigen, https://www.cbs.nl/nl-nl/nieuws/2018/44/prognose-levensverwachting-65-jarigen.
3. CBS, Sterfte kansen en levensverwachting 2017 (18 mei 2018), www.statline.cbs.nl.
4. DNB, Standaard model voor Pensioenfondsen, www.toezicht.dnb.nl.
5. Noorman, J. (2018) Pensioen: De casus voor een andere berekening van het renterisico, https://www.iexprofs.nl/Column/285943/dekkingsgraad/Pensioen-De-casus-voor-een-andere-berekening-van-het-renterisico.aspx.
6. Our problem can also be formulated as a robust optimization problem to reflect uncertainty in the expected return parameters. See, Hansen, L. and Sargent, T. (2007) Robustness, Princeton University Press Princeton, NJ.
7. Brace, A. and Womersley, R. (2000) “Exact Fit to the Swaption Volatility Matrix using Semi-definite Programming,” ICBI Global Derivatives Conference, Paris.
8. Schrager, D.F. and Pelsser, A.A.J. (2006) "Pricing Swaptions and Coupon Bond Options in Affine Term Structure Models," Mathematical Finance, vol. 16, pp. 673-694.
9. Hansen, L. and Sargent, T. (2007) Robustness, Princeton University Press Princeton, NJ.
10. Michaelson, A.T. and Mulholland J. (2014) “Strategy for Increasing the Global Capacity for Longevity Risk Transfer,” The Journal of Alternative Investments, vol. 17-1.
David Schrager, PhD Longitude Solutions
David Schrager (Senior Partner at Longitude Solutions) has extensive experience in balance sheet management and structuring (longevity) hedge solutions for insurance and pension products. David held positions in both insurance and banking at ING, ABN Amro and NN Group and worked in culturally diverse teams for most of his
career. David, in his previous role as head of pricing & hedging at NN Life, executed the second largest pension buy-out in the Netherlands in 2015 (ENCI) and the first Index-based Longevity Swap by NN Group in 2017. He was responsible for setting up internal models for valuation of complex insurance liabilities and economic capital, (longevity) hedge programs, pricing and structuring of pension buy-outs and has been involved in many strategic de-risking projects including M&A. David holds a Ph. D. in quantitative economics from the University of Amsterdam. Major contributions of the thesis focus on analytical solutions for complex stochastic problems in valuation and capital modelling.
Author Bio

Tokenizing Real Assets
Jeroen van Oerle Robeco
Tokenizing Real AssetsQuarter 3 • 2019
31
By now, Bitcoin and blockchain have become household words. Although many people mistakenly assume that they are synonyms, Bitcoin is merely an example of one of the first applications of blockchain technology.
The tokenization of real assets is another one. It potentially expands the investible universe for asset managers. It also increases liquidity of real assets that are currently considered to be illiquid and out of reach for most retail investors.
Bitcoin, which can be used to make payments, was the first application to be administered on a blockchain infrastructure.
Bitcoin Is Not the Same as Blockchain Back in 2016, the whitepaper entitled: “Distributed Ledger Technology for the Financial Industry” was released (Robeco, 2016). Since then, blockchain technology has come a long way. What started as an anarchistic attempt to remove financial institutions from the payments ecosystem, is now one of the biggest opportunities for substantial efficiency gains and new products/services, reaching far beyond the financial services industry. To some, the difference between Bitcoin and blockchain is still unclear. By using the internet as an analogy below, we attempt to explain the differences.

32Tokenizing Real Assets
Bitcoin is to Blockchain what Outlook is to Internet Blockchain is essentially a layer of infrastructure. It comprises many nodes, networks and interconnections that form the basis for administering, updating, and safeguarding the information that has been stored in what is essentially a big spreadsheet. The first application of the internet was email. The nodes and interconnections were used to send messages based on that infrastructure layer. The so-called payment coins were the first application of the blockchain infrastructure. These coins can be used to facilitate online payments, just as the name suggests. An example of an email provider is Outlook, and an example of a payment coin is Bitcoin. Besides Outlook there are many other email providers. There are also many other payment coin providers (over 2000 to be exact) besides Bitcoin. So when we talk about Bitcoin, it is an example of an application of distributed ledger technology, as well as being the first. Besides sending emails, the internet is also used for e-commerce, social media and many other things. Blockchain infrastructure can also be used for many other things besides making payments. Real asset tokenization is one of those alternative uses that could potentially have a big impact on the asset management industry.
The Impact of Electronic Trading Has been Big When trading migrated from physical to electronic marketplaces, many things changed.1 Trading costs came down substantially because much of the paperwork was replaced by electronic record keeping. Access to global markets improved because the physical location no longer mattered. Information asymmetry was reduced substantially because the flow of information was also electronic instead of physical. Liquidity increased because the facilitation of buy-and-sell orders had improved. And finally, an automated trading system − now known as algorithmic trading – was developed on that infrastructure. One outcome of this system is that it enables high-frequency trading.
Electronic Trading was First Developed for the Most Standardized Forms of Contracts
Examples of such contracts are commodity trading futures. Further down the road, it migrated to company shares and bonds. So far, it has had less effect on heterogeneous/real assets. Trading in paintings, real estate, private companies and many other illiquid real assets is still physical and not electronic or fractional.
Buying a share is not the same as buying an entire company. Buying a commodity futures contract is not the same as buying that commodity. And yet, for many real assets the buying or selling is binary. Either you own the entire asset, or you don’t. This is where tokenization of real assets comes in. Around 40 years ago, the term IPO (initial public offering) was used for the first time and now, it’s a well-known principle. In 2013 the ICO (initial coin offering) was introduced and it may also become as commonplace as the IPO over the next decade.
Tokenization as the Next Step in Electronic Trading In a nutshell, tokenization involves converting the partial or full ownership rights to an asset into a digital representation in the form of a token that is stored and administered on the blockchain. For example, you could opt to tokenize a percentage ownership of ‘The scream’ by Edvard Munch, which was valued at USD 120 mln at Sotheby’s in New York in 2012. The fractional ownership of this painting could be translated into one million tokens issued at USD 120, administered on a blockchain and traded on a token exchange. Given that the price of USD 120 mln dates back to 2012, it is likely that if the painting were sold today in an open market where it is possible to own a fractional share of it, a new market value would be established by agents going long or short on the token.
Using Technology to Create Liquid Markets Technological progress facilitated the migration of the physical trading of a few asset classes to an electronic ecosystem. The Nasdaq was the earliest example of this. Blockchain infrastructure can facilitate the next step of automated electronic trading for a wide variety of asset classes, potentially opening up USD256 trillion in real assets.
The Tokenization via Blockchain Adds Efficiency The tokenization process via a blockchain is more efficient than the current trading methods and it adds a global dimension to asset tradability. Auction houses charge fees of between 12% and 25%, while art gallery fees typically range between 6% and 10%. The fees charged by the first tokenized art broker − Maecenas − range from 2% to 6%. The arrival of new participants and a more transparent market are likely to push those fees down to just a fraction of these percentages. In some jurisdictions, there is already a legal framework for investor protection in place. There are insurance companies that insure tokenized paintings, art experts who validate the legitimacy of the artwork by issuing certificates and law firms that manage the token ownership process. All the administration is documented on a blockchain and executed through smart contracts. The benefits that we have seen in the rolling out of electronic trading in equities and fixed income products, may soon apply to real assets, too.
Tokenizing the Income-Generating Real Estate Creating liquid markets by tokenizing assets without an income stream (like paintings) is arguably harder than tokenizing income-generating assets like rent-generating real estate. In such cases, the token would come down to owning a share in the rent-income pool in addition to the underlying asset. In 2018, a USD 30 million luxury condo development project in Manhattan was tokenized on the Ethereum blockchain. Investors could buy the digital tokens, thereby financing the project and receiving a right to the underlying revenue-pool of the property. In this transaction, multiple participants came together to determine the price of the development project and the market price for the tokens that provide access to it. Ownership is administered on the Ethereum blockchain and smart contracts (a kind of automation software) handle the distribution of the rent income amongst token holders.

Tokenizing Real AssetsQuarter 3 • 2019
33
Deciding if a Token Price is a Fair Representation of the Income Yield Instead of deciding whether or not to buy an entire property, investors now have to determine if the price they would pay for a token is a fair representation of the income yield of the underlying property and the possibility of an increase in the asset’s value. Some investors will hold large stakes in the building, while others only own small ones. Some investors will want to diversify by owning small stakes in properties in various cities across the world, while others will set their sights on a particular local market and seek exposure to it in the form of direct token stakes. When the token is sold, merely the ownership of the token is transferred, not the entire underlying asset, as is the case with stock trading.
Tokenizing Intangible Assets Apart from tangible assets, investing in intangible assets such as copyrights, film-production rights, royalties, actors, etc., will also be possible. The methodology would be the same as with other real assets. The value of the token would depend on that of the underlying asset. Financing a film production could, for example, be done by tokenizing the production rights. Depending on whether or not it’s a success, the proceeds would be re-distributed amongst the token holders. Token analysts would have to estimate future income streams and discount those in a model in order to arrive at a fair value for the token. Depending on the heterogeneity of those estimates, trading occurs.
Establishing Functioning Markets by Creating Arbitrage Opportunities
In order to establish a fair value through arbitrage possibilities that resemble structured finance solutions, the two-token waterfall framework by Lippiatt and Oved (September 2018) can be used. See Exhibit 1, in this setting, the real asset is transferred to two separate tokens. One is senior in priority of payment, and it replicates debt. The other − junior in priority − replicates equity. In order to prevent arbitrage opportunities, the token value of both tokens must translate into the same real asset value. This would create a liquid market where the digital tokens are traded frequently.
Tokenizing Liquid Assets We have discussed above the benefits of the tokenization of illiquid assets. It is important to note that the same technology can be applied to equities and bonds. Regulators around the world are starting to develop regulatory frameworks that treat equity and bond tokens in the same way as regular equities and bonds. This implies that there are regulations to protect investors and reporting requirements, just as there are for traditional listed companies. But this begs the question as to why people would invest in tokens and not in the mainstream equities. The key reason has to do with the infrastructure’s efficiency, besides the advantage of direct cash settlement when the tokens are accompanied by digital currency. Fractional share ownership can also be beneficial for portfolio optimization reasons. Finally, the costs of creating active markets in the underlying company assets are likely to be much lower than those of traditional exchanges. We believe the added value of tokenizing liquid assets is currently
Exhibit 1: The Two-Token Waterfall Source: Lipiatt, Oved, 2018
rather limited, simply because the existing infrastructure is relatively efficient compared to market dynamics of real assets. We think that once the benefits of tokenization become clear and observable in the case of real assets, there could be a transition to a similar infrastructure for liquid assets. However, we expect that process to be gradual.
Tokenization is not the Same as Securitization When researching the benefits of tokenization, some people will see parallels with securitization, which also aims to bring liquidity to illiquid assets. Unfortunately, we have seen what the consequences of securitization can be when parts of a packaged product start to deteriorate without knowing the exact impact on the overall portfolio. The securitization of mortgage-backed securities brought liquidity, but the underlying exposure in the repackaged products could not be traced. Tokenization solves this, as there is always a link with the underlying asset. Still, the repackaging of products to create more liquidity remains possible, but in this case the underlying exposure is clear to everyone and it can be diversified at one’s own convenience, without having to rely on the services of third parties.
Effects of Tokenization on Asset Management Although tokenization is not yet widely available and has not become common practice, it is likely that over the coming decade more will be done to make this happen. Financial institutions will need to redefine their activities. This will open up new business opportunities in the area of custody, the safekeeping of real assets, token advising and token investing. The impact on the asset management industry is likely to be considerable. To start, portfolio construction would look different. One’s investible

34Tokenizing Real Assets
universe would expand from being based solely on equities or bonds. The difference between listed and unlisted equities or bonds would cease to exist, thus increasing the opportunity set for portfolio construction.
Opportunity to Add Real Assets to Pension Fund Portfolios There may no longer be a need to construct pension portfolios based on just a mix of equities and bonds, because diversification into real assets will become important as well. Irrespective of the possibilities to accomplish such portfolio construction for pensions today, this is not yet within reach for individuals. The shift from defined benefit to defined contribution pensions increases the need for diversification on a retail investor level. For some larger financial institutions, like pension funds, the prospect of removing illiquidity might not be appealing, since these institutions benefit from the illiquidity premium. However, tokenization democratizes access to real assets and thereby caters to a different group of investors than it has done historically.
We think that in this new era, asset managers will still serve an important function. It is hard for non-professional investors to have a good overview of all investible opportunities. Algorithms can help a lot, but fundamental research and views are becoming more important than ever. Determining what price to pay versus the value the investor gets is the core task of active management, and the importance of that task will increase. However, this also implies that asset managers would need to invest in new capabilities. Direct real estate experts, art experts, patent experts and many more would be needed in order to determine the value of the underlying asset, compare it to the market price and ultimately make an informed investment decision.
Increasing the Investible Opportunity Set The impact on theoretical asset pricing would also be profound, as the Capital Asset Pricing Model (CAPM) − which includes all assets rather than just the smaller universe of liquid assets − will be expanded by a new investible opportunity set. This would have an impact on the relative risk of equity and bonds versus the opportunity set, and would therefore affect valuations, as well, by means of the discount rate adjustment. At the moment, the efficient frontier takes into account equities, bonds, REITS and in some cases, commodities. Real assets like paintings, direct real estate or movie rights are not yet included. The reason for this is simple: there is no up-to-date pricing data and so it is impossible to include these real assets. Once they are tokenized, an active market emerges. It is transparent and can be integrated in the opportunity set, thereby shifting the efficient frontier leftwards (see Exhibit 2).
Consequences of Tokenization for Active Management in Equities
Currently, a choice must be made between building a long-only strategy or a long-short version of a listed equity. The efficient frontier would include various sets of a listed equity with their own expected return and volatility profiles. In the case of tokenized private company assets, the opportunity set would expand beyond listed equity into private companies, which by then will not be considered private companies anymore because
Expe
cted
retu
rn
Volatility (standard deviation)
Risk free investment
MV
Tangent portfolio
Capital market line. Efficient frontier of all available assets including risk free investment
Efficient frontier of all available assets, including tokenized real assets
Efficient frontier of domestic stocks
Efficient frontier of global stocks, bonds, REITS
Exhibit 2: Efficient Frontier Including Tokenized Real Assets Source: Robeco Trends Investing
of the fact that company representations in the form of tokens will have become public. However, the current dynamics in terms of the risk/return profile differ a great deal between these two worlds. That is why venture capital and private equity investment strategies differ from those of actively-managed listed equity managers. If those worlds were to converge, the skill set and investment process would have to change as well.
Challenges to Overcome Before tokenization can become the new normal in asset management, a couple of important hurdles need to be taken. Our expectation is that the roll-out will first take place in specific real asset class categories, like real-estate and arts. That experience can serve as a blueprint for other asset categories once proven beneficial.
Issues to be Resolved Although we have described some clear advantages of tokenization, there are also many obstacles that need to be overcome going forward. We attempt to categorize some of them by looking at the token itself, the underlying asset and the regulatory requirements. The list is by no means exhaustive, and it includes some practical considerations, in addition to the opportunities discussed above.
Hurdles Related to the Token
Exhibit 3 lists some of the hurdles that may come to mind in relation to tokens. The most important consideration here is the issue of ownership and its link with the underlying asset. Do the tokens confer ownership rights and voting rights, for instance? What is the legal protection with regard to those rights in terms of regulatory enforcement? The link to the underlying asset is also critical. Once that link is broken, it undermines the value of the token. Responsibilities need to be defined, as well.
Hurdles Related to the Asset In Exhibit 4 we discuss some of the hurdles that are related to the underlying asset. In this case, too, the ownership rights are an important topic. If an investor owns 51% of the tokens, is he/she the legal owner of the asset? Can he/she decide to change,

Tokenizing Real AssetsQuarter 3 • 2019
35
Exhibit 3: Token Hurdles Source: Robeco Trends Investing
relocate, re-tokenize the asset? In most of the cases we have seen so far, only a minority stake of the underlying asset has been tokenized. But theoretically an art collector could double his collection by investing in tokenized assets and owning 51% of the tokens instead of having to own the entire asset. For shares, there are certain rules that apply in such cases. They also cover full ownership and the right to buy out minority stakes. These rules will need to be implemented in the token space, as well. Besides ownership rights, the underlying assets must be maintained. Paintings, real-estate and classic cars all require regular maintenance in order to protect both the asset and its value. One could charge a fee that is deducted from the token value, like the share class fee deducted from the NAV for funds. Those fees can then be used to pay for maintenance and storage costs, but
Exhibit 4: Asset Hurdles Source: Robeco Trends Investing
that process needs to be formalized and unified across real asset tokens.
Hurdles with Respect to Regulation Exhibit 5 illustrates some of the regulatory hurdles. Even if token- and asset-related hurdles are resolved by service providers, it is still not clear how the regulators would react to the token offering. First, regional standards are disappearing, because tokens are global in nature. Therefore, global cooperation among regulators would be required, and this process would take years to complete. Global cooperation is possible − as we have seen in the case of accounting standards that have migrated over the last several years − but this is not easily achieved. What makes it particularly difficult is the fact that tokenization is a highly technical topic

36Tokenizing Real Assets
that is often misunderstood by regulators given that they do not always have the required skill set to make a full assessment and to conduct oversight.
In addition, the tax authorities would have to find a way to enable uniform treatment of tokens. The ‘Big 4’ accounting firms already started making an assessment of the tax treatment of tokens. Given the virtual and global nature of tokens, it should not be hard to optimize regulatory and tax arbitrage for token holders. As we have seen in the case of cryptocurrencies, simply forbidding ownership would not work. Therefore, a more proactive approach would be required in order to create regulatory frameworks that are comparable to equities and bonds. They should be capable of providing consumer protection on the one hand, and freedom of capital on the other.
Conclusion Real asset tokenization is an interesting innovation that follows in the footsteps of the introduction of blockchain technology in 2009. There are many potential benefits of tokenizing real assets. It would improve liquidity, expand the investible universe and create fractional ownership that provides options for better portfolio optimization. These benefits are not offered by the existing infrastructure – due to the local characteristics of the alternatives currently on offer and the inefficiencies related to those technological solutions. However, there are many hurdles that need to be cleared in order for tokens to become mainstream investment vehicles like the ones we are familiar with today. We expect to see experimental use cases in the near future, with companies pushing the boundaries of the existing regulatory frameworks. This would enable the development of new rules, which, once successful, could be globalized and expanded into other asset categories.
Although it is still in its infancy, we think tokenization would be beneficial for exchanges. There are several exchanges today that are investing heavily in blockchain technology. They do it in order to facilitate trade in private companies and alternative assets. This might create challenges for brokers and
Exhibit 5: Regulatory Hurdles Source: Robeco Trends Investing
Endnote 1. Maniam, Cross, Electronic Trading and Financial Markets,
2003.
Jeroen van Oerle, CFA Global Fintech Equities
Jeroen van Oerle is Portfolio Manager Global Fintech Equities and a member of the Trends Equities team. Furthermore, he researches multiple investment related trends with a focus on the financial sector. Jeroen joined Robeco in 2013 as Portfolio Manager Equities. He holds a Master’s in
Financial Economics from Erasmus University Rotterdam. He is a CFA® charterholder.
Author Bio
investment intermediaries. The distribution model would change substantially, and the global character of token exchanges and token brokerage services would mean some of the current models would have to be adapted in order to remain relevant.

Factor Investing in the China A-Share Market: Revelations from a Contextual Alpha ModelRohit Shrivastava PanAgora
Jaime H. Lee PanAgora
George D. Mussalli PanAgora
Factor Investing in the China A-Share Market: Revelations from a Contextual Alpha ModelQuarter 3 • 2019
37
Due to its unique nature, capricious investment landscape and burdensome regulatory requirements, equity investment in the China A-share market has proven to be difficult to navigate. For quantitative investors who prefer to invest in a diversified, liquid investment strategy and need easy access to market, data and information, building a strategy for China A-shares has been a formidable task.
Through this paper we seek to simplify this perception. We find that with ongoing market reforms, the China A-share market is relatively more accessible to investors than it has previously been. Our research indicates that both market and fundamental data on the China A-share market are readily available and predictive of future returns. As compared to developed and emerging markets, the China A-share market offers a unique investment landscape and compelling risk/return opportunities. Our research also indicates that developing and implementing a successful active equity investment strategy in the China A-share market requires a strong grasp of the market and its history, an understanding of the collectivist investor behavior, and an in-depth knowledge of the scope and scale of government regulations, market-interventions, and China’s corporate governance structures.
The foregoing quirks in the China A-share market change the behavior of several quantitative factors versus their observed characteristics in the rest of the world. Interestingly, we found that valuation-based factors work well due to overcrowded growth stocks, while pure price momentum does not appear to work well, likely due to collectivist investor behavior. Additionally, firm quality and profitability appear to have a muted but positive impact on performance due to what is arguably a less developed investment landscape. Accrual-based measures seem to work well due to

38Factor Investing in the China A-Share Market: Revelations from a Contextual Alpha Model
investor behavior and structural imperfections introduced in the market by the government, while sentiment-based factors have performed strongly and appear statistically independent of other factors.
Leveraging PanAgora’s unique insights into the China A-share market, its decades of experience in alpha signal research and its proprietary contextual alpha modelling framework,1 we have built a diversified, long-term active equity investment strategy focused on the China A-share market. We have found that our strategy has performed well in different market regimes. As we have observed in developed and emerging markets, a quantitative contextual alpha modelling technique can be utilized to harness better long-term performance versus a “one-size-fits-all”2 approach in the China A-share market.
Market IntroductionChina is the world’s second largest and second most liquid equity market after the United States. With greater than $8 trillion3 in market capitalization, China is an economic superpower to be reckoned with. The country has experienced aggressive economic growth and industrialization over the past several years and holds the title of the world’s greatest contributor to economic growth4,5 and largest investor (Carpenter, Lu, and Whitelaw - March 2015). Given this, it is almost a surprise that China’s equity markets are relatively new, having been established less than three decades ago.
0%
2%
4%
6%
8%
10%
12%
China Emerging Europe G7 Japan UnitedStates
World
Real GDP Growth Rate (Annual Percent Change, 1991-2018)
Exhibit 1 Source: International Monetary FundPrivatizing ChinaModern Chinese stock markets opened in 1990 in Shanghai and Shenzhen as part of state-sponsored economic reforms to provide complementary sources of funding to China’s state-owned enterprises (SOEs). China’s stock market, until recently, was a sideshow in a financial system dominated by a $30 trillion banking system which finances centrally planned investment (Allen, Qian, and Qian – 2005).
As its policy indicates, the Chinese financial system will continue to be dominated by a strong banking sector. Still, the stock market has grown to have a significant impact on the economy. Going forward, we expect Chinese stock markets to serve as key entry points for domestic retail and corporate investors, the exit point for private equity investments, and a principal source of entry for
foreign investors. As Chinese stock markets become more efficient and transparent, they will undoubtedly continue to play a bigger role in the second largest economy in the world.
Given the sociopolitical landscape in China, it is no surprise that the stock markets are heavily regulated. Since becoming the chief regulator of Chinese markets in 1997, the China Securities Regulatory Commission (CSRC) has enjoyed broad authority in regulating, and, from time to time, intervening in Chinese equity markets to attain state-directed policy objectives.
Interestingly, only a third of SOE shares were tradable until 2005. This was due to the Split-Share Structure (SSS) model of firm ownership which was created by the Chinese state in order to maintain a controlling stake in the SOEs. Central or local governments owned non-tradable stocks, while private investors held tradable shares. This dual structure created agency problems since the state had all the reserved rights for non-tradable shares but was not exposed to any market risks. Moreover, SOE executives received rewards based on the book value of assets rather than the market price of the shares. This meant that they had no incentive to maximize stock price or add value to private investors’ stakes (He, Mukherjee, and Baker – 2017). In 2005, Split-Share-Structure reform converted a majority of non-tradable shares to tradable shares. This reform made two things possible: it aligned government and private shareholders’ interests toward the common goal of maximizing firm value, and it aligned the government-appointed SOE executives' performance directly with the SOE’s market performance. These reforms made Chinese equity markets relatively more transparent and were a key initial step to privatizing China. As of the end of 2016, around 76% of total market capitalization was tradable. As of the end of 2017, the China A-share market had 3,500 listed firms with north of $8.26 trillion6 of aggregate market capitalization.
As the Chinese stock markets have evolved over the years, the China A-share market has experienced repeated trading halts, market interventions, and IPO suspensions. Markets have been historically dominated by domestic retail investors and to protect the economic interests of its citizens, the government regularly applies regulatory interventions. In the past, the markets were referred to as casinos, exhibiting high levels of volatility and crowding behavior. Carpenter et al. (2015) found that even with these historical deleterious characteristics, the good news is that after the economic reforms undertaken a decade ago the Chinese stock market has become as informative about future corporate profits as in the US. Also, even though it is a segmented market, Chinese investors price risk and other stock characteristics like investors in other large economies.
Exchanges and ListingsChinese firms incorporated in mainland China have to go through a stringent listing approval process by the CSRC. These firms have an option to list as an A-share or a B-share in either the Shanghai (SSE) or Shenzhen (SZSE) exchanges. They can also list as an H-share on the Stock Exchange of Hong Kong (SEHK). Companies avoid the stringent regulations of mainland China by incorporating externally and list as either red chips on SEHK, as N-chips in the US, as S-shares in Singapore, or as L-shares in the London LSE. Larger, more mature firms list on SSE and SZSE main boards. Smaller, more growth-oriented firms tend to list

Factor Investing in the China A-Share Market: Revelations from a Contextual Alpha ModelQuarter 3 • 2019
39
with less exacting listing requirements on the SME or ChiNext boards, which are relatively newer entries on the SZSE. One key requirement for A-share listing is that China does not allow different classes of shares with different voting power, another reason why many firms may choose to list outside of China. The CSRC recently launched a new Chinese Depositary Receipt (CDR) program, which should make it easier for externally listed Chinese firms like Alibaba to list on the China A-share market for domestic investors.
The CSRC mandates that if the listed firm has three years of consecutive losses, it receives “Special Treatment” status.7 Further losses in following years can lead to stock suspensions and subsequent delisting. This rule can encourage firms to significantly manipulate earnings. Firms can also receive “Special Treatment” status due to other reasons, such as product-related issues. The CSRC recently revised delisting guidelines to make it clear that companies that have significant legal issues involving national security, public safety, ecological safety, production safety and public health will be forced to suspend shares or delist. Fraudulent listing and violations regarding key information releases will also trigger forced share suspension or delisting. For asset managers investing in China, this is a very important consideration in identifying a reliable investable universe given that their capital is at risk if companies get flagged and suspended.
Evolving Foreign Participation LandscapeChina accounts for 8-10% of the world’s aggregate total market capitalization.8 However, due to government controls, foreign investor participation in Chinese stock markets has been largely restricted. Quotas, products, accounts, and fund conversions are strictly monitored and regulated. Until 2001, A-shares could only be bought by domestic Chinese investors, while foreign investors could only own B-shares.
To attract a greater number of global investors, the Qualified Foreign Institutional Investors (QFII) program was introduced in 2002. This program significantly decreased B-share issuance. In 2011, to further ease foreign participation, the RMB Qualified Foreign Institutional Investor (RQFII) scheme was initiated. The RQFII program allowed for use of RMB funds raised in
0
500
1000
1500
2000
2500
3000
3500
4000
1990
1991
1992
1993
1994
1995
1996
1997
1998
1999
2000
2001
2002
2003
2004
2005
2006
2007
2008
2009
2010
2011
2012
2013
2014
2015
2016
2017
2018
Listed Securities
SSE SZSE Main Board Chi Next SME
Exhibit 2 Source: Wind
Hong Kong by the subsidiaries of domestic fund management companies and securities companies domiciled in Hong Kong to invest in the domestic securities market. Both the QFII and the RQFII programs were very restrictive in terms of lockup periods and quotas, and were subject to strong capital controls. Investment quotas for both programs were approved by China’s State Administration of Foreign Exchange (SAFE). In early 2016, SAFE further relaxed QFII rules to make it easier for foreign participants.
Foreign investments in the A-share market got another significant boost with the introduction of the Hong Kong-Shanghai and Hong Kong-Shenzhen Connect programs in 2014 and 2016, respectively. These programs allowed offshore investors to trade A-shares on the Shanghai and Shenzhen exchanges via the Hong Kong exchange. These programs drove the inclusion of A-shares in the MSCI Emerging Markets Index in June 2018 and currently allow for a 60 billion RMB daily quota of foreign investors to trade A-shares. The expectation is that these programs will further grow as MSCI raises the aggregate weight of A-shares in the Emerging Markets Index. PanAgora uses Connect to invest in the China A-share market for its active alpha strategies.
What makes China A-shares Unique?Unique RisksRetail Investor Participation and Behavioral Effects
Unlike in other developed and emerging markets, retail investors are major participants in the Chinese equity markets. According to the CSRC, retail investors account for 80% of aggregate trading volume. Compared to the US, Chinese retail investors trade almost four times more frequently (Chen, Kim, Nofsinger, and Rui - 2007). Chinese retail investors also hold around 58% of the aggregate market ( Jia, Wang, and Xiong - 2015), which is amongst the highest in the world. A survey9 found that around 60% of new retail investors have less than a high school education. With their lack of formal education and experience, these investors seem to be investing based on faith, or conviction in the government or pure speculation. Academic journals have found a strong preference of collectivistic investment behavior in Chinese

40Factor Investing in the China A-Share Market: Revelations from a Contextual Alpha Model
investors. A good example of this occurred in 1992 when 500,000 Shenzhen investors lined up to invest in a new, hot IPO without any information on the company or its fundamentals (Mok, and Hui - 1998). Interestingly, for dual-listed stocks with both H and A lines, A-shares react more to revisions done by China mainland-based analysts vs. H-share prices, which are impacted more by offshore analysts (Jia, Wang, and Xiong,- 2015). All of these investor behaviors make the China A-share market a very interesting use case for testing asset pricing anomalies.
Government Control and Intervention
Chinese markets are heavily regulated by the CSRC – the chief market regulator. There are many direct and indirect ways the government can control markets. During May 2017, the government restricted share sales by large shareholders in order to boost investor confidence. During the summer of 2015, in order to stabilize the markets from an imminent plunge, regulators halted IPOs and suspended trading in shares accounting for 40% of market capitalization. The government can also use indirect methods like controlling the yuan level to respond to cash inflows and outflows.
The IPO process is also tightly controlled by the CSRC. Firms must go through extensive regulatory approvals and satisfy multiple criteria before being listed on the A-share market. Duration to list time is unpredictable and the government allocates an annual quota of new IPOs. Given this uncertainty, past research has shown that the IPO premium in the A-share market is several times higher than in other markets.
To avoid these strenuous requirements, several companies have chosen to list outside the China A-share market. Private firms in China which seek public capital have also been known to acquire zombie-listed companies – raising the implicit shell value of declining firms. With the “Made in China 2025” program in sight, the CSRC has relaxed IPO regulations for several advanced, next-generation technology and manufacturing firms.
Recently in order to reduce overall economic risks to the financial system, the Chinese government has made it a priority to deleverage balance sheets of publically listed firms. This is leading to sizable public policy controls and the forceful deleveraging of firms. These forced interventions have led to several structural anomalies which, in our opinion, can be capitalized on via a systematic, process-driven approach and harnessed as alphas.
Corporate Governance
There are two major factors which provide Chinese markets with a unique setting with respect to corporate governance: market dominance by SOEs and the existence of Split-Share Structure.
SOEs are a significant component of the Chinese A-share market. Government owned and controlled, they serve two purposes: they cater to a public policy mandate and provide value maximization to their shareholders. SOEs are run by state-appointed executives who need to align the firm’s interest more with the state vs. the investors. This dynamic can lead to inefficient management, underutilization of resources and overall poor corporate performance.
China had 172 companies on the Forbes Global 2000 list, publish in 2016. These firms, along with others are considered as "national
champions” for China. With the Chinese government’s goal to become the dominant world player in key sectors, these “national champions” are empowered with the expectation to continue and ultimately change market competition globally. State-Owned Assets Supervision and Administration Commission (SASAC) was established in 2003 to oversee the management of China’s SOEs, including appointing top executives and approving any mergers or sales of stock or assets, as well as drafting laws related to state-owned enterprises. One of SASACs directives is to enact policies which can transform key SOEs into national champions.
Split-Share-Structure reform in 2005 was a major event in China. However, even today only around 20-25% of the market capitalization of SOEs is non-tradable. This continues to create problems in valuation for SOEs.
We believe that asset managers, quantitative and fundamental alike, should understand these corporate governance subtleties in China A-share market and pay important consideration while formulating their investment strategies.
Quantifying the China A-Share MarketWith our research and analysis, we have come to believe that the unique risks and opportunities offered by the China A-share market can be harnessed via a quantitative, process-driven, and expandable investment approach.
Investable UniverseTo manage a liquid, investable China A-share market investment strategy, it is important to have a stable investment universe. Even though the China A-share market is the second most liquid market in the world, it has an interesting stock level liquidity profile. As the investment universe has broadened from large-cap, high-liquidity names to mid-cap names, we observe an interesting, homogenous liquidity pattern. Among the top 1,000 names ranked by liquidity and size, the companies in the bottom five deciles tend to have a strikingly similar liquidity profile. These names also tend to frequently oscillate around these liquidity deciles and be relatively higher-growth, smaller-size names which attract higher participation from retail investors. Additional challenges involve closely monitoring the market for frequent stock suspensions, delistings, regulatory events, and liquidity events.
0
10
20
30
40
50
60
70
80
Lowest D2 D3 D4 D5 D6 D7 D8 D9 Highest
Average Median Volume by Volume Decile Groups
Above chart show average of 3 month median volume (in USD) from Dec 2007 - Dec 2017 for top 1000China A-share stocks, as sorted bu volume. Exhibit 3 Source: PanAgora Asset Management and IDC

Factor Investing in the China A-Share Market: Revelations from a Contextual Alpha ModelQuarter 3 • 2019
41
Given these characteristics, we built a liquidity-stabilized investment universe of over 1,000 names using our propriety construction methodology. The universe emanating from our methodology provides desirable stability in names and as indicated by our research, provides sufficient breadth to fully express, and capitalize our alpha potential without taking any meaningful liquidity or delisting/suspension risk.
Quantitative FactorsValuation
A valuation strategy of buying cheap and selling expensive companies is a well-known investment approach used by quantitative and fundamental investors across different geographical regions and asset classes. The good news is that this strategy works in the China A-share market as well, but not for the same reasons.
Unlike those in other markets, Chinese companies have a lower risk of default (Huang, Yang, and Zhang - 2013). This would suggest that value stocks should, if anything, perform worse in China. There are two possible reasons for this: first, their profits are closely monitored by regulators and failure to be profitable would lead to suspension or worse - delisting - or second, strong IPO regulations cause many close-to-default companies to have implicit shell value because they tend to be acquired by prospective firms that want to get their listing rights rather than waiting for their IPO request getting approved.
Having said that, China’s being a strong growth-driven market means that growth stocks tend to be over-crowded by retail investors (Ng, and Wu - 2006). This results in value stocks being underpriced and under-appreciated due to lack of interest and/or attention by investors. Value premium is thus supported by the behavioral biases China A-share investors exhibit.
Firm Quality, Profitability and Accruals
Firm quality and profitability strategies have been successfully tested in developed and emerging markets. These strategies are designed to be stable, to exhibit low turnover, and to provide ample diversification benefits vis-a-vis other quantitative strategies, such as value and momentum.
In the China A-share market, these quality and profitability strategies show positive, but muted, performance. Profitability works better in countries with low political risk, where firms have easy access to capital and have fewer limits to arbitrage. The China A-share market, being more restrictive and regulated, tends to have lower return premia from quality-based measures (Sun, Wei, and Xie – 2014). However, given their low correlation with value, quality, and profitability, these strategies help investors avoid value traps where firms are cheap for a reason.
Historically, we have found that accruals-based signals have worked well in the China A-share market. Low-accrual firms tend to do better because investors tend to focus more on total earnings vs. differentiating between stable cash-based earnings and mean-reverting accrual-based earnings, hence missing the potential earnings management provided by firms (Richardson, Sloan, Soliman, and Tuna - 2005). We are aware of no reasons that investors in the China A-share market would be any different. If anything, given the amount of unsophisticated retail
participation in the China A-share market, this effect is more pronounced. Additionally, given the high degree of earnings management in the China A-share market, as identified by other researchers and as we saw through our own research, accrual effect becomes even stronger. Past research has indicated that earnings management is more pronounced in less developed markets (Leuz, Nanda, and Wysocki – 2003). Driven by regulations in China A-share market, Chinese firms in distress use earnings management as a tool to increase negative accrual income. When A-share firms go through two consecutive annual losses or show negative shareholder equity they receive a “special treatment” status. A third loss results in trading suspensions and a fourth leads to delisting. This motivates firms to use earnings management as a tool (Li, Niu, Zhang, and Largay -- 2011).
Momentum
Momentum is another well-known strategy which bets on buying past winners and selling past losers. This strategy has a good and stable track record across regions and different asset classes. Interestingly, we have found that traditional price-momentum-based strategies have not historically performed well in the China A-share market.
We think this is driven by collectivist investor behavior and by how retail investors participate in the China A-share market. Retail investors trade significantly more often than investors in other markets. This reduces the cycle of anchoring, disposition, and overreaction, which are the key behavioral ingredients for a successful momentum strategy. Additionally, research indicates that investors in the China A-share market tend to adapt faster to realized gains and losses vs. other markets (Arkes, Hirshleifer, Jiang, and Lim – 2010). If anything, the aforementioned theory is more supportive of reversals than momentum. Chui, Titman, and Wei [2010] further pointed out that individualism in a country’s population is positively correlated with equity momentum returns and weakly associated with reversal returns. The majority of investors in China tend to show collectivist culture, hence momentum is less effective.
However, the momentum effect can be captured by alternate measures and China-specific data. Research indicates that leveraging China A-share-focused data and other alternate measures can help us capture non-price-based stock level momentum.
Sentiment
Sentiment refers to a set of orthogonal strategies which captures alpha via crowdsourcing different views from savvy investors. These strategies have a proven track record in developed and emerging markets. Managers and researchers have looked at various sources such as stock size, trading volume, stock-level shorting information, mutual fund manager behavior, biases from retail investor trading behavior, alternate data/information from social media, and chat groups to capture investor sentiment and create appropriate investment strategies. Such strategies not only capture smart or informed investor behavior, but also help quantitative managers systematically capture and leverage several inefficiencies in the aggregate stock market.
Our research indicates that an amalgamation of these alternative data strategies creates a very strong signal for forecasting future

42Factor Investing in the China A-Share Market: Revelations from a Contextual Alpha Model
returns in the China A-share market, especially with the observed high level of stock market inefficiency driven by retail investor participation and structural inefficiencies created by active interference by the regulators and markets. These strategies appear to offer uncorrelated alpha exposure to other strategies at a meaningful turnover.
Above table has annualized Sharpe Ratio's for major factor composites in PanAgora's China A-share liquidity stabilized 1000 stock universe. Period: Dec 2007 - May 2017. Each stock is ranked to aforementioned factors and the Annualized Sharpe Ratios were captured over the period. Exhibit 4 Source: PanAgora Asset Management
Contextual ModelContextual Modelling FrameworkOur proprietary contextual alpha modeling technique seeks to maximize alpha capture by dynamically differentiating return drivers of each stock independently. Our alpha modeling approach can be contrasted with the one-size-fits-all approach in building alpha models in developed and emerging stock markets. The philosophy extends to the China A-share market and should outperform one-size-fits-all models by leveraging our contextual modelling framework. We believe that every company is unique and idiosyncratic by nature and one-size-fits-all is too general to be effective. Contextual models adapt to changes in company characteristics over time as the firm evolves through its life cycle.
ContextsAs Sorensen et al. (2005) mentioned in their work, linking a stock’s ranking signal or factor to expected return and assigning it an appropriate weight is a matter of context. The application of a timely security selection criterion is conditional. For example, many researchers demonstrate that value as a selection variable is often conditional on the type of firm, other non-value factors, the investment horizon or some other dimension. Sloan (2001) as well as Beneish, Lee, and Tapely (2001) call this interdependency of security factors contextual. Seasoned active managers know that value investing focuses on discovering cheap stocks with a balance of quality; at the same time, growth investing often seeks to balance positive momentum with quality and cheapness. This anecdotal assertion finds substantiation in prior academic studies. For example, Daniel, and Titman (1999) find that momentum effects are stronger for growth stocks. Asness (1997) finds that value strategies work, in general, but less so for stocks with high momentum. In a particularly relevant study, Scott, Stumpp, and Xu (1999) focused on prospect theory and investor overconfidence. They provide empirical evidence that rational
value investors should emphasize cheapness, while growth investors should let winners run — with the prospect of future good news.
With the China A-share market in mind, a carefully crafted set of contexts was made with the most economic and fundamental sense. As mentioned before, Chinese state-owned enterprises (SOEs) are an integral part of the Chinese economy. Government owned and controlled, they serve two purposes: first, they cater to a public policy mandate, and second, and most especially, they provide value maximization for shareholders. SOEs are run by state-appointed executives who need to align a firm’s interest more with the state versus the investors. This dynamic can lead to inefficient management, underutilization of resources, and overall poor corporate performance. Also, SOEs receive preferential support and attention from Government versus privately run firms – giving SOEs meaningful competitive advantage in certain sectors. Given this, it is imperative that we generate a separate alpha model for SOEs. Our contextual alpha modelling technique provides us with this handle to model SOE vs. non-SOE firms. Another good example is price momentum. As we discussed earlier, price momentum does not work in the China A-share market. However, research indicates that splitting a firm into high versus low price momentum stocks can help boost returns via applying our contextual framework.
One more differentiating characteristic in the China A-share market is participation from retail investors. As we mentioned earlier, historically, retail investors have shown very interesting and asymmetric market participation when it comes to trading specific stocks at different periods of time. Collectivist trading behavior displayed by Chinese domestic A-share investors further exacerbates this effect. We are able to capture this asymmetric trading behavior and model return drivers for these using our contextual methodology.
From our research, we find that the presence of the aforementioned contexts adds significant value to the contextual alpha modelling framework and helps us outperform the one-size-fit-all approach.
Model Performance: Factor Diversification and ContextualizationDriven by both “factor diversification” and “contextualization,” our contextual alpha model seeks to deliver performance benefits to a one-size-fits-all model. The model appears to weather the significant downturns of the MSCI China A-share standard index, strongly delivering positive performance in both up-markets and down-markets while displaying reasonable levels of market neutrality and robustness in performance. Observed performance from the strategy indicates downside protection and upside benefits.
Through understanding the China A-share market and its history and leveraging the data sources, both domestic to the China A-share market and global, accessing our deep alpha factor library and by utilizing the contextual framework, we are able to build a diversified, sustainable, long-term active equity investment strategy which appears to outperform the one-size-fit-all approach in the analysis period we tested. Additionally, driven by the contextual nature of our model and the uniqueness of the China
0.0
0.5
1.0
1.5
2.0
2.5
Momentum Quality Sentiment Valuation
PanAgora's China A-share Composite Backtest Results(Annualized Information Ratios)

Factor Investing in the China A-Share Market: Revelations from a Contextual Alpha ModelQuarter 3 • 2019
43
A-share market, the China A-share strategy appears to offer significant alpha diversification benefits over existing emerging and developed strategies.
Our contextual model has shown to deliver long-term alpha efficacy with ICs (information coefficient) not showing decay by half until at least nine months after signal formation.
ConclusionAs the China A-share market evolves and China opens its doors to foreign investors, it will become increasingly important to more fully understand the innate structure and history behind China’s equity markets. Controlled by a command economy, this market behaves much differently compared to equity markets in the rest of the world.
We aim to simplify quantitative investment in the China A-share market. Building a successful, diversifiable, quantitative, and process-driven investment strategy in the China A-share market requires deep understanding of the current market and its history. Also essential is knowledge of investor constitution/preferences, the scope of government regulations and tools regulators employ to control the markets, and the dynamics of China’s special corporate governance setup.
Based on our experience and diligent research, we identified several structural, risk and alpha opportunities which we believe can be harnessed via quantitative methods to help generate risk adjusted returns. Given the esoteric nature of the China A-share market and its participants, we believe, it is important that we build an investment strategy which leverages China-specific information. We leveraged our specialized knowledge to build a tradable investment universe, alpha signals, and overall model and investable portfolios.
Further, we built our China A-share alpha model using PanAgora’s proprietary contextual alpha modelling technique and have found that our alpha modelling framework has historically been successful in outperforming the one-size-fits-all alpha model. Our contextual technique adapts to changes in a company’s individual characteristics over time as it and the overall Chinese investment landscape evolve. The framework also provides us with the ability to model firms separately when they have markedly different attributes, such as when a firm is an SOE or a non-SOE.
Endnotes1. PanAgora’s ‘contextual’ active equity process for A-Share
investing presented here is distinguished from PanAgora’s ‘defensive equity’ process. For details on former refer Sorensen et all (2005, 2007). The latter utilizes a unique A-share weighting scheme that optimizes between well-known alpha factor attributes for each stock and the diversification value of each stock.
2. The “one-size-fits-all” model is created without any contextual partition, using the same procedure as contextual. For details on contextual alpha modelling refer Sorensen et all (2005, 2007).
3. Source: Bloomberg, end of 2017.
References Alford, Andrew W., and Alison W. Lau, (2014), “A Foreign Investor’s Guide to Accessing the Chinese Equity Market,” The Journal of Portfolio Management 41, no. 5, 31-40.
Allen, Franklin, Jun Qian, and Meijun Qian, (2005), “Law, finance, and economic growth in China,” Journal of Financial Economics 77, 57–116.
Amihud, Yakov, (2002), “Illiquidity and stock returns: Cross-section and time-series effects,” Journal of Financial Markets 5, 31–56.
Ang, Andrew, Robert J. Hodrick, Yuhang Xing, and Xiaoyan Zhang, (2009), “High idiosyncratic volatility and low returns: International and further US evidence,” Journal of Financial Economics 91, no. 1, 1-23.
Arkes, Hal R., David Hirshleifer, Danling Jiang, and Sonya S. Lim, (2010), “A cross-cultural study of reference point adaptation: Evidence from China, Korea, and the US.” Organizational Behavior and Human Decision Processes 112, no. 2, 99-111.
Asness, Clifford S.,(1997), "The Interaction of Value and Momentum Strategies," Financial Analysts Journal, March/April 1997, pp. 29-36.
Bai, Chong-En, Qiao Liu, Joe Lu, Frank M. Song, and Junxi Zhang, (2004), “Corporate governance and market valuation in China,” Journal of Comparative Economics 32, no. 4, 599-616.
Beltratti, Andrea, Bernardo Bortolotti, and Marianna Caccavaio, (2012), “The stock market reaction to the 2005 split share structure reform in China,” Pacific-Basin Finance Journal 20, no. 4, 543-560.
4. Source: http://www.worldbank.org/en/country/china/overview#1.
5. Source: IMF. Real GDP Growth Rate, Annual Percentage Change.
6. Source: Bloomberg, end of 2017.
7. Source: http://www.csrc.gov.cn/xinjiang/xxfw/tzzsyd/200711/t20071115_88780.htm and https://www.caixinglobal.com/2018-07-28/regulator-targets-harm-to-public-health-in-delisting-rules-101309376.html.
8. Source: Bloomberg.
9. China Household Finance Survey, Southwestern University of Finance and Economics. Bloomberg news: https://www.bloomberg.com/news/articles/2015-03-31/china-s-big-stock-market-rally-is-being-fueled-by-high-school-dropouts.
10. Source: Bloomberg.
11. China Household Finance Survey, Southwestern University of Finance and Economics. Bloomberg news: https://www.bloomberg.com/news/articles/2015-03-31/china-s-big-stock-market-rally-is-being-fueled-by-high-school-dropouts.

44Factor Investing in the China A-Share Market: Revelations from a Contextual Alpha Model
Beneish, Messod D., Charles M. C. Lee, and Robin L. Tarpley, (2001), "Contextual Fundamental Analysis Through the Prediction of Extreme Returns," Review of Accounting Studies, Vol. 6, pp. 65-189.
Carpenter, Jennifer N., Fangzhou Lu, and Robert F. Whitelaw, (2015), “The Real Value of China’s Stock Market,” NBER Working Paper, No. 20957.
Carpenter, Jennifer N., and Robert F. Whitelaw, (2017), “The Development of China's Stock Market and Stakes for the Global Economy,” Annual Review of Financial Economics, 9, 233-257.
Chakravarty, Sugato, Asani Sarkar, and Lifan Wu, (1998), "Information asymmetry, market segmentation and the pricing of cross-listed shares: theory and evidence from Chinese A and B shares," Journal of International Financial Markets, Institutions and Money 8, 325–356.
Chen, Gong-Meng, Kenneth A. Kim, John R. Nofsinger, and Oliver M. Rui, (2007), “Trading performance, disposition effect, overconfidence, representativeness bias, and experience of emerging market investors,” Journal of Behavioral Decision Making 20, no. 4: 425-451.
Cheung, Christopher, George Hoguet, and Sunny Ng, (2014), “Value, Size, Momentum, Dividend Yield, and Volatility in China’s A-Share Market,” The Journal of Portfolio Management 41, no. 5, 57-70.
Chui, Andy CW, Sheridan Titman, and KC John Wei, (2010), “Individualism and Momentum Around the World,” The Journal of Finance 65, no. 1, 361-392.
Daniel, Kent, and Sheridan Titman, (1999), "Market Efficiency in an Irrational World," Financial Analysts Journal, Nov/Dec 1999, pp. 28-40.
Fama, Eugene F, and Kenneth R. French, (1992), "The cross-section of expected stock returns," Journal of Finance 47, 427–465.
Huang, Yujia, Jiawen Yang, and Yongji Zhang, (2013), “Value premium in the Chinese stock market: free lunch or paid lunch?” Applied Financial Economics 23, no. 4, 315-324.
He, Wei, Tarun K. Mukherjee, and H. Kent Baker, (2017), “The effect of the split share structure reform on working capital management of Chinese Companies,” Global Finance Journal 33, Pages 27-37.
Jia, Chunxin, Yaping Wang, and Wei Xiong, (2015), “Social Trust and Differential Reactions of Local and Foreign Investors to Public News,” NBER Working Paper, No. 21075.
Lakonishok, Josef, Andrei Shleifer, and Robert W. Vishny, (1994), “Contrarian Investment, Extrapolation, and Risk,” The Journal of Finance 49, no. 5, 1541-1578.
Leuz, Christian, Dhananjay Nanda, and Peter D. Wysocki, (2003), “Earnings Management and Investor Protection: an International Comparison,” Journal of Financial Economics 69, no. 3: 505-527.
Li, Yu Wai Vic, (2018), “China’s Financial Opening: Coalition Politics and Policy Changes (Routledge Contemporary China Series),” Routledge, 1st edition, ISBN: 978-1138727540.
Lo, Andrew W., (2002), "Bubble, Rubble, Finance in Trouble?" Journal of Psychology and Financial Markets, 3, pp. 76-86.
Mok, Henry MK, and YV Hui, (1998), “Underpricing and Aftermarket Performance of IPOs in Shanghai, China,” Pacific-Basin Finance Journal 6, 453–474.
Ng, Lilian, and Fei Wu, (2006) “Revealed Stock Preferences of Individual Investors: Evidence from Chinese Equity Markets,” Pacific-Basin Finance Journal 14, no. 2, 175-192.
Novy-Marx, Robert, (2013), “The Other Side of Value: The Gross Profitability Premium,” Journal of Financial Economics 108, no. 1, 1-28.
Scott A. Richardson, Richard G. Sloan, Mark T. Soliman, and Irem Tuna, (2005), “Accrual Reliability, Earnings Persistence and Stock Prices,” Journal of Accounting and Economics, 39, 437–485.
Scott, James, Mark Stumpp, and Peter Xu, (1999), "Behavioral Bias, Valuation, and Active Management," Financial Analysts Journal, July/Aug 1999, pp. 49-57.
Sloan, Richard G., (2001), “Discussion of: Contextual Fundamental Analysis Through the Prediction of Extreme Returns," Review of Accounting Studies, 6, pp. 1991-1995.
Sloan, Richard G., (1996), “Do Stock Prices Fully Reflect Information in Accruals and Cash Flows About Future Earnings?” The Accounting Review 71, no. 3, 289-315.
Sorensen, Eric H., Edward Qian, Ronald Hua, and Robert Schoen, (2004), "Multiple Alpha Sources and Active Management," Journal of Portfolio Management, Winter 2004, pp: 39-45.
Sorensen, Eric H., Edward Qian, and Ronald Hua, (2007), “Quantitative Equity Portfolio Management: Modern Techniques and Applications,” Chapman and Hall/CRC Financial Mathematics Series, ISBN: 978-1584885580.
Sun, Lei, Kuo-Chiang John Wei, and Feixue Xie, (2014), “On the Explanations for the Gross Profitability Effect: Insights from International Equity Markets,” Asian Finance Association (AsianFA) 2014 Conference Paper.
Walter, Carl E., and Fraser J. T. Howie, (2006), Privatizing China: Inside China's Stock Markets, 2nd Edition, John Wiley & Sons (Asia) Pte. Ltd, ISBN: 978-0-470-82214-2.

Factor Investing in the China A-Share Market: Revelations from a Contextual Alpha ModelQuarter 3 • 2019
45
Jaime H. Lee, PhD PanAgora
Dr. Lee is a Managing Director at PanAgora Asset Management and leads the Dynamic Equity Team. Her primary responsibilities include oversight and management of the team, conducting research to uncover new alpha sources, building quantitative stock selection models, and managing portfolios
within the Dynamic Equity strategies. Dr. Lee is a key contributor to the innovative equity research used in the development of PanAgora’s Dynamic Equity models. Dr. Lee is a member of the firm’s Operating and Directors Committees.
Prior to joining PanAgora, Dr. Lee was a Managing Director of the Scientific Active Equity team at BlackRock, Inc. Dr. Lee joined Barclays Global Investors in 2007, which merged with BlackRock in 2009. While at BGI/BlackRock, she managed the Emerging Markets strategies and led the Emerging Markets portfolio management team, overseeing $15Bn AUM across long-only, 130/30 and market neutral strategies. Her prior experience includes a role as a Senior Portfolio Manager at Barclays Global Investors as well as Research and Portfolio Management roles at Quantal Asset Management, managing International equity strategies.
Dr. Lee graduated from the University of California, Berkeley with a Ph.D. in Economics.
George D. Mussalli, CFA PanAgora
Mr. Mussalli is Chief Investment Officer and Head of Research, Equity. He is responsible for oversight of the firm’s Dynamic, Stock Selector, and Diversified Arbitrage strategies, as well as the Equity team’s Data Infrastructure, Portfolio Construction, Portfolio Strategy and Trading teams. He is
also a member of the firm’s Investment, Operating, and Directors Committees.
As Chief Investment Officer and Head of Research, Equity, Mr. Mussalli directs innovative equity research used in the development of models used within PanAgora’s equity strategies. Prior to becoming Chief Investment Officer and Head of Research, Equity, Mr. Mussalli served as Head of PanAgora’s Stock Selector strategies. His work focuses on combining fundamental insights with sophisticated quantitative techniques to develop proprietary models designed to analyze companies across many dimensions. In addition to overseeing the management of the firm’s Stock Selector strategies, he has significantly contributed to the proprietary pool of equity research leveraged across the entire firm during his tenure. The research he has conducted also led to the founding of the firm’s Diversified Arbitrage hedge fund strategy in 2010.
Before joining PanAgora, he was a Portfolio Manager on the Putnam Investments Structured Equity team, where he was responsible for Structured Equity portfolios. He contributed to quantitative research and analysis that supported all equity strategies, including International and Global strategies.
Prior to joining Putnam, Mr. Mussalli worked as a Senior Investment Analyst at John Hancock Funds.
Rohit Shrivastava, CQF PanAgora
Mr. Shrivastava is a Director on the Dynamic Equity team at PanAgora Asset Management. His primary responsibilities include managing active equity strategies for the team, conducting and managing quantitative equity research to uncover new sources of alpha, and building quantitative
stock selection models. Mr. Shrivastava is a key contributor to the innovative equity research used in the development of PanAgora’s Dynamic Equity models. Mr. Shrivastava is the member of firms’ Directors and Risk Committee’s
Prior to joining Dynamic Equity team, Mr. Shrivastava was a Vice President-Research on the Global Stock Selection Team at AQR Capital Management. At AQR, he conducted research on new sources of alpha, model construction ideas, portfolio construction/optimization ideas and built AQR’s proprietary equity risk prediction models. He was also responsible for researching and managing AQR’s Emerging Market Neutral strategy, and served as Portfolio Manager for multiple quantitative equity strategies. He also helped tailor AQR’s core quantitative investment strategies to clients’ specific needs.
Prior to joining AQR, Mr. Shrivastava worked as a Senior Consultant with Indus Valley Partners where he consulted to hedge funds such as QVT Financial and FX Concepts.
Mr. Shrivastava holds a Certification in Quantitative Finance (CQF) and has close to 15 years of industry experience.
Authors Bios'

What, Exactly, Is a Factor?
46What, Exactly, Is a Factor?
Melissa R. Brown Axioma
Dieter Vandenbussche Axioma
Esther Mezey Axioma
Ipek Onat Axioma
According to BlackRock, $1.9 trillion was invested in factor-based strategies as of June 2018 — a figure expected to grow by nearly 80% to $3.4 trillion by 2022.1 There is no question that these strategies have moved to the forefront of investing, but their growing popularity begs the basic question: what do we mean by the term “factor?"2
When we refer to factor returns, we mean the return to a long-short portfolio with unit exposure to the factor in question, and no exposure to any other model factor. The portfolio encompasses the model’s investment universe, is rebalanced daily, and has hundreds or thousands of small positions. While we consider these “Factor-Mimicking Portfolios” (FMPs) to be the purest expression of a factor’s return, we recognize that other practitioners may have different definitions – and that those different definitions can produce very different results.
For example, factor returns can impact the decision to use a factor in an investment process, and can help explain the performance of a portfolio when attribution is run using the factor. In addition, a long-only manager may find that using long-short FMPs can give unintuitive results, especially if much of the factor performance comes from the short side. We will address both issues in this paper, part 1 of a 2-part series. Here we will cover the differences that result from factor-construction choices; part 2 will compare long-only portfolio-construction alternatives.
We set out to create a set of portfolios that represent a number of ways one could construct a factor portfolio. The differences in exposures and returns were often quite substantial. All portfolios in the study are designed to be FMPs. In other words, they are meant to represent exposure to the chosen factor, but they have varying degrees of “purity” of that exposure, with some allowing other bets,

What, Exactly, Is a Factor?Quarter 3 • 2019
47
such as industry and other risk-model style factors. To illustrate our points, we chose a few criteria on which to base our analysis, but left out numerous other possible scenarios. This study is therefore hardly comprehensive, but we hope it conveys a sense of how difficult it is to narrow the criteria for defining a factor. Factor investors may ultimately want to choose a factor that best represents their investment process, and should avoid misleading definitions that muddle numerous factors together.
Factor Portfolio Choices. With the exception of the portfolios that are long the top quintile and short the bottom according to a given factor (Top-Bottom), all factor portfolios described below use mean-variance optimization for portfolio construction. The objective term seeks to maximize exposure to the factor, subject to various constraints, which are what distinguishes each portfolio. “Pure” in the portfolio descriptions refers to the presence of constraints on all other factors (in this case style and sector).3,4 For our long-short portfolios, an active risk limit of 3% is imposed, and we ran long-only portfolios at varying levels of active risk.5 We also varied the investment universe and rebalancing frequency. All portfolios and returns discussed in the paper are active. This means that even if an initial portfolio was created to be long only relative to a benchmark, the discussion of results is based on the active portion.
Exhibit 1 describes the investment universe, rebalance frequency, and other restrictions for each portfolio.
The portfolios thus constructed have widely varying levels of volatility and exposure to the desired factor. They can have quite different returns driven by the investment universe, frequency of rebalancing and exposure to other factors. In addition, because the “long only” portfolios may be limited in how much they can short (only up to the benchmark weight), they typically have much lower exposures to the desired factor. At the same time, they may be a better representation of the return that could be achieved from that factor when it is used to evaluate a portfolio that does not permit shorting. Correlations show that the farther you move away from long-short, the broad universe and/or other constraining factors, the more different the portfolios’ holdings and returns become.
Rebalance Frequency
Other Factors Constrained
Benchmark/Universe
Short Constraints
Tracking Error
Factor* Daily Yes US Estimation Unvierse No NA
R3 Daily Pure Daily Yes Russell 3000 No 300 bps
R3 Daily Daily No Russell 3000 No 300 bps
R3 Monthly Pure Monthly Yes Russell 3000 No 300 bps
R1 Daily Pure Daily Yes Russell 1000 No 300 bps
R3 LO Pure Daily Yes Russell 3000 Yes** 300 bps
R3 LO Daily Daily No Russell 3000 Yes** 300 bps
Top-Bottom CW Daily No Russell 3000 No NA
Top-Bottom EW Daily No Russell 3000 No NA
* Axioma's Factor-Mimicking Portfolio ** Short active positions only allowed up to benchmark weight
Exhibit 1: Portfolio Options
We tested these variations on some of Axioma’s traditional factors and, as expected, found substantial differences in exposures, use of risk budget, holdings, etc.
To illustrate the differences, we will focus on the profitability factor, where we focus on a company’s return on equity, return on assets, cash flow to assets, cash flow to income, gross margin and sales to assets. Exhibit 2 shows the portfolios’ exposures and how much of the risk budget is used up by the factor, both of which highlight the substantial differences from one portfolio to the next.
Note: the R3 Daily Pure line is almost exactly the same as the R3 Monthly Pure line, with the later largely obscuring the former in the charts. Exhibit 2: Exposures and Percent of Risk Source: FTSE Russell, Axioma
0.0
0.5
1.0
1.5
2.0
2.5
3.0
3.5
R3 Daily Pure R3 Daily R3 Monthly Pure
R1 Daily Pure R3 LO Pure 300 bps R3 LO
Top-Bottom CW Top-Bottom EW
0%10%20%30%40%50%60%70%80%90%
100%
R3 Daily Pure R3 Daily R3 Monthly Pure
R1 Daily Pure R3 LO Pure 300 bps R3 LO
Top-Bottom CW Top-Bottom EW
Profitability Exposure
Profitability Percent of Risk

48What, Exactly, Is a Factor?
When we look at exposures and percent of risk used by the Profitability tilt in the same chart, we also see some interesting results. When other factor exposures are allowed in the portfolio, the risk allocation for the desired factor can vary widely. On the Upper chart of Exhibit 3 we show the Top-Bottom Cap-Weighted portfolio data. In this case the factor exposure (the pink line plotted against the left scale) remains fairly steady, as we would expect, given that factor definitions are standardized and the portfolio is always long and short the same proportion of stocks. However, Profitability’s contribution to the overall active risk of the portfolio is low and quite variable (because other factors are eating up the risk budget).6 For the R3 Daily portfolio, which does not constrain exposures to other factors, the risk contribution from the desired factor is higher and fairly steady, but the factor exposure ranges from 1 to 3—quite a wide range.7 Given this, can either of these portfolios really be described as representing true exposure to Profitability? Probably not.
Exhibit 4 shows a scatter plot of daily returns and correlations between various iterations of the portfolio and the Profitability FMP (Factor). As we remove factor constraints, reduce the ability to short, and change the universe, it is clear that the results move farther and farther away from the FMP. Adding on the capitalization weighting for the Top-Bottom portfolio led to the lowest correlation — in fact, the correlation almost looks as if it is between different factors. Again, this suggests that quintile- (or decile- or other) sorts are not good reflections of the returns that could be generated from a more purely defined factor.
One surprising finding is the high correlation between the returns of the R3 Daily Pure and R3 Monthly Pure portfolios. This suggests, at least for this factor, that a manager’s portfolio that is rebalanced less frequently than daily can still effectively use this factor in attribution. Over the course of the test, however, while returns were highly correlated, the daily-rebalanced R3 Pure portfolio did fare slightly better than the monthly version (see Exhibit 5, on the next page).
0%
5%
10%
15%
20%
25%
30%
35%
0
0.5
1
1.5
2
2.5
2004
2005
2006
2007
2008
2009
2010
2011
2012
2013
2014
2015
2016
2017
2018
Exposure (Left) Pct of Risk (Right)
Exhibit 3: Profitability Factor Exposure vs. Percent of Risk Source: FTSE Russell, Axioma
Top-Bottom CW
R3 Daily
0%
10%
20%
30%
40%
50%
60%
70%
80%
90%
0
0.5
1
1.5
2
2.5
3
3.5
2004
2005
2006
2007
2008
2009
2010
2011
2012
2013
2014
2015
2016
2017
2018
Exposure (Upper) Pct of Risk (Lower)

What, Exactly, Is a Factor?Quarter 3 • 2019
49
-2.0%
-1.0%
0.0%
1.0%
2.0%
-2.0% -1.0% 0.0% 1.0%
Mon
thly
Daily
Exhibit 5: Portfolio Correlations with Each Other, Daily Returns of Portfolios Rebalanced Daily Versus Once a Month Source: FTSE Russell, Axioma
-2.0%
-1.5%
-1.0%
-0.5%
0.0%
0.5%
1.0%
-1.0% -0.5% 0.0% 0.5% 1.0%
R3 D
aily
Pur
e
Profitabil ity Factor
-3.0%
-2.0%
-1.0%
0.0%
1.0%
2.0%
-1.0% -0.5% 0.0% 0.5% 1.0%
R3 D
aily
Profitabil ity Factor
-2.0%
-1.0%
0.0%
1.0%
2.0%
-1.0% -0.5% 0.0% 0.5% 1.0%
R3 M
onth
ly P
ure
Profitabil ity Factor
-1.5%
-1.0%
-0.5%
0.0%
0.5%
1.0%
1.5%
-1.0% -0.5% 0.0% 0.5% 1.0%
R1 D
aily
Pur
e
Profitabil ity Factor
-1.0%
-0.5%
0.0%
0.5%
1.0%
-1.0% -0.5% 0.0% 0.5% 1.0%
R3 LO
Pur
e
Profitabil ity Factor
-1.5%
-1.0%
-0.5%
0.0%
0.5%
1.0%
1.5%
-1.0% -0.5% 0.0% 0.5% 1.0%
R3 LO
Profitabil ity Factor
-15.0%
-10.0%
-5.0%
0.0%
5.0%
10.0%
-1.0% -0.5% 0.0% 0.5% 1.0%
Top-
Botto
m C
W
Profitabil ity Factor
-8.0%-6.0%-4.0%-2.0%0.0%2.0%4.0%6.0%
-1.0% -0.5% 0.0% 0.5% 1.0%
Top-
Botto
m E
W
Profitabil ity Factor
Exhibit 4: Correlations of Portfolio Daily Active Returns with Profitability Factor, 2005-2018 Source: FTSE Russell, Axioma
Correlation 0.83 Correlation 0.58
Correlation 0.82 Correlation 0.55
Correlation -0.03 Correlation 0.24
Correlation 0.21 Correlation 0.42
Portfolio Returns
As shown, the portfolios have very different levels of factor exposure (for example, the exposure is almost 2.5 for the equal-weighted Top-Bottom portfolio, but less than 1 for the pure Long Only portfolio portfolios) and, therefore, their returns are not directly comparable. We have chosen to show these portfolios’ returns in their “raw” form because they are likely part of the factor lexicon that is out there, and it is important for users to understand their characteristics. However, to make performance results comparable with each other and to our Factor-Mimicking Portfolio, we have also produced returns that re-scale the factor exposure for each portfolio to 1. While this has a large impact on portfolio returns, it had minimal effect on correlations. These differences lead to our major conclusion:
Beware of how the portfolio used to generate returns is exposed to the factor. A standard “off-the-shelf factor” may not be providing the expected exposure, could therefore overstate or understate achievable returns, and may not be suitable for using in true factor-based attribution.

50What, Exactly, Is a Factor?
-10%
0%
10%
20%
30%
40%
50%
60%
70%
80%
2004
2005
2006
2007
2008
2009
2010
2011
2012
2013
2014
2015
2016
2017
2018
Factor R3 Daily Pure R3 Daily
R3 Monthly Pure R1 Daily Pure R3 LO Pure 300 bps
R3 LO
-15%
-5%
5%
15%
25%
35%
45%
2004
2005
2006
2007
2008
2009
2010
2011
2012
2013
2014
2015
2016
2017
2018
Factor R3 Daily Pure R3 Daily
R3 Monthly Pure R1 Daily Pure R3 LO Pure 300 bps
R3 LO
-20%
0%
20%
40%
60%
80%
100%
120%
140%
160%
180%
2004
2005
2006
2007
2008
2009
2010
2011
2012
2013
2014
2015
2016
2017
2018
Factor Top-Bottom CW Top-Bottom EW
-10%
0%
10%
20%
30%
40%
50%
60%
70%
2004
2005
2006
2007
2008
2009
2010
2011
2012
2013
2014
2015
2016
2017
2018
Factor Top-Bottom CW Top-Bottom EW
Exhibit 7: Cumulative Active Returns Source: FTSE Russell, Axioma
RawRaw
Scaled to Exposure of 1
Scaled to Exposure of 1
Factor R3 Daily Pure R3 Daily R3 Monthly
PureR1 Daily Pure R3 LO Pure R3 LO Top-Bottom
CW
R3 Daily Pure 0.83 1
R3 Daily 0.58 0.73 1
R3 Monthly Pure
0.82 0.97 0.70 1
R1 Daily Pure 0.55 0.64 0.47 0.62 1
R3 LO Pure 0.26 0.24 0.19 0.24 0.35 1
R3 LO 0.24 0.31 0.45 0.31 0.38 0.43 1
Top-Bottom CW
0.21 0.18 0.21 0.20 0.15 0.12 0.17 1
Top-Bottom EW
0.42 0.40 0.35 0.41 0.16 0.05 0.05 0.70
Exhibit 6: Full Correlation Matrix, Active Daily Returns, 2005-2018 Source: FTSE Russell, Axioma

What, Exactly, Is a Factor?Quarter 3 • 2019
51
Active return differences for portfolios with the same factor exposures are even more pronounced year-by-year. For example, in 2016 the Russell Daily 3000 Pure portfolio returned almost 5%, whereas the pure portfolio built using the Russell 1000 universe was down 53 basis points, and the pure, long-only, 3% tracking error Russell 3000 portfolio fell more than 2%. This suggests the factor fared better among small stocks (since the broader-universe portfolio did better than the one limited to large-cap stocks) and that factor returns were driven by the shorts (since the portfolio that allowed full shorting had a much higher return than the one that limited shorting to the weight in the index). While differences appeared particularly big in that year, the average spread between the highest and lowest return for the optimized portfolios was a substantial 6%.
Even more striking was the magnitude of returns of the top-bottom quintile portfolios. While it was typically far bigger than that of the optimized portfolios (hence the separate chart), it was also sometimes in the opposite direction, most notably in 2009. Finally, there were clearly periods in which the weighting scheme for the top-bottom portfolios (capitalization or equal) made a substantial difference, with one positive and the other negative, as in 2006, 2012, 2013 and 2016.
-10%
-5%
0%
5%
10%
15%
2005 2006 2007 2008 2009 2010 2011 2012 2013 2014 2015 2016 2017 2018
Factor R3 Daily Pure R3 Daily R3 Monthly Pure
R1 Daily Pure R3 LO Pure R3 LO
-15%
-10%
-5%
0%
5%
10%
15%
20%
25%
2005 2006 2007 2008 2009 2010 2011 2012 2013 2014 2015 2016 2017 2018
Factor Top-Bottom CW Top-Bottom EW
Exhibit 8: Annual Returns, Scaled Portfolios Source: FTSE Russell, Axioma
Attribution We ran factor-based performance attribution on selected portfolios for the five years ended December 2018 to highlight the impact of 1) unconstrained factors, and 2) specific returns. Exhibit 9 shows the attribution for three of our portfolios: the long-only portfolios (LO) run at 3% tracking error; one with other
factors constrained (the “pure” portfolio); and the one without the other constraints, along with the capitalization-weighted portfolio that is long the top quintile of stocks based on the profitability factor and short the bottom quintile (TBCW). The latter is likely one of the most common alternatives for calculating factor returns to a factor-mimicking portfolio. For this part of the study the portfolios were not scaled to have an exposure of 1 to Profitability; the exposure averaged 0.65 for the constrained long-only portfolio, 1.2 for the unconstrained long-only and 1.8 for TBCW over this time period.
This was a very good period for the Profitability factor, and the benefits of tilting on the factor were apparent in two scenarios. The LO Pure portfolio produced an information ratio (IR) of 0.58 and the TBCW portfolio scored an IR of 0.9 — even with its much higher level of realized risk (10%, versus 2.5% for the LO portfolio). In contrast, the LO portfolio that allowed for other exposures was dragged down by them, most notably the positive exposure to Volatility, as well as a high level of specific return. Those issues reduced its IR to just 0.22.
Since the LO portfolio was “pure”, or restricted from taking bets on other factors, most of the return for the LO portfolio was the result of its exposure to the Profitability factor, but that was offset by 81 basis points of drag from specific return. The TBCW portfolio’s strong performance was, to be sure, largely attributable to its exposure to the Profitability factor, but many other factors also contributed, including a positive exposure to Earnings Yield and negative exposures to Market Sensitivity and Volatility. In addition, underweight positions in Energy and Financials boosted return. And specific return cut into the overall return by almost 4% annually.
Using this return in attribution would clearly be misleading and very likely overstate the return a manager could have achieved. Although no other factors had a very large impact on return over this period, one could imagine that exposures big enough to lead to these returns (e.g. an average 32% underweight in Financials or -0.87 exposure to Value) could easily have had the opposite impact. In fact, in 2009, when the Profitability factor fared well (and the optimized variations produced positive returns), the unscaled TBCW portfolio lagged the market by more than 18%. A number of factors contributed to that shortfall: negative exposures to Leverage, Liquidity, Market Sensitivity, Value and Volatility, and positive exposures to Size and Medium-Term Momentum each detracted at least 3% from return (with Market Sensitivity contributing more than -9% and Momentum almost -12%). Some of that was offset by a huge underweight in Financials and overweight in Information Technology, but clearly not enough. And specific return was a 3% drag.
So, does the strong performance of TBCW indicate that profitability was a strong factor in 2013-2018? Or a terrible one in 2009? We would argue that it does not, because there were too many other contributors. And a manager who may impose constraints on risk factors, such as sectors, may not have been able to achieve those returns. A corollary of this finding is that only a “pure” factor, one with no other active exposures, is appropriate for attribution. Otherwise, factors will be double-counted, and results will therefore be too muddled.

52What, Exactly, Is a Factor?
Source of Return R3 LO Pure 300 bp R3 LO Top-Bottom CW
Porfolio 9.36% 8.59% 17.01%
w Benchmark 7.93% 7.93% 7.93%
Active 1.43% 0.67% 9.08%
Specific Return -0.81% -2.16% -3.94%
Factor Contribution 2.24% 2.83% 13.02%
Style 2.22% 2.85% 11.85%
Dividend Yield 0.00% -0.06% -0.16%
Earnings Yeild 0.00% 0.23% 2.04%
Exchange Rate Sensitivity 0.00% 0.02% -0.01%
Growth 0.00% -0.06% -0.36
Leverage 0.00% -0.87% -0.03%
Liquidity 0.00% 0.02% -0.01%
Market Sensitivity 0.00% 0.07% 1.06%
Medium-Term Momentum 0.00% 0.21% -0.08%
MidCap 0.00% -0.16% 0.12%
Profitability 2.22% 3.97% 6.44%
Size 0.00% 0.36% -0.33%
Value 0.00% 0.36% 0.47%
Volatility 0.00% -1.24% 2.69%
Sectors 0.01% -0.03% 1.17%
Consumer Discretionary 0.00% 0.12% -0.32%
Consumer Staples 0.00% -0.06% -0.21%
Energy 0.00% 0.10% 1.13%
Financials 0.00% 0.11% 1.18%
Health Care 0.00% -0.22% -0.55%
Industrials 0.00% -0.03% -0.01%
Information Technology 0.00% -0.03% -0.01%
Materials 0.00% 0.08% 0.08%
Real Estate 0.00% -0.05% -0.26%
Telecommunications Services 0.00% 0.10% -0.04%
Utilities 0.00% -0.16% 0.03%
Exhibit 9: Annualized Attribution, 2013-2018 Source: FTSE Russell, Axioma

What, Exactly, Is a Factor?Quarter 3 • 2019
53
Conclusion To reiterate, factors can be defined in a number of ways. The underlying investment universe, frequency of rebalancing, presence or absence of exposures to other factors, and ability to short — in other words, elements of portfolio construction — are all important drivers of the returns of a “factor” portfolio. Some may be far better representations of the factor return an investor may be able to achieve. To repeat:
Beware of how the portfolio used to generate returns is exposed to the factor. A standard “off-the-shelf factor” may not be providing the expected exposure, could therefore overstate or understate achievable returns, and is not suitable for using in true factor-based attribution. Only a “pure” factor, one with no other active exposures, is appropriate for attribution. Otherwise, factors will be double-counted, and results will therefore be too muddled.
Factor investors may ultimately want to choose a factor that best represents their investment process, and should avoid misleading definitions that muddle numerous factors together.
Endnotes
1. This work is adapted from a series of presentations given by Dieter Vandenbussche, in collaboration with Rob Stubbs and Yilin Dai, all of Axioma, entitled “Factor Attribution: A Framework to Align Attribution with Your Investment Strategy.”
2. https://www.blackrock.com/investing/investment-ideas/what-is-factor-investing/factor-commentary/andrews-angle/factor-growth.
3. No transaction costs are considered in the creation of any of the portfolios.
4. A regional or global model would also include country and currency constraints.
5. This paper concentrates on the long-only portfolios run with 3% tracking error. A subsequent paper will look at varying levels of portfolio tracking error to highlight the impact of the no-shorting constraint.
6. Profitability is based on a company's return on equity, return on assets, cash flow to assets, cash flow to income, gross margin and sales to assets.
7. A risk analysis shows that over the course of the study about half the active risk came from style factors, with a negative bet on Volatility the second-highest contributor (about 13%) after Profitability (about 22%). Industries contributed another 10%, and stock-specific active risk was about 40% of the risk budget. In contrast, the R3 Daily Pure portfolio gets about 83% of its active risk from its Profitability bet.
8. The exposure range in this case is the result of the varying level of factor risk over time.
Authors Bios'
Melissa R. Brown, CFA Axioma
As the Head of Applied Research, Melissa Brown generates unique insights into risk trends by consolidating and analyzing the vast amount of data on market and portfolio risk maintained by Axioma. Melissa’s perspectives help both clients and prospects to better understand and adapt to the
constantly changing risk environment. As an author of Axioma Insight: Quarterly Risk Review, Melissa reports on the state of risk in publicly traded equity markets around the globe. In addition, she produces periodic special reports on a broad range of topics of interest to investors and asset owners, is a frequent speaker on the subject of market risk and is often quoted by the financial media. Prior to joining Axioma in 2011, Brown was Managing Director and head of the institutional business at Wintrust Capital Management. Before that she spent 10 years at Goldman Sachs Asset Management, most recently as a Partner in the Quantitative Investment Strategies (QIS) Group. At Goldman Sachs Asset Management, Brown worked closely with clients as the senior portfolio manager for GSAM’s US Equity Strategy, before becoming co-head of Client Portfolio Management in the QIS Group. She was previously Director of Quantitative Research at Prudential Securities, where among other things she popularized the idea of the “cockroach theory” of earnings surprise and appeared on Institutional Investor’s “All-Star” list for 10 straight years. Brown is a Chartered Financial Analyst. She holds a BS in economics from The Wharton School of the University of Pennsylvania and an MBA in finance from New York University.
Dieter Vandenbussche, PhD Axioma
Dieter’s work has led to numerous enhancements to Axioma’s portfolio construction, analytics, and risk model products and has been published in the Journal of Portfolio Management and other peer reviewed publications.
Prior to joining Axioma in 2006, Dieter was a professor at the University of Illinois Urbana-Champaign where his research focused on theoretical and computational aspects of solving mathematical optimization problems. Much of this research was published in academic journals such as Mathematical Programming, SIAM Journal on Optimization, Journal of Global Optimization, and Computational Optimization and Applications.
Dieter holds an undergraduate and PhD degree in industrial engineering (operations research) from the Georgia Institute of Technology.

54What, Exactly, Is a Factor?
Esther Mezey, PhD Axioma
Esther is a Director of Research at Axioma, where she is responsible for developing factor models used for risk management, risk and return attribution, optimized portfolio construction, and stress testing. She develops fundamental, statistical, and macroeconomic factor models (for
equities), as well as factor models derived from cash-flow data (for alternative investments). Prior to joining Axioma, Esther earned a PhD in Economics from Cornell University, where her research focused on statistical and dynamical modeling of high-dimensional data using spatio-temporal and time series analysis and regularized approaches.
Ipek Onat Axioma
As part of the Portfolio Solutions Team, Ipek’s main focus is to provide expertise on Axioma products and translate client use cases into implementation projects. She mainly assists EMEA clients in portfolio construction processes and portfolio analytics generation. She has experience
with a variety of use cases, such as building hedge portfolios, multi-portfolio optimization and asset allocation.
Ipek joined Axioma in 2015 and has been working closely with various teams since then. Previously she worked in HSBC Treasury in Istanbul, focusing on structured treasury products. As a Fulbright scholar, Ipek received her master’s degree in Financial Engineering from UCLA Anderson School of Management and her bachelor’s degree in Engineering from University of Galatasaray.

Paul R. Kenney, Jr. NEPC
Direct InvestmentsQuarter 3 • 2019
55
Direct InvestmentsDirect investment strategies are becoming increasingly popular with institutional investors and high-net-worth individuals. Direct investments appeal to wealthy individuals and family offices because they not only eliminate the management fees charged by investment firms, but also because the investments can align more closely with the values and mindset of the investor. In this paper we will first focus on trends in direct investing and motivations for private wealth clients. Subsequently, we will examine the performance of direct investments relative to public markets and private fund structures, and then explore strategy development and keys to success.
In the context of a family office, a direct investment represents an investment in a company or asset which is a standalone investment or a co-investment.1 This compares to an indirect investment where the family office is relying on the expertise of an intermediary (commonly known as a general partner) to make an investment in a diversified fund structure, typically charging management and performance fees.
About 67% of high-net-worth-focused practices expect to increase their allocations to direct investments over the next two years, according to a recent study by Cerulli Associates2, underscoring the prevalence of direct investing; this compares to only 22% who plan to increase investments to private equity funds managed by third-parties.
It is worth mentioning that while direct investing is showing an increase in popularity, money into this space has ebbed and flowed for decades; CB INSIGHTS3 notes that corporate venture capital is now in its fourth wave (the four distinct eras are: Conglomerate Venture Capital, 1960 – 1977; Silicon Valley, 1978-1994; Irrational Exuberance, 1995 – 2001; and the Unicorn Era, 2002 to present).

56Direct Investments
The most obvious motivation for direct investing is to save on the substantial fees paid to intermediaries. Other significant incentives include:
• Concentrating dollars into high-conviction investments
• Capitalizing on family domain expertise
• Career opportunities for the next generation
• Better alignment with family values, i.e., pursuing opportunities with greater emphasis on environmental, social and governance (ESG) factors, and socially responsible investments (SRI)
• Greater control and transparency over investments
• Ability to time entry and exit points for the investment
• Enhanced ability to customize risk exposure
• Avoidance of distractions faced by general partners such as fund raising or dealing with client issues
To be sure, direct investing also has its fair share of detractors who point to the risks associated with family offices investing in individual companies and competing head-to-head against well-resourced general partners and corporations. While venture capital and private equity direct investments can generate high returns, we advise caution and encourage a well-developed strategy to underwrite and monitor these investments and to integrate their allocation with overall client objectives.
Family offices should also be aware of the motivations of institutional investors that are involved in direct investing; in some cases, this could create opportunities for investment as well as competition for deals.
Institutional investors engaged in direct investments include large endowments, healthcare systems and corporations and, like family offices, they have ramped up their efforts. Corporations, as an example, have increased their percentage of venture capital deal value from roughly 27% in 2008 to 45% in 2018.4 Venture capital investments made by corporations (CVC) through the third quarter of 2018 are estimated at $39.3 billion (Exhibit 1).
Exhibit 1: Investments by Corporations in Venture Capital Source: PitchBook-NVCA Venture Monitor (Data as of September 30, 2018)
In addition to enhancing returns, incentives for institutional investors may include:
• Monetization of intellectual property
• Application of new technologies
• Improvement in patient outcomes and experience for healthcare organizations
• Tools to facilitate operating efficiencies and resource management
• Professional growth of employees and ability to recruit talent
• Enhanced investment reputation
Potential fee savings are the primary driver of enhanced returns within direct investing. When the typical 2-and-20 private equity fee structure is applied along with other expenses, the total annual cost of these investments is estimated to be 5%-to-7%.5 Theoretically, if a direct investment by a family office underperforms on a relative gross basis, on a net basis it still has the potential to outperform given the magnitude of general partner fees.6
Next, we discuss the performance of direct investments and the lessons learned based on the research in this field.
What Do the Numbers Say?While the fee savings are appealing, there is little evidence to show that direct investments outperform corresponding private equity fund benchmarks. It is challenging for individual investors to compete with te experience, intellectual capital and deep network o frelationships of private equity firms. The performance of direct investments is further diminished when the costs of running such a program are factored in.
Now, we will examine the performance of direct investments relative to both private fund structures and the public markets. For a family office, the math in favor of direct investments represents an investment in a company or asset which is a standalone investment or a co-investment. This compares to an indirect investment where the family office is relying on the expertise of an intermediary—commonly known as a general partner (GP)—to make an investment in a diversified fund structure, typically charging management and performance fees. The math in favor of direct investments can be compelling: general partners have historically generated gross returns of roughly 18% on buyout funds.7 However, after accounting for fees, net returns earned by limited partners are estimated to be around 11% to 13%, leaving open the prospect of capturing part of the gross and net of fee return differential.

Direct InvestmentsQuarter 3 • 2019
57
Still, the depth and breadth of skills required to implement a successful direct investing program raises questions around the resources of a family office and the ability to compete with private equity firms for access to talent and deals. To this end, a comprehensive academic study,8 published in 2014, focused on the performance of direct investments from seven large institutions based in North America, Europe and Asia, including universities, corporate and government-affiliated entities.
Specifics regarding the study participants included:
• Average volume of assets under management was $94 billion
• Total alternatives totaled $21 billion
• Average allocation to private equity was 15.8%
• From 1991 to 2011, 390 transactions occurred
• Data on co-investments and solo deals originated and completed by limited partners
The study showed that direct investments usually fall short of beating their private equity counterparts, although the results did fare better than public market indexes with the best performance attributed to buyout funds of the 1990s. The ability to overcome the information advantage held by general partners is an important factor in solo investing.
Results showed that co-investments underperformed the investments in corresponding funds in which they co-invest; this underperformance is attributed to adverse deal selection. The study noted co-investments tend to cluster in the most heated markets and in the largest deals.
Leads
Active
Diligence
Terms
ClosingOversight
Exit Strategy
Closing
Rinse and Repeat
Strategy Development
Domain Expertise Sourcing
UnderwritingDeal
Execution (Tax, Legal)
Operational
Relationship Management
Skills Required
Exhibit 2: Direct Investment Cycle and Required Skills
Solo transactions outperformed funds; however, both co-investments and solo funds demonstrated performance deterioration over the report’s time horizon, which is an important consideration given the amount of capital waiting to be invested in private companies. The study observed that general partners had less of an information advantage in later-stage investments. The study also noted that direct investments made in firms that were closer in physical proximity to the investor performed better, implying greater involvement in an investment led to better results.
The study also points to the premium that direct investments have earned relative to liquid public equity. However, there are challenges to outperforming general partners and the expertise they bring, even though their fees are substantial. In addition, the benefit of an intermediary—a general partner—is greatest when a unique skill is required, for instance, in the case of venture capital funds, or when there is a premium on access to information. Direct investing in venture capital seems to be particularly challenging given the required domain expertise and the high failure rate of companies in this space.
The process of investing in a company is much more complex than selecting a general partner-led investment. It requires a broad set of tasks and skills to make a single direct investment.
As highlighted in Exhibit 2, there is quite a bit that goes into making direct investments. We will now discuss implementing effective direct investment strategies and keys to success.
Opportunities
58Direct Investments
Tips for Setting a Program Up for Success A family office is very likely to be structured differently than a private equity manager, therefore, its approach should differe as well.
When developing a strategy, consider the following:
• Direct versus GP-led fund investments: These should be considered complementary rather than mutually exclusive. Chances are the expertise a family office brings to the investing process does not cover the universe of opportunities; investments in GP-sponsored fund investments can enhance diversification.
• Active versus passive direct investing: Being a board member or an active investor involved in the business will likely provide more control at the expense of a more concentrated portfolio; this may be worthwhile if it aligns with the family office’s investment skill set and organizational structure. Passive direct investments, where involvement is limited once the investment is funded, offer some implementation ease at the expense of loss of control.
• Buyout versus venture capital: The academic study referenced earlier, published in 2014, showed that the likelihood of direct investments falling short of their private equity counterparts is greatest when a unique skill is required, for instance, in the case of venture capital funds when there is a premium on access to information. To this end, buyout-focused investments will likely be a better area for most family offices.
• Co-investments versus standalone: Co-investments seem like a natural first step when developing a direct-investment program. The advantage of co-investing is leveraging the underwriting work of the GP. The challenge is to avoid the potential anti-selection bias and the risks tied to too much capital being allocated to a specific deal or sector. These situations are typically associated with accelerated timelines and the co-investor is usually passive.
• Sector-focused versus generalist: Certain transactions, such as those involving life sciences and technology, require both business acumen and technical expertise, and may be better suited for family offices with a strategic focus and domain expertise. Other industries may be less specialized, and the broad perspective of skilled generalists may provide an adequately strong foundation.
• Internally-resourced versus using external resources: Family offices can resource a direct investment internally or utilize third-parties to assist in a variety of functions, including market analysis, valuation support, legal and tax reviews. The key is to have a keen understanding of your own strengths and weaknesses.
• Investing alone versus with others: Investing with others may offer additional insights into the due diligence process and provide the opportunity to share resources and expenses. However, you may need to come to an understanding with your fellow investors on key issues,
including the sharing or division of costs and resources, the level of involvement of each party, and how each will deal with success or failure.
For family offices contemplating a direct-investment program, we offer the following suggestions that we believe can help set you up for success:
1. Don’t skimp on the due diligence: The nature of direct investments–individual investments in companies compared to an investment in a fund–magnifies the importance of risk management tied to idiosyncratic risks that create the potential for asymmetrical results. If you lack domain expertise or find yourself at a competitive disadvantage, seek the help of skilled third-parties or avoid investments in that space.
2. Sound governance: Put systems in place to ensure you avoid chasing deals and that support a thorough due diligence process. These include establishing and monitoring milestones and streamlining decision-making around the potential deployment of additional capital into a company when another round of financing is needed. At the time of the initial investment, it is important to know the capital needed to achieve the exit milestone as not participating in additional rounds of financing could lead to dilution of intended returns.
3. Watch out for blind spots: Understand your own bias and weakness, and avoid operating in a vacuum where they can impair the decision-making process. Make sure the size of the investment is appropriate, the organization is equipped to deal with challenges associated with the investments, and the investment program is designed to complement your other portfolio holdings.
Endnotes1. A Limited Partner’s minority equity investment into
a company, which is alongside the lead sponsor’s investment, typically a Fund’s General Partner.
2. “More HNWs Ditching Private Equity for Direct Investments,” ThinkAdvisor. Emily Zulz (February 2018).
3. https://www.cbinsights.com/research/report/corporate-venture-capital-history/.
4. 3Q 2018 PitchBook NVCA Venture Monitor.
5. Gompers and Lerner, 1999; Metrick and Yasuda, 2010
6. https://www.privateequityinternational.com/wanted-by-lps-efficient-fund-management/.
7. "A Note on Direct Investing in Private Equity," Ludovic Phalippou, Associate Professor of Finance, Said Business School, University of Oxford.
8. "The Disintermediation of Financial Markets: Direct Investing in Private Equity," Lily Fang (INSEAD), Victoria Ivashina (Harvard University and NBER), Josh Lerner (Harvard University and NBER) (September 3, 2014).

Direct InvestmentsQuarter 3 • 2019
59
Paul R. Kenney, Jr., CFA NEPC
Paul joined NEPC in April of 2002, with investment experience dating back to 1984. Paul heads NEPC’s Detroit office and has served as a consulting team leader twice during his tenure leading both NEPC’s Corporate DB and Healthcare teams; his consulting responsibilities include servicing
healthcare systems, corporate pension plans, endowments & foundations and private wealth clients.
Prior to joining NEPC, Paul was employed for eight years by Ford Motor Company. In his most recent position as a member of Ford’s Pension Asset Management Department, Paul was the manager of Ford’s $37 billion U.S. Defined Benefit Plan. His responsibilities included investment policy formulation, developing and implementing asset allocation strategies, and monitoring and evaluating the investment performance of the plan and its managers. Prior to joining the Pension Asset Management Department, Paul was the portfolio manager for Ford’s $3 billion international cash portfolio. Paul started his career at Ford as the portfolio manager for Ford Life Insurance Company, where he managed the assets and liabilities associated with a $3 billion annuity portfolio.
Prior to working at Ford, Paul was employed for four years by John Hancock Financial Services where he worked in a variety of positions within the treasury, insurance and investment areas of the company.
Paul has an M.S.F. degree from Bentley College (1988) and a B.A. from Saint Michael’s College in Vermont (1983). He is a CFA charterholder and is a member of the CFA Institute.
Author Bio

The CAIA Endowment: Investable Index
The CAIA Endowment Investable Index Hossein KazemiKathryn Wilkens, CAIA Pearl Quest
60
We present the historical weights, allocation as of month-end June 2019, and historical performance to the replication portfolio that was introduced in our AIAR publication Volume 6 Issue 1.The graph on the following page shows the exposures of the Multi-Asset ETF portfolio through time. It is important to note that the volatility displayed by these exposures does not imply that endowments alter their asset allocations as frequently as the Multi-Asset ETF portfolio. While an endowment may hold a fixed allocation to various asset classes, the underlying assets/manager may display time-varying exposures to different sources of risk. For instance, a hedge fund manager may decide to increase her fund’s exposure to energy stocks while reducing the fund’s exposure to healthcare stocks. Though the endowment’s allocation to that manager has remained unchanged, its exposures to energy and healthcare sectors have changed. Also, if returns on two asset classes are highly correlated, then the algorithm will pick the one that is less volatile. For instance, if returns on venture capital and small cap stocks are highly correlated, then the program will pick the small cap index if it turns out to be less volatile.
Hossein Kazemi, Ph.D., CFACAIA AssociationIsenberg School of Managment,University of Massachusetts Amherst
Dr. Hossein Kazemi is the Senior Advisor to the CAIA Association’s Program. Dr. Kazemi has been involved with the CAIA Association since its inception as a senior advisor
and a managing director. In his current role, he helps with the development of the CAIA program's curriculum and directs the CAIA Association’s academic partnership program. In addition, he serves as the editor of Alternative Investment Analyst Review, which is published by the Association. He has worked with universities and industry organizations to introduce them to the CAIA program. Dr. Kazemi is Michael and Cheryl Philipp Distinguished Professor of Finance at the Isenberg School of Management, the University of Massachusetts - Amherst. He is the Director of the Center for International Securities & Derivatives Markets, a nonprofit organization devoted to research in the area of alternative investments, a co-founder of the CAIA Association, and home to CISDM Hedge Fund/CTA Database and the Journal of Alternative Investments, the official research publication of the CAIA Association. He has over 25 years of experience in the financial industry and has served as consultant to major financial institutions. His research has been in the areas of valuations of equity and fixed income securities, asset allocation for traditional and alternative asset classes, and evaluation and replication of active management investment products. He has a Ph.D. in finance from the University of Michigan.
Kathryn Wilkens, Ph.D., CAIAPearl Quest LLC
Kathryn Wilkens, Ph.D., CAIA is a curriculum and exam advisor to the Financial Data Professional Institute and the founder of Pearl Quest LLC, a consulting firm. She is also a copy editor for the Journal of Alternative Investments and subject matter expert for the Chartered Alternative
Investment Analyst exams on Wiley's Efficient Learning Platform. Kathryn has published several journal articles and book chapters on investments and edited the first edition of the CAIA textbooks. Pearl Quest was founded in 2011 and creates data science applications for investments.

The CAIA Endowment:: Investable IndexQuarter 3 • 2019
61
Endowment Index Weights
Equity
Equity Based Commodities
Commodities
High Yield
Fixed Income
Private Equity
Real Estate
Cash
0%
10%
20%
30%
40%
50%
60%
70%
80%
90%
100%
12/1
/199
95/
1/20
0010
/1/2
000
3/1/
2001
8/1/
2001
1/1/
2002
6/1/
2002
11/1
/200
24/
1/20
039/
1/20
032/
1/20
047/
1/20
0412
/1/2
004
5/1/
2005
10/1
/200
53/
1/20
068/
1/20
061/
1/20
076/
1/20
0711
/1/2
007
4/1/
2008
9/1/
2008
2/1/
2009
7/1/
2009
12/1
/200
95/
1/20
1010
/1/2
010
3/1/
2011
8/1/
2011
1/1/
2012
6/1/
2012
11/1
/201
24/
1/20
139/
1/20
132/
1/20
147/
1/20
1412
/1/2
014
5/1/
2015
10/1
/201
53/
1/20
168/
1/20
161/
1/20
176/
1/20
1711
/1/2
017
4/1/
2018
9/1/
2018
2/1/
2019
Endowment Index Weights
Equity Equity Based Commodities Commodities High Yield Fixed Income Private Equity Real Estate Cash
Historical Performance
$461.33
$-
$50.00
$100.00
$150.00
$200.00
$250.00
$300.00
$350.00
$400.00
$450.00
$500.00
9/1/
1999
3/1/
2000
9/1/
2000
3/1/
2001
9/1/
2001
3/1/
2002
9/1/
2002
3/1/
2003
9/1/
2003
3/1/
2004
9/1/
2004
3/1/
2005
9/1/
2005
3/1/
2006
9/1/
2006
3/1/
2007
9/1/
2007
3/1/
2008
9/1/
2008
3/1/
2009
9/1/
2009
3/1/
2010
9/1/
2010
3/1/
2011
9/1/
2011
3/1/
2012
9/1/
2012
3/1/
2013
9/1/
2013
3/1/
2014
9/1/
2014
3/1/
2015
9/1/
2015
3/1/
2016
9/1/
2016
3/1/
2017
9/1/
2017
3/1/
2018
9/1/
2018
3/1/
2019
9/1/
2019
Multi-Asset ETF: Q3/1999-Q3/2019

The List: Alternative Indices
62
The performance table, on the following page, is a collection of both traditional and alternative indices for the 1, 5, and 10-year period annualized through June 2019. Both the annualized volatility and draw-down figures are calculated using a 10 year quarterly return series. Alternative investments have been growing markedly over the past few years, creating a multitude of opportunities for owners and allocators alike. As the number and type of alternative asset classes continue to proliferate, we believe they are playing a more unique role in assisting investors achieve their desired investment outcomes. As we expect this trend to continue, we found it necessary to structure a pure alternative assets portfolio to have visibility in this exciting marketplace. We set out to strike a balance between available assets in proportion to their market value, and to reflect the average “alternative investor”. We defined the investment opportunity to simply be the following three assets classes: Real Asset, Private Equity/Venture Capital, and Hedge Funds. Real assets are comprised of real estate, commodities, timberland, farmland, and infrastructure; within real asset the weights were structured to reflect the market portfolio1 within that universe. To arrive at our weight’s, we researched various endowments and foundations, as well as surveys conducted by Willis Towers Watson and Russell Investments. Based on our research, alternative historical allocations have not had material deviation and therefore we decided to implement a market weight of 1/3 across each of those asset classes. A few of the constituents are not investable, and some may be reported gross or net of fee.
The List: Alternative Indices

63Quarter 1 • 2019 The List: Alternative IndicesThe List Alternative IndicesQuarter 3 • 2019
63
Founded in 2002, the Chartered Alternative Investment Analyst (CAIA) Association is the global authority in alternative investment education. The CAIA Association is best known for the CAIA Charter®, an internationally recognized finance credential and the gateway to a network of more than 10,000 alternative investment leaders in more than 95 countries.
GET SMART. STAY SMART.
Source: CAIA, CISDM, HFRI, Cambridge Associates and Bloomberg
Ending June 2019
1. Global Investment Capital Market by Hewitt EnnisKnupp, an Aon Company

64Submission Guidelines
Submission Guidelines
Article Submission: To submit your article for consideration to be published, please send the file to [email protected].
File Format: Word Documents are preferred, with any images embedded as objects into the document prior to submission.
Abstract: On the page following the title page, please provide a brief summary or abstract of the article.
Exhibits: Please put tables and graphs on separate individual pages at the end of the paper. Do not integrate them with the text; do not call them Table 1 and Figure 1. Please refer to any tabular or graphical materials as Exhibits, and number them using Arabic numerals, consecutively in order of appearance in the text. We reserve the right to return to an author for reformatting any paper accepted for publication that does not conform to this style.
Exhibit Presentation: Please organize and present tables consistently throughout a paper, because we will print them the way they are presented to us. Exhibits may be created in color or black and white. Please make sure that all categories in an exhibit can be distinguished from each other. Align numbers correctly by decimal points; use the same number of decimal points for the same sorts of numbers; center headings, columns, and numbers correctly; use the exact same language in successive appearances; identify any bold-faced or italicized entries in exhibits; and provide any source notes necessary. Please be consistent with fonts, capitalization, and abbreviations in graphs throughout the paper, and label all axes and lines in graphs clearly and consistently. Please supply Excel files for all of the exhibits.
Equations: Please display equations on separate lines. They should be aligned with the paragraph indents, but not followed by any punctuation. Number equations consecutively throughout the paper, using Arabic numerals at the right-hand margin. Clarify, in handwriting, any operation signs or Greek letters, or any notation that may be unclear. Leave space around operation signs like plus and minus everywhere. We reserve the right to return for resubmitting any accepted article that prepares equations in any other way. Please provide mathematical equations in an editable format (e.g., Microsoft Word, using either Equation Editor or MathType).
Reference Citations: In the text, please refer to authors and works as: Smith (2000). Use parenthesis for the year, not brackets. The same is true for references within parentheses, such as: (see also Smith, 2000).
Endnotes: Please use endnotes, rather than footnotes. Endnotes should only contain material that is not essential to the understanding of an article. If it is essential, it belongs in the text. Bylines will be derived from biographical information, which must be indicated in a separate section; they will not appear as footnotes. Authors’ bio information appearing in the article will be limited to titles, current affiliations, and locations. Do not include full reference details in endnotes; these belong in a separate references list; see next page. We will delete non-essential endnotes in the interest of minimizing distraction and enhancing clarity. We also reserve the right to return to an author any article accepted for publication that includes endnotes with embedded reference detail and no separate references list in exchange for preparation of a paper with the appropriate endnotes and a separate references list.

Submission GuidelinesQuarter 3 • 2019
65
Submission Guidelines
CAIA.org
References List: Please list only those articles cited, using a separate alphabetical references list at the end of the paper. We reserve the right to return any accepted article for preparation of a references list according to this style.
Author Guidelines: The CAIA Association places strong emphasis on the literary quality of our article selections.
Please follow our guidelines in the interests of acceptability and uniformity, and to accelerate both the review and editorial process for publication. The review process normally takes 8-12 weeks. We will return to the author for revision any article, including an accepted article, that deviates in large part from these style instructions. Meanwhile, the editors reserve the right to make further changes for clarity and consistency.
All submitted manuscripts must be original work that has not been submitted for inclusion in another form such as a journal, magazine, website, or book chapter. Authors are restricted from submitting their manuscripts elsewhere until an editorial decision on their work has been made by the CAIA Association’s AIAR Editors.
Copyright: At least one author of each article must sign the CAIA Association’s copyright agreement form—giving us non-exclusive rights to publish the material in all media—prior to publication.
Upon acceptance of the article, no further changes are allowed, except with the permission of the editor. If the article has already been accepted by our production department, you must wait until you receive the formatted article PDF, at which time you can communicate via e-mail with marked changes.
About the CAIA Association
Founded in 2002, the Chartered Alternative Investment Analyst (CAIA) Association® is the international leader in alternative investment education and provider of the CAIA designation, the alternative industry benchmark. The Association grants the CAIA charter to industry practitioners upon the successful completion of a rigorous two-level qualifying exam. Additionally, it furthers the Association’s educational mandate through the dissemination of research, webinars, and videos. CAIA supports three publications for members: AllAboutAlpha.com, The Journal of Alternative Investments, and the Alternative Investment Analyst Review. CAIA members connect globally via networking and educational events, as well as social media.

Chartered Alternative Investment Analyst Association®Q3 2019, Volume 8, Issue 3