The Yamanashi Chuo Bank, Ltd. The 20th Analyst Meeting
43
June 7, 2011 (Tue) ・ Fiscal 2010 Business Results ・ Forecasts for the Current Term (FY11) The Yamanashi Chuo Bank, Ltd. The 20th Analyst Meeting - 0 -
-
Upload
khangminh22 -
Category
Documents
-
view
0 -
download
0
Transcript of The Yamanashi Chuo Bank, Ltd. The 20th Analyst Meeting
June 7, 2011 (Tue)
・ Fiscal 2010 Business Results・ Forecasts for the Current Term (FY11)
The Yamanashi Chuo Bank, Ltd.The 20th Analyst Meeting
- 0 -
- 1 -
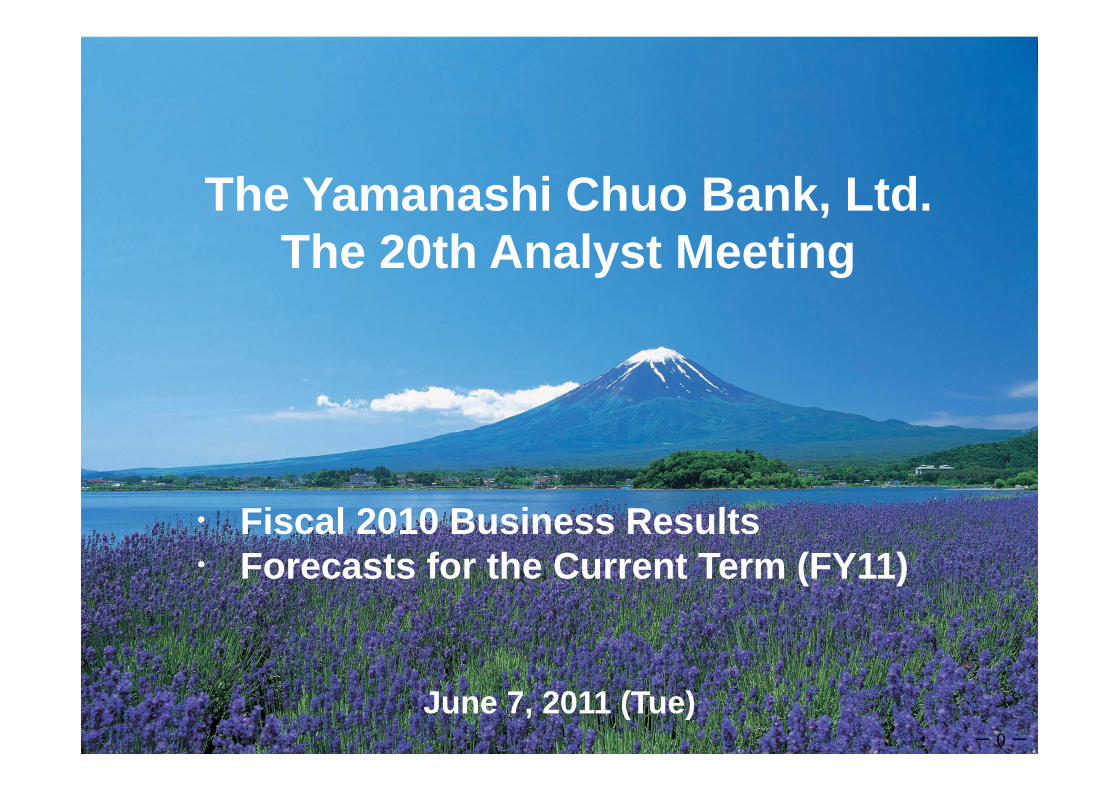
Contents
I Fiscal 2010 Business Results
IV Forecasts for the Current Term (FY2011)
Medium-Term Management Plan‘Future Creation Plan 2013’ 13
Plan Duration 14Quantitative Targets 15
II Medium-Term Management Plan (Future Creation Plan 2013)
III Economic Trends in Yamanashi Prefecture
Business Trends 17Creation of New Industries 18Preparations for High-Speed Transportation Network
19
Earnings Forecasts for the Current Term (FY2011) 21
Plan for Deposits 22
Financial Products Sales Plan 23
Plan for Loans 24
Corporate Banking Strategies 25
Personal Banking Strategies 29
Western Tokyo Area Strategies 31
Plan for Investment in Marketable Securities 35
Operating Expenses and OHR (Trends and Forecasts) 37
Initiatives to Cutback Expenses and Effective
Utilization of Human Resources 38
Credit Cost (Trends and Forecasts) 39
Yields & Interest Margins (Trends and Forecasts) 40
Return to Shareholders 41
Fiscal 2010 Business Results (Summary) 4Deposits 5Loans 6Securities 7Fees and Commissions 9Mandatory Disclosure of Bad Debt under the Financial Reconstruction Law 10
Capital Ratio (Non-Consolidated Basis) 11
Profile 2
- 2 -
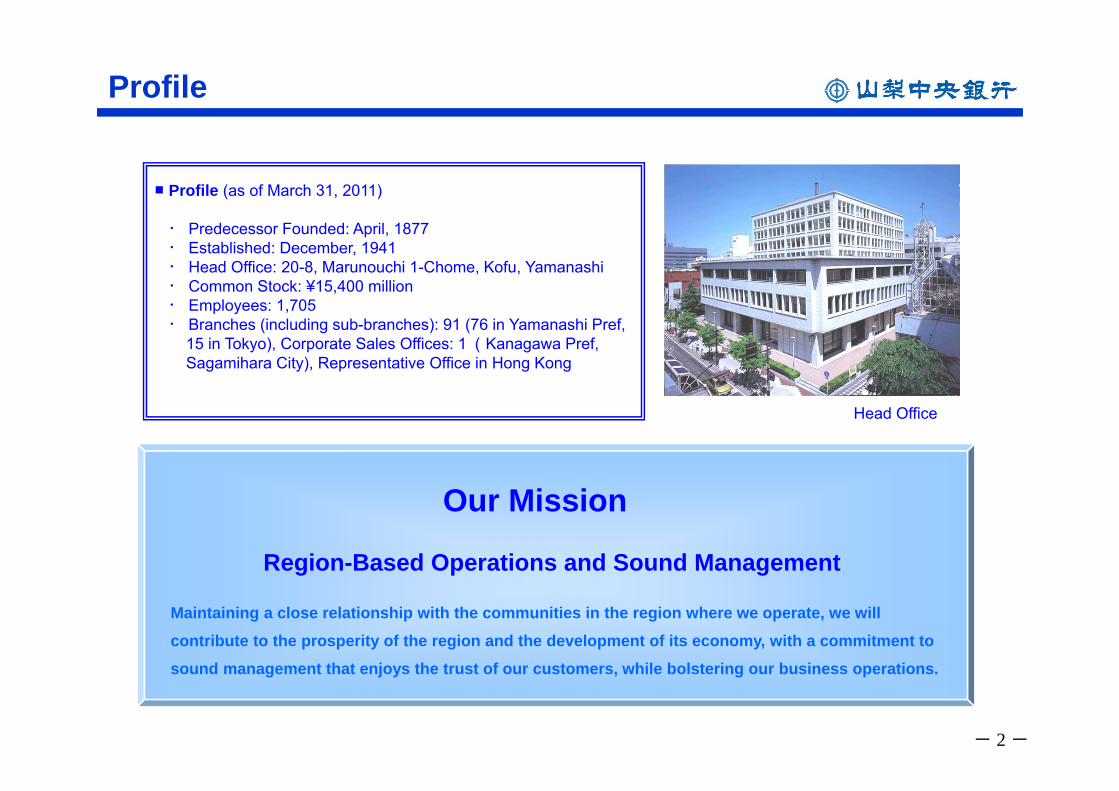
■ Profile (as of March 31, 2011)
・ Predecessor Founded: April, 1877・ Established: December, 1941・ Head Office: 20-8, Marunouchi 1-Chome, Kofu, Yamanashi・ Common Stock: ¥15,400 million・ Employees: 1,705・ Branches (including sub-branches): 91 (76 in Yamanashi Pref,
15 in Tokyo), Corporate Sales Offices:1(Kanagawa Pref, Sagamihara City), Representative Office in Hong Kong
Maintaining a close relationship with the communities in the region where we operate, we will
contribute to the prosperity of the region and the development of its economy, with a commitment to
sound management that enjoys the trust of our customers, while bolstering our business operations.
Head Office
Region-Based Operations and Sound Management
Our Mission
Profile
- 3 -
I Fiscal 2010 Business Results
- 4 -
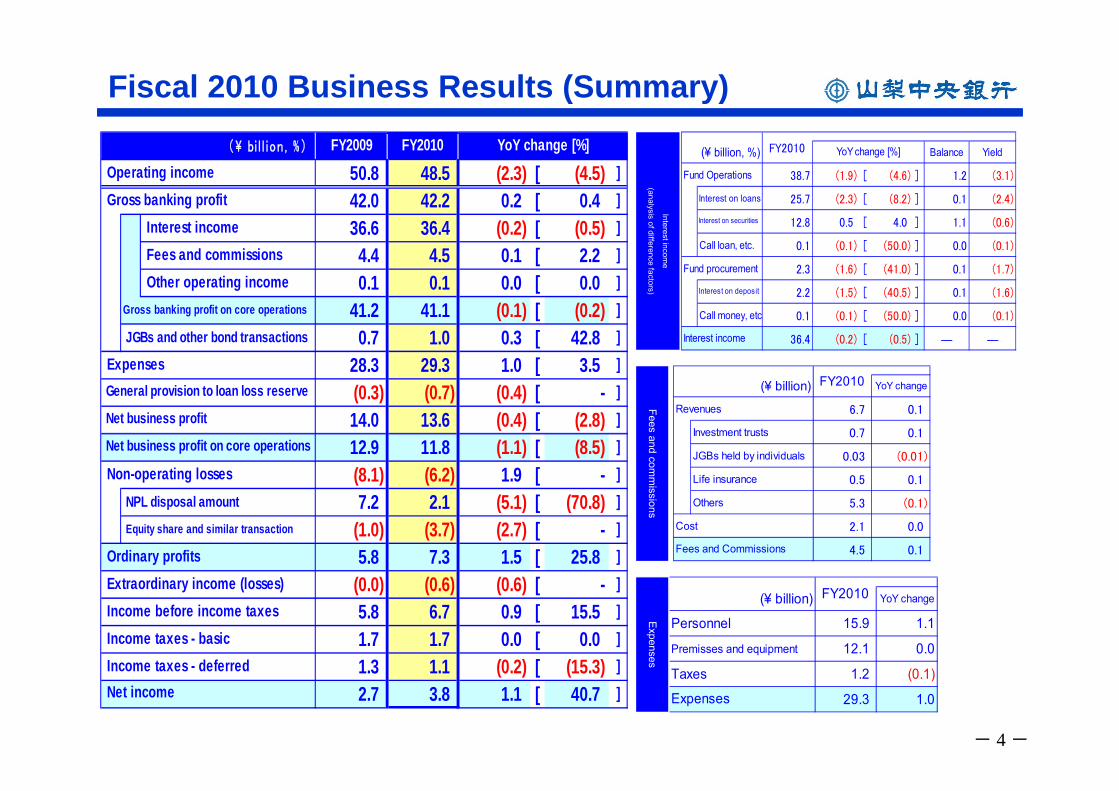
Fiscal 2010 Business Results (Summary)
(¥ billion) YoY change
Personnel 15.9 1.1
Premisses and equipment 12.1 0.0
Taxes 1.2 (0.1)
29.3 1.0Expenses
FY2010
(¥ billion) YoY change
Revenues 6.7 0.1
Investment trusts 0.7 0.1
JGBs held by individuals 0.03 (0.01)
Life insurance 0.5 0.1
Others 5.3 (0.1)
Cost 2.1 0.0
4.5 0.1Fees and Commissions
FY2010
(¥ billion, %) Balance Yield
Fund Operations 38.7 (1.9) [ (4.6) ] 1.2 (3.1)
Interest on loans 25.7 (2.3) [ (8.2) ] 0.1 (2.4)
Interest on securities 12.8 0.5 [ 4.0 ] 1.1 (0.6)
Call loan, etc. 0.1 (0.1) [ (50.0) ] 0.0 (0.1)
Fund procurement 2.3 (1.6) [ (41.0) ] 0.1 (1.7)
Interest on deposit 2.2 (1.5) [ (40.5) ] 0.1 (1.6)
Call money, etc 0.1 (0.1) [ (50.0) ] 0.0 (0.1)
36.4 (0.2) [ (0.5) ] ― ―Interest income
YoY change [%]FY2010FY2009 FY2010Operating income 50.8 48.5 (2.3) [ (4.5) ]Gross banking profit 42.0 42.2 0.2 [ 0.4 ]
Interest income 36.6 36.4 (0.2) [ (0.5) ]Fees and commissions 4.4 4.5 0.1 [ 2.2 ]
Other operating income 0.1 0.1 0.0 [ 0.0 ]
41.2 41.1 (0.1) [ (0.2) ]JGBs and other bond transactions 0.7 1.0 0.3 [ 42.8 ]
28.3 29.3 1.0 [ 3.5 ]
(0.3) (0.7) (0.4) [ - ]
14.0 13.6 (0.4) [ (2.8) ]
12.9 11.8 (1.1) [ (8.5) ]
(8.1) (6.2) 1.9 [ - ]NPL disposal amount 7.2 2.1 (5.1) [ (70.8) ]
(1.0) (3.7) (2.7) [ - ]
5.8 7.3 1.5 [ 25.8 ]
(0.0) (0.6) (0.6) [ - ]
5.8 6.7 0.9 [ 15.5 ]
1.7 1.7 0.0 [ 0.0 ]
1.3 1.1 (0.2) [ (15.3) ]
2.7 3.8 1.1 [ 40.7 ]
YoY change [%](\ bi l l ion , %)
Net business profit on core operations
General provision to loan loss reserve
Expenses
Net business profit
Gross banking profit on core operations
Net income
Non-operating losses
Ordinary profitsExtraordinary income (losses)Income before income taxesIncome taxes - basicIncome taxes - deferred
Equity share and similar transaction
Interest income
(analysis of difference factors)Fees and com
missions
Expenses
- 5 -
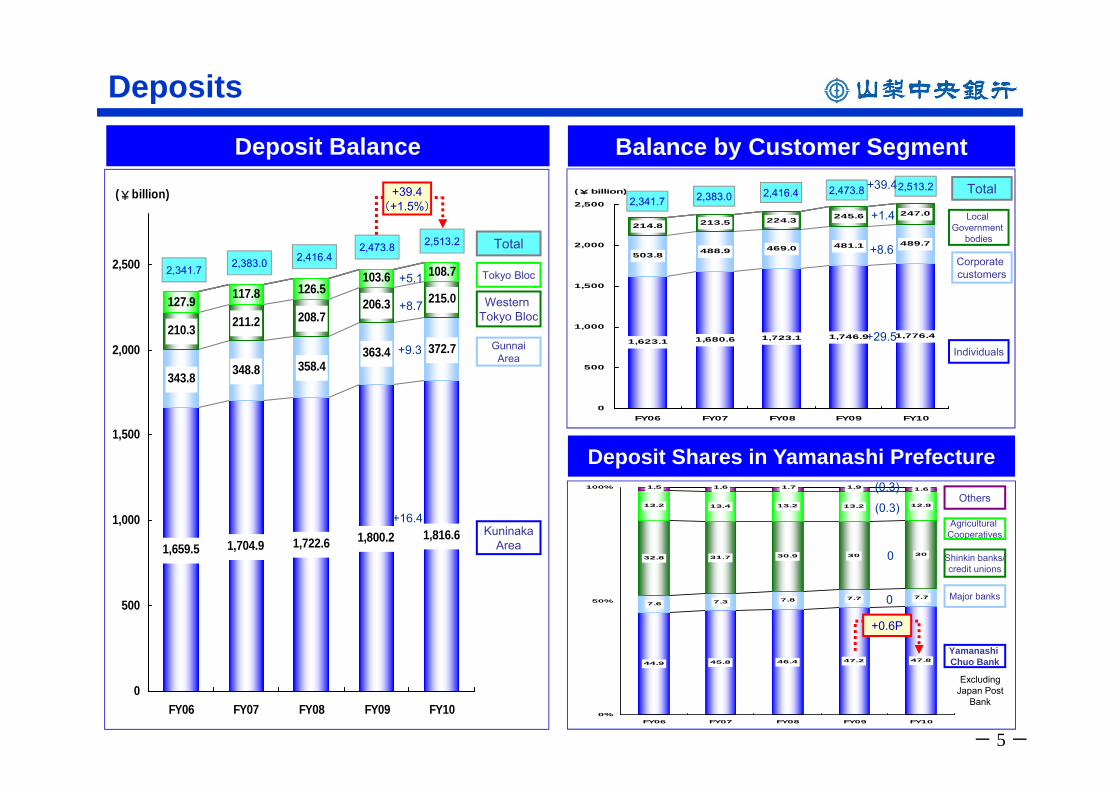
343.8 348.8 358.4363.4 372.7
215.0127.9 117.8 126.5103.6 108.7
1,659.5 1,704.9 1,722.6 1,800.2 1,816.6
206.3208.7211.2210.3
0
500
1,000
1,500
2,000
2,500
FY06 FY07 FY08 FY09 FY10
(¥billion)
1,623.1 1,680.6 1,723.1 1,746.9 1,776.4
503.8 488.9 469.0 481.1 489.7
214.8 213.5 224.3 245.6 247.0
0
500
1,000
1,500
2,000
2,500
FY06 FY07 FY08 FY09 FY10
(¥billion)
Balance by Customer SegmentDeposit Balance
Deposits
KuninakaArea
Western Tokyo Bloc
Total
Individuals
Corporate customers
Total
Local Government
bodies
2,473.82,341.7
Deposit Shares in Yamanashi Prefecture
Tokyo Bloc2,341.72,416.4
44.9 45.8 46.4 47.2 47.8
7.6 7.3 7.8 7.7
32.8 31.7 30.9 30 30
13.2 13.4 13.2 13.2 12.9
1.6
7.7
1.91.71.61.5
0%
50%
100%
FY06 FY07 FY08 FY09 FY10
Excluding Japan Post
Bank
Yamanashi Chuo Bank
Shinkin banks/credit unions
Major banks
2,416.4
2,513.2
2,383.0
2,383.02,513.2
GunnaiArea
Others
Agricultural Cooperatives
2,473.8
+0.6P
+5.1
+8.7
+9.3
+16.4
+29.5
+8.6
+1.4
+39.4+39.4(+1.5%)
0
0
(0.3)
(0.3)
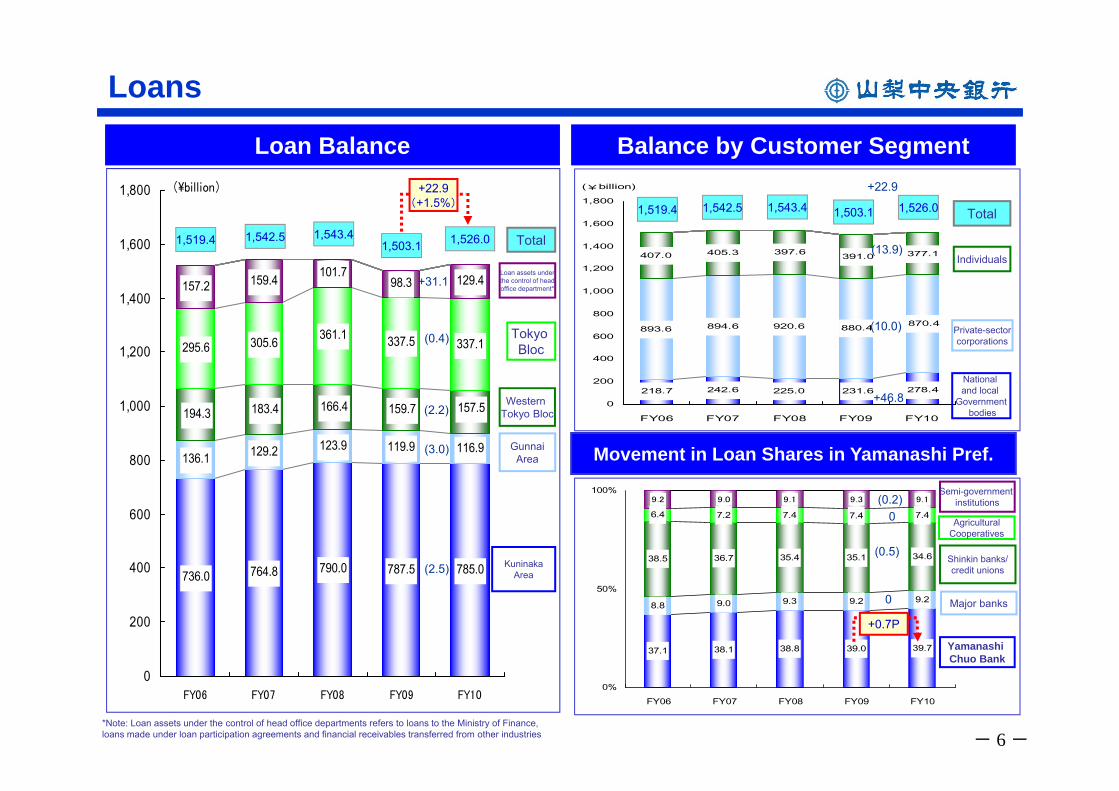
- 6 -
Loan Balance
893.6 894.6 920.6
407.0 405.3
225.0242.6218.7 231.6 278.4
870.4880.4
397.6 377.1391.0
0
200
400
600
800
1,000
1,200
1,400
1,600
1,800
FY06 FY07 FY08 FY09 FY10
(¥billion)
736.0 764.8 790.0 787.5 785.0
136.1 129.2 123.9 119.9 116.9
295.6 305.6 361.1 337.5
157.2 159.4 101.798.3 129.4
194.3 183.4 159.7 157.5166.4
337.1
0
200
400
600
800
1,000
1,200
1,400
1,600
1,800
FY06 FY07 FY08 FY09 FY10
(\billion)
Balance by Customer Segment
Loans
Kuninaka Area
Western Tokyo Bloc
TotalIndividuals
Private-sectorcorporations
National and local
Governmentbodies
Total
1,542.5
Movement in Loan Shares in Yamanashi Pref.
Tokyo Bloc
1,543.41,503.1
37.1 38.1 38.8 39.0 39.7
8.8 9.0 9.3 9.2 9.2
38.5 36.7 35.4 35.1 34.6
6.4 7.2 7.4 7.4 7.4
9.2 9.0 9.1 9.3 9.1
0%
50%
100%
FY06 FY07 FY08 FY09 FY10
1,526.0
Loan assets under the control of head office department*
*Note: Loan assets under the control of head office departments refers to loans to the Ministry of Finance, loans made under loan participation agreements and financial receivables transferred from other industries
1,519.4
Gunnai Area
Yamanashi Chuo Bank
Shinkin banks/credit unions
Major banks
Semi-government institutions
AgriculturalCooperatives
1,519.4 1,542.5 1,543.4 1,503.1 1,526.0
+0.7P
(10.0)
(13.9)
+46.8
+22.9
+31.1
(0.4)
(2.2)
(3.0)
(2.5)
+22.9(+1.5%)
0
(0.5)
0(0.2)
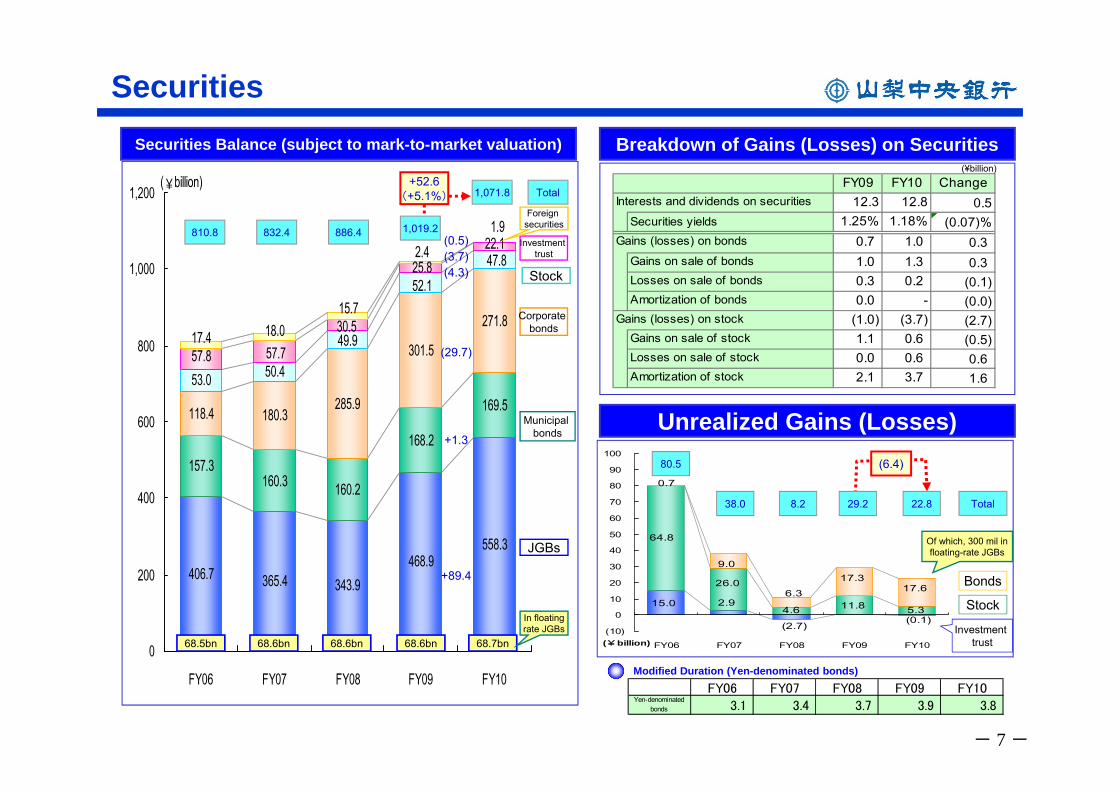
- 7 -
Securities Balance (subject to mark-to-market valuation)
406.7 365.4 343.9468.9
558.3
157.3160.3 160.2
168.2
169.5118.4 180.3285.9
301.5
271.8
53.0 50.4
49.9
52.147.8
57.8
25.8
57.730.5
22.11.9
2.4
18.015.7
17.4
0
200
400
600
800
1,000
1,200
FY06 FY07 FY08 FY09 FY10
(¥billion)
832.4
JGBs
Municipal bonds
Corporate bonds
Stock
Investment trust
Foreign securities
Securities
886.4
68.7bn68.6bn68.6bn
Total
810.8
1,071.8
Unrealized Gains (Losses)
15.0 2.9
(0.1)(2.7)
64.8
11.8 5.34.6
26.0
0.7
17.617.3
9.0
6.3
(10)
0
10
20
30
40
50
60
70
80
90
100
FY06 FY07 FY08 FY09 FY10(¥billion)
80.5
8.238.0 22.8 Total
Of which, 300 mil in floating-rate JGBs
Investment trust
Bonds
Stock
FY09 FY10 Change12.3 12.8 0.5
Securities yields 1.25% 1.18% (0.07)%0.7 1.0 0.3
Gains on sale of bonds 1.0 1.3 0.3Losses on sale of bonds 0.3 0.2 (0.1)Amortization of bonds 0.0 - (0.0)
(1.0) (3.7) (2.7)Gains on sale of stock 1.1 0.6 (0.5)Losses on sale of stock 0.0 0.6 0.6Amortization of stock 2.1 3.7 1.6
Gains (losses) on bonds
Gains (losses) on stock
Interests and dividends on securities
Breakdown of Gains (Losses) on Securities
FY06 FY07 FY08 FY09 FY10Yen-denominated
bonds 3.1 3.4 3.7 3.9 3.8
Modified Duration (Yen-denominated bonds)
68.6bn68.5bn
(¥billion)
In floating rate JGBs
+52.6(+5.1%)
1,019.2
+89.4
(29.7)
(4.3)
+1.3
(3.7)(0.5)
(6.4)
29.2
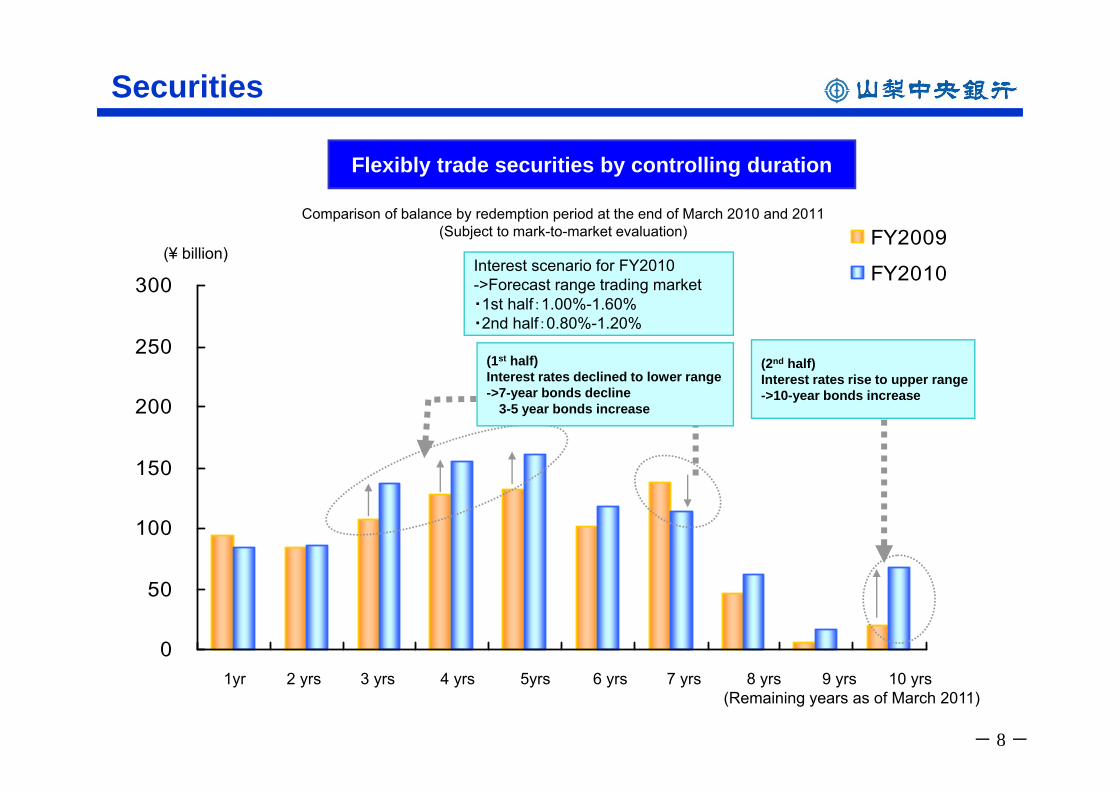
- 8 -
0
50
100
150
200
250
300
2011 2012 2013 2014 2015 2016 2017 2018 2019 2020
FY2009FY2010
Flexibly trade securities by controlling duration
(¥ billion)
(1st half)Interest rates declined to lower range->7-year bonds decline
3-5 year bonds increase
1yr 2 yrs 3 yrs 4 yrs 5yrs 6 yrs 7 yrs 8 yrs 9 yrs 10 yrs(Remaining years as of March 2011)
Interest scenario for FY2010 ->Forecast range trading market・1st half:1.00%-1.60%・2nd half:0.80%-1.20%
(2nd half)Interest rates rise to upper range->10-year bonds increase
Securities
Comparison of balance by redemption period at the end of March 2010 and 2011(Subject to mark-to-market evaluation)
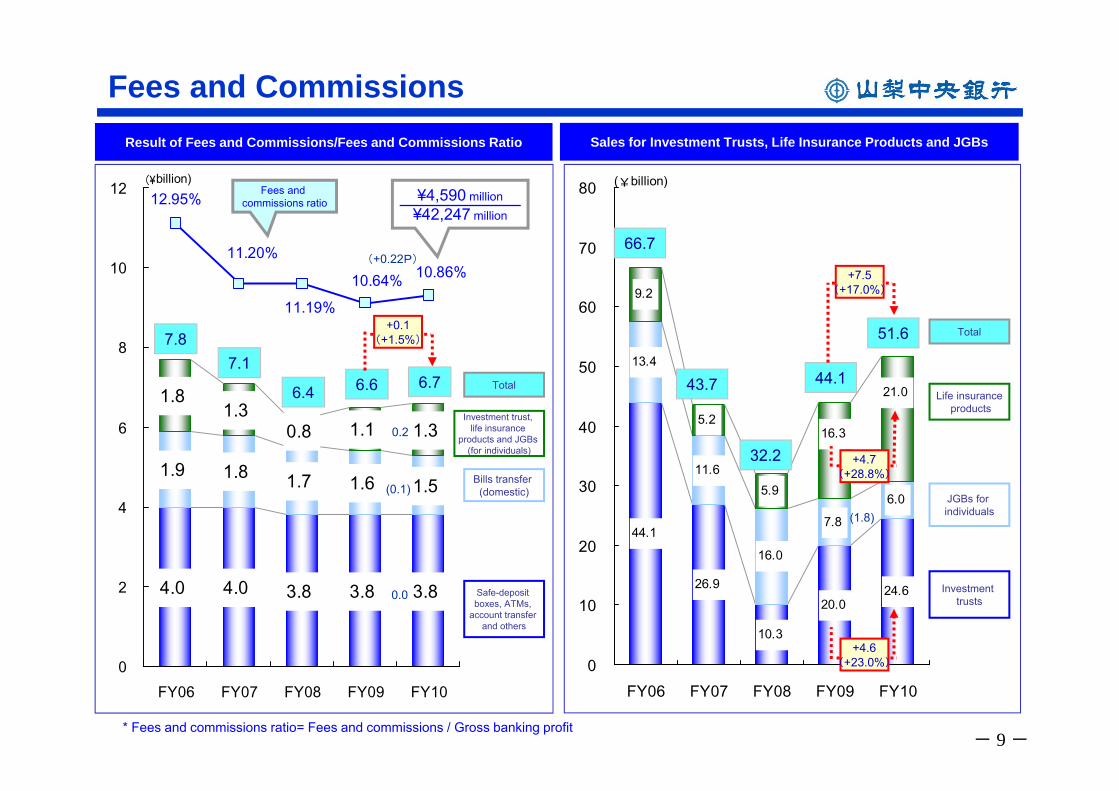
- 9 -
4.0 4.0 3.8 3.8 3.8
1.9 1.8 1.7 1.6 1.5
1.81.3
0.8 1.1 1.3
12.95%
11.20%
11.19%10.64% 10.86%
0
2
4
6
8
10
12
FY06 FY07 FY08 FY09 FY10
(\billion)
7.8
Fees and Commissions
* Fees and commissions ratio= Fees and commissions / Gross banking profit
6.6
Fees and commissions ratio ¥4,590 million
¥42,247 million
Total
Bills transfer (domestic)
Safe-deposit boxes, ATMs,
account transfer and others
Investment trust, life insurance
products and JGBs (for individuals)
6.4
Result of Fees and Commissions/Fees and Commissions Ratio
44.1
26.9
10.3
20.024.6
13.4
11.6
16.0
7.8
6.0
9.2
5.2
5.9
21.0
16.3
0
10
20
30
40
50
60
70
80
FY06 FY07 FY08 FY09 FY10
(¥billion)
Sales for Investment Trusts, Life Insurance Products and JGBs
Investment trusts
JGBs for individuals
Life insuranceproducts
66.7
43.7
32.2
44.1
51.6 Total
6.77.1
0.2
(0.1)
0.0
(1.8)
(+0.22P)
+0.1(+1.5%)
+7.5(+17.0%)
+4.6(+23.0%)
+4.7(+28.8%)

- 10 -
Bad Debt under the Financial Reconstruction Law
Mandatory Disclosure of Bad Debt under the Financial Reconstruction Law
16.77.3
43.448.9
35.3 33.1 37.0
19.4 27.8
27.6 29.3 14.6
2.33.1 1.4
3.51%
5.16%5.39%
4.24%
4.21%
0
30
60
90
120
150
180
FY06 FY07 FY08 FY09 FY10
(¥billion)
63.8
79.5
66.2
Bankrupt and quasi-bankrupt
claims
Claims requiring supervision
Doubtful claims
NPL ratio
Total NPL
If partial charge-offs are
implemented:
3.20%
NPL Ratio
84.1
Coverage of Bad Debt under the Financial Reconstruction Law
貸倒引当金
貸倒引当金
担保・保証等
Collateral and guarantees
Loan loss reserve
Claims requiring supervision
(¥billion) (¥billion)
14.6 8.6
5.9
1.12.3
0.1
27.3
8.6
Total bad debt
Covered portion
Coverageratio
100%
Bankrupt andquasi-bankrupt
claims
97.0%
Doubtful claims
53.7%
Claims requiring supervision
Coverage ratio:95.9%54.0 51.8
Bankrupt andquasi-bankrupt
claims
Loan loss reserve
Loan loss reserve
危険債権
37.0
Doubtful claims
Collateral and guarantees54.0
¥54.0 billion¥1,537.0 billion
¥63.8 billion¥1,515.7 billion
Collateral and guarantees
(14.7)
+3.9
+0.9
(0.70)P
(9.8)[(15.3)%]
- 11 -
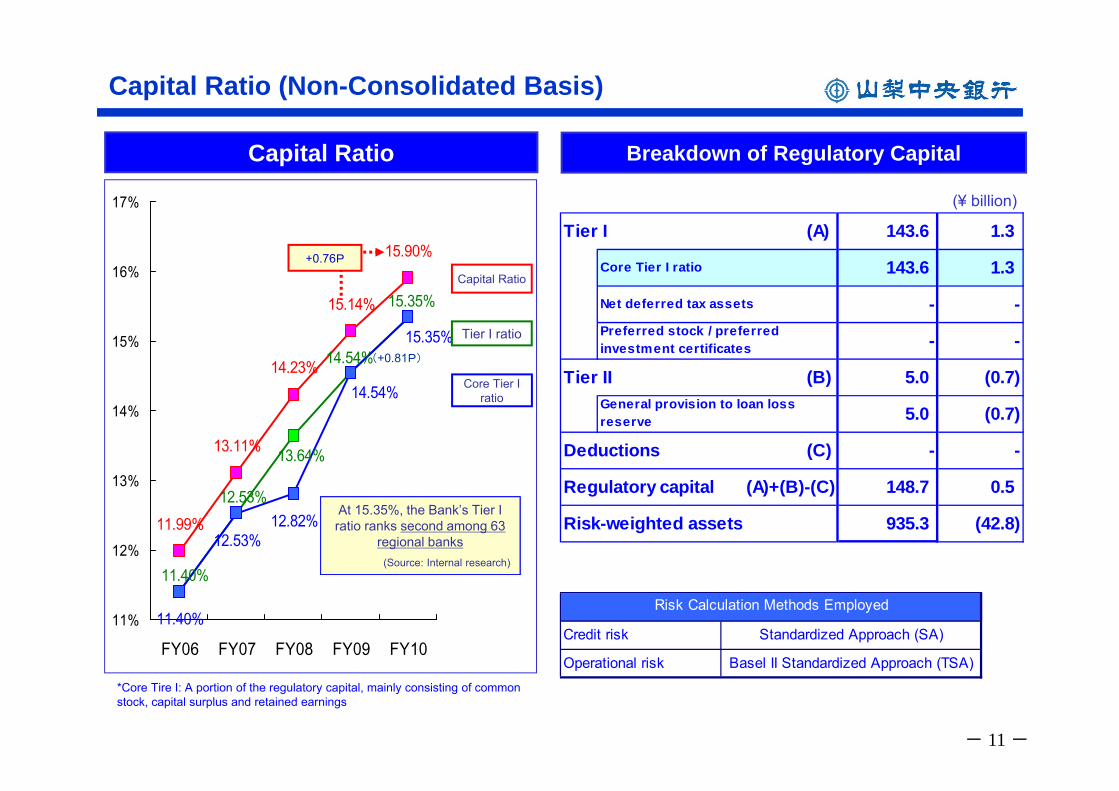
11.40%
12.53%12.82%11.99%
14.23%
15.14%
15.90%
13.11%
14.54%
13.64%
11.40%
15.35%
12.53%
15.35%
14.54%
11%
12%
13%
14%
15%
16%
17%
FY06 FY07 FY08 FY09 FY10
*Core Tire I: A portion of the regulatory capital, mainly consisting of common stock, capital surplus and retained earnings
Capital Ratio Breakdown of Regulatory Capital
(¥ billion)
Credit risk Standardized Approach (SA)
Operational risk Basel II Standardized Approach (TSA)
Risk Calculation Methods Employed
Capital Ratio (Non-Consolidated Basis)
Capital Ratio
Tier I ratio
Core Tier Iratio
Tier I (A) 143.6 1.3
Core Tier I ratio 143.6 1.3
Net deferred tax assets - -Preferred stock / preferredinvestment certificates - -
Tier II (B) 5.0 (0.7)
5.0 (0.7)
Deductions (C) - -
Regulatory capital (A)+(B)-(C) 148.7 0.5
Risk-weighted assets 935.3 (42.8)
General provision to loan lossreserve
At 15.35%, the Bank’s Tier I ratio ranks second among 63
regional banks(Source: Internal research)
+0.76P
(+0.81P)
- 12 -
II Medium-Term Management Plan(Future Creation Plan 2013)
- 13 -
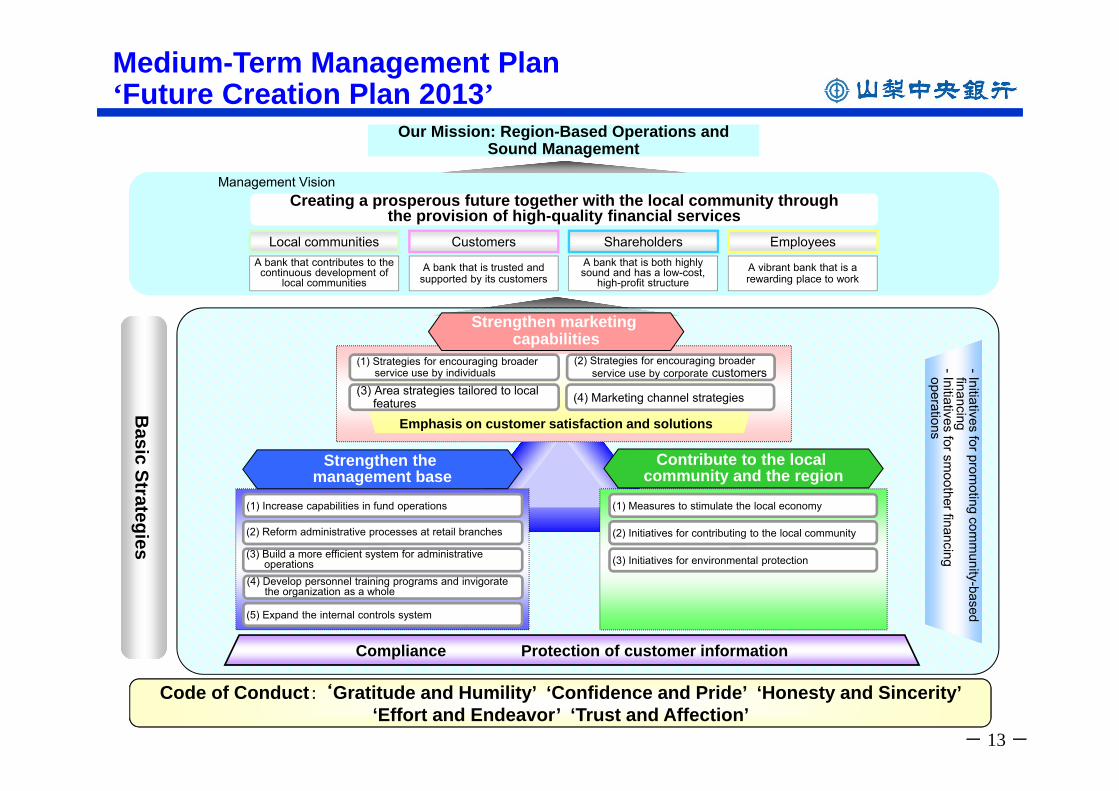
Medium-Term Management Plan ‘Future Creation Plan 2013’
Strengthen the management base
Strengthen marketing capabilities
Contribute to the local community and the region
(3) Area strategies tailored to local featuresB
asic StrategiesB
asic Strategies
(1) Increase capabilities in fund operations
(3) Build a more efficient system for administrative operations
(1) Measures to stimulate the local economy
(3) Initiatives for environmental protection
(2) Initiatives for contributing to the local community
(5) Expand the internal controls system
(2) Strategies for encouraging broaderservice use by corporate customers
(1) Strategies for encouraging broaderservice use by individuals
(2) Reform administrative processes at retail branches
(4) Marketing channel strategies
(4) Develop personnel training programs and invigoratethe organization as a whole
Emphasis on customer satisfaction and solutions
Compliance Protection of customer information
-Initiatives for promoting com
munity-based
financing -Initiatives for sm
oother financingoperations
A bank that contributes to the continuous development of
local communitiesA vibrant bank that is a rewarding place to work
A bank that is both highly sound and has a low-cost,
high-profit structureA bank that is trusted and
supported by its customers
Customers ShareholdersLocal communities Employees
Creating a prosperous future together with the local community throughthe provision of high-quality financial services
Management Vision
Our Mission: Region-Based Operations and Sound Management
Our Mission: Region-Based Operations and Sound Management
Code of Conduct: ‘Gratitude and Humility’ ‘Confidence and Pride’ ‘Honesty and Sincerity’ ‘Effort and Endeavor’ ‘Trust and Affection’
- 14 -
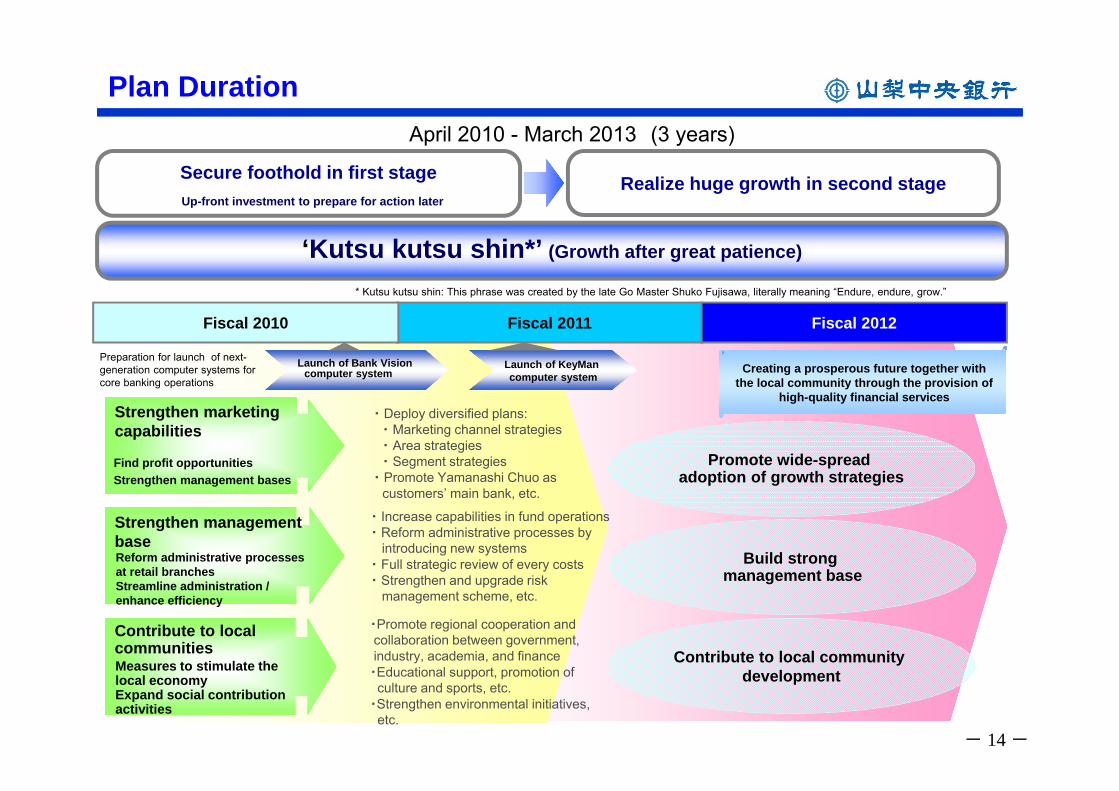
Plan Duration
Secure foothold in first stageUp-front investment to prepare for action later
Realize huge growth in second stage
‘Kutsu kutsu shin*’ (Growth after great patience)
* Kutsu kutsu shin: This phrase was created by the late Go Master Shuko Fujisawa, literally meaning “Endure, endure, grow.”
Preparation for launch of next-generation computer systems for core banking operations
Launch of Bank Vision computer system
Launch of KeyMan computer system
Contribute to local communities
Strengthen marketingcapabilities
Strengthen managementbase
Fiscal 2011 Fiscal 2012Fiscal 2010
Find profit opportunitiesStrengthen management bases
Reform administrative processesat retail branchesStreamline administration /enhance efficiency
Measures to stimulate the local economyExpand social contribution activities
・ Increase capabilities in fund operations・ Reform administrative processes by
introducing new systems ・ Full strategic review of every costs・ Strengthen and upgrade risk
management scheme, etc.
Contribute to local community development
Creating a prosperous future together with the local community through the provision of
high-quality financial services
・Promote regional cooperation and collaboration between government, industry, academia, and finance・Educational support, promotion of culture and sports, etc.
・Strengthen environmental initiatives, etc.
Build strong management base
Promote wide-spread adoption of growth strategies
April 2010 - March 2013 (3 years)
・ Deploy diversified plans:・ Marketing channel strategies・ Area strategies・ Segment strategies
・ Promote Yamanashi Chuo as customers’ main bank, etc.
- 15 -
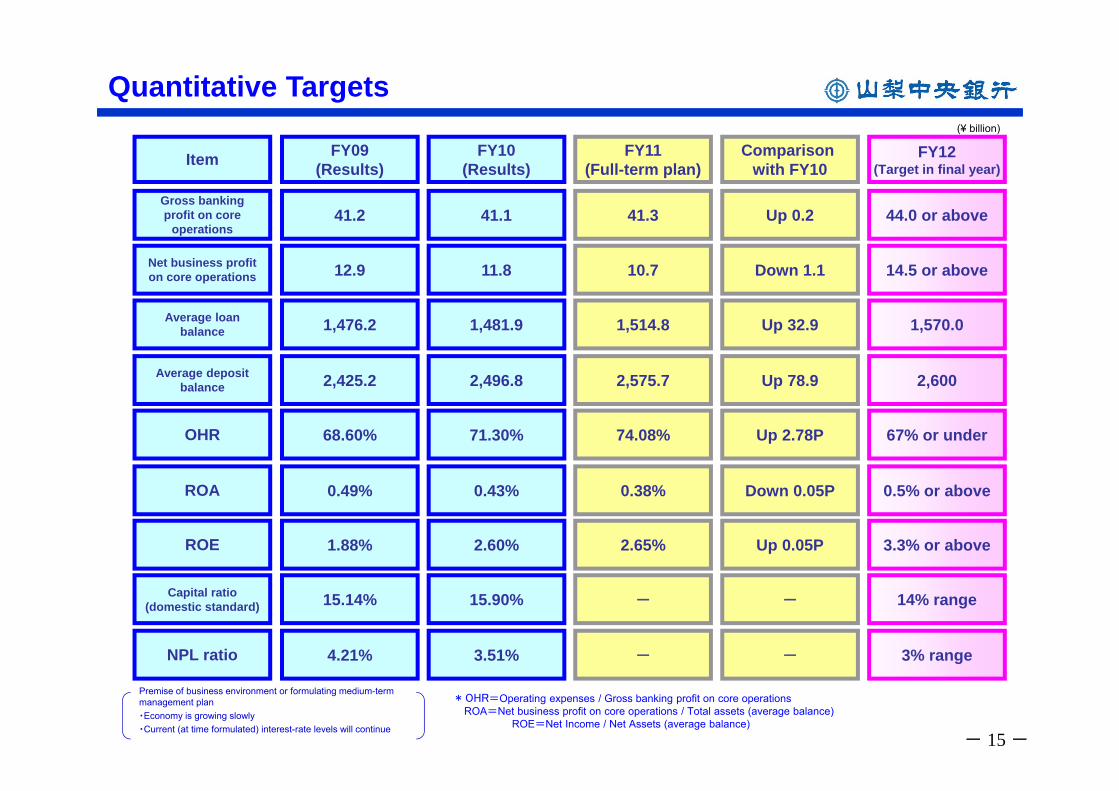
Quantitative Targets
Premise of business environment or formulating medium-term management plan・Economy is growing slowly・Current (at time formulated) interest-rate levels will continue
Item FY09(Results)
FY10(Results)
FY11(Full-term plan)
Comparison with FY10
FY12(Target in final year)
Gross banking profit on core
operations41.2 Up 0.2 44.0 or above
Net business profit on core operations 12.9 Down 1.1 14.5 or above
Average loan balance 1,476.2 Up 32.9 1,570.0
Average deposit balance 2,425.2 Up 78.9 2,600
OHR 68.60% Up 2.78P 67% or under
ROA 0.49% Down 0.05P 0.5% or above
ROE 1.88% Up 0.05P 3.3% or above
Capital ratio (domestic standard) 15.14% - 14% range
NPL ratio 4.21% - 3% range
41.1
11.8
1,481.9
2,496.8
71.30%
0.43%
2.60%
15.90%
3.51%
41.3
10.7
1,514.8
2,575.7
74.08%
0.38%
2.65%
-
-
* OHR=Operating expenses / Gross banking profit on core operationsROA=Net business profit on core operations / Total assets (average balance)
ROE=Net Income / Net Assets (average balance)
(¥ billion)
- 16 -
III Economic Trends in Yamanashi Prefecture

- 17 -
Business Trends
(80)
(70)
(60)
(50)
(40)
(30)
(20)
(10)
0
10
20
30
40
50
FY06 1H FY07 FY07 1H FY08 FY08 1H FY09 FY09 1H FY10 FY10 Q1 FY11(Forecast)
(Bank of Japan Kofu Branch)
Manufacturing (3)All industries (9)Non-manufacturing (14)
Diffusion Index for Yamanashi Prefecture (BOJ’s Tankan Survey)
Manufacturing(15)
All industries(20)
Non-manufacturing
(25)
25.1 24.8
5.7 7.4
15.3 13.5
4.5 6.5
8.615.11.5
2.07.8
6.7
29.222.5
2.3 1.6
YamanashiPrefecture
Japan
Agriculture, forestry,fisheries/mining
Manufacturing
Construction
Utilities
Wholesale/retail
Financing/insurance
Real estate
Transport/communications
Service
(Annual Report on Prefectural Accounts) (Annual Report on National Accounts)
Fiscal 2008
Gross Production by Economic Activity(Industrial Sector = 100)
Food Stuffand others
41.1%Electrical
Machinery8.8%
ElectronicParts12.6%
ITEquipmentand other
24.1% ForProduction
Uses13.4%
Percentage of Shipments of Products Manufactured in Yamanashi Prefecture
Concentrated in Machinery Industry –IT-Related, etc
(Unit = %)
(Fiscal 2009)
- 18 -
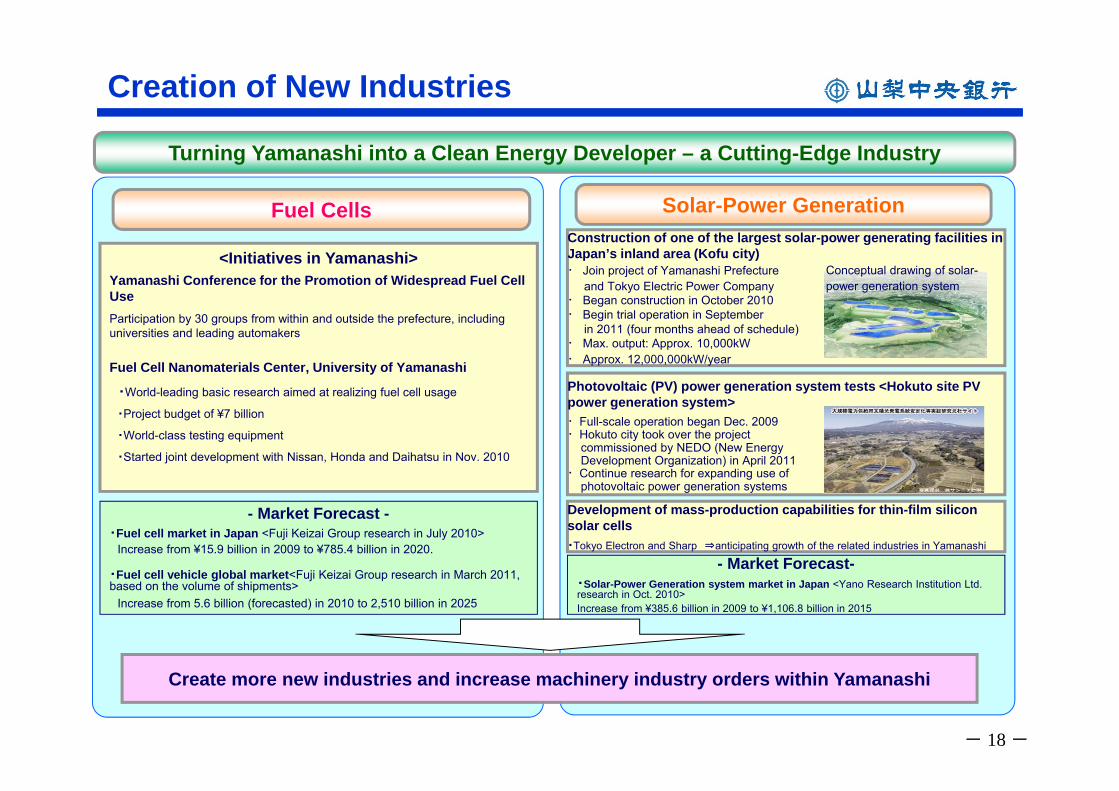
Development of mass-production capabilities for thin-film silicon solar cells・Tokyo Electron and Sharp ⇒anticipating growth of the related industries in Yamanashi
<Initiatives in Yamanashi>Yamanashi Conference for the Promotion of Widespread Fuel Cell UseParticipation by 30 groups from within and outside the prefecture, including universities and leading automakers
Fuel Cell Nanomaterials Center, University of Yamanashi
・World-leading basic research aimed at realizing fuel cell usage
・Project budget of ¥7 billion
・World-class testing equipment
・Started joint development with Nissan, Honda and Daihatsu in Nov. 2010
Fuel Cells Solar-Power Generation
Photovoltaic (PV) power generation system tests <Hokuto site PV power generation system>・Full-scale operation began Dec. 2009・Hokuto city took over the project
commissioned by NEDO (New Energy Development Organization) in April 2011
・Continue research for expanding use of photovoltaic power generation systems
Construction of one of the largest solar-power generating facilities in Japan’s inland area (Kofu city)・ Join project of Yamanashi Prefecture
and Tokyo Electric Power Company・ Began construction in October 2010・ Begin trial operation in September
in 2011 (four months ahead of schedule)・ Max. output: Approx. 10,000kW・ Approx. 12,000,000kW/year
Turning Yamanashi into a Clean Energy Developer – a Cutting-Edge Industry
Create more new industries and increase machinery industry orders within Yamanashi
Creation of New Industries
- Market Forecast -・Fuel cell market in Japan <Fuji Keizai Group research in July 2010>
Increase from ¥15.9 billion in 2009 to ¥785.4 billion in 2020.
・Fuel cell vehicle global market<Fuji Keizai Group research in March 2011, based on the volume of shipments>
Increase from 5.6 billion (forecasted) in 2010 to 2,510 billion in 2025
- Market Forecast-・Solar-Power Generation system market in Japan <Yano Research Institution Ltd. research in Oct. 2010>Increase from ¥385.6 billion in 2009 to ¥1,106.8 billion in 2015
Conceptual drawing of solar-power generation system
- 19 -
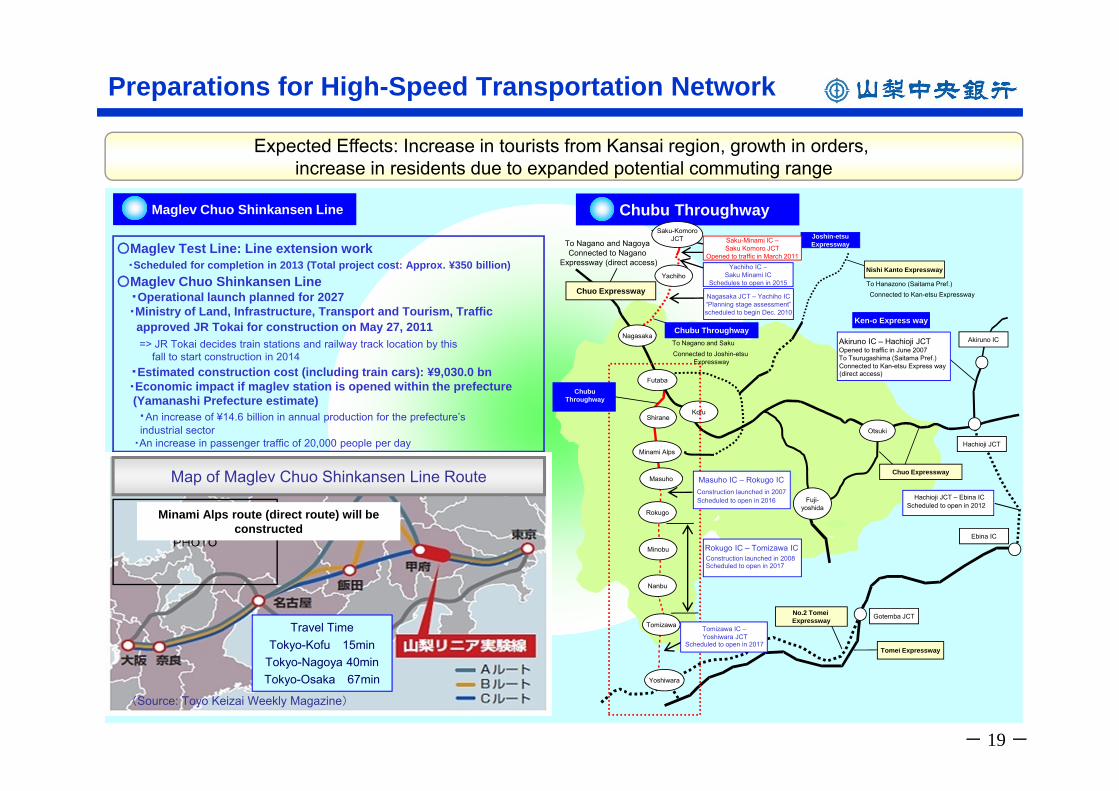
Preparations for High-Speed Transportation Network
○Maglev Test Line: Line extension work・Scheduled for completion in 2013 (Total project cost: Approx. ¥350 billion)
○Maglev Chuo Shinkansen Line ・Operational launch planned for 2027・Ministry of Land, Infrastructure, Transport and Tourism, Traffic
approved JR Tokai for construction on May 27, 2011=> JR Tokai decides train stations and railway track location by this
fall to start construction in 2014・Estimated construction cost (including train cars): ¥9,030.0 bn ・Economic impact if maglev station is opened within the prefecture (Yamanashi Prefecture estimate)・An increase of ¥14.6 billion in annual production for the prefecture’s industrial sector
・An increase in passenger traffic of 20,000 people per day
Maglev Chuo Shinkansen Line Chubu Throughway
Nishi Kanto Expressway
Ken-o Express way
Futaba
Hachioji JCT
Akiruno IC – Hachioji JCTOpened to traffic in June 2007 To Tsurugashima (Saitama Pref.)Connected to Kan-etsu Express way(direct access)
Akiruno ICTo Nagano and SakuConnected to Joshin-etsu
Expressway
To Nagano and Nagoya Connected to Nagano
Expressway (direct access)
To Hanazono (Saitama Pref.)Connected to Kan-etsu Expressway
Rokugo
TomizawaGotemba JCT
Yoshiwara
Ebina IC
Chuo Expressway
Chuo Expressway
Masuho
Kofu
Minami Alps
Tomei Expressway
Hachioji JCT – Ebina ICScheduled to open in 2012
Minobu
Nanbu
Shirane
Chubu Throughway
No.2 Tomei Expressway
Expected Effects: Increase in tourists from Kansai region, growth in orders, increase in residents due to expanded potential commuting range
Chubu Throughway
Yachiho IC –Saku Minami IC
Schedules to open in 2015
Rokugo IC – Tomizawa ICConstruction launched in 2008Scheduled to open in 2017
Masuho IC – Rokugo ICConstruction launched in 2007Scheduled to open in 2016
Nagasaka
Yachiho
Otsuki
Fuji-yoshida
Tomizawa IC –Yoshiwara JCT
Scheduled to open in 2017
Joshin-etsuExpressway
(Source: Toyo Keizai Weekly Magazine)
Travel TimeTokyo-Kofu 15min
Tokyo-Nagoya 40minTokyo-Osaka 67min
Map of Maglev Chuo Shinkansen Line Route
Nagasaka JCT – Yachiho IC “Planning stage assessment” scheduled to begin Dec. 2010
Saku-KomoroJCT Saku-Minami IC –
Saku Komoro JCTOpened to traffic in March 2011
PHOTO
Minami Alps route (direct route) will be constructed
- 20 -
IV Forecasts for the Current Term(FY 2011)
- 21 -
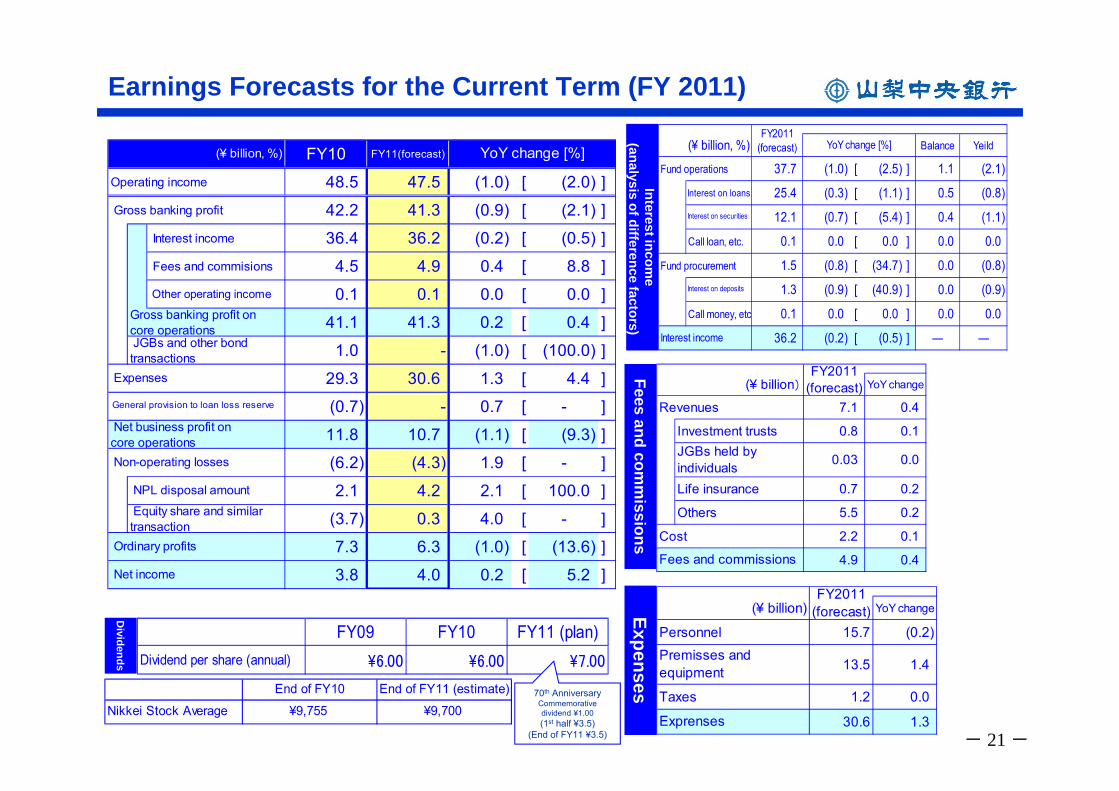
Earnings Forecasts for the Current Term (FY 2011)
Dividends
FY09 FY10 FY11 (plan)\6.00 \6.00 \7.00Dividend per share (annual)
Expenses
(¥ billion) YoY change
Personnel 15.7 (0.2)
13.5 1.4
Taxes 1.2 0.0
30.6 1.3Exprenses
FY2011(forecast)
Premisses andequipment
Fees and comm
issions
(¥ billion) YoY change
Revenues 7.1 0.4
Investment trusts 0.8 0.1JGBs held byindividuals 0.03 0.0
Life insurance 0.7 0.2
Others 5.5 0.2
Cost 2.2 0.1
4.9 0.4Fees and commissions
FY2011(forecast)
Interest income
(analysis of difference factors)
(¥ billion, %) Balance Yeild
Fund operations 37.7 (1.0) [ (2.5) ] 1.1 (2.1)
Interest on loans 25.4 (0.3) [ (1.1) ] 0.5 (0.8)Interest on securities 12.1 (0.7) [ (5.4) ] 0.4 (1.1)
Call loan, etc. 0.1 0.0 [ 0.0 ] 0.0 0.0
Fund procurement 1.5 (0.8) [ (34.7) ] 0.0 (0.8)Interest on deposits 1.3 (0.9) [ (40.9) ] 0.0 (0.9)
Call money, etc 0.1 0.0 [ 0.0 ] 0.0 0.0
36.2 (0.2) [ (0.5) ] ― ―
YoY change [%]FY2011
(forecast)
Interest income
FY10 FY11(forecast)
Operating income 48.5 47.5 (1.0) [ (2.0) ]Gross banking profit 42.2 41.3 (0.9) [ (2.1) ]
Interest income 36.4 36.2 (0.2) [ (0.5) ]Fees and commisions 4.5 4.9 0.4 [ 8.8 ]Other operating income 0.1 0.1 0.0 [ 0.0 ]
41.1 41.3 0.2 [ 0.4 ]
1.0 - (1.0) [ (100.0) ]
29.3 30.6 1.3 [ 4.4 ]
(0.7) - 0.7 [ - ]
11.8 10.7 (1.1) [ (9.3) ]
(6.2) (4.3) 1.9 [ - ]
2.1 4.2 2.1 [ 100.0 ]
(3.7) 0.3 4.0 [ - ]
7.3 6.3 (1.0) [ (13.6) ]
3.8 4.0 0.2 [ 5.2 ]
YoY change [%]
Net income
Net business profit oncore operations
General provision to loan loss reserve
Expenses
Non-operating losses
Ordinary profits
NPL disposal amount
JGBs and other bondtransactions
Gross banking profit oncore operations
Equity share and similartransaction
(¥ billion, %)
End of FY10 End of FY11 (estimate)
Nikkei Stock Average ¥9,755 ¥9,70070th AnniversaryCommemorative dividend ¥1.00(1st half ¥3.5)
(End of FY11 ¥3.5)
- 22 -
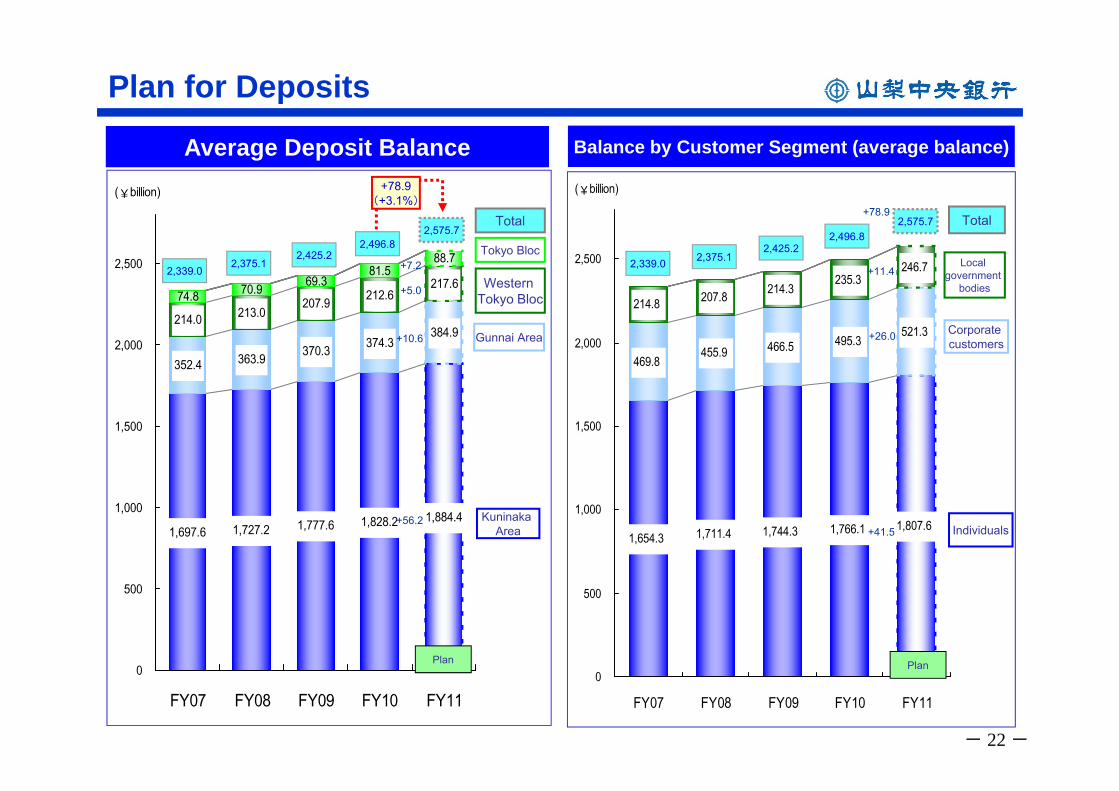
352.4 363.9 370.3 374.3384.9
217.674.8 70.9 69.3
81.588.7
1,697.6 1,727.2 1,777.6 1,828.2 1,884.4
212.6207.9213.0214.0
0
500
1,000
1,500
2,000
2,500
FY07 FY08 FY09 FY10 FY11
(¥billion)
1,654.3 1,711.4 1,744.3 1,766.1 1,807.6
469.8455.9 466.5 495.3
521.3
214.8 207.8 214.3235.3
246.7
0
500
1,000
1,500
2,000
2,500
FY07 FY08 FY09 FY10 FY11
(¥billion)
Balance by Customer Segment (average balance)Average Deposit Balance
Plan for Deposits
Kuninaka Area
Western Tokyo Bloc
Total
Individuals
Corporate customers
Total
Local government
bodies
Tokyo Bloc
2,575.7
2,375.12,425.2
2,496.8
2,339.0
Gunnai Area
Plan Plan
2,575.7
2,375.12,425.2
2,496.8
2,339.0
+56.2
+10.6
+5.0
+7.2
+78.9
+11.4
+26.0
+41.5
+78.9(+3.1%)
- 23 -
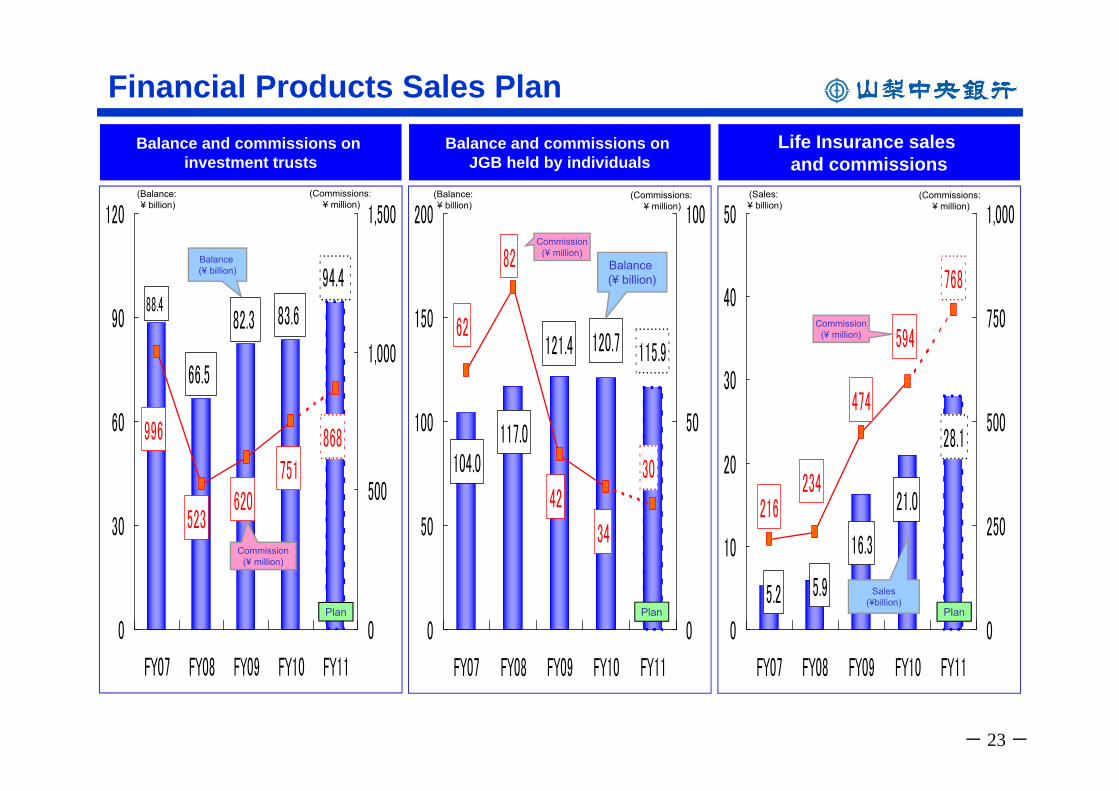
Financial Products Sales PlanBalance and commissions on
JGB held by individuals
115.9
104.0117.0
120.7121.4
30
62
34
42
82
0
50
100
150
200
FY07 FY08 FY09 FY10 FY11
0
50
100
Plan
Balance (¥ billion)
Commission(¥ million)
(Balance: ¥ billion)
(Commissions: ¥ million)
Life Insurance sales and commissions
28.1
5.2 5.9
21.0
16.3
768
216
594
474
234
0
10
20
30
40
50
FY07 FY08 FY09 FY10 FY11
0
250
500
750
1,000
Plan
Sales (¥billion)
Commission(¥ million)
(Sales: ¥ billion)
(Commissions:¥ million)
Balance and commissions on investment trusts
94.488.4
66.5
83.682.3
868996
751620
523
0
30
60
90
120
FY07 FY08 FY09 FY10 FY11
0
500
1,000
1,500
Plan
Balance (¥ billion)
Commission(¥ million)
(Balance: ¥ billion)
(Commissions: ¥ million)
- 24 -
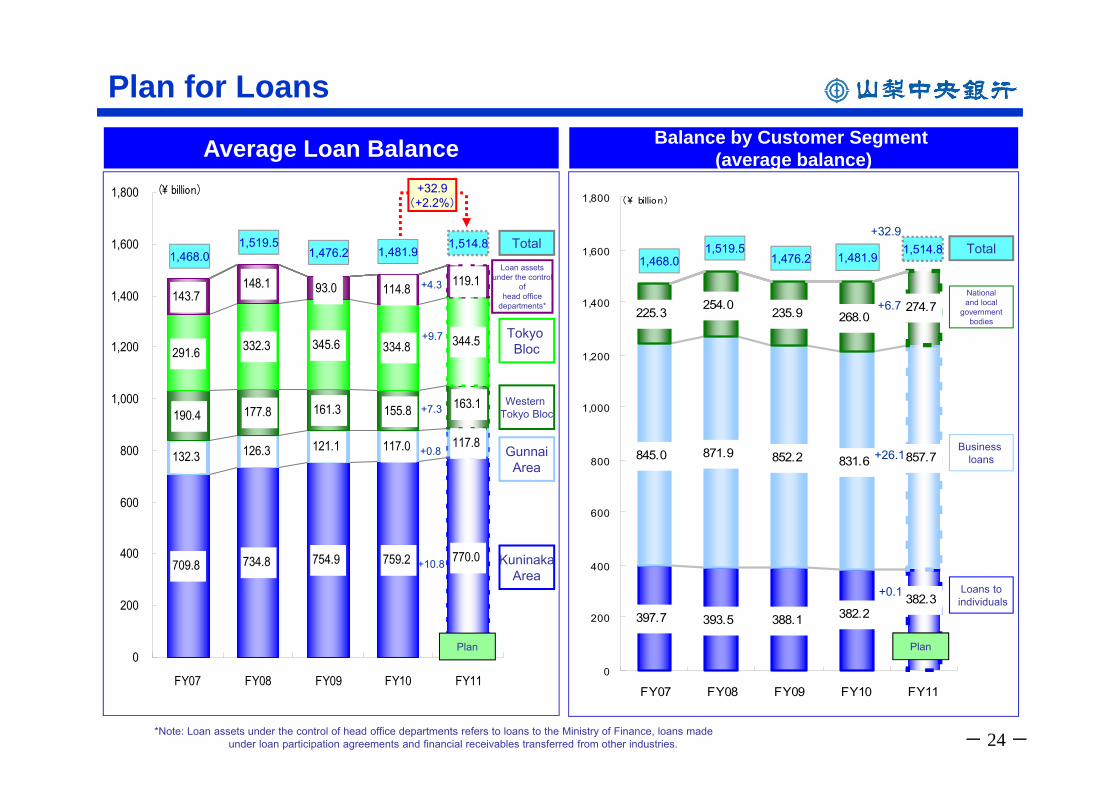
Average Loan Balance
132.3 126.3 121.1 117.0 117.8
291.6 332.3 345.6 334.8 344.5
143.7148.1 93.0 114.8 119.1
754.9734.8709.8 759.2 770.0
190.4 177.8 155.8 163.1161.3
0
200
400
600
800
1,000
1,200
1,400
1,600
1,800
FY07 FY08 FY09 FY10 FY11
(\ billion)
Balance by Customer Segment (average balance)
Plan for Loans
397.7 393.5 388.1
845.0 871.9 852.2 831.6 857.7
225.3 254.0 235.9
382.2382.3
268.0274.7
0
200
400
600
800
1,000
1,200
1,400
1,600
1,800
FY07 FY08 FY09 FY10 FY11
(\ billion)
KuninakaArea
Western Tokyo Bloc
Total
Tokyo Bloc
1,468.01,519.5
1,476.2
GunnaiArea
1,514.8
Plan
Business loans
Loans toindividuals
Loan assets under the control
of head office
departments*
1,481.9
*Note: Loan assets under the control of head office departments refers to loans to the Ministry of Finance, loans made under loan participation agreements and financial receivables transferred from other industries.
Total
National and local
government bodies
Plan
1,468.01,519.5
1,476.21,514.8
1,481.9
+7.3
+4.3
+9.7
+10.8
+0.8
+6.7
+26.1
+0.1
+32.9
+32.9(+2.2%)
- 25 -
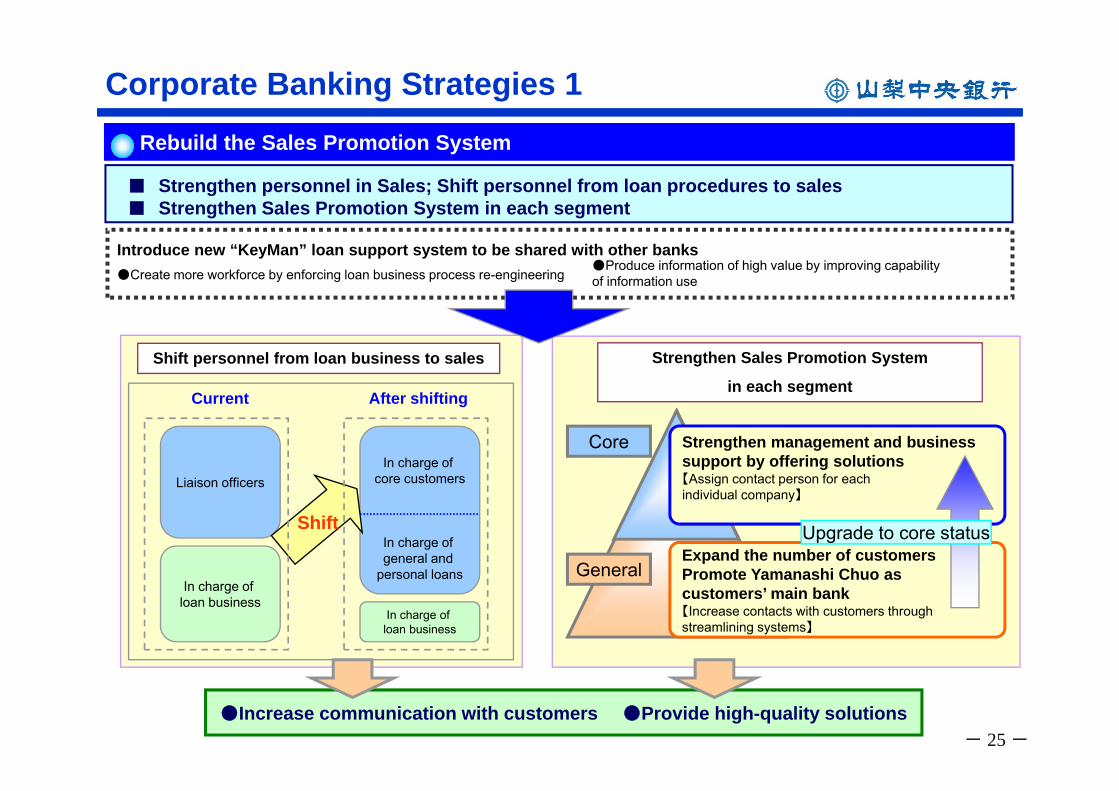
Introduce new “KeyMan” loan support system to be shared with other banks
Strengthen Sales Promotion System
in each segment
Corporate Banking Strategies 1
Current After shifting
Liaison officers
In charge of loan business
In charge of core customers
In charge of general and
personal loans
In charge of loan business
Shift personnel from loan business to sales
■ Strengthen personnel in Sales; Shift personnel from loan procedures to sales■ Strengthen Sales Promotion System in each segment
Rebuild the Sales Promotion System
Shift
Core
General
Strengthen management and business support by offering solutions【Assign contact person for each individual company】
Expand the number of customers Promote Yamanashi Chuo as customers’ main bank【Increase contacts with customers through streamlining systems】
Upgrade to core status
●Increase communication with customers ●Provide high-quality solutions
●Create more workforce by enforcing loan business process re-engineering ●Produce information of high value by improving capability of information use
- 26 -
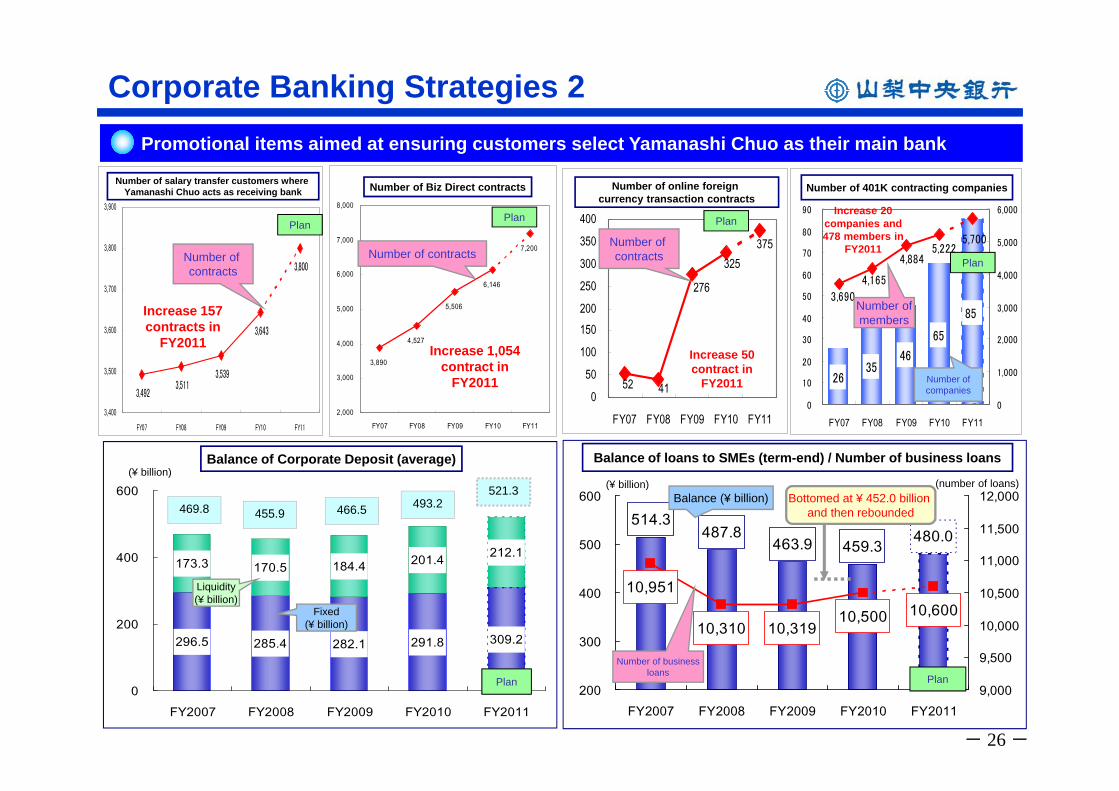
Corporate Banking Strategies 2
3,890
4,527
5,506
6,146
7,200
2,000
3,000
4,000
5,000
6,000
7,000
8,000
FY07 FY08 FY09 FY10 FY11
Plan
Number of Biz Direct contracts
Number of contracts
Increase 1,054 contract in
FY2011
375325
52 41
276
0
50
100
150200
250
300
350
400
FY07 FY08 FY09 FY10 FY11
Number of online foreign currency transaction contracts
Increase 50 contract in
FY2011
Number of contracts
Plan
3,4923,511
3,539
3,643
3,800
3,400
3,500
3,600
3,700
3,800
3,900
FY07 FY08 FY09 FY10 FY11
Increase 157 contracts in
FY2011
Number of contracts
Plan
Number of salary transfer customers where Yamanashi Chuo acts as receiving bank
2635
46
85
65
5,700
3,690
4,165
4,8845,222
0
10
20
30
40
50
60
70
80
90
FY07 FY08 FY09 FY10 FY110
1,000
2,000
3,000
4,000
5,000
6,000
Number of 401K contracting companies
Increase 20companies and 478 members in
FY2011
Number of members
Number of companies
Plan
296.5 309.2
173.3 170.5 184.4 201.4 212.1
285.4 282.1 291.8
0
200
400
600
FY2007 FY2008 FY2009 FY2010 FY2011
Balance of Corporate Deposit (average)
469.8 466.5455.9493.2
521.3
Liquidity (¥ billion)
Fixed (¥ billion)
(¥ billion)
Plan
480.0459.3463.9487.8
514.3
10,60010,50010,31910,310
10,951
200
300
400
500
600
FY2007 FY2008 FY2009 FY2010 FY20119,000
9,500
10,000
10,500
11,000
11,500
12,000
Plan
(¥ billion) (number of loans)
Number of business loans
Balance (¥ billion)
Balance of loans to SMEs (term-end) / Number of business loans
Bottomed at ¥ 452.0 billion and then rebounded
Promotional items aimed at ensuring customers select Yamanashi Chuo as their main bank
- 27 -
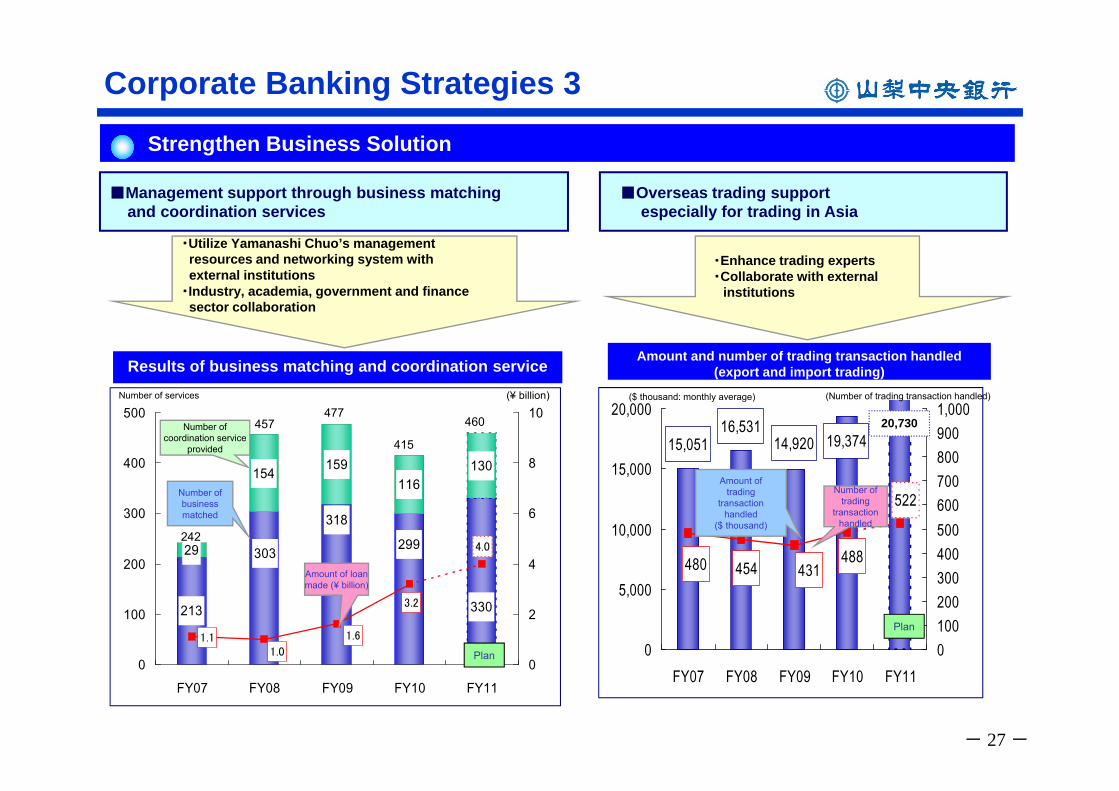
Corporate Banking Strategies 3
Results of business matching and coordination service Amount and number of trading transaction handled (export and import trading)
15,05116,531
14,920 19,374
480 454 431488
522
0
5,000
10,000
15,000
20,000
FY07 FY08 FY09 FY10 FY1101002003004005006007008009001,000
213
29
154 159116
130
330
299
318
303
1.1
4.0
1.6
1.0
3.2
0
100
200
300
400
500
FY07 FY08 FY09 FY10 FY110
2
4
6
8
10
242
457477
415
■Management support through business matching and coordination services
Strengthen Business Solution
・Utilize Yamanashi Chuo’s management resources and networking system with external institutions
・Industry, academia, government and finance sector collaboration
・Enhance trading experts・Collaborate with external
institutions
($ thousand: monthly average) (Number of trading transaction handled)(¥ billion)Number of services
Amount of trading
transaction handled
($ thousand)
Number of trading
transaction handled
■Overseas trading support especially for trading in Asia
Number of business matched
Amount of loan made (¥ billion)
Number of coordination service
provided
Plan
Plan
460 20,730

- 28 -
Corporate Banking Strategies 4
Strengthen activities in SME and growth field
■Response to funding needs through “Growth Platform Reinforcement”
36.0
31.929.2
30.431.1
12.010.4
4.0
20
25
30
35
40
FY07 FY08 FY09 FY10 FY110
4
8
12
Plan
Result of Medical and Nursing care(including results from other than “Growth Platform Reinforcement”
Of which growth fund(¥ 1.5 billion)
Results (¥ billion)
Balance(¥ billion)
(¥ billion)(¥ billion)
Support to growing business fields Expand quality loans
TargetFund: ¥ 20 billion
Stimulus for Regional
RevitalizationResults as of March 31, 2011153 totaling approx. ¥ 8.6
billion
Deploy personnel from each growth fields
at headquarters
Tourism
Medical and Nursing care
Environment
AgricultureTarget in FY11
¥ 2 billion
Target in FY11
¥ 3 billion
Target in FY11
¥ 3 billion
Target in FY11
¥ 0.5 billion
Other fieldsTarget in FY11
¥ 3 billion
- 29 -
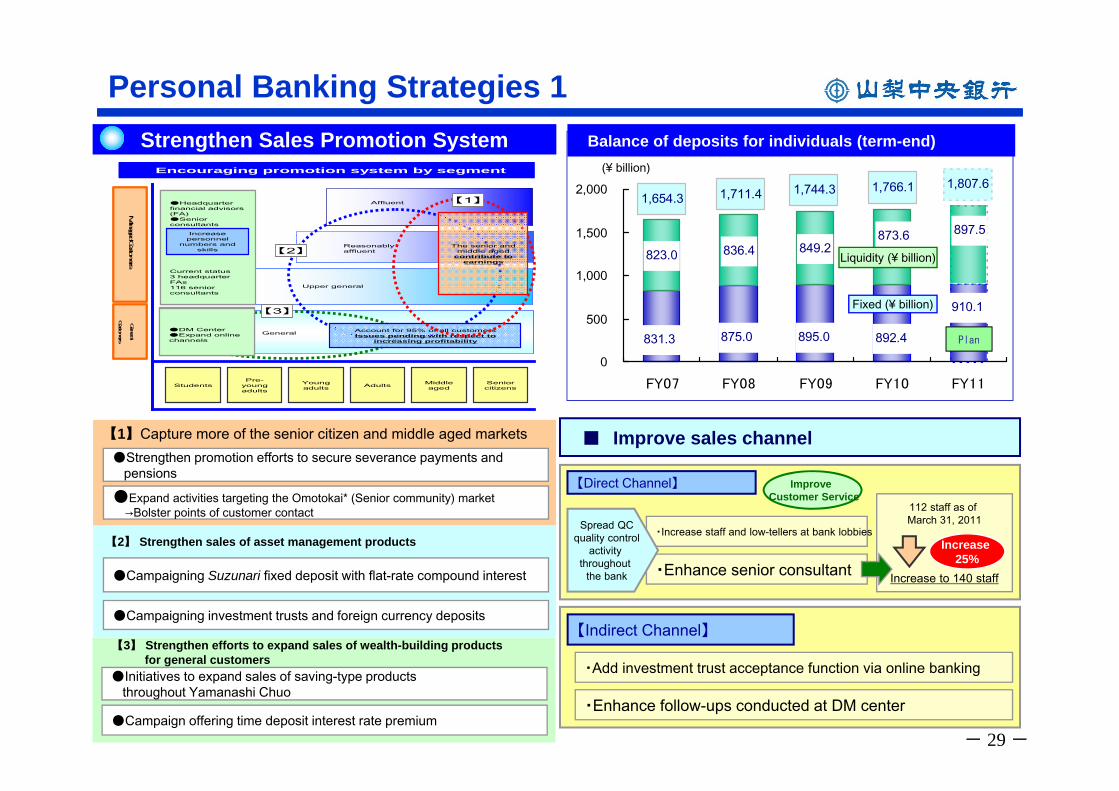
Personal Banking Strategies 1Strengthen Sales Promotion System
【Indirect Channel】
・Add investment trust acceptance function via online banking
・Enhance follow-ups conducted at DM center
【Direct Channel】
・Enhance senior consultant
・Increase staff and low-tellers at bank lobbies
【1】Capture more of the senior citizen and middle aged markets
●Expand activities targeting the Omotokai* (Senior community) market→Bolster points of customer contact
●Strengthen promotion efforts to secure severance payments and pensions
【3】 Strengthen efforts to expand sales of wealth-building products for general customers
●Initiatives to expand sales of saving-type products throughout Yamanashi Chuo
●Campaign offering time deposit interest rate premium
【2】 Strengthen sales of asset management products
●Campaigning Suzunari fixed deposit with flat-rate compound interest
●Campaigning investment trusts and foreign currency deposits
112 staff as of March 31, 2011
Increase to 140 staff
Increase 25%
■ Improve sales channel
910.1
831.3 875.0 895.0 892.4
897.5
823.0 836.4 849.2873.6
1,654.3 1,711.4 1,744.3 1,766.1 1,807.6
0
500
1,000
1,500
2,000
FY07 FY08 FY09 FY10 FY11
Liquidity (¥ billion)
Fixed (¥ billion)
(¥ billion)
Plan
Improve Customer Service
Spread QCquality control
activity throughout
the bank
Balance of deposits for individuals (term-end)
Affluent
Reasonablyaffluent
Upper general
General Account for 95% of all customersIssues pending with respect to
increasing profitability
The senior and middle aged
contribute to earnings
Encouraging promotion system by segment
StudentsPre-
young adults
Young adults Adults Middle
agedSenior citizens
●Headquarterfinancial advisors (FA)●Senior consultants
Current status3 headquarter FAs116 senior consultants
●DM Center●Expand online channels
General
Custom
ers
Managed C
ustomers
General
Custom
ers
Managed C
ustomers
Increase personnel
numbers and skills
【1】
【2】
【3】
Encouraging promotion system by segment
●Headquarterfinancial advisors (FA)●Senior consultants
Current status3 headquarter FAs116 senior consultants
●DM Center●Expand online channels
General
Custom
ers
Managed C
ustomers
General
Custom
ers
Managed C
ustomers
Increase personnel
numbers and skills
- 30 -
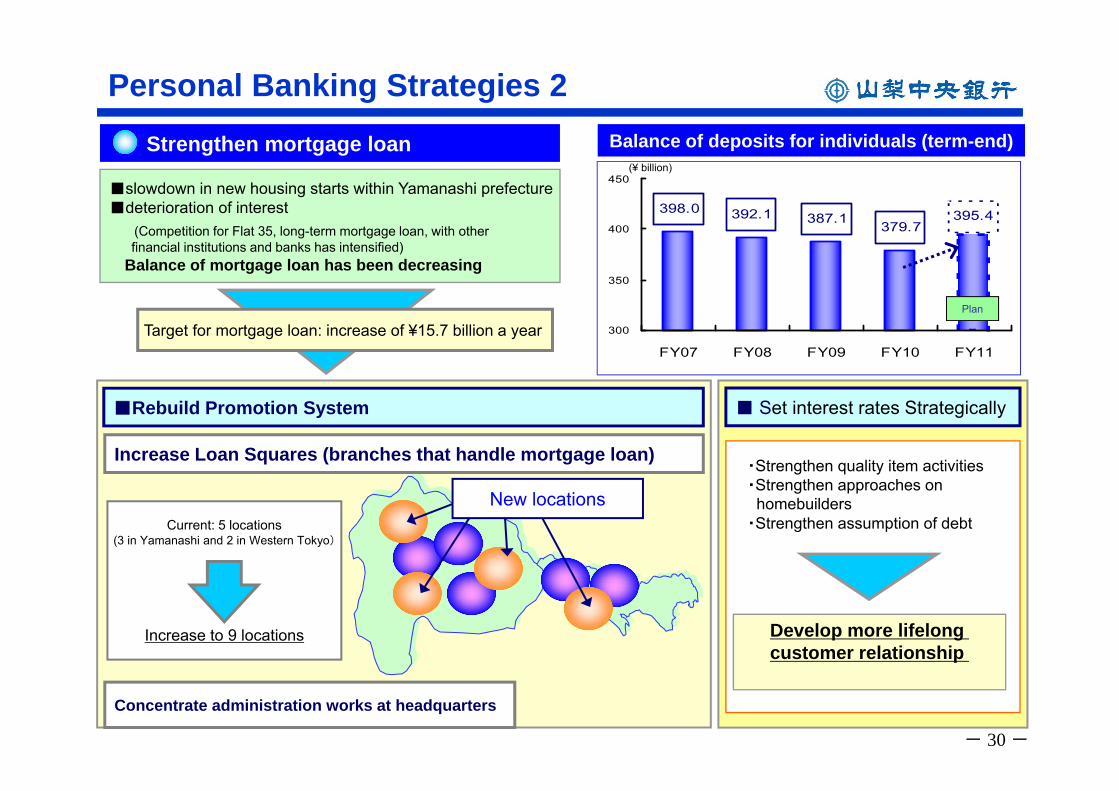
Personal Banking Strategies 2
■slowdown in new housing starts within Yamanashi prefecture■deterioration of interest
(Competition for Flat 35, long-term mortgage loan, with other financial institutions and banks has intensified)
Balance of mortgage loan has been decreasing
395.4398.0 392.1 387.1 379.7
300
350
400
450
FY07 FY08 FY09 FY10 FY11
Balance of deposits for individuals (term-end)
Target for mortgage loan: increase of ¥15.7 billion a year
・Strengthen quality item activities ・Strengthen approaches on
homebuilders ・Strengthen assumption of debt
Develop more lifelong customer relationship
Plan
(¥ billion)
Strengthen mortgage loan
■ Set interest rates Strategically
Concentrate administration works at headquarters
Current: 5 locations(3 in Yamanashi and 2 in Western Tokyo)
Increase to 9 locations
New locations
Increase Loan Squares (branches that handle mortgage loan)
■Rebuild Promotion System
- 31 -
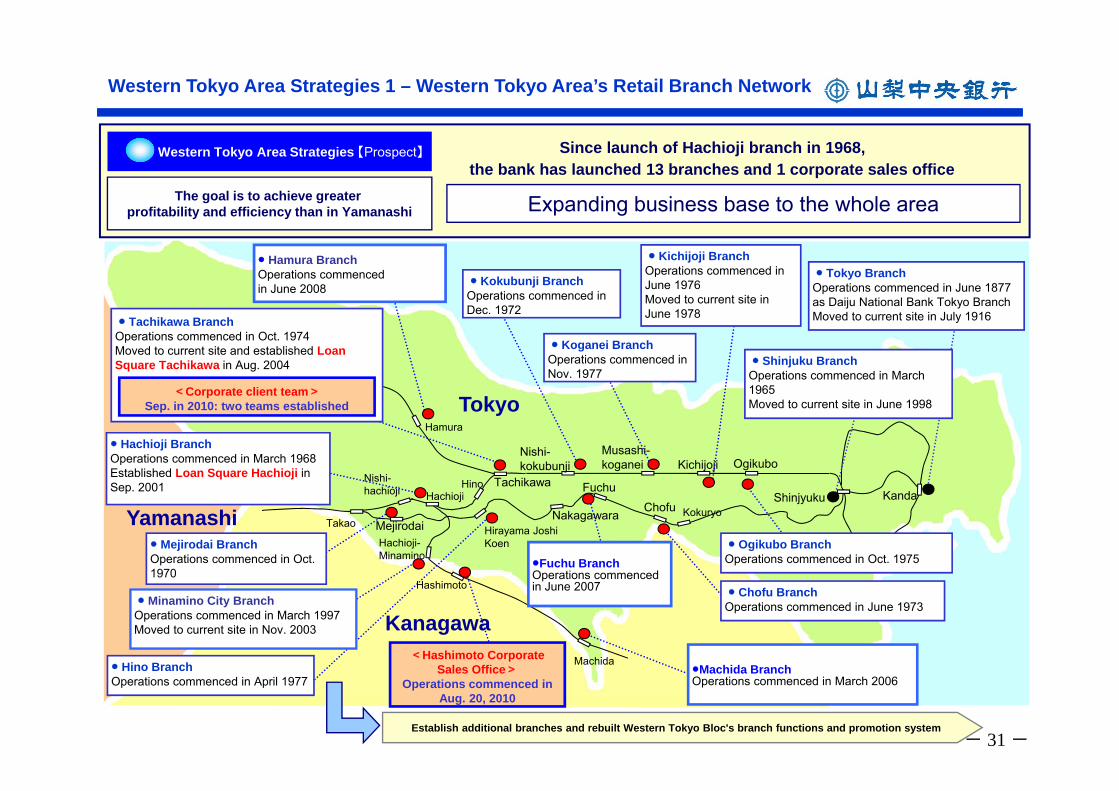
Nishi-hachioji
Tachikawa
Nishi-kokubunji
Musashi-koganei Kichijoji Ogikubo
Kokuryo
FuchuChofu
Hachioji
MejirodaiTakao
Shinjyuku KandaHino
Machida
Hirayama Joshi KoenHachioji-
Minamino
Nakagawara
Hamura
● Tachikawa BranchOperations commenced in Oct. 1974Moved to current site and established Loan Square Tachikawa in Aug. 2004
● Hachioji BranchOperations commenced in March 1968Established Loan Square Hachioji in Sep. 2001
● Mejirodai BranchOperations commenced in Oct. 1970
● Minamino City BranchOperations commenced in March 1997Moved to current site in Nov. 2003
● Hino BranchOperations commenced in April 1977
● Hamura BranchOperations commenced in June 2008 ● Kokubunji Branch
Operations commenced in Dec. 1972
● Koganei BranchOperations commenced in Nov. 1977
●Machida BranchOperations commenced in March 2006
●Fuchu BranchOperations commenced in June 2007
● Kichijoji BranchOperations commenced in June 1976Moved to current site in June 1978
● Ogikubo BranchOperations commenced in Oct. 1975
● Chofu BranchOperations commenced in June 1973
● Shinjuku BranchOperations commenced in March 1965Moved to current site in June 1998
● Tokyo BranchOperations commenced in June 1877 as Daiju National Bank Tokyo BranchMoved to current site in July 1916
Tokyo
Kanagawa
Yamanashi
<Hashimoto Corporate Sales Office>
Operations commenced in Aug. 20, 2010
Hashimoto
Establish additional branches and rebuilt Western Tokyo Bloc's branch functions and promotion system
<Corporate client team>Sep. in 2010: two teams established
Western Tokyo Area Strategies 1 – Western Tokyo Area’s Retail Branch Network
Western Tokyo Area Strategies 【Prospect】
The goal is to achieve greater profitability and efficiency than in Yamanashi
Since launch of Hachioji branch in 1968, the bank has launched 13 branches and 1 corporate sales office
Expanding business base to the whole area
- 32 -
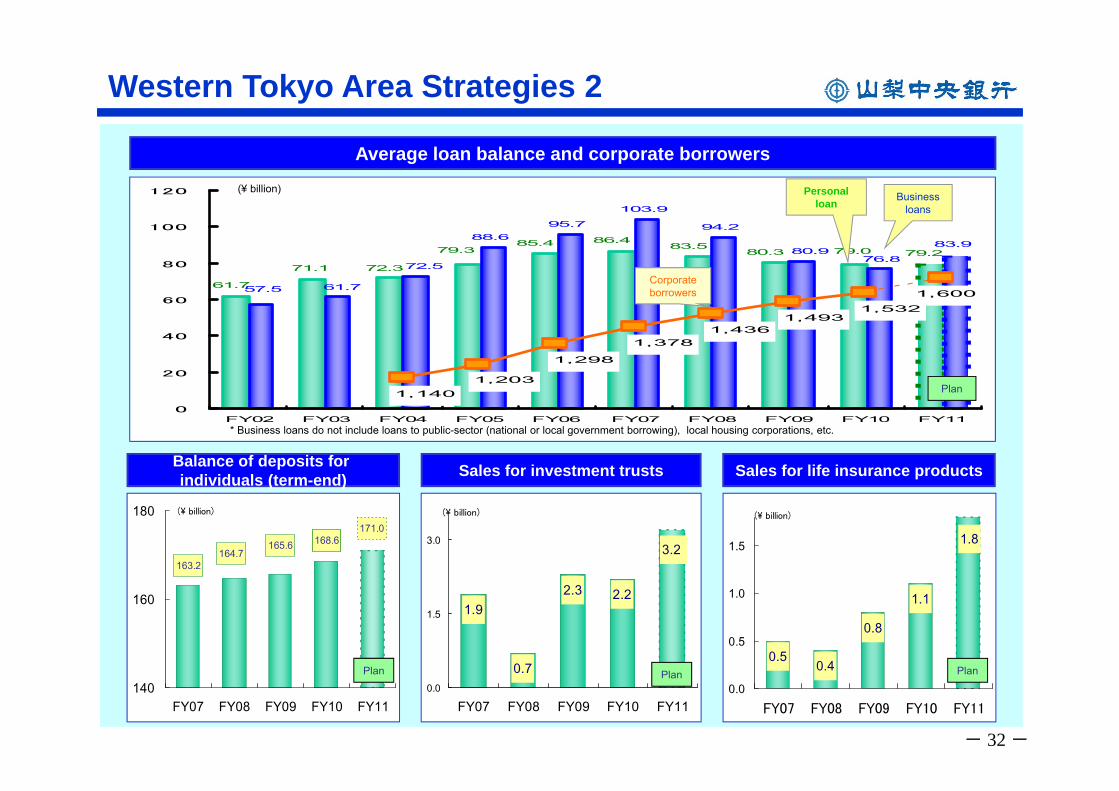
88.695.7
103.9
94.2
72.3
79.0 79.2
61.7
85.4 86.483.5
80.379.3
71.1
80.983.9
61.7
72.5
57.5
76.8
1,140
1,600
1,203
1,298
1,4931,436
1,378
1,532
0
20
40
60
80
100
120
FY02 FY03 FY04 FY05 FY06 FY07 FY08 FY09 FY10 FY11
Personal loan Business
loans
Corporate borrowers
Average loan balance and corporate borrowers
Western Tokyo Area Strategies 2
* Business loans do not include loans to public-sector (national or local government borrowing), local housing corporations, etc.
165.6 168.6164.7
163.2
171.0
140
160
180
FY07 FY08 FY09 FY10 FY11
(\ billion)
Balance of deposits for individuals (term-end)
1.1
1.8
0.50.4
0.8
0.0
0.5
1.0
1.5
FY07 FY08 FY09 FY10 FY11
(\ billion)
3.2
1.9
0.7
2.22.3
0.0
1.5
3.0
FY07 FY08 FY09 FY10 FY11
(\ billion)
Sales for investment trusts Sales for life insurance products
(¥ billion)
Plan
Plan Plan Plan
- 33 -
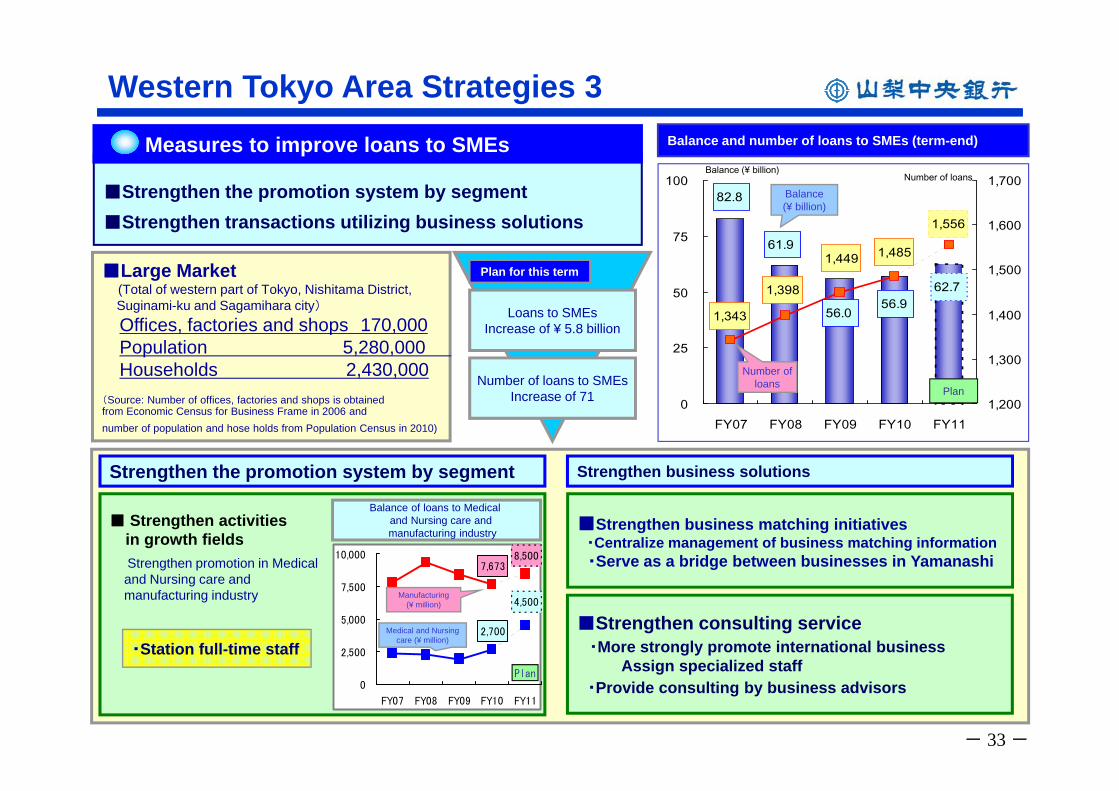
■ Strengthen activities in growth fieldsStrengthen promotion in Medical and Nursing care and manufacturing industry
82.8
61.9
56.056.9
62.7
1,343
1,398
1,449 1,485
1,556
0
25
50
75
100
FY07 FY08 FY09 FY10 FY111,200
1,300
1,400
1,500
1,600
1,700
Western Tokyo Area Strategies 3
■Strengthen the promotion system by segment■Strengthen transactions utilizing business solutions
Measures to improve loans to SMEs Balance and number of loans to SMEs (term-end)
■Large Market(Total of western part of Tokyo, Nishitama District, Suginami-ku and Sagamihara city)Offices, factories and shops 170,000Population 5,280,000 Households 2,430,000
(Source: Number of offices, factories and shops is obtained from Economic Census for Business Frame in 2006 and number of population and hose holds from Population Census in 2010)
・Station full-time staff
■Strengthen business matching initiatives・Centralize management of business matching information・Serve as a bridge between businesses in Yamanashi
Loans to SMEsIncrease of ¥ 5.8 billion
Number of loans to SMEsIncrease of 71
Plan for this term
Strengthen the promotion system by segment Strengthen business solutions
4,500
2,700
8,5007,673
0
2,500
5,000
7,500
10,000
FY07 FY08 FY09 FY10 FY11
Balance of loans to Medical and Nursing care and manufacturing industry
Plan
Balance (¥ billion)
Medical and Nursing care (¥ million)
Manufacturing (¥ million)
Number of loans
Balance (¥ billion)
Number of loans
■Strengthen consulting service・More strongly promote international business
Assign specialized staff・Provide consulting by business advisors
Plan
- 34 -
●
●
●●
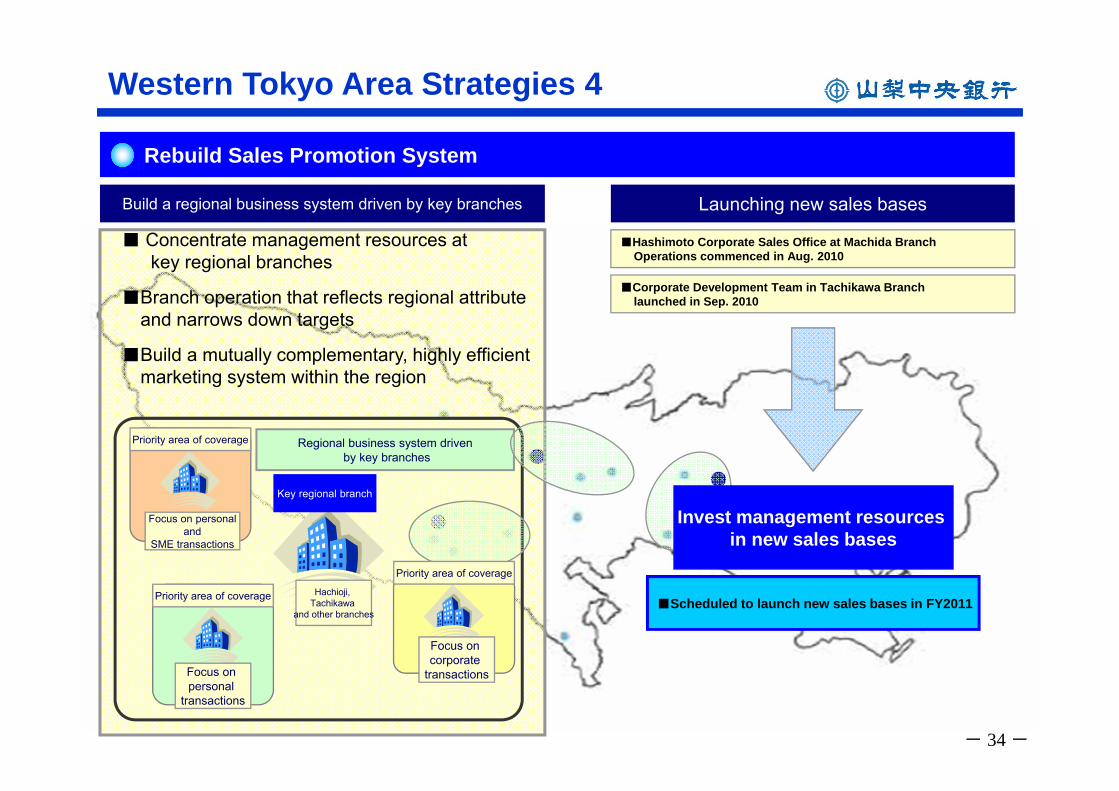
Western Tokyo Area Strategies 4
Build a regional business system driven by key branches Launching new sales bases
■ Concentrate management resources at key regional branches
■Branch operation that reflects regional attribute and narrows down targets
■Build a mutually complementary, highly efficientmarketing system within the region
Rebuild Sales Promotion System
■Scheduled to launch new sales bases in FY2011
Focus on personal
transactions
Focus on personaland
SME transactions
Key regional branch
Priority area of coverage
Priority area of coverage Hachioji, Tachikawa
and other branches
Regional business system drivenby key branches
■Corporate Development Team in Tachikawa Branch launched in Sep. 2010
■Hashimoto Corporate Sales Office at Machida Branch Operations commenced in Aug. 2010
Focus on corporate
transactions
Priority area of coverage
Invest management resources in new sales bases
- 35 -
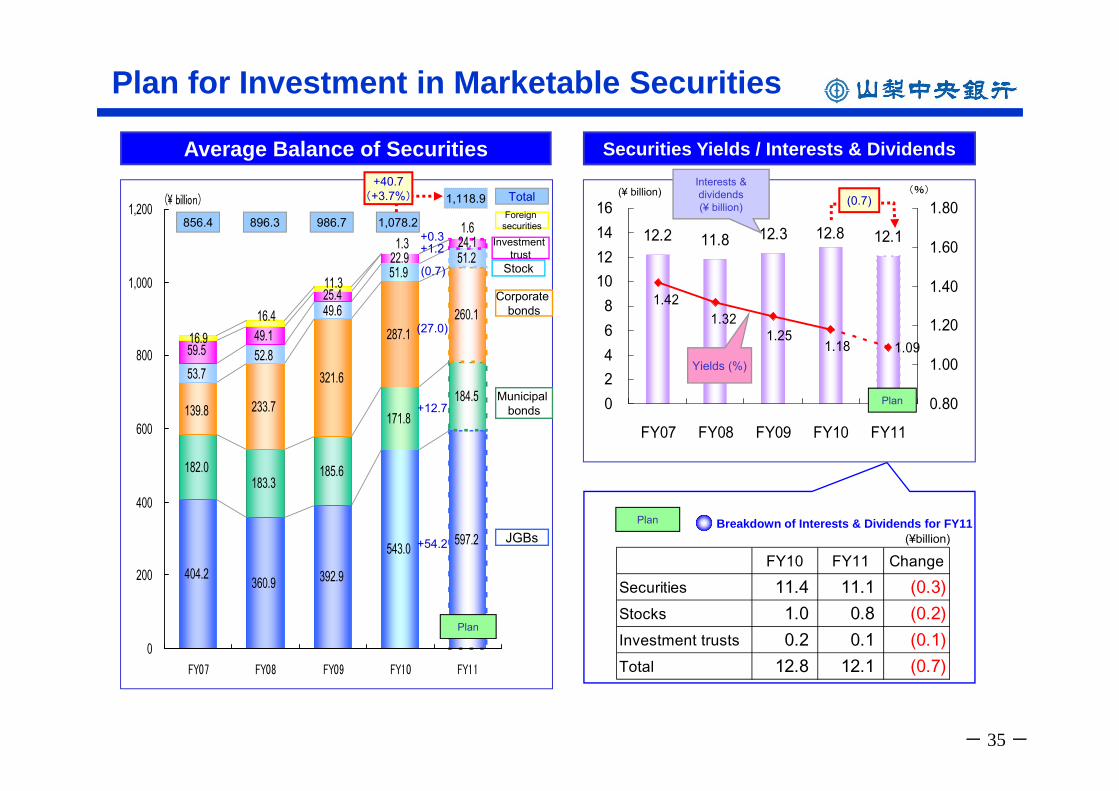
Average Balance of Securities
182.0183.3
185.6
171.8184.5
233.7
321.6
287.1260.1
51.2
16.9
543.0
392.9360.9404.2
597.2
139.8
51.9
49.6
52.853.7
49.159.5
24.1
25.4
22.9
1.61.3
11.3
16.4
0
200
400
600
800
1,000
1,200
FY07 FY08 FY09 FY10 FY11
(\ billion) 1,118.9 Total
JGBs
Stock
Foreign securities
Plan
Plan for Investment in Marketable Securities
Investment trust
1,078.2
Municipal bonds
Corporate bonds
986.7
Securities Yields / Interests & Dividends
FY10 FY11 ChangeSecurities 11.4 11.1 (0.3)Stocks 1.0 0.8 (0.2)Investment trusts 0.2 0.1 (0.1)Total 12.8 12.1 (0.7)
Breakdown of Interests & Dividends for FY11Plan
(¥billion)
856.4 896.3
+12.7
+54.2
(27.0)
+1.2+0.3
(0.7)
+40.7(+3.7%)
12.2 11.8 12.3 12.112.8
1.09
1.42
1.181.25
1.32
02468
10121416
FY07 FY08 FY09 FY10 FY11
0.80
1.00
1.20
1.40
1.60
1.80
Plan
(¥ billion) (%)(0.7)
Interests & dividends(¥ billion)
Yields (%)
- 36 -
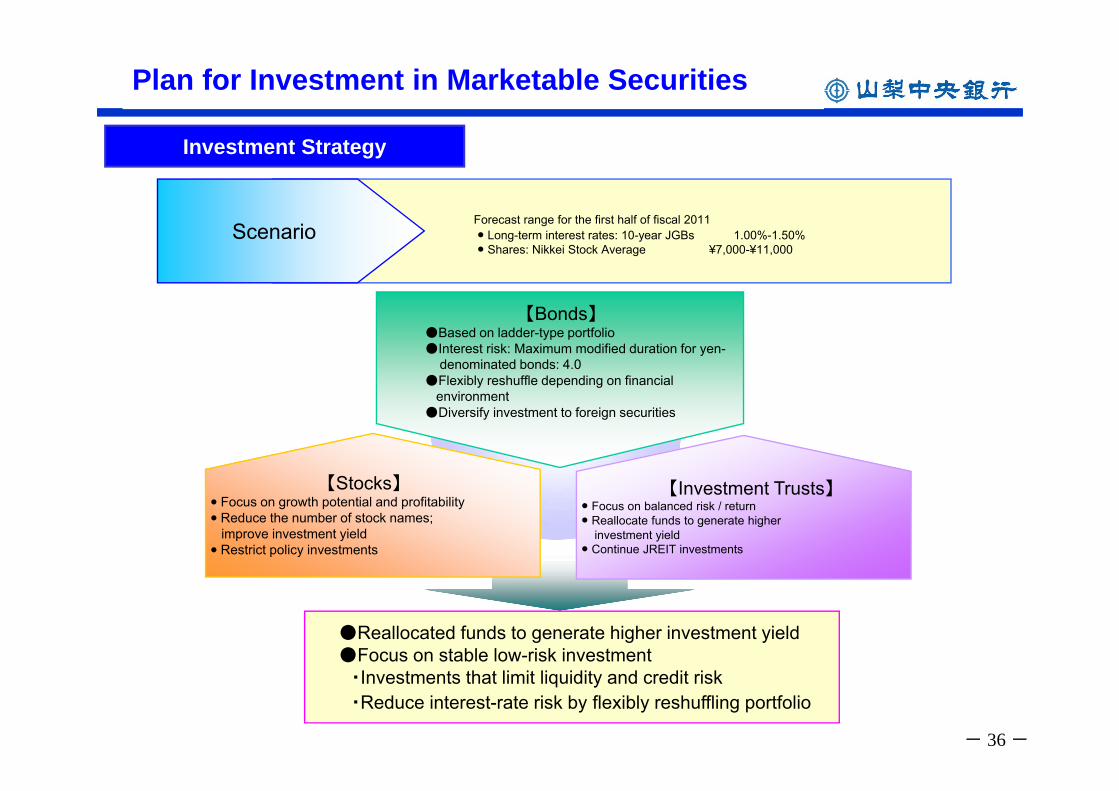
Plan for Investment in Marketable Securities
【Stocks】● Focus on growth potential and profitability● Reduce the number of stock names;
improve investment yield● Restrict policy investments
【Investment Trusts】● Focus on balanced risk / return● Reallocate funds to generate higher
investment yield● Continue JREIT investments
【Bonds】●Based on ladder-type portfolio●Interest risk: Maximum modified duration for yen-
denominated bonds: 4.0●Flexibly reshuffle depending on financial
environment●Diversify investment to foreign securities
Forecast range for the first half of fiscal 2011● Long-term interest rates: 10-year JGBs 1.00%-1.50%● Shares: Nikkei Stock Average ¥7,000-¥11,000
Investment Strategy
Scenario
●Reallocated funds to generate higher investment yield●Focus on stable low-risk investment
・Investments that limit liquidity and credit risk ・Reduce interest-rate risk by flexibly reshuffling portfolio
- 37 -
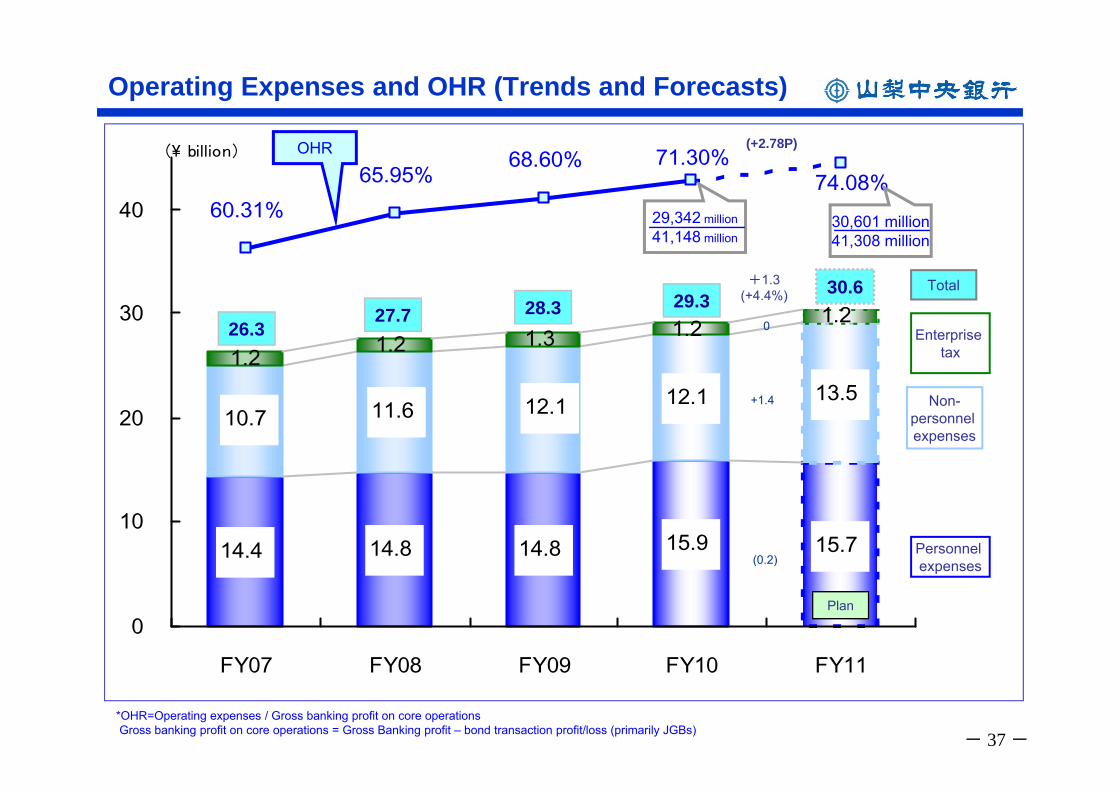
Operating Expenses and OHR (Trends and Forecasts)
14.4 14.8 14.8 15.9 15.7
12.1 13.510.7 11.6 12.1
1.2
1.2 1.2 1.3 1.2
74.08%60.31%
65.95%68.60% 71.30%
0
10
20
30
40
FY07 FY08 FY09 FY10 FY11
(\ billion)
*OHR=Operating expenses / Gross banking profit on core operationsGross banking profit on core operations = Gross Banking profit – bond transaction profit/loss (primarily JGBs)
26.328.3 29.3
Plan
+1.3(+4.4%)
OHR (+2.78P)
30,601 million41,308 million
Enterprise tax
Total
Non-personnel expenses
Personnel expenses
30.627.7
29,342 million41,148 million
0
(0.2)
+1.4
- 38 -
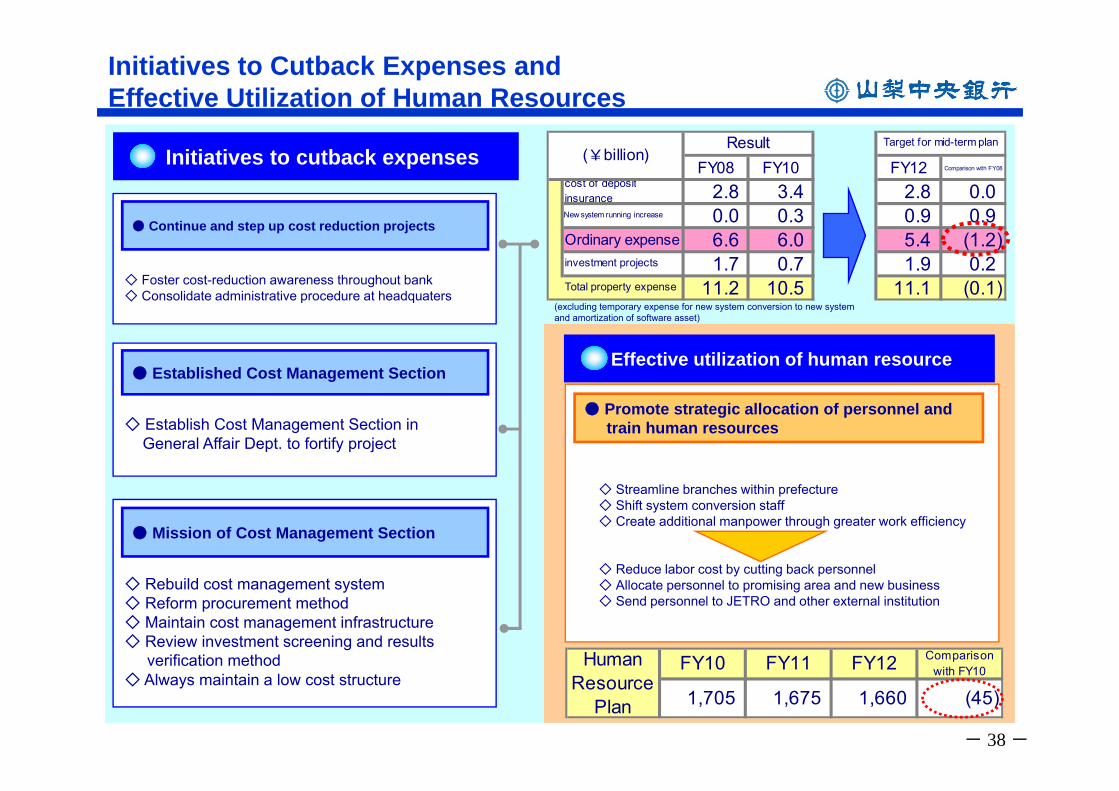
Initiatives to Cutback Expenses and Effective Utilization of Human Resources
● Established Cost Management Section
◇ Establish Cost Management Section in General Affair Dept. to fortify project
● Continue and step up cost reduction projects
◇ Foster cost-reduction awareness throughout bank◇ Consolidate administrative procedure at headquaters
● Mission of Cost Management Section
◇ Rebuild cost management system◇ Reform procurement method◇ Maintain cost management infrastructure ◇ Review investment screening and results
verification method◇ Always maintain a low cost structure
Initiatives to cutback expenses
(excluding temporary expense for new system conversion to new system and amortization of software asset)
● Promote strategic allocation of personnel and train human resources
◇ Streamline branches within prefecture◇ Shift system conversion staff◇ Create additional manpower through greater work efficiency
◇ Reduce labor cost by cutting back personnel ◇ Allocate personnel to promising area and new business ◇ Send personnel to JETRO and other external institution
Effective utilization of human resource
FY10 FY11 FY12 Comparisonwith FY10
1,705 1,675 1,660 (45)
HumanResource
Plan
FY08 FY10 FY12 Comparison with FY08
cost of depositinsurance 2.8 3.4 2.8 0.0New system running increase 0.0 0.3 0.9 0.9Ordinary expense 6.6 6.0 5.4 (1.2)investment projects 1.7 0.7 1.9 0.2Total property expense 11.2 10.5 11.1 (0.1)
Target for mid-term planResult(¥billion)
- 39 -
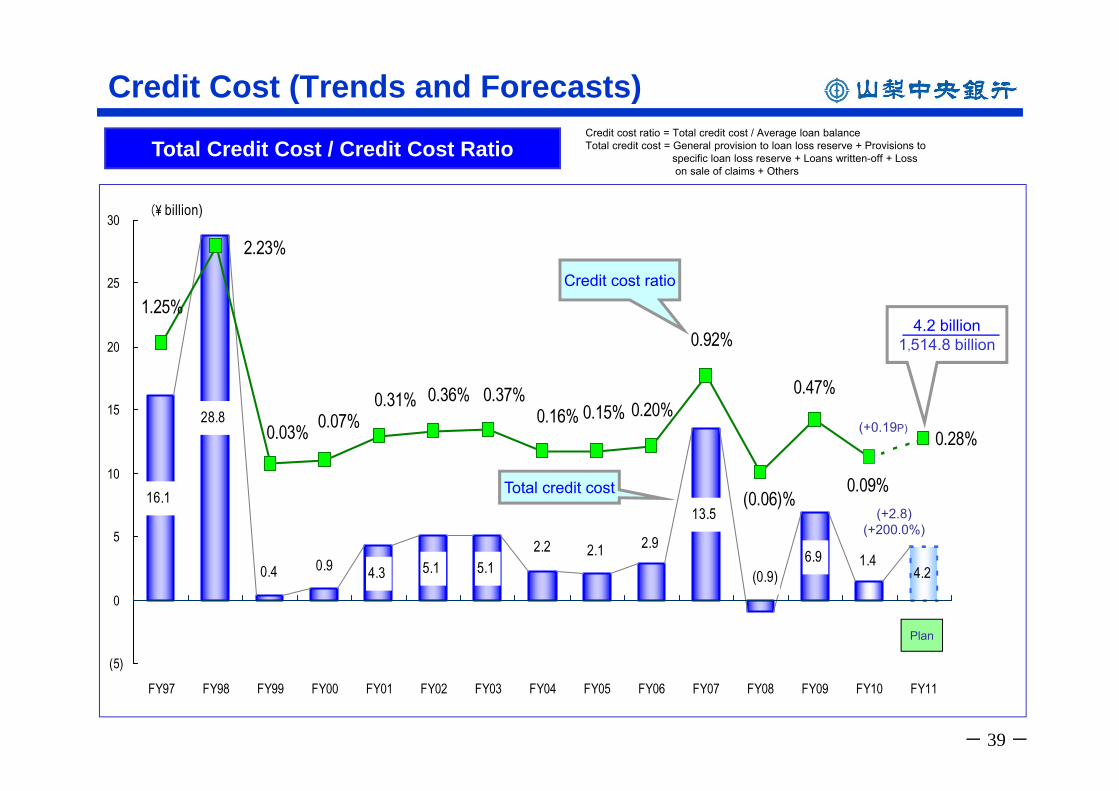
Credit Cost (Trends and Forecasts)
Total Credit Cost / Credit Cost RatioCredit cost ratio = Total credit cost / Average loan balanceTotal credit cost = General provision to loan loss reserve + Provisions to
specific loan loss reserve + Loans written-off + Loss on sale of claims + Others
16.1
28.8
4.3 5.1 5.1
13.5
2.92.12.2 6.9(0.9)0.4 0.9 1.4
4.2
0.28%
0.47%
(0.06)%
1.25%
2.23%
0.03% 0.07%0.31% 0.36% 0.37%
0.16% 0.15% 0.20%
0.92%
0.09%
(5)
0
5
10
15
20
25
30
FY97 FY98 FY99 FY00 FY01 FY02 FY03 FY04 FY05 FY06 FY07 FY08 FY09 FY10 FY11
(\ billion)
Total credit cost
Plan
4.2 billion1,514.8 billion
Credit cost ratio
(+2.8) (+200.0%)
(+0.19P)
- 40 -
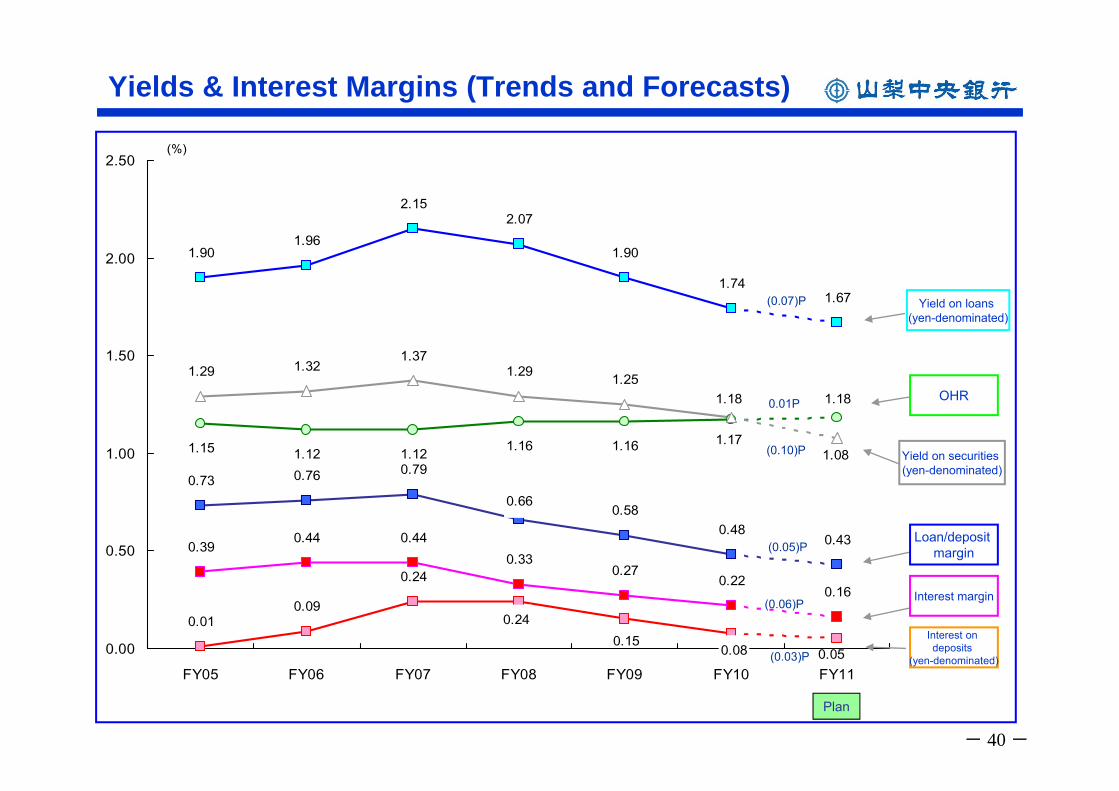
Yields & Interest Margins (Trends and Forecasts)
0.050.080.150.24
0.24
0.090.01
1.18
1.171.161.161.15 1.12 1.12
0.430.48
0.580.66
0.790.760.73
1.671.74
1.90
2.072.15
1.961.90
1.08
1.181.251.29
1.371.321.29
0.160.22
0.270.33
0.440.440.39
0.00
0.50
1.00
1.50
2.00
2.50
FY05 FY06 FY07 FY08 FY09 FY10 FY11
(%)
Plan
Yield on loans (yen-denominated)
Yield on securities (yen-denominated)
OHR
Loan/deposit margin
Interest margin
Interest on deposits
(yen-denominated)
0.01P
(0.07)P
(0.10)P
(0.05)P
(0.06)P
(0.03)P
- 41 -
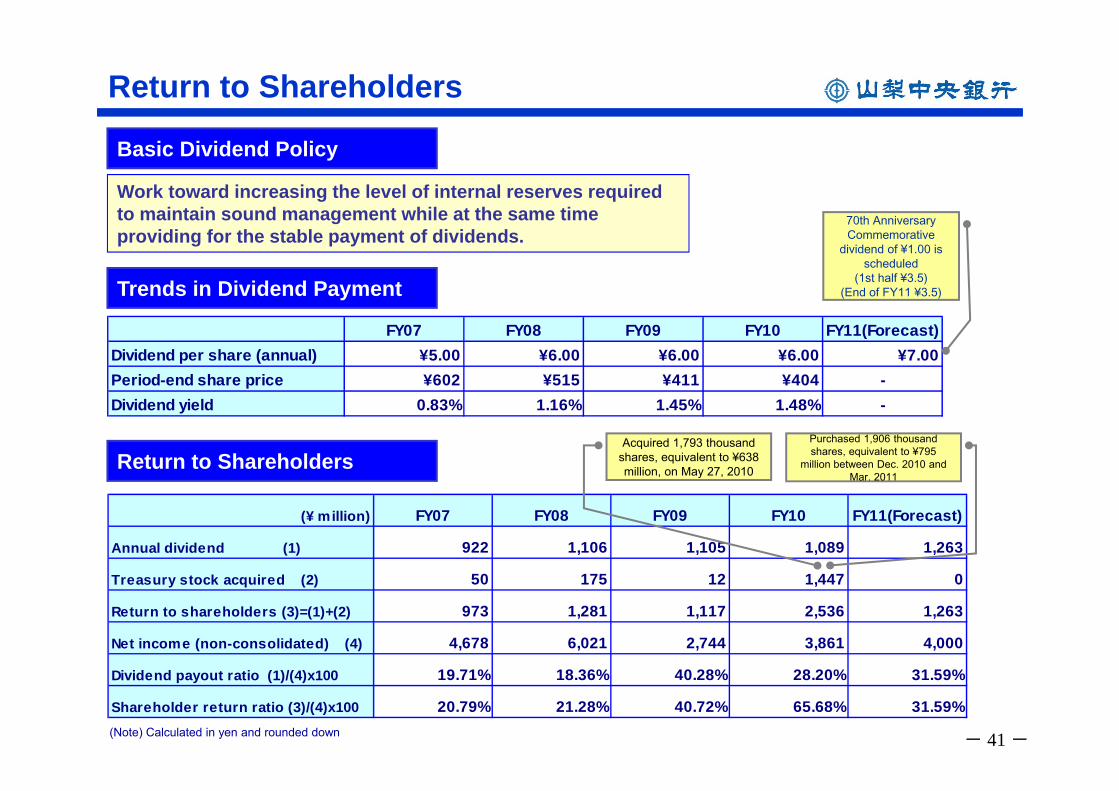
Return to Shareholders
Work toward increasing the level of internal reserves required to maintain sound management while at the same time providing for the stable payment of dividends.
Basic Dividend Policy
Return to Shareholders
Trends in Dividend Payment
FY07 FY08 FY09 FY10 FY11(Forecast)Dividend per share (annual) ¥5.00 ¥6.00 ¥6.00 ¥6.00 ¥7.00Period-end share price ¥602 ¥515 ¥411 ¥404 -Dividend yield 0.83% 1.16% 1.45% 1.48% -
(¥ million) FY07 FY08 FY09 FY10 FY11(Forecast)
Annual dividend (1) 922 1,106 1,105 1,089 1,263
Treasury stock acquired (2) 50 175 12 1,447 0
Return to shareholders (3)=(1)+(2) 973 1,281 1,117 2,536 1,263
Net income (non-consolidated) (4) 4,678 6,021 2,744 3,861 4,000
Dividend payout ratio (1)/(4)x100 19.71% 18.36% 40.28% 28.20% 31.59%
Shareholder return ratio (3)/(4)x100 20.79% 21.28% 40.72% 65.68% 31.59%
Acquired 1,793 thousand shares, equivalent to ¥638 million, on May 27, 2010
Purchased 1,906 thousand shares, equivalent to ¥795
million between Dec. 2010 and Mar. 2011
(Note) Calculated in yen and rounded down
70th AnniversaryCommemorative
dividend of ¥1.00 is scheduled
(1st half ¥3.5)(End of FY11 ¥3.5)
Thank you for coming to our analyst meeting. If you have any further questions, please don’t hesitate to make inquiries at the following address.
Inquiries:
Corporate Communications CSR Office
Corporate Planning Division
The Yamanashi Chuo Bank, Ltd.
Tel: +81-55-233-2111
E‐mail [email protected]
URL: http://www.yamanashibank.co.jp/
The reader is advised that these materials contain forward-looking statements. These statements do not constitute guarantees of future business performance, and they involve various risks and unforeseeable future circumstances. The Bank’s future business performance may be affected by changes in the business environment that are beyond the prediction or control of the Bank, andactual results may therefore differ substantially from the figures contained in the said forward-looking statements.