Working with Analyst Data: Overview and Empirical Issues
31
Working with Analyst Data: Overview and Empirical Issues Denys Glushkov Associate Director, WRDS WRDS Users Meeting The Wharton School, University of Pennsylvania October 1, 2007
-
Upload
independent -
Category
Documents
-
view
5 -
download
0
Transcript of Working with Analyst Data: Overview and Empirical Issues

Working with Analyst Data:
Overview and Empirical Issues
Denys GlushkovAssociate Director, WRDS
WRDS Users Meeting
The Wharton School, University of Pennsylvania
October 1, 2007
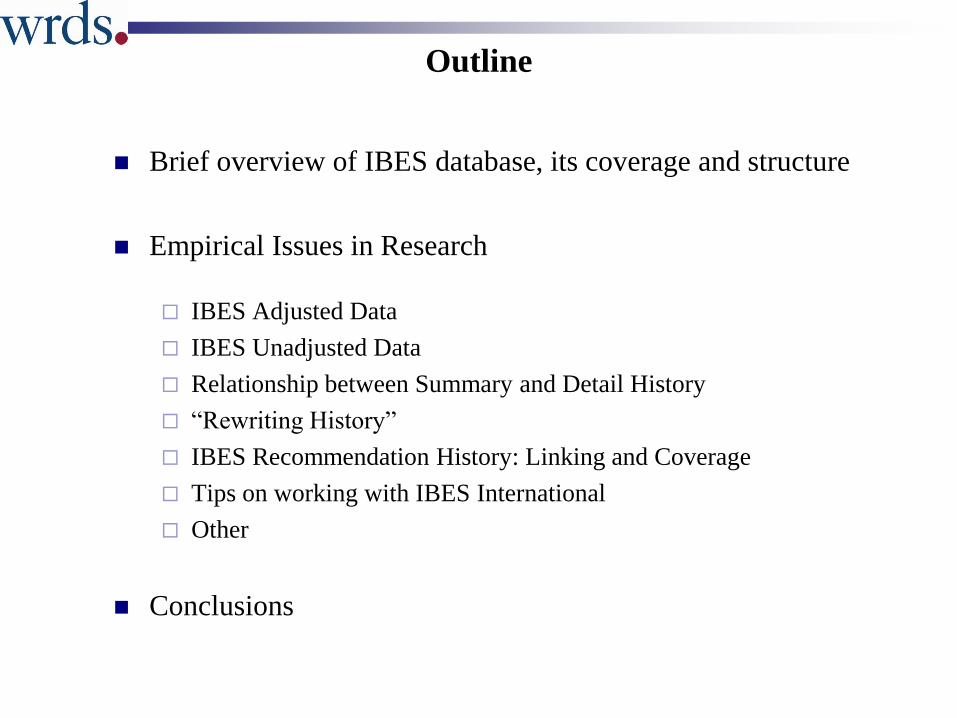
Outline
Brief overview of IBES database, its coverage and structure
Empirical Issues in Research
IBES Adjusted Data
IBES Unadjusted Data
Relationship between Summary and Detail History
“Rewriting History”
IBES Recommendation History: Linking and Coverage
Tips on working with IBES International
Other
Conclusions
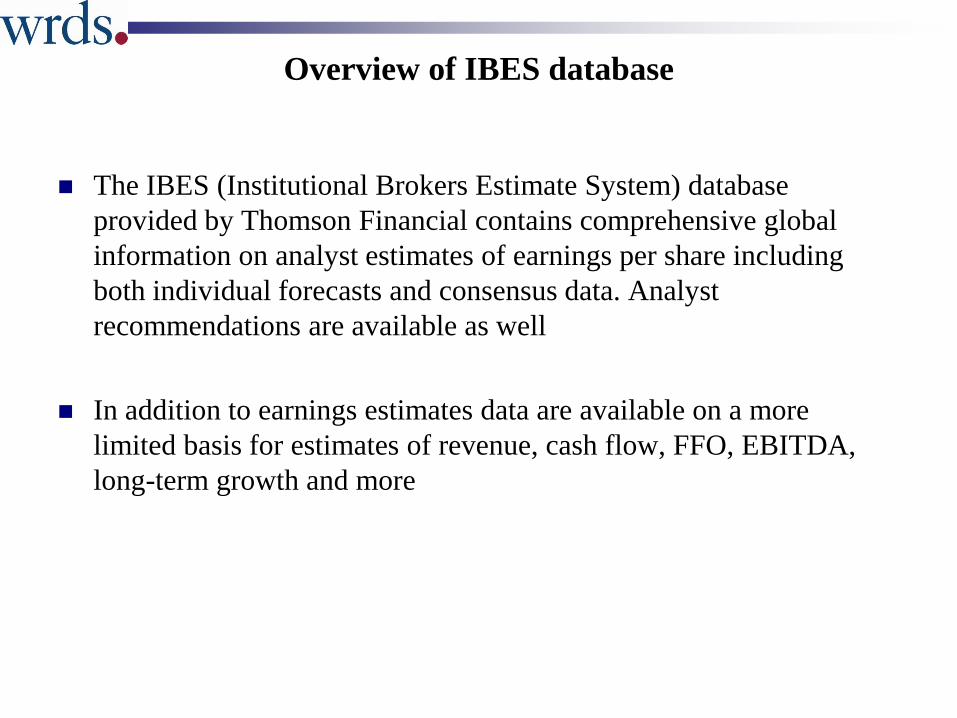
Overview of IBES database
The IBES (Institutional Brokers Estimate System) database
provided by Thomson Financial contains comprehensive global
information on analyst estimates of earnings per share including
both individual forecasts and consensus data. Analyst
recommendations are available as well
In addition to earnings estimates data are available on a more
limited basis for estimates of revenue, cash flow, FFO, EBITDA,
long-term growth and more

IBES Coverage
The IBES database currently covers over 63,000 securities for more
than 50,000 companies in more than 150 industries
Securities in 84 countries
41.5% are for the US including 7% Canadian companies
58.5% are for non-US (international plus some Canadian)
As of Sep 2007, more than 2,500 firms contribute data to I/B/E/S,
from the largest global houses to regional and local brokers, with US
data back to 1976 and international data back to 1987
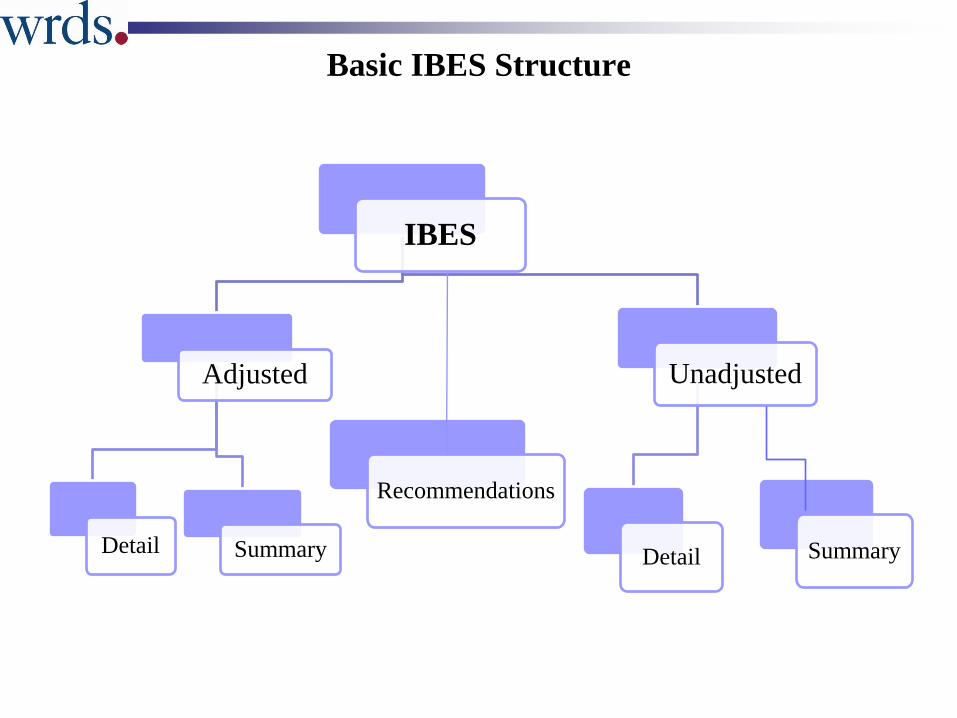
Basic IBES Structure
IBES
Adjusted
Detail Summary
Unadjusted
Detail
Recommendations
Summary
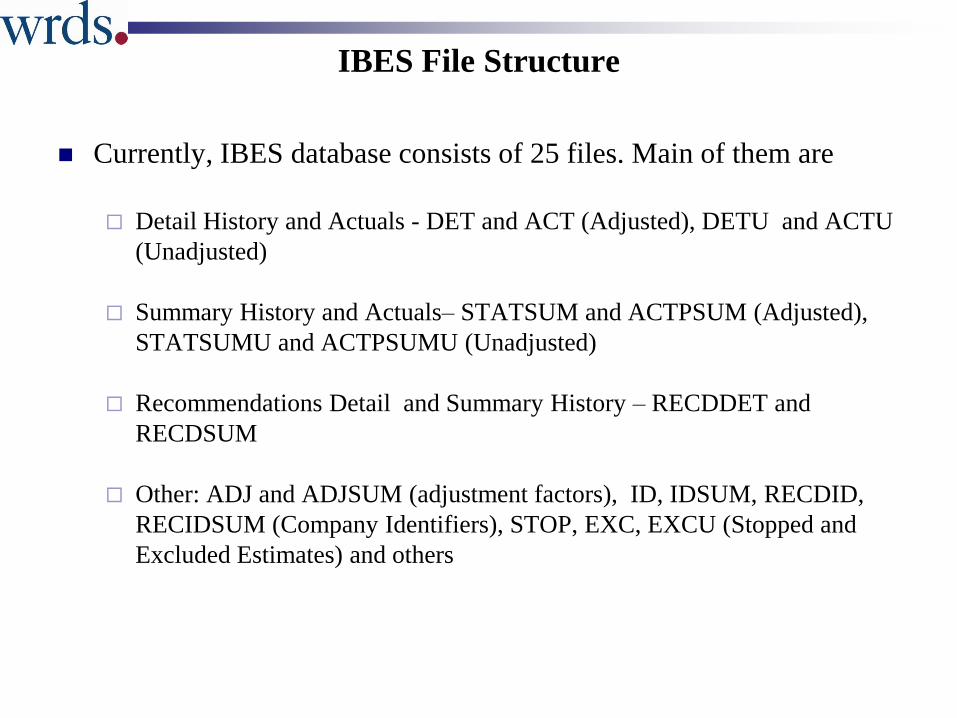
IBES File Structure
Currently, IBES database consists of 25 files. Main of them are
Detail History and Actuals - DET and ACT (Adjusted), DETU and ACTU
(Unadjusted)
Summary History and Actuals– STATSUM and ACTPSUM (Adjusted),
STATSUMU and ACTPSUMU (Unadjusted)
Recommendations Detail and Summary History – RECDDET and
RECDSUM
Other: ADJ and ADJSUM (adjustment factors), ID, IDSUM, RECDID,
RECIDSUM (Company Identifiers), STOP, EXC, EXCU (Stopped and
Excluded Estimates) and others
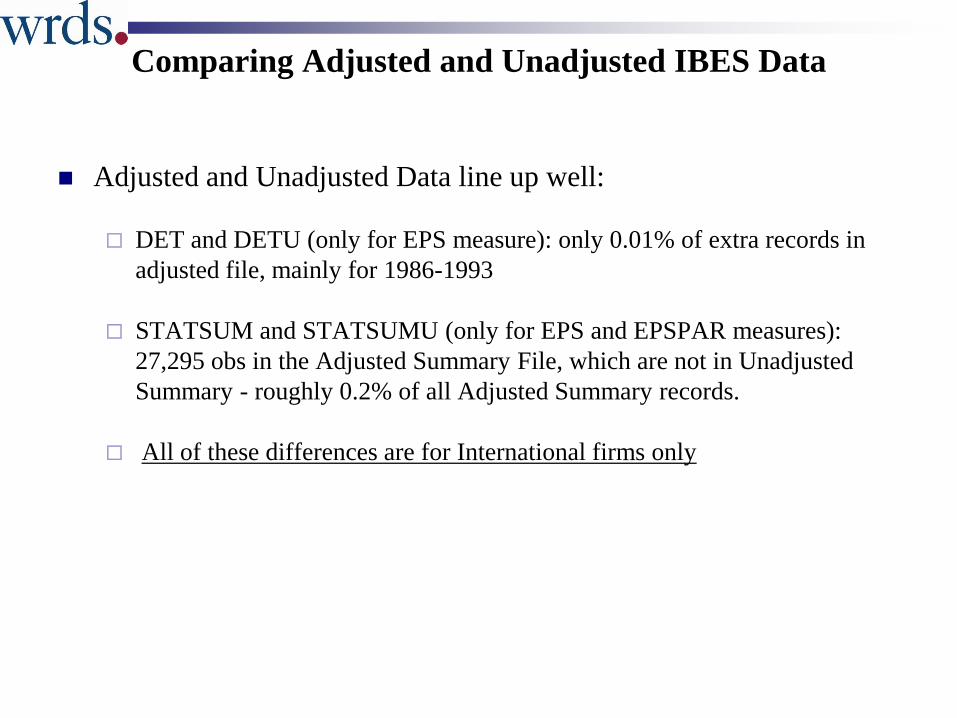
Comparing Adjusted and Unadjusted IBES Data
Adjusted and Unadjusted Data line up well:
DET and DETU (only for EPS measure): only 0.01% of extra records in
adjusted file, mainly for 1986-1993
STATSUM and STATSUMU (only for EPS and EPSPAR measures):
27,295 obs in the Adjusted Summary File, which are not in Unadjusted
Summary - roughly 0.2% of all Adjusted Summary records.
All of these differences are for International firms only
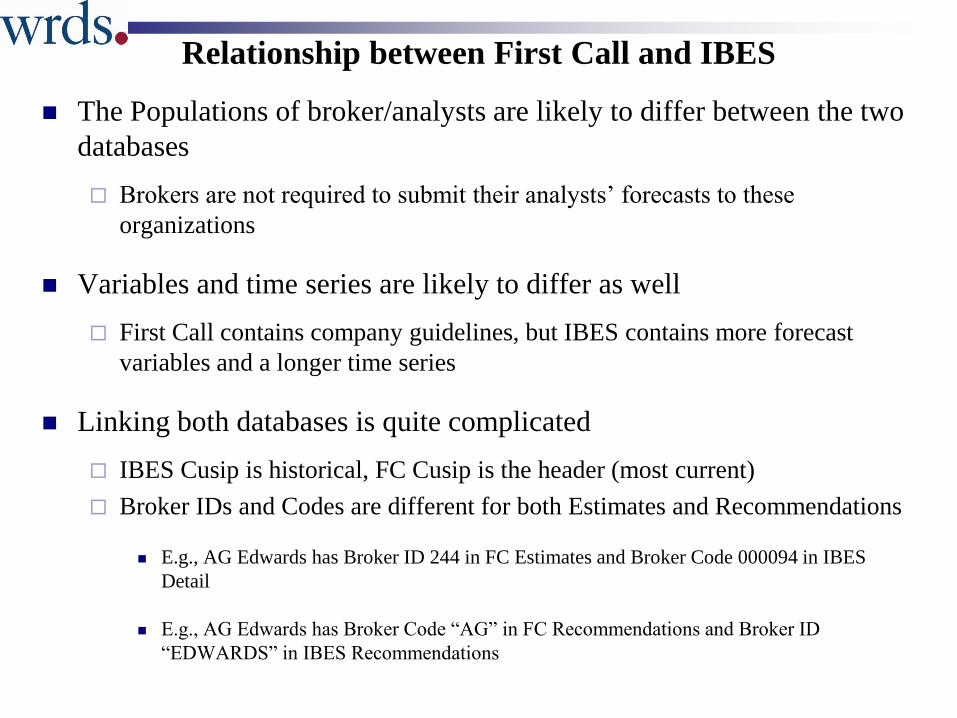
Relationship between First Call and IBES
The Populations of broker/analysts are likely to differ between the two
databases
Brokers are not required to submit their analysts’ forecasts to these
organizations
Variables and time series are likely to differ as well
First Call contains company guidelines, but IBES contains more forecast
variables and a longer time series
Linking both databases is quite complicated
IBES Cusip is historical, FC Cusip is the header (most current)
Broker IDs and Codes are different for both Estimates and Recommendations
E.g., AG Edwards has Broker ID 244 in FC Estimates and Broker Code 000094 in IBES
Detail
E.g., AG Edwards has Broker Code “AG” in FC Recommendations and Broker ID
“EDWARDS” in IBES Recommendations
IBES Adjusted Data: Things to know
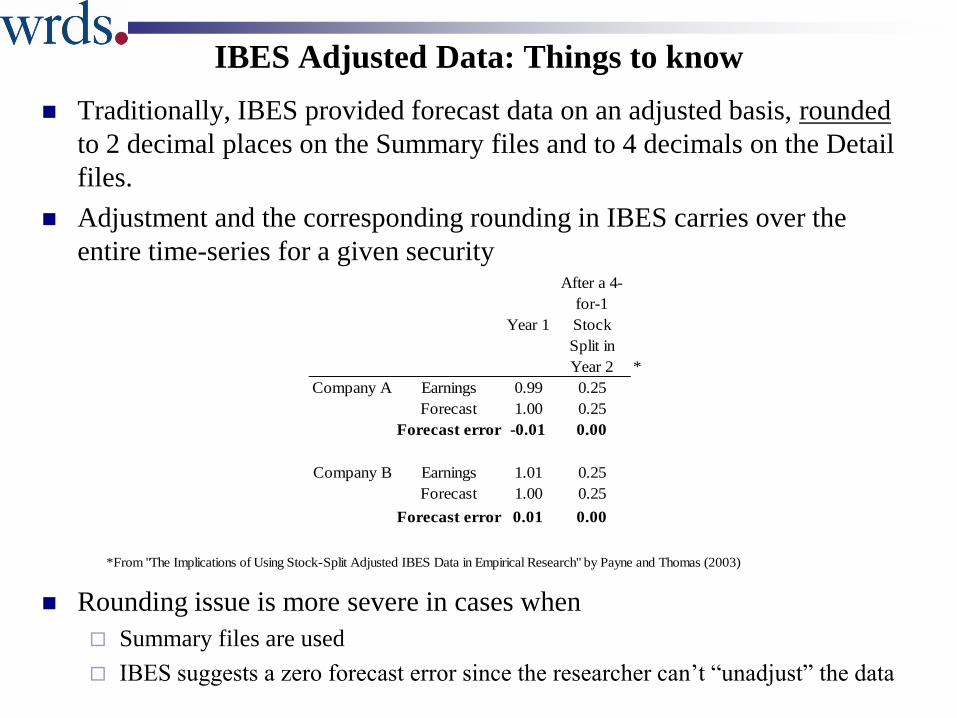
Traditionally, IBES provided forecast data on an adjusted basis, rounded
to 2 decimal places on the Summary files and to 4 decimals on the Detail
files.
Adjustment and the corresponding rounding in IBES carries over the
entire time-series for a given security
Rounding issue is more severe in cases when
Summary files are used
IBES suggests a zero forecast error since the researcher can’t “unadjust” the data
Year 1
After a 4-
for-1
Stock
Split in
Year 2 *
Company A Earnings 0.99 0.25
Forecast 1.00 0.25
Forecast error -0.01 0.00
Company B Earnings 1.01 0.25
Forecast 1.00 0.25
Forecast error 0.01 0.00
*From "The Implications of Using Stock-Split Adjusted IBES Data in Empirical Research" by Payne and Thomas (2003)
IBES Adjusted Data: Things to know
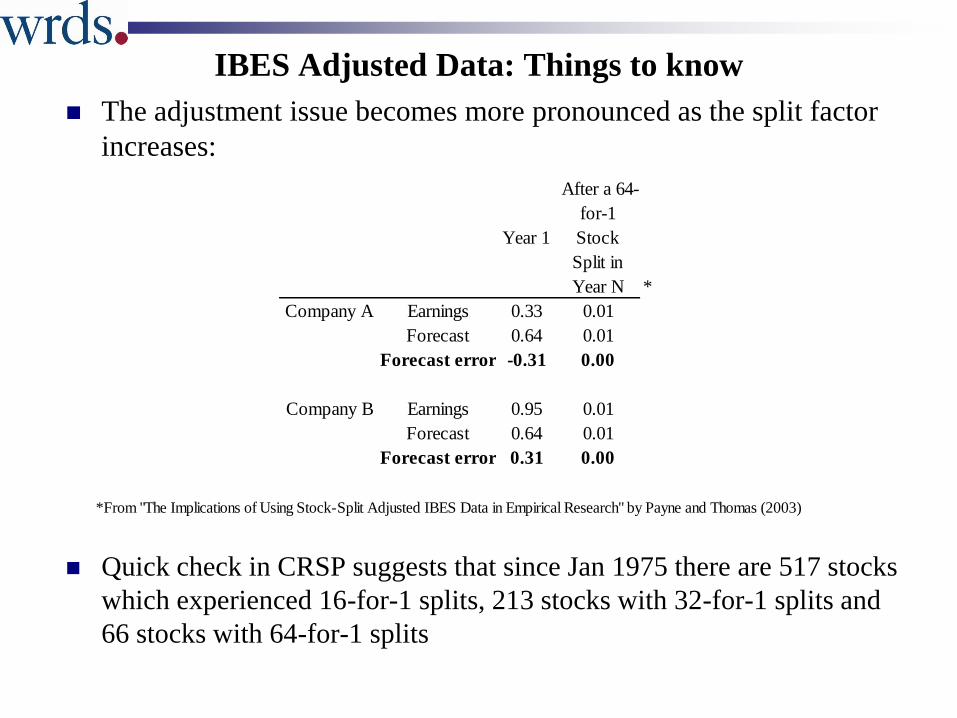
The adjustment issue becomes more pronounced as the split factor
increases:
Quick check in CRSP suggests that since Jan 1975 there are 517 stocks
which experienced 16-for-1 splits, 213 stocks with 32-for-1 splits and
66 stocks with 64-for-1 splits
Year 1
After a 64-
for-1
Stock
Split in
Year N *
Company A Earnings 0.33 0.01
Forecast 0.64 0.01
Forecast error -0.31 0.00
Company B Earnings 0.95 0.01
Forecast 0.64 0.01
Forecast error 0.31 0.00
*From "The Implications of Using Stock-Split Adjusted IBES Data in Empirical Research" by Payne and Thomas (2003)
IBES Adjusted and Unadjusted data: Things to know
Payne and Thomas (2003) find that research conclusions are more
likely to be affected by the rounding procedure in samples that have
stock splits
e.g., larger firms, higher M/B, better performers, etc
AND
Where the research question focuses on zero forecast error amounts
assessing the percentage of zero forecast errors over time
relating firm characteristics to the probability of zero forecast errors over
time
calculating the market’s reaction to zero forecast error
inferring earnings management based on the distribution of earnings,
earnings changes and forecast errors around zero
What is a researcher to do?
It is useful to know the actual historical amounts that are NOT
adjusted for subsequent stock splits – IBES Unadjusted Data - and
create their own split-adjusted data without rounding to the nearest
penny
If unadjusted data can not be obtained, an alternative is to
recalculate IBES consensus statistics using the detail IBES adjusted
data (which has rounding to 4 decimals)
IBES Unadjusted Data I: Things to Know
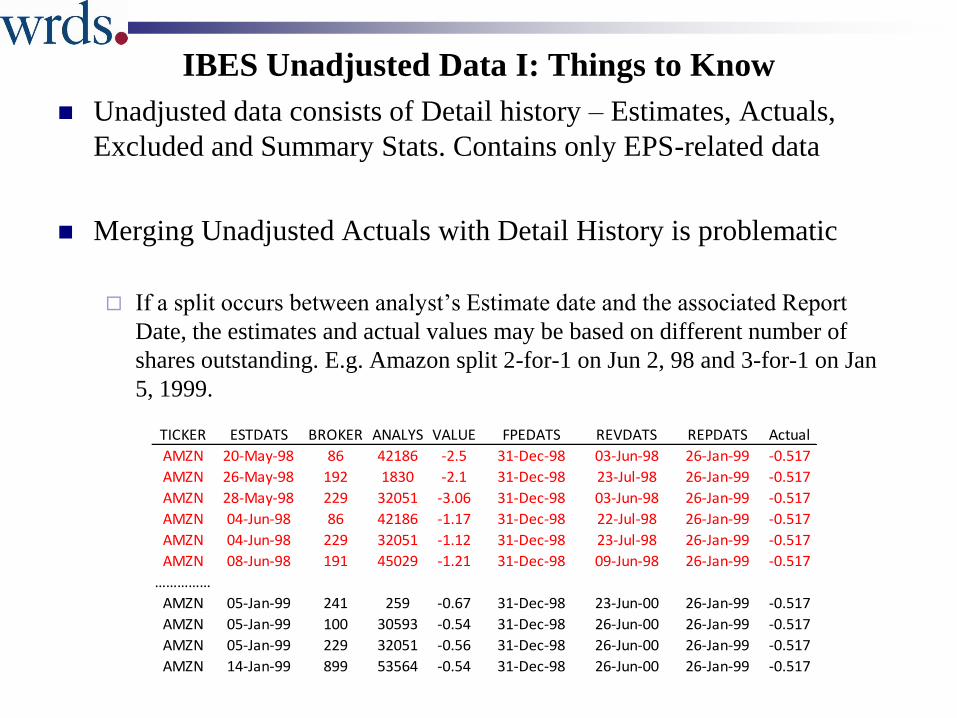
Unadjusted data consists of Detail history – Estimates, Actuals,
Excluded and Summary Stats. Contains only EPS-related data
Merging Unadjusted Actuals with Detail History is problematic
If a split occurs between analyst’s Estimate date and the associated Report
Date, the estimates and actual values may be based on different number of
shares outstanding. E.g. Amazon split 2-for-1 on Jun 2, 98 and 3-for-1 on Jan
5, 1999.
TICKER ESTDATS BROKER ANALYS VALUE FPEDATS REVDATS REPDATS Actual
AMZN 20-May-98 86 42186 -2.5 31-Dec-98 03-Jun-98 26-Jan-99 -0.517
AMZN 26-May-98 192 1830 -2.1 31-Dec-98 23-Jul-98 26-Jan-99 -0.517
AMZN 28-May-98 229 32051 -3.06 31-Dec-98 03-Jun-98 26-Jan-99 -0.517
AMZN 04-Jun-98 86 42186 -1.17 31-Dec-98 22-Jul-98 26-Jan-99 -0.517
AMZN 04-Jun-98 229 32051 -1.12 31-Dec-98 23-Jul-98 26-Jan-99 -0.517
AMZN 08-Jun-98 191 45029 -1.21 31-Dec-98 09-Jun-98 26-Jan-99 -0.517
……………
AMZN 05-Jan-99 241 259 -0.67 31-Dec-98 23-Jun-00 26-Jan-99 -0.517
AMZN 05-Jan-99 100 30593 -0.54 31-Dec-98 26-Jun-00 26-Jan-99 -0.517
AMZN 05-Jan-99 229 32051 -0.56 31-Dec-98 26-Jun-00 26-Jan-99 -0.517
AMZN 14-Jan-99 899 53564 -0.54 31-Dec-98 26-Jun-00 26-Jan-99 -0.517
IBES Unadjusted Data II: Things to Know
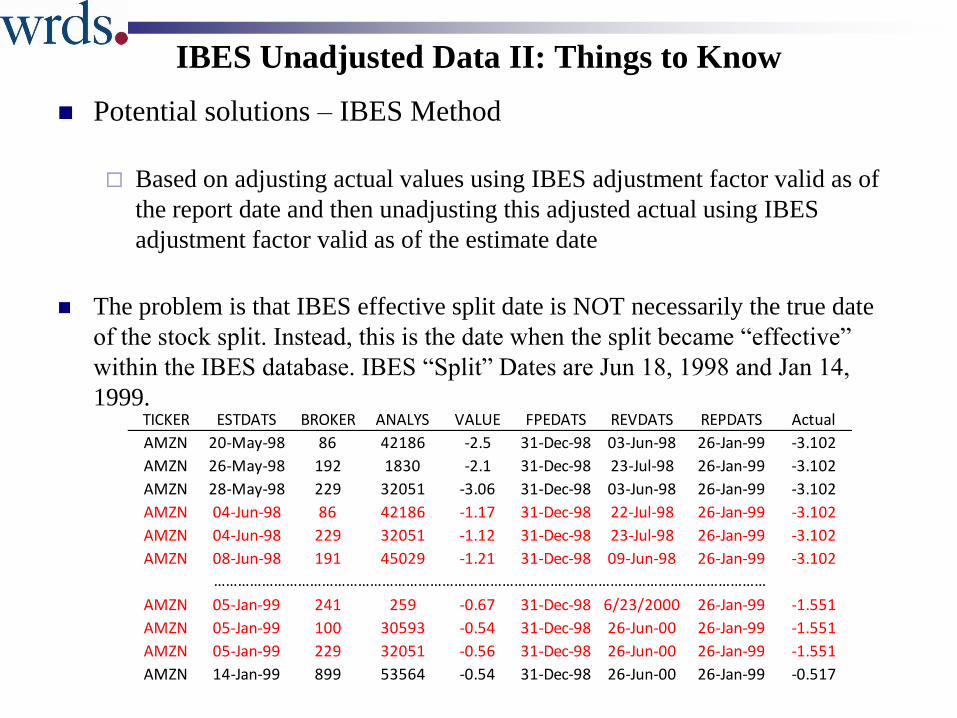
Potential solutions – IBES Method
Based on adjusting actual values using IBES adjustment factor valid as of
the report date and then unadjusting this adjusted actual using IBES
adjustment factor valid as of the estimate date
The problem is that IBES effective split date is NOT necessarily the true date
of the stock split. Instead, this is the date when the split became “effective”
within the IBES database. IBES “Split” Dates are Jun 18, 1998 and Jan 14,
1999.TICKER ESTDATS BROKER ANALYS VALUE FPEDATS REVDATS REPDATS Actual
AMZN 20-May-98 86 42186 -2.5 31-Dec-98 03-Jun-98 26-Jan-99 -3.102
AMZN 26-May-98 192 1830 -2.1 31-Dec-98 23-Jul-98 26-Jan-99 -3.102
AMZN 28-May-98 229 32051 -3.06 31-Dec-98 03-Jun-98 26-Jan-99 -3.102
AMZN 04-Jun-98 86 42186 -1.17 31-Dec-98 22-Jul-98 26-Jan-99 -3.102
AMZN 04-Jun-98 229 32051 -1.12 31-Dec-98 23-Jul-98 26-Jan-99 -3.102
AMZN 08-Jun-98 191 45029 -1.21 31-Dec-98 09-Jun-98 26-Jan-99 -3.102
AMZN 05-Jan-99 241 259 -0.67 31-Dec-98 6/23/2000 26-Jan-99 -1.551
AMZN 05-Jan-99 100 30593 -0.54 31-Dec-98 26-Jun-00 26-Jan-99 -1.551
AMZN 05-Jan-99 229 32051 -0.56 31-Dec-98 26-Jun-00 26-Jan-99 -1.551
AMZN 14-Jan-99 899 53564 -0.54 31-Dec-98 26-Jun-00 26-Jan-99 -0.517
…………………………………………………………………………………………………………………………
IBES Unadjusted Data III: Things to Know
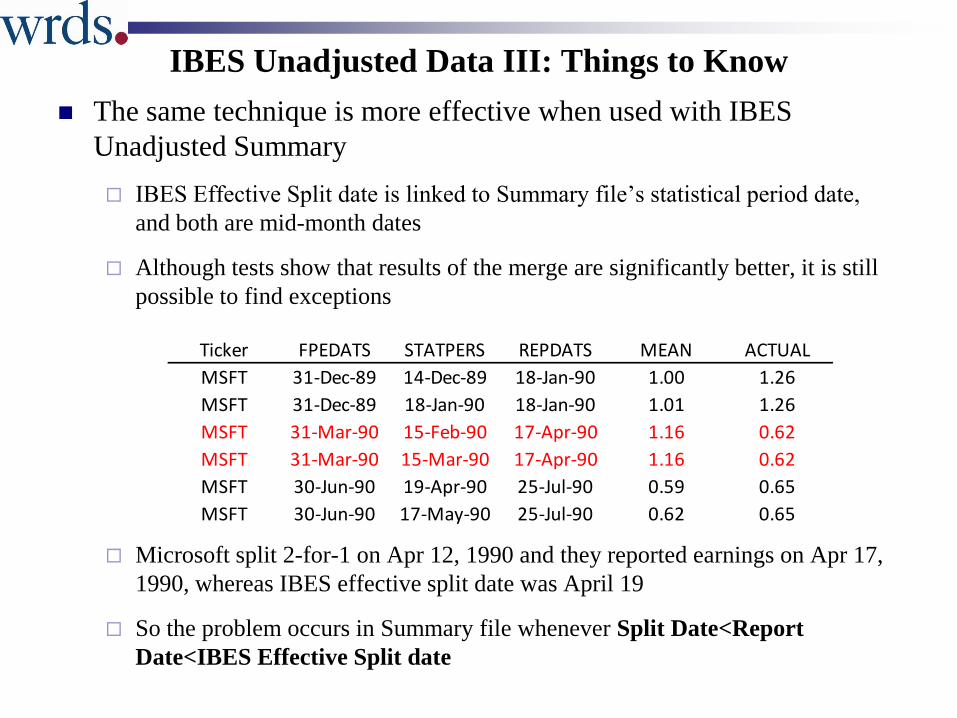
The same technique is more effective when used with IBES
Unadjusted Summary
IBES Effective Split date is linked to Summary file’s statistical period date,
and both are mid-month dates
Although tests show that results of the merge are significantly better, it is still
possible to find exceptions
Microsoft split 2-for-1 on Apr 12, 1990 and they reported earnings on Apr 17,
1990, whereas IBES effective split date was April 19
So the problem occurs in Summary file whenever Split Date<Report
Date<IBES Effective Split date
Ticker FPEDATS STATPERS REPDATS MEAN ACTUAL
MSFT 31-Dec-89 14-Dec-89 18-Jan-90 1.00 1.26
MSFT 31-Dec-89 18-Jan-90 18-Jan-90 1.01 1.26
MSFT 31-Mar-90 15-Feb-90 17-Apr-90 1.16 0.62
MSFT 31-Mar-90 15-Mar-90 17-Apr-90 1.16 0.62
MSFT 30-Jun-90 19-Apr-90 25-Jul-90 0.59 0.65
MSFT 30-Jun-90 17-May-90 25-Jul-90 0.62 0.65
IBES Unadjusted Data IV: Things to Know
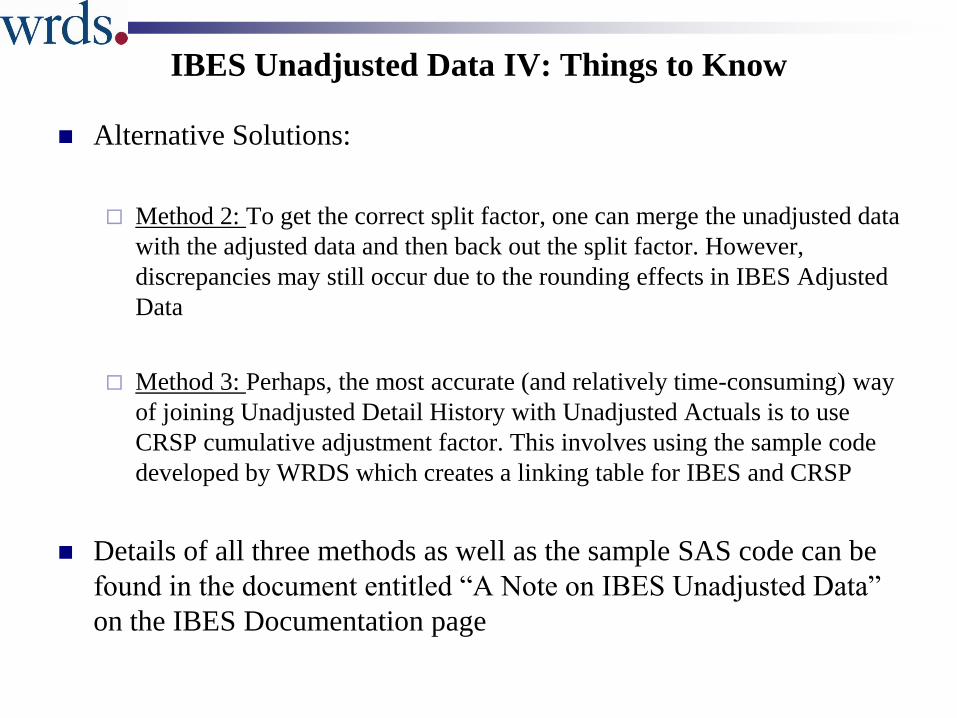
Alternative Solutions:
Method 2: To get the correct split factor, one can merge the unadjusted data
with the adjusted data and then back out the split factor. However,
discrepancies may still occur due to the rounding effects in IBES Adjusted
Data
Method 3: Perhaps, the most accurate (and relatively time-consuming) way
of joining Unadjusted Detail History with Unadjusted Actuals is to use
CRSP cumulative adjustment factor. This involves using the sample code
developed by WRDS which creates a linking table for IBES and CRSP
Details of all three methods as well as the sample SAS code can be
found in the document entitled “A Note on IBES Unadjusted Data”
on the IBES Documentation page
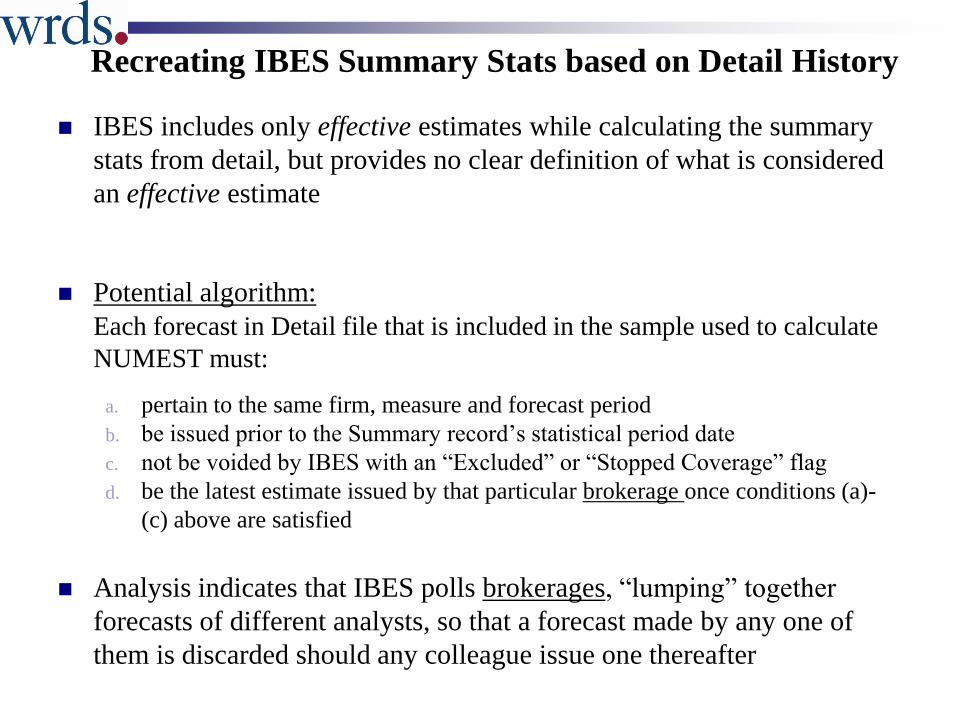
Recreating IBES Summary Stats based on Detail History
IBES includes only effective estimates while calculating the summary
stats from detail, but provides no clear definition of what is considered
an effective estimate
Potential algorithm:
Each forecast in Detail file that is included in the sample used to calculate
NUMEST must:
a. pertain to the same firm, measure and forecast period
b. be issued prior to the Summary record’s statistical period date
c. not be voided by IBES with an “Excluded” or “Stopped Coverage” flag
d. be the latest estimate issued by that particular brokerage once conditions (a)-
(c) above are satisfied
Analysis indicates that IBES polls brokerages, “lumping” together
forecasts of different analysts, so that a forecast made by any one of
them is discarded should any colleague issue one thereafter
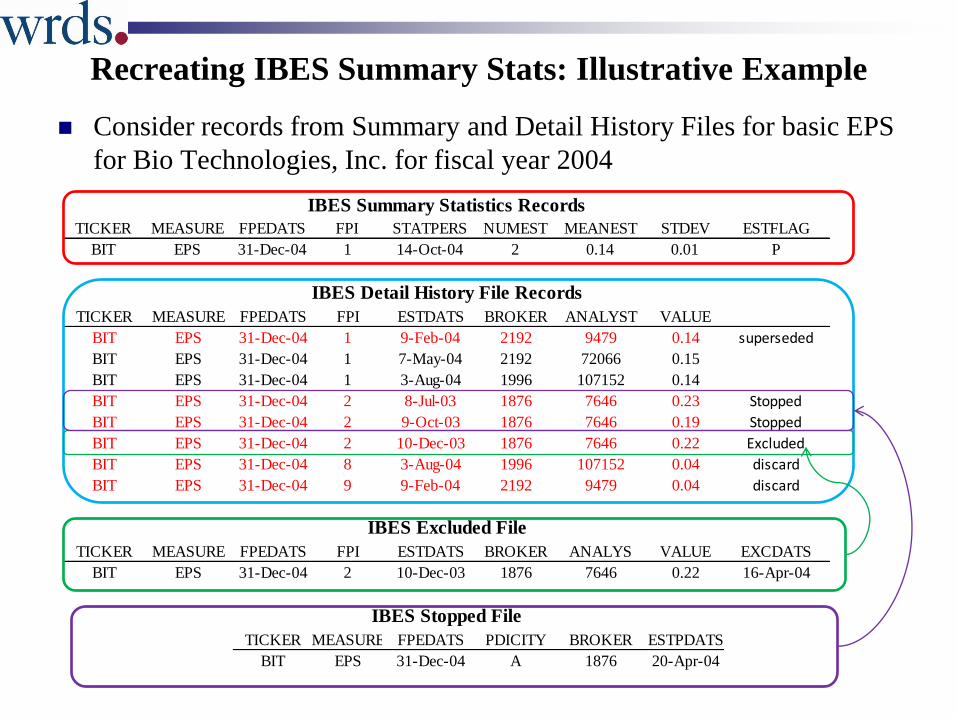
Recreating IBES Summary Stats: Illustrative Example
Consider records from Summary and Detail History Files for basic EPS
for Bio Technologies, Inc. for fiscal year 2004
TICKER MEASURE FPEDATS FPI STATPERS NUMEST MEANEST STDEV ESTFLAG
BIT EPS 31-Dec-04 1 14-Oct-04 2 0.14 0.01 P
TICKER MEASURE FPEDATS FPI ESTDATS BROKER ANALYST VALUE
BIT EPS 31-Dec-04 1 9-Feb-04 2192 9479 0.14 superseded
BIT EPS 31-Dec-04 1 7-May-04 2192 72066 0.15
BIT EPS 31-Dec-04 1 3-Aug-04 1996 107152 0.14
BIT EPS 31-Dec-04 2 8-Jul-03 1876 7646 0.23 Stopped
BIT EPS 31-Dec-04 2 9-Oct-03 1876 7646 0.19 Stopped
BIT EPS 31-Dec-04 2 10-Dec-03 1876 7646 0.22 Excluded
BIT EPS 31-Dec-04 8 3-Aug-04 1996 107152 0.04 discard
BIT EPS 31-Dec-04 9 9-Feb-04 2192 9479 0.04 discard
TICKER MEASURE FPEDATS FPI ESTDATS BROKER ANALYS VALUE EXCDATS
BIT EPS 31-Dec-04 2 10-Dec-03 1876 7646 0.22 16-Apr-04
TICKER MEASURE FPEDATS PDICITY BROKER ESTPDATS
BIT EPS 31-Dec-04 A 1876 20-Apr-04
IBES Detail History File Records
IBES Summary Statistics Records
IBES Excluded File
IBES Stopped File
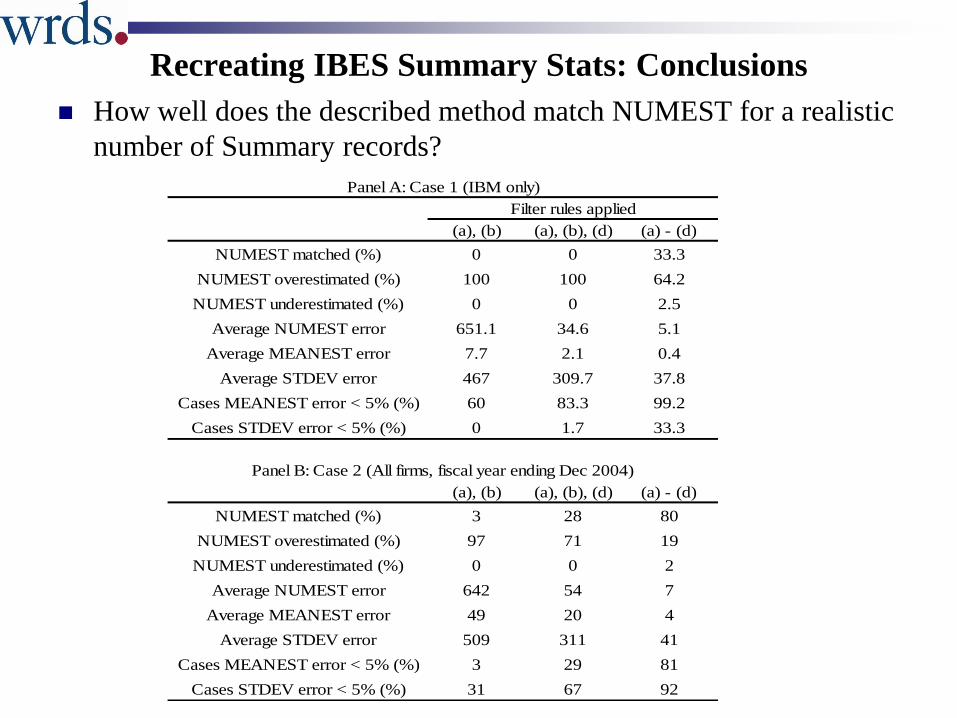
Recreating IBES Summary Stats: Conclusions
How well does the described method match NUMEST for a realistic
number of Summary records?
(a), (b) (a), (b), (d) (a) - (d)
NUMEST matched (%) 0 0 33.3
NUMEST overestimated (%) 100 100 64.2
NUMEST underestimated (%) 0 0 2.5
Average NUMEST error 651.1 34.6 5.1
Average MEANEST error 7.7 2.1 0.4
Average STDEV error 467 309.7 37.8
Cases MEANEST error < 5% (%) 60 83.3 99.2
Cases STDEV error < 5% (%) 0 1.7 33.3
(a), (b) (a), (b), (d) (a) - (d)
NUMEST matched (%) 3 28 80
NUMEST overestimated (%) 97 71 19
NUMEST underestimated (%) 0 0 2
Average NUMEST error 642 54 7
Average MEANEST error 49 20 4
Average STDEV error 509 311 41
Cases MEANEST error < 5% (%) 3 29 81
Cases STDEV error < 5% (%) 31 67 92
Panel A: Case 1 (IBM only)
Filter rules applied
Panel B: Case 2 (All firms, fiscal year ending Dec 2004)
Rewriting History
Ljungqvist, Malloy and Marston (2007) compared two snapshots of
IBES recommendations database (taken in Sep 2002 and May 2004) for
the same time period Oct 29, 1993-July 18, 2002 and find in a dataset of
280,464 obs there are 54,729 non-trivial ex-post changes. Of them
19.5% Alterations – records whose recommendation levels are different on the
2002 and 2004 tapes
9% Deletions - records that appear on the 2002 tape but not on the 2004 tape
35.1% Additions – records that appear on the 2004 tape but not on the 2002 tape
36.4% of anonymizations – records attributed to specific analysts on the 2002
tape whose names on the 2004 tape (and whose amaskcd identifiers have been
set to zero)
Thomson Financial have recently reinstated the missing analyst names in
the recommendation history file – as of Feb 12, 2007, the data on WRDS
now reflect this reinstatement
IBES Vintage Changes, part I
According to the informatiom from Thomson Financial
“the great majority of the records missing in the July 2007
vintage are for brokers Merrill Lynch (non-US and Canada)
and Lehman Brothers (Europe and Global), due to requests
from the two brokers that WRDS does not have access to their
forecast data”
Recommendation History, however, does not appear to have the same issue
WRDS identified 57 unique broker ID which were present in Dec
2002 vintage of Detail History, but no longer exist in July 2007
vintage.
Majority of these “dissappeared” brokers are international such as JP
Morgan (Intl), Bear Stearns &Co Inc (Latin), Morgan Stanley Pacific
Basin and ABN Amro Australia Ltd

IBES Vintage Changes, part II
Though IBES actual values are “as reported” and not “restated”, but
we found some observations for which actuals were changed
between the vintages (march 2007 and aug 2007 were used):
For USFIRM=1 and EPS measure only there is 1.7% of changed actuals. 88%
of them have differences more than 5% in absolute magnitude
For USFIRM=1 and all measures, there is 0.8% of changed actuals. 67% of
them have differences more than 5% in absolute magnitude
For USFIRM=0 and EPS measure, there is 3% of changed actuals
There does not seem to be a drastic number of changes in actuals
and these findings are likely to reflect regular revisions/corrections
IBES does to the database
Linking Detail History and Recommendations
Matching should be performed by the analyst codes in the two files,
ANALYS and AMASKCD.
The analyst codes are the same in both files, but the broker codes are not (i.e., a
given broker may have different codes in the two files).
For each Detail History EPS estimate, match all unique
recommendations that existed during the period that the estimate
was still valid. That is,
If a given analyst estimate was in effect between ESTDATS and REVDATS,
each unique recommendation that existed for at least one day within that time
period will generate a new record in the merged file
The first date of the recommendation must come on or before the last date of
the estimate, and the last date of the recommendation must come on or after the
first date of the estimate.
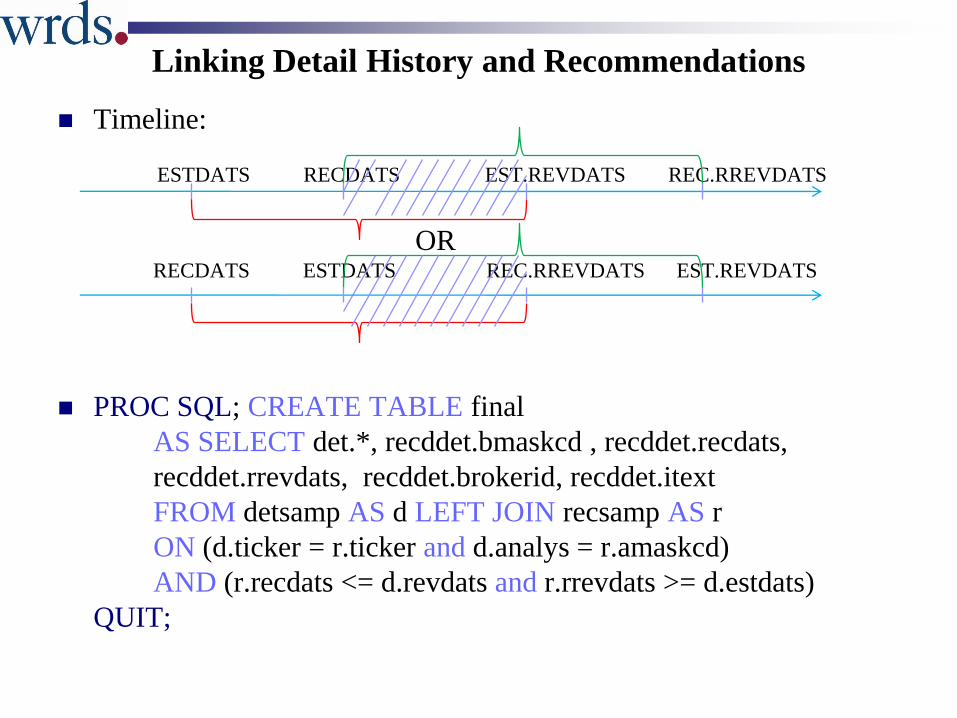
Linking Detail History and Recommendations
Timeline:
ESTDATS RECDATS EST.REVDATS REC.RREVDATS
ORRECDATS ESTDATS REC.RREVDATS EST.REVDATS
PROC SQL; CREATE TABLE final
AS SELECT det.*, recddet.bmaskcd , recddet.recdats,
recddet.rrevdats, recddet.brokerid, recddet.itext
FROM detsamp AS d LEFT JOIN recsamp AS r
ON (d.ticker = r.ticker and d.analys = r.amaskcd)
AND (r.recdats <= d.revdats and r.rrevdats >= d.estdats)
QUIT;
Tips on International Aspects of IBES I
CUSIP in IBES could represent either a CUSIP or SEDOL depending
on whether the company is foreign or not
Country variable is not directly available, but can be identified by the first two
digits of CUSIP variable
USFIRM dummy variable refers to the firm being followed, not the
broker or analyst
According to IBES, “international companies (i.e. non-US companies)
are covered by international (non-US) analysts and US companies are
covered by US analysts
If the broker of the analyst which covers an international firm is a US
company, the analyst is located in a foreign office of that broker
Tips on International Aspects of IBES II
Canadian firms are considered both US firm and an “International firm”
in IBES Detail History. This results in duplicate records for each
Canadian company
IBES uses the convention of putting an “@” symbol in front of tickers of
international companies, with the exception of Canadian firms
Hence, if USFIRM=0 and ticker does not have “@” in it, this is a Canadian
company
Currency issues
CURRFL in the Detail History indicates the currency in which the estimate was issued
for US/Canadian companies. It is missing if the estimate is in the US dollars and takes
“C” if the estimate is in Canadian dollars. For international companies, it indicates
whether the estimate was issued on a parent (“P”) or consolidated level (“C”)
CURR in the Detail History is missing for US/Canadian firms and indicates the
currency in which the estimate was issued for international companies
CCOPCF in the Company Identification file has the same meaning as CURRFL, only
at the company, not estimate, level
CURCODE in the Summary History is the same as CURR, but at the company level
Difference in IBES and Compustat actual EPS numbers
Livnat and Mendenhall (Journal of Accounting Research, Mar 2006)
provide a nice summary for why differences may arise:
Compustat follows a policy of changing firms’ recorded quarterly earnings figures
to reflect restated values. IBES includes the originally reported earnings
Compustat’s earnings reflect GAAP, while most analyst-tracking services report
“street” measures of earnings. That is, IBES earnings exclude various expenses
required by GAAP. Some expenses omitted from street earnings can be found in
Compustat’s variable “Special Items” and can be backed out.
IBES observes the market reaction to the earnings announcement prior to choosing
exactly which earnings components to include in street earnings. This leads to a
potential ex post selection bias.
IBES uses weighted average of the shares outstanding in EPS calculations, but does
not report this average
Also a great overview of the issue is in “GAAP vs. The Street: an
Empirical Assessment of Two Alternative Definitions of Earnings” by
Bradshaw and Sloan (Journal of Accounting Research, 2002)
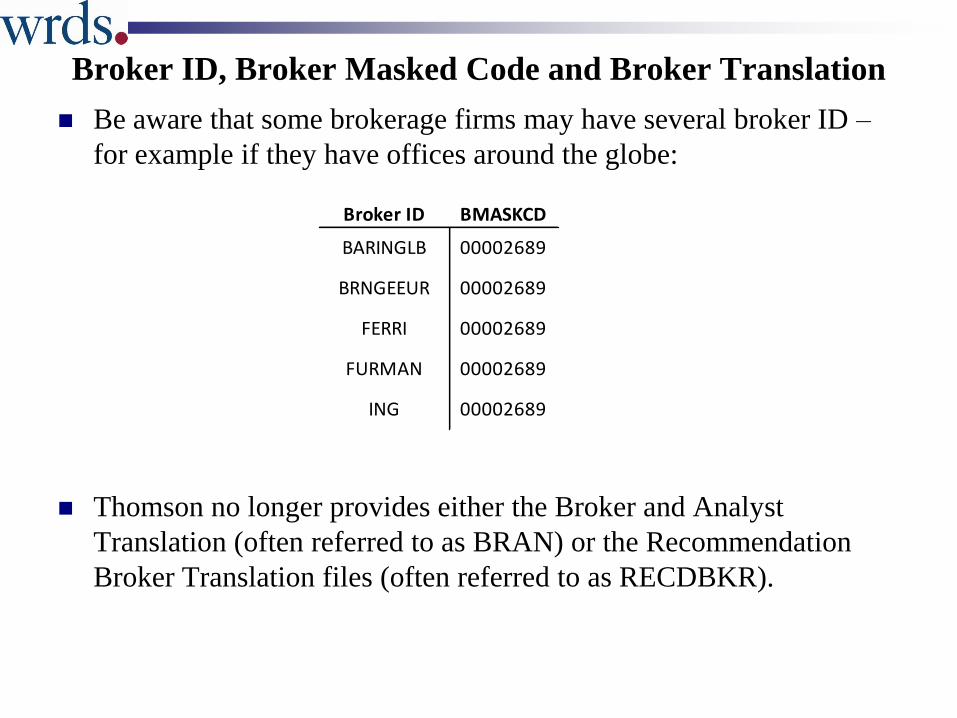
Broker ID, Broker Masked Code and Broker Translation
Be aware that some brokerage firms may have several broker ID –
for example if they have offices around the globe:
Thomson no longer provides either the Broker and Analyst
Translation (often referred to as BRAN) or the Recommendation
Broker Translation files (often referred to as RECDBKR).
Broker ID BMASKCD
BARINGLB 00002689
BRNGEEUR 00002689
FERRI 00002689
FURMAN 00002689
ING 00002689
Other issues in IBES
There are estimates which are dated “after” the announcement date. We
have no explanation other than the entry is in error. % of such
observations in the latest vintage (Aug 2007) is very small (0.04%)
IBES defines REVDATS as ”most recent date that an estimate was
confirmed as accurate”. Note that
Announcement of earnings will increment the FPI variable by 1 in all IBES
records for which review date (REVDATS)> report date (REPDATS)
If at the time of the next review date the same analyst at the same brokerage
changes her forecast for the same (TICKER, ESTDATS, FPEDATS, FPI,
MEASURE, USFIRM) combination, IBES will add a new observation. If the
forecast remains unchanged, IBES will not add new observations, but will
adjust the review date (REVDATS) accordingly
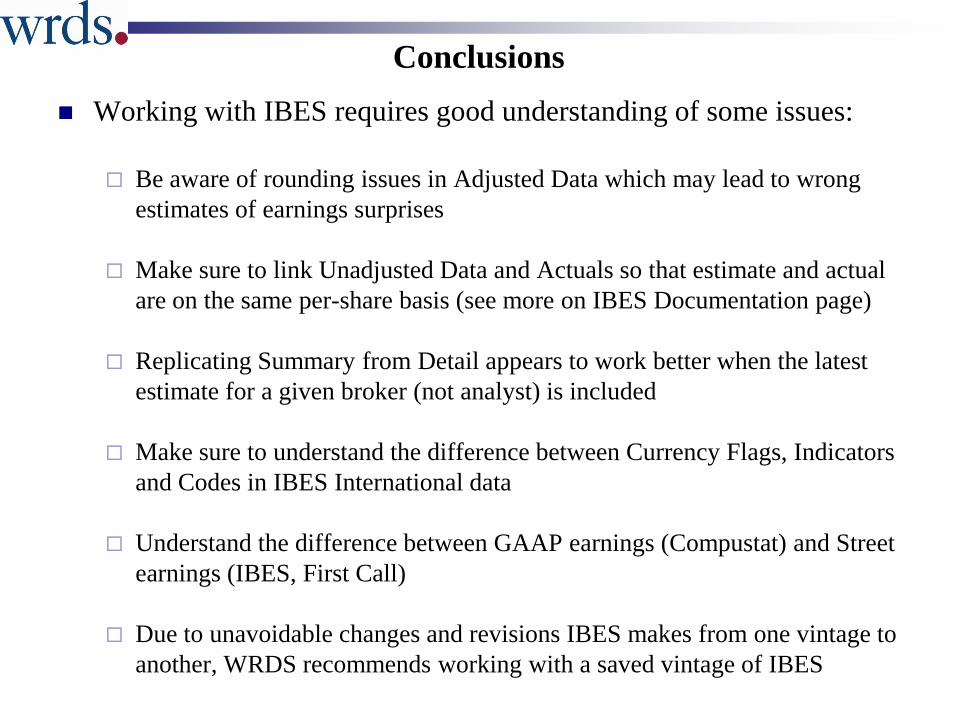
Conclusions
Working with IBES requires good understanding of some issues:
Be aware of rounding issues in Adjusted Data which may lead to wrong
estimates of earnings surprises
Make sure to link Unadjusted Data and Actuals so that estimate and actual
are on the same per-share basis (see more on IBES Documentation page)
Replicating Summary from Detail appears to work better when the latest
estimate for a given broker (not analyst) is included
Make sure to understand the difference between Currency Flags, Indicators
and Codes in IBES International data
Understand the difference between GAAP earnings (Compustat) and Street
earnings (IBES, First Call)
Due to unavoidable changes and revisions IBES makes from one vintage to
another, WRDS recommends working with a saved vintage of IBES
References
1. Bradshaw, M. and Sloan, R. (2002). ”GAAP vs. The Street: an Empirical Assessment
of Two Alternative Definitions of Earnings”. Journal of Accounting Research, Vol. 40
No. 1, pp. 41-66
2. Glushkov, D. and Robinson D. (2006). “A Note on IBES Unadjusted Data”, WRDS
Documentation on IBES, available at
http://wrds.wharton.upenn.edu/ds/ibes/lib/IBES_Unadjusted_Data.pdf
3. Ljungqvist A., Malloy, C. and Marston F. (2007). “Rewriting History”, working paper,
available at http://papers.ssrn.com/sol3/papers.cfm?abstract_id=922053
4. Livnat, J. and Mendenhall, R. (2006). “Comparing the Post-Earnings Announcement
Drift for Surprises Calculated from Analyst and Time Series Forecasts”. Journal of
Accounting Research, Vol. 44 No. 1.
5. Payne, J. and Thomas B. (2003). “The Implications of Using Stock-Split Adjusted
I/B/E/S Data in Empirical Research”. Accounting Review, 78(4), 1049-1067
6. Shvorob, D. and Vora, P. (2006). “Recreating IBES Summary based on Detail History
File”, WRDS Documentation on IBES, available at
http://wrds.wharton.upenn.edu/ds/ibes/lib/IBES_Summary_from_Detail.pdf