Using Geographic Information Systems (GIS) to Understand a Community's Primary Care Needs
9
ORIGINAL RESEARCH Using Geographic Information Systems (GIS) to Understand a Community’s Primary Care Needs Michael F. Dulin, MD, PhD, Thomas M. Ludden, MA, Hazel Tapp, PhD, Joshua Blackwell, MS, Brisa Urquieta de Hernandez, BUS, Heather A. Smith, PhD, and Owen J. Furuseth, PhD Introduction: A key element for reducing health care costs and improving community health is in- creased access to primary care and preventative health services. Geographic information systems (GIS) have the potential to assess patterns of health care utilization and community-level attributes to identify geographic regions most in need of primary care access. Methods: GIS, analytical hierarchy process, and multiattribute assessment and evaluation techniques were used to examine attributes describing primary care need and identify areas that would benefit from increased access to primary care services. Attributes were identified by a collaborative partnership working within a practice-based research network using tenets of community-based participatory re- search. Maps were created based on socioeconomic status, population density, insurance status, and emergency department and primary care safety-net utilization. Results: Individual and composite maps identified areas in our community with the greatest need for increased access to primary care services. Conclusions: Applying GIS to commonly available community- and patient-level data can rapidly identify areas most in need of increased access to primary care services. We have termed this a Multiple Attribute Primary Care Targeting Strategy. This model can be used to plan health services delivery as well as to target and evaluate interventions designed to improve health care access. ( J Am Board Fam Med 2010;23:13–21.) The US health care system is searching for ways to increase health care coverage and reduce costs. One clear strategy is to increase the access to and utilization of primary care and preventative ser- vices. 1,2 Policy changes that increase access to these services must weigh both the community’s primary care needs and the provider work- force. 2–5 Having the ability to create models at a community level that illustrate and predict a community’s current and future primary care needs can be an invaluable tool for planning and implementing changes to increase access to care. This type of descriptive model would assist with the (1) identification of current and future phy- sician workforce needs; (2) development of inter- ventions that improve access to and utilization of primary care services; (3) provision of data for policy leaders as they make decisions about fund- ing for health-related initiates; and (4) evaluation of the effectiveness of interventions and/or policy changes designed to improve a community’s pat- terns of health care access. The process of developing this type of model is complex and requires the ability to access and an- alyze data from multiple sources. Only a handful of studies have applied geographic information sys- tems (GIS) analysis of community and/or patient data to address this. 1,6 –11 Prior studies have exam- ined issues by applying the geographic retrofitting technique to characterize and define a clinic’s ser- vice area 7 ; modeling clinic deprivation scores to This article was externally peer reviewed. Submitted 1 June 2009; revised 2 October 2009; accepted 9 October 2009. From the Department of Family Medicine, Carolinas Medical Center (MFD, HT, BUdH), and the Department of Geography and Earth Sciences, University of North Caro- lina (TML, JB, HAS, OJF), Charlotte, NC. Funding: This study was funded by the Charlotte-Meck- lenburg Health Services Foundation and the Agency for Healthcare Research and Quality (AHRQ), grant R03 HS016023-01. Conflict of interest: none declared. Corresponding author: Hazel Tapp, PhD, Department of Family Medicine, Carolinas Healthcare System, 2001 Vail Avenue, 4th Floor, Suite 400, Charlotte, NC 28207 (E-mail: [email protected]). doi: 10.3122/jabfm.2010.01.090135 Using GIS to Understand Primary Care Needs 13
-
Upload
carolinashealthcare -
Category
Documents
-
view
5 -
download
0
Transcript of Using Geographic Information Systems (GIS) to Understand a Community's Primary Care Needs
ORIGINAL RESEARCH
Using Geographic Information Systems (GIS) toUnderstand a Community’s Primary Care NeedsMichael F. Dulin, MD, PhD, Thomas M. Ludden, MA, Hazel Tapp, PhD,Joshua Blackwell, MS, Brisa Urquieta de Hernandez, BUS, Heather A. Smith, PhD,and Owen J. Furuseth, PhD
Introduction: A key element for reducing health care costs and improving community health is in-creased access to primary care and preventative health services. Geographic information systems (GIS)have the potential to assess patterns of health care utilization and community-level attributes to identifygeographic regions most in need of primary care access.
Methods: GIS, analytical hierarchy process, and multiattribute assessment and evaluation techniqueswere used to examine attributes describing primary care need and identify areas that would benefitfrom increased access to primary care services. Attributes were identified by a collaborative partnershipworking within a practice-based research network using tenets of community-based participatory re-search. Maps were created based on socioeconomic status, population density, insurance status, andemergency department and primary care safety-net utilization.
Results: Individual and composite maps identified areas in our community with the greatest need forincreased access to primary care services.
Conclusions: Applying GIS to commonly available community- and patient-level data can rapidlyidentify areas most in need of increased access to primary care services. We have termed this a MultipleAttribute Primary Care Targeting Strategy. This model can be used to plan health services delivery aswell as to target and evaluate interventions designed to improve health care access. (J Am Board FamMed 2010;23:13–21.)
The US health care system is searching for waysto increase health care coverage and reduce costs.One clear strategy is to increase the access to andutilization of primary care and preventative ser-vices.1,2 Policy changes that increase access tothese services must weigh both the community’sprimary care needs and the provider work-force.2–5 Having the ability to create models at acommunity level that illustrate and predict a
community’s current and future primary careneeds can be an invaluable tool for planning andimplementing changes to increase access to care.This type of descriptive model would assist withthe (1) identification of current and future phy-sician workforce needs; (2) development of inter-ventions that improve access to and utilization ofprimary care services; (3) provision of data forpolicy leaders as they make decisions about fund-ing for health-related initiates; and (4) evaluationof the effectiveness of interventions and/or policychanges designed to improve a community’s pat-terns of health care access.
The process of developing this type of model iscomplex and requires the ability to access and an-alyze data from multiple sources. Only a handful ofstudies have applied geographic information sys-tems (GIS) analysis of community and/or patientdata to address this.1,6–11 Prior studies have exam-ined issues by applying the geographic retrofittingtechnique to characterize and define a clinic’s ser-vice area7; modeling clinic deprivation scores to
This article was externally peer reviewed.Submitted 1 June 2009; revised 2 October 2009; accepted
9 October 2009.From the Department of Family Medicine, Carolinas
Medical Center (MFD, HT, BUdH), and the Department ofGeography and Earth Sciences, University of North Caro-lina (TML, JB, HAS, OJF), Charlotte, NC.
Funding: This study was funded by the Charlotte-Meck-lenburg Health Services Foundation and the Agency forHealthcare Research and Quality (AHRQ), grant R03HS016023-01.
Conflict of interest: none declared.Corresponding author: Hazel Tapp, PhD, Department of
Family Medicine, Carolinas Healthcare System, 2001 VailAvenue, 4th Floor, Suite 400, Charlotte, NC 28207 (E-mail:[email protected]).
doi: 10.3122/jabfm.2010.01.090135 Using GIS to Understand Primary Care Needs 13
measure socioeconomic indicators of a clinic ser-vice area12; and facilitating access to communityhealth information using health data maps.13
We propose a method that uses both descriptivecommunity-level data and information from thecommunity’s primary care safety net and emer-gency departments (EDs) to clearly identify geo-graphic areas that would benefit the most fromimproved access to primary care. This technique,which we have coined “Multiattribute PrimaryCare Targeting Strategy” (MAPCATS), was devel-oped within a regional practice-based research net-work (PBRN) and uses mapping technology andweighted evaluation techniques. Here we describethe theoretical aspects used in our approach andshow how we applied our technique to the popu-lation of Charlotte, NC. To determine the factorsinvolved in blending population and health careindicators into informative maps we took a theo-retical approach involving the analytic hierarchyprocess (AHP) and multiple attribute assessmentand evaluation (MAAE). This combination of map-ping and evaluation provides a unique approach toidentifying geographic locations lacking access tohealth care, particularly for the uninsured andother disadvantaged populations. As such, this ar-ticle answers the research question: Where in ourcommunity would there be the most benefit fromincreased access to primary care services?
MethodsThe Practice-Based Research NetworkTo develop our model we used the resources of theMecklenburg Area Partnership for Primary CareResearch. This regional PBRN is based at Caroli-nas Health care System (CHS), the third largestvertically integrated hospital system in the UnitedStates. The CHS system provides the majority ofcare for our underserved community. Based onpatient volume and community-wide data we esti-mate that this system provides more than 85% ofemergency care and 80% of primary care servicesto the community’s uninsured patient population.The primary care safetynet for this project wasdefined using 4 of the system’s primary care clinicsthat provide the majority of services for the com-munity’s uninsured patients.
The methods described were developed byMecklenburg Area Partnership for Primary CareResearch as a way of carefully targeting interven-
tions designed to improve access to primary care,with the goal of ameliorating disparities and im-proving the health of the community. The researchnetwork brought together ambulatory providers,community members, and research team membersas a community advisory board (CAB) using prin-ciples of community-based participatory research.7
The network’s CAB consisted of the followingmembers: The Carolinas Medical Center (CMC)Ambulatory Clinic System (CMC Eastland FamilyPractice Clinic, CMC NorthPark Clinic, and CMCBiddle Point Clinic); Our Lady of GuadalupeChurch; The Bethesda Clinic (a local free clinic);The Mecklenburg County Health Department;Department of Family Medicine; University ofNorth Carolina at Charlotte Geography and EarthSciences Department; and the Latin American Co-alition. Advisory board involvement spanned fromdevelopment of the research question to selectionof attributes to oversight of research processes andreview of results. Thus, the process involved bothpartnering with and tailoring to the needs of thecommunity.
Analytic Hierarchy ProcessThe AHP is a structured technique for makingcomplex decisions.14,15 Rather than giving a “cor-rect” decision, the AHP helps decision makers findthe solution that best suits their perception of theresearch problem. The research question is trans-lated into a hierarchy of more easily comprehendedsubproblems, each of which can be analyzed inde-pendently. Once the hierarchy is built, the decisionteam systematically evaluates its various elementsby comparing them to one another. When makingcomparisons the decision makers can use data orpersonal judgments about each elements’ relativeimportance. These evaluations are converted to nu-merical values that can then be compared.
The decision makers can assign weights to eachfactor so they can be combined quantitatively on amap. For example, if we have 5 factors of equalweighting, each factor would be multiplied by 0.2.Then the factors would be added together to give afinal score for each census tract. If the weightingswere different for each factor, this would enable theCAB to emphasize key factors with greater weight-ings in the overall map.
For this project, the available community- andpatient-level data were reviewed to identify whatinformation was most pertinent to answer a critical
14 JABFM January–February 2010 Vol. 23 No. 1 http://www.jabfm.org
question in the process: What are the best indica-tors of primary care need for our community? Theresearch team and advisory board used an iterativeprocess of reviewing the available data, selectingattributes that were deemed important, and review-ing maps of each data element before selecting 5key attributes. Identifying these attributes was a keyfirst step in answering the research question ofwhat geographic areas within a defined communitywould receive the greatest benefit by increasingaccess to primary care services.
Each variable was reviewed by the team for itsability to describe the community’s primary careneeds and contribute to the answering of the re-search question. This iterative process led to mul-tiple assessments and weightings of different vari-ables, including (1) the selection of populationdensity; (2) the identification of uninsured/Medic-aid insurance types as risk factors for primary careneed; and (3) the choice of percentage of popula-tion using a primary care safety-net clinic as aprotective variable instead of using the primarycare service area alone.
The 5 selected attributes were standardized tovalues between 0 to 1, and multiple sets of com-posite maps were created based on several differentweighting criteria. After evaluating the differentweighting schemes, the team chose equal weightingfor all variables, with utilization of the primary caresafety-net being given an inverse but equal weightas a protective factor.
Multiple Attribute Assessment and EvaluationMAAE methods analyze multiple attributes andcombine data elements to positively influence de-cision quality.16 For this project we used MAAEmethods to weigh multiple attributes selectedthrough the AHP process (described above) to gaina better understanding of community-wide primarycare needs. The members of the research team andCAB ranked each of the selected attributes accord-ing to its perceived importance. The attributeswere rated on a scale (0 to 1), with 1 being thehighest level of importance. The attributes werethen combined and maps showing the data werecreated and reviewed. After reviewing multiple setsof weights for each attribute, the group selected asystem of equal weighting. Discussion among theresearch team and CAB concluded that no singlefactor deserved differential weighting. As such, all
indicators were considered equally reflective of pri-mary care need in the community.
Geographic Information Systems (GIS)After institutional review board approval for the studywas obtained, data for all ED and primary care clinicvisits in 2007 was extracted from the shared CHSdatabases. The initial dataset contained just morethan 367,000 records. Data for patients living outsideof the county or lacking an address were excluded,which resulted in approximately 187,000 ED visitsand 50,000 primary care patients being included inthe analysis. Census-based demographic data forMecklenburg County projected for 2007 was ob-tained from Claritas (San Diego, CA). All patient
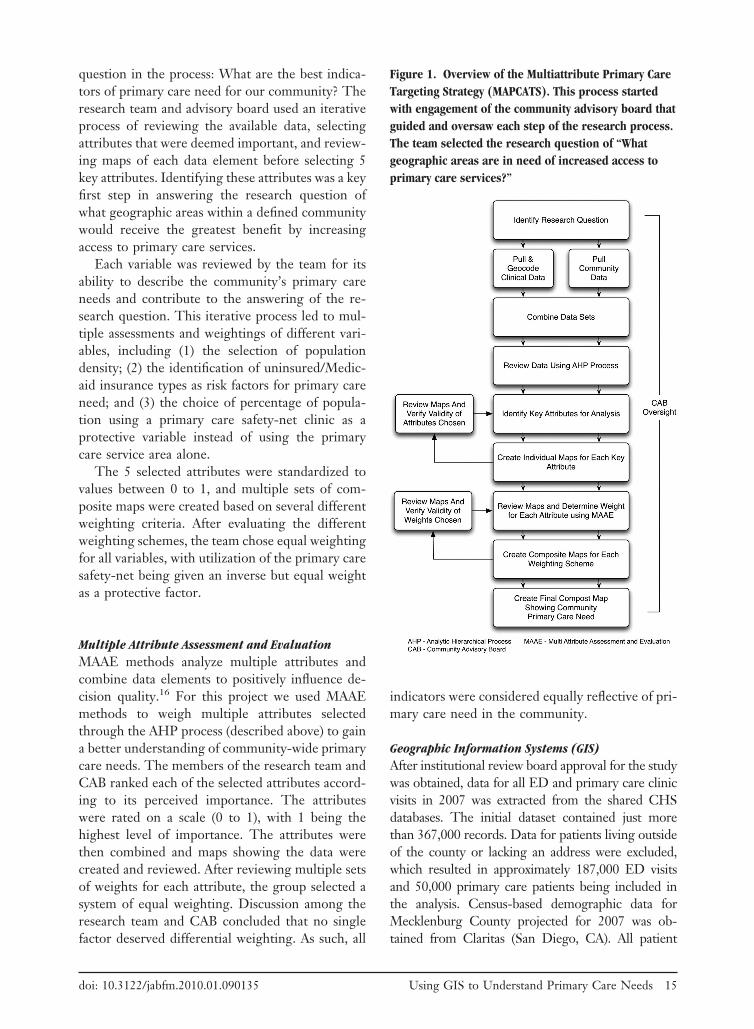
Figure 1. Overview of the Multiattribute Primary CareTargeting Strategy (MAPCATS). This process startedwith engagement of the community advisory board thatguided and oversaw each step of the research process.The team selected the research question of “Whatgeographic areas are in need of increased access toprimary care services?”
doi: 10.3122/jabfm.2010.01.090135 Using GIS to Understand Primary Care Needs 15
address data were geocoded using ArcGIS (ESRIProducts, Redlands, CA) greater than a 97% matchrate for both clinic and ED data.
To ensure patient privacy, the original addressesand any other information that could identify thepatients (other than the geocode) were strippedfrom the data set before further analysis. In addi-tion, all data were reviewed to identify any censustracts containing fewer than 50 individuals fromany one racial or ethnic category. When identified,these data points were either removed or averagedinto an adjacent census tract. All maps created fromthe dataset were at the level of the census tract orhigher, and no dot maps were created for thisproject.
New York University Emergency DepartmentAlgorithmThe New York University (NYU) Algorithm wasdeveloped by the NYU Center for Health andPublic Research to classify ED visits and identifyinappropriate utilization of the ED based on thepatients’ diagnosis.17 The categories include (1)nonemergent; (2) emergent but treatable throughprimary care; (3) emergent with ED care neededbut preventable or avoidable with access to primarycare; (4) emergent with ED care needed and nototherwise preventable; and (5) other categories, in-cluding injury, mental health, drug/alcohol related,and unclassifiable. We applied the NYU ED algo-rithm (version 2.1 for Microsoft Access) applied itto our geocoded ED data. To facilitate this process,
our ED data were reduced to only 2 fields (thegeocode and International Classification of Dis-eases version 9 code) before application of the al-gorithm. The resultant data set provided a geocodelinked with a probability (from 0 to 1) for each ofthe categories described above. For this study wecombined the probabilities for categories 1 to 3because ED visits in each of these groups wereconsidered treatable through primary care or pre-ventable with appropriate access to primary care.These combined categories for issues treatablethrough primary care or preventable ED visits arealso called “ambulatory care sensitive” (ACS).
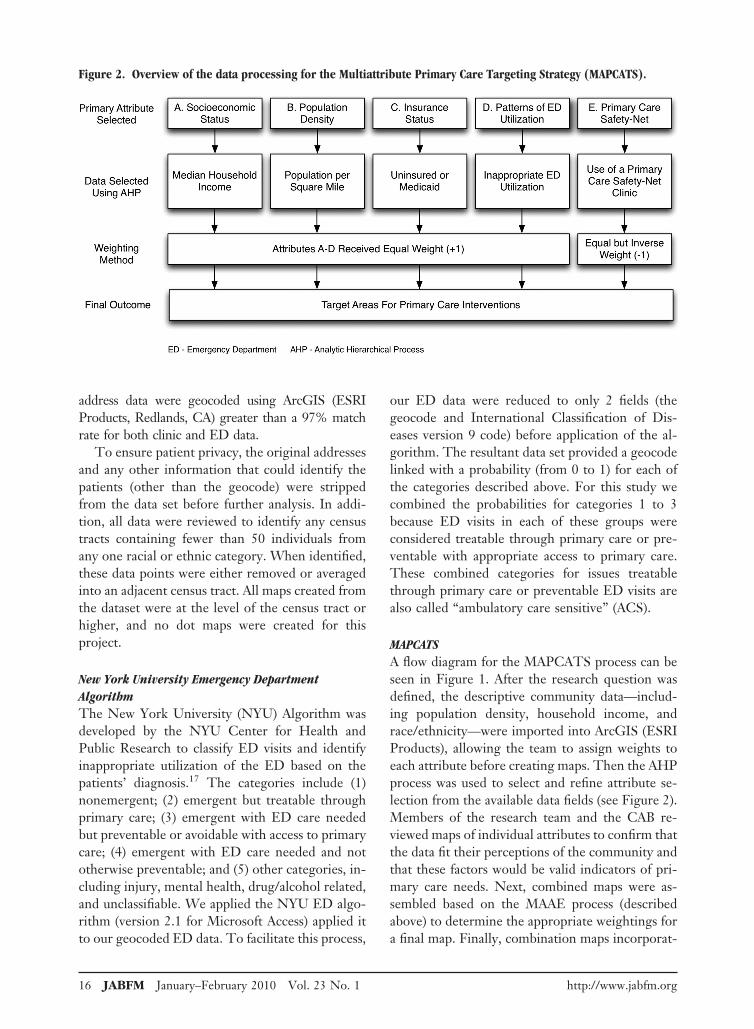
MAPCATSA flow diagram for the MAPCATS process can beseen in Figure 1. After the research question wasdefined, the descriptive community data—includ-ing population density, household income, andrace/ethnicity—were imported into ArcGIS (ESRIProducts), allowing the team to assign weights toeach attribute before creating maps. Then the AHPprocess was used to select and refine attribute se-lection from the available data fields (see Figure 2).Members of the research team and the CAB re-viewed maps of individual attributes to confirm thatthe data fit their perceptions of the community andthat these factors would be valid indicators of pri-mary care needs. Next, combined maps were as-sembled based on the MAAE process (describedabove) to determine the appropriate weightings fora final map. Finally, combination maps incorporat-
Figure 2. Overview of the data processing for the Multiattribute Primary Care Targeting Strategy (MAPCATS).
16 JABFM January–February 2010 Vol. 23 No. 1 http://www.jabfm.org
ing the weightings determined by the group pro-cess were assembled to show the primary care needsof the community.
To validate the results of the model, the indi-vidual variables selected were combined using fac-tor analysis.11 The final component scores (the re-sult of one or more components combined) wereused to create an overall combination map to com-pare with the final target map.
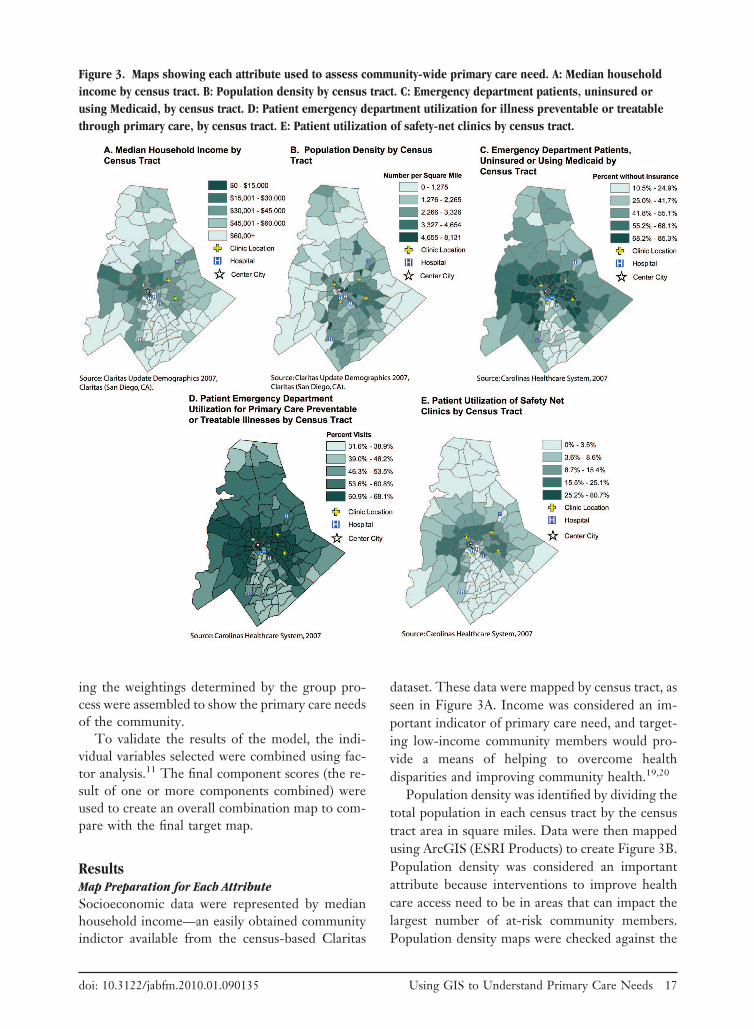
ResultsMap Preparation for Each AttributeSocioeconomic data were represented by medianhousehold income—an easily obtained communityindictor available from the census-based Claritas
dataset. These data were mapped by census tract, asseen in Figure 3A. Income was considered an im-portant indicator of primary care need, and target-ing low-income community members would pro-vide a means of helping to overcome healthdisparities and improving community health.19,20
Population density was identified by dividing thetotal population in each census tract by the censustract area in square miles. Data were then mappedusing ArcGIS (ESRI Products) to create Figure 3B.Population density was considered an importantattribute because interventions to improve healthcare access need to be in areas that can impact thelargest number of at-risk community members.Population density maps were checked against the
Figure 3. Maps showing each attribute used to assess community-wide primary care need. A: Median householdincome by census tract. B: Population density by census tract. C: Emergency department patients, uninsured orusing Medicaid, by census tract. D: Patient emergency department utilization for illness preventable or treatablethrough primary care, by census tract. E: Patient utilization of safety-net clinics by census tract.
doi: 10.3122/jabfm.2010.01.090135 Using GIS to Understand Primary Care Needs 17
hospital’s patient data, and rates of patient EDutilization were found to be directly proportionalto the overall population density.
Insurance status was drawn from the CHS clin-ical databases. This data field was sorted based oninput from the research team members and primarycare providers into 5 categories: uninsured, com-mercial, Medicaid, Medicare, and other. A separateanalysis, comparing each insurance type and EDutilization for ambulatory care-sensitive diagnoses,revealed that lack of insurance and Medicaid insur-ance coverage were significantly linked to inappro-priate ED utilization (unpublished data). From thisanalysis, the number of patients within either ofthese 2 insurance categories were combined anddivided by the total number of patients for eachcensus tract. This data were mapped using ArcGIS(ESRI Products) to produce Figure 3C.
ED utilization patterns were determined usingthe NYU ED algorithm to identify ACS ED visits.Our assumption was that these ACS visits couldhave been treated in a primary care setting oravoided if patients had access to primary care in amore timely fashion. The ACS scores provided aprobability between 0 to 1 for each patient visit.These scores were combined at the census-tractlevel and mapped using ArcGIS (ESRI Products) toprovide Figure 3D. To confirm the validity of thisdata, maps were also created for non-ACS visits.The maps showed patterns that were the directinverse of the ACS ED maps incorporated into thismodel.
The final attribute used in the MAPCATS pro-cess was patient utilization of the community’s pri-mary care safety net. Data from the 4 primary careclinics that provide the majority of care for ourcommunity’s uninsured patients were analyzed.The percentage of the population using the safety-net clinics was determined by dividing the numberof patients in each census tract by the total popu-lation of that tract. This information was thenmapped and can be seen in Figure 3E. This at-tribute was added to the model as a protectivefactor for primary care need, so the areas with ahigher percentage of the population accessing ser-vices were considered to be less likely to needadditional primary care access.
Creation of Composite MapThe numeric values for all the variables in eachcensus tract were added together as a measure for
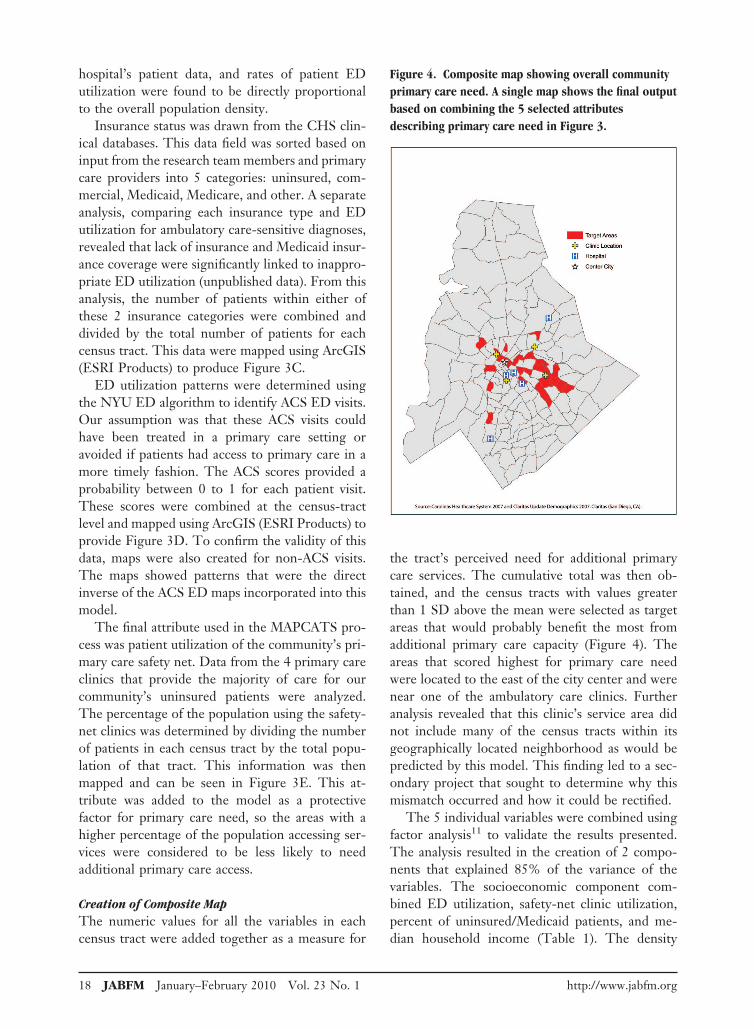
the tract’s perceived need for additional primarycare services. The cumulative total was then ob-tained, and the census tracts with values greaterthan 1 SD above the mean were selected as targetareas that would probably benefit the most fromadditional primary care capacity (Figure 4). Theareas that scored highest for primary care needwere located to the east of the city center and werenear one of the ambulatory care clinics. Furtheranalysis revealed that this clinic’s service area didnot include many of the census tracts within itsgeographically located neighborhood as would bepredicted by this model. This finding led to a sec-ondary project that sought to determine why thismismatch occurred and how it could be rectified.
The 5 individual variables were combined usingfactor analysis11 to validate the results presented.The analysis resulted in the creation of 2 compo-nents that explained 85% of the variance of thevariables. The socioeconomic component com-bined ED utilization, safety-net clinic utilization,percent of uninsured/Medicaid patients, and me-dian household income (Table 1). The density
Figure 4. Composite map showing overall communityprimary care need. A single map shows the final outputbased on combining the 5 selected attributesdescribing primary care need in Figure 3.
18 JABFM January–February 2010 Vol. 23 No. 1 http://www.jabfm.org
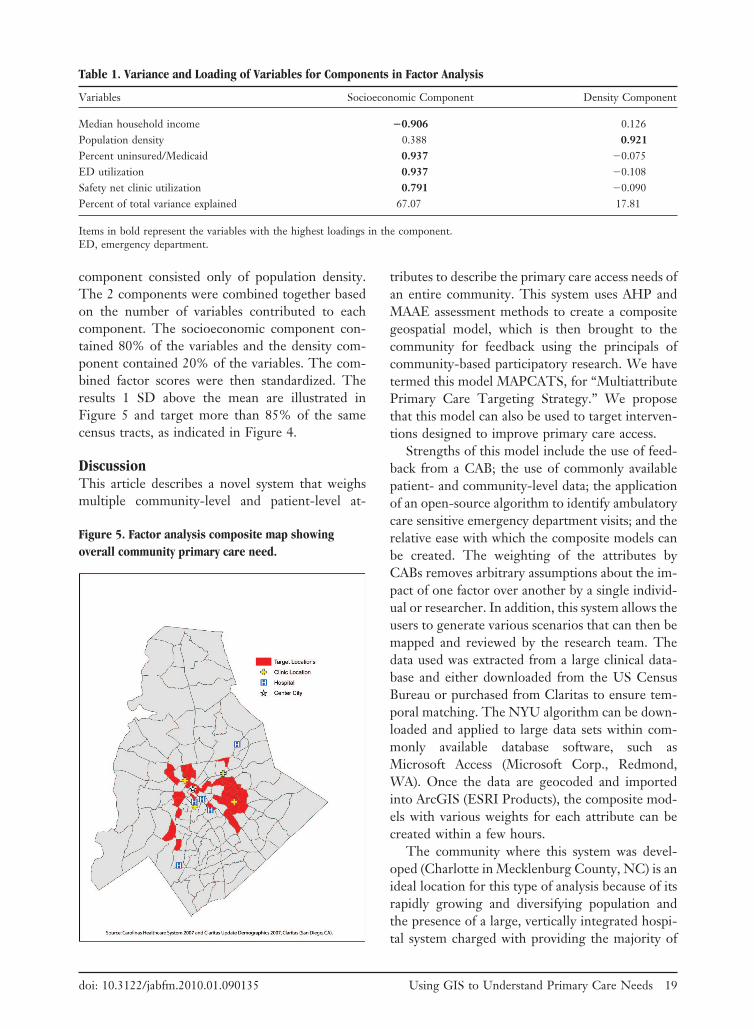
component consisted only of population density.The 2 components were combined together basedon the number of variables contributed to eachcomponent. The socioeconomic component con-tained 80% of the variables and the density com-ponent contained 20% of the variables. The com-bined factor scores were then standardized. Theresults 1 SD above the mean are illustrated inFigure 5 and target more than 85% of the samecensus tracts, as indicated in Figure 4.
DiscussionThis article describes a novel system that weighsmultiple community-level and patient-level at-
tributes to describe the primary care access needs ofan entire community. This system uses AHP andMAAE assessment methods to create a compositegeospatial model, which is then brought to thecommunity for feedback using the principals ofcommunity-based participatory research. We havetermed this model MAPCATS, for “MultiattributePrimary Care Targeting Strategy.” We proposethat this model can also be used to target interven-tions designed to improve primary care access.
Strengths of this model include the use of feed-back from a CAB; the use of commonly availablepatient- and community-level data; the applicationof an open-source algorithm to identify ambulatorycare sensitive emergency department visits; and therelative ease with which the composite models canbe created. The weighting of the attributes byCABs removes arbitrary assumptions about the im-pact of one factor over another by a single individ-ual or researcher. In addition, this system allows theusers to generate various scenarios that can then bemapped and reviewed by the research team. Thedata used was extracted from a large clinical data-base and either downloaded from the US CensusBureau or purchased from Claritas to ensure tem-poral matching. The NYU algorithm can be down-loaded and applied to large data sets within com-monly available database software, such asMicrosoft Access (Microsoft Corp., Redmond,WA). Once the data are geocoded and importedinto ArcGIS (ESRI Products), the composite mod-els with various weights for each attribute can becreated within a few hours.
The community where this system was devel-oped (Charlotte in Mecklenburg County, NC) is anideal location for this type of analysis because of itsrapidly growing and diversifying population andthe presence of a large, vertically integrated hospi-tal system charged with providing the majority of
Table 1. Variance and Loading of Variables for Components in Factor Analysis
Variables Socioeconomic Component Density Component
Median household income �0.906 0.126Population density 0.388 0.921Percent uninsured/Medicaid 0.937 �0.075ED utilization 0.937 �0.108Safety net clinic utilization 0.791 �0.090Percent of total variance explained 67.07 17.81
Items in bold represent the variables with the highest loadings in the component.ED, emergency department.
Figure 5. Factor analysis composite map showingoverall community primary care need.
doi: 10.3122/jabfm.2010.01.090135 Using GIS to Understand Primary Care Needs 19
care to underserved populations.21 We proposethat other communities facing similar populationchanges and/or growing numbers of uninsured pa-tients may consider using this method to identifyat-risk geographic areas within their communitythat would experience the greatest benefit fromadditional resources. Our approach may be partic-ularly useful for specific subpopulations that arecurrently underserved by many community healthcare systems. Indeed, the follow-up article demon-strates the use of the MAPCATS system to developinterventions for Charlotte’s Hispanic immigrantpopulation.22 Using the MAPCATS system to tar-get underserved locations and the vulnerable pop-ulations residing within them will probably have arapid and measurable impact on community healthand subsequently provide a clear return on invest-ment.
One additional potential use of this system couldbe to monitor community-wide changes in patternsof health care access that occur as the result of aspecific intervention. Preliminary data from ourgroup has shown that changes in access patternsaround one of the primary care clinics that mayhave occurred as a result of a community-basedparticipatory research intervention could be de-tected with this system. There is an ongoing studythat will prospectively test this specific hypothesis.
The primary limitation to this model is the lackof validation at the individual level. Combiningpatient-level data with descriptive community-levelinformation helps to overcome this limitation andensures that many community members with lim-ited access to primary care will be identified. How-ever, this data cannot be used to determine thenumber of individuals that live in the same vicinitywho are also at risk. Additional studies, such asselected door-to-door surveying, have previouslybeen used in our community and could be repeatedto validate the MAPCATS process.
The methods used in the model can be adoptedby other communities to reproduce the output cre-ated by MAPCATS. If the data used in the socio-economic component are not readily available (as-suming a community can calculate populationdensity), advisory groups can propose other vari-ables that show similar variability of ED utilization,safety-net clinic utilization, percent uninsured/Medicaid, or median household income at the cen-sus-tract level to identify a set of target areas. How-ever, the level of specificity created by MAPCATS
would require all 4 variables to be used. Our modelis not as broad as the factor analysis validation andtherefore produced a more targeted result.
Gaining understanding of the patterns of healthcare access for a community is a key step in theprocess of improving primary care access and pos-itively impacting community health. The proposedMAPCATS method provides a means for usinginformation about patients’ patterns of health careutilization and community-level data to identifyareas where access to primary care services arelimited and can be improved. This method may beparticularly well suited for use in urban communi-ties facing population changes related to immigra-tion or loss of health insurance. The maps resultingfrom this process could be used to target suchvulnerable populations and monitor the effective-ness of interventions designed to improve their,and overall community, access to care.
The authors would like to acknowledge Travis Haney, AndreaDulin, the providers, and the community members who partic-ipated in the development of the maps.
References1. Phillips R, Miyoshi T, Fryer G. Primary care and
GIS: moving knowledge to action. Abstr AcadHealth Serv Res Health Policy Meet 2002;(19):33.
2. Starfield B, Shi L, Macinko J. Contribution of pri-mary care to health systems and health. Milbank Q2005;83:457–502.
3. Lakhan SE, Laird C. Addressing the primary carephysician shortage in an evolving medical workforce.Int Arch Med 2009;2:14.
4. Brotherton SE, Rockey PH, Etzel SI. US graduatemedical education, 2004–2005: trends in primarycare specialties. JAMA 2005;294:1075–82.
5. Macinko J, Starfield B, Shi L. The contribution ofprimary care systems to health outcomes within Or-ganization for Economic Cooperation and Develop-ment (OECD) countries, 1970–1998. Health ServRes 2003;38:831–65.
6. Phillips RL Jr, Kinman EL, Schnitzer PG, Lind-bloom EJ, Ewigman B. Using geographic informa-tion systems to understand health care access. ArchFam Med 2000;9:971–8.
7. Mullan F, Phillips RL Jr, Kinman EL. Geographicretrofitting: a method of community definition incommunity-oriented primary care practices. FamMed 2004;36:440–6.
8. Smith HA, Furuseth O. Housing. Hispanics andtransitioning geographies in Charlotte, North Caro-lina. Southeast Geogr 2003;44:216–35.
9. Andes N, Davis JE. Linking public health data using
20 JABFM January–February 2010 Vol. 23 No. 1 http://www.jabfm.org
geographic information system techniques: Alaskancommunity characteristics and infant mortality. StatMed 1995;14:481–90.
10. Phillips RL, Bazemore A, Miyoshi TJ, Agency forHealthcare Research and Quality. Mapping tools formonitoring the safety net. Available at http://www.ahrq.gov/data/safetynet/phillips.htm. Accessed 29May 2009.
11. Wang F, Luo W. Assessing spatial and nonspatialfactors for healthcare access: towards an integratedapproach to defining health professional shortageareas. Health Place 2005;11:131–46.
12. Strong M, Maheswaran R, Pearson T, Fryers P. Amethod for modeling GP practice level deprivationscores using GIS. Int J Health Geogr 2007;6:38.
13. Buckeridge DL, Mason R, Robertson A, et al. Mak-ing health data maps: a case study of a community/university research collaboration. Soc Sci Med 2002;55:1189–206.
14. Saaty T. Relative measurement and its generaliza-tion in decision making: why pairwise comparisonsare central in mathematics for the measurement ofintangible factors—the analytic hierarchy/networkprocess. Review of the Royal Spanish Academy ofSciences 2008;102:251–318.
15. Bhushan N, Rai K. Strategic decision making: apply-ing the analytic hierarchy process. London: Springer-Verlag; 2004.
16. Hammond J, Keeney R, Raiifa H. Smart choices: apractical guide to making better decisions. Boston,MA: Harvard Business School Press; 1999.
17. The Center for Health and Public Service Research.NYU ED algorithm. Available at http://wagner.nyu.edu/chpsr/index.html?p�25. Accessed 27 July 2007.
18. Andrulis DP, Brach C. Integrating literacy, culture,and language to improve health care quality for di-verse populations. Am J Health Behav 2007;31(Suppl1):S122–33.
19. Newacheck PW, Hughes DC, Stoddard JJ. Chil-dren’s access to primary care: differences by race,income, and insurance status. Pediatrics 1996;97:26–32.
20. Smith H, Furuseth O. Latinos in the new South:transformations of place. Burlington, VT: Ashgate;2006.
21. Dulin MF, Ludden TM, Tapp H, et al. Geographicinformation systems (GIS) demonstrating primarycare needs for a transitioning Hispanic community.J Am Board Fam Med 2010;23:109–20.
doi: 10.3122/jabfm.2010.01.090135 Using GIS to Understand Primary Care Needs 21