2022 Curriculum Catalog for Medical Office - Evolve Elsevier
Upload
khangminh22Category
view
1download
0
2017 Integrated Annual Report
Co
ca‑Co
la Hellenic B
ottling C
om
pany 2017 Integrated Annual R
eport
UNDERSTANDEVOLVEENERGISE

Key highlights for the yearWe announced our financial results for the year ended 31 December 2017 on 14 February 2018. In addition to the reported and comparable metrics we highlight below from these financial results, we report on our progress towards our 2020 target KPIs on pages 24-25.
1. For details on APMs refer to the Alternative performance measures section.
About our reportThe 2017 Integrated Annual Report (‘Annual Report’) consolidates Coca-Cola HBC AG’s UK and Swiss disclosure requirements while meeting the disclosure requirements for its secondary listing on the Athens Exchange and the sustainability reporting standards. For more information about our Integrated Annual Report, see page 234.
Strategic Report1 Understand, evolve, energise8 Our business10 Joint Q&A with the Chairman
and Chief Executive Officer16 Market review18 Our business model21 Our strategy and KPIs28 People34 Communities38 Consumers44 Customers48 Efficiencies55 Risk and materiality64 Financial review68 Market highlights70 Viability Statement
Corporate Governance72 Board of Directors76 Corporate Governance Report104 Directors’ Remuneration Report126 Statement of Directors’
Responsibilities
Financial Statements128 Independent Auditor’s Report133 Financial Statements139 Notes to the Financial Statements
Swiss Statutory Reporting198 Report of the statutory auditor on
Coca‑Cola HBC AG’s consolidated financial statements
204 Report of the statutory auditor on Coca-Cola HBC AG’s financial statements
207 Coca‑Cola HBC AG’s financial statements
218 Report of the statutory auditor on the Statutory Remuneration Report
219 Statutory Remuneration Report
Supplementary Information223 Alternative performance measures227 Assurance statement230 Shareholder information
Glossary
Contents
VOLUME(m unit cases)
2,1042016: 2,058
COMPARABLE EBIT1
(€m)
6212016: 518
NET SALES REVENUE(€m)
6,5222016: 6,219
COMPARABLE EBIT MARGIN1 (%)
9.52016: 8.3
COMPARABLE NET PROFIT1 (€m)
4502016: 352
NET PROFIT(€m)
4262016: 344

2017 has been a busy and exciting year for
Coca‑Cola HBC.
Changing market environments and evolving
consumer preferences compel us to better
UNDERSTAND our consumers' needs and
to EVOLVE and reformulate our portfolio.
We are ENERGISED by our position now, and our
excellent progress against our strategy leaves us in a confident position for the
year ahead.

Coca‑Cola Zero Lemon launch in Italy and the Czech Republic helped grow
Coke Zero volumes in these countries by more than
20% in 2017.
UN
DER
ST
AN
D
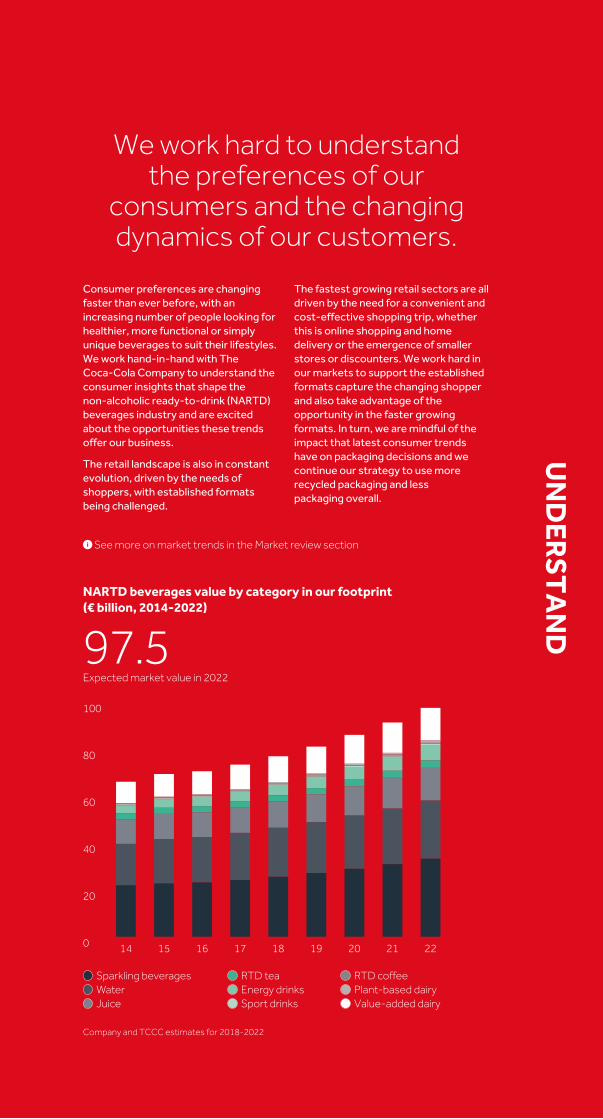
We work hard to understand the preferences of our
consumers and the changing dynamics of our customers.
Consumer preferences are changing faster than ever before, with an increasing number of people looking for healthier, more functional or simply unique beverages to suit their lifestyles. We work hand-in-hand with The Coca-Cola Company to understand the consumer insights that shape the non-alcoholic ready-to-drink (NARTD) beverages industry and are excited about the opportunities these trends offer our business.
The retail landscape is also in constant evolution, driven by the needs of shoppers, with established formats being challenged.
The fastest growing retail sectors are all driven by the need for a convenient and cost-effective shopping trip, whether this is online shopping and home delivery or the emergence of smaller stores or discounters. We work hard in our markets to support the established formats capture the changing shopper and also take advantage of the opportunity in the faster growing formats. In turn, we are mindful of the impact that latest consumer trends have on packaging decisions and we continue our strategy to use more recycled packaging and less packaging overall.
See more on market trends in the Market review section
14 15 16 17 18 19 20 21 220
20
40
60
80
100
Sparkling beveragesWaterJuice
RTD teaEnergy drinksSport drinks
RTD coffeePlant-based dairyValue-added dairy
NARTD beverages value by category in our footprint (€ billion, 2014-2022)
97.5Expected market value in 2022
Company and TCCC estimates for 2018‑2022

A very successful innovation launched in Russia in 2017, Sprite Cucumber
will be rolled out in several other countries.

EVO
LVE
To meet changing consumer preferences, we evolve our portfolio,
creating new beverages and reformulating our products.
Jointly with our partners The Coca-Cola Company, we develop new beverages, flavours and packages to meet the changing needs of our consumers. We also evolve our recipes, providing more options to consumers with fewer calories, while keeping the great taste that consumers love. Key developments in 2017 have been Coca-Cola Zero Lemon, Coca-Cola with stevia and no calories, Sprite Cucumber, Schweppes Pomegranate, Monster Hydro and Vegified juice.
Our route-to-market (RTM) initiatives deliver tailored solutions to the continuously changing retail landscape, ensuring that we capture the growth opportunities in every market and every channel. The consistent growth of smaller households is boosting the search for convenience, while discounters are the most dynamic segment. We are gaining incremental revenue by accelerating our ‘small baskets’ initiatives and single-serve packages. Digital commerce is also redefining the grocery shopping experience, presenting us with opportunities in increased transactions and closer engagement with the consumer.
See more on our initiatives in the Consumers and Customers sections
New categories and brands 5%
New package formats 46%
Variants of Coca‑Cola 28%
Flavours of other sparkling brands 15%
Flavours for adults 4%
Other flavours 2%
We sold 47 million cases of innovative products and packages, accounting for
2.3% volume growth vs 2016.
5%Calories reduced in
total portfolio vs 2016
Growth achieved from new launches in 2017

Schweppes Pomegranate is one of our adult drink offerings. Launched in Russia
in 2017, this variant was instrumental in growing Schweppes volumes
by 15% in the year.

ENER
GIS
E
We have a cash-generative business and a tremendous opportunity to deploy the cash to take advantage of volume and value growth opportunities. In production, we are investing in new technologies for categories such as plant-based beverages and innovative packaging. Cooler technology is also advancing, with digital coolers that can ‘connect’ with our consumers as well as more energy-efficient and environmentally friendly coolers, which will further drive down carbon emissions.
In markets where we can generate higher value by increasing single‑serve volumes, we intend to continue our investment in coolers.
It is crucial that we invest in the promising new categories and brands we are launching, in the form of both advertising and in‑store execution. We have strong plans for investment in this area and our investment is matched by our partner, The Coca‑Cola Company.
We energise our business by investing in it and nurturing it
for long‑term growth.
6%
5%
4%
3%
2%
1%
0%
-1%
12%
10%
8%
6%
4%
2%
0%
11 12 13 14 15 16 17
FX-neutral revenue growth (%) (LH scale)
Total marketing expenses as % of revenue (RH scale)
CapEx as % of revenue(RH scale)
Investing in revenue growth
5.9%FX‑neutral revenue growth in 2017
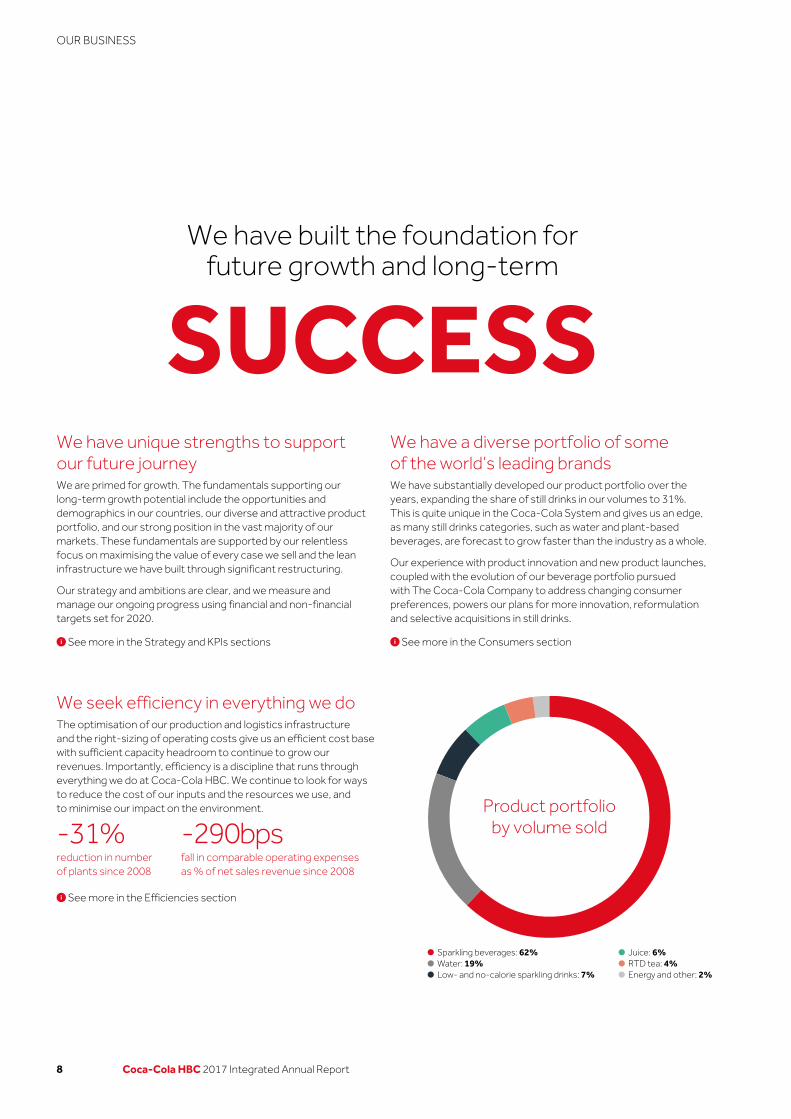
Sparkling beverages: 62%Water: 19%Low- and no-calorie sparkling drinks: 7%
Juice: 6%RTD tea: 4%Energy and other: 2%
Product portfolioby volume sold
We have built the foundation for future growth and long‑term
SUCCESSWe have unique strengths to support our future journeyWe are primed for growth. The fundamentals supporting our long‑term growth potential include the opportunities and demographics in our countries, our diverse and attractive product portfolio, and our strong position in the vast majority of our markets. These fundamentals are supported by our relentless focus on maximising the value of every case we sell and the lean infrastructure we have built through significant restructuring.
Our strategy and ambitions are clear, and we measure and manage our ongoing progress using financial and non‑financial targets set for 2020.
We have a diverse portfolio of some of the world’s leading brandsWe have substantially developed our product portfolio over the years, expanding the share of still drinks in our volumes to 31%. This is quite unique in the Coca‑Cola System and gives us an edge, as many still drinks categories, such as water and plant‑based beverages, are forecast to grow faster than the industry as a whole.
Our experience with product innovation and new product launches, coupled with the evolution of our beverage portfolio pursued with The Coca‑Cola Company to address changing consumer preferences, powers our plans for more innovation, reformulation and selective acquisitions in still drinks.
See more in the Strategy and KPIs sections
See more in the Efficiencies section
See more in the Consumers section
We seek efficiency in everything we doThe optimisation of our production and logistics infrastructure and the right‑sizing of operating costs give us an efficient cost base with sufficient capacity headroom to continue to grow our revenues. Importantly, efficiency is a discipline that runs through everything we do at Coca‑Cola HBC. We continue to look for ways to reduce the cost of our inputs and the resources we use, and to minimise our impact on the environment.
‑31%reduction in number of plants since 2008
‑290bpsfall in comparable operating expenses as % of net sales revenue since 2008
8 Coca-Cola HBC 2017 Integrated Annual Report
OUR BUSINESS

We lead the way in sustainability in the beverage industryThe recognition we have received globally as the sustainability leader amongst beverage companies in the Dow Jones World and Europe Sustainability Indices (‘DJSI’), and as the leader of the wider food, tobacco and beverage sector, reflects our success in operating an efficient, profitable business that is also responsible and trusted by stakeholders. This trust allows us to be even more ambitious in creating shared value, and serves to position our business as fit for purpose in a changing world.
Our priorities are driven by the material issues which have the potential to alter our business environment in the medium to long term, including health and nutrition, and packaging. We also seek to address existing needs as well as new opportunities in our markets to strengthen communities and maximise our impact by carefully measuring the value we add and partnering with others to leverage combined expertise.
‑9.1% reduction in direct carbon emissions ratio
4 yearsconsecutive leadership in our industry in the Dow Jones World and Europe Sustainability Indices
We can develop and fuel growth in our marketsDuring the period from 2009 to 2015, our business faced unprecedented challenges from macroeconomic turmoil. This situation served to demonstrate our strength and resilience and the commitment and dedication of our people. In the last couple of years, we have seen the macroeconomic environment in our markets gradually improve and this is driving growth in the non‑alcoholic ready‑to‑drink (NARTD) beverages industry. Our forecasts indicate that NARTD beverages should grow by 1.5% per annum on average in our markets between 2016 and 2020. We continue to invest in our markets to grow volumes ahead of the industry and extract value out of our business under these more favourable conditions.
Emerging marketsGDP per capita US$5,502
Consumption 97 servings
Revenue in 2017 +7.2%
Developing marketsGDP per capita US$15,117
Consumption 208 servings
Revenue in 2017 +7.2%
Established marketsGDP per capita US$37,854
Consumption 187 servings
Revenue in 2017 +1.2%
See more in the Market highlights section
Consumption is measured as 8 oz. servings per capita of sparkling drinks
We remain agile in the changing retail landscape and execute with excellenceAs the market leader in every market where we operate except for Slovakia, we work closely with our customers to develop and satisfy consumer demand, growing their business as well as ours. There are also efficiencies we can gain when taking our products to market. In a very dynamic retail landscape, we focus on route‑to‑market initiatives that deliver tailored solutions for the continuously changing retail landscape, ensuring that we capture growth opportunities in every market.
See more in the Customers section
See more in the Communities and Efficiencies sections
9Coca-Cola HBC 2017 Integrated Annual Report
Strategic R
eport
Co
rporate G
overnance
Financial Statem
entsS
wiss S
tatutory R
eporting
Supplem
entary Inform
ation

10 Coca-Cola HBC 2017 Integrated Annual Report
JOINT Q&A WITH THE CHAIRMAN AND CHIEF EXECUTIVE OFFICER

IN A STRONG POSITION TO ACHIEVE FUTURE GROWTH OPPORTUNITIESIn 2017, we steered our organisation through another year of success and growth.
Anastassis G. DavidChairman
Zoran BogdanovicChief Executive Officer
I feel privileged to have worked with Dimitris Lois, a special person and an inspiration to the whole Coca‑Cola HBC family. He had remarkable values, and placed our people at the centre of everything we do.
This is reflected in the Company’s 2017 employee engagement results, which set the bar for the Coca‑Cola System and ranked Coca‑Cola HBC above the Willis Towers Watson benchmarking pool of high‑performing companies. This is an achievement that forms the foundation for much of the Company’s success.
I was delighted to announce Zoran’s appointment as Chief Executive Officer in December. He will bring a deep understanding of our markets and corporate culture along with fresh, innovative insights to address new challenges.
We are building on the strong foundation that we established with Dimitris Lois, who led Coca‑Cola HBC as CEO from 2011 until his untimely death in October.
We continue to successfully implement our strategic plans, evolving our Company by diversifying our portfolio of beverages and modifying our offerings to be even more relevant to consumers and customers.
Q: How was 2017 for Coca-Cola HBC?AD: Our impressive results for the year are very pleasing and a clear demonstration of our long‑term efforts to establish a strong strategic framework. The implementation of our internal succession plan, and the reinforcement of corporate governance and sustainability commitments, are also a testament to the effectiveness of the Board.
Strategic R
eport
Co
rporate G
overnance
Financial Statem
entsS
wiss S
tatutory R
eporting
Supplem
entary Inform
ation
11Coca-Cola HBC 2017 Integrated Annual Report

ZB: Needless to say, we are proud that, once again, we achieved solid currency‑neutral revenue growth as well as improvement in operating margin. We started the year excited about the recovering economies in our markets and the well‑thought‑through plans every person was charged with implementing. As the year progressed, the operational and financial results we delivered invigorated everyone in the Company. As Region Director for part of the business before my appointment as CEO, I have been witness to the day‑to‑day motivation and energy throughout the business. Improvements in the macroeconomic environment in Russia and our success in managing the challenging circumstances in Nigeria were key developments in 2017, and provide good momentum for 2018.
Q: How would you summarise the operational and financial highlights for the year?ZB: We have been making significant changes to drive volume and enhance value in an ever‑changing environment, with consumers looking for more choice to suit their preferences and customers making changes to ensure the long‑term health of their businesses.
Each market in the Company had a set of clear ‘revenue growth management’ initiatives, ranging from identifying new revenue pools and improving mix to adjusting pricing and promotional management. These initiatives have been very successful in supporting revenue growth. Our commitment to continuous efficiency improvements remains unchanged, as does our steady focus on attracting, developing and retaining the best people. Finally, we are proud to have been named the food, tobacco and beverage supersector leader this year in addition to remaining beverages industry leader in the Dow Jones Sustainability Indices for the fourth year in a row. This is an important indication of our commitment to our stakeholders and communities as well as our success in managing critical material issues.
Our strong results for the year have us on track to achieve the 2020 financial targets we announced in 2016. We delivered 5.9% revenue growth on a currency‑neutral basis. Importantly, this was achieved with a good balance between volume growth and price and mix improvements. As anticipated, the operational leverage in the business meant that this revenue growth resulted in a 120 basis‑point expansion in our comparable operating margin to 9.5%.
We also continued to convert our profits to cash, delivering €426 million of free cash flow.
Q: Can you elaborate on the 2017 Integrated Annual Report theme: Understand, Evolve, Energise?ZB: Consumers’ lifestyles are changing, with growth coming from lower calorie and more unique product propositions, some of which offer additional functions in addition to satisfying thirst. Demographics in many of our markets are also changing, with populations in many European markets ageing and more people living alone. As lifestyles change, shopping habits are also changing, making the adult segment and ‘small baskets’ increasingly important.
Understanding these trends is important to ensure that we evolve our business, our product portfolio and market execution in ways that meet changing consumer and customer needs and preferences. As consumers are spending more time at work, or at home having ‘me time’, we are evolving our approach to cater to these occasions alongside the more traditional occasions such as ’Coke with meals’. Digital technology is also impacting consumption patterns and shopping habits, opening up new sales channels.
“Consumers’ lifestyles are changing, with growth coming from lower calorie and more unique product propositions, some of which offer additional functions in addition to satisfying thirst.”Zoran Bogdanovic
12 Coca-Cola HBC 2017 Integrated Annual Report
JOINT Q&A WITH THE CHAIRMAN AND CHIEF EXECUTIVE OFFICER CONTINUED

“We have been making significant changes to drive volume and enhance value in an ever‑changing environment.”Zoran Bogdanovic
Having applied revenue growth management principles in our business for a few years, we have gained greater impetus. The understanding and discipline we now have, coupled with the tools we have developed, will support volume and value growth in a sustainable way.
With the total beverage portfolio evolution that we are pursuing with The Coca‑Cola Company, we are collaborating in realising an unprecedented level of innovation, leading to new categories, brands, packages and channels. We are in touch with consumers 24/7, for every occasion.
Our route‑to‑market and execution capabilities have recently been upgraded, helping to make sure we can support our existing customers in the established channels as well as taking advantage of opportunities presented by newly emerging channels.
Gaining efficiencies in production, logistics and operating cost base are a way of life at Coca‑Cola HBC, and our continued focus on efficiency is key to streamlining packaging, reducing energy use and minimising our impact. Finally, we are determined to continue to invest in the business for growth.
These are, I believe, the key factors for the fulfilment of our vision.
Q: Two years into the 2020 plan and you have delivered very well. Are your plans and financial targets still valid until 2020?AD: When the Company first announced its 2020 financial targets in 2016, the targets were seen as ambitious by the investment community. We indicated that our progress would be slow through 2017, picking up significantly as the macroeconomic environment improved.
That we are well on track to achieve our 2020 plan goals is very pleasing and shows that our confidence in our business and our people was justified. I am just as pleased that the Company is on course to achieve the vast majority of its ambitious sustainability targets.
More informationSee more about strategy and KPIs page 21See more about our market page 16See more about consumers and customers page 38
In this report you will read about our plans for innovation, reformulation, new packaging formats, changes to our route to market, digital coolers and e‑commerce, all of which contribute to this evolution, energising our business for growth and success in the long term.
AD: Our consumers are key stakeholders, and understanding their needs is crucial. We are also mindful that all of the other stakeholders we engage with, from investors and customers to employees and suppliers, are keen to understand how our business is evolving to remain fit for purpose and energised to grow in a changing world.
Q: What innovations are being prioritised for the year ahead?ZB: Firstly, in order to shape choice and proactively support low‑ and no‑calorie sparkling drinks consumption, we are working with The Coca‑Cola Company to evolve the recipes. Sparkling drinks account for two thirds of our portfolio and we will continue to accelerate their growth. We are also refreshing the juice portfolio with smoothies and seasonal flavours. In ready‑to‑drink tea, we are launching FUZE tea, which will replace Nestea in all but three of our markets.
We believe that the innovative flavour and herb combinations of FUZE tea and the marketing investment to support the brand will revitalise the ready‑to‑drink tea category.
We are very excited about new categories, too. AdeZ plant‑based beverages are coming in 13 markets. Coffee, which is critical to our efforts to grow the ‘at work’ occasion, has already been launched in several markets. Finally, we are running a new initiative called Incubate & Grow, which will pilot certain products such as Appletiser, glacéau smartwater and ZICO Coconut Water in affluent cities in our territory. In my 21 years at Coca‑Cola HBC, I have never witnessed as many launches as we will have in 2018.
Q: How is the Company tracking against its strategy?ZB: The financial results speak for themselves. What is important for me is how well entrenched our strategy is in the hearts and minds of our people. After all, our people and our culture are the most critical differentiating factors of our Company as well as being the drivers of growth.
13Coca-Cola HBC 2017 Integrated Annual Report
Strategic R
eport
Co
rporate G
overnance
Financial Statem
entsS
wiss S
tatutory R
eporting
Supplem
entary Inform
ation

This investment is lower than our commitment to spend 2% of our pre‑tax profit on communities due to the fact that our programmes take longer to ramp up while the increase in profitability is nearly 60% in two years.
I am particularly happy with our achievement of a 9% reduction in carbon emissions from operations in 2017, compared to 2016 levels. Moreover, we reduced the amount of water we use and energy we consume to produce a litre of beverage by 6% and 4% respectively. These actions demonstrate our commitment to grow our business profitably, whilst lowering our impact on the environment.
We also introduced a new commitment in 2017. As part of an overall industry pledge, we will by 2020 reduce the amount of added sugars in our sparkling soft drinks across the EU and Switzerland by 10% against the 2015 baseline. We have already made a good start in 2017, and ongoing work to reformulate recipes supports this objective – and global health and wellness – while helping us meet consumer needs.
We will keep our commitments relevant and maintain our focus on our key material issues; in 2018, we will review our sustainability commitments with a view beyond 2020.
AD: 2017 has been a pivotal year for our sustainability agenda. Along with the improvements that Zoran mentions, we have successfully rolled out our flagship community programme, #Youth Empowered, in 21 of our markets. We know that the future of our business is linked to the futures of young people across our markets. #YouthEmpowered seeks to address persistent underemployment for young people between 18 and 30 years old. During 2017, more than 21,500 youngsters participated in a combination of on‑site workshops and online training sessions. In December, I attended a town hall session with youth participants in Athens, along with our Operating Committee, and all of the country General Managers, and saw for myself how meaningful it is to contribute to the futures of people in this age group.
“That we are well on track to achieve our 2020 plan goals is very pleasing and shows that our confidence in our business and our people was justified.”Anastassis David
ZB: Our strategy is clear and implementation has been successful because our people really understand their role in making it happen. The success we are achieving validates the strategy, and we believe we are gaining speed. Barring unforeseen circumstances, we are committed to our plans and reiterate our financial targets for 2020.
Q: As a signatory to the United Nations’ (UN) Global Compact since 2005, and a supporter of the UN’s Sustainable Development Goals (SDGs), the business has a very strong sustainability focus. Can you explain how this strengthens your business?ZB: During 2017, we continued to make substantial progress against our ambitious sustainability targets. These targets, set for 2020, range from science‑based goals for carbon reduction to increasing the recycled content used in product packaging.
Let me summarise our progress. We are partly behind on our commitment to increase the use of recycled PET and plant‑based PET materials for our PET packaging due to the higher cost of these materials in our geographies. On the other hand, we are pleased that in 2017 we have already met our 2020 packaging recovery target, collecting for recycling approximately 41% of the total packaging we put in the marketplace. Encouraged by this strong performance, we are working on revising the recovery rate target.
We have also joined the World Without Waste global packaging commitment of The Coca‑Cola Company, developing plans for drastic packaging reduction and increased recovery beyond 2020.
In 2017, we invested €7.4 million in our communities, which is 2% higher than 2016 and is equivalent to 1.3% of our pre‑tax profit.
14 Coca-Cola HBC 2017 Integrated Annual Report
JOINT Q&A WITH THE CHAIRMAN AND CHIEF EXECUTIVE OFFICER CONTINUED

Our sustainability efforts are also recognised internationally. In 2017, Coca‑Cola HBC was named the industry leader amongst beverage companies in the Dow Jones World and Europe Sustainability Indices (‘DJSI’) for the fourth consecutive year. In addition, we became the leader in the wider food, tobacco and beverage sector for the first time ever. We are committed to remaining a force for positive change in our communities.
Q: With the change in leadership, should one expect a change in the culture of the business?AD: The Board believes that Coca‑Cola HBC has an incredibly strong corporate culture, and that this is a valuable asset which requires attention and investment. The Company has very deep roots, both within our markets and within the Coca‑Cola System, and our culture is also deeply rooted.
However, as reflected in the theme of this report, we are focused on the need for our business to evolve, and we expect that this will impact our culture. As our Company evolves as a total beverage company, agility will become even more critical. Innovation has already become much more important.
ZB: Our stakeholders, particularly employees, can expect our core values to remain unchanged. Our values are the cornerstone of our culture and the work we do to embed them will continue.
We have defined important behaviours that represent the essential building blocks of our culture; the behaviours we encourage. There are also behaviours, such as being curious, adopting innovative ideas with speed, taking risks and learning from both winning and failing, that will come to the fore with the evolution of the business. We have likewise identified behaviours that are not in alignment with our culture, including accepting the status quo or failing to respond to customer needs. As our business evolves, we will adjust the set of behaviours to ensure it is always one that supports our business the most.
Q: What are the Board’s areas of focus as we go into 2018?AD: The Board will focus on supporting the evolution of the business, the acceleration of product innovation in alignment with The Coca‑Cola Company and nurturing our culture and values, all of which are critical for the long‑term growth and success of Coca‑Cola HBC.
We will also seek to continue demonstrating leadership in sustainability, working to continually improve and meet or exceed our commitments. To maintain resiliency and a strong pipeline of diverse talent, the Board will build on its succession planning work for Board and senior management positions.
Q: How do you see the outlook for 2018?ZB: In 2018, we expect further economic growth and healthy inflation in Europe and Russia. In Nigeria, high inflation impacted consumers in 2017, but economic conditions are forecast to improve in 2018.
Overall, we expect volume to continue to grow in all three of our segments, with the Emerging markets segment accelerating, as Russia and Nigeria return to volume growth.
We are excited about the year ahead, which has a particularly strong pipeline of product innovation and commercial activity around our route to market and in‑store execution. There is good momentum in the business and a determination to build on our success. We are confident that 2018 will be another successful year.
Anastassis G. DavidChairman
Zoran BogdanovicChief Executive Officer
15Coca-Cola HBC 2017 Integrated Annual Report
Strategic R
eport
Co
rporate G
overnance
Financial Statem
entsS
wiss S
tatutory R
eporting
Supplem
entary Inform
ation

UNDERSTANDING EVOLVING TRENDS AND PREFERENCES
Market trends
Success involves anticipating the future. We continually track and monitor evolving consumer preferences, shifting market conditions and emerging trends.
How we are responding
To win with customers and delight consumers, we take proactive approaches, navigate changing expectations and demonstrate business agility.
Our focus on route to market enables us to partner with our customers and ensure that we capture all growth opportunities across channels. We support the well-established organised trade and fragmented trade channels while simultaneously investing in newer, faster growing ones. Whilst at a small base, e-commerce has doubled in value over the last five years. We prioritise strategic partnerships with online retailers, driving transactions by working to ensure our products are well represented on their platforms. Consistent with our 24/7 approach, we are devoting more resources to capture the socialising occasion growth in HoReCa and to develop new channels in line with category expansion.
Dynamic retail environment The retail landscape keeps shifting as lifestyles and shopping habits change. Smaller and more frequent shopping trips and the increase of smaller households is driving growth in the proximity and convenience channel. E-commerce is also seeing rapid growth. We expect these channels to be the highest incremental revenue contributors in our industry by 2020. Socialising occasions such as ‘Away from home’ show signs of growth and recovery in most of our markets, following an upward trend in consumer sentiment. This places increased emphasis on sales through hotels, restaurants and cafes (HoReCa).
Increased connectivity of consumers creates new opportunities for sales, brand awareness and consumer feedback. Digital solutions are being rolled out across our business to activate customers, empower our people and engage communities. We launched the WOAH (‘Where only awesome happens’) app to connect with teenagers in eight countries. The WOAH app, launched in partnership with The Coca-Cola Company, interacts with connected coolers, sending our consumers push notifications for customised promotions. It also provides useful information to business developers and helps to minimise the time needed for administrative tasks.
Digital evolutionWe see a consistently growing reliance on digital communications which affects the way consumers connect with brands. The total shopping experience is being digitalised, from market research for the most appropriate product to online orders and home delivery. Social media is increasingly powerful for shaping category and brand perceptions. Mobile phones and wearables allow constant connectivity, providing opportunities for companies to disseminate information on promotional activities, new launches and brands.
+2.2%Online purchase of groceries is forecast to increase by 1 billion euros by 2020, accounting for 2.2% of the total future consumption channel value
0.55mWOAH app downloaded 0.55m times in the first eight countries during 2017
Working with our customers
Being relevant to our consumers
Efficiencies
Working with our customers
Being relevant to our consumersDelivered through
16 Coca-Cola HBC 2017 Integrated Annual Report
MARKET REVIEW

As a responsible category leader, we have taken steps to drive sustainable, profitable growth for our brands, while enabling consumers to control their sugar intake. We are accelerating sales growth of low- and no-calorie drinks, offering smaller packages and reformulating our sparkling beverages to include fewer calories. We also support the Evolved Nutrition Labelling initiative along with The Coca-Cola Company and four other industry players, for clear and uniform product information across the European Union. We contribute to the fight against childhood obesity by not advertising to children younger than 12 and are taking steps to remove sugar-sweetened drinks from secondary schools.
In Coca-Cola HBC, sustainability is at the core of all aspects of production, from sustainable raw material sourcing and responsible use of water and energy to environmentally friendly packaging and waste management. It has also become part of the DNA of our business, impacting all decisions and nearly everything we do. Sustainability considerations are part of product development, procurement decisions and our efforts to engage our employees. In 2017, we were named global beverage industry leader in the Dow Jones Sustainability Indices (‘DJSI’) for the fourth consecutive year and we were also recognised by the CDP (formerly the Carbon Disclosure Project), scoring an A for Climate and Water.
We are greatly expanding our product portfolio with new brands and new categories to satisfy a broader range of beverage needs. New, innovative products include natural juices, premium water, plant-based beverages and adult sparkling soft drinks. To address concerns about sugar intake, our innovation in sparkling drinks focuses on low- and no-calorie options and on the development of smaller packages. As new product launches become key drivers of future growth, and to remain competitive, we are investing in enhancing our processes to manage multiple launches simultaneously and to ensure that the speed to market is fast.
Regulatory environmentThe regulatory environment for the food and beverage industry is becoming increasingly prescriptive. Tax on products with added sugar, especially beverages, is a reality in a number of countries and is a trend that is gaining strength. To guide consumers and address public health concerns, the World Health Organization recommends that added sugars be limited to 10% of daily calorie intake. Product labelling regulations and packaging and environmental legislation are also higher on regulators' agendas.
Changing consumer preferencesHealth and wellness is becoming a greater priority, triggering a clear shift towards natural, organic and functional offerings that contain less sugar, have pure ingredients and are sourced locally. The demand for more differentiation and more choice provides an opportunity for the creation and growth of smaller brands. The European population is ageing, leading to an increase in adult consumers looking for more sophisticated offers focusing on taste and premiumisation.
Sustainability Consumers have become more conscious of the social and environmental impact of consumption decisions. Sustainability considerations shape choice, especially among those who are less price-sensitive. As this preference is more pronounced among younger consumers, we expect this trend to accelerate. Companies that follow sustainable practices are able to develop greater brand loyalty and customer engagement, strengthening their competitive advantage. In addition, as natural resources become more scarce and environmental regulations stricter, companies that engage in sustainable practices benefit from financial incentives and reduced supply chain risk.
-5%In 2017, the implementation of our plans resulted in reducing the number of calories per 100ml in our sparkling portfolio by almost 5%
+20% p.a.Plant-based beverages are expected to grow by 20% p.a. between now and 2020
#1We are number one in the DJSI and one of just 25 companies in all industries to score A in both climate and water in the CDP
Working with our customers
Being relevant to our consumers
Efficiencies
Being relevant to our consumers
Winning the trust of our communities
Being relevant to our consumers
Winning the trust of our communities
Efficiencies
17Coca-Cola HBC 2017 Integrated Annual Report
Strategic R
eport
Co
rporate G
overnance
Financial Statem
entsS
wiss S
tatutory R
eporting
Supplem
entary Inform
ation

We are a bottling partner of The Coca‑Cola Company.This means that we use the concentrates, or syrups, from The Coca-Cola Company to manufacture, package, merchandise and distribute the final branded products to our trade partners and consumers.
Our business model is at the heart of everything we do. It supports our growth and defines the activities we engage in, the relationships we depend on and the outputs and outcomes we aim to achieve in order to create value for all of our stakeholders in the short, medium and long term.
Sourcing sustainable materialsWe work with 35,000 suppliers to procure the finest ingredients, raw materials, equipment and services.
Serving consumers and communitiesWe continue to innovate our product portfolio to meet the changing consumer preferences in the market.
Our resources and relationships What we do
Leveraging our growth model
How we do it
CREATING VALUE FOR ALL STAKEHOLDERS
See more on page 20
Human
Natural
Social and relationship
Financial
Intellectual
Manufactured
The Coca-Cola Company creates demand
Trademark ownership
Concentrate supply
Brand development
Consumer marketing
Coca-Cola HBC delivers demand
Bottling
Sales and distribution
Customer management
In-outlet execution
Investment in production facilities, equipment,
vehicles
See more on our growth model on page 20
Growth in category volume
Investment in production optimisation
Working capital management
Brand investment – The Coca‑Cola Company
Share gains
Operating expense reduction
Disciplined CapEx investment
In-store activation – Coca-Cola HBC
In-market execution
Cost efficiencies
Use of cash
Marketing
OUR BUSINESS MODEL
18 Coca-Cola HBC 2017 Integrated Annual Report
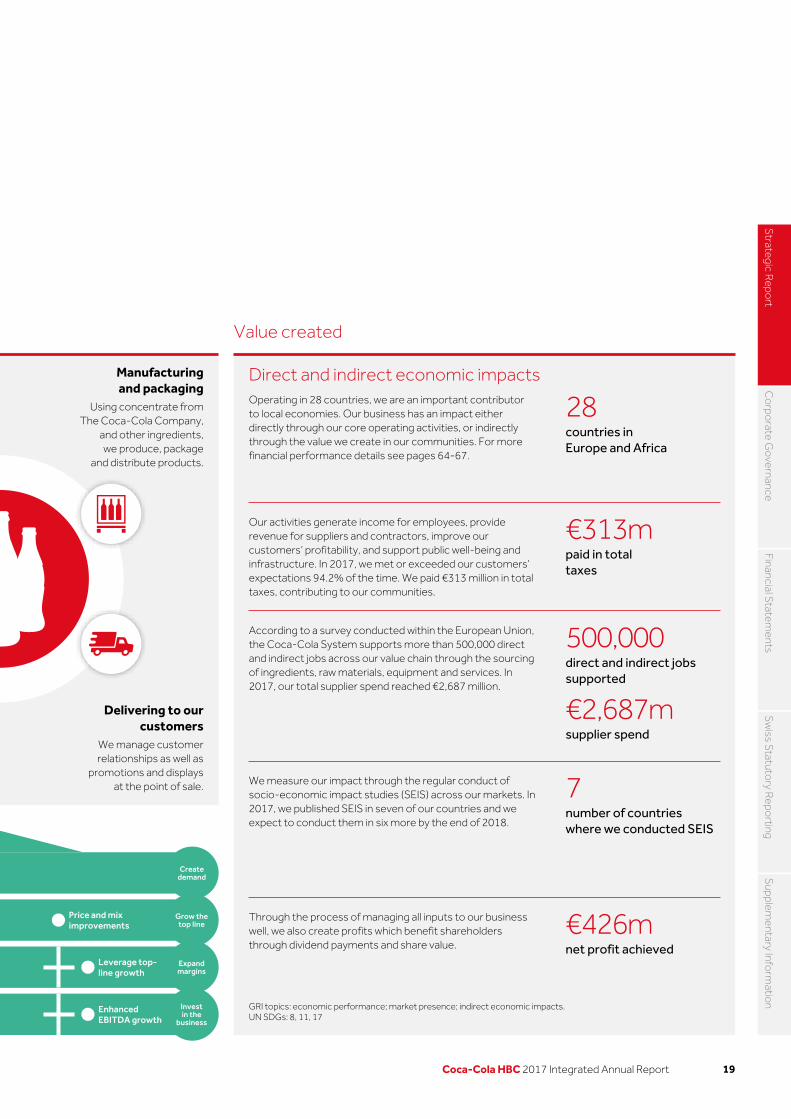
Manufacturing and packaging
Using concentrate from The Coca‑Cola Company,
and other ingredients, we produce, package
and distribute products.
Delivering to our customers
We manage customer relationships as well as
promotions and displays at the point of sale.
Price and mix improvements
Leverage top- line growth
Enhanced EBITDA growth
In-store activation – Coca-Cola HBC
Invest in the
business
Grow the top line
Expand margins
Create demand
28countries in Europe and Africa
€313mpaid in total taxes
7number of countries where we conducted SEIS
€426mnet profit achieved
500,000direct and indirect jobs supported
€2,687msupplier spend
Value created
Our activities generate income for employees, provide revenue for suppliers and contractors, improve our customers’ profitability, and support public well‑being and infrastructure. In 2017, we met or exceeded our customers’ expectations 94.2% of the time. We paid €313 million in total taxes, contributing to our communities.
According to a survey conducted within the European Union, the Coca‑Cola System supports more than 500,000 direct and indirect jobs across our value chain through the sourcing of ingredients, raw materials, equipment and services. In 2017, our total supplier spend reached €2,687 million.
We measure our impact through the regular conduct of socio‑economic impact studies (SEIS) across our markets. In 2017, we published SEIS in seven of our countries and we expect to conduct them in six more by the end of 2018.
Through the process of managing all inputs to our business well, we also create profits which benefit shareholders through dividend payments and share value.
GRI topics: economic performance; market presence; indirect economic impacts.UN SDGs: 8, 11, 17
Direct and indirect economic impactsOperating in 28 countries, we are an important contributor to local economies. Our business has an impact either directly through our core operating activities, or indirectly through the value we create in our communities. For more financial performance details see pages 64‑67.
19Coca-Cola HBC 2017 Integrated Annual Report
Strategic R
eport
Co
rporate G
overnance
Financial Statem
entsS
wiss S
tatutory R
eporting
Supplem
entary Inform
ation

HumanOur 29,427 people bring talent and strong capabilities relevant to all aspects of our business, from community and customer relations to the innovative thinking necessary to drive value growth and efficiency.
FinancialOur business activities require financial capital, which includes shareholders’ equity, debt and reinvested cash. Coca‑Cola HBC has only one class of shares: ordinary shares.
NaturalWater is the most important ingredient for nearly all of our products. Energy, sugar, aluminium and resin are also critical inputs which we seek to source responsibly and use efficiently.
IntellectualOur intellectual property includes our packaging, product and cooler innovations and our operational excellence systems. As we evolve our beverage portfolio, the importance of these types of innovation is increasing.
Social and relationshipOur social 'licence to operate' is due to our reputation and the trust of key stakeholders. Our most valuable stakeholder relationships are with The Coca‑Cola Company, and our people, customers, suppliers and partners as well as governments and regulators.
ManufacturedAs a bottler, we require production and logistics assets that allow us to manufacture, package and deliver our products to meet the demands of customers and consumers.
Every element of our business model is unique to our Company and has a role to play in our future long‑term success.
UNDERSTANDING OUR BUSINESS MODEL
The resources and relationships we depend on to create value
Our growth modelWe create demand by investing in our brands jointly with The Coca-Cola Company. In delivering demand, we focus on growing the non-alcoholic ready-to-drink category, while gaining share. Our work with our customers helps to grow their business as well as ours, improving
value with price and mix improvements. At the same time, we continuously optimise our production and logistics infrastructure and adjust our cost base. The growth in the top line, combined with an efficient and well-invested cost base, gives us powerful operating leverage and
expands our profitability. Disciplined management of working capital and capital expenditure enhances the cash we generate, which in turn is invested to fuel growth in the business.
Our values that guide how we create value – Authenticity – Excellence
– Learning – Caring for our people
– Performing as one – Winning with customers
20 Coca-Cola HBC 2017 Integrated Annual Report
OUR BUSINESS MODEL CONTINUED

Our strategy is designed to achieve responsible, sustainable and profitable growth. We have identified specific initiatives to drive the business and a 2020 scorecard against which we measure our progress.
FOCUSED ON DELIVERY
How we measure our performance We have five key performance indicators (KPIs) that are chosen to measure our progress. We report on these every year. Please see pages 24‑25 for our 2017 KPIs.
What we do to achieve our objectivesAll of our operations in 28 countries work towards the same objectives – drive volume growth, focus on value, improve efficiency and invest in the business – by implementing initiatives that are designed centrally. These initiatives are adjusted to respond to local demographics, economies and market characteristics in order to manage risk while driving growth.
Scorecard
Enablers and values
Initiatives
Objectives
Average currency-neutral revenue growth
4‑5% p.a.
Comparable EBIT
11%by 2020
Comparable OpEx as % of revenue
26‑27%by 2020
Capital expenditure
5.5‑6.5%of revenue
Working capital less than
‑€100m
Expand and deepen route to market
Execute in‑store with excellence
Create joint value with customers
Drive the water category, focusing on value
Capitalise on meals and socialising occasions for sparkling drinks
Increase share of single‑serve packs, driving transactions
Improve performance in hotels, restaurants and cafes (HoReCa)
Grow in the energy category
Drive pricing strategies
Continue production infrastructure and logistics optimisation
Capitalise on contiguous territory and Emerging markets opportunities
Utilise shared services to gain process efficiency
Drive packaging harmonisation and innovation (light‑weighting)
Invest in revenue‑ generating assets and innovative technology
Acquire water and juice brands in existing territory
Maintain negative working capital balance sheet position
Drive volume growth
Focus on value
Improve efficiency
Invest in the business
Our people Our most important enablers of growth are our people: unparalleled talent and a high-performance
mindset are what we strive for. Our people make our Company what it is and create value by growing our business responsibly and sustainably. Strengthening the capabilities of our people as well as
engaging them and rewarding them appropriately are priorities at every level of our Company, enabling us to continue to attract and retain the best talent in every position.
A sustainable businessWe create a sustainable business by growing profitably, responsibly and sustainably,
and by driving positive change in our communities.
21Coca-Cola HBC 2017 Integrated Annual Report
Strategic R
eport
OUR STRATEGY AND KPIs
Co
rporate G
overnance
Financial Statem
entsS
wiss S
tatutory R
eporting
Supplem
entary Inform
ation

ENERGISING OUR STRATEGY
Progress against our strategy Progress against our strategy
Drive volume growth Focus on value
What we said we would do
– Grow volumes in Emerging and Developing market segments
– Stabilise volumes in Established markets
– Expand and deepen route to market
What we said we would do
– Deliver a substantial increase in FX‑neutral net sales revenue per case
– Capitalise on occasions and HoReCa
– Increase share of single‑serve packs
– Grow the energy category
– Drive pricing strategies
Priorities for 2018
– Continue launches of new products, variants, flavours and packaging formats
– Continue to drive the water category, focusing on value
– Successfully migrate to the new FUZE tea brand
Priorities for 2018
– Drive category and pack mix as well as price strategies in countries where there is currency depreciation
– Expand the distribution of the Monster energy brand
– Capitalise on HoReCa
– Develop Incubate & Grow unit in affluent cities in Europe
Risk management approach
Addressed under principal risks
– Consumer health and Channel mix
2017 20172020 2020
Challenges in 2017
– Economic conditions challenged our consumers in Nigeria and to a lesser extent in Russia
– Consumers' preferences continued to evolve in our Established markets
Challenges in 2017
– Pack mix was negatively impacted in the Emerging markets segment as consumers in Nigeria and Russia continued to seek affordable packs and formats
– Continued growth in the organised trade had an adverse impact on channel mix
What we did in 2017
– We revitalised our portfolios with launches of variants of our brands, most of them containing no or low sugar
– We made changes to our route to market, e.g. in Poland
– Specifically in Nigeria, we changed our price pack architecture to provide consumers with affordable options
– We delivered volume growth in all three segments
What we did in 2017
– We increased the share of single‑serve packs overall
– We achieved double‑digit growth in the energy category
– We adjusted the price pack architecture in Nigeria and drove pricing with minimal impact on volumes
– We delivered improvements in FX‑neutral revenue per case in all three segments
Key performance indicators
– Volume growth
Key performance indicators
– FX‑neutral net sales revenue per case growth (%)
– FX‑neutral net sales revenue growth (%)
See more on pages 38 and 44 See more on pages 38, 44 and 34
Delivered through
Being relevant to consumers
Working with our customers
Delivered through
Working with our customers
Being relevant to our consumers
Winning the trust of our communities
See more on page 60
Risk management approach
Addressed under principal risks
– Channel mix and Declining consumer demand
See more on pages 60 and 61
22 Coca-Cola HBC 2017 Integrated Annual Report
PROGRESS ON OUR STRATEGY

Progress against our strategy Progress against our strategy
Improve efficiency Invest in the business
What we said we would do
– Gain further efficiencies in our operating cost base
– Optimise production and logistics infrastructure
– Procure and use all resources efficiently
What we said we would do
– Continue to invest in revenue‑generating assets and innovative technology
– Acquire water and juice brands in existing territory
– Maintain discipline to ensure return on the capital invested
Priorities for 2018
– Continue to optimise production and logistics
– Make further enhancements to procurement processes
– Review our sustainability commitments with a view beyond 2020
Priorities for 2018
– Invest to support the production of plant‑based beverages, juice smoothies, and PET juice packaging in Nigeria
– Continue optimising and investing in our production in Nigeria
– Maintain working capital discipline
Risk management approach
Managed as an operational risk by the business units and functions in line with our risk management processes
Risk management approach
Managed as an operational risk by the business units and functions in line with our risk management processes
2017 20172020 2020
Challenges in 2017
– Increased cost of commodities, e.g. PET resin
– Increased pressure on packaging and recycling of packaging
– One‑off operating costs
Challenges in 2017
– Potential acquisition targets were either not available or did not meet our strategic and financial criteria
What we did in 2017
– We consolidated production and distribution centres in Russia and in Nigeria
– We gained efficiencies in administration and warehousing costs
– We invested in marketing
– We fully delivered on our packaging recycling target
What we did in 2017
– We invested in new 'smart' coolers
– We invested in infrastructure relevant to FUZE tea
– We developed digital solutions for production
– We added production capabilities for glacéau smartwater in Hungary
Key performance indicators
– OpEx as percentage of net sales revenue (%)
– Comparable EBIT margin (%)
Key performance indicators
– CapEx as percentage of net sales revenue (%)
– ROIC (%)
See more on pages 48 and 34 See more on pages 48 and 38
Delivered through
Efficiencies
Winning the trust of our communities
Delivered through
Efficiencies
Being relevant to our consumers
23Coca-Cola HBC 2017 Integrated Annual Report
Strategic R
eport
Co
rporate G
overnance
Financial Statem
entsS
wiss S
tatutory R
eporting
Supplem
entary Inform
ation

A STRONG TRACK RECORD
Nurture unparalleled talent and a high‑performance mindset
We track the percentage of employees responding positively to a Group‑wide engagement survey.
We record the number of key people in key positions and the number of women in our Company.
What happened in the year
Based on survey results, the employee engagement score was 89% in 2017. 92% of our key people were in key positions – up from 87% in 2016.
Women make up 26% of our total workforce, 35% of our managers, 35% of our senior leaders and 25% of our Board of Directors.
Underpinned by our enablers and values
KPIs
Volume is measured in million cases sold, where one unit case represents 5.678 litres.
Net sales revenue (NSR) comprises revenues from Coca‑Cola HBC’s primary activities. We track this on an FX‑neutral basis.
Net sales revenue generated per case sold is calculated on an FX‑neutral basis.
Volumes grew by 2.2% , with particularly strong growth in our Emerging and Developing markets, despite a challenging operating environment in both Nigeria and Russia.
FX‑neutral revenue per case grew strongly, up 3.6%, supported by better price, category and package mix in all segments.
Volume is a measure for MIP awards. Net sales revenue is a financial measure for MIP awards.
What happened in the year
Link to remuneration
Objectives
Objectives
KPIs Volume (m unit cases)
Employee engagement score (%)
Key people in key positions (%)
Women in management (%)
FX-neutral revenue per case growth (%)
FX-neutral revenue growth (%)
Drive volume growth Focus on value
How we track our progress
How we measure our performance
0
500
1,000
1,500
2,000
2,500
2,10
4
2,05
8
2,05
5
2015 2016 2017 0
2
4
63.
6
2.9
0.3
2015 2016 2017 0
2
4
6
5.9
3.0
2.9
2015 2016 2017
4-5
0
20
40
60
80
100
898887
2015 2016 2017 0
20
40
60
80
100
9287
79
2015 2016 2017 0
10
20
30
40
353333
2015 2016 2017
See page 104
24 Coca-Cola HBC 2017 Integrated Annual Report
OUR KEY PERFORMANCE INDICATORS

2020 sustainability targets status update
OpEx (operating expenses) as a percentage of net sales revenue is calculated by dividing comparable operating expenses by total net sales revenue.
Comparable EBIT margin refers to comparable profit before tax excluding finance income or cost and share of results of equity method investments divided by net sales revenue.
Working capital is operating current assets minus operating current liabilities, excluding financing and investment activities.
CapEx (capital expenditure) is calculated as a percentage of NSR.
Return on invested capital (ROIC) is comparable operating profit before finance costs divided by capital employed (average equity and net debt).
OpEx as a percentage of NSR and comparable EBIT are financial measures for MIP awards.
Working capital acts as a qualifier for the volume MIP payout. ROIC is a financial measure for PSP awards.
OpEx as percentage of NSR (%)
Comparable EBIT margin (%)
CapEx as percentage of NSR (%)
ROIC (%)
Improve efficiency Invest in the business
Operating leverage resulted in a 30 basis‑point reduction in OpEx as a percentage of revenue. This, combined with the improvement in gross margin, gave us 120 basis‑point expansion in comparable EBIT margin.
We kept the year‑end working capital balance sheet position under negative €100 million. We increased capital expenditure to 5.8% of revenue to support the growth opportunities in our business.
0
10
20
30
27.9
28.2
29.2
2015 2016 2017
26-27
0
2
4
6
8
10
9.5
8.3
7.5
2015 2016 2017
11
0
2
4
6
5.8
5.3
5.2
2015 2016 2017
5.5-6.5
0
5
10
15
12.4
10.3
8.8
2015 2016 2017
Avg. 40% of total packaging recovered for recycling
41%
25% less packaging per litre of beverage produced*
18%
20% of PET sourced from rPET and/or PET from renewable materials
9%
30% water use reduction in operations*
‑21%
Water stewardship certification for all plants
26
10% reduction in added sugar per 100 ml of sparkling beverage in EU&CH
‑5%
10% of our people volunteering during work hours
11%
Community investment at 2% of pre-tax profit
1.3%
>95% of key agricultural ingredients sustainably sourced
33%
50% less direct carbon emissions*
‑42%
25% less carbon emissions in value chain *
‑23%
40% of total energy from clean and renewable energy sources
34%
(*) versus baseline year
Annual target = 2020 target =
Status at the end of 2017 Fully on track Partly on track Step‑up required
25Coca-Cola HBC 2017 Integrated Annual Report
Strategic R
eport
Co
rporate G
overnance
Financial Statem
entsS
wiss S
tatutory R
eporting
Supplem
entary Inform
ation

Dimitris Lois1961-2017
26 Coca-Cola HBC 2017 Integrated Annual Report

Dimitris Lois had been our leader at Coca-Cola HBC for nine years until his untimely and sudden death in 2017.
He was a willing mentor and inspiration to the whole Coca-Cola HBC family. Under Dimitris’s leadership, our Company
has gone from strength to strength.
In 2017, Dimitris launched a photo competition designed to capture and celebrate life at Coca-Cola HBC. Throughout this report, you will see photographs taken by our people within the business – a fitting
epitaph to an inspirational leader.
The safest way to win is
to deserve it
“
”
27Coca-Cola HBC 2017 Integrated Annual Report

Our people and our culture: catalysing our evolutionOur journey to evolve our Company and to make a distinct difference for a better and happier world is supported by the capabilities of our people and the strength of our culture. We seek to offer a workplace where our people can enjoy accelerated personal growth, where they are celebrated as they deliver results with speed and agility, and where diverse backgrounds and perspectives are always welcome.
Our people strategy supports the long-term success of our business by emphasising workforce engagement and growth behaviours, and developing the capabilities, leadership and talent that are necessary for the evolution of our Company. The three focus areas of this approach are:
– Maintain high levels of employee engagement and commitment to Company values and make our business more agile and innovative;
– Focus more than ever on developing skills and capabilities to take advantage of growth opportunities; and
– Have the best person in every position today and tomorrow.
Every leader is accountable for delivering in each area, as our leadership plays an essential role in enhancing the capabilities of our people and in strengthening our culture.
High levels of employee engagement We believe high employee engagement leads to best-in-class performance. Successfully engaging our people is therefore a material issue which we take seriously.
We conduct an employee engagement survey annually, and partner with Willis Towers Watson to benchmark our performance against other companies in the Coca-Cola System as well as other high-performing companies. We are pleased by our progress during 2017, with our Employee Engagement Index score increasing to 89% from 88% in the prior year. Survey participation also increased to include 97% of our people.
Our engagement results for 2017 meant not only that we remained the benchmark in the Coca-Cola System, but also that we retained a leading position in our industry and among the Willis Towers Watson benchmarking pool of high-performing companies.
CREATING AN INSPIRING WORKPLACE FOR OUR
PEOPLEWe seek to offer a workplace where our people are inspired to take advantage of opportunities to learn, grow and take charge of their careers.
2017 progress
– Improved talent pool, working on our key positions and refined employer value proposition to aid in attracting and hiring the best people
– Upgraded our revenue growth management, route-to-market and customer-centric market execution capabilities
– Employee Engagement and Values Indices increased to 89% and 91%, respectively
– New cloud-based applications deployed to digitalise learning and to simplify our processes
2018 priorities
– Continued focus to have the best person in every position
– Maintaining employee engagement and commitment to Company values
– Further developing skills and capabilities to take advantage of growth opportunities
– Making our business more agile and innovative
28 Coca-Cola HBC 2017 Integrated Annual Report
OUR STRATEGY IN ACTION: PEOPLE

The results are also considerably higher than the 80% average for FTSE 100 companies participating in this pool.
Results from this survey are reviewed, and our people may be challenged to suggest ideas for improvements or solutions to remove barriers to their performance. This level of vigilance ensures that engagement levels are sustained and business results are improved.
Living our values and making our culture more agile and innovativeEverything in our Company starts with our six core values: authenticity, excellence, learning, caring for our people, performing as one and winning with customers. These values represent the foundation of our Company culture.
We promote behaviours that embody our values, such as adopting innovative ideas with speed, taking risks and learning from both winning and failing. We have likewise identified behaviours we aim to eliminate, such as accepting the status quo or failing to respond to customer needs.
As is the case with employee engagement, we closely monitor our progress in embedding and living our values. Our Values Index captures employees’ awareness of and commitment to the values. The survey also asks employees their opinion about the relevance of the values.
Employee engagement: outperforming peer companies (%)
60
66
72
78
84
90
15 16 17 17 17 17 17 17
CC
HB
C 8
7
CC
HB
C 8
8
CC
HB
C 8
9
Hig
h-pe
rfo
rmin
g no
rm 8
8
Co
ca-C
ola
Bo
ttle
rs 8
6
Co
ca-C
ola
Sys
tem
85
FTS
E 10
0 8
0
FMC
G n
orm
81
Direct employment
29,427(2016: 31,083)
Key people in key positions
92%(2016: 87%)
Employee Engagement Index
89%(2016: 88%)
Values Index
91%(2016: 90%)
Data for FTSE 100 companies and high-performing companies represents those companies participating in Willis Towers Watson benchmarking. This does not include all FTSE 100 companies.
29Coca-Cola HBC 2017 Integrated Annual Report
Strategic R
eport
Co
rporate G
overnance
Financial Statem
entsS
wiss S
tatutory R
eporting
Supplem
entary Inform
ation

positions across all segments that have a disproportionate impact on the Company’s performance.
As of the end of 2017, 92% of our key positions are occupied by key people, compared with 87% at the end of 2016. Our focus on succession for business unit function heads also paid off as we enriched our successor pool for this critical workforce segment in 2017.
To support our efforts to recruit the best people into all positions, we refreshed our employer value proposition with customised benefits for different workforce segments. In 2018, we will finalise updates to our employer brand and digital communication to talent pools. Finally, our recruiters have received training in using new candidate selection tools.
Our ability to develop leaders internally is an important competitive advantage, ensuring cultural continuity. Career progression in our Company depends on performance against standards, potential and alignment with core values. Leadership acceleration centres have been established to support developing successors for leadership positions. They help our people understand their strengths and the areas of opportunity for their development in their current and future roles.
To accelerate the development of our people with leadership potential, we offer experiential learning to build new skills through our Fast Forward programmes. In 2017, we redesigned three Fast Forward programmes and introduced one new Fast Forward programme for a segment not previously covered. We also upgraded our management trainee programme with an aim to make it more relevant for the new generation of graduates and a more effective entry point for our leadership pipeline.
Our leadership plays an essential role in ensuring that we have the best people in every position, with every leader accountable for attracting, developing, retaining and engaging the right talent and then empowering them to execute our strategy. As our programmes and tools have been improved and streamlined, our leaders have become even more motivated and engaged.
well as the knowledge and skills of our people.
We made particularly strong progress during 2017 in bolstering our internal capabilities in revenue growth management and route-to-market capabilities. In 2018, we are poised to continue this work in even more areas to support our Company’s evolution and growth.
To match internal skills with business needs, our learning and leadership development architecture reflects the priorities of our business strategy. We have identified when learning needs to happen to be the most impactful and where development is needed, focusing on prioritised skills and performance differentiators that can accelerate the performance of all our people. In 2017, we completed an upgrade of our core leadership development programmes and we significantly improved our onboarding, induction and leadership transition programmes. These programmes are increasingly blended, using technology to engage wider communities, with line manager resources to sustain development and maximise learning from critical work experiences.
New cloud-based applications introduced in 2017 empower our people with more accessible tools for learning, onboarding and recruitment. Additional applications deployed for performance and talent management will be introduced, extending the scope of this platform, which we call HELO (hiring, empowering and learning online).
HELO is available to all our employees, democratising learning, accelerating development and helping our people fulfil their potential.
The best person in every positionHaving the best people in every position today and tomorrow is an important issue and it is the underlying principle of our decision-making processes, placing the development of our people at the centre of everything we do.
Every position contributes to our success, but every workforce segment delivers different types of results and requires different skills. We have segmented our workforce to target recruitment and development efforts, and identified key
From the results of our annual Values Index survey, we know that over 90% of our employees are aware of and committed to our values, and 88% find them relevant and useful. These numbers are components of our overall Value Index, which was 91% for 2017, a 1% improvement on the prior year.
Our performance framework links team performance and individual results, actions and skills, and aligns to our six core values. Our team performance management system allows us to bridge our strategy and its execution by aligning priorities across functions and teams and applying an iterative ‘plan, act and review’ cycle to improve output continuously. In 2017, we fully deployed this approach across our territory.
To ensure that our people balance short- and long-term objectives, in addition to assessing performance against financial objectives, we also plan and measure achievement for innovation, fostering of partnerships, people leadership, managing resources, and compliance with policies and procedures.
We continue improving and simplifying the elements of this framework to support growth and create a line of sight between our values and behaviours and our results.
Strengthening capabilities Evolving our business to offer a total beverage portfolio requires specific organisational capabilities. We are building the capabilities our business needs to grow by improving our business processes, structures and performance systems as
Every digital people conversation starts with a simple HELO.We further digitalised our workplace by introducing new cloud-based applications under the new HELO platform. This is designed to help our people to grow, learn and lead within our organisation.
30 Coca-Cola HBC 2017 Integrated Annual Report
OUR STRATEGY IN ACTION: PEOPLE CONTINUED

Talent pipeline improved
2017 2016
Key people in key positions (‘KPo’) 92% 87%Key position succession rate 0.69 0.67Key position bench strength (% of key positions with successors ready now or within the year) 57% 50%Turnover of key people 6% 5%Total turnover rate 13% 12%Management trainees 181 231Participants in Fast Forward programmes 612 902Promotion rate for Fast Forward programme participants 75% 71%Total number of employees in leadership acceleration centres 5,596 3,525% of workforce covered during annual people review 53% 46%
Championing inclusion, diversity and human rightsWe believe that fostering a workforce that reflects the diversity of our markets is essential to remaining the strategic partner of choice for all our customers. Our business benefits greatly from the diverse range of people who work for us, and we actively seek to attract and retain employees with a range of backgrounds, skills and experiences. Beyond our own footprint, we champion international human rights principles in our supply chain and expect our partners to uphold prized workplace values.
We know that to maximise everyone’s contribution, we must ensure that every employee feels respected and heard. This is why respect for individuals is at the core of our values, and why we foster behaviours that create an inclusive culture. These behaviours are enshrined in our formal Inclusion and Diversity Policy, our Code of Business Conduct and our Human Rights Policy.
At the end of 2017, 35% of management roles in our Company were held by women, a 2% increase vs 2016. We foster diversity in our talent pipeline by recruiting a balanced number of male and female management trainees. In keeping with this approach, 49% of the 181 management trainees we hired in 2017 were women.
As an example of our efforts to foster the success of women in management, we support women to develop their confidence and leadership skills. More than 1,300 women employees were invited to
participate in a webinar series called Elevate, which helps women understand how to drive their performance, impact and exposure.
Our Human Rights Policy adheres to international human rights standards and covers issues such as diversity, collective bargaining and workplace security. Regular reviews ensure that we adhere to all applicable laws and regulations, that processes are well implemented, that targets are set and reached and that reporting is timely and accurate.
We also maintain a zero-tolerance approach to breaches of our Code of Business Conduct, or of our anti-bribery policies, and regarding retaliation against individuals who in good faith report potential violations.
We have established grievance mechanisms, including an independently operated whistle-blower hotline, available in all Coca-Cola HBC countries in local languages. In 2017, we received 292 allegations, of which 98 were received through the whistle-blower hotline. For details concerning the handling of allegations received in 2017 see our website. We ran a dedicated ‘Human rights week’ campaign across all our 28 countries, as part of our annual ‘Ethics and compliance week’. Beyond these dedicated weeks, ongoing training on human rights and ethics is also provided.
We are pleased that once again, in 2017 Coca-Cola HBC received no fines for non-compliance with human rights-related laws and regulations.
UN Sustainable Development Goals 5 and 16 are supported through our activities and initiatives to champion human rights and diversity. These relate to gender equality and peace, justice and strong institutions.
Key position bench strength
57%(2016: 50%)
31Coca-Cola HBC 2017 Integrated Annual Report
Strategic R
eport
Co
rporate G
overnance
Financial Statem
entsS
wiss S
tatutory R
eporting
Supplem
entary Inform
ation

Countries have also covered emotional well-being through on-site counselling, relaxation techniques, and energy balance programmes; and social well-being with family days, Christmas events, employee bonding days and teambuilding events.
We have a well-being toolkit for countries, sharing best practice approaches for developing holistic employee well-being programmes, and in 2017 we introduced a guide to help managers recognise, prevent and manage work and personal stress in themselves and their teams. Training was also provided to our HR business partners in a ‘train the trainer’ approach to help our managers manage stress.
Five of our markets invested in employees' core energy needs to fuel their passion, resilience and excitement about work. Through the Energy Project programme our people learn how to recognise their energy-draining habits, and are encouraged to take responsibility for changing them, using various techniques to improve their physical, emotional, mental and spiritual energy. Energy level increased by 14% based on our energy audit for these business units.
Our initiatives for well-being and safety contribute to UN Sustainable Development Goals 3 and 8, which relate to good health and well-being and decent work and economic growth, respectively.
While we are pleased with our improvements, we are determined to do more to ensure employee safety and well-being. After analysing the causes of all accidents and near-misses, we launched a new behaviour-based safety programme to create a truly proactive safety culture. In 2017, we introduced this programme at four company sites in Italy, Hungary, Northern Ireland and Serbia. We will use the insights from these locations to deploy the programme in manufacturing sites and selected logistics units in 2018.
This behaviour-based programme complements safety reviews of our manufacturing sites, our safety recognition programmes and our Safety week. In 2017, we conducted full-scope safety assessments in eight manufacturing locations and we upgraded our safety recognition programmes. Activities for our 2017 Safety week provided helpful information on driving safety, manual handling, falls and slips and contractor management.
Well-being and sustaining energy during workUnder our well-being umbrella, we have developed a Health and Dependent Care Framework which includes two pillars, one related to health care and the other to dependent care. Within each pillar there are a number of initiatives from which our countries provide at least one initiative per pillar to the employees. Regarding health care, these initiatives include: employee medical and health insurance benefits; vaccination programmes, cancer screening and other preventative health measures; on-site sports and gym facilities, as well as subsidised gym memberships; and nutrition information. Regarding dependent care, these initiatives include days off for dependent care, subsidies for school activities and supplies, internships and career days. To help employees financially, as well as benefits such as pensions and savings schemes and life insurance, measures have included financial planning and literacy and a variety of partner discount programmes.
The health and safety of our people is paramountWhile health and safety has always been closely monitored as a strategic risk, we elevated it to a principal risk in 2017. This emphasises the critical importance of ensuring the safety and well-being of our employees and contractors, and the safety of others in the workplace. We know that an enabling and socially supportive work environment fosters sustained engagement. To address this, we seek to create a culture of well-being that exemplifies our values and enhances productivity and our reputation.
For the eighth consecutive year in 2017, the number of employee workplace accidents fell. In 2017, the Lost Time Accident Rate (LTAR) was 0.40, compared with 0.43 the prior year.
While we continue to improve our focus on safety, we regret that four employees and four contractors lost their lives in fatal road traffic accidents in 2017. While we have worked hard to strengthen our vehicle safety programmes, each of these tragedies was caused by other drivers.
Our Fleet Safety Policy and training programmes were improved in 2017, providing customised approaches for different types of drivers within the Group. The blend of online, classroom and on-the-road training elements is adjusted for different groups, reflecting their relative risk classification. Overall, 7,366 employees received training in these programmes in 2017.
We also continued installing collision avoidance technology in fleet vehicles, and 82.5% of the Company’s light fleet vehicles are now equipped with OEM or MobilEye collision driver warning technology to avoid collisions.
As a result of these efforts, the number of accidents per million kilometres travelled fell to 3.92 in 2017, a 7% reduction compared to 2016. This was our fifth consecutive year of improvement, resulting in a cumulative reduction of 56%.
56% improvement on fleet accidents over the last five years
0
1
2
3
4
5
6
7
8
9
10
2013 2014 2015 2016 2017
Accidents per million kilometres travelled.
32 Coca-Cola HBC 2017 Integrated Annual Report
OUR STRATEGY IN ACTION: PEOPLE CONTINUED

Number of lost time accidents (LTA>1 day)
120(13% reduction vs 2016)
Fleet accidents per million kilometres travelled
3.92(7% reduction vs 2016)
Absenteeism days due to sickness per full-time employee
1.67(2% reduction vs 2016)
Adopting innovative ideas
Awards for ‘Vegified’, ‘Impulse screens’ and ‘Illuminated bridge’ To accelerate our culture of entrepreneurship and innovation we operate an innovation platform across eight business units of the Company called Ideas for Growth. The ideation process, the tools, the programmes and the communication solutions represent the critical ingredients of the platform.
We recognise the best innovations, and in 2017 23 ideas were shortlisted and the following three won Innovation Awards:
– ‘Vegified’ – a new juice product fortified with vitamins, developed and marketed in Ireland;
– ‘Impulse screens’ – a solution to increase impulse consumption in stores, launched in Greece; and
– the ‘Illuminated bridge’ – where 5,000 glass Coke bottles formed a replica of Croatia’s biggest bridge.
The award event also looked ahead into 2018 and recognised six new bold ideas as ‘Big Bet Ideas’ including a suggestive selling competition to increase sparkling incidence in HoReCa.
Listening and acting to remove blockages to performance
‘Make My Life Easy’ – the most popular in-house social media network in 2017To achieve more with less, eliminating unnecessary blockages to performance is the guiding idea behind our ‘Make My Life Easy’ (MMLE) initiative. Among other ways of sharing and spreading MMLE ideas, we operate an in-house voluntary social media network that became the Company's most popular network in 2017 among our employees.
Network participants shared almost 100 MMLE ideas and successful practices, triggering many ‘likes’ and online discussions as well as voluntary adoption across several business units. The majority of posts were around thoughtful email communication practices, effective meeting management, improvements in workplace conditions, caring leadership behaviours and reducing complexity of how we operate and communicate. Many of the practices provided tips to leverage our tools and technology applications better, further digitalising our workplace.
Recognising deeply held values and behaviours
We reinforce values through many recognition programmes in our countries.To motivate high performance, inject entrepreneurial spirit and encourage values ambassadors, our Russian business unit has introduced ‘Premier League’, an employee recognition programme. Through an innovative platform, employees recognised their colleagues and teams exhibiting value behaviours more than 8,000 times during 2017.
In Romania our programme includes awards that recognise individuals and teams that have a high-performance mindset, inspire others by creating a positive work environment, exceed customer expectations, take action towards innovation and optimisation and are active Coke ambassadors.
The platform facilitates on-the-spot recognition, through which employees can endorse any colleague for a specific behaviour. Over 400 badges were granted on the digital platform in the second half of 2017.
UnderstandWe know that engaged employees from diverse backgrounds and with different perspectives are critical to our ability to serve consumers, customers and communities.
EvolveWe are working to develop key capabilities and a more agile, innovative culture.
EnergiseWe make substantial investments in recruiting, attracting, training and retaining talented people to ensure our long-term success.
Values in action
33Coca-Cola HBC 2017 Integrated Annual Report
Strategic R
eport
Co
rporate G
overnance
Financial Statem
entsS
wiss S
tatutory R
eporting
Supplem
entary Inform
ation

BUILDING TRUST WITH OUR
COMMUNITIESWe are a trusted partner in the communities in which
we operate because of the way we run our business and work with stakeholders to deliver value locally. This trust
gives us licence to be ever more ambitious in tackling societal challenges.
2017 progress – 21 countries launched
#YouthEmpowered, our flagship community programme
– 2,767 tonnes of waste were collected from river banks and sea shores
– 18,118 employee hours volunteered during worktime
2018 priorities – #YouthEmpowered rolled out in
all Coca-Cola HBC countries and DigiHub go-live in 19 countries
– Enhanced focus on water basins and marine protection
– Shift focus from output to measuring and reporting on the impact of key community programmes
Focus of community investment
#YouthEmpowered and otheryouth programmes: 38%Community well-being: 35%Water and environmental protection: 12%Emergency relief: 1%Other: 14%
2017 investmentsIn 2017, we invested €7.4 million in our communities, which is 2% more than 2016 and is equivalent to 1.3% of our pre-tax profit. The biggest proportion of this investment was allocated to youth development, as seen in the chart below, and more specifically to our flagship #YouthEmpowered programme (see page 35).
Alongside financial investments, we enable employees to volunteer a portion of their working week to support community programmes. This not only positively impacts our communities, but also provides learning and development opportunities for our employees and supports employee engagement and well-being.
In 2017, our employees volunteered more than 18,118 work hours in support of strategic community programmes.
While we continue to report this data, we recognise these figures represent inputs and not the effectiveness of our efforts, an issue we will be addressing during 2018.
Strategic priorities for community investmentOver the years, our community investments have evolved from philanthropic initiatives to long-term
programmes aligned to three key strategic priorities:
– Youth development
– Environmental and water stewardship
– Community well-being
In addition, we are active in emergency relief efforts, providing help in times of disaster, either directly or via our stakeholder partnerships.
34 Coca-Cola HBC 2017 Integrated Annual Report
OUR STRATEGY IN ACTION: COMMUNITIES
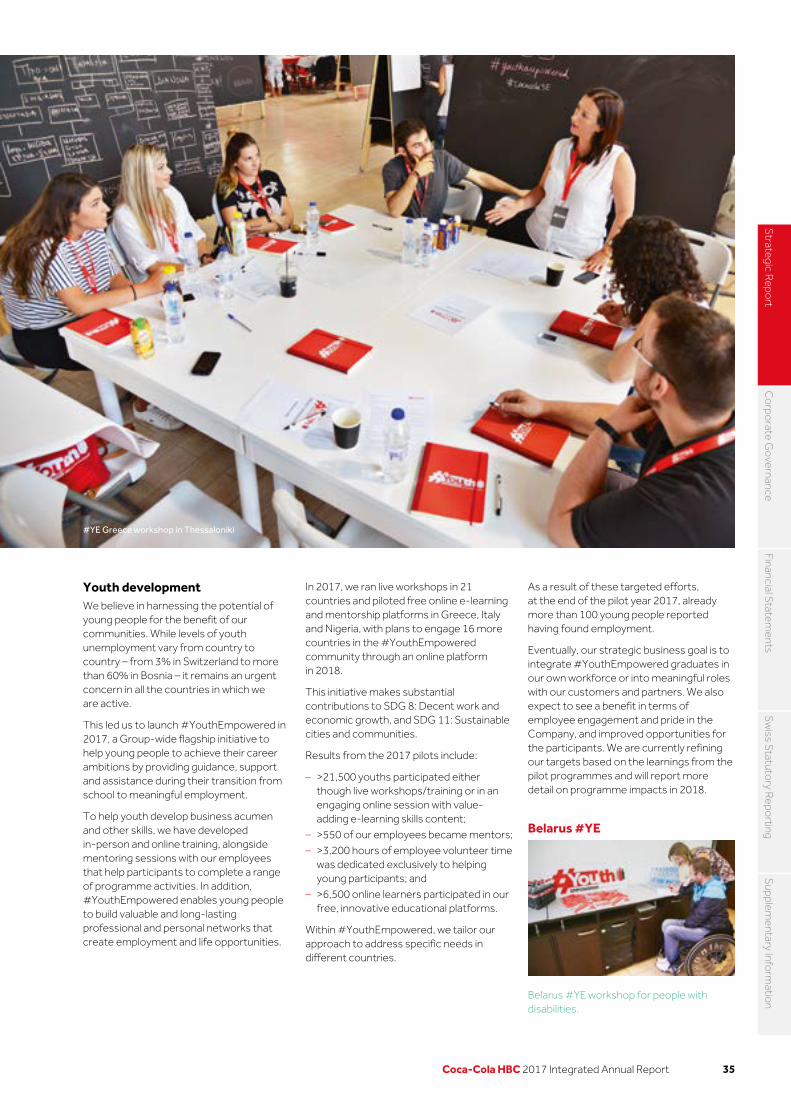
Youth developmentWe believe in harnessing the potential of young people for the benefit of our communities. While levels of youth unemployment vary from country to country – from 3% in Switzerland to more than 60% in Bosnia – it remains an urgent concern in all the countries in which we are active.
This led us to launch #YouthEmpowered in 2017, a Group-wide flagship initiative to help young people to achieve their career ambitions by providing guidance, support and assistance during their transition from school to meaningful employment.
To help youth develop business acumen and other skills, we have developed in-person and online training, alongside mentoring sessions with our employees that help participants to complete a range of programme activities. In addition, #YouthEmpowered enables young people to build valuable and long-lasting professional and personal networks that create employment and life opportunities.
In 2017, we ran live workshops in 21 countries and piloted free online e-learning and mentorship platforms in Greece, Italy and Nigeria, with plans to engage 16 more countries in the #YouthEmpowered community through an online platform in 2018.
This initiative makes substantial contributions to SDG 8: Decent work and economic growth, and SDG 11: Sustainable cities and communities.
Results from the 2017 pilots include:
– >21,500 youths participated either though live workshops/training or in an engaging online session with value-adding e-learning skills content;
– >550 of our employees became mentors;
– >3,200 hours of employee volunteer time was dedicated exclusively to helping young participants; and
– >6,500 online learners participated in our free, innovative educational platforms.
Within #YouthEmpowered, we tailor our approach to address specific needs in different countries.
As a result of these targeted efforts, at the end of the pilot year 2017, already more than 100 young people reported having found employment.
Eventually, our strategic business goal is to integrate #YouthEmpowered graduates in our own workforce or into meaningful roles with our customers and partners. We also expect to see a benefit in terms of employee engagement and pride in the Company, and improved opportunities for the participants. We are currently refining our targets based on the learnings from the pilot programmes and will report more detail on programme impacts in 2018.
#YE Greece workshop in Thessaloniki
Belarus #YE workshop for people with disabilities.
Belarus #YE
35Coca-Cola HBC 2017 Integrated Annual Report
Strategic R
eport
Co
rporate G
overnance
Financial Statem
entsS
wiss S
tatutory R
eporting
Supplem
entary Inform
ation

Environmental protection and water stewardshipOur focus on natural resources follows a two-pronged approach. First, we are driving improvements in eco-efficiency within our operations, e.g. minimising our water consumption and replenishing the water we use in our manufacturing processes. Second, we prioritise support for community water stewardship programmes to protect water sources, wetlands, biodiversity and ecological processes.
Our 2020 commitment is to improve our water intensity ratio by 30% compared to our 2010 baseline and we are on track to achieve this. In 2017, the level of reduction reached 21% vs 2010. Our Top 10 Water Savers programme is mandatory for all our plants, encouraging water saving developments and initiatives throughout our facilities. The current implementation rate is 72.3% and in addition we implemented more than 110 water saving projects that saved 1.5 million cubic metres of water in our plants. At the end of 2017, we achieved 26 Gold certificates under the European Water Stewardship Standard and we have committed to certify 100% of our plants by 2020 to the European Water Stewardship Standard or Alliance for Water Stewardship. We also consider water used in agriculture as part of our supplier evaluation assessments.
By implementing water stewardship programmes at the community level, we help to preserve the natural habitat of key water basins and access to clean water. Moreover, we invest in programmes to prevent environmental damage from packaging waste and climate change. All activities are done in partnership with or after engaging local water users, authorities and other key stakeholders in the community.
We also work together with environmental ministries, and intergovernmental and civil organisations, to preserve and protect important ecosystems.
We invested €1 million in environmental community programmes during 2017.
With the dedicated support of employee volunteers, in 2017 we collected 2,767 tonnes of waste at river and sea shores and cleaned more than 1,950 kilometres of river banks and beaches. During the same time period, we have also contributed to reforestation by planting more than 109,696 trees in over 203,400 square metres of land.
Our contributions in this area aid global progress toward SDG 6: Clean water and sanitation, and SDG 13: Climate action.
During 2017, we have also further consolidated our environmental community initiatives. Consequently, our future efforts will be more clearly focused on water and environmental protection.
Community well-beingAs well as being committed to reducing the amount of sugar in our products by 2020 (see Consumers section), we continue to support initiatives across our 28 countries to improve community well-being and health. These encourage physical activity and include the installation of active zones, walking trails and paths, and support for sports events and social gatherings. Many of the programmes are implemented in partnership with The Coca-Cola Company.
These programmes contribute to SDG 3: Good health and well-being, and SDG 11: Sustainable cities and communities. As our business and product portfolio evolves, we expect that more of our impact on well-being will come directly from new products that support healthy lifestyles.
Serbia #YE launch: Aleksandar Ruzevic, GM of CCH Serbia, Aleksandar Vulin, Minister of Labour, Employment and Social Policy of Serbia (from April 2014 to June 2017), Zoran Martinović, Director of the National Employment Service and Ninoslav Erić, President of the Cuprija municipality, one of the 14 municipalities we collaborated with in Serbia.
Nigeria #YE launch in Port Harcourt with the River State Commissioner for Employment and Empowerment opening the event.
FYROM: five new free active zones installed in Skopje.
Serbia #YE
Nigeria #YE
36 Coca-Cola HBC 2017 Integrated Annual Report
OUR STRATEGY IN ACTION: COMMUNITIES CONTINUED

UnderstandBuilding and maintaining trust involves understanding what our stakeholders value.
EvolveWhile our approach is consistently strategic, our community investment reflects the evolving needs of the communities in which we work.
EnergiseOur ambitious 2020 commitments provide internal momentum and allow us to make substantial contributions to global progress towards the UN’s Sustainable Development Goals.
Greece is projected to be among the most water-stressed countries by 2040, with water scarcity a particular concern on the Greek islands.
The Mission Water programme has promoted water conservation, primarily through rainwater harvesting on dry islands, since 2006. The project involves a partnership between the Coca-Cola System in Greece , Global Water Partnership – Mediterranean (‘GWP- Med’) and authorities. with funding from The Coca-Cola Foundation since 2011.
In 2017, the programme worked with local authorities to install three new water storage tanks on Kythera island, which was suffering a water shortage crisis, increasing the municipal water supply's volume.
Kythera is the 31st island to be aided by the programme.
In Armenia, we have joined forces with the United States Agency for International Development (USAID) to help communities denied reliable access to water as a result of uncontrolled water use by fish farms.
Our joint project, the Advanced Science and Partnerships for Integrated Resource Development (ASPIRED) project, implemented an initiative during 2017 to reduce groundwater use in the Ararat Valley. Water from fisheries, which was
previously dumped into the drainage network, is now used for irrigating farmland. This has benefited the Hayanist community, where workforce migration decreased by 50-60% because the Hayanist are able to cultivate land again.
As a result, 1.1 million cubic metres of water was saved, 11 times the amount used annually by our Armenian manufacturing site.
Stakeholder partnershipsWe have a long record of delivering meaningful community programmes by investing creativity, innovation and resources and ensuring that our efforts align with our own strategic interests. We carefully measure the value that we add and are constantly looking for opportunities to partner with local stakeholders to combine our expertise and maximise this value. This also contributes to SDG 17: Partnerships.
In 2017, this led us to work with more than 300 non-governmental organisations and non-trade partners in 28 countries, including the International Federation of the Red Cross, the International Commission for the Preservation of the Danube River, World Wide Fund for Nature, Junior Achievement, Teach for All and the Global Water Partnership.
Greece – Mission Water
Armenia – ASPIRED project
Looking aheadWe will continue the roll-out of #YouthEmpowered in 2018, with the aim of reaching all our markets by year end.
We are also excited to launch the #YouthEmpowered DigiHub, our innovative online educational and mentorship platform, in 19 countries in 2018.
We will continue driving water and environmental protection through specific water stewardship programmes to preserve water sources and wetlands.
Overall, our approach has become more strategic and we are also applying better metrics to measure and manage the impacts of our key community programmes, with focus on both youth development and environmental and water stewardship. We will report on our progress in these areas in our 2018 Integrated Annual Report.
37Coca-Cola HBC 2017 Integrated Annual Report
Strategic R
eport
Co
rporate G
overnance
Financial Statem
entsS
wiss S
tatutory R
eporting
Supplem
entary Inform
ation

An evolving portfolio for a healthier worldOur focus is on providing healthier new options across our portfolio of sparkling and still beverages, and emphasising low or no-sugar choices to our consumers. These efforts are helping us to maintain our strength in sparkling beverages and we also have strong foundations on which to grow in the stills category, since 30% of our revenues are from still drinks, the highest proportion amongst the listed Coca-Cola bottlers.
On average people in our markets drink six beverages each day, and although our share in sparkling soft drinks is at an average of 43% across our markets, our share of total beverage consumption is still low at around 5%, which offers huge potential for growth. Our evolving portfolio equips us to better serve consumers at every occasion in which they want to enjoy a drink, which, when combined with our ability to get this portfolio into the hands of our end consumer, allows us opportunities to better serve our consumers and grow our business sustainably.
Coca-Cola HBC has committed, in partnership with the Union of European Soft Drinks Associations (UNESDA), to reduce sugar in sparkling soft drinks by 10% between 2015 and 2020 across the EU and Switzerland. With more than 30 years of experience in launching low- and no-calorie beverages, we are on track to achieve this goal with a reduction of nearly 5% in 2017 compared to 2016. We achieved our sugar reduction target in 2017 through our portfolio evolution towards no-sugar variants and reformulations with lower sugar content. For that purpose, we are accelerating the rollout of our pipeline across all innovation pillars, i.e. reformulation of existing products, more zero-sugar formulations with improved taste, new products with low or no sugar and the development of small packages.
We are applying a holistic approach to the reduction of sugar which considers sweetness taste profiles, the impact on appearance, mouthfeel and taste and advanced sensory knowledge. Our aim is to produce drinks with fewer calories, that consumers love. We believe these efforts support progress toward several of the Sustainable Development Goals (SDGs) adopted by the UN, including SDG 3: Good health and well-being, SDG 9: Industry innovation and infrastructure, and SDG 12: Responsible consumption and production.
INNOVATING OUR PORTFOLIO FOR OUR
CONSUMERSPeople’s tastes and lifestyles are changing
and with that comes a desire for different drink choices.
2018 priorities – 2018 will see more launches from
Coca-Cola HBC than at any time in recent history, both within the existing portfolio and in new categories
2017 progress – Excellent growth from our low- and
no-sugar portfolio; with positive customer reactions to both reformulations and no-sugar variants
– Adult-focused flavours and brands saw strong growth
– Second year of growth above 20% in energy drinks
– Growth, with a focus on value in stills.
– Ongoing progress on creating a nimble organisation that can manage a faster pace of launches
38 Coca-Cola HBC 2017 Integrated Annual Report
OUR STRATEGY IN ACTION: CONSUMERS

We support, along with The Coca-Cola Company, the recommendation of the World Health Organization and other health authorities that intake of added sugar should be no more than 10% of total energy or calories consumed per day.
Trademark Coca-Cola brandsTo highlight our evolving approach to our brands and to build awareness of low- and no-sugar drinks, we launched the ‘One Brand’ marketing strategy in Trademark Coca-Cola in collaboration with The Coca-Cola Company. With ‘One Brand’ we offer our consumers a Coca-Cola with a range of choices: Coke Zero; Coca-Cola Light; or Coca-Cola.
As the category leader, we believe it is our responsibility to actively shape consumer choice towards lower calorie options. In order to achieve this we have taken the decision to make the sugar-free variants of Coke the focal point in marketing efforts and are dedicating a greater proportion of shelf space to sugar-free Coke variants than their current share of the mix, ensuring increased prominence and availability of our sugar-free Coke drinks.
Fanta and Sprite In Fanta, a combination of ongoing innovation and strong market activation delivered growth. New flavour launches for Fanta, including Dragonfruit, Shokata and Raspberry, helped to keep excitement in the brand high. Sprite Cucumber was launched in Russia early in 2017, and strong execution of the launch and fast distribution supported double-digit year-on-year growth for Sprite in Russia.
Fanta and Sprite are also benefiting from innovative reformulations to reduce their sugar content. Sprite Fresh contains half the sugar of the original version, while Fanta Orange contains 30% less sugar than regular Fanta. We began the rollout of Sprite Fresh in 2017 and will roll out the reformulated Fanta Orange in 2018. We are also launching no-calorie Fanta Lemon in a number of our markets in 2018.
We initiated a pilot of this approach at the start of 2017 in Poland and Romania with excellent results. Sales grew, versus a control group, for both Coke Zero and for Trademark Coca-Cola overall. We subsequently rolled out ‘One Brand’ throughout our markets. In addition, we completed the relaunch of Coke Zero by February 2017 and launched new light variants such as Coca-Cola Zero with Lemon, which achieved 88% distribution within 20 weeks of launch. This strong execution supported growth for Trademark Coke variants exceeding that of the sparkling drinks category overall in our markets in 2017 (2.7% and 2.3% respectively). These results were aided by the 22% growth in sales of Coke Zero during the year.
39Coca-Cola HBC 2017 Integrated Annual Report
Strategic R
eport
Co
rporate G
overnance
Financial Statem
entsS
wiss S
tatutory R
eporting
Supplem
entary Inform
ation

Driving the water and juice categories while focusing on value creationWater represents 30% of the underlying non-alcoholic beverage market value across our regions and is expected to drive almost a quarter of the non-alcoholic beverage incremental value growth to 2020. The fastest growth is expected to be seen in the premium segment including water with functional benefits or flavours. We are currently under-indexed to water with under 20% of our volumes coming from the category.
We intend to grow our water business in line with two pillars. The first is to grow our existing mainstream brands while enriching the portfolio with flavoured water, and the second is to enter new premium segments.
To meet growing consumer interest in the juice category we are evolving our offering to include more innovative flavours and no-added-sugar varieties, while working to grow value in excess of volume. In Russia, for example, we launched three unique flavour mixes reflecting local heritage. The new flavours were marketed as a premium offering within the mainstream Dobriy brand and sold only in a one-litre size to improve pack mix.
Growth in energyEnergy remains a small category for us, but one that is growing fast and with attractive revenue per case. For the second year in a row our sales in the energy category grew over 20%. We aim to sustain our growth in the energy segment with a dual brand strategy focused on Burn and Monster. With the launch of Monster in Nigeria in 2017, the brand is now available in all but three of our countries.
Growing adult opportunityAs the overall population in Europe is getting older, there is greater demand for sophisticated flavour profiles and for adult sparkling beverages. Two of our brands targeted to this consumer segment are Schweppes and Kinley. For Schweppes, our premiumisation strategy, combined with a strong launch of Schweppes Pomegranate during the year, helped to deliver mid single-digit growth for the brand. We are excited about the launch of Coca-Cola’s Royal Bliss brand in a few of our countries in 2018. Royal Bliss is a line of premium mixers, with complex and nuanced flavour profiles, which will be available exclusively in hotels, restaurants and cafes.
Energy drinks growth (%)
Proportion of lights within the sparkling category* (%)
0
10
20
30
40
50
2016 2017
2129
2541
Organic MonsterEnergy *Lights here refers to Coke Light, Coke Zero, Coke Life, Sprite Zero and Fanta Zero
0
5
10
15
20
25
2014 2015 2016 2017
Emerging Developing Established CCH total
9 9
2
310 10
21
221010
3
2312
4
11
20
40 Coca-Cola HBC 2017 Integrated Annual Report
OUR STRATEGY IN ACTION: CONSUMERS CONTINUED

In Ireland we launched Vegified, a vegetable and fruit drink fortified with vitamins which was offered at an affordable price in single-serve packs intended to help busy people who are trying to achieve a healthier lifestyle.
In addition to our focus on organic growth and innovation, we will continue to look at bolt-on M&A in the juice and water categories. Where we find strong local and regional brands that fit well with our footprint, we will seek to add these to our portfolio.
Satisfying demand: consumption occasionsTo meet consumer demand we need to understand what drives someone’s desire for a beverage at different times throughout the day.
We segment possible consumption opportunities into occasions. For each occasion, we aim to provide every consumer with the perfect brand in the right package, from the right channel and at the right price. We call this process Occasion, Brand, Pack, Price, Channel, or OBPPC, and it helps us to construct our business plans on a country and brand level.
We seek to capture the opportunities in these occasions, with The Coca-Cola Company, through co-ordinated campaigns including television and traditional media, in-store displays, sampling and social media.
Meals and socialising occasions We prioritise the largest and most valuable occasions for beverages: meals and socialising. At-home consumption is the largest opportunity across our markets, accounting for 54% of the value share within the non-alcoholic ready-to-drink market and as such it will always be a priority for our business.
Away-from-home consumption represents an interesting growth opportunity, as it delivers a higher revenue per case than the average for the Group. We seek to capture away-from-home consumption by focusing on increasing our sales in hotels, restaurants and cafes and offering single-serve packages which can earn two to three times the revenue per case of multi-serve packages and beverages bought for future consumption.
Engaging with consumers digitallyIn order to remain relevant, we also consider changes in the way consumers use technology. Digitalisation presents new opportunities to communicate with consumers and new information about consumption.
Connected coolers offer opportunities for more direct communication with our consumers. In 2017, with The Coca-Cola Company, we launched a new consumer app called WOAH, which stands for ‘Where only awesome happens’, in eight of our countries.
The WOAH app delivers engaging content from The Coca-Cola Company and helps us to communicate directly to consumers. Once downloaded, the WOAH app can serve push notifications on promotions from a nearby, digitally connected cooler.
Connectivity also helps us position coolers, by providing data on door openings and how coolers are used. In addition, they can gain our sales force four days of selling time a year. Less than 10% of our 1.4 million coolers are currently digitally connected, but we aim to achieve 100% connectivity by 2022.
Long-term success To ensure that our business continues to deliver what consumers need and want we prioritise successfully growing our revenues ahead of volumes and volumes ahead of calories, ensuring product quality and marketing our products responsibly.
Revenue growth managementWe aim to grow transactions and revenue faster than volume since this will both create a more sustainable business and improve our profitability. Coca-Cola HBC, in partnership with The Coca-Cola Company, has developed a comprehensive approach to achieve this goal of revenue growth management which we call RGM 2.0. RGM 2.0 puts in place a 10-step framework to address consumers, shoppers and customers together. After considerable work in conjunction with external consultants we have now implemented a set of strategies, specifically targeted to each market, intended to maximise value growth. We are developing the relevant skills, capabilities and growth mindset in our teams to ensure this initiative is sustainable. We started this programme in Q3 of 2016 in Nigeria and Russia and in 2017 we expanded it into our other largest markets; we aim to complete the full rollout of these initiatives within 2018.
22.4%Growth in Coke Zero in 2017
12Number of product reformulations or conversion to no-sugar formulas planned for 2018
Share of single-serve packs in volume (%)
0
10
20
30
40
50
WaterTotal
2013 2014 2015 2016 2017
39.2
33.3
39.9
35.0
40.3
34.5
41.7
36.6
38.142
.0
41Coca-Cola HBC 2017 Integrated Annual Report
Strategic R
eport
Co
rporate G
overnance
Financial Statem
entsS
wiss S
tatutory R
eporting
Supplem
entary Inform
ation

We comply with The Coca-Cola Company’s Global Responsible Marketing Policy and are signatories of the UNESDA commitments. This compliance is checked regularly by external third-party auditors contracted by UNESDA.
As part of UNESDA’s school sales commitment, we do not offer our products for sale in primary schools. In addition, we will ensure from 2018 onwards that only no- and low-calorie drinks are offered in secondary schools as a complement to water, which remains the primary drink available for schoolchildren and adolescents.
We are not only complying with the letter of these policies; we strive to follow the spirit of them as well. Therefore, we do not place advertising in media where the target audience includes a substantial portion of children. This applies to all media including television shows, print media, websites, social media, movies, SMS/email marketing, animation, third-party characters, celebrities/games/contests, branded toys/merchandise, talent selection, point of sale, and merchandise items. Moreover, we do not design our marketing communications in a way that directly appeals to children under 12.
Further, the number of trade quality issues declined by 58% and business losses from trade quality issues were reduced by 84% in 2017 compared to 2016. Overall consumer complaints in 2017 remained at a low level, standing at 20 per 100 million containers sold. This is, however, higher than our target of 17. While the number of consumer complaints decreased by 4% in the Emerging and Developing segments, we saw a 7% increase in the Established segment, mainly due to elevated social media activities related to product taste and carbonation.
The continued low rate of consumer complaints shows that our beverages are of high quality and people trust our products and brands. Better product quality and food safety also contribute to SDG 3: Good health and well-being, and SDG 12: Responsible consumption and production.
Responsible marketingMarketing our brands responsibly but effectively is of great importance to our business. Offering a wide range of products and providing clear and transparent information is at the centre of our approach.
In our Emerging segment the likelihood of currency depreciation means that we need to balance affordability for our consumers with required price increases to offset inflation and a weaker local currency. The flexibility of our business allows us to adjust pack sizes, list prices and promotions to serve our consumers in ways that protect the viability of our business.
Product quality and integrity Product quality, safety and integrity are necessary to build consumer trust, maintain market leadership and generate sales volumes and revenues. Product integrity for us means offering the highest quality beverages that satisfy customers’ and consumers’ expectations in every aspect. In addition to product functionality, quality, safety, taste and design, integrity also includes intangibles such as brand equity. We have zero tolerance for quality and food safety non-compliance.
Therefore, in 2017 we continued to collaborate with key ingredient and packaging suppliers. As a result of this product quality culture development and governance processes, the freshness of our soft drinks improved by 12% in 2017 compared to 2016.
An example of our ‘One Brand’ strategy at work. This marketing effort presents Coke Regular, Zero and Light under one brand and emphasises the no-sugar options.
42 Coca-Cola HBC 2017 Integrated Annual Report
OUR STRATEGY IN ACTION: CONSUMERS CONTINUED
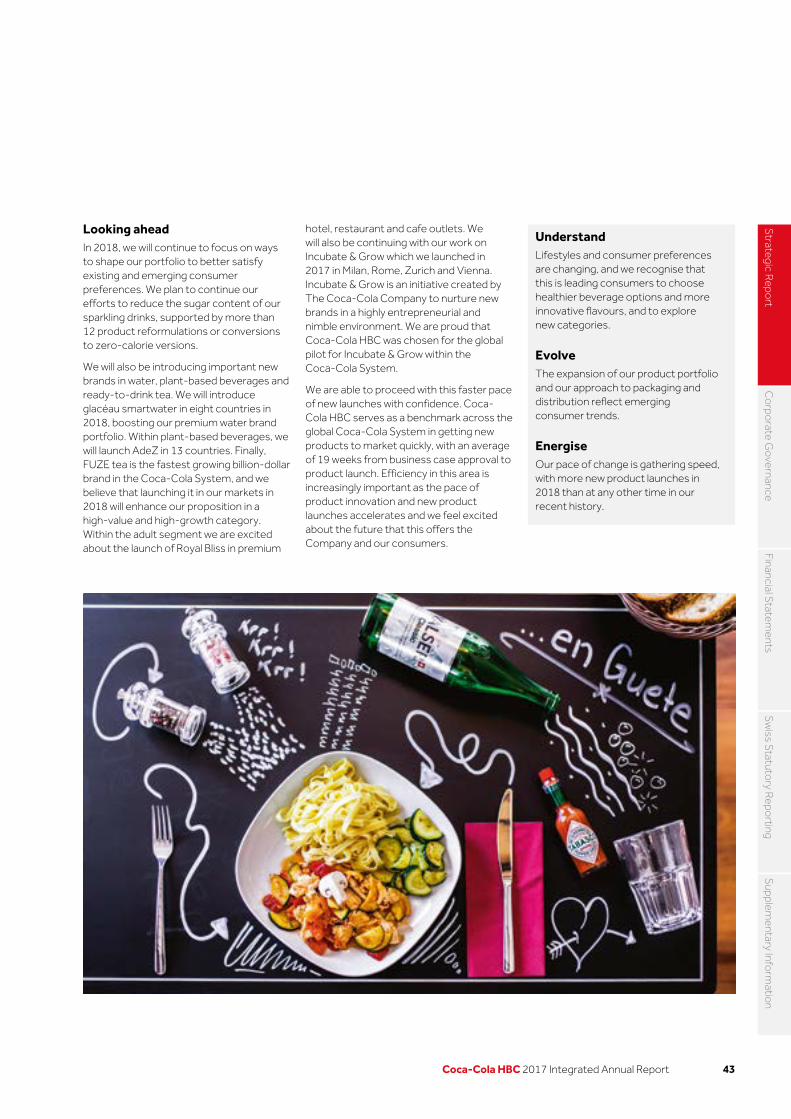
Looking aheadIn 2018, we will continue to focus on ways to shape our portfolio to better satisfy existing and emerging consumer preferences. We plan to continue our efforts to reduce the sugar content of our sparkling drinks, supported by more than 12 product reformulations or conversions to zero-calorie versions.
We will also be introducing important new brands in water, plant-based beverages and ready-to-drink tea. We will introduce glacéau smartwater in eight countries in 2018, boosting our premium water brand portfolio. Within plant-based beverages, we will launch AdeZ in 13 countries. Finally, FUZE tea is the fastest growing billion-dollar brand in the Coca-Cola System, and we believe that launching it in our markets in 2018 will enhance our proposition in a high-value and high-growth category. Within the adult segment we are excited about the launch of Royal Bliss in premium
hotel, restaurant and cafe outlets. We will also be continuing with our work on Incubate & Grow which we launched in 2017 in Milan, Rome, Zurich and Vienna. Incubate & Grow is an initiative created by The Coca-Cola Company to nurture new brands in a highly entrepreneurial and nimble environment. We are proud that Coca-Cola HBC was chosen for the global pilot for Incubate & Grow within the Coca-Cola System.
We are able to proceed with this faster pace of new launches with confidence. Coca-Cola HBC serves as a benchmark across the global Coca-Cola System in getting new products to market quickly, with an average of 19 weeks from business case approval to product launch. Efficiency in this area is increasingly important as the pace of product innovation and new product launches accelerates and we feel excited about the future that this offers the Company and our consumers.
UnderstandLifestyles and consumer preferences are changing, and we recognise that this is leading consumers to choose healthier beverage options and more innovative flavours, and to explore new categories.
Evolve The expansion of our product portfolio and our approach to packaging and distribution reflect emerging consumer trends.
EnergiseOur pace of change is gathering speed, with more new product launches in 2018 than at any other time in our recent history.
43Coca-Cola HBC 2017 Integrated Annual Report
Strategic R
eport
Co
rporate G
overnance
Financial Statem
entsS
wiss S
tatutory R
eporting
Supplem
entary Inform
ation

Customer preference: customer partnership and shared growth Changing lifestyles and new technologies are impacting purchasing behaviour and preferences in retail formats, causing significant change in the retail landscape. Successfully adapting to these market changes, and helping our customers to seize new opportunities, boosts the resilience and profitability of our business and our customers' businesses. With all of our customers, the key objectives remain the same: excellent customer service and in-store execution, to create joint value for long-term success.
Creating satisfaction and economic benefit Winning with customers is one of our six core values, and we work hard to build strong customer relationships to create shared success. We monitor customer satisfaction by commissioning an annual survey of more than 15,000 customers, comparing ourselves to other beverage suppliers including suppliers of beer and dairy products. In 2017, more than half of our customers, 59.8%, said we exceeded their expectations, an increase of 3.3% compared to 2016.
In addition, 94.2% of customers reported that the Company either met or exceeded their expectations.
The feedback we receive from our customers helps direct priorities for training and development, indicating where we need to improve skills and capabilities. We encourage customers to disclose the detail of their individual responses so that we can build a specific improvement plan tailored to their needs. In Italy in 2017, we managed to get nearly 100% of the customers that we engaged with to provide detailed feedback, an improvement from 41% in 2016. We believe this increase reflects our responsiveness to feedback and the value customers find in bespoke improvement plans.
Improving product accessibilityTo ensure that customers can best serve consumers, we tailor our customer relationships so that we can provide each customer with the right level of sales force coverage and access to our distribution networks.
Due to the dynamism of the retail environment, outlets open and close over time.
EVOLVING WITH THE CHANGING NEEDS OF OUR
CUSTOMERSChanging lifestyles and new technologies are
impacting purchasing behaviour and preferences in retail formats, causing significant change
in the retail landscape.
2018 priorities – Rolling out our new route-to-market
initiatives across all of our countries
– Improving our e-commerce capabilities
– Continuing the work and investments that make us a responsible supplier
2017 progress – Further improvement in customer
satisfaction
– Embedding of our new route-to-market initiatives across our five largest countries, resulting in an improvement in both depth and breadth of coverage
– Ongoing improvement in in-store execution
– Seizing of e-commerce opportunities by serving new and existing customers online
44 Coca-Cola HBC 2017 Integrated Annual Report
OUR STRATEGY IN ACTION: CUSTOMERS

We have to assess relevant changes in the retail universe and incorporate these appropriately into our route-to-market solutions. By performing a complete assessment of the outlet universe, we capture incremental growth opportunities, both horizontally through new outlets and vertically through improved service to existing customers. This project is called the Every Dealer Survey (EDS), and it allows us to improve by adjusting the structure of our sales force and ensuring that our capabilities address the changing needs of our customers. Our most recent assessment of outlets identified a number of specific opportunities which we then invested in in order to improve. One example was the creation of dedicated teams exclusively serving hotels, restaurants and cafes; another was the decision to make hunting for new outlets a priority and an ongoing project. Additionally, during 2017, we successfully embedded new initiatives in the routes to market in five of our largest countries. In Poland, for example, we expanded the number of outlets carrying our full portfolio from 1,800 to 7,000, while in Russia we put in place a dedicated team to serve top-end bars, cafes and restaurants, and in Switzerland we expanded home delivery of our product portfolio.
Ensuring excellent execution in storeGetting the basics right is critical to building strong relationships with our customers. For Coca-Cola HBC, this means that we seek to always deliver in full, on time and accurately invoiced, an internal metric we monitor and call by the acronym DIFOTAI. We track our success in achieving this each day, for each customer, and constantly work to improve our performance. Our overall DIFOTAI score for 2017 was 97.2%, a small decline from the result achieved in 2016 of 97.9%.
To ensure that the right product is presented in the right location, we track real-time execution in our customers’ stores and use that data to evaluate and improve in-store operations. We use an approach called Right Execution Daily, referred to by the acronym RED, which measures aspects required for strong execution and awards a score to each customer, channel and, ultimately, country on that basis. These scores reflect our execution level relative to our internal targets, and we use all this data to continually improve.
In our experience, using this approach, we have found that for every percentage point of improvement in the RED score, our sales volume increases between 0.25% and 1%. The data collected for RED is also used by our business developers to pursue opportunities for growth and they are able to adjust our in-store operations to improve performance. In 2017 our RED score increased by 5.8%, helped by strong performance in Nigeria. A significant percentage of our customer base is included in this data collection and we continue to expand coverage, creating a positive feedback loop for improvement.
Creating joint valueWe want to create shared value and help our customers grow their overall beverage sales. One way that we do this is by sharing our expertise to enhance the shopping experience, extending our service to customers beyond just sparkling beverages. With a supermarket chain in Romania, for example, we helped to improve shopping experiences and drive transactions by building on the ‘beverage with meals’ experience in their in-store restaurant and outside barbecue area.
45Coca-Cola HBC 2017 Integrated Annual Report
Strategic R
eport
Co
rporate G
overnance
Financial Statem
entsS
wiss S
tatutory R
eporting
Supplem
entary Inform
ation

As chilled single-serve packs become more important to meet the needs of busy consumers, and help to drive revenue per case and profitability, cold drinks equipment (CDE) is an essential part of our engagement with customers and our consumer experience.
At approximately 39%, refrigeration represents a significant part of our carbon emissions footprint. A major focus for improvement has been phasing out HFC refrigerants since 2015. Instead, all new equipment placed in the market is eco-friendly. These new coolers use either CO or HC (hydrocarbon) as refrigerant agents, which have zero global warming potential, and are also 57% more energy-efficient than conventional coolers.
In 2017, we introduced a total of 71,786 eco-coolers across our markets, helping our customers save 735.2 million kWh of electricity, and contributing 16% of our total electricity savings, 26% more than in 2016. In total, eco-coolers currently account for 5% of our 1.4 million units.
At the same time, we continue to optimise our cooler portfolio in order to improve our spend and reduce our energy consumption. Within five years, we have reduced the number of cooler types from 33 to 10.
At the same time, we supported strong execution and product placement within the store aisles. In another example, we collaborated with a leading operator of petrol station convenience stores, developing a category vision concept for this channel to offer fast, easy, cold beverage solutions to the busy consumers this customer serves. The project started with a pilot in Hungary, and we subsequently became a strategic partner for the customer's outlets in six countries.
Seizing opportunities in single-serve packagesThe rising trend for smaller and more frequent shopping trips, and consumer decisions to reduce sugar content through buying smaller packages, has increased the importance of chilled availability for single-serve packs consumed ‘on the go’.
In Switzerland, we worked with one international customer to optimise sales of chilled single-serve drinks located beside the customer’s prepared foods by rolling out open-fronted coolers in two-thirds of their stores. The project successfully increased the number of shoppers adding a non-alcoholic beverage to their shopping basket. Careful adjustments to store layout can be extremely impactful for customers.
Our people are highly engaged (%)
Met or exceeded customer expectations
94.2%Exceeded customer expectations
59.8%
60
70
80
90
17 17 17 17 17 17 17
FTS
E 10
0 In
dex
80
FM
CG
no
rm 8
1
Co
ca-C
ola
Sys
tem
Inde
x 8
5
Co
ca-C
ola
bo
ttle
rs In
dex
86
Hig
h-pe
rfo
rmin
g n
orm
88
CC
HB
C In
dex
89
CC
HB
C c
om
mer
cial
dep
t 89
Right Execution Daily (RED)An approach to executing in-store with excellence
0
8
16
24
32
40
2013 2014 2015 2016 2017
520
1425
1627
1627 27
17
CCH countries with RED frameworkCountries with >35% numerical coverage
Expanding the coverage base
46 Coca-Cola HBC 2017 Integrated Annual Report
OUR STRATEGY IN ACTION: CUSTOMERS CONTINUED

In addition, we foster the innovation of connected coolers, using internet of things technologies to optimise the energy consumption to the actual time of use. In 2018, the ICOOL range of coolers will use a lower charge of HC refrigerant gas, while keeping the energy consumption stable, if not lowering it.
Improving performance in hotels, restaurants and cafes Our expectation is that sales through hotels, restaurants and cafes will grow faster than our overall sales growth in the near term. This reflects the increasing trend for people to prioritise experiences and is supported by the economic recovery in our markets. To support sales in this channel we are intent on sharing best practice within Coca-Cola HBC to improve our performance. Within the Group there are countries with excellent performance in the HoReCa channel and in 2017 our sales teams met in Croatia to benefit from the Croatian team’s expertise and to further improve the Group’s performance in this channel.
UnderstandWe strive to understand our customers so that we can provide a tailored solution that best suits their needs.
EvolveIn a constantly changing retail landscape, we maintain strong customer satisfaction by adapting to challenges and emerging trends.
EnergiseWe help our customers seize new opportunities and we grow with them, creating joint value for long-term success.
Growth in e-commerce The value of e-commerce in our markets has doubled over the last five years and is expected to double again over the next five, making the e-commerce channel one of our most dynamic.
E-commerce is still a small proportion of our overall revenue, but we are clear on its importance for the future, and we are working with new and existing customers to capture growth through this channel.
Online shopping has brought us new customers, including online takeaway food businesses. We help them to increase the value of each transaction by including a beverage with every meal. We achieved this objective with one online takeaway food business in Poland, for example, by developing combination meals (a meal and a beverage for a single price point) and improving product displays in online menus. This resulted in volume growth of 60% with this online takeaway food business, with distribution of our full portfolio increasing by 20%.
We continue to invest to improve our ability to serve online shoppers, creating the fundamentals to be ready for rapid growth. In 2017, we piloted a platform to manage our commercial digital assets, including information on how to best present our brands in online stores.
We have also developed eRED, a measurement system to score execution in online stores. eRED allows us to check that our full portfolio is available and presented with the right quality standards and messaging. This system also creates an improvement plan for each online retailer to drive incremental transactions.
Looking aheadIn 2018, we expect to make further progress in rolling out new route-to-market initiatives, improving our e-commerce capabilities and continuing to be a strong partner for our customers and a responsible supplier.
By the end of 2018, we expect to have rolled out the newly identified route-to-market initiatives in all our countries. We believe that e-commerce channels will continue to gain momentum and building our internal capabilities within this channel is ongoing.
47Coca-Cola HBC 2017 Integrated Annual Report
Strategic R
eport
Co
rporate G
overnance
Financial Statem
entsS
wiss S
tatutory R
eporting
Supplem
entary Inform
ation
To drive profitability, our focus remains on those areas we can influence: optimisation of our production and logistics base, our operating cost base and our cash conversion. Careful management of all inputs to our business includes natural resources. Efforts to reduce costs are therefore directly linked to streamlined packaging and reduced water and energy use.
Infrastructure optimisationThe drive to optimise and develop our infrastructure to manage growth and to produce a broader beverage portfolio continued in 2017. Strong focus on managing and modernising cost-efficient mega-plants that can effectively serve a country or region remains our priority. In addition, we added new capabilities in selected sites during 2017 to support the expansion of our beverage portfolio, particularly for still drinks.
Since 2008, our optimisation work has resulted in a 31% reduction in the number of plants across the Group, from 80 to 55 at the end of 2017. In the process, the average number of filling lines per plant has increased from 3.6 to 4.9, creating more efficient and flexible facilities.
During the same period, we also reduced the number of our warehouses and distribution centres by 53%. Our capacity utilisation across the business was 65% during peak months in 2017, giving us plenty of room for growth without the need for additional investment.
In Russia, we closed a juice production plant in St Petersburg, transferring the production capacity to our local production facility for sparkling drinks and to other parts of the country. This change allows for better geographic alignment between production and demand for our juice products, reducing transport distances in our vast Russian territory. In addition, we temporarily closed five filling lines for juice and three for sparkling drinks, while retaining the option to resume production on these lines as the market recovers.
We focused on creating mega-plants in Nigeria in 2017, consolidating production in Asejire, Abuja and Port Harcourt. Our plant in Ikeja, which is the largest Coca-Cola bottling plant in Africa, was also further modernised.
REMAINING FOCUSED ON COST
EFFICIENCIESOur focus remains on optimising both infrastructure and processes to support evolving business needs,
while achieving efficiencies and ensuring the sustainability of our resources.
2018 priorities – Ensure fast response of the supply
chain to growing market's needs
– Strong cash generation
– Further exploit digital solutions and systems
– Increase the use of recycled PET in our packaging
2017 progress – Total cost of supply as percentage
of revenue fell below 10%, following logistics initiatives
– Full integration of Nigeria into our business services organisation
– Strong cash generation with increased capital expenditure focusing on revenue-generating assets
– Enhanced relationships with suppliers, emphasising local sourcing and sustainable principles
– 41% of total packaging recovered for recycling
– Zero waste to landfill in four plants
– Renewable and clean energy accounting for 34.1% of all energy used
48 Coca-Cola HBC 2017 Integrated Annual Report
OUR STRATEGY IN ACTION: EFFICIENCIES

We have closed 34 distribution centres in the past two years, reducing numbers from 51 in 2015 to 17 in 2017 and outsourcing distribution without disrupting our supply chain. Optimisation of production and logistics will continue in Nigeria throughout 2018, with further closures of less efficient facilities in due course.
In 2017, our ongoing work on logistics reduced the total cost to supply as a percentage of revenue to a level below 10%. Our drive to shift from fixed to variable costs across the Group continued, outsourcing logistics activities and partnering with suppliers. These initiatives reduce risk and fixed cost, while improving operational efficiency.
To support commercial initiatives, we upgraded production lines, so that our manufacturing capabilities reflect our diverse product portfolio. We made investments relevant for the packaging of the new FUZE tea brand and for the production of plant-based beverages, juice smoothies and juice drinks with PET packaging in Nigeria. In Hungary, we invested in production capabilities for glacéau smartwater, a new premium lifestyle water brand which we plan to launch in 10 markets in 2018.
Digital solutions provide great opportunities for efficiency with high quality standards. In 2017, we implemented a real-time quality monitoring and process control system in eight of our manufacturing facilities.
In nine of our largest and most important plants, we introduced a line monitoring solution to collect data automatically from production lines. These investments enhance the reliability of our production processes and the quality of our products. We also developed and piloted a control tower solution which provides end-to-end visibility of logistics activities. This allows us to monitor deliveries to our customers, supporting efficient execution and service quality.
Business standardisationNigeria was the latest addition to the Company-wide business standardisation initiative, which began with a shared business services organisation (BSO) in Bulgaria in 2011 and was followed in late 2016 by the Russian service centre in Nizhny Novgorod.
The extension of services from our BSO in Sofia, Bulgaria to our Nigerian business unit centralises and standardises the management of general accounting, cash collection, credit and dispute management and human resource processes.
Serving as a business partner, in 2017 the BSO streamlined back-office work for the commercial function, freeing up time for launching products and serving customers. New digital solutions were introduced, including travel and expense tools, a self-service supplier portal and an automated accounts payable solution.
While carrying out this transformative work, the BSO is also a part of our efforts to achieve service excellence, conducting customer workshops on process design and delivering soft skills training for Coca-Cola HBC employees with customer support responsibilities. The BSO also serves as a talent pool for our Company, with 43 people promoted to country operations and corporate service centre roles in 2017.
49Coca-Cola HBC 2017 Integrated Annual Report
Strategic R
eport
Co
rporate G
overnance
Financial Statem
entsS
wiss S
tatutory R
eporting
Supplem
entary Inform
ation
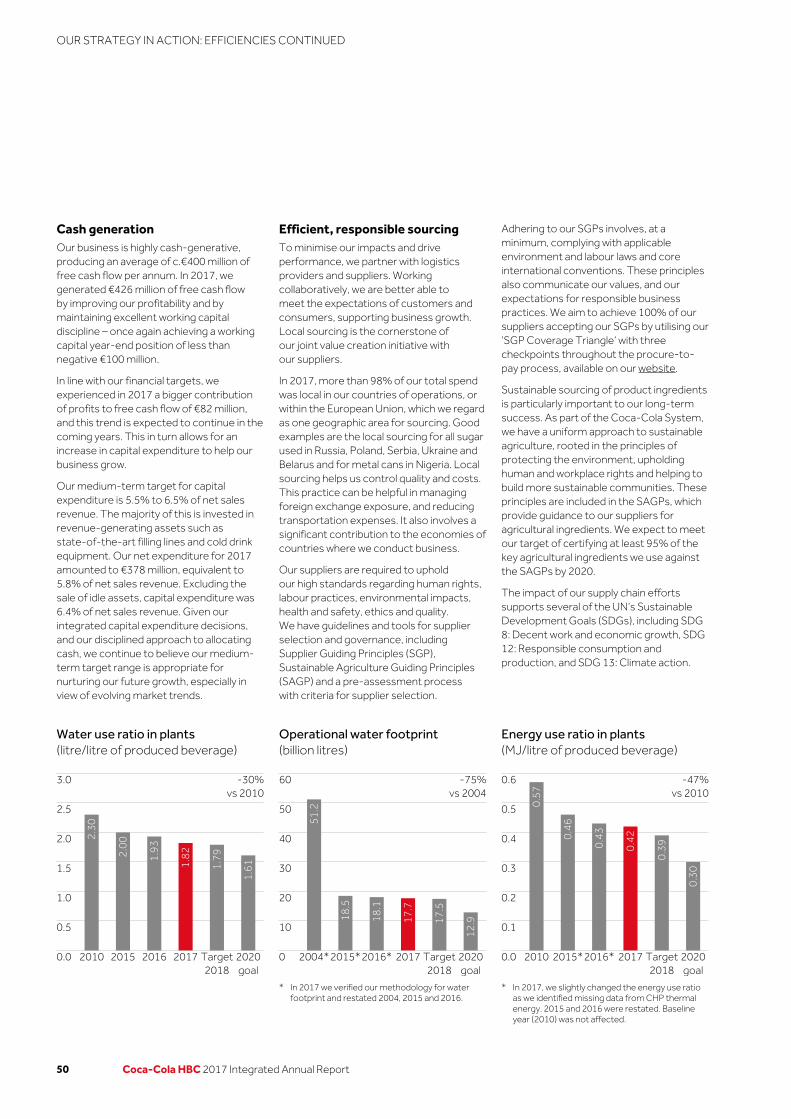
Water use ratio in plants (litre/litre of produced beverage)
Operational water footprint (billion litres)
Energy use ratio in plants (MJ/litre of produced beverage)
Cash generationOur business is highly cash-generative, producing an average of c.€400 million of free cash flow per annum. In 2017, we generated €426 million of free cash flow by improving our profitability and by maintaining excellent working capital discipline – once again achieving a working capital year-end position of less than negative €100 million.
In line with our financial targets, we experienced in 2017 a bigger contribution of profits to free cash flow of €82 million, and this trend is expected to continue in the coming years. This in turn allows for an increase in capital expenditure to help our business grow.
Our medium-term target for capital expenditure is 5.5% to 6.5% of net sales revenue. The majority of this is invested in revenue-generating assets such as state-of-the-art filling lines and cold drink equipment. Our net expenditure for 2017 amounted to €378 million, equivalent to 5.8% of net sales revenue. Excluding the sale of idle assets, capital expenditure was 6.4% of net sales revenue. Given our integrated capital expenditure decisions, and our disciplined approach to allocating cash, we continue to believe our medium-term target range is appropriate for nurturing our future growth, especially in view of evolving market trends.
Adhering to our SGPs involves, at a minimum, complying with applicable environment and labour laws and core international conventions. These principles also communicate our values, and our expectations for responsible business practices. We aim to achieve 100% of our suppliers accepting our SGPs by utilising our ‘SGP Coverage Triangle’ with three checkpoints throughout the procure-to-pay process, available on our website.
Sustainable sourcing of product ingredients is particularly important to our long-term success. As part of the Coca-Cola System, we have a uniform approach to sustainable agriculture, rooted in the principles of protecting the environment, upholding human and workplace rights and helping to build more sustainable communities. These principles are included in the SAGPs, which provide guidance to our suppliers for agricultural ingredients. We expect to meet our target of certifying at least 95% of the key agricultural ingredients we use against the SAGPs by 2020.
The impact of our supply chain efforts supports several of the UN’s Sustainable Development Goals (SDGs), including SDG 8: Decent work and economic growth, SDG 12: Responsible consumption and production, and SDG 13: Climate action.
Efficient, responsible sourcingTo minimise our impacts and drive performance, we partner with logistics providers and suppliers. Working collaboratively, we are better able to meet the expectations of customers and consumers, supporting business growth. Local sourcing is the cornerstone of our joint value creation initiative with our suppliers.
In 2017, more than 98% of our total spend was local in our countries of operations, or within the European Union, which we regard as one geographic area for sourcing. Good examples are the local sourcing for all sugar used in Russia, Poland, Serbia, Ukraine and Belarus and for metal cans in Nigeria. Local sourcing helps us control quality and costs. This practice can be helpful in managing foreign exchange exposure, and reducing transportation expenses. It also involves a significant contribution to the economies of countries where we conduct business.
Our suppliers are required to uphold our high standards regarding human rights, labour practices, environmental impacts, health and safety, ethics and quality. We have guidelines and tools for supplier selection and governance, including Supplier Guiding Principles (SGP), Sustainable Agriculture Guiding Principles (SAGP) and a pre-assessment process with criteria for supplier selection.
0.0
0.5
1.0
1.5
2.0
2.5
3.0 -30%vs 2010
2010 2015 2016 2017 Target2018
2020goal
1.611.
79
1.821.
932.00
2.30
0
10
20
30
40
50
60 -75%vs 2004
2004*2015*2016* 2017 Target2018
2020goal
12.917
.5
17.7
18.1
18.5
51.2
0.0
0.1
0.2
0.3
0.4
0.5
0.6
2010 2015*2016* 2017 Target2018
2020goal
0.30
0.390.
420.430.
46
0.57
-47%vs 2010
* In 2017 we verified our methodology for water footprint and restated 2004, 2015 and 2016.
* In 2017, we slightly changed the energy use ratio as we identified missing data from CHP thermal energy. 2015 and 2016 were restated. Baseline year (2010) was not affected.
50 Coca-Cola HBC 2017 Integrated Annual Report
OUR STRATEGY IN ACTION: EFFICIENCIES CONTINUED

Smarter procurementIn 2013, we ran the PLATO (Procurement Lean and Agile Transformation and Optimisation) project with the objective of aggregating the spend managed by the procurement function and of achieving synergies across countries, while improving the quality of the procurement service. A pitstop named PLATO 2.0 was held in 2017, which focused on efficiency and performance with the participation of stakeholders from other functions.
In order to benefit from the large quantities our business requires, we consolidate orders for promotional materials and marketing equipment needed across our business. Our cooler supplier, for example, has helped us standardise and harmonise our cooler portfolio across our markets while stabilising costs through a multi-year contract agreement.
To leverage bargaining power related to our large volumes, all countries are requested to place their orders for promotional materials within certain time frames. Volume leverage through this ‘One Hellenic’ approach produced a 6.6% cost optimisation for FUZE tea glassware procurement – just one example of how this approach produces benefits.
Joint growth initiatives and benchmarkingTo increase awareness of sustainability, engagement with strategic suppliers and the development of our people, we introduced new events, workshops and tools in 2017. We piloted three sustainability day events in 2017 with strategic suppliers in Zurich, Belgrade and Moscow, which created an opportunity to share information about our Company’s corporate social responsibility policy and sustainability commitments, share achievements and best practices, and begin working together on joint targets and initiatives.
Consistent with our interest in developing our people and our suppliers, we developed workshops and training sessions for specific commodities for packaging, such as PET plastic and metals used for cans.
The Ecovadis CSR platform, a third-party assessment tool, was introduced in 2017 to evaluate corporate social responsibility performance management systems for our suppliers. More than 120 critical suppliers have already been assessed using the platform.
CO2 ratio (scopes 1 and 2) (gCO2/litre of produced beverage)
CO2 ratio (scopes 1, 2 and 3) (gCO2/litre of produced beverage)
Landfill waste ratio (g/litre of produced beverage)
0
15
30
45
60
75
90
2010 2015*2016* 2017 Target2018
2020goal
39.144
.0
45.750
.353.6
78.3
-50%vs 2010
0
100
200
300
400
500
600
2010 2015*2016* 2017 Target2018
2020goal
331
336
339
350
352
441
-25%vs 2010
0
1
2
3
4
5
6
2004 2015 2016 2017 Target2018
2020goal
0.50
0.38
0.390.510.
76
5.0
-90%vs 2004
Efficient use of resourcesOur efforts to reduce our use of packaging materials, energy and water continued in 2017. As a leading bottler in the Coca-Cola System, we place a significant amount of packaging in the marketplace. Packaging plays a central role in our business, ensuring the quality and safety of our products, but innovative light-weight packaging reduces costs and environmental impact.
We are taking decisive action to address the risks and opportunities presented by climate change. In November 2017, Coca-Cola HBC was among the first to sign the Accounting for Sustainability (A4S) CFO statement of support for the Task Force on Climate-related Financial Disclosures (‘TCFD’).
We have specific 2020 targets, aiming at reducing carbon emissions per litre of produced beverage by 50% in our operations and by 25% across our value chain, against a 2010 baseline, and in 2017 we continued to make good progress. Since 2015, our energy and carbon reduction initiatives have resulted in approximately €11 million aggregate savings.
* Restated 2015 and 2016 figures to include the new plant acquisition.
* Restated 2015 and 2016 figures to include the new plant acquisition.
51Coca-Cola HBC 2017 Integrated Annual Report
Strategic R
eport
Co
rporate G
overnance
Financial Statem
entsS
wiss S
tatutory R
eporting
Supplem
entary Inform
ation

Our 2020 target for waste from plants to landfill was also overachieved in 2017, reaching 0.39g/lpb, compared to a target of 0.5g/lpb. At the same time, four of our plants had zero waste to landfill in 2017.
Energy efficiencyClimate change brings significant potential risks to Coca-Cola HBC, with the potential for increased energy costs, carbon taxation, reduced access to water and business disruption due to severe weather conditions. However, it also presents us with an opportunity to make our value chain more efficient and sustainable.
Our efforts to address climate change and its impacts contribute to the UN Sustainable Development Goal on climate action (SDG 13) and affordable and clean energy (SDG 7).
To seize this opportunity, we were among the first companies to introduce science-based climate targets. These commit us to use energy from renewable and clean energy sources for at least 40% of the total energy we use by 2020, and reduce the total energy Coca-Cola HBC consumes per litre of produced beverage by 47% compared to a 2010 baseline.
To ensure we meet our targets, we use an internal carbon price of €25 per metric tonne of CO2 to guide decision-making, hold regular reviews to confirm that we adhere to all our internal standards and external environmental laws and regulations, and have third parties annually audit our environmental management systems and all bottling plant data.
We are well placed to achieve our 2020 targets: during 2017, renewable and clean energy (CHP – combined heat and power) accounted for 34.1% of all the energy we used, and we reduced the total amount of energy consumed per litre of produced beverage by 26.5% compared to the 2010 baseline. Our energy intensity dropped by 4% in 2017 compared to 2016. Direct carbon emissions also declined by 9.1% during 2017, and indirect emissions from our value chain fell by 3.2%.
Progress in packaging and waste managementWe have a holistic approach to packaging, intended to minimise our impact at every stage of the lifecycle by reducing weight, increasing the use of recyclable materials and increasing the overall recyclability of packaging. Further, we have been using renewable (plant-based) materials, as well as improving our post-consumer waste management.
With our light-weighting initiatives, we reduced the main packaging materials used for our beverages, namely PET, aluminium cans and glass bottles, by 18% in 2017 vs our baseline of 2010.
Our packaging-related targets commit us to source 20% of the total PET we use from recycled PET or PET from renewable materials by 2020. We are partly behind on this commitment due to the higher cost of these materials in our geographies. We invested more than €14.9 million in packaging optimisation and efficiency. We used 13,100 tonnes of recycled PET material and 11,050 tonnes of plant PET material, which together with light-weighting initiatives helped us to save more than 36,000 tonnes of CO2. We have dedicated teams at a country level who work on developing thorough plans for further weight reduction for each container size and type, without impacting the quality of the bottles or product taste.
Streamlining packaging is, by itself, not enough. We champion increases in recycling and other solutions to packaging waste, and we want to close the recycling loop, converting used packaging into new. We support 19 packaging waste management schemes across our markets and we have a Group-wide policy on post-consumer waste management. We have initiated projects in Russia, Nigeria and Ukraine for packaging recovery with a target of 20% in each by 2020. In Poland, we have initiated a separate collection system, working with four other companies, to focus on increased collection of PET. In 2017, 41% of the total packaging we placed in the market was recovered for recycling, exceeding our 2020 target of 40%.
52 Coca-Cola HBC 2017 Integrated Annual Report
OUR STRATEGY IN ACTION: EFFICIENCIES CONTINUED

UnderstandMaximising our performance requires us to prioritise and focus on those areas where we have the most control: optimising our production and logistics, our operating costs and our cash conversion.
EvolveTo support the expansion of our beverage portfolio, we are using all resources more efficiently and effectively, while adding new capabilities.
EnergiseOur long-term growth is nurtured and energised through investments in new technologies which support new product categories and energy efficiency.
Looking aheadAs we enter a year of strong innovation, we will accelerate our investments in revenue-generating activities and assets.
In 2018, we will continue to optimise our production and logistics, make enhancements to our procurement processes, increase awareness on sustainability issues, and continue minimising the use of packaging materials. We will also extend the implementation of our carbon, water and energy-saving projects.
In addition to the ongoing focus on light-weighting projects for packaging, we will increase the use of recycled PET content. We are currently working on two joint value creation projects with our PET resin suppliers to develop the technology required to achieve this.
Digital solutions supporting efficiency and automation will also continue to be rolled out across the Group. These include pilot programmes, such as an integrated business planning cloud platform to strengthen collaboration in sales and operations and optimise inventories, which was tested in six countries in 2017.
The outcome from PLATO 2.0 will be the roadmap for procurement for the coming years. The streamlining of procurement processes, the simplification of guidelines and the exploitation of digital solutions are the tools we will put in place to reinforce relationships with our suppliers.
Based on the positive feedback received, we will extend our sustainability events and workshops in 2018, with supplier events held in additional countries and new training workshops covering raw materials such as sugar, juices and other ingredients. We also expect to assess the corporate social responsibility systems of at least 200 more suppliers using the third-party platform we implemented in 2017.
We are committed to reaching our 2020 sustainability targets and in 2018 we will critically review them and raise the bar higher, expanding our time horizon. Moreover, as part of the Coca-Cola System we are working with The Coca-Cola Company to achieve the goals set out in the ‘World Without Waste’ System platform, to collect and recover 100% of primary packaging we place in the market.
53Coca-Cola HBC 2017 Integrated Annual Report
Strategic R
eport
Co
rporate G
overnance
Financial Statem
entsS
wiss S
tatutory R
eporting
Supplem
entary Inform
ation

1. Biogas from waste water treatment plant used in Istra manufacturing site, RussiaAfter a €35,000 investment, the Istra plant in Russia now burns biogas taken from its waste water treatment process, rather than natural gas. Through this, we expect savings of 181,000 Nm3 of natural gas each year, and 540 tonnes of CO2. This is the first renewable energy of its kind to be used in our Russian operations. The concept was deployed in our Novosibirsk plant and in 2018 we will implement it in the Oricola plant in Italy.
2. New cooling system in Kostinbrod plant, Bulgaria We invested €310,000 in a new cooling system in our manufacturing site in Kostinbrod, Bulgaria. We introduced chillers with direct evaporation/heat exchange in the water tanks and now use water instead of mono propylene glycol. This has contributed not only to chemical reduction and a safer environment, but also to 530 MWh of energy savings annually.
3. Waste heat recovery boilers, NigeriaA €1.4 million investment in waste heat recovery boilers in our Nigerian sites is expected to save over 400 tonnes of carbon emissions each year. The waste heat coming from our generators is
converted to steam and used again in the plant. This steam can also be used to create chilled water with vapour absorption chillers (‘VAC’).
4. Water, energy and CO2 emissions reduction, SwitzerlandWe are working with the Swiss start-up company Climeworks, which has developed a process for capturing CO2 from air with the world’s first commercial carbon removal technology. The CO2 produced by Climeworks causes 66% fewer CO2 emissions than traditionally produced CO2. This technology demonstrates our commitment to sustainability and local sourcing. The CO2 will be used for carbonation of our mineral water Valser Classic in 2018.
3. Nigeria
400 tonnesof carbon emissions
saved each year
1. Russia
181,000 Nm3
of natural gas saved annually
2. Bulgaria
530 MWhof energy savings annually
4. Switzerland
66%fewer CO2 emissions
Reducing our environmental footprint remains a key priority. In 2017, we invested in innovative solutions across our territories to improve energy efficiency.
54 Coca-Cola HBC 2017 Integrated Annual Report
OUR STRATEGY IN ACTION: EFFICIENCIES CONTINUED

UNDERSTANDING OUR RISKS TO CREATE AND HARNESS
OPPORTUNITIESUnderstanding and proactively managing our material issues and principal risks is vital. This is because they
have the greatest potential to impact our ability to create and sustain value, which can influence
our ability to remain viable over time.
Due to their critical importance, our material issues and principal risks are integrated into our business planning processes and monitored on a regular basis by our Operating Committee and our Board. They offer two complementary lenses for viewing our future course.
One is the risk management lens, which provides insight into future threats and uncertainty, and opportunities for seizing advantage.The other is the material issues lens, which provides a filter for prioritising those environmental, social, economic and financial issues that are critically important to our ability to create value for all of our stakeholders.
In this section, we outline how our material issues and principal risks are identified, managed and reported.
55Coca-Cola HBC 2017 Integrated Annual Report
Strategic R
eport
Co
rporate G
overnance
Financial Statem
entsS
wiss S
tatutory R
eporting
Supplem
entary Inform
ation

For these reasons, we undertake an annual materiality assessment process. This involves looking beyond our own footprint and considering all of the environmental, social, economic and financial topics that could affect – negatively or positively – our ability to create value over the short, medium and long term.
To support our annual materiality assessment, we conduct ongoing dialogue with our stakeholders, including suppliers, consumers, regulators and non-governmental organisations (NGOs). We also assess material issues based on their relevance to our strategic plans and objectives.
Our internal process for assessing materiality involves the following groups:
– Our cross-functional Sustainability Steering Committee assesses the list of material issues and ensures that our sustainability approach is fully aligned with our business priorities.
– The Social Responsibility Committee of the Board of Directors endorses the prioritised list of issues and the resulting materiality matrix.
– The Operating Committee integrates our sustainability priorities into our business strategy.
Engaging stakeholdersWe engage with our stakeholders to listen and to understand their insights into the issues that matter most to our communities and our business. This engagement enables our leadership to understand emerging trends and different perspectives, strengthens our relationships and helps us make better business decisions to deliver on our commitments. Our key internal and external stakeholders include investors, employees, customers, suppliers, local communities, NGOs and governments, among others.
Environmental, social, economic and financial issues touch on every aspect of our business. Engaging with stakeholders is, therefore, a cross-functional process that takes place across all of our markets. This is done through co-operation with trade associations, governments, civil organisations and alliances, in various meetings, forums and events.
Once a year, together with The Coca-Cola Company, we invite a selected group of people to a Group stakeholder forum, where we present briefs on two to three material issues and seek input regarding these and our other material issues. Our 2017 stakeholder forum took place in Vienna in November.
Attendees included 25 high-level academics, suppliers, customers and NGO representatives, and discussions centred on the two material issues we presented: health and nutrition and employee engagement and well-being.
Beyond this, we ask more than 460 key stakeholders to provide online feedback every year via our material issues survey. This gives them the opportunity to prioritise our material issues based on their own interests and perception of the value we create.
The survey includes open-ended questions allowing stakeholders to share feedback on anything we may have missed. A similar survey is conducted internally to collect input from our top 300 business leaders, which includes the senior leadership teams in our 28 countries, as well as the regional management teams and the Group top management. The output of these surveys is used to derive our materiality matrix.
In 2017, we continued the standardisation of materiality assessment and stakeholder engagement at the country level, with Russia, Poland and FYROM among the first countries to implement this initiative. The objective is to gauge input from a broad array of stakeholders in a structured way, both at the Group and country level. Local teams use the same standard set of material issues as the Group, and may amend them by adding up to three others which reflect the unique characteristics of their local market, following the endorsement of the local senior leadership.
You can read more about our stakeholder engagement processes in the Governance section of this report and on our website.
Our material issues are those that matter most to our stakeholders and contribute to our business success. Assessing their importance provides a guide to strategically managing the risks and opportunities they represent.
OUR APPROACH TO MATERIALITY
Engaging with stakeholders in Moscow and Skopje.
56 Coca-Cola HBC 2017 Integrated Annual Report
RISK AND MATERIALITY CONTINUED

This includes setting and disclosing targets and metrics to measure progress. Executive compensation is linked to these targets.
We use the Sustainable Development Goals (SDGs) adopted by the United Nations in 2016 as a framework to guide us in creating value for all stakeholders through the proactive management of our material issues.
KeyEconomic dimension Environmental dimension
Social dimension
12
3
4
5
6
7
89
10 1112
Materiality matrix
Impo
rtan
ce to
sta
keho
lder
s
Significance of economic, social and environmental impacts on our business
Moderate
Mo
dera
teV
ery
high
Hig
h
Very highHigh
1Corporate governance, business ethics and anti-corruption
2Direct and indirect economic impacts
3 Health and nutrition
4Product quality and integrity
5 Responsible marketing
6
10
7
11
8
12
9
Carbon and energy
Community investment and engagement
Packaging, recycling and waste management
Employee well-being and engagement
Sustainable sourcing
Human rights and diversity
Water stewardship
By combining the importance of these issues for stakeholders with the significance of their economic, environmental and social impacts on our business, we derive the relative materiality of each issue. This is shown in the materiality matrix graphic below.
Following the process of prioritising our material issues, our Operating Committee ensures that they are proactively managed within our overall strategic framework.
MANAGING OUR MATERIAL ISSUESWe continue to regard the 12 material issues identified below as the most relevant and important to our business, and believe they will remain so.
Our contributions to the specific SDGs below, which we believe are relevant to our business, are noted in the Communities, Consumers, Customers and Efficiencies sections of this report.
You can find more details on our sustainability performance in the GRI Content Index: https://coca-colahellenic.com/en/investors/2017-integrated-annual-report/
57Coca-Cola HBC 2017 Integrated Annual Report
Strategic R
eport
Co
rporate G
overnance
Financial Statem
entsS
wiss S
tatutory R
eporting
Supplem
entary Inform
ation

Risk management is the central pillar of our business resilience programme which was disclosed in the 2015 Annual report. The full programme description is available at:https://coca-colahellenic.com/en/about-us
Risk managementIntrinsically linked to materiality is the management of risk. During 2017, to support informed risk-taking at all levels, we further embedded our enterprise risk management programme into our Company culture. Informed risk-taking allows us to innovate and leverage opportunities for growth across our 28 countries and forms the foundation of our effective risk management strategy. The enterprise risk management programme is led by the Group Chief Risk Officer (CRO) who works in close collaboration with the risk owners in specialised functions on specific business risks.
The Board is ultimately responsible for the Group’s risk management and internal control systems, and for reviewing their effectiveness. The Board has defined the Group’s risk appetite and reviews quarterly the Company’s risk exposure to ensure that material matters and principal risks facing the Company are managed in alignment with our strategic goals and objectives. While oversight responsibility rests with the Audit and Risk Committee (as described in the Governance section of this report), the Board is updated on outcomes and all significant issues.
Collaboration is central to the success of the risk management programme and strong partnerships have been forged across all business functions which actively support the enterprise risk management programme. Successful collaborations in 2017 included:
– an updated Board-endorsed risk management policy;
– Group statements on strategic direction, ethics and values;
– clear business strategies, objectives and principles;
– an annually reviewed enterprise risk management framework that articulates the continuous process for the identification and evaluation of significant risks to the achievement of business objectives;
– programme integration into the business planning cycle;
– continual monitoring of our internal and external environment for factors that may change our risk profile or create opportunities;
– training and awareness programmes across all operations and functions focused on embedding a risk management culture into our DNA and creating informed risk-taking leaders at all levels, which builds the capability to leverage opportunities; and
– the annual evaluation of the type and amount of Group insurance purchased from the market while leveraging our captive insurance entity. This is with reference to the availability of cover and cost measured against the probability and magnitude of the associated risks.
Programme reviewThe risk management programme is audited annually by the Company’s internal audit department. It measures the programme, its processes and their application against best practice and the International Accounting Standard. The Corporate Audit Director makes recommendations to improve the overall risk management programme with the findings submitted to the Audit and Risk Committee.
Our principal risksLeveraging our robust risk management programme, we are constantly vigilant to uncertainty in our operating environments. In this way, we proactively identify new opportunities and risks, and understand the threats to our business viability.
This overview of our most important risks, which involves an assessment of the likelihood of occurrence and the potential consequences, does not include all risks that can ultimately affect the Company. There are risks not yet known to us, or currently believed to be immaterial, that could ultimately have an impact on our business or financial performance.
For the current reporting period, we have made three changes to our principal risk categories. Moving off the list is the risk of change management. With our major business transformation projects involving supply chain and information technology effectively implemented, the probability and impact of this risk was further reduced in 2017 and therefore it is no longer evaluated as a principal risk. However, the category will continue to be monitored as part of our strategic risk review processes, which allows for its reclassification if required.
The people and talent risk has transformed into two separate risks due to the differing mitigations: people attraction and people engagement. Elevated to a principal risk is health and safety. While health and safety was always closely monitored as a strategic risk, the elevation to a principal risk emphases the critical importance of the well-being and safety of our employees and contractors, and the safety of others in the workplace.
With respect to the risk ratings, the principal risks of cyber and discriminatory taxes increased in comparison to 2016 in both likelihood and impact. The foreign currency risk observed a decrease in impact.The risk ratings were influenced by changes experienced in our operational environment.
EFFECTIVE MANAGEMENT OF RISK
58 Coca-Cola HBC 2017 Integrated Annual Report
RISK AND MATERIALITY CONTINUED

A solid framework to manage riskOur enterprise risk management process for the identification, review, management and escalation of both risks and opportunities is based on ISO 31000. In 2017 this process incorporated the following key activities:
Opportunities and risks
Feedback to this
process
<
<
– quarterly risk reviews were undertaken by the markets and corporate functions;
– the CRO and his team facilitated 20 of these sessions with senior leaders;
– management actions were reviewed quarterly. In May and November, facilitated regional-level reviews including the Regional Directors, their teams and the CRO were conducted. Stakeholder feedback was provided after these sessions, ensuring a cyclic bottom/up, top/down information loop;
– the Group Risk Forum (GRF), which acts as an internal think tank and is headed by the CRO, convened on a six-monthly basis and evaluated risk trends and the risk environment as part of the preparation of our strategic risk register and list of principal risks;
– the Operating Committee reviewed the findings of the GRF and our risk exposures with the CRO in May and November; and
– on a quarterly basis, the CRO briefed the Audit and Risk Committee on material risks, management actions, and process compliance with the UK Corporate Governance Code.
The Group Risk Forum
Quarterly reviews
Operating Committee
review
Committee briefings
Management actions reviewed
CRO leadership
sessions
59Coca-Cola HBC 2017 Integrated Annual Report
Strategic R
eport
Co
rporate G
overnance
Financial Statem
entsS
wiss S
tatutory R
eporting
Supplem
entary Inform
ation

Principal risks Description Potential impact Key mitigationsLink to material issues
1. Consumer health Failure to adapt to changing consumer health trends and address misconceptions about our formulations and the health impact of soft drinks.
• Failure to achieve our growth plans
• Damage to our brand and corporate reputation
• Loss of consumer base
• Focus on product innovation and expansion to a 24/7 total beverage portfolio
• Expand our range of low- and no-calorie beverages
• Introduce smaller entry packs• Reduce the calorie content of
products in the portfolio• Clearer labelling on packaging• Promote active lifestyles through
consumer engagement programmes focused on health and wellness
Health and nutrition
Responsible marketing
Product quality and integrity
2. Foreign currency Foreign exchange exposure arises from changes in exchange rates, as well as currency depreciation in combination with capital controls, restricts movement of funds and increases the risk of asset impairment.
• Financial loss• Asset impairment• Limitations on
cash repatriation
• Treasury policy requires the hedging of 25% to 80% of rolling 12-month forecasted transactional exposure
• Hedging beyond 12 months may occur in exceptional cases subject to approval of the Group CFO
• Derivative financial instruments are used, where available, to reduce net exposure to currency fluctuations
Direct and indirect economic impacts
3. Climate, carbon and water
Failure to meet our stakeholders’ expectations in making a positive contribution to the sustainability agenda, particularly relating to climate change, packaging waste and water usage.
• Long-term damage to our corporate reputation
• Less influence in shaping the citizenship and sustainability agenda
• Reduced profitability
• Water stewardship programmes that are reducing our water consumption, our footprint and assuring sustainable end-to-end water (from water sourcing, and using treated waste water for the benefit of our communities, other users and stakeholders)
• Carbon and energy management programmes
• Packaging waste management programmes
• Partnering with NGOs and international NGOs on common issues such as nature conservation
• Partnering with local communities to minimise environmental impact
• Focus on sustainable procurement
Carbon and energy
Packaging, recycling and waste management
Sustainable sourcing
Water stewardship
4. Channel mix A continued increase in the concentration of retailers and independent wholesalers on whom we depend to distribute our products. The immediate consumption channel remains under pressure as consumers alter consumption habits.
• Reduced profitability
• Continued to increase our presence in the discounter channel during 2017
• Working closely with our customers to identify opportunities for joint value creation
• Right Execution Daily (RED) strategy continues to support our commitment to operational excellence, enabling us to respond to changing customer needs across all channels
Direct and indirect economic impacts
OUR PRINCIPAL RISKS
60 Coca-Cola HBC 2017 Integrated Annual Report
RISK AND MATERIALITY CONTINUED

Principal risks Description Potential impact Key mitigationsLink to material issues
5. Declining consumer demand
Challenging and volatile macroeconomic, security and political conditions can affect consumer demand and create security risks across our diverse mix of markets.
• Eroded consumer confidence affecting spending
• Inflationary pressures
• Social unrest• Safety of people
and security of assets
• Seeking to offer the right brand, at the right price, in the right package through the right channel
• Robust security practices and procedures to protect people and assets
• Crisis response and business continuity strategies
Direct and indirect economic impacts
Community investment and engagement
6. Discriminatory taxes
Regulations on consumer health, government misconceptions relating to formulations and the risk of the targeting of our products by governments and NGOs for discriminatory taxation and packaging waste recovery.
• Reduction in profitability
• Proactively working with governments and regulatory authorities to ensure that the facts relating to formulations are clearly understood and that our products are not singled out unfairly
• Shaping the sustainability agenda as it relates to packaging and waste recovery
• Engaging with stakeholders including NGOs and the communities in which we operate on strategies to protect the environment and build consumer trust
Direct and indirect economic impacts
7. Quality The occurrence of quality issues, or the contamination of our products, across our diverse total beverage portfolio.
• Damage to brand and corporate reputation
• Loss of consumer trust
• Reduction in volume and net sales revenue
• Stringent quality processes in place to minimise the occurrence of quality issues
• Early warning systems (Consumer Interaction Centres and social media monitoring) that enable issue identification
• Robust response processes and systems that enable us to quickly and efficiently deal with quality issues, ensuring customers and consumers retain confidence in our products
Product quality and integrity
8. Regulatory challenges
Inadvertent non-compliance, by the Company or related third parties, with laws and regulations, that exist across our diverse mix of markets.
• Damage to our corporate reputation
• Significant financial penalties
• Management time diverted to resolving legal issues
• Annual ‘tone from the top’ messaging
• Code of Business Conduct training and awareness
• Anti-Bribery Policy and commercial compliance training
• Internal control assurance programme with local management accountability
• Risk-based internal control framework
• Whistle-blower hotline• Legal function in constant dialogue
with regulators
Corporate governance, business ethics and anti-corruption
Human rights and diversity
Key for principal risks tableIncreasing Stable Decreasing
61Coca-Cola HBC 2017 Integrated Annual Report
Strategic R
eport
Co
rporate G
overnance
Financial Statem
entsS
wiss S
tatutory R
eporting
Supplem
entary Inform
ation

Principal risks Description Potential impact Key mitigationsLink to material issues
9. People attraction Inability to attract and retain sufficient numbers of qualified and experienced employees in competitive talent markets.
• Failure to achieve our growth plans
• Upgrade our employer value proposition and employer brand
• Develop leaders and people for key positions internally
• Improve leaders’ skills and commitment to talent development
• Create shared value with the communities in which we work to ensure we are seen and considered as an ethical business with an attractive purpose
• Expand employee pool by hiring a more diverse workforce
Employee well-being and engagement
10. People engagement
Inability to ensure ongoing engagement and commitment of our workforce.
• Failure to achieve our growth plans
• Promote operational excellence and remove barriers to performance
• Listen to our people to measure engagement and address findings
• Improve well-being of employees• Improve leaders’ skills so that they
can enable, engage and energise employees sustainably
• Promote an inclusive environment that allows all employees to realise their full potential
Employee well-being and engagement
11. Cyber A cyber-attack or data centre failure resulting in business disruption, or the loss of personal data.
• Financial loss• Operational
disruption• Damage to
corporate reputation
• Non-compliance with statutory data protection legislation
• Monitoring, identifying and addressing cyber threats and suspicious internal computer activity
• Training on information management and the protection of information
• Disaster recovery testing and enhanced crisis response capabilities
Direct and indirect economic impacts
62 Coca-Cola HBC 2017 Integrated Annual Report
RISK AND MATERIALITY CONTINUED

Principal risks Description Potential impact Key mitigationsLink to material issues
12. Strategic stakeholder relationships
We rely on our strategic relationships and agreements with The Coca-Cola Company. Monster Energy and our premium spirits partners.
• Termination of agreements or unfavourable renewal terms could adversely affect profitability
• Management focus on effective day-to-day interaction with our strategic partners
• Working together as effective partners for growth
• Engagement in joint projects and business planning with a focus on strategic issues
• Participation in ‘top to top’ senior management forums
Direct and indirect economic impacts
13. Health and safety
The risk of health and safety issues being ineffectively managed. This incorporates the management of third-party providers, particularly fleet and logistics.
Not linked to viability
• Death or injury of employees, contractors or third parties
• Employee engagement and motivation
• Standardised programmes, policies and legislation applied locally
• Group oversight by the health and safety team
• Health and Safety Board with the clear purpose to accelerate the implementation of the health and safety step-change plan
Employee well-being and engagement
Key for principal risks tableIncreasing Stable Decreasing
1
2
34
5
6
7
8
11
12
10
139
Principal risk heat mapThis heat map illustrates the likelihood and impact of our principal risks. The timeframes for our principal risks are directly linked to our viability statement.
Low
Low
Hig
hIm
pact
HighLikelihood
Key
Consumer health1
Foreign currency2
Climate, carbon and water3
Channel mix4
Declining consumer demand
5
Discriminatory taxes
Quality
6
7
Regulatory challenges8
Cyber
Strategic stakeholder relationships
Health and safety
People attraction
People engagement
13
9
10
11
12
63Coca-Cola HBC 2017 Integrated Annual Report
Strategic R
eport
Co
rporate G
overnance
Financial Statem
entsS
wiss S
tatutory R
eporting
Supplem
entary Inform
ation

AN EXCEPTIONAL SET OF RESULTSIn 2017, we achieved balanced growth across our business, with a considerable improvement in every line of our income statement, making this an exceptional year in our recent history.
We delivered another year of progress towards our 2020 objectives, and with better momentum. Strong in-market execution, supported by an improving economic environment, resulted in excellent top-line growth and margin expansion in 2017. Here are the highlights:
– good balance of volume and price/mix growth drove net sales revenue up 5.9% on an FX-neutral basis; reported net sales revenue increased by 4.9%;
– FX-neutral revenue per case improved in all segments, up 3.6% overall;
– volume increased by 2.2%, with growth in all segments;
– operating leverage drove a 30 basis-point reduction in comparable operating expenses as a percentage of net sales revenue;
– comparable EBIT margin increased by 120 basis points to 9.5%; and
– comparable EPS increased by 26.9% to €1.233.
Michalis ImellosChief Financial Officer
64 Coca-Cola HBC 2017 Integrated Annual Report
FINANCIAL REVIEW

FX-neutral revenue growth
5.9%Comparable operating profit
€621mComparable EBIT margin improvement
+120bps
Key financial information
2017 2016 %
change
Volume (million unit cases) 2,104 2,058 2.2Net sales revenue (€ million) 6,522 6,219 4.9Net sales revenue per unit case (€) 3.10 3.02 2.6FX-neutral net sales revenue (€ million) 6,522 6,157 5.9 FX-neutral net sales revenue per unit case (€) 3.10 2.99 3.6Operating profit (EBIT) (€ million) 590 506 16.5Comparable EBIT (€ million) 621 518 20.0EBIT margin (%) 9.0 8.1 90bpsComparable EBIT margin (%) 9.5 8.3 120bpsNet profit (€ million) 426 344 24.0Comparable net profit (€ million) 450 352 27.7Comparable basic earnings per share (€) 1.233 0.972 26.9
Percentage changes are calculated on precise numbers.
Balance sheet
2017
€ million2016
€ million
Assets Total non-current assets 4,345 4,504Total current assets 2,286 2,061Total assets 6,630 6,565Liabilities Total current liabilities 1,896 1,968Total non-current liabilities 1,722 1,727Total liabilities 3,618 3,695Equity Owners of the parent 3,007 2,866Non-controlling interests 5 5Total equity 3,012 2,870Total equity and liabilities 6,630 6,565
Figures are rounded.
Income statementVolume grew 2.2% in the year, an acceleration from the marginal expansion of 0.1% in the prior year. We saw a good performance from both sparkling drinks (including Energy) and still drinks, which grew 2.6% and 1.5% respectively. Volume was up 1.1% in the Established segment, up 2.8% in the Developing segment and up 2.7% in the Emerging segment. Strong volume delivery from our medium-sized markets in the Developing and Emerging segments has been an important component of overall volume growth.
Net sales revenue improved by 5.9% on an FX-neutral basis. Reported revenue grew 4.9%, aided by the stronger Russian rouble when compared to the prior year. FX-neutral revenue per case grew in all segments, up 3.6% overall, with positive contributions from price, category and package mix.
Cost of goods sold increased by 4.2% in 2017, compared to the prior year, as a result of volume growth as well as higher input costs, driven mainly by increases in PET resin while the cost of our other main commodities declined year on year.
Ongoing tight cost management, combined with strong revenue growth, delivered a 30 basis-point reduction in comparable operating expenses as a percentage of revenue in a year where we invested to support our revenue growth management initiatives and increased marketing spend.
Comparable operating profit increased by 20.0% in 2017, compared to the prior year, as benefits from our revenue growth management initiatives including price increases, higher sales volume and slightly positive FX impact more than offset higher cost of goods sold and increased operating expenses. Operating profit increased by 16.5% in 2017, compared to the prior year.
65Coca-Cola HBC 2017 Integrated Annual Report
Strategic R
eport
Co
rporate G
overnance
Financial Statem
entsS
wiss S
tatutory R
eporting
Supplem
entary Inform
ation

Cash flow
2017
€ million2016
€ million
Cash flow from operating activities 804 763Payments for purchases of property, plant and equipment (410) (348)Proceeds from sales of property, plant and equipment 39 36
Principal repayments of finance lease obligations (7) (20)Free cash flow 426 431
Figures are rounded.
Net finance costs declined by €26 million during 2017, compared to the prior year, mainly driven by the issuance of the €600 million bond in March 2016 and the repayment in November 2016 of the 4.25% fixed rate bond, that had resulted in higher interest costs in 2016, as well as the lower effective interest rate of the new bond.
On a comparable basis, the effective tax rate was 24.5% for 2017 and 24.8% for 2016. On a reported basis, the effective tax rate was fairly stable at 24.5% and 24.9% for 2017 and 2016 respectively. The Group’s effective tax rate varies depending on the mix of taxable profits by territory, the non-deductibility of certain expenses, non-taxable income and other one-off tax items across its territories.
Comparable net profit increased by 27.7% and net profit by 24.0% in 2017 compared to the prior year, mainly driven by higher operating profitability and lower net finance costs, only partially offset by increased taxes.
DividendIn view of the Group's progressive dividend policy and the Board's assessment of progress against the Group's strategy, the Board of Directors has proposed a dividend of €0.54 per share. This is a 22.7% increase from €0.44 per share for 2016. The dividend payment will be subject to, among other things, shareholders’ approval at our Annual General Meeting.
Balance sheetTotal non-current assets decreased by €159 million in 2017, mainly due to the impact of foreign currency translation. Net current assets increased by €296 million in 2017, driven mainly by the cash and cash equivalents generated by the Group in the year.
Cash flowNet cash from operating activities increased by 5.3% in 2017 compared to the prior year, as increased operating profitability was only partially offset by taxes paid.
Capital expenditure, net of receipts from the disposal of assets and including principal repayments of finance lease obligations, increased by 13.7% in 2017 compared to the prior year and represented 5.8% of net sales revenue, up from 5.3% in 2016.
We generated €426 million of free cash flow, compared to €431 million in 2016, despite increasing capital expenditure.
Economic valueEfficient use of capital and higher profits resulted in an increase in return on invested capital (ROIC) from 10.3% in 2016 to 12.4% in 2017. At the same time, our weighted average cost of capital (WACC) fell from 8.2% in 2016 to 7.8% in 2017, reflecting the improving economic environment in a number of our countries in the year. As a result, we continued to grow the positive economic value generated by our operations.
Financial risk managementGiven the volatility in currency and commodity markets, proactively managing financial risks was critical throughout the year. We experienced certain adverse currency impacts due to our foreign currency exposures arising from changes in exchange rates between the euro, the US dollar and the currencies of our non-euro countries. In 2017, unusually for our business, we incurred an overall positive impact of €8 million at operating profit level, mainly due to the stronger Russian rouble, which more than offset the impact arising from other depreciating currencies.
We actively hedge transaction exposures in each foreign currency with an available active hedging market on a rolling 12-month basis. The Nigerian naira experienced double-digit depreciation against the euro in 2017. We mitigated a significant part of the impact of this depreciation by pre-buying certain key raw materials at the beginning of the year. On the other hand, the Russian rouble significantly appreciated versus 2016 against both euro and US dollar. The significant appreciation of the Russian rouble, the depreciating Nigerian naira and minor impacts from various other currencies resulted in a €4 million positive transaction impact to our P&L. With an additional €4 million positive impact from translation, the total impact of currencies on our P&L was €8 million in the year.
We had contracted EU sugar prices at favourable levels at the end of 2015, which proved successful. PET resin prices did increase, as expected, but careful management and certain well-timed pre-buys by our procurement team ensured that we secured better pricing compared to our plans. Overall, input cost per case on an FX-neutral basis was up by 3.1% year on year.
Our general policy is to retain a minimum amount of liquidity reserves in the form of cash and cash equivalents on our balance sheet while maintaining liquidity potential in the form of an unused committed €500 million revolving credit facility. We invest our excess cash at Group level primarily in short-term time deposits.
66 Coca-Cola HBC 2017 Integrated Annual Report
FINANCIAL REVIEW CONTINUED

Taxes we contribute to our communitiesCoca-Cola HBC commits to a transparent approach to tax, and will continue paying taxes in the countries where value is created, driving a consistent tax behaviour across the Group. Our tax policy is aligned with business and commercial strategy, and we observe all applicable laws, rules and regulations everywhere we operate.
We support the communities in the countries where we operate directly, by creating wealth, and also indirectly, by paying taxes. These taxes include: corporate income tax calculated on each country’s taxable profit, employer taxes and social security contributions, net VAT cost and other taxes that are reflected as operating expenses. Excise taxes and taxes borne by employees are not included.
Tax contribution by category
Borrowing structure (€ million)
In principle, we do not keep excess cash in any of our countries except for the ones with various degrees of capital controls. We have a multi-currency zero balance automated pool structure in place for 15 of our countries. Fund transfer restrictions exist in Belarus, Greece, Serbia and Ukraine, but these restrictions do not have a material impact on our liquidity, as the amount of cash and cash equivalents we hold in these countries is generally retained for capital expenditure, working capital and dividend distribution purposes. Fund transfer restrictions also exist in Nigeria and the tight liquidity in the local foreign exchange market in 2016 and the start of 2017 significantly limited our ability to execute payments in foreign currency during that period. Foreign currency liquidity has improved considerably since the second quarter of 2017.
BorrowingsOur medium- to long-term aim is to maintain a ratio of net debt to comparable EBITDA in the range of 1.5 to 2.0 times. We ended the year with a ratio of 0.8 times. Our funding strategy in the debt capital markets involves raising financing through our wholly owned Dutch financing subsidiary, Coca-Cola HBC Finance B.V., except in the case of subsidiaries with joint control, or countries where certain legal or tax restrictions apply. In such cases, financing at lower levels in the organisation may be considered.
We use our €3 billion Euro Medium Term Note programme and our €1 billion Euro Commercial Paper programme as the main basis for our financing.
We endeavour to maintain our presence and profile in the international capital markets and, where possible, to broaden our investor base. We also seek to maintain a well-balanced redemption profile.
In early 2016, we issued a €600 million bond, repayable in November 2024, at an effective interest rate of 2.99%. This was utilised mainly in the refinancing of the €600 million bond maturing in November 2016. Our €800 million bond, with June 2020 maturity, is still outstanding.
We also have a €500 million syndicated revolving credit facility, which was extended until 24 June 2021. We have never drawn down on this facility, which can be used for general corporate purposes and carries a floating interest rate over EURIBOR and LIBOR.
Looking aheadGiven the improving economic conditions in our territory, we expect volume to continue to grow in all three segments, with the Emerging markets segment accelerating, as Russia and Nigeria return to volume growth.
Our revenue growth management initiatives, which are designed to grow revenue faster than volume, have gained momentum and should continue to enhance the value we get from every case we sell. We also intend to continue with pricing actions in markets impacted by foreign currency depreciation and markets where deflationary pressures are abating. We expect our plans to continue to improve FX-neutral net sales revenue per case in the year.
On the cost side, we expect our input costs per case to increase by low single digits on an FX-neutral basis and further reduction in operating expenses as a percentage of net sales revenue in the year.
In summary, we have started the year excited about our plans for product innovation and the work we are doing in route to market and in-store execution. We expect the combination of volume growth, price/mix improvement and cost control to deliver FX-neutral revenue growth and margin expansion in the year.
Bonds issued: 1,394Commercial paper: 120Finance leases: 74Other: 39
Corporate income tax: 42.6%Withholding tax: 1.7%Payroll taxes: 46.6%VAT (cost): 1.3%Environmental taxes: 0.2%Other taxes: 7.6%
67Coca-Cola HBC 2017 Integrated Annual Report
Strategic R
eport
Co
rporate G
overnance
Financial Statem
entsS
wiss S
tatutory R
eporting
Supplem
entary Inform
ation

BROAD-BASED GROWTH IN OUR DIVERSE GEOGRAPHIES Established markets “We are focusing on innovation and value in
the Established markets segment, with a number of initiatives supporting Lights and Adult drinks. Therefore seeing Coca-Cola Zero up by 14% and Schweppes up by 10% in this segment is very encouraging.”
Sotiris YannopoulosRegion Director
Volume vs 2016
+1.1%FX-neutral net sales revenue per case vs 2016
+0.7%
Developing markets “Developing markets grew very well in the year, showing an acceleration in the second half, mainly due to a better volume performance in Poland. Hungary and the Czech Republic grew faster compared to 2016, helped by their favourable economies and good summer weather.”
Keith SandersRegion Director
Volume vs 2016
+2.8%FX-neutral net sales revenue per case vs 2016
+2.7%
Emerging markets “We are pleased to see good momentum in our medium-sized Emerging segment countries, while Nigeria and Russia produced flattish results in a challenging operating environment.
“With slightly favourable currency rates in the year, the profitability of the segment improved, delivering 300 basis points of comparable operating margin expansion.”
Naya KalogerakiGroup Chief Customer and Commercial Officer
Volume vs 2016
+2.7%FX-neutral net sales revenue per case vs 2016
+6.9%
68 Coca-Cola HBC 2017 Integrated Annual Report
MARKET HIGHLIGHTS

We achieved broad-based revenue growth in all of our segments with a good balance between volume and price/mix growth, despite facing a challenging operating environment in Nigeria and Russia.
2017 2016 % change
Volume (million unit cases) 613 607 1.1%Net sales revenue (€ million) 2,436 2,408 1.2%Operating profit (EBIT) (€ million) 238 237 0.6%Comparable EBIT (€ million) 250 242 3.3%Total taxes1 (€ million) 130 121 7.6%Population2 (million) 91.2 90.9 0.3%GDP per capita (US$) 37,854 36,565 3.5%Bottling plants (number) 13 13 –Employees (number) 6,530 6,744 -3%Water footprint (billion litres) 5.0 5.5* -9.4%Carbon emissions (tonnes) 99,812 114,329 -12.7%Safety rate (lost time accidents >1 day per 100 employees) 0.93 0.94 -0.7%
1. Total taxes include corporate income tax, withholding tax, and deferred tax, as well as social security costs and other taxes that are reflected as operating expenses; as per IFRS accounts.
2. Population source: International Monetary Fund, World Economic Outlook Database, October 2017. Northern Ireland: NISRA (Northern Ireland Statistics and Research Agency), Office for National Statistics, UK, Northern Ireland Economic Outlook, 2017. Italian data: Sicilian population excluded based on data from ISTAT (Italian National Institute of Statistics).
Italy: 42%Greece: 17%Austria: 14%Switzerland: 12%Ireland: 12%Cyprus: 3%
Volume breakdown by country
2017 2016 % change
Volume (million unit cases) 394 383 2.8%Net sales revenue (€ million) 1,173 1,094 7.2%Operating profit (EBIT) (€ million) 92 93 -1.4%Comparable EBIT (€ million) 92 97 -4.9%Total taxes1 (€ million) 54 54 –Population2 (million) 76.1 76.2 -0.1%GDP per capita (US$) 15,117 14,020 7.8%Bottling plants (number) 8 8 –Employees (number) 4,747 4,980 -5%Water footprint (billion litres) 2.6 2.5* 1.9%Carbon emissions (tonnes) 78,630 84,498 -12.1%Safety rate (lost time accidents >1 day per 100 employees) 0.36 0.66 -46%
Poland: 43%Hungary: 23%Czech Republic: 13%Baltics: 7%Croatia: 7%Slovakia: 5%Slovenia: 2%
Volume breakdown by country
1. Total taxes include corporate income tax, withholding tax, and deferred tax, as well as social security costs and other taxes that are reflected as operating expenses; as per IFRS accounts.
2. Population source: International Monetary Fund, World Economic Outlook Database, October 2017.
2017 2016 % change
Volume (million unit cases) 1,097 1,068 2.7%Net sales revenue (€ million) 2,912 2,717 7.2%Operating profit (EBIT) (€ million) 260 177 47.2%Comparable EBIT (€ million) 278 178 56.3%Total taxes1 (€ million) 129 106 20.9%Population2 (million) 432.6 427.8 1.1%GDP per capita (US$) 5,502 5,055 8.8%Bottling plants (number) 34 35 -3%Employees (number) 18,150 19,359 -6%Water footprint (billion litres) 10.2 10.1* 1.2%Carbon emissions (tonnes) 368,144 383,604 -4%Safety rate (lost time accidents >1 day per 100 employees) 0.26 0.24 10.1%
Russian Federation: 31%Nigeria: 23%Romania: 16%Serbia and Montenegro: 9%Ukraine: 9%Bulgaria: 5%Belarus: 3%Bosnia and Herzegovina: 2%Armenia: 1%Moldova: 1%
Volume breakdown by country
1. Total taxes include corporate income tax, withholding tax and deferred tax, as well as social security costs and other taxes that are reflected as operating expenses; as per IFRS accounts.
2. Population source: International Monetary Fund, World Economic Outlook Database, October 2017.
* In 2017 we verified our methodology for water footprint, restating 2016.
Figures are rounded.Percentage changes are calculated on precise numbers.
69Coca-Cola HBC 2017 Integrated Annual Report
Strategic R
eport
Co
rporate G
overnance
Financial Statem
entsS
wiss S
tatutory R
eporting
Supplem
entary Inform
ation
Business model and prospectsOur business model and strategy, as outlined on pages 18-21 of this report, constitute the key factors underpinning the understanding and evaluation of our prospects, which are our:
– strong sales and execution capabilities;
– attractive geographic diversity;
– market leadership;
– global brands; and
– diverse beverage portfolio.
Our strategy is being adapted over time in order to sustainably create value for our shareholders, suppliers, employees, and the customers and communities we serve. The Group’s business model has proven to be effective and resilient even during the recent challenging market conditions. Our Board has historically applied a prudent approach to the Group’s decisions relating to major projects and investments. From 2013 to 2017, we generated free cash flow of an average of €403 million per year. The Board considers that our diverse geographic footprint, including exposure to emerging markets with low per capita consumption, and our proven strategy in combination with our leading market position, offer significant opportunities for future growth.
The business planning process, key assumptions and viability periodThe Group has a well-established strategic business planning process which has formed the basis of the Board’s quantitative assessment of the Group’s viability. The business plan reflects our current strategy over a five-year rolling period. The financial projections included in the plan are based on the following key assumptions:
– key macroeconomic data, that could impact our consumers’ disposable income and consequently our sales volume and revenues;
– key raw material costs;
– foreign currency rates;
– spending for production overheads and operating expenses;
– working capital levels; and
– capital expenditure.
The Board believes that a viability period of five years is the most appropriate as it aligns with the Group’s strategic business planning cycle and is also consistent with the potential impact of principal risks as disclosed on pages 58-63, the Group’s debt profile and our impairment review process, where goodwill and indefinite-lived intangible assets are tested based on five-year forecasts.
Assessment of viability From a qualitative perspective, we analysed the output of the enterprise risk management, business planning and liquidity management internal processes, to ensure that the risks to the Group’s viability are understood and managed. The Board has concluded that the Group’s processes continue to provide a comprehensive framework that effectively supports the operational and strategic objectives of the Group and provides a robust basis for assessment and confirmation of the Company’s ability to continue in operation and meet its obligations as they fall due over the period of assessment. Supporting the qualitative assessment was a quantitative analysis performed through the strategic business plan including, but not limited to, the Group’s ability to generate cash. We have continued to stress test the plan against several severe but plausible downside scenarios linked to certain principal risks as follows:
Scenario 1: the impact of changes to foreign exchange rates was considered, particularly the depreciation of key currencies – principal risk: foreign exchange
Scenario 2: lower estimates for sales volumes were assessed – principal risk: declining consumer demand
Scenario 3: lower estimates for sales revenue for reasons other than volume decline are considered – principal risk: channel mix
Scenario 4: the impact of higher raw material costs was also considered.
The above scenarios were tested in isolation as well as in combination and our stress testing showed that due to the stable cash generation of our business, the Group would be able to withstand the impact of these scenarios occurring over the period of the financial forecasts by making adjustments, if required, to its operating plans within the normal course of business. Following the above, as well as carrying out a robust assessment of the Group’s risks that could threaten our business model, future performance, solvency or liquidity, the Board has concluded that the Group is well positioned to effectively manage its financial, operational and strategic risks.
Viability StatementBased on our assessment of prospects and viability as outlined above, the Directors confirm that they have a reasonable expectation that the Group will be able to continue operating and meet its liabilities as they fall due over the five-year period ending 31 December 2022.
70 Coca-Cola HBC 2017 Integrated Annual Report
VIABILITY STATEMENT

GOVERNANCE
Contents
Corporate Governance72 Board of Directors76 Corporate Governance Report104 Directors’ Remuneration Report126 Statement of Directors’ Responsibilities
Strategic R
eport
Co
rporate G
overnance
Financial Statem
entsS
wiss S
tatutory R
eporting
Supplem
entary Inform
ation
71Coca-Cola HBC 2017 Integrated Annual Report
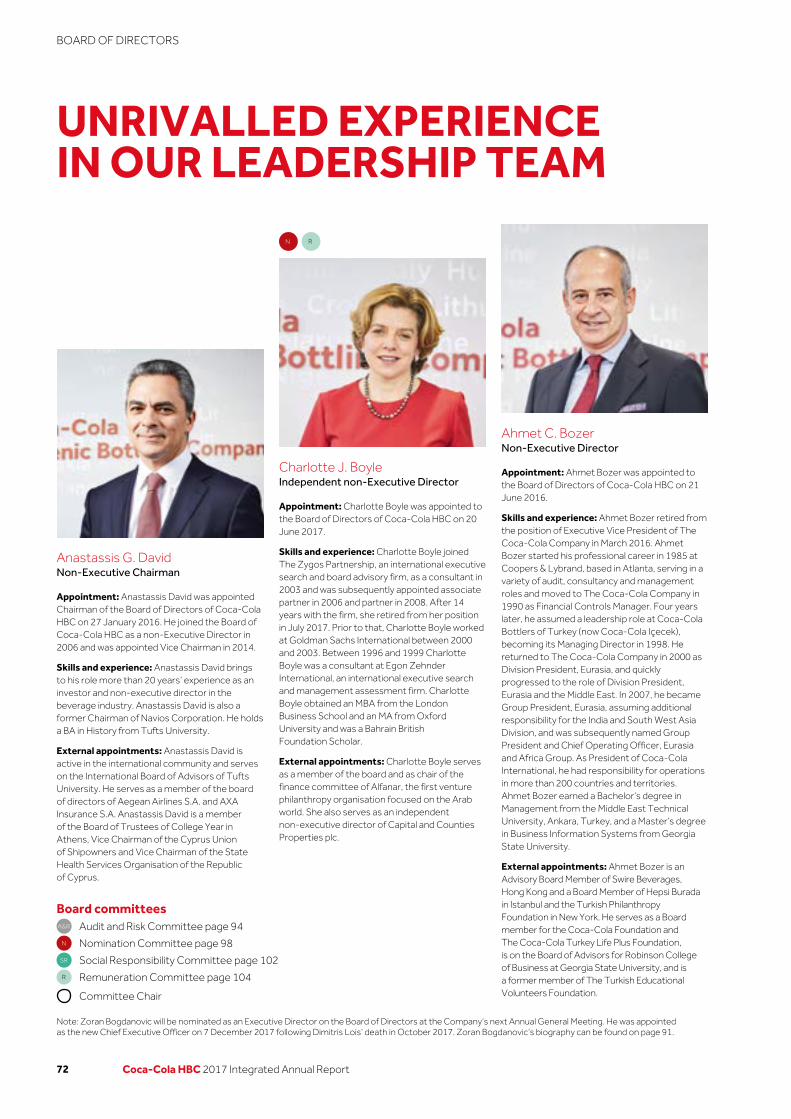
Anastassis G. DavidNon-Executive Chairman
Appointment: Anastassis David was appointed Chairman of the Board of Directors of Coca-Cola HBC on 27 January 2016. He joined the Board of Coca-Cola HBC as a non-Executive Director in 2006 and was appointed Vice Chairman in 2014.
Skills and experience: Anastassis David brings to his role more than 20 years’ experience as an investor and non-executive director in the beverage industry. Anastassis David is also a former Chairman of Navios Corporation. He holds a BA in History from Tufts University.
External appointments: Anastassis David is active in the international community and serves on the International Board of Advisors of Tufts University. He serves as a member of the board of directors of Aegean Airlines S.A. and AXA Insurance S.A. Anastassis David is a member of the Board of Trustees of College Year in Athens, Vice Chairman of the Cyprus Union of Shipowners and Vice Chairman of the State Health Services Organisation of the Republic of Cyprus.
Charlotte J. BoyleIndependent non-Executive Director
Appointment: Charlotte Boyle was appointed to the Board of Directors of Coca-Cola HBC on 20 June 2017.
Skills and experience: Charlotte Boyle joined The Zygos Partnership, an international executive search and board advisory firm, as a consultant in 2003 and was subsequently appointed associate partner in 2006 and partner in 2008. After 14 years with the firm, she retired from her position in July 2017. Prior to that, Charlotte Boyle worked at Goldman Sachs International between 2000 and 2003. Between 1996 and 1999 Charlotte Boyle was a consultant at Egon Zehnder International, an international executive search and management assessment firm. Charlotte Boyle obtained an MBA from the London Business School and an MA from Oxford University and was a Bahrain British Foundation Scholar.
External appointments: Charlotte Boyle serves as a member of the board and as chair of the finance committee of Alfanar, the first venture philanthropy organisation focused on the Arab world. She also serves as an independent non-executive director of Capital and Counties Properties plc.
Ahmet C. BozerNon-Executive Director
Appointment: Ahmet Bozer was appointed to the Board of Directors of Coca-Cola HBC on 21 June 2016.
Skills and experience: Ahmet Bozer retired from the position of Executive Vice President of The Coca-Cola Company in March 2016. Ahmet Bozer started his professional career in 1985 at Coopers & Lybrand, based in Atlanta, serving in a variety of audit, consultancy and management roles and moved to The Coca-Cola Company in 1990 as Financial Controls Manager. Four years later, he assumed a leadership role at Coca-Cola Bottlers of Turkey (now Coca-Cola Içecek), becoming its Managing Director in 1998. He returned to The Coca-Cola Company in 2000 as Division President, Eurasia, and quickly progressed to the role of Division President, Eurasia and the Middle East. In 2007, he became Group President, Eurasia, assuming additional responsibility for the India and South West Asia Division, and was subsequently named Group President and Chief Operating Officer, Eurasia and Africa Group. As President of Coca-Cola International, he had responsibility for operations in more than 200 countries and territories. Ahmet Bozer earned a Bachelor’s degree in Management from the Middle East Technical University, Ankara, Turkey, and a Master’s degree in Business Information Systems from Georgia State University.
External appointments: Ahmet Bozer is an Advisory Board Member of Swire Beverages, Hong Kong and a Board Member of Hepsi Burada in Istanbul and the Turkish Philanthropy Foundation in New York. He serves as a Board member for the Coca-Cola Foundation and The Coca-Cola Turkey Life Plus Foundation, is on the Board of Advisors for Robinson College of Business at Georgia State University, and is a former member of The Turkish Educational Volunteers Foundation.
Board committeesAudit and Risk Committee page 94
Nomination Committee page 98
Social Responsibility Committee page 102
Remuneration Committee page 104
Committee Chair
N
A&R
R
SR
UNRIVALLED EXPERIENCE IN OUR LEADERSHIP TEAM
N R
Note: Zoran Bogdanovic will be nominated as an Executive Director on the Board of Directors at the Company’s next Annual General Meeting. He was appointed as the new Chief Executive Officer on 7 December 2017 following Dimitris Lois’ death in October 2017. Zoran Bogdanovic’s biography can be found on page 91.
72 Coca-Cola HBC 2017 Integrated Annual Report
BOARD OF DIRECTORS

Olusola (Sola) David-BorhaIndependent non-Executive Director
Appointment: Sola David-Borha was appointed to the Board of Directors of Coca-Cola HBC in 2015.
Skills and experience: Sola David-Borha was Chief Executive Officer of Stanbic IBTC Holdings plc, a full service financial services group with subsidiaries in commercial banking, investment banking, pension and non-pension asset management and stockbroking. Stanbic IBTC Holdings is listed on the Nigerian Stock Exchange and is a member of Standard Bank group. Sola David-Borha has over 30 years’ experience in financial services and held several senior roles within the Stanbic Group, including the position of Chief Executive of Stanbic IBTC Bank from May 2011 to November 2012. She also served as Deputy Chief Executive Officer of Stanbic IBTC Bank and Head of Investment Banking Coverage Africa (excluding South Africa). Sola David-Borha holds a first degree in Economics, and obtained an MBA degree from Manchester Business School. Her executive education experience includes the Advanced Management Programme of the Harvard Business School and the Global CEO Programme of CEIBS, Wharton and IESE.
External appointments: Since January 2017, Sola David-Borha is the Chief Executive of the Africa Regions (excluding South Africa) for Standard Bank Group, Africa’s largest bank by assets with operations in 20 countries across the continent. Sola David-Borha is an Honorary Fellow of the Chartered Institute of Bankers of Nigeria (CIBN) and a former Vice Chairman of the Nigerian Economic Summit Group.
William W. (Bill) Douglas IIIIndependent non-Executive Director
Appointment: Bill Douglas was appointed to the Board of Directors of Coca-Cola HBC on 21 June 2016.
Skills and experience: Bill Douglas is a former Vice President of Coca-Cola Enterprises, a position in which he served from July 2004 until his retirement in June 2016. Bill Douglas has held various positions within the Coca-Cola System since 1985. In 1991, he was appointed Division Finance Manager for the Nordic & Northern Eurasia Division of The Coca-Cola Company. Bill Douglas moved to Atlanta in 1994 as Executive Assistant to the President of The Coca-Cola Company’s Greater Europe Group. In 1996, Bill Douglas became Nordic Region Manager. In 1998, he was appointed Controller of Coca-Cola Beverages plc. From 2000 until 2004, Bill Douglas served as Chief Financial Officer of Coca-Cola HBC. He joined Coca-Cola Enterprises in 2004 when he was appointed Vice President, Controller and Principal Accounting Officer. He was appointed Senior Vice President and Chief Financial Officer in 2005 and Executive Vice President and Chief Financial Officer of Coca-Cola Enterprises in 2008. From 2013 to 2015, Bill Douglas was the Executive Vice President, Supply Chain. Before joining the Coca-Cola System, Bill Douglas was associated with Ernst & Whinney, an international accounting firm. He received his undergraduate degree from the J.M. Tull School of Accounting at the University of Georgia.
External appointments: : Bill Douglas is the Lead Director and Chairman of the Audit Committee of SiteOne Landscape Supply, Inc. He is also member of the Board of Directors and Chair of the Audit Committee for The North Highland company. Finally, Bill Douglas is the Chairman of the Board of the University of Georgia Trustees.
Reto FrancioniSenior Independent non-Executive Director
Appointment: Reto Francioni was appointed to the Board of Directors of Coca-Cola HBC on 21 June 2016.
Skills and experience: Reto Francioni has been Professor of Applied Capital Markets Theory at the University of Basel since 2006 and is the author of several highly respected books on capital market issues. From 2005 until 2015, Reto Francioni was Chief Executive Officer of Deutsche Börse AG and from 2002 until 2005, he served as Chairman of the Supervisory Board and President of the SWX Group, which owns the Swiss Stock Exchange and has holdings in other exchanges. Between 2000 and 2002, Reto Francioni was Co-Chief Executive Officer and Spokesman for the Board of Directors of Consors AG. Between 1993 and 2000, he held various management positions at Deutsche Börse AG, including that of Deputy Chief Executive Officer. From 2003 until 2005, Reto Francioni was an Adjunct Professor of Economics and Finance at Zicklin School of Business, part of the City University of New York. He earned his Doctorate of Law at the University of Zurich.
External appointments: Reto Francioni serves as a member of the Board of Directors of UBS Group and also as the Chairman of the Supervisory Board of Swiss International Airlines.
A&R
A&R
N R
73Coca-Cola HBC 2017 Integrated Annual Report
Strategic R
eport
Co
rporate G
overnance
Financial Statem
entsS
wiss S
tatutory R
eporting
Supplem
entary Inform
ation

Christo Leventis Non-Executive Director
Appointment: Christo Leventis was appointed to the Board of Directors of Coca-Cola HBC in 2014.
Skills and experience: Christo Leventis worked as an Investment Analyst with Credit Suisse Asset Management from 1994 to 1999. In 2001, he joined J.P. Morgan Securities as an Equity Research Analyst focusing on European beverage companies. From 2003 until March 2014, Christo Leventis was a member of the Board of Directors of Frigoglass S.A.I.C., a leading global manufacturer of commercial refrigeration products for the beverage industry. Christo Leventis holds a BA in Classics from University College London and an MBA from the Kellogg School of Management in Chicago.
External appointments: In 2003, Christo Leventis started the private equity investment arm of Alpheus, a private asset management company, and he continues to serve as a member of its investment advisory committee.
Alexandra PapalexopoulouIndependent non-Executive Director
Appointment: Alexandra Papalexopoulou was appointed to the Board of Directors of Coca-Cola HBC in 2015.
Skills and experience: Alexandra Papalexopoulou worked previously for the OECD and the consultancy firm Booz, Allen & Hamilton, in Paris. From 2003 until February 2015 she served as a member of the board of directors of Frigoglass S.A.I.C., from 2010 to 2015 she served as a member of the board of directors of National Bank of Greece and from 2007 to 2009 she served as a member of the board of directors of Emporiki Bank. Alexandra Papalexopoulou holds a BA in Economics and Mathematics from Swarthmore College, USA, and an MBA from INSEAD, France.
External appointments: Alexandra Papalexopoulou is the Strategic Planning Director at Titan Cement Company S.A., where she has been employed since 1992 and serves as Executive Director since 1995. Alexandra Papalexopoulou is treasurer and a member of the board of directors of the Paul and Alexandra Canellopoulos Foundation, a member of the board of directors of the ALBA College of Business Administration Association and a member of the board of trustees of the American College of Greece.
Anastasios I. LeventisNon-Executive Director
Appointment: Anastasios Leventis was appointed to the Board of Directors of Coca-Cola HBC in 2014.
Skills and experience: Anastasios Leventis holds a BA in Classics from the University of Exeter and an MBA from New York University’s Leonard Stern School of Business.
External appointments: Anastasios Leventis is currently employed by Leventis Overseas Limited, a company that imports and exports to West Africa, and is a board member of A.G. Leventis (Nigeria) Plc. Anastasios Leventis is also a director of Alpheus Group Limited, a private asset management company managing assets of private clients and charitable foundations. In addition, he serves as a trustee of the A.G. Leventis Foundation, a member of the board of overseers of the Gennadius Library in Athens and a member of the Campaign board of the University of Exeter.
N R
SR
SR
Board committeesAudit and Risk Committee page 94
Nomination Committee page 98
Social Responsibility Committee page 102
Remuneration Committee page 104
Committee Chair
N
A&R
R
SR
74 Coca-Cola HBC 2017 Integrated Annual Report
BOARD OF DIRECTORS CONTINUED

José Octavio ReyesNon-Executive Director
Appointment: José Octavio Reyes was appointed to the Board of Directors of Coca-Cola HBC in 2014.
Skills and experience: José Octavio Reyes is the former Vice Chairman of The Coca-Cola Export Corporation, a position in which he served from January 2013 until his retirement in March 2014. He was president of the Latin America Group of The Coca-Cola Company from December 2002 to December 2012. Following various managerial positions in Mexico, Brazil and in The Coca-Cola Company headquarters in Atlanta, José Octavio Reyes was named President of the North Latin America Division of Coca-Cola in 2002. Prior to joining Coca-Cola, José Octavio Reyes spent five years with Grupo IRSA, a Monsanto Company joint venture. José Octavio Reyes holds a BSc in Chemical Engineering from the Universidad Nacional Autónoma de México and an MBA from the Instituto Tecnológico de Estudios Superiores de Monterrey.
External appointments: José Octavio Reyes has been a member of the board of directors of MasterCard WorldWide since January 2008 and is a member of the board of directors of Papalote Children’s Museum in Mexico City and Fundación UNAM. He has been a Director of Coca-Cola FEMSA S.A.B. de C.V. since 2016.
Robert Ryan RudolphNon-Executive Director
Appointment: Robert Ryan Rudolph was appointed to the Board of Directors of Coca-Cola HBC on 21 June 2016.
Skills and experience: From 1993 until 2006, Robert Ryan Rudolph worked as an attorney at the business law firm Lenz & Staehelin in Zurich. Prior to that, Robert Ryan Rudolph worked as a public relations consultant at the public relations agency Huber & Partner in Zurich, as marketing assistant and subsequently as manager at Winterthur Life Insurance as well as part-time with D&S, the Institute for Marketing and Communications Research in Zurich. Robert Ryan Rudolph obtained an LLM from the University of Zurich and is admitted to the Zurich bar. Robert Ryan Rudolph also studied at the Faculté des Lettres of the University of Geneva as well as the Ecole Polytechnique in Lausanne.
External appointments: Robert Ryan Rudolph is an attorney and partner at the Zurich-based law firm Oesch & Rudolph. In addition, he serves as a member of the Foundation Board of the A.G. Leventis Foundation and as a member of the board of various privately held companies.
John P. SechiIndependent non-Executive Director
Appointment: John Sechi was appointed to the Board of Directors of Coca-Cola HBC in 2014.
Skills and experience: John Sechi started his career as a financial analyst and audit manager. In 1985, he joined The Coca-Cola Company as an internal auditor. In 1987, John Sechi became the Finance Director for Coca-Cola Great Britain Limited based in London. The following year, he was appointed General Manager of the European Supply Point Group and in 1990 he moved to Madrid to join the Iberian Division as Chief Financial Officer. In 1993, John Sechi was promoted to President of the Central Mediterranean Division of The Coca-Cola Company, based in Milan, where he was responsible for operations in Greece, Cyprus, Malta, Bulgaria, Former Yugoslavia (Croatia, Serbia, Bosnia, Montenegro, Kosovo and FYROM), Albania and Italy. In 1998, he was promoted to President of the German Division, based in Düsseldorf. John Sechi was Chairman of Globalpraxis, a commercial consulting firm, from 2001 to 2008. From 2007 until 2013, he was President, Greater Europe of The Campbell Soup Company, and from 2006 to 2011, a non-executive Board member and Chairman of the Audit Committee of Coca-Cola Içecek. John Sechi has a BA in Business Management from Ryerson University in Toronto and is a Chartered Accountant (Canada) and a Chartered Professional Accountant.
External appointments: John Sechi is a non-executive director and advisor to various privately-held companies, and serves as Executive Chairman of Sechi & Sechi Properties Limited.
A&RSR
75Coca-Cola HBC 2017 Integrated Annual Report
Strategic R
eport
Co
rporate G
overnance
Financial Statem
entsS
wiss S
tatutory R
eporting
Supplem
entary Inform
ation

GOOD GOVERNANCE SITS AT THE HEART OF OUR COMPANY
Good governance continues to sit at the heart of our CompanyAs a Board, our aim is to ensure the highest standards of corporate governance, accountability and risk management. Our internal policies and procedures, which have been consistently effective since the Group was formed, are properly documented and communicated against the framework applicable to premium listed companies in the UK.
The UK Corporate Governance Code sets out the principles of good practice in relation to board leadership and effectiveness, remuneration, accountability and relationships with shareholders. Further information on our compliance with these main principles for the year ended 31 December 2017 can be found in this report as follows:
Main principle Page
Leadership 78 Effectiveness 84 Accountability 82 Remuneration 104 Relations with shareholders 87
Further details on the corporate governance regime applying to the Company are described in detail on page 89.
Strategy and oversightThe Board’s principal focus during the year continued to be on the execution of our strategic objectives, which are mainly to drive volume growth, focus on value, improve efficiency and invest in the business, as described in detail in the Strategic Report. We were also particularly focused on aligning strategically with The Coca-Cola Company in all of our markets and managing the risks related to the external environment. These include risks associated with currency volatility, geopolitical instability and adverse macroeconomic conditions. Our governance framework is designed to ensure appropriate oversight and challenge.
The Board’s meetings are split between consideration of the longer-term vision and strategy of the Group and operational and financial updates on the markets where we operate. These updates provide links and context for the strategic discussions, as well as governance oversight. Meetings take place in Zug, Switzerland, but also in selected markets across our footprint, in order for the Board to interact with local management and learn more about their challenges and the way they are operating at a local level. For instance, we held our June 2017 meeting in Belgrade, Serbia, which represents one of our Emerging markets.
Dear ShareholderAs Chairman, I believe that the Board continues to be highly effective in performing its role and ensures that we have a strong and effective governance system throughout the Group which supports high corporate governance standards. With this in mind, on behalf of the Board, I am pleased to introduce our Corporate Governance Report.
We have renewed our Board in the last few years, with seven of the 12-strong Board having been appointed in the last two years. The results of our work this year on strategy, CEO succession and the reinforcement of corporate governance and sustainability commitments is a testament to the effectiveness of the Board as well as the appropriateness of the present skill set.
Anastassis G. DavidChairman of the Board
CORPORATE GOVERNANCE REPORT
Letter from the Chairman of the Board
76 Coca-Cola HBC 2017 Integrated Annual Report

Culture and valuesOur strong corporate culture is fundamental to our business success. The Board plays a critical role in shaping the culture of the Company by promoting values-based conduct. The Company’s culture is defined by our six core values: authenticity, excellence, learning, caring for our people, performing as one, and winning with customers. These values make for a culture where our people have a strong sense of integrity and ownership.
We monitor our progress in integrating our values through various indicators including our Values Index, Employee Engagement Index, diversity indicators, and health and safety indicators. We understand the importance of the Board’s role in establishing the Company’s ‘tone from the top’ in terms of its culture and values, and our Directors lead by example as ambassadors of our values in order to cascade good behaviour through the organisation. By focusing on continuous improvement, we model the values of excellence and learning.
Appointments and Board compositionDuring 2017, the Nomination Committee reviewed the composition of the Board to ensure it has the appropriate balance of skills, experience, independence and knowledge in order to discharge its duties and responsibilities effectively. As a result of this review, we recommended Charlotte Boyle as a new non-Executive Director, following the retirement of Antonio D’Amato. Charlotte brings significant skills and experience in the areas of people, talent, succession and executive remuneration to the Board, Nomination Committee and Remuneration Committee. Our Nomination Committee is devoted to developing strong succession plans for the Board and senior management. The internal appointment of Zoran Bogdanovic as our new CEO, following the untimely death of Dimitris Lois, is a testament to the quality of the work of the Committee.
Board evaluationIn line with our commitment to adhere to best corporate governance practices, a Board effectiveness evaluation was conducted in the second half of 2017. We will do this once again in 2018 to build upon the learnings of the 2017 evaluation. Further details are set out in the Nomination Committee Report on page 98.
Anastassis G. DavidChairman of the Board
Board composition and diversityWe will continue to keep the composition and size of the Board under review. We believe that our Board is well balanced and diverse, with the right mix of international skills, experience, background, independence and knowledge.
The Board is committed to recruiting Directors with diverse backgrounds, personalities, skills and experience. We continue to make good progress in improving the diversity of the Board and senior management and increased the number of women on the Board during 2017. We will continue to attach importance to all aspects of diversity in our nomination processes, while at the same time appointing candidates with the credentials that are necessary for the continuing growth of our operations within a highly competitive and specialised industry. Our Board Diversity Policy guides the Board and the Nomination Committee in relation to their approach to diversity in respect of succession planning and the selection process for the appointment of new Board members. Further details on our approach to Board diversity are set out on page 100.
77Coca-Cola HBC 2017 Integrated Annual Report
Strategic R
eport
Co
rporate G
overnance
Financial Statem
entsS
wiss S
tatutory R
eporting
Supplem
entary Inform
ation

Coca-Cola HBC’s Board Nomination Policy requires that each Director is recognised as a person of the highest integrity and standing, both personally and professionally. Each Director must be ready to devote the time necessary to fulfil his or her responsibilities to the Company according to the terms and conditions of his or her letter of appointment. Each Director should have demonstrable experience, skills, and knowledge which enhance Board effectiveness and will complement those of the other members of the Board to ensure an overall balance of experience, skills, and knowledge on the Board. In addition, each Director must demonstrate familiarity with and respect for good corporate governance practices, sustainability and responsible approaches to social issues.
Business characteristics Qualifications, skills and experience DirectorsOur business is extensive and involves complex financial transactions in the various jurisdictions where we operate.
Experience in finance, investments and accounting12
Our business is truly international with operations in 28 countries, at different stages of development, on three continents.
Broad international exposure and emerging and developing markets experience
12Our business involves the manufacturing, sale and distribution of the world’s leading non-alcoholic beverage brands.
Extensive knowledge of our business and the fast-moving consumer goods industry, as well as experience with manufacturing, route to market and customer relationships 8
Our Board’s responsibilities include the understanding and oversight of the key risks we are facing, establishing our risk appetite and ensuring that appropriate policies and procedures are in place to effectively manage and mitigate risks.
Risk oversight and management expertise
6 Building community trust through the responsible and sustainable management of our business is an indispensable part of our culture.
Expertise in sustainability and experience in community engagement
7 Our business involves compliance with many different regulatory and corporate governance requirements across a number of countries, as well as relationships with national governments and local authorities.
Expertise in corporate governance and/or government relations
6
Board composition
Membership of the BoardOn 31 December 2017, our Board comprised 12 Directors: the Chairman, one Senior Independent Director and 10 non-Executive Directors. The biographies of each member of the Board are set out on pages 72 to 75.
At the Annual General Meeting on 20 June 2017, Charlotte Boyle was appointed as a non-Executive Director of the Board, and as a member of the Nomination Committee and Remuneration Committee, following the retirement of Antonio D’Amato. Further details on Charlotte Boyle’s appointment are set out in the Nomination Committee Report on page 98.
In September 2017, Dimitris Lois took medical leave of absence to undergo treatment for a medical condition. Michalis Imellos (our Chief Financial Officer) served as Acting Chief Executive Officer from 15 September 2017 to 7 December 2017. On 7 December 2017, Zoran Bogdanovic was appointed as the new Chief Executive Officer (CEO) following Dimitris Lois’ untimely death on 2 October 2017.
Zoran Bogdanovic will also be nominated as an Executive Director on the Board of Directors at the Company’s next Annual General Meeting. Zoran Bogdanovic was previously the Company’s Region Director responsible for operations in 12 countries, and has been a member of the Operating Committee since 2013. He joined the Company in 1996 and has held a number of senior leadership positions, including as General Manager of the Company’s operations in Croatia, Switzerland and Greece. Zoran Bogdanovic’s biography can be found on page 91. Further details on the CEO succession are set out in the Nomination Committee Report on page 98.
The Operating Committee, described on page 90, supports Zoran Bogdanovic in his role as CEO.
The non-Executive Directors, of whom six are determined by the Board to be independent, are experienced individuals from a range of backgrounds, countries and industries. The composition of the Board complies with the UK Corporate Governance Code’s recommendation that at least half of the Board, excluding the Chairman, comprise independent Directors.
CORPORATE GOVERNANCE REPORT CONTINUED
General qualifications required of all Directors
78 Coca-Cola HBC 2017 Integrated Annual Report

Outside appointmentsThe Articles of Association of the Company (article 36) set out limits on the maximum number of external appointments that members of our Board and executive management may hold. In addition, if a Board member wishes to take up an external appointment he or she must ask our Chairman’s permission to do so (and the Chairman must consult the Chairman of the Nomination Committee). The Chairman will assess all requests on a case-by-case basis, including whether the appointment in question could negatively impact the Company or the performance of the Director’s duties to the Group. The nature of the appointment and the expected time commitment are also assessed to ensure that the effectiveness of the Board would not be compromised.
Details of the external appointments of our non-Executive Directors are contained in their respective biographies set out on pages 72 to 75.
Our Chairman holds positions on the Boards of Aegean Airlines S.A. and AXA Insurance S.A. He is a member of the International Board of Advisors at Tufts University. He is a member of the Board of Trustees of College Year in Athens, Vice Chairman of the Cyprus Union of Shipowners and Vice Chairman of the State Health Services Organisation of the Republic of Cyprus. In this context, the Board considers that fewer than four of the positions held by the Chairman are considered to be significant.
Having considered the scope of the external appointments of the Directors referred to above, our Board is satisfied that they do not compromise the effectiveness of the Board as each Director has sufficient time to devote to his or her role on the Board as the Board requires.
IndependenceOur Board has concluded that Charlotte J. Boyle (appointed on 20 June 2017), Olusola (Sola) David-Borha, William W. (Bill) Douglas III, Reto Francioni, Alexandra Papalexopoulou and John P. Sechi are deemed to be independent in accordance with the criteria set out in the UK Corporate Governance Code, with such individuals being independent in both character and judgement. Antonio D’Amato who retired from the Board on 20 June 2017 was also deemed to be independent in accordance with the same criteria.
The other non-Executive Directors, Anastassis G. David (Chairman), Anastasios I. Leventis, Christo Leventis, José Octavio Reyes, Ahmet C. Bozer and Robert Ryan Rudolph, were appointed at the request of shareholders of the Company: Kar-Tess Holding and The Coca-Cola Company. They are therefore not considered to be independent as defined by the UK Corporate Governance Code.
Anastassis G. David was appointed as Chairman on 27 January 2016. The Board specifically considered Anastassis David’s qualifications, skills, and experience prior to his appointment.
The Board firmly believes that Anastassis David embodies the Company’s core values, heritage and culture and that these attributes, together with his strong identification with the Company and its shareholders’ interests, and his deep knowledge and experience of the Coca-Cola System, will ensure an effective and appropriately balanced leadership of the Board and the Company.
Shareholders’ nomineesAs described under the heading ‘Major shareholders’ on page 230, since the main listing of the Company on the Official List of the London Stock Exchange in 2013, Kar-Tess Holding, The Coca-Cola Company and their respective affiliates have no special rights in relation to the appointment or re-election of nominee Directors, and those Directors of the Company who were originally nominated at the request of The Coca-Cola Company or Kar-Tess Holding will be required to stand for re-election on an annual basis in the same way as the other Directors. The Nomination Committee is responsible for identifying and recommending persons for subsequent nomination by the Board for election as Directors by the shareholders on an annual basis.
As our Board currently comprises 12 Directors, neither Kar-Tess Holding nor The Coca-Cola Company is in a position to control (positively or negatively) decisions of the Board that are subject to simple majority approval. However, decisions of the Board that are subject to the special quorum provisions and supermajority requirements contained in the Articles of Association, in practice, require the support of Directors nominated at the request of at least one of either The Coca-Cola Company or Kar-Tess Holding in order to be approved. In addition, based on their current shareholdings, neither Kar-Tess Holding nor The Coca-Cola Company are in a position to control a decision of the shareholders (positively or negatively), except to block a resolution to wind up or dissolve the Company or to amend the supermajority voting requirements. The latter requires the approval of 80% of shareholders where all shareholders are represented and voting. Depending on the attendance levels at Annual General Meetings, Kar-Tess Holding or The Coca-Cola Company may also be in a position to control other matters requiring supermajority shareholder approval.
Anastassis G. David, Anastasios I. Leventis, Christo Leventis and Robert Ryan Rudolph were all originally appointed at the request of Kar-Tess Holding. José Octavio Reyes and Ahmet C. Bozer have been appointed at the request of The Coca-Cola Company.
Separation of rolesThere is a clear separation of the roles of the Chairman and the Chief Executive Officer. The Chairman is responsible for the operation of the Board and for ensuring that all Directors are properly informed and consulted on all relevant matters. The Chairman is also actively involved in the work of the Nomination Committee concerning succession planning and the selection of key people. The Chief Executive Officer, Zoran Bogdanovic, is responsible for the day-to-day management and performance of the Company and for the implementation of the strategy approved by the Board.
79Coca-Cola HBC 2017 Integrated Annual Report
Strategic R
eport
Co
rporate G
overnance
Financial Statem
entsS
wiss S
tatutory R
eporting
Supplem
entary Inform
ation

CORPORATE GOVERNANCE REPORT CONTINUED
Key roles and responsibilities
The roles and responsibilities of our Chairman, Chief Executive Officer, Senior Independent Director, non-Executive Directors and Company Secretary are set out in detail in our Organisational Regulations which can be found at http://coca-colahellenic.com/en/about-us/corporate-governance/corporate-governance-overview/. Their key responsibilities are as follows:
Chairman• leads the Board, presides over its meetings and ensures
its effectiveness;• sets the agenda for Board meetings, ensures that
adequate time is available for discussion and makes sure that Board members get timely, accurate and clear information;
• promotes a culture of openness and debate;• ensures the highest standards of corporate governance;• is the main point of contact between the Board
and management;• co-ordinates the work of the Board committees with
committee Chairs; and• ensures effective communication with shareholders
and stakeholders.
Chief Executive Officer• leads the development and execution of our long-term
strategy with a clear view to creating shareholder value;• is responsible for day-to-day management and
implementation of the Board’s direction and policies;• acts as a liaison between the Board and management and
communicates with the Board on behalf of management; and
• communicates on behalf of the Group with shareholders, employees, government authorities, other stakeholders and the public.
Company Secretary• ensures good information flows within the Board and
its committees;• facilitates induction and assists with the Board’s
professional development requirements;• helps the Board and the Chairman to co-ordinate
and fulfil their duties and assignments; and• advises the Board on governance matters.
Senior Independent Director• acts as a sounding board for the Chairman;• leads the independent non-Executive Directors on
matters that benefit from an independent review; and• is available to shareholders if they have concerns which
have not been resolved through the normal channels of communication.
Non-Executive DirectorsThe main responsibilities of the non-Executive Directors are set out in the UK Corporate Governance Code and include:• scrutinising the performance of management in meeting
agreed goals and objectives;• challenging constructively and helping develop the
Group’s strategy;• ensuring the integrity of financial information;• ensuring that executive remuneration is at appropriate
levels; and• overseeing succession planning, including the
appointment of Executive Directors.
The appointment of the non-Executive Directors is for the period from the date of their election until the next Annual General Meeting. The non-Executive Directors are required to stand for re-election on an annual basis. Upon appointment, non-Executive Directors confirm they are able to allocate sufficient time to meet the requirements of the role.
Board committeesOur Board has delegated specific tasks to its committees as set out in the Organisational Regulations and reports from these committees are set out in this Corporate Governance Report. Biographies of the Chairmen of the Board committees and the other members of the Board, the Audit and Risk Committee, the Nomination Committee, the Remuneration Committee and the Social Responsibility Committee are set out on pages 72 to 75.
80 Coca-Cola HBC 2017 Integrated Annual Report

Governance framework
Board of Directors
Nomination Committee
Responsibilities – reviewing the size and
composition of the Board;
– identifying candidates and nominating new members to the Board;
– planning and managing, in consultation with the Chairman, a Board membership succession plan;
– ensuring, together with the Chairman, the operation of a satisfactory induction programme for new members of the Board and a satisfactory ongoing training and education programme for existing members of the Board and its committees as necessary to deliver on our strategy. The Committee will also oversee an externally facilitated self-assessment process;
– setting the criteria for, and overseeing, the annual assessment of the performance and effectiveness of each member of the Board and each Board committee;
– conducting an annual assessment of the performance and effectiveness of the Board and reporting conclusions and recommendations based on the assessment to the Board; and
– ensuring that each committee of the Board is carrying out a self-assessment of its performance and reporting its conclusions and any recommendations for change to the Board.
Remuneration Committee
ResponsibilitiesReviewing and approving:
– the rewards for the executives of the Group;
– Company-wide remuneration and benefit plans;
– all non-cash obligations greater than €15,000 which are reportable by employees as income (except personal use of company cars and group life or health benefits);
– general policies governing the early termination of employment of the executives of the Group; and
– the implementation or modification of employee coverage for any benefit plan resulting in an increased annual cost of €5 million or more.
Social Responsibility Committee
Responsibilities – establishing the principles
governing the Group’s policies on social responsibility and the environment to guide management’s decisions and actions;
– overseeing the development and supervision of procedures and systems to ensure the achievement of the Group’s social responsibility and environmental goals;
– establishing and operating a council responsible for developing and implementing policies and strategies to achieve the Company’s social responsibility and environmental goals and ensuring Group-wide capabilities to execute such policies and strategies;
– ensuring the necessary and appropriate transparency and openness in the Group’s business conduct in pursuit of its social responsibility and environmental goals;
– ensuring and overseeing the Group’s interactions with stakeholders in relation to its social responsibility and environmental policies, goals and achievements, including the level of compliance with internationally accepted standards; and
– reviewing Group policies on environmental issues, human rights, and other topics as they relate to social responsibility.
Operating CommitteeThe Operating Committee, led by the Chief Executive Officer, meets 12 times each year and is responsible for:
– the day-to-day executive management of the Group and its businesses, including all matters not reserved for the Board or other bodies;
– the development of the Group strategies and implementation of the strategies approved by the Board;
– providing adequate head-office support for each of the Group’s countries;
– the setting of annual targets and approval of annual business plans which form the basis of the Group’s performance management, including a comprehensive programme of strategies and targets agreed between the Country General Managers and the Region Directors;
– working closely with the Country General Managers, as set out in the Group’s operating framework, in order to capture benefits of scale, ensuring appropriate governance and compliance, and managing the performance of the Group; and
– leading the Group’s talent and capability development programmes.
Audit and Risk Committee
Responsibilities – providing advice to the Board
on whether the Annual Report and Accounts, taken as a whole, is fair, balanced and understandable and provides the information necessary for shareholders to assess our position and performance;
– monitoring the quality, fairness and integrity of the financial statements of the Group and reviewing significant financial reporting issues and judgements contained in them;
– reviewing the Group’s internal financial control and anti-fraud systems as well as the Group’s broader enterprise risk management and legal and ethical compliance programmes (including computerised information system controls and security) with the input of the external auditors and the internal audit department;
– reviewing and evaluating the Group’s major areas of financial risk and the steps taken to monitor and control such risk, as well as guidelines and policies governing risk assessment; and
– monitoring and reviewing the external auditors’ independence, quality, adequacy and effectiveness, taking into consideration the requirements of all applicable laws in Switzerland and the UK, the listing requirements of the London Stock Exchange and Athens Stock Exchange, and applicable professional standards.
81Coca-Cola HBC 2017 Integrated Annual Report
Strategic R
eport
Co
rporate G
overnance
Financial Statem
entsS
wiss S
tatutory R
eporting
Supplem
entary Inform
ation

Board and committee attendance in 2017 The following table shows the membership of the Board committees and includes the Directors’ attendance at Board and committee meetings during the period between 1 January and 31 December 2017.
Board Audit and Risk1 Remuneration Nomination Social Responsibility
Director Independent AttendedTotal
meetings AttendedTotal
meetings AttendedTotal
meetings AttendedTotal
meetings AttendedTotal
meetings
Anastassis G. David No 7 7 – – – – – – – – Dimitris Lois2 No 6 6 – – – – – – – – Charlotte J. Boyle3 Yes 4 4 – – 3 3 3 3 – – Ahmet C. Bozer No 7 7 – – – – – – – – Olusola (Sola) David-Borha4 Yes 7 7 7 8 – – – – – – William W. (Bill) Douglas III Yes 7 7 8 8 – – – – – – Antonio D’Amato5 Yes 3 3 – – 1 1 1 1 – – Reto Francioni6 Yes 6 7 – – 3 4 3 4 – – Anastasios I. Leventis No 7 7 – – – – – – 4 4Christo Leventis No 7 7 – – – – – – – – Alexandra Papalexopoulou Yes 7 7 – – 4 4 4 4 4 4José Octavio Reyes7 No 7 7 – – – – – – 3 4Robert Ryan Rudolph No 7 7 – – – – – – – – John P. Sechi Yes 7 7 8 8 – – – – – –
1. Includes four conference calls.2. Dimitris Lois was eligible to attend six meetings of the Board held prior to his untimely death on 2 October 2017.3. Charlotte Boyle was appointed to the Board on 20 June 2017. She was eligible to attend four meetings of the Board, three meetings of the Remuneration Committee
and three meetings of the Nomination Committee held after her appointment.4. Sola David-Borha did not attend one meeting of the Audit and Risk Committee due to a long-standing prior commitment.5. Antonio D’Amato retired from the Board and Nomination Committee on 20 June 2017. He was eligible to attend three meetings of the Board and one meeting
of the Remuneration and Nomination committees held prior to his retirement.6. Reto Francioni did not attend the meetings in June 2017 due to a prior long-standing commitment.7. José Octavio Reyes did not attend the Social Responsibility Committee meeting in December 2017 due to a prior long-standing commitment.
Operation of the Board
Board governance of the CompanyThe governance process of the Board is set out in our Articles of Association and the Organisational Regulations. These regulations define the role of the Board and its committees, their respective responsibilities and authority, their processes and their relationship with management. The Articles and the Organisational Regulations can be found at http://coca-colahellenic.com/en/about-us/corporate-governance/corporate-governance-overview/.
Role of the BoardOur Board has ultimate responsibility for our long-term success and for delivering sustainable shareholder value. There is a clear division of responsibilities between the Board and the executive responsibility for the running of our business, with certain matters specifically reserved for the Board’s decision.
Key tasks of the Board include:
– providing entrepreneurial leadership within the Company’s control and risk management framework;
– determining the long-term business strategy and objectives of the Group and monitoring the implementation of the strategy and the achievement of those objectives;
– reviewing and approving the annual business plan;
– setting appropriate risk parameters and monitoring to ensure that effective risk management and internal control processes are in place;
– assessing the principal risks to the Company’s business model, future performance, solvency and liquidity;
– assessing the longer-term viability of the Company;
– reviewing and approving periodic financial reports;
– performing Board and senior management succession planning;
– setting the Company’s culture, values, and standards and ensuring that its obligations to shareholders are understood and met;
– monitoring the Group’s compliance programmes to ensure effective corporate governance; and
– supervising management.
In addition, the Swiss Ordinance against Excessive Compensation in Listed Companies imposes certain obligations on the Board, including a requirement to prepare a remuneration report pursuant to Swiss law. The remuneration report must be made available for inspection, together with the Swiss business report and audit report, no later than 20 days prior to the ordinary shareholders’ meeting at the offices of the Company. Any shareholder may request a copy of these reports when available.
CORPORATE GOVERNANCE REPORT CONTINUED
82 Coca-Cola HBC 2017 Integrated Annual Report

Summary of key Board activities for 2017 and priorities for 2018Topic 2017 activity 2018 priority
Strategy • Reviewed our total beverage portfolio together with The Coca-Cola Company (TCCC), including product, activation and distribution initiatives
• reviewed our revenue growth management and route-to-market strategies
• held deep-dive discussions concerning our digital and e-commerce programmes; and
• reviewed progress against the Company’s 2020 targets
• Support the acceleration of product and package innovation
• continue optimisation of costs and investments, driving process efficiency while improving customer satisfaction
• continue playing an industry-leading role on sustainability
• continue ensuring effective alignment with TCCC
Performance • Reviewed business performance, including key business indicators for talent, engagement, sales, cost optimisation, profitability and sustainability
• held deep-dive reviews of the Company’s largest markets, including Nigeria, Russia, Italy, Poland and Romania
• held periodic reviews of macroeconomic indicators, FX volatility and commodities prices
• Periodic performance reviews with a focus on the Company’s key business indicators
• deep-dive reviews of each of the Company’s regions
• monitoring of external factors such as macroeconomic conditions, FX volatility and commodities markets
Risk management and internal control
• Risk discussions with the Audit and Risk Committee four times during the year
• ongoing oversight of regulatory and compliance risks
• periodic reviews of currency and commodities risks
• detailed review of cyber-security and risks
• Continued review of the principal risks and mitigation programmes reported on pages: 55 to 63
Operational • Periodic reviews of the Company’s main operations performance
• visit by Board members to a Group manufacturing facility and market visit in Belgrade, Serbia
• detailed review and approval of CapEx investments
• Continued review of the Company’s cost optimisation and investment programmes to ensure efficiency improvements and improved customer satisfaction
• monitoring of the effectiveness of the Company’s acceleration plan for cold drink equipment
Culture and values • Reviewed the results of the Company’s annual Employee Engagement, Values and Ambassadorship survey
• discussed talent and capabilities plans• reviewed the Group’s #YouthEmpowered
programme which involved more than 450 employee volunteers and approximately 6,000 young people
• Continue shaping the culture, values and employee engagement of the Company through the Board’s interaction with management and employees
Succession planning and diversity
• Reviewed succession planning and bench strength initiatives for managers
• developed a succession plan for Antonio D’Amato and recruited Charlotte Boyle as a new Board member
• activated the Board’s succession plan for the CEO and appointed Zoran Bogdanovic as our new CEO
• Ongoing succession planning work for Board and senior management positions
83Coca-Cola HBC 2017 Integrated Annual Report
Strategic R
eport
Co
rporate G
overnance
Financial Statem
entsS
wiss S
tatutory R
eporting
Supplem
entary Inform
ation

Information and trainingThe practices and procedures adopted by our Board ensure that the Directors are supplied on a timely basis with comprehensive information on the business development and financial position of the Company, the form and content of which is expected to enable the Directors to discharge their duties and carry out their responsibilities. All Directors have access to our General Counsel, as well as independent professional advice at the expense of the Company. All Directors have full access to the Chief Executive Officer and senior management, as well as the external auditors and internal audit team.
The Board has in place an induction programme for new Directors, which was followed this past year by Charlotte Boyle. She met individually with the Chairman, Anastassis David, Operating Committee members, and other senior executives and received orientation training from the relevant senior executives in relation to the Group and its corporate governance practices. The induction programme also included meetings with representatives of our sales force, customers and major shareholders, and visits to our production plants.
Charlotte Boyle was also appropriately briefed on Coca-Cola HBC’s strategy, financials, operations, risks and procedures in order to achieve the necessary insight into our activities.
All Directors are given the opportunity to attend training to ensure that they are kept up to date on relevant legal, accounting and corporate governance developments. The Directors individually attend seminars, forums, conferences and working groups on relevant topics. The Nomination Committee reviews our Director training activities regularly. Finally, as part of the continuing development of the Directors, the Company Secretary ensures that our Board is kept up to date with key corporate governance developments. The Board appoints the Company Secretary, who acts as secretary to the Board.
Following Dimitris Lois’ untimely death, Zoran Bogdanovic was appointed as the Company’s new Chief Executive Officer (CEO). He will also be nominated as an Executive Director at the Company’s next Annual General Meeting. Zoran Bogdanovic was a part of the Company‘s internal succession plan for the CEO position. The Nomination Committee led a thorough process and benchmarking exercise for the CEO succession. Further details on the CEO succession are set out in the Nomination Committee Report on page 98. There were no other changes to Board or committee membership during 2017.
Board effectivenessBoard, committee and Director performance evaluationAt least annually, on the basis of an assessment conducted by the Nomination Committee, the Board reviews its own performance as well as the performance of each of the Board committees. This review seeks to determine whether the Board and its committees function effectively and efficiently. During the year, the Chairman meets with the Directors to receive feedback on the functioning of the Board and its committees, the boardroom dynamics, and the Group’s strategy. Particular focus is given to areas where a Director believes the performance of the Board and its committees could be improved. A report is prepared for the Board on its effectiveness and that of its committees. For the past two years, the evaluation of the Board’s effectiveness has been facilitated by Lintstock, and details of the 2017 Lintstock Report are set out on page 85. A summary of the Board evaluation findings for 2016, the actions taken in response to improve Board effectiveness in 2017, the Board evaluation findings for 2017, and the resulting priorities for 2018 is as follows:
2016 Board evaluation findings 2017 actions
– Devote more time to discussions on strategic issues
– Succession planning, particularly for top management
– Focus on monitoring performance of the Group
– More time was dedicated to strategy discussions and the Board reviewed performance of business against the Group’s 2020 growth objectives
– Developed a robust succession plan for the retirement of one of our Board members
– Activated the contingency plans for an interim CEO and successfully appointed the new CEO from our talent pool
– Reviewed dedicated presentations on Regional performance
2017 Board evaluation findings 2018 priorities
– Focus on strategy
– Risk oversight
– Focus on CEO transition
– Evolving our total beverage portfolio in close alignment with TCCC
– Ongoing monitoring of the Group’s principal risks
The independent Directors meet separately at every regular Board meeting to discuss a variety of issues, including the effectiveness of the Board. An evaluation of each Director (other than the Chairman) is conducted by the Chairman and the Senior Independent Director. The Senior Independent Director leads the evaluation of the Chairman in conjunction with the non-Executive Directors (taking into account the views of the Chief Executive Officer) and, as a matter of practice, meets with the other independent non-Executive Directors when each Board meeting is held to discuss issues together, without the Chief Executive Officer or other non-Executive Directors present.
84 Coca-Cola HBC 2017 Integrated Annual Report
CORPORATE GOVERNANCE REPORT CONTINUED

Lintstock ReportIn 2017, we once again engaged advisory firm Lintstock to undertake an evaluation of the performance of the Board. Lintstock
specialises in Board performance reviews and has no other connection with Coca-Cola HBC.
ProcessThe first stage of the review involved Lintstock engaging with the corporate secretariat to set the context for the evaluation, and to tailor survey content to the specific circumstances of Coca-Cola HBC. All Board members were then requested to complete an online survey on the performance of the Board, its committees, and the Chairman. The anonymity of respondents was ensured throughout the process in order to promote an open and frank sharing of views.
Lintstock subsequently produced a report addressing the following areas of Board performance:
– The appropriateness of the Board’s composition was reviewed, and respondents were asked to identify any changes that ought to be made to the profile of the Board.
– The Board’s understanding of the views of key stakeholders, and of the markets in which the Company operates, was considered, and the extent to which the experience of Board members is drawn upon was reviewed.
– The Board’s engagement with management in providing effective support and constructive challenge was assessed.
The management of, and atmosphere in, meetings was also considered, as was the quality of the Board packs and the presentations given by management.
– The Board’s agenda, and in particular the balance of time between strategic and operational issues, was reviewed, and respondents were asked to identify the areas upon which they felt the Board ought to spend more or less time focusing over the next year.
– The Board’s oversight of strategy was considered, as was the capacity of the organisation to deliver strategy, and opinions on the top strategic issues facing the Company over the next three to five years were sought.
– The Board’s focus on risk was assessed, and the effectiveness with which the Board monitors culture and behaviours throughout the organisation was considered. The Company’s processes for attracting, developing and retaining talent were also reviewed.
– The performance of the committees of the Board was assessed, as was the performance of the Chairman and individual Board members.
As a result of the review, among other things the Board agreed to focus on the CEO transition, continue delivering against the Group’s strategy towards our 2020 targets, and continue focusing on risk oversight.
Conflicts of interestIn accordance with the Organisational Regulations, Directors are required to arrange their personal and business affairs so as to avoid a conflict of interest with the Group.
Each Director must disclose to the Chairman the nature and extent of any conflict of interest arising generally or in relation to any matter to be discussed at a Board meeting, as soon as the Director becomes aware of its existence. In the event that the Chairman becomes aware of a Director’s conflict of interest, the Chairman is required to contact that Director promptly and discuss with him or her the nature and extent of such a conflict of interest. Subject to exceptional circumstances in which the best interests of the Company dictate otherwise, the Director affected by a conflict of interest is not permitted to participate in discussions and decision-making involving the interest at stake.
Board appointments and succession planningOur Board has in place plans to ensure the progressive renewal of the Board and appropriate succession planning for senior management.
Pursuant to our Articles of Association, the Board consists of a minimum of seven and a maximum of 15 members and the Directors are elected annually for a term of one year by the Company’s shareholders. Accordingly, all Directors are subject to annual re-election by shareholders in accordance with the UK Corporate Governance Code. In case of resignation or death of any member of the Board, the Board may elect a permanent guest, whom the Board will propose for election by the shareholders at the next Annual General Meeting.
85Coca-Cola HBC 2017 Integrated Annual Report
Strategic R
eport
Co
rporate G
overnance
Financial Statem
entsS
wiss S
tatutory R
eporting
Supplem
entary Inform
ation

CORPORATE GOVERNANCE REPORT CONTINUED
Key investor relations activities in 2017
December
– Citi Global Consumer conference, London
November
– Investor roadshow in UK, USA and Canada
September
– Barclays Global Consumer Staples conference, Boston
Jan
Feb
Mar
Apr
May
JuneJuly
Aug
Sept
Oct
Nov
Dec
February
– Investor roadshow in UK
March
– The Consumer Analyst Group of Europe conference, London
– Investor roadshow in London
April
– Investor roadshow in the USA and Canada
May
– JP Morgan Global Consumer and Retail conference, London
June
– Deutsche Bank Access Global Consumer conference, Paris
– Annual General Meeting, Zug
– Investor roadshow in London
In accordance with the Organisational Regulations, the Board proposes for election at the shareholders’ meeting new Directors who have been recommended by the Nomination Committee after consultation with the Chairman. In making such recommendations, the Nomination Committee and the Board must consider criteria including the overall balance of skills, experience, independence and knowledge of the Board member, as well as diversity considerations including gender. See the Nomination Committee report on page 98 for further information on the role and work of the Nomination Committee, including the Board Diversity Policy. Through this process, the Board is satisfied that the Board and its committees have the appropriate balance of experience, diversity, independence and knowledge of the Company to enable them to discharge their duties and responsibilities effectively.
At the Annual General Meeting on 20 June 2017, Charlotte Boyle was appointed as a non-Executive Director, and as a member of the Nomination Committee and Remuneration Committee, following the retirement of Antonio D’Amato. Following Dimitris Lois’ untimely death, Zoran Bogdanovic was appointed as the Company’s Chief Executive Officer. He will also be nominated as an Executive Director at the Company’s next Annual General Meeting. Zoran Bogdanovic was a part of the Company’s internal succession plan for the CEO position. The Nomination Committee led a thorough process and benchmarking exercise for the CEO succession. Further details on the CEO succession are set out in the Nomination Committee Report on page 98. There were no other changes to Board or committee membership during 2017.
86 Coca-Cola HBC 2017 Integrated Annual Report

Shareholder engagementThe Chairman, the Senior Independent Director, the Chair of the Remuneration Committee and the Chairman of the Audit and Risk Committee will be available at the Annual General Meeting of the Company to answer questions from shareholders. The Board encourages shareholders to attend as it provides an opportunity to engage with the Board.
Pursuant to Swiss law and the Articles of Association, shareholders annually elect an independent proxy and we have adopted an electronic proxy voting system for our Annual General Meetings.
The Company has a dedicated investor relations function which reports to the Chief Financial Officer. Through the investor relations team, the Company and Board maintain a dialogue with institutional investors and financial analysts on operational financial performance and strategic direction items. As evident in the graphic on page 86, to reflect our commitment to our strong shareholder base, members of our management and the investor relations team held numerous meetings with investors and shareholders during 2017. The feedback from shareholders has been regularly considered by the Board and where necessary appropriate action to further engage with shareholders was taken.
Wider stakeholder engagementThe Board is regularly updated on wider stakeholder engagement feedback to stay abreast of stakeholder insights into the issues that matter most to them and our business, and to enable the Board to understand and consider these issues in decision-making. Engaging with our stakeholders strengthens our relationships and helps us make better business decisions to deliver on our commitments.
Employees are one of our most important stakeholder groups and the Board therefore closely monitors and reviews the results of the Company’s annual Employee Engagement, Values and Ambassadorship surveys as well as a number of other metrics to ensure alignment of interests. For more information about these surveys, see the People section on page 28.
The Company also engages extensively with external stakeholders through a variety of different channels including our annual Material Issues survey in which 460 stakeholders provide feedback. We also work, among others, with our customers, consumers, suppliers, local community representatives and other business partners across the value chain every day. The infographic on the following page sets out the different channels we use to engage stakeholders, which in turn is reported on to the Board.
As part of our engagement programme we also partner with people, businesses and organisations that share our interest in a sustainable future and have a stake in our business. This is essential for our success. We therefore engage in the following manner:
– Our business leaders engage with a variety of international organisations and business associations such as the UN Global Compact and the Union of European Soft Drinks Associations (UNESDA).
– As organisational stakeholders of the Global Reporting Initiative (GRI), we can share experiences and learn from people from other companies and industries.
– We are active members of the Corporate Leadership Group on Integrated Reporting, shaping the future of integrated reporting standards and stakeholder engagement.
– Our leaders are active members of local business alliances such as business leaders’ forums, local UN Global Compact networks, business councils for sustainable development and other industry associations. This work includes participating at conferences, working with civil organisations and influencing public policy related to key sustainability issues such as health and well-being, packaging, water and climate, and matters concerning social sustainability such as labour relations and talent attraction and retention.
– We work with local communities on sustainable solutions that support local and global sustainable development goals, and we actively contribute to the Sustainable Development Goals (SDGs) adopted by the UN.
– Through our partnership with The Coca-Cola Company, we have access to consumer insights globally and locally, and we also make sure our partnerships and actions related to sustainable development are in synergy with theirs.
Considering stakeholders in decision-making The Board considers the impact on stakeholders when taking a number of key decisions. Examples of these include:
– Shaping choice – in developing our product portfolio and our marketing efforts, together with The Coca-Cola Company, we consider consumer health and nutrition. This means that we are focusing on shaping choice across our portfolio of sparkling and still beverages, emphasising on low- or no-sugar variants.
– Cooler technology – cold drinks equipment (CDE) is an essential part of our engagement with customers and our consumer experience. When investing in cooling technology we carefully weigh up meeting the demands of customers and the environmental impact of our technology and thus since 2015 we have been investing in new ‘smart’ cooler technology.
– Infrastructure optimisation – during the year we consolidated production and distribution centres in several of our countries including Russia and Nigeria. In doing so we considered the impact on the social and economy scales of the local communities we operate.
– Price pack architecture – we considered consumer affordability in our Emerging segments with weaker local currencies and have changed our price pack architecture to provide consumers with affordable options by adjusting pack sizes, list prices and promotions to serve our consumers in ways that also protect the viability of our business.
– Route-to-market solutions – our Every Dealer Survey considers the changing needs of our customers, allowing us to adjust the structure of our sales force and ensure that our capabilities address these needs through improved service to existing customers.
87Coca-Cola HBC 2017 Integrated Annual Report
Strategic R
eport
Co
rporate G
overnance
Financial Statem
entsS
wiss S
tatutory R
eporting
Supplem
entary Inform
ation

CORPORATE GOVERNANCE REPORT CONTINUED
How we engage with our stakeholders
CustomersRegular visits, dedicated
account teams, joint business planning, joint value creation
initiatives, customer care centres, customer
satisfaction surveys
The Coca-Cola Company
Day-to-day interaction as business partners, joint projects,
joint business planning, functional groups on strategic
issues, ‘top-to-top’ senior management meetings
CommunitiesPlant visits, community
meetings, partnerships on common issues, sponsorship
activities, lectures at universities
ConsumersConsumer hotlines, local
websites, plant tours, research, surveys, focus groups
Non-governmental and
intergovernmental organisations
Dialogue, policy work, partnerships on common issues,
membership of business and industry associations
Governments and regulatory
authoritiesRecycling and recovery
initiatives, EU Platform for Action on Diet, Physical Activity and Health, foreign investment
advisory councils, chambers of commerce
SuppliersJoint value creation
initiatives, annual supplier conference, sustainable
sourcing, Supplier Guiding Principles, packaging
associations, whistle-blower hotline
Every year we ask over 460 stakeholders from the above groups to provide online feedback via our material issues survey. These surveys give our stakeholders the opportunity to prioritise our material issues based on their own interests and the relevance of these to our business.
We also ask for their opinions by providing open-ended questions, so they can share with us anything we might have missed or that needs more attention.
ShareholdersAnnual General Meetings,
investor roadshows and results briefings, webcasts, ongoing
dialogue with analysts and investors
88 Coca-Cola HBC 2017 Integrated Annual Report
UK Corporate Governance CodeAs a Swiss corporation listed on the London Stock Exchange (LSE) with a secondary listing on the Athens Exchange, we aim to ensure that our corporate governance systems remain in line with international best practices. Our corporate governance standards and procedures are continuously reviewed in light of current developments and rulemaking processes in the UK, Switzerland and also the EU.
As a premium listed company, we are required to comply with the provisions of the UK Corporate Governance Code or explain any instances of non-compliance to shareholders. Our Board believes that, except as set out in the paragraphs below, the Company is in compliance with the provisions of the UK Corporate Governance Code and complied with such provisions throughout 2017. Pursuant to our obligations under the Listing Rules, we intend to continually comply with the provisions of the UK Corporate Governance Code or to explain any instances of non-compliance in our Annual Report.
The UK Corporate Governance Code is available online at https://www.frc.org.uk/Our-Work/Publications/Corporate-Governance/UK-Corporate-Governance-Code-April-2016.pdf.
Certain differences between the Company’s corporate governance practices and the UK Corporate Governance CodeThe Swiss Ordinance against Excessive Compensation in Listed Companies further limits the authority of the Remuneration Committee and the Board to determine compensation. The effective limitations include requiring that the Annual General Meeting approve the maximum total compensation of each of the Board and the Operating Committee, requiring that certain compensation elements be authorised in the Articles of Association and prohibiting certain forms of compensation, such as severance payments and financial or monetary incentives for the acquisition or disposal of firms. We are in compliance with the requirements of the Swiss Ordinance against Excessive Compensation in Listed Companies and have amended our Articles of Association to that effect.
Anastassis G. David was originally appointed at the request of Kar-Tess Holding and was not, at the time of his appointment as Chairman, independent as defined by the UK Corporate Governance Code. In view of Anastassis David’s strong identification with the Company and its shareholder interests, combined with his deep knowledge and experience of the Coca-Cola System, the Board deemed it to be in the best interests of the Group and its shareholders for him to be appointed as Chairman, to continue to promote an effective and appropriately balanced leadership of the Group. In accordance with the established policy of appointing all Directors for one year at a time, the Board intends to continue to keep all positions under regular review and subject to annual election by shareholders at the Annual General Meeting.
Application of governance codes
Other corporate governance codesThere is no mandatory corporate governance code under Swiss law applicable to us. The main source of law for Swiss governance rules is the company law contained in articles 620 ff. of the Swiss Code of Obligations, as well as the Ordinance against Excessive Compensation in Listed Companies.
In addition, the UK’s City Code on Takeovers and Mergers (the ‘City Code’) does not apply to the Company by operation of law, as the Company is not incorporated under English law. The Articles of Association include specific provisions designed to prevent any person acquiring shares carrying 30% or more of the voting rights (taken together with any interest in shares held or acquired by the acquirer or persons acting in concert with the acquirer) except if (subject to certain exceptions) such acquisition would not have been prohibited by the City Code or if such acquisition is made through an offer conducted in accordance with the City Code. For further details, please refer to the Company’s Articles of Association, which are available on our website.
89Coca-Cola HBC 2017 Integrated Annual Report
Strategic R
eport
Co
rporate G
overnance
Financial Statem
entsS
wiss S
tatutory R
eporting
Supplem
entary Inform
ation

CORPORATE GOVERNANCE REPORT
From left to right
Row oneMichalis Imellos, Zoran Bogdanovic, Naya Kalogeraki, Alain Brouhard, Keith Sanders
Row twoMarcel Martin, Sotiris Yannopoulos
Row threeJan Gustavsson, Sanda Parezanovic
THE OPERATING COMMITTEE REPRESENTS THE EXECUTIVE LEADERSHIP OF THE COMPANY.
90 Coca-Cola HBC 2017 Integrated Annual Report

Zoran Bogdanovic(46) Chief Executive OfficerSenior management tenure: Appointed December 2017 (less than 1 year)
Previous Group roles: Zoran Bogdanovic’s previous roles include: Member of the Finance Team of Coca Cola HBC Croatia from 1996 to 1998; CFO and then General Manager of Croatian operations from 1998 to 2004; Country General Manager of Coca-Cola HBC Croatia from 2004 to 2008; Country General Manager for Coca-Cola HBC Switzerland from 2008 to 2011; Country General Manager for Coca-Cola HBC Greece from 2011 to 2013; and Region Director, responsible for operations in 12 countries, and a Member of Coca-Cola HBC’s Operating Committee since 2013.
Outside interests: No external appointments
Previous relevant experience: Zoran Bogdanovic started his career as an auditor with Arthur Andersen before joining Coca-Cola HBC Croatia in 1996.
Nationality: Croatian
Michalis Imellos(49) Chief Financial OfficerSenior management tenure: Appointed April 2012 (5 years)
Previous Group roles: Region Finance Director responsible for Nigeria, Romania, Moldova, Bulgaria, Greece, Cyprus, Serbia and Montenegro; General manager, Romania and Moldova.
Outside interests: No external appointments
Previous relevant experience: Michalis Imellos held a number of finance positions in the UK-based European headquarters of Xerox, including those of European Mergers & Acquisitions Director and Finance Director of the Office Europe Division. He managed the financial, tax and legal aspects of Xerox’s sponsorship of the Athens 2004 Olympic Games as well as the finance function of the company’s operations in Greece. He is a Fellow of the Institute of Chartered Accountants in England and Wales, and started his career at Ernst & Young.
Nationality: Greek
Naya Kalogeraki(48) Group Chief Customer and Commercial OfficerSenior management tenure: Appointed July 2016 (1 year)
Previous Group roles: Director of Strategy, CEO office. From 1998, when Naya Kalogeraki joined the Company she built her career assuming roles of increased scale and scope including Marketing Director, Trade Marketing Director, Sales Director and Country Commercial Director, Greece. She has been heavily involved in Group strategic projects and task forces addressing mission-critical business imperatives. In September 2013, Naya Kalogeraki was appointed to the role of General Manager, Greece and Cyprus.
Outside interests: No external appointments
Previous relevant experience: Naya Kalogeraki joined the Company in 1998 from The Coca-Cola Company where she held a number of marketing positions up to Marketing Manager.
Nationality: Greek
Alain Brouhard(55) Business Solutions and Systems DirectorSenior management tenure: Appointed June 2010 (7 years)
Previous Group roles: Region Director responsible for Nigeria, Romania, Moldova, Bulgaria, Serbia and Montenegro (2010 to 2013), and Water and Juice Business Director.
Outside interests: No external appointments
Previous relevant experience: Alain Brouhard began his career with Procter & Gamble, where he worked in four different countries and in a variety of commercial and management roles leading up to Global Customer Team Leader in 2000, when he oversaw the global account management of Delhaize and the European management of new channels, including discounters (such as Aldi, Lidl and Dia) and convenience retailing (such as petrol stations). From 2002 to 2010, Alain Brouhard held positions at Adidas, including managing Director, Italy and Southeast Europe, from 2007 until 2010. Prior to that, he was Vice-President for commercial operations, EMEA, from 2002 to 2005, and, from 2005, took the role of Managing Director, Iberia, based in Spain, with responsibility for Spain and Portugal.
Nationality: French
Keith Sanders(57) Region Director: Armenia, Belarus, Estonia, Latvia, Lithuania, Poland, Russian Federation, Ukraine and MoldovaSenior management tenure: Appointed August 2009 (8 years)
Previous Group roles: General Manager of the Company’s operations in Russia (2004).
Outside interests: No external appointments
Previous relevant experience: Prior to joining the Group, Keith Sanders spent 11 years within the Coca-Cola System. He started his career with The Coca-Cola Company in a regional marketing role within the Gulf Region. In 1993, he was appointed Human Resources and Training Manager for the Gulf Region. In 1994, he assumed his first Bottling General Manager role in Bahrain, and then moved through a series of larger country general management roles until 2001, when he was appointed Director for Bottling Operations in the Eurasia & Middle East Division with responsibility for Saudi Arabia, Pakistan, UAE, Oman, Bahrain and Qatar. Prior to joining the Coca-Cola System, Keith Sanders spent six years with Procter & Gamble in the United States in a variety of sales and marketing roles.
Nationality: American
91Coca-Cola HBC 2017 Integrated Annual Report
Strategic R
eport
Co
rporate G
overnance
Financial Statem
entsS
wiss S
tatutory R
eporting
Supplem
entary Inform
ation

CORPORATE GOVERNANCE REPORT CONTINUED
Sotiris Yannopoulos(50) Region Director: Austria, Czech Republic, Hungary, Slovakia, Italy and SwitzerlandSenior management tenure: Appointed July 2014 (3 years)
Previous Group roles: Sotiris Yannopoulos was general manager in Serbia and Montenegro from 2009 to 2012 and Country General Manager in Italy from 2012 to 2014.
Outside interests: No external appointments
Previous relevant experience: Prior to joining the Group, Sotiris Yannopoulos spent 12 years working at PepsiCo in various roles. He also spent five years with Star Foods, where he was the East Balkans Business Unit Manager, and seven years with Tasty Foods in Greece, where his roles included Business Development Director, Marketing and Trade Marketing Director, Marketing Manager and Group Brand Manager. He started his career as an Assistant Product Manager (USA/South Africa) with Colgate-Palmolive.
Nationality: Greek
Marcel Martin(59) Group Supply Chain DirectorSenior management tenure: Appointed January 2015 (3 years)
Previous Group roles: Marcel Martin joined the Group in 1993, holding positions with increasing responsibility in the supply chain and commercial functions. Since 1995, Marcel Martin has held general management assignments in several of our markets, including as General Manager for Eastern Romania, Regional Manager Russia, Country General Manager Ukraine and General Manager Nigeria. Marcel Martin became General Manager of our Irish operations in 2010 and is now our Group Supply Chain Director.
Outside interests: No external appointments
Nationality: Romanian
Jan Gustavsson(52) General Counsel, Company Secretary and Director of Strategic DevelopmentSenior management tenure: Appointed August 2001 (16 years)
Previous Group roles: Jan Gustavsson served as Deputy General Counsel for Coca-Cola Beverages plc from 1999-2001.
Outside interests: No external appointments
Previous relevant experience: Jan Gustavsson started his career in 1993 with the law firm of White & Case in Stockholm, Sweden. In 1995, he joined The Coca-Cola Company as Assistant Division Counsel in the Nordic and Northern Eurasia Division. From 1997 to 1999, Jan Gustavsson was Senior Associate in White & Case’s New York office, practicing securities law and M&A.
Nationality: Swedish
Sanda Parezanovic(53) Group Human Resources DirectorSenior management tenure: Appointed June 2015 (2 years)
Previous Group roles: Sanda Parezanovic’s previous roles in the Group include: Public Affairs & Communications Manager, Serbia and Montenegro from 2003 to 2006; Country Human Resources and Public Affairs & Communications Manager, Serbia and Montenegro from 2006 to 2010; and Region Human Resources Director Bosnia & Herzegovina, Bulgaria, Croatia, Cyprus, FYROM, Greece, Northern Ireland, the Republic of Ireland, Moldova, Montenegro, Nigeria, Romania, Serbia and Slovenia from 2010 to 2015.
Outside interests: No external appointments
Previous relevant experience: Sanda Parezanovic started in 1989 as Market Researcher and later Strategic Planner working for various local research and marketing agencies in SFR Yugoslavia. Sanda Parezanovic joined Saatchi & Saatchi Balkans in 1994, holding various senior management positions in several Balkan countries, including Managing Director of two start-up agencies, first in FYROM and later in Serbia. In 1999 she relocated to London, where she worked for Saatchi & Saatchi and Marketing Drive on a number of pan-European and business development projects, before she joined our Group in 2003.
Nationality: Serbian
92 Coca-Cola HBC 2017 Integrated Annual Report

Operating Committee key activities and decisions in 2017
Business case reviews and approvals
– Strategic revenue-generating initiatives and product launches
– Strategic transformation of supply chain, human resources, commercial, finance and business solutions and systems departments
– Optimisation of our logistics and manufacturing infrastructure
– Development of our business services organisation
Policy formulation and reviews
– Commercial policy
Priority projects – Revenue growth
management
– Route to market
– Renewing category growth
– Right Execution Daily
– Engagement
– Business Performance Management System (BPMS)
Long-term direction-setting
– Defining Group strategic priorities and performance parameters
– Reviewing and adjusting the Group’s revenue growth management framework and aligning with local commercialisation plans
– Aligning our sustainability priorities on the way to delivering 2020 commitments
– Reviewing our route-to-market approach
Business planning – Evaluating and updating
the Group’s long-range business plan
– Reviewing and approving annual business plans for 2017 for all operations and central functions
– Approving Group and country talent, capabilities development and succession plans
Risk, safety and business resilience – Evaluating the Group’s business resilience
strategies
– Reviewing the Group’s health and safety policies and material incidents
Jan
Feb
Mar
Apr
May
JuneJuly
Aug
Sept
Oct
Nov
Dec
93Coca-Cola HBC 2017 Integrated Annual Report
Strategic R
eport
Co
rporate G
overnance
Financial Statem
entsS
wiss S
tatutory R
eporting
Supplem
entary Inform
ation
A WELL-DEFINED FRAMEWORK FOR RISK MANAGEMENT
Letter from the Chair of the Audit and Risk Committee
Dear ShareholderThe Audit and Risk Committee focused its work during 2017 on enhancing and strengthening the Group’s existing financial controls and risk management and compliance systems, including in relation to its financial reporting process and in relation to the process for preparing consolidated accounts, which the Board recognises as essential components of effective corporate governance.
During 2017, the Audit and Risk Committee also worked closely with the internal audit and finance teams in implementing the Group’s internal control framework. The Committee also considered developments in accounting and regulatory matters including changes to IFRS accounting standards, initiatives around human rights and gender diversity, and the new EU Data Protection Regulation.
The Audit and Risk Committee Report describes in more detail the work and the achievements of the Audit and Risk Committee during 2017 and we are proud to report that the Committee addressed the challenges the business faced during the year and ensured that we have a well-defined framework for financial controls and risk management that meets best practice standards.
CORPORATE GOVERNANCE REPORT CONTINUED
Role and responsibilitiesThe Audit and Risk Committee monitors the effectiveness of our financial reporting, internal control and risk management systems and processes. The role of the Audit and Risk Committee is set out in the charter for the committees of the Board of Directors in Annex C to the Company’s Organisational Regulations. This is available at http://coca-colahellenic.com/en/about-us/corporate-governance/corporate-governance-overview/.
The key responsibilities of and elements of the Audit and Risk Committee’s role are set out on page 81.
Members Membership status
William W. (Bill) Douglas III (Chairman) Member since 2016, Chairman since 2016
John P. Sechi Member since 2014Olusola (Sola) David-Borha Member since 2015
The Audit and Risk Committee comprises three independent non-Executive Directors, Bill Douglas (Chairman), Olusola (Sola) David-Borha, and John P. Sechi, who were each re-elected for a one-year term by the shareholders at the Annual General Meeting on 20 June 2017.
The Board remains satisfied that Bill Douglas,John Sechi, and Sola David-Borha possess recent and relevant financial and sector experience in compliance with the UK Corporate Governance Code. Bill Douglas was formerly Executive Vice President and Chief Financial Officer, and Executive Vice President, Supply Chain of Coca-Cola Enterprises, and John Sechi and Sola David-Borha have held a number of senior financial positions. Further details on their experience are set out in their respective biographies on pages 75 and 73 respectively.
The Chief Financial Officer, as well as the General Counsel, external auditors, the Director of Internal Audit, and the Group Chief Accountant normally attend all meetings of the Audit and Risk Committee. Other officers and employees are invited to attend meetings when appropriate. The Director of Internal Audit, and, separately, the external auditors, meet regularly with the Audit and Risk Committee without the presence of management to discuss the adequacy of internal controls over financial reporting and any other matters deemed relevant to the Audit and Risk Committee.
Work and activitiesThe Audit and Risk Committee met eight times during 2017 and discharged the responsibilities defined under Annex C of the Organisational Regulations. The work of the Audit and Risk Committee during the accounting year included consideration of:
– the annual financial statements and the annual financial report for the year ended 31 December 2016 prior to their submission to the Board for approval, including consideration of the Group on a going concern basis, and compliance with Group policies;
– the interim financial statements and interim results announcement for the six-month period ending 30 June 2017, prior to their submission to the Board for approval;
– the trading updates for the three-month period ended 31 March 2017 and the nine-month period ended 29 September 2017;
– areas of significance in the preparation of the financial statements;
William W. (Bill) Douglas IIICommittee Chair
94 Coca-Cola HBC 2017 Integrated Annual Report

– the internal control environment, principal risks and risk management systems and the Group’s statement on the effectiveness of its internal controls prior to endorsement by the Board;
– review of the Viability Statement scenarios and underlying assumptions and recommendations to the Board that the Viability Statement be approved;
– review and approval of the internal audit plan, quarterly reports on the results of internal audit work and an internal and external independent quality assessment of the internal audit function in accordance with the Institute of Internal Auditors Attribute Standard 1312, including the following:
– reassessment of the overall financial risk management of the Group’s operations and review of internal financial control procedures;
– review of regulatory changes and developments and impact on risk management processes;
– review and approval of changes to the corporate audit department, including training and development programmes;
– matters arising under the Group’s Code of Business Conduct and the actions taken to address any identified issues; and
– revisions to and compliance with treasury policies, including risk limits, hedging programmes and counterparty limits;
– the geopolitical developments in Greece, Russia, Ukraine and Nigeria, and their implications for the Group’s operations;
– regular reports on quality assurance, health and safety, environmental protection, asset protection, treasury and financial risks, security and security enterprise risk management processes;
– reports from the external auditor on the annual and interim financial statements, approval of the external audit plan and pre-approval of audit fees for 2017; and
– the results of the Audit and Risk Committee self-assessment process.
Areas of key significance in the preparation of the financial statements The Audit and Risk Committee considered a number of areas of key significance in the preparation of the financial statements in 2017 including the following:
– critical accounting judgements and estimates that affect the reported amounts of assets, liabilities, revenues and expenses, and the disclosure of contingent assets and liabilities in the consolidated financial statements including income taxes (detailed in Notes 5, 10 and 28 to the consolidated financial statements);
– contingencies, legal proceedings, competition law and regulatory procedures, including cases involving the national competition authorities of Greece and Switzerland and litigation matters in Nigeria, Russia, Italy and Greece, and the impact of these on the consolidated financial statements and accompanying notes;
– the impairment testing of goodwill and indefinite-lived intangible assets with a particular emphasis on reviewing and challenging the key assumptions used in the value-in-use calculation and the sensitivity analysis performed for the material operations with reduced financial headroom. These assumptions, and a discussion of how they are established as well as the sensitivity analysis, are described in Note 13 to the consolidated financial statements; and
Priorities for 2018The key priorities for 2018 are the following:
– monitoring the developments in accounting and regulatory matters including potential changes to IFRS accounting standards;
– implementation of the new EU Data Protection Regulation; and
– ongoing monitoring of risks as well impairment testing of goodwill and intangible assets.
External auditorPricewaterhouseCoopers AG, Birchstrasse 160, CH 8050 Zurich, Switzerland (‘PwC AG’) has been elected by the shareholders as the statutory auditor for the Group’s statutory consolidated and stand-alone financial statements. Signing partner for the statutory financial statements on behalf of PwC AG is Mike Foley, who has held this role since the year ended 31 December 2016.
The Board, at the recommendation of the Audit and Risk Committee, has retained PricewaterhouseCoopers S.A., 268 Kifissias Avenue – 15232 Halandri, Greece (‘PwC S.A.’), an affiliate of PwC AG, to act as the Group’s independent registered public accounting firm for the purposes of reporting under the UK rules for the year ended 31 December 2017. Signing partner for the financial statements on behalf of PwC S.A. is Marios Psaltis, who has held this role for five years.
The appointment of PwC has been approved by the shareholders until the next Annual General Meeting by way of advisory vote. ‘PwC’ refers to PwC AG or PwC S.A., as applicable, in this Annual Report.
During the accounting period, the members of the Audit and Risk Committee met separately with PwC on a regular basis and the Audit and Risk Committee took an active role in reviewing the scope of the audit, the independence, objectivity and effectiveness of PwC, and the negotiations relating to audit fees. The Audit and Risk Committee also met with the management team, which led the discussions with PwC, including the Director of Internal Audit, to discuss the performance of PwC without PwC being present. Following this review process, the Audit and Risk Committee has recommended to the Board that a proposal to reappoint PwC be put to a shareholders’ vote at the next Annual General Meeting.
PwC has acted as the Group’s sole external auditor since 2003. The Company ran a competitive tender for the external auditor services in 2015 which was overseen by the Audit and Risk Committee. Following the evaluation of the proposals, the Audit and Risk Committee concluded in 2015 that the best interests of the Group and its shareholders would be served by retaining PwC as external auditor and made such recommendation to the Board. PwC was reappointed by the Board as the Group’s external auditor with effect from 11 December 2015. Currently, the Audit and Risk Committee anticipates that the audit contract will be put out to tender again in 2025. There are no contractual or other obligations restricting the Group’s choice of external auditor.
95Coca-Cola HBC 2017 Integrated Annual Report
Strategic R
eport
Co
rporate G
overnance
Financial Statem
entsS
wiss S
tatutory R
eporting
Supplem
entary Inform
ation

Non-audit services provided by the external auditorThe Audit and Risk Committee considers the independence, in both fact and appearance, of the external auditor as critical and has long had an auditor independence policy providing definitions of the services that the external auditor may and may not provide. The policy requires the Audit and Risk Committee’s pre-approval of all audit and permissible non-audit services provided by the external auditor. Such services include audit, work directly related to audit, and certain tax and other services as further explained below. In practice, the Audit and Risk Committee applies the policy restrictively and approval for work other than audit and audit-related services is rarely granted.
Under the policy, pre-approval may be provided for work associated with: statutory or other financial audit work under IFRS or according to local statutory requirements; attestation services not required by statute or regulation; accounting and financial reporting consultation and research work necessary to comply with generally accepted accounting and auditing standards; internal control reviews and assistance with internal control reporting requirements; review of information systems security and controls; tax compliance and related tax services, excluding any tax services prohibited by regulatory or other oversight authorities; expatriates’ and other individual tax services; and assistance and consultation on questions raised by regulatory agencies. For each proposed service, the external auditor is required to provide detailed back-up documentation at the time of approval to permit the Audit and Risk Committee to make a determination whether the provision of such services would impair the external auditor’s independence.
PwC has complied with the policy for the financial year ended on 31 December 2017 and there have been no changes to the policy during the year.
Audit fees and all other fees
Audit feesThe total fees for audit services paid to PwC and affiliates were approximately €4.3 million for the year ended 31 December 2017, compared to approximately €4.5 million for the year ended 31 December 2016. The total fees for 2017 include fees associated with the annual audit and reviews of the Group’s half-year reports, prepared in accordance with IFRS and local statutory audits.
Audit-related feesFees for audit-related services paid to PwC and affiliates for the year ended 31 December 2017 were €0.4 million compared to €0.4 million for the year ended 31 December 2016.
Tax-related feesFees for tax services to PwC and affiliates for the year ended 31 December 2017 were €nil million compared to €0.1 million for the year ended 31 December 2016.
All other feesFees for non-audit services paid to PwC or affiliates for the year ended 31 December 2017 were €nil million. There were €0.1 million in fees for non-audit services paid to PwC or affiliates during the year ended 31 December 2016.
Risk managementDuring 2017, the Company continued to revise and strengthen its approach to risk management as described in detail on pages 55 to 63. The primary aim of this framework is to minimise our exposure and ensure that the nature and significance of all risks we are facing are properly identified, reviewed, managed and, where necessary, escalated. A quarterly risk assessment is undertaken by the countries and corporate office support functions, and significant risks are then reported to the Region Directors and the Chief Risk Officer. The Company’s Group Risk Forum reviews the identified risks biannually and presents issues of critical exposure to the Operating Committee. The latter, after careful review, reports to the Audit and Risk Committee material risks and mitigating actions. This process is both top-down and bottom-up and is designed to ensure that risks arising from business activities are appropriately managed.
Finally, we have in place third-party insurance to cover residual insurable risk exposure such as property damage, business interruption and liability protection, including Directors’ and officers’ insurance for our Directors and officers as well as for the officers and directors of certain subsidiaries.
Internal controlThe Board has ultimate responsibility for ensuring that the Company has adequate systems of financial control. Systems of financial control can provide only reasonable and not absolute assurance against material misstatements or loss. In certain of the countries in which we operate, our businesses are exposed to a heightened risk of loss due to fraud and criminal activity. We review our systems of financial control regularly in order to minimise such losses.
The Board has adopted a chart of authority defining financial and other authorisation limits and setting procedures for approving capital and investment expenditure. The Board also approves detailed annual budgets. It subsequently reviews quarterly performance against targets set forth in these plans and budgets. A key focus of the financial management strategy is the protection of our earnings stream and management of our cash flow.
The Board and its committees have conducted an annual review of the effectiveness of our risk management system and internal control systems in accordance with the UK Corporate Governance Code. Part of this review involves regular review of our financial, operational and compliance controls by the Audit and Risk Committee, which then reports back to the Board on its work and findings as described above. The Board confirms that it has concluded that our risk management and internal control systems are effective.
CORPORATE GOVERNANCE REPORT CONTINUED
96 Coca-Cola HBC 2017 Integrated Annual Report

Internal auditOur internal audit function reports directly to the Audit and Risk Committee, which reviews and approves the internal audit plan for each year. The internal audit function consists of approximately 40 full-time professional audit staff based in Athens, Budapest, Sofia, Moscow and Lagos, covering a range of disciplines and business expertise. One of the responsibilities of the internal audit function is to confirm to the Board the effective operation of our internal control framework. For this purpose, the Director of Internal Audit makes quarterly presentations to the Audit and Risk Committee and meets regularly with the Audit and Risk Committee without the presence of our management.
In addition, the internal audit function reviews the internal financial, operational, and compliance control systems across all the jurisdictions in which we operate and reports its findings to management and the Audit and Risk Committee on a regular basis. The internal audit function focuses its work on the areas of greatest risk to us, as determined by a risk-based approach to audit planning. As part of our commitment to maintaining and strengthening best practice in corporate governance matters, we also consistently seek to enhance our internal control environment and risk management capability.
The internal audit function prepares audit reports and recommendations following each audit and appropriate measures are then taken to ensure that all recommendations are implemented. Status reports on our management’s implementation of internal audit recommendations are provided to the Audit and Risk Committee on a quarterly basis. Significant issues, if any, are raised at once. There were no such issues in 2017. The Chief Executive Officer, the Chief Financial Officer, the General Counsel, the Group Chief Accountant and the region and country managers have access to the implementation status of the recommendations at all times.
Whistle-blowing measuresWe operate a hotline to receive, retain, investigate and act on employee complaints or concerns regarding accounting, internal control or ethical matters. This includes any matters regarding the circumvention or attempted circumvention of internal controls including matters that would constitute a violation of our Code of Business Conduct or matters involving fraudulent behaviour by officers or employees of the Group. All such allegations, complaints or concerns may be communicated in a variety of ways, in local languages and on an anonymous basis, to our Director of Internal Audit. Communications received by the Director of Internal Audit, or directly through the hotline, are kept confidential and, where requested, anonymous. The Director of Internal Audit liaises regularly with the General Counsel and communicates all significant allegations to the Chairman of the Audit and Risk Committee.
In 2017, we received 292 allegations (2016: 186) of which 98 (2016: 48) were received through the whistle-blower hotline. All allegations involving potential Code of Business Conduct violations were investigated in accordance with the Group Code of Business Conduct Handling Guidelines. Of those investigated, 124 (2016: 79) matters were substantiated as code violations of which 35 (2016: 20) involved an employee in a management position or involved a loss greater than €10 thousand. For details concerning the handling of allegations received in 2017 see our website.
Disclosure CommitteeA Disclosure Committee has been established and disclosure controls and procedures have been adopted to ensure the accuracy and completeness of our public disclosures. The Disclosure Committee is composed of the Chief Financial Officer, the General Counsel, the Director of Investor Relations and the Group Chief Accountant.
Performance reportingReports on our annual performance and prospects are presented in the Annual Report following recommendation by the Audit and Risk Committee. We also prepare a half-yearly financial report on our performance during the first six months of the financial year. In 2015, the Group discontinued the practice of quarterly reporting. In line with UK practice, we have adopted half-year and full-year reports, and Q1 and Q3 trading updates effective from Q1 2015. Internally, our financial results and key performance indicators are reviewed by the Operating Committee on a monthly basis. This information includes comparisons against business plans, forecasts and prior year performance. The Board of Directors receives updates on performance at each Board meeting, as well as a monthly report on our business and financial performance.
97Coca-Cola HBC 2017 Integrated Annual Report
Strategic R
eport
Co
rporate G
overnance
Financial Statem
entsS
wiss S
tatutory R
eporting
Supplem
entary Inform
ation

Dear ShareholderThe work of the Nomination Committee has continued to focus on the composition of the Board and the important task of succession planning.
As a result of our 2017 review to ensure an appropriate balance of skills, experience, independence and knowledge, we recommended Charlotte Boyle as a new non-Executive Director following the retirement of Antonio D’Amato in June 2017. Charlotte Boyle brings significant skills and experience in the areas of people, talent, succession and executive remuneration to the Board, Nomination Committee and Remuneration Committee.
CORPORATE GOVERNANCE REPORT CONTINUED
Letter from the Chair of the Nomination Committee
FOCUS ON THE COMPOSITION OF THE BOARD
Following the untimely death of Dimitris Lois, Chief Executive Officer from 2011 until he passed away in October 2017, the Nomination Committee led a thorough process that resulted in the appointment of Zoran Bogdanovic as the Company’s new Chief Executive Officer. Zoran Bogdanovic brings a track record of delivering results across our territories and demonstrating the values that are the foundation of our Company culture. He will also be nominated as an Executive Director on the Board at the Annual General Meeting in 2018.
In 2018, the Committee will continue to review the balance of skills, experience and diversity on the Board and will also focus on the talent development, employee engagement and gender diversity initiatives necessary to ensure that the Group has the people and skills to deliver on its strategy. The Committee will also oversee an internally facilitated self-assessment process.
A summary of the Group’s Nomination Policy for the recruitment of Board members is available online at: https://coca-colahellenic.com/media/1549/summary-of-nomination-policy-for-recruitment-of-board-members.pdf. The Board Diversity Policy is described on page 100.
Reto FrancioniCommittee Chair
98 Coca-Cola HBC 2017 Integrated Annual Report

Role and responsibilitiesThe function of the Nomination Committee is to support the Board in fulfilling its duty to conduct a Board self-assessment, to establish and maintain a process for appointing new Board members and to manage, in consultation with the Chairman, the succession of the Chief Executive Officer. The formal role of the Nomination Committee is set out in the charter for the committees of the Board of Directors in Annex C of the Company’s Organisational Regulations. This is available online at http://coca-colahellenic.com/en/about-us/corporate-governance/corporate-governance-overview/.
Key elements of the Nomination Committee’s role are set out on page 81.
Members Membership status
Reto Francioni (Chairman) Member since 2016, Chairman since 2016
Charlotte J. Boyle Member since 2017Alexandra Papalexopoulou Member since 2015
The members of the Nomination Committee are Reto Francioni, Charlotte Boyle, and Alexandra Papalexopoulou. At the Annual General Meeting on 20 June 2017, Antonio D’Amato retired as a member of the Board and member of the Nomination Committee and the Board appointed Charlotte Boyle to replace him. At the Annual General Meeting on 20 June 2017, Reto Francioni and Alexandra Papalexopoulou were also re-elected for a one-year term by the shareholders. Since June 2015 all members of the Nomination Committee have been independent non-Executive Directors and the Nomination Committee is chaired by Reto Francioni.
Work and activitiesThe Nomination Committee met four times during 2017 and discharged the responsibilities defined under Annex C of the Company’s Organisational Regulations. The Chief Executive Officer and the Group Human Resources Director regularly attend meetings of the Nomination Committee. In addition, the Chairman is actively involved in the work of the Nomination Committee concerning succession planning and the selection of key people. In 2017, the General Counsel also met with the Nomination Committee on several occasions. During 2017, the work of the Nomination Committee included consideration of:
– leading the process for the appointment of the new Chief Executive Officer
– succession planning and development of plans for the recruitment of new Board members;
– composition of the Board, including the appropriate balance of skills, knowledge, experience and diversity;
– agreeing the process for the recruitment and nomination of new Board members;
– review of the talent management framework;
– compilation of a list of potential candidates to fill roles on the Board in conjunction with executive search consultants;
– recommendation to the Board of proposed candidates for appointment to the Board;
– the performance evaluation and annual assessments of the committees and the Board;
– review of the Director induction process and training programmes; and
– review of the Group’s Inclusion and Diversity Policy.
Committee at work – Recruitment process
Succession planning
Board composition
Recruitment Shortlisting
Interview Balance of skills
Appointment Introduction
99Coca-Cola HBC 2017 Integrated Annual Report
Strategic R
eport
Co
rporate G
overnance
Financial Statem
entsS
wiss S
tatutory R
eporting
Supplem
entary Inform
ation

As the result of the Nomination Committee’s review of the composition of the Board in 2017, the Nomination Committee recommended Charlotte Boyle to be appointed as a new non-Executive Director, and as a member of the Nomination Committee and Remuneration Committee following the retirement of Antonio D’Amato. The Nomination Committee used the services of Lygon Group, an external search consultant, to help with the appointment of Charlotte Boyle. Lygon specialises in senior recruitment assignments and has no other connections with the Company.
Following the untimely death of Dimitris Lois in October 2017, the Nomination Committee led a thorough process and benchmarking exercise that resulted in the appointment of Zoran Bogdanovic as the Group’s new Chief Executive Officer. He will also be nominated as an Executive Director on the Board at the Annual General Meeting in 2018.
The Nomination Committee and the Board undertook a formal process to find an appropriate candidate for the CEO position. Egon Zehnder International supported the Committee to design and implement a robust succession process.
Egon Zehnder International provides recruitment and career development services to the Company from time-to-time, but does not have any other connection with the company. The main steps of the succession process in summary were as follows:
– a Chief Executive Officer role profile for the Group was prepared and agreed by the Committee;
– the Committee conducted initial reviews and assessed a list of internal and external candidates against the agreed profile to produce a shortlist of potential candidates;
– after due consideration, the Committee concluded that Zoran Bogdanovic was the lead candidate for the position, based, among other things, on the Company’s pre-existing succession planning work and his strong track record with the Company;
– with the support of the external consultant, the Committee conducted a very extensive interview and assessment process, which confirmed Zoran Bogdanovic as a qualified and suitable candidate for the position;
– Zoran Bogdanovic was benchmarked against external candidates;
– the Committee considered all available facts and concluded that due to his proven leadership skills, strategic agility, industry expertise and cultural fit, Zoran Bogdanovic was the best qualified candidate for the position; and
– the Board unanimously approved the Committee’s recommendation.
Priorities for 2018The Nomination Committee’s priorities for 2018 include:
– successful onboarding of the new CEO;
– continuous work on succession plans for Board and senior management positions; and
– internal Board and committee assessments.
Performance evaluation of the BoardThe Nomination Committee led the annual assessment of the performance of the Board and its committees during the year with the support of Lintstock, an external advisory firm. The key areas included in the assessment were Board structure and diversity, timeliness and quality of information, Board discussions, committees and their operation, succession planning, risk appetite and risk management, and remuneration and performance. The scores were overall high and the results of the evaluation were presented at the December 2017 Board meeting. Further details on the internal board evaluation are set out on page 84.
As with all employees, the Group offers training opportunities to the Board and senior management in order to improve their skills, and encourages all Board members and senior management to gain relevant experience and knowledge to fulfil their position’s duties.
DiversityThe Group continues to be deeply committed to policies promoting diversity, equal opportunity and talent development at every level throughout the Group, including at Board and management level, and is constantly seeking to attract and recruit highly qualified candidates for all positions in its business. The Group’s Inclusion and Diversity Policy applies to all people who work for us. Further details on the Group’s Inclusion and Diversity Policy are set out on page 31 in the Strategic Report.
The Group believes that diversity at Board level acts as a key driver of Board effectiveness, helps to ensure that the Group can achieve its overall business goals, especially in light of our geographical footprint, and is critical in promoting a diverse and inclusive culture across the whole Group. The Board has now adopted a formal Board Diversity Policy.
The Group’s Board Diversity Policy guides the Nomination Committee and the Board in relation to their approach to diversity in respect of succession planning and the selection process for the appointment of new Board members. The Nomination Committee is responsible for implementing this policy and for monitoring progress towards the achievement of its objectives.
Under the Board Diversity Policy, the Nomination Committee is required to take into account all aspects of diversity, including age, ethnicity, gender, educational and professional background when considering succession planning and new Board appointments. Board appointments are evaluated on merit against objective criteria with due regard for diversity to ensure that candidates contribute to the balance of skills, experience, knowledge and diversity of the Board.
100 Coca-Cola HBC 2017 Integrated Annual Report
CORPORATE GOVERNANCE REPORT CONTINUED

Since 31 December 2016, there has been an increase in the number of women on the Board from 15% to 25% following the appointment of Charlotte Boyle (reducing to 23% if Zoran Bogdanovic is elected at the Annual General Meeting of the Company as proposed (see page 78)). The percentage of managers who were women has also increased from 33% as at 31 December 2016 to 35% as at 31 December 2017, while the percentage of women among executive leaders remained 30%.
The Nomination Committee, in conjunction with the Operating Committee, will continue to monitor the proportion of women at all levels of the Group and ensure that all appointments are made with a view to having a high level of diversity within the workplace and in leadership positions.
101Coca-Cola HBC 2017 Integrated Annual Report
Strategic R
eport
Co
rporate G
overnance
Financial Statem
entsS
wiss S
tatutory R
eporting
Supplem
entary Inform
ation

Letter from the Chair of the Social Responsibility Committee
FOCUS ON ACHIEVING OUR 2020 SUSTAINABILITY GOALS
CORPORATE GOVERNANCE REPORT CONTINUED
Dear ShareholderIn 2017, the Committee continued its overview and monitoring of the implementation of our sustainability strategy. During the year, particular emphasis was placed on the progress made against the targets associated with the Group’s 2020 sustainability commitments, details of which are set out on page 25.
At the same time, we continued monitoring regulatory developments in the area of sustainability, with an emphasis on the circular economy, within the framework of the related European Union policy package.
The Committee also oversaw the Group’s continued efforts to align and integrate its sustainability priorities to its overall business strategy, particularly in the areas of use of clean and renewable energy, carbon emissions, packaging light-weighting, recovery for recycling, and sustainable sourcing. We are particularly pleased that in 2017 the CDP (formerly the Carbon Disclosure Project) recognised these efforts, considering Coca-Cola HBC as a global leader in the areas of climate and water.
We are especially proud that in addition to being named the industry leader on both the Dow Jones World and Europe Sustainability Indices for a record four consecutive years, Coca-Cola HBC has now also taken the lead within the food, beverage and tobacco industry group as a whole.
The Committee will continue to promote the sustainability agenda within the organisation, and ensure that this remains a key driver of our corporate reputation as a leader in the field.
Anastasios I. LeventisCommittee Chair
102 Coca-Cola HBC 2017 Integrated Annual Report

Notably, the Social Responsibility Committee reviewed, and endorsed, the process for the annual assessment of material issues, which combined input from both business leaders and internal stakeholders, in accordance with the framework of the International Integrated Reporting Council (IIRC), the GRI Sustainability Report Standards, and the guidance of the Sustainability Accounting Standards Board for the beverage industry.
Priorities for 2018The Social Responsibility Committee’s priorities for 2018 include:
– overseeing a review of our 2020 commitments in order to identify the key themes and priorities within a longer time frame;
– reviewing and endorsing the Group’s sustainability reporting according to the GRI and IIRC frameworks; and
– addressing potential sparkling soft drinks and plastic packaging taxation.
Role and responsibilitiesThe Social Responsibility Committee is responsible for the development and supervision of procedures and systems to ensure the pursuit of the Group’s social and environmental goals. The formal role of the Social Responsibility Committee is set out in the charter for the committees of the Board of Directors in Annex C of the Company’s Organisational Regulations. This is available online at https://coca-colahellenic.com/en/about-us/corporate-governance/corporate-governance-overview/.The key elements of the Social Responsibility Committee’s role and responsibilities are set out on page 81.
Members Membership status
Anastasios I. Leventis Member since 2016, Chairman since 2016
Alexandra Papalexopoulou Member since 2016José Octavio Reyes Member since 2014
Work and activitiesThe Social Responsibility Committee met four times during 2017 and discharged its responsibilities as defined under Annex C of the Company’s Organisational Regulations. In addition to the members of the Social Responsibility Committee, the Director of Public Affairs and Communication attends all meetings of the Committee.
During 2017 the Social Responsibility Committee reviewed and provided guidance and insights to advance the Group’s sustainability approach in the following areas:
– assessment of the Group’s progress regarding the level of disclosure and reporting across all three dimensions of sustainability (economic, environmental and social), with particular focus on the Dow Jones Sustainability Indices and recently introduced GRI Standards;
– monitoring of the rate of implementation and progress made against the 12 publicly communicated 2020 sustainability commitments; and
– assessment of emerging trends in sustainability and potential implications for Coca-Cola HBC, particularly in the areas of packaging, and health and nutrition.
103Coca-Cola HBC 2017 Integrated Annual Report
Strategic R
eport
Co
rporate G
overnance
Financial Statem
entsS
wiss S
tatutory R
eporting
Supplem
entary Inform
ation

DRIVING SUSTAINABLE PERFORMANCE
2017 performance outcomes2017 saw the business performing well, with a clear strategic direction. With this in mind we are delighted to announce strong results for the 2017 financial year, delivering net sales revenue growth of 5.9% on an FX-neutral basis (an improvement on 2016 performance of 3.0%) and volume growth of 2.2% with positive performance in all segments. Our comparable EBIT margin also improved this year, now at 9.5%. We have sustained our ability to improve cost-efficiency with our operating expenditure at 27.9% of revenue, which is a positive step towards our 2020 target range of 26%-27%. We also saw an improvement in our overall ROIC performance, which reached 12.4% this year. This exceptional performance demonstrates our significant progress towards our 2020 targets.
The table below illustrates Company performance achieved against key performance indicators, and highlights those that are used in our Management Incentive Plan (MIP) and Performance Share Plan (PSP) variable pay arrangements.
Dear ShareholderAs the Chair of the Remuneration Committee, I am pleased to present our Directors’ Remuneration Report for the year ended 31 December 2017. Our primary listing is on the London Stock Exchange and our Company is domiciled in Switzerland. We therefore ensure that we comply fully with UK regulations, except where these conflict with Swiss law. The format of our 2017 Remuneration Report is consistent with last year's format as there were no significant changes in relevant regulations or internal policies.
The Group’s remuneration philosophy and policies are designed to attract, motivate and retain the talented people we need to meet the Company’s strategic objectives, and to give them due recognition. To this end, the Remuneration Committee has worked to ensure that the remuneration policy of the Group remains fair, transparent and competitive in comparison with our peers, and that remuneration is linked to business strategy and drives sustainable performance.
Alexandra PapalexopoulouChair of the Remuneration Committee
Volume (m unit cases)2,104
2016: 2,058
Net sales revenue (€m)6,522
2016: 6,219
FX-neutral NSR generated per case (€)
3.102016: 3.02
Operating expense as % of NSR (excl. DME)
25.5%2016: 25.8%
Comparable EBIT (€m)621
2016: 518
Free cash flow (€m)426
2016: 431
ROIC12.4%
2016: 10.3%
Comparable EPS (€)1.233
2016: 0.972
Applying the remuneration policy for Directors in 2017Dimitris Lois, the Company’s Chief Executive Officer since 2011, went on extended leave for medical treatment last year. It was with great sadness that we had to announce his passing on 2 October 2017. The Remuneration Committee deemed that all death in service payments be made in line with the termination policy contained within the approved Executive Director's Remuneration Policy. In line with this policy, no base salary was paid out in lieu of notice and all outstanding awards under the MIP and PSP were pro-rated for time and subject to performance assessment. Under Swiss law, share awards are considered annual compensation and as such when time pro-rating is required, the year of grant (12 months) and not the vesting period (36 months) for time pro-rating calculations is considered. The Remuneration Committee made the decision that the vesting of these pro-rated PSP awards be accelerated and vest as soon as reasonably practicable to Dimitris Lois’ heirs. Full details of these awards can be found on page 118.
Included in MIP Other key performance indicatorsIncluded in PSP
Letter from the Chair of the Remuneration Committee
104 Coca-Cola HBC 2017 Integrated Annual Report
DIRECTORS’ REMUNERATION REPORT

The Remuneration Committee will continue to keep policies under review so as to ensure that plans and programmes relating to remuneration support the Company’s business strategy and are closely linked to shareholders’ interests. We value the dialogue with shareholders and welcome views on this Remuneration Report. We were pleased with the positive vote for the Company’s remuneration policy and the Annual Report on Remuneration at the 2017 Annual General Meeting and trust we shall have your support again in 2018.
The role of the Remuneration CommitteeThe main tasks of our Remuneration Committee are to establish the remuneration strategy for the Group and to approve compensation packages for Directors and other select senior management. The Remuneration Committee operates under the Charter for the Committees of the Board of the Company set forth in Annex C to the Organisational Regulations of the Company, available on the Group’s website at: http://coca-colahellenic.com/en/about-us/corporate-governance/corporate-governance-overview/.
Members Membership status
Alexandra Papalexopoulou (Chair) Member since 2015Chair since June 2016
Reto Francioni Appointed June 2016Charlotte J. Boyle Appointed June 2017
In accordance with the UK Corporate Governance Code, the Remuneration Committee consists of three independent non-Executive Directors: Alexandra Papalexopoulou (Chair), Reto Francioni and Charlotte J. Boyle, who were each elected by the shareholders for a one-year term on 20 June 2017. The Remuneration Committee met four times in 2017: March, June, September and December. Please refer to the Board and Committee attendance in 2017 section of the Corporate Governance Report on page 82 for details on the Remuneration Committee meetings.
During the period from 15 September leading up to 7 December, our Chief Financial Officer, Michalis Imellos, took on the role of Acting Chief Executive Officer. During this period, he was not appointed to the Board. The Remuneration Committee made no additional interim payments for his interim role.
Zoran Bogdanovic, previously a Region Director and member of the Operating Committee since 2013, was appointed to the role of Chief Executive Officer on 7 December 2017. His formal appointment to the Board will be put forward for shareholder approval at the next Annual General Meeting in June 2018. Remuneration arrangements for Zoran Bogdanovic have been determined by the Remuneration Committee and are aligned to the remuneration policy for Executive Directors. Full details can be found on page 107.
In accordance with our remuneration policy, the base salary of Dimitris Lois had been reviewed earlier this year. In light of consideration of base salary increases across the organisation and market positioning, as well as business and individual performance, we decided to recommend increasing his annual base salary by 2.5%, which was effective 1 May 2017. The Remuneration Committee considered business and individual performance criteria when recommending the increase.
Further, in March 2017 Dimitris Lois received a third grant under the PSP. The award represented 330% of his base salary at the date of grant. These shares were originally subject to a three-year performance period, aligned to the Company’s financial year, with performance measured to the end of the financial year 2019, and vesting anticipated in March 2020. The treatment of this award is provided on page 118.
We continue to commit to disclosing MIP targets retrospectively and you will find the 2017 performance targets and outcomes reported on page 119.
Policy changes Every year, the Remuneration Committee reassesses the Group’s remuneration policy. In 2017, we believed that the remuneration policy could be enhanced to be brought more in line with UK best practice and become more aligned to the long-term strategy of the business. As such, the Remuneration Committee focused on reviewing and approving the implementation of:
– bonus deferral within the MIP whereby the Chief Executive Officer will receive half of any bonus as deferred shares which will vest after three years, subject to continued service; and
– an additional holding period within the PSP whereby any vested shares held by the Chief Executive Officer are subject to a no-sale commitment for two years following the three-year performance period.
We believe that these changes support the alignment of management with our business strategy and our shareholders’ interests.
Alexandra PapalexopoulouChair of the Remuneration Committee
105Coca-Cola HBC 2017 Integrated Annual Report
Strategic R
eport
Co
rporate G
overnance
Financial Statem
entsS
wiss S
tatutory R
eporting
Supplem
entary Inform
ation

Reward strategy and objective The objective of the Group’s remuneration philosophy is to attract, retain and motivate employees who are curious, agile and committed to perform. Our reward strategy seeks to promote a growth mindset and reinforce desirable behaviours, ensuring that employees are fairly rewarded and that they recognise their individual contributions are directly linked to the success of the Company.
Variable pay is an important element of our reward philosophy. A significant proportion of total remuneration for top managers (including the Chief Executive Officer and the members of the Operating Committee) is tied to the achievement of our business objectives. These objectives are defined by key business metrics that are consistent with our growth strategy and will deliver long-term shareholder value. The variable pay element increases or decreases based on the achieved business performance. Through equity-related long-term compensation, we seek to ensure that the financial interests of the Chief Executive Officer, the members of the Operating Committee and other top managers are aligned with those of shareholders.
All of our remuneration plans, both fixed and variable, are designed to be cost-effective, taking into account market practice, business performance and individual performance and experience where relevant. We pay close attention to our shareholders’ views in reviewing our remuneration policy and programmes.
How we implement our reward strategy
RetainingContinuing to attract the
best talent
Note: Participants in the PSP are not eligible to participate in the Long-Term Incentive Plan.
Chief Executive Officer and Operating Committee
Support the alignment with shareholder interests ensuring sustainable performance:
– Chief Executive Officer – required to hold shares in the Company equal in value to 200% of annual base salary within a five-year period.
– Operating Committee – required to hold shares in the Company equal in value to 100% of annual base salary within a five-year period.
Performance share awards vest over three years. PSP awards are cascaded down to top managers, promoting a focus on long-term performance and aligning them to shareholders’ interests.
Chief Executive Officer and Operating Committee and selected senior management
Cash long-term incentive awards vest over three years. LTIP awards are cascaded down to select middle and senior management to promote a high-performance culture.
Selected middle and senior management
Management employees may be eligible to receive an award under the annual bonus scheme. Performance conditions are bespoke to the role and business unit.
All management
The Employee Share Purchase Plan encourages share ownership and aligns the interests of our employees with those of shareholders.
All employees
Base salaries may reflect the market value of each role as well as the individual’s performance and potential. Retirement and other benefits are subject to local market practice.
Shareholding guidelines
Performance Share Plan
Management Incentive Plan
Employee Share Purchase Plan (dependent on
country practice)
Fixed pay and benefits
(base salary, retirement and other benefits
– dependent on country practice)
Long-Term Incentive Plan
Remuneration throughout the organisation – a snapshot
AttractingFinding the people we want and need
RetainingContinuing to attract the best talent
MotivatingAchieving financial, business
and non-financial targets
RecognisingAdopting behaviours that
produce exceptional performance
A competitive winning team
The chart below illustrates how we put our reward strategy into practice, with the different remuneration arrangements that apply to different employee groups.
106 Coca-Cola HBC 2017 Integrated Annual Report
DIRECTORS’ REMUNERATION REPORT CONTINUED

Pay element DetailBase salary The annual base salary of the newly appointed Chief Executive Officer is €750,000.
The salary is reviewed annually and any increase is typically effective 1 May each year.Retirement benefits The Chief Executive Officer participates in a defined benefit pension plan under Swiss law.
Employer contributions are 15% of annual base salary.Other benefits Other benefits include (but are not limited to) medical insurance, housing allowance, Company car/
allowance, cost of living adjustment, trip allowance, partner allowance, exchange rate protection, tax equalisation and tax filing support and advice. Benefit levels vary each year depending on need.
ESPP(Employee Share Purchase Plan)
The Chief Executive Officer may participate in the Company’s Employee Share Purchase Plan. As a scheme participant, the Chief Executive Officer has the opportunity to invest a portion of his salary and/or MIP payments in shares. The Company matches employee contributions on a one-to-one basis up to 3% of salary and/or MIP payout.
Awards are subject to potential application of malus and clawback provisions. MIP(Management Incentive Plan)
The MIP consists of a maximum annual bonus opportunity of up to 130% of base salary.
Payout is based on business performance targets (up to 120% of base salary) and individual performance (up to 10% of base salary).
No bonus will be paid out if the Chief Executive Officer has achieved less than 50% of his individual objectives.
50% of any bonus will be deferred into shares for a further three-year period.
Payments are subject to potential application of malus and clawback provisions.PSP(Performance Share Plan)
The PSP is an annual share award which vests after three years and is subject to two equally weighted performance conditions:
(i) comparable earnings per share (EPS) and;
(ii) return on invested capital (ROIC), each measured over a three-year period.
An additional two-year holding period will apply following vesting.
Awards are subject to potential application of malus and clawback provisions.
+ =Base salaryRetirement benefits
Other benefits
ESPP MIP PSPTotal
compensation
At a glance – remuneration arrangements for the Chief Executive Officer
The table below summarises the remuneration arrangements in place for Zoran Bogdanovic, our new Chief Executive Officer. See page 118 for total compensation received in the 2017 financial year.
Fixed payVariable pay subject
to performance
107Coca-Cola HBC 2017 Integrated Annual Report
Strategic R
eport
Co
rporate G
overnance
Financial Statem
entsS
wiss S
tatutory R
eporting
Supplem
entary Inform
ation

Remuneration policy
IntroductionThe following section (pages 108 to 110) sets out our Directors’ remuneration policy which was approved by the Remuneration Committee in December 2017, following revisions to incorporate annual bonus deferral within the MIP and add an additional holding period to the PSP. This remuneration policy will be put forward to shareholders on a voluntary basis at the next Annual General Meeting in June 2018. Remuneration continues to be structured in a way that attracts, motivates and retains the talented people we need to achieve the Company’s strategic objectives and give them due recognition, whilst driving sustainable performance. It is intended that this remuneration policy will apply from the next Annual General Meeting.
As a Swiss-incorporated company, we are not required to put forward our remuneration policy for a shareholder vote, but we intend to do so voluntarily at least every three years (or when there are changes). We continue to endeavour to make sure that our disclosure complies fully with UK regulations, except when these conflict with Swiss law.
Policy table – Chief Executive OfficerThe Company currently has a single Executive Director, being the Chief Executive Officer. Therefore, for simplicity, this section refers only to the Chief Executive Officer. This remuneration policy would, however, apply for any new Executive Director role, in the event that one were created during the life of this remuneration policy. In that case, references in this section to the Chief Executive Officer should be read as being to each Executive Director.
Fixed
Base salary Retirement benefitsPurpose and link to strategyTo provide a fixed level of compensation appropriate to the requirements of the role of Chief Executive Officer and to support the attraction and retention of the talent able to deliver the Group’s strategy.
OperationSalary is reviewed annually, with salary changes normally effective on 1 May each year.
The following parameters are considered when reviewing base salary level:
• the Chief Executive Officer’s performance, skills and responsibilities;
• economic conditions and performance trends;• experience of the Chief Executive Officer;• pay increases for other employees; and• external comparisons based on factors such as: the industry
of the business, revenue, market capitalisation, headcount, geographical footprint, stock exchange listing (FTSE) and other European companies.
Malus and clawback provisions do not apply to base salary.
Maximum opportunityWhilst there is no maximum salary level, any increases awarded to the Chief Executive Officer will normally be broadly aligned with the broader employee population. The salary increase made to the Chief Executive Officer may exceed the average salary increase under certain circumstances at the Remuneration Committee’s discretion. For example, this may be due to: business and individual performance; material changes to the business; internal promotions; accrual of experience; changes to the role; or other material factors.
Performance metricsIndividual and business performance are key factors when determining any base salary changes.
The annual base salary for the Chief Executive Officer is set out on page 107.
Purpose and link to strategyTo provide competitive, cost-effective post-retirement benefits.
OperationThe Chief Executive Officer participates in a defined benefit pension plan under Swiss law. There is no obligation for employee contributions.
Normal retirement age for the Chief Executive Officer’s plan is 65 years. In case of early retirement, which is possible from the age of 58, the Chief Executive Officer is entitled to receive the amount accrued under the plan as a lump sum.
Malus and clawback provisions do not apply to retirement benefits.
Maximum opportunityThe contributions to the pension plan are calculated as a percentage of annual base salary (excluding any incentive payments or other allowance/benefits provided) based on age brackets as defined by federal Swiss legislation. This percentage is currently 15% of base salary and increases to 18% for age above 55.
Performance metricsNone.
108 Coca-Cola HBC 2017 Integrated Annual Report
DIRECTORS’ REMUNERATION REPORT CONTINUED

Other benefits ESPP (Employee Share Purchase Plan)Purpose and link to strategyTo provide benefits to the Chief Executive Officer which are consistent with market practice.
OperationBenefit provisions are reviewed by the Remuneration Committee which has the discretion to recommend the introduction of additional benefits where appropriate.
Typical provisions for the Chief Executive Officer include benefits related to relocation such as: housing allowance, Company car/allowance, cost of living adjustment, trip allowance, partner allowance, exchange rate protection, tax equalisation and tax filing support and advice. For all benefits, the Company will bear any income tax and social security contributions arising from such payments.
Malus and clawback provisions do not apply to benefits.
Maximum opportunityThere is no defined maximum as the cost to the Company of providing such benefits will vary from year to year.
Performance metricsNone.
Purpose and link to strategyThe ESPP is an employee share purchase plan, encouraging broader share ownership, and is intended to align the interests of employees including the Chief Executive Officer with those of shareholders.
OperationThe ESPP is a voluntary share purchase scheme across many of the Group’s countries. The Chief Executive Officer as a scheme participant has the opportunity to invest from 1% to 15% of his salary and/or MIP payout to purchase the Company’s shares by contributing to the plan on a monthly basis.
The Company matches the contributions on a one-to-one basis up to 3% of the employee’s salary and /or MIP payout. Matching contributions are used to purchase shares one year after the matching. Matching shares are immediately vested.
Dividends received in respect of shares held under the ESPP are used to purchase additional shares and are immediately vested.
The Chief Executive Officer is eligible to participate in the ESPP operated by the Company on the same basis as other employees.
Malus and clawback provisions apply. Further details may be found in the Additional notes to the Executive Director's remuneration policy table section on page 111.
Maximum opportunityMaximum investment is 15% of gross base salary and MIP payout. The Company matches contributions up to 3% of gross base salary and MIP payout. Matching contributions are used to purchase shares one year after the matching. Matching shares are immediately vested.
Performance metricsThe value is directly linked to the share price performance.
It is therefore not affected by other performance criteria.
Variable pay
MIP (Management Incentive Plan) PSP (Performance Share Plan)Purpose and link to strategyTo support profitable growth and reward annually for contribution to business performance. The plan aims to promote a high-performance culture with stretched individual and business targets linked to our key strategies.
OperationAnnual cash bonus awarded under the MIP is subject to business and individual performance metrics and is not part of the base for calculating pension.
The Chief Executive Officer’s individual objectives are regularly reviewed to ensure relevance to business strategy and are set and approved annually by the Chair of the Remuneration Committee and Chairman of the Board of Directors.
Stretched targets for business performance are set annually based on the business plan of the Group as approved by the Board of Directors.
Performance against these targets and bonus outcomes are assessed by the Remuneration Committee, which may recommend an adjustment to the payout level where it considers the overall performance of the Company or the individual’s contribution warrants a higher or lower outcome.
Malus and clawback provisions apply. Further details may be found in the Additional notes to the Executive Director’s remuneration policy table section on page 111.
Purpose and link to strategyTo align the Chief Executive Officer’s interests with the interests of shareholders and increase the ability of the Group to attract and reward individuals with exceptional skills.
OperationThe Chief Executive Officer is granted conditional awards of shares which vest after three years, subject to the achievement of performance metrics and continued service. Grants take place annually, normally every March.
Performance metrics and the associated targets are reviewed and determined at the beginning of each performance period to ensure that they support the long-term strategies and objectives of the Group and are aligned with shareholders’ interests.
Dividends may be paid on vested shares where the performance metrics are achieved at the end of the three-year period.
Malus and clawback provisions apply. Further details may be found in the Additional notes to the Executive Director’s remuneration policy table section on page 111.
109Coca-Cola HBC 2017 Integrated Annual Report
Strategic R
eport
Co
rporate G
overnance
Financial Statem
entsS
wiss S
tatutory R
eporting
Supplem
entary Inform
ation

Variable pay
MIP (Management Incentive Plan) PSP (Performance Share Plan)Maximum opportunityThe Chief Executive Officer’s maximum MIP opportunity is set at 130% of annual base salary.
Threshold, target and maximum bonus opportunity levels are as follows:
• Threshold: 5% of base salary• Target: 70% of base salary• Maximum: 130% of base salary.
Maximum payout is based on business performance targets (up to 120% of salary) and individual performance (up to 10% of salary).
Performance metricsThe MIP awards are based on business metrics linked to our business strategy. These may include but are not limited to measures of volume, revenue, profit, cash and operating efficiencies. The weighting of individual performance metrics shall be determined by the Remuneration Committee at the beginning of the MIP performance period. Details related to the key performance indicators and individual objectives can be found in the Annual Report on Remuneration on page 122.
Deferral of MIP50% of any MIP award is to be deferred in shares which will be made available after a three-year deferral period which commences on the first day of the fiscal year in which the deferred share award is made.
Deferred shares may be subject to malus and clawback (for a period of two years following the incentive award) to the extent deemed appropriate by the Remuneration Committee, in line with best practice.
Maximum opportunityAwards (normally) have a face value up to 330% of base salary. In exceptional circumstances only, the Remuneration Committee has the discretion to grant awards up to 450% of base salary.Performance metricsVesting of awards is subject to the three-year Group performance metrics based on two equally-weighted measures which have been selected as they are aligned to long-term growth and also measure the efficient use of capital, both of which are aligned to our strategic plan: comparable earnings per share (Comparable EPS); and the percentage of net operating profit after tax divided by the capital employed (ROIC). Capital employed is calculated as the average of net borrowings and shareholders’ equity through the year.
Following the end of the three-year period, the Remuneration Committee will determine the extent to which performance metrics have been met and, in turn, the level of vesting. Participants may receive vested awards in the form of shares or a cash equivalent.
For both performance metrics, achieving threshold performance results in vesting of 25% of the award and maximum performance results in vesting of 100% of the award.
Performance share awards will lapse if the Remuneration Committee determines that the performance metrics have not been met.
Holding period Any vested award (net of shares sold to cover tax liability) is subject to a further two-year holding period following the end of the three-year performance period. During this two-year period these beneficially owned shares are subject to a no-sale commitment. Any shares subject to the holding period count towards the shareholding requirement.
AdjustmentsIn the event of an equity restructuring, the Remuneration Committee may make an equitable adjustment to the terms of the performance share award by adjusting the number and kind of shares which have been granted or may be granted and/or making provision for payment of cash in respect of any outstanding performance share award.
Change in controlIn the event of change of control, unvested performance share awards held by participants vest immediately on a pro-rated basis if the Remuneration Committee determines that the performance metrics have been satisfied or would have been likely to be satisfied at the end of the performance period, unless the Remuneration Committee determines that substitute performance share awards may be used in place of the previous awards. For vested shares subject to the additional holding period, the holding period will lapse and the participants are no longer subject to the no-sale commitment.
110 Coca-Cola HBC 2017 Integrated Annual Report
DIRECTORS’ REMUNERATION REPORT CONTINUED

Maximum
Target
Minimum
16%
23%
58%
10%
14%
33% 1,300
2%
4%
9%
20%
16% 43% 3,202
52% 4,779
Base pay Cash and non-cash benefits Pension MIP PSP
Additional notes to the Executive Director's remuneration policy table
Chief Executive Officer’s remuneration policy illustration
Component Minimum (€ 000s) Target (€ 000s) Maximum (€ 000s)
Fixed Base salary1 750 750 750 Pension 113 113 113 Cash and non-cash benefits2, 3 437 453 466Variable MIP – 525 975 PSP – 1,361 2,475Total 1,300 3,202 4,779
1. Represents the annual base salary for the new Chief Executive Officer effective 7 December 2017.2. Represent the annual cash and non-cash benefits for the new Chief Executive Officer effective 7 December 2017. 3. ESPP employer contributions may vary depending on the MIP payout and whether the Chief Executive Officer decides to contribute a portion. The figures provided
have been calculated on the basis of the applicable MIP payout and the Chief Executive Officer deciding to contribute 3% to the ESPP.
ESOP (Employee Stock Option Plan)The ESOP was replaced by the PSP in 2015 and the last grant under the ESOP took place in December 2014. Although the Remuneration Committee does not intend to award under the ESOP going forward, there are still outstanding share option awards which may be exercised in future years. Awards vest in one-third increments each year for three years and can be exercised for up to 10 years from the date of the award.
Malus and clawback provision for variable pay plans The MIP, PSP, ESOP and ESPP plans include malus provisions which give the Remuneration Committee and/or the Board discretion to judge that an award should lapse wholly or partly in the event of material misstatement of financial results and/or misconduct.
The Remuneration Committee and/or Board also has the discretion to determine that clawback should be applied to awards under the MIP, PSP, ESOP and ESPP plans for the Chief Executive Officer and members of the Operating Committee. Clawback can potentially be applied to payments or vested awards for up to a two-year period following the payment or vesting.
Changes from previous policy in respect of Executive DirectorsThe Remuneration Committee has updated the policy to provide for:
– bonus deferral within the MIP, whereby the Chief Executive Officer will receive half of any bonus as deferred shares which will vest after three years, subject to continued service; and
– an additional holding period within the PSP whereby any vested shares held by the Chief Executive Officer are subject to a no-sale commitment for two years following the three-year performance period.
The Remuneration Committee considers that these changes support the alignment of management with our business strategy and our shareholders’ interests.
111Coca-Cola HBC 2017 Integrated Annual Report
Strategic R
eport
Co
rporate G
overnance
Financial Statem
entsS
wiss S
tatutory R
eporting
Supplem
entary Inform
ation

Shareholding guidelinesIn order to strengthen the link with shareholders’ interests, the Chief Executive Officer is required to hold shares in the Company equal in value to 200% of annual base salary. Members of the Operating Committee are required to hold 100% of annual base salary. The required shareholdings are to be achieved within a five-year period starting from the date of the first PSP grant (10 December 2015) or later based on the date of the appointment.
Remuneration arrangements across the GroupThe remuneration approach for the Chief Executive Officer, the members of the Operating Committee and senior management is similar. The Chief Executive Officer’s total remuneration has a significantly higher proportion of variable pay in comparison with the rest of our employees. The Chief Executive Officer’s remuneration will increase or decrease in line with business performance, aligning it with shareholders’ interests.
The structure of the remuneration package for the wider employee population takes into account local market practice and is intended to attract and retain the right talent, be competitive and remunerate employees for promoting a growth mindset, while contributing to the Group’s performance.
Policy table – non-Executive DirectorsBase feesPurpose and link to strategy
To provide a fixed level of compensation appropriate to the requirements of the role of non-Executive Director and to attract and retain high-quality non-Executive Directors with the right talent, values and skills necessary to provide oversight and support to management to grow the business, support the Company’s strategic framework and maximise shareholder value.Operation
Non-Executive Directors’ pay is set at a level that will not call into question the objectivity of the Board. When considering market levels, comparable companies typically include those in the FTSE 100 Index with similar positioning as the Company, other Swiss companies with similar market caps and/or revenues, and other relevant European listed companies.
The Group’s compensation of non-Executive Directors includes an annual fixed fee plus additional fees for serving on any Board committees.Maximum opportunity
Fee levels for non-Executive Directors include an annual fixed fee plus additional fees for membership of Board committees when applicable, as summarised below:
• Base non-Executive Director’s fee: €70,000• Senior Independent Director’s fee: €15,000• Audit and Risk Committee Chairman fee: €27,500• Audit and Risk Committee member fee: €13,800• Remuneration, Nomination and Social Responsibility Committee Chair fees: €11,000• Remuneration, Nomination and Social Responsibility Committee member fees: €5,500Other benefits
Non-Executive Directors do not receive any benefits in cash or in kind. They are not entitled to severance payments in the event of termination of their appointment. They are entitled to reimbursement of all reasonable expenses incurred in the interests of the Group.Variable remuneration
Non-Executive Directors do not receive any form of variable compensation.
Legacy arrangementsFor the avoidance of doubt, it is noted that the Company will honour any commitments entered into that have previously been disclosed to shareholders.
112 Coca-Cola HBC 2017 Integrated Annual Report
DIRECTORS’ REMUNERATION REPORT CONTINUED

Policy on recruitment/appointment
Executive DirectorsAnnual base salary arrangements for the appointment of an Executive Director will be set considering market relevance, skills, experience, internal comparisons and cost. The Remuneration Committee may recommend an appropriate initial annual base salary below relevant market levels. In such situations, the Remuneration Committee may make a recommendation to realign the level of base salary in subsequent years. As highlighted above, annual base salary ‘gaps’ may result in exceptional rates of salary increase in the short term, subject to an individual’s performance. The discretion is retained to offer an annual base salary necessary to meet the individual circumstances of the recruited Executive Director and to enable the hiring of an individual with the necessary skills and expertise.
The maximum level of variable pay that may be offered will follow the rules of the MIP and is capped at 130% of the relevant individual’s annual base salary. The maximum level of equity-related pay that may be offered will follow the PSP rules and is capped at 450% of the relevant individual’s annual base salary. The typical PSP award is not expected to surpass 330% of base salary. Different performance measures may be set initially for the annual bonus taking into consideration the point in the financial year that a new Executive Director joins. The above limits do not include the value of any buyout arrangements.
Benefits will be provided in line with those offered according to the Group’s policy for other employees. If an Executive Director is required to relocate, benefits may be provided as per the Group’s international transfer policy which may include transfer allowance, tax equalisation, tax advice and support, housing, cost of living, schooling, travel and relocation costs. Retirement benefits will be in line with the policy table.
The Remuneration Committee may consider recommending the buying out of incentive awards that an individual would forfeit by accepting the appointment up to an equivalent value in shares or in cash. In the case of a share award, the Remuneration Committee may approve a grant of shares under the PSP. When deciding on a potential incentive award buyout and in particular the level and value thereof, the Remuneration Committee will be informed of the time and performance pro-rated level of any forfeited award.
It is expected that Executive Directors appointed during the remuneration policy period will be appointed on similar notice provisions to the Chief Executive Officer, allowing for termination of office by either party on six months’ notice.
Non-Executive DirectorsIt is expected that non-Executive Directors appointed during the remuneration policy period will receive the same basic fee and, as appropriate, committee fee or fees as existing non-Executive Directors and will be entitled to reimbursement of all reasonable expenses incurred in the interests of the Group.
It is expected that non-Executive Directors appointed during the remuneration policy period will be appointed on a one-year term of appointment, in the same manner as existing non-Executive Directors.
The Company does not compensate new non-Executive Directors for any forfeited share awards in previous employment.
Termination paymentsThe Swiss Ordinance against Excessive Compensation in Listed Companies limits the authority of the Board to determine compensation. Limitations include the prohibition on certain types of severance compensation.
Our governance framework ensures that the Group uses the right channels to support reward decisions. In the case of early termination, a non-Executive Director would be entitled to his/her fees accrued as of the date of termination, but not any additional compensation. The Chief Executive Officer’s employment contract does not contain any provisions for payments on termination. Notice periods are set for up to six months and non-compete clauses are 12 months, effective in 2017. The notice period anticipates that up to six months' paid garden leave may be provided. Similarly, up to 12 months of base salary may be paid out in relation to the non-compete period.
In case of future terminations, payments will be made in accordance with the termination policy on page 114.
113Coca-Cola HBC 2017 Integrated Annual Report
Strategic R
eport
Co
rporate G
overnance
Financial Statem
entsS
wiss S
tatutory R
eporting
Supplem
entary Inform
ation

Pay element
Good leaver (retirement at 55 or later/at least 10 years' continued service)
Good leaver (redundancy, injury, disability)
Bad leaver (resignation, dismissal) Death in service
Base salary and other benefits / non-Executive Directors’ fees
Payment in lieu of notice is not permissible. The Company could ask the Chief Executive Officer to be on paid garden leave for up to six months.
ESPP Unvested shares held in the ESPP will vest upon termination
Unvested shares under the ESPP are forfeited
Available ESPP shares will be transferred to heirs
MIP A pro-rated payout as of the date of retirement will be applied.
Deferred shares will continue to vest as normal.
A pro-rated payout as of the date of leaving will be applied.
Deferred shares will continue to vest as normal.
In the event of resignation or dismissal, as per Swiss law, the Chief Executive Officer is entitled to a pro-rated MIP payout.
Any outstanding deferred shares will lapse.
A pro-rated payout will be applied and will be paid immediately to heirs based on the latest rolling estimate.
Deferred shares will continue to vest as normal.
PSP/ESOP Unvested performance shares and options are retained and will continue to vest as normal subject to performance conditions as set out in the award agreement.
For vested shares which are subject to the additional holding period, they will continue to be subject to the no-sale commitment until the end of the relevant two-year period.
All unvested options and performance share awards immediately vest to the extent that the Remuneration Committee determines that the performance conditions have been met, or are likely to be met at the end of the three-year performance period.
Any options which vest are exercisable within 12 months of the date of termination.
For vested shares which are subject to the additional holding period, they will continue to be subject to the no-sale commitment until the end of the relevant two-year period.
All unvested options and performance share awards immediately lapse without any compensation.
In the event of resignation, all vested options must be exercised within six months of the date of termination.
Upon dismissal, all vested options must be exercised within 30 days of the date of termination.
For vested shares which are subject to the additional holding period, they will continue to be subject to the no-sale commitment until the end of the relevant two-year period.
All unvested options and performance share awards immediately vest subject to time and performance pro-rating.
Any options which vest are exercisable within 12 months of the date of termination.
For vested shares which are subject to the additional holding period, the no-sale commitment will cease immediately.
Under Swiss law, share awards are considered annual compensation and as such when time pro-rating is required, the year of grant (12 months) and not the vesting period (36 months) for time pro-rating calculations is considered.
Corporate eventsIn the event of an equity restructuring, the Remuneration Committee may make an equitable adjustment to the terms of the performance share award by adjusting the number and kind of shares which have been granted or may be granted and/or making provision for payment of cash in respect of any outstanding performance share award.
In the event of a change of control, unvested performance share awards held by participants vest immediately on a pro-rated basis if the Remuneration Committee determines that the performance condition(s) have been satisfied or would have been likely to be satisfied at the end of the performance period, unless the Remuneration Committee determines that substitute performance share awards may be used in place of the previous awards.
Service contractsZoran Bogdanovic, the new Chief Executive Officer, has an employment contract with the Company, effective 7 December 2017, that contains a six-month notice period. As noted in the termination payments, the Chief Executive Officer’s employment contract does not include any termination benefits, other than as mandated by Swiss law. The Swiss Code of Obligations requires employers to pay severance when an employment relationship ends with an employee of at least 50 years of age after 20 years or more of service.
114 Coca-Cola HBC 2017 Integrated Annual Report
DIRECTORS’ REMUNERATION REPORT CONTINUED

The Chief Executive Officer is also entitled to reimbursement of all reasonable expenses incurred in the interests of the Company. In accordance with the Swiss Ordinance against Excessive Compensation in Listed Companies, there are no sign-on policies/provisions for the appointment of the Chief Executive Officer.
The table below provides details of the current service contracts and terms of appointment for the Chief Executive Officer and other Directors.
Name TitleDate originally appointed to the Board of the Company
Date appointed to the Board of the Company
Unexpired term of service contract or appointment as non-Executive Director
Anastassis G. David Chairman and non-Executive Director
27 July 2006 20 June 2017 One year
Zoran Bogdanovic Chief Executive Officer NA – to be appointed to the Board at the next AGM in June 2018
NA – to be appointed to the Board at the next AGM in June 2018
Indefinite, terminable on six months’ notice
Ahmet C. Bozer Non-Executive Director 21 June 2016 20 June 2017 One yearCharlotte J. Boyle1 Non-Executive Director 20 June 2017 20 June 2017 One yearAntonio D’Amato2 Non-Executive Director 1 January 2002 – – Olusola (Sola) David-Borha Non-Executive Director 24 June 2015 20 June 2017 One yearWilliam W. (Bill) Douglas III Non-Executive Director 21 June 2016 20 June 2017 One yearReto Francioni Senior Independent
non-Executive Director21 June 2016 20 June 2017 One year
Anastasios I. Leventis Non-Executive Director 25 June 2014 20 June 2017 One yearChristo Leventis Non-Executive Director 25 June 2014 20 June 2017 One yearAlexandra Papalexopoulou Non-Executive Director 24 June 2015 20 June 2017 One yearJosé Octavio Reyes Non-Executive Director 25 June 2014 20 June 2017 One year Robert Ryan Rudolph Non-Executive Director 21 June 2016 20 June 2017 One yearJohn P. Sechi Non-Executive Director 25 June 2014 20 June 2017 One year
1. Charlotte J. Boyle was appointed to the Board of Directors, the Remuneration Committee and the Nomination Committee at the 2017 AGM on 20 June 2017.2. Antonio D’Amato retired from the Board of Directors, the Remuneration Committee and the Nomination Committee at the 2017 AGM on 20 June 2017.
The Chief Executive Officer’s service contract and the terms and conditions of appointment of the non-Executive Directors are open for inspection by the public at the registered office of the Group.
Consideration of employee viewsThe Remuneration Committee does not currently consult specifically with employees on policy for the remuneration of the Chief Executive Officer. Pay movement for the wider employment group is considered when making pay decisions for the Chief Executive Officer.
Consideration of shareholder viewsShareholder views and the achievement of the Group’s overall business strategies have been taken into account in formulating the remuneration policy. Following shareholder feedback before and after the Annual General Meeting, the Remuneration Committee and the Board consult with shareholders and meet with the largest institutional investors to gather feedback on the Company’s remuneration strategy and corporate governance. The Company would be happy to engage with shareholders in the future to discuss the outcomes of the remuneration policy.
In reviewing and determining remuneration, the Remuneration Committee takes into account the following:
– the business strategies and needs of the Company;
– the views of shareholders on Group policies and programmes of remuneration;
– market comparisons and the positioning of the Group’s remuneration relative to comparable companies;
– input from employees regarding our remuneration programmes;
– the need for similar, performance-related principles for the determination of executive remuneration and the remuneration of other employees; and
– the need for objectivity. Board members, the Chief Executive Officer and Operating Committee members play no part in determining their own remuneration. The Chair of the Remuneration Committee and the Chief Executive Officer are not present when the Remuneration Committee and the Board discuss matters that pertain to their remuneration.
This ensures that the same performance-setting principles are applied for executive remuneration and other employees in the organisation.
115Coca-Cola HBC 2017 Integrated Annual Report
Strategic R
eport
Co
rporate G
overnance
Financial Statem
entsS
wiss S
tatutory R
eporting
Supplem
entary Inform
ation

Annual Report on Remuneration
IntroductionThis section of the Report provides detail on how we have implemented our remuneration policy in 2017 which, in accordance with the UK remuneration reporting regulations, will be subject to an advisory shareholder vote at our 2018 Annual General Meeting.
Activities of the Remuneration Committee during 2017During 2017, the key Remuneration Committee activities were to:
– review and sign off the 2016 Directors’ Remuneration Report;
– review and recommend the 2017 base salary for the former Chief Executive Officer;
– review and approve 2017 base salaries for the Operating Committee members and general managers;
– review and approve the 2016 MIP payout for the former Chief Executive Officer;
– review and approve payout levels for the 2016 MIP in relation to Operating Committee members and general managers;
– set and approve 2017 PSP targets;
– review award levels for 2017 PSP awards;
– review the Company's Irish pension plans;
– review and approve changes to the Executive Director's remuneration policy – a three-year annual bonus deferral within the MIP and an additional two-year holding period within the PSP;
– following the untimely death of Dimitris Lois in October 2017, determine the payments due to his beneficiaries under the MIP and PSP; and
– review and approve the remuneration arrangements for the new Chief Executive Officer.
Advisors to the Remuneration CommitteeThe Chairman of the Board, the Chief Executive Officer, the Group Human Resources Director, the Group Rewards Director and the General Counsel regularly attend meetings of the Remuneration Committee.
While the Remuneration Committee does not have external advisors, in 2017 it authorised management to work with external consultancy firm Willis Towers Watson to provide independent advice on ad hoc remuneration issues during the year. These services are considered to have been independent and relevant to the market. Other than employee engagement benchmarking services, Willis Towers Watson does not provide any other services to the Company. The total cost in connection with providing advice on remuneration issues was €46,328. Willis Towers Watson are members of the Remuneration Consultants Group and provide advice in line with its Code of Business Conduct.
Herbert Smith Freehills LLP provide the Company with legal advice. Advice from Herbert Smith Freehills LLP is made available to the Remuneration Committee, where it relates to matters within its remit.
116 Coca-Cola HBC 2017 Integrated Annual Report
DIRECTORS’ REMUNERATION REPORT CONTINUED

Non-Executive Directors’ remuneration for the years ended 31 December 2017 and 2016 (EUR)
Financial year Base fee1
Audit and Risk Committee
Remuneration Committee
Nomination Committee
Social Responsibility
Committee
Senior Independent
Director Social security contributions2 Total
Anastassis G. David FY2017 70,000 – – – – – – 70,000 FY2016 67,500 – – – – – – 67,500Ahmet C. Bozer FY2017 70,000 – – – – – – 70,000 FY2016 35,000 – – – – – – 35,000Charlotte J. Boyle3 FY2017 35,000 – 2,750 2,750 – – – 40,500 FY2016 – – – – – – – –Antonio D’Amato4 FY2017 35,000 – 2,750 2,750 – – – 40,500 FY2016 67,500 – 5,250 5,250 – – – 78,000Olusola (Sola) David-Borha FY2017 70,000 13,800 – – – – 6,584 90,384 FY2016 67,500 13,150 – – – – 6,344 86,994William W. (Bill) Douglas lll FY2017 70,000 27,500 – – – – – 97,500 FY2016 35,000 13,750 – – – – – 48,750Reto Francioni FY2017 70,000 – 5,500 11,000 – 15,000 7,974 109,474 FY2016 35,000 – 2,750 5,500 – 7,500 3,992 54,742Anastasios I. Leventis FY2017 70,000 – – – 11,000 – – 81,000 FY2016 35,000 – – – 5,500 – – 40,500Christo Leventis5 FY2017 70,000 – – – – – 2,179 72,179 FY2016 35,000 – – – – – 2,753 37,753Alexandra Papalexopoulou FY2017 70,000 – 11,000 5,500 5,500 – – 92,000 FY2016 67,500 – 8,000 5,250 2,750 – – 83,500José Octavio Reyes FY2017 70,000 – – – 5,500 – 4,560 80,060 FY2016 67,500 – – – 5,250 – 5,722 78,472Robert Ryan Rudolph FY2017 70,000 – – – – – 5,499 75,499 FY2016 35,000 – – – – – 2,753 37,753John P. Sechi FY2017 70,000 13,800 – – – – – 83,800 FY2016 67,500 13,150 – – – – – 80,650
1. Non-Executive Director fees for 2017 are in line with the fees that were revised in 2016.2. Social security employer contributions as required by Swiss legislation.3. Charlotte Boyle was appointed to the Board of Directors, the Remuneration Committee and the Nomination Committee on 20 June 2017. The Group has applied
a half-year period base fee.4. Antonio D’ Amato retired from the Board of Directors, the Remuneration Committee and the Nomination Committee on 20 June 2017. The Group has applied
a half-year period base fee.5. In June 2017 social security contributions of EUR 2,179, withheld in December 2016, were returned to Christo Leventis, on top of his fees, as he was deemed not
subject to Swiss social security.
117Coca-Cola HBC 2017 Integrated Annual Report
Strategic R
eport
Co
rporate G
overnance
Financial Statem
entsS
wiss S
tatutory R
eporting
Supplem
entary Inform
ation

Single figure table
Single total figure of remuneration for the Chief Executive Officer for the years ended 31 December 2017 and 2016
Base pay5
€ 000s
Cash and non-cash benefits6
€ 000s Annual bonus7
€ 000s
Employee Share Purchase Plan 8
€ 000s Long-term incentives
€ 000s
Retirement benefits € 000s
Total single figure € 000s
2017 2016 2017 2016 2017 2016 2017 2016 2017 2016 2017 2016 2017 2016
Dimitris Lois1,2,3 852 899 498 502 643 647 40 53 13,227 665 118 157 15,378 2,923Zoran Bogdanovic4 58 0 35 0 47 0 2 0 262 0 6 0 410 0
1. 2017 base salary and all benefits for Dimitris Lois reflect the period 1 January to 2 October 2017, including 2 months' salary and benefits to the heirs as per Swiss law. Relevant payments did not include any variable pay.
2. The annual bonus payout for Dimitris Lois reflects the pro-rated period to 2 October 2017. 3. Long-term incentives reflect the 2015, 2016 and 2017 awards made under the Performance Share Plan, the dividend equivalent shares paid on PSP shares that
vested in 2017 and share options that vested to Dimitris Lois in 2017 under the Employee Stock Option Plan. In line with the Performance Share Plan rules, awards were pro-rated for time and performance up to 2 October 2017. For the share options, the value reflects the number of share options multiplied by the market price at vesting minus the exercise price at grant. Further details are included in the table under ‘Arrangements for Dimitris Lois, former Chief Executive Officer’ below.
4. For Zoran Bogdanovic, 2017 base salary and all benefits reflect his role as Chief Executive Officer and hence the period from the date of his appointment, 7 December 2017, to the end of the financial year. Long-term incentives reflect the share options that vested to Zoran Bogdanovic in 2017 under the Employee Stock Option Plan. The value reflects the number of share options multiplied by the market price at vesting minus the exercise price at grant.
5. Base pay includes the monthly instalments linked with the base salary for 2017. A salary increase was applied to the base salary effective from 1 May.6. Under Cash and non-cash benefits we include the value of all benefits paid during 2017. These are outlined in the Cash and non-cash benefits section below. 7. Annual bonus for 2017 includes the MIP payout, receivable early in 2018 for the 2017 performance year. 8. Employee Share Purchase Plan was previously reported under Cash and non-cash benefits. From 2017 onwards, it is reported separately.
Arrangements for Dimitris Lois, former Chief Executive OfficerIn line with the provisions for death in service as set out in the relevant compensation plan policies (as outlined on page 114), no base salary in lieu of notice was paid out. The MIP award of 130% of base salary for the 2017 financial year, was pro-rated for time and performance up to 2 October 2017. This pro-rated payment of € 643,208 (69% of base salary), made under the MIP, was paid in March 2018 to his heirs. The performance targets and outcomes can be found in the MIP payout section on page 119. In line with the death-in-service provisions, all available plan shares under the ESPP, 56,379 shares, were immediately transferred to his heirs.
In line with the PSP rules, all of Dimitris Lois’ outstanding PSP awards were pro-rated for time and performance up to 2 October 2017. The Remuneration Committee deemed it appropriate for all outstanding PSP awards to vest immediately to Dimitris Lois’ heirs – the number of shares that vested is summarised in the table below. The Remuneration Committee deemed that the vesting portion of all outstanding share awards should attract the value of dividend equivalent shares. These dividend equivalent shares vested at the same time as the vesting of the outstanding share awards. The performance targets and outcomes can be found on page 121.
Award Original performance period Time for pro-ratingFace value of award (number of shares)
Time pro-rating – % vesting
Performance pro-rating – % vesting
Number of shares to vest (following time and performance pro-rating)
2015 award 1 January 2015 – 31 December 2017
1 January 2015 – 31 December 2015
138,476 100% 100% 138,476
2016 award 1 January 2016 – 31 December 2018
1 January 2016 – 31 December 2016
159,876 100% 100% 159,876
2017 award 1 January 2017 – 31 December 2019
1 January 2017 – 2 October 2017
128,421 75% 88% 84,757
2016 Dividend equivalent shares 6,608 2017 Dividend equivalent shares 6,685
Under Swiss law, share awards are considered annual compensation and as such when time pro-rating is required, the year of grant (12 months) and not the vesting period (36 months) for time pro-rating calculations is considered.
118 Coca-Cola HBC 2017 Integrated Annual Report
DIRECTORS’ REMUNERATION REPORT CONTINUED

Fixed pay for 2017
Base salaryDuring the year, the Remuneration Committee recommended to the Board for approval a salary increase for Dimitris Lois of 2.5%, resulting in a base salary of €932,000, effective 1 May 2017. When approving this increase, the Remuneration Committee took into consideration base salary increases across the organisation, and alignment and competitiveness versus peers in the FTSE. The salary increase rate for the Swiss-based employees is 1.7%. As described above, upon Dimitris Lois’ death, no base salary in lieu of notice was paid out.
Following the appointment of Zoran Bogdanovic to Chief Executive Officer, the Remuneration Committee recommended and the Board approved a base salary of €750,000, effective 7 December 2017. When determining the base salary level, the Remuneration Committee considered alignment and competitiveness versus peers in the FTSE, internal relativities and the experience of the individual.
Retirement benefitsDimitris Lois received a retirement benefit of 18% of base salary during 2017, which is aligned to the retirement benefit provided under Swiss law and based on the age brackets defined by federal Swiss legislation.
Zoran Bogdanovic is to receive an annual retirement benefit of 15% of base salary, aligning to the retirement benefit provided under Swiss law and based on the age brackets defined by federal Swiss legislation. During the year, €5,801 of retirement benefit was received, reflecting the period 7 December 2017 to 31 December 2017.
Cash and non-cash benefitsDimitris Lois received additional benefits during the financial year until his passing on 2 October 2017. This included cost of living and foreign exchange rate adjustment (€299,387), private medical insurance (€22,865), Company car allowance (€23,084), housing allowance (€113,786), trip allowance (€8,268), tax assistance and filing support (€35,777), Company matching contribution related to the ESPP (€40,306 – reflecting the maximum match of 3% under the plan), tax equalisation (€ -162,136), payout of untaken leave days (€36,244) and the value of social security contributions (€121,201). The decrease in tax equalisation in comparison to the prior year is driven by changes in effective tax rates. Cash and non-cash benefits for Dimitris Lois reflect the period 1 January to 2 October 2017 and include two months' payment made to his heirs as per Swiss law.
Zoran Bogdanovic received additional benefits during the period 7 December to 31 December 2017. This included cost of living and foreign exchange rate adjustment (€17,928), private medical insurance (€402), Company car allowance (€1,201), housing allowance (€8,260), tax assistance and filing support (€517), Company matching contribution related to the ESPP (€1,750 – reflecting the maximum match of 3% under the plan), tax equalisation (€ -350) and the value of social security contributions (€6,583).
Variable pay for 2017
MIP performance outcomes – 2017
As outlined above, the annual bonus award in respect of the 2017 financial year for the former Chief Executive Officer was €643,208 reflecting 69% of base salary and this was paid out to his heirs in March 2018. This value reflects time and performance pro-rating up to 2 October 2017. This cash bonus reflects the financial and individual performance achieved during the period 1 January 2017 to 2 October 2017. The financial metrics, the associated targets and level of achievement are set out below (time pro-rating results in a payout of 61% of base salary).
Total financial performance measures payoutThreshold Target Maximum Actual
Volume (m unit cases)
Comparable EBIT (€ m)
OpEx % of NSR
NSR (€ m)
Total Working Capital Days Qualifier to Volume performance measure
16.3%
30.0%
13.7%
21.7%
Achieved
81.7%
1,928
529
27.3
5,869
6.67
2,095
575
25.5 25.3
6,380
6.08
2,104
Payout (% of base salary)Threshold (0%) Maximum (30%)Target (15%)
2,200
621 621
24.6
6,522 6,699
5.63 4.86
119Coca-Cola HBC 2017 Integrated Annual Report
Strategic R
eport
Co
rporate G
overnance
Financial Statem
entsS
wiss S
tatutory R
eporting
Supplem
entary Inform
ation

Following strong performance against the individual objectives set at the beginning of the year, where for all three segments revenue grew faster than 2016 and volume increased, engagement scores were maintained across the business, the EBIT margin grew and CCHBC maintained its industry-leading status as the beverage industry leader on the DJSI, the Remuneration Committee deemed there to be 100% achievement against the individual objectives, resulting in a maximum payout of 7.5% of base salary (time pro-rated amount).
Achievement against the Group targets and the respective payout is outlined in the table on page 119. Note that the payout levels have been pro-rated to reflect the period 1 January 2017 to 2 October 2017.
Employee Stock Option Plan (ESOP) outcomes – 2017The Remuneration Committee will no longer make awards under this plan. Under the grants made in December 2014, a total of 120,000 share options vested this year for Dimitris Lois and 23,334 for Zoran Bogdanovic. Share options vested for Zoran Bogdanovic do not relate to his appointment as a CEO. We have reflected the value of stock option awards that vested during 2017 for both employees, being the number of options multiplied by the market price at vest minus exercise price at grant.
In December 2017, the exercise period for certain existing options under the ESOP which were awarded in December 2007 was extended by the Remuneration Committee for a six month period from 13 December 2017 to 13 June 2018 in order to allow option holders the ability to exercise the options outside of closed periods.
Performance Share Plan (PSP) awards – 2017Since the discontinuation of the ESOP in late 2015, the PSP is now the primary long-term incentive vehicle. In March 2017 the Chief Executive Officer was granted a performance share award over 128,421 shares under the PSP, representing 330% of base salary at date of grant. The award was originally subject to a three-year performance period, aligned to the Company’s financial year, with performance measured to the end of financial year 2019, and vesting anticipated in March 2020.
The following table sets out the details of the performance share award made to the former Chief Executive Officer under the PSP for 2017.
Type of award made Performance share award over 128,421 shares, receivable for nil costShare price at date of grant €23.36 (£19.81)Date of grant 16 March 2017Performance period 1 January 2017 to 31 December 2019Face value of the award(The maximum number of shares that would vest if all performance measures and targets are met, multiplied by the share price at the date of grant)
€2,999,700
Face value of the award as a % of annual base salary 330% Percentage that would be distributed if threshold performance was achieved in both PSP key performance indicators
25% of maximum award
Percentage that would be distributed if threshold performance was achieved only in one PSP key performance indicator
12.5% of maximum award
Similar to the award made in March 2016, the 2017 award was subject to comparable earnings per share (EPS) and return on invested capital (ROIC), as outlined below.
Threshold Maximum
Measure Description Weighting TargetVesting
(% of max) TargetVesting (%
of max)
Comparable EPS Calculated by dividing the comparable net profit attributable to the owners of the parent by the weighted average number of outstanding shares during the period.
50% 1.24 25% 1.50 100%
Return on invested capital (ROIC)
ROIC is the percentage return that a company makes over its invested capital. More specifically, we define ROIC as the percentage of net operating profit after tax divided by the capital employed. Capital employed is calculated as the average of net borrowings and shareholders’ equity through the year.
50% 13% 25% 15.8% 100%
The vesting schedule for PSP performance conditions is not a straight line between the threshold and maximum performance levels. The Remuneration Committee considers that it is appropriate to place greater emphasis on achieving the target performance level than the outperformance of this level.
Zoran Bogdanovic did not receive an award under the PSP in his capacity as Chief Executive Officer during 2017.
120 Coca-Cola HBC 2017 Integrated Annual Report
DIRECTORS’ REMUNERATION REPORT CONTINUED

Performance Share Plan (PSP) outcomes – 2017As outlined on page 118, all of Dimitris Lois’s outstanding awards, including the 2017 award detailed above, were pro-rated for both time and performance. The Remuneration Committee deemed that the vesting of these pro-rated awards be accelerated and that they should vest as soon as reasonably practicable following his passing. Under Swiss law, share awards are considered annual compensation and as such when time pro-rating is required, the year of grant (12 months) and not the vesting period (36 months) for time pro-rata calculations is considered. As such, there is no time pro-rating applied to the 2015 and 2016 PSP awards and we have applied a 75% time pro-rating to the 2017 PSP award to reflect the period January 2017 – October 2017.
Where the full three-year performance period had not been completed, the Committee considered levels of performance over the shortened period, assessing 2017 performance against shortened period targets that were used when calibrating the three-year targets and are in line with the original three-year targets. In these circumstances, the Committee deemed this the fairest way to measure performance to 2017 for these outstanding share awards. Full disclosure of these original performance targets, the shortened period performance targets against which performance was measured and the 2017 outcomes are provided below.
Threshold Maximum
Actual to the year ending 2017
Measure Weighting TargetVesting
(% of max)
Original three-year
targetShortened
period targetVesting
(% of max) AchievementVesting
(% of max)Total
(% of max)
2015 award EPS 50% 1.08 25% 1.31 1.16 100% 1.23 100% 100%
ROIC 50% 10.1% 25% 12.1% 10.8% 100% 12.4% 100% 2016 award EPS 50% 1.08 25% 1.31 1.16 100% 1.23 100%
100% ROIC 50% 10.1% 25% 12.1% 10.8% 100% 12.4% 100% 2017 award EPS 50% 1.11 25% 1.50 1.19 100% 1.23 100%
88% ROIC 50% 12.0% 25% 15.8% 12.9% 100% 12.4% 75%
The 2015 award was made in December 2015 and as such the performance period commenced on 1 January 2016 and hence the performance targets are the same as the 2016 award.
Dilution limitUsage of shares under all share plans and executive share plans adheres to the dilution limits set by the Investment Association Principles of Remuneration (10% for all share plans and 5% for all executive share plans, in any 10-year period).
Implementation of policy in 2018For 2018, we will continue to apply our approved remuneration policy outlined on pages 108 to 110 as described above.
Arrangements for Zoran Bogdanovic, the newly appointed Chief Executive OfficerThe Remuneration Committee approved a base salary of €750,000 effective from Bogdanovic's date of appointment as Chief Executive Officer on 7 December 2017. His remaining remuneration will be in line with our Executive Director's remuneration policy. The normal maximum bonus potential under the MIP will be 130% of base salary and under the PSP will be 330% of base salary. Additional benefits will include private medical insurance, housing allowance, Company car/allowance, schooling allowance, trip allowance, partner allowance, exchange rate protection, tax equalisation and tax filing support and advice. Any retirement benefit will align to the retirement benefit provided under Swiss law and based on the age brackets defined by federal Swiss legislation. For all benefits, the Company will bear any income tax and social security contributions arising from such payments.
Base salary and feesBogdanovic’s base salary will be reviewed in March 2018 at the same time as that of the Operating Committee members and the general managers. Any base salary increase will be effective 1 May 2018 and is anticipated to be broadly in line with the increase provided to other employees.
The fee levels for the Chairman and other non-Executive Directors were last reviewed in 2016 and remained consistent in 2017, as outlined on page 112. Fee levels were reviewed in early 2018 and it was determined that the current base and committee fees are increased by 5% with effect from June 2018.
121Coca-Cola HBC 2017 Integrated Annual Report
Strategic R
eport
Co
rporate G
overnance
Financial Statem
entsS
wiss S
tatutory R
eporting
Supplem
entary Inform
ation
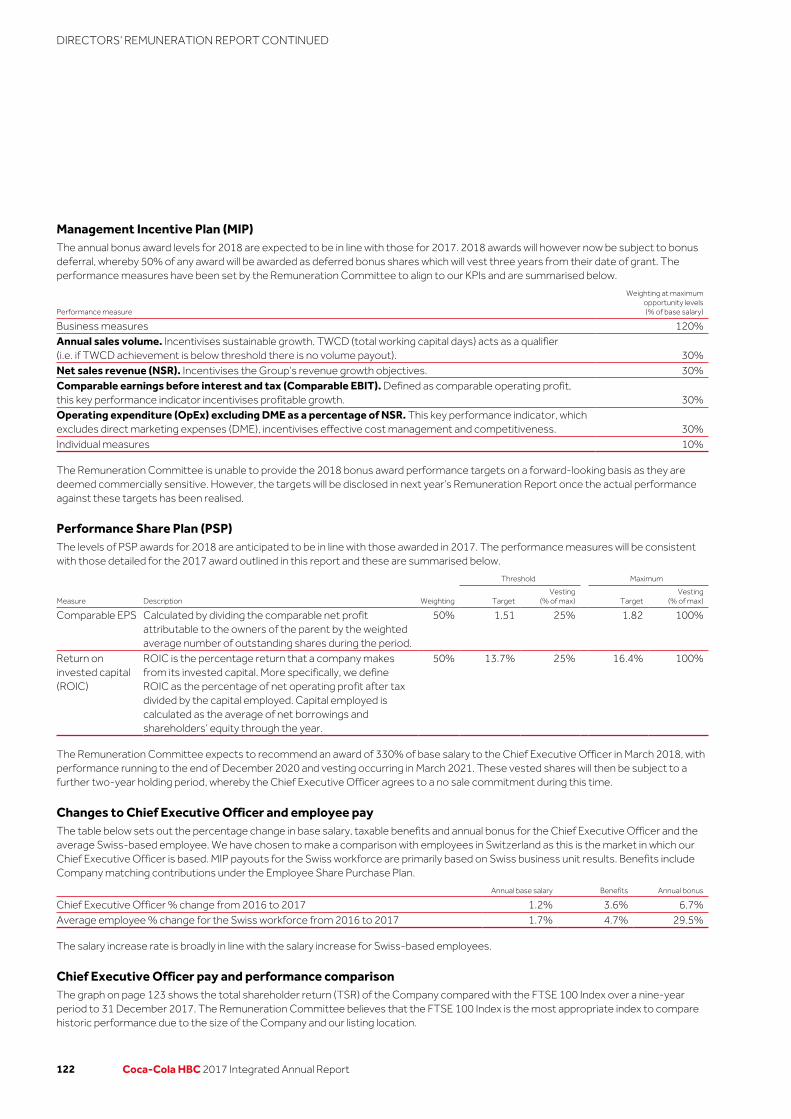
Management Incentive Plan (MIP)The annual bonus award levels for 2018 are expected to be in line with those for 2017. 2018 awards will however now be subject to bonus deferral, whereby 50% of any award will be awarded as deferred bonus shares which will vest three years from their date of grant. The performance measures have been set by the Remuneration Committee to align to our KPIs and are summarised below.
Performance measure
Weighting at maximum opportunity levels (% of base salary)
Business measures 120%Annual sales volume. Incentivises sustainable growth. TWCD (total working capital days) acts as a qualifier (i.e. if TWCD achievement is below threshold there is no volume payout). 30%Net sales revenue (NSR). Incentivises the Group’s revenue growth objectives. 30%Comparable earnings before interest and tax (Comparable EBIT). Defined as comparable operating profit, this key performance indicator incentivises profitable growth. 30%Operating expenditure (OpEx) excluding DME as a percentage of NSR. This key performance indicator, which excludes direct marketing expenses (DME), incentivises effective cost management and competitiveness. 30%Individual measures 10%
The Remuneration Committee is unable to provide the 2018 bonus award performance targets on a forward-looking basis as they are deemed commercially sensitive. However, the targets will be disclosed in next year’s Remuneration Report once the actual performance against these targets has been realised.
Performance Share Plan (PSP)The levels of PSP awards for 2018 are anticipated to be in line with those awarded in 2017. The performance measures will be consistent with those detailed for the 2017 award outlined in this report and these are summarised below.
Threshold Maximum
Measure Description Weighting TargetVesting
(% of max) TargetVesting
(% of max)
Comparable EPS Calculated by dividing the comparable net profit attributable to the owners of the parent by the weighted average number of outstanding shares during the period.
50% 1.51 25% 1.82 100%
Return on invested capital (ROIC)
ROIC is the percentage return that a company makes from its invested capital. More specifically, we define ROIC as the percentage of net operating profit after tax divided by the capital employed. Capital employed is calculated as the average of net borrowings and shareholders’ equity through the year.
50% 13.7% 25% 16.4% 100%
The Remuneration Committee expects to recommend an award of 330% of base salary to the Chief Executive Officer in March 2018, with performance running to the end of December 2020 and vesting occurring in March 2021. These vested shares will then be subject to a further two-year holding period, whereby the Chief Executive Officer agrees to a no sale commitment during this time.
Changes to Chief Executive Officer and employee payThe table below sets out the percentage change in base salary, taxable benefits and annual bonus for the Chief Executive Officer and the average Swiss-based employee. We have chosen to make a comparison with employees in Switzerland as this is the market in which our Chief Executive Officer is based. MIP payouts for the Swiss workforce are primarily based on Swiss business unit results. Benefits include Company matching contributions under the Employee Share Purchase Plan.
Annual base salary Benefits Annual bonus
Chief Executive Officer % change from 2016 to 2017 1.2% 3.6% 6.7%Average employee % change for the Swiss workforce from 2016 to 2017 1.7% 4.7% 29.5%
The salary increase rate is broadly in line with the salary increase for Swiss-based employees.
Chief Executive Officer pay and performance comparisonThe graph on page 123 shows the total shareholder return (TSR) of the Company compared with the FTSE 100 Index over a nine-year period to 31 December 2017. The Remuneration Committee believes that the FTSE 100 Index is the most appropriate index to compare historic performance due to the size of the Company and our listing location.
122 Coca-Cola HBC 2017 Integrated Annual Report
DIRECTORS’ REMUNERATION REPORT CONTINUED

50
100
150
200
250
300
350
Dec 08 Dec 09 Dec 10 Dec 11 Dec 12 Dec 13 Dec 14 Dec 15 Dec 16 Dec 17
FTSE 100 CCH
Total shareholder return versus FTSE 100
2009 2010 2011 2012 2013 2014 2015 2016 2017
Doros
Constantinou Doros
Constantinou Doros
ConstantinouDimitris
Lois Dimitris
Lois Dimitris
Lois Dimitris
Lois Dimitris
Lois Dimitris
Lois Dimitris
LoisZoran
Bogdanovic
Total remuneration – single figure (€ 000s) 2,887 3,752 4,708 711 1,524 1,928 1,918 3,012 2,923 15,378 410 MIP (% of maximum) 63% 65% 9% 24% 68% 49% 45% 75% 55% 53% 5% PSP (% of maximum) – – – – – – – – – 90% –
On 4 July 2011, Doros Constantinou retired from service, and Dimitris Lois succeeded him. The amounts for 2011 include the remuneration of Doros Constantinou up to the retirement date and the remuneration of Dimitris Lois for the remainder of the year. For 2011, the remuneration of Doros Constantinou includes termination benefits due to retirement.
As the Company listed on the London Stock Exchange in April 2013, the amounts included in respect of the period before that date relate to the remuneration the Chief Executive Officer received in his capacity as Chief Executive Officer of Coca-Cola Hellenic Bottling Company S.A.
On 15 September 2017, Dimitris Lois went on leave to seek medical treatment and sadly passed away on 2 October 2017. The 2017 base salary values above reflect the period 1 January 2017 to 2 October 2017. The total remuneration value for Zoran Bogdanovic reflects the period from his appointment as Chief Executive Officer to the end of the financial year, 7 December 2017 to 31 December 2017.
Until 2017 there were no PSP awards that vested. PSP % of maximum reflects the average of all three awards (2015, 2016 & 2017) where vesting was accelerated.
Relative importance of spend on pay (€m)
Compared to the prior year, the total staff costs increased by 1%, while the dividends distributed to shareholders have increased by 11%.
992.3
984.0
162.0
146.1
Total employee costs Distribution to shareholders
2017
2016
123Coca-Cola HBC 2017 Integrated Annual Report
Strategic R
eport
Co
rporate G
overnance
Financial Statem
entsS
wiss S
tatutory R
eporting
Supplem
entary Inform
ation

Shareholder voting outcomesThe table below sets out the result of the votes on the remuneration-related resolutions at the Annual General Meeting held in June 2017:
Resolution Votes for Votes against Abstentions Total votes castVoting rights represented
Advisory vote on the UK Remuneration Report 246,074,548 2,762,647 141,690 248,978,885 68.31% 98.83% 1.11% 0.06% Advisory vote on the Swiss Remuneration Report 247,193,583 1,748,622 36,680 248,978,885 68.31% 99.29% 0.70% 0.01% Advisory vote on the remuneration policy 244,288,071 4,654,134 36,680 248,978,885 68.31% 98.12% 1.87% 0.01% Approval of the maximum aggregate amount of remuneration for the Board until the next Annual General Meeting
248,653,337 195,828 129,720 248,849,165 68.31%
99.92% 0.08% 0.0% Approval of the maximum aggregate amount of remuneration for the Operating Committee for the next financial year
248,048,728 608,447 321,710 248,657,175 68.31%
99.76% 0.24% 0.0%
The Remuneration Committee was pleased that shareholders supported our remuneration-related resolutions so strongly. We value our ongoing dialogue with shareholders and welcome any views on this report.
Payments to past Directors and payments for loss of officeFollowing the death of Dimitris Lois in October 2017, all outstanding share awards were pro-rated for time and performance and paid out as soon as reasonably practicable to his heirs. Full details on the treatment of these awards and payout levels can be found on page 118.
No compensation for loss of office was paid to any Director.
Payments to appointed DirectorsCharlotte Boyle joined the Board in 2017. As per the recruitment policy for non-Executive Directors, new non-Executive Directors are not compensated for any forfeited share awards or other incentives related to previous employment. Non-Executive Directors do not receive any form of variable compensation, nor any other benefits in cash or in kind.
Zoran Bogdanovic was appointed Chief Executive Officer on 7 December 2017, and his remuneration arrangements, which are in line with the shareholder-approved remuneration policy for Executive Directors, are outlined on page 121. His formal appointment to the Board will be put forward for shareholder approval at the next Annual General Meeting in June 2018.
Outside appointments for the Chief Executive OfficerZoran Bogdanovic does not hold any appointments outside the Company.
Total Directors’ and Operating Committee members’ remunerationThe table below outlines the aggregated total remuneration figures for Directors and Operating Committee members in the year.
2017
(€ million)2016
(€ million)
Total remuneration paid to or accrued for Directors, the Operating Committee and the Chief Executive Officer 27.1 24.4Salaries and other short-term benefits 13.8 18.7Amount accrued for stock option and performance share awards 12.6 4.9Pension and post-employment benefits for Directors, the Operating Committee and the Chief Executive Officer 0.7 0.8
Credits and loans granted to governing bodiesIn 2017, no credits or loans were granted to active or former members of the Company’s Board, members of the Operating Committee or any related persons.
124 Coca-Cola HBC 2017 Integrated Annual Report
DIRECTORS’ REMUNERATION REPORT CONTINUED

Alexandra PapalexopoulouChair of the Remuneration Committee
15 March 2018
Share ownership The table below summarises the total shareholding as of 31 December 2017, including any outstanding shares awarded through our incentive plans, for the Chief Executive Officer and other Directors.
With performance measures Without performance measures
PSP ESOP ESPP
NameShare
interests
Performance shares
granted in year 2017
Unvested and subject to
performance conditions Vested
Number of stock options
outstandingFully
vested
Vesting at the end of 2018
Number of outstanding
shares held1 as at 31-Dec-17
Current shareholding as % of base
salary1
Shareholding guideline
met1
Dimitris Lois2, 3 Yes 128,421 426,773 – – – – 57,379 179% NoZoran Bogdanovic Yes 25,473 84,841 – 236,750 236,750 – 19,869 72% No Anastassis G. David4 – – – – – – – – – Ahmet C. Bozer – – – – – – – – –Charlotte J. Boyle – – – – – – – – – Antonio D’Amato – – – – – – – – –Olusola (Sola) David-Borha – – – – – – – – –William W. (Bill) Douglas III5 – – – – – – – – –Reto Francioni – – – – – – – – – Anastasios I. Leventis6 – – – – – – – – – Christo Leventis7 – – – – – – – – – Alexandra Papalexopoulou – – – – – – – – – José Octavio Reyes – – – – – – – – – Robert Ryan Rudolph – – – – – – – – – John P. Sechi – – – – – – – – –
1. The shareholding requirement was introduced from the date of the 2015 PSP award, 10 December 2015. The CEO has a period of five years from his appointment to December 2022 to build up a 200% of base salary shareholding.
2. The number of shares held by Dimitris Lois includes the amount of purchased and vested shares held under the ESPP on 31 December 2017 and 1,000 shares held by Dimitris Lois’s spouse. Dimitris Lois’ heirs exercised 1,700,000 options under ESOP between 2 October and 31 December 2017.
3. As more fully set out at page 118 of the report and following the passing of Dimitris Lois, the Remuneration Committee determined at its meeting in March 2018 that, in line with the terms of the PSP, PSP awards granted to Dimitris Lois in 2015, 2016 and 2017 should vest pro-rated for time and performance up to 2 October 2017. PSP awards therefore vested over in aggregate 396,402 shares. The remainder of the shares subject to PSP awards granted to Dimitris Lois lapsed. The Remuneration Committee further determined that these awards should vest immediately to Dimitris Lois’ heirs.
4. Anastassis David is a beneficiary of:(a) a private discretionary trust for the primary benefit of present and future members of the family of the late Anastasios George Leventis, of which Truad Verwaltungs AG is the Trustee, whereby he has an indirect interest with respect to the 85,355,019 shares held by Kar-Tess Holding S.A.(b) a further private discretionary trust for the primary benefit of present and future members of the family of the late Anastasios George Leventis, of which Selene Treuhand AG is the Trustee, whereby he has an indirect interest with respect to 823,008 shares held by Selene Treuhand AG.
5. William W. (Bill) Douglas III owns 10,000 Company shares.6. Anastasios I. Leventis is a beneficiary of:
(a) a private discretionary trust for the primary benefit of present and future members of the family of the late Anastasios George Leventis, of which Truad Verwaltungs AG is the Trustee, whereby he has an indirect interest with respect to the 85,355,019 shares held by Kar- Tess Holding S.A.(b) a further private discretionary trust for the primary benefit of present and future members of the family of the late Anastasios George Leventis, of which Selene Treuhand AG is the Trustee, whereby he has an indirect interest with respect to 386,879 shares held by Selene Treuhand AG.(c) a further private discretionary trust for the primary benefit of present and future members of the family of the late Christodoulos Papaneokleus Leventis, of which Mervail Company (PTC) Limited is the Trustee, whereby he has an indirect interest with respect to 623,664 shares held by Carlcan Holding Limited.
7. Christo Leventis is a beneficiary of:(a) a private discretionary trust for the primary benefit of present and future members of the family of the late Anastasios George Leventis, of which Truad Verwaltungs AG is the Trustee, whereby he has an indirect interest with respect to the 85,355,019 shares held by Kar- Tess Holding S.A.(b) a further private discretionary trust for the primary benefit of present and future members of the family of the late Anastasios George Leventis, of which Selene Treuhand AG is the Trustee, whereby he has an indirect interest with respect to 498,545 shares held by Selene Treuhand AG.(c) a further private discretionary trust for the primary benefit of present and future members of the family of the late Christodoulos Papaneokleus Leventis, of which Mervail Company (PTC) Limited is the trustee, whereby he has an indirect interest with respect to 757,307 shares held by Carlcan Holding Limited.
Approval of the Directors’ Remuneration ReportThe Directors’ Remuneration Report set out on pages 104 to 125 was approved by the Board of Directors on 15 March 2018 and signed on its behalf by Alexandra Papalexopoulou, Chair of the Remuneration Committee.
125Coca-Cola HBC 2017 Integrated Annual Report
Strategic R
eport
Co
rporate G
overnance
Financial Statem
entsS
wiss S
tatutory R
eporting
Supplem
entary Inform
ation

The activities of the Group, together with the factors likely to affect its future development, performance, financial position, cash flows, liquidity position and borrowing facilities are described in the Strategic Report (pages 1 to 70). In addition, Notes 23 ‘Financial risk management and financial instruments’, 24 ‘Net debt’ and 25 ‘Equity’ include the Company’s objectives, policies and processes for managing its capital; its financial risk management objectives; details of its financial instruments and hedging activities; and its exposures to credit risk and liquidity risk. The Group has considerable financial resources together with long-term contracts with a number of customers and suppliers across different countries. The Directors have also assessed the principal risks and the other matters discussed in connection with the Viability Statement on page 70. The Directors considered it appropriate to adopt the going concern basis of accounting in preparing the annual financial statements and have not identified any material uncertainties to the Group’s ability to continue to do so over a period of at least 12 months from the date of approval of these financial statements.
Statement of Directors’ responsibilitiesThe Directors are responsible for preparing the Annual Report, including the consolidated financial statements, and the Corporate Governance Report including the Remuneration Report and the Strategic Report, in accordance with applicable law and regulations.
The Directors, whose names and functions are set out on pages 72 to 75, confirm to the best of their knowledge that:
(a) The Annual Report, taken as a whole, is fair, balanced and understandable, and provides the information necessary for shareholders to assess the Group’s position and performance, business model and strategy.
(b) The consolidated financial statements, which have been prepared in accordance with International Financial Reporting Standards as issued by the IASB, give a true and fair view of the assets, liabilities, financial position and profit or loss of the Company and the undertakings included in the consolidation of the Group taken as a whole.
(c) The Annual Report includes a fair review of the development and performance of the business and the position of the Company and the undertakings included in the consolidated Coca-Cola HBC Group taken as a whole, together with a description of the principal risks and uncertainties that they face.
Disclosure of information required under Listing Rule 9.8.4RFor the purposes of Listing Rule 9.8.4C, the information required to be disclosed by premium listed companies in the United Kingdom is as follows:
Listing Rule Information to be included Reference in report
9.8.4(1) Interest capitalised by the Group and an indication of the amount and treatment of any associated tax relief Not applicable9.8.4(2) Details of any unaudited financial information required by LR 9.2.18 Not applicable 9.8.4(4) Details of any long-term incentive scheme described in LR 9.4.3 Not applicable 9.8.4(5) Details of any arrangement under which a Director has waived any emoluments Not applicable 9.8.4(6) Details of any arrangement under which a Director has agreed to waive future emoluments Not applicable 9.8.4(7) Details of any allotments of shares by the Company for cash not previously authorised by shareholders Not applicable 9.8.4(8) Details of any allotments of shares for cash by a major subsidiary of the Company Not applicable 9.8.4(9) Details of the participation by the Company in any placing made by its parent company Not applicable 9.8.4(10) Details of any contracts of significance involving a Director Not applicable 9.8.4(11) Details of any contract for the provision of services to the Company by a controlling shareholder Not applicable 9.8.4(12) Details of any arrangement under which a shareholder has waived or agreed to waive any dividends Not applicable 9.8.4(13) Details of any arrangement under which a shareholder has agreed to waive future dividends Not applicable 9.8.4(14) Agreements with a controlling shareholder Not applicable
By order of the Board
Anastassis G. David Chairman of the Board
16 March 2018
126 Coca-Cola HBC 2017 Integrated Annual Report
STATEMENT OF DIRECTORS’ RESPONSIBILITIES

FINANCIAL STATEMENTS
Contents
Financial Statements128 Independent Auditor’s Report Consolidated Financial Statements133 Consolidated Income Statement134 Consolidated Statement of Comprehensive Income135 Consolidated Balance Sheet136 Consolidated Statement of Changes in Equity138 Consolidated Cash Flow Statement Notes to the Consolidated Financial Statements Basis of reporting139 1. Description of business139 2. Basis of preparation and consolidation139 3. Foreign currency and translation140 4. Accounting pronouncements141 5. Critical accounting estimates and judgements Results for the year142 6. Segmental analysis146 7. Net sales revenue146 8. Operating expenses148 9. Finance costs, net148 10. Taxation151 11. Earnings per share151 12. Components of other comprehensive income Operating assets and liabilities152 13. Intangible assets155 14. Property, plant and equipment158 15. Interests in other entities161 16. Inventories162 17. Trade, other receivables and assets165 18. Assets classified as held for sale165 19. Trade and other payables166 20. Provisions and employee benefits171 21. Offsetting financial assets and financial liabilities172 22. Business combinations Risk management and capital structure173 23. Financial risk management and financial instruments184 24. Net debt188 25. Equity Other financial information190 26. Related party transactions192 27. Share based payments195 28. Contingencies196 29. Commitments196 30. Post balance sheet events
Strategic R
eport
Co
rporate G
overnance
Financial Statem
entsS
wiss S
tatutory R
eporting
Supplem
entary Inform
ation
127Coca-Cola HBC 2017 Integrated Annual Report

Independent auditor’s report to Coca-Cola HBC AG
Report on the audit of the consolidated financial statements
Our opinionIn our opinion, the consolidated financial statements give a true and fair view of the consolidated financial position of Coca-Cola HBC AG’s (the “Company”) and its subsidiaries (together the “Group”) as at 31 December 2017, and of its consolidated financial performance and its consolidated cash flows for the year then ended in accordance with International Financial Reporting Standards (IFRSs) as issued by the International Accounting Standards Board (IASB).
What we have auditedThe Group’s consolidated financial statements included within the 2017 Integrated Annual Report comprise:
– the consolidated balance sheet as at 31 December 2017;
– the consolidated income statement for the year then ended;
– the consolidated statement of comprehensive income for the year then ended;
– the consolidated statement of changes in equity for the year then ended;
– the consolidated cash flow statement for the year then ended; and
– the notes to the consolidated financial statements, which include a summary of significant accounting policies.
Basis for opinionWe conducted our audit in accordance with International Standards on Auditing (ISAs). Our responsibilities under those standards are further described in the Auditor’s responsibilities for the audit of the consolidated financial statements section of our report.
We believe that the audit evidence we have obtained is sufficient and appropriate to provide a basis for our opinion.
IndependenceWe are independent of the Group in accordance with applicable laws and regulations regarding independence relevant to our audit of the consolidated financial statements, including the International Ethics Standards Board for Accountants’ Code of Ethics for Professional Accountants (IESBA Code). We have also fulfilled our other ethical responsibilities in accordance with the IESBA Code and other applicable laws and regulations.
Our audit approach
Overview
As part of designing our audit, we determined materiality and assessed the risks of material misstatement in the consolidated financial statements. In particular, we looked at where the Directors made subjective judgements; for example, in respect of significant accounting estimates that involved making assumptions and considering future events that are inherently uncertain. As in all of our audits, we also addressed the risk of management override of internal controls, including among other matters consideration of whether there was evidence of bias by the Directors that represented a risk of material misstatement due to fraud.
Overall group materiality: €28.2 million, which represents 5% of profit before tax.
– We audited the complete financial information of the Company and of subsidiary undertakings in 16 countries.
– Taken together, the undertakings of which an audit of their complete financial information was performed accounted for 87% of consolidated net sales revenue, 93% of consolidated profit before tax and 88% of consolidated total assets of the Group.
– We also conducted specified audit procedures and analytical review procedures for other Group undertakings and functions.
Key audit matters, which remain the same as the prior year, comprised:
– Goodwill and indefinite-lived intangible assets impairment assessment.
– Uncertain tax positions.
– Provisions and contingent liabilities.
Key audit matters
Materiality
Group scoping
128 Coca-Cola HBC 2017 Integrated Annual Report
INDEPENDENT AUDITOR’S REPORT

MaterialityThe scope of our audit was influenced by our application of materiality. An audit is designed to obtain reasonable assurance whether the financial statements are free from material misstatement. Misstatements may arise due to fraud or error. They are considered material if individually or in aggregate, they could reasonably be expected to influence the economic decisions of users taken on the basis of the consolidated financial statements.
Based on our professional judgement, we determined certain quantitative thresholds for materiality, including the overall group materiality for the consolidated financial statements as a whole as set out in the table below. These, together with qualitative considerations, helped us to determine the scope of our audit and the nature, timing and extent of our audit procedures and to evaluate the effect of misstatements, both individually and in aggregate, on the financial statements as a whole.
Overall group materiality €28.2 million (2016: €22.9 million)How we determined it 5% of profit before tax
Rationale for the materiality benchmark applied
We chose profit before tax as the benchmark because, in our view, it is one of the principal measures considered by users, and is a generally accepted benchmark. We chose 5% which is within the range of acceptable quantitative materiality thresholds in generally accepted auditing practice.
We agreed with the Audit and Risk Committee that we would report to them misstatements identified during our audit above €1.0 million as well as misstatements below that amount that, in our view, warranted reporting for qualitative reasons.
Key audit matters Key audit matters are those matters that, in our professional judgement, were of most significance in our audit of the consolidated financial statements of the current period. These matters were addressed in the context of our audit of the consolidated financial statements as a whole, and in forming our opinion thereon, and we do not provide a separate opinion on these matters.
Key audit matter How our audit addressed the key audit matter
Goodwill and indefinite-lived intangible assets impairment assessment Refer to Note 13 for intangible assets including goodwill.
Goodwill and indefinite-lived intangible assets as at 31 December 2017 amount to €1,621.2 million and €199.9 million, respectively.
The above noted amounts have been allocated to individual cash-generating units (‘CGUs’). The impairment assessment must be performed at least annually and involves the determination of the recoverable amount, being the higher of the value-in-use and the fair value less costs to dispose.
This area was a key matter for our audit due to the size of goodwill and indefinite-lived intangible assets and because the determination of whether elements of goodwill and of indefinite-lived intangible assets are impaired involves complex and subjective estimates and judgements by management about the future results of the CGUs. These estimates and judgements include assumptions surrounding revenue growth rates, direct costs, foreign exchange rates and discount rates.
Furthermore, macroeconomic volatility, competitor activity and regulatory/fiscal developments can adversely affect each CGU and potentially the carrying amount of goodwill and indefinite-lived intangible assets.
No impairment charge was recorded in 2017. Goodwill and franchise agreements held by the Nigeria CGU have been determined by management to remain sensitive to changes in the key drivers of cash flow forecasts given the macroeconomic volatility in Nigeria.
We evaluated the appropriateness of management’s identification of the Group’s CGUs and the process by which management prepared the CGUs value-in-use calculations which we found to be satisfactory for the purposes of our audit. We tested the mathematical accuracy of the CGUs value-in-use calculations and compared them to the latest budget approved by the Directors and assessed the quality of the budgeting process by comparing the prior year budget with actual data.
With the support of our valuation specialists, we challenged management’s analysis around the key drivers of cash flow forecasts including selling price increases, short-term and long-term volume growth and the level of direct costs by comparing them with either the Group’s historical information or market data, as appropriate. We also evaluated the appropriateness of other key assumptions including discount rates and foreign exchange rates by comparing them to relevant market data. We found the assumptions to be consistent and in line with our expectations.
We also performed sensitivity analyses on the key drivers of cash flow forecasts for the CGUs with significant balances of goodwill and indefinite-lived intangible assets as well as for CGUs which remain sensitive to changes in the key drivers, including the goodwill and franchise agreements held by the Nigeria CGU.
We assessed the appropriateness and completeness of the related disclosures in Note 13, and consider them to be reasonable. As a result of our work, we found that the determination by management that no impairment was required for goodwill and indefinite-lived intangible assets was supported by assumptions within reasonable ranges.
129Coca-Cola HBC 2017 Integrated Annual Report
Strategic R
eport
Co
rporate G
overnance
Financial Statem
entsS
wiss S
tatutory R
eporting
Supplem
entary Inform
ation

Key audit matter How our audit addressed the key audit matter
Uncertain tax positionsRefer to Note 10 for taxation and Note 28 for contingencies.
The Group operates in a complex multinational tax environment which gives rise to uncertain tax positions in relation to corporation tax, transfer pricing and indirect taxes. As at 31 December 2017, the Group has current tax liabilities of €97.5 million which include €69.2 million of provisions for tax uncertainties.
The Group establishes provisions based on management’s judgements of the probable amount of the liability. Given the number of judgements involved in estimating the provisions relating to uncertain tax positions and the complexities of dealing with tax rules and regulations in numerous jurisdictions, this was considered as a key audit matter.
We evaluated the related accounting policy for provisioning for tax exposures and found it to be appropriate.
In conjunction with our tax specialists, we evaluated management’s judgements in respect of estimates of tax exposures and contingencies in order to assess the adequacy of the Group’s tax provisions. In order to understand and evaluate management’s judgements, we considered the status of current tax authority audits and enquiries, the outcome of previous tax authority audits, judgemental positions taken in tax returns and current year estimates and recent developments in the tax environments in which the Group operates.
We challenged management’s key assumptions, in particular on cases where there had been significant developments with tax authorities, noting no significant deviation from our expectations.
From the evidence obtained and in the context of the consolidated financial statements, taken as a whole, we consider the provisions in relation to uncertain tax positions as at 31 December 2017 to be appropriate.
Provisions and contingent liabilitiesRefer to Note 20 for provisions and Note 28 for contingencies.
The Group faces a number of threatened and actual legal and regulatory proceedings. The determination of the provision and/or the level of disclosure required involves a high degree of judgement resulting in provisions and contingent liabilities being considered as a key audit matter.
We evaluated the design of, and tested, key controls in respect of litigation and regulatory procedures, which we found to be satisfactory for the purposes of our audit.
Our procedures included the following:
– where relevant, reading external legal advice obtained by management;
– discussing open matters with the Group general counsel;
– meeting with local management and reading subsequent correspondence;
– assessing and challenging management’s conclusions through understanding precedents set in similar cases; and
– circularising relevant third-party legal representatives and follow up discussions, where appropriate, on certain material cases.
On the basis of the work performed, whilst noting the inherent uncertainty with such legal and regulatory matters, we determined the relevant provisions as at 31 December 2017 to be appropriate.
We assessed the appropriateness of the related disclosures in Note 28 and considered these to be reasonable.
How we tailored our group audit scopeWe tailored the scope of our audit in order to perform sufficient work to enable us to provide an opinion on the consolidated financial statements as a whole, taking into account the geographic structure of the Group, the accounting processes and controls, and the industry in which the Group operates.
The Group operates through its trading subsidiary undertakings in 28 countries, as set out on page 142 of the 2017 Integrated Annual Report. The processing of the accounting entries for these entities is largely centralised in a shared services centre in Bulgaria, except for the subsidiary undertakings in Russia, Ukraine, Belarus and Armenia, which process their accounting entries locally. The Group also operates a centralised treasury function in the Netherlands and in Greece and a centralised procurement function in Austria. We considered the nature of the work that needed to be performed on these entities and functions by us, as the group engagement team and by component auditors from other PwC network firms. Where work was performed by component auditors, we determined the level of involvement we needed to have in the audit work at those entities or functions to be able to conclude whether appropriate audit evidence had been obtained as a basis for our opinion on the consolidated financial statements as a whole.
Based on the significance to the consolidated financial statements and in light of the key audit matters as noted above, we identified subsidiary undertakings in 16 countries (including the trading subsidiary undertakings in Russia, Nigeria and Italy) which in our view, required an audit of their complete financial information. Furthermore, the Company’s complete financial information was subject to audit. Specified audit procedures on certain balances and transactions were also performed on one joint venture and the corporate service centres in Greece and Austria. In addition, audit procedures were performed with respect to the centralised treasury function by the group engagement team and by the component audit team in Austria as regards to the centralised procurement function. The group engagement team also performed analytical review and other procedures on balances and transactions of subsidiary undertakings not covered by the procedures described above.
130 Coca-Cola HBC 2017 Integrated Annual Report
INDEPENDENT AUDITOR’S REPORT CONTINUED

Our group engagement team’s involvement with respect to audit work performed by component auditors included site visits (to Russia, Nigeria, Italy, Switzerland, Romania, Poland, Austria Bulgaria and Greece), conference calls with component audit teams, meetings with local management, review of component auditor work papers, attendance at component audit clearance meetings, and other forms of interactions as considered necessary depending on the significance of the component and the extent of accounting and audit issues arising. The group engagement team was also responsible for planning, designing and overseeing the audit procedures performed at the shared services centre in Bulgaria. The Group consolidation, financial statement disclosures and a number of areas of significant judgement, including goodwill and intangible assets, material provisions and contingent liabilities, were audited by the group engagement team. We also performed work centrally on IT general controls. This year, we held a two-day audit planning workshop in Bulgaria focusing on planning and risk assessment activities, auditor independence, centralised testing procedures and implementation of new IFRSs. This audit planning workshop was attended by the component teams responsible for the subsidiaries requiring an audit of their complete financial information.
Based on the above, the undertakings of which an audit of their complete financial information was performed accounted for 87% of consolidated net sales revenue, 93% of consolidated profit before tax and 88% of consolidated total assets of the Group.
Other information The Directors are responsible for the other information. The other information comprises Coca-Cola HBC AG’s 2017 Integrated Annual Report (but does not include the consolidated financial statements, our auditor’s report thereon and the Swiss statutory reporting), which we obtained prior to the date of this auditor’s report.
Our opinion on the consolidated financial statements does not cover the other information and, accordingly, we do not express an audit opinion or, except to the extent otherwise explicitly stated in this report, any form of assurance thereon.
In connection with our audit of the consolidated financial statements, our responsibility is to read the other information identified above and, in doing so, consider whether the other information is materially inconsistent with the consolidated financial statements or our knowledge obtained in the audit, or otherwise appears to be materially misstated.
If, based on the work we have performed, we conclude that there is a material misstatement of this other information, we are required to report that fact. We have nothing to report on these responsibilities.
UK Corporate Governance Code provisionsWe have nothing to report in respect of our responsibility to report when the Directors’ statement relating to the Company’s compliance with the UK Corporate Governance Code (the “Code”) does not properly disclose a departure from a relevant provision of the Code specified, under the Listing Rules, for review by the auditor.
The Directors’ statement on going concernWe have reviewed the statement on going concern, included in the Statement of Directors’ Responsibilities, in Coca-Cola HBC AG’s 2017 Integrated Annual Report on page 126, as if the Company were a UK incorporated premium listed entity. We have nothing to report having performed our review.
As noted in the Statement of Directors’ Responsibilities, the Directors have concluded that it is appropriate to prepare the consolidated financial statements using the going concern basis of accounting. The going concern basis presumes that the Group has adequate resources to remain in operation, and that the Directors intend it to do so, for at least one year from the date the consolidated financial statements were signed. As part of our audit we have concluded that the Directors’ use of the going concern basis is appropriate.
However, because not all future events or conditions can be predicted, these statements are not a guarantee as to the Group’s ability to continue as a going concern.
The Directors’ assessment of the prospects of the GroupWe have also reviewed the Directors’ statement in relation to the longer-term viability of the Group, set out on page 70, of the Coca-Cola HBC’s 2017 Integrated Annual Report as if the Company were a UK incorporated premium listed entity. Our review was substantially less in scope than an audit and only consisted of making inquiries and considering the Directors’ process supporting their statement; checking that the statement is in alignment with the relevant provisions of the Code; and considering whether the statement is consistent with the knowledge acquired by us in the course of performing our audit. We have nothing to report having performed our review.
Responsibilities of the Directors for the consolidated financial statementsAs explained more fully in the Statement of Directors’ Responsibilities set out in the 2017 Integrated Annual Report on page 126, the Directors are responsible for the preparation of the consolidated financial statements and for being satisfied that they give a true and fair view, and for such internal control as the Directors determine is necessary to enable the preparation of consolidated financial statements that are free from material misstatement, whether due to fraud or error.
In preparing the consolidated financial statements, the Directors are responsible for assessing the Group’s ability to continue as a going concern, disclosing, as applicable, matters related to going concern and using the going concern basis of accounting unless the Directors either intend to liquidate the Group or to cease operations, or have no realistic alternative but to do so.
131Coca-Cola HBC 2017 Integrated Annual Report
Strategic R
eport
Co
rporate G
overnance
Financial Statem
entsS
wiss S
tatutory R
eporting
Supplem
entary Inform
ation

Auditor’s responsibilities for the audit of the consolidated financial statementsOur objectives are to obtain reasonable assurance about whether the consolidated financial statements as a whole are free from material misstatement, whether due to fraud or error, and to issue an auditor’s report that includes our opinion. Reasonable assurance is a high level of assurance, but is not a guarantee that an audit conducted in accordance with ISAs will always detect a material misstatement when it exists. Misstatements can arise from fraud or error and are considered material if, individually or in the aggregate, they could reasonably be expected to influence the economic decisions of users taken on the basis of these consolidated financial statements.
As part of an audit in accordance with ISAs, we exercise professional judgement and maintain professional scepticism throughout the audit. We also:
– Identify and assess the risks of material misstatement of the consolidated financial statements, whether due to fraud or error, design and perform audit procedures responsive to those risks, and obtain audit evidence that is sufficient and appropriate to provide a basis for our opinion. The risk of not detecting a material misstatement resulting from fraud is higher than for one resulting from error, as fraud may involve collusion, forgery, intentional omissions, misrepresentations, or the override of internal control.
– Obtain an understanding of internal control relevant to the audit in order to design audit procedures that are appropriate in the circumstances, but not for the purpose of expressing an opinion on the effectiveness of the Group’s internal control.
– Evaluate the appropriateness of accounting policies used and the reasonableness of accounting estimates and related disclosures made by the Directors.
– Conclude on the appropriateness of the Directors’ use of the going concern basis of accounting and, based on the audit evidence obtained, whether a material uncertainty exists related to events or conditions that may cast significant doubt on the Group’s ability to continue as a going concern. If we conclude that a material uncertainty exists, we are required to draw attention in our auditor’s report to the related disclosures in the consolidated financial statements or, if such disclosures are inadequate, to modify our opinion. Our conclusions are based on the audit evidence obtained up to the date of our auditor’s report. However, future events or conditions may cause the Group to cease to continue as a going concern.
– Evaluate the overall presentation, structure and content of the consolidated financial statements, including the disclosures, and whether the consolidated financial statements represent the underlying transactions and events in a manner that achieves fair presentation.
– Obtain sufficient appropriate audit evidence regarding the financial information of the entities or business activities within the Group to express an opinion on the consolidated financial statements. We are responsible for the direction, supervision and performance of the group audit. We remain solely responsible for our audit opinion.
We communicate with those charged with governance regarding, among other matters, the planned scope and timing of the audit and significant audit findings, including any significant deficiencies in internal control that we identify during our audit. Those charged with governance are responsible for overseeing the Group’s financial reporting process.
We also provide those charged with governance with a statement that we have complied with relevant ethical requirements regarding independence, and to communicate with them all relationships and other matters that may reasonably be thought to bear on our independence, and where applicable, related safeguards.
From the matters communicated with those charged with governance, we determine those matters that were of most significance in the audit of the consolidated financial statements of the current period and are therefore the key audit matters. We describe these matters in our auditor’s report unless law or regulation precludes public disclosure about the matter or when, in extremely rare circumstances, we determine that a matter should not be communicated in our report because the adverse consequences of doing so would reasonably be expected to outweigh the public interest benefits of such communication.
Use of this reportThis report, including the opinion, has been prepared for and only for Coca-Cola HBC AG for the purpose of the Disclosure Guidance and Transparency Rules sourcebook and the Listing Rules of the Financial Conduct Authority and for no other purpose.
Marios Psaltisthe Certified Auditor, Reg. No. 38081for and on behalf of PricewaterhouseCoopers S.A.Certified Auditors, Reg. No. 113Athens, Greece
16 March 2018
Notes:(a) The maintenance and integrity of the Coca-Cola HBC AG website is the responsibility of the Directors; the work carried out by the auditors does not involve
consideration of these matters and, accordingly, the auditors accept no responsibility for any changes that may have occurred to the consolidated financial statements since they were initially presented on the website.
(b) Legislation in UK and Switzerland governing the preparation and dissemination of consolidated financial statements may differ from legislation in other jurisdictions.
132 Coca-Cola HBC 2017 Integrated Annual Report
INDEPENDENT AUDITOR’S REPORT CONTINUED

Consolidated income statementFor the year ended 31 December
Note2017
€ million2016
€ million
Net sales revenue 6,7 6,522.0 6,219.0Cost of goods sold (4,083.0) (3,920.2)Gross profit 2,439.0 2,298.8 Operating expenses 8 (1,849.2) (1,792.5)Operating profit 6 589.8 506.3 Finance income 10.6 7.4Finance costs (47.3) (69.7)Finance costs, net 9 (36.7) (62.3)Share of results of equity method investments 15 11.8 13.8Profit before tax 564.9 457.8 Tax 10 (138.4) (113.8)Profit after tax 426.5 344.0 Attributable to: Owners of the parent 426.0 343.5Non-controlling interests 0.5 0.5 426.5 344.0 Basic earnings per share (€) 11 1.17 0.95Diluted earnings per share (€) 11 1.16 0.95
The accompanying notes form an integral part of these consolidated financial statements.
133Coca-Cola HBC 2017 Integrated Annual Report
Strategic R
eport
Co
rporate G
overnance
Financial Statem
entsS
wiss S
tatutory R
eporting
Supplem
entary Inform
ation
FINANCIAL STATEMENTS

Consolidated statement of comprehensive incomeFor the year ended 31 December
2017
€ million2016
€ million
Profit after tax 426.5 344.0Other comprehensive income: Items that may be subsequently reclassified to income statement: Available-for-sale financial assets: Valuation gain / (loss) during the year 0.1 (0.1)Cash flow hedges:
Net losses during the year (7.0) (48.2) Net losses reclassified to income statement for the year 6.3 12.8 Transfers to inventory for the year 9.3 8.6 4.1 (31.3)
Foreign currency translation (219.2) (112.9)Share of other comprehensive income of equity method investments (5.3) (7.5)Income tax relating to items that may be subsequently reclassified to income statement (refer to Note 12) (0.3) 1.1 (216.1) (150.7)Items that will not be subsequently reclassified to income statement: Actuarial gains / (losses) 6.9 (41.7)Income tax relating to items that will not be subsequently reclassified to income statement (refer to Note 12) (2.2) 7.0 4.7 (34.7)Other comprehensive loss for the year, net of tax (refer to Note 12) (211.4) (185.4)Total comprehensive income for the year 215.1 158.6 Total comprehensive income attributable to: Owners of the parent 214.6 158.1Non-controlling interests 0.5 0.5 215.1 158.6
The accompanying notes form an integral part of these consolidated financial statements.
134 Coca-Cola HBC 2017 Integrated Annual Report
FINANCIAL STATEMENTS CONTINUED

Consolidated balance sheetAs at 31 December
Note2017
€ million 2016
€ million
Assets Intangible assets 13 1,829.9 1,885.7Property, plant and equipment 14 2,322.0 2,406.6Equity method investments 15 96.8 117.0Derivative financial instruments 23 4.4 8.1Deferred tax assets 10 59.1 57.5Other non-current assets 17 32.4 28.7Total non-current assets 4,344.6 4,503.6 Inventories 16 416.8 431.5Trade, other receivables and assets 17 966.8 1,030.8Other financial assets 24 150.9 –Derivative financial instruments 23 12.0 7.9Current tax assets 12.3 6.1Cash and cash equivalents 24 723.5 573.2 2,282.3 2,049.5Assets classified as held for sale 18 3.3 11.8Total current assets 2,285.6 2,061.3Total assets 6,630.2 6,564.9 Liabilities Borrowings 24 166.4 156.5Derivative financial instruments 23 4.5 14.2Trade and other payables 19 1,544.4 1,587.3Provisions and employee benefits 20 83.6 118.6Current tax liabilities 97.5 91.5Total current liabilities 1,896.4 1,968.1 Borrowings 24 1,459.8 1,468.1Derivative financial instruments 23 0.9 1.3Deferred tax liabilities 10 134.0 124.1Provisions and employee benefits 20 120.2 125.0Other non-current liabilities 6.7 8.2Total non-current liabilities 1,721.6 1,726.7Total liabilities 3,618.0 3,694.8 Equity Share capital 25 2,015.1 1,990.8Share premium 25 4,739.3 4,854.6Group reorganisation reserve 25 (6,472.1) (6,472.1)Treasury shares 25 (71.3) (70.7)Exchange equalisation reserve 25 (1,026.3) (801.8)Other reserves 25 271.2 245.1Retained earnings 3,551.5 3,119.7Equity attributable to owners of the parent 3,007.4 2,865.6Non-controlling interests 4.8 4.5Total equity 3,012.2 2,870.1Total equity and liabilities 6,630.2 6,564.9
The accompanying notes form an integral part of these consolidated financial statements.
135Coca-Cola HBC 2017 Integrated Annual Report
Strategic R
eport
Co
rporate G
overnance
Financial Statem
entsS
wiss S
tatutory R
eporting
Supplem
entary Inform
ation

Consolidated statement of changes in equity Attributable to owners of the parent
Non- controlling
interests€ million
Total equity
€ million
Share capital
€ million
Share premium
€ million
Group reorganisation
reserve€ million
Treasury shares
€ million
Exchange equalisation
reserve€ million
Other reserves€ million
Retained earnings€ million
Total€ million
Balance as 1 January 2016 2,000.1 5,028.3 (6,472.1) (132.0) (681.4) 260.4 2,816.5 2,819.8 4.3 2,824.1Shares issued to employees exercising stock options 9.1 12.5 – – – – – 21.6 – 21.6Share-based compensation:
Options and performance shares – – – – – 8.1 – 8.1 – 8.1Movement in shares held for equity compensation plan – – – (0.4) – – – (0.4) – (0.4)
Sale of own shares – – – 3.1 – – – 3.1 – 3.1Cancellation of shares (18.4) (40.1) – 58.5 – – – – – –Appropriation of reserves – – – 0.1 – 6.9 (7.0) – – –Dividends – (146.1) – – – – 1.4 (144.7) (0.3) (145.0) 1,990.8 4,854.6 (6,472.1) (70.7) (681.4) 275.4 2,810.9 2,707.5 4.0 2,711.5Profit for the year net of tax – – – 343.5 343.5 0.5 344.0Other comprehensive loss for the year, net of tax – – – (120.4) (30.3) (34.7) (185.4) – (185.4)Total comprehensive income for the year, net of tax1 – – – (120.4) (30.3) 308.8 158.1 0.5 158.6Balance as at 31 December 2016 1,990.8 4,854.6 (6,472.1) (70.7) (801.8) 245.1 3,119.7 2,865.6 4.5 2,870.1
1. The amount included in the exchange equalisation reserve of €120.4m loss for 2016 represents the exchange loss attributed to the owners of the parent, including €7.5m loss relating to share of other comprehensive income of equity method investments.
The amount included in other reserves of €30.3m loss for 2016 consists of loss on valuation of available-for-sale financial assets of €0.1m, cash flow hedges losses of €31.3m and the deferred tax income thereof amounting to €1.1m.
The amount of €308.8m gain comprises profit for the year of €343.5m, less actuarial losses of €41.7m, plus a deferred tax income of €7.0m. The amount of €0.5m gain included in non-controlling interests for 2016 represents the share of non-controlling interests in profit for the year.
The accompanying notes form an integral part of these consolidated financial statements.
136 Coca-Cola HBC 2017 Integrated Annual Report
FINANCIAL STATEMENTS CONTINUED

Attributable to owners of the parent
Non- controlling
interests€ million
Total equity
€ million
Share capital
€ million
Share premium
€ million
Group reorganisation
reserve€ million
Treasury shares
€ million
Exchange equalisation
reserve€ million
Other reserves€ million
Retained earnings€ million
Total€ million
Balance as at 1 January 2017 1,990.8 4,854.6 (6,472.1) (70.7) (801.8) 245.1 3,119.7 2,865.6 4.5 2,870.1Shares issued to employees exercising stock options 24.3 46.7 – – – – – 71.0 – 71.0Share-based compensation:
Options and performance shares – – – – – 17.2 – 17.2 – 17.2Movement in shares held for equity compensation plan – – – (0.6) – 0.1 – (0.5) – (0.5)
Appropriation of reserves – – – – – 0.4 (0.4) – – –Dividends – (162.0) – – – – 1.5 (160.5) (0.2) (160.7) 2,015.1 4,739.3 (6,472.1) (71.3) (801.8) 262.8 3,120.8 2,792.8 4.3 2,797.1Profit for the year net of tax – – – – – – 426.0 426.0 0.5 426.5Other comprehensive loss for the year, net of tax – – – – (224.5) 8.4 4.7 (211.4) – (211.4)Total comprehensive income for the year, net of tax2 – – – – (224.5) 8.4 430.7 214.6 0.5 215.1Balance as at 31 December 2017 2,015.1 4,739.3 (6,472.1) (71.3) (1,026.3) 271.2 3,551.5 3,007.4 4.8 3,012.2
2. The amount included in the exchange equalisation reserve of €224.5m loss for 2017 represents the exchange loss attributed to the owners of the parent, including €5.3m loss relating to share of other comprehensive income of equity method investments.
The amount included in other reserves of €8.4m gain for 2017 consists of gain on valuation of available-for-sale financial assets of €0.1m, cash flow hedges gains of €8.6m and the deferred tax expense thereof amounting to €0.3m.
The amount of €430.7m gain comprises profit for the year of €426.0m, plus actuarial gains of €6.9m, minus deferred tax expense of €2.2m. The amount of €0.5m gain included in non-controlling interests for 2017 represents the share of non-controlling interests in profit for the year.
For further details, refer to: Note 25 Equity and Note 27 Share based payments.
The accompanying notes form an integral part of these consolidated financial statements.
137Coca-Cola HBC 2017 Integrated Annual Report
Strategic R
eport
Co
rporate G
overnance
Financial Statem
entsS
wiss S
tatutory R
eporting
Supplem
entary Inform
ation

Consolidated cash flow statementFor the year ended 31 December
Note2017
€million2016
€million
Operating activities Profit after tax 426.5 344.0Finance costs, net 9 36.7 62.3Share of results of equity method investments 15 (11.8) (13.8)Tax charged to the income statement 10 138.4 113.8Depreciation of property, plant and equipment 14 300.7 305.5Impairment of property, plant and equipment 14 16.1 26.9Employee stock options and performance shares 27 20.8 8.1Amortisation of intangible assets 13 0.4 0.4Other non-cash items (0.3) (1.3) 927.5 845.9Gain on disposals of non-current assets 8 (4.3) (2.9)(Increase) / Decrease in inventories (13.1) 3.8Decrease / (Increase) in trade and other receivables 11.7 (122.6)Increase in trade and other payables 10.1 131.2Tax paid (128.4) (92.1)Net cash inflow from operating activities 803.5 763.3 Investing activities Payments for purchases of property, plant and equipment (409.9) (347.8)Payments for purchases of intangible assets 13 (1.8) –Proceeds from sales of property, plant and equipment 39.5 35.9Net receipts from equity investments 24.4 17.8Net payments for investments in financial assets 23 (151.0) –Proceeds from loans to related parties 1.6 2.8Interest received 7.1 7.3Payments for acquisition of subsidiary 22 – (19.5)Net cash outflow from investing activities (490.1) (303.5) Financing activities Proceeds from shares issued to employees exercising stock options 25 71.0 21.6Purchase of shares from non-controlling interests (0.5) (0.7)Proceeds from sale of own shares – 3.1Dividends paid to owners of the parent 25 (160.5) (144.7)Dividends paid to non-controlling interests (0.2) (0.3)Proceeds from borrowings 82.2 679.6Repayments of borrowings (83.8) (738.2)Principal repayments of finance lease obligations (7.2) (20.2)Payments for settlement of derivatives and forward starting swaps (3.1) (55.4)Interest paid (36.9) (72.8)Net cash outflow from financing activities (139.0) (328.0)Net increase in cash and cash equivalents 174.4 131.8 Movement in cash and cash equivalents Cash and cash equivalents at 1 January 573.2 487.4Net increase in cash and cash equivalents 174.4 131.8Effect of changes in exchange rates (24.1) (46.0)Cash and cash equivalents at 31 December 24 723.5 573.2
The accompanying notes form an integral part of these consolidated financial statements.
138 Coca-Cola HBC 2017 Integrated Annual Report
FINANCIAL STATEMENTS CONTINUED

1. Description of businessCoca-Cola HBC AG and its subsidiaries (the ‘Group’ or ‘Coca-Cola HBC’ or ‘the Company’) are principally engaged in the production, sales and distribution of non-alcoholic ready-to-drink beverages, under franchise from The Coca-Cola Company. The Company distributes its products in Nigeria and 27 countries in Europe. Information on the Company’s operations by segment is included in Note 6.
On 11 October 2012, Coca-Cola HBC, a Swiss stock corporation (Aktiengesellschaft/Société Anonyme) incorporated by Kar-Tess Holding (a related party of the Group, see Note 26), announced a voluntary share exchange offer to acquire all outstanding ordinary registered shares and all American depositary shares of Coca-Cola Hellenic Bottling Company S.A. As a result of the successful completion of this offer, on 25 April 2013 Coca-Cola HBC acquired 96.85% of the issued Coca-Cola Hellenic Bottling Company S.A. shares, including shares represented by American depositary shares, and became the new parent company of the Group. On 17 June 2013, Coca-Cola HBC completed its statutory buy-out of the remaining shares of Coca-Cola Hellenic Bottling Company S.A. that it did not acquire upon completion of its voluntary share exchange offer. Consequently, Coca-Cola HBC acquired 100% of Coca-Cola Hellenic Bottling Company S.A. which was eventually delisted from the Athens Exchange, from the London Stock Exchange where it had a secondary listing and from the New York Stock Exchange where American depositary shares were listed.
The shares of Coca-Cola HBC started trading in the premium segment of the London Stock Exchange (Ticker symbol: CCH), on the Athens Exchange (Ticker symbol: EEE) and regular way trading in Coca-Cola HBC ADS commenced on the New York Stock Exchange (Ticker symbol: CCH) on 29 April 2013. On 24 July 2014 the Group proceeded to the delisting of its American Depository Receipts from the New York Stock Exchange and terminated its reporting obligations under the US Securities Exchange Act of 1934. The deregistration of Coca-Cola HBC shares under the US Securities Exchange Act of 1934 and the termination of its reporting obligations became effective on 3 November 2014.
2. Basis of preparation and consolidation
Basis of preparationThe consolidated financial statements included in this document are prepared in accordance with International Financial Reporting Standards (‘IFRS’) as issued by the International Accounting Standards Board (‘IASB’).
The consolidated financial statements are prepared on a going concern basis under the historical cost convention, as modified by the revaluation of available-for-sale financial assets and derivative financial instruments.
These consolidated financial statements were approved for issue by the Board of Directors on 15 March 2018 and are expected to be verified at the Annual General Meeting to be held on 11 June 2018.
Basis of consolidationSubsidiary undertakings are those companies over which the Group, directly or indirectly, has control. The Group controls an entity when the Group is exposed to, or has rights to, variable returns from its involvement with the entity and has the ability to affect those returns through power over the entity. Subsidiary undertakings are consolidated from the date on which control is transferred to the Group and cease to be consolidated from the date on which control is transferred out of the Group.
Transactions with non-controlling interests that do not result in loss of control are accounted for as equity transactions – that is, as transactions with the owners in their capacity as owners. The difference between fair value of any consideration paid and the relevant share acquired of the carrying value of net assets of the subsidiary is recorded in equity.
Inter-company transactions and balances between Group companies are eliminated. The subsidiaries’ accounting policies are consistent with policies adopted by the Group.
When the Group ceases to have control, any retained interest in the entity is remeasured to its fair value at the date when such control is lost, with the change in carrying amount recognised in profit or loss. The fair value is the initial carrying amount for the purposes of subsequently accounting for the retained interest as an associate, joint venture or financial asset. In addition, any amounts previously recognised in other comprehensive income in respect of that entity are accounted for as if the Group had directly disposed of the related assets or liabilities. This may mean that amounts previously recognised in other comprehensive income are reclassified to profit or loss.
3. Foreign currency and translationThe individual financial statements of each Group entity are presented in the currency of the primary economic environment in which the entity operates (its functional currency). For the purpose of the consolidated financial statements, the results and financial position of each entity are expressed in Euro, which is the presentation currency for the consolidated financial statements.
139Coca-Cola HBC 2017 Integrated Annual Report
Strategic R
eport
Co
rporate G
overnance
Financial Statem
entsS
wiss S
tatutory R
eporting
Supplem
entary Inform
ation
NOTES TO THE CONSOLIDATED FINANCIAL STATEMENTS

3. Foreign currency and translation continuedThe assets and liabilities of foreign subsidiaries are translated into Euro at the exchange rate ruling at the balance sheet date. The results of foreign subsidiaries are translated into Euro using the average monthly exchange rate (being a reasonable approximation of the rates prevailing on the transaction dates). The exchange differences arising on translation are recognised in other comprehensive income. On disposal of a foreign entity, accumulated exchange differences are recognised as a component of the gain or loss on disposal.
Transactions in foreign currencies are recorded at the rate ruling at the date of transaction. Monetary assets and liabilities denominated in foreign currencies are remeasured at the rate of exchange ruling at the balance sheet date. All gains and losses arising on remeasurement are included in the income statement, except for exchange differences arising on assets and liabilities classified as cash flow hedges which are deferred in equity until the occurrence of the hedged transaction, at which time they are recognised in the income statement. Share capital denominated in a currency other than the functional currency is initially stated at spot rate of the date of issue but is not retranslated.
The principal exchange rates used for translation purposes in respect of one Euro are:
Average
2017Average
2016Closing
2017Closing
2016
US dollar 1.13 1.11 1.19 1.04UK sterling 0.88 0.82 0.89 0.85Polish zloty 4.26 4.36 4.19 4.40Nigerian naira 378.60 279.97 428.75 317.95Hungarian forint 309.20 311.40 310.12 309.22Swiss franc 1.11 1.09 1.17 1.07Russian rouble 65.87 74.36 68.67 64.72Romanian leu 4.57 4.49 4.65 4.54Ukrainian hryvnia 29.97 28.27 33.12 27.97Czech koruna 26.34 27.03 25.93 27.02Serbian dinar 121.45 123.08 118.29 123.30
4. Accounting pronouncements
a) Accounting pronouncements adopted in 2017In the current period, the Group has adopted the following amendments which were issued by the IASB, that are relevant to its operations and effective for accounting periods beginning on 1 January 2017:
– Amendments to IAS 7: Disclosure initiative
– Amendments to IAS 12: Recognition of deferred tax assets for unrealised losses
– Amendments to IFRS 12: Disclosure of interests in other entities
The adoption of these amendments did not have any impact on amounts recognised in the current period or any prior period and are not likely to affect future periods. However, the amendment to IAS 7 requires disclosure of changes in liabilities arising from financing activities, refer to Note 24.
b) Accounting pronouncements not yet adoptedAt the date of approval of these consolidated financial statements, the following standards and interpretations relevant to the Group’s operations were issued but not yet effective and not early adopted.
IFRS 15, Revenue from Contracts with Customers that will replace IAS 18, which covers contracts for goods and services, and IAS 11, which covers construction contracts. The new standard is based on the principle that revenue is recognised when control of a good or service is transferred to a customer. IFRS 15 is effective for annual periods beginning on or after 1 January 2018. Management has carried out an assessment of the impact of adopting the new standard focusing on areas such as: identification of material rights that should be accounted for as performance obligations and consideration paid to customers. Management has concluded that adoption of the new standard will not have a material impact on the Group’s financial statements.
140 Coca-Cola HBC 2017 Integrated Annual Report
NOTES TO THE CONSOLIDATED FINANCIAL STATEMENTS CONTINUED

IFRS 9, Financial Instruments, which reflects all phases of the financial instruments project and replaces IAS 39, Financial Instruments: Recognition and Measurement. The standard introduces new requirements for classification and measurement, impairment, and hedge accounting. IFRS 9 is effective for annual periods beginning on or after 1 January 2018. Management has assessed the effect of adopting the new standard on the Group’s financial statements and has concluded that neither the new requirements related to the classification and measurement nor the ones related to impairment will have a material impact to the financial statements although may impact disclosures. The new hedge accounting requirements will align the accounting for hedging instruments more closely with the Group’s risk management practices and therefore more hedge relationships are expected to be eligible for hedge accounting. Furthermore, changes in time value of option contracts will in future be deferred in a new ‘costs of hedging’ reserve within equity. The deferred amounts will be recognised against the related hedged transaction when it occurs. The Group will apply the new rules retrospectively from 1 January 2018, with the practical expedients permitted under the standard.
IFRS 16, Leases. The new standard supersedes IAS 17 and its objective is to ensure that lessees and lessors provide relevant information in a manner that faithfully represents those transactions. IFRS 16 introduces a single lessee accounting model and requires a lessee to recognise assets and liabilities for all leases with a term of more than 12 months, unless the underlying asset is of low value. IFRS 16 is effective for annual periods beginning on or after 1 January 2019. The Group is currently evaluating the impact IFRS 16 will have on its consolidated financial statements.
In addition, the following amendments have been issued by the IASB but are not yet effective. The Group is currently evaluating the impact these amendments will have on its consolidated financial statements:
– Amendments to IFRS 2: Classification and Measurement of Share-based Payment Transactions
– Amendments to IFRS 10 and IAS 28: Sale or contribution of assets between an investor and its associate or joint venture
– Interpretation 22: Foreign Currency Transactions and Advance Consideration
– Annual improvements to IFRSs: 2014-2016 Cycle – IAS 28
– Annual improvements to IFRSs: 2015-2017 Cycle
– Interpretation 23: Uncertainty over income tax treatments
5. Critical accounting estimates and judgementsIn conformity with IFRS, the preparation of the consolidated financial statements for Coca-Cola HBC requires management to make estimates and judgements that affect the reported amounts of assets, liabilities, revenues and expenses, and the disclosure of contingent assets and liabilities in the consolidated financial statements and accompanying notes. Although these estimates and judgements are based on management’s knowledge of current events and actions that may be undertaken in the future, actual results may ultimately differ from estimates.
Estimates – Income taxes (Refer to Note 10)
– Impairment of goodwill and indefinite lived intangible assets (Refer to Note 13)
– Employee benefits – defined benefit pension plans (Refer to Note 20)
Judgements – Joint arrangements (Refer to Note 15)
141Coca-Cola HBC 2017 Integrated Annual Report
Strategic R
eport
Co
rporate G
overnance
Financial Statem
entsS
wiss S
tatutory R
eporting
Supplem
entary Inform
ation
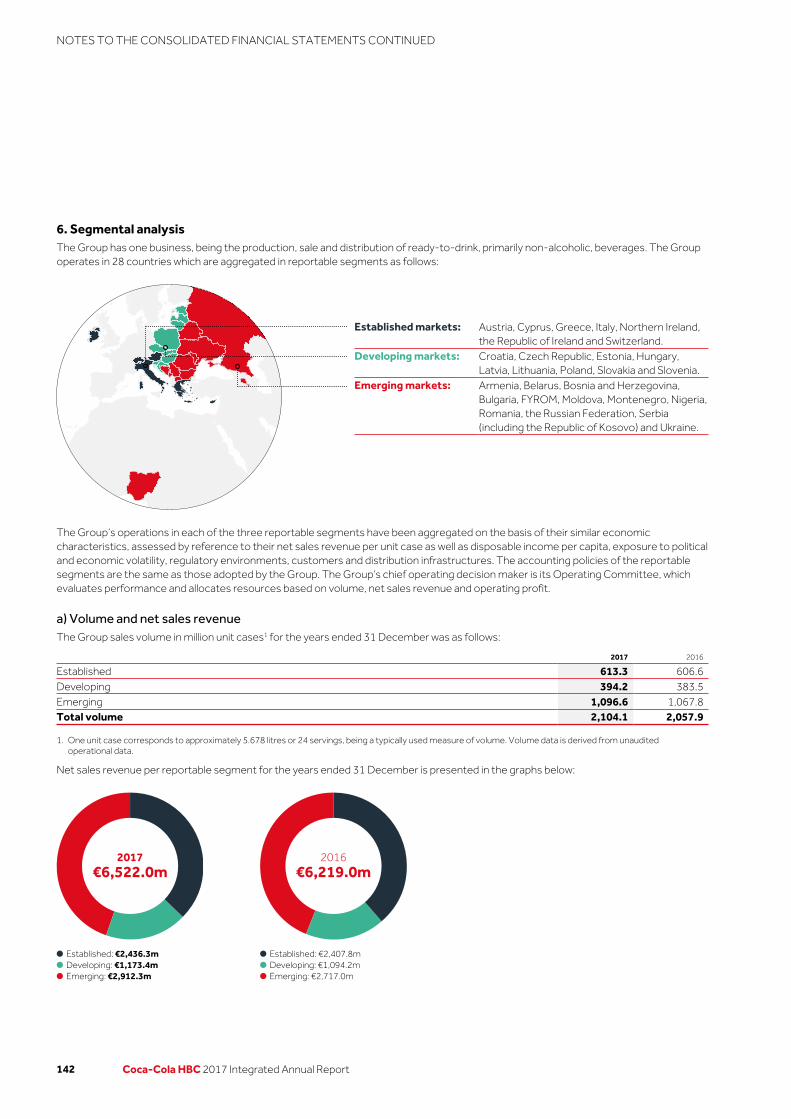
6. Segmental analysisThe Group has one business, being the production, sale and distribution of ready-to-drink, primarily non-alcoholic, beverages. The Group operates in 28 countries which are aggregated in reportable segments as follows:
Established markets: Austria, Cyprus, Greece, Italy, Northern Ireland, the Republic of Ireland and Switzerland.
Developing markets: Croatia, Czech Republic, Estonia, Hungary, Latvia, Lithuania, Poland, Slovakia and Slovenia.
Emerging markets: Armenia, Belarus, Bosnia and Herzegovina, Bulgaria, FYROM, Moldova, Montenegro, Nigeria, Romania, the Russian Federation, Serbia (including the Republic of Kosovo) and Ukraine.
Established: €2,407.8mDeveloping: €1,094.2mEmerging: €2,717.0m
2016€6,219.0m
Established: €2,436.3mDeveloping: €1,173.4mEmerging: €2,912.3m
2017€6,522.0m
The Group’s operations in each of the three reportable segments have been aggregated on the basis of their similar economic characteristics, assessed by reference to their net sales revenue per unit case as well as disposable income per capita, exposure to political and economic volatility, regulatory environments, customers and distribution infrastructures. The accounting policies of the reportable segments are the same as those adopted by the Group. The Group’s chief operating decision maker is its Operating Committee, which evaluates performance and allocates resources based on volume, net sales revenue and operating profit.
a) Volume and net sales revenueThe Group sales volume in million unit cases1 for the years ended 31 December was as follows:
2017 2016
Established 613.3 606.6Developing 394.2 383.5Emerging 1,096.6 1,067.8Total volume 2,104.1 2,057.9
1. One unit case corresponds to approximately 5.678 litres or 24 servings, being a typically used measure of volume. Volume data is derived from unaudited operational data.
Net sales revenue per reportable segment for the years ended 31 December is presented in the graphs below:
142 Coca-Cola HBC 2017 Integrated Annual Report
NOTES TO THE CONSOLIDATED FINANCIAL STATEMENTS CONTINUED

There are no material amounts of sales or transfers between the Group’s segments nor are there any customers who represent more than 10% of net sales revenue for the Group.
In addition to non-alcoholic, ready-to-drink beverages (‘NARTD’), the Group sells and distributes premium spirits. An analysis of volume and net sales revenue per product type for the years ended 31 December is presented below:
Volume in million unit cases1: 2017 2016
NARTD2 2,101.3 2,055.5Premium Spirits1 2.8 2.4Total volume 2,104.1 2,057.9 Net sales revenue in € million: NARTD 6,295.2 6,040.6Premium Spirits 226.8 178.4Total net sales revenue 6,522.0 6,219.0
1. One unit case corresponds to approximately 5.678 litres or 24 servings, being a typically used measure of volume. Volume data is derived from unaudited operational data. For premium spirits volume, one case corresponds to 5.678 litres.
2. NARTD: non-alcoholic, ready-to-drink beverages.
Net sales revenue from external customers attributed to Switzerland (the Group’s country of domicile), Russia, Italy and Nigeria was as follows for the years ended 31 December:
2017
€ million2016
€ million
Switzerland 416.3 423.6Russia 1,117.6 983.0Italy 880.6 897.7Nigeria 532.8 583.3 All countries, other than Switzerland, Russia, Italy and Nigeria 3,574.7 3,331.4Total net sales revenue from external customers 6,522.0 6,219.0
143Coca-Cola HBC 2017 Integrated Annual Report
Strategic R
eport
Co
rporate G
overnance
Financial Statem
entsS
wiss S
tatutory R
eporting
Supplem
entary Inform
ation

6. Segmental analysis continued
b) Other income statement items
Year ended 31 December Note2017
€ million2016
€ million
Operating profit: Established 238.3 236.8Developing 91.6 92.9Emerging 259.9 176.6Total operating profit 589.8 506.3 Interest expense and other finance costs: Established (25.4) (40.1)Developing (4.3) (4.9)Emerging (12.9) (8.9)Corporate3 (99.4) (133.2)Inter-segment interest expense 94.7 117.4Interest expense and other finance costs 9 (47.3) (69.7) Finance income: Established 0.6 0.5Developing 1.3 1.7Emerging 23.9 21.5Corporate3 79.5 101.1Inter-segment finance income (94.7) (117.4)Total finance income 9 10.6 7.4 Income tax expense: Established (57.6) (49.7)Developing (17.2) (19.0)Emerging (45.4) (35.7)Corporate3 (18.2) (9.4)Total income tax expense 10 (138.4) (113.8) Reconciling items: Share of results of equity method investments 15 11.8 13.8Profit after tax 426.5 344.0
Depreciation and impairment of property, plant and equipment and amortisation of intangible assets included in the measure of operating profit, are as follows:
Note2017
€ million2016
€ million
Depreciation and impairment of property, plant and equipment: Established (93.4) (95.8)Developing (52.2) (56.6)Emerging (171.2) (180.0)Total depreciation and impairment of property, plant and equipment 14 (316.8) (332.4)Amortisation of intangible assets: Emerging (0.4) (0.4)Total amortisation of intangible assets 13 (0.4) (0.4)
3. Corporate refers to holding, finance and other non-operating subsidiaries of the Group.
144 Coca-Cola HBC 2017 Integrated Annual Report
NOTES TO THE CONSOLIDATED FINANCIAL STATEMENTS CONTINUED

c) Other itemsThe balance of non-current assets4 attributed to Switzerland (the Group’s country of domicile), Russia, Italy and Nigeria was as follows for the year ended 31 December:
2017
€ million2016
€ million
Switzerland 497.9 546.0Russia 542.2 578.0Italy 979.4 990.7Nigeria 388.7 439.9 All countries, other than Switzerland, Russia, Italy and Nigeria 1,768.8 1,759.3Total non-current assets4 4,177.0 4,313.9
4. Excluding financial instruments, equity method investments and deferred tax assets.
Expenditure of property, plant and equipment per reportable segment was as follows for the year ended 31 December:
2017
€ million2016
€ million
Established 89.7 94.7Developing 63.2 44.3Emerging 257.0 208.8Total expenditure of property, plant and equipment 409.9 347.8
During 2016 and 2017 the Nigerian naira was significantly devalued against the Euro, resulting in foreign currency translation losses which were recognised within other comprehensive income of the consolidated statement of comprehensive income in both 2016 and 2017 (refer to Note 12). The Group continues to monitor the situation in Nigeria in order to ensure that timely actions and initiatives are undertaken to minimise potential adverse impact on its performance, particularly in relation to the currency volatility.
145Coca-Cola HBC 2017 Integrated Annual Report
Strategic R
eport
Co
rporate G
overnance
Financial Statem
entsS
wiss S
tatutory R
eporting
Supplem
entary Inform
ation
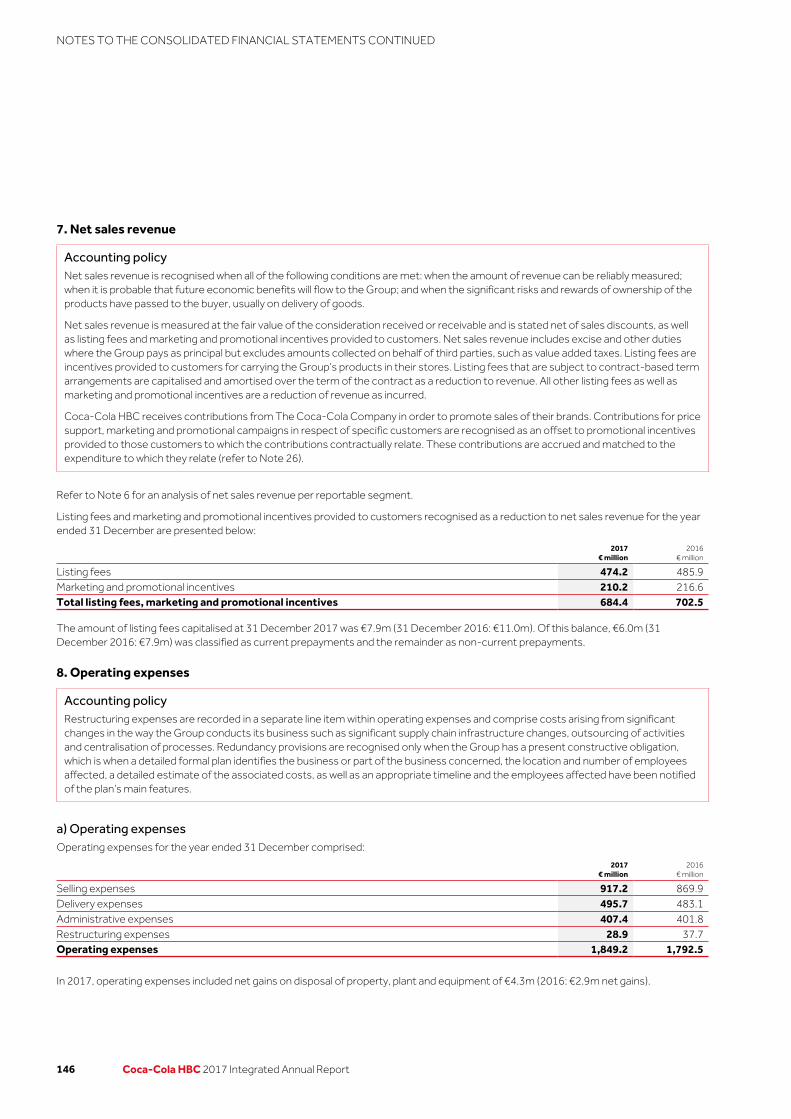
7. Net sales revenue
Accounting policyNet sales revenue is recognised when all of the following conditions are met: when the amount of revenue can be reliably measured; when it is probable that future economic benefits will flow to the Group; and when the significant risks and rewards of ownership of the products have passed to the buyer, usually on delivery of goods.
Net sales revenue is measured at the fair value of the consideration received or receivable and is stated net of sales discounts, as well as listing fees and marketing and promotional incentives provided to customers. Net sales revenue includes excise and other duties where the Group pays as principal but excludes amounts collected on behalf of third parties, such as value added taxes. Listing fees are incentives provided to customers for carrying the Group’s products in their stores. Listing fees that are subject to contract-based term arrangements are capitalised and amortised over the term of the contract as a reduction to revenue. All other listing fees as well as marketing and promotional incentives are a reduction of revenue as incurred.
Coca-Cola HBC receives contributions from The Coca-Cola Company in order to promote sales of their brands. Contributions for price support, marketing and promotional campaigns in respect of specific customers are recognised as an offset to promotional incentives provided to those customers to which the contributions contractually relate. These contributions are accrued and matched to the expenditure to which they relate (refer to Note 26).
Refer to Note 6 for an analysis of net sales revenue per reportable segment.
Listing fees and marketing and promotional incentives provided to customers recognised as a reduction to net sales revenue for the year ended 31 December are presented below:
2017
€ million2016
€ million
Listing fees 474.2 485.9Marketing and promotional incentives 210.2 216.6Total listing fees, marketing and promotional incentives 684.4 702.5
The amount of listing fees capitalised at 31 December 2017 was €7.9m (31 December 2016: €11.0m). Of this balance, €6.0m (31 December 2016: €7.9m) was classified as current prepayments and the remainder as non-current prepayments.
8. Operating expenses
Accounting policyRestructuring expenses are recorded in a separate line item within operating expenses and comprise costs arising from significant changes in the way the Group conducts its business such as significant supply chain infrastructure changes, outsourcing of activities and centralisation of processes. Redundancy provisions are recognised only when the Group has a present constructive obligation, which is when a detailed formal plan identifies the business or part of the business concerned, the location and number of employees affected, a detailed estimate of the associated costs, as well as an appropriate timeline and the employees affected have been notified of the plan’s main features.
a) Operating expensesOperating expenses for the year ended 31 December comprised:
2017
€ million2016
€ million
Selling expenses 917.2 869.9Delivery expenses 495.7 483.1Administrative expenses 407.4 401.8Restructuring expenses 28.9 37.7Operating expenses 1,849.2 1,792.5
In 2017, operating expenses included net gains on disposal of property, plant and equipment of €4.3m (2016: €2.9m net gains).
146 Coca-Cola HBC 2017 Integrated Annual Report
NOTES TO THE CONSOLIDATED FINANCIAL STATEMENTS CONTINUED
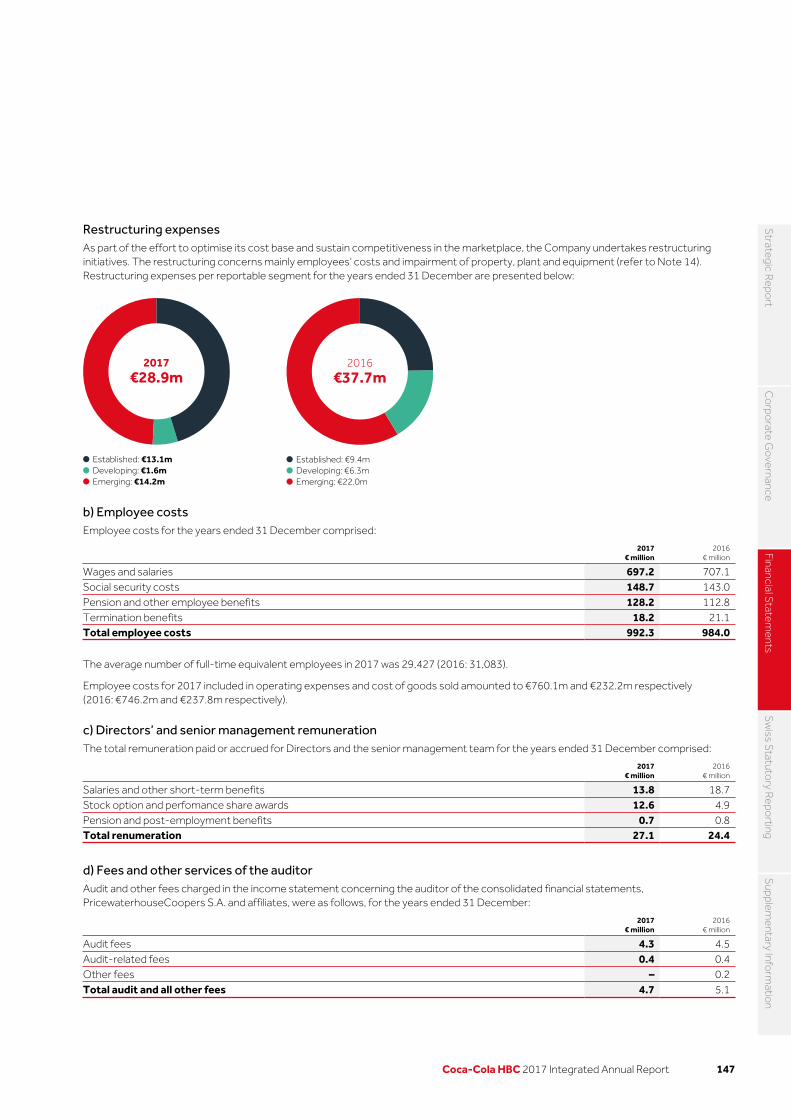
Restructuring expensesAs part of the effort to optimise its cost base and sustain competitiveness in the marketplace, the Company undertakes restructuring initiatives. The restructuring concerns mainly employees’ costs and impairment of property, plant and equipment (refer to Note 14). Restructuring expenses per reportable segment for the years ended 31 December are presented below:
b) Employee costsEmployee costs for the years ended 31 December comprised:
2017
€ million2016
€ million
Wages and salaries 697.2 707.1Social security costs 148.7 143.0Pension and other employee benefits 128.2 112.8Termination benefits 18.2 21.1Total employee costs 992.3 984.0
The average number of full-time equivalent employees in 2017 was 29,427 (2016: 31,083).
Employee costs for 2017 included in operating expenses and cost of goods sold amounted to €760.1m and €232.2m respectively (2016: €746.2m and €237.8m respectively).
c) Directors’ and senior management remunerationThe total remuneration paid or accrued for Directors and the senior management team for the years ended 31 December comprised:
2017
€ million2016
€ million
Salaries and other short-term benefits 13.8 18.7Stock option and perfomance share awards 12.6 4.9Pension and post-employment benefits 0.7 0.8Total renumeration 27.1 24.4
d) Fees and other services of the auditorAudit and other fees charged in the income statement concerning the auditor of the consolidated financial statements, PricewaterhouseCoopers S.A. and affiliates, were as follows, for the years ended 31 December:
2017
€ million2016
€ million
Audit fees 4.3 4.5Audit-related fees 0.4 0.4Other fees – 0.2Total audit and all other fees 4.7 5.1
Established: €9.4mDeveloping: €6.3mEmerging: €22.0m
2016€37.7m
Established: €13.1mDeveloping: €1.6mEmerging: €14.2m
2017€28.9m
147Coca-Cola HBC 2017 Integrated Annual Report
Strategic R
eport
Co
rporate G
overnance
Financial Statem
entsS
wiss S
tatutory R
eporting
Supplem
entary Inform
ation

9. Finance costs, net
Accounting policyInterest income and interest expense are recognised using the effective interest rate method, and are recorded in the income statement within ‘Finance income’ and ‘Finance cost’ respectively.
Finance costs, net for the years ended 31 December comprised:
2017
€ million2016
€ million
Interest income 10.6 7.4Interest expense (39.9) (60.6)Finance charges incurred with respect to finance leases (6.0) (7.7)Other finance costs (1.4) (1.4)Finance costs (47.3) (69.7)Finance costs, net (36.7) (62.3)
Other finance costs include commitment fees on loan facilities (for the part not yet drawn down) and other similar fees.
10. Taxation
Accounting policyTax is recognised in the income statement, except to the extent that it relates to items recognised in other comprehensive income or in equity. In this case, the tax is recognised in other comprehensive income or directly in equity.
The current income tax expense is calculated on the basis of the tax laws enacted or substantively enacted at the balance sheet date in the countries where the Group operates and generates taxable income. Management periodically evaluates positions taken in tax returns with respect to situations in which applicable tax regulations are subject to interpretation and establishes provisions where appropriate, on the basis of amounts expected to be paid to the tax authorities.
Deferred tax is provided using the liability method for all temporary differences arising between the tax bases of assets and liabilities and their carrying values for financial reporting purposes. However, the deferred tax liabilities are not recognised if they arise from the initial recognition of goodwill; deferred tax is not accounted for if it arises from initial recognition of an asset or liability in a transaction other than a business combination that at the time of the transaction affects neither accounting nor taxable profit or loss. Tax rates enacted or substantively enacted at the balance sheet date are those that are expected to apply when the deferred tax asset is realised or deferred tax liability is settled.
Deferred tax assets are recognised to the extent that it is probable that future taxable profit will be available against which the temporary differences can be utilised. Deferred tax assets are recognised for tax losses carried forward to the extent that realisation of the related tax benefit through the reduction of the future taxes is probable.
Deferred tax is provided on temporary differences arising on investments in subsidiaries, associates and joint ventures, except where the timing of the reversal of the temporary difference can be controlled by the Group, and it is probable that the temporary difference will not reverse in the foreseeable future. This includes taxation in respect of the retained earnings of overseas subsidiaries only to the extent that, at the balance sheet date, dividends have been accrued as receivable or a binding agreement to distribute past earnings in future periods has been entered into by the subsidiary.
Deferred tax assets and deferred tax liabilities are offset if a legally enforceable right exists to offset current tax assets against current income tax liabilities and the deferred taxes relate to the same taxation authority on either the same taxable entity or different taxable entities where there is an intention to settle the balances on a net basis.
Critical accounting estimatesThe Group is subject to income taxes in numerous jurisdictions. There are many transactions and calculations for which the ultimate tax determination cannot be assessed with certainty in the ordinary course of business. The Group recognises a provision for potential cases that might arise in the foreseeable future based on assessment of the probabilities as to whether additional taxes will be due. Where the final tax outcome on these matters is different from the amounts that were initially recorded, such differences will impact the income tax provision in the period in which such determination is made. The income tax provision amounted to €69.2m as at 31 December 2017 (2016: €56.7m) and is included in the line ‘Current tax liabilities’ of the consolidated balance sheet.
148 Coca-Cola HBC 2017 Integrated Annual Report
NOTES TO THE CONSOLIDATED FINANCIAL STATEMENTS CONTINUED

The income tax charge for the years ended 31 December is as follows:
2017
€ million2016
€ million
Current tax expense 130.6 116.4Deferred tax 7.8 (2.6)Income tax expense 138.4 113.8
The tax on the Group’s profit before tax differs from the theoretical amount that would arise using the weighted average tax rate applicable to profits of the consolidated entities as follows:
2017
€ million2016
€ million
Profit before tax 564.9 457.8 Tax calculated at domestic tax rates applicable to profits in the respective countries 130.1 105.0Additional local taxes in foreign jurisdictions 8.8 8.9Tax holidays in foreign jurisdictions (11.9) 0.7Expenses non-deductible for tax purposes 15.4 14.9Income not subject to tax (8.9) (12.5)Changes in tax laws and rates – (2.3)Movement in utilisation of accumulated tax losses 0.3 (2.3)Movement of deferred tax asset not recognised 2.0 (0.7)Recognition of previously unrecognised post-acquisition tax losses (0.3) 1.5Other 2.9 0.6Income tax expense 138.4 113.8
Non-deductible expenses for tax purposes include marketing and advertising expenses, service fees, bad debt provisions, entertainment expenses, certain employee benefits and stock options expenses and other items that, partially or in full, are not deductible for tax purposes in certain of our jurisdictions.
Deferred tax assets and liabilities presented in the consolidated balance sheet as at 31 December, can be further analysed as follows:
Deferred tax assets:2017
€ million2016
€ million
To be recovered after 12 months 47.1 48.0To be recovered within 12 months 67.2 86.0Gross deferred tax assets 114.3 134.0Offset of deferred tax (55.2) (76.5)Net deferred tax assets 59.1 57.5 Deferred tax liabilities: To be recovered after 12 months (167.1) (181.9)To be recovered within 12 months (22.1) (18.7)Gross deferred tax liabilities (189.2) (200.6)Offset of deferred tax 55.2 76.5Net deferred tax liabilities (134.0) (124.1)
A reconciliation of net deferred tax is presented below:
2017
€ million2016
€ million
As at 1 January (66.6) (75.7)Taken to the income statement (7.8) 2.6Taken to other comprehensive income (2.5) 8.1Foreign currency translation 2.0 (1.6)As at 31 December (74.9) (66.6)
149Coca-Cola HBC 2017 Integrated Annual Report
Strategic R
eport
Co
rporate G
overnance
Financial Statem
entsS
wiss S
tatutory R
eporting
Supplem
entary Inform
ation

10. Taxation continuedThe movements in deferred tax assets and liabilities during the year, without taking into consideration the offsetting of balances within the same tax jurisdiction where applicable, are as follows:
Deferred tax assets Provisions
€ million
Pensions and benefit plans
€ million
Tax losses carry-forward
€ million
Book in excess of tax depreciation
€ millionLeasing€ million
Other deferred tax assets
€ millionTotal
€ million
As at 1 January 2016 46.3 27.0 24.4 7.8 12.1 21.3 138.9Taken to the income statement 7.7 (6.0) (9.1) 0.3 (3.3) 3.2 (7.2)Taken to other comprehensive income 0.3 6.0 – – – 0.3 6.6Transfers between assets/liabilities 6.0 (1.0) – 0.2 – (6.0) (0.8)Foreign currency translation 3.2 (3.9) 1.4 – (0.2) (4.0) (3.5)As at 31 December 2016 63.5 22.1 16.7 8.3 8.6 14.8 134.0Taken to the income statement (12.1) (0.1) (6.1) 13.5 (0.9) 1.7 (4.0)Taken to other comprehensive income – (2.1) – – – (0.1) (2.2)Transfers between assets/liabilities (0.3) 0.3 – (0.1) – (10.5) (10.6)Foreign currency translation (1.3) (1.5) (0.2) (1.5) – 1.6 (2.9)As at 31 December 2017 49.8 18.7 10.4 20.2 7.7 7.5 114.3
Deferred tax liabilities
Tax in excess of book depreciation
€ million
Derivative instruments
€ million
Other deferred tax liabilities
€ millionTotal
€ million
As at 1 January 2016 (203.8) (1.9) (8.9) (214.6)Taken to the income statement 13.6 (1.5) (2.3) 9.8Taken to other comprehensive income – 1.5 – 1.5Transfers between assets/liabilities (0.2) – 1.0 0.8Foreign currency translation 2.0 – (0.1) 1.9As at 31 December 2016 (188.4) (1.9) (10.3) (200.6)Taken to the income statement 7.9 0.2 (11.9) (3.8)Taken to other comprehensive income – (0.2) (0.1) (0.3)Transfers between assets/liabilities (0.1) – 10.7 10.6Foreign currency translation 4.6 (0.1) 0.4 4.9As at 31 December 2017 (176.0) (2.0) (11.2) (189.2)
Deferred tax assets recognised for tax losses carry-forward in accordance with the relevant local rules applying in our jurisdictions, can be analysed as follows:
2017
€ million2016
€ million
Attributable to tax losses that expire within five years 5.5 9.8Attributable to tax losses that expire after five years 0.1 –Attributable to tax losses that can be carried forward indefinitely 4.8 6.9Recognised deferred tax assets attributable to tax losses 10.4 16.7
The Group has unrecognised deferred tax assets attributable to tax losses that are available to carry forward against future taxable income of €12.6m (2016: €13.0m). These are analysed as follows:
2017
€ million2016
€ million
Attributable to tax losses that expire within five years 12.6 12.3Attributable to tax losses that expire after five years – 0.7Unrecognised deferred tax assets attributable to tax losses 12.6 13.0
The aggregate amount of distributable reserves arising from the realised earnings of the Group’s operations was €2,071.6m in 2017 (2016: €1,871.9m). No deferred tax liabilities have been recognised on such reserves given that their distribution is controlled by the Group, or in the event of plans to remit overseas earnings of subsidiaries, such distribution would not give rise to a tax liability.
150 Coca-Cola HBC 2017 Integrated Annual Report
NOTES TO THE CONSOLIDATED FINANCIAL STATEMENTS CONTINUED

11. Earnings per share
Accounting policyBasic earnings per share is calculated by dividing the net profit attributable to the owners of the parent by the weighted average number of ordinary shares outstanding during the year. The weighted average number of ordinary shares outstanding during the year is the number of ordinary shares outstanding at the beginning of the year, adjusted by the number of ordinary shares bought back or issued during the year multiplied by a time-weighting factor. Diluted earnings per share incorporates stock options for which the average share price for the year is in excess of the exercise price of the stock option and there is a dilutive effect.
The calculation of the basic and diluted earnings per share attributable to the owners of the parent entity is based on the following data:
2017 2016
Net profit attributable to the owners of the parent (€ million) 426.0 343.5Weighted average number of ordinary shares for the purposes of basic earnings per share (million) 364.7 362.1Effect of dilutive stock options (million) 2.9 1.4Weighted average number of ordinary shares for the purposes of diluted earnings per share (million) 367.6 363.5Basic earnings per share (€) 1.17 0.95Diluted earnings per share (€) 1.16 0.95
Outstanding stock options that have an anti-dilutive effect and therefore were excluded from diluted earnings per share in 2017 were €1.0m (2016: €4.3m).
12. Components of other comprehensive incomeThe components of other comprehensive income for the years ended 31 December comprise:
2017 2016
Before-tax
€ millionTax expense
€ millionNet-of-tax
€ millionBefore-tax
€ millionTax income
€ millionNet-of-tax
€ million
Available-for-sale financial assets 0.1 – 0.1 (0.1) – (0.1)Cash flow hedges 8.6 (0.3) 8.3 (31.3) 1.1 (30.2)Foreign currency translation (219.2) – (219.2) (112.9) – (112.9)Actuarial gains / (losses) 6.9 (2.2) 4.7 (41.7) 7.0 (34.7)Share of other comprehensive income of equity method investments (5.3) – (5.3) (7.5) – (7.5)Other comprehensive loss (208.9) (2.5) (211.4) (193.5) 8.1 (185.4)
The majority of foreign currency translation impact for 2017 is related to the Nigerian naira as well as the Russian rouble and the Swiss franc, while the majority of the impact for 2016 related to the Nigerian naira and the Russian rouble.
151Coca-Cola HBC 2017 Integrated Annual Report
Strategic R
eport
Co
rporate G
overnance
Financial Statem
entsS
wiss S
tatutory R
eporting
Supplem
entary Inform
ation

13. Intangible assets
Accounting policyIntangible assets consist of goodwill, franchise agreements, trademarks and water rights. Goodwill and other indefinite-lived intangible assets are carried at cost less accumulated impairment losses, while intangible assets with finite lives are amortised over their useful economic lives. The useful lives, both finite and indefinite, assigned to intangible assets are evaluated on an annual basis.
Intangible assets with indefinite lives (‘not subject to amortisation’)
Intangible assets not subject to amortisation consist of goodwill, franchise agreements and trademarks.
Goodwill is the excess of the consideration transferred over the fair value of the share of net assets acquired. Goodwill and fair value adjustments arising on the acquisition of subsidiaries are treated as the assets and liabilities of those subsidiaries. These balances are denominated in the functional currency of the subsidiary and are translated to Euro on a basis consistent with the other assets and liabilities of the subsidiary.
The useful life of franchise agreements is usually based on the term of the respective franchise agreements. The Coca-Cola Company does not grant perpetual franchise rights outside the United States. However, given the Group's strategic relationship with The Coca-Cola Company and consistent with past experience, the Group believes that franchise agreements will continue to be renewed at each expiration date with no significant costs. The Group has concluded that the franchise agreements are perpetual in nature and they have therefore been assigned indefinite useful lives.
The Group’s trademarks are assigned an indefinite useful life when they have an established sales history in the applicable region. It is the intention of the Group to receive a benefit from them indefinitely and there is no indication that this will not be the case.
Goodwill and other indefinite-lived intangible assets are tested for impairment annually and whenever there is an indication of impairment.
For the purpose of impairment testing, goodwill is allocated to each of the Group’s cash-generating units expected to benefit from the business combination in which the goodwill arose. Other indefinite-lived intangible assets are also allocated to the Group’s cash-generating units expected to benefit from those intangibles. The cash-generating units (‘unit’) to which goodwill and other indefinite-lived intangible assets have been allocated are tested for impairment annually, or more frequently when there is an indication that the unit may be impaired. If the recoverable amount (i.e. the higher of the value-in-use and fair value less costs to sell) of the cash-generating unit is less than the carrying amount of the unit, the impairment loss is allocated first to reduce the carrying amount of any goodwill allocated to the unit and then pro-rata to the other assets of the unit on the basis of the carrying amount of each asset in the unit. Impairment losses recognised against goodwill are not reversed in subsequent periods.
Intangible assets with finite lives
Intangible assets with finite lives mainly consist of water rights and are amortised over their useful economic lives and are carried at cost less accumulated amortisation and impairment losses.
Critical accounting estimatesDetermining whether goodwill or indefinite-lived intangible assets are impaired requires an estimation of the value-in-use of the cash-generating units to which they have been allocated in order to determine the recoverable amount of the cash-generating units. The value in use calculation requires the Group to estimate the future cash flows expected to arise from the cash-generating unit and a suitable discount rate in order to calculate present value.
152 Coca-Cola HBC 2017 Integrated Annual Report
NOTES TO THE CONSOLIDATED FINANCIAL STATEMENTS CONTINUED

The movements in intangible assets by classes of assets during the year are as follows:
Goodwill€ million
Franchiseagreements
€ millionTrademarks
€ million
Other intangible assets
€ millionTotal
€ million
Cost As at 1 January 2016 1,882.6 155.7 56.9 26.2 2,121.4Intangible assets arising on current year acquisitions (refer to Note 22) 3.2 – 7.8 8.8 19.8Reclassified to assets held for sale (refer to Note 18) – – (7.8) (8.8) (16.6)Foreign currency translation (31.5) (6.3) 9.0 0.1 (28.7)As at 31 December 2016 1,854.3 149.4 65.9 26.3 2,095.9Amortisation As at 1 January 2016 182.4 – 8.9 18.5 209.8Charge for the year – – – 0.4 0.4As at 31 December 2016 182.4 – 8.9 18.9 210.2Net book value as at 1 January 2016 1,700.2 155.7 48.0 7.7 1,911.6Net book value as at 31 December 2016 1,671.9 149.4 57.0 7.4 1,885.7Cost As at 1 January 2017 1,854.3 149.4 65.9 26.3 2,095.9Additions – – 1.8 – 1.8Foreign currency translation (50.7) (3.5) (3.0) – (57.2)As at 31 December 2017 1,803.6 145.9 64.7 26.3 2,040.5Amortisation As at 1 January 2017 182.4 – 8.9 18.9 210.2Charge for the year – – – 0.4 0.4As at 31 December 2017 182.4 – 8.9 19.3 210.6Net book value as at 1 January 2017 1,671.9 149.4 57.0 7.4 1,885.7Net book value as at 31 December 2017 1,621.2 145.9 55.8 7.0 1,829.9
Intangible assets not subject to amortisation amounted to €1,821.1m (2016: €1,878.3m), and are presented in the chart below:
The carrying value of intangible assets subject to amortisation amounted to €8.8m (2016: €7.4m) and comprise primarily of water rights.
Goodwill: €1,671.9mFranchise agreements: €149.4mTrademarks: €57.0m
2016€1,878.3m
Goodwill: €1,621.2mFranchise agreements: €145.9mTrademarks: €54.0m
2017€1,821.1m
153Coca-Cola HBC 2017 Integrated Annual Report
Strategic R
eport
Co
rporate G
overnance
Financial Statem
entsS
wiss S
tatutory R
eporting
Supplem
entary Inform
ation

13. Intangible assets continued
Impairment tests for goodwill and other indefinite-lived intangible assetsThe recoverable amount of each cash-generating unit was determined through a value-in-use calculation. That calculation uses cash flow projections based on financial budgets approved by the Board of Directors covering a one-year period and cash projections for four additional years. Cash flows for years two to five were projected by management based on operation and market specific high-level assumptions including growth rates, discount rates and forecasted selling prices and direct costs. Management determined gross margins based on past performance, expectations for the development of the market and expectations about raw material costs. The growth rates used in perpetuity reflect the forecasts in line with management beliefs. These forecasts exceeded, in certain cases, those expected for the industry in general, due to the strength of our brand portfolio. Management estimates discount rates using rates that reflect current market assessments of the time value of money and risks specific to the countries of operation.
No impairment of goodwill and other indefinite lived assets was indicated from the impairment tests of 2017 and 2016.
The following table sets forth the carrying value of goodwill and other indefinite lived intangible assets for those cash-generating units whose carrying value is greater than 10% of the total, as at 31 December 2017.
Goodwill€ million
Franchiseagreements
€ millionTrademarks
€ millionTotal
€ million
Italy 625.2 126.9 – 752.1Switzerland 393.0 – – 393.0The Republic of Ireland and Northern Ireland 240.4 – – 240.4All other cash-generating units 362.6 19.0 54.0 435.6Total 1,621.2 145.9 54.0 1,821.1
For the above cash-generating units, cash flows beyond the five-year period (the period in perpetuity) have been extrapolated using the following estimated growth and discount rates:
Sensitivity analysisIn the cash-generating unit of Nigeria, which held €20.1m of goodwill and franchise agreements as at 31 December 2017, possible changes in certain key assumptions of the 2017 impairment test would remove the remaining headroom. As at 31 December 2017, the recoverable amount of the Nigerian CGU calculated based on value in use exceeded carrying value by €605.1m; changes per assumption that would eliminate remaining headroom are summarised in the table below:
Average gross
profit marginGrowth rate in
perpetuityDiscount
rate
Nigeria 6.0% 6.6% 5.3%
Intangible assets not subject to amortisation as at 31 December 2017 (%)
Growth rate in perpetuity(%)
Discount rate(%)
2017 2016 2017 2016
Italy 2.5 2.5 6.7 6.5 Switzerland 1.1 1.5 6.7 6.7 The Republic of Ireland and Northern Ireland 2.9 3.1 6.8 6.8
Italy: 41%Switzerland: 22%The Republic of Ireland andNorthern Ireland: 13%Other: 24%
154 Coca-Cola HBC 2017 Integrated Annual Report
NOTES TO THE CONSOLIDATED FINANCIAL STATEMENTS CONTINUED

14. Property, plant and equipment
Accounting policyAll property, plant and equipment is initially recorded at cost and subsequently measured at cost less accumulated depreciation and impairment losses. Subsequent expenditure is added to the carrying value of the asset when it is probable that future economic benefits, in excess of the original assessed standard of performance of the existing asset, will flow to the operation and the costs can be measured reliably. All other subsequent expenditure is expensed in the period in which it is incurred.
Assets under construction are recorded as part of property, plant and equipment and depreciation on these assets commences when the assets are available for use.
The Coca-Cola Company, at its sole discretion, provides the Group with contributions towards the purchase of cold drink equipment. Payments are made on placement of coolers and are based on franchise incentive arrangements. The terms and conditions of these arrangements require reimbursement if certain conditions stipulated in the agreements are not met, including minimum volume through-put requirements. Support payments received from The Coca-Cola Company for the placement of cold drink equipment are deducted from the cost of the related asset.
Depreciation is calculated on a straight-line basis to allocate the depreciable amount over the estimated useful life of the assets as follows:
Freehold buildings and improvements 40 yearsLeasehold buildings and improvements Over the lease term, up to 40 yearsProduction equipment 4 to 20 yearsVehicles 5 to 8 yearsComputer hardware and software 3 to 10 yearsMarketing equipment 3 to 10 yearsFixtures and fittings 8 yearsReturnable containers 3 to 12 years
Freehold land is not depreciated as it is considered to have an indefinite life.
Deposits received for returnable containers by customers are accounted for as deposit liabilities (refer to Note 19).
Residual values and useful lives of assets are reviewed and adjusted if appropriate at each balance sheet date.
Property, plant and equipment and other non-financial assets that are subject to depreciation are reviewed for impairment whenever events or changes in circumstances indicate that the carrying amount may not be recoverable. An impairment loss is recognised for the amount by which the carrying amount of the asset exceeds its recoverable amount, which is the higher of the asset’s fair value less cost to sell and its value-in-use. For the purposes of assessing impairment, assets are grouped at the lowest level of separately identifiable cash flows.
155Coca-Cola HBC 2017 Integrated Annual Report
Strategic R
eport
Co
rporate G
overnance
Financial Statem
entsS
wiss S
tatutory R
eporting
Supplem
entary Inform
ation

14. Property, plant and equipment continuedThe movements of property, plant and equipment by class of assets are as follows:
Land andbuildings€ million
Plant andequipment
€ million
Returnable containers
€ million
Assets under construction
€ millionTotal
€ million
CostAs at 1 January 2016 1,441.6 3,671.0 427.7 87.0 5,627.3Additions 4.1 119.5 43.0 173.1 339.7Arising on acquisitions (refer to Note 22) 1.5 1.3 – – 2.8Disposals (25.0) (210.0) (14.2) (0.1) (249.3)Reclassified from assets held for sale (refer to Note 18) 10.4 3.0 – – 13.4Reclassified to assets held for sale (refer to Note 18) (48.5) (3.0) – – (51.5)Reclassifications 43.0 102.0 – (145.0) –Foreign currency translation (20.5) (61.7) (62.4) (12.6) (157.2)As at 31 December 2016 1,406.6 3,622.1 394.1 102.4 5,525.2Depreciation and impairmentAs at 1 January 2016 423.9 2,451.4 206.2 0.3 3,081.8Charge for the year 39.5 229.5 36.5 – 305.5Impairment 13.8 10.8 1.7 0.6 26.9Disposals (9.5) (202.9) (11.7) – (224.1)Reclassified from assets held for sale (refer to Note 18) 6.3 2.8 – – 9.1Reclassified to assets held for sale (refer to Note 18) (34.3) (2.8) – – (37.1)Foreign currency translation 0.8 (22.6) (21.7) – (43.5)As at 31 December 2016 440.5 2,466.2 211.0 0.9 3,118.6Net book value as at 31 December 2016 966.1 1,155.9 183.1 101.5 2,406.6CostAs at 1 January 2017 1,406.6 3,622.1 394.1 102.4 5,525.2Additions 6.0 142.2 34.7 232.6 415.5Disposals (18.9) (205.8) (17.1) – (241.8)Reclassified to assets held for sale (refer to Note 18) (40.7) (14.4) – – (55.1)Reclassifications 89.1 138.6 – (227.7) –Foreign currency translation (58.1) (157.6) (35.7) (14.6) (266.0)As at 31 December 2017 1,384.0 3,525.1 376.0 92.7 5,377.8DepreciationAs at 1 January 2017 440.5 2,466.2 211.0 0.9 3,118.6Charge for the year 37.7 235.3 27.7 – 300.7Impairment 6.7 7.5 1.7 0.2 16.1Disposals (11.5) (202.8) (14.8) – (229.1)Reclassified to assets held for sale (refer to Note 18) (28.8) (12.1) – – (40.9)Foreign currency translation (13.2) (85.7) (10.7) – (109.6)As at 31 December 2017 431.4 2,408.4 214.9 1.1 3,055.8Net book value as at 31 December 2017 952.6 1,116.7 161.1 91.6 2,322.0
Assets under construction at 31 December 2017 include advances for equipment purchases of €22.6m (2016: €12.5m). Depreciation charge for the year included in operating expenses amounted to €141.9m (2016: €135.0m). Depreciation charge for the year included in cost of goods sold amounted to €158.8m (2016: €170.5m).
156 Coca-Cola HBC 2017 Integrated Annual Report
NOTES TO THE CONSOLIDATED FINANCIAL STATEMENTS CONTINUED

Impairment of property, plant and equipmentIn 2016 the Group recorded an impairment loss of €3.9m, €6.1m and €20.2m and recorded reversals of impairment of €0.9m, €nil and €2.4m relating to property, plant and equipment in the Established, Developing and Emerging segments respectively. This resulted in a net impairment loss of €3.0m, €6.1m and €17.8m in the Established, Developing and Emerging segments respectively. Impairment recorded mainly relates to restructuring initiatives (refer to Note 8). The impaired assets, being mainly buildings and production equipment, were written off based mainly on value-in-use calculations.
In 2017 the Group recorded an impairment loss of €6.6m, €1.9m and €13.6m and recorded reversals of impairment of €0.9m, €1.4m and €3.7m relating to property, plant and equipment in the Established, Developing and Emerging segments respectively. This resulted in a net impairment loss of €5.7m, €0.5m and €9.9m in the Established, Developing and Emerging segments respectively. Impairment recorded mainly relates to restructuring initiatives (refer to Note 8). The impaired assets, being mainly buildings and production equipment, were written off based mainly on value-in-use calculations.
Leased assets
Accounting policyLeases of property, plant and equipment, where the Group has substantially all the risks and rewards of ownership, are classified as finance leases.
Finance leases are capitalised at the inception of the lease at the lower of the fair value of the leased assets and the present value of the minimum lease payments. Each lease payment is allocated between liability and finance charges to achieve a constant rate on the finance balance outstanding. The corresponding lease obligations, net of finance charges, are included in current and non-current borrowings. The interest element of the finance cost is charged to the income statement over the lease period, so as to produce a constant periodic rate of interest on the remaining balance of the liability for each period (refer to Note 24). Property, plant and equipment acquired under finance lease is depreciated over the shorter of the useful life of the asset and the lease term. The useful life for leased assets corresponds with the Group policy for the depreciable life of property, plant and equipment.
Included in property, plant and equipment are assets held under finance leases, where the Group is the lessee, as follows:
2017€ million
2016€ million
Cost 175.7 184.9Accumulated depreciation (80.3) (82.4)Net book value 95.4 102.5
Net book value of assets held under finance leases by classes of assets is as follows:Plant and equipment 61.1 67.4Land and buildings 34.3 35.1Net book value 95.4 102.5
157Coca-Cola HBC 2017 Integrated Annual Report
Strategic R
eport
Co
rporate G
overnance
Financial Statem
entsS
wiss S
tatutory R
eporting
Supplem
entary Inform
ation

15. Interest in other entities
List of principal subsidiariesThe following are the principal subsidiaries of the Group as at 31 December:
Country of registration
% of voting rights % ownership
2017 2016 2017 2016
AS Coca-Cola HBC Eesti Estonia 100.0% 100.0% 100.0% 100.0%CCB Management Services GmbH Austria 100.0% 100.0% 100.0% 100.0%CCHBC Armenia CJSC Armenia 90.0% 90.0% 90.0% 90.0%CCHBC Bulgaria AD Bulgaria 99.4% 99.4% 99.4% 99.4%CCHBC Insurance (Guernsey) Limited Guernsey 100.0% 100.0% 100.0% 100.0%CCHBC IT Services Limited Bulgaria 100.0% 100.0% 100.0% 100.0%Coca-Cola Beverages Austria GmbH Austria 100.0% 100.0% 100.0% 100.0%Coca-Cola Beverages Belorussiya Belarus 100.0% 100.0% 100.0% 100.0%Coca-Cola Beverages Ukraine Ltd Ukraine 100.0% 100.0% 100.0% 100.0%Coca-Cola Bottlers Chisinau S.R.L. Moldova 100.0% 100.0% 100.0% 100.0%Coca-Cola HBC B-H d.o.o. Sarajevo Bosnia and Herzegovina 100.0% 100.0% 100.0% 100.0%Coca-Cola HBC Česko a Slovensko, s.r.o.1 Czech Republic 100.0% 100.0% 100.0% 100.0%Coca-Cola HBC Česko a Slovensko, s.r.o. – organizačná zložka2 Slovakia 100.0% 100.0% 100.0% 100.0%Coca-Cola HBC Finance B.V. The Netherlands 100.0% 100.0% 100.0% 100.0%Coca-Cola HBC Greece S.A.I.C. Greece 100.0% 100.0% 100.0% 100.0%Coca-Cola HBC Holdings B.V. The Netherlands 100.0% 100.0% 100.0% 100.0%Coca-Cola HBC Hrvatska d.o.o. Croatia 100.0% 100.0% 100.0% 100.0%Coca-Cola HBC Hungary Ltd Hungary 100.0% 100.0% 100.0% 100.0%Coca-Cola HBC Ireland Limited Republic of Ireland 100.0% 100.0% 100.0% 100.0%Coca-Cola HBC Italia S.r.l. Italy 100.0% 100.0% 100.0% 100.0%Coca-Cola HBC Kosovo L.L.C. Kosovo 100.0% 100.0% 100.0% 100.0%Coca-Cola HBC Northern Ireland Limited Northern Ireland 100.0% 100.0% 100.0% 100.0%Coca-Cola HBC Polska sp. z o.o. Poland 100.0% 100.0% 100.0% 100.0%Coca-Cola HBC Romania Ltd Romania 100.0% 100.0% 100.0% 100.0%Coca-Cola HBC Slovenija d.o.o. Slovenia 100.0% 100.0% 100.0% 100.0%Coca-Cola HBC Slovenska republica, s.r.o.2 Slovakia – 100.0% – 100.0%Coca-Cola HBC Switzerland Ltd Switzerland 99.9% 99.9% 99.9% 99.9%Coca-Cola HBC-Srbija d.o.o. Serbia 100.0% 100.0% 100.0% 100.0%Coca-Cola Hellenic Bottling Company-Crna Gora d.o.o., Podgorica Montenegro 100.0% 100.0% 100.0% 100.0%Coca-Cola Hellenic Business Service Organisation Bulgaria 100.0% 100.0% 100.0% 100.0%Coca-Cola Hellenic Procurement GmbH Austria 100.0% 100.0% 100.0% 100.0%CC Beverages Holdings II B.V. The Netherlands 100.0% 100.0% 100.0% 100.0%Lanitis Bros Ltd Cyprus 100.0% 100.0% 100.0% 100.0%LLC Coca-Cola HBC Eurasia Russia 100.0% 100.0% 100.0% 100.0%Nigerian Bottling Company Ltd Nigeria 100.0% 100.0% 100.0% 100.0%SIA Coca-Cola HBC Latvia Latvia 100.0% 100.0% 100.0% 100.0%Star Bottling Limited. Cyprus 100.0% 100.0% 100.0% 100.0%UAB Coca-Cola HBC Lietuva Lithuania 100.0% 100.0% 100.0% 100.0%
1. Effective 4 January 2017 Coca-Cola HBC Ceska republica, s.r.o. was renamed Coca-Cola HBC Česko a Slovensko, s.r.o.2. Effective 1 April 2017 Coca-Cola HBC Slovenska republica, s.r.o was merged with Coca-Cola HBC Česko a Slovensko, s.r.o. – organizačná zložka, branch
of Coca-Cola HBC Ceska republica, s.r.o.
158 Coca-Cola HBC 2017 Integrated Annual Report
NOTES TO THE CONSOLIDATED FINANCIAL STATEMENTS CONTINUED

Associates and joint arrangements
Accounting policies
Investments in associates
Investments in associated undertakings are accounted for by the equity method of accounting. Associated undertakings are all entities over which the Group has significant influence but not control, generally accompanying a shareholding of between 20% to 50% of the voting rights.
The equity method of accounting involves recognising the Group’s share of the associates’ post-acquisition profit or loss and movements in other comprehensive income for the period in the income statement and other comprehensive income respectively. Unrealised gains and losses resulting from transactions between the Group and the associate are eliminated to the extent of the interest in the associate.
The Group’s interest in each associate is carried in the balance sheet at an amount that reflects its share of the net assets of the associate and includes goodwill on acquisition. When the Group’s share of losses in an associate equals or exceeds its interest in the associate, the Group does not recognise further losses, unless the Group has incurred obligations or made payments on behalf of the associate.
Investments in joint arrangements
Joint arrangements are arrangements in which the Group has contractually agreed sharing of control, which exists only when decisions about the relevant activities require unanimous consent. Joint arrangements are classified as joint ventures or joint operations depending upon the rights and obligations arising from the joint arrangement.
The Group classifies a joint arrangement as a joint venture when the Group has rights to the net assets of the arrangement. The Group accounts for its interests in joint ventures using the equity method of accounting as described in the section above.
The Group classifies a joint arrangement as a joint operation when the Group has the rights to the assets, and obligations for the liabilities, of the arrangement and accounts for each of its assets, liabilities, revenues and expenses, including its share of those held or incurred jointly, in relation to the joint operation.
If facts and circumstances change, the Group reassesses whether it still has joint control and whether the type of joint arrangement in which it is involved has changed.
Critical accounting judgementsThe Group participates in several joint arrangements. Judgement is required in order to determine their classification as a joint venture where the Group has rights to the net assets of the arrangement, or a joint operation where the Group has rights to the assets and obligations for the liabilities of the arrangement. In making this judgement, consideration is given to the legal form of the arrangement, and the contractual terms and conditions, as well as other facts and circumstances (including the economic rationale of the arrangement and the impact of the legal framework).
a) Equity method investmentsChanges in the carrying amounts of equity method investments are as follows:
Associates
€ millionJoint ventures
€ millionTotal
€ million
As at 1 January 2016 23.2 90.6 113.8Capital increase – 7.9 7.9Additions (refer to Note 22) – 7.1 7.1Share of results of equity method investments 7.8 6.0 13.8Share of other comprehensive income of equity method investments (7.4) (0.1) (7.5)
Share of total comprehensive income 0.4 5.9 6.3Dividends (1.1) (17.0) (18.1)As at 31 December 2016 22.5 94.5 117.0Share of results of equity method investments 5.2 6.6 11.8Share of other comprehensive income of equity method investments (5.2) (0.1) (5.3)
Share of total comprehensive income – 6.5 6.5Disposals (refer to Note 22) – (3.5) (3.5)Return of capital – (17.7) (17.7)Dividends (0.5) (5.0) (5.5)As at 31 December 2017 22.0 74.8 96.8
159Coca-Cola HBC 2017 Integrated Annual Report
Strategic R
eport
Co
rporate G
overnance
Financial Statem
entsS
wiss S
tatutory R
eporting
Supplem
entary Inform
ation

15. Interests in other entities continuedIncluded in investment in associates is the Group’s investment in Frigoglass Industries Limited and Frigoglass West Africa Ltd. Nigerian Bottling Company Ltd holds an interest in Frigoglass Industries Limited of 23.9% (2016: 23.9% respectively). The Group has a 100% (2016: 100%) interest in Nigeria Bottling Company Ltd, therefore the Group has an effective interest of 23.9% in both Frigoglass Industries Limited (2016: 23.9%) and Frigoglass West Africa Ltd (2016: 23.9%).
In 2017, Frigoglass Industries Nigeria Limited and Frigoglass West Africa Ltd, became guarantors under the amended banking facilities and notes issued by the Frigoglass Group, as part of the debt restructuring of the latter. The Group has no direct exposure arising from these guarantee arrangements, but the Group’s investment in these associates, which stood at €16.8m as at 31 December 2017, would be at potential risk if there was a default under the terms of the amended banking facilities or the notes and the Frigoglass Group (including the guarantors) were unable to meet their obligations there under.
Investments in joint venturesThe Group has a significant joint venture with Heineken that is conducted through a number of legal entities being the BrewTech B.V. Group of companies, which is engaged in the bottling and distribution of soft drinks and beer in FYROM and the Brewinvest S.A. Group of companies which has minimal activity. BrewTech B.V. is incorporated in the Netherlands and the Group owns 50% (2016: 50%) of its share capital. Brewinvest S.A., parent company of Brewinvest S.A. Group of companies, which has minimal other activities, is incorporated in Greece and the Group owns 50% (2016: 50%) of its share capital. The structure of the joint venture provides the Group with rights to their net assets.
Summarised financial information of the Group’s significant joint venture is as follows (the information below reflects the amount presented in the IFRS financial statements of the joint venture, and not the Group’s share in those amounts):
2017
€ million2016
€ million
Summarised balance sheet: Non-current assets 56.1 46.9 Cash and cash equivalents 5.4 31.1Other current assets 7.8 16.8Total current assets 13.2 47.9Other current liabilities (including trade payables) (11.2) (10.9)Total current liabilities (11.2) (10.9)Non-current other liabilities (0.1) (0.2)Net assets 58.0 83.7 Summarised statement of comprehensive income: Revenue 61.8 57.8Depreciation and amortisation (5.0) (4.7)Interest income 0.2 0.6Interest expense – (0.1)Profit before tax 13.9 13.2Income tax expense (1.7) (1.6)Profit after tax 12.2 11.6Other comprehensive income 0.1 –Total comprehensive income 12.3 11.6Dividends received and capital returns (refer to Note 26) 19.3 16.5 Reconciliation of net assets to carrying amount: Closing net assets 58.0 83.7Interest in joint venture at 50% 29.0 41.8Goodwill 16.9 16.9Non-controlling interest (1.7) (1.7)Carrying value 44.2 57.0
160 Coca-Cola HBC 2017 Integrated Annual Report
NOTES TO THE CONSOLIDATED FINANCIAL STATEMENTS CONTINUED

Summarised financial information of the Group’s investment in other joint venture is as follows:
2017
€ million2016
€ million
Carrying amount 30.6 37.5Share of profit 0.5 0.2Share of other comprehensive income (0.1) (0.1)Share of total comprehensive income 0.4 0.1
The Group’s share of profit in other joint ventures includes restructuring initiatives within joint ventures of €0.2m (2016: €0.1m)
At 31 December 2017, the Group’s share of its joint ventures’ capital commitments and long-term commitments to purchase raw materials and receive services amounted to €nil (2016: €0.4m and €nil respectively).
b) Joint operations with TCCCThe Group has a 50% interest in the Multon Z.A.O. group of companies (‘Multon’). Multon is engaged in the production and distribution of juices in Russia and is classified as a joint operation as the arrangement gives the Group rights to the assets and obligations for the liabilities relating to the joint arrangement. Other joint operations of the Group comprise mainly a 50% interest in each of the water businesses depicted below, which are engaged in the production and distribution of water in the respective countries.
Country Joint operation Country Joint operation
Austria Römerquelle Poland MultivitaItaly Fonti del Vulture Switzerland ValserRomania Dorna Serbia VlasinkaBaltics Neptuno Vandenys
16. Inventories
Accounting policyInventories are stated at the lower of cost and net realisable value.
Cost for raw materials and consumables is determined on a weighted average basis. Cost for work in progress and finished goods is comprised of the cost of direct materials and labour plus attributable overhead costs. Cost includes all costs incurred to bring the product to its present location and condition.
Net realisable value is the estimated selling price in the ordinary course of business, less the estimated costs necessary to complete and sell the inventory.
Inventories consisted of the following at 31 December:
2017
€ million2016
€ million
Finished goods 197.7 199.8Raw materials and work in progress 151.4 158.3Consumables 67.7 73.4Total inventories 416.8 431.5
The amount of inventories recognised as an expense during 2017 was €3,154.6m (2016: €2,990.3m). During 2017 provision of obsolete inventories recognised as an expense amounted to €10.6m (2016: €11.4m), whereas provision reversed in the year amounted to €1.2m (2016: €0.5m).
161Coca-Cola HBC 2017 Integrated Annual Report
Strategic R
eport
Co
rporate G
overnance
Financial Statem
entsS
wiss S
tatutory R
eporting
Supplem
entary Inform
ation

17. Trade, other receivables and assets
Accounting policiesTrade receivables are initially recognised at fair value and subsequently measured at amortised cost. A provision for doubtful debts is established when there is objective evidence that the Group will not be able to collect all amounts due, according to the original terms of the trade receivable. Significant financial difficulties of the debtor, probability that the debtor will enter into bankruptcy or financial reorganisation and default or delinquency in payments (over 90 days) are considered indicators that the trade receivable could be uncollectible. The amount of the provision is the difference between the receivable’s carrying amount and the present value of its estimated future cash flows, discounted at the original effective interest rate. The carrying amount of the receivable is reduced by the amount of the provision, which is recognised as part of operating expenses. If a trade receivable ultimately becomes uncollectible, it is written off initially against any provision made in respect of that receivable with any excess recognised as part of operating expenses. Subsequent recoveries of amounts previously written off or provisions no longer required are credited against operating expenses.
Loans are initially recognised at the fair value net of transaction costs incurred.
After initial recognition, all interest-bearing loans are subsequently measured at amortised cost. Amortised cost is calculated using the effective interest rate method whereby any discount, premium or transaction costs associated with a loan are amortised to the income statement over the borrowing period.
Financial assets
The Group classifies its investments in debt and equity securities into the following categories: held-to-maturity and available-for-sale. The classification depends on the purpose for which the investment was acquired. Investments with a fixed maturity that management has the intent and ability to hold to maturity are classified as held-to-maturity and are included in non-current assets, except for those with maturities within 12 months from the balance sheet date, which are classified as current assets. Investments intended to be held for an indefinite period of time, which may be sold in response to need for liquidity or changes in interest rates, are classified as available-for-sale and are classified as non-current assets, unless they are expected to be realised within 12 months of the balance sheet date. Available-for-sale financial assets are carried at fair value. Held-to-maturity investments are carried at amortised cost using the effective interest rate method.
The Group derecognises a financial asset when the contractual rights to the cash flows from the asset expire, or it transfers the rights to receive the contractual cash flows in a transaction in which substantially all of the risks and rewards of ownership of the financial asset are transferred, or it neither transfers nor retains substantially all of the risks and rewards of ownership and does not retain control over the transferred asset. When the Group has neither transferred nor retained substantially all the risks and rewards of the asset, nor transferred control of the asset, the Group continues to recognise the transferred asset to the extent of the Group’s continuing involvement. In that case, the Group also recognises an associated liability. The transferred asset and the associated liability are measured on a basis that reflects the rights and obligations that the Group has retained.
Unrealised gains and losses on available-for-sale financial assets are recognised in other comprehensive income, except for impairment losses and foreign exchange gains and losses on monetary financial assets that are recognised in the income statement, until the financial assets are derecognised, at which time the cumulative gains or losses previously recognised in equity are reclassified to the income statement.
Gains and losses on held-to-maturity investments are recognised in the income statement, when the investments are derecognised or impaired.
162 Coca-Cola HBC 2017 Integrated Annual Report
NOTES TO THE CONSOLIDATED FINANCIAL STATEMENTS CONTINUED

Trade, other receivables and assets consisted of the following as at 31 December:
Current assets Non-current assets
2017€ million
2016€ million
2017€ million
2016€ million
Trade and other receivables: Trade receivables 688.7 727.6 2.0 2.2Receivables from related parties (refer to Note 26) 89.8 117.0 – –Loans to related parties (refer to Note 26) 3.6 5.2 – –Loans receivable 1.2 0.1 0.7 0.4Receivables from sale of property, plant and equipment 2.8 0.5 – –Non-current income tax receivable – – 8.5 8.4VAT and other taxes receivable 30.0 35.5 – –Loans and advances to employees 5.5 5.7 – –Other receivables 72.3 63.2 – –Total trade and other receivables 893.9 954.8 11.2 11.0Other assets: Prepayments 72.9 76.0 14.6 13.2Held-to-maturity investments – – 0.9 0.9Pension plan assets (refer to Note 20) – – 2.0 –Available-for-sale financial assets – – 3.7 3.6Total other assets 72.9 76.0 21.2 17.7Total trade, other receivables and assets 966.8 1,030.8 32.4 28.7
Non-current trade receivables relate to re-negotiated receivables, which are expected to be settled within the new contractual due date.
Current assets classified within the category ‘held-to-maturity’ are recorded as ‘Other financial assets’ in the consolidated balance sheet, refer to Note 23 – ‘Financial instruments categories’.
Trade receivables classified as current assets consisted of the following at 31 December:
2017
€ million2016
€ million
Trade receivables 792.3 819.6Less: Provision for doubtful debts (103.6) (92.0)Total trade receivables 688.7 727.6
Trade receivables classified as current assets, are as follows:
2017
€ million2016
€ million
Within due date 576.8 588.9Less: Provision for doubtful debts within due date (3.4) (2.5)Past due 215.5 230.7Less: Provision for doubtful debts past due (100.2) (89.5)Total trade receivables 688.7 727.6
The carrying amount of the trade receivables include €0.3m which are subject to a factoring agreement (2016: €15.3m). The Group continues to recognise the factored receivables in their entirety as it has retained the significant risks of ownership. The amount payable under the factoring agreement is presented within borrowings (refer to Note 24).
163Coca-Cola HBC 2017 Integrated Annual Report
Strategic R
eport
Co
rporate G
overnance
Financial Statem
entsS
wiss S
tatutory R
eporting
Supplem
entary Inform
ation

17. Trade, other receivables and assets continuedThe ageing analysis of past due trade receivables is as follows:
2017
€ million
Up to three
monthsThree to six
monthsSix to nine
monthsMore than nine
months Total
Trade receivables past due but not impaired 103.8 2.3 2.0 7.2 115.3Trade receivables past due and impaired 4.4 7.5 5.0 83.3 100.2Total trade receivables past due 108.2 9.8 7.0 90.5 215.5
2016
€ million
Up to three
monthsThree to six
monthsSix to nine
monthsMore than nine
months Total
Trade receivables past due but not impaired 114.6 12.6 3.5 10.5 141.2Trade receivables past due and impaired 4.1 7.3 3.4 74.7 89.5Total trade receivables past due 118.7 19.9 6.9 85.2 230.7
The movement in the provision for doubtful debts during the year is as follows:
2017
€ million2016
€ million
As at 1 January (92.0) (78.9)Amounts written off during the year 5.3 7.7Amounts recovered during the year 6.0 2.2Increase in allowance recognised in income statement (23.6) (22.8)Foreign currency translation 0.7 (0.2)As at 31 December (103.6) (92.0)
Receivables from related partiesThe related party receivables, net of the provision for doubtful debts, are as follows:
2017
€ million2016
€ million
Within due date 85.7 114.0Past due 4.4 3.3Less: Provision for doubtful debts (0.3) (0.3)Total related party receivables 89.8 117.0
As at 31 December 2017, related party receivables of €4.1m (2016: €3.0m) were past due but not impaired. The ageing analysis of these receivables is as follows:
2017
€ million2016
€ million
Up to three months 3.3 1.3Three to six months 0.2 0.3Six to nine months 0.1 0.3More than nine months 0.5 1.1Total 4.1 3.0
164 Coca-Cola HBC 2017 Integrated Annual Report
NOTES TO THE CONSOLIDATED FINANCIAL STATEMENTS CONTINUED

18. Assets classified as held for sale
Accounting policyNon-current assets and disposal groups are classified as held for sale if it is considered highly probable that their carrying amount will be principally recovered through a sale transaction rather than through continuing use. This condition is regarded as met only when the sale is highly probable and the asset (or disposal group) is available for immediate sale in its present condition. In order for a sale to be considered highly probable, management must be committed to a plan to sell the asset, an active programme to locate a buyer and complete the plan must have been initiated, and the sale expected to be completed within one year from the date of classification. In the event that the criteria for continued classification as held for sale are no longer met, the assets are reclassified to property, plant and equipment and the depreciation charge is adjusted for the depreciation that would have been recognised had the assets not been classified as held for sale. Non-current assets and disposal groups classified as held for sale are measured at the lower of the individual assets’ previous carrying amount and their fair value less costs to sell.
Changes in carrying amounts of assets classified as held for sale for the years ended 31 December are as follows:
2017
€ million2016
€ million
As at 1 January 11.8 5.5Reclassified from property, plant and equipment (refer to Note 14) 14.2 14.4Other assets classified as held for sale – 14.0Disposals (22.5) (17.1)Reclassified to property, plant and equipment (refer to Note 14) – (4.3)Foreign currency translation (0.2) (0.7)As at 31 December 3.3 11.8
In 2016, it was agreed that 50% of the Group’s share in its subsidiary Neptūno Vandenys, UAB, would be sold to European Refreshments, a subsidiary of TCCC. Accordingly, 50% of the net assets of Neptūno Vandenys, UAB amounting to €14.0m, mainly relating to intangible assets of €16.6m (refer to Note 13), net of the relevant deferred tax liability, were classified as assets held for sale. The transaction was completed in December 2016 (refer to Note 22). Total assets classified as held for sale as at 31 December 2016 amounted to €11.8m comprising property, plant and equipment in our Established, Developing and Emerging markets, measured at the lower of the carrying amount and fair value less costs to sell. The fair value of held for sale assets was determined through the use of a sales comparison approach and is a non-recurring fair value measurement within Level 3 of the fair value hierarchy.
Total assets classified as held for sale as at 31 December 2017 amounted to €3.3m comprising the net book value of property, plant and equipment in our Established, Developing and Emerging markets that have been written down to fair value less cost to sell. The fair value of assets classified as held for sale was determined through the use of a sales comparison approach and is a non-recurring fair value measurement within Level 3 of the fair value hierarchy.
19. Trade and other payables
Accounting policyTrade payables are recognised initially at fair value and subsequently measured at amortised cost using the effective interest rate method.
Trade and other payables consisted of the following at 31 December:
2017
€ million2016
€ million
Trade payables 569.5 536.7Accrued liabilities 428.1 471.2Payables to related parties (refer to Note 26) 300.9 303.4Deposit liabilities 94.0 100.6Other tax and social security liabilities 84.8 98.1Salaries and employee-related payables 41.8 43.6Deferred income 1.0 1.0Other payables 24.3 32.7Total trade and other payables 1,544.4 1,587.3
The amount due to pension funds as at 31 December 2017 was €0.9m (2016: €1.3m).
165Coca-Cola HBC 2017 Integrated Annual Report
Strategic R
eport
Co
rporate G
overnance
Financial Statem
entsS
wiss S
tatutory R
eporting
Supplem
entary Inform
ation

20. Provisions and employee benefitsProvisions and employee benefits consisted of the following at 31 December:
2017
€ million2016
€ million
Current: Employee benefits 61.8 96.0Restructuring provisions 7.7 8.5Other provisions 14.1 14.1Total current provisions and employee benefits 83.6 118.6 Non-current: Employee benefits 118.7 123.0Other provisions 1.5 2.0Total non-current provisions and employee benefits 120.2 125.0Total provisions and employee benefits 203.8 243.6
a) Provisions
Accounting policyProvisions are recognised when: the Group has a present obligation (legal or constructive) as a result of a past event; it is probable that an outflow of resources embodying economic benefits will be required to settle the obligation; and a reliable estimate can be made of the amount of the obligation.
Where the Group expects a provision to be reimbursed, for example under an insurance contract, the reimbursement is recognised as a separate asset only when such reimbursement is virtually certain. If the effect of the time value of money is material, provisions are determined by discounting the expected future cash flows at a pre-tax rate that reflects current market assessments of the time value of money and the risks specific to the liability.
The movements in restructuring and other provisions comprise:
2017
€ million2016
€ million
Restructuring
provisionsOther
provisionsRestructuring
provisionsOther
provisions
As at 1 January 8.5 16.1 15.8 10.1Arising during the year 19.3 5.4 22.7 11.8Utilised during the year (17.3) (4.2) (26.8) (4.3)Unused amount reversed (2.5) (1.6) (2.5) (1.5)Foreign currency translation (0.3) (0.1) (0.7) –As at 31 December 7.7 15.6 8.5 16.1
Other provisions comprise a provision for employee litigation of €3.2m (2016: €4.2m) and other items of €12.4m (2016: €11.9m).
166 Coca-Cola HBC 2017 Integrated Annual Report
NOTES TO THE CONSOLIDATED FINANCIAL STATEMENTS CONTINUED

b) Employee benefits
Accounting policies
Employee benefits
The Group operates a number of defined benefit and defined contribution pension plans in its territories.
The defined benefit plans are made up of both funded and unfunded pension plans and employee leaving indemnities. The assets of funded plans are generally held in separate trustee-administered funds and are financed by payments from employees and/or the relevant Group companies.
The liability recognised in the balance sheet in respect of defined benefit plans is the present value of the defined benefit obligation at the balance sheet date less the fair value of the plan assets.
For defined benefit pension plans, pension costs are assessed using the projected unit credit method. Actuarial gains and losses arising from experience adjustments and changes in actuarial assumptions are charged or credited to equity in other comprehensive income in the period in which they arise. Such actuarial gains and losses are not reclassified to the income statement in subsequent periods. The defined benefit obligations are measured at the present value of the estimated future cash outflows using interest rates of high-quality corporate bonds that are denominated in the currency in which the benefits will be paid, and that have terms approximating to the terms of the related obligation. In countries where there is no deep market in such bonds, the market rates on government bonds are used. Past service cost is recognised immediately in the income statement. A number of the Group’s operations have other long-service benefits in the form of jubilee plans. These plans are measured at the present value of the estimated future cash outflows with immediate recognition of actuarial gains and losses in the income statement.
The Group’s contributions to the defined contribution pension plans are charged to the income statement in the period to which the contributions relate.
Termination benefits
Termination benefits are payable whenever an employee’s employment is terminated before the normal retirement date or whenever an employee accepts voluntary redundancy in exchange for these benefits. The Group recognises termination benefits at the earlier of the following dates: a) when the Group can no longer withdraw the offer of those benefits and b) when the Group recognises costs for a restructuring that is within the scope of IAS 37 Provisions, Contingent Liabilities and Contingent Assets and involves the payment of termination benefits. In the case of an offer made to encourage voluntary redundancy, the termination benefits are measured based on the number of employees expected to accept the offer.
Critical accounting estimatesThe Group provides defined benefit pension plans as an employee benefit in certain territories. Determining the value of these plans requires several actuarial assumptions and estimates about discount rates, future salary increases and future pension increases. Due to the long-term nature of these plans, such estimates are subject to significant uncertainty.
Employee benefits consisted of the following at 31 December:
2017
€ million2016
€ million
Defined benefit plans: Employee leaving indemnities 68.9 76.0Pension plans 27.7 39.8Long service benefits – jubilee plans 7.4 8.4Total defined benefits plans 104.0 124.2Other employee benefits: Annual leave 7.5 7.4Other employee benefits 69.0 87.4Total other employee benefits 76.5 94.8Total employee benefits obligations 180.5 219.0
Other employee benefits are primarily comprised of employee bonuses including a management incentive plan which is a cash variable plan that operates over a three-year period.
167Coca-Cola HBC 2017 Integrated Annual Report
Strategic R
eport
Co
rporate G
overnance
Financial Statem
entsS
wiss S
tatutory R
eporting
Supplem
entary Inform
ation

20. Provisions and employee benefits continuedEmployees of Coca-Cola HBC’s subsidiaries in Austria, Bulgaria, Croatia, Greece, Italy, Montenegro, Nigeria, Poland, Romania, Serbia and Slovenia are entitled to employee leaving indemnities, generally based on each employee’s length of service, employment category and remuneration. These are unfunded plans where the Company meets the payment obligation as it falls due.
Coca-Cola HBC’s subsidiaries in Austria, Greece, Northern Ireland, the Republic of Ireland and Switzerland sponsor defined benefit pension plans. Of the three plans in the Republic of Ireland, two have plan assets, as do the two plans in Northern Ireland, one plan in Greece and two plans in Switzerland. The Austrian plans do not have plan assets and the Company meets the payment obligation as it falls due. The defined benefit plans in Austria, Greece, Republic of Ireland and Northern Ireland are closed to new members.
Coca-Cola HBC provides long-service benefits in the form of jubilee plans to its employees in Austria, Croatia, Nigeria, Poland, Slovenia and Switzerland.
Defined benefit obligation by segment is as follows for the years ended 31 December:
The average duration of the defined benefit obligations is 19 years and the total employer contributions expected to be paid in 2018 are €16.8m.
Reconciliation of defined benefit obligation:
2017
€ million2016
€ million
Present value of defined benefit obligation at 1 January 525.6 496.4Current service cost 8.8 10.5Interest cost 9.0 11.2Plan participants’ contributions 4.4 4.5Past service cost (0.2) (8.8)Curtailment/settlement (6.8) (1.3)Benefits paid (26.5) (25.3)Loss from change in demographic assumptions – 0.4Loss from change in financial assumptions 6.1 56.2Experience adjustments (3.5) 3.2Foreign currency translation (27.3) (21.4)Present value of defined benefit obligation at 31 December 489.6 525.6
Reconciliation of plan assets:
2017
€ million2016
€ million
Fair value of plan assets at 1 January 401.4 380.7Interest income on plan assets 5.3 7.1Return on plan assets excluding interest income 18.9 18.6Actual employer’s contributions 12.9 16.2Actual participants’ contributions 4.4 4.5Actual benefits paid (18.6) (15.4)Settlement (5.7) (1.1)Admin expenses (0.3) (0.3)Foreign currency translation (22.4) (8.9)Fair value of plan assets at 31 December 395.9 401.4
€85.6m
€20.5m
€2.7m
€2.5m
€15.7m
€101.2m
Established Developing Emerging
Total €104.0m
Total €124.2m
2017
2016
168 Coca-Cola HBC 2017 Integrated Annual Report
NOTES TO THE CONSOLIDATED FINANCIAL STATEMENTS CONTINUED

The present value and funded status of defined benefit obligations were as follows at 31 December:
2017
€ million2016
€ million
Present value of funded obligations 411.3 439.1Fair value of plan assets (395.9) (401.4)Defined benefit obligations of funded plans 15.4 37.7Present value of unfunded obligations 78.3 86.5Unrecognised asset due to asset ceiling 8.3 –Defined benefit obligations 102.0 124.2Plus: amounts recognised within non-current assets (refer to Note 17) 2.0 –Total defined benefit obligations 104.0 124.2
Funding levels are monitored in conjunction with the agreed contribution rate. The funding level of the funded plans as at 31 December 2017 was 94% (2016: 91%).
Two of the plans have funded status surplus of €2.0m as at 31 December 2017 (31 December 2016: € nil) that is recognised as an asset on the basis that the Group has an unconditional right to future economic benefits either via a refund or a reduction in future contributions.
The movement in the defined benefit obligation recognised on the balance sheet was as follows:
2017
€ million2016
€ million
Defined benefit obligation as at 1 January 124.2 115.7Expense recognised in the income statement 10.4 5.4Remeasurements recognised in OCI (6.9) 41.7Employer contributions (12.9) (16.2)Benefits paid (7.9) (9.9)Foreign currency translation (4.9) (12.5)Defined benefit obligation as at 31 December 102.0 124.2Plus: amounts recognised within non-current assets (refer to Note 17) 2.0 –Total defined benefit obligation as at 31 December 104.0 124.2
The expense recognised in the income statement comprised the following for the years ended 31 December:
2017
€ million2016
€ million
Service cost 7.5 1.5Net interest cost on defined benefit liability / (asset) 3.7 4.1Actuarial gain (1.1) (0.5)Administrative expenses 0.3 0.3Total 10.4 5.4
Defined benefit plan expense is included in staff costs and presented in cost of goods sold and operating expenses.
The assumptions (weighted average for the Group) used in computing the defined benefit obligation comprised the following for the years ended 31 December:
2017
%2016
%
Discount rate 1.8 1.9Rate of compensation increase 2.7 2.7Rate of pension increase 1.1 1.0Life expectancy for pensioners at the age of 65 in years: Male 22 22Female 24 24
Asset liability matching: Plan assets allocated to growth assets are monitored regularly to ensure they remain appropriate and in line with the Group’s long-term strategy to manage the plans. As the plans mature, the level of investment risk will be reduced by investing more in assets such as bonds that better match the liabilities.
169Coca-Cola HBC 2017 Integrated Annual Report
Strategic R
eport
Co
rporate G
overnance
Financial Statem
entsS
wiss S
tatutory R
eporting
Supplem
entary Inform
ation

20. Provisions and employee benefits continuedPension plan assets are invested in different asset classes in order to maintain a balance between risk and return. Investments are well diversified to limit the financial effect of the failure of any individual investment. Through its defined benefit plans the Group is exposed to a number of risks, as outlined below:
Asset volatility: The liabilities are calculated using a discount rate set with reference to corporate bond yields; if assets underperform this yield, a deficit will be created. The Northern Ireland, the Republic of Ireland and Swiss plans hold a significant proportion of growth assets (equities) which are expected to outperform corporate bonds in the long term while providing volatility and risk in the short term.
Changes in bond yields: A decrease in corporate bond yields will increase the plan liabilities, although this will be partially offset by an increase in the value of the plans’ bond holdings. Whereas an increase in corporate bond yields will decrease the plan liabilities, although this will be partially offset by a decrease in the value of the plans’ bond holdings.
Inflation: The Northern Ireland, the Republic of Ireland and Swiss plans’ benefit obligations are linked to inflation, and higher inflation will lead to higher liabilities (although, in most cases, caps on the level of inflationary increases are in place to protect against extreme inflation). The majority of the assets are either unaffected by or loosely correlated with inflation, meaning that an increase in inflation will also increase the deficit.
Life expectancy: The majority of the pension plans’ obligations are to provide benefits for the life of the member, so increases in life expectancy will result in an increase in the liabilities.
The sensitivity analysis presented below is based on a change in assumption while all other assumptions remain constant.
Impact on defined benefit obligation as at
31 December 2017
Change in
assumptionsIncrease in
assumptionDecrease in assumption
Discount rate 0.50% 8.7% 10.1 %
Rate of compensation increase 0.50% 2.2% 2.0 %
Rate of pension increase 0.50% 4.6% 2.6 %
Life expectancy 1 year 2.7% 2.6 %
Plan assets are invested as follows:
The assets of funded plans are generally held in separately administered trusts, either as specific assets or as a proportion of a general fund, or are insurance contracts. Plan assets held in trust are governed by local regulations and practice in each country. The category ‘other’ mainly includes investments in funds holding a portfolio of assets. Plan assets relate predominantly to quoted financial instruments.
Equity securities were not invested in ordinary shares of the Company as at 31 December 2017 or 31 December 2016.
Defined contribution plansThe expense recognised in the income statement in 2017 for the defined contribution plan is €16.9m (2016: €19.0m). This is included in employee costs and recorded in cost of goods sold and operating expenses.
Assets category 2017 (%) Assets category 2016 (%)
Equity securities – Eurozone: 6%Equity securities – Non-Eurozone: 28%Government bonds – Eurozone: 21%Corporate bonds – Eurozone: 6%Corporate bonds – Non-Eurozone: 16%Real estate: 11%Cash: 3%Other: 9%
Equity securities – Eurozone: 4%Equity securities – Non-Eurozone: 22%Government bonds – Eurozone: 19%Corporate bonds – Eurozone: 7%Corporate bonds – Non-Eurozone: 20%Real estate: 10%Cash: 3%Other: 15%
170 Coca-Cola HBC 2017 Integrated Annual Report
NOTES TO THE CONSOLIDATED FINANCIAL STATEMENTS CONTINUED

21. Offsetting financial assets and financial liabilities
Accounting policyThe Group offsets financial assets and financial liabilities to the net amount reported in the balance sheet when it currently has a legally enforceable right to offset the recognised amounts and it intends to settle on a net basis or to realise the asset and settle the liability simultaneously. The legally enforceable right must not be contingent on future events and must be enforceable in the normal course of business and in the event of default, insolvency or bankruptcy of the company or the counterparty.
The Group enters into derivative transactions under International Swaps and Derivatives Association (ISDA) master netting agreements or other similar agreements. In general, under such agreements the counterparties can elect to settle into one single net amount the aggregated amounts owed by each counterparty on a single day with respect of all outstanding transactions of the same currency and the same type of derivative. In the event of default or early termination all outstanding transactions under the agreement are terminated and subject to any set-off. These agreements do not meet all of the IAS 32 criteria for offsetting in the balance sheet as the Group does not have any current legally enforceable right to offset amounts since the right can only be applied if elected by both counterparties.
The financial assets and financial liabilities presented below are subject to offsetting, enforceable master netting or similar agreements. The column ‘Net amount’ shows the impact on the Group’s balance sheet if all set-off rights were exercised.
a) Financial assetsAs at 31 December 2017
Related amounts not set
off in the balance sheet
Gross amounts of recognised financial
assets€ million
Gross amounts of recognised financial
liabilities set off in the balance sheet
€ million
Net amounts of financial assets presented in the
balance sheet€ million
Financialinstruments
€ millionNet amount
€ million
Derivative financial assets 16.4 – 16.4 (5.0) 11.4Cash and cash equivalents 723.5 – 723.5 – 723.5Other financial assets 150.9 – 150.9 – 150.9Trade receivables 757.2 (68.5) 688.7 – 688.7Total 1,648.0 (68.5) 1,579.5 (5.0) 1,574.5
As at 31 December 2016
Related amounts not set
off in the balance sheet
Gross amounts of recognised financial
assets€ million
Gross amounts of recognised financial
liabilities set off in the balance sheet
€ million
Net amounts of financial assets presented in the
balance sheet€ million
Financialinstruments
€ millionNet amount
€ million
Derivative financial assets 16.0 – 16.0 (8.3) 7.7Cash and cash equivalents 573.2 – 573.2 – 573.2Trade receivables 780.7 (53.1) 727.6 – 727.6Total 1,369.9 (53.1) 1,316.8 (8.3) 1,308.5
b) Financial liabilitiesAs at 31 December 2017
Related amounts not set
off in the balance sheet
Gross amounts of recognised financial
liabilities€ million
Gross amounts of recognised financial assets set off in the
balance sheet€ million
Net amounts of financial liabilities presented in
the balance sheet€ million
Financialinstruments
€ millionNet amount
€ million
Derivative financial liabilities 5.4 – 5.4 (5.0) 0.4Trade payables 638.0 (68.5) 569.5 – 569.5Total 643.4 (68.5) 574.9 (5.0) 569.9
171Coca-Cola HBC 2017 Integrated Annual Report
Strategic R
eport
Co
rporate G
overnance
Financial Statem
entsS
wiss S
tatutory R
eporting
Supplem
entary Inform
ation

21. Offsetting financial assets and financial liabilities continuedAs at 31 December 2016
Related amounts not set
off in the balance sheet
Gross amounts of recognised financial
liabilities€ million
Gross amounts of recognised financial assets set off in the
balance sheet€ million
Net amounts of financial liabilities presented in the
balance sheet€ million
Financialinstruments
€ millionNet amount
€ million
Derivative financial liabilities 15.5 – 15.5 (8.3) 7.2Trade payables 589.8 (53.1) 536.7 – 536.7Total 605.3 (53.1) 552.2 (8.3) 543.9
22. Business combinations
Accounting policyThe acquisition method of accounting is used to account for business combinations. The consideration transferred is the fair value of any asset transferred, shares issued and liabilities assumed. The consideration transferred includes the fair value of any asset or liability resulting from a contingent consideration arrangement. Identifiable assets acquired and liabilities and contingent liabilities assumed are measured initially at their fair values at the acquisition date. The excess of the consideration transferred and the fair value of non-controlling interest over the net assets acquired and liabilities assumed is recorded as goodwill. All acquisition-related costs are expensed as incurred.
For each business combination, the Group elects whether it measures the non-controlling interest in the acquiree either at fair value or at the proportionate share of the acquiree’s identifiable net assets.
Acquisition of controlling interestOn 1 April 2016, the Group acquired 100% of Neptūno Vandenys, UAB, the leading bottled water company in Lithuania, for a consideration of €19.5m, including the assumption of debt of €1.0m. The acquisition includes the mineral water brand ‘Neptūnas’ and is expected to increase the Group’s market share in the still drinks category in Lithuania. Details of the acquisition are as follows:
Acquiree’s carrying amount before
acquisition€ million
Fair value adjustments
€ millionFair value
€ million
Trademark – 7.8 7.8Water rights – 8.8 8.8Property, plant and equipment 2.4 0.4 2.8Inventories 0.1 – 0.1Other current assets 1.1 – 1.1Short-term borrowings (1.0) – (1.0)Other current liabilities (0.7) – (0.7)Deferred tax liabilities – (2.6) (2.6)Net identifiable assets acquired 1.9 14.4 16.3Goodwill arising on acquisition 3.2Cash paid to former shareholders 19.5
The acquisition resulted in the Group recording €3.2m of goodwill, €7.8m of trademark and €8.8m of water rights in its Developing markets segment. The goodwill arising from the acquisition of Neptūno Vandenys, UAB is attributed to expected future cash flows (including the effect of synergies) in excess of the value of net identifiable assets.
The acquired business contributed net sales revenue of €3.8m and net profit of €1.4m to the Group for the period from 1 April 2016 to 31 December 2016. If the acquisition had occurred on 1 January 2016, consolidated Group revenue and consolidated Group profit after tax for year ended 31 December 2016 would have been higher by €1.0m and €0.5m respectively.
172 Coca-Cola HBC 2017 Integrated Annual Report
NOTES TO THE CONSOLIDATED FINANCIAL STATEMENTS CONTINUED

In December 2016, TCCC acquired 50% of the share capital of Neptūno Vandenys, UAB for a total consideration of €10.3m, of which €9.8m was received in 2016 and the remaining in 2017 and is included in line ‘Net receipts from equity investments’ in the consolidated cash flow statement. This transaction resulted in a joint venture between the Group and TCCC. The gain on the transaction was immaterial.
During 2017, following the successful completion of the reorganisation of Neptūno Vandenys, UAB joint venture with TCCC, the Group obtained control over net assets of the joint venture amounting to €3.5m, with a corresponding decrease in the carrying amount of the investment in the joint venture (refer to Note 15a).
23. Financial risk management and financial instruments
Accounting policies
Derivative financial instruments
The Group uses derivative financial instruments, including currency, commodity and interest rate derivatives, to manage currency, commodity price and interest rate risk associated with the Group’s underlying business activities. The Group does not enter into derivative financial instruments for trading activity purposes.
All derivative financial instruments are initially recognised on the balance sheet at fair value and are subsequently remeasured at their fair value. Changes in the fair value of derivative financial instruments are recognised at each reporting date either in the income statement or in equity, depending on whether the derivative financial instrument qualifies for hedge accounting, and if so, whether it qualifies as a fair value hedge or a cash flow hedge.
Derivatives embedded in host contracts are accounted for as separate derivatives and recorded at fair value if:
a) their economic characteristics and risks are not closely related to those of the host contracts;
b) the host contracts are not designated as at fair value through profit or loss, and
c) a separate instrument with the same terms as the embedded derivative meets the definition of a derivative.
These embedded derivatives are measured at fair value with changes in fair value recognised in profit or loss. Reassessment only occurs if there is either a change in the terms of the contract that significantly modifies the cash flows that would otherwise be required or a reclassification of a financial asset out of the fair value through profit or loss.
All derivative financial instruments that are not part of an effective hedging relationship (undesignated hedges) are classified as assets or liabilities at fair value through profit or loss (‘FVTPL’).
At the inception of a hedge transaction the Group documents the relationship between the hedging instrument and the hedged item, as well as its risk management objective and strategy for undertaking the hedge transaction. This process includes linking the derivative financial instrument designated as a hedging instrument to the specific asset, liability, firm commitment or forecast transaction. Both at the hedge inception and on an ongoing basis, the Group assesses and documents whether the derivative financial instrument used in the hedging transaction is highly effective in offsetting changes in fair value or cash flow of the hedged item.
Changes in the fair values of derivative financial instruments that are designated and qualify as fair value hedges and are effective, are recorded in the income statement, together with the changes in the fair values of the hedged items that relate to the hedged risks. Changes in the fair value of derivative financial instruments that are designated and effective as hedges of future cash flows are recognised directly in other comprehensive income and the ineffective portion is recognised immediately in the income statement. Amounts accumulated in equity are recycled to the income statement as the related asset acquired or liability assumed affects the income statement. Changes in the fair values of derivative financial instruments that do not qualify for hedge accounting are recognised in the income statement as they arise.
Hedge accounting is discontinued when the hedging instrument expires or is sold, terminated, exercised, or no longer qualifies for hedge accounting. At that time, any cumulative gain or loss on the hedging instrument recognised in equity is retained in equity until the forecast transaction occurs. If a hedged transaction is no longer expected to occur, the net cumulative gain or loss recognised in equity is transferred to the income statement.
Regular purchases and sales of investments are recognised on the trade date, which is the day the Group commits to purchase or sell. The investments are recognised initially at fair value plus transaction costs, except in the case of FVTPL. For investments traded in active markets, fair value is determined by reference to stock exchange quoted bid prices. For other investments, fair value is estimated by reference to the current market value of similar instruments or by reference to the discounted cash flows of the underlying net assets.
173Coca-Cola HBC 2017 Integrated Annual Report
Strategic R
eport
Co
rporate G
overnance
Financial Statem
entsS
wiss S
tatutory R
eporting
Supplem
entary Inform
ation

23. Financial risk management and financial instruments continued
Financial risk factorsThe Group’s activities expose it to a variety of financial risks: market risk (including foreign currency risk, commodity price risk, interest rate risk), credit risk, liquidity risk and capital risk. The Group’s overall risk management programme focuses on the volatility of financial markets and seeks to minimise potential adverse effects on the Group’s cash flows. The Group uses derivative financial instruments to hedge certain risk exposures. Risk management is carried out by Group Treasury in a controlled manner, consistent with the Board of Directors’ approved policies. Group Treasury identifies, evaluates and hedges financial risks in close co-operation with the Group’s subsidiaries. The Board of Directors has approved the Treasury Policy which provides the control framework for all treasury and treasury-related transactions.
Market risk
a) Foreign currency riskThe Group is exposed to the effect of foreign currency risk on future transactions, recognised monetary assets and liabilities that are denominated in currencies other than the local entity’s functional currency, as well as net investments in foreign operations. Foreign currency forward, option and future contracts are used to hedge a portion of the Group’s foreign currency risk. The majority of the foreign currency forward, option and future contracts have maturities of less than one year after the balance sheet date. The foreign currency risk arising from the investment in foreign operations is not hedged.
Management has set up a policy that requires Group companies to manage their foreign exchange risk against their functional currency. To manage their foreign exchange risk arising from future transactions and recognised monetary assets and liabilities, entities in the Group use foreign currency forward, option and future contracts transacted by Group Treasury. Group Treasury’s risk management policy is to hedge, on an average coverage ratio basis, between 25% and 80% of anticipated cash flows for the next 12 months by using a layer strategy and 100% of balance sheet re-measurement risk in each major foreign currency for which hedging is applicable. Each subsidiary designates contracts with Group Treasury as fair value hedges or cash flow hedges, as appropriate. External foreign exchange contracts are designated at Group level as hedges of foreign exchange risk on specific monetary assets, monetary liabilities or future transactions on a gross basis.
The following tables present details of the Group’s sensitivity to reasonably possible increases and decreases in the Euro and US dollar against the relevant foreign currencies. In determining reasonable possible changes, the historical volatility over a 12-month period of the respective foreign currencies in relation to the Euro and the US dollar has been considered. The sensitivity analysis determines the potential gains and losses in the income statement or equity arising from the Group’s foreign exchange positions as a result of the corresponding percentage increases and decreases in the Group’s main foreign currencies relative to the Euro and the US dollar. The sensitivity analysis includes outstanding foreign currency denominated monetary items, external loans, and loans between operations within the Group where the denomination of the loan is in a currency other than the functional currency of the local entity.
2017 exchange risk sensitivity to reasonably possible changes in the Euro against relevant other currencies Euro strengthens againstlocal currency Euro weakens against local currency
% historicalvolatility over a
12-month period
Loss/(gain) in income statement
€ million
(Gain)/lossin equity€ million
(Gain)/loss in incomestatement
€ million
Loss/(gain)in equity€ million
Armenian dram 7.26% (0.5) – 0.6 –Bulgarian lev 0.59% (0.1) – 0.1 –Croatian kuna 1.95% 0.1 (0.1) (0.1) 0.1Czech koruna 3.46% (1.1) (0.3) 1.2 0.3Hungarian forint 3.54% 0.4 (0.3) (0.4) 0.3FYROM dinar 4.06% – – 0.1 –Moldovan leu 7.76% (0.2) 0.6 0.2 (0.7)Nigerian naira 22.76% 4.4 – (6.9) –Polish zloty 4.56% (0.2) (1.9) 0.2 2.1Romanian leu 2.83% 0.4 (1.2) – 0.4Russian rouble 12.10% 0.6 (3.3) 2.0 0.7Serbian dinar 2.24% 0.1 – – –Swiss franc 4.89% 0.6 (1.1) (0.6) 1.2UK sterling 8.17% 0.2 0.2 (0.2) (0.2)Ukrainian hryvnia 10.25% 1.0 – (1.3) –US dollar 7.34% (0.5) 0.3 0.6 (0.3) 5.2 (7.1) (4.5) 3.9
174 Coca-Cola HBC 2017 Integrated Annual Report
NOTES TO THE CONSOLIDATED FINANCIAL STATEMENTS CONTINUED

2017 exchange risk sensitivity to reasonably possible changes in the US dollar against relevant other currencies US dollar strengthens against local currency US dollar weakens against local currency
% historicalvolatility over a
12-month period
Loss/(gain) in incomestatement
€ million
(Gain)/lossin equity€ million
Loss/(Gain) in incomestatement
€ million
Loss/(gain)in equity€ million
Bulgarian lev 7.28% 0.1 – (0.1) –Euro 7.34% 1.6 – (1.8) –Hungarian forint 8.74% 0.1 – (0.1) –Nigerian naira 21.07% (1.7) – 2.0 –Romanian leu 7.65% 0.2 – (0.3) –Russian rouble 11.04% 2.7 (9.7) 1.1 5.1Serbian dinar 7.49% (0.1) – 0.1 –Ukrainian hryvnia 6.68% 0.1 – (0.1) – 3.0 (9.7) 0.8 5.1
2016 exchange risk sensitivity sensitivity to reasonably possible changes in the Euro against relevant other currencies Euro strengthens against local currency Euro weakens against local currency
% historicalvolatility over a
12-month period
Loss/(gain) in incomestatement
€ million
(Gain)/lossin equity€ million
(Gain)/loss in incomestatement
€ million
Loss/(gain)in equity€ million
Armenian dram 8.94% (0.3) – 0.3 –Belarusian rouble 14.59% (1.0) – 1.4 –Bulgarian lev 0.70% (0.2) – 0.2 –Croatian kuna 1.63% – (0.1) – 0.2Czech koruna 0.69% (0.1) – 0.1 –Hungarian forint 4.91% 0.2 (0.5) (0.3) 0.5Moldovan leu 9.90% – 0.7 – (0.9)Nigerian naira 43.27% 11.1 – (28.0) –Polish zloty 7.29% 0.1 (1.8) (0.1) 2.1Romanian leu 2.58% 0.1 (0.5) (0.1) 0.6Russian rouble 20.12% (2.2) (4.0) 3.2 6.5Serbian dinar 2.73% 0.2 – (0.3) –Swiss franc 4.47% 0.3 (1.5) (0.3) 1.6UK sterling 11.91% 1.2 0.4 (1.5) (0.5)Ukrainian hryvnia 14.84% 1.3 – (1.7) –US dollar 8.29% (0.5) 0.2 0.6 (0.2) 10.2 (7.1) (26.5) 9.9
2016 exchange risk sensitivity to reasonably possible changes in the US dollar against relevant other currencies US dollar strengthens against local currency US dollar weakens against local currency
% of historicalvolatility over a
12-month period
Loss/(gain) in incomestatement
€ million
(Gain)/lossin equity€ million
(Gain)/loss in incomestatement
€ million
Loss/(gain)in equity€ million
Euro 8.29% 1.8 – (2.1) –Hungarian forint 9.79% 0.1 – (0.2) –Nigerian naira 38.95% (1.9) – 1.0 –Russian rouble 19.53% (0.1) (9.3) (0.6) 15.4Serbian dinar 8.46% 0.1 – (0.1) –Ukrainian hryvnia 11.80% 0.4 – (0.5) – 0.4 (9.3) (2.5) 15.4
175Coca-Cola HBC 2017 Integrated Annual Report
Strategic R
eport
Co
rporate G
overnance
Financial Statem
entsS
wiss S
tatutory R
eporting
Supplem
entary Inform
ation

23. Financial risk management and financial instruments continued
b) Commodity price riskThe Group is affected by the volatility of certain commodity prices (being mainly sugar, aluminium, aluminium premium, PET and gas oil) in relation to certain raw materials necessary for the production of the Group’s products.
Due to the significantly increased volatility of commodity prices, the Group’s Board of Directors has developed and enacted a risk management strategy regarding commodity price risk and its mitigation. Although the Group continues to contract prices with suppliers in advance, to reduce its exposure to the effect of short-term changes in the price of sugar, aluminium, aluminium premium, gas oil and PET the Group hedges the market price of sugar, aluminium, aluminium premium and gas oil using commodity swap contracts based on a rolling 36-month forecast. The Group Treasury’s Risk management policy is to hedge a minimum of 25% and a maximum of 80% of commodity exposure for the next 12 months except for PET where no minimum coverage is required and the maximum is at 50% for the first year.
The following table presents details of the Group’s income statement and equity sensitivity to increases and decreases in sugar, aluminium, aluminium premium and gas oil prices. The table does not show the sensitivity to the Group’s total underlying commodity exposure or the impact of changes in volumes that may arise from increase or decrease in the respective commodity prices. The sensitivity analysis determines the potential effect on profit or loss and equity arising from the Group’s commodity swap contract positions as a result of the reasonably possible increases or decreases of the respective commodity price.
2017 commodity price risk sensitivity to reasonably possible changes in the commodity price of relevant commodities
Commodity price increases withall other variables held constant
Commodity price decreases withall other variables held constant
% historicalvolatility over a
12-month period per contract maturity
(Gain)/lossin income
statement€ million
(Gain)/lossin equity€ million
Loss/(gain)in income
statement€ million
Loss/(gain)in equity€ million
Sugar 19.3% (8.8) – 8.8 –Aluminium 15.4% (5.2) (1.1) 5.2 1.1Aluminium Premium 18.0% (0.3) – 0.3 –Gas oil 22.7% (2.2) – 2.2 – (16.5) (1.1) 16.5 1.1
2016 commodity price risk sensitivity to reasonably possible changes in the commodity price of relevant commodities
Commodity price increases withall other variables held constant
Commodity price decreases withall other variables held constant
% historicalvolatility over a
12-month period per contract maturity
(Gain)/lossin income
statement€ million
(Gain)/lossin equity€ million
Loss/(gain)in income
statement€ million
Loss/(gain)in equity€ million
Sugar 19.2% (12.4) – 12.4 –Aluminium 16.4% (6.7) (1.1) 6.7 1.1Aluminium Premium 19.2% (0.4) – 0.4 –Gas oil 41.0% (6.5) – 6.5 – (26.0) (1.1) 26.0 1.1
c) Interest rate riskThe sensitivity analysis in the following table has been determined based on exposure to interest rates of both derivative and non-derivative instruments existing at the balance sheet date and assuming constant foreign exchange rates. For floating rate liabilities, the analysis is prepared assuming the amount of liability outstanding at the balance sheet date was outstanding for the whole year. A 50 basis point increase or decrease for 2017 (2016:50 basis point) represents management’s assessment of a reasonably possible change in interest rates.
Interest rate risk sensitivity to reasonably possible changes in interest rates
2017
€ million2016
€ million
Loss/(gain)in income
statement(Gain)/loss
In equity
Loss/(gain)in income
statement(Gain)/loss
In equity
Increase in basis points 0.1 – – –Decrease in basis points (0.1) – – –
176 Coca-Cola HBC 2017 Integrated Annual Report
NOTES TO THE CONSOLIDATED FINANCIAL STATEMENTS CONTINUED

Credit riskCredit risk is the risk of financial loss to the Group if a customer or counterparty to a financial instrument fails to meet its obligations under the contract or arrangement. The Group has limited concentration of credit risk across trade and financial counterparties. Credit policies are in place and the exposure to credit risk is monitored on an ongoing basis.
The Group’s maximum exposure to credit risk in the event that counterparties fail to perform their obligations at 31 December 2017 in relation to each class of recognised financial asset is the carrying amount of those assets as indicated on the balance sheet.
Under the credit policies, before accepting any new credit customers, the Group investigates the potential customer’s credit quality, using either external agencies and in some cases bank references and/or historic experience, and defines credit limits for each customer. Customers that fail to meet the Group’s benchmark credit quality may transact with the Group only on a prepayment or cash basis. Customers are reviewed on an ongoing basis and credit limits are adjusted accordingly. There is no significant concentration of credit risk with regards to loans, trade and other receivables as the Group has a large number of customers which are internationally dispersed.
The Group has policies that limit the amount of credit exposure to any single financial institution. The Group only undertakes investment and derivative transactions with banks and financial institutions that have a minimum credit rating of ‘BBB-’ from Standard & Poor’s and ‘Baa3’ from Moody’s. The Group also uses Credit Default Swaps of a counterparty in order to measure in a timelier way the creditworthiness of a counterparty and set up its counterparties in tiers in order to assign maximum exposure and tenor per tier. If the Credit Default Swaps of certain counterparty exceed 400 basis points the Group will stop trading derivatives with that counterparty and will try to cancel any deposits on a best-effort basis. In addition, the Group regularly makes use of time deposits to invest excess cash balances and to diversify its counterparty risk. As at 31 December 2017, an amount of €476.8m (2016: € 243.5m) is invested in time deposits (refer to Note 24).
Liquidity risk The Group actively manages liquidity risk to ensure there are sufficient funds available for any short-term and long-term commitments. Bank overdrafts and bank facilities, both committed and uncommitted, are used to manage this risk.
The Group manages liquidity risk by maintaining adequate cash reserves and committed banking facilities, access to the debt and equity capital markets, and by continuously monitoring forecasted and actual cash flows. In Note 24, the undrawn facilities that the Group has at its disposal to manage liquidity risk are discussed under the headings ‘commercial paper programme’ and ‘committed credit facilities’.
The following tables detail the Group’s remaining contractual maturities for its financial liabilities. The tables include both interest and principal undiscounted cash flows, assuming that interest rates remain constant from 31 December 2017.
Up toone year€ million
One totwo years
€ million
Two tofive years
€ million
Overfive years
€ million
Borrowings 203.3 41.6 887.7 668.6Derivative liabilities 4.5 0.9 – –Trade and other payables 1,458.8 0.2 1.0 5.3As at 31 December 2017 1,666.6 42.7 888.7 673.9
Up toone year€ million
One totwo years
€ million
Two tofive years
€ million
Overfive years
€ million
Borrowings 193.4 43.7 903.6 691.9Derivative liabilities 14.2 1.0 0.3 –Trade and other payables 1,488.2 1.3 0.2 6.7As at 31 December 2016 1,695.8 46.0 904.1 698.6
177Coca-Cola HBC 2017 Integrated Annual Report
Strategic R
eport
Co
rporate G
overnance
Financial Statem
entsS
wiss S
tatutory R
eporting
Supplem
entary Inform
ation

23. Financial risk management and financial instruments continued
Capital risk
The Group monitors its financial capacity and credit ratings by reference to a number of key financial ratios including net debt to comparable adjusted EBITDA, which provides a framework within which the Group's capital base is managed. This ratio is calculated as net debt divided by comparable adjusted EBITDA.
Adjusted EBITDA is calculated by adding back to operating profit the depreciation and impairment of property, plant and equipment, the amortisation and impairment of intangible assets, the employee share option and performance share costs and other non-cash items, if any. Comparable adjusted EBITDA refers to adjusted EBITDA excluding restructuring expenses and the unrealised gains or losses resulting from the mark-to-market valuation of derivatives and embedded derivatives related to commodity hedging.
Refer to Note 24 for definition of net debt.
The Group’s objectives when managing capital are to safeguard the Group’s ability to continue as a going concern and to maintain an optimal capital structure to reduce the cost of capital.
In order to maintain or adjust the capital structure, the Group may increase or decrease debt, issue or buy back shares, adjust the amount of dividends paid to shareholders, or return capital to shareholders.
The Group’s goal is to maintain a conservative financial profile. This is evidenced by the credit ratings maintained with Standard & Poor’s and Moody’s. In April 2017, Standard & Poor’s affirmed Coca-Cola HBC’s ‘BBB+’ long-term, ‘A2’ short-term corporate credit ratings and positive outlook. The corporate credit ratings by Moody’s remained unchanged, ‘Baa1’ long-term, ‘P2’ short-term and stable outlook after the latest assessment in October 2017.
The Group’s medium-to long-term target is to maintain the net debt to comparable adjusted EBITDA ratio within a 1.5 to 2.0 range.
The ratios as at 31 December were as follows:
2017
€ million2016
€ million
Net debt (refer to Note 24) 751.8 1,051.4Operating profit 589.8 506.3Depreciation and impairment of property, plant and equipment 316.8 332.4Amortisation of intangible assets 0.4 0.4Employee share options and performance shares 20.8 8.1Other non-cash items included in operating income (0.3) (1.3)Adjusted EBITDA 927.5 845.9Restructuring expenses 19.5 19.9Unrealised commodity derivatives 2.3 (26.5)Total comparable adjusted EBITDA 949.3 839.3Net debt / comparable adjusted EBITDA ratio 0.79 1.25
Hedging activity
a) Cash flow hedges
The fair values of derivative financial instruments as at 31 December designated as cash flow hedges were:
Contracts with positive fair values Contracts with negative fair values
2017
€ million2016
€ million2017
€ million2016
€ million
Foreign currency forward contracts 0.7 1.0 (1.6) (4.0)Foreign currency option contracts 2.3 0.3 – –Commodity swap contracts 0.6 0.4 – (0.1)Total contracts 3.6 1.7 (1.6) (4.1)
Cash flows from the Group’s foreign currency cash flow hedges at 31 December 2017 are expected to occur and, accordingly, affect profit or loss in 2018; cash flows from the Group’s commodity swap contracts, are expected to occur and affect profit or loss between 2018 and 2020.The net amount reclassified from other comprehensive income to the income statement for the year amounted to a €6.3m loss
178 Coca-Cola HBC 2017 Integrated Annual Report
NOTES TO THE CONSOLIDATED FINANCIAL STATEMENTS CONTINUED

(2016: €12.8m loss), out of which €6.4m loss was recorded in interest expense (2016: €5.2m loss) and €0.1m gain was recorded in cost of goods sold (2016: €7.6m loss).
b) Fair value hedges
As at 31 December 2017, the fair values of derivative financial instruments were €nil (2016: €1.7m liability). The fair value net loss of the foreign currency forward and option contracts used as fair value hedging instruments was €0.5 loss in 2017 (2016: €4.2m net loss).
c) Undesignated hedges
The fair values of derivative financial instruments as at 31 December which economically hedge Group’s risks and for which hedge accounting has not been applied, were:
Contracts with positive fair values Contracts with negative fair values
2017
€ million2016
€ million2017
€ million2016
€ million
Foreign currency forward contracts 0.9 1.5 (1.6) (4.6)Foreign currency option contracts 0.9 – – –Foreign currency future contracts 1.2 0.3 – –Embedded derivatives 2.6 3.3 – –Commodity swap contracts 7.2 9.2 (2.2) (5.1)Total contracts 12.8 14.3 (3.8) (9.7)
The net gains on foreign currency and commodity derivative contracts at fair value through profit and loss (for which hedge accounting was not applied) amounted to a €1.7m gain (2016: €59.1m gain) of which a €4.6m loss was recorded in cost of goods sold (2016: €17.4m gain) and a €6.3m gain in operating expenses (2016: €41.7m gain).
Derivative financial instrumentsThe derivative financial instruments are included in the Group’s balance sheet as follows:
Assets Liabilities
2017
€ million2016
€ million2017
€ million2016
€ million
Current Foreign currency forward contracts 1.6 2.5 (3.2) (10.3)Foreign currency option contracts 3.2 0.3 – –Foreign currency future contracts 1.2 0.3 – –Commodity swap contracts 6.0 4.8 (1.3) (3.9)Total current 12.0 7.9 (4.5) (14.2)Non-current Commodity swap contracts 1.8 4.8 (0.9) (1.3)Embedded derivatives 2.6 3.3 – –Total non-current 4.4 8.1 (0.9) (1.3)
179Coca-Cola HBC 2017 Integrated Annual Report
Strategic R
eport
Co
rporate G
overnance
Financial Statem
entsS
wiss S
tatutory R
eporting
Supplem
entary Inform
ation

23. Financial risk management and financial instruments continued
Financial instruments categoriesCategories of financial instruments as at 31 December were as follows (in € million):
2017 Analysis of total assets
AssetsLoans and
receivablesAssets at
FVTPL
Derivatives designated as hedging
instrumentsHeld-to-maturity
Available-for-sale
Total current and
non-current Current Non-current
Investments – – – 151.8 3.7 155.5 150.9 4.6Derivative financial instruments – 12.8 3.6 – – 16.4 12.0 4.4Trade and other receivables excluding prepayments 896.6 – – – – 896.6 893.9 2.7Cash and cash equivalents 723.5 – – – – 723.5 723.5 –Total 1,620.1 12.8 3.6 151.8 3.7 1,792.0 1,780.3 11.7
Analysis of total liabilities
Liabilities
Liabilities held at
amortised cost
Liabilities at FVTPL
Derivatives designated as hedging
instruments
Total current and
non-current Current Non-current
Trade and other payables excluding provisions and deferred income 1,465.3 – – 1,465.3 1,458.6 6.7Borrowings 1,626.2 – – 1,626.2 166.4 1,459.8Derivative financial instruments – 3.8 1.6 5.4 4.5 0.9Total 3,091.5 3.8 1.6 3,096.9 1,629.5 1,467.4
2016 Analysis of total assets
AssetsLoans and
receivablesAssets at
FVTPL
Derivatives designated as hedging
instrumentsHeld-to-maturity
Available-for-sale
Total current and
non-current Current Non-current
Investments – – – 0.9 3.6 4.5 – 4.5Derivative financial instruments – 14.3 1.7 – – 16.0 7.9 8.1Trade and other receivables excluding prepayments 957.4 – – – – 957.4 954.8 2.6Cash and cash equivalents 573.2 – – – – 573.2 573.2 –Total 1,530.6 14.3 1.7 0.9 3.6 1,551.1 1,535.9 15.2
Analysis of total liabilities
Liabilities
Liabilities held at amortised
costLiabilities at FVTPL
Derivatives designated as hedging
instruments
Total current and
non-current Current Non-current
Trade and other payables excluding provisions and deferred income 1,496.4 – – 1,496.4 1,488.2 8.2Borrowings 1,624.6 – – 1,624.6 156.5 1,468.1Derivative financial instruments – 9.7 5.8 15.5 14.2 1.3Total 3,121.0 9.7 5.8 3,136.5 1,658.9 1,477.6
Foreign currency derivatives
The net notional principal amounts of the outstanding foreign currency forward contracts at 31 December 2017 totalled €190.5m (2016: €289.9m). The net notional principal amounts of the outstanding foreign currency option contracts at 31 December 2017 totalled €91.2m (2016: €13.8m). The net notional principal amounts of the outstanding foreign currency future contracts at 31 December 2017 totalled €5.6m (2016: €7.6m).
180 Coca-Cola HBC 2017 Integrated Annual Report
NOTES TO THE CONSOLIDATED FINANCIAL STATEMENTS CONTINUED

Commodity swap contracts
The notional principal amounts of the outstanding commodity swap contracts at 31 December 2017 totalled €92.6m (2016: €125.2m).
Forward starting swap contracts
The Group entered into forward starting swap contracts of €500.0m in 2014 to hedge the interest rate risk related to its Euro denominated forecasted issuance of fixed rate debt in March 2016. In August 2015 the Group entered into additional forward starting swap contracts of €100.0m. In March 2016 the forward starting swap contracts were settled and at the same time the new note was issued, the accumulated loss of €55.4m recorded in other comprehensive income is being amortised to the income statement over the term of the new note (refer to Note 24).
Embedded derivatives
During 2015 the Group recognised embedded derivatives whose risks and economic characteristics were not considered to be closely related to the commodity contract in which they were embedded. The fair value of the embedded derivatives as at 31 December 2017 amounted to a financial asset of €2.6m (2016: €3.3m).
Fair values of financial assets and liabilitiesFor financial instruments such as cash, deposits, debtors and creditors, investments, loans payable to related parties, short-term borrowings (excluding the current portion of bonds and notes payable) and other financial liabilities (other than bonds and notes payable), carrying values are a reasonable approximation of their fair values. According to the fair value hierarchy, the financial instruments measured at fair value are classified as follows:
Level 1The fair value of available-for-sale listed equity securities is based on quoted market prices at the reported date. The fair value of bonds is based on quoted market prices at the recorded date.
Level 2The fair value of foreign currency forward, option and future contracts, commodity swap contracts, bonds and notes payable, interest rate swap contracts, forward starting swap contracts, embedded foreign currency derivatives and cross currency swap contracts is determined by using valuation techniques. These valuation techniques maximise the use of observable market data. The fair value of the foreign currency forward, option and future contracts, commodity swap contracts, embedded foreign currency derivatives and cross currency swap contracts is calculated by reference to quoted forward exchange, deposit rates and forward rate curve of the underlying commodity at the reported date for contracts with similar maturity dates. The fair value of interest rate option contracts is calculated by reference to the Black-Scholes valuation model and implied volatilities. The fair value of interest rate swap contracts is determined as the difference in the present value of the future interest cash inflows and outflows based on observable yield curves.
Level 3The fair value of available-for-sale unlisted investments is determined through the use of estimated discounted cash flows.
181Coca-Cola HBC 2017 Integrated Annual Report
Strategic R
eport
Co
rporate G
overnance
Financial Statem
entsS
wiss S
tatutory R
eporting
Supplem
entary Inform
ation

23. Financial risk management and financial instruments continuedThe following table provides the fair value hierarchy in which fair value measurements are categorised for assets and liabilities measured at fair value as at 31 December 2017:
Level 1
€ millionLevel 2
€ millionLevel 3
€ millionTotal
€ million
Financial assets at FVTPL Foreign currency forward contracts – 0.9 – 0.9Foreign currency option contracts – 0.9 – 0.9Embedded derivatives – 2.6 – 2.6Foreign currency futures contracts – 1.2 – 1.2Commodity swap contracts – 7.2 – 7.2
Derivative financial assets used for hedging Cash flow hedges
Foreign currency forward contracts – 0.7 – 0.7Foreign currency option contracts – 2.3 – 2.3Commodity swap contracts – 0.6 – 0.6
Available-for-sale financial assets Equity securities 1.0 – 2.7 3.7
Total financial assets 1.0 16.4 2.7 20.1Financial liabilities at FVTPL
Foreign currency forward contracts – (1.6) – (1.6)Commodity swap contracts – (2.2) – (2.2)
Derivative financial liabilities used for hedging Cash flow hedges
Foreign currency forward contracts – (1.6) – (1.6)Total financial liabilities – (5.4) – (5.4)
There were no transfers between Level 1, Level 2 and Level 3 in the period.
182 Coca-Cola HBC 2017 Integrated Annual Report
NOTES TO THE CONSOLIDATED FINANCIAL STATEMENTS CONTINUED

The following table provides the fair value hierarchy in which fair value measurements are categorised for assets and liabilities measured at fair value as at 31 December 2016:
Level 1
€ millionLevel 2
€ millionLevel 3
€ millionTotal
€ million
Financial assets at FVTPL Foreign currency forward contracts – 1.5 – 1.5Embedded derivatives – 3.3 – 3.3Foreign currency future contracts – 0.3 – 0.3Commodity swap contracts – 9.2 – 9.2
Derivative financial assets used for hedging Cash flow hedges
Foreign currency forward contracts – 1.0 – 1.0Foreign currency option contracts – 0.3 – 0.3Commodity swap contracts – 0.4 – 0.4
Available-for-sale financial assets Equity securities 0.9 – 2.7 3.6
Total financial assets 0.9 16.0 2.7 19.6Financial liabilities at FVTPL
Foreign currency forward contracts – (4.6) – (4.6)Commodity swap contracts – (5.1) – (5.1)
Derivative financial liabilities used for hedging Fair value hedges
Foreign currency forward contracts – (1.7) – (1.7)Cash flow hedges
Foreign currency forward contracts – (4.0) – (4.0)Commodity swap contracts – (0.1) – (0.1)
Total financial liabilities – (15.5) – (15.5)
During 2016 the Group acquired an equity investment of €2.2m classified within Level 3. There were no transfers between Level 1, Level 2 and Level 3 in the period.
183Coca-Cola HBC 2017 Integrated Annual Report
Strategic R
eport
Co
rporate G
overnance
Financial Statem
entsS
wiss S
tatutory R
eporting
Supplem
entary Inform
ation

24. Net debt
Accounting policyBorrowings are initially recognised at the fair value net of transaction costs incurred.
After initial recognition, all interest-bearing borrowings are subsequently measured at amortised cost. Amortised cost is calculated using the effective interest rate method whereby any discount, premium or transaction costs associated with a borrowing are amortised to the income statement over the borrowing period.
Refer also to Note 14 for accounting policy on finance leases.
Cash and cash equivalents comprise cash balances and short-term, highly liquid investments that are readily convertible to known amounts of cash and which are subject to insignificant risk of change in value. Bank overdrafts are classified as short-term borrowings in the balance sheet and for the purpose of the cash flow statement. Time deposits which do not meet the definition of cash and cash equivalents are classified as short-term investments, in the held-to-maturity category.
Net debt is defined as current borrowings plus non-current borrowings less cash and cash equivalents, and time deposits classified as other financial assets.
Net debt for the year ended 31 December comprised:
2017
€ million2016
€ million
Current borrowings 166.4 156.5Non-current borrowings 1,459.8 1,468.1Less: Cash and cash equivalents (723.5) (573.2)Less: Other financial assets – time deposits (150.9) –Net debt 751.8 1,051.4
a) BorrowingsThe Group held the following borrowings as at 31 December:
2017
€ million2016
€ million
Commercial paper 120.0 108.5Loan payable to related parties (refer to Note 26) 4.3 4.1Other Borrowings 34.5 36.4 158.8 149.0Obligations under finance leases falling due within one year 7.6 7.5Total borrowings falling due within one year 166.4 156.5Borrowings falling due within two to five years
Bonds, bills and unsecured notes 797.2 796.0Borrowings falling due in more than five years
Bonds, bills and unsecured notes 596.3 595.8 1,393.5 1,391.8Obligations under finance leases falling due in more than one year 66.3 76.3Total borrowings falling due after one year 1,459.8 1,468.1Total borrowings 1,626.2 1,624.6
184 Coca-Cola HBC 2017 Integrated Annual Report
NOTES TO THE CONSOLIDATED FINANCIAL STATEMENTS CONTINUED

Reconciliation of liabilities to cash flows arising from financing activities:
Borrowings Finance leases
due within
one yeardue in more
than one yeardue within
one yeardue in more
than one year
Derivative assets/
(liabilities) Total
Balance at 1 January 2017 149.0 1,391.8 7.5 76.3 – 1,624.6Cash flows Proceeds from borrowings 82.2 – – – – 82.2Repayments of borrowings (83.8) – – – – (83.8)Principal repayments of finance lease obligations – – (7.2) – – (7.2)Interest paid (30.7) – (6.2) – – (36.9)Payments for settlement of derivatives – – – – (3.1) (3.1)Total cash flows (32.3) – (13.4) – (3.1) (48.8)Finance leases increase – – 0.1 0.8 – 0.9Effect of changes in exchange rates (0.4) – (0.2) (3.5) – (4.1)Other non-cash movements 42.5 1.7 13.6 (7.3) 3.1 53.6Balance at 31 December 2017 158.8 1,393.5 7.6 66.3 – 1,626.2
Other non-cash movements include the impact from interest expense and remeasurement of derivatives.
Commercial paper programme
In October 2013 the Group established a €1.0bn Euro-commercial paper programme (‘CP programme’) which was updated in September 2014 and then in May 2017, to further diversify its short-term funding sources. The Euro-commercial paper notes may be issued either as non-interest-bearing notes sold at a discount or as interest-bearing notes at a fixed or floating rate. All commercial paper issued under the CP programme must be repaid within 7 to 364 days. The CP programme has been granted the Short Term Euro Paper label (‘STEP’) and commercial paper is issued through Coca-Cola HBC’s 100%-owned subsidiary Coca-Cola HBC Finance B.V. and is fully, unconditionally and irrevocably guaranteed by Coca-Cola HBC AG. The outstanding amount under the CP programme as at 31 December 2017 was €120.0m (2016: €108.5m).
Committed credit facilities
In June 2015, the Group replaced its then existing €500.0m syndicated revolving credit facility with a new €500.0m syndicated loan facility, provided by various financial institutions, expiring on 24 June 2020, with the option to be extended for one more year. In June 2016, the Company exercised its option and the banks agreed to extend the facility for one more year until 24 June 2021. This facility can be used for general corporate purposes and carries a floating interest rate over EURIBOR and LIBOR. No amounts have been drawn under the syndicated loan facility since inception. The borrower in the syndicated loan facility is Coca-Cola HBC’s 100%-owned subsidiary Coca-Cola HBC Finance B.V. and it is fully, unconditionally and irrevocably guaranteed by Coca-Cola HBC AG and Coca-Cola HBC Holdings B.V. and not subject to any financial covenants.
Euro medium-term note programme
In June 2013, the Group established a new €3.0bn Euro medium-term note programme (the ‘EMTN programme’). The EMTN programme was updated in September 2014 and again in September 2015. Notes are issued under the EMTN programme through Coca-Cola HBC’s 100%-owned subsidiary Coca-Cola HBC Finance B.V. and are fully, unconditionally and irrevocably guaranteed by Coca-Cola HBC AG.
In June 2013, Coca Cola HBC Finance B.V. completed the issue of €800 million, 2.375%, seven-year fixed rate, Euro-denominated notes. The net proceeds of the new issue were used to repay the US$500m notes due in September 2013 and partially repay €183.0m of the 7.875% five-year fixed rate notes due in January 2014.
In March 2016, Coca-Cola HBC Finance B.V. completed the issue of a €600 million Euro-denominated fixed rate bond maturing in November 2024. The coupon rate of the new bond is 1.875% which, including the amortisation of the loss on the forward starting swap contracts over the term of the fixed rate bond, results in an effective interest rate of 2.99% (refer to Note 23). The net proceeds of the new issue were used to partially repay €214.6 million of the 4.25% seven-year fixed rate notes due in November 2016, the remaining €385.4m was repaid in November 2016 upon its maturity.
As at 31 December 2017, a total of €1.4bn in notes issued under the EMTN programme were outstanding.
The EMTN Programme has not been updated since September 2015 so further issues under the EMTN Programme are currently not possible pending a further update.
185Coca-Cola HBC 2017 Integrated Annual Report
Strategic R
eport
Co
rporate G
overnance
Financial Statem
entsS
wiss S
tatutory R
eporting
Supplem
entary Inform
ation

24. Net debt continued
Summary of notes outstanding as at 31 December Book value Fair value
Notes Start date Maturity date Fixed coupon2017
€ million2016
€ million2017
€ million2016
€ million
€800m 18 June 2013 18 June 2020 2.375% 797.2 796.0 841.5 855.9€600m 10 March 2016 11 November 2024 1.875% 596.3 595.8 643.6 634.8Total 1,393.5 1,391.8 1,485.1 1,490.7
The fair values are within Level 1 of the fair value hierarchy.
Obligations under finance leases
Future minimum lease payments under finance leases together with the present value of the net minimum lease payments as at 31 December, were as follows:
2017
€ million2016
€ million
Minimum
paymentsPresent value
of paymentsMinimum
paymentsPresent value
of payments
Less than one year 14.3 7.6 13.7 7.5Later than one year but less than two years 11.3 6.5 13.5 7.7Later than two years but less than three years 12.6 6.8 11.9 6.7Later than three years but less than four years 12.5 7.3 11.9 7.1Later than four years but less than five years 12.6 7.8 11.9 7.5Later than five years 49.9 37.9 62.6 47.3Total minimum lease payments 113.2 73.9 125.5 83.8Future finance charges on finance leases (39.3) – (41.7) –Present value of minimum lease payments 73.9 73.9 83.8 83.8
Total borrowings at 31 December were held in the following currencies:
Current Non-current
2017
€ million2016
€ million2017
€ million2016
€ million
Euro 152.0 122.8 1,414.1 1,416.1US dollar 11.0 4.5 24.1 28.4UK sterling 1.3 1.3 9.2 10.9Polish zloty 1.0 0.9 12.4 12.7Croatian kuna 0.3 15.3 – –Russian rouble – 11.6 – –Other 0.8 0.1 – –Total borrowings 166.4 156.5 1,459.8 1,468.1
The carrying amounts of interest bearing borrowings held at fixed and floating interest rate as at 31 December 2017, as well as the weighted average interest rates and maturities of fixed rate borrowings, were as follows:
Fixedinterest rate
€ million
Floatinginterest rate
€ millionTotal
€ million
Euro 1,537.3 28.8 1,566.1US dollar 31.2 3.9 35.1Polish zloty – 13.4 13.4UK sterling – 10.5 10.5Other 0.7 0.1 0.8 Total interest bearing borrowings 1,569.2 56.7 1,625.9
Other borrowings of €0.3m (2016: €15.3m) are subject to factoring agreements, based on which the customers are liable to the interest being charged (refer to Note 17).
186 Coca-Cola HBC 2017 Integrated Annual Report
NOTES TO THE CONSOLIDATED FINANCIAL STATEMENTS CONTINUED

Financial liabilities represent fixed and floating rate borrowings held by the Group. The Group’s policy is to hedge exposures to changes in the fair value of debt and interest rates by using a combination of cross-currency swap contracts, fixed-to-floating-rate interest rate swap contracts and interest rate option contracts. The weighted average interest rate of the fixed Euro liabilities is 2.4% and the weighted average maturity for which the interest is fixed is 4.1 years.
b) Cash and cash equivalentsCash and cash equivalents as at 31 December comprise the following:
2017
€ million2016
€ million
Cash at bank, in transit and in hand 397.6 329.7 Short-term deposits 325.9 243.5 Total cash and cash equivalents 723.5 573.2
Cash and cash equivalents are held in the following currencies:
2017
€ million2016
€ million
Euro 568.6 400.7Nigerian naira 82.8 110.7UK sterling 14.5 6.6Hungarian forint 10.6 6.1Romanian leu 9.9 5.6Russian rouble 9.8 11.7Serbian dinar 7.2 9.1Swiss franc 6.3 4.6Ukrainian hryvnia 3.0 2.5Czech koruna 2.3 2.1Croatian kuna 1.8 0.7US dollar 1.7 3.3Moldovan leu 1.2 0.8Belarusian rouble 1.1 1.4Other 2.7 7.3Total cash and cash equivalents 723.5 573.2
Time deposits of €150.9m, which do not meet the definition of cash and cash equivalents, are recorded as other financial assets.
Cash and cash equivalents include an amount of €83.9m held by the Group’s subsidiary, Nigerian Bottling Company Ltd, (€82.8m equivalent in Nigerian naira and €1.1m equivalent in other currencies). Furthermore, this amount includes €12.9m equivalent Nigerian naira, which relates to the outstanding balance of the bank account held for the repayment of its former minority shareholders, following the 2011 acquisition of non-controlling interests.
Cash and cash equivalents held by our subsidiaries in Greece of €16.6m were subject to capital controls as at 31 December 2017.
The amount of dividends payable to the Company by its operating subsidiaries is subject to, among other restrictions, general limitations imposed by the corporate laws and exchange control restrictions of the respective jurisdictions where those subsidiaries are organised and operate. Also, there are fund transfer restrictions in certain countries in which we operate, in particular Belarus, Greece, Serbia and Ukraine, where these restrictions do not have a material impact on the Group’s liquidity, as the amounts of cash and cash equivalents held in such countries are generally retained for capital expenditure, working capital and dividend distribution purposes. Fund transfer restrictions are also applicable in Nigeria; furthermore, the tight liquidity in 2016 and the first quarter of 2017 in the foreign exchange market in Nigeria has significantly limited our ability to execute payments in foreign currency, leading to a temporarily high Nigerian naira cash balance. We expect all this excess cash to be fully utilised to fund capital expenditure in 2018. Intra group dividends paid by certain of our subsidiaries are also subject to withholding taxes.
187Coca-Cola HBC 2017 Integrated Annual Report
Strategic R
eport
Co
rporate G
overnance
Financial Statem
entsS
wiss S
tatutory R
eporting
Supplem
entary Inform
ation

25. Equity
Accounting policies
Share capital
Coca-Cola HBC has only one class of shares, ordinary shares. When new shares are issued, they are recorded in share capital at their par value. The excess of the issue price over the par value is recorded to the share premium reserve. Incremental external costs directly attributable to the issue of new shares or to the process of returning capital to shareholders are recorded in equity as a deduction, net of tax, in the share premium reserve.
Dividends
Dividends are recorded in the Group’s consolidated financial statements in the period in which they are approved by the Group’s shareholders.
a) Share capital, share premium and Group reorganisation reserveNumber
of shares(authorisedand issued)
Sharecapital
€ million
Sharepremium€ million
Groupreorganisation
reserve€ million
Balance as at 1 January 2016 368,141,297 2,000.1 5,028.3 (6,472.1)Shares issued to employees exercising stock options (refer to Note 27) 1,499,341 9.1 12.5 –Cancellation of shares (3,000,000) (18.4) (40.1) –Dividends – – (146.1) –Balance as at 31 December 2016 366,640,638 1,990.8 4,854.6 (6,472.1)Shares issued to employees exercising stock options (refer to Note 27) 4,122,401 24.3 46.7 –Dividends – – (162.0) –Balance as at 31 December 2017 370,763,039 2,015.1 4,739.3 (6,472.1)
The Group reorganisation reserve relates to the impact from adjusting share capital, share premium and treasury shares to depict the respective statutory amounts of Coca-Cola HBC on 25 April 2013, together with the transaction costs incurred by the latter, relating primarily to the re-domiciliation of the Group and its admission to listing in the premium segment of the London Stock Exchange, following successful completion of the voluntary share exchange offer (refer also to Note 1). These transactions were treated as a reorganisation of an existing entity that has not changed the substance of the reporting entity.
On 23 June 2015, the Annual General Meeting adopted a proposal for share buy-back of up to 3,000,000 ordinary shares of Coca-Cola HBC for the purpose of neutralising the dilution resulting from shares issues under Coca-Cola HBC’s equity compensation plans. The programme was completed in full during 2015 for a consideration of €58.5m. On 21 June 2016, the Annual General Meeting approved the proposal to reduce the share capital of Coca-Cola HBC AG by cancelling the 3,000,000 treasury shares acquired as part of the share buy-back programme described above. The respective reduction of the share capital was completed in September 2016.
In 2017, the share capital of Coca-Cola HBC increased by the issue of 4,122,401 (2016: 1,499,341) new ordinary shares following the exercise of stock options pursuant to the Coca-Cola HBC AG’s employees’ stock option plan. Total proceeds from the issuance of the shares under the stock option plan amounted to €71.0m (2016: €21.6m).
Following the above changes, as at 31 December 2017 the share capital of the Group amounted to €2,015.1m (2016: €1,990.8m) and comprised 370,763,039 shares with a nominal value of CHF 6.70 each.
b) DividendsThe shareholders of Coca-Cola HBC AG approved the 2015 dividend distribution of €0.40 per share at the Annual General Meeting held on 21 June 2016. The total dividend amounted to €146.1m and was paid on 26 July 2016. Of this, an amount of €1.4m related to shares held by the Group.
The shareholders of Coca-Cola HBC AG approved the 2016 dividend distribution of €0.44 per share at the Annual General Meeting held on 20 June 2017. The total dividend amounted to €162.0m and was paid on 25 July 2017. Of this, an amount of €1.5m related to shares held by the Group.
The Board of Directors of Coca-Cola HBC AG has proposed a €0.54 dividend per share in respect of 2017. If approved by the shareholders of Coca-Cola HBC AG, this dividend will be paid in 2018.
188 Coca-Cola HBC 2017 Integrated Annual Report
NOTES TO THE CONSOLIDATED FINANCIAL STATEMENTS CONTINUED

c) ReservesThe reserves of the Group at 31 December were as follows:
2017€ million
2016€ million
Treasury shares (71.3) (70.7)Exchange equalisation reserve (1,026.3) (801.8)Other reserves
Hedging reserve, net (47.0) (55.3)Tax-free reserve 163.8 163.8Statutory reserves 27.3 26.9Stock option reserve 104.4 87.2Available-for-sale financial assets valuation reserve, net 0.8 0.7Other 21.9 21.8
Total other reserves 271.2 245.1Total reserves (826.4) (627.4)
Treasury shares
Treasury shares held by the Group represent shares acquired following approval of share buy-back programmes, forfeited shares under the equity compensation plan operated by the Group as well as shares representing the initial ordinary shares of Coca-Cola HBC acquired from Kar-Tess Holding. In September 2016 the 3,000,000 treasury shares, acquired as part of the 2015 share buy-back programme for a consideration of €58.5m, were cancelled (refer also to section a) ‘Share capital, share premium and Group reorganisation reserve’). As at 31 December 2017, 3,445,060 treasury shares were held by the Group.
Exchange equalisation reserve
The exchange equalisation reserve comprises all foreign exchange differences arising from the translation of the financial statements of entities with functional currencies other than the Euro.
Other reserves
Hedging reserveThe hedging reserve reflects changes in the fair values of derivatives accounted for as cash flow hedges, net of the deferred tax related to such balances.
Tax-free and statutory reservesThe tax-free reserve includes investment amount exempt from tax according to incentive legislation, other tax-free income or income taxed at source.
Statutory reserves are particular to the various countries in which the Group operates. The amount of statutory reserves of the parent entity, Coca-Cola HBC AG, is €nil. During 2017, an amount of €0.4m (2016: €6.9m) was reclassified to statutory reserves relating to the establishment of additional reserves by the Group’s subsidiaries.
Other reservesOther reserves are particular to the various countries in which the Group operates.
Stock option reserveThe stock option reserve represents the cumulative charge to the income statement for employee stock option and performance share awards (refer also to Note 27).
189Coca-Cola HBC 2017 Integrated Annual Report
Strategic R
eport
Co
rporate G
overnance
Financial Statem
entsS
wiss S
tatutory R
eporting
Supplem
entary Inform
ation

26. Related party transactions
a) The Coca-Cola CompanyAs at 31 December 2017, The Coca-Cola Company indirectly owned 23.0% (2016: 23.2%) of the issued share capital of Coca-Cola HBC. The Coca-Cola Company considers Coca-Cola HBC to be a ‘key bottler’ and has entered into bottlers’ agreements with Coca-Cola HBC in respect of each of the Group’s territories. All the bottlers’ agreements entered into by The Coca-Cola Company and Coca-Cola HBC are Standard International Bottlers’ (‘SIB’) agreements. The terms of the bottlers’ agreements grant Coca-Cola HBC the right to produce and the exclusive right to sell and distribute the beverages of The Coca-Cola Company in each of the countries in which the Group operates. Consequently, Coca-Cola HBC is obliged to purchase all concentrate for The Coca-Cola Company’s beverages from The Coca-Cola Company, or its designee, in the ordinary course of business. On 10 October 2012, The Coca-Cola Company agreed to extend the term of the bottlers’ agreements for further 10 years until 2023.
The Coca-Cola Company owns or has applied for the trademarks that identify its beverages in each of the countries in which the Group operates. The Coca-Cola Company has authorised Coca-Cola HBC and certain of its subsidiaries to use the trademark ‘Coca-Cola’ in their corporate names.
The below table summarises transactions with The Coca-Cola Company and its subsidiaries:
2017
€ million2016
€ million
Purchases of concentrate, finished goods and other items 1,379.9 1,319.4 Net contributions received for marketing and promotional incentives 83.9 91.2 Sales of finished goods and raw materials 14.3 10.8 Other income 6.1 4.4 Other expenses 3.6 3.5
The Coca-Cola Company makes discretionary marketing contributions to Coca-Cola HBC’s operating subsidiaries. The participation in shared marketing agreements is at The Coca-Cola Company’s discretion and, where co-operative arrangements are entered into, marketing expenses are shared. Such arrangements include the development of marketing programmes to promote The Coca-Cola Company’s beverages. Contributions received from The Coca-Cola Company for marketing and promotional incentives during the year amounted to €83.9m (2016: €91.2m): contributions made by The Coca-Cola Company to Coca-Cola HBC for price support and marketing and promotional campaigns in respect of specific customers in 2017 totalled €59.6m (2016: €66.0m), while contributions made by The Coca-Cola Company to Coca-Cola HBC for general marketing programmes in 2017 totalled €24.3m (2016: €25.2m). The Coca-Cola Company has also customarily made additional payments for marketing and advertising directly to suppliers as part of the shared marketing arrangements. The proportion of direct and indirect payments made at The Coca-Cola Company’s discretion, will not necessarily be the same from year to year.
Other income primarily comprises rent and other items. Other expenses related to facility costs charged by The Coca-Cola Company and shared costs included in operating expenses.
In December 2016 the Group sold 50% of its share in its subsidiary Neptūno Vandenys, UAB, to European Refreshments, a subsidiary of TCCC for a total consideration of €10.3m (refer to Note 22), of which €9.8m was received in 2016 and the remaining in 2017 and is included in line ‘Net receipts from equity investments’ in the consolidated cash flow statement.
As at 31 December 2017, the Group had a total amount due from The Coca-Cola Company of €79.3m (2016: €94.3m), and a total amount due to The Coca-Cola Company of €260.2m (2016: €234.6m).
190 Coca-Cola HBC 2017 Integrated Annual Report
NOTES TO THE CONSOLIDATED FINANCIAL STATEMENTS CONTINUED

b) Frigoglass S.A. (‘Frigoglass’), Kar-Tess Holding and AG Leventis (Nigeria) PlcTruad Verwaltungs AG, currently indirectly owns 48.6% of Frigoglass and 50.7% of AG Leventis (Nigeria) Plc and also indirectly controls Kar-Tess Holding, which holds approximately 23.0% (2016: 23.3%) of Coca-Cola HBC’s total issued share capital.
The below table summarises transactions with the above entities:
Frigoglass & subsidiaries2017
€ million2016
€ million
Purchases of coolers, cooler parts, glass bottles, crowns, raw materials and plastics 117.3 108.1Maintenance and other expenses 18.1 19.6AG Leventis (Nigeria) Plc Purchases of finished goods and other materials 8.7 11.9Purchases of property, plant and equipment 0.2 3.0Rental expenses 2.1 1.8
Frigoglass, a company listed on the Athens Exchange, is a manufacturer of coolers, cooler parts, glass bottles, crowns and plastics. Frigoglass has a controlling interest in Frigoglass Industries Limited, a company in which the Group has a 23.9% effective interest, through its investment in Nigerian Bottling Company Ltd. Furthermore, during 2015 the Group acquired through its investment in Nigerian Bottling Company Ltd a 23.9% effective interest of Frigoglass West Africa Ltd, a company in which Frigoglass has a controlling interest.
The Group entered into a supply agreement with Frigoglass for the purchase of cooling equipment in 1999. The supply agreement was extended in 2004, 2008 and, most recently, in 2013, on substantially similar terms. Coca-Cola HBC has the status of most favoured customer of Frigoglass, on a non-exclusive basis, provided that it obtains at least 60% (at prices which are negotiated on an annual basis and which must be competitive) of its annual requirements for cooling equipment from Frigoglass. The current agreement expires on 31 December 2018.
As at 31 December 2017, Coca-Cola HBC owed €14.8m (2016: €32.0m) to and was owed €0.2m (2016: €1.0m) by Frigoglass.
As at 31 December 2017, the Group owed €1.3m (2016: €2.6m) to AG Leventis (Nigeria) Plc.
Capital commitments with Frigoglass and its subsidiaries at 31 December 2017 amounted to €21.9m (2016: €0.4m).
c) Other related partiesThe below table summarises transactions with other related parties:
2017
€ million2016
€ million
Purchases 79.3 90.2 Other expenses 23.2 23.5
Beverage Partners Worldwide (‘BPW’)
BPW is a 50/50 joint venture between The Coca-Cola Company and Nestlé. During 2017, the Group purchased inventory from BPW amounting to €77.9m (2016: €88.3m).
As at 31 December 2017, Coca-Cola HBC owed €4.5m (2016: €5.4m) to and was owed €4.5m (2016: €14.9m) by BPW. Effective 1 January 2018, TCCC and Nestle have agreed to dissolve BPW.
Other
During 2017, the Group purchased € nil (2016: €0.8m) of raw materials and finished goods and acquired €1.4m (2016: €1.1m) of property, plant and equipment from other related parties. Furthermore, during 2017, the Group incurred expenses of €23.2m (2016: €23.5m) mainly related to maintenance services for cold drink equipment and installations of coolers, fountains, vending and merchandising equipment from other related parties.
At 31 December 2017, the Group owed €0.4m (2016: €0.1m) to and was owed €0.8m including loans receivable of €nil (2016: €0.1m including loans receivable of €0.1m) by other related parties.
191Coca-Cola HBC 2017 Integrated Annual Report
Strategic R
eport
Co
rporate G
overnance
Financial Statem
entsS
wiss S
tatutory R
eporting
Supplem
entary Inform
ation

26. Related party transactions continued
d) Joint venturesDuring 2017, the Group purchased €19.7m of finished goods (2016: €42.2m). In addition, during 2017 the Group recorded sales of finished goods and raw materials of €12.6m (2016: €12.3m) to joint ventures. Furthermore, the Group recorded other income of €1.4m (2016: €1.6m) from joint ventures. During 2017, the Group sold property, plant and equipment of € nil (2016: € 2.5m) to joint ventures.
As at 31 December 2017, the Group owed €24.0m including loans payable of €4.3m (2016: €34.0m including loans payable €4.1m) to and was owed €8.6m including loans receivable of €3.6m (2016: €11.9m including loans receivable of €5.1m) by joint ventures. During 2017 the Group received dividends and capital returns of €19.3m (2016: €16.5m dividends) from Brewinvest S.A. Group of companies which are included in line ‘Net receipts from equity investments’ of the consolidated cash flow statement.
e) DirectorsAnastassis G. David, Anastasios I. Leventis, Christo Leventis and Robert Ryan Rudolph have all been nominated by Kar-Tess Holding to the Board of Coca-Cola HBC. José Octavio Reyes and Ahmet C. Bozer have been nominated by TCCC to the Board of Coca-Cola HBC. There have been no transactions between Coca-Cola HBC and the Directors except for remuneration (refer to Note 8).
27. Share based payments
Accounting policies
Stock option and performance share compensation plans
Coca-Cola HBC issues equity-settled share-based payments to its senior managers in the form of an employee stock option plan and a performance share plan.
The employee stock option plan is measured at fair value at the date of grant. Fair value reflects the parameters of the compensation plan, the risk-free interest rate, the expected volatility, the dividend yield and the early exercise experience of the Group’s plans. Expected volatility is determined by calculating the historical volatility of Coca-Cola HBC’s share price over previous years. The fair value determined at the grant date is expensed on a straight-line basis over the vesting period.
The performance share plan offers a specified number of performance share awards that vest three years after the grant. The fair value is determined at the grant date and reflects the parameters of the compensation plan, the dividend yield and the weighted average share price. The fair value determined at the grant date is expensed on a straight-line basis over the vesting period. At the end of each reporting period the Group revises its estimates of the number of shares that are expected to vest based on non-market conditions, and recognises the impact of the revision to original estimates, if any, in the income statement with a corresponding adjustment to equity.
Employee Share Purchase Plan
The Group operates an employee share purchase plan, the Employee Share Purchase Plan, an equity compensation plan in which eligible employees can participate. The Group makes contributions to the plan for participating employees and recognises expenses over the vesting period of the contributions.
The charge included in employee costs regarding share-based payments for the years ended 31 December is analysed as follows:
2017
€ million2016
€ million
Stock option awards 0.7 3.7Performance shares awards 20.1 4.4Employee Share Purchase Plan 4.6 4.6Total share based payments charge 25.4 12.7
192 Coca-Cola HBC 2017 Integrated Annual Report
NOTES TO THE CONSOLIDATED FINANCIAL STATEMENTS CONTINUED

Terms and conditions
Stock option plan:
Senior managers are granted awards of stock options, based on performance, potentiality and level of responsibility. Options are granted at an exercise price equal to the closing price of the Company’s shares trading on the London Stock Exchange on the day of the grant. Options vest in one-third increments each year for three years and can be exercised for up to 10 years from the date of award. When the options are exercised, the proceeds received, net of any transaction costs, are credited to share capital (at the nominal value) and share premium.
Performance share plan:
During 2015 the Group adopted a Performance share plan, under which senior managers are granted performance share awards, which have a three-year vesting period and are linked with Group specific key performance indicators. Performance share awards are granted at a price equal to the closing price of the Company’s shares trading on the London Stock Exchange on the day of the grant.
Employee Share Purchase Plan:
The Employee Share Purchase Plan is administered by a Plan Administrator. Under the terms of this plan, employees have the opportunity to invest 1% to 15% of their salary in ordinary Coca-Cola HBC shares by contributing to the plan monthly. Coca-Cola HBC will match up to a maximum of 3% of the employee’s salary by way of contribution. Employer contributions, in the form of a cash allocation, take place on a monthly basis and are used to purchase matching shares on the open market, which is the London Stock Exchange, at the time of vesting. Matching contributions vest one year after the grant. Dividends received in respect of shares under the Plan are used to purchase additional shares at the time of vesting. Shares are held under the Plan Administrator. In order to adapt the plan to the Greek legal framework Coca-Cola HBC matches the contribution of employees’ resident in Greece with an annual employer contribution, of up to 5% of the employee’s salary in December of each year, which vest immediately.
Stock option activityThe Group has not issued any new stock options in 2017 or 2016.
The following table summarises information regarding outstanding stock options exercisable at 31 December 2017:
Exercise price
(EUR)Exercise price
(GBP)
Vestingstatus as at
31 Dec 2017 End of period
Number ofstock options
outstanding
2005 December Grant 13.19 11.24 fully vested 31.12.20201 245,0012006 December Grant 16.37 13.95 fully vested 12.12.20211 397,5002007 December Grant 26.41 22.51 fully vested 31.12.20221 537,2502008 December Grant 9.02 7.69 fully vested 10.12.2018 539,5002009 December Grant 15.70 13.38 fully vested 09.12.2019 796,5002010 December Grant 19.31 16.46 fully vested 08.12.2020 1,048,0002011 March Grant 18.53 15.79 fully vested 15.03.2021 18,3342011 December Grant 11.98 10.21 fully vested 15.12.2021 502,1682013 June Grant – 15.00 fully vested 20.06.2023 587,5002013 December Grant – 16.99 fully vested 09.12.2023 763,0002014 December Grant – 13.33 fully vested 09.12.2024 928,904Total 6,363,657
1. Relates to stock options granted under the previous stock option plans which expire in December 2020, 2021 and 2022 respectively.
193Coca-Cola HBC 2017 Integrated Annual Report
Strategic R
eport
Co
rporate G
overnance
Financial Statem
entsS
wiss S
tatutory R
eporting
Supplem
entary Inform
ation

27. Share based payments continuedA summary of stock option activity in 2017 under all plans is as follows:
Numberof stockoptions
2017
Weighted*average
exercise price2017 (EUR)
Weightedaverage
exercise price2017 (GBP)
Outstanding at 1 January 10,540,809 17.38 14.80Exercised (4,122,401) 17.19 15.25Expired (12,750) 25.37 22.51Forfeited / Cancelled (42,001) 20.98 18.62Outstanding at 31 December 6,363,657 16.29 14.46Exercisable at 31 December 6,363,657 16.29 14.46
A summary of stock option activity in 2016 under all plans is as follows:
Numberof stockoptions
2016
Weighted*average
exercise price2016 (EUR)
Weightedaverage
exercise price2016 (GBP)
Outstanding at 1 January 12,337,506 19.76 14.56Exercised (1,499,341) 14.56 12.40Expired (271,687) 20.29 17.28Forfeited / Cancelled (25,669) 16.82 14.32Outstanding at 31 December 10,540,809 17.38 14.80Exercisable at 31 December 10,019,308 17.46 14.87
* For convenience purposes, the prices are translated with the closing exchange rate.
Total proceeds from the issuance of the shares under the stock option plan in 2017 amounted to €71.0m (2016: €21.6m).
The weighted average remaining contractual life of share options outstanding under the stock option compensation plans at 31 December 2017 was 4.0 years (2016: 4.8 years).
Performance shares activityA summary of performance shares activity is as follows:
Number ofperformance
shares2017
Number ofperformance
shares2016
Outstanding at 1 January 1,363,992 652,159Granted 824,074 716,269Forfeited / Cancelled (65,776) (4,436)Outstanding at 31 December 2,122,290 1,363,992
The 2017 expense recognised for performance shares awards includes the retrospective adjustment resulting from the reassessment of the performance conditions of the plan as well as the impact from the accelerated vesting of 396,402 shares, due to the passing of the former CEO. The weighted average remaining contractual life of performance shares outstanding under the performance share plans at 31 December 2017 was 1.6 years (2016: 2.2 years).
The fair value of the 2017 performance share plan amounted to £18.70m (2016: £13.50m). Relevant inputs into the valuation are as follows:
2017 2016
Weighted average share price £19.81 £14.34Dividend yield 1.9% 2.0%Weighted average exercise period 3.0 years 3.0 years
194 Coca-Cola HBC 2017 Integrated Annual Report
NOTES TO THE CONSOLIDATED FINANCIAL STATEMENTS CONTINUED

28. Contingencies In relation to the Greek Competition Authority’s decision of 25 January 2002, one of Coca-Cola Hellenic Bottling Company S.A.’s competitors has filed a lawsuit against Coca-Cola Hellenic Bottling Company S.A. claiming damages in an amount of €7.7m. The court of first instance heard the case on 21 January 2009 and subsequently rejected the lawsuit. The plaintiff has appealed the judgement and on 9 December 2013 the Athens Court of Appeals rejected the plaintiff’s appeal. Following the spin-off, Coca-Cola HBC Greece S.A.I.C. substituted Coca-Cola Hellenic Bottling Company S.A. as defendant in this lawsuit. Coca-Cola HBC Greece S.A.I.C. has not provided for any losses related to this case. The defendant has not filed for a cessation of the decision within the relevant deadline set by law, therefore the decision of the Athens Court of Appeal is final and irrecoverable and the case has closed. On 19 April 2014, the same plaintiff filed a new lawsuit against Coca-Cola Hellenic Bottling Company S.A. (following the spin-off, Coca-Cola HBC Greece S.A.I.C.) claiming payment of €7.5m as compensation for losses and moral damages for alleged anti-competitive commercial practices of Coca-Cola Hellenic Bottling Company S.A. between 1994 and 2013. The two lawsuits partially overlap in the time period for which damages are sought by the plaintiff. The hearing of the new lawsuit is now scheduled for 17 January 2019. Coca-Cola HBC Greece S.A.I.C. has not provided for any losses related to this case.
On 6 September 2016, the Greek Competition Commission initiated an audit of Coca-Cola HBC Greece S.A.I.C.’s operations as part of an investigation into certain commercial practices in the sparkling, juice and water categories. Coca-Cola HBC Greece S.A.I.C. has a policy of strict compliance with Greek and EU competition law and it is co-operating fully with the Greek Competition Commission.
In 1992, our subsidiary Nigerian Bottling Company (‘NBC’) acquired a manufacturing facility in Nigeria from Vacunak, a Nigerian company. In 1994, Vacunak filed a lawsuit against NBC, alleging that a representative of NBC had orally agreed to rescind the sale agreement and instead enter into a lease agreement with Vacunak. As part of its lawsuit Vacunak sought compensation for rent and loss of business opportunities. NBC discontinued all use of the facility in 1995. On 19 August 2013, NBC received the written judgement of the Nigerian court of first instance issued on 28 June 2012 providing for damages of approximately €19.3m. NBC has filed an appeal against the judgement. Based on advice from NBC’s outside legal counsel, we believe that it is unlikely that NBC will suffer material financial losses from this case. We have consequently not provided for any losses in relation to this case.
The tax filings of the Group and its subsidiaries are routinely subjected to audit by tax authorities in most of the jurisdictions in which the Group conducts business. These audits may result in assessments of additional taxes. The Group provides additional tax in relation to the outcome of such tax assessments, to the extent that a liability is probable and estimable.
The Group is also involved in various other legal proceedings. Management believes that any liability to the Group that may arise as a result of these pending legal proceedings will not have a material adverse effect on the results of operations, cash flows, or the financial position of the Group taken as a whole.
195Coca-Cola HBC 2017 Integrated Annual Report
Strategic R
eport
Co
rporate G
overnance
Financial Statem
entsS
wiss S
tatutory R
eporting
Supplem
entary Inform
ation

29. Commitments
Accounting policyLeases of property, plant and equipment not classified as finance leases are classified as operating leases. Rentals paid under operating leases are charged to the income statement on a straight-line basis over the lease term.
a) Operating leasesThe total of future minimum lease payments under non-cancellable operating leases at 31 December was as follows:
2017
€ million2016
€ million
Less than one year 39.1 33.3Later than one year but less than five years 89.8 80.4Later than five years 23.7 12.1Future minimum lease payments 152.6 125.8
The total operating lease charges included within operating expenses for the years ended 31 December were as follows:
b) Capital commitmentsAs at 31 December 2017, the Group had capital commitments amounting to €76.3m (2016: €84.9m). Of this, €0.6m related to the Group’s share of the commitments arising from joint operations (2016: €1.6m). The Group’s share of the commitments arising from joint ventures is disclosed in Note 15.
c) Long-term commitmentsAs at 31 December 2017 the Group had commitments to purchase raw materials and receive services amounting to €452.8m (2016: €510.6m). Of this, €nil related to the Group’s share of the commitments arising from joint operations (2016: €0.5m). The Group’s share of the commitments arising from joint ventures is disclosed in Note 15.
30. Post balance sheet eventsOn 14 March 2018 the Remuneration Committee granted 665,676 performance share plan awards under the performance share plan, which have a three-year vesting period.
Plant and equipment: €61.7mProperty: €24.3m
2016€86.0m
Plant and equipment: €37.1mProperty: €23.8m
2017€60.9m
196 Coca-Cola HBC 2017 Integrated Annual Report
NOTES TO THE CONSOLIDATED FINANCIAL STATEMENTS CONTINUED

Contents
Swiss Statutory Reporting198 Report of the statutory auditor on Coca‑Cola HBC AG’s
consolidated financial statements204 Report of the statutory auditor on Coca‑Cola HBC AG’s
financial statements207 Coca‑Cola HBC AG’s financial statements218 Report of the statutory auditor on the Statutory
Remuneration Report 219 Statutory Remuneration Report
SWISS STATUTORY REPORTING
Strategic R
eport
Co
rporate G
overnance
Financial Statem
entsS
wiss S
tatutory R
eporting
Supplem
entary Inform
ation
197Coca-Cola HBC 2017 Integrated Annual Report

Report of the statutory auditorto the General Meeting ofCoca‑Cola HBC AGSteinhausen/Zug
Report on the audit of the consolidated financial statements
OpinionWe have audited the consolidated financial statements of Coca‑Cola HBC AG and its subsidiaries (the Group), which comprise the consolidated statement of financial position as at 31 December 2017 and the consolidated income statement, consolidated statement of comprehensive income, consolidated statement of changes in equity and consolidated statement of cash flows for the year then ended, and notes to the consolidated financial statements, including a summary of significant accounting policies.
In our opinion, the accompanying consolidated financial statements give a true and fair view of the consolidated financial position of the Group as at 31 December 2017 and its consolidated financial performance and its consolidated cash flows for the year then ended in accordance with the International Financial Reporting Standards (IFRS) and comply with Swiss law.
Basis for opinionWe conducted our audit in accordance with Swiss law, International Standards on Auditing (ISAs) and Swiss Auditing Standards. Our responsibilities under those provisions and standards are further described in the “Auditor’s responsibilities for the audit of the consolidated financial statements” section of our report.
We are independent of the Group in accordance with the provisions of Swiss law and the requirements of the Swiss audit profession, as well as the IESBA Code of Ethics for Professional Accountants, and we have fulfilled our other ethical responsibilities in accordance with these requirements. We believe that the audit evidence we have obtained is sufficient and appropriate to provide a basis for our opinion.
Our audit approach
Overview Overall Group materiality: € 28.2 million, which represents 5% of profit before tax.
We conducted full scope audit work at subsidiary undertakings in 16 countries. Our audit scope addressed 87% of the Group’s consolidated net sales revenue and 88% of the Group’s assets. We also conducted specified audit procedures and analytical review procedures for other Group undertakings and functions.
As key audit matters, the following areas of focus, which are consistent with the prior year, have been identified:
– Goodwill and indefinite‑lived intangible assets impairment assessment
– Uncertain tax positions
– Provisions and contingent liabilitiesAudit scope
Key audit matters
Materiality
198 Coca-Cola HBC 2017 Integrated Annual Report
SWISS STATUTORY REPORTING CONTINUED

Audit scopeThe Group operates through its trading subsidiary undertakings in 28 countries, as set out on page 142 of the 2017 Integrated Annual Report. The processing of the accounting entries for these entities is largely centralised in a shared services centre in Bulgaria, except for the subsidiary undertakings in Russia, Ukraine, Belarus and Armenia, which process their accounting entries locally. The Group also operates a centralised treasury function in the Netherlands and in Greece and a centralised procurement function in Austria.
Mirroring the Group’s set‑up, with the parent entity incorporated in Switzerland and the Group Finance Function located in Greece, we structured our audit as a referred reporting assurance engagement and involved PwC Athens as a Performing Firm, while performing specific procedures related to our role of Signing Firm of the audit report on the Consolidated Financial Statements prepared for Swiss statutory purposes.
In close liaison with the performing firm, we designed our audit by determining materiality and assessing the risks of material misstatement in the consolidated financial statements. In particular, we considered where subjective judgements were made; for example, in respect of significant accounting estimates that involved making assumptions and considering future events that are inherently uncertain. As in all of our audits, we also addressed the risk of management override of internal controls, including among other matters consideration of whether there was evidence of bias that represented a risk of material misstatement due to fraud.
We tailored the scope of our audit in order to perform sufficient work to enable us to provide an opinion on the consolidated financial statements as a whole, taking into account the geographic structure of the Group, the accounting processes and controls, and the industry in which the Group operates.
199Coca-Cola HBC 2017 Integrated Annual Report
Strategic R
eport
Co
rporate G
overnance
Financial Statem
entsS
wiss S
tatutory R
eporting
Supplem
entary Inform
ation

MaterialityThe scope of our audit was influenced by our application of materiality. Our audit opinion aims to provide reasonable assurance that the consolidated financial statements are free from material misstatement. Misstatements may arise due to fraud or error. They are considered material if, individually or in aggregate, they could reasonably be expected to influence the economic decisions of users taken on the basis of the consolidated financial statements.
Based on our professional judgement, we determined certain quantitative thresholds for materiality, including the overall Group materiality for the consolidated financial statements as a whole as set out in the table below. These, together with qualitative considerations, helped us to determine the scope of our audit and the nature, timing and extent of our audit procedures and to evaluate the effect of misstatements, both individually and in aggregate, on the consolidated financial statements as a whole.
Overall Group materiality € 28.2 millionHow we determined it 5% of profit before taxRationale for the materiality benchmark applied
We chose profit before tax as the benchmark because, in our view, it is the benchmark against which the performance of the Group is most commonly measured, and it is a generally accepted benchmark
We agreed with the Audit Committee that we would report to them misstatements above €1.0 million identified during our audit as well as any misstatements below that amount which, in our view, warranted reporting for qualitative reasons.
Key audit mattersKey audit matters are those matters that, in our professional judgement, were of most significance in our audit of the consolidated financial statements of the current period. These matters were addressed in the context of our audit of the consolidated financial statements as a whole, and in forming our opinion thereon, and we do not provide a separate opinion on these matters.
200 Coca-Cola HBC 2017 Integrated Annual Report
SWISS STATUTORY REPORTING CONTINUED

Goodwill and indefinite-lived intangible assets impairment assessmentKey audit matter How our audit addressed the key audit matter
Refer to Note 13 for intangible assets including goodwill.
Goodwill and indefinite‑lived intangible assets as at 31 December 2017 amount to €1,621.2 million and €199,9 million, respectively.
The above noted amounts have been allocated to individual cash‑generating units (‘CGUs’). The impairment assessment must be performed at least annually and involves the determination of the recoverable amount, being the higher of the value‑in‑use and the fair value less costs to dispose.
This area was a key matter for our audit due to the size of goodwill and indefinite‑lived intangible assets and because the determination of whether elements of goodwill and of indefinite‑lived intangible assets are impaired involves complex and subjective estimates and judgements by management about the future results of the CGUs. These estimates and judgements include assumptions surrounding revenue growth rates, direct costs, foreign exchange rates and discount rates.
Furthermore, macroeconomic volatility, competitor activity and regulatory/fiscal developments can adversely affect each CGU and potentially the carrying amount of goodwill and indefinite‑lived intangible assets.
No impairment charge was recorded in 2017. Goodwill and franchise agreements held by the Nigeria CGU have been determined by management to remain sensitive to changes in the key drivers of cash flow forecasts given the macroeconomic volatility in Nigeria.
We evaluated the appropriateness of management’s identification of Group’s CGUs and the process by which management prepared the CGUs value‑in‑use calculations which we found to be satisfactory for the purposes of our audit. We tested the mathematical accuracy of the CGUs value‑in‑use calculations and compared them to the latest budget approved by the Directors and assessed the quality of the budgeting process by comparing the prior year budget with actual data.
With the support of our valuation specialists, we challenged management’s analysis around the key drivers of cash flow forecasts including selling price increases, short‑term and long‑term volume growth and the level of direct costs by comparing them with either the Group’s historical information or market data, as appropriate. We also evaluated the appropriateness of other key assumptions including discount rates and foreign exchange rates by comparing them to relevant market data. We found the assumptions to be consistent and in line with our expectations.
We also performed sensitivity analyses on the key drivers of cash flow forecasts for the CGUs with significant balances of goodwill and indefinite‑lived intangible assets as well as for CGUs which remain sensitive to changes in the key drivers, including the goodwill and franchise agreements held by the Nigeria CGU.
We assessed the appropriateness and completeness of the related disclosures in Note 13, and consider them to be reasonable. As a result of our work, we found that the determination by management that no impairment was required for goodwill and indefinite‑lived intangible assets was supported by assumptions within reasonable ranges.
Uncertain tax positionsKey audit matter How our audit addressed the key audit matter
Refer to Note 10 for taxation and Note 28 for contingencies.
The Group operates in a complex multinational tax environment which gives rise to uncertain tax positions in relation to corporation tax, transfer pricing and indirect taxes. As at 31 December 2017, the Group has current tax liabilities of €97.5 million which include €69.2 million of provisions for tax uncertainties.
The Group establishes provisions based on management’s judgements of the probable amount of the liability. Given the number of judgements involved in estimating the provisions relating to uncertain tax positions and the complexities of dealing with tax rules and regulations in numerous jurisdictions, this was considered as a key audit matter.
We evaluated the related accounting policy for provisioning for tax exposures and found it to be appropriate.
In conjunction with our tax specialists, we evaluated management’s judgements in respect of estimates of tax exposures and contingencies in order to assess the adequacy of the Group’s tax provisions. In order to understand and evaluate management’s judgements, we considered the status of current tax authority audits and enquiries, the outcome of previous tax authority audits, judgemental positions taken in tax returns and current year estimates and recent developments in the tax environments in which the Group operates.
We challenged management’s key assumptions, in particular on cases where there had been significant developments with tax authorities, noting no significant deviation from our expectations.
From the evidence obtained and in the context of the consolidated financial statements, taken as a whole, we consider the provisions in relation to uncertain tax positions as at 31 December 2017 to be appropriate.
201Coca-Cola HBC 2017 Integrated Annual Report
Strategic R
eport
Co
rporate G
overnance
Financial Statem
entsS
wiss S
tatutory R
eporting
Supplem
entary Inform
ation

Provisions and contingent liabilitiesKey audit matter How our audit addressed the key audit matter
Refer to Note 20 for provisions and Note 28 for contingencies.
The Group faces a number of threatened and actual legal and regulatory proceedings. The determination of the provision and/or the level of disclosure required involves a high degree of judgement resulting in provisions and contingent liabilities being considered as a key audit matter.
We evaluated the design of and tested key controls in respect of litigation and regulatory procedures, which we found to be satisfactory for the purposes of our audit.
Our procedures included the following:
– where relevant, reading external legal advice obtained by management;
– discussing open matters with the Group general counsel;
– meeting with local management and reading subsequent correspondence;
– assessing and challenging management’s conclusions through understanding precedents set in similar cases; and
– circularising relevant third‑party legal representatives and follow up discussions, where appropriate, on certain material cases.
On the basis of the work performed, whilst noting the inherent uncertainty with such legal and regulatory matters, we determined the relevant provisions as at 31 December 2017 to be appropriate.
We assessed the appropriateness of the related disclosures in Note 28 and considered these to be reasonable.
Other information in the annual reportThe Board of Directors is responsible for the other information in the annual report. The other information comprises all information included in the annual report, but does not include the consolidated financial statements, the stand‑alone financial statements and the remuneration report of Coca‑Cola HBC AG and our auditor’s reports thereon.
Our opinion on the consolidated financial statements does not cover the other information in the annual report and we do not express any form of assurance conclusion thereon.
In connection with our audit of the consolidated financial statements, our responsibility is to read the other information in the annual report and, in doing so, consider whether the other information is materially inconsistent with the consolidated financial statements or our knowledge obtained in the audit, or otherwise appears to be materially misstated. If, based on the work we have performed, we conclude that there is a material misstatement of this other information, we are required to report that fact. We have nothing to report in this regard.
Responsibilities of the Board of Directors for the consolidated financial statementsThe Board of Directors is responsible for the preparation of the consolidated financial statements that give a true and fair view in accordance with IFRS and the provisions of Swiss law, and for such internal control as the Board of Directors determines is necessary to enable the preparation of consolidated financial statements that are free from material misstatement, whether due to fraud or error.
In preparing the consolidated financial statements, the Board of Directors is responsible for assessing the Group’s ability to continue as a going concern, disclosing, as applicable, matters related to going concern and using the going concern basis of accounting unless the Board of Directors either intends to liquidate the Group or to cease operations, or has no realistic alternative but to do so.
202 Coca-Cola HBC 2017 Integrated Annual Report
SWISS STATUTORY REPORTING CONTINUED

Auditor’s responsibilities for the audit of the consolidated financial statementsOur objectives are to obtain reasonable assurance about whether the consolidated financial statements as a whole are free from material misstatement, whether due to fraud or error, and to issue an auditor’s report that includes our opinion. Reasonable assurance is a high level of assurance, but is not a guarantee that an audit conducted in accordance with Swiss law, ISAs and Swiss Auditing Standards will always detect a material misstatement when it exists. Misstatements can arise from fraud or error and are considered material if, individually or in the aggregate, they could reasonably be expected to influence the economic decisions of users taken on the basis of these consolidated financial statements.
A further description of our responsibilities for the audit of the consolidated financial statements is located at the website of EXPERTsuisse: http://expertsuisse.ch/en/audit-report-for-public-companies. This description forms part of our auditor’s report.
Report on other legal and regulatory requirementsIn accordance with article 728a paragraph 1 item 3 CO and Swiss Auditing Standard 890, we confirm that an internal control system exists which has been designed for the preparation of consolidated financial statements according to the instructions of the Board of Directors.
We recommend that the consolidated financial statements submitted to you be approved.
PricewaterhouseCoopers AG
Michael FoleyAudit expert Auditor in change
Lausanne, 16 March 2018
Laura Bucur
203Coca-Cola HBC 2017 Integrated Annual Report
Strategic R
eport
Co
rporate G
overnance
Financial Statem
entsS
wiss S
tatutory R
eporting
Supplem
entary Inform
ation

Report of the statutory auditorto the General Meeting ofCoca‑Cola HBC AGSteinhausen/Zug
Report on the audit of the financial statements
OpinionWe have audited the financial statements of Coca‑Cola HBC AG, which comprise the Balance Sheet as at 31 December 2017, Income Statement and Notes for the year then ended, including a summary of significant accounting policies.
In our opinion, the financial statements (pages 207 to 217) as at 31 December 2017 comply with Swiss law and the Company’s articles of incorporation.
Basis for opinionWe conducted our audit in accordance with Swiss law and Swiss Auditing Standards. Our responsibilities under those provisions and standards are further described in the “Auditor’s responsibilities for the audit of the financial statements” section of our report.
We are independent of the entity in accordance with the provisions of Swiss law and the requirements of the Swiss audit profession and we have fulfilled our other ethical responsibilities in accordance with these requirements. We believe that the audit evidence we have obtained is sufficient and appropriate to provide a basis for our opinion.
Our audit approach
Overview Overall materiality: CHF 42.6 million, which represents 0.5% of net assets.
We tailored the scope of our audit in order to perform sufficient work to enable us to provide an opinion on the financial statements as a whole, taking into account the structure of the entity, the accounting processes and controls, and the industry in which the entity operates.
As key audit matter, consistent with the prior year, the following area of focus has been identified:
– Valuation of investment in subsidiary
Audit scope
Key audit matters
Materiality
Audit scopeWe designed our audit by determining materiality and assessing the risks of material misstatement in the financial statements. In particular, we considered where subjective judgements were made; for example, in respect of significant accounting estimates that involved making assumptions and considering future events that are inherently uncertain. As in all of our audits, we also addressed the risk of management override of internal controls, including among other matters consideration of whether there was evidence of bias that represented a risk of material misstatement due to fraud.
204 Coca-Cola HBC 2017 Integrated Annual Report
SWISS STATUTORY REPORTING CONTINUED

MaterialityThe scope of our audit was influenced by our application of materiality. Our audit opinion aims to provide reasonable assurance that the financial statements are free from material misstatement. Misstatements may arise due to fraud or error. They are considered material if, individually or in aggregate, they could reasonably be expected to influence the economic decisions of users taken on the basis of the financial statements.
Based on our professional judgement, we determined certain quantitative thresholds for materiality, including the overall materiality for the financial statements as a whole as set out in the table below. These, together with qualitative considerations, helped us to determine the scope of our audit and the nature, timing and extent of our audit procedures and to evaluate the effect of misstatements, both individually and in aggregate, on the financial statements as a whole.
Overall materiality CHF 42.6 millionHow we determined it 0.5% of net assetsRationale for the materiality benchmark applied
We chose net assets as the benchmark because, in our view, it is the benchmark which reflects the actual substance of the entity. This is a generally accepted benchmark for ultimate holding entities.
Report on key audit matters based on the circular 1/2015 of the Federal Audit Oversight AuthorityKey audit matters are those matters that, in our professional judgement, were of most significance in our audit of the financial statements of the current period. These matters were addressed in the context of our audit of the financial statements as a whole, and in forming our opinion thereon, and we do not provide a separate opinion on these matters.
Valuation of investment in subsidiaryKey audit matter How our audit addressed the key audit matter
See Note 1 and 2.2 to the financial statements of the Company for the Directors’ disclosures of the related accounting policy and the detailed information on the valuation of the investment in subsidiary.
The investment in subsidiary as at 31 December 2017 amounts to CHF 8,501 million.
The valuation of the investment in subsidiary is inherently a matter of judgement as it relies on forecasts of future profitability and cash flows. Macroeconomic volatility, competitor activity and regulatory/fiscal developments can adversely affect each underlying cash – generating unit and potentially the carrying amount the total investments.
The Company’s market capitalization is subject to share price volatility.
Management test the carrying value of the Company’s investment annually by comparing the market capitalisation of the group with the carrying value of the investment.
We reperformed the market capitalisation comparison test performed by management
In addition, we took comfort from the evidence obtained while reviewing management’s goodwill impairment analysis performed for the purposes of the IFRS consolidated financial statements.
As a result of our work, we found management’s assumptions and their determination that no impairment was required to be reasonable, after having reflected the reduction of the investment to reflect the dividend received from Coca Cola HBC Holdings B.V. of CHF 203.4 million.
Responsibilities of the Board of Directors for the financial statementsThe Board of Directors is responsible for the preparation of the financial statements in accordance with the provisions of Swiss law and the Company’s articles of incorporation, and for such internal control as the Board of Directors determines is necessary to enable the preparation of financial statements that are free from material misstatement, whether due to fraud or error.
In preparing the financial statements, the Board of Directors is responsible for assessing the entity’s ability to continue as a going concern, disclosing, as applicable, matters related to going concern and using the going concern basis of accounting unless the Board of Directors either intends to liquidate the entity or to cease operations, or has no realistic alternative but to do so.
205Coca-Cola HBC 2017 Integrated Annual Report
Strategic R
eport
Co
rporate G
overnance
Financial Statem
entsS
wiss S
tatutory R
eporting
Supplem
entary Inform
ation

Auditor’s responsibilities for the audit of the financial statementsOur objectives are to obtain reasonable assurance about whether the financial statements as a whole are free from material misstatement, whether due to fraud or error, and to issue an auditor’s report that includes our opinion. Reasonable assurance is a high level of assurance, but is not a guarantee that an audit conducted in accordance with Swiss law and Swiss Auditing Standards will always detect a material misstatement when it exists. Misstatements can arise from fraud or error and are considered material if, individually or in the aggregate, they could reasonably be expected to influence the economic decisions of users taken on the basis of these financial statements.
A further description of our responsibilities for the audit of the financial statements is located at the website of EXPERTsuisse: http expertsuisse.ch/en/audit-report-for-public-companies. This description forms part of our auditor’s report.
Report on other legal and regulatory requirementsIn accordance with article 728a paragraph 1 item 3 CO and Swiss Auditing Standard 890, we confirm that an internal control system exists which has been designed for the preparation of financial statements according to the instructions of the Board of Directors.
We further confirm that the proposed appropriation of available earnings complies with Swiss law and the Company’s articles of incorporation. We recommend that the financial statements submitted to you be approved.
PricewaterhouseCoopers AG
Michael FoleyAudit expert Auditor in change
Zürich, 16 March 2018
Laura Bucur
206 Coca-Cola HBC 2017 Integrated Annual Report
SWISS STATUTORY REPORTING CONTINUED

Coca‑Cola HBC AG’s financial statements, Zug
Balance sheet Note As at 31 December
CHF thousands
2017 2016
ASSETS Cash and cash equivalents 601 1,648Short‑term receivables from direct and indirect participations 2.1 37,673 7,354Short‑term receivables from third parties 1,126 763Prepaid expenses and accrued income 37 –Total current assets 39,437 9,765Investments in subsidiaries 2.2 8,501,197 8,704,582Property, plant and equipment 1,296 1,465Total non-current assets 8,502,493 8,706,047Total assets 8,541,930 8,715,812 LIABILITIES AND SHAREHOLDERS’ EQUITY Trade payables due to third parties 1,170 806Short‑term liabilities to direct and indirect participations 2.3 2,168 3,493Short‑term interest‑bearing liabilities to direct and indirect participations 2.3 117 2,142Accrued expenses 2.3 20,002 15,605Total short-term liabilities 23,457 22,046Long‑term interest‑bearing liabilities to indirect participations 2.4 – 68,446Provisions 65 –Total long-term liabilities 65 68,446Share capital 2.5 2,484,112 2,456,492Legal capital reserves
Reserves from capital contributions 5,824,716 5,948,183Reserves for treasury shares 2.6 85,298 85,298
Retained earnings Results carried forward 137,297 144,617Loss for the year (11,065) (7,320)
Treasury shares 2.6 (1,950) (1,950)Total shareholders’ equity 2.7 8,518,408 8,625,320Total liabilities and shareholders’ equity 8,541,930 8,715,812
207Coca-Cola HBC 2017 Integrated Annual Report
Strategic R
eport
Co
rporate G
overnance
Financial Statem
entsS
wiss S
tatutory R
eporting
Supplem
entary Inform
ation

Statement of income Note Year ended 31 December
CHF thousands
2017 2016
Dividend income 203,385 160,395Other operating income 2.8 34,420 25,333Total operating income 237,805 185,728 Employee costs (27,463) (14,728)Other operating expenses (15,719) (17,198)Write down of investments 2.2 (203,385) (160,395)Depreciation of property, plant and equipment (197) (213)Total operating expenses (246,764) (192,534) Operating loss (8,959) (6,806) Finance income – 3,568Finance costs (1,835) (3,790) Loss before tax (10,794) (7,028)Direct taxes (271) (292) Loss for the year (11,065) (7,320)
208 Coca-Cola HBC 2017 Integrated Annual Report
SWISS STATUTORY REPORTING CONTINUED
Notes to the financial statements of Coca‑Cola HBC AG, Zug
IntroductionCoca‑Cola HBC AG (‘the Company’) was incorporated on 19 September 2012 by Kar‑Tess Holding. On 11 October 2012, the Company announced a voluntary share exchange offer to acquire all outstanding ordinary registered shares and all American depositary shares of Coca‑Cola Hellenic Bottling Company S.A., Maroussi (GR) (‘CCHBC SA’). As a result of the successful completion of this offer, on 25 April 2013 the Company acquired 96.85% of the issued CCHBC SA shares, including shares represented by American depositary shares, and became the new parent company of the Group (the Company and its direct and indirect subsidiaries). On 17 June 2013, the Company completed its statutory buyout of the remaining shares of CCHBC SA that it did not acquire upon completion of its voluntary share exchange offer.
1. Accounting principles
Accounting principles applied in the preparation of the financial statements
These financial statements have been prepared in accordance with the provisions of commercial accounting as set out in the Swiss Code of Obligations (Art. 957 to 963b CO). Significant accounting and valuation principles are described below:
Dividend income
Dividend income is recognised when the right to receive payment is established.
Other operating income
The Company provides management services to its principal subsidiaries and acts as guarantor to its principal subsidiary, Coca‑Cola HBC Finance B.V. The income from these services is recognised in the accounting period in which the service is provided.
Exchange rate differences
The accounting records of the Company are retained in Euro and translated to Swiss francs (CHF) for presentation purposes. Except for investments in subsidiaries, property, plant and equipment, long‑term liabilities and equity, which are translated at historical rates, all assets and liabilities denominated in foreign currencies are translated into CHF using the closing exchange rate as at 31 December 2017. Income and expenses are translated into CHF at the average exchange rate of the reporting year except for dividend income and related write down of investments (see note 2.2) which are valued at transaction date exchange rate. Net unrealised exchange losses are recorded in the income statement, while net unrealised gains are deferred within accrued liabilities.
Balance sheet as at Income statement for the year ended
Exchange rates 31 December 2017 31 December 2016 31 December 2017 31 December 2016
EUR 1.17 1.07 1.11 1.09USD 0.99 1.03 GBP 1.32 1.26
Investments in subsidiaries
Investments in subsidiaries are valued at historical cost and evaluated for impairment if identified triggering events occur.
Property, plant and equipment
Depreciation is calculated on the basis of the following useful lives and in accordance with the following methods:
Property, plant and equipment Useful life Method
Leasehold improvement (building) 20 years 5% linearLeasehold improvement (office infrastructure) 10 years 10% linearBuilding infrastructure 12 years 8.33% linearFurniture and fixtures, office equipment and other tangible fixed assets 8 years 12.5% linearTelephony infrastructure 7 years 14.29% linearCommunication equipment, computers and PCs 4 years 25% linearTablets 3 years 33.33% linear
Treasury shares
Treasury shares are recognised at acquisition cost and deducted from shareholders’ equity at the time of acquisition. If treasury shares are sold, the gain or loss arising is recognised in the income statement as finance income or finance cost as appropriate.
209Coca-Cola HBC 2017 Integrated Annual Report
Strategic R
eport
Co
rporate G
overnance
Financial Statem
entsS
wiss S
tatutory R
eporting
Supplem
entary Inform
ation

2. Information relating to the balance sheet and statement of income
2.1. Short-term receivables from direct and indirect participationsThe short‑term receivables from direct and indirect participations do not bear interest.
As at 31 December
CHF thousands
Name of participation 2017 2016
Coca‑Cola HBC Schweiz AG, Brüttisellen 14 –CCB Management Services GmbH, Vienna 16,076 6,631Coca‑Cola HBC Finance B.V., Amsterdam 21,583 703LLC Coca‑Cola Eurasia, Nizhni Novgorod – 15Coca‑Cola HBC Business Services Organisation, Sofia – 5Short-term receivables from direct and indirect participations 37,673 7,354
2.2. Investments in subsidiaries As at 31 December
CHF thousands
Direct subsidiary Share of capital Share of votes 2017 2016
Coca‑Cola HBC Holdings B.V., Amsterdam1 100% 100% 8,704,582 8,864,977Write down of investment (203,385) (160,395)Investments in subsidiaries 100% 100% 8,501,197 8,704,582
1. Coca‑Cola HBC Holdings B.V., Amsterdam was incorporated on 26 June 2013.
In 2015 the Company adopted a practice to reduce the value of its investment in Coca‑Cola HBC Holdings B.V. by an amount equal to the dividend received from that subsidiary. The amount of the write down in 2017 is equal to the dividend received in July 2017 from Coca‑Cola HBC Holdings B.V. of CHF203,385 thousand.
The principal direct and indirect participations of the Company are disclosed in Note 15 to the consolidated financial statements.
2.3. Short-term liabilities to direct and indirect participations and accrued expensesThe short‑term liabilities to the direct and indirect participations do not bear interest except for the liability to Coca‑Cola HBC Finance B.V. which is interest bearing.
As at 31 December
CHF thousands
Name of participation 2017 2016
CCB Management Services GmbH, Vienna 1,865 2,820Coca‑Cola Hellenic Business Service Organisation, Sofia 50 4Coca‑Cola HBC Srbija d.o.o., Belgrade 146 –Coca‑Cola HBC Finance B.V. Amsterdam 89 647Coca‑Cola HBC Services, Athens – 17Coca‑Cola HBC Northern Ireland Ltd., Lisburn 18 5Total short-term non interest-bearing liabilities to direct and indirect participations 2,168 3,493
Name of participation 2017 2016
Coca‑Cola HBC Finance B.V., Amsterdam 117 2,142Total short-term interest-bearing liabilities to direct and indirect participations 117 2,142
Accrued expenses 2017 2016
Direct taxes 359 313 Employee related costs (Management incentive plan and vesting of Performance Shares) 15,963 2,848Employee related costs (social security & insurance, payroll taxes) 1,734 1,149Other accrued expenses 1,205 2,360Net unrealised gains from foreign currency translation 741 8,935Total accrued expenses 20,002 15,605
210 Coca-Cola HBC 2017 Integrated Annual Report
SWISS STATUTORY REPORTING CONTINUED

Employee related costs (Management incentive plan and vesting of Performance Shares) as at 31 December 2017 includes an accrual of CHF 12,2 million due to the accelerated vesting of the former CEO’s Performance Share Plan of estimated net 374,152 shares at GBP 24.64 per share.
2.4. Long-term interest-bearing liabilities to indirect participations As at 31 December
CHF thousands
2017 2016
Coca‑Cola HBC Finance B.V., Amsterdam – 68,446
Long‑term interest‑bearing liabilities comprise loans from Coca‑Cola HBC Finance B.V. On 13 August 2015 the Company entered into interest bearing long‑term loan agreements with Coca‑Cola Finance B.V. with a nominal amount of EUR 66,000 thousand and maturing on 31 December 2019. The loan was fully repaid on 28 December 2017.
2.5. Share capital Number of shares Nominal value Total
CHF CHF thousands
Share capital as at 1 January 2016 368,141,297 6.70 2,466,547Cancellation of shares 1 (3,000,000) 6.70 (20,100)Shares issued to employees exercising stock options 1,499,341 6.70 10,045Share capital as at 31 December 2016 366,640,638 6.70 2,456,492
Number of shares Nominal value Total
CHF CHF thousands
Share capital as at 1 January 2017 366,640,638 6.70 2,456,492Shares issued to employees exercising stock options 4,122,401 6.70 27,620Share capital as at 31 December 2017 370,763,039 6.70 2,484,112
2.6. Treasury sharesThe number of treasury shares held by Coca‑Cola HBC AG and its subsidiaries qualifying under article 659b SCO and their movements are as follows:
Treasury shares (held by subsidiaries) Number of sharesAcquisition cost
per share Total
CHF CHF thousands
Total treasury shares at 31 December 2016 3,430,135 24.8673 85,298 Total treasury shares at 31 December 2017 3,430,135 24.8673 85,298
Treasury shares held by the Company Number of sharesAcquisition cost
per share Total
CHF CHF thousands
Treasury shares held by the Company as at 1 January 2016 3,014,925 21.8404 (65,847)Cancellation of shares1 (3,000,000) 21.2990 63,897Treasury shares held by Coca-Cola HBC AG as at 31 December 2016 14,925 130.6600 (1,950)Treasury shares held by Coca-Cola HBC AG as at 31 December 2017 14,925 130.6600 (1,950)
1. On 23 June 2015, the Annual General Meeting adopted a proposal to buy‑back of up to 3,000,000 ordinary shares. The programme started on 17 August 2015 and was completed on 21 December 2015. The Company purchased 3,000,000 of its ordinary shares of CHF 6.70 each at an average price of GBP 1,407.53 per share (minimum price of GBP 1,284.67 and maximum price of GBP 1,548.45). On 21 June 2016, the Annual General Meeting approved the proposal to reduce the share capital of Coca-Cola HBC AG by cancelling the 3,000,000 treasury shares acquired as part of the share buy-back programme described above. The respective reduction of the share capital was completed in September 2016.
211Coca-Cola HBC 2017 Integrated Annual Report
Strategic R
eport
Co
rporate G
overnance
Financial Statem
entsS
wiss S
tatutory R
eporting
Supplem
entary Inform
ation

2. Information relating to the balance sheet and statement of income continued
2.7. Equity Share capital Legal capital reserves Retained earnings Treasury shares Total
Reserves from capital
contributionsReserves for
treasury shares1
CHF thousands
Balance as at 1 January 2016 2,466,547 6,137,760 85,298 144,617 (65,847) 8,768,375Shares issued to employees exercising stock options 10,045 13,462 – – – 23,507Dividends – (159,242) – – – (159,242)Cancellation of shares (20,100) (43,797) – – 63,897 –Loss for the year – – – (7,320) – (7,320)Balance as at 31 December 2016 2,456,492 5,948,183 85,298 137,297 (1,950) 8,625,320 Balance as at 1 January 2017 2,456,492 5,948,183 85,298 137,297 (1,950) 8,625,320Shares issued to employees exercising stock options 27,620 53,368 – – – 80,988Dividends2 – (176,835) – – – (176,835)Loss for the year – – – (11,065) – (11,065)Balance as at 31 December 2017 2,484,112 5,824,716 85,298 126,232 (1,950) 8,518,408
1. Represents the book value of treasury shares held by subsidiaries.2. On 21 June 2017 the shareholders of the Company at the Annual General Meeting approved the distribution of a €0.44 dividend per each ordinary registered share.
The dividend was paid on 25 July 2017 and amounted to CHF 176,835 thousand.
2.8. Other operating income 2017 2016
CHF thousands
Management fees 31,763 22,383Guarantee fee 2,657 2,950Total other operating income 34,420 25,333
Management fees relate to service income earned from services provided to the Company‘s direct and indirect participations.
Guarantee fee is the income the Company receives for the services provided as guarantor to Coca‑Cola HBC Finance B.V.
212 Coca-Cola HBC 2017 Integrated Annual Report
SWISS STATUTORY REPORTING CONTINUED

3. Other information
3.1. Net release of hidden reservesNo hidden reserves were released for the years ended 31 December 2017 or 31 December 2016.
3.2. Number of employeesIn 2017 and 2016 on an annual average basis, the number of full‑time equivalent employees did not exceed 50.
3.3. Operating lease liabilities (not terminable or expiring within 12 months of balance sheet date) Residual term (years) 2017 2016
CHF thousands
Office rental, Turmstrasse 26, Zug 1 to 5 year – 500Total lease liabilities – 500
3.4. Contingent liabilities
Euro medium-term note programmes
In June 2013 the Group established a new €3.0bn Euro medium‑term note programme (the ‘EMTN Programme’). The EMTN Programme was updated in September 2014 and then again in September 2015. Notes are issued under the EMTN Programme through the Company’s wholly owned subsidiary, Coca‑Cola HBC Finance B.V., a private limited liability company established under the laws of the Netherlands, and are guaranteed by the Company.
On 18 June 2013 Coca‑Cola HBC Finance B.V. issued €800m 2.375% notes due 18 June 2020 under the EMTN Programme, which are guaranteed by the Company.
On 10 March 2016 Coca‑Cola HBC Finance B.V. issued €600m 1.875% notes due 11 November 2024 under the EMTN Programme, which are guaranteed by the Company.
As at 31 December 2017, a total of €1.4bn in notes issued under the EMTN Programme were outstanding.
The EMTN Programme has not been updated since September 2015 so further issues under the EMTN Programme are currently not possible pending a further update.
Syndicated multi-currency revolving credit facility
In June 2015, a new syndicated multi‑currency revolving credit facility agreement was signed for €500m. Coca‑Cola HBC Finance B.V. is the original borrower, ING Bank N.V., London Branch the facility agent and the Company and Coca-Cola HBC Holdings B.V are the two guarantors.
Commercial paper programme
In October 2013 the Group established a new €1.0bn Euro commercial paper programme (the ‘CP Programme’). The CP Programme was updated in September 2014 and then again in May 2017. Notes are issued under the CP Programme by Coca‑Cola HBC Finance B.V. and guaranteed by the Company. The outstanding amount under the CP Programme was €120m as at 31 December 2017 (2016: €108.5m).
Credit support provider
On 18 July 2013 the Company signed as credit support provider to Deutsche Bank AG, J.P. Morgan Securities plc, Credit Suisse International, Credit Suisse AG, ING Bank N.V., Societe Generale, Merrill Lynch International and to The Royal Bank of Scotland plc in favour of Coca‑Cola HBC Finance B.V. for the obligations as defined in the ISDA Master Agreements.1
On 24 July 2013 the Company signed as credit support provider to the Governor and Company of the Bank of Ireland, in favour of Coca‑Cola HBC Finance B.V. for the obligations as defined in the ISDA Master Agreement.1
On 8 August 2013 the Company signed as credit support provider to Citibank N.A. in favour of CCHBC Bulgaria AD for the obligations as defined in the ISDA Master Agreement.1
On 8 August 2013 the Company signed as credit support provider to Citibank N.A. in favour of Coca‑Cola HBC Finance B.V. for the obligations as defined in the ISDA Master Agreement.1
On 24 June 2014 the Company signed as credit support provider to Intesa Sanpaolo S.pA. in favour of Coca‑Cola HBC Finance B.V. for the obligations as defined in the ISDA Master Agreement.1
213Coca-Cola HBC 2017 Integrated Annual Report
Strategic R
eport
Co
rporate G
overnance
Financial Statem
entsS
wiss S
tatutory R
eporting
Supplem
entary Inform
ation

3.4. Contingent liabilities continuedOn 5 October 2015 the Company signed as credit support provider to Macquarie Bank International Limited in favour of Coca‑Cola HBC Finance B.V. for the obligations as defined in the ISDA Master Agreement.1
On 22 June 2016 the Company signed as credit support provider to UniCredit Bank AG in favour of Coca‑Cola HBC Finance B.V. for the obligations as defined in the ISDA Master Agreement.1
On 31 August 2016 the Company signed as credit support provider to BNP Paribas in favour of Coca‑Cola HBC Finance B.V. for the obligations as defined in the ISDA Master Agreement.1
On 1 November 2017 the Company signed as credit support provider to Goldman Sachs Global International in favour of Coca‑Cola HBC Finance B.V. for the obligations as defined in the ISDA Master Agreement.1
On 22 December 2017 the Company signed as credit support provider to Citigroup Global Markets Limited in favour of Coca‑Cola HBC Finance B.V. for the obligations as defined in the ISDA Master Agreement.1
1. The ISDA (International Swap Dealers Association) Master Agreement is a standardised form issued by the International Swap Dealers Association Inc. to be used for credit support transactions.
3.5. Significant shareholdersAs at 31 December 2017 and 2016, there were two shareholders exceeding the threshold of 5% voting rights in the Company’s share capital.
Date Number of shares
Percentage of issued share
capital1
Percentage of outstanding share
capital2
Total Kar‑Tess Holding 31.12.2016 85,355,019 23.3% 23.5%Total Kar‑Tess Holding 31.12.2017 85,355,019 23.0% 23.2%Total shareholdings related to The Coca‑Cola Company 31.12.2016 85,112,078 23.2% 23.4%Total shareholdings related to The Coca‑Cola Company 31.12.2017 85,112,078 23.0% 23.2%
1. Basis: total issued share capital including treasury shares. Share basis 370,763,039 as at 31 December 2017 (2016: 366,640,638).2. Basis: total issued share capital excluding treasury shares. Share basis 367,317,979 as at 31 December 2017 (2016: 363,195,578).
3.6. Shareholdings, conversion and option rightsThe table below sets out a comparison of the interests in the Company’s total issued share capital that the members of the Board of Directors (‘Directors’) and Operating Committee hold (all of which, unless otherwise stated, are beneficial interests or are interests of a person connected with a Director or a member of the Operating Committee) and the interests in the Company’s share capital.
31 December 2017 31 December 2016
Number of shares
Percentage of issued share
capital1
Percentage of outstanding
share capital2 Number of shares
Percentage of issued share
capital1
Percentage of outstanding
share capital2
Directors Anastassis G. David3 – – – – – –Dimitris Lois 57,379 0.02% 0.02% 49,142 0.01% 0.01%Zoran Bogdanovic10 19,869 0.01% 0.01% 16,817 0.00% 0.00%Ahmet C. Bozer – – – – – –Olusola (Sola) David‑Borha – – – – – –William W. (Bill) Douglas III 10,000 0.00% 0.00% 10,000 0.00% 0.00%Charlotte J. Boyle4 – – – – – –Antonio D’Amato5 – – – – – –Reto Francioni – – – – – –Anastasios I. Leventis6 – – – – – –Christo Leventis7 – – – – – –José Octavio Reyes – – – – – –Alexandra Papalexopoulou – – – – – –Robert Ryan Rudolph – – – – – –John P. Sechi – – – – – –
214 Coca-Cola HBC 2017 Integrated Annual Report
SWISS STATUTORY REPORTING CONTINUED

31 December 2017 31 December 2016
Number of shares
Percentage of issued share
capital1
Percentage of outstanding share
capital2 Number of shares
Percentage of issued share
capital1
Percentage of outstanding share
capital2
Operating Committee Alain Brouhard 17,304 0.00% 0.00% 14,534 0.00% 0.00%Jan Gustavsson 56,633 0.02% 0.02% 53,027 0.01% 0.01%Keith Sanders 28,555 0.01% 0.01% 27,125 0.01% 0.01%Martin Marcel 9,171 0.00% 0.00% 5,824 0.00% 0.00%Michalis Imellos 16,650 0.00% 0.00% 14,649 0.00% 0.00%Naya Kalogeraki 1,755 0.00% 0.00% 355 0.00% 0.00%Sanda Parezanovic 2,236 0.00% 0.00% 1,477 0.00% 0.00%Sotiris Yannopoulos 12,385 0.00% 0.00% 10,377 0.00% 0.00%
The following table sets out information regarding the stock options and performance shares held by members of the Operating Committee as at 31 December 2017:
Stock options (‘ESOP’) Performance shares (‘PSP’)
Number of
stock optionsAlready
vestedVesting at the
end of 2018 Granted in
2017
Unvested and subject to
performance conditions Vested
Dimitris Lois8, 9 – – – 128,421 426,773 –Alain Brouhard 320,000 320,000 – 24,214 81,275 –Jan Gustavsson 726,000 726,000 – 27,211 91,190 –Keith Sanders 499,000 499,000 – 26,552 88,945 –Martin Marcel 178,000 178,000 – 23,255 76,571 –Michalis Imellos 286,500 286,500 – 30,148 100,755 –Naya Kalogeraki 45,000 45,000 – 20,378 43,189 –Sanda Parezanovic 48,500 48,500 – 20,858 62,646 –Sotiris Yannopoulos 150,500 150,500 – 23,675 78,144 –Zoran Bogdanovic 236,750 236,750 – 25,473 84,841 –
1. Basis: total issued share capital including treasury shares. Share basis 370,763,039 as at 31 December 2017 (2016: 366,640,638).2. Basis: total issued share capital excluding treasury shares. Share basis 367,317,979 as at 31 December 2017 (2016: 363,195,578).3. Anastassis David is a beneficiary of:
(a) a private discretionary trust for the primary benefit of present and future members of the family of the late Anastasios George Leventis, of which Truad Verwaltungs AG is the Trustee, whereby he has an indirect interest with respect to the 85,355,019 shares held by Kar‑Tess Holding S.A.(b) a further private discretionary trust for the primary benefit of present and future members of the family of the late Anastasios George Leventis, of which Selene Treuhand AG is the Trustee, whereby he has an indirect interest with respect to 823,008 shares held by Selene Treuhand AG.
4. Charlotte J. Boyle was appointed to the Board of Directors, the Remuneration Committee and the Nomination Committee on 20 June 2017.5. Antonio D’ Amato retired from the Board of Directors, the Remuneration Committee and the Nomination Committee on 20 June 2017.6. Anastasios I. Leventis is a beneficiary of:
(a) a private discretionary trust for the primary benefit of present and future members of the family of the late Anastasios George Leventis, of which Truad Verwaltungs AG is the Trustee, whereby he has an indirect interest with respect to the 85,355,019 shares held by Kar‑ Tess Holding S.A.(b) a further private discretionary trust for the primary benefit of present and future members of the family of the late Anastasios George Leventis, of which Selene Treuhand AG is the Trustee, whereby he has an indirect interest with respect to 386,879 shares held by Selene Treuhand AG.(c) a further private discretionary trust for the primary benefit of present and future members of the family of the late Christodoulos Papaneokleus Leventis, of which Mervail Company (PTC) Limited is the Trustee, whereby he has an indirect interest with respect to 623,664 shares held by Carlcan Holding Limited.
7. Christo Leventis is a beneficiary of:(a) a private discretionary trust for the primary benefit of present and future members of the family of the late Anastasios George Leventis, of which Truad Verwaltungs AG is the Trustee, whereby he has an indirect interest with respect to the 85,355,019 shares held by Kar‑ Tess Holding S.A.(b) a further private discretionary trust for the primary benefit of present and future members of the family of the late Anastasios George Leventis, of which Selene Treuhand AG is the Trustee, whereby he has an indirect interest with respect to 498,545 shares held by Selene Treuhand AG.(c) a further private discretionary trust for the primary benefit of present and future members of the family of the late Christodoulos Papaneokleus Leventis, of which Mervail Company (PTC) Limited is the trustee, whereby he has an indirect interest with respect to 757,307 shares held by Carlcan Holding Limited.
8. Dimitris Lois’ heirs exercised 1,700,000 options under ESOP between 2 October and 31 December 2017. 9. Following the passing of Dimitris Lois, the Remuneration Committee determined at its meeting in March 2018 that, in line with the terms of the PSP, PSP awards
granted to Dimitris Lois in 2015, 2016 and 2017 should vest pro‑rated for time and performance up to 2 October 2017. PSP awards therefore vested over in aggregate 396,402 shares. The remainder of the shares subject to PSP awards granted to Dimitris Lois lapsed. The Remuneration Committee further determined that these awards should vest immediately to Dimitris Lois’ heirs.
10. Zoran Bogdanovic will be formerly appointed to the Board of Directors at the next AGM in June 2018.
215Coca-Cola HBC 2017 Integrated Annual Report
Strategic R
eport
Co
rporate G
overnance
Financial Statem
entsS
wiss S
tatutory R
eporting
Supplem
entary Inform
ation

3.7. Fees paid to the auditorThe audit and other fees paid to the auditor are disclosed in Note 8 of the consolidated financial statements.
3.8. Conditional capitalOn 25 April 2013, the shareholders’ meeting agreed to the creation of conditional capital in the maximum amount of CHF 245,601 thousand, through issuance of a maximum of 36,657 thousand fully paid‑in registered shares with a par value of CHF 6.70 each upon exercise of options issued to members of the Board of Directors, members of the management, employees or advisers of the Company, its subsidiaries and other affiliated companies. The share capital of CHF 2,484,112 thousand as disclosed in the balance sheet differs from the share capital in the commercial register of CHF 2,456,492 thousand as per 31 December 2017 due to the exercise of management options in the course of full year 2017.
Conditional capital Number of sharesBook value per
share CHF Total CHF thousand
Agreed conditional capital as per shareholders’ meeting on 25 April 2013 36,656,843 6.70 245,601Shares issued to employees exercising stock options until 31 December 2015 (1,650,152) 6.70 (11,056)Shares issued to employees exercising stock options in 2016 (1,499,341) 6.70 (10,046)Remaining conditional capital as at 31 December 2016 33,507,350 6.70 224,499Shares issued to employees exercising stock options in 2017 (4,122,401) 6.70 (27,620)Remaining conditional capital as at 31 December 2017 29,384,949 6.70 196,879
216 Coca-Cola HBC 2017 Integrated Annual Report
SWISS STATUTORY REPORTING CONTINUED

Proposed appropriation of available earnings and reserves / declaration of dividend
1. Proposed appropriation of available earningsAvailable earnings and reserves CHF thousands
Balance brought forward from previous years 137,297Net loss for the year (11,065)Total available retained earnings to be carried forward 126,232 Reserves from capital contributions before distribution 5,824,716Total available retained earnings and reserves 5,950,948
2. Proposed declaration of a dividend from reservesThe Board of Directors proposes to declare a gross dividend of EUR 0.54 on each ordinary registered share with a par value of CHF 6.70 from the general capital contribution reserve. Own shares held directly by the Company are not entitled to dividends. The total aggregate amount of the dividends shall be capped at an amount of CHF 300,000 thousand (the ‘Cap’), and thus will reduce the general capital contribution reserve of CHF 5,824,716 thousand, as shown in the financial statements as of 31 December 2017, by a maximum of CHF 300,000 thousand. To the extent that the dividend calculated on EUR 0.54 per share would exceed the Cap on the day of the Annual General Meeting, due to the exchange rate determined by the Board of Directors in its reasonable opinion, the Euro per share amount of the dividend shall be reduced on a pro-rata basis so that the aggregate amount of all dividends paid does not exceed the Cap. Payment of the dividend shall be made at such time and with such record date as shall be determined by the Annual General Meeting and the Board of Directors.
3. Proposed appropriation of reserves/declaration of dividend
Variant 1: Dividend of EUR 0.54 at current exchange ratioAs of 31 December 2017 CHF thousands
Reserves from capital contributions before distribution 5,824,716Proposed dividend of EUR 0.541 (236,241)Reserves from capital contributions after distribution 5,588,475
1. Illustrative at an exchange rate of CHF 1.18 per EUR. Assumes that the shares entitled to a dividend amount to 370,748,114.
Variant 2: Dividend if Cap is triggeredAs of 31 December 2017 CHF thousands
Reserves from capital contributions before distribution 5,824,716(Maximum) dividend if Cap is triggered2 (300,000)(Minimum) Reserves from capital contributions after distribution 5,524,716
2. Dividend is capped at a total aggregate amount of CHF 300,000 thousand.
217Coca-Cola HBC 2017 Integrated Annual Report
Strategic R
eport
Co
rporate G
overnance
Financial Statem
entsS
wiss S
tatutory R
eporting
Supplem
entary Inform
ation

Report of the statutory auditorto the General MeetingCoca‑Cola HBC AGSteinhausen/Zug
Report of the statutory auditor on the statutory remuneration reportWe have audited the accompanying remuneration report of Coca‑Cola HBC AG for the year ended 31 December 2017. The audit was limited to the information according to articles 14–16 of the Ordinance against Excessive Compensation in Stock Exchange Listed Companies (Ordinance) on pages 220 to 222 of the remuneration report.
Board of Directors’ responsibilityThe Board of Directors is responsible for the preparation and overall fair presentation of the remunera‑tion report in accordance with Swiss law and the Ordinance against Excessive Compensation in Stock Exchange Listed Companies (Ordinance). The Board of Directors is also responsible for designing the remuneration system and defining individual remuneration packages.
Auditor’s responsibilityOur responsibility is to express an opinion on the accompanying remuneration report. We conducted our audit in accordance with Swiss Auditing Standards. Those standards require that we comply with ethical requirements and plan and perform the audit to obtain reasonable assurance about whether the remuner‑ation report complies with Swiss law and articles 14–16 of the Ordinance.
An audit involves performing procedures to obtain audit evidence on the disclosures made in the remu‑neration report with regard to compensation, loans and credits in accordance with articles 14–16 of the Ordinance. The procedures selected depend on the auditor’s judgment, including the assessment of the risks of material misstatements in the remuneration report, whether due to fraud or error. This audit also includes evaluating the reasonableness of the methods applied to value components of remuneration, as well as assessing the overall presentation of the remuneration report.
We believe that the audit evidence we have obtained is sufficient and appropriate to provide a basis for our opinion.
OpinionIn our opinion, the remuneration report of Coca‑Cola HBC AG for the year ended 31 December 2017 complies with Swiss law and articles 14–16 of the Ordinance.
PricewaterhouseCoopers SA
Michael FoleyAudit expert Auditor in change
Lausanne, 16 March 2018
Laura Bucur
218 Coca-Cola HBC 2017 Integrated Annual Report
SWISS STATUTORY REPORTING CONTINUED
Statutory Remuneration Report
Additional disclosures regarding the Statutory Remuneration Report
The section below is in line with the Ordinance against excessive pay in stock exchange listed companies, which requires disclosure of the elements of compensation paid to the Company’s Board of Directors and the Operating Committee. The numbers relate to the calendar years of 2017 and 2016. In the information presented below, the exchange rate used for conversion of 2017 remuneration data from Euro to CHF is 1/1.1202 and the exchange rate used for conversion of 2016 remuneration data from Euro to CHF is 1/1.0903.
As the Company is headquartered in Switzerland, it is required for statutory purposes to present compensation data for two consecutive years, 2016 and 2017. The applicable methodology used to calculate the value of stock option and performance shares follows Swiss standards. In 2017 and 2016, the fair value of performance shares from the 2017 and 2016 grants is calculated based on the performance share awards that are expected to vest, and not the stock options that vested in 2017 and 2016 respectively. Below is the relevant information for Swiss statutory purposes.
Compensation for acting members of governing bodies
The Company‘s Directors believe that the level of remuneration offered to Directors and the members of the Operating Committee should reflect their experience and responsibility as determined by, among other factors, a comparison with similar multinational companies and should be sufficient to attract and retain high‑calibre Directors who will lead the Group successfully. In line with the Group‘s commitment to maximise shareholder value, its policy is to link a significant proportion of remuneration for its Operating Committee to the performance of the business through short and long‑term incentives. Therefore, the Operating Committee members’ financial interests are closely aligned with those of the Company’s shareholders through the equity‑related long‑term compensation plan.
The total remuneration of the Directors and members of the Operating Committee of the Company, including performance share grants, during 2017 amounted to CHF 22.5 million. Out of this, the amount relating to the expected value of performance share awards granted in relation to 2017 was CHF 7.3 million. Pension and post‑employment benefits for Directors and the Operating Committee of the Company during 2017 amounted to CHF 0.8 million.
219Coca-Cola HBC 2017 Integrated Annual Report
Strategic R
eport
Co
rporate G
overnance
Financial Statem
entsS
wiss S
tatutory R
eporting
Supplem
entary Inform
ation

Compensation of the Board of Directors 2017 CHF
Fees
Cash andnon-cash
benefits1
Cashperformance
incentives
Pension and post-employment
benefits
Total fair value of stock options at
the date grantedTotal
compensation
Anastassis G. David 78,411 – – – – 78,411Ahmet C. Bozer 78,411 – – – – 78,411Olusola (Sola) David‑Borha2 101,285 – – – – 101,285William W. (Bill) Douglas III 109,216 – – – – 109,216Antonio D’Amato 3 45,366 – – – – 45,366Charlotte J. Boyle4 45,366 - - - - 45,366Reto Francioni5 122,678 – – – – 122,678Anastasios I. Leventis 90,733 – – – – 90,733Christo Leventis6 80,790 – – – – 80,790José Octavio Reyes7 89,693 – – – – 89,693Alexandra Papalexopoulou 103,055 – – – – 103,055Robert Ryan Rudolph8 84,605 – – – – 84,605John P. Sechi 93,869 – – – – 93,869Dimitris Lois9 – – – – – –Total Board of Directors 1,123,478 – – – – 1,123,478
1. Allowances consist of cost of living allowance, housing support, Employee Share Purchase Plan, private medical insurance relocation expenses, home trip allowance, lump sum expenses and similar allowances.
2. For Olusola (Sola) David‑Borha, on top of her fees of CHF 93,869, the Group paid CHF 7,416 in social security contributions as required by Swiss legislation.3. Antonio D’ Amato retired from the Board of Directors, the Remuneration Committee and the Nomination Committee on 20 June 2017. The Group has applied
a half-year period base fee of CHF 45,366.4. Charlotte J. Boyle was appointed to the Board of Directors, the Remuneration Committee and the Nomination Committee on 20 June 2017. The Group has applied
a half‑year period base fee of CHF 45,366.5. For Reto Francioni, on top of his fees of CHF 113,696, the Group paid CHF 8,982 in social security contributions as required by Swiss legislation.6. In June 2017 social security contributions of CHF 2,379, withheld in December 2016, were returned to Christo Leventis, on top of his fees of CHF 78,411, as he was
deemed not subject to Swiss social security.7. For José Octavio Reyes, on top of his fees of CHF 84,572, the Group paid CHF 5,121 in social security contributions as required by Swiss legislation.8. For Robert Ryan Rudolph, on top of his fees of CHF 78,411, the Group paid CHF 6,194 in social security contributions as required by Swiss legislation.9. Dimitris Lois’ compensation was based on his role as CEO, member of the Operating Committee Team, and his employment agreement. Dimitris Lois was not
entitled and did not receive additional compensation as a Director.
Non‑Executive Directors do not participate in any of the Group’s incentive plans, nor do they receive any retirement benefits.
220 Coca-Cola HBC 2017 Integrated Annual Report
SWISS STATUTORY REPORTING CONTINUED

Compensation of the Board of Directors 2016 CHF
Fees
Cash andnon‑cash
benefits1
Cashperformance
incentives
Pension and post‑employment
benefits
Total fair value of stock options at the
date grantedTotal
compensation
Anastassis G. David 73,490 – – – – 73,490Ahmet C. Bozer2 37,555 – – – – 37,555George A. David3 – – – – – –Olusola (Sola) David‑Borha4 94,712 – – – – 94,712William W. (Bill) Douglas III5 52,310 – – – – 52,310Irial Finan6 35,935 – – – – 35,935Antonio D’Amato 84,920 – – – – 84,920Reto Francioni7 58,738 – – – – 58,738Sir Michael Llewellyn‑Smith8 52,522 – – – – 52,522Nigel Macdonald9 49,757 – – – – 49,757Anastasios I. Leventis10 43,457 – – – – 43,457Christo Leventis11 40,509 – – – – 40,509José Octavio Reyes12 85,435 – – – – 85,435Alexandra Papalexopoulou13 90,822 – – – – 90,822Robert Ryan Rudolph14 40,509 – – – – 40,509John P. Sechi15 87,805 – – – – 87,805Dimitris Lois16 – – – – – –Total Board of Directors 928,476 – – – – 928,476
1. Allowances consist of cost of living allowance, housing support, Employee Share Purchase Plan, private medical insurance, relocation expenses, home trip allowance, lump sum expenses and similar allowances.
2. Ahmet C. Bozer was appointed to the Board on 21 June 2016. The Group has applied a half‑year period base fee of CHF 37,555.3. George A. David retired from the Board and the Social Responsibility Committee on 21 June 2016. For the first half of 2016, George A. David waived any fee in
respect to his membership on the Board of Directors or any Board Committee.4. For Olusola (Sola) David Borha, on top of the base fee of CHF 73,490 and Audit and Risk Committee membership fee of CHF 14,315, the Group paid CHF 6,907 in
social security contributions as required by Swiss legislation.5. William W. (Bill) Douglas III was appointed to the Board and the Audit and Risk Committee on 21 June 2016. The Group has applied a half‑year period base fee of CHF
37,555 and CHF 14,755 for the Audit and Risk Committee. 6. Irial Finan retired from the Board on 21 June 2016. The Group has applied a half‑year period base fee of CHF 35,935.7. Reto Francioni was appointed to the Board, the Remuneration Committee and the Nomination Committee on 21 June 2016. For Reto Francioni on top of the fees
of CHF 54,455 the Group paid CHF 4,283 in social security contributions as required by Swiss legislation. The Group has applied a half-year period base fee of CHF 37,555, CHF 5,902 for the Nomination Committee, CHF 2,951 for the Remuneration Committee and CHF 8,047 for Senior Independent Director fee.
8. Sir Michael Llewellyn‑Smith retired from the Board, the Remuneration Committee, the Nomination Committee and the Social Responsibility Committee on 21 June 2016. For the first half of 2016, Sir Michael Llewellyn‑Smith waived his membership fee on the Social Responsibility Committee. The Group has applied a half‑year period fee of CHF 5,529 for the Nomination Committee Chairmanship, CHF 5,529 for the Remuneration Committee Chairmanship, CHF 5,529 for the Senior Independent Director fee and a CHF 35,935 base fee.
9. Nigel Macdonald retired from the Board and the Audit and Risk Committee on 21 June 2016. The Group has applied a half‑year period fee of CHF 13,822 for the Audit and Risk Committee Chairmanship and a CHF 35,935 base fee.
10. For Anastasios I. Leventis, the Group has applied a half‑year period base fee of CHF 37,555 and CHF 5,902 for the Social Responsibility Committee Chairmanship. For the first half of 2016, Anastasios I. Leventis waived any fee in respect to his membership on the Board of Directors or any Board Committee.
11. For Christo Leventis, on top of the base fee of CHF 37,555, the Group paid CHF 2,954 in social security contributions as required by Swiss legislation. The Group has applied a half‑year period base fee of CHF 40,509. For the first half of 2016, Christo Leventis waived any fee in respect to his membership on the Board of Directors or any Board Committee.
12. For José Octavio Reyes, on top of the base fee of CHF 73,490 and Social Responsibility Committee membership fee of CHF 5,715, the Group paid a social security contribution of CHF 6,230 as required by Swiss legislation.
13. For Alexandra Papalexopoulou on top of the full year base fees of CHF 73,490 and CHF 5,715 for the Nomination Committee, the Group has applied a half‑year period fee of CHF 2,951 for the Social Responsibility Committee as required by Swiss legislation, a half year period membership fee of CHF 2,764 as member of the Remuneration Committee and a half‑year period fee of CHF 5,902 as Chair of the Remuneration Committee.
14. Robert Ryan Rudolph was appointed to the Board on 21 June 2016. For Robert Ryan Rudolph, on top of the base half‑year fee of CHF 37,555, the Group paid, as required by Swiss legislation, a social security contribution of CHF 2,954.
15. For John P. Sechi the Group has applied a full year period fee of CHF 14,315 for the Audit and Risk Committee membership and a CHF 73,490 base fee.16. Dimitris Lois’ compensation was based on his role as CEO and member of the Operating Committee, according to his employment contract. Dimitris Lois was not
entitled to and did not receive additional compensation as a Director.
Non‑Executive Directors do not participate in any of the Group’s incentive plans, nor do they receive any retirement benefits.
221Coca-Cola HBC 2017 Integrated Annual Report
Strategic R
eport
Co
rporate G
overnance
Financial Statem
entsS
wiss S
tatutory R
eporting
Supplem
entary Inform
ation

Compensation of the Operating CommitteeThe total remuneration paid to or accrued for the Operating Committee for 2017 amounted to CHF 22.5 million.
2017 CHF
Base salary
Cash andnon-cash
benefits1
Cashperformance
incentives2
Pension and post-employment
benefits3
Total fair value of performance shares at the date granted4
Total compensation
Dimitris Lois5, 6, Chief Executive Officer (highest compensated member of the Operating Committee) 954,005 603,522 724,976 132,354 2,217,695 4,632,552Zoran Bogdanovic7, Chief Executive Officer 65,347 40,651 0 6,498 48,876 161,372Other members 4,194,756 5,066,461 2,719,887 699,118 5,057,260 17,737,482Total Operating Committee 5,214,108 5,710,634 3,444,863 837,970 7,323,831 22,531,406
1. Cash and non‑cash benefits consist of cost of living allowance, housing support, schooling, Employee Share Purchase Plan, private medical insurance, relocation expenses, home trip allowance, employer social security contributions, lump sum expenses and similar allowances.
2. The cash performance incentives represent the monetary value that was paid under MIP in 2017 reflecting the 2016 business performance, inclusive of the value that was paid under LTIP in 2017 reflecting the 2014‑2016 business performance for Naya Kalogeraki, Marcel Martin and Sanda Parezanovic.
3. Members of the Operating Committee participate in the pension plan of their employing entity, as appropriate.4. Values under long‑term incentives represent the fair value of performance shares that are expected to vest for the 2017 grant in order to comply with Swiss
reporting guidelines.5. Dimitris Lois’ compensation was based on his role as CEO, member of the Operating Committee Team, and his employment agreement. Dimitris Lois was not
entitled to and did not receive the fixed compensation applicable for non‑Executive Directors of the Board of Directors.6. Dimitris Lois’ compensation reflects the period 1 January to 2 October 2017 and includes 2 months’ payment made to the heirs as per Swiss law. Total fair value of
performance shares at the date granted has been prorated for the period 1 January to 2 October 2017.7. Zoran Bogdanovic’s compensation as CEO reflects the period 7 December to 31 December 2017. His compensation for the period 1 January to 6 December 2017
is included under “Other Members”. Total fair value of performance shares at the date granted has been prorated for the period 7 December to 31 December 2017.
The total remuneration paid to or accrued for the Operating Committee for 2016 amounted to CHF 26.6 million.
2016 CHF
Base salary
Cash andnon‑cash
benefits1
Cashperformance
incentives2
Pension and post‑employment
benefits3
Total fair value of stock options at the
date granted4 Total compensation
Dimitris Lois, Chief Executive Officer (highest compensated member of the Operating Committee)5 979,959 605,006 934,732 171,448 2,191,279 4,882,424Other members6,7 4,541,369 8,872,660 3,551,429 706,926 4,064,975 21,737,359Total Operating Committee 5,521,328 9,477,666 4,486,161 878,374 6,256,254 26,619,783
1. Allowances consist of cost of living allowance, housing, support, schooling, Employee Share Purchase Plan, private medical insurance, relocation expenses, employer social security contributions, lump sum expenses and similar allowances.
2. The bonus represents the monetary value that was paid under MIP in 2016 reflecting the 2015 business performance.3. Members of the Operating Committee participate in the pension plan of their employing entity, as appropriate.4. Values under long‑term incentives represent the fair value of performance shares that are expected to vest for the 2016 grant in order to comply with Swiss
reporting guidelines. 5. Dimitris Lois’ compensation is based on his role as CEO and member of the Operating Committee, according to his employment contract. Dimitris Lois is not
entitled to and does not receive the fixed compensation applicable for non‑Executive Directors of the Board of Directors.6. John Brady left the Group on 31 December 2016.7. Naya Kalogeraki was appointed to the role of Group Commercial Director on 1 July 2016.
Credits and loans granted to governing bodiesIn 2017, there were no credits or loans granted to active or former members of the Company’s Board of Directors, members of the Operating Committee or to any related persons. There are no outstanding credits or loans.
222 Coca-Cola HBC 2017 Integrated Annual Report
SWISS STATUTORY REPORTING CONTINUED

The Group uses certain Alternative Performance Measures (APMs) in making financial, operating and planning decisions as well as in evaluating and reporting its performance. These APMs provide additional insights and understanding to the Group’s underlying operating and financial performance, financial condition and cash flow. The APMs should be read in conjunction with and do not replace by any means the directly reconcilable IFRS line items.
Definitions and reconciliations of Alternative Performance Measures (APMs)
1. Comparable APMs1
In discussing the performance of the Group, “comparable” measures are used, which are calculated by deducting from the directly reconcilable IFRS measures the impact of the Group’s restructuring costs, the mark‑to‑market valuation of the commodity hedging activity and certain other tax items, which are collectively considered as items impacting comparability, due to their nature. More specifically the following items are considered as items that impact comparability:
1. Restructuring costs
Restructuring costs comprise costs arising from significant changes in the way the Group conducts business, such as significant supply chain infrastructure changes, outsourcing of activities and centralisation of processes. These costs are included within the income statement line ‘Operating expenses’. However, they are excluded from the comparable results in order for the user to obtain a better understanding of the Group’s operating and financial performance achieved from underlying activity.
2. Commodity hedging
The Group has entered into certain commodity derivative transactions in order to hedge its exposure to commodity price risk. Although these transactions are economic hedging activities that aim to manage our exposure to sugar, aluminium and gasoil price volatility, they do not qualify for hedge accounting. In addition, the Group recognises certain derivatives embedded within commodity purchase contracts that have been accounted for as stand‑alone derivatives and do not qualify for hedge accounting. The fair value gains and losses on the derivatives and embedded derivatives are immediately recognised in the income statement in the cost of goods sold and operating expenses line items. The Group’s comparable results exclude the gains or losses resulting from the mark‑to‑market valuation of these derivatives and embedded derivatives. These gains or losses are reflected in the comparable results in the year when the underlying transactions occur, to match the profit or loss to that of the corresponding underlying transactions. We believe this adjustment provides useful information related to the impact of our economic risk management activities.
3. Other tax items
Other tax items represent the tax impact of changes in income tax rates affecting the opening balance of deferred tax arising during the year, included in the Tax line item of the income statement. These are excluded from comparable after‑tax results in order for the user to obtain a better understanding of the Group’s underlying financial performance.
1. Comparable APMs refer to comparable cost of goods sold, comparable gross profit, comparable operating expenses, comparable EBIT, comparable EBIT margin, comparable Adjusted EBITDA, comparable tax, comparable net profit and comparable EPS.
The Group discloses comparable performance measures to enable users to focus on the underlying performance of the business on a basis which is common to both years for which these measures are presented.
The reconciliation of comparable measures to the directly related measures calculated in accordance with IFRS is as follows:
Reconciliation of comparable financial indicators (numbers in € million except per share data)2017
Cost ofgoods sold Gross profit
Operating expenses EBIT
Adjusted EBITDA Tax Net profit1 EPS (€)
As reported (4,083) 2,439 (1,849) 590 928 (138) 426 1.168Restructuring costs – – 29 29 20 (7) 22 0.061Commodity hedging 3 3 (1) 2 2 (1) 1 0.004Other tax items – – – – – – – –Comparable (4,080) 2,443 (1,822) 621 949 (146) 450 1.233
2016
Cost ofgoods sold Gross profit
Operating expenses EBIT
Adjusted EBITDA Tax Net profit1 EPS (€)
As reported (3,920) 2,299 (1,793) 506 846 (114) 344 0.949Restructuring costs – – 38 38 20 (8) 30 0.082Commodity hedging (25) (25) (2) (27) (27) 8 (19) (0.052)Other tax items – – – – – (2) (2) (0.007)Comparable (3,945) 2,274 (1,757) 518 839 (117) 352 0.972
Figures are rounded.1. Net profit and comparable net profit refer to net profit and comparable net profit respectively after tax attributable to owners of the parent.
223Coca-Cola HBC 2017 Integrated Annual Report
Strategic R
eport
Co
rporate G
overnance
Financial Statem
entsS
wiss S
tatutory R
eporting
Supplem
entary Inform
ation
ALTERNATIVE PERFORMANCE MEASURES

Reconciliation of Comparable EBIT per reportable segment (numbers in € million) 2017
Established Developing Emerging Consolidated
EBIT 238 92 260 590Restructuring costs 13 2 14 29Commodity hedging (1) (1) 4 2Comparable EBIT 250 92 278 621
2016
Established Developing Emerging Consolidated
EBIT 237 93 177 506Restructuring costs 9 6 22 38Commodity hedging (4) (2) (21) (27)Comparable EBIT 242 97 178 518
Figures are rounded.
2. FX-neutral APMsA business like ours, operating in 28 countries and with many different currencies, is bound to be affected by foreign exchange movements, and we report our financial results to reflect this. However, we manage the business against targets which are set to be comparable between years and within them, for otherwise foreign currency movements would undermine our ability to drive the business forward and control it. Through this Report, as in previous years, we will highlight comparable results and foreign‑exchange‑neutral results as well as the audited results which reflect the actual foreign currency effects experienced. It is through the relentless focus on managing by using comparable figures that we have succeeded in delivering significantly improved performance, although we recognise that in the shorter term currency movements may distort the underlying trends.
The Group therefore also evaluates its operating and financial performance on an FX‑neutral basis (i.e. without giving effect to the impact of variation of foreign currency exchange rates from year to year). FX‑neutral APMs are calculated by adjusting prior year amounts for the impact of exchange rates applicable to the current year. FX‑neutral measures enable users to focus on the performance of the business on a basis which is not affected by changes in foreign currency exchange rates applicable to the Group’s operating activities from year to year. The most common FX-neutral measures used by the Group are:
1. FX‑neutral net sales revenue and FX‑neutral net sales revenue per unit case
FX‑neutral net sales revenue and FX‑neutral net sales revenue per unit case are calculated by adjusting prior‑year net sales revenue for the impact of changes in exchange rates applicable in the current year.
2. FX‑neutral comparable input costs per unit case
FX‑neutral comparable input costs per unit case is calculated by adjusting prior‑year commodity costs and more specifically, sugar, resin, aluminium and fuel commodity costs, excluding commodity hedging as described above; and other raw materials costs for the impact of changes in exchange rates applicable in the current year.
The calculations of the FX‑neutral APMs and the reconciliation to the most directly related measures calculated in accordance with IFRS are as follows:
Reconciliation of FX-neutral net sales revenue per unit case (numbers in € million unless otherwise stated) 2017
Established Developing Emerging Consolidated
Net sales revenue 2,436 1,173 2,912 6,522Currency impact – – – –FX‑neutral net sales revenue 2,436 1,173 2,912 6,522Volume (m unit cases) 613 394 1,097 2,104FX-neutral net sales revenue per unit case (€) 3.97 2.98 2.66 3.10
2016
Established Developing Emerging Consolidated
Net sales revenue 2,408 1,094 2,717 6,219Currency impact (15) 18 (64) (62)FX‑neutral net sales revenue 2,392 1,112 2,653 6,157Volume (m unit cases) 607 383 1,068 2,058FX‑neutral net sales revenue per unit case (€) 3.94 2.90 2.48 2.99
Figures are rounded.
224 Coca-Cola HBC 2017 Integrated Annual Report
ALTERNATIVE PERFORMANCE MEASURES CONTINUED

3. Other APMs
Adjusted EBITDA
Adjusted EBITDA is calculated by adding back to operating profit the depreciation and impairment of property, plant and equipment, the amortisation and impairment of intangible assets, the employee share option and performance share costs and items, if any, reported in the line ‘Other non‑cash items’ of the consolidated cash flow statement. Adjusted EBITDA is intended to provide useful information to analyse the Group’s operating performance excluding the impact of operating non‑cash items as defined above. It is also intended to measure the level of financial leverage of the Group by comparing Adjusted EBITDA to Net debt.
Adjusted EBITDA is not a measure of profitability and liquidity under IFRS and has limitations, some of which are as follows: Adjusted EBITDA does not reflect our cash expenditures, or future requirements, for capital expenditures or contractual commitments; Adjusted EBITDA does not reflect changes in, or cash requirements for, our working capital needs; and although depreciation and amortisation are non‑cash charges, the assets being depreciated and amortised will often have to be replaced in the future, and Adjusted EBITDA does not reflect any cash requirements for such replacements. Because of these limitations, Adjusted EBITDA should not be considered as a measure of discretionary cash available to us and should be used only as a supplementary APM.
Free cash flow
Free cash flow is an APM used by the Group and defined as cash generated by operating activities after payments for purchases of property, plant and equipment net of proceeds from sales of property, plant and equipment and including principal repayments of finance lease obligations. Free cash flow is intended to measure the cash generation from the Group’s business, based on operating activities, including the efficient use of working capital and taking into account its net payments for purchases of property, plant and equipment. The Group considers the purchase and disposal of property, plant and equipment as ultimately non-discretionary since ongoing investment in plant, machinery, technology and marketing equipment, including coolers, is required to support the day‑to‑day operations and the CCHBC Group’s growth prospects. The Group presents free cash flow because it believes the measure assists users of the financial statements in understanding the Group’s cash‑generating performance as well as availability for interest payment, dividend distribution and own retention. The free cash flow measure is used by management for its own planning and reporting purposes since it provides information on operating cash flows, working capital changes and net capital expenditure that local managers are most directly able to influence.
Free cash flow is not a measure of cash generation under IFRS and has limitations, some of which are as follows: free cash flow does not represent the Group’s residual cash flow available for discretionary expenditures since the Group has debt payment obligations that are not deducted from the measure; free cash flow does not deduct cash flows used by the Group in other investing and financing activities; and free cash flow does not deduct certain items settled in cash. Furthermore, other companies in the industry in which the Group operates may calculate free cash flow differently, limiting its usefulness as a comparative measure.
225Coca-Cola HBC 2017 Integrated Annual Report
Strategic R
eport
Co
rporate G
overnance
Financial Statem
entsS
wiss S
tatutory R
eporting
Supplem
entary Inform
ation

Capital expenditure
The Group uses capital expenditure as an APM to ensure that its cash spending is in line with its overall strategy for the use of cash. Capital expenditure is defined as payments for purchases of property, plant and equipment plus principal repayments of finance lease obligations less proceeds from sale of property, plant and equipment.
The following table illustrates how Adjusted EBITDA, free cash flow and capital expenditure are calculated:
2017
€ million2016
€ million
Operating profit (EBIT) 590 506Depreciation and impairment of property, plant and equipment 317 332Employee share options and performance shares 21 8Other non‑cash items included in operating income – (1)Adjusted EBITDA 927 846Gains on disposal of non‑current assets (4) (3)Decrease in working capital 9 12Tax paid (128) (92)Net cash from operating activities 804 763 Payments for purchases of property, plant and equipment (410) (348)Principal repayments of finance lease obligations (7) (20)Proceeds from sale of property, plant and equipment 39 36Capital expenditure (378) (332) Net cash from operating activities 804 763Capital expenditure (378) (332)Free cash flow 426 431
Figures are rounded.
Net debt
Net debt is an APM used by management to evaluate the Group’s capital structure and leverage. Net debt is defined as current borrowings plus non-current borrowings less cash and cash equivalents and time deposits classified as other financial assets, as illustrated below:
As at 31 December
2017
€ million2016
€ million
Current borrowings 166 157Non‑current borrowings 1,460 1,468Other financial assets – time deposits (151) –Cash and cash equivalents (724) (573)Net debt 752 1,051
Figures are rounded.
226 Coca-Cola HBC 2017 Integrated Annual Report
ALTERNATIVE PERFORMANCE MEASURES CONTINUED

Independent Assurance Statement on the 2017 Integrated Annual Report
To the management and stakeholders of Coca-Cola Hellenic Bottling Company AG:denkstatt GmbH was commissioned by Coca-Cola Hellenic Bottling Company AG (hereinafter referred to as “the Company”) to provide independent third‑party assurance, in accordance with the AA1000 Assurance Standard (AA1000AS) for the printed and downloadable pdf versions of the Company’s 2017 Integrated Annual Report (hereinafter referred to as “the Report”). We have reviewed all sustainability‑related content and data included in the Report. Financial data were not reviewed as part of this process. The assurance engagement covered the nature and extent of the Company’s incorporation of the principles of inclusivity, materiality and responsiveness for stakeholder dialogue contained in the AA1000 Series. The application level of the Global Reporting Initiative (GRI Standards) has been verified.
denkstatt is an independent professional services company. Our team of experts has extensive professional experience of assurance engagements related to non‑financial information and sustainability management, meaning it is qualified to conduct this independent assurance engagement. denkstatt has implemented a certified quality and environmental management system which complies with the requirements of ISO 9001 and ISO 14001, and accordingly maintains a comprehensive quality control system.
Management responsibilitiesThe Company’s management is responsible for preparing the Report, statements within it and related website content. Management is also responsible for identifying stakeholders and material issues, defining commitments with respect to sustainability performance, and establishing and maintaining appropriate performance management and internal control systems from which reported information is derived.
The Company’s management is also responsible for establishing data collection and internal control systems to ensure reliable reporting, specifying acceptable reporting criteria and selecting data to be collected for the purposes of the Report. Management responsibilities also extend to preparing the Report in accordance with the GRI Standards.
Assurance provider’s responsibilitiesOur responsibilities are to:
– express our conclusions and make recommendations on the nature and extent of the Company’s adherence to the AA1000 Accountability Principles Standard (APS);
– express our conclusions on the reliability of the information in the Report, and whether it is in accordance with the criteria in the GRI Standards.
During 2017 we did not perform any tasks or services for the Company or other clients which would lead to a conflict of interest, nor were we responsible for the preparation of any part of the Report.
Scope, standards and criteria usedWe have fulfilled our responsibilities to provide appropriate assurance that the information in the Report is free of material misstatements. We planned and carried out our work based on the GRI Standards and the AA1000 Series. We used the criteria in AA1000APS to perform a Type 2 engagement and to provide high assurance regarding the nature and extent of the Company’s adherence to the principles of inclusivity, materiality and responsiveness.
Methodology, approach, limitations and scope of workWe planned and carried out our work in order to obtain all the evidence, information and explanations that we considered necessary in relation to the above responsibilities. Our work included the following procedures, which involved a range of evidence‑gathering activities.
– Gathering information and conducting interviews with members of the Executive Management, staff from the Sustainability Department, the Human Resources Department, the Procurement Department, the Product Quality and Safety Department and the Public Affairs and Communication Department, as well as various Group-level functional managers, regarding the Company’s adherence to the principles of inclusivity, materiality, sustainability context, completeness and responsiveness as required by GRI and AA1000. This includes the commitment of the Company’s management to these principles, the existence of systems and procedures to support adherence to these principles, and the embedding of the principles at country level. The key topics of the interviews conducted at Group level were: the materiality process, employee wellbeing and engagement, corporate governance, business ethics and anti‑corruption, sustainable sourcing, responsible marketing, packaging, recycling and recovery, climate, carbon and water, as well as health and nutrition.
227Coca-Cola HBC 2017 Integrated Annual Report
Strategic R
eport
Co
rporate G
overnance
Financial Statem
entsS
wiss S
tatutory R
eporting
Supplem
entary Inform
ation
ASSURANCE STATEMENT

– Conducting further interviews at national headquarters in Belarus, Croatia, Cyprus, Italy, Nigeria, Romania and Russia in order to guarantee the completeness of the information required for the audit.
– Site visits to nine bottling plants, with a focus on developing markets:
– Established markets: Kykkos (Cyprus), Marcianise (Italy)
– Developing markets: Zagreb (Croatia)
– Emerging markets: Vlanpak (Belarus), Ikeja, Owerri (both Nigeria), Ploiesti (Romania), Davydovskoe and Yekatarinburg (both Russia)
– Making enquiries and conducting spot checks to assess implementation of the Company’s policies (at plant, country and corporate level).
– Making enquiries and conducting spot checks with regard to documentation required to assess current data collection systems and procedures in place to ensure reliable and consistent reporting from the plants to the corporate level.
– Conducting additional interviews with six representatives of the following external stakeholder groups: customers, academia, non‑governmental organisations and employee representatives. The interviews were conducted during the Joint Annual Stakeholder Forum of the Company and The Coca‑Cola Company in Vienna.
– Verifying all three inventory scopes (scopes 1, 2 and 3) as defined by the GHG Protocol, including progress against emission reduction targets, reported changes in emissions compared with base years (2004 and 2010) and emissions intensity figures for 2017.
– Verifying the GRI content index, which was published separately to the Report, to ensure consistency with the requirements of the GRI Standards (comprehensive).
The scope of the assurance covered all of the information relevant to sustainability in the Report and focused on Company systems and activities during the reporting period. The following chapters were not covered in the sustainability assurance process:
– Financial Statements, Supplementary Information, and Swiss Statutory Reporting.
ConclusionsOn the basis of our work, we found nothing to suggest that the information in the Integrated Annual Report 2017 is inaccurate or contains material misstatements. Any errors or misstatements identified during the engagement were corrected prior to the Report being published.
Positive developments – As a member of the Union of European Soft Drinks Associations (UNESDA), CCHBC has developed a clear commitment regarding
health and nutrition in EU countries and Switzerland to reduce sugar in sparkling soft drinks by 10% between 2015 and 2020. A sugar reduction of 5% was achieved in 2017 by realigning the portfolio in favour of sugar-free variants and re-formulations with lower sugar content.
– CCHBC is signatory of the Task Force on Climate‑related Financial Disclosures, which develops voluntary, consistent climate‑related financial risk disclosures for use by companies to provide information to investors, lenders, insurers and other stakeholders.
– CCHBC has made excellent progress in all environmental dimensions covering energy, carbon, water, packaging and waste. In addition, the internal carbon and water pricing system as well as top 10 support efficiency projects for water deserve to be mentioned. The documentation of environmental data is highly sophisticated in most operations.
– Diversity and inclusion: CCHBC has developed a new Inclusion and Diversity Policy to ensure that diversity, which is essential to the Company, is properly implemented in the Group. For the Company, diversity and inclusion means being able to serve customers as effectively as possible. CCHBC strives to ensure that no one is treated inappropriately or disrespectfully in the workplace, which is why diversity and inclusion are also defined as core leadership values.
– Sustainable sourcing: a third-party assessment tool was introduced in 2017 to evaluate CCHBC suppliers’ performance in terms of corporate social responsibility. More than 120 critical suppliers have already been assessed using the tool. In addition, CCHBC piloted three sustainability day events with strategic suppliers. These events provided an opportunity to share information about corporate social responsibility policies and sustainability commitments, as well as achievements and best practice. Moreover they are seen as a starting point for collaboration on shared targets and joint initiatives.
– Risk management: CCHBC has set up an excellent risk management system which incorporates sustainability-related aspects. Risk assessment is conducted on a quarterly basis and covers topics such as environmental protection, obesity, strikes, labour unrest and supplier continuity.
– Remuneration: sustainability-related topics are considered important aspects in the incentive system, which represents an exceptional approach.
228 Coca-Cola HBC 2017 Integrated Annual Report
ASSURANCE STATEMENT CONTINUED

Findings and conclusions regarding adherence to the AA1000 principles of inclusivity, materiality, responsiveness, and specific performance-related information.
Inclusivity
– Group level: the Company has implemented a comprehensive and efficient stakeholder engagement process at Group level. Its cornerstones are the annual internal and external stakeholder survey and the Annual Stakeholder Forum (held in Vienna in 2017).
– Country and plant level: various stakeholder management tools are used at country and plant level (e.g. Sparkle). The tools in place provide an overview of relevant stakeholders and evaluate them based on factors such as influence and attitude. As a result, optimised communication and engagement strategies can be implemented for each stakeholder group.
Materiality
– Group level: an advanced process is in place for defining material topics. The materiality assessment process considers stakeholders’ expectations on the relevant sustainability‑related topics. The materiality assessment also forms the basis for preparing a GRI‑compliant report.
– Country and plant level: in most organisations there is strong awareness of current and upcoming material sustainability-related topics. However, most locations have not yet implemented a formal process for defining material topics. With an increasing number of GRI‑compliant sustainability reports at country level, more systematic approaches will need to be established. We recommend promoting the implementation of materiality assessments at country level and incorporating the plants as well.
Responsiveness
– Country level: effective plans for stakeholder engagement are developed at country level. However, these plans place an emphasis on the stakeholder groups with the greatest influence on the Company, and thus focus on the likes of public authorities and customers. In order to ensure that no stakeholder groups are ignored, a more holistic approach is recommended. By including a wider range of stakeholders in communication, new sustainability-related topics can be addressed.
– A variety of excellent community projects have been implemented at both country and plant level. There are especially good examples of communication with consumers regarding the use of natural and artificial sweeteners.
– Excellent examples of sustainability reporting (e.g. Belarus) and socio‑economic impact assessments (e.g. Croatia and Italy) were found in the course of the audit. The Group should highlight these examples of good practice and encourage further enhancement of reporting in line with sustainability standards.
Additional conclusions and recommendations
– Reporting: the internal reporting process needs to be strengthened in terms of relevant sustainability-related topics, particularly in the following cases:
– Training hours: currently the documentation of training hours is being transferred from two systems to a single new platform. Steps must be taken to ensure that all training hours are captured in this platform. This can be done by means of training for representatives and by ensuring that all functional training hours are recorded on the new platform. In addition, a clear process for documenting external training courses has to be implemented.
– Community investment: complete transparency in terms of performance indicators (participant numbers, volunteer numbers, plant visits, cash or in‑kind contributions) needs to be ensured. The documentation of figures has to be streamlined. Moreover, action is needed to ensure that all plant-based community investments are covered in the reporting.
– Sustainable sourcing: full implementation of the Environmental, Social and Governance Pre-assessment Tool (a key tool for screening suppliers, launched in 2016) is required, combined with further training on proper use of the tool in procurement processes.
– Packaging recycling and recovery: the 2020 Commitments are an important development in this area. However, the documentation, verification process and methodology used to calculate country‑specific figures could be improved and described in a packaging recycling and recovery guidance document. In addition, new commitments should be developed based on TCCC’s World Without Waste vision.
– Responsible marketing: responsible marketing activities should be further strengthened in specific UNESDA KPIs, such as making a full range of beverages available in schools and using unbranded vending machines.
Vienna, 6 March, 2018
denkstatt GmbHConsultancy for Sustainable Development
Willibald KaltenbrunnerLead Auditor Managing Partner, denkstatt 229Coca-Cola HBC 2017 Integrated Annual Report
Strategic R
eport
Co
rporate G
overnance
Financial Statem
entsS
wiss S
tatutory R
eporting
Supplem
entary Inform
ation

We take great pride in being regarded as a transparent and accessible Company in all our communications with investment communities around the world. We engage with key financial audiences, including institutional investors, sell-side analysts and financial journalists, as well as our Company’s shareholders. The investor relations department manages the interaction with these audiences by attending ad hoc meetings and investor conferences throughout the year, in addition to the regular meetings and presentations held at the time of our results announcements.
ListingsCoca-Cola HBC AG (LSE: CCH) was admitted to the premium listing segment of the Official List of the UK Listing Authority and to trading on the London Stock Exchange’s main market for listed securities on 29 April 2013. With effect from 29 April 2013, Coca‑Cola HBC AG’s shares are also admitted on the Athens Exchange (ATHEX: EEE). Coca Cola HBC AG has been included as a constituent of the FTSE 100 and FTSE All‑Share Indices from 20 September 2013.
London Stock Exchange Ticker symbol: CCH ISIN: CH019 825 1305 SEDOL: B9895B7 Reuters: CCH.L Bloomberg: CCH LN
Athens Exchange Ticker symbol: EEE ISIN: CH019 825 1305 Reuters: EEEr.AT Bloomberg: EEE GA
Credit rating Standard & Poor’s: L/T BBB+, S/T A2, positive outlook Moody’s: L/T Baa1, S/T P2, stable outlook
Share price performanceLSE: CCH 2017 2016 2015
In £ per share Close 24.20 17.70 14.48High 26.71 18.40 16.29Low 17.69 12.65 10.57Market capitalisation (£ million) 8,862 6,426 5,237
ATHEX: EEE 2017 2016 2015
In € per share Close 27.25 20.69 19.79High 29.80 20.99 23.16Low 20.47 16.00 13.88Market capitalisation (€ million) 9,979 7,512 7,158
Share capitalIn 2017, the share capital of Coca‑Cola HBC increased by the issue of 4,122,401 new ordinary shares following the exercise of stock options pursuant to the Group’s employee stock option plan. Total proceeds from the issuance of the shares under the stock option plan amounted to €71.0 million.
Following the above changes, and including 3,445,060 ordinary shares held as treasury shares, on 31 December 2017 the share capital of the Group amounted to €2,015.1 million and comprised 370,763,039 shares with a nominal value of CHF 6.70 each.
Major shareholdersThe principal shareholders of the Group are Kar-Tess Holding (a Luxembourg company), which holds approximately 23%, and The Coca‑Cola Company, which indirectly holds approximately 23% of the Group’s issued share capital.
DividendsFor 2017, the Board of Directors has proposed a €0.54 dividend per share in line with the Group’s progressive dividend policy. This compares to a dividend payment of €0.44 per share in 2016. For more information on our dividend policy and dividend history, please visit our website at www.coca-colahellenic.com.
Financial calendar9 May 2018 First quarter trading update11 June 2018 Annual General Meeting9 August 2018 Half-year financial results8 November 2018 Third quarter trading update
Corporate websitewww.coca-colahellenic.com
Shareholder and analyst informationShareholders and financial analysts can obtain further information by contacting:
Investor Relations Tel: +30 210 618 3100 Email: [email protected] IR website: www.coca‑colahellenic.com/investorrelations
Geographic concentration
Analysis of shareholding sizes
1 – 10,000: 1%10,001 – 100,000: 13%100,001 – 1,000,00: 40%1,000,001 – over: 45%Treasury shares: 2%
UK: 29%Continental Europe: 33%United States: 28%Rest of the world: 3%Retail investors: 6%
230 Coca-Cola HBC 2017 Integrated Annual Report
SHAREHOLDER INFORMATION

Basis points (bps)One hundredth of one percentage point (used chiefly in expressing differences)
Brand Coca-Cola productsIncludes Coca‑Cola, Coca‑Cola Zero and Coca‑Cola Light brands
BSOBusiness services organisation
BSSBusiness solutions and systems
CAGRCompound annual growth rate
Capital expenditure or CapExGross CapEx is defined as payments for purchase of property, plant and equipment. Net CapEx is defined as payments for purchase of property, plant and equipment less receipts from disposals of property, plant and equipment plus principal repayment of finance lease obligations
Carbon emissions (scope 1 and 2)Emissions of CO
2 and other greenhouse
gases from fuel combustion and energy use in Coca‑Cola HBC’s own operations in bottling, storage, distribution and in offices
Carbon footprintGlobal emissions of CO
2 and other
greenhouse gases from Coca‑Cola HBC’s wider value chain (raw materials, product cooling etc.)
CHPCombined heat and power plants
Coca-Cola HBCCoca‑Cola HBC AG, and, as the context may require, its subsidiaries and joint ventures; also, the Group, the Company
Coca-Cola SystemThe Coca-Cola Company and its bottling partners
Cold drink equipmentA generic term encompassing point-of-sale equipment such as coolers (refrigerators), vending machines and post‑mix machines
Comparable adjusted EBITDAWe define adjusted EBITDA as operating profit before deductions for depreciation and impairment of property, plant and equipment (included both in cost of goods sold and in operating expenses), amortisation and impairment of and adjustments to intangible assets, stock option compensation and other non‑cash items, if any
Comparable net profitRefers to net profit after tax attributable to owners of the parent
Comparable operating profit (EBIT)Operating profit (EBIT) refers to profit before tax excluding finance income/(costs) and share of results of equity method investments
CustomerRetail outlet, restaurant or other operation that sells or serves Coca-Cola HBC products directly to consumers
DIFOTAIDeliver in full, on time and accurately invoiced
DMEDirect marketing expenses
EDSEvery Dealer Survey
Energy use ratioThe KPI used by Coca‑Cola HBC to measure energy consumption in the bottling plants, expressed in megajoules of energy consumed per litre of produced beverage (MJ/lpb)
FMCGFast‑moving consumer goods
Fragmented tradeKiosks, quick service restaurants (QSR) and hotels, restaurants and cafes (HoReCa)
Future consumptionA distribution channel where consumers buy multi-packs and larger packages from supermarkets and discounters which are not consumed on the spot
FYROMFormer Yugoslav Republic of Macedonia
GDPGross domestic product
GfKWe work with the company Growth for Knowledge (GfK) to track our customer satisfaction level.
GRIGlobal Reporting Initiative, a global standard for sustainability reporting
HoReCaDistribution channel encompassing hotels, restaurants, cafes
IFRSInternational Financial Reporting Standards, issued by the International Accounting Standards Board
IIRCThe International Integrated Reporting Council, a global coalition of regulators, investors, companies, standard-setters, the accounting profession and NGOs. The coalition is promoting communication about value creation as the next step in the evolution of corporate reporting
Immediate consumptionA distribution channel where consumers buy chilled beverages in single-serve packages and fountain products for immediate consumption, away from home
Inventory daysWe define inventory days as the average number of days an item remains in inventory before being sold, using the following formula: average inventory ÷ cost of goods sold x 365
IrelandThe Republic of Ireland and Northern Ireland
ItalyTerritory in Italy served by Coca‑Cola HBC (excludes Sicily)
231Coca-Cola HBC 2017 Integrated Annual Report
Strategic R
eport
Co
rporate G
overnance
Financial Statem
entsS
wiss S
tatutory R
eporting
Supplem
entary Inform
ation
GLOSSARY

Joint value creation (JVC)An advanced programme and process to collaborate with customers in order to create shared value
Litre of produced beverage (lpb)Unit of reference to show environmental performance relative to production volume
MarketWhen used in reference to geographic areas, a country in which Coca-Cola HBC does business
NARTDNon‑alcoholic ready‑to‑drink
NGOsNon‑governmental organisations
Nm3
Normal cubic metre
NSRNet sales revenue
OBPPCOccasion, Brand, Price, Package, Channel
Organised tradeLarge retailers (e.g. supermarkets, discounters etc.)
PETPolyethylene terepthalate, a form of polyester used in the manufacturing of beverage bottles
Ready-to-drink (RTD)Drinks that are pre‑mixed and packaged, ready to be consumed immediately with no further preparation
Right Execution Daily (RED)Major Group‑wide programme to ensure in‑outlet excellence
Receivable daysThe average number of days it takes to collect receivables using the following formula: average accounts receivables x net sales revenue x 365
ROICReturn on invested capital
SAPA powerful software platform that enables us to standardise key business processes and systems
SDGUN Sustainable Development Goals. On 25 September 2015, countries adopted a set of 17 goals to end poverty, protect the planet and ensure prosperity for all as part of a new sustainable development agenda. Each goal has specific targets to be achieved by 2030.
Serving237ml or 8oz of beverage, equivalent to 1/24 of a unit case
Shared servicesCentre to standardise and simplify key finance and human resources processes
Small basketRefers to a shift in buying habits as consumers increase frequency of visits to stores but have smaller basket sizes which can result in lower volume but higher revenue
Sparkling beveragesNon‑alcoholic carbonated beverages containing flavourings and sweeteners, but excluding, among others, waters and flavoured waters, juices and juice drinks, sports and energy drinks, teas and coffee
SKUStock Keeping Unit
Still and water beveragesNon‑alcoholic beverages without carbonation including, but not limited to, waters and flavoured waters, juices and juice drinks, sports and energy drinks, teas and coffee
TerritoryThe 28 countries where Coca‑Cola HBC operates
UNESDAUnion of European Soft Drinks Associations
Unit case (u.c.)Approximately 5.678 litres or 24 servings, a typical volume measurement unit
UN Global Compact (UNGC)The world’s largest corporate citizenship initiative which provides a framework for businesses to align strategies with its 10 principles promoting labour rights, human rights, environmental protection and anti-corruption
VolumeAmount of physical product produced and sold, measured in unit cases
Volume shareShare of total unit cases sold
Value shareShare of total revenue
Waste ratioThe KPI used by Coca‑Cola HBC to measure waste generation in its bottling plants, expressed in grammes of waste generated per litre of produced beverage (g/lpb)
Waste recyclingThe KPI used by Coca‑Cola HBC to measure the percentage of production waste at bottling plants that is recycled or recovered
Water footprintA measure of the impact of water use, in operations or beyond, as defined by the Water Footprint Network methodology
Water use ratioThe KPI used by Coca‑Cola HBC to measure water use in its bottling plants, expressed in litres of water used per litre of produced beverage (l/lpb)
Working capitalOperating current assets minus operating current liabilities excluding financing and investment activities
232 Coca-Cola HBC 2017 Integrated Annual Report
GLOSSARY CONTINUED

Special note regarding forward-looking statementsThis document contains forward-looking statements that involve risks and uncertainties. These statements may generally, but not always, be identified by the use of words such as ‘believe’, ‘outlook’, ‘guidance’, ‘intend’, ‘expect’, ‘anticipate’, ‘plan’, ‘target’, ‘seek’, ‘estimates’, ’potential‘ and similar expressions to identify forward‑looking statements. All statements other than statements of historical facts, including, among others, statements regarding the future financial position and results; Coca‑Cola HBC’s outlook for 2018 and future years; business strategy and the effects of the global economic slowdown; the impact of the sovereign debt crisis, currency volatility, Coca‑Cola HBC’s recent acquisitions, and restructuring initiatives on Coca‑Cola HBC’s business and financial condition; Coca‑Cola HBC’s future dealings with The Coca Cola Company; budgets; projected levels of consumption and production; projected raw material and other costs; estimates of capital expenditure; free cash flow; and effective tax rates and plans and objectives of management for future operations, are forward‑looking statements. You should not place undue reliance on such forward‑looking statements. By their nature, forward‑looking statements involve risk and uncertainty because they reflect Coca‑Cola HBC’s current expectations and assumptions about future events and circumstances that may not prove accurate. Forward‑looking statements speak only as of the date they are made. Coca‑Cola HBC’s actual results and events could differ materially from those anticipated in the forward‑looking statements for many reasons, including the risks described in the Risk and materiality section. Although Coca-Cola HBC believes that, as of the date of this document, the expectations reflected in the forward‑looking statements are reasonable, Coca‑Cola HBC cannot assure that Coca‑Cola HBC’s future results, level of activity, performance or achievements will meet these expectations. Moreover, neither Coca‑Cola HBC, nor its Directors, employees, advisors nor any other person assumes responsibility for the accuracy and completeness of any forward-looking statements. After the date of this Integrated Annual Report, unless Coca‑Cola HBC is required by law or the rules of the UK Financial Conduct Authority to update these forward-looking statements, Coca-Cola HBC makes no commitment to update any of these forward-looking statements to conform them either to actual results or to changes in Coca‑Cola HBC’s expectations.
233Coca-Cola HBC 2017 Integrated Annual Report
Strategic R
eport
Co
rporate G
overnance
Financial Statem
entsS
wiss S
tatutory R
eporting
Supplem
entary Inform
ation

About our reportThe 2017 Integrated Annual Report (the ‘Annual Report’) consolidates Coca‑Cola HBC AG’s (also referred to as ‘Coca‑Cola HBC' or the ‘Company’ or the ‘Group’) UK and Swiss disclosure requirements, while meeting the disclosure requirements for its secondary listing on the Athens Exchange. In addition, the Annual Report aims to deliver against the expectations of the Company’s stakeholders and sustainability reporting standards, providing a transparent overview of the Group’s performance and progress in sustainable development for 2017.
Our strategy is designed to deliver responsible, sustainable and profitable growth. Our strategic objectives of driving volume growth, focusing on value, improving efficiency and investing in the business are supported by our people and our commitment to sustainability. The initiatives we implemented to achieve our objectives and the evidence of our success during the year form the basis of the narrative in the Annual Report, which is structured around our stakeholders: our people, communities, consumers, customers and other stakeholders, with whom we work to enhance efficiencies in the business.
The Annual Report is for the year ended 31 December 2017, and its focus is on the primary core business of non‑alcoholic ready‑to‑drink beverages across the 28 countries in which we operate. Our website and any other website referred to in the Annual Report are not incorporated by reference and do not form part of the Annual Report.
The consolidated financial statements of the Group, included on pages 133‑196, have been prepared in accordance with International Financial Reporting Standards (IFRS) as issued by the International Accounting Standards Board (IASB). Coca‑Cola HBC AG’s statutory financial statements, included on pages 207‑217, have been prepared in accordance with the Swiss Code of Obligations. Unless otherwise indicated or required by context, all financial information contained in this document has been prepared in accordance with IFRS. For Swiss law purposes, the annual management report consists of the sections entitled ‘Strategic Report’, ‘Corporate Governance’ (without the sub‑section ‘Director’s Remuneration Report’), ‘Supplementary Information’ and ‘Glossary’.
The Group uses certain Alternative performance measures (‘APMs’) that provide additional insights and understanding to the Group’s underlying operating and financial performance, financial condition and cash flows. A full list of these APMs, their definition and reconciliation to the respective IFRS measures can be found on pages 223‑226.
This report is prepared in accordance with the Global Reporting Initiative (GRI) standards, comprehensive option. In addition, the sustainability aspects of this Annual Report comply with the AA1000AS Assurance Standard, and the advanced level requirements for communication on progress against the 10 Principles of the United Nations Global Compact. In addition, the report is aligned with the principles and elements of the International Integrated Reporting Council’s (IIRC) framework. Carbon emissions are calculated using the GHG Protocol Corporate Accounting and Reporting Standard methodology. Furthermore, Coca‑Cola HBC supports the Task Force on Climate‑related Financial Disclosures (TCFD). The sustainability aspects of the Integrated Annual Report have been verified by an independent professional assurance provider as dictated by the Company’s Operating and Sustainability Steering Committees, and you can find the relevant assurance statement on pages 227‑229. As with the rest of the information provided, the sustainability aspects of this Annual Report are for the full year ended 31 December 2017 and the related information presented is based on an annual reporting cycle.
We remain committed to strong corporate governance and leadership as well as transparency in our disclosures. We will continue to review our reporting approach and routines, to ensure they meet best practice reporting standards and the expectations of our stakeholders, and provide visibility on how we create sustainable value for the communities we serve.
234 Coca-Cola HBC 2017 Integrated Annual Report

VISIT USwww.coca‑colahellenic.comThe Group site features all the latest news and stories from around our business and communities as well as an interactive online version of this report.
Write to usWe have dedicated email addresses which you can use to communicate with us:

Co
ca‑Co
la Hellenic B
ottling C
om
pany 2017 Integrated Annual R
eport
Coca‑Cola HBC AGTurmstrasse 26, CH‑6312 Steinhausen, Switzerland
www.coca‑[email protected]@cchellenic.com
This report is printed utilising vegetable‑based inks on Magno satin & Arco print, both of which are sourced from well‑managed forests independently certified according to the rules of the Forest Stewardship Council (FSC®). This report was printed by an FSC and carbon‑neutral printing company. Both materials are manufactured at a mill that is certified to the ISO14001 and EMAS environmental standards.
Designed and produced by Black Sun Plc
Copyright © 2022 FDOKUMEN