The Coca-Cola Company - cloudfront.net
86
The Coca-Cola Company r ***** •
-
Upload
khangminh22 -
Category
Documents
-
view
2 -
download
0
Transcript of The Coca-Cola Company - cloudfront.net

The Coca-Cola Company
r
*****
•

Financial Highlights The Coca-Co/a Company and Subsidiaries
The Coca-Cola Company
The Coca-Cola Company is the world's fore-
most marketer of soft drinks. Through the world's
largest production and distribution system, the
Company sells more than twice as many soft
drinks as its nearest competitor. Every day in
1991, consumers in more than 185 countries
enjoyed an average of more than 668 million
servings of Coca-Cola, diet Coke/Coca-Cola
light, Sprite, Fanta and our other soft drinks.
With a market value of more than $53 billion at
year-end 1991, the Company was the sixth-
largest public company in the United States.
Year Ended December 31,
(In millions except per share data and ratios)
Net operating revenues
Operating income
Income before income taxes
Net income
Preferred stock dividends
Net income available to common share owners
Net income per common share
Cash dividends per common share
Average common shares outstanding
Common share-owners' equity at year-end
Return on common equity'
Closing market price per common share
199-F
$11,571.6
$ 2,319.0
$ 2,383.3
$ 1,618.0
$ .5
$ 1,617.5
$ 2.43
$ .96
666.5
$ 4,425.8
39.5%
$ 80.25
1990J
$10,236.4
$ 1,951.6
$ 2,014.4
$ 1,381.9
$ 18.2
$ 1,363.7
S 2.04
$ .80
668.6
$ 3,774.2
39.2%
$ 46.50
PercentChange
13.0%
18.8%
18.3%
17.1%
-
18.6%
19.1%
20.0%
f.3)%
17.3%
-
72.6%
'Return on common equity is calculated by dividing net income available to common share owners by average common share-
owners'equity.!1991includes a $69 million pretax gain ($.07 per common share after income taxes) on the sale of property in Japan, a $27 million
pretax gain (S. 03 per common share after income taxes) on the sale of a bottling investment to Coca-Cola Enterprises Inc. (CCE),
a nonrecurring pretax charge of S21 million ($. 02 per common share after income taxes) for potential future costs, including
interest, related to bottler litigation and a reduction to equity income of $44 million ($.07per common share after income taxes)
related to restructuring charges recorded by CCE.S1990 includes a $52 million pretax gain ($.05 per common share after income taxes) on the Company's investment in BCI
Securities L. P. and nonrecurring pretax charges of $49 million (S, 05 per common share after income taxes) related to the
Company's United States soft drink business.
Cover
In Brussels, Belgium,
one of the worldwide
Coca-Cola system's
many neon spectacu-
lars invites consumers,
in English and French,
to enjoy the world's
favori te soft drink.

The Coca-Cola Company
oaCD
DC
CC
a>
Contents Message to Share Owners
Globalization: The Coca-Cola Perspective
The Size, Scope and Power of the System
The Year in Review
Financial Report
Directors and Officers
Share-Owner Information

Share OwnersFor our Company, the year 1991 could be characterized by the
words challenging and rewarding. It was challenging becauseof the harsh economic conditions which prevailed in several of
our most important markets, e.g., Australia, Canada, the United
States and the United Kingdom. Balancing those economic
negatives, however, were the strong free market economies
emerging in Latin America with their resulting positive impact on
our business; the new markets evolving in eastern Europe; and
the continued strong showing of our soft drink business in the
Pacific Rim countries. In addition, we achieved share gains
relative to the competition in most countries where soft drink
industry growth was affected by the local economies.
1991 was especially rewarding because our Company, to-
gether with the global Coca-Cola system, demonstrated an extraor-
dinary capability to adapt to local market conditions so as to derive
the greatest benefits for our soft drink business. This pragmatic
adaptability is largely responsible for our Company's ability to
continue to produce consistent and reliable profitable growth.Last year our share price gained nearly 73 percent, almost
three times the increase of the S&P 500. Adding the annual
dividend of 96 cents per share to the stock price appreciation
gave the owners of this Company a total return of 75 percent on
their investment. The annualized total return over the past five
and 10 years, assuming reinvestment of dividends, has been 37
percent and 34 percent, respectively.
In 1991 the market value of The Coca-Cola Company
increased by more than $22 billion, an amount $6 billion greater
than our Company's total market value at January 1, 1989. Inother words, last year, in terms of market capitalization, wecreated the equivalent of another company larger than TheCoca-Cola Company was lessthan three years ago.
At year-end 1991, our Com-
pany was the sixth-largest public
company in the U.S. in terms ofmarket value, worth over $53 bil-
lion. This market value is more
than three times what it was three
years ago, and morethan 12 times
what it was 10 years ago, back onJanuary 1,1982, when it stood at
$4.3 billion. Stated differently,
$49 billion of additional wealth
The Coca-Cola Company• Standard & Poor's 500.. Dow Jones Industrial Average
Total Return
Appreciation plus reinvested divi-
dends on $100 investment on
12/31/81. From 1982 to 1991,
the Company's common stock
outperformed the S&P 500 by
approximately 4-to-1 and the
Dow Jones Industrial Average
by approximately 5-to-1.

Total Market
Capitalization
(In billions)
$15.8
12/31/91
Roberto C. Goizueta, Chairman, Board of Directors, and Chief Executive Officer (left), and
Donald R. Keough, President and Chief Operating Officer, at the Dunkirk, France, megaplant

has been created for the owners of our Company over the last10 years, $37 billion over the last three years alone.
Our net earnings available to common share owners of$1.62 billion for the year and earnings per share of $2.43increased 18.6 percent and 19.1 percent respectively over1990. Our return on share-owners' equity reached 39.5 percent,and we ended the year with a net-debt-to-net-capital ratio of 21percent. For 1992 our Directors voted to raise our quarterlydividend 17 percent to 28 cents per share, equivalent to anannual dividend of $1.12 per share.
In 1991 the global Coca-Cola system sold 9.9 billion unitcases of our soft drinks, an increase of 474 million unit cases, or5 percent, over 1990. To put this growth into perspective, if ourincremental 1991 volume were considered as a single country,it would rank as our fifth-largest international market, betweenGermany and Spain.
Coca-Cola Foods continued to maintain its leadership inthe U.S. orange juice business in 1991 and to be totally focusedon juice and juice-drink products. We won't allow any distrac-tions to take our attention away from our efforts to enhance ourleadership position in the citrus business in this country. Weview this as a growth business, and we have the plans in placeto fully benefit from it and consistently grow profits.
As an organization, we are not wasting our energy fore-casting what the future of the soft drink industry will be like in themany countries around the world in which we operate. Andneither are we spending our time forecasting what the futureholds for this Company. We will use our resources to constructtoday the foundation on which our future... the future we arecreating for ourselves... will be built.
We don't view the future as preordained, but as an infiniteseries of openings, of possibilities. What is required to succeedin the middle of this uncertainty is what the Greeks called"practical intelligence." Above all else, this "practical intelli-
gence" forces adaptability and teachesconstant preparedness. It acknowledgesthat nothing succeeds quite as planned,and that the model is not the reality. Butit also teaches that choice and prepara-tion can influence the future. This An-nual Report details many of the choiceswe are making today which will pro-foundly influence the exciting future weare shaping for our globa! system.

We do not want to leave our share owners with the false
impression that this wonderful soft drink business of The
Coca-Cola Company is totally impervious to any and all set-
backs. However, we are running this business today at a highefficiency, and we have the attitude and the financial resources,
as well as the management team, needed to take care of any
negative eventuality which may come our way. So... when it
does, if we don't completely neutralize it, at the very least, we will
minimize its impact.
On the other hand, and as with everything in life, there will
also surely be unexpected positive events in the future of this
Company. When they happen, we will quickly put them to work
to our advantage. In the past we have demonstrated that our
system has such capabilities, and we will continue to take
advantage of every opportunity in the future.
We do not foresee 1992 as being any less challengingthan 1991 or any less rewarding. We are confident that we
have the building blocks in place to continue into 1992 and
beyond the profitable growth pattern we have established over
the last few years.We are proud of our associates throughout the world who
form a loyal, dedicated and talented global team. We are
appreciative of the support, advice and counsel we receive from
our most distinguished group of Directors, who continuously
challenge us to ever higher levels of achievement. We are
fortunate to have as key members of the Coca-Cola system,bottling partners who share our same vision for profitable
growth. We thank our suppliers for joining us in committing to
product quality and customer service. We express our gratitude
to our customers and consumers, without whom The Coca-Cola
Company and the enterprise we call the Coca-Cola system
would cease to exist. Finally, we take this opportunity to once
again thank you, the owners of this business, for the confidenceyou continue to demonstrate by having chosen our Company as
the object of your investment.
Roberto C. GoizuetaChairman, Board of Directors,and Chief Executive Officer
February 20,1992
Donald R. KeoughPresident andChief Operating Officer

Roberto C. Goizueta
Chairman, Board of Directors,
and Chief Executive Officer
Netherlands
The global marketplace is something people have been
writing about for years, and while it may not be completely here
yet, it is a fact that most U.S.-based companies of any size
today think and act in international terms. At The
Coca-Cola Company, we view ourselves today as
an international corporation headquartered in the
United States, as opposed to a U.S. company
with a sizable international business. This
report is largely devoted to the Coca-Cola jl$
system, arguably the only truly global busi-
ness system in existence today.
The trend toward globalization by U.S.-
based companies will continue. Not only
do 95 percent of the world's 5 billion people
live outside the United States, but the global
climate today is generally favorable for com-
panies disposed to expansion.
First, disposable income is rising around the world and, with it,
people's ability to purchase more consumer products.
Second, outside the U.S. and Europe, the world is getting
younger, and young people are the most enthusiastic purchasers
of many consumer products.
Third, the world's markets are becoming easier to reach. The
events of last year in eastern Europe and the former Soviet Union
are just the most recent examples.
Finally, in many important ways, the world's markets are also
becoming more alike. Every corner of the free world is increas-
ingly subjected to intense and similar communications: commer-

cial, cultural, social and hard news. Thus, people around the
world are today connected to each other by brand name con-
sumer products as much as by anything else. Tokyo, London,
New York and Los Angeles resemble each other today far more
than they did 25 years ago, in large part because their residents'
tastes in consumer products have converged.
Successful global marketing, however, cannot be dictated
from a central point, much less practiced through the exercise of
a myriad of unrelated decisions at many points around the world.
Successful global marketing by any company requires that
certain conditions be in place, most of which require a
long time to be developed. While the experiences of
The Coca-Cola Company may not be universally
applicable, we view certain key points as the
cornerstones of successful global marketing.
Chile
First, a company wanting to go global must have, build or buy a
powerful trademark. Of course, the best example is Coca-Cola.
Long the world's most ubiquitous trademark, it is today more
valuable than ever and without peer in its appeal and relevance
to consumers, as confirmed time and again by independent
surveys.
Second, the company must have a global business system
through which to reach consumers. In our case, the system
comprises not only the Company itself, but a worldwide network
of employees, bottling partners, vendors and customers. This
system is made up of dedicated people working long and hard to
sell products they believe in.
Third, such a business system must do much more than just
deliver products. In order to appeal to cultures as diverse as
those in Switzerland and Swaziland, it must also tailor products
and messages to local markets. At The Coca-Cola Company, we
V

alter our central advertising themes slightly, for instance, to
make them more relevant in each of the more than 185
countries where we do business, appealing to regional tastes
to create universal leadership.
Lastly, our formula for international success also contains a
less obvious, less tangible ingredient. That ingredient is a
central theme, idea or symbol that binds together the busi-
ness system, the brands and the consumers. In the case of
our Company, that image began to take shape in 1886
when a man named Frank Robinson first wrote the words
"Coca-Cola" in beautiful, flowing Spencerian script. Over the
106 years since then, that image has grown to represent more
than a simple moment of refreshment.
Through our advertising and marketing we have encouraged
consumers to associate Coca-Cola with their best feelings
and memories...friends and family...joy and laughter...sports
and music. Through our insistence on product integrity, we
have made sure that wherever and whenever they drink a
Coke, the product will live up to their expectations.
France
m United States
Through our worldwide business system we have made
sure that Coca-Cola is there, so that wherever consumers
travel they can always find a point of reference, a friendly
reminder of home, regardless of where home may be. And
through our efforts to serve our customers and consumers with
a passion, they in turn have come to feel passionate about
Coca-Cola.
Over time, this image—this idea of Coca-Cola — has attracted
people who have worked hard to enhance and perpetuate its
relevance. And throughout the system, business relationships
have been strengthened and made personal by a shared
commitment to this central Coca-Cola theme. It is this deep,
heartfelt bond shared by Coca-Cola consumers and the
members of the Coca-Cola system around the world that The
Coca-Cola Company and its management cherish and value
above all else. We cherish it because it is, more than anything
else, the true measure of success in the global marketplace.

The Size, Scope Power of the System
system than to The Coca-Cola Company, and for a very
good reason: the system is the primary engine of srfare-
L owner value. Graphically, this system can best be\V represented as an inverted triangle or pyramid I
» comprising many levels, of which the Company is /
. only the base. The following pages examine /
\ the size, scope and power of this incompa- /\ /\ rable global system, which builds from /
\ 650,000 employees through more than /
million customer tisfy the
thirst of the world's more th;
billion consumers. >
i important, the system is grow-
\ ing and expanding e1
V\ day. As impressive
\ the numbers in the;
pages are, by the
time you read
. them, they will
have been /
* -
surpas-
sed .
.- '-Vm

employees


PeopleIn Bangkok and
around the world,
system employees
like Khun Montri
Thirakul help the
Company think
globally but act
locally.
People650,000 employees
$7 billion in wages
•oCD0•£(D
The global
Coca-Cola sys-
tem works be-
cause more than
650,000 employees
around the world
share a common cul-
ture. Whether in Ger-
many, Malaysia, Peru or
any otherof the Company's
185-plus markets, these
people think, work and react
with virtually identical instincts,
rooted in a shared commitment
to the quality of the Company's
products and the value of the
Company's trademarks.

Serving Australia's "Red Centre," Peter Fogerty (right)
sometimes travels hundreds of kilometers from Alice
T Springs to reach customers like camel expedition
leader Noel Fullerton. In re-
cent years, the consolidation
of virtually the entire Austra-
lian system under a single
bottler, Coca-Cola Amatil, has
brought greatly increased ef-
ficiency to the market.
lionand growing

•oCD0
T3(5"
Workers at the new bottling plant in eastern Berlin oversee
production as part of what one industry analyst has called
"the soft drink equivalent of the Marshall Plan." Thirteen
production and distribution centers have
been opened in eastern Germany to
serve 17 million new consumers.
As new markets emerged
throughout eastern Europe, the
Company announced plans to
form a joint venture to serve
Ukrainian consumers. Based in
Kiev, Rosinka - Coca-Cola Bot-
tling will be led byAndrey M. Poznansky. Rosinka -
Coca-Cola Bottling will help fill the dramatic need for
consumer goods asUkrainecreatesamarket economy.

Distribution

and Distributionco+3O3T30
The global
Coca-Cola sys-
tem is capable of
producing more than
22 billion cases of soft
drinks annually, more than
528 billion individual soft
drinkservings. TheCompany's
products are delivered to the mar-
ketplace by more than 115,000
Company- or bottler-owned vehicles
Production >•
and Distribution
In Lubbock, Texas,
Jack Watley's truck
exemplifies regional
marketing programs
designed to
strengthen the
"multi-local" aspects
of the Coca-Cola
system.
Productionand Distribution22 billion case capacity
115,000 vehicles
People650,000 employees
$7 billion in wages

productioncapacity
billion
with more to come

(0c0'u3
T50
Distribution
V In addition to those vehicles owned by the Coca-Cola
system, a vast fleet of independently owned vehicles
helps get Coca-Cola to the marketplace. Each week, for
instance, Deliverance delivers
Coca-Cola to Australia's Bedarra
Island near the Great Barrier Reef.
Truly "multi-local" in nature, the Coca-Cola
system readily adapts to local environments.
In Hong Kong, for instance, scarcity of real
estate led to the construction of the world's two
tallest bottling plants, one a remarkable 59
stories high. Both use large elevators to raise
and lower delivery trucks.
In Amsterdam and throughout an in-
creasingly unified European Commu-
nity, production and distribution sys-
tems have been modified to meet the
needs of both local and pan-Euro-
pean customers. New canning and
concentrate megaplants, centralized information systems and consolidated
bottling operations have created new efficiencies.
. *.
*• **•

million
and counting

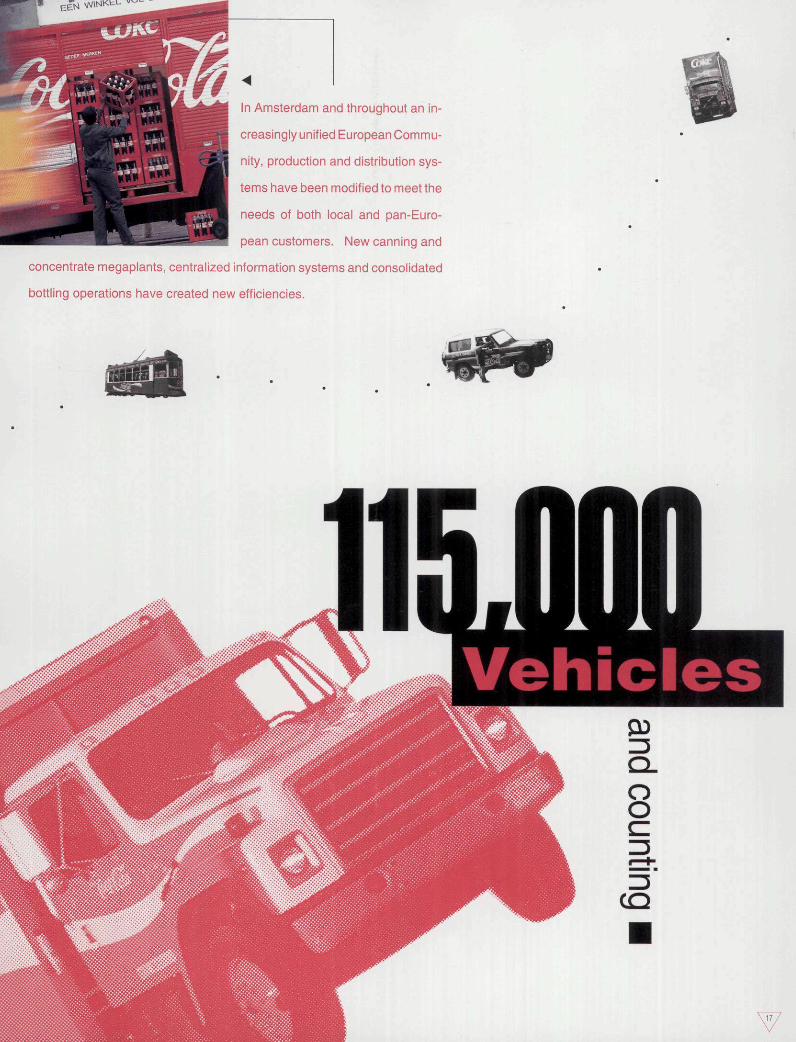
Customers
Barbecue and
Coca-Cola are the
specialties at
Maurice's Piggy
Park in Columbia,
South Carolina.
Customers8 million customers$66 billion in retail sales
Productionand Distribution22 billion case capacity
115,000 vehicles
People650,000 employees$7 billion in wages
ocWF*
0
>
If all the Coca-Cola
system's customers
lined up alongthe equa-
tor, a thirsty consumer
could purchase a Coca-Cola
every 16 feet. From huge,
multi-national grocery chains to
individual street vendors, these 8
million customers are our link with
the world's consumers. Last year, our
products helped our customers gener-
ate more than $66 billion in retail sales.

0) and growing
(ft0)S1
All over the world, customers like Carlos
Fernandez Veloso in Montevideo, Uru-
guay, have helped make Coca-Cola
and good food a natural pairing. ^

Customers
In virtually every country in which it is
available, Coca-Cola plays a major
role in the local retail economy. In
Nigeria, more than 100,000 custom-
ers sell Coca-Cola, and many own-
ersof small shops rely on itfora large
percentage of their profit.
U.S. customers like Jerry's Super- A
marketin Sanibel Island, Florida, ben-
efit from the increased efficiencies of
large, consolidated bottling compa-
nies like Coca-Cola Enterprises.


and Advertising
ICO
Millions of pieces
of Coca-Cola adver-
tising help make the
familiar red and white
script the world's number
one trademark. From Kiev
to Kansas City, "Coca-Cola" is
understood by more people
worldwide than any other term
except "Okay."
Marketingand Advertising20 million advertising pieces
$4 billion annual
marketing investment
Customers8 million customers
$66 billion in retail sales
Productionand Distribution22 billion case capacity
115,000 vehicles
People650,000 employees$7 billion in wages
Marketing ^
and Advertising
The Brussels,
Belgium, neon
spectacular
symbolizes the
system's power
and pervasiveness.

illionpieces ofadvertising

"D Advertisingas0)c"0u(0
Neon spectaculars bring the Coca-Cola trade-
mark to the world's busiest street corners in a big
way. A landmark for 70 years, the spectacular
at New York's Times Square became even
bigger and better in 1991. The new 65-by-41 -
foot, 55-ton structure features nearly 60 miles of
fiber optic tubing, a mile of neon tubing and
13,000 light bulbs.
For Coca-Cola, good marketing transcends traditional adver-
tising. The system is committed to making Coca-Cola an
integral part of every community. Coca-Cola (Japan) Com-
pany and its bottling partners, for example, sponsor a wide
variety of local events and pro-
grams, including the annual
Awa Odori dance festival.

Decades of major promotions and sponsorships have closely
linked Coca-Cola and sports. The diet Coke Great North Run in
Newcastle, England, was only one of thousands of sporting events
sponsored last year by the Coca-Cola system. Televised through-
out Europe, the event is Britain's largest road race, drawing 30,000
runners and more than 100,000 spectators.
Annual MarketingInvestmentand Growing

pieces of
-100 vlOO
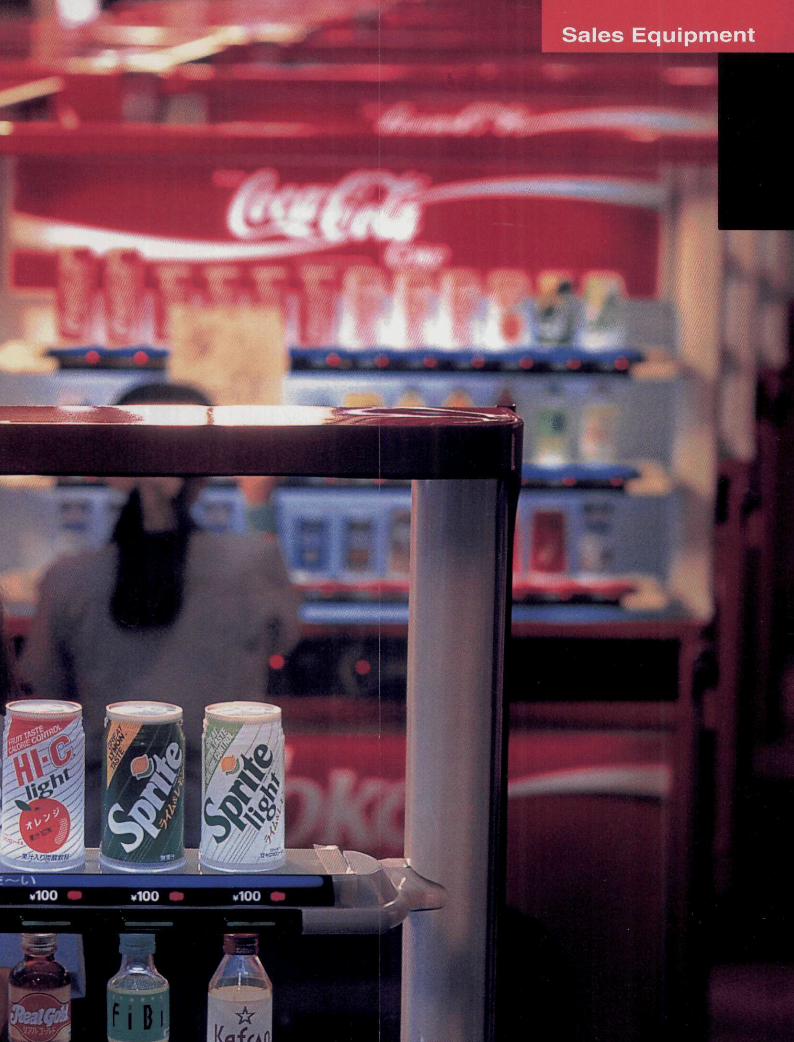
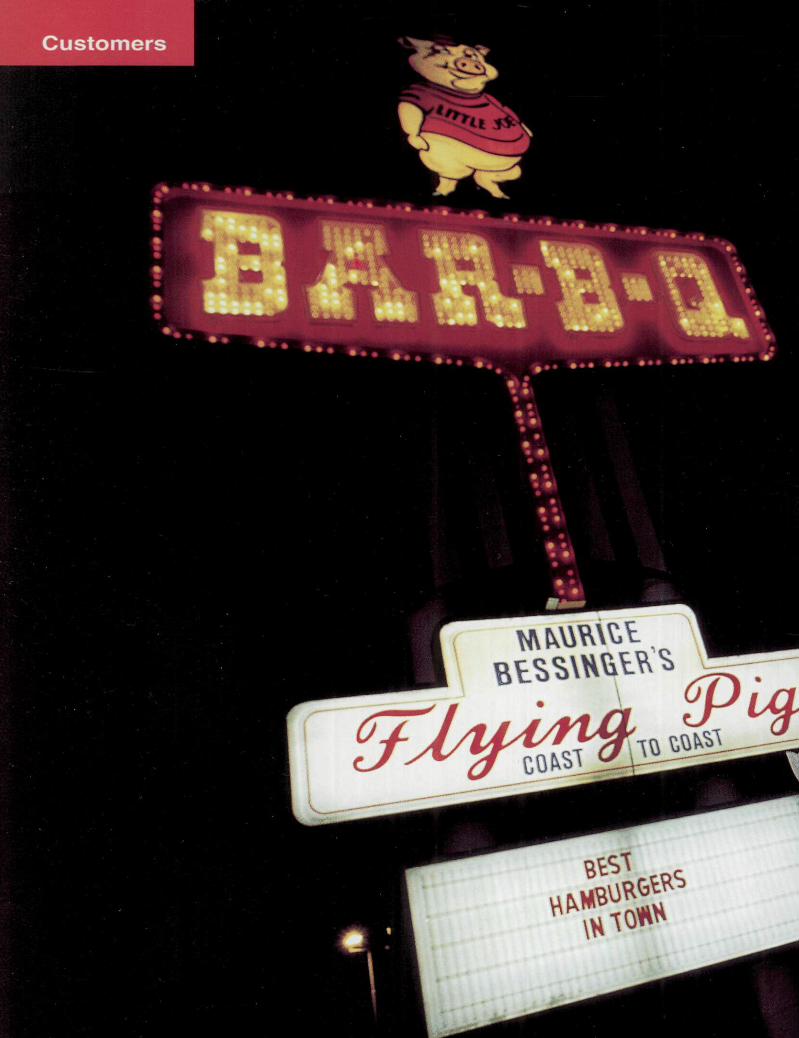
Sales Equipment

SalesEquipment6 million pieces2 million vending
machines dispensing
33 million servings daily
Marketingand Advertising20 million advertising pieces
$4 billion annual
marketing investment
The system's un-
Sales
Equipment
More than half of our
unit case sales in
Japan come through
the system's more
than 770,000 vending
machines. Last year,
more than 136,000
new Coca-Cola
venders were manu-
factured in Japan.
Customers -8 million customers$66 billion in retail sales
Productionand Distribution22 billion case capacity
115,000 vehicles
People650,000 employees
$7 billion in wages
equalled ability to put
a cold Coca-Cola "within
an arm's reach of desire"
drives sales. More than 6
million pieces of sales equip-
ment help make Coca-Cola the
most ubiquitous trademarked
product on earth. This equipment
ranges from high-tech vending and
post-mix machinery to simple ice chests
and pushcarts.

ion
C servings0 daily andS growing
E
Post-mix represents a tremendous opportu-
nity in international markets. In Norway, for
example, post-mix sales climbed steadily in
1991 but still account for only 5 percent of
the system's total unit case sales.

Negotiating the narrow streets of Venice, local
bottling employees install one of the system's
more than 2 million vending machines. Vend-
ers provide consumers with convenient, round-
the-clock opportunities for purchasing a cold
Coca-Cola. V
0)5"(/)mi}c•5'3(D3
In many developing markets, making Coca-Cola
available cold is a top priority. Local entrepre-
neurs do their part in Douala, Cameroon, tra-
versing the city's streets
with 160 locally produced
pushcarts. ^

billion


Consumers5 billion
Sales —_Equipment6 million pieces
2 million vending
machines dispensing
33 million servings daily
Marketingand Advertising20 million advertising pieces
$4 billion annual
marketing investment
Customers -8 million customers
$66 billion in retail sales
Productionand Distribution22 billion case capacity
115,000 vehicles
Consumers
Herero women in
traditional clothing
refresh themselves
under a warm
Namibian sky.
People650,000 employees$7 billion in wages
oo30)c3mCO
In more than 185
countries, the sys-
tem works to make
Coca-Cola and our
other quality products
available to more than 5 bil-
lion consumers. With approxi-
mately 95 percent of these con-
sumers living outside the United
States, the system has only begun
to develop the international growth
potential of our brands.

Consumers
T As the world has gotten smaller, a "global teenager" has emerged.
In Germany and around the world, these teenagers share similar
tastes in music, clothing and consumer brands. With its global
scope and the power of the
world's most ubiquitous
trademark, the Coca-Cola
system is uniquely equipped
to market to this group.
The rapid restructuring of eastern
Europe and the former Soviet re-
publics makes it far easier to reach
millions of new potential Coca-Cola
consumers, including 52 million
Ukrainians. ^

Arguably the most successful new product introduced in the United States
in the 1980s, diet Coke has also averaged 29 percent annual growth in
international markets since its debut. In fact, in both Europe and Japan, diet
Coke/Coca-Cola light is now the numbertwo cola-flavored soft drink, trailing
only Coca-Cola, as well as the number three carbonated soft drink overall,
behind Coca-Cola and Fanta. In Japan, Coke light unit case sales exceed
the combined total sales of our nearest competitor's sugar and diet colas.

elected Country Results
Estimated Unit Case Sales7
Carbonated Soft Drinks
Average Annual Growth 1991 Results
10 Years
Company
Worldwide 6%
5 Years
Industry Company
5% 6%
Industry
5%
Unit Case Growth
Company
5%
Industry
oo/O /o
Company
Share Per Capita
Consumption
43% 54
United States 5 4 4 3 2.5 1.7 41 296
International 7 5 8 6 6 3 44 39
European Community
France
Germany
Great Britain
Italy
Spain
9
13
6
13
10
7
5
5
5
6
6
5
11
16
9
14
8
11
7
9
10
4
5
7
8
11
19
(-11)
4
6
1
1
6
(10)4
3
45
41
46
32
55
51
116
52
178
87
91
155
Pacific2
Australia
Japan2
Korea
Philippines
Thailand
9
7
7
8
12
10
7
5
7
10
3
9
10
8
9
7
8
17
9
6
9
11
5
18
4
2
7
(1)
(1)
3
3
3
6
1
(7)
4
40
56
34
49
76
57
18
223
122
63
89
43
Northeast Europe/Africa
Austria
Nigeria
Norway
Switzerland
Turkey
7
6
4
12
10
19
6
6
4
7
5
12
8
10
8
11
8
17
6
10
6
4
6
13
5
12
10
8
9
6
4
8
3
3
11
14
27
46
68
59
44
39
18
141
21
218
155
21
Latin America
Argentina
Brazil
Chile
Colombia
Mexico
6
3
8
9
6
5
4
3
6
7
3
4
6
(2)
6
16
3
8
4
(3)
4
18
1
7
8
31
4
9
0.4
6
6
37
3
6
(2)
3
53
62
60
61
43
53
131
133
101
158
105
273
1 Unit case equals 24 8-ounce drinks. Data include, for the first time, results from the former Soviet Union and China. Excluding those
markets, the Company's share of international soft drink sales was 49 percent. ^Includes Japanese non-carbonated soft drinks

the Future
Over the past five years, the Company's international unit case saleshave increased at an average annual rate of 8 percent. No countriesbetter exemplify the Company's long-term opportunity to maintain orexceed that sort of growth than the three profiled on this page. Nearly45 percent of the more than 5 billion people on earth live in China,India or Indonesia, but the per capita soft drink consumption ratesfor the countries are only 8, 3 and 6, respectively. While explosiveshort-term growth is unlikely, the potential for tremendous, sustainedgrowth over time is extraordinary, and the Company is taking aggres-sive actions now to prepare the ground. Set forth below are some ofthe ways in which we are seeding for the future.
Last year, the entire Indian car-bonated soft drink industry sold only
113 million unit cases, less than theCompany sold in Korea, a countrywith only 5 percent as many people.To say that the opportunity is enor-mous is an understatement. Nomarket in the world shows greaterpromise for rapid, sustained growthfor years to come.
M a INDIA
With 860 million people, India is, byfar, the largest market in which Com-
pany products are not currently pro-duced. Thatshouldchangein1993,thanks to the Indian government'sapproval of a joint venture formed in
late 1991.The Company will not, however,
be starting from scratch. During the1970s, the Coca-Cola system in
India comprised 21 bottlers sellingmore than 32 million unit cases an-nually and accounting for 60 per-cent of the country's carbonated
soft drink sales. The Company leftIndia in 1977, but the Coca-Colatrademark continues to enjoystrong, positive recognition and re-
call among consumers.The immediate task is to re-
establish bottling and distributionnetworks in and around large met-ropolitan areas. Once up and run-ning, we will be addressing severalmarketing opportunities, includingpackaging, where we see tremen-
dous potential for large, multiservecontainers.
CHINA
The Company resumed operationsinChinain 1981 after an absence of
41 years. Since our re-entry, wehave invested $75 million in 13 bot-tling plants and a concentrate plantin Shanghai, which makes it pos-
sible for bottlers to purchase con-centrate with local currency, a dis-tinct advantage.
Company products have long
been acceptable in China—in 1933the country became the first marketoutside the United States to postannual sales of more than a million
unit cases —and we are continuingto invest as necessary to make themavailable and affordable to everyone of China's 1.2 billion people.
INDONESIA
If there is such a thing as an idealsoft drink market, it probably looks
like Indonesia. Fifty-five percent ofits 180 million people are underage 25; the average year-roundtemperature is a humid 80°F; gross
national product is growing 6 to 7percent a year; and the governmentwelcomes foreign investment.
Last year, the Coca-Cola sys-
tem sold 34 million unit cases ofCompany products, accounting for71 percent of all carbonated softdrinks sold in the country. Because
we see the potential for a vastlylarger market, we have, over thepast few years, rationalized our bot-tling system and entered, directly
and indirectly, into three joint ven-tures that last year posted 87 per-cent of oursystem'sunit case sales.Since we began making these in-vestments in 1987, unit case saleshave grown at a compound annualrate of 15 percent, and the businessis well positionedforcontinued rapid
growth in the years to come.

0)
Coca-Cola
New York 53%
Brucephil 29%
Coca-Cola Beverages 49%
(Canada)
Coca-Cola
Consolidated
Coca-Cola
Enterprises 44%
Grupo Continental 11%
(Mexico)
Industria de Cafe 37%
(Guatemala)
Industrias Roman 20%
(Colombia)
Coca-Cola S.A. 100%
Inti S.A. 57%
(Argentina)
NCCB 30%
(Netherlands)
Brussels Bottler 28%
Belgium CBO 100%
(Brugge/Hasselt/Aalst)
France CBO 100%
Coca-Cola &Schweppes
Beverages 49%
Essen CBO 100%
Gottingen CBO 100%
Frankfurt Bottler 44% 0
Eastern Germany CBO 100%
Cologne CBO 80%
West Berlin CBO 100%
Dusseldorf Bottler 30%
Refresca AG 33%
(Switzerland)
BONAGUI
(Guinea)
44%
Refrescos
doBrasil 13%
(Brazil)
Montevideo
Refrescos 55%
(Uruguay)
AN SAN 88%
MAKSAN100%
(Turkey)
IAWC(Egypt) 100%
I Nairobi CBO 77%
Zambia Bottlers Ltd.
100%
Hainan 25%
Tianjin Bottler 50%
(China)
Taiwan Bottling
Company 34%
Swire Bottle
Coca-ColaPhilippines 30%
Coca-ColaAmatil51%
Thai Pure
Drinks Ltd.
Bucharest
CBO 51%Milan CBO 100%
Rome CBO 100%
Turin CBO 100%
Piacenza CBO 100%

Since 1981, the Company has invested approximately $2 billion in more
than 40 bottling and canning operations around the world. They range from
joint ventures, to minority interests in public companies, to bottling opera-
tions in which the Company owns a majority interest ("CBO"). By working
closely with our bottlers to help increase retail sales, we are also boosting
our concentrate sales. These investments, shown on the map at left, also
allow us to share in the earnings of our system and the increasing value of
individual bottling companies. As the
graph below illustrates, we have an
ownership interest in bottlers ac-
counting for 38 percent of the 8.9
billion unit cases sold by our world-
wide bottling system last year.

Worldwide 1991 Unit Case Sales
United States 33%• Latin America 26%
EuropeanCommunity 18%
• Pacific 12%Northeast Europe/Africa 9%Canada 2%
The World'sFavorite Soft Drinks »> SwedenAn International Sampling
Australia
Austria
Belgium
Brazil
Denmark
France
Germany
Great Britain
Greece
Italy
Japan**
Korea
Norway
Spain
Sweden
Market Leader
Coca-Cola
Coca-Cola
Coca-Cola
Coca-Cola
Coca-Cola
Coca-Cola
Coca-Cola
Coca-Cola
Coca-Cola
Coca-Cola
Coca-Cola
Coca-Cola
Coca-Cola
Coca-Cola
Coca-Cola
LeadershipMargin
3.3-1
2.6-1
6.9-1
3.9-1
1.4-1
2.7-1
3.5
1.7-1
2.6-1
2.0-1
1.5-1
1.6-1
2.0-1
1.5-1
2.8
SecondPlace
diet Coke
Fanta
local brand
local brand
local brand
local brand
Fanta
diet Coke
Fanta
Fanta
Fanta
local brand
Coke light
local brand
Fanta
" Share of flavored, carbonated soft drink salesSource: A. C. Nielsen
" Source: Company data
1991 Per Capita Consumptionof Company Products inSelected Countries(8-Ounce Servings
per Person per Year)
United Stales
Norway
Germany
Canada
Spain
Argentina
Japan*
Colombia
Brazil
Italy
Philippines
Great Britain
International average 39
Taiwan 38
Morocco 35
Turkey 21
Indonesia 4'Includes non-carbonated soft drinks

European Community Group
In 1991, Coke light became
Europe's number three selling
soft drink, behind Coca-Cola
and Fanta. Despite adverse
economic conditions in Great
Britain, where gallon sales were
down, overall gallon sales in
the EC Group rose 6 percent. Two concentrate
megaplants are now serving a vastly more efficient
network of approximately 100 bottlers, less than
half the number of just 10 years ago, and many
Company departments have been reorganized to
function on a pan-European basis.
Growth Rate1991 vs. 1990
Germany
Great Britain
Spain
Italy
France
Benelux
Other
Total
Gallon
Sales
17%
(9)%
<2)%
4%
10%
8%
3%
6%
Unit CaseSales
19%
(11)%
6%
4%
11%
9%
4%
8%
Germany 13 manufacturing and distri-bution facilities operating in easternGermany. ..two years after entering east-ern Germany, sales reached 71 millionunit cases...restructuring in western Ger-many resulted in further consolidation
Spain Comprehensive marketing pro-grams implemented to capitalize on Sum-mer Olympics and Seville's Expo '92
I Italy Coca-Cola light reintroduced...strong bottler system initiated aggres-sive marketing programs... continued ac-quisition and consolidation of Company-owned bottling operations in the north
France Aggressive pricing and mer-chandising programs expanded marketleadership nearly 4 points...emphasis onrelationships with key retail customersimproved in-store presence... intensifiedfocus on cold drink market

Pacific Group
Pacific Group1991 Unit Case Sales
Fueled by continued strong momentum in Japan,
overall gallon sales increased 4 percent, despite
several natural disasters in the region. Significant
investments in soft drink production and distribu-
tion equipment are building a foundation for future
growth in premier markets like Japan and Australia
and in largely untapped markets like Indonesia
and China.
• Japan* 42%Philippines 16%
H Australia 11%Korea 8%Thailand 7%Other 16%
'Includes Japanese non-carbonated soft drinks
Growth Rate1991 vs.1990
Japan*
Philippines
Australia
Korea
Thailand
Other
Total*
Gallon Unit CaseSales Sales
7%
0%
1%
1%
3%
3%
4%
7%
(D%
2%
(1)%
3%
7%
4%
'Includes Japanese non-carbonated soft drinks
Japan Coca-Cola light unit case salesincreased 35 percent...Georgia Ice Cof-fee and Cafe Au Lait Premium success-fully launched... Betacarotene-enrichedsoft drink VegitaBeta and Bonaqua fla-vored water test marketed
Philippines Sprite position enhancedthrough launch of 1-liter package...pre-sell delivery program implemented,increasing distribution efficiencies...Company products accountedfor76 per-cent of industry soft drink sales
Thailand More than 100 million unitcases sold...strong Fanta and Sprite unitcase sales helped secure Company mar-ket leadership...strong post-mix growth
Australia Lift and diet Lift launched...12-packcans rolled out... newSkysurfercommercial immensely successful... colddrink equipment placements increasedby 34 percent
China Shanghai, Nanjing, Hangzhouand Tianjin plants sparked 64 percentunit case sales increase... cold drink avail-ability increased... post-mix sales nearlydoubled... joint venture bottling plantopened on Hainan Island

NEA Group
The Northeast Europe/Africa (NEA) Group regis-
tered excellent unit case sales growth in most
major markets. This growth, however, was partly
offset by the effects of recession and civil distur-
bances in some markets, principally in Africa. Over-
all, the NEA Group achieved a 5 percent increase
in unit case sales and a 3 percent increase in gallon
sales, as bottlers in Africa reduced concentrate
inventories. During the year,
important groundwork was laid
for future growth in East Cen-
tral Europe and the Middle East.
The dynamic geopolitical envi-
ronment and the move toward
market economies bode well
for the NEA Group.
Nigeria Double-digit unit casegrowth...larger packages and thousandsof new coolers driving volume...new con-centrate plant opened, permitting reduc-tion in bottler's inventory levels, whichmoderated gallon sales growth
Norway New PET packaging contrib-uted strongly to solid growth...Coke lightreached 14 percent share, highest inworld
Turkey Company-owned Ankara bot-tler set pace with 50 percent unit casegrowth...new Company-owned plantopened in Trabzon, contributing to over-all solid growth
Austria Coke, Fanta, Sprite and each oftheir light versions all gained ground,propelling double-digit unit casegrowth...new PET packaging
Growth Rate1991 vs. 1990
Africa Division
GallonSales
(2)%
Unit CaseSales
2%
East Central European Division 12%
Middle East Division 27%
Nordic andNorthern Eurasia Division (14)%
Total 3%
9%
11%
6%
5%
NEA Group1991 Unit Case Sales
Africa Division 53%East Central EuropeanDivision 22%Middle EastDivision 13%Nordic andNorthern EurasiaDivision 12%

Latin America Group
Growth Rate, 1991 vs. 1990
Mexico
Brazil
Argentina
Chile
Other
Total
Gallon Unit CaseSales Sales
7%
4%
31%
11%
9%
8%
6%
4%
31%
9%
9%
8%
Gallon sales for the Latin America Group rose 8
percent, thanks in part to falling trade barriers and
government deregulation, which permitted the in-
troduction of larger package sizes. Larger pack-
ages were introduced in Guatemala, Colombia,
Paraguay, Chile and Mexico. And in Brazil and
Argentina, the 1.5-liter PET bottle
is quickly becoming the most popu-
lar package. Mexico became the
first country outside the United
States to sell more than 1 billion
unit cases in a year.
Mexico Larger refillable glass and 1.5-liter PET packages launched...Spritelaunched in key markets...significant in-vestments in production and distributioninfrastructure
Brazil Four new production facilitiesopened, four more planned for 1992...larger cups and 2,200 additional dispens-ers helped increase post-mix volume
Argentina Diet Coke reformulated andrelaunched...cans introduced in keymarkets...larger package sizes helpeddrive 31 percent unit case sales increase
Chile Diet Coke unit case sales up 29percent...340 additional post-mix unitsplaced...cans launched in Santiago andother key markets...key account man-agement system implemented for largecustomers

Coca-Cola USA
Total Liquid
Consumption
Representing 33 percent of the Company's total sales, more than 3
billion unit cases, Coca-Cola USA posted impressive results, gaining
share and volume on an already phenomenal base. Coca-Cola USA
now accounts for 41 percent of total U.S. soft drink sales. Coca-Cola
USA's gallon sales increased more than 2 percent, and unit case sales
increased 2.5 percent, substantially higher than the rest of the industry.
To grasp the sheer size of Coca-Cola
USA's growth last year, consider that
the division already accounts for 10
percent of America's total liquid con-
sumption. In 1991, the gap between
Coca-Cola USA and its nearest com-
petitor expanded to more than our total
annual case sales in Brazil, our sec-
ond-largest international market.
Coca-Cola USA 10°/<Other CarbonatedSoft Drinks 15%Juice 6%Mi Ik 15%
• Coffee 11%• Beer 12%• Tap Water 19%• Other 12%
1.1%
1991 Unit CaseSales Growth
Coca-Cola Rest ofUSA Industry

Post-Mix Opportunity
Post-mix 6%
Post-mix 32%
InternationalTotal Gallons:1.6 Billion
USATotal Gallons:742 Million
Bottle/Can 94%
Bottle/Can 68%
Although relatively youthful compared to the U.S.
post-mix business, the international post-mix busi-
ness is growing rapidly and holds tremendous
worldwide potential. In 1991, post-mix accounted
for 32 percent of total U.S. soft drink gallon sales,
but only 6 percent of international sales.
An emphasis on strengthening the Minute Maid
trademark and driving volume resulted in contin-
ued market leadership and a 12 percent increase
in unit volume at Coca-Cola Foods. Total orange
juice volume increased nearly 17 percent, includ-
ing a 22 percent increase in retail volume for
Minute Maid orange juice. Volume of other juice
and juice-drink products was up nearly 8 percent.
Coca-Cola Food
Total SalesIn Millions of Gallons
TotalOrange JuiceOther Juices andJuice Drinks
271 278232

Financial Report
46 Financial Review IncorporatingManagement's Discussion and Analysis
54 Selected Financial Data
56 Consolidated Balance Sheets
58 Consolidated Statements of Income
59 Consolidated Statements of Cash Flows
60 Consolidated Statements ofShare-Owners' Equity
61 Notes to Consolidated FinancialStatements
71 Report of Independent Auditors
72 Report of Management
73 Quarterly Data
73 Financial Glossary

Financial Review IncorporatingManagement's Discussion and Analysis The Coca-Cote Company and Subsidiaries
Management's primary objective is to maximize share-owner
value overtime. To accomplish this objective, The
Coca-Cola Company and subsidiaries {the Company) havedeveloped a comprehensive business strategy that empha-
sizes maximizing long-term cash flow by increasing gallon
sales, optimizing profit margins, expanding global business
systems through investment in areas offering attractive
returns and maintaining an appropriate capital structure.
The success of this strategy is evidenced by the growth in
the Company's cash flow and earnings, its increasedreturns on total capital and equity and the total return to
its share owners.Global Business Systems: The Company distributes its
products in more than 185 countries. In 1991, the Coca-Cola
system continued to expand into new markets, including
joint ventures in Hungary, Romania and Indonesia, andinvestments in production and distribution infrastructure in
eastern Germany and Poland. Per capita consumption of
Company products increased in most markets. With effec-
tive global systems in place, the Company is well positioned
to capitalize on investment opportunities as they arise.
Investments: Management seeks investments that
strategically enhance existing operations and offer cash
returns that exceed the Company's long-term weighted aver-
age cost of capital, estimated by management to be approxi-mately 12 percent after taxes. Capital expenditures in 1991
amounted to approximately $678 million in the Company's
soft drink business, $57 million in its foods sector and $57million in its corporate operations.
The Company's soft drink business provides an attrac-tive area for investment due to its inherent high returns.
Most soft drink markets are relatively undeveloped com-
pared to the United States market. International per capita
consumption of Company products is still only 13 percent of
the United States level. As a result, attractive investmentopportunities exist to expand the production, distribution and
marketing systems in these markets. Additional strategic
investments are also required in the relatively more devel-oped markets to increase product availability, enhance mar-
keting focus and improve efficiency. Efficiencies have been
gained through the continued consolidation of production and
distribution networks and investment in the latest technology
and information systems.
A significant element of the Company's financial frame-
work is bottling investments. The principal objective of theseinvestments is to ensure the strongest and most efficient
production, distribution and marketing systems possible, inorder to maximize long-term growth in volume, cash flow
and share-owner value of the bottler and the Company.
When considered appropriate, the Company makes
equity investments in bottling companies (typically between
20 percent and 50 percent). Through these investments, the
Company is able to help focus and improve sales and mar-
keting programs, assist in the development of effective busi-
ness and information systems and help establish capital
structures appropriate for these respective operations.

Financial Review IncorporatingManagement's Discussion and Analysis The coca-Cola company and Subsidiaries
!n certain situations, management believes it is advan-
tageous to own a controlling interest in bottling operations.
For example, in eastern Germany, the Company's objectiveis to establish a modern soft drink business quickly. Due to
the limited local resources, this is being accomplishedthrough a wholly-owned bottling subsidiary.
In connection with restructuring the bottling system, the
Company periodically participates in bottler ownership
changes or takes temporary ownership positions in bottlers.
The length of ownership is influenced by various factors,
including operational changes, management changes or
other restructuring that may be taking place at the bottleritself, and the process of identifying appropriate new
investors.
At December 31, 1991, the Company owned approxi-
mately 51 percent ol Coca-Cola Amatil Limited (CCA), an
Australian-based bottler of Company products and manufac-
turer of snack foods. The Company expects to reduce its own-
ership interest to below 50 percent within the next 3 years.
Accordingly, the investment has been accounted for by the
equity method of accounting. If valued at the December 31,
1991, quoted closing price of the publicly traded CCA common
shares, the calculated value of the Company's investment in
CCA exceeded its $571 million carrying value by approximately
$201 million at December 31, 1991.At December 31,1991, the Company had an additional
$279 million of investments that represented majority interests
in companies that were not consolidated. These investments
were accounted for by the cost or equity methods, dependingon the circumstances. Approximately $170 million related to
recent acquisitions that will be consolidated in 1992 when
alignment of financial reporting systems is complete. Theremainder related primarily to a temporary majority interest in
The Coca-Cola Bottling Company of New York, Inc., which
management expects to reduce to below 50 percent within the
next 2 years. Based on management's estimates, the market
values of these majority-owned investments exceeded their
carrying values at December 31,1991.
The Company's consolidated bottling subsidiaries pro-
duced and distributed approximately 5 percent of worldwidebottle/can unit case sales and generated approximately $1.5
billion in revenues in 1991. Equity investee bottlers produced
and distributed an additional 33 percent of worldwidebottle/can unit case sales.
Gallon Sales and Margins: The Company's emphasison profitable gallon-sales growth is reflected in its level of re-
investment in the form of increased advertising. Advertising
expenditures increased to $988 million in 1991, compared to$932 million in 1990 and $888 million in 1989. These expen-
ditures position and enhance the Company's products as
industry leaders.
Gallon sales and profits have benefited from the Company'sownership of and investments in bottling operations. While
the bottling business has relatively lower margins on sales
revenue compared to the concentrate business, aggressive
investment in soft drink infrastructure has resulted in growth
in share and unit case sales at the bottler level, which in turn
generates gallon-sales gains for the concentrate business.
The Company manages its concentrate and bottlingoperations so as to optimize profit margins while at the same
time increasing gallon-sales growth and its share of soft
drink sales. Through cost control and efficient marketing, the
Company has generally been able to maintain or improve
margins in 1991 despite declining economic conditions in
several key markets.
Capital Structure: The Company utilizes prudent debt
levels to lower its overall cost of capital and increase its total
return to share owners. The Company operates under a self-imposed net-debt-to-net-capital ratio ceiling of 35 percent,
excluding the Company's finance subsidiary. Net debt repre-
sented 20.9 percent of net capital at December 31, 1991,
compared with 22.8 percent at December 31,1990. Net debt
and net capital are net of $.8 billion and $1.2 billion of cash,
cash equivalents and current marketable securities in
excess of operating requirements at December 31, 1991 and
1990, respectively.

Financial Review IncorporatingManagement's Discussion and Analysis The Coca-Cola Company ahd Subsidiaries
Additional borrowing capacity within the 35 percent net
debt ceiling was approximately $1.2 billion at December 31,
1991, excluding the Company's finance subsidiary. The
Company anticipates using this additional borrowing capac-
ity principally to fund investment opportunities that meet itsstrategic and financial objectives and, as a second priority,
to fund the share repurchase program.
In October 1989, the Board of Directors approved a plan
to repurchase up to an additional 40 million shares of the
Company's common stock. Under this program, approximately
24.8 million shares (including 6.9 million shares in 1991)
have been repurchased at an aggregate cost of approxi-
mately $1 billion (including $397 million in 1991). Since theintroduction of share repurchase programs in 1984, the Com-
pany has repurchased 192.6 million shares at an aggregate
cost of approximately $4 billion. This represents nearly a
quarter of the Company's common shares that were out-
standing in 1984. If these shares were valued based on the
December 31, 1991, quoted closing price of the Company's
common stock traded on the New York Stock Exchange, the
result would be approximately $15.5 billion.
In February 1991, the Company completed the redemp-
tion of the remaining $75 million of its initial $300 million of
Cumulative Money Market Preferred Stock (MMP). In 1990,
the Company redeemed $225 million of the MMP.
The Company's capital structure and financial policies
have resulted in long-term credit ratings of "AA" from
Standard & Poor's and "Aa2" from Moody's, as well as thehighest credit ratings available for its commercial paper pro-
grams. The Company's strong financial position and cash
flow allow it opportunistic access to financing in financial
markets around the world.
Economic Profit and Economic Value Added: A significantportion of the increase in the rate of growth of the Company's
earnings, returns and cash flows can be attributed to the
Company taking actions to (a) increase share and gallon-
sales growth for its products, (b) increase its investments inthe high-margin, high-return soft drink business and (c) man-
age its existing asset base effectively and efficiently. Eco-
nomic Profit and Economic Value Added provide amanagement framework to measure the impact of these
value-oriented actions. Economic Profit is defined as net
operating profit after taxes in excess of capital charges for
average operating capital employed. Economic Value Added
represents the growth in Economic Profit from year to year.
Economic Profit and
Economic Value Added vs.
Stock Price Appreciation
Per Share ;.'. Economic ProfitStock Price per Share
$63
$42
1986 1991 1986 1991

Financial Review IncorporatingManagement's Discussion and Analysis The coca-cota company ami subsidiaries
Over the last five years, Economic Profit has grown
more than 3 times, resulting in Economic Value Added to the
Company of $732 million. Over the same period, the
Company's stock price has increased more than 4 times.
Management believes that, over the long term, growth in
Economic Profit, or Economic Value Added, will have a
positive impact on the growth in share-owner value.
Return to Share Owners: During the past decade, theshare owners of the Company have enjoyed an excellent
return on their investment. A $100 investment in the
Company's common stock at December 31, 1981, together
with reinvested dividends, would be worth approximately$1,902 at December 31, 1991 —an average annual com-
pounded return of 34.3 percent.
Strong earnings growth has enabled the Company to
reduce the dividend payout ratio while increasing the cash
dividend per common share by an average annual com-
pounded growth rate of 9.4 percent since December 31,
1981. The annual common stock dividend was $.96 per
share, $.80 per share and $.68 per share in 1991, 1990 and
1989, respectively. At its February 1992 meeting, the Board
of Directors increased the quarterly dividend per common
share to $.28, equivalent to a full-year common dividend of
$1.12 in 1992. This is the 30th consecutive year in which the
Board of Directors has approved common stock dividend
increases.
With approval from the Board of Directors, management
plans to maintain a common stock dividend payout ratio of
approximately 40 percent of earnings available to commonshare owners. The 1991 dividend payout ratio was 46.9
percent based on prior year earnings available to common
share owners and 39.5 percent based on current year
results.

Financial Review IncorporatingManagement's DisCUSSion and Analysis The Coca-Cola Company and Subsidiaries
Management's Discussionand Analysis
Lines of Business
The Company operates in two major lines of business:soft drinks and foods (principally juice and juice-drinkproducts).
Soft Drinks: The Company is the largest manufacturer,
marketer and distributor of soft drink concentrates and
syrups in the world. It manufactures soft drink concentratesand syrups, which it sells to bottling and canning operations,
and manufactures fountain/post-mix soft drink syrups, whichit sells to authorized fountain wholesalers and some fountain
retailers. The Company has substantial equity investmentsin numerous soft drink bottling and canning operations, and
it owns and operates certain bottling and canning operations
outside the United States.
Foods: The foods business sector's principal business
is processing and marketing citrus and other juice and juice-
drink products, primarily orange juice. It is the world's largest
marketer of packaged citrus products.
Operating Results
Soft Drinks: Worldwide revenues and operating income forthe Company's soft drink business increased in 1991 pri-
marily due to gallon-sales growth, price increases and con-tinued expansion of bottling and canning operations. In
1990, revenues and operating income increased due to
gallon-sales growth, price increases and the positiveexchange effects of a weaker dollar.
Gallon sales of concentrates and syrups increased
5 percent and 6 percent in 1991 and 1990, respectively.
Operating income increased 18 percent in 1991 compared
to 16 percent in 1990, excluding nonrecurring items. Operat-ing income in both years was favorably affected by system
efficiencies and a more favorable product mix.
In the United States, gallon sales increased more than
2 percent in 1991, compared to an increase of just over 3
percent in 1990. The increase in 1991 was due in part to full-
year results from significant fountain customers added in
1990. The Company's growth in the United States outpaced
the growth of the rest of the industry in both 1991 and 1990.
Soft drink gallon sales outside the United States
increased 6 percent in 1991 and 8 percent in 1990. Approxi-mately 68 percent of soft drink gallon sales were generated
outside the United States in 1991 and 1990.
In 1991, international performance was led by strong
results in Latin America, where gallon sales advanced 8 per-
cent. Gallon sales increased 6 percent in the European
Community, 4 percent in the Pacific and 3 percent in North-
east Europe/Africa.

Financial Review IncorporatingManagement's Discussion and Analysis The Coca-Cofa Company and Subsidiaries
In 1990, gallon sales increased 14 percent in the Euro-
pean Community, 11 percent in the Pacific, 8 percent in
Northeast Europe/Africa and 4 percent in Latin America.
Foods: In the foods business sector, 1991 revenues
increased 2 percent and operating income increased 11
percent, primarily due to a 12 percent volume increase,
partially offset by price decreases. The volume increase
reflects 17 percent and 29 percent growth in the Company's
retail chilled and frozen orange juice categories, respec-
tively. The volume increase for chilled orange juice benefited
from a 38 percent volume gain for Minute Maid Premium
Choice not-from-concentrate orange juice.
In 1990, revenues increased 1 percent, primarily due to
price increases, offset by volume decreases. Revenues in
1990 increased 3 percent after adjustments for business
disposals in 1989.
Selling, Administrative and General Expenses
Selling expenses were $3.5 billion in 1991, $3.2 billion in
1990 and $2.6 billion in 1989. The increases in 1991 and
1990 were due primarily to higher marketing investments in
line with expansion of the business.
Administrative and general expenses increased 24 per-
cent and 20 percent in 1991 and 1990, respectively. The
1991 increase was due to the growth of the business and
stock-related employee benefits. The 1990 increase was
due to the growth of the business and the inclusion of a full
year of administrative and general expenses of the French
bottling operation acquired in 1989. Administrative and gen-
eral expenses, as a percentage of net operating revenues,
were approximately 9 percent in 1991 and 8 percent in 1990
and 1989.
Interest Income and Interest ExpenseInterest expense declined in 1991 due primarily to lower
interest rates. Interest income in 1991 remained consistent
with 1990 levels.
Interest income and interest expense decreased in 1990
due primarily to lower average invested balances and bor-
rowings and lower interest rates.
Equity IncomeEquity income decreased $70 million in 1991 due primarily to
a decrease in earnings of Coca-Cola Enterprises Inc. (CCE).
CCE's 1991 results were less than prior year earnings due to
pretax restructuring charges of $152 million, a pretax charge
of $15 million to increase insurance reserves and a nonre-
curring gain that was recorded by CCE in 1990. The 1991
decrease in equity income was partially offset by improved
results of the Company's United Kingdom equity investee,
Coca-Cola & Schweppes Beverages Ltd. (CC&SB), which
implemented a cost reduction program during 1991.
In 1990, equity income increased approximately $35
million due primarily to the inclusion of a full year of equity
earnings from CCA and growth in earnings of CCE and
CC&SB. CCE's 1990 earnings included a pretax gain of
approximately $56 million on the sale of two bottling opera-
tions to Johnston Coca-Cola Bottling Group, Inc. (Johnston),
a bottling company that, at the time of the sale, was 22 per-
cent owned by the Company. CCE's 1990 results also
included nonrecurring charges of $19 million.

Financial Review IncorporatingManagement's Discussion and Analysis The coca-Cola Company and Subsidiaries
Other Income—NetThe $28 million favorable change in other income—net in
1991 results from a pretax gain of $69 million on the sale of
property no longer required as a result of a consolidation of
concentrate operations in Japan and a pretax gain of $27
million on the sale of the Company's 22 percent ownership
interest in Johnston to CCE. This favorable change was
partially offset by an increase in net foreign exchange costs
(including certain hedging costs) and a nonrecurring gain
that was recorded in the prior year.
The $52 million unfavorable change in other income-
net in 1990 is due to a $61 million pretax gain recorded in
1989 related to the sale of Belmont Springs Water Co., Inc.
and net foreign exchange costs in 1990 compared to net
foreign exchange gains in 1989. This unfavorable change
was partially offset by a 1990 pretax gain of $52 million on
the Company's investment in BCI Securities L.P. (BCI)
resulting from BCI's sale of Beatrice Company stock.
Discontinued OperationIn November 1989, the Company sold its common and pre-
ferred stock investments in Columbia Pictures Entertain-
ment, Inc. (CPE) for approximately $1.6 billion in cash. The
sale resulted in a pretax gain of approximately $930 mil-
lion. On an after-tax basis, the gain was approximately
$509 million or $.74 per common share. CPE has been
reported as a discontinued operation, and, accordingly, the
gain from the sale of CPE stock and the Company's equity
income from CPE have been reported separately from
continuing operations.
Liquidity and Capital ResourcesThe Company generates a significant amount of cash from
operations. Normalized free cash flow (defined as operating
cash flow less capital expenditures) was $1.3 billion in 1991,
$691 million in 1990 and $672 million in 1989.
In 1991, primary sources of cash were from operations,
issuances of debt and the sale of the Company's 22 percent
ownership interest in Johnston. Primary uses of cash were
payments of debt, capital expenditures, dividends, pur-
chases of common stock for treasury and acquisitions of
businesses.
In 1990, primary sources of cash were from operations,
issuances of debt, the sale of a temporary investment and
the sale of CCE stock to CCE under a share repurchase
program. Major uses of cash were capital expenditures,
dividends, estimated tax payments related to the 1989 gain
on the sale of CPE stock, purchases of common stock for
treasury and the redemption of preferred stock.
At December 31. 1991, the Company had $753 million
in lines of credit and other short-term credit facilities contrac-
tually available, under which $111 million was outstanding.
The lines included $505 million designated to support com-
mercial paper and other borrowings, of which no amounts
were outstanding at December 31, 1991.
The Company's ratio of earnings to fixed charges was
11.6 in 1991, 8.5 in 1990 and 6.2 in 1989. The Company
aggressively manages its mix of short-term versus long-term
debt to lower its overall cost of borrowing, resulting in cur-
rent liabilities exceeding current assets at December 31.
1990.
The increase in prepaid expenses and other assets in
1991 was primarily due to growth in the business, increases
in prepaid marketing expenses and amounts due from the
sale of assets.
While total debt decreased in 1991, the Company
increased its long-term debt levels. During 1991. the
Company issued $250 million of 73A percent five-year notes
due in 1996 and $250 million of 77/e percent seven-year
notes due in 1998. The proceeds were used to pay current
loans and notes payable and replace $86 million of 11 %
percent notes that matured in 1991.

Financial Review IncorporatingManagement's Discussion and Analysis The Coca-Cola Company and Subsidiaries
In 1990, working capital accounts, including trade
accounts receivable, inventories and accounts payable,
increased due primarily to the expansion of French bottling
operations and entry into the eastern German market. Pre-
paid expenses and other assets decreased in 1990 due to
the sale of a temporary investment to CCE.
The 1990 decrease in accrued taxes reflects estimated
tax payments related to the gain on the November 1989 sale
of the Company's investment in CPE. The estimated tax
payments resulted in an increase in loans and notes pay-
able The 1990 increase in loans and notes payable was also
attributable to capital investments, the redemption of pre-
ferred stock and the share repurchase program.
International Operations
Approximately 79 percent of total operating income in 1991
was generated by operations outside the United States.
International operations are subject to certain opportunities
and risks, including currency fluctuations and government
actions. The Company closely monitors its methods of oper-
ating in each country and adopts strategies responsive to
changing economic and political environments. In addition,
the Company engages in various hedging activities to
minimize potential losses on cash flows denominated in
foreign currencies
The Company uses approximately 40 functional cur-
rencies. For the Company, the weighted average annual
exchange rates of foreign hard currencies, compared to the
U.S. dollar, weakened slightly during 1991 and strengthened
approximately 5 percent in 1990. In 1991, 1990 and 1989,
weighted average exchange rates for certain key foreign cur-
rencies strengthened (weakened) against the U.S. dollar as
follows:
Australian dollar
British pound
Canadian dollar
German mark
Japanese yen
1991
1 %
(1)%
1 %
<3>%
8%
1990
0%
10%
2%
17%
(5)%
19S9
1 %
(9)%
4%
(6)%
(7)%
Exchange effects recorded in other income—net were $(22)
million in 1991, $(.5) million in 1990 and $20 million in 1989.
Exchange effects include costs of hedging certain balance
sheet, translation and transaction exposures, net gains or
losses on foreign currency transactions and the remeasure-
ment of foreign currencies into functional currencies.
Impact of Inflation and Changing Prices
Inflation is a factor in many markets around the world and
consequently impacts the way the Company operates. In
general, management believes that the Company is able to
adjust prices to counteract the effects of increasing costs
and generate sufficient cash flow to maintain its productive
capability.
In highly inflationary countries, the Company has bene-
fited from its net monetary liability position in recent years.
This position is viewed as a hedge against the effects of
inflation, since net liabilities would ultimately be paid with
devalued currency.
Additional Information
For additional information concerning the Company's opera-
tions, cash flow, liquidity and capital resources, this analysis
should be read in conjunction with the information on pages
56 through 72 of this Annual Report. Additional information
concerning operations in different lines of business and
geographic areas is presented on pages 69 and 70.
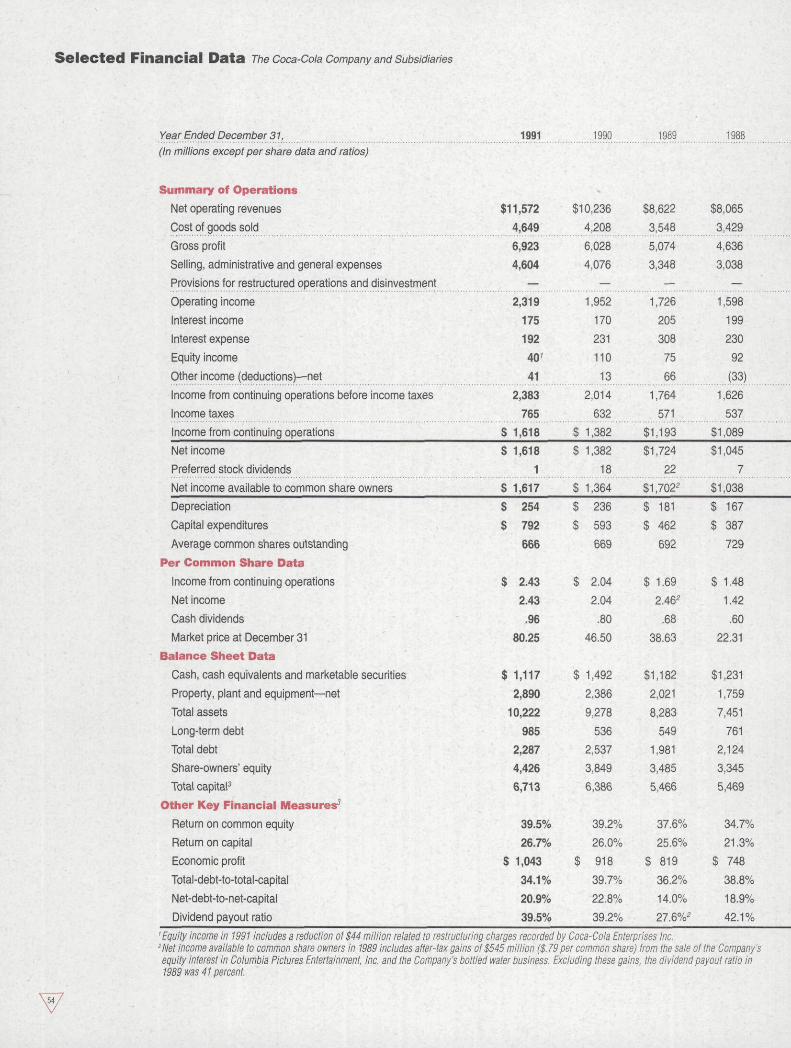
Selected Financial Data TheCoca-Cola Company and Subsidiaries
Year Ended December 31, 1991 1990 1989 1988
(In millions except per share data and ratios)
Summary of Operations
Net operating revenues
Cost of goods sold
Gross profit
Selling, administrative and general expenses
Provisions for restructured operations and disinvestment
Operating income
Interest income
Interest expense
Equity income
Other income (deductions)— net
Income from continuing operations before income taxes
Income taxes
Income from continuing operations
Net income
Preferred stock dividends
Net income available to common share owners
Depreciation
Capital expenditures
Average common shares outstanding
Per Common Share Data
Income from continuing operations
Net income
Cash dividends
Market price at December 31
Balance Sheet Data
Cash, cash equivalents and marketable securities
Property, plant and equipment— net
Total assets
Long-term debt
Total debt
Share-owners' equity
Total capital3
Other Key Financial Measures5
Return on common equity
Return on capital
Economic profit
Total-debt-to-total-capital
Net-debt-to-net-capital
Dividend payout ratio
$11,572
4,649
6,923
4,604__
2,319
175
192
40'
41
2,383
765
$ 1,618
$ 1,618
1
$ 1,617
$ 254
$ 792
666
$ 2.43
2.43
.96
80.25
$ 1,117
2,890
10,222
985
2,287
4,426
6,713
39.5%
26.7%
$ 1,043
34.1%
20.9%
39.5%
$10,236
4,208
6,028
4,076
_
1,952
170
231
110
13
2,014
632
$ 1,382
$ 1,382
18
$ 1,364
$ 236
$ 593
669
$ 2.04
2.04
.80
46.50
$ 1,492
2,386
9,278
536
2,537
3,849
6,386
39.2%
26.0%
$ 918
39.7%
22.8%
39.2%
$8,622
3,548
5,074
3,348
—
1,726
205
308
75
66
1,764
571
$1,193
$1 ,724
22
$1,702*
$ 181
$ 462
692
$ 1.69
2.462
.68
38.63
$1,182
2,021
8,283
549
1,981
3,485
5,466
37.6%
25.6%
$ 819
36.2%
14.0%
27.6%2
$8,065
3,429
4,636
3,038
—
1,598
199
230
92
(33)
1,626
537
$1 ,089
$1,045
7
$1,038
$ 167
$ 387
729
$ 1.48
1.42
.60
22.31
$1,231
1,759
7,451
761
2,124
3,345
5,469
34.7%
21 .3%
$ 748
38.8%
18.9%
42.1%
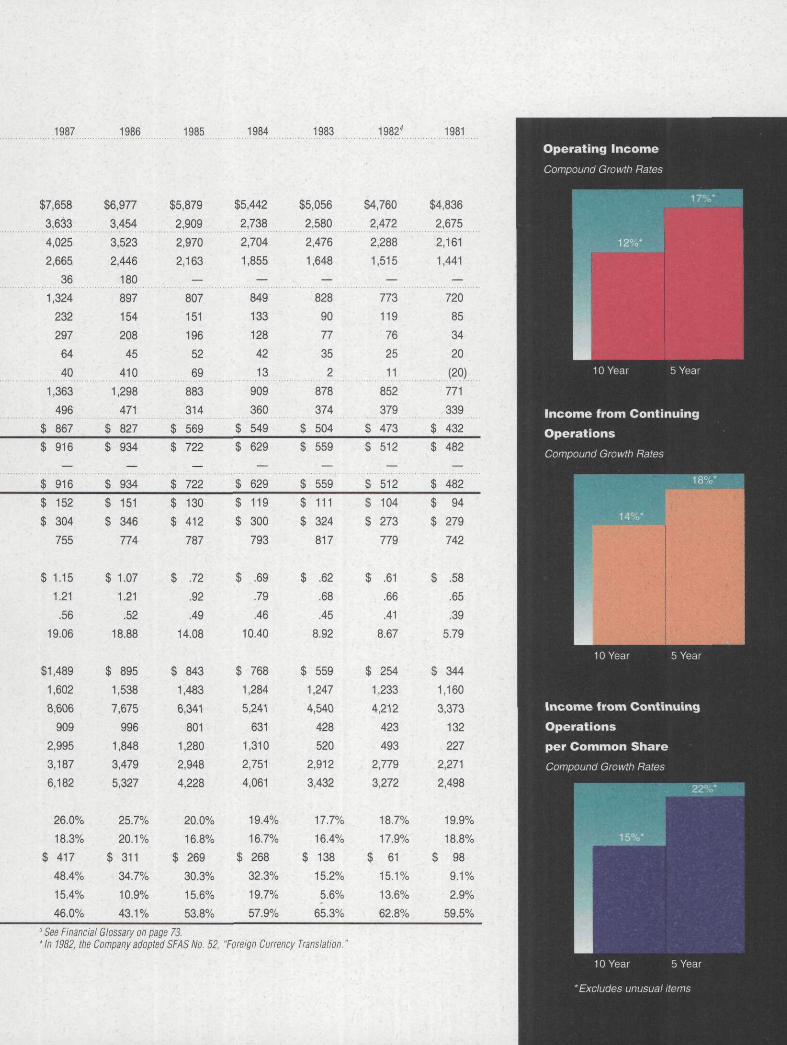
1987 1986 1985 1984 1983 1982' 1981
$7,658
3,633
4,025
2,665
36
1,324
232
297
64
40
1,363
496
$ 867
$6,977
3,454
3,523
2,446
180897
154
208
45
410
1,298471
$ 827
$5,879
2,909
2,970
2,163
—807151
196
52
69
883
314
$ 569
$5,442
2,738
2,704
1,855
—849
133
128
42
13
909
360
$ 549
$5,056
2,580
2,476
1,648
—828
90
77
35
2
878
374
$ 504
$4,760
2,472
2,288
1,515
—773
119
76
25
11
852
379
$ 473
$4,836
2,675
2,161
1,441
—
720
85
34
20
(20)771
339
$ 432
$ 916
$ 916
$ 934
$ 934
$ 722
$ 722
$ 629
$ 629
$ 559
$ 559
$ 512
$ 512
$ 482
$ 482
$ 152
$ 304
755
$ 1.15
1.21
.56
19.06
$1,489
1,602
8,606
909
2,995
3,187
6,182
26.0%
18.3%
$ 417
48.4%
15.4%
46.0%
$ 151
$ 346
774
$ 1.07
1.21
.52
18.88
$ 895
1,538
7,675
996
1,848
3,479
5,327
25.7%
20.1%
$ 311
34.7%
10.9%
43.1%
$ 130
$ 412
787
$ .72
.92
.49
14.08
$ 843
1,483
6,341
801
1,280
2,948
4,228
20.0%
16.8%
$ 269
30.3%
15.6%
53.8%
$ 119
$ 300
793
$ .69
.79
.46
10.40
$ 768
1,284
5,241
631
1,310
2,751
4,061
19.4%
16.7%
$ 268
32.3%
19.7%
57.9%
$ 111
$ 324
817
$ .62
.68
.45
8.92
$ 559
1,247
4,540
428
520
2,912
3,432
17.7%
16.4%
$ 138
15.2%
5.6%
65.3%
$ 104
$ 273
779
$ .61
.66
.41
8.67
$ 254
1,233
4,212
423
493
2,779
3,272
18.7%
17.9%
$ 61
15.1%
13.6%
62.8%
$ 94
$ 279
742
$ .58
.65
.39
5.79
$ 344
1,160
3,373
132
227
2,271
2,498
19.9%
18.8%
$ 98
9.1%
2.9%
59.5%J See Financial Glossary on page 73.1 In 1982, the Company adopted SFAS No. 52, "Foreign Currency Translation.

Consolidated Balance Sheets The Coca-Cote Company and Subsidiaries
December31, 1991 1990
(In thousands except share data)
Assets
Current
Cash and cash equivalents $ 1,058,250 $1,429,555
Marketable securities, at cost (approximates market) 58,946 62,569
1,117,196 1,492,124
Trade accounts receivable, less allowances of $34,567
in 1991 and $29,510 in 1990 933,448 913,541
Finance subsidiary—receivables 36,172 38,199
Inventories 987,764 982,313
Prepaid expenses and other assets 1,069,664 716,601
Total Current Assets 4,144,244 4,142,778
Investments and Other Assets
Investments
Coca-Cola Enterprises Inc. (CCE) 602,776 666,847
Coca-Cola Amatil Limited 570,774 569,057
Other, principally bottling companies 980,465 788,718
Finance subsidiary—receivables 288,471 128,119
Long-term receivables and other assets 442,135 321,977
2,884,621 2,474,718
Property, Plant and Equipment
Land 172,781 147,057
Buildings and improvements 1,200,672 1,059,969
Machinery and equipment 2,680,446 2,204,188
Containers 390,737 374,526
4,444,636 3,785,740
Less allowances tor depreciation 1,554,754 1,400,175
2,889,882 2,385,565
Goodwill and Other Intangible Assets 303,681 275,126
$10,222,428 $9,278,187
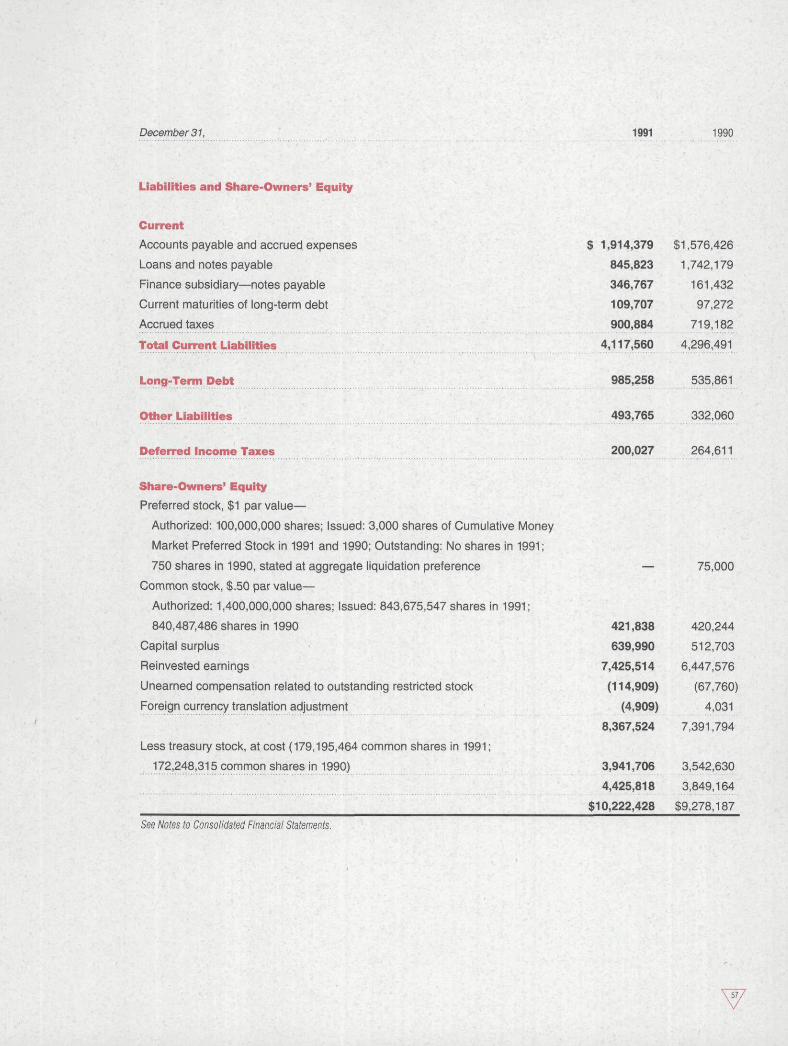
December 31, 1991 1990
Liabilities and Share-Owners' Equity
Current
Accounts payable and accrued expenses S 1,914,379 $1,576,426
Loans and notes payable 845,823 1,742,179
Finance subsidiary—notes payable 346,767 161,432
Current maturities of long-term debt 109,707 97,272
Accrued taxes 900,884 719,182
Total Current Liabilities 4,117,560 4,296,491
Long-Term Debt 985,258 535,861
Other Liabilities 493,765 332,060
Deferred Income Taxes 200,027 264,611
Share-Owners' Equity
Preferred stock, $1 par value-
Authorized: 100,000,000 shares; Issued: 3,000 shares of Cumulative Money
Market Preferred Stock in 1991 and 1990; Outstanding: No shares in 1991;
750 shares in 1990, stated at aggregate liquidation preference 75,000
Common stock, $.50 par value—
Authorized: 1,400,000,000 shares; Issued: 843,675,547 shares in 1991;
840,487,486 shares in 1990 421,838 420,244
Capital surplus 639,990 512,703
Reinvested earnings 7,425,514 6,447,576
Unearned compensation related to outstanding restricted stock (114,909) (67,760)
Foreign currency translation adjustment (4,909) 4,031
8,367,524 7,391,794
Less treasury stock, at cost (179,195,464 common shares in 1991;
172,248,315 common shares in 1990) 3,941,706 3,542,630
4,425,818 3,849,164
__ $10,222,428 $9.278,187
See Notes lo Consolidated Financial Statements.

Consolidated Statements of Income The Coca-Cola company and Subsidiaries
Year Ended December 31,
(In thousands except per share data)
1991 1990 1989
Net Operating Revenues
Cost of goods sold
Gross Profit
Selling, administrative and general expenses
Operating Income
Interest income
Interest expense
Equity income (1991 reduced by $44 million related to
restructuring charges recorded by CCE)
Other income — net
Income from Continuing Operations beforeIncome Taxes
Income taxes
Income from Continuing Operations
Equity income from discontinued operation
Gain on sale of discontinued operation
(net of income taxes of $421 ,021 )
Net Income
Preferred stock dividends
Net Income Available to Common Share Owners
Income per Common Share
Continuing operations
Discontinued operation
Net Income per Common Share
Average Common Shares Outstanding
See /Vote to Consolidated Financial Statements.
$11,571,614
4,648,385
6,923,229
4,604,184
2,319,045
175,406
192,515
39,975
41,368
2,383,279
765,277
1,618,002
—
—
1,618,002
521
$ 1,617,481
$ 2.43
—
$ 2.43
666,472
$10,236,350
4,208,850
6,027,500
4,075,936
1 ,951 ,564
169,985
230,979
110,139
13,727
2,014,436
632,532
1,381,904
—
—
1 ,381 ,904
18,158
$ 1,363,746
$ 2.04
—
$ 2.04
668,570
$8,622,287
3,548,570
5,073,717
3,347,932
1,725,785
205,035
308,034
75,490
66,034
1,764,310
571 ,471
1,192,839
21,537
509,449
1,723,825
21 ,392
$1 ,702,433
$ 1.69
.77
$ 2.46
691,962

Consolidated Statements of Cash Flows The Coca-Cola Company and Subsidiaries
Year Ended December 31, 1991 1990 1989
(In thousands)
Operating ActivitiesNet income
Depreciation and amortization
Deferred income taxes
Equity income, net of dividends
Foreign currency adjustments
Gain on sale of businesses and investments before income taxes
Other noncash items
Net change in operating assets and liabilities
Net cash provided by operating activities
Investing Activities
Additions to finance subsidiary receivables
Collections of finance subsidiary receivables
Purchases of investments and other assets
Proceeds from disposals of investments and other assets
Proceeds from sale of businesses
Decrease (increase) in marketable securities
Purchases of property, plant and equipment
Proceeds from disposals of property, plant and equipment
Purchases of temporary investments and other
Proceeds from disposals of temporary investments
Net cash provided by (used in) investing activities
Net cash provided by operations after reinvestment
Financing ActivitiesIssuances of debt
Payments of debt
Preferred stock redeemed
Common stock issued
Purchases of common stock for treasury
Dividends (common and preferred)
Net cash used in financing activities
Effect of Exchange Rate Changes on Cashand Cash Equivalents
Cash and Cash EquivalentsNet increase (decrease) during the year
Balance at beginning of year
Balance at end of year
$1,618,002
261,427
(66,147)
(16,013)
65,534
(34,577)
33,338
222,837
2,084,401
(210,267)
51,942
(399,183)
180,058
—
2,735
(791,677)
43,958
(2,246)
—
(1,124,680)
959,721
989,926
(1,246,664)
(75,000)
39,394
(399,076)
(640,064)
(1,331,484)
458
(371,305)
1,429,555
$1,058,250
$1,381,904
243,888
(30,254)
(93,816)
(77,068)
(60,277)
97,752
(178,202)
1,283,927
(31,551)
58,243
(186,631)
149,807
—
16,733
(592,971)
19,208
(113,875)
241 ,373
(439,664)
844,263
592,417
(81 ,594)
(225,000)
29,904
(306,667)
(552,640)
(543,580)
32,852
333,535
1,096,020
$1,429,555
$1,723,825
183,765
37,036
(76,088)
(31 ,043)
(1,006,664)
24,360
279,382
1,134,573
(57,006)
188,810
(858,510)
126,850
1,680,073
(3,889)
(462,466)
60,665
(145,009)
—
529,518
1 ,664,091
336,370
(410,690)
—
41,395
(1,166,941)
(490,655)
(1,690,521)
(22,896)
(49,326)
1,145,346
$1,096,020

Consolidated Statements of Share-Owners' Equity The Coca-Cola Company and Subsidiaries
Three Years EndedDecember 31, 1991(In thousands except per share data)
Balance December 31, 1988
Sales to employees exercisingstock options
Tax benefit from employees' stockoption and restricted stock plans
Translation adjustments (net ofincome taxes of $900)
Stock issued under restricted stock plans,less amortization of $7,944
Purchases of common stock for treasury
Net income
Dividends
Preferred
Common {per share—$.68)
Balance December 31, 1989
Sales to employees exercisingstock options
Tax benefit from employees' stockoption and restricted stock plans
Translation adjustments {net ofincome taxes of $573)
Stock issued under restricted stock plans,less amortization of $11,655
Purchases of common stock for treasury
Redemption of preferred stock
Net income
Dividends
Preferred
Common (per share—$.80)
Balance December 31, 1990
Sales to employees exercisingstock options
Tax benefit from employees' stockoption and restricted stock plans
Translation adjustments (net ofincome taxes of $958)
Stock issued under restricted stock plans,less amortization of $22,323
Purchases of common stock for treasury
Redemption of preferred stock
Net income
Dividends
Preferred
Common (per share—$.96)
Balance December 31, 1991
Unearned ForeignPreferred Common Capital Reinvested Restricted Currency Treasury
Stock Stock Surplus Earnings Stock Translation Stock
$300,000 $417,395 $380,264 $4,385,142 $ (51,467) ${17,010) $(2,069,022)
1,481 39,914 (3,804)
14,811
— — — — — 9,804 —
34 2,335 5,575
— (1,163,137)
— 1,723,825
(21,392)
(469,263)
300,000 418,910 437,324 5,618,312 (45,892)
905 28,999
— 13,286 — —
(7,206) (3,235,963)
— (2,762)
11,237
429 33,094 — (21,868)
(303,905)
(225,000)
— 1,381,904
(18,158)
(534,482)
75,000 420,244 512,703 6,447,576 (67,760)
972 38,422
4,031 (3,542,630)
— (2,421)
20,015
(8,940)
622 68,850 (47,149)
(396,655)
(75,000)
— 1,618,002
(521)
(639,543)
— $421,838 $639,990 $7,425,514 $(114,909) $ (4,909) $(3,941,706)
See Notes to Consolidated Financial Statements.

Notes to Consolidated Financial Statements The Coca-Cola Company and Subsidiaries
V Accounting Policies
The significant accounting policies and practices followed by
The Coca-Cola Company and subsidiaries (the Company)
are as follows:
Consolidation
The consolidated financial statements include the accounts
of the Company and all subsidiaries where control is not
temporary. The Company's investments in companies in
which it has the ability to exercise significant influence over
operating and financial policies, including certain invest-
ments where there is a temporary majority interest, are
accounted for by the equity method. Accordingly, the Com-
pany's share of the net earnings of these companies is
included in consolidated net income. The Company's invest-
ments in other companies are carried at cost. All significant
intercompany accounts and transactions are eliminated.
Certain amounts in the prior years' financial statements
have been reclassified to conform to the current year
presentation.
Net Income per Common Share
Net income per common share is computed by dividing net
income less dividends on preferred stock by the weighted
average number of common shares outstanding.
Cash Equivalents
Marketable securities that are highly liquid and have maturi-
ties of three months or less at the date of purchase are clas-
sified as cash equivalents.
InventoriesInventories are valued at the lower of cost or market. In
general, inventories are valued on the basis of average cost
or first-in, first-out methods. However, certain soft drink and
citrus inventories are valued on the last-in, first-out (LIFO)
method. The excess of current costs over LIFO stated
values amounted to approximately $27 million and $42 mil-
lion at December 31,1991 and 1990, respectively.
Property, Plant and Equipment
Property, plant and equipment are stated at cost, less
allowances for depreciation. Property, plant and equipment
are depreciated principally by the straight-line method over
the estimated useful lives of the assets.
Goodwill and Other Intangible Assets
Goodwill and other intangible assets are stated on the basis
of cost and are being amortized, principally on a straight-line
basis, over the estimated future periods to be benefited (not
exceeding 40 years). Accumulated amortization was approx-
imately $16 million and $10 million at December 31,1991 and
1990, respectively.
Income Taxes
Income tax amounts and balances have been computed
in accordance with APB Opinion No. 11, "Accounting for
Income Taxes."
In 1987, the Financial Accounting Standards Board
(FASB) issued Statement of Financial Accounting Standards
No. 96, "Accounting for Income Taxes" (SFAS 96). In 1991,
the FASB issued an Exposure Draft, which would further
modify accounting for income taxes. The Company's
required adoption date is January 1, 1993. Based on prelimi-
nary studies and evaluations, accounting for income taxes
under SFAS 96 or the Exposure Draft would not have a
material impact on the Company's results of operations or
financial position.
V InventoriesInventories consist of the following (in thousands):
December 31, 1991
Raw materials and supplies $615,459
Work in process
Finished goods
1990
$567,694
23,475 18,451
348,830 396,168
$987,764 $982,313
3 Bottling InvestmentsThe Company invests in bottling companies to ensure the
strongest and most efficient production, distribution and
marketing systems possible, in order to maximize long-term
growth in volume, cash flow and share-owner value of the
bottler and the Company.

Notes to Consolidated Financial Statements The Coca-Cola Company and Subsidiaries
Coca-Cola Enterprises Inc.
Coca-Cola Enterprises Inc. {CCE) is the largest bottler of
Company products in the United States. The Company
owns approximately 44 percent of the outstanding common
stock of CCE and, accordingly, accounts for its investment
by the equity method of accounting. A summary of financial
information for CCE is as follows (in thousands):
December 31, December 28,1991 1990
Current assets
Noncurrent assets
Total assets
Current liabilities
Noncurrent liabilities
Total liabilities
Share-owners' equity
Company equity investment
Year Ended
Net operating revenues
Cost of goods sold
Gross profit
Operating income
Operating cash flow'
Income (loss) beforeincome taxes
Net income (loss) availableto common share owners
Company equity income (loss)
December 31,1991
$4,050,798
2,380,258
$1,670,540
$ 120,178
$ 538,422
$ (91,140)
$ (91,675)
$ (39,732)
$ 706,298
5,970,297
$6,676,595
$1,385,445
3,848,519
$5,233,964
$1,442,631
$ 602,776
December 28,1990
$4,034,043
2,359,267
$1,674,776
$ 325,548
$ 592,391
$ 184,247
$ 77,148
$ 34,429
$ 495,341
4,525,255
$5,020,596
$1,054,791
2,339,326
$3,394,117
$1,626,479
$ 666,847
December 29,1989
$3,881,947
2,313,032
$1,568,915
$ 310,067
$ 539,086
$ 137,931
$ 53,507
$ 26,218
CCE's 1991 results include pretax restructuring charges
of $152 million and a pretax charge of $15 million to
increase insurance reserves.
In a December 18, 1991, merger, CCE acquired Johnston
Coca-Cola Bottling Group, Inc. (Johnston) for approximately
$196 million and 13 million shares of CCE common stock.
The Company exchanged its 22 percent ownership interest
in Johnston for approximately $81 million in cash and
50,000 shares of CCE common stock, resulting in a pretax
gain of $27 million to the Company. The Company's owner-
ship interest in CCE was reduced from 49 percent to 44
percent as a result of this transaction.
Net concentrate/syrup sales to CCE were $626 million in
1991, $602 million in 1990 and $569 million in 1989. CCE
purchases sweeteners through the Company under a pass-
through arrangement, and, accordingly, related collections
from CCE and payments to suppliers are not included in the
Company's consolidated statements of income. These trans-
actions amounted to $185 million in 1991 and 1990 and
$195 million in 1989. The Company also provides certain
administrative and other services to CCE under negotiated
fee arrangements.
The Company engages in a wide range of marketing
programs, media advertising and other similar arrangements
to promote the sale of Company products in territories in
which CCE operates. The Company's direct support for
certain CCE marketing activities and participation with CCE
in cooperative advertising and other marketing programs,
net of fees charged for services provided, amounted to
approximately $199 million, $181 million and $178 million in
1991, 1990 and 1989, respectively.
During 1990, the Company sold 4 million shares of CCE
common stock to CCE for $60 million under a share repur-
chase program.
In June 1990, the Company sold a temporary investment,
Coca-Cola Holdings (Arkansas) Inc. (CCHA), to CCE for
approximately $241 million and assumed indebtedness,
which approximated the Company's original 1989 invest-
ment, plus carrying costs.
In June 1990, CCE recorded a pretax gain of approxi-
mately $56 million from the sale of two of its bottling sub-
sidiaries. The purchaser of these former CCE bottling
subsidiaries was Johnston, which, at the time of the sale,
was 22 percent owned by the Company.
If valued at the December 31, 1991, quoted closing price
of the publicly traded CCE shares, the calculated value of
the Company's investment in CCE common stock would
have exceeded the Company's carrying value by approxi-
mately $263 million.
Other Equity InvestmentsThe Company owns approximately 51 percent of Coca-Cola
Amatil Limited (CCA), an Australian-based bottler of Com-
pany products and manufacturer of snack foods. In August
1989, the Company acquired an initial 59.5 percent owner-
ship interest in CCA for approximately $491 million (includ-
ing certain acquisition-related costs). In separate
transactions during 1990, CCA acquired an independent
Australian bottler and the Company's 50 percent interest in a
New Zealand bottling joint venture in exchange for consider-
ation that included previously unissued common stock of
CCA, resulting in a net reduction of the Company's owner-

Notes to Consolidated Financial Statements The Coca-Cola Company and Subsidiaries
ship interest to its present level. The Company intends to
reduce its ownership interest in CCA to below 50 percent.
Accordingly, the investment has been accounted for by theequity method of accounting.
At December 31,1991, the excess of the Company's
investment over its equity in the underlying net assets of
CCA was approximately $283 million, which is being amor-
tized primarily over 40 years. The Company recorded equityincome from CCA of $15 million, $17 million and $6 million
in 1991, 1990 and 1989, respectively. These amounts are net
of the amortization charges discussed above.
Operating results include the Company's proportionate
share of income from equity investments since the respec-
tive dates of investment. A summary of financial information
for the Company's equity investments, other than CCE, is as
follows (in thousands):
December 31,
Current assets
Noncurrent assets
Total assetsCurrent liabilities
Noncurrent liabilities
Total liabilities
Share-owners' equity
Company equity investments
Year Ended December 31,
Net operating revenues
Cost of goods sold
Gross profit
Operating income
Operating cash flow
Income beforeincome taxes
Net income
Company equity income
1991
$7,876,737
5,243,943
$2,632,794
S 559,885
S 979,232
S 315,231
$ 214,144
$ 79,707
1991
$1,797,396
3,794,114
$5,591,510
$1,947,025
1,594,696
$3,541,721
$2,049,789
$1,456,959
1990
$7,312,904
4,609,004
$2,703,900
$ 574,712
$ 940,244
$ 327,784
$ 205,436
$ 75,710
1990
$1,658,341
4,431,810
$6,090,151
$1,696,796
2,518,902
$4,215,698
$1,874,453
$1,310,209
1989
$5,598,946
3,633,647
$1,965,299
$ 431,915
$ 679,552
$ 199,255
$ 123,752
$ 49,272
Net sales to equity investees, other than CCE, were
$1.3 billion in 1991 and $1.2 billion in 1990. The Company
participates in various marketing, promotional and other
activities with these investees, the majority of which are
located outside the United States.
If valued at the December 31, 1991, quoted closing
prices of shares actively traded on stock markets, the net
calculated value of the Company's investment in publicly
traded bottlers, other than CCE, would have exceeded theCompany's carrying value by approximately $189 million.
The balance sheet caption "Other, principally bottling
companies" also includes various investments that are
accounted for by the cost method.
V Finance SubsidiaryCoca-Cola Financial Corporation (CCFC) provides loans
and other forms of financing to Coca-Cola bottlers and cus-
tomers for the acquisition of sales-related equipment and for
other business purposes. The approximate contractualmaturities of finance receivables for the five years succeed-
ing December 31, 1991, are as follows (in thousands):1992 $ 36,172
1993 23,325
1994 169,317
1995 10,414
1996 19,620
These amounts do not reflect possible prepayments or
renewals.
In connection with the December 1991 acquisition of
Sunbelt Coca-Cola Bottling Company, Inc. by Coca-ColaBottling Co. Consolidated (Consolidated), CCFC purchased
25,000 shares of Consolidated preferred stock for $50 mil-
lion, provided to Consolidated a $153 million bridge loan and
issued a $77 million letter of credit on Consolidated's behalf.
The Company beneficially owns a 30 percent economic
interest and a 23 percent voting interest in Consolidated.
Finance receivables also include amounts due from CCE
(substantially all of which were assumed by CCE upon its
acquisition of Johnston) of $68 million and $56 million at
December 31, 1991 and 1990, respectively.
V Short-Term Borrowings and Credit ArrangementsLoans and notes payable consist primarily of commercial
paper issued in the United States. At December 31, 1991,
the Company had $753 million in lines of credit and othershort-term credit facilities contractually available, under
which $111 million was outstanding. The lines included $505
million designated to support commercial paper and other
borrowings, of which no amounts were outstanding at
December 31,1991. These facilities are subject to normal
banking terms and conditions. Some of the financialarrangements require compensating balances, none of
which are presently significant to the Company.

Notes to Consolidated Financial Statements The Coca-Cola Company and SubsidiariM
Accrued TaxesAccrued taxes consist of the following (in thousands):
December 31
Income taxes
Sales, payroll and miscellaneous taxes
1991 1990
$789,632 $618,590
111,252 100,592
$900,884 $719,182
7 Long-Term Debt
Long-term debt consists of the following (in thousands):
December 31.
97/e% U.S. dollar notes due 1992
73/«% U.S. dollar notes due 1996
53A% Japanese yen notes due 1996'
53A% German mark notes due 1998'
77/a% U.S. dollar notes due 1998
1 1%% U.S. dollar notes due 1991
Other, due 1992 to 201 3^
Less current portion
1991
$ 89,565
249,890
239,987
165,206
249,372
—
100,945
1,094,965
109,707
$ 985,258
1990
$ 59,667
—
222,977
166,953
—
85,675
97,861
633,133
97,272
$535,861
' Interest on a portion of this debt vanes with the changes in the prime rate, andthe weighted average interest Fate applicable to the remainder is approximately12.3 percent.
Maturities of long-term debt for the five years succeeding
December 31, 1991, are as follows (in thousands):
1992 $109,707
1993 28,396
1994 17,601
1995 7,932
1996 494,264
The above notes include various restrictions, none of
which are presently significant to the Company.
Interest paid was approximately $160 million, $233 million
and $319 million in 1991,1990 and 1989, respectively.
Financial InstrumentsThe Company has entered into foreign currency hedging
transactions to reduce its exposure to adverse fluctuations in
foreign exchange rates. While the hedging instruments are
subject to the risk of loss from changes in exchange rates,
these losses would generally be offset by gains on the
exposures being hedged. The Company had $2.6 billion and
$1.4 billion of foreign currency hedging instruments out-
standing at December 31, 1991 and 1990, respectively. The
contracts are transacted with creditworthy financial institu-
tions and generally mature within one year.
At December 31, 1991, the Company is contingently
liable for guarantees of indebtedness owed by third parties
of $117 million, of which $54 million is related to indepen-
dent bottling licensees.
^7 Preferred StockIn February 1991, the Company completed the redemption
of the remaining $75 million of its initial $300 million of
Cumulative Money Market Preferred Stock (MMP). The
Company redeemed $225 million of the MMP in 1990. Prior
to redemption, the weighted average dividend rate (per
annum) for the MMP was approximately 6 percent in 1991
and 1990.
0 Common StockCommon shares outstanding and related changes for the
three years ended December 31,1991, are as follows
(in thousands):
Outstanding at January 1 ,
Issued to employeesexercising stock options
Issued under restrictedstock plans
Purchases of common stockfor treasury
Outstanding at December 31 ,
1991
668,239
1,943
1,245
(6,947)
664,480
1990
674,030
1,810
858
(8,459)
668,239
1989
709,578
2,962
68
(38,578)
674,030
11 Restricted Stock, Stock Options andOther Stock Plans
The Company sponsors restricted stock award plans, stock
option plans, Incentive Unit Agreements and Performance
Unit Agreements.
Under the amended 1989 Restricted Stock Award Plan
and the amended 1983 Restricted Stock Award Plan (the
Plans), 10 million and 6 million shares of restricted common
stock, respectively, may be granted to certain officers and
key employees of the Company.
In 1991, 1990 and 1989, 1,245,000 shares, 858,000
shares and 68,000 shares, respectively, were granted under
the Plans. At December 31, 1991, 8.7 million shares were
available for grant under the Plans. The participant is entitled
to vote and receive dividends on the shares, and, under the

Notes to Consolidated Financial Statements The Coca-Cola Company and Subsidiaries
1983 Restricted Stock Award Plan, the participant is reim-
bursed by the Company for income taxes imposed on the
award. The shares are subject to certain transfer restrictions
and may be forfeited if the participant leaves the Company
for reasons other than retirement, disability or death, absent
a change in control of the Company. On July 18, 1991, the
Plans were amended to specify age 62 as the minimumretirement age. In addition, the 1983 Restricted Stock Award
Plan was further amended to conform to the terms of the
1989 Restricted Stock Award Plan by requiring a minimum
of five years of service prior to retirement. The amendmentsaffect shares granted subsequent to July 18, 1991.
Under the Company's 1991 Stock Option Plan (the
Option Plan), a maximum of 30 million shares of the
Company's common stock may be issued or transferred to
certain officers and employees pursuant to stock options andstock appreciation rights granted under the Option Plan. The
stock appreciation rights permit the holder, upon surrender-
ing all or part of the related stock option, to receive cash,
common stock or a combination thereof, in an amount up to
100 percent of the difference between the market price and
the option price. No stock appreciation rights have been
granted since April 1990, and the Company does not
presently intend to grant additional stock appreciation rights
in the future. Options outstanding at December 31, 1991,
also include various options granted under previous plans.
Further information relating to options is as follows (in thou-
sands, except per share amounts):
Outstanding at January 1 ,
Granted
Exercised
Canceled
Outstanding at December 31,
Exercisable at December 31 ,
Shares available at December 31 ,for options that may be granted
Prices per share
Exercised
Unexercised at December 31 ,
1991
16,532
3,996
(1,943)
(394)
18,191
12,026
27,689
$6-556
S8-S59
1990
13,504
5,196
(1,810)
(358)
16,532
9,569
1,559
$5-$39
$6-$48
1989
17,315
32
(2,962)
(881)
13,504
8,561
6,643
$5-$23
$5-$24
In 1988, the Company entered into Incentive Unit Agree-
ments, whereby certain officers will be granted cash awards
based on the market value of 600,000 shares of theCompany's common stock at the measurement dates. The
Incentive Unit Agreements provide for a cash payment for
income taxes when the value of the units is paid.
In 1985, the Company entered into Performance UnitAgreements, whereby certain officers will be qranted cash
awards based on the difference in the market value of
approximately 1.1 million shares of the Company's common
stock at the measurement dates and the base price of
$10.31, the market value as of January 2, 1985.
\7 Pensions and Other Postretirement BenefitsIn the United States, the Company sponsors and/or con-
tributes to pension plans covering substantially all U.S.employees and certain employees in international locations.
The benefits are primarily based on years of service and the
employees' compensation for certain periods during the last
years of employment. Pension costs are generally funded
currently, subject to regulatory funding limitations. The
Company also sponsors nonqualified, unfunded defined
benefit plans for certain officers and other employees. In
addition, the Company and its subsidiaries have various
pension plans and other forms of postretirement arrange-
ments outside the United States.
Total pension expense amounted to approximately $42million in 1991, $30 million in 1990 and $23 million in 1989.
Net periodic pension cost for the Company's defined benefit
plans in 1991,1990 and 1989 consists of the following
(in thousands):

Notes to Consolidated Financial Statements The Coca-Cola Company anitsubsidiartos
U.S. Plans International Plans
Year Ended December 31, 1991 1990
Service cost— benefits earned during the period $ 12,475 $ 10,684 :
Interest cost on projected benefit obligation
Actual return on plan assets
Net amortization and deferral
Net periodic pension cost
The following table sets forth the
(in thousands):
December 3 1
Actuarial present value ofbenefit obligations
Vested benefit obligation
Accumulated benefit obligation
Projected benefit obligation
Plan assets at fair value'
Plan assets in excess of (lessthan) projected benefit obligation
Unrecognized net (asset) liabilityat transition
Unrecognized prior service cost
Unrecognized net (gain) loss
Adjustment required to recognizeminimum liability
Accrued pension asset (liability)included in the consolidatedbalance sheet
45,860 41,786
(112,530) (9,121)
71,090 (31,168)
$ 16,895 $12,181 :
1989 1991
S 9,830 $15,894
35,393 18,523
(95,254) (17,498)
56,548 555
$ 6.517 $17,474
funded status for the Company's defined benefit plans at December 31
U.S. PlansAssets Exceed Accumulated Benefits
Accumulated Benefits Exceed Assets
1991 1990 1991 1990
$359,857 $340,598 $ 66,907 $ 53,386
$383,972 $362,724 $72,610 $57,372
$455,357 $424,118 $82,251 $65,703
583,819 508,267 811
128,462 84,149 (82,251 X (64,892)*
(40,764) (44,31 7) 21 ,292 23,41 6
25,756 28,302 2,795 1,175
(114,934) (64,617) 14,506 5,647
(28,952) (21,941)
$ (1,480) $ 3.517 $(72,610) $(56,595)
1990 1989
$12,902 $12,133
14,720 12,539
(3,811) (16,108)
(11,273) 2,240
$12,538 $10,804
, 1991 and 1990
International PlansAssets Exceed
Accumulated Benefits
1991 1990
$ 96,074 $ 84,890
$106,286 $ 89,263
$145,435 $129,435
175,392 160,945
29,957 31,510
(29,229) (32,076)
105 2,017
10,265 5,171
,.
$ 11,098 $ 6,622
Accumulated BenefitsExceed Assets
1991 1990
$ 81,609 $ 70,044
$ 91,208 $ 72,938
$144,245 $113,842
74,640 62,335
(69,605) (51 ,507)
40,908 38,121
5,243
(1,672) 58
(453) (167)
$(25,579) $(13,495)
' Primarily listed stocks, bonds and government securities.? Substantially all of this amount relates to nonqualified, unfunded defined benetit plans.
The assumptions used in computing the above information are as follows:
Discount rates
Rates of increase in compensation levels
Expected long-term rates of return on assets
U.S. Plans
1991 1990 1989
9% 9% 9%
6% 6% 6%
9V2% 91/2% 9%
International Plans(weighted average rates)
1991 1990 1989
7V2% 8% 7%
6% 6% 4%
7V2% 8% 8%

Notes to Consolidated Financial Statements The Coca-Cota Company and.Subsidiaries
The Company also has plans that provide postretirement
health care and life insurance benefits to substantially all
U.S. employees and certain international employees who
retire with a minimum of five years of service. The annual
cash cost of these benefits is not significant. In 1990, the
FASB issued Statement of Financial Accounting Standards
No. 106, "Employers' Accounting for Postretirement Benefits
Other than Pensions" (SFAS 106). SFAS 106 will require
companies to accrue the cost of postretirement health care
and life insurance benefits within employees' active service
periods. The Company's required adoption date for SFAS
106 is January 1, 1993.
SFAS 106 allows companies to either recognize their full
accumulated postretirement benefit obligation at the date of
adoption or amortize it as a component of postretirement
benefits expense over a period of up to twenty years. The
Company is currently evaluating these options.
Based on preliminary studies and evaluations, the Com-
pany's accumulated postretirement benefit obligation at
January 1, 1993, will be approximately $200 million, before
related income tax benefits. The increase in annual pretax
postretirement benefits expense after adoption of SFAS 106
is expected to be in the range of $20 million to $30 million.
V Income TaxesThe components of income before income taxes for both
continuing and discontinued operations consist of the follow-
ing (in thousands):
Year Ended December 3 1,
United States
International
1991
$ 648,471
1,734,808
$2,383,279
1990
$ 494,544
1,519,892
$2,014,436
1989
$1,459,213
1,257,104
$2,716,317
Income taxes for continuing and discontinued operations
consist of the following (in thousands):
Year Ended December 31,
1991
Current
Deferred
1990
Current
Deferred
1989
Current
Deferred
UnitedStates
$204,781
(61,229)
$134,973
(49,387)
$478,004
(8.025)
State& Local
$30,981
(5,267)
$26,515
(2,596)
$84,072
160
International
$595,662
349
$501,298
21,729
$393,380
44,901
Total
$831,424
(66,147)
$662,786
(30,254)
$955,456
37,036
The Company made income tax payments of approxi-
mately $672 million, $803 million and $537 million in 1991,
1990 and 1989, respectively.
A reconciliation of the statutory U.S. federal rate and
effective rates for continuing operations is as follows:
Year Ended December 31,
Statutory U.S. federal rate
State income taxes—-net offederal benefit
1991 1990
34.0% 34.0%
1.0 1.0
1989
34.0%
1.0
Earnings in jurisdictions taxedat rates different from thestatutory U.S. federal rate
Equity income
Other — net
(3.1)
(.6)
.8
32.1%
(2.6)
(1.8)
.8
31 .4%
(1.6)
(1.5)
.5
32.4%
Deferred taxes are provided principally for depreciation,
certain employee compensation-related expenses and cer-
tain capital transactions that are recognized in different
years for financial statement and income tax purposes. The
Company has manufacturing facilities in Puerto Rico that
operate under a negotiated exemption grant that expires
December 31, 2009.
Appropriate U.S. and international taxes have been pro-
vided for earnings of subsidiary companies that are
expected to be remitted to the parent company. Accumu-
lated unremitted earnings of international subsidiaries that
are expected to be required for use in the international oper-
ations were approximately $373 million at December 31,
1991, exclusive of amounts that, if remitted, would result in
little or no tax.

Notes to Consolidated Financial Statements The Coca-Cola Company and Subsidiaries
14 Net Change in Operating Assets and LiabilitiesThe changes in operating assets and liabilities, net of effects
of acquisitions and divestitures of businesses and unrealized
exchange gains/losses, are as follows (in thousands):
Year Ended December 31, 1991 1990 1989
Increase in tradeaccounts receivable
Increase in inventories
Increase in prepaid expensesand other assets
Increase in accounts payableand accrued expenses
Increase (decrease) inaccrued taxes
Increase in otherliabilities
S (31,826) $ (87,749) $(99,496)
(3,020) (169,442) (34,709)
(325,595) (65,758) (204,222)
266,684 198,631 88,940
215,877 (111,014) 456,544
100,717 57,130 72,325
$222,837 $(178,202) $279,382
The net change in operating assets and liabilities in
1990 reflects estimated tax payments of approximately
$300 million related to the 1989 gain on the sale of
Columbia Pictures Entertainment, Inc. stock.
V Acquisitions and DivestituresThe Company periodically engages in the acquisition and/or
divestiture of bottling and other related companies. Signifi-
cant transactions are discussed below.
In August 1989, the Company acquired all of the
Coca-Cola bottling operations of Pernod Ricard. Pernod
Ricard had operated the Coca-Cola bottling, canning and
distribution business in six major territories in France. The
fair values of assets acquired and liabilities assumed were
$285 million and $145 million, respectively. The $140 million
acquisition was accounted for by the purchase method.
Operating results have been included in the consolidated
statements of income from the date of acquisition.
In August 1989, the Company sold Belmont Springs
Water Co., Inc., a bottled water operation, which resulted in
a pretax gain of approximately $61 million.
See Note 3 for discussions of the equity investment in
CCA, which was acquired in August 1989, and the tempo-
rary investment in CCHA, which was acquired in July 1989
and sold in June 1990. See Note 17 for a discussion of the
sale of Columbia Pictures Entertainment, Inc. stock.
V Other Nonrecurring Items"Other income—net" in 1991 includes a $69 million pretax
gain on the sale of property no longer required as a result of
a consolidation of concentrate operations in Japan and a
$27 million pretax gain on the sale of the Company's 22
percent ownership interest in Johnston to CCE. "Selling,
administrative and general expenses" and "Interest
expense" include 1991 pretax charges of $13 million and $8
million, respectively, for potential future costs related to
bottler litigation. In addition, 1991 equity income has been
reduced by $44 million related to restructuring charges
recorded by CCE.
"Other income—net" in 1990 includes a pretax gain of
$52 million on the Company's investment in BCI Securities
L.P. (BCI) resulting from BCI's sale of Beatrice Company
stock. "Selling, administrative and general expenses" in
1990 include nonrecurring pretax charges of $49 million
related to the Company's United States soft drink business.
These charges reflect accelerated amortization of certain
software costs due to management plans to upgrade and
standardize information systems and adjustments to the
carrying value of certain fountain equipment and marketing-
related items to amounts estimated to be recoverable in
future periods.
17 Discontinued Operation
In 1989, the Company sold its entire equity interest in
Columbia Pictures Entertainment, Inc. (CPE) for approxi-
mately $1.6 billion in cash. The equity interest consisted of
approximately 49 percent of the outstanding common shares
of CPE and 1,000 shares of preferred stock. The sale
resulted in a pretax gain of approximately $930 million. On
an after-tax basis, the gain was approximately $509 million
or $.74 per common share. The effective tax rate of 45 per-
cent on the gain on the sale of CPE stock differs from the
statutory U.S. federal rate of 34 percent due primarily to dif-
ferences between the book basis and tax basis of the
Company's investment in CPE.
CPE has been reported as a discontinued operation, and,
accordingly, the gain from the sale of CPE stock and the
Company's equity income from CPE have been reported
separately from continuing operations.

Notes to Consolidated Financial Statements The Coca-Cola Company and SubalcffarleB
18 Lines of Business
The Company operates in two major lines of business: soft drinks and foods (principally juice and juice-drink products). Infor-
mation concerning operations in these businesses at December 31, 1991, 1990 and 1989, and for the years then ended, is
presented below (in millions):
Soft Drinks
1991
Net operating revenues
Operating income
Identifiable operating assets
Equity income
Investments (principally bottling companies)
Capital expenditures
Depreciation and amortization
United States
$2,645.2
468.7
1 ,447.0
131.1
81.9
International
$7,244.8
2,141.1
4,742.3
546.3
111.9
Foods
$1,635.7
103.7
755.0
57.1
30.8
Corporate
$ 45.9
(394.5)
1,124.1*
40.0'
2,154.0
57.2
36.8
Consolidated
$11,571.6
2,319.0
8,068.4
40.0
2,154.0
791.7
261.4
SpftDrinks
1990
Net operating revenues
Operating income
Identifiable operating assets
Equity income
Investments (principally bottling companies)
Capital expenditures
Depreciation and amortization
United States
$2,461.3
358. 1?
1,691.0
138.4
88.5
International
$6,125.4
1,801.4
3,672.2
321.4
94.4
Foods
$1,604.9
93.5
759.2
68.2
28.3
Corporate
$ 44.8
(301 .4)
1,131.2s
110.1
2,024.6
65.0
32.7
Consolidated
$10,236.4
1,951.6
7.253.6
110.1
2,024.6
593.0
243.9
Soft Drinks
1989
Net operating revenues
Operating income
Identifiable operating assets
Equity income
Investments (principally bottling companies)
Capital expenditures
Depreciation and amortization
United Slates
$2,222.2
390.6
1,814.4
136.3
73.9
International
$4,759.2
1,517.6
2.806.0
215.6
48.4
Foods
$1 ,583.3
87.4
695.3
61,6
30.7
Corporate
$ 57.6
(269.8)
1,036.4s
75.5
1 ,930.4
49.0
30.8
Consolidated
$ 8.622.3
1.725.8
6.352.1
75.5
1,930.4
462.5
183.8
Intercompany transfers between sectors are not material.
Reduced by $44 million related to restructuring charges recorded by CCE.2 Includes nonrecurring charges of $49 million.3 Corporate identifiable operating assets are composed principally of marketable securities and fixed assets.
Operating Income by
Line of Business (In millions)
Soft Drinks - United StatesSoft Drinks - International
Foods Soft Drinks - United StatesSoft Drinks - International
Foods
Net Operating
Revenues
by Line
of Business
(In millions)

Notes to Consolidated Financial Statements The Coca-Cote Company and Subsidiaries
V Operations in Geographic AreasInformation about the Company's operations in different geographic areas at December 31, 1991, 1990 and 1989, and for the
years then ended, is presented below {in millions):
1991
Net operating revenues
Operating income
Identifiable operating assets
Equity income
Investments {principally bottling companies)
Capital expenditures
Depreciation and amortization
United Slates Latin America
$4,124.8 $1,103.2
560-2 404.6
2,160.9
184.8
111.3
814.6
105.5
23.3
EuropeanCommunity
330.6
65.8
NortheastEurope/Africa
$3,338.3 $613.6
767.3 204.1
2,558.0 423.5
61.3
9.7
$2,345.8
777.3
987.3
52.3
14.5
Corporate
S 45.9
(394.5)
1.124.13
40.0'
2,154.0
57.2
36.8
Consolidated
$11,571.6
2,319.0
8,068.4
40.0
2,154.0
791.7
261.4
Northeast
1990
Net operating revenues
Operating income
Identifiable operating assets
Equity income
Investments (principally bottling companies)
Capital expenditures
Depreciation and amortization
United States
$3,931 .0
440.4^
2,414.2
204.0
115.6
Latin America
$ 813.0
300.2
640.3
59.7
18.0
EuropeanCommunity
$2,804.8
666.5
1,818.8
203.5
54.5
Europe/Africa
$562.8
174.2
400.1
38.8
7.6
Pacificand Canada
$2,080.0
671.7
849.0
22.0
15.5
Corporate
$ 44.8
(301 .4)
1,131 .2J
110.1
2,024.6
65.0
32.7
Consolidated
$10,236.4
1,951.6
7,253.6
110.1
2,024.6
593.0
243.9
1989
Net operating revenues
Operating income
Identifiable operating assets
Equity income
Investments (principally bottling companies)
Capital expenditures
Depreciation and amortization
United Slates Latin AmericaEuropean
CommunityPacific
anrj Canada Corporate Consolidated
$3,678.7 $ 646.2 $1,855.1 $425.2 $1,959.5 $ 57.6 $ 8,622.3
468-2 226.7 540.6 147.3 612.8 (269.8) 1,725.8
2,476.0 515.4 1,342.8 328.8 652.7 1,036.4J 6,352.1
75.5 75.5
1,930.4 1,930.4
196.4 30.7 133.9 24.6 27.9 49.0 462.5
103-5 11.8 18.0 4.9 14.8 30.8 183.8
intercompany transfers between geographic areas are not material.Identifiable liabilities of operations outside the United States amounted to approximately $1.7billion, $1,5 billion and $1.1 billion at December 31, 1991, 1990 andrespectively.
1 Reduced by $44 million related to restructuring charges recorded by CCE.2 Includes nonrecurring charges of $49 million.3 Corporate identifiable operating assets are composed principally of marketable securities and fixed assets
United States
Latin America
European Community
Northeast Europe/AfricaPacific & Canada
United States
Latin AmericaEuropean Community
Operating Income byGeographic Area(In millions)
• Northeast Europe/Africa
Pacific & Canada
Net OperatingRevenues byGeographic
(In millions)

Report of Independent Auditors
Board of Directors and Share Owners
The Coca-Cola Company
We have audited the accompanying consolidated balance
sheets of The Coca-Cola Company and subsidiaries as ofDecember 31 , 1991 and 1990, and the related consolidated
statements of income, share-owners' equity and cash flows
for each of the three years in the period ended December 31,1991. These financial statements are the responsibility of the
Company's management. Our responsibility is to express an
opinion on these financial statements based on our audits.
We conducted our audits in accordance with generally
accepted auditing standards. Those standards require thatwe plan and perform the audit to obtain reasonable assur-
ance about whether the financial statements are free of
material misstatement. An audit includes examining, on a test
basis, evidence supporting the amounts and disclosures in
the financial statements. An audit also includes assessing theaccounting principles used and significant estimates made by
management, as well as evaluating the overall financial
statement presentation. We believe that our audits provide a
reasonable basis for our opinion.
In our opinion, the financial statements referred to above
present fairly, in all material respects, the consolidated finan-
cial position of The Coca-Cola Company and subsidiaries at
December 31, 1991 and 1990, and the consolidated results of
their operations and their cash flows for each of the three
years in the period ended December 31, 1991, in conformitywith generally accepted accounting principles.
Atlanta, Georgia / nJanuary 24, 1992 "

Report Of Management The Coca-Cola Company and Subsidiaries
Management is responsible for the preparation and
integrity of the consolidated financial statements appearing in
this Annual Report. The financial statements were prepared
in conformity with generally accepted accounting principles
appropriate in the circumstances and, accordingly, include
some amounts based on management's best judgments and
estimates. Financial information in this Annual Report isconsistent with that in the financial statements.
Management is responsible for maintaining a system ofinternal accounting controls and procedures to provide
reasonable assurance, at an appropriate cost/benefit rela-tionship, that assets are safeguarded and that transactions
are authorized, recorded and reported properly. The internal
accounting control system is augmented by a program ofinternal audits and appropriate reviews by management,
written policies and guidelines, careful selection and training
of qualified personnel and a written Code of Business
Conduct adopted by the Board of Directors, applicable to all
employees of the Company and its subsidiaries. Manage-ment believes that the Company's internal accounting
controls provide reasonable assurance that assets are safe-
guarded against material loss from unauthorized use or
disposition and that the financial records are reliable for
preparing financial statements and other data and for main-
taining accountability of assets.
The Audit Committee of the Board of Directors, composed
solely of Directors who are not officers of the Company,
meets with the independent auditors, management and
internal auditors periodically to discuss internal accounting
controls, auditing matters and financial reporting matters. The
Committee reviews with the independent auditors the scope
and results of the audit effort. The Committee also meets
with the independent auditors and the chief internal auditor
without management present to ensure that the independentauditors and the chief internal auditor have free access to
the Committee.
The independent auditors, Ernst & Young, are recom-
mended by the Audit Committee of the Board of Directors,
selected by the Board of Directors and ratified by the share
owners. Ernst & Young is engaged to audit the consolidated
financial statements of The Coca-Cola Company and
subsidiaries and conduct such tests and related proceduresas they deem necessary in conformity with generally
accepted auditing standards. The opinion of the independent
auditors, based upon their audits of the consolidated financial
statements, is contained in this Annual Report.
Roberto C. Goizueta
Chairman, Board of Directors,and Chief Executive Officer
Jack L. Stahl
Senior Vice President
and Chief Financial Officer
Patrick M. Worsham
Vice Presidentand Controller
January 24,1992
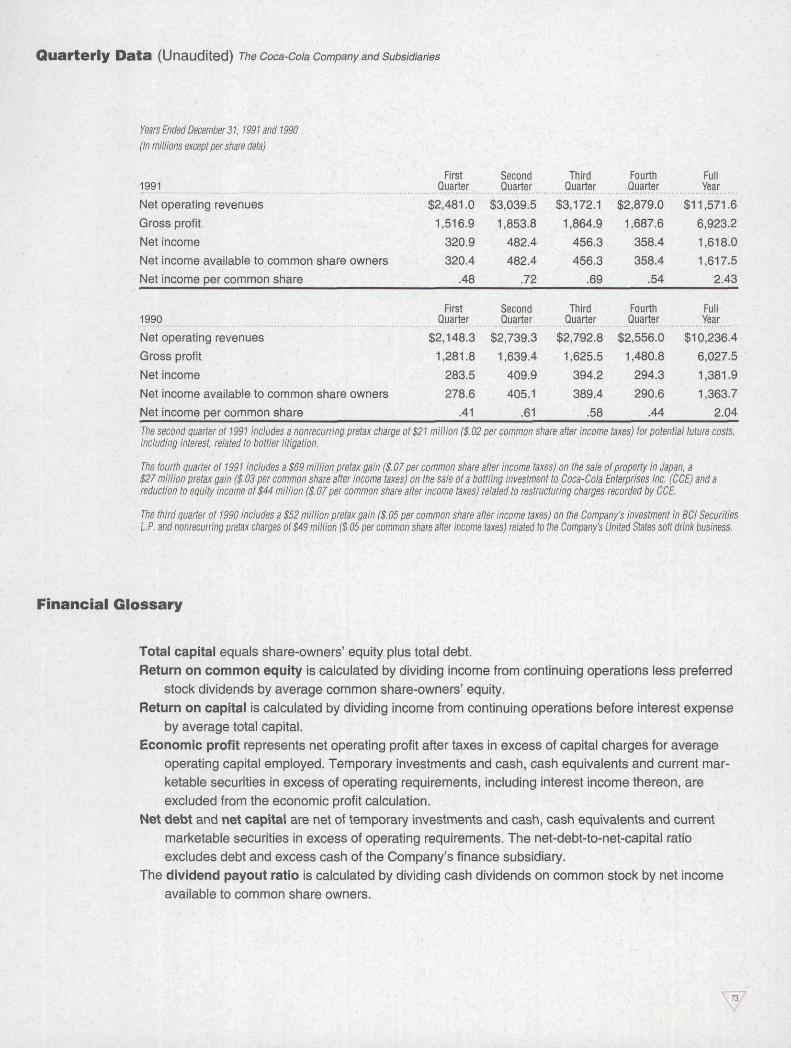
Quarterly Data (Unaudited) The Coca-Cofa Company and Subsidiaries
Years Ended December 31,1991 and 1990(In millions except pet share data)
1991
Net operating revenues
Gross profit
Net income
Net income available to common share owners
Net income per common share
1990
Net operating revenues
Gross profit
Net income
Net income available to common share owners
Net income per common share
FirstQuarter
$2,481.0
1,516.9
320.9
320.4
.48
FirstQuarter
$2,148.3
1,281.8
283.5
278.6
.41
SecondQuarter
$3,039.5
1 ,853.8
482.4
482.4
.72
SecondQuarter
$2,739.3
1,639.4
409.9
405.1
.61
ThirdQuarter
$3,172.1
1 ,864.9
456.3
456.3
.69
ThirdQuarter
$2,792.8
1 ,625.5
394.2
389.4
.58
FourthQuarter
$2,879.0
1 ,687.6
358.4
358.4
.54
FourthQuarter
$2,556.0
1 ,480.8
294.3
290.6
.44
FullYear
$11,571.6
6,923.2
1,618.0
1,617.5
2.43
FullYear
$10,236.4
6,027.5
1,381.9
1 ,363.7
2.04
The second quarter of 199 / includes a nonrecurring pretax charge of $21 mi/lion ($. 02 per common share after income taxes) for potential future costs,including inlerest, related to bottler litigation.
The third quarter of 1990 includes a $52 million pretax gain ($. 05 per common share after income taxes) on She Company's investment in BCI SecuritiesLP. and nonrecurring pretax charges of $49 million ($. 05 per common share after income taxes) related to the Company's United States soft drink business.
Financial Glossary
Total capital equals share-owners' equity plus total debt.
Return on common equity is calculated by dividing income from continuing operations less preferred
stock dividends by average common share-owners' equity.
Return on capital is calculated by dividing income from continuing operations before interest expense
by average total capital.
Economic profit represents net operating profit after taxes in excess of capital charges for averageoperating capital employed. Temporary investments and cash, cash equivalents and current mar-
ketable securities in excess of operating requirements, including interest income thereon, are
excluded from the economic profit calculation.
Net debt and net capital are net of temporary investments and cash, cash equivalents and current
marketable securities in excess of operating requirements. The net-debt-to-net-capital ratio
excludes debt and excess cash of the Company's finance subsidiary.
The dividend payout ratio is calculated by dividing cash dividends on common stock by net income
available to common share owners.

Corporate Officers Board of Directors
Roberto C. Goizueta
Chairman. Board of Directors,
and Chief Executive Officer
Donald R. Keough
President and Chief
Operating Officer
Senior Vice Presidents
Ralph H. Cooper!
Douglas N. Daft'
M.A. Gianturco
Joseph R. Gladden, Jr.
John Hunter
E. Neville Isdell1
M. Douglas Ivester
Weldon H. Johnson 1
Earl T. Leonard, Jr.1
Alex Malaspina
Peter S. Sealey 1
Jack L. Stahl1
R.V. Waltemeyer1
Carl Ware
Vice Presidents
Anton Amon
William R. Buehler
Robert L. Callahan, Jr.
Philip J. CarsweH, Jr.
Carlton L. Curtis
William J. Davis
Lance E. Disley
Thomas E. Floyd
Murray D. Friedman
Charles B. Fruit
C. Patrick Garner
John J. Gillin
George Gourlay
Robert D. Guy
Timothy J. Haas
Gary P. Hite
Ingrid S. Jones
W. Glenn Kernel
Janmarie C. Pruning
Hugh K. Switzer
Michael W. Walters
Patrick M. Worsham 1
Jack L. Stahl
Chief Financial Officer
Joseph R. Gladden, Jr.
General Counsel
Lance E. Disley
Treasurer
Patrick M. Worsham
Controller
Susan E. Shaw
Secretary
Executive Officers-Operating Units
North AmericaBusiness SectorM. Douglas IvesterPresident
Coca-Cola USAM. Douglas Ivester
President
Coca-Cola FoodsTimothy J. HaasPresident
InternationalBusiness SectorJohn HunterPresident
Pacific GroupDouglas N. DaftPresident
EuropeanCommunity Group
Ralph H. Cooper
President
Northeast Europe/Africa GroupE. Neville Isdell
President
Latin America Group
Weldon H. Johnson
President
Herbert A. Allen 3'4'5
President and
Chief Executive Officer
The investment banking firm
Allen & Company Incorporated
Ronald W. Allen 4>6
Chairman of the Board and
Chief Executive Officer
Delta Air Lines, Inc.
Warren E. Buffett2'3
Chairman of the Board
and Chief Executive Officer
The diversified holding company
Berkshire Hathaway Inc.
Charles W. Duncan, Jr. a•*Private Investor
Roberto C. Goizueta 4
Chairman, Board of Directors,
Chief Executive Officer
The Coca-Cola Company
Donald R. KeoughPresident and
Chief Operating Officer
The Coca-Cola Company
Susan B. King 5-'
Senior Vice President-
Corporate Affairs
Coming Incorporated
James T. Laney 7
President
Emory University
Donald F. McHenry 2-6<7
University Research
Professor of Diplomacy
and International Affairs
Georgetown University
Paul F. Oreffice 3'e
Chairman of the Board
The Dow Chemical Company
James D. Robinson, IIIChairman and
Chief Executive Officer
American Express Company
William B.Turner3'4-5
Chairman, Executive Committee
of Board of DirectorsThe diversified company
W.C. Bradley Co.
Chairman, Executive Committee
of Board of Directors
Synovus Financial Corp.
Chairman of the Board
Columbus Bank & Trust Company
Peter V. Ueberroth 2'"
Investor,
Managing Director
The management company
The Contrarian Group, Inc.
James B. WilliamsChairman and
Chief Executive Officer
SunTrust Banks, Inc.
1 Officers subject to the reporting
requirements of Section 16 of the
Securities Exchange Act of 19342 Audit Committee3 Finance Committee
'l Executive Committee5 Compensation Committee6 Committee on Directors7 Public Issues Review Committee
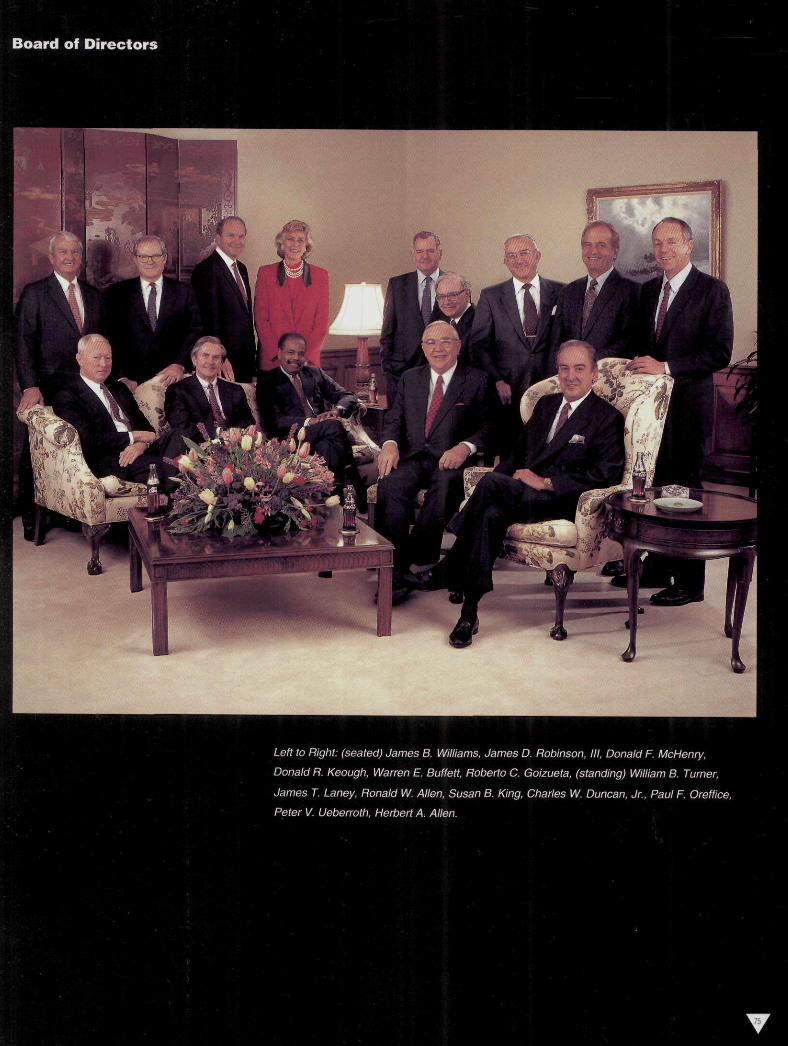
Board of Directors
/.eft to Right: (seated) James B. Williams, James D. Robinson, III, Donald F. McHenry,
Donald H. Keough, Warren E. Buffett, Hoberto C. Goizueta, (standing) William B. Turner,
James T. Laney, Ftonald W. Allen, Susan B. King, Charles W. Duncan, Jr., Paul F. Oreffice,
Peter V. Ueberroth, Herbert A. Allen.

Share-Owner Information
Common StockTicker symbol: KO
The Coca-Cola Company is one of 30 companies in the DowJones Industrial Average.
Common stock of The Coca-Cola Company is listed and tradedon the New York Stock Exchange, which is the principal marketfor the common stock, and also is traded on the Boston,Cincinnati, Midwest, Pacific and Philadelphia stock exchanges.Outside the United States, the Company's common stock islisted and traded on the German exchange in Frankfurt and onSwiss exchanges in Zurich, Geneva, Bern, Basel and Lausanne.
Share owners of record at year-end: 117,874
Shares outstanding at year-end: 664 million
Stock PricesBelow are the New York Stock Exchange high, low and closingprices of The Coca-Cola Company stock for each quarter of1991 and 1990, adjusted for a 2-for-1 stock split in May 1990.
Quarter
FourthThirdSecondFirst
1991 High
81.75
66.50
58.00
55.50
Low
62.38
54.50
51.38
42.63
Close
80.25
64.50
54.50
54.25
Quarter Low Close
Fourth
Third
Second
First
49.00
48.38
46.88
39.00
39.75
37.25
37.13
32.63
46-50
39.50
44.38
37.38
DividendsAt its February 1992 meeting, the Company's Board of Directorsincreased the quarterly dividend to 28 cents per share, equiva-lent to an annual dividend of $1.12 per share. The Company hasincreased dividends each of the last 30 years.
The Coca-Cola Company normally pays dividends fourtimes a year, usually on April 1, July 1, October 1 and December15. The Company has paid 283 consecutive quarterly dividends,beginning in 1920.
Dividend and Cash Investment PlanAll share owners of record are invited to participate in theDividend and Cash Investment Plan. The Plan provides a conve-nient, economical and systematic method of acquiring additionalshares of the Company's common stock. The Plan permits shareowners of record to reinvest dividends from Company stock inshares of The Coca-Cola Company. Share owners also maypurchase Company stock through voluntary cash investments ofup to $60,000 per year.
All costs and commissions associated with joining andparticipating in the Plan are paid by the Company.
The Plan's administrator, First Chicago Trust Company ofNew York, purchases stock for voluntary cash investments on orabout the first of each month, and for dividend reinvestment onApril 1, July 1, October 1 and December 15.
At year-end, 37 percent of share owners of record wereparticipants in the Plan. In 1991, share owners invested $12.78million in dividends and $16.35 million in cash in the Plan.
Annual Meeting of Share Owners
April 15, 1992, at 9:00 a.m. local timeThe Georgia World Congress Center Ballroom285 International Boulevard, N.W.Atlanta, Georgia
PublicationsThe Company's annual report on Form 10-K and quarterlyreport on Form 10-Q are available free of charge from the Officeof the Secretary, The Coca-Cola Company, P.O. Drawer 1734,Atlanta, Georgia 30301.
A Notice of Annual Meeting of Share Owners and ProxyStatement are furnished to share owners in advance of theannual meeting. Progress Reports, containing financial resultsand other information, are distributed quarterly to share owners.
Also available from the Office of the Secretary areCoca-Cola, A Business System Toward 2000: Our Mission in the1990s, The Chronicle of Coca-Cola Since 1886 and other book-lets about the Company and its products.
Equal Opportunity PolicyThe Coca-Cola Company employs 28,900 people worldwide andmaintains a long-standing commitment to equal opportunity andaffirmative action. The Company strives to create a working envi-ronment free of discrimination and harassment with respect torace, sex, color, national origin, religion, age, disability or being aveteran of the Vietnam era as well as to make reasonableaccommodations in the employment of qualified individuals withdisabilities. The Company continued to increase minority andfemale representation in 1991. In addition, the Companyprovides fair marketing opportunities to all suppliers and main-tains programs to increase transactions with firms that areowned and operated by minorities and women.

Corporate OfficesThe Coca-Cola CompanyOne Coca-Cola PlazaAtlanta, Georgia 30313(404)676-2121
Mailing AddressThe Coca-Cola CompanyP.O. Drawer 1734Atlanta, Georgia 30301
Share-Owner Account AssistanceFor address changes, dividend checks,account consolidation, registrationchanges, lost stock certificates, stockholdings and the Dividend and CashInvestment Plan:
Registrar and Transfer AgentFirst Chicago Trust Companyof New YorkP.O. Box 3981Church Street StationNew York, New York 10008-39811-800-446-2617
or(212)791-6422
orOffice of the SecretaryThe Coca-Cola Company(404) 676-2777
Institutional Investor Inquiries(404) 676-5766
Annual Report Requests1-800-438-2653
This Report is printed on recycled paper.
Design: Critt Graham + Associates
Photography: Principle/Cover- Arthur
Meyerson, Contributing - Ovak Arslanian.
Kraig Carlstrom, Neil Krivonak, Joe
Stewardson, Arnaud de Wildenberg,
Board-Jon Riley
Printing: George Rice & Sons