CCEP FY20 Presentation - Coca-Cola Europacific Partners
23
*Unaudited Preliminary* Results for the Fourth-Quarter & Full-Year 2020 11 February 2021
-
Upload
khangminh22 -
Category
Documents
-
view
0 -
download
0
Transcript of CCEP FY20 Presentation - Coca-Cola Europacific Partners
1
*Unaudited
Preliminary* Results for the Fourth-Quarter & Full-Year 202011 February 2021

22
Forward looking statementsThis document contains statements, estimates or projections that constitute “forward-looking statements” concerning the financial condition, performance, results, strategy and objectives of Coca-Cola European Partners plc and its subsidiaries (together “CCEP”). CCEP's proposed acquisition (the "Acquisition") of Coca-Cola Amatil Limited and its subsidiaries (together "CCL") and the integration of CCL into CCEP. Generally, the words “believe,” “expect,” “intend,” “estimate,” “anticipate,” “project,” “plan,” “seek,” “may,” “could,” “would,” “should,” “might,” “will,” “forecast,” “outlook,” “guidance,” “possible,” “potential,” “predict,” “objective” and similar expressions identify forward-looking statements, which generally are not historical in nature.
Forward-looking statements are subject to certain risks that could cause actual results to differ materially from CCEP’s and CCL’s historical experience and present expectations or projections, including with respect to the Acquisition. As a result, undue reliance should not be placed on forward-looking statements, which speak only as of the date on which they are made. These risks include but are not limited to:
1. those set forth in the "Risk Factors" section of CCEP’s 2019 Integrated Report / Annual Report on Form 20-F, including the statements under the following headings: Packaging (such as, refillables and recycled plastic); Perceived health impacts of our beverages and ingredients, and changing consumer preferences (such as sugar alternatives and other ingredients); Legal, regulatory and tax change (such as the development of regulations regarding packaging, taxes and deposit return schemes); Market (such as disruption due to customer negotiations, customer consolidation and route to market); Cyber and social engineering attacks; Competitiveness and transformation; Climate change and water (such as net zero emission legislation and regulation, and resource scarcity); Economic and political conditions (such as the UK's exit from the EU, the EU-UK trade and co-operation agreement, and uncertainty about the future relationship between the UK and EU); The relationship with The Coca-Cola Company and other franchisors; Product quality; and Other risks, such as widespread outbreaks of infectious disease including the adverse impact that the COVID-19 pandemic and related government restrictions and social distancing measures implemented in many of our markets, and any associated economic downturn, may have on our financial results, operations, workforce and demand for our products;
2. those set forth in the "Principal Risks" section of CCEP’s 2019 Integrated Report / Annual Report on Form 20-F, as updated in CCEP’s Results for the six months ended 26 June 2020 & COVID-19 update and including principal risks under the additional headings: Business continuity (such as government restrictions in our countries of operation); People; and Stakeholders; and
3. risks and uncertainties relating to the Acquisition, including the risk that the businesses will not be integrated successfully or such integration may be more difficult, time-consuming or costly than expected, which could result in additional demands on CCEP’s resources, systems, procedures and controls, disruption of its ongoing business and diversion of management’s attention from other business concerns; the possibility that certain assumptions with respect to CCL or the Acquisition could prove to be inaccurate; the failure to receive, delays in the receipt of, or unacceptable or burdensome conditions imposed in connection with, all required regulatory approvals, shareholder approvals and the satisfaction of closing conditions to the Acquisition; ability to raise financing; the possibility that CCEP and CCL fail to agree upon a scheme implementation agreement; the potential that the Acquisition may involve unexpected liabilities for which there is no indemnity; the potential failure to retain key employees of CCEP and CCL as a result of the proposed Acquisition or during integration of the businesses and disruptions resulting from the proposed Acquisition, making it more difficult to maintain business relationships; the potential if the Acquisition is not completed in a timely manner or at all for (i) negative reaction from financial markets, customers, regulators, employees and other stakeholders, (ii) loss of time spent on an unsuccessful Acquisition, and (iii) litigation related to the Acquisition.
The full extent to which the COVID-19 pandemic will negatively affect CCEP and/or CCL and the results of their operations, financial condition and cash flows will depend on future developments that are highly uncertain and cannot be predicted, includingthe scope and duration of the pandemic and actions taken by governmental authorities and other third parties in response to the pandemic.
Due to these risks, CCEP’s actual future results, dividend payments, and capital and leverage ratios may differ materially from the plans, goals, expectations and guidance set out in forward-looking statements (including those issued by CCL prior to the Acquisition). These risks may also adversely affect CCEP’s share price. Additional risks that may impact CCEP’s future financial condition and performance are identified in filings with the United States Securities and Exchange Commission (“SEC”) which areavailable on the SEC's website at www.sec.gov. CCEP does not undertake any obligation to publicly update or revise any forward-looking statements, whether as a result of new information, future events, or otherwise, except as required under applicable rules, laws and regulations. Furthermore, CCEP assumes no responsibility for the accuracy and completeness of any forward-looking statements. Any or all of the forward-looking statements contained in this filing and in any other of CCEP’s public statements (whether prior or subsequent to the Acquisition) may prove to be incorrect.
Reconciliation & definition of alternative performance measuresThe following presentation includes certain alternative performance measures, or non-GAAP performance measures. Refer to our Preliminary Unaudited results for the Fourth-Quarter and Full-Year Ended 31 December 2020, issued on 11 February 2021, (“Preliminary Unaudited Results”) which details our non-GAAP performance measures and reconciles, where applicable, our 2020 and 2019 results as reported under IFRS to the non-GAAP performance measures included in this presentation. This presentation also includes certain forward looking non-GAAP financial information. We are not able to reconcile forward looking non-GAAP performance measures to reported GAAP measures without unreasonable efforts because it is not possible to predict with a reasonable degree of certainty the actual impact or exact timing of items that may impact comparability.

33
SummaryWell on the road to a stronger and even more sustainable business
People, customers & communities
Business continuity
Value share gains4
Mitigation over-delivery & launch of Accelerate Competitiveness
efficiency programme
Continued investments in portfolio, digital & sustainability
COVID-19: Respond, recover & build for future
Confident in our future
Exciting growth platform
Led by green & digital
Supported by future-ready culture & efficiency mindset
Acquisition of Coca-Cola Amatil: unique & exciting
opportunity
Stronger & even more sustainable business
1. TCCC = The Coca-Cola Company2. Comparable (non-GAAP performance measure - refer to slide 2)
3. Non-GAAP performance measure – refer to slide 24. Nielsen Global Track Data for ES, PT, DE, GB, FR, BE, NL, SE, NO to YE 27.12.20
5. Fx-neutral6. Comparable & fx-neutral (non-GAAP performance measure – refer to slide 2)
Revenue 10.6bn (-11%)5
Operating profit2 1.2bn (-28.5%)6
Free cash flow3 0.9bn
2020 2021+2019
Great people
Solid track record
Great portfolio in attractive category
Unrivalled customer coverage
Solid balance sheet
Strongly aligned with TCCC1
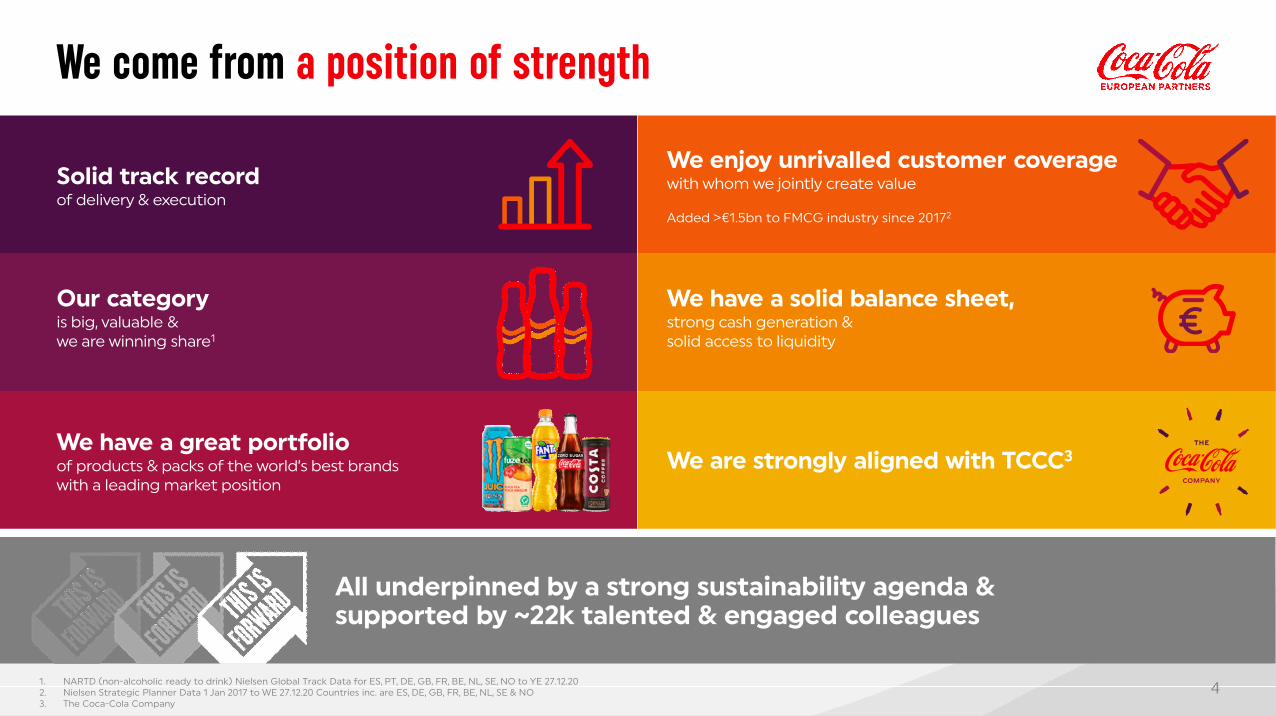
We come from a position of strength
Revenue 12.0bnOperating profit2 1.7bnFree cash flow3 1.1bn
44
We come from a position of strength
Solid track record of delivery & execution
Our category is big, valuable & we are winning share1
We have a great portfolio of products & packs of the world’s best brands with a leading market position
All underpinned by a strong sustainability agenda & supported by ~22k talented & engaged colleagues
We enjoy unrivalled customer coverage with whom we jointly create value
Added > 1.5bn to FMCG industry since 20172
We are strongly aligned with TCCC3
We have a solid balance sheet,strong cash generation & solid access to liquidity
1. NARTD (non-alcoholic ready to drink) Nielsen Global Track Data for ES, PT, DE, GB, FR, BE, NL, SE, NO to YE 27.12.202. Nielsen Strategic Planner Data 1 Jan 2017 to WE 27.12.20 Countries inc. are ES, DE, GB, FR, BE, NL, SE & NO3. The Coca-Cola Company

5
Securedbusiness continuity
Protectedour business
Supportedour communities
Safeguardedour people
5
Leveraged strong relationships with brand partners & jointly invested behind core brands
Optimised pack price architecture
Delivered discretionary opex savings of 260m, ahead of guided 200-250m & launch of Accelerate Competitiveness efficiency
programme
Reduced capex2 spend by ~1/3 to 360m
Suspension of share buyback programme
Maintained solid balance sheet & strong FCF3 generation
Set ambition to reach net zero on entire value chain by 2040
Comprehensive measures in line with government guidance
Advanced digital workplace capabilities
Increased internal communications with colleagues
Extensive emotional & mental well-being support
Maintained high colleague engagement & progressed on inclusion & diversity
Donated over 600,000 unit cases of product
Partnered with TCCC to provide substantial financial aid through the Red Cross & other local NGOs
1. NARTD (non-alcoholic ready to drink) Nielsen Global Track Data for ES, PT, DE, GB, FR, BE, NL, SE, NO to YE 27.12.202. Non-GAAP performance measure - refer to slide 2. Excludes payments of principal on lease obligations . Change vs initial FY20 guidance announced 13 February 2020; 3. Free Cash Flow
Gained FY value
share1
2020 Respond,
recover & build for future,
led by green & digital
Maintained great customer service levels
Reallocated resource to capture revenue opportunities
Leveraged our digital capabilities

66
Going further & faster
on our packaging
Continued recognition as a leader in sustainability
Announced net zero ambition by 2040
on entire value chain
Signed ‘Recover Better’ business statement1. GHG = Greenhouse gas2. Absolute emissions across our value chain (scope 1, 2 & 3). approved by the Science-Based Targets initiative3. 15% of the 2020 LTIP (long-term incentive plan) award will be based on the extent to which CCEP reduces it’s greenhouse
gas emissions over the next three years
4. Unaudited. Provisional5. Sweden transitioned to 100% in 2020. Norway, Iceland & the Netherlands to switch full portfolio to 100% n 2021
FY20 strengthened our sustainability commitments
100%5
79% packaging collected4
(Target: 100% by 2025)
30% GHG1 reduction by 20302 (vs 2019)
LTIP3 based on GHG reduction target
41% rPET4 (Target: 50% by 2023)
50%
98% recyclable packaging4
(Target: 100% by 2025)

77
FY20 financial summary
1. Fx-neutral 2. Comparable and fx-neutral (non-GAAP performance measures - refer to slide 2)3. Comparable (non-GAAP performance measures - refer to slide 2)4. Non-GAAP performance measure – refer to slide 2. Rounded to the nearest 5m5. Non-GAAP performance measure – refer to slide 2
Revenue
10.6bndown 11.0%1
COGS/UC
up+2.5%2
Operatingprofit
1.2bn3
down 28.5%2
Dividendper share
925m4
Earningsper share
1.803
down 28.5%2
Free cash flow4
0.85 ~50%
payout ratio5
88
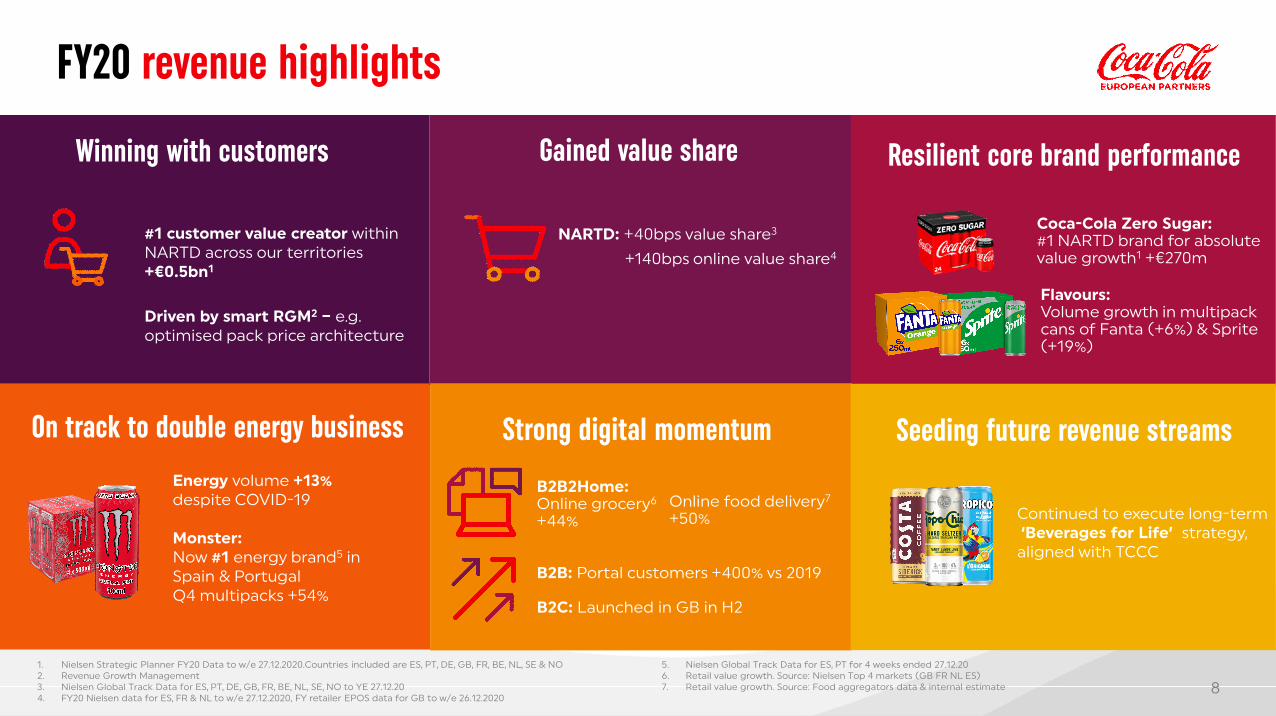
FY20 revenue highlights
NARTD: +40bps value share3
Resilient core brand performance
#1 customer value creator within NARTD across our territories + 0.5bn1
Driven by smart RGM2 – e.g. optimised pack price architecture
Gained value share
Strong digital momentum
B2B2Home:Online grocery6
+44%
B2B: Portal customers +400% vs 2019
B2C: Launched in GB in H2
Online food delivery7
+50%
1. Nielsen Strategic Planner FY20 Data to w/e 27.12.2020.Countries included are ES, PT, DE, GB, FR, BE, NL, SE & NO2. Revenue Growth Management 3. Nielsen Global Track Data for ES, PT, DE, GB, FR, BE, NL, SE, NO to YE 27.12.204. FY20 Nielsen data for ES, FR & NL to w/e 27.12.2020, FY retailer EPOS data for GB to w/e 26.12.2020
5. Nielsen Global Track Data for ES, PT for 4 weeks ended 27.12.206. Retail value growth. Source: Nielsen Top 4 markets (GB FR NL ES)7. Retail value growth. Source: Food aggregators data & internal estimate
Winning with customers
Energy volume +13% despite COVID-19
Monster: Now #1 energy brand5 in Spain & PortugalQ4 multipacks +54%
Coca-Cola Zero Sugar: #1 NARTD brand for absolute value growth1 + 270m
Seeding future revenue streamsOn track to double energy business
+140bps online value share4
Continued to execute long-term‘Beverages for Life’ strategy,
aligned with TCCC
Flavours: Volume growth in multipack cans of Fanta (+6%) & Sprite (+19%)
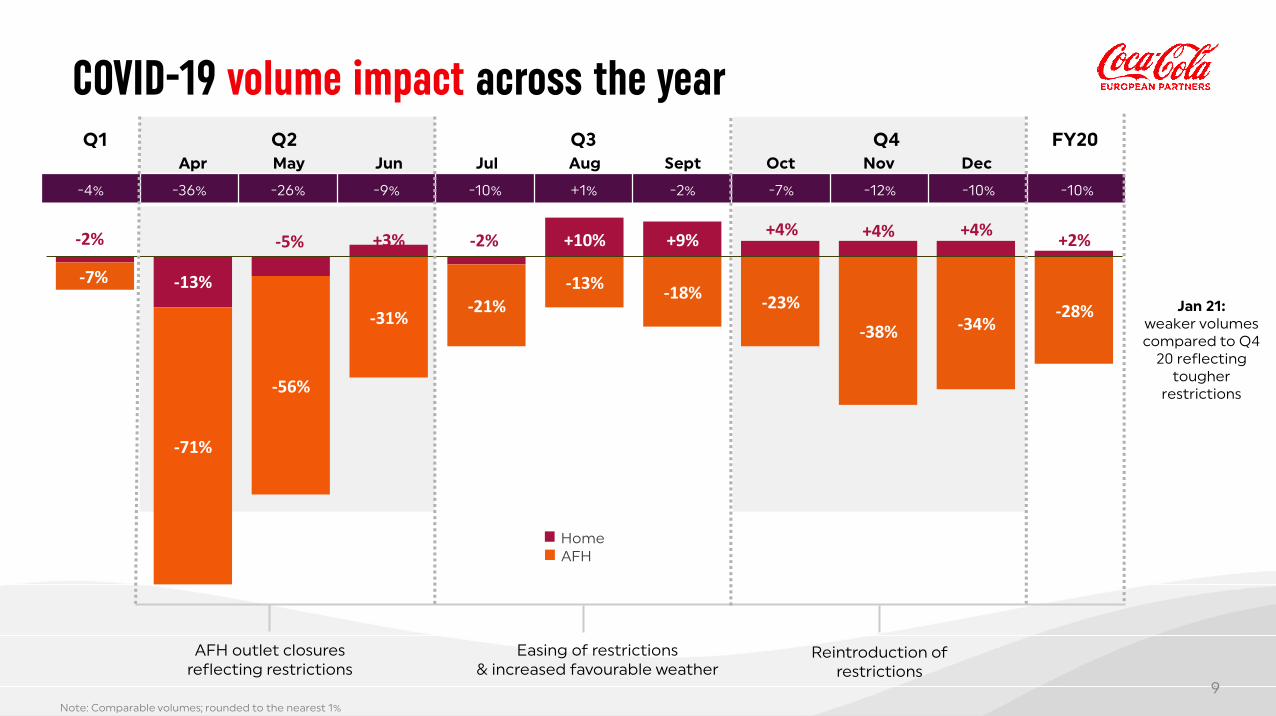
99Note: Comparable volumes; rounded to the nearest 1%
COVID-19 volume impact across the year
-2%
-13%
-5% +3% -2% +10% +9%+4% +4% +4%
+2%
-7%
-71%
-56%
-31%-21%
-13%-18%
-23%
-38% -34%-28%
Q1 Apr May Jun Jul Aug Sept Oct Nov Dec FY
-4% -36% -26% -9% -10% +1% -2% -7% -12% -10% -10%
Easing of restrictions & increased favourable weather
Reintroduction of restrictions
AFH outlet closures reflecting restrictions
Q2 Q3 Q4
HomeAFH
Jan 21:weaker volumes compared to Q4
20 reflecting tougher
restrictions
Q1 FY20
10
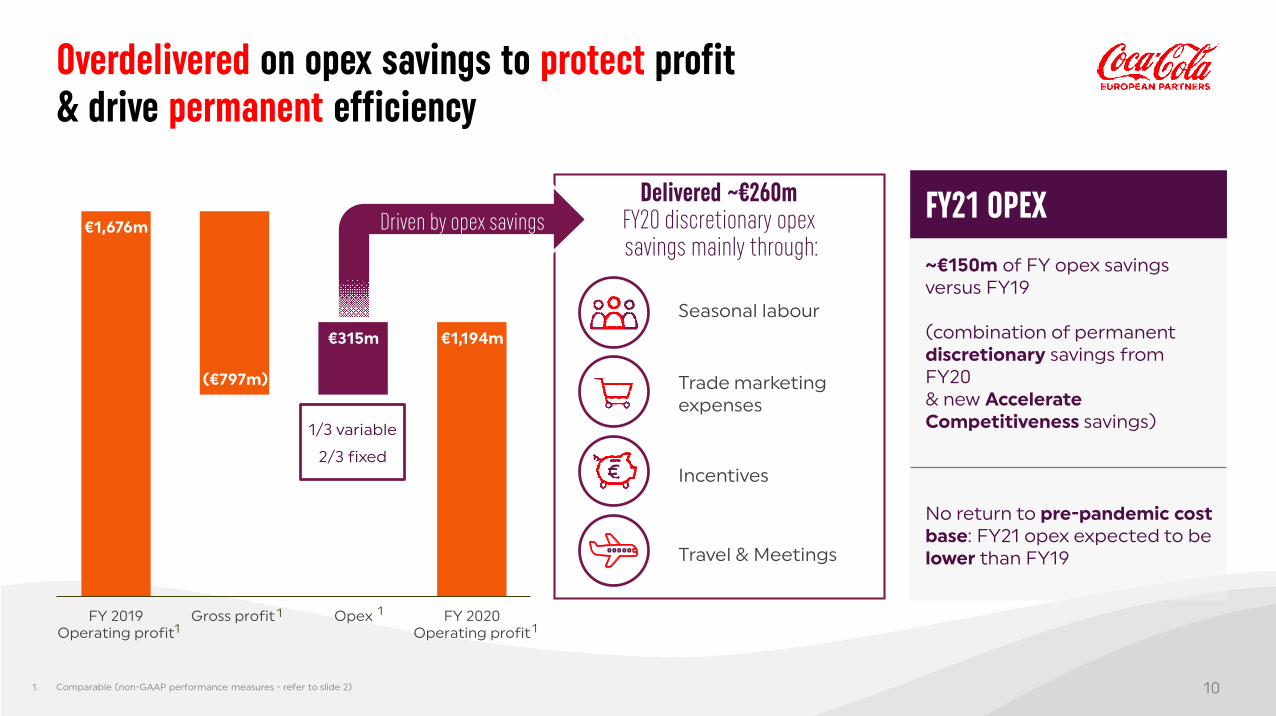
FY21 OPEX
~ 150m of FY opex savings versus FY19
(combination of permanentdiscretionary savings from FY20& new Accelerate Competitiveness savings)
No return to pre-pandemic cost base: FY21 opex expected to be lower than FY19
Overdelivered on opex savings to protect profit & drive permanent efficiency
Delivered ~ 260m FY20 discretionary opexsavings mainly through:
1,676m
( 797m)
315m 1,194m
FY 2019Operating profit
Gross profit Opex FY 2020Operating profit
1. Comparable (non-GAAP performance measures - refer to slide 2)
11 1
1
Driven by opex savings
10
1/3 variable
2/3 fixed
Seasonal labour
Trade marketing expenses
Incentives
Travel & Meetings
1111
Adjusted EBITDA1
Capex
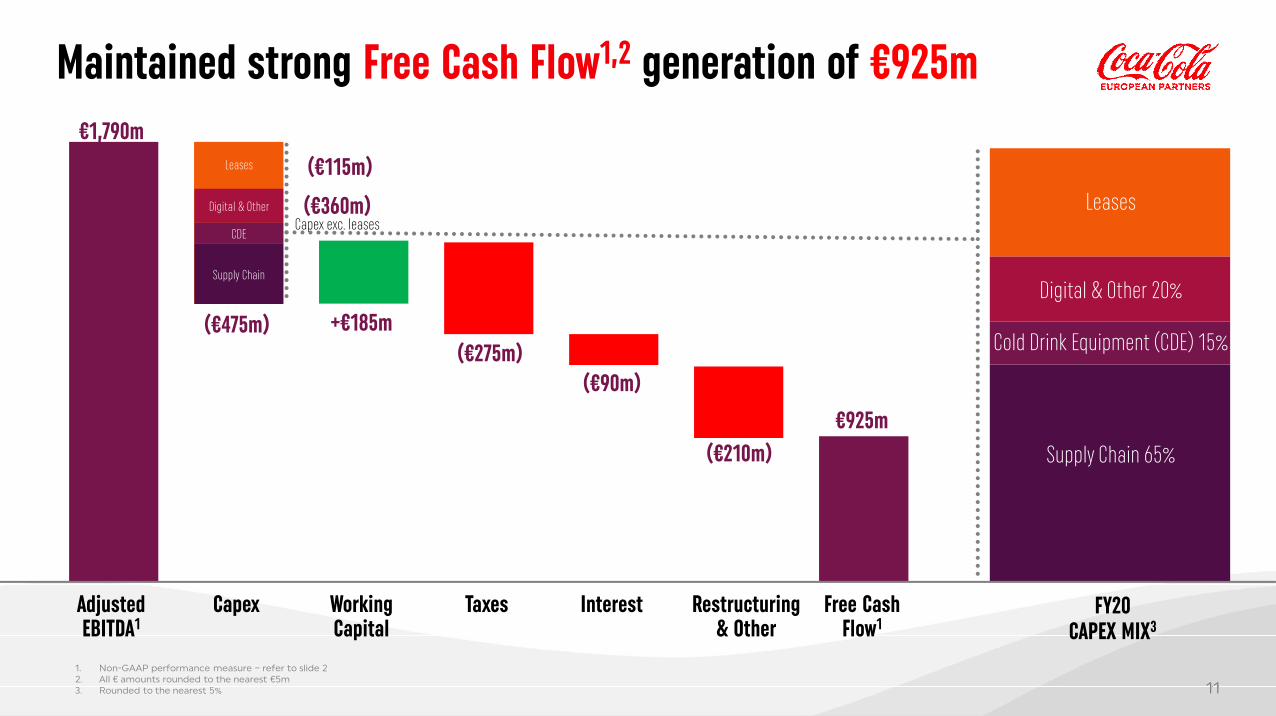
Maintained strong Free Cash Flow1,2 generation of 925m
1. Non-GAAP performance measure – refer to slide 22. All amounts rounded to the nearest 5m3. Rounded to the nearest 5%
1,790m
WorkingCapital
Taxes Interest Restructuring& Other
Free Cash Flow1
FY20CAPEX MIX3
Supply Chain 65%
Cold Drink Equipment (CDE) 15%
Leases
Digital & Other 20%( 475m)
( 115m)
( 360m)Capex exc. leases
Digital & Other
CDE
Supply Chain
+ 185m( 275m)
( 90m)
( 210m)925m
Leases

1212
709 700
350
500
350
250
400
500 500 500 500
600
250
750
2021 2022 2023 2024 2025 2026 2027 2028 2029 2030 2031
Bonds - Issued prior to 2020 Bonds - Issued in 2020
Maintained robust balance sheet & solid access to liquidity Balanced bond maturity3 ( ’m)
No covenantson debt or facilities
Strong balance sheet (net debt/adjusted EBITDA of 3.2 times1)
Strong investmentgrade debt rating(Moody’s2 A3/P2; S&P2 BBB+/A2)
1. As at 31 December 2020. Non-GAAP performance measure – refer to slide 2 2. Moody’s on review for downgrade ; S&P on CreditWatch negative reflecting proposed acquisition of Coca-Cola Amatil3. As at 31 December 2020
1313
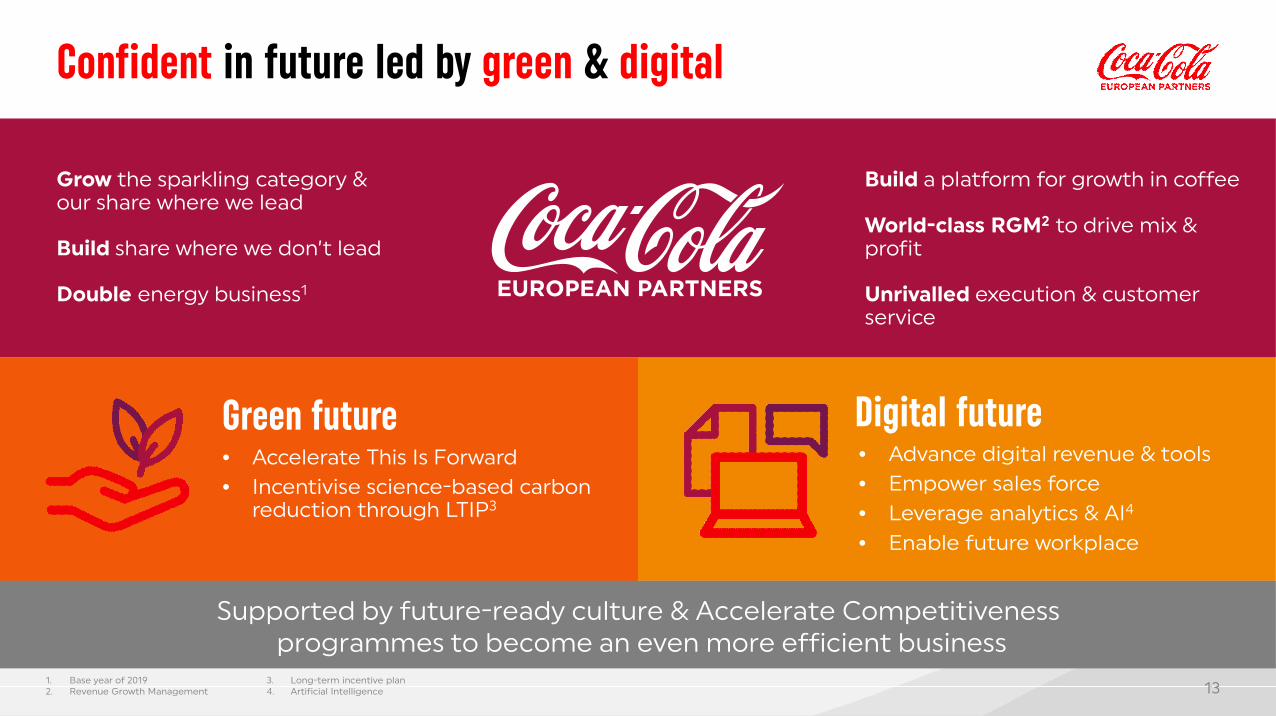
Confident in future led by green & digital
Digital future• Advance digital revenue & tools• Empower sales force• Leverage analytics & AI4
• Enable future workplace
Green future• Accelerate This Is Forward• Incentivise science-based carbon
reduction through LTIP3
Grow the sparkling category & our share where we lead
Build share where we don’t lead
Double energy business1
Build a platform for growth in coffee
World-class RGM2 to drive mix & profit
Unrivalled execution & customer service
Supported by future-ready culture & Accelerate Competitivenessprogrammes to become an even more efficient business
1. Base year of 20192. Revenue Growth Management
3. Long-term incentive plan4. Artificial Intelligence

1414
Exciting portfolio growth platform
Launching into hard seltzers
Double energy business1 Build share where
we don’t lead
Grow the sparkling category & our share where we lead
1. Base year of 2019

1515
• New, dedicated team in place
• Launching in Germany, Belux1 & Norway in 2021
• Targeting high value AFH sub-channels & high-traffic outlets
• Leveraging our sales force, equipment management & route-to-market capabilities
• Preparing for 2022+ roll-out to other markets
Proud to Serve
Express Ready To Drink
Build a platform for growth in coffee with Costa
FY21 focus platforms
1. Belgium & Luxembourg
1 2 3

1616
Entered into binding agreement to acquire CCL on 3 November 2020
Received Australian Foreign Investment Review Board regulatory approval 29 January 2021
The Scheme remains subject to other customary conditions, including CCL independent shareholder approval, court approval and the New Zealand Overseas Investment Office regulatory approval
Further updates will be provided in due course
Progressing with acquisition of Coca-Cola AmatilCreates platform for accelerated growth & returns

1717
Highly engaged employees
Strength of FCF1 generation
Accelerated investments for the future led by green & digital
Power of relationship with TCCC & other brand partners
Resilience and agility of our business
Becoming a stronger & even more sustainable business for the
future
Key takeaways from
1. Free cash flow. Non-GAAP performance measure – refer to slide 2
Summary

18
Thank YouQuestions & Answers

19
Appendices
2020
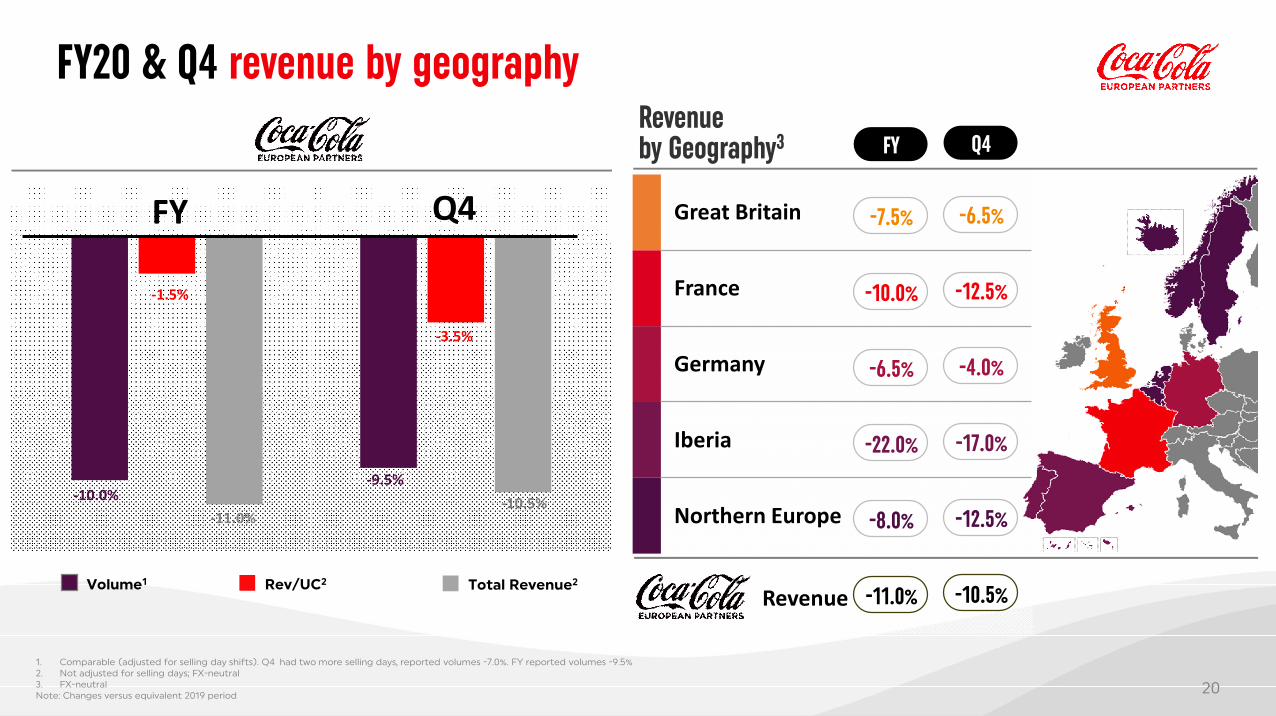
FY20 & Q4 revenue by geography
Great Britain
France
Germany
Iberia
Northern Europe
-6.5%
-12.5%
-4.0%
-17.0%
-12.5%
-7.5%
-10.0%
-6.5%
-22.0%
-8.0%
Q4FY
FY
Volume1 Rev/UC2 Total Revenue2
Revenue by Geography3
-10.5%-11.0%Revenue
1. Comparable (adjusted for selling day shifts). Q4 had two more selling days, reported volumes -7.0%. FY reported volumes -9.5%2. Not adjusted for selling days; FX-neutral 3. FX-neutral Note: Changes versus equivalent 2019 period
Q4
-3.5%
-1.5%
-9.5%-10.0%
-11.0%-10.5%
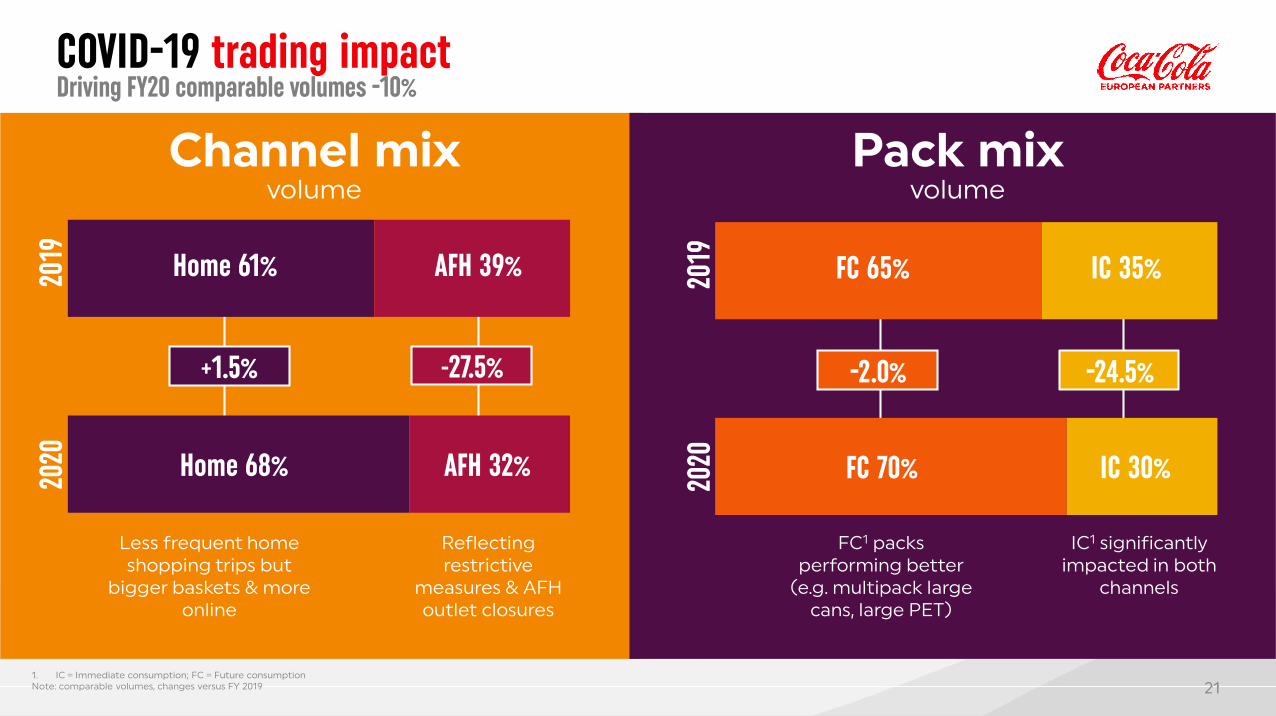
2121
Channel mixvolume
Pack mixvolume
1. IC = Immediate consumption; FC = Future consumptionNote: comparable volumes, changes versus FY 2019
Home 61% AFH 39%2019
2020 Home 68% AFH 32%
+1.5% -27.5%
FC 65% IC 35%2019
2020 FC 70% IC 30%
-2.0% -24.5%
Reflecting restrictive
measures & AFH outlet closures
Less frequent home shopping trips but
bigger baskets & more online
FC1 packs performing better
(e.g. multipack large cans, large PET)
IC1 significantly impacted in both
channels
COVID-19 trading impactDriving FY20 comparable volumes -10%

2222
1
Concentrate, finished goods
Commodities
Taxes &other
Manufacturing & D&A
15%
15%
25%
45%
FY20 cost of sales
up 2.5%
COGS per UC2Fixed
Variable
Mix Effect
1. Cost of goods mix rounded to nearest 5%, 2020 mix2. COGS/UC growth is comparable and fx-neutral (non-GAAP performance measure - refer to slide 2).

2323
SARAH WILLETTVICE [email protected]
CLAIRE [email protected]
JOE COLLINSASSOCIATE [email protected]
IR Contacts