The Application of Monkey Cola Pericarp (Cola lepidota) in ...
15
_____________________________________________________________________________________________________ *Corresponding author: Email: [email protected]; Asian Journal of Applied Chemistry Research 5(2): 53-67, 2020; Article no.AJACR.57296 ISSN: 2582-0273 The Application of Monkey Cola Pericarp (Cola lepidota) in the Removal of Toluene from Aqueous Medium C. Obi 1* , N. C. Ngobiri 1 , L. C. Agbaka 1 and M. U. Ibezim-Ezeani 1,2 1 Department of Pure and Industrial Chemistry, University of Port Harcourt, Nigeria. 2 Niger Delta Aqua Research Group, Department of Biochemistry and Chemistry Technology, School of Science Laboratory Technology, University of Port Harcourt, Port Harcourt, P.M.B. 5323, Choba, Rivers State, Nigeria. Authors’ contributions This work was carried out in collaboration among all authors. Authors CO and MUIE designed and supervised the study. Author NCN wrote the protocol and elucidation of the mechanism. Author LCA conducted the laboratory protocol and wrote the first draft of the manuscript. All authors read and approved the final manuscript. Article Information DOI: 10.9734/AJACR/2020/v5i230140 Editor(s): (1) Dr. Endang Tri Wahyuni, Gadjah Mada University, Indonesia. Reviewers: (1) N. A. A. Babarinde, Olabisi Onabanjo University, Nigeria. (2) Julian Cruz-Olivares, Autonomous University of State of Mexico, Mexico. Complete Peer review History: http://www.sdiarticle4.com/review-history/57296 Received 22 February 2020 Accepted 27 April 2020 Published 29 April 2020 ABSTRACT The study focused on the investigation of the effectiveness of the pericarp of monkey kola (Cola lepidota) biomass (CLPB) in the removal of toluene from aqueous system. X-Ray Diffraction (XRD), Fourier Transform Infrared (FTIR), Scanning Electron Microscopy (SEM) and phytochemical screening methods were used for characterizing the biosorbent. The effects of contact time, pH, and concentration on biosorption process were studied. The phytochemical screening showed the presence of alkaloids, flavonoids, tannins, carbohydrate, saponins and steroids. Carboxylic, alkene and alcohol groups were found to be the principal functional groups. The highest percentage removal was 99.63% at toluene initial concentration of 40 mg/L and 98.30% at pH 8. The contact time 30 minutes gave better removal efficiency of 99.89%. Among the biosorption isotherm models tested (Langmuir, Freundlich, Dubinin Radushkevich and Temkin, respectively), the Langmuir model equation gave a better fit of the Original Research Article
-
Upload
khangminh22 -
Category
Documents
-
view
4 -
download
0
Transcript of The Application of Monkey Cola Pericarp (Cola lepidota) in ...

_____________________________________________________________________________________________________ *Corresponding author: Email: [email protected];
Asian Journal of Applied Chemistry Research
5(2): 53-67, 2020; Article no.AJACR.57296 ISSN: 2582-0273
The Application of Monkey Cola Pericarp (Cola lepidota) in the Removal of Toluene from
Aqueous Medium
C. Obi1*, N. C. Ngobiri1, L. C. Agbaka1 and M. U. Ibezim-Ezeani1,2
1Department of Pure and Industrial Chemistry, University of Port Harcourt, Nigeria.
2Niger Delta Aqua Research Group, Department of Biochemistry and Chemistry Technology, School of Science Laboratory Technology, University of Port Harcourt, Port Harcourt, P.M.B. 5323,
Choba, Rivers State, Nigeria.
Authors’ contributions
This work was carried out in collaboration among all authors. Authors CO and MUIE designed and supervised the study. Author NCN wrote the protocol and elucidation of the mechanism. Author LCA
conducted the laboratory protocol and wrote the first draft of the manuscript. All authors read and approved the final manuscript.
Article Information
DOI: 10.9734/AJACR/2020/v5i230140
Editor(s): (1) Dr. Endang Tri Wahyuni, Gadjah Mada University, Indonesia.
Reviewers: (1) N. A. A. Babarinde, Olabisi Onabanjo University, Nigeria.
(2) Julian Cruz-Olivares, Autonomous University of State of Mexico, Mexico. Complete Peer review History: http://www.sdiarticle4.com/review-history/57296
Received 22 February 2020 Accepted 27 April 2020 Published 29 April 2020
ABSTRACT
The study focused on the investigation of the effectiveness of the pericarp of monkey kola (Cola lepidota) biomass (CLPB) in the removal of toluene from aqueous system. X-Ray Diffraction (XRD), Fourier Transform Infrared (FTIR), Scanning Electron Microscopy (SEM) and phytochemical screening methods were used for characterizing the biosorbent. The effects of contact time, pH, and concentration on biosorption process were studied. The phytochemical screening showed the presence of alkaloids, flavonoids, tannins, carbohydrate, saponins and steroids. Carboxylic, alkene and alcohol groups were found to be the principal functional groups. The highest percentage removal was 99.63% at toluene initial concentration of 40 mg/L and 98.30% at pH 8. The contact time 30 minutes gave better removal efficiency of 99.89%. Among the biosorption isotherm models tested (Langmuir, Freundlich, Dubinin Radushkevich and Temkin, respectively), the Langmuir model equation gave a better fit of the
Original Research Article

Obi et al.; AJACR, 5(2): 53-67, 2020; Article no.AJACR.57296
54
equilibrium data with a correlation coefficient (R2) of 0.99. The equilibrium data was tested with pseudo-first order and pseudo-second order models and pseudo-second order model (R² = 0.99) fitted more than the pseudo-first order model (R² = 0.85). This study has revealed that Cola lepidota is a potential biosorbent for the removal of toluene from aqueous medium under the operating conditions of contact time of 30 minutes, pH of 8 and initial concentration of 40 mg/g.
Keywords: Biosorption; aqueous medium; remediation; isotherm models; toluene. 1. INTRODUCTION Pollution is a great threat to mankind and causes biodiversity loss, ocean acidification, desertification, and depletion of the world’s fresh water supply [1]. Pollution destabilizes the earth’s support systems and endangers the continuing survival of human societies [2]. Pollution, especially pollution caused by industrial emissions, vehicular exhausts, and toxic chemicals, has increased in the past 100 years, with greatest increases reported in rapidly developing low- and middle-income countries [3]. While modern societies face growing concern about global environmental issues, developing countries such as Nigeria are experiencing complex, serious and fast-growing pollution problems of their own. The potent combination of industrialization, urban development and mass consumption trends is exacerbated by foreign companies operating with little regard for the impact on the local environment. Environmental pollution is more than just a health issue; it is a wider social issue in that pollution has the potential to destroy homes and communities. Pollution problems are also closely tied to the mode of development in developing countries. Despite this, many developing countries either have not developed environmental pollution control measures, or have not provided adequate implementation structures to ensure that policies are effective. Toluene also known as toluol represents a group of volatile organic compounds (VOCs) available in petroleum, gasoline and industrial effluents which in lower concentrations is deleterious to humans and the ecosystem [4]. Exposure to toluene causes decrease in the neural mechanism, irritation of mucosal membrane and malfunctioning of both the liver and kidney [5]. The use of biosorbents in biosorption process has been recognized as a potential alternative to existing technologies for removal of contaminants from aqueous phase [6-7]. Abundant natural materials such as bacteria, fungi and yeasts are considered as good
biosorbents for recovery from aqueous phase [8]. The key advantage of microbial biomass is a wide range of functional groups present including polysaccharides, protein peptides and nucleic acid which accounts for the majority of metal adsorption by ion exchange mechanism [9]. The biosorption process involves a solid phase (sorbent or biosorbent, usually a biological material) and a liquid phase (solvent) containing a dissolved species to be sorbed (sorbate, a metal ion). From both economic and ecological points of view, it is very important to utilize inexpensive and waste biomaterials as metal removal agents. However, the major challenge lies on the identification of biosorbents for the process. It is desirable to develop biosorbents with the capacity to adsorb metal ions, volatile organic compounds and industrial effluents with greater affinities [10]. A wide variety of materials available in nature can be used as biosorbents for the removal of metals from contaminated aqueous phases. Any kind of plant, animal and microbial biomass and their derivatives; industrial and agriculture wastes; and byproducts discharged from various industries can be employed as biosorbents. It is important to select a biosorbent from the large spectrum of available materials. The desired characteristics of an ideal biosorbent are demonstrated in its high affinity for metals (biosorption capacity), low economic values (low cost), availability in large quantities, easy desorption of the adsorbed metal ions and possible multiple reuse of the biosorbent [10]. A great deal of interest in the removal of pollutants from wastewaters has focused on the use of agricultural waste/byproducts as biosorbents [1]. Agricultural wastes especially those with high percentage of cellulose and lignin contains polar functional groups like amino, carbonyl, alcoholic, phenolic, and ether groups having high potential for metal binding [11]. These groups donate a lone pair of electrons and form complexes with metal ions in the solution [12]. Due to their unique chemical composition (the presence of hemicellulose, lipids, lignin,

Obi et al.; AJACR, 5(2): 53-67, 2020; Article no.AJACR.57296
55
water hydrocarbons, simple sugars, and starch having a variety of functional groups) and availability, the use of agro-wastes seems to be a viable option for heavy metal remediation. Monkey kola is an under-utilized fruit found in South-Eastern Nigeria [13]. It belongs to the family Sterculiaceae; and genus Cola. It is made up of three varieties: red (Cola latertia), yellow (Cola parchycarpa) and white (Cola lepidota) [14]. The red specie is not very common but the white and yellow species are commonly found in Southern Nigeria between the months of June to November [15]. The pod of the yellow variety is roundish, while the white variety has more cylindrical shape. Monkey kola is identified by various local names in South-Eastern Nigeria as achicha or ohiricha in Igbo and ndiyah in Efik [15]. Monkey kola has record of nutritional and medicinal value [8]. In Nigeria monkey kola is mostly consumed fresh and like most fruits and vegetables it has a very short life span probably due to its high moisture content and its hard texture also limits its consumption particularly among the vulnerable group (young children, Aged) due to poor dentition.
This study was centered on the world increasing population which has resulted in environmental build-up of waste products causing pollution to mankind and ecosystem and the expansion of data on the efficiency and effectiveness of the of Cola lepidota pericarp biomass to remove organic pollutants from the aqueous phase.
Therefore, this study was carried out to investigate the use of Cola lepidota pericarp
(yellow species) biomass in the removal of toluene from aqueous medium and by extension highlight the standard protocol for organic pollutant remediation.
2. MATERIALS AND METHODS
2.1 Sample Collection and Preparation Fresh sample of Cola lepidota were collected from Ikpa farm plantation in Aguata Local Government area of Anambra State. The samples were identified by a Herbarium in Botany Department, University of Port Harcourt, Nigeria. The pericarp of the fruit was peeled off (Fig. 1) by hand and dried to a constant weight at 105°C. The dried samples were ground into powder using a blender, sieved using a 105 μm mesh and stored in an incubator with tag CPLP until required for analysis. 2.2 Characterization of Cola lepidota
Pericarp Biomass 2.2.1 X-Ray diffraction (XRD) analysis X-ray powder diffraction (XRD) was performed to analyze the crystallographic structure of the ground pellets at 298 K. Afterward, 1 g of CLPB was packed in an aluminum sample holder and analyzed with an automated x-ray diffractometer (N8 HORIZON) with a Cu-Kα radiation (wavelength =1.789010 Ǻ) source operating at voltage of 40 kV (40mA current) in the 2θ range from 10 – 55º in steps of 0.05º at a rate of 5º per 10 seconds.
Fig. 1. Cola lepidota used in this study

Obi et al.; AJACR, 5(2): 53-67, 2020; Article no.AJACR.57296
56
2.2.2 Fourier Transform Infrared (FTIR) spectrophotometric analysis
A 2 mg of sample and 200 mg KBr was dried and ground. The mixture was squeezed to form transparent pellets of less than 2 μm. The analysis was carried out using (ATR-FTIR model) spectrophotometer. The background spectrum was collected to form an interferogram and was subsequently converted to frequency data by inverse Fourier transform. Data analysis was done by assigning the observed absorption frequency bands in the sample spectrum to the appropriate normal modes of vibrations in the molecules. 2.2.3 Scanning Electron Microscope (SEM)
analysis of OPP Scanning electron microscope (Verios G4 XHR) was used to resolve the surface morphology of CLPB sample before adsorption of thin layer of platinum was sputter-coated on the CLPB sample for charge dissipation during SEM imaging. The sputter coater was operated in an argon environment using a current of 6 mA for 3 minutes. The coated sample was then transferred to the SEM specimen chamber and observed at an accelerating voltage of 5 kV, eight spot size, four aperture and 15 mm working distance. CLPB sample was placed in the path of the electron beam which was continuously deflected into a raster scanning pattern by the deflection coil.
2.3 Phytochemical Screening The phytochemical screening consists of different screening processes to determine the therapeutic properties of the biomass of Cola lepidota. The procedures include the following; 2.3.1 Sample preparation 5 g of CLPB was added into two different conical flasks. A 10 mL of chloroform was added to the test conical flasks and covered with a cotton wool for 1-2 minutes and filtered. A 2 mL of HCl was added into one of the conical flasks and filtered (unboiled sample) while the other was boiled and filtered (boiled sample). The filtrates were used for analysis.
2.4 Glycoside Test It was determined using different test methods which include:
I. Keller Killian: The sample was first extracted using a chloroform (unboiled sample) and 2 mL was measured into a conical flask and 2 mL of acetic acid was added and agitated thoroughly to observe at the inter phase separating the sample from the acids indicating a positive test.
II. Liberman Test: 2 mL of glacial acetic acid was added into the sample solution (unboiled sample) and 2 mL of concentration H2SO4 was added. A brown ring at the inter phase indicates a positive result.
III. Kedde Test: 2 mL of the chloroform filtrate was measured and 5 mL of NaOH and Kedde reagent was added. The immediate change of color from brown to light brown indicates a positive result. In general, the positive result indicates the presence of glycoside.
2.5 Free Anthraquinone Test This was determined by adding 10% of ammonia to the filtrate (unboiled sample) and was agitated for 1 minute. Segregation was observed between the chloroform filtrate and anthraquinone which indicates a positive test.
2.6 Carbohydrate The following methods were used to indicate the presence of carbohydrate in the biomass: I. Fehling Test: 2 mL of the chloroform filtrate
(boiled sample) was measured into a conical flask and 2 mL of Fehling solution A & B was added to indicate sugar reduction and the solution were boiled for 2-3 minutes in a water bath. A precipitation with a brick red coloration was observed indicating a positive result.
II. Molish Test: 2 mL of alpha naphtol was added into the boiled filtrate and shaken, then 2 mL of H2SO4. A blue-black layer at the inter phase segregating the acid from the filtrate indicates a positive result.
2.7 Flavonoid This Phytochemical property was determined by Shinoda and sodium hydroxide tests: I. Shinoda Test: 10mL of the boiled filtrate
was measured into a conical flask and a piece of magnesium metal was added into

Obi et al.; AJACR, 5(2): 53-67, 2020; Article no.AJACR.57296
57
the filtrate and boiled for 2-5 minutes, H2SO4 was added. The magenta layer at the bottom of the test tube and bubbles on top indicates a positive result.
II. Sodium hydroxide Test: 10% of NaOH was added to the boiled filtrate and a light brown color was observed. Another 10% of NaOH was added and a dark brown color was observed. Hence, the usual color changes observed indicates a positive test.
2.8 Saponin It was determined using the following methods: I. Frothing Test: 10 mL of the boiled filtrate
was shaken and the presence of foam on top of the test tube indicates a positive result.
II. Emulsion Test: Arachis oil was added to10 mL of boiled filtrate and was allowed to settle for 10-15 minutes. A cloudy coloration on the conical flask indicates a positive result.
2.9 Alkaloid Test 10 mL of the boiled filtrate was measured and 2 mL of HCl was added, boiled, filtered and separated into three (3) different conical flasks. Hager, Meyer and Drangendorpp reagents were added differently to sack conical flask. Hanger’s reagent was added into the first conical flask and 2 mL of Meyers reagent was added to the second conical flask. A cream precipitate was formed which indicates a positive result and lastly 2 mL of Drangendorpp reagent was added into the third conical and shaken. A dark brown precipitate indicates the presence of alkaloid. 2.10 Cryogenic Glycoside CLPB (2 g) was mixed with 10 mL of distilled water. A piece of sodium picric paper was dipped into it and covered with a cotton wool and boiled for 10 minutes. A brown color at the edge of the picric paper indicates a positive result for cryogenic glycoside.
2.11 Biosorption Studies Analytical grade reagents were used and the stock standard solution of 1000 mg/L phenol was prepared by dissolving 1.00 g of phenol in 1000 mL of distilled water in a 1000 mL standard flask. Different concentrations of phenol were prepared
from the stock standard solution using the dilution formula:
C1V1 = C2V2 (1) Where C1 =known stock concentration; (1000 mg/L), V1 = unknown volume of the stock concentration, C2 = known concentration of the phenol that is to be prepared (i.e. 10 mg/L to 70 mg/L) and V2 = known volume). The percentage removal of toluene from aqueous medium was calculated using equation 2.
% R = �� � ��
�� × 100 (2)
Where %R represents percentage removal, Co represents initial concentration in mg/L and Ce represents equilibrium concentration in mg/L. Effect of Concentration: 1 g of Cola lepidota pericarp biomass (CLPB) was weighed into different conical flasks containing 10-70 mg/L of toluene. It was agitated for 60 minutes using a mechanical shaker at 180 revolutions per minute (rpm). The mixture was filtered and the supernatant analyzed using Ultra-Violet (UV) Spectrophotometer. Effect of Contact Time: 1 g of CLPB was weighed into a different conical flasks containing 10 mg/L each and was agitated at different times (10 - 60 minutes) using a mechanical shaker (180 rpm). At the end of each time, the sample was collected and filtered and the filtrate was analyzed using UV Spectrophotometer. Effect of pH: 20 mL of 10 mg/L toluene was measured into different conical flasks containing 1 g of CLPB. It was agitated using a mechanical shaker (180 rpm) and a pH meter was used to analyze the acidity and alkalinity of the sample adjusted using 0.1 M HCl and 0.1 M NaOH. At the end of each pH, the mixture was filtered and the filtrate was analyzed using UV Spectrophotometer.
3. RESULTS AND DISCUSSION
3.1 Scanning Electron Microscopy Analysis
The morphological structure of CLPB before toluene biosorption was examined and presented in Fig. 2. The microgram showed that CLPB is
Obi et al.; AJACR, 5(2): 53-67, 2020; Article no.AJACR.57296
58
Fig. 2. Micrograms of CLPB before biosorption
Fig. 3. Diffractogram of CLPB before adsorption

Obi et al.; AJACR, 5(2): 53-67, 2020; Article no.AJACR.57296
59
Table 1. Composition of Cola lepidota pericarp biomass
Index Amount % Name Formula sum A 59.0 Silicon oxide SiO2 B 25.8 Sodium aluminum silicate carnegiette AlNaO4Si C 14.5 Lepidocrocite FeO2
D 0.7 Dipotassium sodium hydroxide dodecatungstugermanate heptahydrate
Ge H15 K2 Na O47 W12
Fig. 4. Fourier transform infrared spectrum of CLPB
Table 2. Vibrational bands and functional groups in Cola lepidota pericarp biomass
Frequency range Absorption (cm-¹) Appearance Group Compound class
4000 – 3500 3700 - 3584 Medium sharp OH Alcohol 3000 – 2500 2586 - 2893 Strong weak O=C=O Carbon dioxide 2000 – 1750 1678 - 1668 Weak C-H Alkene 1500 – 1250 1440 - 1259 Medium O-H bending Carboxylic acid
microporous and this is similar to the work reported by [16]. In general, biomass rich in cellulose is predominantly microporous [17]. This result indicates that CLPB has higher adsorption energy because of the reduction in micro-pore size revealing a reduction of the relative pressure at which maximum adsorption occurs.
3.2 X-ray Diffraction Analysis The diffractogram of CLPB before bisorption is presented in Fig. 3 and the result showed that the crystallography structure is composed of silicon oxide, sodium aluminum silicate carnegiette, lepidocrocite, and dipotassium sodium hydroxidedodecatungs heptahydrate. The Components of the structure is made of a
trigonal crystal with a = 9115A°b = 0 and c = 5.4038A°.
3.3 Fourier Transform Infrared Analysis
The vibrational bands and surface functional groups of CLPB before biosorption were identified as shown in Fig. 4 and Table 2.
The surface functional group of CLPB such as alcohol, carbon dioxide, alkene and carboxylic acid at different bands play major roles in toluene biosorption.
3.4 Phytochemical Analysis
The result of the phytochemical screening of Cola lepidota pericarp biomass (CLPB) is shown in Table 3.
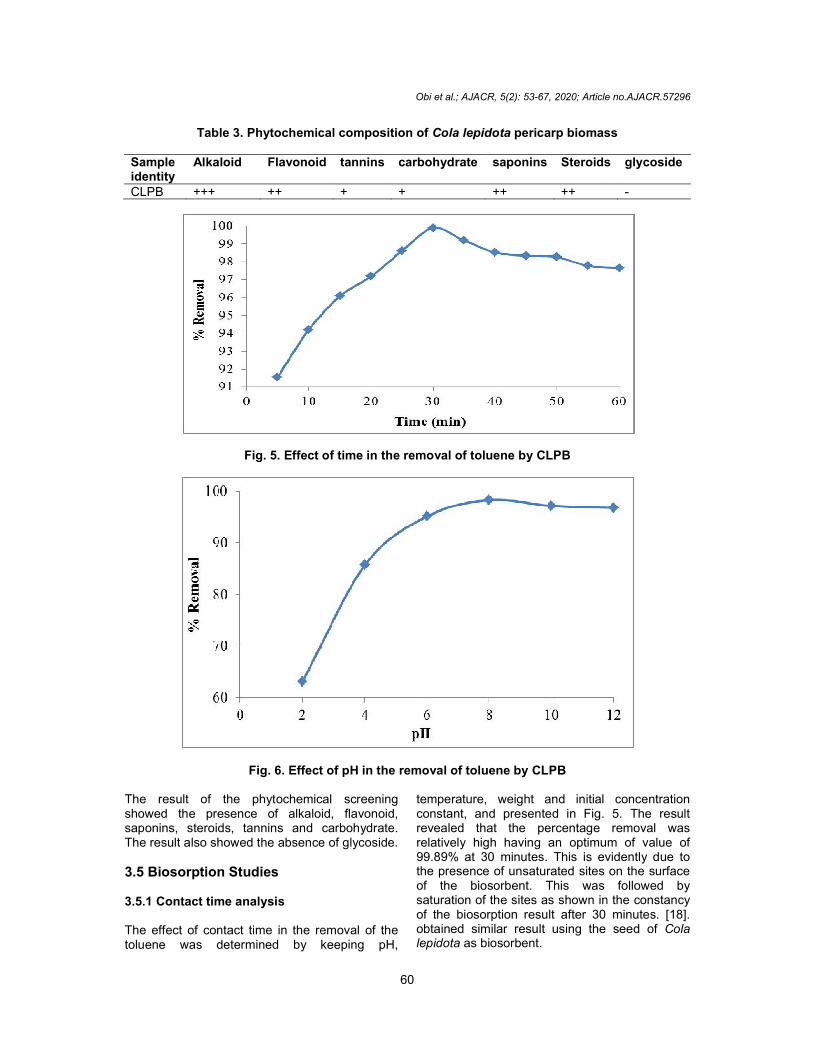
Table 3. Phytochemical
Sample identity
Alkaloid Flavonoid
CLPB +++ ++
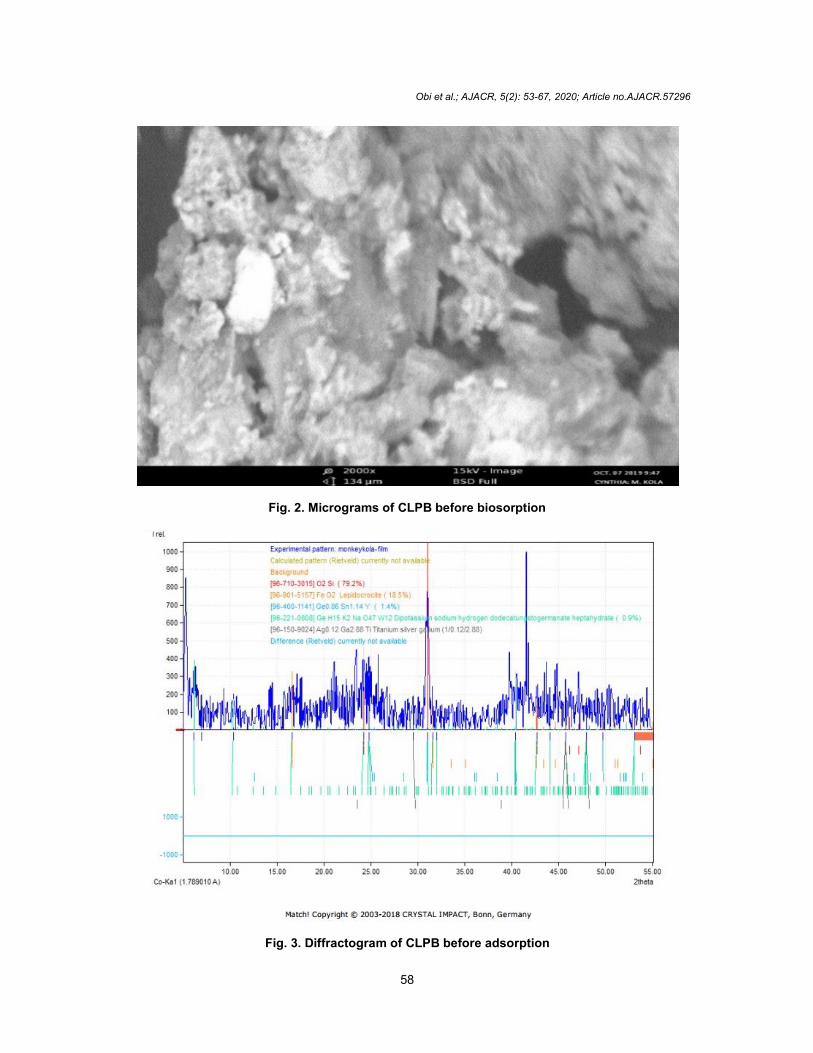
Fig. 5. Effect of time in the removal of toluene by CLPB
Fig. 6. Effect of pH in the removal of toluene by CLPB
The result of the phytochemical screening showed the presence of alkaloid, flavonoid, saponins, steroids, tannins and The result also showed the absence of glycoside.
3.5 Biosorption Studies 3.5.1 Contact time analysis The effect of contact time in the removal of the toluene was determined by keeping pH,
Obi et al.; AJACR, 5(2): 53-67, 2020; Article no.AJACR
60
Phytochemical composition of Cola lepidota pericarp biomass
Flavonoid tannins carbohydrate saponins Steroids
+ + ++ ++
Effect of time in the removal of toluene by CLPB
Effect of pH in the removal of toluene by CLPB
The result of the phytochemical screening showed the presence of alkaloid, flavonoid, saponins, steroids, tannins and carbohydrate. The result also showed the absence of glycoside.
The effect of contact time in the removal of the toluene was determined by keeping pH,
temperature, weight and initial concentration constant, and presented in Fig. 5. The result revealed that the percentage removal was relatively high having an optimum of value of 99.89% at 30 minutes. This is evidently due to the presence of unsaturated sites on the surface of the biosorbent. This was followed by saturation of the sites as shown in the constancy of the biosorption result after 30 minutes. [18]. obtained similar result using the seed of lepidota as biosorbent.
; Article no.AJACR.57296
pericarp biomass
Steroids glycoside
-
temperature, weight and initial concentration constant, and presented in Fig. 5. The result revealed that the percentage removal was relatively high having an optimum of value of 99.89% at 30 minutes. This is evidently due to
tes on the surface of the biosorbent. This was followed by saturation of the sites as shown in the constancy of the biosorption result after 30 minutes. [18]. obtained similar result using the seed of Cola

Fig. 7. Effect of initial concentration in the removal of toluene by CLPB
3.6 Effect of pH The pH of the solution has a significant impact on the uptake of toluene since it determines the surface charge of the adsorbent and the degree of ionization and speciation of the adsorbate [19]. The effect of the variation in the pH of the toluene solution by Cola lepidota is shown in Fig. 6. The result showed that maximum removal of toluene was 98.3% at pH of 8. The result showed that at lower concentration, the percentage removal was low. This could be as a result of competition between the adsorbate (tothe surface of the biomass. However, at higher concentration, maximum percentage removal was observed.
3.7 Effect of Initial Toluene Concentration The effect of initial toluene concentration on rate of toluene removal was carried out at 298 represented in Fig. 7. The result showed that the percentage removal increases with the increase in the initial toluene concentration. The result further revealed that the maximum removal percentage of toluene was 99.63% at 40 mg/L. 3.8 Biosorption Isotherms of
unto CLPB The biosorption isotherm evaluations were studied following the Langmuir, Freundlich, Dubinin-Radushkevich (D-R) and Temkin model
Obi et al.; AJACR, 5(2): 53-67, 2020; Article no.AJACR
61
Effect of initial concentration in the removal of toluene by CLPB
The pH of the solution has a significant impact on the uptake of toluene since it determines the surface charge of the adsorbent and the degree of ionization and speciation of the adsorbate [19]. The effect of the variation in the pH of the
is shown in Fig. 6. The result showed that maximum removal of toluene was 98.3% at pH of 8. The result showed that at lower concentration, the percentage removal was low. This could be as a result of competition between the adsorbate (toluene) and the surface of the biomass. However, at higher concentration, maximum percentage removal
3.7 Effect of Initial Toluene Concentration
The effect of initial toluene concentration on rate of toluene removal was carried out at 298 K and represented in Fig. 7. The result showed that the percentage removal increases with the increase in the initial toluene concentration. The result further revealed that the maximum removal percentage of toluene was 99.63% at 40 mg/L.
Isotherms of Toluene
The biosorption isotherm evaluations were studied following the Langmuir, Freundlich,
R) and Temkin model
equations. The linear forms of the equations are expressed as:
��
��=
�
����+
��
��
Where Ce represents the equilibrium liquidconcentration, qe represents the amount of heavy metal ions (mg/g) adsorbed at equilibrium, q(mg/g) represents the monolayer adsorption capacity, and KL represents the Lconstant. The qm and kL values were determined from the intercept and slope of the line obtained by plotting Ce/qe against Ce respectively. The essential characteristics of the Langmuir isotherm can be expressed by a dimensionless constant called the separation factor (Rand expressed as:
R� = �
�� ����
RL values indicate the adsorption to be unfavorable when RL > 1, linear when Rfavorable when 0 < R� < 1.
ln q� = ln K� + �
�ln C�
Where KF and n are constants obtained from the slope and intercept of a plot of log q
ln q�� = ln q� − Kɛ�
; Article no.AJACR.57296
Effect of initial concentration in the removal of toluene by CLPB
equations. The linear forms of the equations are
(3)
represents the equilibrium liquid-phase represents the amount of heavy
metal ions (mg/g) adsorbed at equilibrium, qm (mg/g) represents the monolayer adsorption
represents the Langmuir values were determined
from the intercept and slope of the line obtained respectively.
The essential characteristics of the Langmuir isotherm can be expressed by a dimensionless
the separation factor (RL) [20]
(4)
RL values indicate the adsorption to be unfavorable when RL > 1, linear when RL = 1,
(5)
and n are constants obtained from the slope and intercept of a plot of log qe against Ce.
(6)
Where qeq and qm (or BD) are adsorption at equilibrium and D-R monolayer capacity (in mg/g), ɛ is the Polanyi potential associated with the concentration at equilibrium (J/mol) and K is the constant associated with energy of sorption (mol/J)2. The D-R sorption equilibrium isotherm is investigated by plotting ln qeq against the values of ln qeq and K from the intercept and slope respectively [21] and ɛ is calculated from equation 7.
ɛ = RT ln(1 + �
��)
The mean free energy (E) is calculated from equation 8 given as:
E = (2K)��.�
q� = ��
��In A� +
��
�� In C�
Where R represents universal gas constant, T represents absolute temperature, ATemkin binding equilibrium constant in L/molvalues obtained from this corresponds to the highest possible binding energies, bthe heat of adsorption. The investigation was carried out by plotting qagainst In Ce and the bT and AT
determined from the slope and interplot.
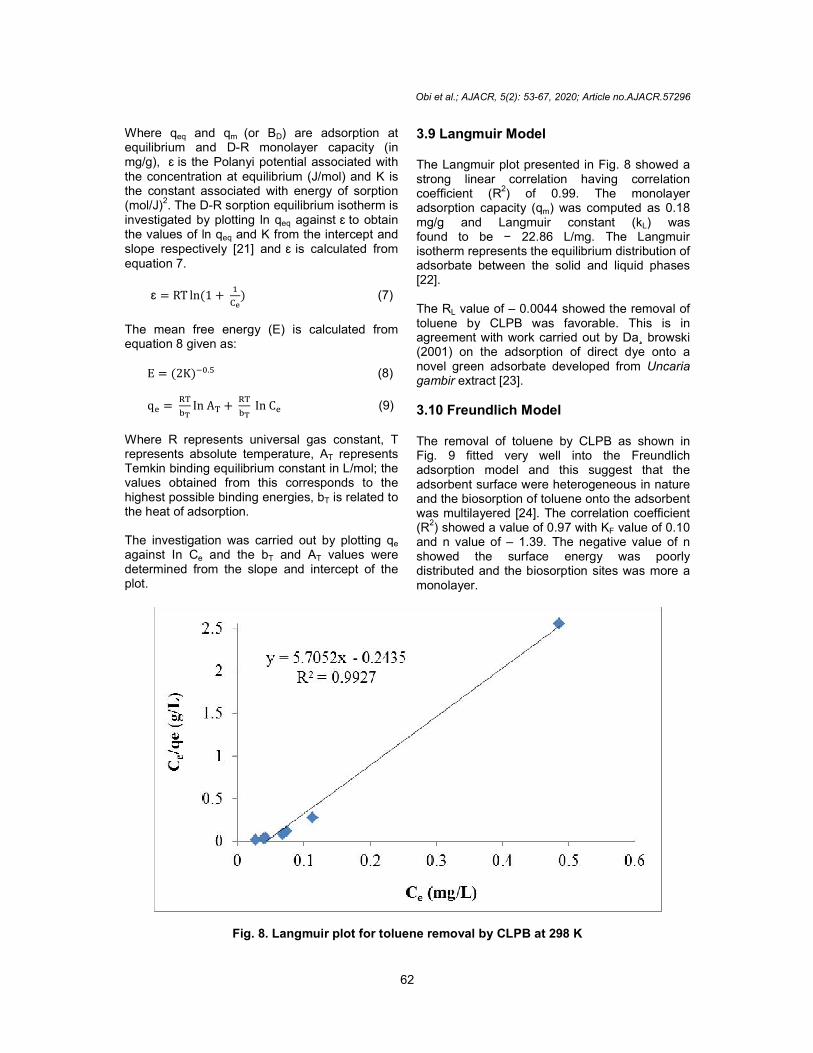
Fig. 8. Langmuir plot for toluene removal by CLPB at 298 K
Obi et al.; AJACR, 5(2): 53-67, 2020; Article no.AJACR
62
) are adsorption at monolayer capacity (in
is the Polanyi potential associated with the concentration at equilibrium (J/mol) and K is the constant associated with energy of sorption
R sorption equilibrium isotherm is against ɛ to obtain
and K from the intercept and is calculated from
(7)
The mean free energy (E) is calculated from
(8)
(9)
Where R represents universal gas constant, T represents absolute temperature, AT represents Temkin binding equilibrium constant in L/mol; the values obtained from this corresponds to the highest possible binding energies, bT is related to
The investigation was carried out by plotting qe
T values were determined from the slope and intercept of the
3.9 Langmuir Model The Langmuir plot presented in Figstrong linear correlation having correlation coefficient (R
2) of 0.99. The monolayer
adsorption capacity (qm) was computed as 0.18 mg/g and Langmuir constant (kfound to be − 22.86 L/mg. The Langmuir isotherm represents the equilibrium distribution of adsorbate between the solid and liquid phases [22]. The RL value of – 0.0044 showed the removal of toluene by CLPB was favorable. This is in agreement with work carried out by Da¸(2001) on the adsorption of direct dye onto a novel green adsorbate developed from gambir extract [23]. 3.10 Freundlich Model The removal of toluene by CLPB as shown in Fig. 9 fitted very well into the Freundlich adsorption model and this suggest that the adsorbent surface were heterogeneous in nature and the biosorption of toluene onto the adsorbent was multilayered [24]. The correlation coefficient (R
2) showed a value of 0.97 with K
and n value of – 1.39. The negative value of n showed the surface energy was poorly distributed and the biosorption sites was more a monolayer.
Langmuir plot for toluene removal by CLPB at 298 K
; Article no.AJACR.57296
The Langmuir plot presented in Fig. 8 showed a strong linear correlation having correlation
) of 0.99. The monolayer ) was computed as 0.18
mg/g and Langmuir constant (kL) was − 22.86 L/mg. The Langmuir
isotherm represents the equilibrium distribution of adsorbate between the solid and liquid phases
0.0044 showed the removal of toluene by CLPB was favorable. This is in agreement with work carried out by Da¸ browski (2001) on the adsorption of direct dye onto a novel green adsorbate developed from Uncaria
The removal of toluene by CLPB as shown in Fig. 9 fitted very well into the Freundlich adsorption model and this suggest that the adsorbent surface were heterogeneous in nature and the biosorption of toluene onto the adsorbent
yered [24]. The correlation coefficient ) showed a value of 0.97 with KF value of 0.10
1.39. The negative value of n showed the surface energy was poorly distributed and the biosorption sites was more a

Fig. 9. Freundlich plot for toluene removal by CLPB at 298 K
-2
-1.5
-1
-0.5
0
0.5
1
0.00 20.00
In q
e
Fig. 10. D-R plot for toluene removal by CLPB at 298 K
3.11 D-R Model The D-R plot in Fig. 10 though with strong relationship (R2 = 0.96) does not fit well with the removal of toluene by CLPB because the biosorption energy was difficult to be calculated from the model equation. This is because of the negative value of K (− 3 × 10associated to biosorption energy. The value of amount biosorbed (qe) was close the value obtained from the Langmuir model equation. This also supports the fact that the biosorptionfollowed Langmuir isotherm model equation.
Obi et al.; AJACR, 5(2): 53-67, 2020; Article no.AJACR
63
Freundlich plot for toluene removal by CLPB at 298 K
y = 3E-08x - 1.7719 R² = 0.962
20.00 40.00 60.00 80.00 100.00
ϵ2
Millions
R plot for toluene removal by CLPB at 298 K
R plot in Fig. 10 though with strong = 0.96) does not fit well with the
removal of toluene by CLPB because the biosorption energy was difficult to be calculated
because of the − 3 × 10⁻⁸
) which is associated to biosorption energy. The value of
) was close the value obtained from the Langmuir model equation. This also supports the fact that the biosorption followed Langmuir isotherm model equation.
3.12 Temkin Model The result presented in Fig. 11 showed that the heat of adsorption of the interaction between toluene and CLPB decreased linearly as a result of increase in the surface coverage However, the model showed a relatively weak linear correlation having R
2 of 0.85. The Temkin
constant related to heat of sorption (b) was obtained as – 5,935.72 J/mol and the Temkin isotherm constant (KT) was calculated to be 2.00 L/g. The values of the isotherm model parameters are presented in Table 4.
; Article no.AJACR.57296
11 showed that the heat of adsorption of the interaction between toluene and CLPB decreased linearly as a result of increase in the surface coverage [25]. However, the model showed a relatively weak
of 0.85. The Temkin constant related to heat of sorption (b) was
5,935.72 J/mol and the Temkin lculated to be 2.00
The values of the isotherm model parameters are presented in Table 4.

Obi et al.; AJACR, 5(2): 53-67, 2020; Article no.AJACR.57296
64
y = -0.4174x - 0.2892 R² = 0.8454
0
0.2
0.4
0.6
0.8
1
1.2
1.4
1.6
-4 -3 -2 -1 0
q e (
mg/
g)
In Ce
Fig. 11. Temkin plot for toluene removal by CLPB at 298 K
Table 4. Constants for adsorption isotherm
models
Model Values Langmuir qm(mg/g) 0.18 kL(L/mg) − 22.86 RL − 0.0044 R2 0.99 Freundlich kF(mg/g) 0.10 n − 1.39 R
2 0.97
D-R b − 3.00 × 10
−8
qm (mg/g) 0.17 R
2 0.96
Temkin b (J/mol) − 5,935.72 KT (L/g) 2.00 R
2 0.85
3.13 Kinetics Studies The kinetic adsorption data were investigated to understand the dynamic of the biosorption process in terms of the order of the rate constant.
3.13.1 Pseudo-first-order kinetic model
The linear form of the pseudo first-order kinetic model proposed for adsorption is expressed as:
In (qe − qt) = ln qe – k1t (10)
Where qt is adsorption capacity at time, t (mg/g) and k1 (min
-1) is the rate constant. qe and k1 were
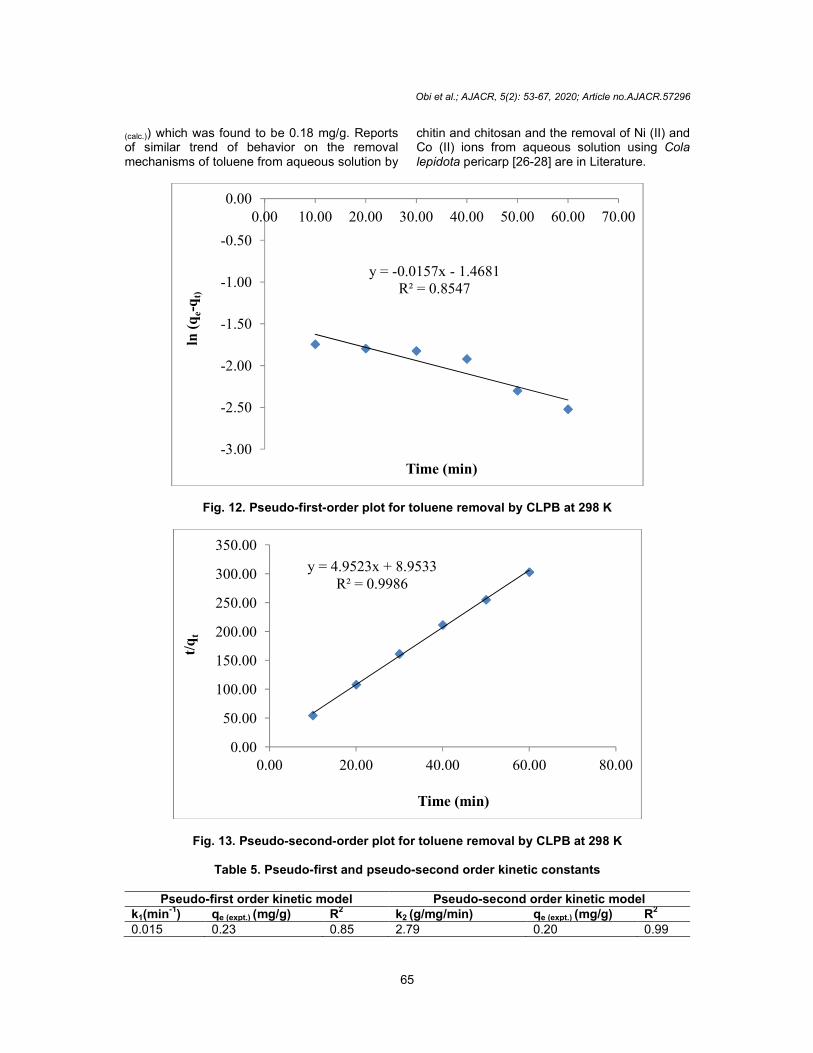
determined from the intercept and slope of the plot of ln (qe – qt) versus time. The pseudo – first order plot as shown in Fig. 12 showed relatively weak linear relationship with correlation coefficient (R
2) = 0.85 and the
experimentally deduced equilibrium adsorption capacity (qe(expt.)) for the pseudo first – order process was 0.23 mg/g and k1 was found to be 0.015. 3.13.2 Pseudo-second-order kinetic model The pseudo-second-order kinetic is given by the model
�
��=
�
��t +
�
����� (11)
Where qt and qe represent the biosorption capacity at time, t and equilibrium (mg/g) and k2 (g/mol/min) represents the rate constant, the values of k2 and qe were deduced from the slope and intercept of the plots of t/qt versus time. The experimental data represented in Fig. 13 fitted well with pseudo – second order model with R2 = 0.99 than pseudo – first order model. This suggests that chemisorption was the dominant mechanism, and that the result of the equilibrium study followed Langmuir biosorption isotherm model. Further perusal of the tabulation (Table 5), revealed that the experimentally deduced equilibrium biosorption capacity (qe (expt.)) for the pseudo second – order process was found to be 0.20 mg/g and conformed relatively closer to the calculated equilibrium biosorption capacity (qe
Obi et al.; AJACR, 5(2): 53-67, 2020; Article no.AJACR.57296
65
(calc.)) which was found to be 0.18 mg/g. Reports of similar trend of behavior on the removal mechanisms of toluene from aqueous solution by
chitin and chitosan and the removal of Ni (II) and Co (II) ions from aqueous solution using Cola lepidota pericarp [26-28] are in Literature.
Fig. 12. Pseudo-first-order plot for toluene removal by CLPB at 298 K
Fig. 13. Pseudo-second-order plot for toluene removal by CLPB at 298 K
Table 5. Pseudo-first and pseudo-second order kinetic constants
Pseudo-first order kinetic model Pseudo-second order kinetic model k1(min-1) qe (expt.) (mg/g) R2 k2 (g/mg/min) qe (expt.) (mg/g) R2 0.015 0.23 0.85 2.79 0.20 0.99
y = -0.0157x - 1.4681R² = 0.8547
-3.00
-2.50
-2.00
-1.50
-1.00
-0.50
0.000.00 10.00 20.00 30.00 40.00 50.00 60.00 70.00
ln (
qe-
qt)
Time (min)
y = 4.9523x + 8.9533R² = 0.9986
0.00
50.00
100.00
150.00
200.00
250.00
300.00
350.00
0.00 20.00 40.00 60.00 80.00
t/q
t
Time (min)

Obi et al.; AJACR, 5(2): 53-67, 2020; Article no.AJACR.57296
66
4. CONCLUSION
The result showed the highest percentage removal of 99.63% at toluene initial concentration of 40 mg/L and 98.30% at pH 8. The contact time 30 minutes gave better removal efficiency of 99.89%. The equilibrium data modeling showed the biosorption process followed Langmuir isotherm model and the kinetic evaluation followed pseudo-second-order model indicating that there was a clear interaction between toluene and the Cola lepidota pericarp biomass. The results obtained were possible because of the surface composition, morphology and crystallographic structure of Cola lepidota. The result reveals that Cola lepidota is a promising bio-material which can be packaged in a granular form for the removal of organic pollutants from the ecosystem.
COMPETING INTERESTS
Authors have declared that no competing interests exist.
REFERENCES
1. Obi C, Woke J. The removal of phenol from aqueous solution by Colocasia esculenta araesia Linn Schott. Sky Journal of Soil Science and Environmental Management. 2014;3(6):059-066.
2. Steffen W, Richardson K, Roskstrom J, Cornell SE. Planetary boundaries: Guiding human development on a changing planet. Science. 2015;347(6223):1259855-1259855.
3. Lelieveld J, Evans JS, Fnais M, Giannadaki D, Pozzer A. The contribution of outdoor air pollution sources to premature mortality on a global scale. Nature. 2015;525:367-371.
4. Heydari M, Sabbaghi S, Zeinali S. Adsorptive removal of toluene from aqueous solution using metal-organic framework MIL-101 (Cr): Removal optimization by response surface methodology. International Journal of Environmental, Science and Technology. 2019;16:6217-6226.
5. World Health Organization. Guidelines for drinking quality water: Recommendations. World Health Organization, Geneva. 2004;1:1.
6. Pat – Okunborq AE, Obi C, Ibezim – Ezeani MU. Equilibrium and thermodynamic studies using eco-friendly Cola lepidota seed resins as novel
adsorbents in the removal of Pb (II) and Cd (II) ions from aqueous system. Pakistan Journal of Science and Industrial Research. 2019;62A(3): 146 – 156.
7. Obi C, Obo BU, Agha II. Adsorption of Lead (II) Ion onto Jackfruit Chaff Matrix. World Applied Sciences Journal. 2019;37(7):544-549.
8. Singh S, Goyal D. Microbial and plant derived biomass for removal of heavy metals from wastewater. Bioresource Technology. 2007;98(12):2243-2257.
9. Mehta SK, Gaur JP. Use of algae for removing heavy metal ions from wastewater: Progress and prospects. Critical Reviews in Biotechnology. 2008;25(3):113-152.
10. Macek T, Mackova M. Potential of biosorption technology, In: Microbial Biosorption of Metals (eds P. Kotrba, M. Mackova T. Macek), Springer, Dordrecht. 2011;7–17.
11. Hossain MA, Piyatida P, Teixeira da Silva JA, Fujita M. Molecular mechanism of heavy metal toxicity and tolerance in plants: Central role of glutathione in detoxification of reactive oxygen species and methylglyoxal and in heavy metal chelation. Journal of Botany. 2012;1-37.
12. Demirbas A. Biofuels sources, biofuel policy, biofuel economy and global biofuel projections. Energy Conversion and Management. 2008;49(8):2106-2116.
13. Obi C, Ibezim-Ezeani MU, Nwagbo JE. Production of biodiesel using novel C. lepodita oil in the presence of heterogeneous solid catalyst. Chemistry International Journal. 2020;6(2):91-97.
14. Ogbu JU, Umeokechukwu CE. Aspects of fruit biology of three wild edible monkey kola species fruits (Cola spp: Malvaceae). Annual Research and Review in Biology. 2014;4(12):2007-2014.
15. Ogbu JU, Essien, BA, Kadurumba CH. Nutritional value of wild Cola spp. (Monkey kola) fruits of southern Nigeria. Nigeria Journal of Horticultural Science. 2007;12:113-117.
16. Chen J, Zhang D, Zhang H, Ghosh S, Pan B. Fast and slow adsorption of carbamazepine on biochar as affected by carbon structure and mineral composition. Scientific Total Environment. 2017;579:598-605.
17. Joseph S, Downie A, Munroe P, Crosky A, Lehmann J. Biochar for carbon

Obi et al.; AJACR, 5(2): 53-67, 2020; Article no.AJACR.57296
67
sequestration, reduction of greenhouse gas emissions and enhancement of soil fertility: A review of the materials science. In: Proceedings of the Australian Combustion Symposium. 2007;130-133.
18. Armstrong EP, Ibezim-Ezeani MU, Obi C. Kinetics and Physical mechanism of pb(ll) and CD(ll)ions Uptake from aqueous solution using unmodified and modified cola lapidota seed extract as adsorbents. International Journal of Modern Chemistry. 2019;11(1):40-56.
19. Imamoglu M, Tekir O. Removal of copper (II) and lead (II) ions from aqueous solutions by a new precursor hazelnut husks. Desalination. 2008;228(1-3):108-113.
20. Ayawei N, Angaye SS, Wankasi D, Dikio ED. Synthesis, characterization and application of Mg/Al layered double hydroxide for the degradation of congo red in aqueous solution. Open Journal of Physical Chemistry. 2015;5(3):56-70.
21. Coskun A, Yildiz A, Delibas A. Removal of methylene blue using fast sucking adsorbent. Journal of Materials and Environmental Sciences. 2017;8:398-409.
22. Dada AO, Olalekan AP, Olatunya AM, Dada O. Langmuir, Freundlich, Temkin and Dubinin–Radushkevich isotherms studies of equilibrium sorption of Zn2+ unto phosphoric acid modified rice husk. IOSR Journal of Applied Chemistry. 2012;3(1):38-45.
23. Ho YS, McKay G. A kinetic study of dye sorption by biosorbent waste product pith. Resources, Conservation and Recycling. 1999;25(3): 171-193.
24. Shahbeig H, Bagheri N, Ghorbaman S, Hallajisani A, Poor karimi S. A new adsorption isotherm model of aqueous solutions on granular activated carbon. World Journal of Modelling and Simulation. 2013;9(4):243–254.
25. Muhammad TA, Abdulrahman AA., Muhammad S. Adsorptive removal of reactive black 5 from waste water using bentonite clay: Isotherms, kinetics and thermodynamics. Sustainability. 2015; 7:15302-15318.
26. Mohamed M, Ouki S. Removal mechanisms of toluene from aqueous solutions by chitin and chitosan. Industrial and Engineering Chemistry Research. 2011;50(16):9557-9563.
27. Obi C, Njoku OE. Removal of Ni (II) and Pb (II) ions from aqueous solutions by grapefruit (Citrus paradisi) Mesocarp Biomass. Journal of Applied Sciences and Environmental Management. 2015;19(3):436-444.
28. Adesanmi SO, Ibezim-Ezeani MU, Obi C. Decontamination of Ni(II) and Co(II) ions from Aqueous Medium using the Cola lepidota Pericarp. Makara Journal of Science. 2019;23(1):51-64.
© 2020 Obi et al.; This is an Open Access article distributed under the terms of the Creative Commons Attribution License (http://creativecommons.org/licenses/by/4.0), which permits unrestricted use, distribution, and reproduction in any medium, provided the original work is properly cited.
Peer-review history: The peer review history for this paper can be accessed here:
http://www.sdiarticle4.com/review-history/57296