2.2. Coca / Cocaine market - UNODC
29
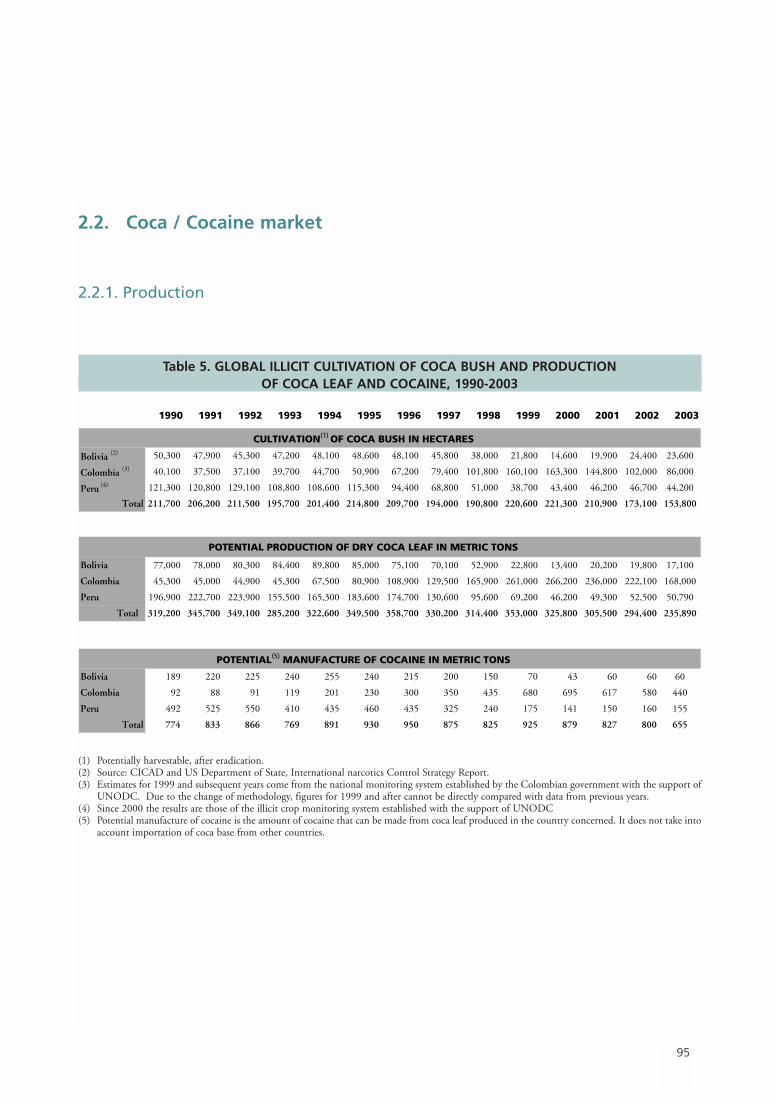
95 2.2. Coca / Cocaine market 2.2.1. Production 1990 1991 1992 1993 1994 1995 1996 1997 1998 1999 2000 2001 2002 2003 CULTIVATION (1) OF COCA BUSH IN HECTARES Bolivia (2) 50,300 47,900 45,300 47,200 48,100 48,600 48,100 45,800 38,000 21,800 14,600 19,900 24,400 23,600 Colombia (3) 40,100 37,500 37,100 39,700 44,700 50,900 67,200 79,400 101,800 160,100 163,300 144,800 102,000 86,000 Peru (4) 121,300 120,800 129,100 108,800 108,600 115,300 94,400 68,800 51,000 38,700 43,400 46,200 46,700 44,200 Total 211,700 206,200 211,500 195,700 201,400 214,800 209,700 194,000 190,800 220,600 221,300 210,900 173,100 153,800 POTENTIAL PRODUCTION OF DRY COCA LEAF IN METRIC TONS Bolivia 77,000 78,000 80,300 84,400 89,800 85,000 75,100 70,100 52,900 22,800 13,400 20,200 19,800 17,100 Colombia 45,300 45,000 44,900 45,300 67,500 80,900 108,900 129,500 165,900 261,000 266,200 236,000 222,100 168,000 Peru 196,900 222,700 223,900 155,500 165,300 183,600 174,700 130,600 95,600 69,200 46,200 49,300 52,500 50,790 Total 319,200 345,700 349,100 285,200 322,600 349,500 358,700 330,200 314,400 353,000 325,800 305,500 294,400 235,890 POTENTIAL (5) MANUFACTURE OF COCAINE IN METRIC TONS Bolivia 189 220 225 240 255 240 215 200 150 70 43 60 60 60 Colombia 92 88 91 119 201 230 300 350 435 680 695 617 580 440 Peru 492 525 550 410 435 460 435 325 240 175 141 150 160 155 Total 774 833 866 769 891 930 950 875 825 925 879 827 800 655 Table 5. GLOBAL ILLICIT CULTIVATION OF COCA BUSH AND PRODUCTION OF COCA LEAF AND COCAINE, 1990-2003 (1) Potentially harvestable, after eradication. (2) Source: CICAD and US Department of State, International narcotics Control Strategy Report. (3) Estimates for 1999 and subsequent years come from the national monitoring system established by the Colombian government with the support of UNODC. Due to the change of methodology, figures for 1999 and after cannot be directly compared with data from previous years. (4) Since 2000 the results are those of the illicit crop monitoring system established with the support of UNODC (5) Potential manufacture of cocaine is the amount of cocaine that can be made from coca leaf produced in the country concerned. It does not take into account importation of coca base from other countries.
-
Upload
khangminh22 -
Category
Documents
-
view
2 -
download
0
Transcript of 2.2. Coca / Cocaine market - UNODC
95
2.2. Coca / Cocaine market
2.2.1. Production
1990 1991 1992 1993 1994 1995 1996 1997 1998 1999 2000 2001 2002 2003
CULTIVATION(1) OF COCA BUSH IN HECTARES
Bolivia (2) 50,300 47,900 45,300 47,200 48,100 48,600 48,100 45,800 38,000 21,800 14,600 19,900 24,400 23,600
Colombia (3) 40,100 37,500 37,100 39,700 44,700 50,900 67,200 79,400 101,800 160,100 163,300 144,800 102,000 86,000
Peru (4) 121,300 120,800 129,100 108,800 108,600 115,300 94,400 68,800 51,000 38,700 43,400 46,200 46,700 44,200
Total 211,700 206,200 211,500 195,700 201,400 214,800 209,700 194,000 190,800 220,600 221,300 210,900 173,100 153,800
POTENTIAL PRODUCTION OF DRY COCA LEAF IN METRIC TONS
Bolivia 77,000 78,000 80,300 84,400 89,800 85,000 75,100 70,100 52,900 22,800 13,400 20,200 19,800 17,100
Colombia 45,300 45,000 44,900 45,300 67,500 80,900 108,900 129,500 165,900 261,000 266,200 236,000 222,100 168,000
Peru 196,900 222,700 223,900 155,500 165,300 183,600 174,700 130,600 95,600 69,200 46,200 49,300 52,500 50,790
Total 319,200 345,700 349,100 285,200 322,600 349,500 358,700 330,200 314,400 353,000 325,800 305,500 294,400 235,890
POTENTIAL(5) MANUFACTURE OF COCAINE IN METRIC TONS
Bolivia 189 220 225 240 255 240 215 200 150 70 43 60 60 60
Colombia 92 88 91 119 201 230 300 350 435 680 695 617 580 440
Peru 492 525 550 410 435 460 435 325 240 175 141 150 160 155
Total 774 833 866 769 891 930 950 875 825 925 879 827 800 655
Table 5. GLOBAL ILLICIT CULTIVATION OF COCA BUSH AND PRODUCTION OF COCA LEAF AND COCAINE, 1990-2003
(1) Potentially harvestable, after eradication.(2) Source: CICAD and US Department of State, International narcotics Control Strategy Report. (3) Estimates for 1999 and subsequent years come from the national monitoring system established by the Colombian government with the support of
UNODC. Due to the change of methodology, figures for 1999 and after cannot be directly compared with data from previous years.(4) Since 2000 the results are those of the illicit crop monitoring system established with the support of UNODC(5) Potential manufacture of cocaine is the amount of cocaine that can be made from coca leaf produced in the country concerned. It does not take into
account importation of coca base from other countries.
96
World Drug Report 2004 Volume I. Analysis
Global cultivation of coca has reached its lowest levelsince 1985…
Global coca cultivation continued declining for thethird straight year in 2003. The total area under cocacultivation in Colombia, Peru and Bolivia combineddeclined to 153,800 ha, an 11% decline from 2003 anda 30% decline from the peak of coca cultivation in1999. As has been the case since 1996, the majority ofall coca cultivation (56%) took place in Colombia, 29%took place in Peru and 15% took place in Bolivia.
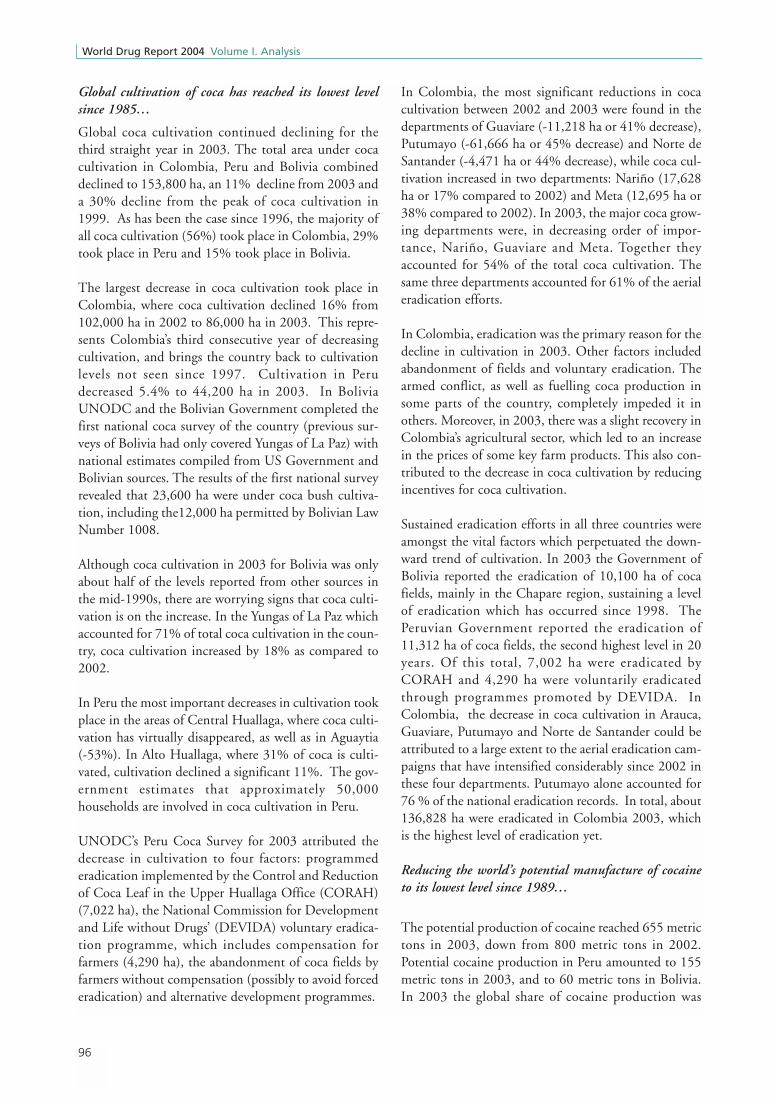
The largest decrease in coca cultivation took place inColombia, where coca cultivation declined 16% from102,000 ha in 2002 to 86,000 ha in 2003. This repre-sents Colombia’s third consecutive year of decreasingcultivation, and brings the country back to cultivationlevels not seen since 1997. Cultivation in Perudecreased 5.4% to 44,200 ha in 2003. In BoliviaUNODC and the Bolivian Government completed thefirst national coca survey of the country (previous sur-veys of Bolivia had only covered Yungas of La Paz) withnational estimates compiled from US Government andBolivian sources. The results of the first national surveyrevealed that 23,600 ha were under coca bush cultiva-tion, including the12,000 ha permitted by Bolivian LawNumber 1008.
Although coca cultivation in 2003 for Bolivia was onlyabout half of the levels reported from other sources inthe mid-1990s, there are worrying signs that coca culti-vation is on the increase. In the Yungas of La Paz whichaccounted for 71% of total coca cultivation in the coun-try, coca cultivation increased by 18% as compared to2002.
In Peru the most important decreases in cultivation tookplace in the areas of Central Huallaga, where coca culti-vation has virtually disappeared, as well as in Aguaytia(-53%). In Alto Huallaga, where 31% of coca is culti-vated, cultivation declined a significant 11%. The gov-ernment estimates that approximately 50,000households are involved in coca cultivation in Peru.
UNODC’s Peru Coca Survey for 2003 attributed thedecrease in cultivation to four factors: programmederadication implemented by the Control and Reductionof Coca Leaf in the Upper Huallaga Office (CORAH)(7,022 ha), the National Commission for Developmentand Life without Drugs’ (DEVIDA) voluntary eradica-tion programme, which includes compensation forfarmers (4,290 ha), the abandonment of coca fields byfarmers without compensation (possibly to avoid forcederadication) and alternative development programmes.
In Colombia, the most significant reductions in cocacultivation between 2002 and 2003 were found in thedepartments of Guaviare (-11,218 ha or 41% decrease),Putumayo (-61,666 ha or 45% decrease) and Norte deSantander (-4,471 ha or 44% decrease), while coca cul-tivation increased in two departments: Nariño (17,628ha or 17% compared to 2002) and Meta (12,695 ha or38% compared to 2002). In 2003, the major coca grow-ing departments were, in decreasing order of impor-tance, Nariño, Guaviare and Meta. Together theyaccounted for 54% of the total coca cultivation. Thesame three departments accounted for 61% of the aerialeradication efforts.
In Colombia, eradication was the primary reason for thedecline in cultivation in 2003. Other factors includedabandonment of fields and voluntary eradication. Thearmed conflict, as well as fuelling coca production insome parts of the country, completely impeded it inothers. Moreover, in 2003, there was a slight recovery inColombia’s agricultural sector, which led to an increasein the prices of some key farm products. This also con-tributed to the decrease in coca cultivation by reducingincentives for coca cultivation.
Sustained eradication efforts in all three countries wereamongst the vital factors which perpetuated the down-ward trend of cultivation. In 2003 the Government ofBolivia reported the eradication of 10,100 ha of cocafields, mainly in the Chapare region, sustaining a levelof eradication which has occurred since 1998. ThePeruvian Government reported the eradication of11,312 ha of coca fields, the second highest level in 20years. Of this total, 7,002 ha were eradicated byCORAH and 4,290 ha were voluntarily eradicatedthrough programmes promoted by DEVIDA. InColombia, the decrease in coca cultivation in Arauca,Guaviare, Putumayo and Norte de Santander could beattributed to a large extent to the aerial eradication cam-paigns that have intensified considerably since 2002 inthese four departments. Putumayo alone accounted for76 % of the national eradication records. In total, about136,828 ha were eradicated in Colombia 2003, whichis the highest level of eradication yet.
Reducing the world’s potential manufacture of cocaineto its lowest level since 1989…
The potential production of cocaine reached 655 metrictons in 2003, down from 800 metric tons in 2002.Potential cocaine production in Peru amounted to 155metric tons in 2003, and to 60 metric tons in Bolivia.In 2003 the global share of cocaine production was

97
2. Trends Coca / Cocaine market
slightly redistributed between the three countries withColombia’s share of cocaine production falling from75% to 67%. Peru’s share amounted to 24%, andBolivia’s to 9% of cocaine production.
In Peru, the research carried out by Peru’s Tropical CropInstitute in 2003 supports reports that farmers areimproving coca yields on existing plots instead ofincreasing the surface of their cultivation. Between2001 and 2003 the average yield of coca crops in theUpper Huallaga rose from 500 kg/ha/year to800/kg/ha/year (four harvests per year). At the countrylevel, the gross potential farm-gate value of the dry cocaleaf production harvested in 2003 amounted to US$112million. Considering that 50,000 households cultivatecoca in Peru, discounting maintenance costs, the netincome per household derived from the sale of coca leafis around US$1,344 per year.
In Bolivia, where the law allows for coca production fortraditional use, the total coca leaf production amountedto 28,300 metric tons, of which 17,100 metric tonswere estimated to have been available for cocaine pro-duction. The total gross potential farmgate value ofcoca leaf production in Bolivia in 2003 is estimated tobe US$153million, equivalent to 2% of the country’sGDP or 13.4% of the value added of the (licit) agricul-tural sector. The gross income from coca leaf produc-tion amounted to US$500 per capita (coca growers andnon-growers) in the coca producing regions in 2003.The overall (licit) GDP per capita in Bolivia was aroundUS$880 in 2003. 3.8% of the country’s total popula-tion live in the coca producing regions.
UNODC has not yet conducted a scientific and com-prehensive study on coca leaf and cocaine productivityin Colombia, but information gathered from othersources, enabled the estimation of the potential cocaineproduction in Colombia at about 440 metric tons.Using the average price for coca base of US$793/kg in2003, and assuming a one to one conversion ratebetween cocaine and coca base, the total farmgate valueof the 440 metric tons of coca base produced in Colom-bia in 2003 would amount to about US$ 350 million.
However, there is some sign of shifting cultivation pat-terns and improved techniques…
UNODC’s surveys consistently reveal signs that farmersare improving and adapting their cultivation tech-niques, both to increase yield and to hide crops. InBolivia, for example, fertilizers and pesticides have beenwidely used for coca cultivation in the Yungas of La Paz,
but it is only in 2003 that the irrigation of coca fieldshas become common.
The interpretation of satellite images in Bolivia revealedthat most of the new coca fields were established to thedetriment of the primary forest. Farmers are also inter-spersing their coca crop with other licit crops, such asrice, cassava, pineapple and citrus trees. Farmers timethe addition of the coca crop to the licit crop carefully,when the licit crop is at about half of its maturity. Whilethis technique is neither new nor complex, it may begrowing more common as a method of avoiding eradi-cation. This, for example, is done in Chapare in Boliviawhere most of the eradication takes place.
In Peru, there has been some shifting in cultivation,with Apurimac Ene replacing Alto Huallaga as the areawith the largest area under coca cultivation. Althoughcultivation is declining in Alto Huallaga, it remainshigh. UNODC’s alternative development programmesin the region estimate that 80% of farmers income inthe area of Mozon in Alto Huallaga comes from cocacultivation. In Mozon, coca cultivation is concentratedin the steep slopes of the mountains, while licit cropstend to be cultivated in the more productive soils of thelower valleys. The insecurity and violence broughtabout by organizations of coca farmers in Mozon wereconstant in 2003, especially in the higher areas wherethe coca cultivation is concentrated. Mozon accountsfor 71% of the cultivation in the Alto Huallaga area, inthe other areas agriculture is more diverse and coca cul-tivation accounts for only a marginal fraction of farmer’sincome. There are both direct and indirect indicatorsthat farmers are abandoning their coca fields in order toavoid eradication. Once the risk of eradication disap-pears, abandoned coca fields can be quickly reactivatedat a fraction of the cost of establishing a brand new field.
Cultivation in Apurimac-Ene, which now accounts forthe largest portion (32%) of coca cultivation in Peru,has been increasing since 1997. It is thought that theincrease is due mainly to the rehabilitation and improve-ment of abandoned coca fields, rather than the estab-hishment of new crops. UNODC’s survey has foundthat it costs approximately US$ 400 to rehabilitate anabandoned coca field, with the first harvest ready after3 or 4 months, whereas, the cost for establishing a newhectare ranges from US$1,500 to US$1,800 and thefirst harvest is produced only after 9 to 15 months.
In Colombia, coca cultivation is characterized by a highdegree of mobility, both within and across departmentboundaries. With cultivation shifting tactically to avoid

98
World Drug Report 2004 Volume I. Analysis
eradication and to exploit new growing areas. InPutomayo cultivation declined 45%. Declines corre-sponded roughly to aerial spraying activity and volun-tary eradication. Unlike in other parts of the country,this was not counterbalanced by the establishment ofnew fields or the reseeding of sprayed areas. A highdegree of mobility of coca cultivation was noted withinthe region of Guaviare, which in the 90’s, was the largestcoca growing area of Colombia, until most of the cocamigrated to Putumayo at the end of the decade and thento the Nariño area. Guaviare remains one of the mostimportant coca growing regions in Colombia, despitethe 41% decrease in the level of coca cultivationbetween 2002 and 2003. Nariño experienced a 17%increase in cultivation , perhaps as a consequence of thesignificant reduction in coca cultivation in Putumayo,which drove landless labourers to move to Nariño.Other factors would have included violence, insecurity,proximity of the sea and international trafficking routes.

99
2. Trends Coca / Cocaine market
Fig. 45: Global coca bush cultivation, 1990-2003 (in ha)
Fig. 46: Potential cocaine production, 1990-2003 (metric tons)
0
25,000
50,000
75,000
100,000
125,000
150,000
175,000
200,000
225,000
1990 1991 1992 1993 1994 1995 1996 1997 1998 1999 2000 2001 2002 2003
hec
tare
s
Bolivia Colombia Peru
0
100
200
300
400
500
600
700
800
900
1,000
1990 1991 1992 1993 1994 1995 1996 1997 1998 1999 2000 2001 2002 2003
met
ric
ton
s
Bolivia Colombia Peru
Estimates for Colombia for 1999 and subsequent years come from the national monitoring system established by the Colombiangovernment with the support of UNODC. Due to the change of methodology, figures for 1999 and after cannot be directly comparedwith data from previous years.
100
World Drug Report 2004 Volume I. Analysis
Colombia
Peru
Bolivia
Colombia
Peru
Bolivia
102,
000
24,4
00
46,7
00
60
160
580
Cultivation
in hectares
2002
2003
Production in
metric tons
2002
2003
86,0
00
44,2
00
23,6
00
440
155
60
Map 11. Coca bush cultivation (2002 - 2003)
Map 12. Potential cocaine production (2002 - 2003)

101
2. Trends Coca / Cocaine market
COLOMBIA - COCA BUSH CULTIVATION, 1990 - 2003 (ha) COLOMBIA - POTENTIAL COCAINE PRODUCTION, 1990 - 2003 (mt)
PERU - COCA BUSH CULTIVATION, 1990 - 2003 (ha) PERU - POTENTIAL COCAINE PRODUCTION, 1990 - 2003 (mt)
BOLIVIA - COCA BUSH CULTIVATION, 1990 - 2003 (ha) BOLIVIA - POTENTIAL COCAINE PRODUCTION, 1990 - 2003 (mt)
0
25,000
50,000
75,000
100,000
125,000
150,000
175,000
90 91 92 93 94 95 96 97 98 99 00 01 02 03
0
25,000
50,000
75,000
100,000
125,000
150,000
175,000
90 91 92 93 94 95 96 97 98 99 00 01 02 03
0
25,000
50,000
75,000
100,000
125,000
150,000
175,000
90 91 92 93 94 95 96 97 98 99 00 01 02 03
0
50,000
100,000
150,000
200,000
250,000
90 91 92 93 94 95 96 97 98 99 00 01 02 03
0
50,000
100,000
150,000
200,000
250,000
90 91 92 93 94 95 96 97 98 99 00 01 02 03
0
50,000
100,000
150,000
200,000
250,000
90 91 92 93 94 95 96 97 98 99 00 01 02 03
Estimates for Colombia for 1999 and subsequent years come from the national monitoring system established by the Colombian governmentwith the support of UNDCP. Due to the change of methodology, figures for 1999 and after cannot be directly compared with data fromprevious years.
Fig. 47. Annual coca bush cultivation and cocaine production in main producing countries, 1990 - 2003

102
World Drug Report 2004 Volume I. Analysis
Colombia59%
Bolivia14%
Peru27%
Colombia75%
Bolivia8%
Peru20%
2003
Colombia56%
Bolivia15%
Peru29%
Colombia67%
Bolivia9%Peru
24%
2002
20032002
Fig. 49: Potential cocaine production (in % of global total)
Fig. 48: Coca bush cultivation (in % of global total)
103
2. Trends Coca / Cocaine market
1993 1994 1995 1996 1997 1998 1999 2000 2001 2002 2003
Bolivia 2,400 1,100 5,493 7,512 7,000 11,620 15,353 7,653 9,395 11,839 10,089
Colombia 946 4,904 25,402 23,025 44,123 69,155 44,157 61,574 95,898 126,933 136,828 *
Peru 240 7,512 7,512 3,462 17,800 13,800 6,200 3,900 7,000 11,312
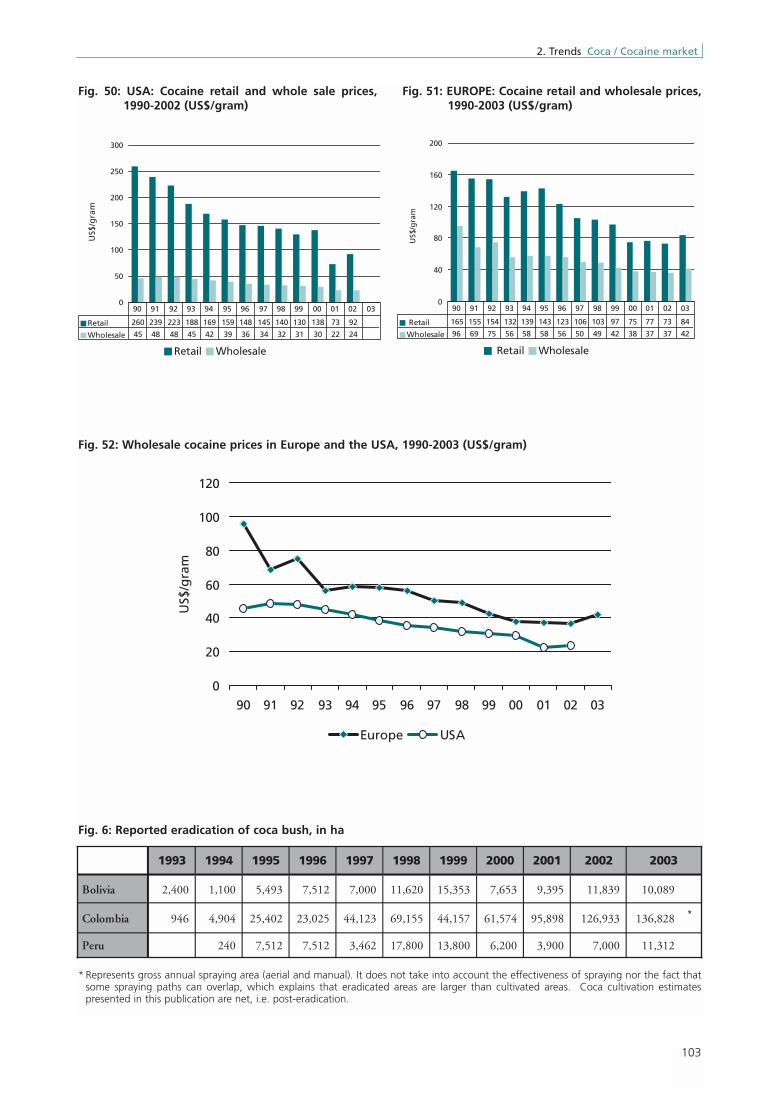
Fig. 6: Reported eradication of coca bush, in ha
* Represents gross annual spraying area (aerial and manual). It does not take into account the effectiveness of spraying nor the fact thatsome spraying paths can overlap, which explains that eradicated areas are larger than cultivated areas. Coca cultivation estimatespresented in this publication are net, i.e. post-eradication.
Fig. 50: USA: Cocaine retail and whole sale prices,1990-2002 (US$/gram)
Fig. 51: EUROPE: Cocaine retail and wholesale prices,1990-2003 (US$/gram)
0
50
100
150
200
250
300
US$
/gra
m
Retail Wholesale
Retail 260 239 223 188 169 159 148 145 140 130 138 73 92
Wholesale 45 48 48 45 42 39 36 34 32 31 30 22 24
90 91 92 93 94 95 96 97 98 99 00 01 02 030
40
80
120
160
200
US$
/gra
m
Retail Wholesale
Retail 165 155 154 132 139 143 123 106 103 97 75 77 73 84
Wholesale 96 69 75 56 58 58 56 50 49 42 38 37 37 42
90 91 92 93 94 95 96 97 98 99 00 01 02 03
Fig. 52: Wholesale cocaine prices in Europe and the USA, 1990-2003 (US$/gram)
0
20
40
60
80
100
120
90 91 92 93 94 95 96 97 98 99 00 01 02 03
US$
/gra
m
Europe USA

104
World Drug Report 2004 Volume I. Analysis
The cocaine seizure trend was stable in 2002
Cocaine seizures remained stable in 2002, and weresome 10% less than in 1999, the latest peak year ofglobal cocaine production. After having increased dra-matically, in tandem with cocaine production, in the1980s, cocaine seizures have been stable to declining inrecent years, reflecting the global production trend.
Trafficking remains concentrated in the Americas and,to a lesser extent, in Western Europe
The bulk of cocaine continues to be seized in the Amer-icas. In 2002, 55% of all cocaine seizures were made inSouth America (including Central America and theCaribbean), 32% in North America and 13% in Europe(of which 99% were in Western Europe).
While the trend has been stable/declining in NorthAmerica, increases have been reported from WesternEurope over the last decade
The most striking trend in recent years has been thestrong increase in European cocaine seizures, reflectingunderlying shifts in trafficking. Although Europe'srecord cocaine seizures of 2001 were not repeated in2002, the proportion of cocaine seized in Europe (13%of global seizures in 2002) was substantially higher thanin 1990 (6%) or in 2000 (8%). The increase in traf-ficking went in parallel with rising levels of cocaine usein a number of West European countries. Traffickersappear to turning away from the saturated and high-riskNorth American market to the lucrative, and possiblyless risky, West European market.
2.2.2. Trafficking
1985 1990 1995 2000 2001 2002
Americas 97.80% 94.00% 92.80% 91.10% 83.00% 87.10%
Europe 2.10% 5.90% 7.00% 8.30% 16.30% 12.70%
Asia 0.09% 0.04% 0.04% 0.03% 0.32% 0.06%
Oceania 0.03% 0.04% 0.11% 0.41% 0.32% 0.03%
Africa 0.00% 0.02% 0.08% 0.12% 0.13% 0.15%
Total 100% 100% 100% 100% 100% 100%
Source: UNODC, Annual Reports Questionnaire Data / DELTA.
0
100
200
300
400
500
80 82 84 86 88 90 92 94 96 98 00 02
met
ric
ton
s
EuropeSouth America ('non-NAFTA')North America ('NAFTA')Trend
Fig. 53: Global cocaine seizures 1980-2002
Source: UNODC, Annual Reports Questionnaire Data / DELTA
Table 7. Distribution of cocaine seizures by region in % (1985-2001)
Fig. 54: Average* cocaine prices in North America andWestern Europe in 2002
Source: UNODC, Annual Reports Questionnaire Data / DELTA.
71
42
82
26
0
40
80
120
160
wholesale retail
US$
per
gra
m
North America**Western Europe***
* Unweighted average of reported prices; error bars indicate minimum
and maximum prices.
** USA and Canada.
*** 21 West European countries.

105
2. Trends Coca / Cocaine market
A comparison of cocaine wholesale and retail prices sug-gests that, from a trafficker's point of view, the Euro-pean market is more attractive than the basically stableUS market. The difference, however, has become lesspronounced over the last few years.
Short-term trends are, however, similar in North Amer-ica and Western Europe…
In both North America and Western Europe cocaineseizures increased in 1999, fell in 2000, increased in2001 and fell again in 2002. The decline in 2002 seemsto have been a consequence of two factors occurring inparallel: an increase in coca eradication and moreenforcement action against cocaine trafficking in thesource countries. The total area under coca cultivationacross the Andean region fell by 18% in 2002. As mostof the eradication took place towards the end of the year,the actual reduction in cocaine manufactured was muchless (-3%). More enforcement in South America, how-ever, led to cocaine seizures rising by more than a fifthin 2002, which, in turn, had an impact on globalcocaine availability. Data collected among US studentsalso suggests that cocaine availability declined by 12%between 2001 and 2003.
… a consequence of strongly rising cocaine seizures inthe source countries in 2002
In the Americas, the relative importance of seizures inthe three source countries (Colombia, Peru and Bolivia)increased significantly in 2002. In 2001 cocaine
(including cocaine base) seizures in the three countriesaccounted for 28% of all cocaine seizures in the Amer-icas; in 2002 this proportion rose to 44%. Seizures inColombia were the largest worldwide, even exceedingthose in the USA in 2002. Some of the seizures wererelated to a large-scale destruction of cocaine manufac-turing capabilities. Colombia dismantled 1,273 cocabase, 23 cocaine paste and 138 cocaine HCL laborato-ries, which is by far the largest number of cocaine labo-ratories destroyed worldwide. As a result of theseevents, seizures declined in the transit countries (notablythe Caribbean, Central America and Mexico) and themain consumer markets of North America (USA andCanada) and Europe.
Fig. 55: Cocaine seizures: North America and WesternEurope
0
20
40
60
80
100
120
140
160
180
91 92 93 94 95 96 97 98 99 00 01 020
10
20
30
40
50
60
70
80
90
North America (left scale)Western Europe (right scale)Trend - Western EuropeTrend - North America
Seiz
ure
s in
No
rth
A
mer
ica
in m
etri
c to
ns
Seizures in
Western
Euro
pe in
m
etric ton
s
Source: UNODC, Annual Reports Questionnaire Data.
Fig. 56: Cocaine seizures in 2001 in the Americas(N = 303 tons)
Other3%
Brazil3%
Ecuador4%
Venezuela5%
Bolivia1% Peru
3% Colombia24%
Central America
5%
Caribbean6%
Mexico10%
United States36%
Source: UNODC, Annual Reports Questionnaire Data / DELTA.
Fig. 57: Cocaine seizures in 2002 in the Americas(N = 316 tons)
United States32%
Mexico4%
Caribbean4%
Central America
4%
Colombia37%
Peru5%Bolivia
2%
Venezuela6%
Brazil 3%
Ecuador2%
Other1%
Source: UNODC, Annual Reports Questionnaire Data / DELTA.

106
World Drug Report 2004 Volume I. Analysis
The main trafficking route continues to run fromColombia to the USA
The world's main cocaine trafficking route runs fromColombia to the USA. The cocaine is smuggledthrough neighbouring countries, the Caribbean (on theso called go-fast boats), Central America, or Mexico.Some of it goes directly to the USA, either by air or byboat to the east or west coast. Venezuela, for instance,reported that 72% of the cocaine it seized in 2002 wasdestined for the USA, 14% for Mexico and the rest forEurope (mainly the Netherlands). Central Americancountries (Guatemala, Honduras) report that 80-85%of their seized cocaine was destined for the USA. TheCaribbean countries report that 60-100% of the cocainetransiting their territories was for the USA. The Mexi-can authorities report that 90% of the cocaine theyseized was meant to go to the USA.
Colombian criminal organizations are still heavilyinvolved in smuggling cocaine from Colombia to theUnited States. These organizations also control much ofthe wholesale-level distribution in the North-East of theUSA. Over the last decade, however, Mexican traffick-ing organizations have taken an increasing portion ofthe market, smuggling the drug from Mexico across theland border and controlling distribution networksthroughout the West and the Mid-West of the USA.The primary entry points for cocaine in the USA are:Miami, Houston and New Orleans for maritime ship-ments and the South-West border states for land ship-ments. Chicago has emerged as one of the keydistribution hubs for Mexican trafficking organizations,while New York remains under the control of Colom-bian organizations.
The situation is different for many of the countriessouth of Colombia. The dismantling of cocaine labora-tories reveals that cocaine-manufacturing capacities existnot only in Colombia, but also in Bolivia, Peru,Argentina, Chile and Venezuela. In Peru and Boliviamost of the cocaine is of domestic origin (100% in Peru,78% in Bolivia, with the remaining 22% of the cocaineseized in Bolivia originating in Peru in 2002). Theauthorities in Chile report that 43% of the cocaine theyseized came from Peru and 28% from Bolivia. InArgentina, 60% of the cocaine is believed to have comefrom Bolivia, 15% from Peru and only 25% from
Colombia in 2002. In Uruguay the proportion ofColombian cocaine is apparently even lower: 70% ofthe cocaine is reported to come from Bolivia, 15% fromPeru and 15% from Colombia.
In contrast, Colombian cocaine dominates the marketsto the east of Colombia. In 2002, Venezuela reportedthat all cocaine seized originated in Colombia. Brazilestimated that about 70% of the cocaine originated inColombia, 20% in Bolivia and 10% in Peru (2000). InSuriname about 60% of the cocaine seized in 2002could be traced back to Colombia, 20% to Venezuelaand 20% to Brazil. Suriname is one of the few countriesin South America where the bulk of the cocaine seizedwas not going to the USA (20%) but to Europe(Netherlands 80%).
Spain and the Netherlands continue to be Europe'smain entry points for cocaine…
Throughout the last decade Spain and the Netherlandsreported the highest cocaine seizures in Europe; bothwere also mentioned as important transshipment pointsby most other European countries. Data for 2001 and2002 confirmed this pattern. From exceptionally highlevels in 2001, cocaine seizures in Spain declined in2002 to levels reported in the second half of the 1990s.In the Netherlands, traditionally the second largestentry point, seizures declined slightly in 2002. Measurestaken since early 2002 reduced the number of cocainecouriers coming into Amsterdam airport. Despite thesedeclines the two countries together accounted for morethan half of all European cocaine seizures in 2002. Sig-nificant increases in cocaine seizures in 2002 werereported from Italy, France, Belgium, Germany and -starting from low levels - the countries of EasternEurope. Italy recorded the third largest cocaine seizuresin Europe in 2002, slightly ahead of France, Belgiumand Portugaln.
… but direct cocaine imports to other countries arerising
Direct overseas imports of cocaine play an importantrole in supplying the European market. South Americangroups are often involved in these shipments. Colom-bia, followed by Peru and Bolivia, are the most fre-quently mentioned source countries. Venezuela, Brazil
n) At the time of writing, these data do not include the UK as the country has not yet reported 2002 seizure data. If it is assumed that seizures remainedroughly stable between 2001 and 2002, the UK's cocaine seizures would be slightly less than those reported by Portugal.

107
2. Trends Coca / Cocaine market
and, to a lesser extent, Ecuador, Suriname, Aruba, theNetherlands Antilles and Jamaica have been mentionedas significant overseas transit countries. Along withSpain (reporting cocaine imports from all three cocaproducing countries) and the Netherlands (oftenobtaining cocaine via Suriname and the NetherlandsAntilles), significant direct imports from South Americain 2002 were also reported from Italy (from Colombiaand Venezuela), France (from Colombia and Peru), Bel-gium (from Colombia) and Germany (from Colombiaand Ecuador). In most cases the role of the South-Amer-ican trafficking groups stops once the cocaine hasentered Europe.
Trafficking across countries within Europe is increasing
Cocaine trafficking across countries within Europe isincreasing. Most of the cocaine seized in Italy transitedSpain or the Netherlands. The cocaine seized in the UKis increasingly transiting Spain and France, followingsome successes in dismantling networks that shipped itdirectly from South America and the Caribbean.French authorities reported that significant amounts ofthe cocaine found on their market usually came throughthe Netherlands; they also found that 44% of thecocaine they seized in 2002 was actually destined for theNetherlands. Belgium reported that only 5% of thecocaine seized was for the local market; 30% was des-tined for the Netherlands and the rest for other EUcountries. Germany reported that significant amountsentered the country via the Netherlands. About two
thirds of the cocaine seized in Germany in 2002, how-ever, was actually destined for Spain, with much of theremainder intended for Italy. Austria reported thatcocaine entered its territory via Germany and via Serbia& Montenegro and that most of it was destined for Italyand the Netherlands.
Prior to their entry into the EU, some of the new acces-sion countries had already been integrated into Pan-European trafficking networks. There have been directshipments of cocaine from South America to thesecountries for re-export to other European countries. Inaddition, the Polish authorities mentioned Turkey as animportant transit country for cocaine found on theirmarket, destined for Germany, the Netherlands and theUK. The Czech Republic reported that its seizedcocaine frequently transited France and the Netherlandswith the final destination being Germany. Hungaryreported imports of cocaine via Austria, the Netherlandsand Spain, for final destinations in Italy.
These trafficking patterns indicate that traffickingroutes within Europe have become highly diversifiedand are now far less predictable than in previous years.Another feature, reported from several countries of con-tinental Europe, has been the increasing importance ofcriminal groups of West African origin in the local dis-tribution of cocaine (and other drugs). In the UKgroups originating in the Caribbean continue to play adominant role.
Fig. 58: Cocaine seizures in Europe in 2001 and 2002
265
615
1,290
2,897
5,575
2,814
2,102
1,809
8,382
33,681
649
382
2,150
3,140
3,589
3,667
4,057
7,968
17,618
0 5,000 10,000 15,000 20,000 25,000 30,000 35,000
Eastern Europe
Other Western Europe
Germany
United Kingdom
Portugal
Belgium
France
Italy
Netherlands
Spain
kilograms
2002
2001
Source: UNODC, Annual Reports Questionnaire Data / DELTA

108
World Drug Report 2004 Volume I. Analysis
Some trafficking to Europe is via Africa
Between 1999 and 2002, there were a number of reportsfrom several African countries, including Nigeria, Togo,Ghana, Gambia, the Republic of South Africa, Zim-babwe, Swaziland, Tanzania, Kenya, and Uganda, thatSouth American cocaine was being transshipped viatheir territory to Europe. The large number of countriesreporting seizures of cocaine in Africa indicates that traf-ficking in cocaine is already widespread. From 1992-2002, 52 African countries reported seizures of cocaine,up from 24 countries over the 1980-1990 period. Thelargest cocaine seizures over the 2000-2002 period werereported from South Africa and Nigeria. While theydeclined in South Africa in recent years, they increasedin Nigeria.
Cocaine trafficking in Asia remains limited
The trafficking of cocaine in Asia is still at a low level(0.1% of global seizures in 2002). The number of Asiancountries reporting cocaine seizures rose, however, froman average of 10 in the 1980s to 15 in the 1990s and 18in 2002. Of all the cocaine seized in Asia in 2002, 70%was in the Near and Middle East, notably Israel, Syriaand Lebanon. Japan and Thailand, followed by HongKong SAR of China, and the Philippines reported thehighest cocaine seizures in East & South-East Asia.There were also few attempts to manufacture cocaine inthe Asia region. Hong Kong SAR of China dismantledtwo cocaine-manufacturing laboratories in 2001 andanother two in 2002. One cocaine-manufacturing lab-oratory was dismantled in Thailand in 2001.
Cocaine seizures declined in Oceania in 2002
Cocaine seizures in Oceania fell by some 90% in 2002(after having grown strongly since 1999), largely reflect-ing declining seizures in Australia, the main cocainemarket in the region. Most of the cocaine in 2002 wasreported to have been shipped to Australia from Peru,sometimes via Argentina. Smaller amounts were shippedto Australia also via the UK and via the USA. Thecocaine market within Australia is largely concentratedin New South-Wales, particularly in Sydney.
Despite the decline, cocaine prices and puritiesremained basically stable over the first two quarters of2002 compared to previous quarters. This suggestseither that cocaine seizures in Oceania only amount to
a small fraction of supply and that changes do not havea measurable impact, or that the fall in seizures wasprompted by a decline in supply and demand, leavingprices unchanged. The analysis of blood test results ofpolice detainees seems to lend some support to thesecond hypothesis, that the cocaine market actuallydeclined in 2002. Results from selected locations ofSydney (Bankstown and Parramatta) show that 18%-20% of police detainees tested positive for cocaine inthe third and fourth quarters of 2001. By the third quar-ter of 2002, this rate had fallen to around 1.5%o. Whatprompted this shift is still not entirely clear.
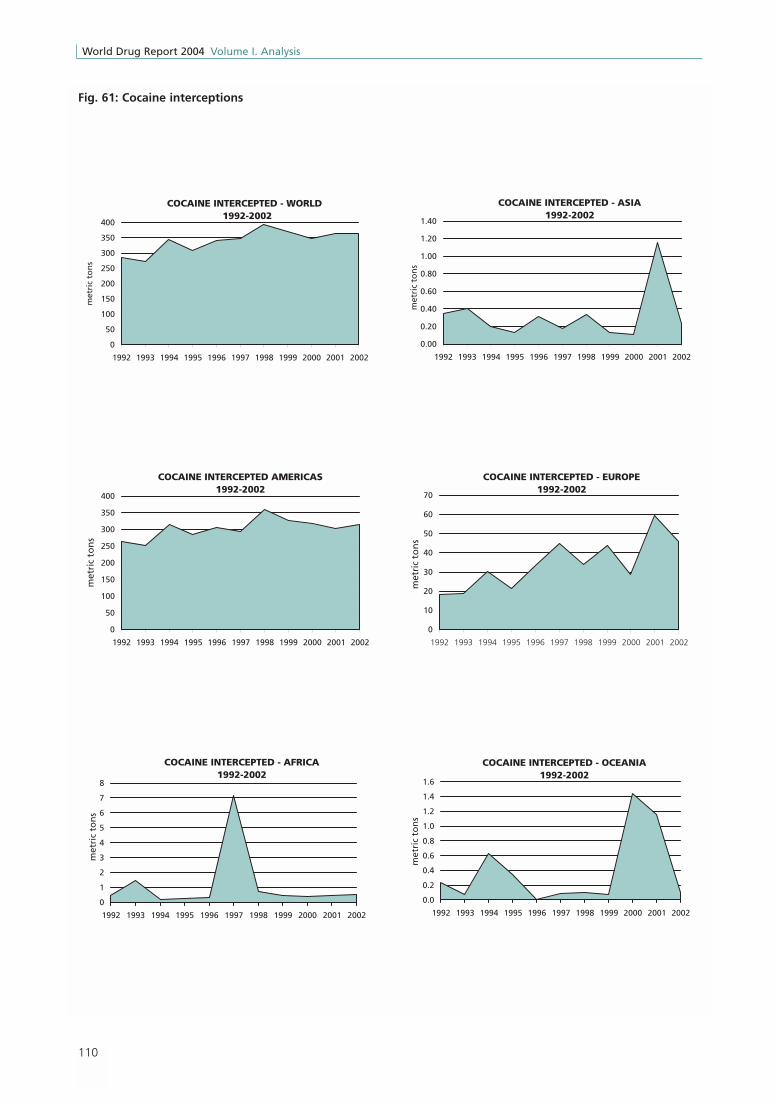
Cocaine interception rates continue rising
Over the last two decades interception rates for cocaineincreased, from 37% of the cocaine produced over the1986-95 period to 45% over the 2001-2002 period.This suggests that law enforcement has become moreeffective.
The absolute level of the calculated interception ratecould be misleading, however, because it implicitlyassumes that cocaine has the same level of purity at theproduction and the seizure stages. This is not the casein reality: cocaine is frequently produced at purity levelsof around 90%, while purity levels found in seizuresfluctuate, on average, around 60%p. Based on theseconsiderations, the purity adjusted interception rate ofcocaine in 2001-2002 is estimated to have been around30%, up from less than 25% over the 1986-95 period.
Fig. 59: Cocaine interception rate
37%41%
45%
30%27%
24%
0%
10%
20%
30%
40%
50%
1986-1995
1996-2000
2001-2002
calculatedinterception rate(cocaine seizures asa proportion ofcocaine production)
interception rateadjusted fordifferences in puritybetween location ofproduction andlocation of seizure
o) Australian Institute of Criminology, Drug Use Monitoring in Australia (DUMA), Drug Use Amongst Police Detainees. p) The US reported that the purity of cocaine found on their market was around 56% at the retail level and 69% at the wholesale level in 2002.
Similarly, the UK Customs and Excise reported that they seized cocaine at purity levels around 70% while the police seized it at average purity levelsof around 50% in 2002.
Source: UNODC, Annual Reports Questionnaire Data / DELTA.

109
2. Trends Coca / Cocaine market
*excluding seizures in liquid form
118,867
101,905
17,790
17,617
14,568
9,215
7,968
5,138
5,103
4,040
3,725
3,653
2,586
2,477
2,455
2,293
12,639
3,589
2,995
3,140
2,927
2,842
- 20,000 40,000 60,000 80,000 100,000 120,000 140,000
Colombia
United States
Venezuela
Spain
Peru
Mexico
Brazil
Netherlands
Ecuador
Bolivia
Italy
Jamaica
France
Belgium
Portugal
Costa Rica
Guatemala
United Kingdom
Panama
Bahamas
Netherlands Antilles
Dominican Republic
3%
44%1
1
33%
28%
5%
(3%)
4%
5%
4%
3%
2%
2
%
175,194
114,723
45,367
12,990
12,870
649
418
18
21
25
51
53
106
163
- 50,000 100,000 150,000 200,000
South America
North America
Western Europe
Caribbean
Central America
Eastern Europe
Southern Africa
Near and Middle East /South-West Asia
Oceania
West and Central Africa
East and South-East Asia
East Africa
North Africa
South Asia
(48%)
(31%)
(13%)
(4%)
(4%)
SEIZURES OF COCAINE* in % of world total and kg- HIGHEST RANKING COUNTRIES - 2002
SEIZURES OF COCAINE (kg and %) - BY REGION - 2002
582496
546622 610
528431
554 531463 437
308 340
347394
371347
364
866
769
891930 950
875825
925879
827
284
363273
345 800
0
200
400
600
800
1,000
1992 1993 1994 1995 1996 1997 1998 1999 2000 2001 2002
Cocaineintercepted- in metric tons- in % of production
Total cocaine production- in metric tons
Cocaineavailable for consumption(potential)- in metric tons
36%
39% 40%
36%
40%
48%
40%
44%45%
33%
33%
Fig. 60: Global illicit supply of cocaine 1992 - 2002
**
**data refer to 2001.
110
World Drug Report 2004 Volume I. Analysis
COCAINE INTERCEPTED - ASIA 1992-2002
0.00
0.20
0.40
0.60
0.80
1.00
1.20
1.40
1992 1993 1994 1995 1996 1997 1998 1999 2000 2001 2002
met
ric
ton
s
COCAINE INTERCEPTED - WORLD 1992-2002
0
50
100
150
200
250
300
350
400
1992 1993 1994 1995 1996 1997 1998 1999 2000 2001 2002
met
ric
ton
s
COCAINE INTERCEPTED AMERICAS 1992-2002
0
50
100
150
200
250
300
350
400
1992 1993 1994 1995 1996 1997 1998 1999 2000 2001 2002
met
ric
ton
s
COCAINE INTERCEPTED - EUROPE 1992-2002
0
10
20
30
40
50
60
70
1992 1993 1994 1995 1996 1997 1998 1999 2000 2001 2002
met
ric
ton
s
COCAINE INTERCEPTED - AFRICA 1992-2002
0
1
2
3
4
5
6
7
8
1992 1993 1994 1995 1996 1997 1998 1999 2000 2001 2002
met
ric
ton
s
COCAINE INTERCEPTED - OCEANIA 1992-2002
0.0
0.2
0.4
0.6
0.8
1.0
1.2
1.4
1.6
1992 1993 1994 1995 1996 1997 1998 1999 2000 2001 2002
met
ric
ton
s
Fig. 61: Cocaine interceptions

111
2. Trends Coca / Cocaine market
0.0
2
Tre
nd
(2
00
1-2
00
2)
De
cre
ase
(>
10
%)
Sta
ble
(+
/- 1
0%
)
Incr
ea
se (
+1
0%
)
Mai
n t
raff
icki
ng
ro
ute
s
Oth
er t
raff
icki
ng
ro
ute
s
Coca
ine
seiz
ures
rep
orte
dto
UN
OD
C (1
998-
2002
)
Bra
zil
Mex
ico
Ven
ezu
ela
Cen
tral
Am
eric
a
Bo
livia
Para
gu
ay
Suri
nam
e
Peru C
hile
Car
ibb
ean
Can
ada
Arg
enti
na
Uru
gu
ay
Ecu
ado
r
Un
ited
Sta
tes
of
Am
eric
a
0.2
Co
lom
bia
11
9
10
6
17
.8
13
12
.9
9.6
0.3
5.1
0.2
0.0
4
1.6
5.1
12
.6
14
.6
Nig
eria
East
ern
Afr
ica
Zam
bia
East
ern
Eu
rop
e (i
ncl
ud
ing
C.I.
S.)
Euro
pea
n U
nio
n/E
FTA
Nea
r &
Mid
dle
Eas
t
Sout
h A
fric
a
Aus
tral
ia
1.1
0.6
0.0
2
0.0
4
0.2
0.0
1
0.0
3
Thai
land
0.1
0.4
2.3
45
Japa
n
5V
olu
me
inm
etri
c to
ns
Map
11:
Co
cain
e* s
eiz
ure
s 2001 -
2002:
exte
nt
an
d t
ren
ds
(co
un
trie
s re
po
rtin
g s
eizu
res
of
mo
re t
han
0.0
1 to
ns
(10k
g.)
)
* C
ocai
ne s
eizu
res
pres
ente
d in
thi
s m
ap d
o no
t in
clud
e se
izur
es in
liqu
id f
orm
.
Not
e: R
oute
s sh
own
are
not
nece
ssar
ily d
ocum
ente
d ac
tual
rou
tes,
but
are
rat
her
gene
ral i
ndic
atio
ns o
f th
e di
rect
ions
of
illic
it dr
ug f
low
s.

112
World Drug Report 2004 Volume I. Analysis
2.2.3.1. Extent
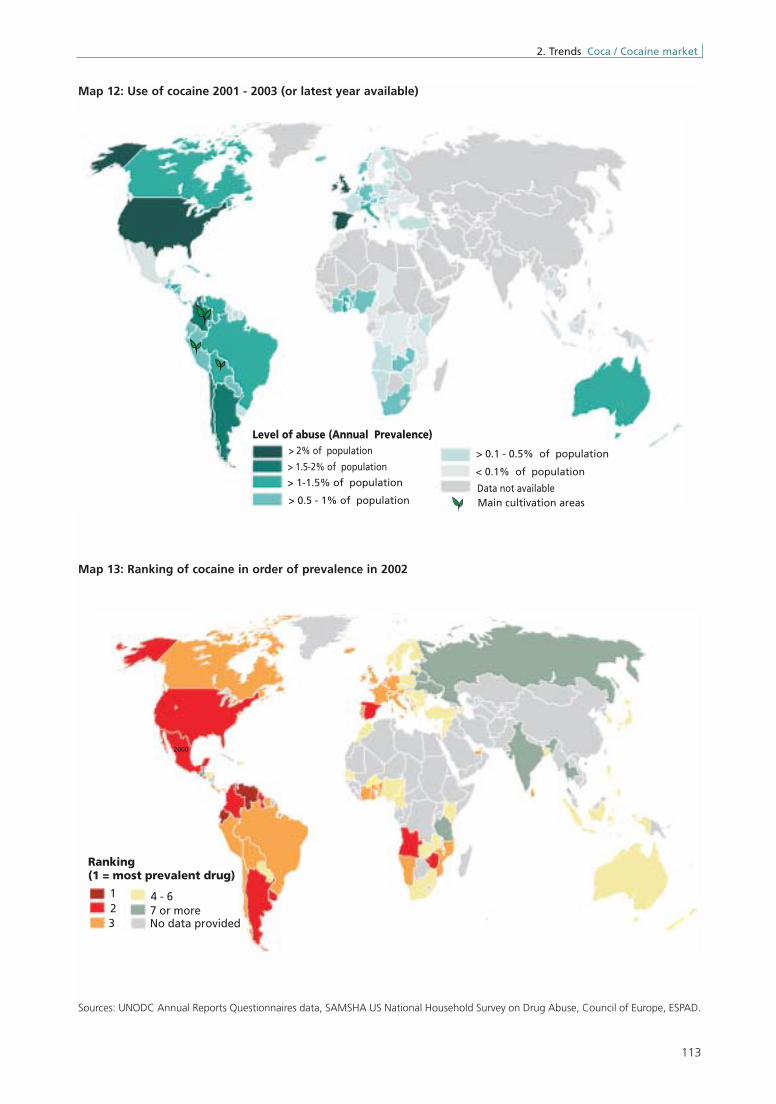
Cocaine is the second most common problem drug inthe world and the main problem drug in the Americas.In several countries of Western Europe, it is the secondor third most common problem drug.
Cocaine consumption is estimated to affect more than13 million people or 0.3% of the population age 15-64.Most cocaine continues to be consumed in the Ameri-cas (65%), notably in North America (48%). The over-all prevalence rate of cocaine use in the Americas is1.6%. The single largest cocaine market in the worldcontinues to be the USA (5.9 million people in 2002,equivalent to 2.5% of the population age 12 and aboveor 3.1% of the population age 15-64). Cocaine use inthe countries of South America (including CentralAmerica and the Caribbean) affects 2.3 million peopleor 0.8% of the population age 15-64. Above averagelevels of cocaine use are found in Argentina, Chile,Colombia, Bolivia, Venezuela, Panama, Guatemala,Jamaica, the Dominican Republic and some other coun-tries of Central America and the Caribbean.
The 3.3 million cocaine users in Europe account forabout a quarter of global cocaine use (0.6% of the pop-ulation age 15-64). More than 90% of Europe's cocaineusers are in Western Europe (1% of the population age15-64). The highest cocaine prevalence rates in Europe
(age 15-64) have been reported from Spain (2.6% in2001), Ireland (2.4% in 2002), the UK (2.1% in2003) and the Netherlands (1.1% in 2001).
In Oceania the level of cocaine use is 1.1% of the pop-ulation age 15-64. Most cocaine use in this region takesplace in Australia (1.5% of the population 15-64 in2001).
In all other regions, cocaine use is below the global aver-age of 0.3%. The lowest level of cocaine use is in Asia.Cocaine use in Africa is largely linked to spill-overs ofcocaine being shipped from South America via Africa toEurope. Concentrations can be identified in SouthAfrica and in some countries of Western Africa.
Importance of cocaine use compared to other drugsMost countries in the Americas see cocaine as thesecond or third most widely used illicit substance intheir territories. In most countries of Western Europe,cocaine is the third most widely consumed drug aftercannabis and the ATS. Cocaine is of less importance inthe Nordic countries and in most of the new EUmember states or candidate countries where it ranks 4thto 6th. In the C.I.S. countries, including the RussianFederation, it is of less importance. The same appliesto a number of Asian countries. In Western and South-ern African countries, in contrast, its relative impor-tance is significantly higher.
2.2.3. Abuse
Number of people in % of population(in million) age 15 - 64
AMERICAS 8.70 1.57
- North America 6.38 2.30
- South America 2.32 0.84
OCEANIA 0.21 1.05
EUROPE 3.34 0.62
- West Europe 3.11 1.01
- East Europe 0.23 0.10
AFRICA 0.94 0.21
ASIA 0.15 0.01
GLOBAL 13.34 0.34
Cocaine abuse above global average Cocaine abuse below global average
Table 8: Annual prevalence estimates of cocaine use: 2001-2003
Sources: UNODC, Annual Reports Questionnaire data, various Govt. reports, reports of regional bodies, UNODC estimates.
113
2. Trends Coca / Cocaine market
> 1-1.5% of population
> 0.5 - 1% of population
> 0.1 - 0.5% of population
Main cultivation areas
< 0.1% of population
Level of abuse (Annual Prevalence)
> 1.5-2% of population
> 2% of population
Data not available
Map 12: Use of cocaine 2001 - 2003 (or latest year available)
Map 13: Ranking of cocaine in order of prevalence in 2002
(1993)
21
Ranking(1 = most prevalent drug)
7 or more4 - 6
3
1998
1998
2000
No data provided
2000
Sources: UNODC Annual Reports Questionnaires data, SAMSHA US National Household Survey on Drug Abuse, Council of Europe, ESPAD.

114
World Drug Report 2004 Volume I. Analysis
2.2.1.2. Trends
Spread of cocaine expansion loses momentum
Throughout the 1990s and in subsequent years therehave been more countries reporting increases in cocaineuse than countries reporting declines. The spread of thecocaine expansion, however, is loosing momentum. In2002, there was a decline in the number of countriesreporting increases (from 49 to 42) and an increase inthe number of countries reporting falling levels ofcocaine use (from 6 to 13). While in 2001 57% thecountries reporting cocaine consumption trends saw anincrease, this proportion declined to 46% in 2002. Inother words, more than half of all countries (54%) sawcocaine use levels stabilize or decline in 2002.
AMERICAS
Largely stable in North America
In terms of regional patterns, the use of cocaine appearsto have been basically stable in North America. Theannual prevalence of cocaine use in the USA was 2.5%of the population age 12 and above in 2002. Cocaineuse is rather evenly spread across the USA, with thehighest levels found in the state of New Mexico, someof the neighbouring states and a few states on the Eastcoast. Cocaine use remains primarily an urban phe-nomenon (2.5%-2.9% versus 1.4% in rural areas).Local concentrations -- as reflected in cocaine relatedemergency room visits (2002) -- are found in Chicago,Philadelphia, Baltimore, Miami, Atlanta, Newark,Detroit, Buffalo and New York.
Given changes in the methodology, the results of the2002 survey are not directly comparable with previoushousehold surveys. The results (5.9 million people usingcocaine, equivalent to 3.1% of the population age 15-64) are, however, in line with previous estimates of theoverall (chronic and occasional) cocaine abusing popu-lation in the USA produced by the Office of NationalDrug Control Policy (3.1% of the population age 15-64in 2000, down from 4.8% in 1990 and 6% in 1988).
The Monitoring the Future study, conducted amongUS high school students, found a marginal increase inthe annual prevalence rate of 12th graders in 2002 anda marginal decline in 2003. The prevalence rate ofcocaine use amounted to 4.8% in 2003 and was thusmore than 20% lower than in 1999 (6.2%) and morethan 60% lower than in 1985 (13.1%).
Fig. 62: Cocaine consumption trends, 1993 - 2002 Number of countries reporting increase lessnumber of countries reporting declining levels ofcocaine use
0
10
20
30
40
50
93 94 95 96 97 98 99 00 01 02
Nu
mb
er o
f co
un
trie
s
Number of countries reporting increases lessnumber of countries reporting declinesTrend
Source: UNODC, Annual Reports Questionnaire Data
Fig. 63: Cocaine consumption trends in 2001(n =65)
large increase
12%
some increase
45%stable36%
some decline
5%
large decline
2%
Source: UNODC, Annual Reports Questionnaire Data
Fig. 64: Cocaine consumption trends in 2002(n =74)
large increase
8%
large decline
5%
some decline
9%
stable40%
some increase
38%
Source: UNODC, Annual Reports Questionnaire Data

115
2. Trends Coca / Cocaine market
Canada reported a stabilization of cocaine use in 2002.Trends observed in 2003 show a more complex pattern.Student surveys undertaken in Canada's largestprovince of Ontario (which accounts for 38% ofCanada's total population) found a stabilization ofcocaine use among 11th graders in 2003, a decline
among 8th and 10th graders, but increasing levelsamong 7th, 9th and 12th graders. The net result ofthese opposing trends was an increase. Cocaine useamong high-school students in Ontario is now back tothe levels observed in the late 1970s. Prevalence rates ofcocaine use among high-school students in Ontario are
Fig. 65: Cocaine use in the USA: 1985-2003 annual prevalence rates among the general population, age 12 yearsand above, and among high-school students (12th graders)
2.6%
4.4%
5.1%
1.9% 2.5%
6.2%
5.0%5.0%
4.8%
3.1%
13.1%
4.8%
0%
1%
2%
3%
4%
5%
6%
7%
85 86 87 88 89 90 91 92 93 94 95 96 97 98 99 00 01 02 03
an
nu
al p
reva
len
ce in
gen
eral
po
pu
lati
on
0%
2%
4%
6%
8%
10%
12%
14%
ann
ual
pre
vale
nce
am
on
g 1
2th
gra
der
s
general population (1985-2001) general population 2002* 12th graders
* Given changes in the methodology used, general household survey data for 2002 are not comparable with resultsprevious surveys conducted in previous years.
Sources: SAMHSA, Results from the 2002 National Survey on Drug Use and Health and previous National Househould Surveys on DrugAbuse; NIDA, Monitoring the Future, 2002 and previous years.
Fig. 66: Cocaine use among high-school students in Canada (Ontario) and in the USA
0
2
4
6
8
10
12
14
ann
ual
pre
vale
nce
in
%
Ontario: 7,9,11th grades USA: 8,10,12th grades
Ontario:11th grade USA: 12th grades
Ontario: 7,9,11th grades 5.3 4.6 4.0 4.0 3.4 2.4 1.7 1.5 2.5 2.7 3.7 4.0 5.1
USA: 8,10,12th grades 2.3 2.4 3.4 4.3 4.6 3.6 3.4
Ontario:11th grade 6.0 5.4 5.0 5.2 4.6 4.5 2.8 2.5 3.5 4.3 5.4 7.0 6.9
USA: 12th grades 12.0 12.4 11.4 13.1 10.3 6.5 3.5 3.3 4.0 5.5 6.2 4.8 4.8
79 81 83 85 87 89 91 93 95 97 99 01 03
Sources: Centre for Addiction and Mental Health, Drug Use Among Ontario Students, 2003 and NIDA, Monitoring the Future 2003.
116
World Drug Report 2004 Volume I. Analysis
now higher than in the USA, reversing the previous pat-tern which, until 1999, had shown higher levels ofcocaine use among US high school students.
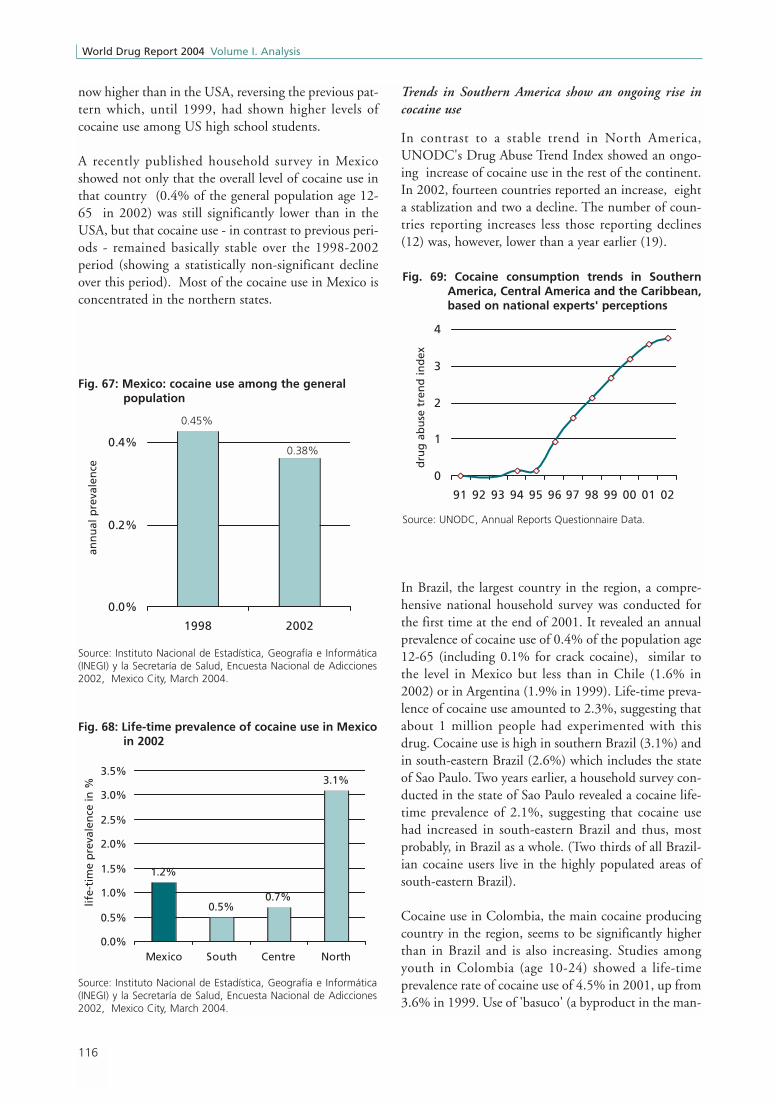
A recently published household survey in Mexicoshowed not only that the overall level of cocaine use inthat country (0.4% of the general population age 12-65 in 2002) was still significantly lower than in theUSA, but that cocaine use - in contrast to previous peri-ods - remained basically stable over the 1998-2002period (showing a statistically non-significant declineover this period). Most of the cocaine use in Mexico isconcentrated in the northern states.
Trends in Southern America show an ongoing rise incocaine use
In contrast to a stable trend in North America,UNODC's Drug Abuse Trend Index showed an ongo-ing increase of cocaine use in the rest of the continent.In 2002, fourteen countries reported an increase, eighta stablization and two a decline. The number of coun-tries reporting increases less those reporting declines(12) was, however, lower than a year earlier (19).
In Brazil, the largest country in the region, a compre-hensive national household survey was conducted forthe first time at the end of 2001. It revealed an annualprevalence of cocaine use of 0.4% of the population age12-65 (including 0.1% for crack cocaine), similar tothe level in Mexico but less than in Chile (1.6% in2002) or in Argentina (1.9% in 1999). Life-time preva-lence of cocaine use amounted to 2.3%, suggesting thatabout 1 million people had experimented with thisdrug. Cocaine use is high in southern Brazil (3.1%) andin south-eastern Brazil (2.6%) which includes the stateof Sao Paulo. Two years earlier, a household survey con-ducted in the state of Sao Paulo revealed a cocaine life-time prevalence of 2.1%, suggesting that cocaine usehad increased in south-eastern Brazil and thus, mostprobably, in Brazil as a whole. (Two thirds of all Brazil-ian cocaine users live in the highly populated areas ofsouth-eastern Brazil).
Cocaine use in Colombia, the main cocaine producingcountry in the region, seems to be significantly higherthan in Brazil and is also increasing. Studies amongyouth in Colombia (age 10-24) showed a life-timeprevalence rate of cocaine use of 4.5% in 2001, up from3.6% in 1999. Use of 'basuco' (a byproduct in the man-
Source: Instituto Nacional de Estadística, Geografía e Informática(INEGI) y la Secretaría de Salud, Encuesta Nacional de Adicciones2002, Mexico City, March 2004.
0.45%
0.38%
0.0%
0.2%
0.4%
1998 2002
ann
ual
pre
vale
nce
Fig. 67: Mexico: cocaine use among the generalpopulation
Source: Instituto Nacional de Estadística, Geografía e Informática(INEGI) y la Secretaría de Salud, Encuesta Nacional de Adicciones2002, Mexico City, March 2004.
1.2%
0.5%0.7%
3.1%
0.0%
0.5%
1.0%
1.5%
2.0%
2.5%
3.0%
3.5%
Mexico South Centre North
life-
tim
e p
reva
len
ce in
%
Fig. 68: Life-time prevalence of cocaine use in Mexicoin 2002
Fig. 69: Cocaine consumption trends in SouthernAmerica, Central America and the Caribbean,based on national experts' perceptions
0
1
2
3
4
91 92 93 94 95 96 97 98 99 00 01 02
dru
g a
bu
se t
ren
d in
dex
Source: UNODC, Annual Reports Questionnaire Data.

117
2. Trends Coca / Cocaine market
ufacture of cocaine), however, declined. For 2002, theColombian authorities reported a further rise in cocaineuse, of both powder cocaine and crack-cocaine. Whiletreatment demand, in general (including for basuco)remained stable, cocaine-related treatment demand con-tinued to rise in Colombia in 2002.
Increases in cocaine use in 2002 were also reported fromneighbouring Venezuela and Panama as well as from
Argentina, Paraguay and in the Caribbean region fromHaiti and the Dominican Republic.
There are, however, also some positive trends. Cocaineuse in Chile - after having grown strongly in previousyears - stabilized at less than 1.6% of the general popu-lation (age 12-64) between 2000 and 2002. Use of cocapaste declined. This stabilization appears to be the resultof increased demand reduction efforts and is probablyassociated with the lower levels of coca production inPeru and Bolivia as compared to the late 1990s.
Fig. 70: Brazil, life-time prevalence of cocaine useamong the general population (age 12-65) in2001
2.3%
0.8%
1.4% 1.4%
2.6%
3.6%
0.0%
0.5%
1.0%
1.5%
2.0%
2.5%
3.0%
3.5%
Brazil
North
North-e
ast
Centra
l-wes
t
South
-Eas
t
South
life-
tim
e p
reva
len
ce in
%
Fig. 72: Brazil, cocaine consumption trends, 1987-2001
Sources: CEBRID, I Levantamento Domicilia Sobre O Uso de Drogas Psicotrópicas no Brasil 2001 and CEBRID, I Levantamento domiciliarNacional Sobre O Uso de Drogas Psicotrópicas - Estudo envolvendo as 24 Maiores Cidades do Estado de São Paulo 1999, CEBRID, IVLevantamento Sobre O Uso de Drogas entre Estudantes de 1e 2e graus em 10 Capitais Brasileiras, 1997.
2.1%
2.6%
0.7%
1.2%
2.0%
0.5%
0%
1%
2%
3%
87 89 93 97 99 01
life
-tim
e p
reva
len
ce in
%
General population surveys (age 12-65); Stateof Sau Paulo (1999) / South-East Brazil (2001)
National school surveys (age 10-19) in statecapital cities
Fig. 71: Colombia: cocaine use among youth (age 10-24)
3.6%
2.1%
1.2%
4.5%
0%
1%
2%
3%
4%
5%
Cocaine Basuco
life-
tim
e p
reva
len
ce in
%
1999 2001
Sources: Programa Presidencial Rumbos, Sondeo Nacional delConsumo de Drogas en Jovenes, 1999-2000 and ProgramaPresidencial Rumbos, Encuesta Nacional sobre consumo desustancias psicoactivas en jóvenes de 10 a 24 años el 2001.
Fig. 73: Chile: Annual prevalence of cocaine and cocapaste use in the general population (age 12-64), 1984-2002
0.87%
1.33%
1.52% 1.57%
0.85%
0.63%
0.84%0.73%
0.51%
0.84%
0.0%
0.5%
1.0%
1.5%
2.0%
1994 1996 1998 2000 2002
ann
ual
pre
vale
nce
Cocaine Coca pasteSource: CONACE, Estudio Nacional de Drogas en la PoblaciónNacional de Chile, 2002.

118
World Drug Report 2004 Volume I. Analysis
Similarly, cocaine consumption stabilized in Peru overthe 1998-2002/2003 period and is now lower than in1997. Use of coca paste ('pasta basica'), an intermediateproduct in the manufacture of cocaine, declined signif-icantly over the 1998-2002/2003 period. Annual preva-lence of cocaine use affected 0.7% of the population age12-64 in 2002/03. This is a higher percentage than inBrazil (0.4% in 2001) but less than in neighbouringBolivia (1.1% of the urban population age 12 andabove in 2000) or in neighbouring Chile (1.6% of thepopulation age 12-64 in 2002). Annual prevalence ofthe use of coca paste in Peru fell to 0.7% of the generalpopulation in Peru in 2002/03 and is now less than inBolivia (1.1%) but still more than in Brazil (less than0.1%) or in Chile (0.5%).
Studies in Bolivia also showed that, following strongincreases during the 1990s, a stabilization of cocaine usetook place over the 1998-2000 period, i.e. at the timewhen coca production in the country declined. Unfor-tunately, no new epidemiological surveys have beenundertaken which would reveal whether the stabiliza-tion continued in subsequent years.
Cocaine use continues to rise in Europe, though at alower pace than in previous years
UNODC's Drug Abuse Index showed a strong rise ofcocaine use over the last decade. The overall increase inthe 1990s appears to have been similar to that observedin South America (incl. Caribbean and Central Amer-ica). Over the last two years, however, signs of stabiliza-tion have occurred. While in 2000 the number ofEuropean countries reporting increases less those report-ing stable or declining trends was 5, this number fell to1 in 2001 and to -4 in 2002.
This positive development, however, has been partiallyoffset by the emergence of crack-cocaine, a particularlydangerous form of cocaine (often associated with vio-lence and crime) in several European markets over thelast few years. Out of 29 European countries reportingon cocaine, 16 countries had already provided informa-tion on trends in abuse of crack-cocaine in 2002 (twothirds of these were located in Western Europe). Sevencountries saw an increase in crack-cocaine use, 7 coun-tries reported no great change and 2 saw a decline.Crack cocaine is still concentrated in a few locations inEurope, but there is a risk that, once established in localmarkets, it could spread across the continent.
The general upward trend in the use of cocaine over thelast decade in Europe is well documented in a number
Fig. 74: Peru: Cocaine use among the urbanpopulation, age 12-50, 1995-2001
Fig. 75: Peru: Cocaine use among the generalpopulation, age 12-64, 1998-2002/03
Source: CEDRO, Epidemiologia de Drogas en la Población UrbanaPerruana 2001.
1.7% 1.8%
3.9%
2.1%
0%
1%
2%
3%
4%
1998 2002/2003
Cocaine Pasta basica
Fig. 76: Cocaine consumption trend in Europe (basedon national experts' perceptions)
0
1
2
3
4
5
91 92 93 94 95 96 97 98 99 00 01 02
dru
g a
bu
se t
ren
d in
dex
Source: UNODC, Annual Reports Questionnaire Data.
1.9%
3.5%
2.0%
0.0%
1.0%
2.0%
3.0%
4.0%
1995 1997 2001
Cocaine Trend
Source: DEVIDA/INEI/UNODC, II Encuesta Nacional sobrePrevención y Consumo de Drogas 2002, Peru 2003.
119
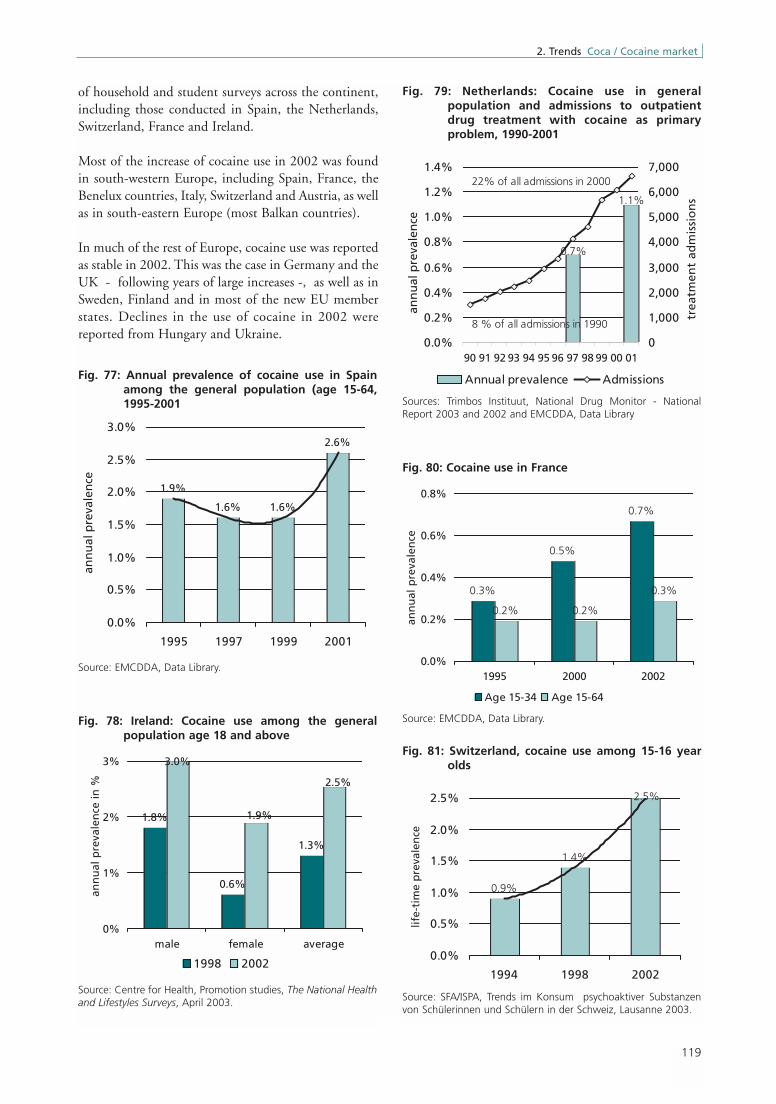
2. Trends Coca / Cocaine market
of household and student surveys across the continent,including those conducted in Spain, the Netherlands,Switzerland, France and Ireland.
Most of the increase of cocaine use in 2002 was foundin south-western Europe, including Spain, France, theBenelux countries, Italy, Switzerland and Austria, as wellas in south-eastern Europe (most Balkan countries).
In much of the rest of Europe, cocaine use was reportedas stable in 2002. This was the case in Germany and theUK - following years of large increases -, as well as inSweden, Finland and in most of the new EU memberstates. Declines in the use of cocaine in 2002 werereported from Hungary and Ukraine.
Fig. 77: Annual prevalence of cocaine use in Spainamong the general population (age 15-64,1995-2001
1.9%
1.6% 1.6%
2.6%
0.0%
0.5%
1.0%
1.5%
2.0%
2.5%
3.0%
1995 1997 1999 2001
ann
ual
pre
vale
nce
Source: EMCDDA, Data Library.
Fig. 78: Ireland: Cocaine use among the generalpopulation age 18 and above
Source: Centre for Health, Promotion studies, The National Healthand Lifestyles Surveys, April 2003.
Fig. 79: Netherlands: Cocaine use in generalpopulation and admissions to outpatientdrug treatment with cocaine as primaryproblem, 1990-2001
1.1%
0.7%
0.0%
0.2%
0.4%
0.6%
0.8%
1.0%
1.2%
1.4%
90 91 92 93 94 95 96 97 98 99 00 01
trea
tmen
t ad
mis
sio
ns
0
1,000
2,000
3,000
4,000
5,000
6,000
7,000
ann
ual
pre
vale
nce
Annual prevalence Admissions
8 % of all admissions in 1990
22% of all admissions in 2000
Source: EMCDDA, Data Library.
Fig. 80: Cocaine use in France
Sources: Trimbos Instituut, National Drug Monitor - NationalReport 2003 and 2002 and EMCDDA, Data Library
Fig. 81: Switzerland, cocaine use among 15-16 yearolds
0.9%
1.4%
2.5%
0.0%
0.5%
1.0%
1.5%
2.0%
2.5%
1994 1998 2002
life-
tim
e p
reva
len
ce
Source: SFA/ISPA, Trends im Konsum psychoaktiver Substanzenvon Schülerinnen und Schülern in der Schweiz, Lausanne 2003.
1.8%
0.6%
1.3%
3.0%
1.9%
2.5%
0%
1%
2%
3%
male female average
ann
ual
pre
vale
nce
in %
1998 2002
0.3%
0.5%
0.7%
0.2% 0.2%
0.3%
0.0%
0.2%
0.4%
0.6%
0.8%
1995 2000 2002
ann
ual
pre
vale
nce
Age 15-34 Age 15-64
120
World Drug Report 2004 Volume I. Analysis
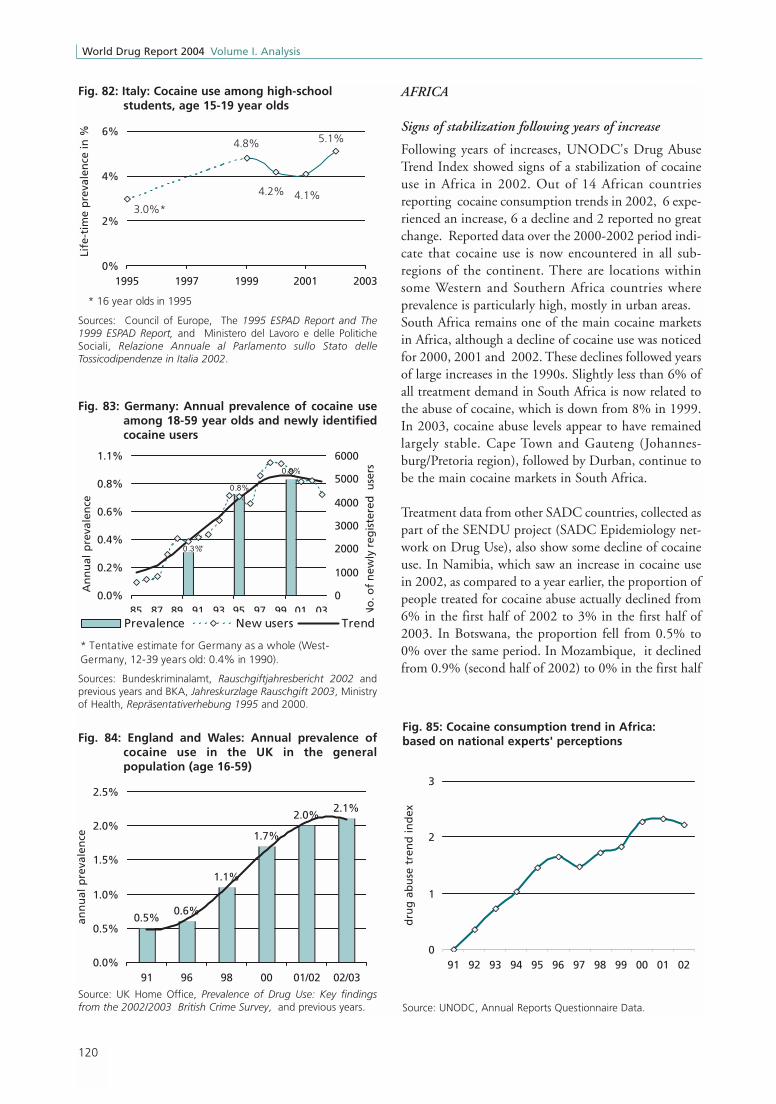
AFRICA
Signs of stabilization following years of increase
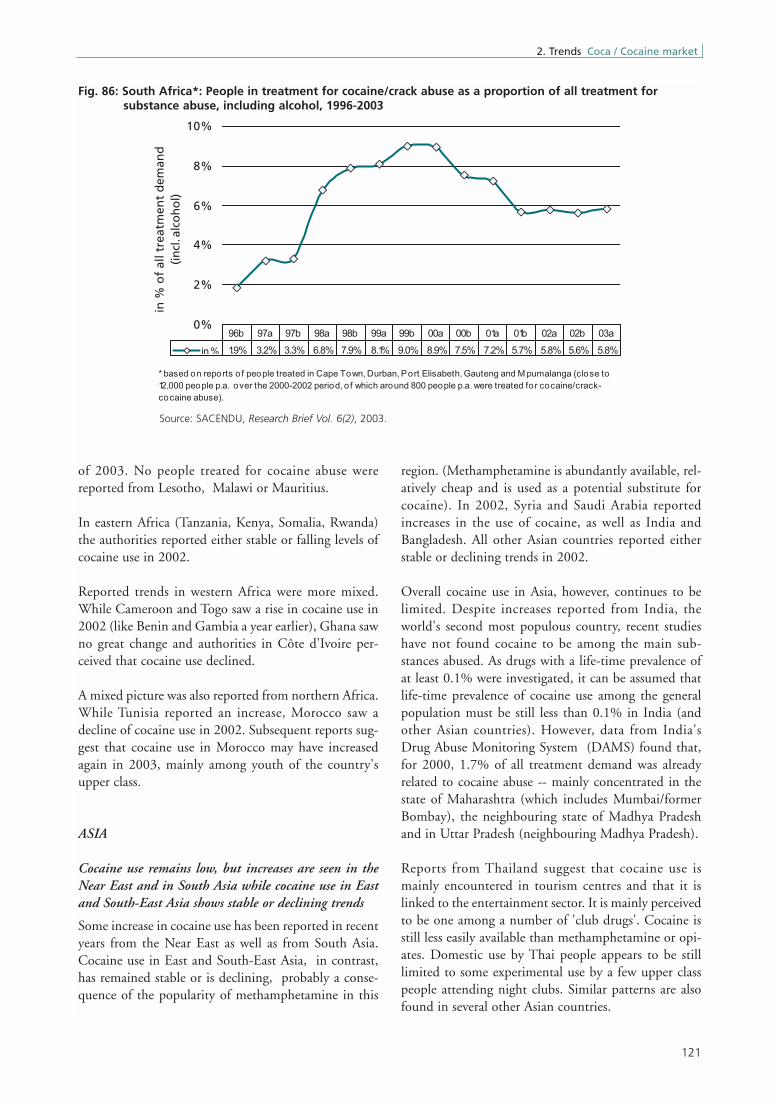
Following years of increases, UNODC's Drug AbuseTrend Index showed signs of a stabilization of cocaineuse in Africa in 2002. Out of 14 African countriesreporting cocaine consumption trends in 2002, 6 expe-rienced an increase, 6 a decline and 2 reported no greatchange. Reported data over the 2000-2002 period indi-cate that cocaine use is now encountered in all sub-regions of the continent. There are locations withinsome Western and Southern Africa countries whereprevalence is particularly high, mostly in urban areas. South Africa remains one of the main cocaine marketsin Africa, although a decline of cocaine use was noticedfor 2000, 2001 and 2002. These declines followed yearsof large increases in the 1990s. Slightly less than 6% ofall treatment demand in South Africa is now related tothe abuse of cocaine, which is down from 8% in 1999.In 2003, cocaine abuse levels appear to have remainedlargely stable. Cape Town and Gauteng (Johannes-burg/Pretoria region), followed by Durban, continue tobe the main cocaine markets in South Africa.
Treatment data from other SADC countries, collected aspart of the SENDU project (SADC Epidemiology net-work on Drug Use), also show some decline of cocaineuse. In Namibia, which saw an increase in cocaine usein 2002, as compared to a year earlier, the proportion ofpeople treated for cocaine abuse actually declined from6% in the first half of 2002 to 3% in the first half of2003. In Botswana, the proportion fell from 0.5% to0% over the same period. In Mozambique, it declinedfrom 0.9% (second half of 2002) to 0% in the first half
Fig. 82: Italy: Cocaine use among high-schoolstudents, age 15-19 year olds
4.1%4.2%
5.1%4.8%
3.0%*
0%
2%
4%
6%
1995 1997 1999 2001 2003
Life
-tim
e p
reva
len
ce in
%
* 16 year olds in 1995
Sources: Council of Europe, The 1995 ESPAD Report and The1999 ESPAD Report, and Ministero del Lavoro e delle PoliticheSociali, Relazione Annuale al Parlamento sullo Stato delleTossicodipendenze in Italia 2002.
Fig. 83: Germany: Annual prevalence of cocaine useamong 18-59 year olds and newly identifiedcocaine users
0.8%
0.9%
0.3%*
0.0%
0.2%
0.4%
0.6%
0.8%
1.1%
85 87 89 91 93 95 97 99 01 03
An
nu
al p
reva
len
ce
0
1000
2000
3000
4000
5000
6000
No
. of
new
ly r
egis
tere
d u
sers
Prevalence New users Trend
* Tentative estimate for Germany as a whole (West-Germany, 12-39 years old: 0.4% in 1990).
Sources: Bundeskriminalamt, Rauschgiftjahresbericht 2002 andprevious years and BKA, Jahreskurzlage Rauschgift 2003, Ministryof Health, Repräsentativerhebung 1995 and 2000.
Fig. 84: England and Wales: Annual prevalence ofcocaine use in the UK in the generalpopulation (age 16-59)
0.5%0.6%
1.1%
1.7%
2.0%2.1%
0.0%
0.5%
1.0%
1.5%
2.0%
2.5%
91 96 98 00 01/02 02/03
ann
ual
pre
vale
nce
Source: UK Home Office, Prevalence of Drug Use: Key findingsfrom the 2002/2003 British Crime Survey, and previous years.
Fig. 85: Cocaine consumption trend in Africa: based on national experts' perceptions
0
1
2
3
91 92 93 94 95 96 97 98 99 00 01 02
dru
g a
bu
se t
ren
d in
dex
Source: UNODC, Annual Reports Questionnaire Data.
121
2. Trends Coca / Cocaine market
of 2003. No people treated for cocaine abuse werereported from Lesotho, Malawi or Mauritius.
In eastern Africa (Tanzania, Kenya, Somalia, Rwanda)the authorities reported either stable or falling levels ofcocaine use in 2002.
Reported trends in western Africa were more mixed.While Cameroon and Togo saw a rise in cocaine use in2002 (like Benin and Gambia a year earlier), Ghana sawno great change and authorities in Côte d'Ivoire per-ceived that cocaine use declined.
A mixed picture was also reported from northern Africa.While Tunisia reported an increase, Morocco saw adecline of cocaine use in 2002. Subsequent reports sug-gest that cocaine use in Morocco may have increasedagain in 2003, mainly among youth of the country'supper class.
ASIA
Cocaine use remains low, but increases are seen in theNear East and in South Asia while cocaine use in Eastand South-East Asia shows stable or declining trends
Some increase in cocaine use has been reported in recentyears from the Near East as well as from South Asia.Cocaine use in East and South-East Asia, in contrast,has remained stable or is declining, probably a conse-quence of the popularity of methamphetamine in this
region. (Methamphetamine is abundantly available, rel-atively cheap and is used as a potential substitute forcocaine). In 2002, Syria and Saudi Arabia reportedincreases in the use of cocaine, as well as India andBangladesh. All other Asian countries reported eitherstable or declining trends in 2002.
Overall cocaine use in Asia, however, continues to belimited. Despite increases reported from India, theworld's second most populous country, recent studieshave not found cocaine to be among the main sub-stances abused. As drugs with a life-time prevalence ofat least 0.1% were investigated, it can be assumed thatlife-time prevalence of cocaine use among the generalpopulation must be still less than 0.1% in India (andother Asian countries). However, data from India'sDrug Abuse Monitoring System (DAMS) found that,for 2000, 1.7% of all treatment demand was alreadyrelated to cocaine abuse -- mainly concentrated in thestate of Maharashtra (which includes Mumbai/formerBombay), the neighbouring state of Madhya Pradeshand in Uttar Pradesh (neighbouring Madhya Pradesh).
Reports from Thailand suggest that cocaine use ismainly encountered in tourism centres and that it islinked to the entertainment sector. It is mainly perceivedto be one among a number of 'club drugs'. Cocaine isstill less easily available than methamphetamine or opi-ates. Domestic use by Thai people appears to be stilllimited to some experimental use by a few upper classpeople attending night clubs. Similar patterns are alsofound in several other Asian countries.
Fig. 86: South Africa*: People in treatment for cocaine/crack abuse as a proportion of all treatment forsubstance abuse, including alcohol, 1996-2003
0%
2%
4%
6%
8%
10%
in %
of
all t
reat
men
t d
eman
d
(incl
. alc
oh
ol)
in % 1.9% 3.2% 3.3% 6.8% 7.9% 8.1% 9.0% 8.9% 7.5% 7.2% 5.7% 5.8% 5.6% 5.8%
96b 97a 97b 98a 98b 99a 99b 00a 00b 01a 01b 02a 02b 03a
* based on reports o f people treated in Cape Town, Durban, Port Elisabeth, Gauteng and M pumalanga (close to
12,000 people p.a. over the 2000-2002 period, o f which around 800 people p.a. were treated for cocaine/crack-
cocaine abuse).
Source: SACENDU, Research Brief Vol. 6(2), 2003.

122
World Drug Report 2004 Volume I. Analysis
OCEANIA
After massive increases in the 1990s cocaine use has sta-bilized in recent years
Cocaine use in Oceania is mainly concentrated in Aus-tralia and, within Australia, in New South Wales(notably in Sydney). Household survey data showedalmost a tripling in the number of cocaine users between
1993 and 1998, followed by a marginal decline ofcocaine use over the 1998 to 2001 period (from 1.4%to 1.3% of the general population age 14 and above).
Following a temporary rise in 2001, cocaine consump-tion fell back to the levels seen in 2000
Trends for 2001 and 2002 can be deduced from otherindicators. They all show an increase in cocaine use in2001, mainly reflecting the heroin drought of 2001 andthus some shifts into cocaine (and methamphetamine),followed by a decline in 2002. The Drug Use Monitor-ing in Australia (DUMA) data, for instance, revealedthat the proportion of male police detainees testing pos-itive for cocaine in four sites across Australia(Bankstown, Parramatta, South Port and East Perth)increased from, on average, 2.4% in 2000 to 6.6% in2001, but declined again to 3.1% in 2002. Based oninterviews among injecting drug users (IDUs), the IllicitDrug Reporting System (IDRS), found that the pro-portion of IDUs taking cocaine rose from 24% in 2000to 35% in 2001, but fell again to 27% in 2002.
The increase in 2001 and the fall of cocaine use in 2002do not appear to have been caused by changes in cocaineavailability. Cocaine prices remained largely stable and,importantly, cocaine availability was also perceived bydrug users to have remained largely stable in 2002.Cocaine purity, however, appears to have declined in2002q.
q) National Drug and Alcohol Research Centre (NDARC), Australian Drug Trends 2002 - IDRS - Findings from the Illicit Drug Reporting System(IDRS), NDARC Monograph No. 50, Sydney 2003.
Fig. 87: Cocaine consumption trend in Asia (based on national experts' perceptions)
0
1
91 92 93 94 95 96 97 98 99 00 01 02
dru
g a
bu
se t
ren
d in
dex
Source: UNODC, Annual Reports Questionnaire Data.
Fig. 88: Percent testing positive for cocaine amongpolice detainees* in Australia, 1999-2002
Fig.89: Annual prevalence of cocaine use in Australia
0.5%
1.0%
1.4%1.3%
0.0%
0.5%
1.0%
1.5%
1993 1995 1998 2001
ann
ual
pre
vale
nce
Source: AIHW, Statistics on Drug Use in Australia 2002, Canberra2003.Source: Australian Institute of Criminology, "Drug Use Monitoring
in Australia (Duma) Collection 1999-2002".
0%
2%
4%
6%
8%
10%
Q4 Q1 Q2 Q3 Q4 Q1 Q2 Q3 Q4 Q1 Q2 Q3 Q4
1999 2000 2001 2002
Percent testing positive for cocaineTrend

123
2. Trends Coca / Cocaine market
1999
1997
2001
2001
1999
2001
2001
2001
2001
2001
2001
2001 20
01
200120
02
2000
1999
2000
2001
1998
2000
1999
2001
2001
1997
1997
2001
2000
1998
1999
2001
1999
Som
e in
crea
se
Larg
e in
crea
se
Stro
ng d
eclin
e
Not
ava
ilabl
e
Som
e de
clin
e
Stab
le
Map
14:
Ch
ang
es in
co
nsu
mp
tio
n o
f co
cain
e, 2
002
(or
leat
est
year
ava
ilab
le)
Sour
ces:
UN
OD
C A
nnua
l Rep
orts
Que
stio
nnai
res
data
, UN
OD
C (R
egio
nal C
entr
e Ba
ngko
k) E
pide
mio
logy
Tre
nds
in D
rug
Tren
ds in
Asi
a (F
indi
ngs
of t
he A
sian
Mul
ticity
Epi
dem
iolo
gy W
orkg
roup
), D
ecem
ber
1999
, Nat
iona
l Hou
seho
ld S
urve
ys s
ubm
itted
to
UN
OD
C, U
nite
d St
ates
Dep
artm
ent
of S
tate
(Bur
eau
for
Inte
rnat
iona
l Nar
cotic
s an
d La
w E
nfor
cem
ent
Aff
airs
) Int
erna
tiona
l Nar
cotic
s C
ontr
ol S
trat
egy
Repo
rt,
1999
;Bun
desk
rimin
alam
t (
BKA
) an
d ot
her
Law
Enf
orce
men
t Re
port
s, S
AC
END
U (
Sout
h A
fric
an C
omm
unity
Epi
dem
iolo
gy N
etw
ork)
Jul
y -
Dec
embe
r 19
98,U
NO
DC
and
Min
iste
rio d
e Ed
ucac
ion,
Estu
dio
Epid
emio
logi
co 1
999,
CED
RO,
Epid
emio
logi
a de
Dro
gas
en la
pob
laci
on u
rban
a Pe
ruan
a -
1995
, IN
CB,
A
nnua
l Rep
ort
for
1999
.