4. the ats market - UNODC
47
4. The ATS market 127 4.1 Introduction The term amphetamine-type stimulants (ATS) refers to a group of synthetic substances comprised of ampheta- mines-group substances (primarily amphetamine, meth- amphetamine and methcathinone) and ecstasy-group substances (MDMA and its analogues). ATS are available in diverse forms and purities. Meth- amphetamine or amphetamine can be in powder, tablet, paste or crystalline form while ‘ecstasy’ is usually avail- able in tablet or powder form. 4.2 Consumption For the past two decades, the use of amphetamine type stimulants (ATS) has been one of the most significant drug problems worldwide. This section describes the trends in the use of amphetamines-group and ecstasy- group substances in the different regions. Amphetamines-group substances In 2009, UNODC estimates that, with an annual prev- alence ranging between 0.3% and 1.3%, between 13.7 and 56.4 million people aged 15-64 globally had used amphetamines-group substances at least once in the past year. While these numbers reflect a slight increase over estimates for previous years, they do not essentially indi- cate a significant difference in the prevalence of amphet- amines-group substances. The type of amphetamines-group substances used in different regions varies considerably. In East and South- East Asia, methamphetamine is the primary substance consumed within this group, while in the Near and Middle East, the use of tablets sold as Captagon is reportedly more common. In Europe, amphetamine is the main substance used within this group with the exception of Czech Republic and Slovakia, where meth- amphetamine has traditionally been the predominant amphetamines-group substance used. In North America as well as Australia and New Zealand, the use of prescription stimulants 1 is as common as methamphetamine. In South America and the Carib- bean, prescription stimulants are more commonly used. In Africa, especially in West, Central and East Africa and some parts of Southern Africa, the use of amphetamines- groups substances may comprise use of prescription stimulants. In South Africa, methamphetamine and methcathinone are the most commonly used ATS. In 2009, out of the 69 Member States that reported expert perception on amphetamines-group use trends through the Annual Reports Questionnaire, an equal number of countries perceived increasing and stable trends in the use of ATS over the past year. In Asia, however - particularly in South and South-East Asia - the majority of countries reported a perceived increase in the use of ATS in their countries. Trends over the past 12 years in the perceived increase in use of ATS as reported by Member States indicate that since 2001, the rate of increase has been much higher and more substantial in the developing (non-OECD) countries than in the developed (OECD) countries. In developing countries and especially emerging econo- 1 Prescription stimulants may include substances such as amfepra- mone, fenetylline, methylphenidate, phenmetrazine, et cetera.
-
Upload
khangminh22 -
Category
Documents
-
view
0 -
download
0
Transcript of 4. the ats market - UNODC

4. the ats market
127
4.1 Introduction
The term amphetamine-type stimulants (ATS) refers to a group of synthetic substances comprised of ampheta-mines-group substances (primarily amphetamine, meth-amphetamine and methcathinone) and ecstasy-group substances (MDMA and its analogues).
ATS are available in diverse forms and purities. Meth-amphetamine or amphetamine can be in powder, tablet, paste or crystalline form while ‘ecstasy’ is usually avail-able in tablet or powder form.
4.2 Consumption
For the past two decades, the use of amphetamine type stimulants (ATS) has been one of the most significant drug problems worldwide. This section describes the trends in the use of amphetamines-group and ecstasy-group substances in the different regions.
Amphetamines-group substances
In 2009, UNODC estimates that, with an annual prev-alence ranging between 0.3% and 1.3%, between 13.7 and 56.4 million people aged 15-64 globally had used amphetamines-group substances at least once in the past year. While these numbers reflect a slight increase over estimates for previous years, they do not essentially indi-cate a significant difference in the prevalence of amphet-amines-group substances.
The type of amphetamines-group substances used in different regions varies considerably. In East and South-East Asia, methamphetamine is the primary substance consumed within this group, while in the Near and
Middle East, the use of tablets sold as Captagon is reportedly more common. In Europe, amphetamine is the main substance used within this group with the exception of Czech Republic and Slovakia, where meth-amphetamine has traditionally been the predominant amphetamines-group substance used.
In North America as well as Australia and New Zealand, the use of prescription stimulants1 is as common as methamphetamine. In South America and the Carib-bean, prescription stimulants are more commonly used. In Africa, especially in West, Central and East Africa and some parts of Southern Africa, the use of amphetamines-groups substances may comprise use of prescription stimulants. In South Africa, methamphetamine and methcathinone are the most commonly used ATS.
In 2009, out of the 69 Member States that reported expert perception on amphetamines-group use trends through the Annual Reports Questionnaire, an equal number of countries perceived increasing and stable trends in the use of ATS over the past year. In Asia, however - particularly in South and South-East Asia - the majority of countries reported a perceived increase in the use of ATS in their countries.
Trends over the past 12 years in the perceived increase in use of ATS as reported by Member States indicate that since 2001, the rate of increase has been much higher and more substantial in the developing (non-OECD) countries than in the developed (OECD) countries. In developing countries and especially emerging econo-
1 Prescription stimulants may include substances such as amfepra-mone, fenetylline, methylphenidate, phenmetrazine, et cetera.

128
World Drug Report 2011
mies, there is an expanding middle class with more dis-posable income. The association in developed countries of synthetic drugs, especially stimulants, with moderni-zation and affluent lifestyles, combined with increasing demands for higher performance and the availability and reported common use of stimulants in recreational
and entertainment settings, may be contributing to an increase in the use of stimulants in developing countries where young people within the growing middle class may want to emulate these lifestyles.
Region/subregion (amphetamines-group)
Estimated number of
users annually (lower)
-
Estimated number of
users annually (upper)
Percent of population age 15-64
(lower)
-
Percent of population age 15-64
(upper)
AfricaEast AfricaNorth AfricaSouthern AfricaWest and Central Africa
1,180,000
280,000
-
-
8,150,000
780,000
0.2
0.4
-
-
1.4
1.0
AmericasCaribbeanCentral AmericaNorth AmericaSouth America
5,170,00030,000
320,0003,460,0001,340,000
-----
6,210,000530,000320,000
3,460,0001,890,000
0.80.11.31.10.5
-----
1.01.91.31.10.7
AsiaCentral AsiaEast/South-East AsiaNear and Middle EastSouth Asia
4,330,000
3,480,000460,000
-
--
38,230,000
20,870,0004,330,000
0.2
0.20.2
-
--
1.4
1.41.7
EuropeEast/South-East EuropeWest/Central Europe
2,540,000510,000
2,030,000
---
3,180,0001,050,0002,120,000
0.50.20.7
---
0.60.50.7
Oceania 470,000 - 640,000 2.0 - 2.8
Global 13,690,000 - 56,410,000 0.3 - 1.3
Table 30: Annual prevalence and estimated number of amphetamines-group substances users, by region, subregion and globally, 2009
Fig. 91: Range of estimated number of amphetamines-group substance users by region
Source: UNODC.
Fig. 92: Range annual prevalence of amphetamines-group substance users by region
Source: UNODC.
0
10,000,000
20,000,000
30,000,000
40,000,000
50,000,000
60,000,000
Wor
ld
Asi
a
Am
eric
as
Afr
ica
Euro
pe
Oce
ania
Low
er/u
pp
er r
ang
e u
sers
(m
illio
ns)
0.0
0.5
1.0
1.5
2.0
2.5
3.0
3.5
Wor
ld
Oce
ania
Afr
ica
Am
eric
as
Asi
a
Euro
pe
Low
er/u
pp
er r
ang
e p
reva
len
ce (
%)

129
The ATS market
North America: Increased use of amphetamines-group substances reported in United States and Mexico; decrease reported in Canada
With an estimated 3.5 million people who had used amphetamines-group substances at least once in the previous year, this region has probably the third highest prevalence of amphetamines-group substance use (1.1% of the population aged 15-64) globally.
In the United States of America, the annual prevalence of amphetamines-group substances was reported as 1.5% of the population aged 15-64 in 2009. The non-
medical use of prescription stimulants is higher in the United States compared to the use of methampheta-mine, whose annual prevalence reached 0.6% of the population aged 15-64. Between 2002 and 2006, there was a steady increase in the use of amphetamines and methamphetamine among the population 12 years or older, followed by a decrease between 2007 and 2008. In 2009, the annual prevalence showed an increase, but at levels below the ones observed between 2002 and 2006.
The number of people aged 12 years or older who had initiated drug use with methamphetamine was 154,000
Region
Member States
providing perception
data
Member States
perception response
rate
Use problem
increased*
Percent use
problem increased*
Use problem stable
Percent use
problem stable
Use problem
decreased*
Percent use problem
decreased*
Africa 5 9% 2 40% 2 40% 1 20%
Americas 11 31% 4 36% 6 55% 1 9%
Asia 24 53% 14 58% 5 21% 5 21%
Europe 28 62% 10 36% 16 57% 2 7%
Oceania 1 7% 0 1 0
Global 69 36% 30 43% 30 43% 9 13%
* Identifies increases/decreases ranging from either some to strong, unweighted by population.
Map 25: Use of different types of amphetamines-group substances
Table 31: Expert perceptions of trends in amphetamines-group substance use, 2009
Source: UNODC ARQ.
! ! ! !
! ! ! !
! ! ! !
! ! !
! ! !
!
!
!
! ! !
! ! !
! ! ! ! ! ! ! ! ! ! ! ! ! ! ! ! ! ! ! ! ! ! ! ! ! ! ! ! ! ! ! ! ! ! ! ! ! ! ! ! ! ! ! ! ! ! ! ! ! ! ! ! ! ! ! ! ! ! ! ! ! ! ! ! ! ! ! ! ! ! ! ! ! ! ! ! ! ! ! ! ! ! ! ! ! ! ! ! ! ! ! ! ! ! ! ! ! ! ! ! ! ! ! ! ! ! ! ! ! ! ! ! ! ! ! ! ! ! ! ! ! ! ! ! ! ! ! ! ! ! ! ! !
! ! ! ! ! ! ! ! ! ! ! ! ! ! ! ! ! ! ! ! ! ! ! ! ! ! ! ! ! ! ! ! ! ! ! ! ! ! ! ! ! ! ! ! ! ! ! ! ! ! ! ! ! ! ! ! ! ! ! ! ! ! ! ! ! ! ! ! ! ! ! ! ! ! ! ! ! ! ! ! ! ! ! ! ! ! ! ! ! ! ! ! ! ! ! ! ! ! ! ! ! ! ! ! ! ! ! ! ! ! ! ! ! ! ! ! ! ! ! ! ! ! ! ! ! ! ! ! ! ! ! ! !
! ! ! ! ! ! ! ! ! ! ! ! ! ! ! ! ! ! ! ! ! ! ! ! ! ! ! ! ! ! ! ! ! ! ! ! ! ! ! ! ! ! ! ! ! ! ! ! ! ! ! ! ! ! ! ! ! ! ! ! ! ! ! ! ! ! ! ! ! ! ! ! ! ! ! ! ! ! ! ! ! ! ! ! ! ! ! ! ! ! ! ! ! ! ! ! ! ! ! ! ! ! ! ! ! ! ! ! ! ! ! ! ! ! ! ! ! ! ! ! ! ! ! ! ! ! ! ! ! ! ! ! !
! ! ! ! ! ! ! ! ! ! ! ! ! ! ! ! ! ! ! ! ! ! ! ! ! ! ! ! ! ! ! ! ! ! ! ! ! ! ! ! ! ! ! ! ! ! ! ! ! ! ! ! ! ! ! ! ! ! ! ! ! ! ! ! ! ! ! ! ! ! ! ! ! ! ! ! ! ! ! ! ! ! ! ! ! ! ! ! ! ! ! ! ! ! ! ! ! ! ! ! ! ! ! ! ! ! ! ! ! ! ! ! ! ! ! ! ! ! ! ! ! ! ! ! ! ! ! ! ! ! ! ! !
! ! ! ! ! ! ! ! ! ! ! ! ! ! ! ! ! ! ! ! ! ! ! ! ! ! ! ! ! ! ! ! ! ! ! ! ! ! ! ! ! ! ! ! ! ! ! ! ! ! ! ! ! ! ! ! ! ! ! ! ! ! ! ! ! ! ! ! ! ! ! ! ! ! ! ! ! ! ! ! ! ! ! ! ! ! ! ! ! ! ! ! ! ! ! ! ! ! ! ! ! ! ! ! ! ! ! ! ! ! ! ! ! ! ! ! ! ! ! ! ! ! ! ! ! ! ! ! ! ! ! ! !
! ! ! ! ! ! ! ! ! ! ! ! ! ! ! ! ! ! ! ! ! ! ! ! ! ! ! ! ! ! ! ! ! ! ! ! ! ! ! ! ! ! ! ! ! ! ! ! ! ! ! ! ! ! ! ! ! ! ! ! ! ! ! ! ! ! ! ! ! ! ! ! ! ! ! ! ! ! ! ! ! ! ! ! ! ! ! ! ! ! ! ! ! ! ! ! ! ! ! ! ! ! ! ! ! ! ! ! ! ! ! ! ! ! ! ! ! ! ! ! ! ! ! ! ! ! ! ! ! ! ! ! !
! ! ! ! ! ! ! ! ! ! ! ! ! ! ! ! ! ! ! ! ! ! ! ! ! ! ! ! ! ! ! ! ! ! ! ! ! ! ! ! ! ! ! ! ! ! ! ! ! ! ! ! ! ! ! ! ! ! ! ! ! ! ! ! ! ! ! ! ! ! ! ! ! ! ! ! ! ! ! ! ! ! ! ! ! ! ! ! ! ! ! ! ! ! ! ! ! ! ! ! ! ! ! ! ! ! ! ! ! ! ! ! ! ! ! ! ! ! ! ! ! ! ! ! ! ! ! ! ! ! ! ! !
! ! ! ! ! ! ! ! ! ! ! ! ! ! ! ! ! ! ! ! ! ! ! ! ! ! ! ! ! ! ! ! ! ! ! ! ! ! ! ! ! ! ! ! ! ! ! ! ! ! ! ! ! ! ! ! ! ! ! ! ! ! ! ! ! ! ! ! ! ! ! ! ! ! ! ! ! ! ! ! ! ! ! ! ! ! ! ! ! ! ! ! ! ! ! ! ! ! ! ! ! ! ! ! ! ! ! ! ! ! ! ! ! ! ! ! ! ! ! ! ! ! ! ! ! ! ! ! ! ! ! ! !
! ! ! ! ! ! ! ! ! ! ! ! ! ! ! ! ! ! ! ! ! ! ! ! ! ! ! ! ! ! ! ! ! ! ! ! ! ! ! ! ! ! ! ! ! ! ! ! ! ! ! ! ! ! ! ! ! ! ! ! ! ! ! ! ! ! ! ! ! ! ! ! ! ! ! ! ! ! ! ! ! ! ! ! ! ! ! ! ! ! ! ! ! ! ! ! ! ! ! ! ! ! ! ! ! ! ! ! ! ! ! ! ! ! ! ! ! ! ! ! ! ! ! ! ! ! ! ! ! ! ! ! !
! ! ! ! ! ! ! ! ! ! ! ! ! ! ! ! ! ! ! ! ! ! ! ! ! ! ! ! ! ! ! ! ! ! ! ! ! ! ! ! ! ! ! ! ! ! ! ! ! ! ! ! ! ! ! ! ! ! ! ! ! ! ! ! ! ! ! ! ! ! ! ! ! ! ! ! ! ! ! ! ! ! ! ! ! ! ! ! ! ! ! ! ! ! ! ! ! ! ! ! ! ! ! ! ! ! ! ! ! ! ! ! ! ! ! ! ! ! ! ! ! ! ! ! ! ! ! ! ! ! ! ! !
! ! ! ! ! ! ! ! ! ! ! ! ! ! ! ! ! ! ! ! ! ! ! ! ! ! ! ! ! ! ! ! ! ! ! ! ! ! ! ! ! ! ! ! ! ! ! ! ! ! ! ! ! ! ! ! ! ! ! ! ! ! ! ! ! ! ! ! ! ! ! ! ! ! ! ! ! ! ! ! ! ! ! ! ! ! ! ! ! ! ! ! ! ! ! ! ! ! ! ! ! ! ! ! ! ! ! ! ! ! ! ! ! ! ! ! ! ! ! ! ! ! ! ! ! ! ! ! ! ! ! ! !
! ! ! ! ! ! ! ! ! ! ! ! ! ! ! ! ! ! ! ! ! ! ! ! ! ! ! ! ! ! ! ! ! ! ! ! ! ! ! ! ! ! ! ! ! ! ! ! ! ! ! ! ! ! ! ! ! ! ! ! ! ! ! ! ! ! ! ! ! ! ! ! ! ! ! ! ! ! ! ! ! ! ! ! ! ! ! ! ! ! ! ! ! ! ! ! ! ! ! ! ! ! ! ! ! ! ! ! ! ! ! ! ! ! ! ! ! ! ! ! ! ! ! ! ! ! ! ! ! ! ! ! !
! ! ! ! ! ! ! ! ! ! ! ! ! ! ! ! ! ! ! ! ! ! ! ! ! ! ! ! ! ! ! ! ! ! ! ! ! ! ! ! ! ! ! ! ! ! ! ! ! ! ! ! ! ! ! ! ! ! ! ! ! ! ! ! ! ! ! ! ! ! ! ! ! ! ! ! ! ! ! ! ! ! ! ! ! ! ! ! ! ! ! ! ! ! ! ! ! ! ! ! ! ! ! ! ! ! ! ! ! ! ! ! ! ! ! ! ! ! ! ! ! ! ! ! ! ! ! ! ! ! ! ! !
! ! ! ! ! ! ! ! ! ! ! ! ! ! ! ! ! ! ! ! ! ! ! ! ! ! ! ! ! ! ! ! ! ! ! ! ! ! ! ! ! ! ! ! ! ! ! ! ! ! ! ! ! ! ! ! ! ! ! ! ! ! ! ! ! ! ! ! ! ! ! ! ! ! ! ! ! ! ! ! ! ! ! ! ! ! ! ! ! ! ! ! ! ! ! ! ! ! ! ! ! ! ! ! ! ! ! ! ! ! ! ! ! ! ! ! ! ! ! ! ! ! ! ! ! ! ! ! ! ! ! ! !
! ! ! ! ! ! ! ! ! ! ! ! ! ! ! ! ! ! ! ! ! ! ! ! ! ! ! ! ! ! ! ! ! ! ! ! ! ! ! ! ! ! ! ! ! ! ! ! ! ! ! ! ! ! ! ! ! ! ! ! ! ! ! ! ! ! ! ! ! ! ! ! ! ! ! ! ! ! ! ! ! ! ! ! ! ! ! ! ! ! ! ! ! ! ! ! ! ! ! ! ! ! ! ! ! ! ! ! ! ! ! ! ! ! ! ! ! ! ! ! ! ! ! ! ! ! ! ! ! ! ! ! !
! ! ! ! ! ! ! ! ! ! ! ! ! ! ! ! ! ! ! ! ! ! ! ! ! ! ! ! ! ! ! ! ! ! ! ! ! ! ! ! ! ! ! ! ! ! ! ! ! ! ! ! ! ! ! ! ! ! ! ! ! ! ! ! ! ! ! ! ! ! ! ! ! ! ! ! ! ! ! ! ! ! ! ! ! ! ! ! ! ! ! ! ! ! ! ! ! ! ! ! ! ! ! ! ! ! ! ! ! ! ! ! ! ! ! ! ! ! ! ! ! ! ! ! ! ! ! ! ! ! ! ! !
! ! ! ! ! ! ! ! ! ! ! ! ! ! ! ! ! ! ! ! ! ! ! ! ! ! ! ! ! ! ! ! ! ! ! ! ! ! ! ! ! ! ! ! ! ! ! ! ! ! ! ! ! ! ! ! ! ! ! ! ! ! ! ! ! ! ! ! ! ! ! ! ! ! ! ! ! ! ! ! ! ! ! ! ! ! ! ! ! ! ! ! ! ! ! ! ! ! ! ! ! ! ! ! ! ! ! ! ! ! ! ! ! ! ! ! ! ! ! ! ! ! ! ! ! ! ! ! ! ! ! ! !
! ! ! ! ! ! ! ! ! ! ! ! ! ! ! ! ! ! ! ! ! ! ! ! ! ! ! ! ! ! ! ! ! ! ! ! ! ! ! ! ! ! ! ! ! ! ! ! ! ! ! ! ! ! ! ! ! ! ! ! ! ! ! ! ! ! ! ! ! ! ! ! ! ! ! ! ! ! ! ! ! ! ! ! ! ! ! ! ! ! ! ! ! ! ! ! ! ! ! ! ! ! ! ! ! ! ! ! ! ! ! ! ! ! ! ! ! ! ! ! ! ! ! ! ! ! ! ! ! ! ! ! !
! ! ! ! ! ! ! ! ! ! ! ! ! ! ! ! ! ! ! ! ! ! ! ! ! ! ! ! ! ! ! ! ! ! ! ! ! ! ! ! ! ! ! ! ! ! ! ! ! ! ! ! ! ! ! ! ! ! ! ! ! ! ! ! ! ! ! ! ! ! ! ! ! ! ! ! ! ! ! ! ! ! ! ! ! ! ! ! ! ! ! ! ! ! ! ! ! ! ! ! ! ! ! ! ! ! ! ! ! ! ! ! ! ! ! ! ! ! ! ! ! ! ! ! ! ! ! ! ! ! ! ! !
! ! ! ! ! ! ! ! !
! ! ! ! ! ! ! ! !
! ! ! ! ! ! ! ! !
! ! ! ! ! ! ! ! !
! ! ! ! ! ! ! ! !
! ! ! ! ! ! ! ! !
! ! ! ! ! ! ! ! !
! ! ! ! ! ! ! ! !
! ! ! ! ! ! ! ! !
! ! ! ! ! ! ! ! !
! ! ! ! ! ! ! ! !
! ! ! ! ! ! ! ! !
! ! ! ! ! ! ! ! !
! ! ! ! ! ! ! ! !
! ! ! ! ! ! !
! ! ! ! ! ! !
! ! ! ! ! ! !
! ! ! ! ! ! !
! ! ! ! ! ! !
! ! ! ! ! ! !
! ! ! ! ! ! !
! ! ! ! ! ! !
! ! ! ! ! ! !
Use of main types of amphetamine-group substances
Amphetamine
Methamphetamine
Prescription stimulants
! ! ! ! !
! ! ! ! !
! ! ! ! !
Methcathinone / other stimulants
No data available
Sources: ARQs, Government Sources and UNODC field offices.
Note: The colours do not represent the level of use, only the category of stimulants used.The boundaries and names shown and the designations used on this map do not imply official endorsement or acceptance by the United Nations.

130
World Drug Report 2011
in 2009 in the United States. While this estimate was significantly higher than the estimate in 2008 (95,000), it is still substantially lower than the estimate for 2002 (299,000),2 and far lower than the reported initiates for most other illicit drugs (except for PCP). In line with the annual prevalence, the number and proportion of people who had reported non-medical use of stimulants in the past 30 days (prior to the survey) increased sig-nificantly from 904,000 (0.4%) in 2008 to 1.3 million
2 Substance Abuse and Mental Health Services Administration, Results from the 2009 National Survey on Drug Use and Health: Volume I. Summary of National Findings, Rockville, Maryland, USA, 2010.
(0.5%) in 2009. This increase in the prevalence of stim-ulants use is attributed in part to an increase in the number of methamphetamine users.3
The recent increase in stimulant and notably in meth-amphetamine use among the general US population was not reflected in prevalence data for high school students for 2009. Among secondary school students in the United States, there has been a declining trend in the annual prevalence of amphetamine and methampheta-mine use between 2002 and 2008, and stable trends in
3 Ibid.
Fig. 93: Expert perceptions of the trends in amphetamines-group substance consumption, 2000-2009
Source: UNODC ARQ.
Fig. 94: Amphetamines-group substance use trends as perceived by experts of de-veloped (OECD) and developing coun-tries, 1998-2009 (baseline: 1998 =100)
Source: UNODC ARQ.
0
10
20
30
40
50
2000(50)
2001(74)
2002(79)
2003(79)
2004(90)
2005(85)
2006(84)
2007(91)
2008(78)
2009(69)
Nu
mb
er o
f M
emb
er S
tate
s R
esp
on
din
g
Some decrease Strong decrease Stable over last year Some increase Strong increase
97
98
99
100
101
102
103
104
105
106
1998
1999
2000
2001
2002
2003
2004
2005
2006
2007
2008
2009
Bas
elin
e 19
98: 1
00
OECD
Non-OECD
Global
Fig. 95: Experts’ perceptions on global and regional trends in the use of ampheta-mines-group substances, 1998-2009
Source: UNODC ARQ.
97
98
99
100
101
102
103
104
105
106
1998
1999
2000
2001
2002
2003
2004
2005
2006
2007
2008
2009
Bas
eliin
e 19
98=
100
Africa Americas Asia
Europe Oceania Global

131
The ATS market
2009.4 In 2010, annual prevalence of amphetamines use rose among 10th and 12th graders while it continued to decline among 8th graders. Use of methamphetamine, in contrast, increased among 8th graders, remained stable among 10th graders but declined among 12th graders in 2010. Despite some increases in ampheta-mines use and a stable level of methamphetamine use
4 Johnston, L. D., O’Malley, P. M., Bachman, J. G., and Schulen-berg, J. E., Monitoring the Future national results on adolescent drug use: Overview of key findings, 2010, Ann Arbor, Institute for Social Research, The University of Michigan, USA, 2011.
among US high school students in 2010, the overall level in 2010 remained substantially lower than over the 2002-2006 period.
In contrast to an overall rising trend of ATS use in the United States, the annual prevalence of ATS use among the general population in Canada (0.7%) was signifi-cantly lower in 2009 than in 2008 (1.5%). The annual prevalence of both amphetamine and methampheta-mine was substantially lower in 2009 than a year earlier (0.5% and 0.1% compared to 1.3% and 0.2% respec-tively).
In Mexico, while there has been no update in the annual prevalence of amphetamines-group substance use since the last household survey in 2008, the expert perception in 2009 indicates stable trends for amphetamines use but a great increase in the use of methamphetamine over the past year. In 2009, among school students aged 12-19 in Mexico, the reported lifetime prevalence of amphetamine and methamphetamine use was 1.9% and 0.7% respectively.5 In previous years, however, the life-time prevalence among youth aged 12-17 was reported as 0.07% for amphetamine and 0.35% for metham-phetamine.6
Amphetamines-group substance use in South America appears to remain stable
There is no updated information on the prevalence of amphetamines-group substance use in South America. Existing information shows that the annual prevalence
5 UNODC ARQ.6 The information on annual prevalence in the ARQ for Mexico in
2008 was based on the national survey conducted among the general population aged 12-65 with the breakdown of the estimates among the ages 12-17 years
Fig. 96: United States: Annual prevalence of stimulants and methamphetamine use in the population aged 12 and older, 2002-2009
Source: Substance Abuse and Mental Health Services Adminis-tration, Results from the 2009 National Survey on Drug Use and Health: Volume I, Summary of National Findings, 2010.
1.41.3
1.41.3
1.5
1.21.1
1.2
0.7 0.70.8
0.70.8
0.5
0.3
0.5
0
0.2
0.4
0.6
0.8
1
1.2
1.4
1.6
2002 2003 2004 2005 2006 2007 2008 2009
An
nu
al p
reva
len
ce (
as %
)
Stimulants (all types) Methamphetamine
4.1
9
8
7.1
9.9 10
8.6
6.8 6.6
5.5 5.54.9 4.9 4.7
4.2 4.53.9
6.4
7.97.88.5
10.7
7.67.58.1
11.1
7.4
0
2
4
6
8
10
12
2002 2003 2004 2005 2006 2007 2008 2009 2010
An
nu
al p
reva
len
ce (
%)
Amphet 8th grade Amphet 10th grade Amphet 12th grade
Meth 8th grade Meth 10th grade Meth12th grade
Fig. 97: Annual prevalence of amphetamines use among secondary school students in the United States, 2002-2009
Source: United States Monitoring the Future: national results on adolescent drug use.

132
World Drug Report 2011
of amphetamines-group substance use in South America remains close to the world average, with estimates rang-ing between 0.5% and 0.7% of the population aged 15-64 or between 1.34 and 1.89 million people in that age group who had used these substances in the previous year. Compared to 2008, most of the countries report-ing from the region perceive trends of amphetamine and methamphetamine use as being stable in 2009. Brazil, the Bolivarian Republic of Venezuela and Argentina remain countries with a high prevalence and absolute number of users of amphetamine and methampheta-mine in South America.
In a national survey conducted among university stu-dents in Brazil in 2009, the annual prevalence of amphetamines use among the students was reported as 10.5%. The annual prevalence was higher among female students (14.1%) than male students (5.5%), and was also higher among the older students, that is, those who were 35 years or older (18.6%), followed by students aged between 25-34 years (13.7%).7 The use of amphet-amine-like substances is reportedly more common among women due to their anorexic effects and a preva-lent culture to use medications for weight loss purposes.8
Although there are no recent updates on the prevalence of amphetamine and methamphetamine in Central America, as a region, it has a high prevalence of amphet-
7 Andrade, A.G., Duarte, P. and Oliveira, L. G., I Levantamento Nacio-nal Sobre O Uso De Álcool, Tabaco E Outras Drogas Entre Universita-rios Das 27 Capitais Brasileiras, Secretaria Nacional Politicas sobre Drogas, Brasilia, 2010.
8 Napp S.A., et al., ‘Use of anorectic amphetamine-like drugs by Bra-zilian women,’ Eating Behaviors, Volume 3, Issue 2, Summer 2002, pages 153-1165
amines-group substance use (1.3% of the adult popula-tion), with El Salvador (3.3%), Belize (1.4%) and Panama (1.2%) as the three countries with high annual prevalence among the general population. A large pro-portion of the ATS use in these countries is related to the use of prescription stimulants.
While most countries in Europe show stabilizing trends in the use of amphetamines-group substances, high levels of injecting amphetamines use are reported by a few
In 2009, more than half of European countries reported stable trends of ATS use in their countries. The coun-tries that reported data show a mixed trend from previ-ous years. The annual prevalence of amphetamines-group substance use in Europe is estimated between 0.5% and 0.6%, which corresponds to an estimated 2.6 to 3.3 mil-lion people who had used these substances in the past year. Like in other regions, the majority of amphetamine users fall within the 15-34 years age group, with a much higher estimated annual prevalence of 1.2%.
The amphetamines-group substance prevalence is, over-all, higher in West and Central Europe than in East and South-East Europe. In most parts of Europe, ampheta-mine is the more commonly used substance within this group, while the use of methamphetamine remains lim-ited and has historically been highest in the Czech Republic and Slovakia. In 2009 and 2010, countries that reported new data on ATS prevalence include Cyprus, Germany, Spain, Sweden and the United King-dom (England and Wales). Except for Germany and Sweden, many of these countries are showing stabilizing or decreasing trends in the use of amphetamines-group
0.1
0.2
0.2
0.4
0.5
0.5
0.5
0.5
0.6
0.6
0.7
0.7
0 0.2 0.4 0.6 0.8
Uruguay (2006)
Ecuador (2005)
Peru (2006)
Chile (2008)
Bolivia (2007)
Colombia (2008)
Guyana (2002)
Paraguay (2005)
Argentina (2005)
Venezuela (2002)
Brazil (2005)
Suriname (2007)
Fig. 98: Annual prevalence of amphetamines-group substances use in South America among the population aged 15-64, latest year available
Source: UNODC ARQ.
Fig. 99: Brazil: Prevalence of amphetamine use among university students, 2009
Source: I Levantamento Nacional Sobre O Uso De Álcool, Tabaco E Outras Drogas Entre Universitarios Das 27 Capitais Brasileiras, Secretaria Nacional Politicas sobre Drogas, Brasilia, 2010.
8.1
18.1
10
17.9
23.6
13.814.1
6.6
13.7
18.6
10.5
2.7
11.6
5.95.57.3
4.4
11.7
16.5
8.7
5.7
0
5
10
15
20
25
Male Female 18 18-24 25-34 35 Overall
Prev
alen
ce (
%)
Lifetime Annual Monthly

133
The ATS market
substances. While in Germany, there was an increase in the annual prevalence in 2009 (0.7%) over the previous estimates in 2006 (0.5%), the estimate remains at lower levels than shown for 2003 (0.9%).
Within West and Central Europe, the Czech Republic, Denmark, the United Kingdom, Norway and Estonia remain the countries with the highest annual prevalence rates, while in South-East Europe, Bosnia and Herze-govina and Bulgaria have high annual prevalence of amphetamines use.
In most West and Central European countries, problem amphetamines use represents a small fraction of overall problem drug use, except for the Czech Republic and some of the Nordic countries. Those who report amphetamine as their primary substance account for less than 5% of drug users in treatment, on average, in Europe. High levels of injecting use are reported from the Czech Republic, Estonia, Latvia, Lithuania, Sweden and Finland, ranging from 57% to 82% among amphet-amines users.9
Mixed trends on use of amphetamines-group substances in Africa
The annual prevalence of amphetamines-group sub-stances in Africa is estimated between 0.2% and 1.4% (between 1.2 and 8 million people), reflecting the fact that for most parts of Africa, there is either limited or no recent or reliable data available on the prevalence or trends of amphetamines-group substance use, resulting
9 European Monitoring Centre for Drugs and Drug Addiction (EMCDDA), Annual Report 2010: The State of the drugs problem in Europe, Lisbon, 2010
in a wide range and uncertainty of the estimates. The only valid estimates that can be derived in the region are for Southern Africa where the annual prevalence is esti-mated between 0.4% and 1% of the population aged 15-64.
Among the limited number of countries that have reported expert opinion on trends in the use of amphet-amines-group substances in Africa, nearly half of the countries report that the trend has increased while a similar proportion report stable trends over the past year. In most parts of Africa, prescription amphetamines comprise the primary substances used within this group.
South Africa is one country in the region from which there is more consistent and recent information available on drug use trends. Such data – based on treatment demand - showed a strong increase in the importance of amphetamines until the second half of 2006, followed by a stabilization or small downward trend since. The importance of amphetamines increased again temporar-ily in the first half of 2009, before falling back in the second half of the year to the levels reported in 2008.
The past 3 months prevalence of amphetamines-group substances in South Africa was reported at 0.7% in 2008 for the population aged 15 and above. Based on this information, the annual prevalence of amphetamines-group substance use was estimated by UNODC at between 0.7% to 1.4% of the adult population (aged 15-64) in South Africa.
In contrast to the patterns in other parts of Africa, meth-amphetamine and methcathinone are the main sub-stances used within the amphetamines-group substances.
Fig. 100: Trends in amphetamines-group substances in selected European countries, various years
Sources: EMCDDA; UNODC.
0.40.3
0.6
0.9
0.5
0.7
1.5
1.31.2
1
0.10.2
0.8
1.3
0.7
1.21.1
0.7
1.7
0.4
0.20.3 0.3
1.2
0.80.7
0.9
0.6
0
0.2
0.4
0.6
0.8
1
1.2
1.4
1.6
1.8
Cyp
rus
'06
Cyp
rus
'09
Ger
man
y '0
0
Ger
man
y '0
3
Ger
man
y '0
6
Ger
man
y '0
9
Engl
and
& W
ales
'03
/04
Engl
and
& W
ales
'05
/06
Engl
and
& W
ales
'08
/09
Engl
and
& W
ales
'09
/10
Swed
en '
98
Swed
en '
00
Swed
en '
08
Den
mar
k '0
0
Den
mar
k '0
5
Den
mar
k '0
8
Cze
ch R
epub
lic '
02
Cze
ch R
epub
lic '
04
Cze
ch R
epub
lic '
08
Slov
akia
'00
Slov
akia
'02
Slov
akia
'04
Slov
akia
'06
Spai
n '0
1
Spai
n '0
3
Spai
n '0
5/06
Spai
n '0
7/08
Spai
n '0
9/10
An
nu
al p
reva
len
ce (
%)

134
World Drug Report 2011
In South Africa, methamphetamine or ‘tik’ as it is locally known, remained the primary substance of use for which people were seeking treatment, mainly in Cape Town. In other parts of the country, the proportion has remained very low.10 For the other countries in Africa, for which information on treatment demand is available, amphet-amines-group substances as the primary substance of abuse among persons treated in the region averaged around 5% of all treatment demand. This ranges from 30% of all treatment admissions reported in Niger to around 2% in Nigeria.
Increasing trends of amphetamines-group sub-stances use in Asia with injecting methamphetamine and its associated negative health consequences reported as an increasing problem in East and South-East Asia
The annual prevalence of amphetamines-group sub-stance use in Asia ranges between 0.2%-1.4% or from 4 to 38 million people aged 15-64 who are estimated to have used these substances in the past year. The wide range and uncertainty in the estimates derive from miss-ing information on the extent and pattern of use from large countries in Asia, particularly China and India. Due to a lack of recent or reliable estimates from many countries in the region, estimates cannot be calculated for the subregions of Central and South Asia.
Nevertheless, among the Asian countries reporting through the ARQ, experts in more than half of the countries, mainly in East and South-East Asia, perceived
10 Pluddemann A., Parry C., et al. Alcohol and Drug Abuse Trends: July – December, 2009 (Phase 27), South African Community Epidemiol-ogy Network on Drug Use (SACENDU) Update June 2010.
an increase in the use of amphetamines-group sub-stances, compared to less than a quarter of countries in which experts perceived the problem to have stabilized or decreased over the past year. Outside East and South-East Asia,11 Armenia, Georgia, Jordan, Pakistan and Qatar are five countries that have reported a perceived increase in the use of amphetamine-type stimulants over the past years.
In East and South-East Asia, the annual prevalence of amphetamines-group substances ranges between 0.2%-1.4% of the adult population aged 15-64.12 Metham-phetamine, both in pill and crystalline forms, is the main substance used within this group. The Philippines (2.1%), Thailand (1.4%) and the Lao People’s Demo-cratic Republic (1.4%) are the countries in the subre-gion with prevalence of methamphetamine use higher than the global average.
On average, the countries in South-East Asia in 2009 reported a 250% increase in the number of metham-phetamine-related arrests since 2004. The highest increase reported was from Lao People’s Democratic Republic, whereas Japan has reported a decline in meth-amphetamine-related attests.13
11 The countries and areas reporting increases in ATS use in 2009 include China (and Macao, China), Indonesia, Lao People’s Demo-cratic Republic, Malaysia, Myanmar and Viet Nam. On the other hand, Hong Kong China, Kazakhstan, the Republic of Korea and Lebanon have reported decreasing use of ATS.
12 In East and South-East Asia, most of the information on ampheta-mines-group substances is available through the UNODC SMART programme that assists the countries in the region to monitor drug trends with a particular focus on use of amphetamine-type stimu-lants.
13 UNODC Patterns and Trends of Amphetamine-Type Stimulants and
Fig. 101: Trends in treatment demand for methamphetamine as the primary sub-stance in Western Cape (Cape Town), South Africa, 2005-2009 (biannual data)
Source: Alcohol and Drug Abuse Trends: July – December, 2009 (Phase 27), South African Community Epidemiology Network on Drug Use (SACENDU) Update June 2010.
Fig. 102: Percentage of ATS-group substances among primary substance of abuse in treatment in Africa, 2009 or latest year available
Source: UNODC ARQ.
26.1
34.737.2
42.3 40.7
36.1 35.8 35.1
41
36
0
5
10
15
20
25
30
35
40
45
2005
a
2005
b
2006
a
2006
b
2007
a
2007
b
2008
a
2008
b
2009
a
2009
b
%
2
7
9.8
20.6
25.6
30
0
5
10
15
20
25
30
35
Nigeria Egypt Namibia BurkinaFaso
SouthAfrica
Niger%
in t
reat
men
t

135
The ATS market
The treatment demand for methamphetamine in East and South-East Asia has also increased considerably over the last decade. It rose from on average a quarter of all treatment demand in 1998 to nearly half of all treatment admissions in 2009. The treatment demand for meth-amphetamine in 2009, or the latest year for which data is available, varied considerably across the countries and areas, ranging from nearly the entire treatment demand for methamphetamine use in Brunei Darussalam, the Republic of Korea and the Lao People's Democratic Republic to only 9% in Indonesia and Hong Kong, China.
Heroin and methamphetamine are the two common substances being injected in East and South-East Asia, with increasing trends reported of injecting metham-phetamine in the subregion. In Thailand, injecting is the second most common method for using crystalline methamphetamine and the third most common method for abuse of methamphetamine pills.14 In 2009, Indo-nesia reported an increasing trend in injecting heroin and crystalline methamphetamine, while Malaysia reported injecting of crystalline methamphetamine for the first time in 2009.15 As a consequence, many coun-tries in East and South-East Asia also have concentrated HIV epidemics that are in large part driven by sharing of contaminated needles and syringes among the inject-ing drug users.
Other Drugs, Asia and Pacific, Global SMART Programme, 2010.14 Pills are crushed, dissolved and injected.15 UNODC, Patterns and Trends of Amphetamine-Type Stimulants and
Other Drugs, Asia and Pacific, Global SMART Programme, 2010
Infection with the hepatitis C virus (HCV), another major health consequence of injecting, is also reportedly high in the countries of East and South-East Asia. Among the countries and areas that reported prevalence of HCV among injecting drug users, this ranged between 50% in Macao, China to over 80% in Indonesia, Myan-mar and Hong Kong, China.16
16 UNODC ARQ.
Fig. 103: Trends in methamphetamine-related arrests in selected countries in East and South-East Asia, 2004-2009
Source: UNODC, Patterns and Trends of Amphetamine-Type Stimulants and Other Drugs, Asia and Pacific, Global SMART Programme, 2010.
0
100
200
300
400
500
600
2004 2005 2006 2007 2008 2009
Bas
elin
e (2
004)
Indonesia JapanRepublic of Korea ThailandLao PDR
9912
1922
2755
5982
90959899
0 20 40 60 80 100
Hong Kong, ChinaIndonesiaMalaysia
ChinaTaiwan, Prov. of China
SingaporeJapan
PhilippinesThailand
CambodiaLao PDR
Korea (Republic of)Brunei Darussalam
Primary drug of abuse among those treated (%)
Fig. 104: Percentage of methamphetamine as the primary substance of abuse among those treated (%), 2009 or latest year available
Source: UNODC ARQ.
0
20,000
40,000
60,000
80,000
100,000
120,000
140,000
160,000
180,000
Indo
nesi
a
Thai
land
Mya
nmar
Cam
bodi
a
Mal
aysi
a
Vie
t N
am
Phili
ppin
es
Nu
mb
er o
f ID
U
0
10
20
30
40
50
60
HIV
pre
vale
nce
(%
)
Injecting drug usersHIV among IDU (%)
Fig. 105: East and South-East Asia: Number of injecting drug users and HIV prevalence among IDU in selected countries, 2009 or latest year available
Source: United Nations Regional Task Force on Injecting Drug use and HIV and AIDS for Asia and the Pacific.

136
World Drug Report 2011
Prevalence of amphetamines-group substances remains highest in Oceania but with declining trends in Australia and New Zealand
Oceania as a region reportedly has the highest preva-lence rate of amphetamines-group substances, ranging between 2% to 2.8% of the population aged 15-64. Marshall Islands, Australia and New Zealand, with annual prevalence rates of 2.7%, 2.7% and 2.1% respec-tively, remain the countries with the highest prevalence rates. The Pacific island states and territories in the region with available data report high prevalence rates of amphetamines-group substances.The annual prevalence of meth/amphetamine use among the population aged 14 and above in Australia declined from 3.4% in 2001 to 2.3% in 2007. Although there is no updated information on annual prevalence of amphetamines use among the general population since 2007, available information points to a continuing decline in the trends of amphetamines use reported through different indicators. Among Australian students aged 12-17 there has been a significant decline in both the lifetime and past month prevalence of amphetamines use from 2002 to 2005 and further to 2008.17 The lifetime prevalence among the students had declined to 3.7% in 2008 from the 6.6% reported in 2002.18
17 White V., Smith G., Australian secondary school students’ use of tobacco, alcohol, and over-the-counter and illicit substance in 2008, Drug Strat-egy Branch, Australian Government Department of Health and Ageing, September 2009.
18 Like in other countries, the lifetime and past month prevalence of amphetamines use among students aged 16-17 is higher (6.2% and 2.4% respectively) than those aged 12-15 years (2.7% and 1.2% respectively).
The monitoring among detainees who were tested for drug use in Australia in 2008 revealed that 22% of detainees tested positive for methamphetamine use, down from 27% in 2007. This proportion was lower than at any point in time since 2000.19
Among the injecting drug users who were interviewed as part of the Illicit Drug Reporting System (IDRS), the
19 Gaffney A., et al Drug Use Monitoring in Australia: 2008 Annual Report on drug use among police detainees, Australian Institute of Criminology, 2010
Fig. 106: Annual prevalence of amphetamines-group substances in selected areas in Oceania, 2007/2008*
* In the case of New Zealand the estimates are for 2008, while for the rest of the countries they are from 2007.
Source: UNODC.
Fig. 107: Australia: Prevalence of amphetamine use among students, 2002, 2005 and 2008
Source: Australian secondary school students’ use of tobacco, alcohol, and over-the-counter and illicit substance in 2008, Drug Strategy Branch, Australian Government Department of Health and Ageing, September 2009.
1.2
1.3
1.6
2.1
2.7
2.7
0 0.5 1 1.5 2 2.5 3
Northern Mariana Islands
American Samoa
Palau
New Zealand
Australia
Marshall Islands
Annual prevalence (%)
6.6
5.3
3.7
1.5
2.6 2.4
0
1
2
3
4
5
6
7
2002 2005 2008
Prev
alen
ce a
mo
ng
12-
17 y
ears
(%
)
Lifetime Past month
24
3129
3129
27 28 27
22
0
5
10
15
20
25
30
35
2000
2001
2002
2003
2004
2005
2006
2007
2008
Ad
ult
det
ain
ess
test
ed p
osi
tive
fo
r am
ph
etam
ine
(%)
Fig. 108: Australia: Proportion of detainees testing positive for use of ampheta-mines, 2000-2008
* Trend data from the 4 original DUMA sites of Bankstown, Parramatta, East Perth and Southport
Source: Drug Use Monitoring in Australia: 2008 Annual Report on drug use among police detainees, Australian Institute of Criminology, 2010.
137
The ATS market
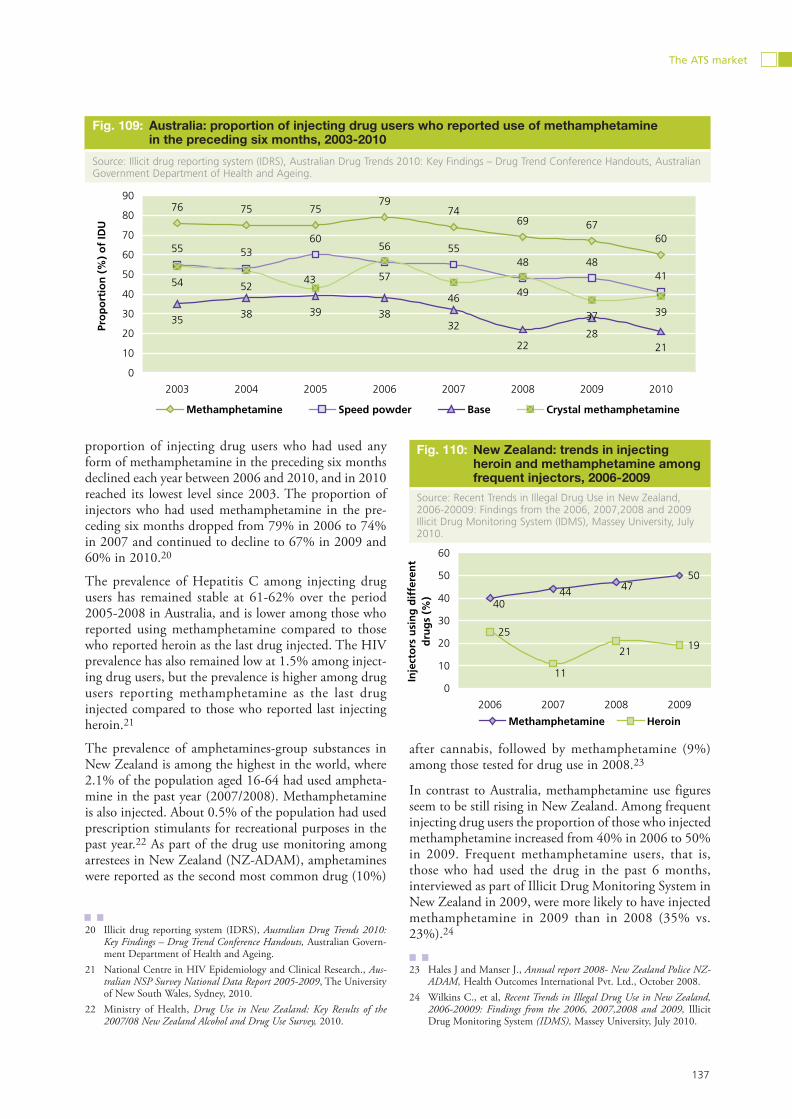
proportion of injecting drug users who had used any form of methamphetamine in the preceding six months declined each year between 2006 and 2010, and in 2010 reached its lowest level since 2003. The proportion of injectors who had used methamphetamine in the pre-ceding six months dropped from 79% in 2006 to 74% in 2007 and continued to decline to 67% in 2009 and 60% in 2010.20
The prevalence of Hepatitis C among injecting drug users has remained stable at 61-62% over the period 2005-2008 in Australia, and is lower among those who reported using methamphetamine compared to those who reported heroin as the last drug injected. The HIV prevalence has also remained low at 1.5% among inject-ing drug users, but the prevalence is higher among drug users reporting methamphetamine as the last drug injected compared to those who reported last injecting heroin.21
The prevalence of amphetamines-group substances in New Zealand is among the highest in the world, where 2.1% of the population aged 16-64 had used ampheta-mine in the past year (2007/2008). Methamphetamine is also injected. About 0.5% of the population had used prescription stimulants for recreational purposes in the past year.22 As part of the drug use monitoring among arrestees in New Zealand (NZ-ADAM), amphetamines were reported as the second most common drug (10%)
20 Illicit drug reporting system (IDRS), Australian Drug Trends 2010: Key Findings – Drug Trend Conference Handouts, Australian Govern-ment Department of Health and Ageing.
21 National Centre in HIV Epidemiology and Clinical Research., Aus-tralian NSP Survey National Data Report 2005-2009, The University of New South Wales, Sydney, 2010.
22 Ministry of Health, Drug Use in New Zealand: Key Results of the 2007/08 New Zealand Alcohol and Drug Use Survey, 2010.
after cannabis, followed by methamphetamine (9%) among those tested for drug use in 2008.23
In contrast to Australia, methamphetamine use figures seem to be still rising in New Zealand. Among frequent injecting drug users the proportion of those who injected methamphetamine increased from 40% in 2006 to 50% in 2009. Frequent methamphetamine users, that is, those who had used the drug in the past 6 months, interviewed as part of Illicit Drug Monitoring System in New Zealand in 2009, were more likely to have injected methamphetamine in 2009 than in 2008 (35% vs. 23%).24
23 Hales J and Manser J., Annual report 2008- New Zealand Police NZ-ADAM, Health Outcomes International Pvt. Ltd., October 2008.
24 Wilkins C., et al, Recent Trends in Illegal Drug Use in New Zealand, 2006-20009: Findings from the 2006, 2007,2008 and 2009, Illicit Drug Monitoring System (IDMS), Massey University, July 2010.
Fig. 109: Australia: proportion of injecting drug users who reported use of methamphetamine in the preceding six months, 2003-2010
Source: Illicit drug reporting system (IDRS), Australian Drug Trends 2010: Key Findings – Drug Trend Conference Handouts, Australian Government Department of Health and Ageing.
76 75 7579
7469 67
6055
6055
4841
35 38 39 3832
2228
21
54
37 39
4853 56
434946
5257
0
10
20
30
40
50
60
70
80
90
2003 2004 2005 2006 2007 2008 2009 2010
Pro
po
rtio
n (
%)
of
IDU
Methamphetamine Speed powder Base Crystal methamphetamine
Fig. 110: New Zealand: trends in injecting heroin and methamphetamine among frequent injectors, 2006-2009
Source: Recent Trends in Illegal Drug Use in New Zealand, 2006-20009: Findings from the 2006, 2007,2008 and 2009 Illicit Drug Monitoring System (IDMS), Massey University, July 2010.
50
2519
474440
11
21
0
10
20
30
40
50
60
2006 2007 2008 2009
Inje
cto
rs u
sin
g d
iffe
ren
t d
rug
s (%
)
Methamphetamine Heroin
138
World Drug Report 2011
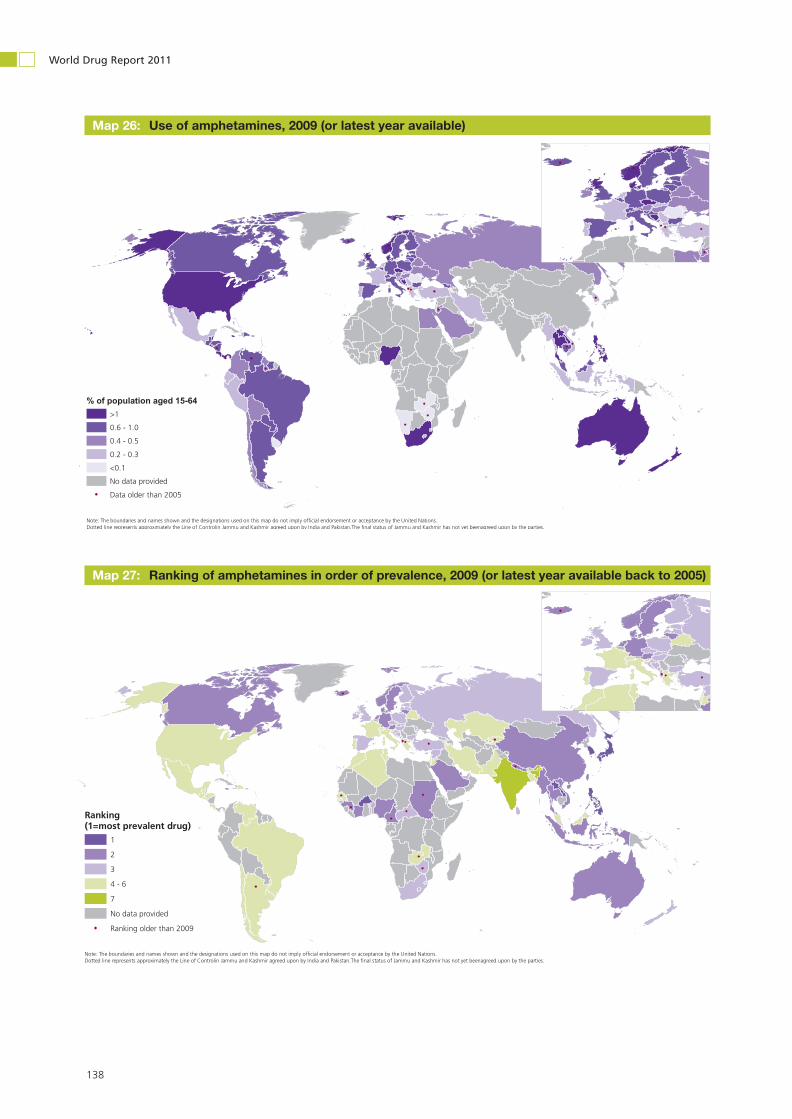
Map 26: Use of amphetamines, 2009 (or latest year available)
Map 27: Ranking of amphetamines in order of prevalence, 2009 (or latest year available back to 2005)
Ç
ÇÇÇÇÇÇ
Ç Ç
ÇÇ
Ç
Ç Ç
Ç
ÇÇÇÇÇÇ
Ç Ç
ÇÇ
Ç
Ç Ç
Ranking of amphetamine-type drugs in order of prevalence, 2009 (or latest year available back to 2005)
1
2
3
4 - 6
7
No data provided
Ranking older than 2009
Ranking (1=most prevalent drug)
Note: The boundaries and names shown and the designations used on this map do not imply official endorsement or acceptance by the United Nations.Dotted line represents approximately the Line of Controlin Jammu and Kashmir agreed upon by India and Pakistan.The final status of Jammu and Kashmir has not yet beenagreed upon by the parties.
Ç
ÇÇÇÇÇ
Ç
ÇÇ
ÇÇ
Ç
ÇÇ
Ç
ÇÇÇÇÇ
Ç
ÇÇ
ÇÇ
Ç
ÇÇ
Use of amphetamines including heroin in 2009 (or latest year available)
% of population aged 15-64>1
0.6 - 1.0
0.4 - 0.5
0.2 - 0.3
<0.1
No data provided
Data older than 2005
Note: The boundaries and names shown and the designations used on this map do not imply official endorsement or acceptance by the United Nations.Dotted line represents approximately the Line of Controlin Jammu and Kashmir agreed upon by India and Pakistan.The final status of Jammu and Kashmir has not yet beenagreed upon by the parties.

139
The ATS market
Map 28: Expert perception of trend changes in the use of amphetamines, 2009 (or latest year available back to 2005)
Map 29: Expert perception of trend changes in the use of methamphetamine, 2009 (or latest year available back to 2005)
Ç
ÇÇÇÇÇÇ
ÇÇ
ÇÇ
Ç
ÇÇ
Ç
ÇÇÇÇÇÇ
ÇÇ
ÇÇ
Ç
ÇÇ
Expert perception of trend changes in the use of metamphetamines, 2009 (or latest year available back to 2005)
Large Increase
Some Increase
No great change
Some Decrease
Large Decrease
No data provided
Trend
Data older than 2009
Note: The boundaries and names shown and the designations used on this map do not imply official endorsement or acceptance by the United Nations.Dotted line represents approximately the Line of Control in Jammu and Kashmir agreed upon by India and Pakistan.The final status of Jammu and Kashmir has not yet beenagreed upon by the parties.
Ç
ÇÇÇÇÇÇ
Ç Ç
ÇÇ
Ç
Ç Ç
Ç
ÇÇÇÇÇÇ
Ç Ç
ÇÇ
Ç
Ç Ç
Expert perception of trend changes in the use of amphetamines, 2009 (or latest year available back to 2005)
Large Increase
Some Increase
No great change
Some Decrease
Large Decrease
No data provided
Data older than 2009
Trend
Note: The boundaries and names shown and the designations used on this map do not imply official endorsement or acceptance by the United Nations.Dotted line represents approximately the Line of Control in Jammu and Kashmir agreed upon by India and Pakistan.The final status of Jammu and Kashmir has not yet beenagreed upon by the parties.

140
World Drug Report 2011
Ecstasy-group substances
Ecstasy-group substances include primarily MDMA and its analogues,25 whose use is often associated with rec-reational settings such as night clubs and raves fre-quented by young people. Prevalence of ‘ecstasy’ use is thus particularly high among younger age cohorts and it often correlates with the number of raves and similar type of dance events taking place. Young people using ‘ecstasy’ may not necessarily be experimenters or regular users of other illicit substances, but being in the general environment of illicit drug use exposes them to increas-ing levels of opportunity and a greater chance to experi-ment with other illicit substances as well. While in developed countries, all sectors of society are affected by ‘ecstasy’ use, such use is still a phenomenon of the middle and upper classes in developing countries.
In 2009, UNODC estimates the global annual preva-lence of ‘ecstasy’ use as between 0.2%-0.6% of the pop-ulation aged 15-64, corresponding to between 11 and 28 million people who had used ‘ecstasy’ at least once in the previous year. As very little information was availa-ble, the estimated annual prevalence for ‘ecstasy’ use
25 Reports have shown that unbeknown to many ecstasy users what is sold to them as ecstasy (MDMA) is often a combination of many psychoactive substances, such as methamphetamine and ketamine. Amphetamines and Ecstasy: 2008 Global ATS Assessment (United Nations publications, Sales No. E.08.XI.12)
appears to have remained at around the same level as in the previous year (2008).
At the global level, most (47%) of the countries respond-ing through the ARQ in 2010 perceived ‘ecstasy’ use to be stable in their countries. In the Americas (83%) and Europe (54%), the majority of the countries reported stable trends for 2009. Similarly, in Africa, the region with the fewest respondents on this question (reflecting low response rates as well as a low spread of ‘ecstasy’ use), the majority of countries (67%) also reported stable trends. The only region where most (47%) of the coun-tries reported decreasing trends in ‘ecstasy’ use was Asia. There are indications that the stabilization or decline of ‘ecstasy’ use has been linked to reductions in the manu-facture of ‘ecstasy’ which, in turn, appears to have been a consequence of some progress made in the control of precursor chemicals. Wherever the supply situation improved however, or where the perceptions of the harmfulness of ‘ecstasy’ declined, demand increased immediately, clearly showing that far more still needs to be done with regard to effective prevention.
North America: signs of increased ‘ecstasy’ use in the United States, decline noted in Canada
The annual prevalence of ‘ecstasy’ use in North America is estimated at 1.1% or around 3.2 million people aged 15-64 who had used ecstasy-group substances in the previous year. Within the region, the United States of
Map 30: Expert perception of trends in the use of undefined amphetamines, 2009 (or latest year available)
Expert perception of trend changes in the use of (undefined) amphetamines, 2009 (or latest year available back to 2005)
Large Increase
Some Increase
No great change
Some Decrease
Large Decrease
No data provided
Data older than 2009
Trend
Ç
ÇÇÇÇÇÇ
Ç Ç
ÇÇ
Ç
Ç Ç
Note: The boundaries and names shown and the designations used on this map do not imply official endorsement or acceptance by the United Nations.Dotted line represents approximately the Line of Control in Jammu and Kashmir agreed upon by India and Pakistan.The final status of Jammu and Kashmir has not yet beenagreed upon by the parties.

141
The ATS market
America has the highest prevalence rate of 1.4% of ‘ecstasy’ use among the general population.
Around 1.1 million people initiated their drug use with ‘ecstasy’ in the United States in 2009, signalling a sig-nificant increase over the previous year (894,000 people in 2008). Most (66.3%) of the ‘ecstasy’ users who had initiated in 2009 were aged 18 years or older, with an average age of 20.2 among those using ‘ecstasy’ for the first time in 2009.26
26 Substance Abuse and Mental Health Services Administration. (2010). Results from the 2009 National Survey on Drug Use and Health: Volume
Since the decline in prevalence of ‘ecstasy’ use in 2002, the trends remained stable between 2003 and 2008, but began to register an increase in 2009.
A similar trend was observed among secondary school students, where the annual prevalence of ‘ecstasy’ use among students in the 8th, 10th and 12th grades, after having remained stable between 2003 and 2008, regis-tered a clear increase over the 2008-2010 period, nota-bly among the younger age groups, the 8th and 10th
I. Summary of National Findings, Rockville, Maryland, USA.
Region/subregion
Estimated number of
users annually (lower)
-Estimated
number of users annually (upper)
Percent of population age 15-64
(lower)
-
Percent of population age 15-64
(upper)
AfricaEast AfricaNorth AfricaSouthern AfricaWest and Central Africa
390,000
190,000
-
-
1,900,000
300,000
0.1
0.2
-
-
0.3
0.4
AmericasCaribbeanCentral AmericaNorth AmericaSouth America
3,770,00020,00020,000
3,210,000520,000
-----
4,020,000240,000
30,0003,210,000
530,000
0.60.10.11.10.2
-----
0.70.90.11.10.2
AsiaCentral AsiaEast/South-East AsiaNear and Middle EastSouth Asia
2,390,000
1,480,000
-
-
17,330,000
6,920,000
0.1
0.1
-
-
0.6
0.5
EuropeEast/South-East EuropeWest/Central Europe
3,680,0001,190,0002,490,000
---
3,920,0001,370,0002,560,000
0.70.50.8
---
0.70.60.8
Oceania 850,000 - 920,000 3.6 - 4.0
Global 11,080,000 - 28,090,000 0.2 - 0.6
Table 32: Annual prevalence and estimated number of ‘ecstasy’ users, by region, subregion and globally, 2009
Region
Member States
providing perception
data
Member States
perception response
rate
Use problem
increased*
Percent use
problem increased*
Use problem stable
Percent use
problem stable
Use problem
decreased*
Percent use
problem decreased*
Africa 3 6% 1 33% 2 67% 0 0%
Americas 6 17% 1 17% 5 83% 0 0%
Asia 17 38% 6 35% 3 18% 8 47%
Europe 24 53% 8 33% 13 54% 3 13%
Oceania 1 7% 0 1 0
Global 51 27% 16 31% 24 47% 11 22%
*Identifies increases/decreases ranging from either some to strong, unweighted by population.
Table 33: Expert perceptions of trends in ‘ecstasy’ use, 2009

142
World Drug Report 2011
graders.27 US data among high school students did not indicate any increase in the availability of ‘ecstasy.’ The increase of ‘ecstasy’ use went, however, hand in hand with reduced risk perceptions of the harmfulness of using the substance.
By contrast, in Canada, ‘ecstasy’ use declined in 2009 compared to the previous year. The annual prevalence of ‘ecstasy’ use among the population aged 15-64 was reported at 1.1% in 2009, down from 1.7% in 2008.28 The annual prevalence among young people, aged 15-19, was 3% in 2009.29
For Mexico there are no recent quantitative estimates on ‘ecstasy’ use. Expert perceptions indicate an increasing ‘ecstasy’ use trend in the country.
In Central and South America, ‘ecstasy’ use remains low in the general population but higher among youth.
There is no update on ‘ecstasy’ use in Central and South America. Available information suggests, however, that the annual prevalence among the general population remains much lower in these subregions than the world average, ranging between 0.1% in Chile and 0.5% in Argentina. El Salvador, Peru and Trinidad and Tobago reported a perceived increase in ‘ecstasy’ use over the past year. As in other countries, information on ‘ecstasy’
27 Johnston, L. D., et al., Monitoring the Future national results on ado-lescent drug use: Overview of key findings, 2010, Institute for Social Research, The University of Michigan, Ann Arbor, Michigan, USA.
28 UNODC ARQ.29 For prevalence among youth, Canada reported only the annual preva-
lence among young people in 2008 as 6.2% among young people aged 12-17, while in 2009, the annual prevalence was reported at 4.5% and last year prevalence at 3% among those aged 15-19.
use among school children in South and Central Amer-ica shows much higher prevalence rates than for the general population. The latest information (2008 or 2009) on lifetime prevalence of ‘ecstasy’ shows the prev-alence rates ranging from 0.5% in the Bolivarian Repub-lic of Venezuela to 3.7% in Chile.
In Brazil, the annual prevalence of ‘ecstasy’ use accord-ing to a national survey conducted among university students in 2009 was 3.1%, clearly exceeding UNODC’s general population estimates of around 0.2%. Like in the rest of the world, ‘ecstasy’ use was found to be more common among male than female students. The annual and past 30 days prevalence was higher among students aged 18-24 than for any other age group.30
30 Andrade, A.G., Duarte, P. and Oliveira, L.G., I Levantamento Nacio-
Fig. 111: United States: Trends in prevalence of ‘ecstasy’ use among the population aged 12 years or older, 2002-2009
Source: Substance Abuse and Mental Health Services Adminis-tration, Results from the 2009 National Survey on Drug Use and Health: Volume I. Summary of National Findings.
Fig. 112: United States: Trends in annual prevalence of ‘ecstasy’ use among secondary school students, 2002-2010
Source: Monitoring the Future: national results on adolescent drug use: Overview of key findings, Institute for Social Research, The University of Michigan, USA.
1.3
0.90.8
0.9
1.1
0.3 0.30.2
0
0.2
0.4
0.6
0.8
1
1.2
1.4
2002 2003 2004 2005 2006 2007 2008 2009
Prev
alen
ce (
%)
Last year Last Month
2.9
2.11.7 1.7
1.4 1.5 1.71.3
2.4
4.9
32.4 2.6 2.8
3.52.9
3.7
4.7
7.4
4.54
3
4.14.5 4.3 4.3 4.5
0
1
2
3
4
5
6
7
8
2002 2003 2004 2005 2006 2007 2008 2009 2010A
nn
ual
pre
vale
nce
(%
)
8th grade 10th grade 12th grade
Fig. 113: South and Central America: lifetime prevalence of ‘ecstasy’ use among youth, 2008 or 2009
Source: UNODC ARQ.
0.5
0.5
0.8
0.9
1.3
1.6
1.7
2
3.7
0 1 2 3 4
Venezuela
Dominican Republic
El Salvador
Bahamas
Ecuador
Bolivia
Uruguay
Argentina
Chile
Lifetime prevalence (%)

143
The ATS market
‘Ecstasy’ use is reported to be stabilizing in Europe, but use patterns are becoming more polarized among club-goers and the general population
The annual prevalence of ‘ecstasy’ use in Europe is esti-mated at 0.7% of the adult population. Between 3.7 and 4 million people aged 15-64 years used ‘ecstasy’ in the past year in Europe. The ‘ecstasy’ use prevalence rate is still higher in West and Central Europe (0.8%) than in East and South-East Europe (0.6%). Most of the countries in Europe are now reporting sta-
nal Sobre O Uso De Álcool, Tabaco E Outras Drogas Entre Universi-tarios Das 27 Capitais Brasileiras, Secretaria Nacional Politicas sobre Drogas, Brasilia 2010.
bilizing trends of ‘ecstasy’ use. Updated or new estimates for ‘ecstasy’ use were available from some countries in Europe, including Belgium, Cyprus, Germany, Spain Sweden and the United Kingdom (England and Wales, and Scotland). Many of these countries have reported a decline in the annual prevalence in their current surveys compared to previous years. This is in line with reports of manufacturing difficulties in a number of European countries in recent years, and thus the use of various other substances than MDMA in ‘ecstasy’ tablets. The Czech Republic, Latvia, Slovakia and the United King-dom remain countries with high ‘ecstasy’ use prevalence rates in the general population.
Like in other parts of the world, most of the ‘ecstasy’ users are young people aged 15-34. The EMCDDA in its annual report for 2010 mentions that practically all of the estimated 2.5 million ‘ecstasy’ users who had used ‘ecstasy’ in the past year were between 15 and 34 years old.
Targeted surveys in nightlife settings in European coun-tries suggest that the prevalence and patterns of stimu-lants and ‘ecstasy’ use, together with alcohol, remains high. Some studies even suggest that drug use patterns among club-goers are becoming increasingly ‘polarized,’ that is, showing ever higher prevalence rates, in sharp contrast to the situation among the general population.31
Lack of information from Africa makes it difficult to determine any trends in ‘ecstasy’ use in the region
Based on very limited country information, the an - nual prevalence of ‘ecstasy’ use – based on UNODC’s
31 EMCDDA, The State of the Drugs Problem in Europe: Annual Report 2010, 2010.
11
4.9
0.9
7.5
11.2
1.8
7.5
4.74.3
2.81.91.9 2.2
3.1
0.71.3
2.5
1.7
0.7
0
2
4
6
8
10
12
Male Female 18 18-24 25-34 35 total
Prev
alen
ce (
%)
Lifetime Annual Monthly
Fig. 114: Brazil: prevalence of ‘ecstasy’ use among university students, 2009
Source: I Levantamento Nacional Sobre O Uso De Álcool, Tabaco E Outras Drogas Entre Universitarios Das 27 Capitais Brasileiras, Secretaria Nacional Politicas sobre Drogas.
Fig. 115: Europe: trends in ‘ecstasy’ use in selected countries and areas, various years
Source: EMCDDA; UNODC ARQ.
0.1
1.1 1
0.6 0.7 0.8
0.4 0.40.2 0.3
0.1
1.81.5
1.81.6 1.5
1
3.2
2.5
1.9
1.41.2 1.2
0.8
0
0.5
1
1.5
2
2.5
3
3.5
Belg
ium
'94
Belg
ium
'07
Cyp
rus
'06
Cyp
rus
'09
Ger
man
y '0
0
Ger
man
y '0
3
Ger
man
y '0
6
Ger
man
y '0
9
Swed
en '
00
Swed
en '
07
Swed
en '
08
Engl
and
and
Wal
es '
06/0
7
Engl
and
and
Wal
es '
07/0
8
Engl
and
and
Wal
es '
08/0
9
Engl
and
and
Wal
es '
09/1
0
Scot
land
'03
Scot
land
'04
Scot
land
'06
Scot
land
'09
Spai
n '0
1
Spai
n '0
3
Spai
n '0
5/06
Spai
n '0
7/08
Spai
n '0
9/10
An
nu
al p
reva
len
ce (
%)

144
World Drug Report 2011
standard model - is estimated between 0.1% and 0.3% in Africa. The actual figures are probably closer to the lower end of the range or perhaps even below that range, as ‘ecstasy’ use in Africa is still primarily a phenomenon of youth from the upper classes and/or concentrations in some tourist resorts where the prime target group is foreigners from overseas. The wide range in the esti-mates is due to missing data or information on ‘ecstasy’ use from most of the region. Only three countries in Africa - Algeria, Morocco and South Africa - reported expert opinions on ‘ecstasy’ use trends through the ARQ in 2009. While Morocco reported an increase in ‘ecstasy’ use, Algeria and South Africa reported stabilizing trends for 2009.
Mixed trends on ‘ecstasy’ use reported from Asia
In 2009, nearly half (47%) of the Asian countries report-ing expert opinion on ‘ecstasy’ use through the ARQ considered its trends to be decreasing, while one third of the countries reported increasing trends in the past year. The annual prevalence of ‘ecstasy’ use in Asia is esti-mated between 0.1% and 0.6% of the population aged 15-64, or some 2.4 to 17 million people who could have used ‘ecstasy’ at least once in the previous year. The wide range in the estimates reflects the uncertainty due to lack of information on ‘ecstasy’ use for most parts of Asia.
‘Ecstasy’ use in New Zealand and Australia remains high
Oceania (primarily Australia and New Zealand) has the highest prevalence of ‘ecstasy’ use in the world, with annual prevalence ranging from 3.6% to 4% of the adult population. This corresponds to between 850,000 and 920,000 people who had used ‘ecstasy’ at least once in the preceding year.
The annual prevalence of ‘ecstasy’ use among the popu-lation aged 16-64 in New Zealand ranged from 2% to 3%, or an estimated 67,000 people which reported having used ‘ecstasy’ in the previous year (2007/2008). The highest prevalence, like in other countries, was reported among the 18-24 year age group; higher among men than women (annual prevalence of 8.9% among men and 4.9% among women in this age group). Most of the ‘ecstasy’ users in New Zealand were reported to have used it with alcohol (78.9%), cannabis (42.8%) and benzylpiperazine (BZP) party pills32 (13.5%).33
In Australia, ‘ecstasy’ use was estimated at around 4.2% of the population aged 15-64 in 2007. Since then, there has been no update on drug use prevalence in Australia. However, in 2010, a survey carried out among 974 ath-letes indicated that one quarter had been offered or had the opportunity to use ‘ecstasy’ in the past 12 months. This was a higher proportion than for cannabis (22%) and cocaine (17%). Past year ‘ecstasy’ use was reported by 3.2% of the sample.34
32 Products containing benzylpiperazine (BZP) and related substances, with stimulant and euphoric effects.
33 Ministry of Health Drug Use in New Zealand: Key Results of the 2007/08, New Zealand Alcohol and Drug Use Survey, 2010.
34 Dunn, M. and Thomas, J.O., ‘Attitudes toward, knowledge of, and prevalence of recreational drug use among elite Australian athletes,’ EDRS Drug Trends Bulletin, April 2010, Sydney: National Drug and Alcohol Research Centre, University of New South Wales.
Decrease Stable Increase
China Korea (Republic of) Armenia
Hong Kong, China Kuwait Georgia
Macao, China Malaysia Israel
Indonesia Lebanon
Japan Pakistan
Kazakhstan Viet Nam
Singapore
Thailand
Table 34: Asia: countries and areas reporting expert perception in ‘ecstasy’ use in 2009
Source: UNODC ARQ.

145
The ATS market
Map 31: Use of ‘ecstasy’ in 2009 (or latest year available back to 2005)
Ç
ÇÇÇÇÇ
Ç
ÇÇ
ÇÇ
Ç
ÇÇ
Ç
ÇÇÇÇÇ
Ç
ÇÇ
ÇÇ
Ç
ÇÇ
Use of ecstasy in 2009 (or latest year available)
% of population aged 15-64
>1.0
0.6 - 1.0
0.4 - 0.5
0.2 - 0.3
<0.1
No data provided
Data older than 2005
Note: The boundaries and names shown and the designations used on this map do not imply official endorsement or acceptance by the United Nations.Dotted line represents approximately the Line of Controlin Jammu and Kashmir agreed upon by India and Pakistan.The final status of Jammu and Kashmir has not yet beenagreed upon by the parties.
Map 32: Expert perception of trend changes in the use of ‘ecstasy’, 2009 (or latest year available back to 2005)
Ç
ÇÇÇÇÇÇ
ÇÇ
ÇÇ
Ç
ÇÇ
Expert perception of trend changes in the use of ecstasy, 2009 (or latest year available back to 2005)
Large Increase
Some Increase
No great change
Some Decrease
Large Decrease
No data provided
Data older than 2009
Trend
Note: The boundaries and names shown and the designations used on this map do not imply official endorsement or acceptance by the United Nations.Dotted line represents approximately the Line of Control in Jammu and Kashmir agreed upon by India and Pakistan.The final status of Jammu and Kashmir has not yet beenagreed upon by the parties.

146
World Drug Report 2011
4.3 Manufacture
Unlike the illicit cultivation of coca plant and opium poppy which is constrained to specific locations, the manufacture of ATS is not geographically limited. ATS laboratories tend to be located close to the illicit markets for these drugs. Precursors and other chemicals used in the illicit manufacture of ATS are frequently trafficked across regions.
Over the past two decades, there has been a spread in ATS manufacture, with more than 60 Member States having reported ATS manufacturing activity to date. Manufacture has been reported from all regions of the world. Since 2000, significant ATS manufacture has been reported to UNODC in a number of small clan-destine laboratories, as well as in larger-scale operations, from Australia, Belgium, Bulgaria, Canada, China,35 the Czech Republic, Germany, Indonesia, Malaysia, Mexico, Republic of Moldova, Myanmar, the Netherlands, New Zealand, the Philippines, Poland, the Russian Federa-tion, Slovakia, South Africa and the United States of America.
35 Includes all provinces and Special Administrative Regions.
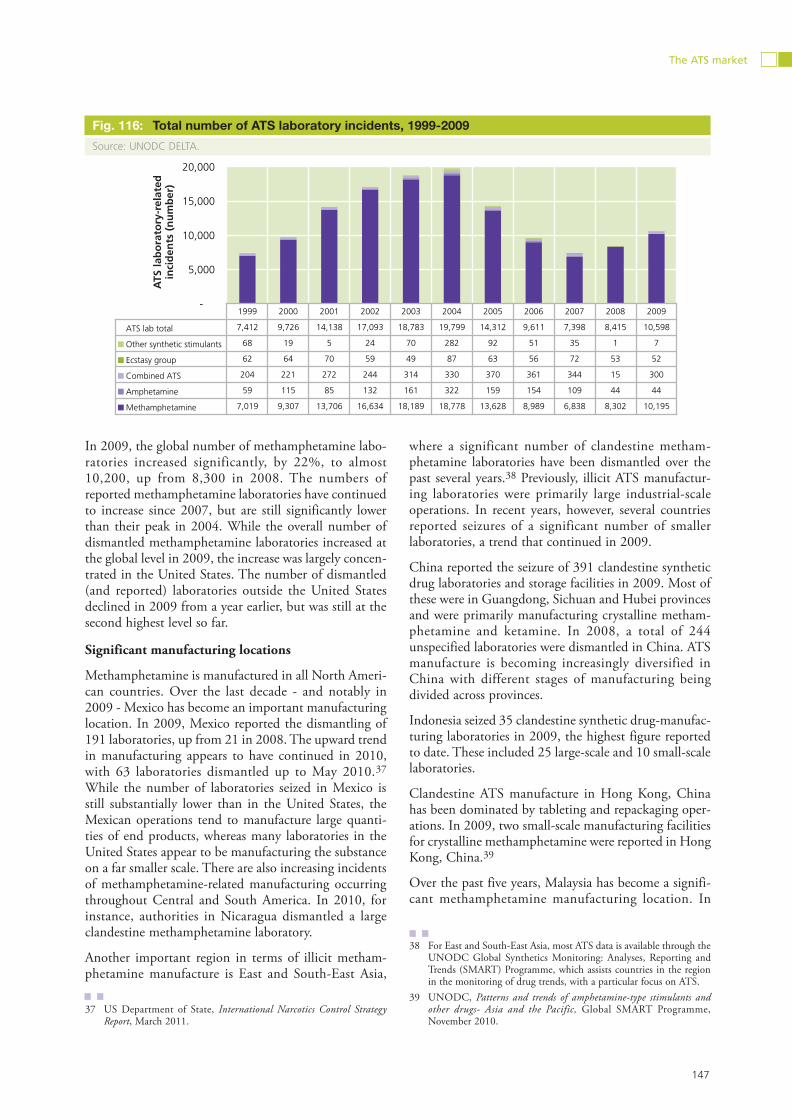
The global number of ATS laboratories continues to increase
In 2009, the seizure of some 10,600 ATS-related labo-ratories was reported to UNODC through the Annual Reports Questionnaire, which represents an increase of 26% from the 8,400 laboratories reported in 2008, though still down from the peak of 19,800 reported in 2004.36 The overall trend reflects seizures reported from the United States which continues to dismantle the vast majority of all illicit ATS laboratories worldwide. Small methamphetamine labs are the typical pattern in the United States.
Methamphetamine is still, by far, the most widely man-ufactured amphetamine-type stimulant worldwide. Amphetamine and ‘ecstasy’ manufacture operations tend to be fewer in number but more sophisticated, as they require more specialized equipment, precursor chemicals and greater skill levels.
36 As there is no standardized definition of a clandestine laboratory, figures reflect any stage of a seized laboratory operation reported to UNODC, such as a location containing laboratory equipment and chemicals in preparation for manufacturing, a location where synthesis or tableting are/were occurring and toxic dumpsites where chemicals and equipment are illicitly discarded.
Map 33: Member States reporting ATS-related manufacture* since 1990
Ç
ÇÇÇÇÇÇ
ÇÇ
ÇÇ
Ç
ÇÇ
Ç
ÇÇÇÇÇÇ
ÇÇ
ÇÇ
Ç
ÇÇ
Member States reporting ATS-related manufacture* since 1990
Recent incidents (2009-2010)
Previous incidents (1990-2008)
No records of incidents since 1990
At least one incident of ATS-related manufacture activity
* Includes ATS precursor extraction laboratories and attempts thwarted by law enforcement.Note: The boundaries and names shown and the designations used on this map do not imply official endorsement or acceptance by the United Nations. Dotted line represents approximately the Line of Controlin Jammu and Kashmir agreed upon by India and Pakistan.The final status of Jammu and Kashmir has not yet beenagreed upon by the parties.
147
The ATS market
In 2009, the global number of methamphetamine labo-ratories increased significantly, by 22%, to almost 10,200, up from 8,300 in 2008. The numbers of reported methamphetamine laboratories have continued to increase since 2007, but are still significantly lower than their peak in 2004. While the overall number of dismantled methamphetamine laboratories increased at the global level in 2009, the increase was largely concen-trated in the United States. The number of dismantled (and reported) laboratories outside the United States declined in 2009 from a year earlier, but was still at the second highest level so far.
Significant manufacturing locations
Methamphetamine is manufactured in all North Ameri-can countries. Over the last decade - and notably in 2009 - Mexico has become an important manufacturing location. In 2009, Mexico reported the dismantling of 191 laboratories, up from 21 in 2008. The upward trend in manufacturing appears to have continued in 2010, with 63 laboratories dismantled up to May 2010.37 While the number of laboratories seized in Mexico is still substantially lower than in the United States, the Mexican operations tend to manufacture large quanti-ties of end products, whereas many laboratories in the United States appear to be manufacturing the substance on a far smaller scale. There are also increasing incidents of methamphetamine-related manufacturing occurring throughout Central and South America. In 2010, for instance, authorities in Nicaragua dismantled a large clandestine methamphetamine laboratory.
Another important region in terms of illicit metham-phetamine manufacture is East and South-East Asia,
37 US Department of State, International Narcotics Control Strategy Report, March 2011.
where a significant number of clandestine metham-phetamine laboratories have been dismantled over the past several years.38 Previously, illicit ATS manufactur-ing laboratories were primarily large industrial-scale operations. In recent years, however, several countries reported seizures of a significant number of smaller laboratories, a trend that continued in 2009.
China reported the seizure of 391 clandestine synthetic drug laboratories and storage facilities in 2009. Most of these were in Guangdong, Sichuan and Hubei provinces and were primarily manufacturing crystalline metham-phetamine and ketamine. In 2008, a total of 244 unspecified laboratories were dismantled in China. ATS manufacture is becoming increasingly diversified in China with different stages of manufacturing being divided across provinces.
Indonesia seized 35 clandestine synthetic drug-manufac-turing laboratories in 2009, the highest figure reported to date. These included 25 large-scale and 10 small-scale laboratories.
Clandestine ATS manufacture in Hong Kong, China has been dominated by tableting and repackaging oper-ations. In 2009, two small-scale manufacturing facilities for crystalline methamphetamine were reported in Hong Kong, China.39
Over the past five years, Malaysia has become a signifi-cant methamphetamine manufacturing location. In
38 For East and South-East Asia, most ATS data is available through the UNODC Global Synthetics Monitoring: Analyses, Reporting and Trends (SMART) Programme, which assists countries in the region in the monitoring of drug trends, with a particular focus on ATS.
39 UNODC, Patterns and trends of amphetamine-type stimulants and other drugs- Asia and the Pacific, Global SMART Programme, November 2010.
Fig. 116: Total number of ATS laboratory incidents, 1999-2009
Source: UNODC DELTA.
-
5,000
10,000
15,000
20,000A
TS la
bo
rato
ry-r
elat
ed
inci
den
ts (
#)
ATS lab total 7,412 9,726 14,138 17,093 18,783 19,799 14,312 9,611 7,398 8,415 10,598
Other synthetic stimulants 68 19 5 24 70 282 92 51 35 1 7
Ecstasy group 62 64 70 59 49 87 63 56 72 53 52
Combined ATS 204 221 272 244 314 330 370 361 344 15 300
Amphetamine 59 115 85 132 161 322 159 154 109 44 44
Methamphetamine 7,019 9,307 13,706 16,634 18,189 18,778 13,628 8,989 6,838 8,302 10,195
1999 2000 2001 2002 2003 2004 2005 2006 2007 2008 2009
ATS
lab
ora
tory
-rel
ated
in
cid
ents
(n
um
ber
)

148
World Drug Report 2011
2009, 11 clandestine ATS manufacturing laboratories were seized. Most of the laboratories were located in Kuala Lumpur and southern Malaysia.40
In the Philippines, illicit manufacture of crystalline methamphetamine was first reported in 1996, and in 1997, the first industrial-scale clandestine manufactur-ing facility was reported. The manufacture of crystalline methamphetamine continues in the Philippines, with 9 manufacturing laboratories detected in 2009. Clandes-tine methamphetamine manufacturing laboratories have been seized across the country in recent years and have been located in both rural and urban areas. The labora-tories have also shifted from large and medium-sized facilities in previous years to smaller ‘kitchen type’ facil-ities in 2009.41 In 2009, most of the seized clandestine laboratories were again located in urban areas.42
Myanmar main source of methamphetamine pills in South-East Asia
Myanmar is the primary source of the region’s metham-phetamine in pill form. Reported seizures of clandestine manufacturing laboratories in Myanmar in previous years have mainly consisted of tableting operations. This is inconsistent, however, with the vast number of pills seized throughout the region. Extensive forensic profil-ing of methamphetamine seized in Thailand suggests that there are likely 12 large-scale methamphetamine manufacturing operations in the ‘Golden Triangle’
40 UNODC, Patterns and trends of amphetamine-type stimulants and other drugs- Asia and the Pacific, Global SMART Programme, November 2010.
41 Communication with the Philippine Drug Enforcement Agency, August 2010.
42 Philippine Drug Enforcement Agency, Philippine National ATS Situation 2008-2009, presented at the Global SMART Programme Regional Workshop, Bangkok, 5-6 August 2010.
region. While there have been no facilities seized for crystalline methamphetamine manufacture, authorities in both Myanmar and Thailand confirm that manufac-ture occurs in Myanmar and has been the source of most crystalline methamphetamine seized in the northern part of Thailand in the past few years.
In Japan, the illicit manufacture of ATS is rare. In June 2010, however, police arrested two nationals of the Islamic Republic of Iran on suspicion of manufacturing methamphetamine. This was the first such incident in the country since 1995.
Australia and New Zealand report methampheta-mine manufacture; little data from the Pacific Island states and territories
In Oceania, ATS manufacture has been reported from Australia and New Zealand. Australia reported the dis-mantling of 316 ATS manufacturing laboratories in 2009. Most of the laboratories were identified as manu-facturing methamphetamine and amphetamine. New Zealand reported that a total of 135 laboratories were dismantled in 2009, primarily for methamphetamine. Further increases in the number of laboratories might be recorded in 2010 due to the increased efforts of the Government of New Zealand to tackle methampheta-mine.43
Little data is available from the Pacific Island states and territories, which remain vulnerable to illicit manufac-ture of amphetamine-type stimulants, given the fact that several of the countries are not parties to the 1988 United Nations Convention Against Illicit Traffic in Narcotic Drugs and Psychotropic Substances.44
43 Monthly Illicit Drug Assessment, National Drug Intelligence Bureau (NDIB), Wellington, January 2010.
44 These include Kiribati, Nauru, Palau, Papua New Guinea, Solomon
Fig. 117: Number of reported methamphetamine laboratory incidents, 1999-2009
Source: UNODC DELTA.
10,195
18,778
-
200
400
600
800
1,000
1,200
1,400
1999 2000 2001 2002 2003 2004 2005 2006 2007 2008 2009
Met
h la
bo
rato
ries
in s
elec
ted
reg
ion
s (#
)
0
5,000
10,000
15,000
20,000
Total (an
d U
SA) M
eth lab
orato
ries (#)Oceania West & Central Europe Southern AfricaEast Europe East and South-East Asia USA (right-scale)Global (right scale)
Met
h l
abo
rato
ries
in
sel
ecte
d r
egio
ns
(nu
mb
er)
Total (an
d U
SA) M
eth lab
orato
ries (n
um
ber)

149
The ATS market
Level of methamphetamine manufacture in Europe comparatively low
Compared to most other regions of the world, illicit manufacture of methamphetamine in Europe is fairly low. Until recently, methamphetamine manufacture was largely confined to the Czech Republic, where some 300-400 mostly small-scale manufacturing sites are being dismantled every year. These are so-called kitchen laboratories, which typically manufacture a few grams of drugs at a time. Seizures of methamphetamine manufac-turing facilities were also reported to Europol in neigh-bouring countries such as Slovakia, Germany, Poland and Austria. The second hub of methamphetamine supply is centred around the Baltic countries, particu-larly Lithuania and Estonia.45
Methamphetamine manufacture is rarely reported from Africa, except for South Africa and Egypt. In 2009, 10 methamphetamine laboratory incidents were reported from South Africa, compared to 20 such incidents reported for 2008.
The global number of dismantled amphetamine laboratories remains stable
In 2009, 44 amphetamine laboratories were reported, remaining essentially stable compared to 2008. Most of these laboratories continue to be reported in Europe, particularly West, Central and East Europe.
According to the European Monitoring Centre on Drugs and Drug Addiction, most amphetamine seized in Europe is manufactured, in order of importance, in the Netherlands, Poland and Belgium, and to a lesser extent in Estonia, Lithuania and the United Kingdom. In 2007, 29 sites involved in the production, tableting or storage of amphetamine were discovered in the Euro-pean Union and reported to Europol.
The relatively low number of amphetamine laboratories reported is inconsistent with the high number of global amphetamine seizures which have continued to rise over the past two years.
Increase in seizures of precursors for methamphetamine and amphetamine manufacture
Ephedrine and pseudoephedrine are the main precursors for methamphetamine and both substances are control-led in Table I of the 1988 United Nations Convention Against Illicit Traffic in Narcotic Drugs and Psycho-tropic Substances. Seizures of these precursors can pro-vide some indications about manufacturing trends. In 2009, 41.9 mt of ephedrine and 7.2 mt of pseudoephe-drine were seized, compared to 18.2 mt of ephedrine
Islands and Tuvalu, status as of 7 April 2011.45 EMCDDA, Amphetamine and methamphetamine use in Europe,
Lisbon, November 2010.
and 5.1 mt of pseudoephedrine in 2008.46 Recently, there has been a shift from bulk substances to pharma-ceutical preparations used in the illicit manufacture of methamphetamine.
46 International Narcotics Control Board, Precursors and chemicals fre-quently used in the illicit manufacture of narcotic drugs and psychotropic substances, E/INCB/2010/4, March 2011.
0
50
100
150
200
250
300
350
1999
2000
2001
2002
2003
2004
2005
2006
2007
2008
2009
Am
ph
etam
ine
lab
ora
tori
es (
nu
mb
er)
Europe Americas Asia
Fig. 118: Number of seized amphetamine laboratories, 1999-2009
Source: UNODC ARQ.
Fig. 119: Global seizures of ephedrine and pseudoephedrine, 2005-2009*
* The chart is based on data on domestic seizures and on seizures effected at points of entry or exit. They do not include reported seizures of substances where it is known that the substances were not intended for the illicit manufacture of drugs. Stopped ship-ments are also not included.
Source: INCB.
0
10,000
20,000
30,000
40,000
50,000
60,000
2005 2006 2007 2008 2009
Qu
anti
ty [
kg]
Ephedrine Pseudoephedrine

150
World Drug Report 2011
Traffickers adopt alternative strategies to evade stricter control measures
As awareness, restrictions and enforcement against illicit ATS manufacture increases, manufacturing operations tend to move to more vulnerable countries. When con-trols over precursors were strengthened in the United States, manufacture shifted to Mexico. As Mexico has responded with strong counter-methamphetamine ini-tiatives, manufacturing activities are increasingly reported from countries in Central and South America.
Traffickers also resort to substitute chemicals. As Gov-ernments have restricted the availability of ephedrine and pseudoephedrine, some traffickers could turn to other chemicals such as norephedrine which can replace these two chemicals with only slight modifications to the illicit manufacturing process. Traffickers have also attempted to divert the ephedra plant - a natural source of ephedrine - for illicit ATS manufacture. In addition, there have been reports that traffickers transform exist-ing precursors into new uncontrolled chemicals, which are subsequently converted back to the original precur-sor chemical once in the final destination country.
A precursor chemical commonly used in the illicit man-ufacture of methamphetamine and amphetamine is 1-phenyl-2-propanone (P-2-P). The diversion of this chemical may be fuelling the market for amphetamine in the Near and Middle East, where amphetamine is often sold as Captagon on illicit markets. In 2009 and
2010, Jordan reported the world’s highest annual legiti-mate requirement of P-2-P to the International Narcot-ics Control Board, accounting for half of the global total. The high legitimate need is based on the pur-ported formulation of P-2-P into cleaning and disinfec-tion products. The volume represents a significant risk of diversion into illicit manufacture, however, particu-larly as P-2-P is not an essential ingredient in the formu-lation of cleaning and disinfection products and alternative chemicals exist.
Number of reported ecstasy-group laboratories remains essentially stable
In 2009, 52 ecstasy-group laboratories were reported, compared to 53 in 2008. The highest number of dis-mantled laboratories was reported from Asia and Oce-ania, namely Indonesia (18) and Australia (19). This might indicate that Indonesia has replaced Europe as the main source for ‘ecstasy’ used in South-East Asia.
In the past, ecstasy-group substances used to be manu-factured predominantly in West Europe. Manufacture peaked in 2000, when 50 laboratories were reported as having been dismantled in Europe. Since that time, however, manufacture of ecstasy-group substances has shifted away from the region to a number of other mar-kets around the world. Large-scale manufacturing oper-ations are more frequently being dismantled in East and South-East Asia, the Americas and Oceania. In 2008, only four laboratories were reported from Europe; for
Notable ephedrine & pseudoephedrinetrafficking route cases
Routes identified in 2008-2010Established trafficking routes
Note: The boundaries and names shown and the designations used on this map do not imply official endorsement or acceptance by the United Nations. Lines represent origin and intended destination, not necessarily exact
route, and include completed or stopped trafficking attempts. Modes of transport include by air, sea, overland, or any combination thereof.
Other government sources include: ACC (2010), DEA-ODC (2008), INSCR (2011), NDIB (2009), RCMP (2010 and previous years) and WCO (2010 and previous years)
Map 34: Routes of notable ephedrine/pseudoephedrine diversion, 2008-2010
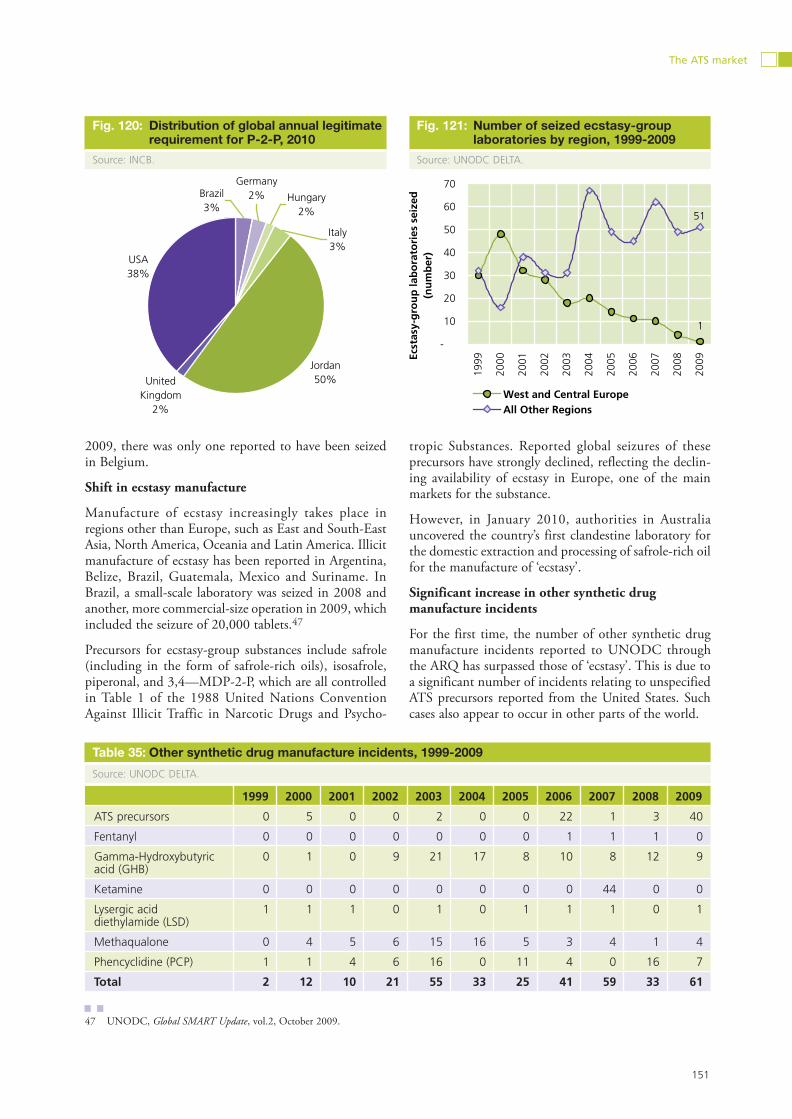
151
The ATS market
2009, there was only one reported to have been seized in Belgium.
Shift in ecstasy manufacture
Manufacture of ecstasy increasingly takes place in regions other than Europe, such as East and South-East Asia, North America, Oceania and Latin America. Illicit manufacture of ecstasy has been reported in Argentina, Belize, Brazil, Guatemala, Mexico and Suriname. In Brazil, a small-scale laboratory was seized in 2008 and another, more commercial-size operation in 2009, which included the seizure of 20,000 tablets.47
Precursors for ecstasy-group substances include safrole (including in the form of safrole-rich oils), isosafrole, piperonal, and 3,4—MDP-2-P, which are all controlled in Table 1 of the 1988 United Nations Convention Against Illicit Traffic in Narcotic Drugs and Psycho-
47 UNODC, Global SMART Update, vol.2, October 2009.
tropic Substances. Reported global seizures of these precursors have strongly declined, reflecting the declin-ing availability of ecstasy in Europe, one of the main markets for the substance.
However, in January 2010, authorities in Australia uncovered the country’s first clandestine laboratory for the domestic extraction and processing of safrole-rich oil for the manufacture of ‘ecstasy’.
Significant increase in other synthetic drug manufacture incidents
For the first time, the number of other synthetic drug manufacture incidents reported to UNODC through the ARQ has surpassed those of ‘ecstasy’. This is due to a significant number of incidents relating to unspecified ATS precursors reported from the United States. Such cases also appear to occur in other parts of the world.
Fig. 120: Distribution of global annual legitimate requirement for P-2-P, 2010
Source: INCB.
Fig. 121: Number of seized ecstasy-group laboratories by region, 1999-2009
Source: UNODC DELTA.
1999 2000 2001 2002 2003 2004 2005 2006 2007 2008 2009
ATS precursors 0 5 0 0 2 0 0 22 1 3 40
Fentanyl 0 0 0 0 0 0 0 1 1 1 0
Gamma-Hydroxybutyric acid (GHB)
0 1 0 9 21 17 8 10 8 12 9
Ketamine 0 0 0 0 0 0 0 0 44 0 0
Lysergic acid diethylamide (LSD)
1 1 1 0 1 0 1 1 1 0 1
Methaqualone 0 4 5 6 15 16 5 3 4 1 4
Phencyclidine (PCP) 1 1 4 6 16 0 11 4 0 16 7
Total 2 12 10 21 55 33 25 41 59 33 61
Table 35: Other synthetic drug manufacture incidents, 1999-2009
Source: UNODC DELTA.
1
51
-
10
20
30
40
50
60
70
1999
2000
2001
2002
2003
2004
2005
2006
2007
2008
2009Ec
stas
y-g
rou
p la
bo
rato
ries
sei
zed
(n
um
ber
)
West and Central EuropeAll Other Regions
Jordan50%
USA38%
United Kingdom
2%
Italy3%
Hungary2%
Germany2%Brazil
3%

152
World Drug Report 2011
The number of GHB laboratory incidents decreased from 12 in 2008 to 9 in 2009. No ketamine laboratory was reported through the ARQ. As ketamine is not under international control, however, the extent of man-ufacture is probably underreported. Government sources in China indicate that ketamine laboratories are regu-larly dismantled in that country.
Seizures of precursors used in the illicit manufacture of ATS
Chemical precursors are necessary for the synthesis of amphetamine-type stimulants, and many of the chemi-cals are controlled internationally through the 1988 United Nations Convention Against Illicit Traffic in Narcotic Drugs and Psychotropic Substances. Their seizures are reported to the International Narcotics Con-trol Board and can provide some indications about trends in illicit manufacture.
Seizures in 2009 included:
Amphetamines-group
• Methamphetamine: 41,931 kg of ephedrine and 7,241 kg of pseudoephedrine, sufficient to manufac-ture 32.7 mt of methamphetamine.
• Amphetamine: 4,885 litres of phenyl-2-propoanone (P-2-P), sufficient for 2.4 mt of amphetamine or methamphetamine.
• 195 kg of norephedrine, sufficient to manufacture 130 kg of amphetamine.
Ecstasy-group • 40 litres of 3,4-MDP-2-P, enough to manufacture 33
kg of MDMA; • 1048 l of safrole oil, sufficient to manufacture 222 kg
of MDMA; • 4.3 mt of piperonal which could be converted into
1.6 mt of MDMA; and • 5 l of isosafrole, which could be used in the manufac-
ture of 2.36 kg of MDMA.
The low amounts of precursor chemicals seized are inconsistent with the size of the consuming market, sug-gesting that much of the trafficking of precursors needed for ATS manufacture goes undetected. Criminal organi-zations adopt several strategies to avoid control by traf-ficking precursors through new locations, such as Africa, by relocating manufacturing operations to new coun-tries and by changing precursor chemicals.
Seizure data for precursors can only provide a partial picture of precursor availability. Diversions and stopped shipments are not included in the traditional seizure statistics, neither are domestic diversions followed by onward smuggling.
These figures largely represent raw chemical seizures and in some cases pharmaceutical preparations, and thus are not representative of all precursors seized.
No amphetamines-group seizuresreports (2005-2009)
Amphetamines-group seizures (2005 - 2009)
Main routes Methamphetamine Amphetamine
Other/ notable routes Methamphetamine Amphetamine
Methamphetamine
Amphetamine
Amphetamines-group seizures
Known notable locations ofmanufacture/tableting
Notable trafficking routes
Other government sources include: ACC (2010), DCHIRI (2008), ICPO (2010), INSCR (2011), JNPA (2010), LDECB (2008), RCMP (2010), TKOM (2008-2009), and WCO (2010)Note: The boundaries and names shown and the designations used on this map do not imply official endorsement or acceptance by the United Nations. Lines represent origin and intended des�na�on, not necessarily exact
route, and include completed or stopped trafficking a�empts. Modes of transport include by air, sea, overland, or any combina�on thereof.
Map 35: Notable locations of manufacture and main trafficking routes of ATS

153
The ATS market
No ecstasy seizures reported toUNODC (2005-2009)
Ecstasy seizures reported toUNODC (2005-2009)
Note: The boundaries and names shown and the designations used on this map do not imply official endorsement or acceptance by the United Nations. Lines represent origin and intended des�na�on, not necessarily exact
route, and include completed or stopped trafficking a�empts. Modes of transport include by air, sea, overland, or any combina�on thereof.
Main routes
Other/ notable routes
Notable trafficking routesKnown notable sources of manufacture/ tableting
Ecstasy-group
Ecstasy-group seizures
Other government sources include: ACC (2010), DCHIRI (2008), ICPO (2010), INSCR (2011), JNPA (2010), LDECB (2008), RCMP (2010), TKOM (2008-2009), and WCO (2010)
Map 36: Notable locations of manufacture and main trafficking routes of ecstasy-group substances

154
World Drug Report 2011
4.4 Trafficking
Global ATS seizures
In 2009, global seizures of ATS rose significantly (by 16%), slightly exceeding the high level of 2007 (follow-ing a dip of 9% in 2008). The increase was driven by the quantities of seized methamphetamine, which rose markedly to 31 mt (from 22 mt in 2008) and ampheta-mine, which rose more moderately (33 mt, up from 30 mt in 2008). Seizures of ecstasy amounted to 5.4 mt, remaining below the reduced level of 2008. The increases in methamphetamine and amphetamine were also partly offset by a drop in seizures of non-specified ampheta-mines, so that total ATS seizures in 2009 amounted to 71 mt. Due to the paucity of data from some countries, the decline in non-specified amphetamines is not statis-tically significant, and the total for amphetamine, meth-amphetamine and ecstasy rose by 22% in 2009.
Seizures of amphetamine-type stimulants are reported by weight (in kg), by volume (in litres, usually when the seized drugs are in liquid form) and by number of tab-lets, doses or ‘units’. Although UNODC maintains and publishes records to reflect - as closely as possible - sei-zure quantities as reported by countries, it is often useful to aggregate data of different types to compare over time or across countries and regions. For the purposes of this aggregation, conversion factors are used to convert the quantities into ‘kilogram equivalents.’
The aggregate statistics used in this report depend on the conversion factors used, and the impact of these conversion factors can be especially pronounced in the case of amphetamine-type stimulants, as a significant share of seizures of these drug types are quantified by number of tablets. In previous editions of the World Drug Report the conversion factors used were intended to reflect the amount of psychoactive ingredient in the seized tablets. In order to enhance the comparability with seizures reported by weight, which are quantified by bulk weight and can only be adjusted for purity in a minority of cases where the availability of data allows, UNODC has revised the conversion factors used for amphetamine-type stimulants to reflect the bulk weight of the seized tablets. The new factors are based on foren-sic studies and range between 90 mg and 300 mg per tablet, depending on the region as well as the drug type. These factors are subject to revision as the available information improves; details can be found in the meth-odology section.
Although trafficking in and consumption of ampheta-mine-type stimulants has come to affect all regions of the world, different types of ATS prevail in different regions. In past years, seizures of ATS in Europe have been dominated by ecstasy and amphetamine; however, ecstasy seizures in Europe fell sharply between 2007 and
ATS seizures worldwide, in kg, litres, number of units and aggregates, 2001-2009
0
10,000
20,000
30,000
40,000
50,000
60,000
70,000
80,000
2001 2002 2003 2004 2005 2006 2007 2008 2009
Kg
, Lit
res
and
Kg
Eq
uiv
alen
ts
0
20
40
60
80
100
120
Mill
ion
s o
f ta
ble
ts/u
nit
s
Kilograms Litres Units (right axis) Aggregate (kg equivalents)
Fig. 122: ATS seizures worldwide, in kg, litres, number of units and aggregates, 2001-2009
Source: UNODC DELTA.
kg,
litre
s an
d k
g e
qu
ival
ents

155
The ATS market
2009, while methamphetamine seizures reached a record level by European standards in 2009. Ecstasy accounted for only 10% of ATS seizures in Europe in 2009, compared with 6% for methamphetamine. In North America, seizures continue to be dominated by metham-phetamine and ‘ecstasy’. In relative terms, seizures of ‘ecstasy’ remained important also in Central and South America and the Caribbean, although the majority of reported ATS seizures in this region consisted of amphet-amine in 2009. The market in Oceania remained diver-sified among the various types of amphetamine-type stimulants. In the Near and Middle East/South-West
Asia, seizures of amphetamine-type stimulants are mainly in the form of Captagon, believed to contain amphetamine as the main psychoactive ingredient. Methamphetamine seizures have been reported from Nigeria and South Africa. For 2009, however, only South Africa reported seizures of methamphetamine, out of a total of four African countries reporting any ATS seizures in the ARQ. Approximately one half of the ATS seized in Africa referred to amphetamine. The pau-city of the data thus does not allow for a reliable charac-terization for the continent as a whole.
Fig. 123: Seizures of ATS by type
Source: UNODC DELTA.
Absolute values, 2001-2009
0
5
10
15
20
25
30
35
2001
2002
2003
2004
2005
2006
2007
2008
2009
Ton
eq
uiv
alen
ts
0
10
20
30
40
50
60
70
80
Ton
eq
uiv
alen
tsTotal ATS (includingnon-specified amphetamines; right axis)
Amphetamine (left axis)
Methamphetamine (left axis)
Ecstasy (MDA, MDEA, MDMA; left axis)
Absolute values, 2001-2009
-
5.00
10.00
15.00
20.00
25.00
30.00
35.00
2001
2002
2003
2004
2005
2006
2007
2008
2009
Ton
eq
uiv
alen
ts
0
10
20
30
40
50
60
70
80
Ton
eq
uiv
alen
tsTotal ATS (includingnon-specified amphetamines, right axis)
Amphetamine (left axis)
Methamphetamine (left axis)
Ecstasy (MDA, MDEA, MDMA; left axis)
Recent year-on-year trends
+3%
+17%
-64%
+13%
-9%
+45%
-70%
-50%
-30%
-10%
10%
30%
50%
Am
phet
amin
e
Met
ham
phet
amin
e
Ecst
asy
(MD
A,
MD
EA, M
DM
A)
2007-08
2008-09
Distribution of ATS seizures by region, 2009
0%
20%
40%
60%
80%
100%
Africa Europe Near and MiddleEast /South-West
Asia
Rest of Asia Central andSouth America
and theCaribbean
North America Oceania
Amphetamine Methamphetamine Non-specified amphetamines Ecstasy (MDA, MDEA, MDMA)
Fig. 124: Distribution of ATS seizures by region, 2009
Source: UNODC DELTA.
Absolute values, 2001-2009
-
5.00
10.00
15.00
20.00
25.00
30.00
35.00
2001
2002
2003
2004
2005
2006
2007
2008
2009
Ton
eq
uiv
alen
ts
0
10
20
30
40
50
60
70
80
Ton
eq
uiv
alen
ts
Total ATS (includingnon-specified amphetamines, right axis)
Amphetamine (left axis)
Methamphetamine (left axis)
Ecstasy (MDA, MDEA, MDMA; left axis)
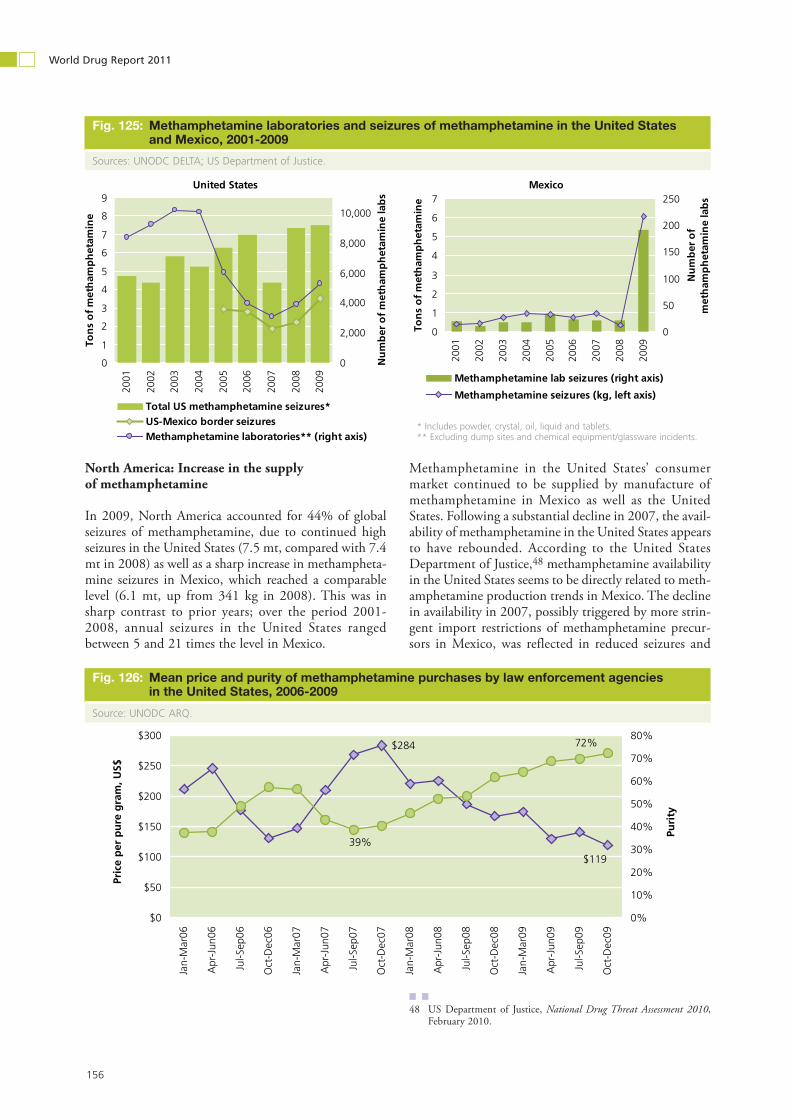
156
World Drug Report 2011
North America: Increase in the supply of methamphetamine
In 2009, North America accounted for 44% of global seizures of methamphetamine, due to continued high seizures in the United States (7.5 mt, compared with 7.4 mt in 2008) as well as a sharp increase in methampheta-mine seizures in Mexico, which reached a comparable level (6.1 mt, up from 341 kg in 2008). This was in sharp contrast to prior years; over the period 2001-2008, annual seizures in the United States ranged between 5 and 21 times the level in Mexico.
Methamphetamine in the United States’ consumer market continued to be supplied by manufacture of methamphetamine in Mexico as well as the United States. Following a substantial decline in 2007, the avail-ability of methamphetamine in the United States appears to have rebounded. According to the United States Department of Justice,48 methamphetamine availability in the United States seems to be directly related to meth-amphetamine production trends in Mexico. The decline in availability in 2007, possibly triggered by more strin-gent import restrictions of methamphetamine precur-sors in Mexico, was reflected in reduced seizures and
48 US Department of Justice, National Drug Threat Assessment 2010, February 2010.
Fig. 125: Methamphetamine laboratories and seizures of methamphetamine in the United States and Mexico, 2001-2009
Sources: UNODC DELTA; US Department of Justice.
Fig. 126: Mean price and purity of methamphetamine purchases by law enforcement agencies in the United States, 2006-2009
Source: UNODC ARQ.
United States
0
1
2
3
4
5
6
7
8
9
2001
2002
2003
2004
2005
2006
2007
2008
2009
Ton
s o
f m
eth
amp
het
amin
e
0
2,000
4,000
6,000
8,000
10,000
Nu
mb
er o
f m
eth
amp
het
amin
e la
bs
Total US methamphetamine seizures*
US-Mexico border seizures
Methamphetamine laboratories** (right axis)* Includes powder, crystal, oil, liquid and tablets. ** Excluding dump sites and chemical equipment/glassware incidents.
Mexico
0
1
2
3
4
5
6
7
2001
2002
2003
2004
2005
2006
2007
2008
2009
Ton
s o
f m
eth
amp
het
amin
e
0
50
100
150
200
250
Nu
mb
er o
f m
eth
amp
het
amin
e la
bs
Methamphetamine lab seizures (right axis)
Methamphetamine seizures (kg, left axis)
Mean price and purity of methamphetamine purchases by law enforcement agencies in the United States, 2006-2009
$284
$119
72%
39%
$0
$50
$100
$150
$200
$250
$300
Jan-
Mar
06
Apr
-Jun
06
Jul-S
ep06
Oct
-Dec
06
Jan-
Mar
07
Apr
-Jun
07
Jul-S
ep07
Oct
-Dec
07
Jan-
Mar
08
Apr
-Jun
08
Jul-S
ep08
Oct
-Dec
08
Jan-
Mar
09
Apr
-Jun
09
Jul-S
ep09
Oct
-Dec
09
Pric
e p
er p
ure
gra
m, U
S$
0%
10%
20%
30%
40%
50%
60%
70%
80%
Puri
ty
Price (USD/pure gram) Purity (right axis)

157
The ATS market
increased prices, and may have led to an increase in manufacture of methamphetamine in the United States. The number of methamphetamine laboratories detected in the United States rose from 3,049 in 2007 to 3,873 in 2008 and 5,286 in 2009. The increase was mainly attributable to the number of small-scale laboratories. Moreover, some Mexican drug trafficking organizations shifted their production operations from Mexico to the United States, particularly to California.
Since 2007, manufacture of methamphetamine in Mexico appears to have grown significantly. Mexico reported 191 methamphetamine laboratories in 2009, up from 21 in 2008. In 2009, the laboratories were discovered in the central Pacific region (in particular, the states of Michoacan, Jalisco and Sinaloa). Between 2007 and 2009, seizures of methamphetamine by United States authorities along the border with Mexico increased by at least 87%, as the partial total for 2009 amounted to 3,478 kg (compared with 1,860 kg in 2007).49 The increased availability in the United States is also visible in price and purity data. Between the fourth quarter of 2007 and the fourth quarter of 2009, the average price per pure gram of methamphetamine followed a gener-ally decreasing trend, falling from US$284 to US$119, while the average purity followed a distinct increasing trend, rising from 39% to 72%.50
The rising purity and falling price are, however, also due to a less potent product being manufactured – a racemic ‘d/l methamphetamine’. The loss in potency of this infe-rior product can, however, be compensated by higher purity levels – and this is currently happening. It appears that the reduced availability of ephedrine and pseu-doephedrine (which would be required for the manufac-ture of the more potent ‘d-methamphetamine’) in Mexico had led to an increased use of alternative meth-ods for the manufacture of methamphetamine. Such techniques either synthesize these chemicals from others more easily available or bypass their use entirely, employ-ing for example the 1-phenyl-2-propanone (P-2-P) method, or its pre-precursor, phenylacetic acid (PAA). The product obtained from the use of PAA or P-2-P is a less potent racemic ‘d/l methamphetamine,’ unless an additional purification step is added on to obtain again the traditional ‘d-methamphetamine.’ Mexico made large seizures of phenylacetic acid (31 mt in 2009), which can be used to obtain P-2-P, as well as other closely related chemicals, including some which are not under international control (such as esters of phenylace-tic acid in 200851 and phenylacetyl amide in 2009). In
49 Ibid.50 US Department of Justice, National Drug Threat Assessment 2010.
Based on data extracted from System To Retrieve Information on Drug Evidence (STRIDE).
51 International Narcotics Control Board, Precursors and chemicals fre-quently used in the illicit manufacture of narcotic drugs and psychotropic
2010 and 2011, Mexican authorities continued to make seizures of esters of phenylacetic acid.52
Increasing seizures of MDMA in the United States and Canada
For the second year in a row, North America accounted for more than half of global ‘ecstasy’ seizures in 2009. The United States alone accounted for 63% of the global total. Contrary to the trend in global seizures, which essentially remained at the significantly reduced level of 2008, in 2009, seizures in North America sus-tained the increased levels of 2007 and 2008. According to the United States Department of Justice,53 the resur-gence of MDMA availability in the United States was fuelled by the manufacture of MDMA in Canada and subsequent smuggling into the United States across the northern border. MDMA seizures at the northern border more than doubled between 2007 and 2008.
Canada reported 23 methamphetamine laboratories and 12 MDMA laboratories in 2009. Although ‘ecstasy’ seizures in Canada fell for the second year in a row – from 1 mt in 2007 to 715 kg in 2008 and 405 kg in 2009 – Canada reported an increased amount of powder MDMA shipments destined for foreign countries and an apparent expansion of international consumer mar-kets for Canadian-produced MDMA. Destinations for MDMA shipments seized in or en route from Canada included the Philippines, Malaysia, Taiwan Province of China, Mexico and Jamaica. While cross-border meth-amphetamine trafficking between Canada and the United States continued to be limited in comparison with cross-border MDMA trafficking, a slight increase was registered in the number of methamphetamine ship-ments intercepted in both directions.
Central America, South America and the Caribbean
In this region, seizures of amphetamine-type stimulants are limited. In recent years however, illicit manufacture of amphetamine-type stimulants has emerged in several countries with little or no previous history of reported manufacture.
In Argentina, seizures of ‘ecstasy’ tablets rose from 11,072 in 2008 to 136,550 in 2009.54 Argentina also seized 20 kg of methamphetamine in 2008, and small quantities of methamphetamine tablets in 2008 and 2009. Argentina reported the seizure of one ‘ecstasy’ laboratory in 2008. In August 2009, Argentine authori-ties seized 4.2 mt of ephedrine (a precursor for metham-
substances, 2008, February 2009. 52 Procuraduría General de la República, Mexico, Secretaría de Marina,
Mexico.53 US Department of Justice, National Drug Threat Assessment 2010,
February 2010.54 In addition, Argentina also reported 15 grams and 10 grams of
‘ecstasy’ seized in 2008 and 2009 respectively.

158
World Drug Report 2011
phetamine) in two operations in the outskirts of Buenos Aires. Although manufacture in Argentina cannot be ruled out, it is likely that the large quantity of precursor chemical was intended for other destinations, possibly Mexico.55
In 2010, Brazil seized 2,740 ‘ecstasy’ tablets and 5,910 units of methamphetamine.56 Brazilian authorities seized one ‘ecstasy’ laboratory in 200857 in the state of Paraná, and, according to preliminary data, one ‘ecstasy’ laboratory, again in Paraná, as well as one metham-phetamine laboratory in the state of Santa Catarina, in 2009.58 Chile seized one laboratory manufacturing mes-caline59 in 2009. Seizures and investigations by Chilean authorities also point to trafficking of ephedrine from Chile to Mexico.60 Colombia seized 126,573 ATS tab-lets in 2009, including 23,477 ‘ecstasy’ tablets.61
In the Dominican Republic – for years an important trans-shipment location of ecstasy – seizures of ‘ecstasy’ tablets fell from 20,861 units in 2007 to 17,885 in 200862 and 10,166 in 2009. In August 2009, author-ities in the Dominican Republic intercepted more than 409,000 pseudoephedrine tablets in a shipment en route to Guatemala and originating in Bangladesh.63
55 UNODC, Global SMART Update, Volume 2, October 2009. 56 Brazil Federal Police.57 Brazil Federal Police. Dados Estatísticos apreensão de drogas, Coorde-
nação Geral Polícia de Repressão a Entorpecentes. December 2010.58 UNODC, Global SMART Update, Volume 2, October 2009. 59 Although mescaline is not classified as an amphetamine-type stimu-
lant, it is a psychotropic substance and a hallucinogen.60 UNODC, Global Smart Update, Volume 2, October 2009.61 Observatorio de Drogas de Colombia.62 In addition, in 2008, 49 grams of ‘ecstasy’ were seized in the Domini-
can Republic.63 UNODC, Global Smart Update, Volume 2, October 2009.
Guatemala reported the seizure of one ATS laboratory in 2008 and three in 2009, as well as the seizure of 12 mt of pseudoephedrine in 2009. In 2008, Honduran authorities discovered some establishments used for extracting pseudoephedrine. In Nicaragua, police dis-covered a laboratory manufacturing illicit synthetic drugs in February 2010, and seized a small quantity of amphetamine. This represented the third reported ATS laboratory in Nicaragua.64
64 UNODC, Global Smart Update, Volume 3, March 2010.
Fig. 127: Ecstasy seizures in the United States and by region, 2001-2009
Source: UNODC DELTA.
Fig. 128: Distribution of global ecstasy seizures, by region, 2000-2009
Source: UNODC DELTA.
Ecstasy seizures in the United States, North America and worldwide, 2001-2009
0
2
4
6
8
10
12
14
16
18
2001 2002 2003 2004 2005 2006 2007 2008 2009
Ton
eq
uiv
alen
ts
Rest of the world
Oceania
East and South-East Asia
Europe
North America
United States of America
Distribution of "ecstasy" seizures worldwide, 2000-2009
11%
70%
15%
63%
0%
10%
20%
30%
40%
50%
60%
70%
80%
90%
100%
2000 2002 2004 2006 2008
Rest of the world
Near and Middle East /South-West Asia
Oceania
East Europe
South-East Europe
West & Central Europe
North America

159
The ATS market
In 2009, small quantities of amphetamine-type stimu-lants were also seized in Costa Rica (methamphetamine and ‘ecstasy’), Chile (amphetamine and ‘ecstasy’) Cuba (methamphetamine and unspecified ATS), the Bahamas (‘ecstasy’) and El Salvador (amphetamine).
Near and Middle East/South-West Asia: Rise in amphetamine seizures
Countries in the Near and Middle East/South-West Asia continued to be affected by trafficking of Captagon on a large scale. The content of tablets bearing the Capta-gon logo is not always clear, but the main psychoactive ingredient in such tablets is now amphetamine (rather than fenetylline, the active ingredient in the licit phar-maceutical preparation some 15 years ago). Caffeine is also frequently found in such tablets.
Seizures of amphetamine in the Near and Middle East/ South-West Asia increased steadily between 2000 and 2007, appeared to stabilize in 2008, amounting to 19.6 mt, and resumed the increasing trend in 2009, reaching 24.8 tons. The long-term growth in seizures in this region was driven mainly by seizures in Saudi Arabia, which rose consistently over the period 2000-2007, reaching 13.9 mt65 in 2007. Seizures in this country have remained stable since then, amounting to 12.8 mt in 2008 and 13.4 mt66 in 2009. Saudi Arabia has a significant con-sumer market for Captagon tablets. In January 2010, eight million Captagon pills were confiscated in a single seizure in Saudi Arabia. The traffickers were believed to
65 Data relative to the period 2002-2007 and 2009 were sourced from the World Customs Organization and ICPO/INTERPOL.
66 World Customs Organization.
have ties to an amphetamine manufacturing and distri-bution ring that was broken in Turkey a few months earlier.67 Turkey is believed to be mainly a transit country for Captagon, and a gateway for illicit trafficking from South-East Europe to the Middle East.
Replies to the Annual Reports Questionnaire from the Near and Middle East identified Saudi Arabia as a major destination for amphetamine (specifically Captagon) trafficked on their territory. It also appeared that Egypt had become a point of departure for amphetamine ship-ments. In a single seizure at Dhuba seaport, Saudi Ara-bian Customs seized over 1.3 million tablets that were concealed on board a vessel that had arrived from Egypt.68
Jordan registered significant increases in amphetamine seizures in 2008 and again in 2009. Seizures in this country averaged 11 million tablets over the period 2004-2007, and rose to 14 million tablets in 2008 and 29 million tablets (specifically Captagon tablets) in 2009. Seizures also continued to increase in the Syrian Arab Republic, from 12 million tablets in 2007 and 2008 to 22 million tablets in 2009.
Turkey reported seizures of 2.8 million Captagon tablets in 2009,69 in addition to 479 kg of amphetamine, of which 473 kg70 were seized at a Captagon laboratory
67 UNODC, Global SMART Update, Volume 3, March 2010.68 World Customs Organization, Customs and Drugs Report 2009. June
2010.69 Turkey also confirmed that, in 2009, Captagon tablets contained
amphetamine rather than fenetylline. 70 Ministry of Interior, Turkish National Police, Department of Anti-
Smuggling and Organized Crime. Turkish Report on Drugs and
Fig. 129: Seizures of amphetamine in the Near and Middle East/South-West Asia and worldwide, 2000-2009
Source: UNODC DELTA.
Fig. 130: Distribution of amphetamine seizures in the Near and Middle East/South- West Asia, 2009 (kg equivalents)
Source: UNODC DELTA.
0
5
10
15
20
25
30
35
40
2000
2001
2002
2003
2004
2005
2006
2007
2008
2009
Ton
eq
uiv
alen
ts
Rest of the world
South-East Europe
West & Central Europe
Near and Middle East/South-West Asia
Jordan, 20%
SyrianArab Republic,
15%
Saudi Arabia, 54%
Iran (Islamic Republic of) JordanQatar Saudi ArabiaSyrian Arab Republic United Arab EmiratesYemen Other

160
World Drug Report 2011
discovered in Istanbul in September 2009. According to Turkish authorities,71 such establishments, which are discovered sporadically, carry out the conversion into tablet form, rather than the chemical process whereby amphetamine is manufactured from other substances. In 2010 seizures of Captagon tablets fell to 1.1 million.72
Increased seizures of methamphetamine in the Islamic Republic of Iran
Starting in 2005, the Islamic Republic of Iran has seized increasing quantities of methamphetamine. In the first nine months of 2010, the country seized 883 kg of methamphetamine, up from 571 kg in 2009.73 The results of research in the country, as reported by the Drug Control Headquarters74, indicate that the use of methamphetamine has increased. The Islamic Republic of Iran reported that, in 2009, methamphetamine traf-ficked on its territory originated in North-West Asia, South-East Asia and northern and western Europe, with 1% manufactured domestically. It also reported the detection of six ‘kitchen’ laboratories manufacturing methamphetamine. In 2009, the Islamic Republic of Iran registered legitimate requirements of 55 mt75 of the precursor pseudoepehedrine, the fourth largest level worldwide for that year.
According to Thai authorities,76 there was an emergent trend of Iranian nationals trafficking methamphetamine into the region. This pattern was also observed in Japan, where Iranian nationals accounted for one fifth of arrests of non-resident foreigners related to methampheta-mine.77 In two incidents in July 2009 and February 2010, a total of five Iranian nationals were arrested in Malaysia for attempting to traffic a total of 75 kg of methamphetamine on flights from the United Arab Emirates.78 In August 2010, police in Sri Lanka arrested three Iranian nationals, confiscating 16 kg of metham-
Organized Crime 2009.71 Ibid.72 Ministry of Interior, Turkish National Police, Department of Anti-
Smuggling and Organized Crime. Turkish Report on Drugs and Organized Crime 2010.
73 Drug Control Headquarters, Islamic Republic of Iran, Drug Control in 2010, Annual Report.
74 Drug Control Headquarters, Islamic Republic of Iran. Drug control in 2008, Annual Report and Rapid Situation Assessment,
75 International Narcotics Control Board, Precursors and chemicals fre-quently used in the illicit manufacture of narcotic drugs and psychotropic substances, Report of the International Narcotics Control Board for 2009 on the Implementation of Article 12 of the United Nations Convention against Illicit Traffic in Narcotic Drugs and Psychotropic Substances of 1988, E/INCB/2009/4. February 2010.
76 Office of the Narcotics Control Board of Thailand, presentation at the Twentieth Anti-Drug Liaison Officials’ Meeting for International Cooperation (ADLOMICO), October 2010, Seoul, Republic of Korea.
77 Fifteenth Asia-Pacific Operational Drug Enforcement Conference, February 2010, Tokyo, Japan. Country report by Japan.
78 UNODC, Global SMART Update, Volume 3, March 2010.
phetamine.79 Turkey, which registered methampheta-mine seizures for the first time in 2009, also reported that methamphetamine was smuggled overland from the Islamic Republic of Iran into Turkey and then trafficked by air to countries in East and South-East Asia such as Indonesia, Japan, Malaysia and the Republic of Korea. Indonesia also mentioned the Islamic Republic of Iran as a source country for methamphetamine in 2009, and Turkey as a transit country. Trafficking of metham-phetamine from the Islamic Republic of Iran via Turkey was also confirmed by Philippine authorities.80
Asia-Pacific: Increased seizures of methamphetamine
The Asia-Pacific region - notably the area encompassing Cambodia, the Lao People’s Democratic Republic, Myanmar, Thailand, Viet Nam and bordering provinces of south China - continued to be affected by manufac-ture, trafficking and consumption of methamphetamine on a large scale. In 2009, seizures in East and South-East Asia rose by more than one third, from 11.6 mt in 2008 to 15.8 mt, mainly due to the quantities seized in Myan-mar. In relative terms, Thailand recently also registered significant increases. The largest seizures in the Asia-Pacific region continued to be made by China, while East and South-East Asia as a whole continued to account for approximately one half of global seizures of methamphetamine. Moreover, there were signs of diver-sification in trafficking routes, with methamphetamine reaching the region from Africa and the Islamic Repub-lic of Iran.
In China, aggregate seizures of methamphetamine were remarkably stable over the period 2005-2009, ranging between 6.1 mt and 6.8 mt (6.6 mt in 2009). According to Chinese authorities,81 there was an increase in traf-ficking of amphetamine-type stimulants from neigh-bouring countries (referred to as the ‘Golden Triangle’) into Yunnan province. Methamphetamine seizures in this province rose from 2.2 mt in 2008 to 3.2 mt in 2009. There was also an increase in the domestic manu-facture of illicit drugs, with the number of dismantled clandestine laboratories rising from 244 in 2008 to 391 in 2009. Manufacture occurred in particular in the provinces of Guangdong, Sichuan and Hubei, and the substances involved were mainly amphetamine-type stimulants and ketamine.
79 UNODC, Global SMART Update, Volume 4, October 2010.80 Twentieth Anti-Drug Liaison Officials’ Meeting for International
Cooperation (ADLOMICO), October 2010, Seoul, Republic of Korea. Country report by the Philippines.
81 National Narcotics Control Commission of China, presentation at the Twentieth Anti-Drug Liaison Officials’ Meeting for International Cooperation (ADLOMICO), October 2010, Seoul, Republic of Korea.
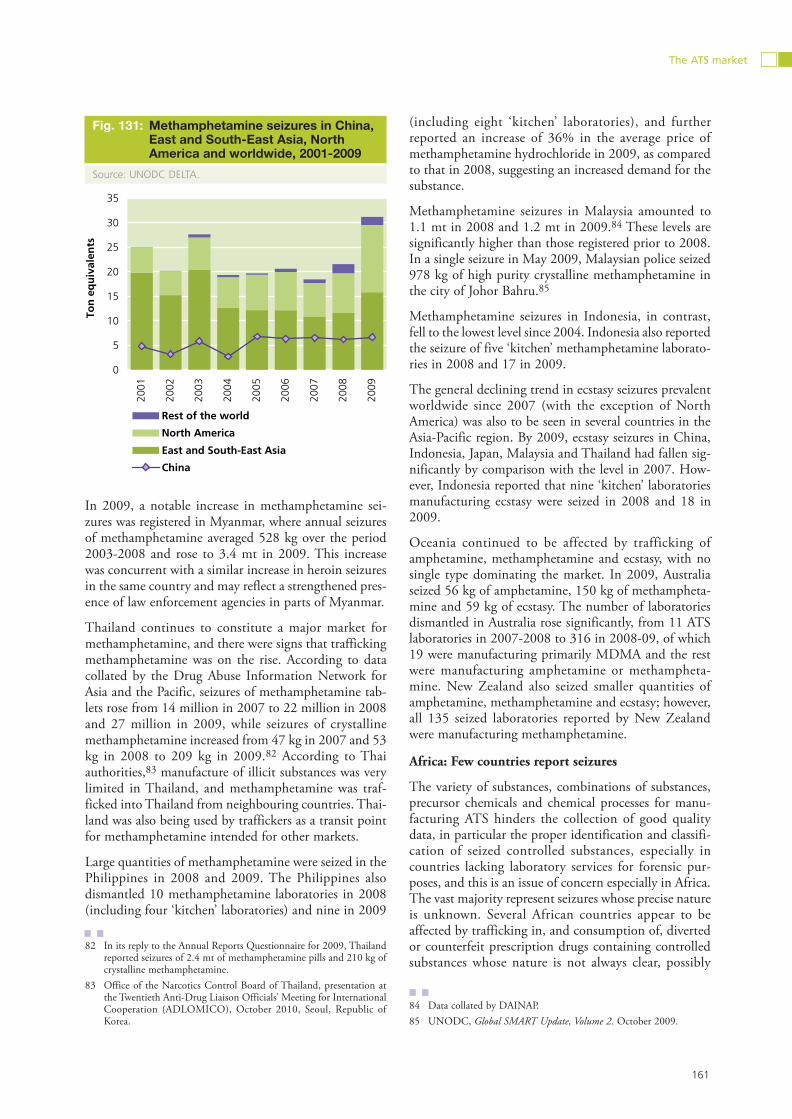
161
The ATS market
In 2009, a notable increase in methamphetamine sei-zures was registered in Myanmar, where annual seizures of methamphetamine averaged 528 kg over the period 2003-2008 and rose to 3.4 mt in 2009. This increase was concurrent with a similar increase in heroin seizures in the same country and may reflect a strengthened pres-ence of law enforcement agencies in parts of Myanmar.
Thailand continues to constitute a major market for methamphetamine, and there were signs that trafficking methamphetamine was on the rise. According to data collated by the Drug Abuse Information Network for Asia and the Pacific, seizures of methamphetamine tab-lets rose from 14 million in 2007 to 22 million in 2008 and 27 million in 2009, while seizures of crystalline methamphetamine increased from 47 kg in 2007 and 53 kg in 2008 to 209 kg in 2009.82 According to Thai authorities,83 manufacture of illicit substances was very limited in Thailand, and methamphetamine was traf-ficked into Thailand from neighbouring countries. Thai-land was also being used by traffickers as a transit point for methamphetamine intended for other markets.
Large quantities of methamphetamine were seized in the Philippines in 2008 and 2009. The Philippines also dismantled 10 methamphetamine laboratories in 2008 (including four ‘kitchen’ laboratories) and nine in 2009
82 In its reply to the Annual Reports Questionnaire for 2009, Thailand reported seizures of 2.4 mt of methamphetamine pills and 210 kg of crystalline methamphetamine.
83 Office of the Narcotics Control Board of Thailand, presentation at the Twentieth Anti-Drug Liaison Officials’ Meeting for International Cooperation (ADLOMICO), October 2010, Seoul, Republic of Korea.
(including eight ‘kitchen’ laboratories), and further reported an increase of 36% in the average price of methamphetamine hydrochloride in 2009, as compared to that in 2008, suggesting an increased demand for the substance.
Methamphetamine seizures in Malaysia amounted to 1.1 mt in 2008 and 1.2 mt in 2009.84 These levels are significantly higher than those registered prior to 2008. In a single seizure in May 2009, Malaysian police seized 978 kg of high purity crystalline methamphetamine in the city of Johor Bahru.85
Methamphetamine seizures in Indonesia, in contrast, fell to the lowest level since 2004. Indonesia also reported the seizure of five ‘kitchen’ methamphetamine laborato-ries in 2008 and 17 in 2009.
The general declining trend in ecstasy seizures prevalent worldwide since 2007 (with the exception of North America) was also to be seen in several countries in the Asia-Pacific region. By 2009, ecstasy seizures in China, Indonesia, Japan, Malaysia and Thailand had fallen sig-nificantly by comparison with the level in 2007. How-ever, Indonesia reported that nine ‘kitchen’ laboratories manufacturing ecstasy were seized in 2008 and 18 in 2009.
Oceania continued to be affected by trafficking of amphetamine, methamphetamine and ecstasy, with no single type dominating the market. In 2009, Australia seized 56 kg of amphetamine, 150 kg of methampheta-mine and 59 kg of ecstasy. The number of laboratories dismantled in Australia rose significantly, from 11 ATS laboratories in 2007-2008 to 316 in 2008-09, of which 19 were manufacturing primarily MDMA and the rest were manufacturing amphetamine or methampheta-mine. New Zealand also seized smaller quantities of amphetamine, methamphetamine and ecstasy; however, all 135 seized laboratories reported by New Zealand were manufacturing methamphetamine.
Africa: Few countries report seizures
The variety of substances, combinations of substances, precursor chemicals and chemical processes for manu-facturing ATS hinders the collection of good quality data, in particular the proper identification and classifi-cation of seized controlled substances, especially in countries lacking laboratory services for forensic pur-poses, and this is an issue of concern especially in Africa. The vast majority represent seizures whose precise nature is unknown. Several African countries appear to be affected by trafficking in, and consumption of, diverted or counterfeit prescription drugs containing controlled substances whose nature is not always clear, possibly
84 Data collated by DAINAP.85 UNODC, Global SMART Update, Volume 2. October 2009.
Fig. 131: Methamphetamine seizures in China, East and South-East Asia, North America and worldwide, 2001-2009
Source: UNODC DELTA.
0
5
10
15
20
25
30
35
2001
2002
2003
2004
2005
2006
2007
2008
2009
Ton
eq
uiv
alen
ts
Rest of the world
North America
East and South-East Asia
China

162
World Drug Report 2011
including amphetamine-type stimulants as well as seda-tives and tranquillisers.
Nigeria reported seizures of 712 kg of psychotropic sub-stances in 2009, up from 530 kg of psychotropic sub-stances in 2008. Burkina Faso reported seizures of 3,403 kg of ‘médicaments de la rue’ in 2008. Morocco reported seizures of 48,293 units of psychotropic substances in 2008, rising to 61,254 in 2009 and 105,940 in 2010.86 South Africa reported aggregate seizures of 48 kg of amphetamine-type stimulants in 2009, including 37 kg of methamphetamine. Algeria reported aggregate sei-zures of 90,630 tablets of sedatives and tranquillisers in 2009. Côte d’Ivoire seized 43 kg of amphetamine in 2008, as well as 17,155 amphetamine tablets (in addi-tion to seizures of clonazepam and diazepam tablets).87 In 2009, seizures of amphetamine in Côte d’Ivoire fell to 1,200 tablets. The World Customs Organization also reported that Sudanese officials foiled an attempt to smuggle 18.3 kg of stimulant tablets at Khartoum air-port.
Every year from 2000 to 2009, Egyptian authorities seized small quantities of ‘ecstasy tablets’. Seizures exceeded 10,000 tablets in 2006, but had fallen to 203 tablets by 2008 to 76 tablets in 2009. In April 2010,88 one methamphetamine laboratory was seized in Egypt.
According to South African authorities, amphetamine-type stimulants, in particular methamphetamine and club drugs such as ecstasy and cathinone, continued to be used in South Africa.89 These drugs, with the excep-tion of ecstasy, were manufactured locally in clandestine laboratories, while ecstasy was mainly smuggled in from Europe by air freight and parcel post. Over the period 1 April 2008 to 31 March 2009, 20 clandestine laboratories manufacturing methamphetamine were dismantled,90 while 10 methamphetamine laboratories and six cathinone laboratories were dismantled during 2009. South Africa also reported that an increase of methamphetamine trafficking allowed for a decrease in prices.
86 Official communication from the Government of Morocco. The replies to the Annual Reports Questionnaire for the year 2009 and 2010 from the Kingdom of Morocco were not available at the time of preparation of the present report.
87 Country report by Côte d’Ivoire to the Nineteenth Meeting of Heads of National Drug Law Enforcement Agencies, Africa. The replies to the ARQ for 2008 from Côte d’Ivoire were not available at the time of preparation of the present report.
88 UNODC, Global SMART Update Volume 4.89 Country report by South Africa to the Nineteenth Meeting of Heads
of National Drug Law Enforcement Agencies, Africa.90 South African Police Service, Annual Report 2008/2009. In the replies
to the ARQ for 2008, South Africa did not report any clandestine laboratories.
Methamphetamine trafficking from Africa to Japan
One emerging trend identified by Japanese authorities91 was that of methamphetamine trafficking from Africa to Japan. The proportion of methamphetamine seized in Japan that was sourced from Africa increased from 7.4% in 2009 to 36% in the first half of 2010. The West and Central African countries of Benin, Nigeria, Cameroon and Senegal were prominent among the source countries in Africa. It is unclear whether West Africa, already a hub for cocaine trafficking, was beginning to see the emergence of local ATS manufacture, or is simply serv-ing as a transit point for methamphetamine manufac-tured elsewhere, possibly in South Africa. Nevertheless this trend, together with reports from other countries in the region, suggests that African trafficking syndicates active in the Asia-Pacific region may be expanding their activities to include trafficking of methamphetamine in addition to heroin and cocaine.
Countries in West Africa, which have assumed an important role in the trafficking of cocaine, are also vulnerable to a potentially increased role in the traffick-ing or manufacture of other drugs, including ampheta-mine-type stimulants. In July 2009, large quantities of chemicals and equipment that could be used in the manufacture of illicit drugs were discovered in multiple facilities in Guinea. Among the seized materials were more than 5,000 litres of sassafras oil and 80 litres of
91 Japan Customs Intelligence and Targeting Centre, presentation at the Twentieth Anti-Drug Liaison Officials’ Meeting for International Cooperation (ADLOMICO), October 2010, Seoul, Republic of Korea.
Fig. 132: Number of methamphetamine and cathinone/methcathinone laboratories seized in South Africa (all sizes), 2002-2009
Source: UNODC DELTA.
*Covers the period 1 April 2008 to 31 March 2009
Number of methamphetamine and cathinone/methcathinone laboratories seized in South Africa (all sizes), 2002-2009
14
11
17
12
20
1013
36
23
28
18
10
6
0
5
10
15
20
25
30
35
40
2002
2003
2004
2005
2006
2007
2008
*
2009
Methamphetamine
Cathinone/methcathinone

163
The ATS market
3,4-MDP-2-P, which can be used to manufacture MDMA. In a separate single seizure, also in July 2009, Nigerian officials seized 10 kg of crystalline metham-phetamine and 10 kg of amphetamine along with 57 kg of the precursor chemical ephedrine. The seizure was made at the departure concourse of a flight en route to South Africa.92 (The methamphetamine seizures were, however, not reported separately in the ARQ but included in the broad category of psychotropic sub-stances seizures). In 2010, Nigeria seized 75 kg of meth-amphetamine: over the nine-month period May 2010 – January 2011, 11 out of 150 seizures made by author-ities at Murtala Muhammed International Airport involved methamphetamine, intended predominantly for the Asia-Pacific region.93
Europe: Amphetamine seizures appear to recede
Europe, notably West and Central Europe, continues to be an important market for amphetamine, in terms of both manufacture and consumption. Amphetamine seizures in West and Central Europe reached a record level (8.2 mt) in 2007, and essentially sustained this level in 2008 (7.9 mt). In 2007 and 2008, the Nether-lands, the United Kingdom and Germany collectively accounted for more than 70% of annual amphetamine seizures in West and Central Europe, and in 2009 the United Kingdom and Germany accounted for the larg-est and second largest seizure levels in Europe, respec-tively. Seizure data from the Netherlands for 2009 were not available; however, a comparison of seizure totals for 2008 and 2009 excluding the Netherlands indicates a decline of 20%.
92 UNODC, Global SMART Update, Volume 2, October 2009.93 National Drug Law Enforcement Agency of Nigeria.
A sharp drop in seizures in the United Kingdom, from the high level of 2008, was partly offset by increased seizures in France, while seizures in Germany continued the gradually increasing trend that can be traced back to 2002. Among all countries worldwide, the Netherlands continued to be the most frequently mentioned country of origin for amphetamine as well as ‘ecstasy’. Poland continued to be the second most frequently mentioned country of origin for amphetamine: Poland dismantled eight amphetamine laboratories in 2009, and identified Germany, Scandinavia and the United Kingdom as the main destinations for amphetamine manufactured in Poland.
Ecstasy seizures continue to decline
Seizures of ecstasy in Europe have declined sharply, standing at 1.8 mt in 2008 – approximately one third the prior levels – and appearing to decline by a further 59% in 2009 (excluding seizures in the Netherlands). The decreases were prevalent throughout Europe but were more pronounced in some countries than others; due to recent decreases in countries which historically accounted for a dominant portion of European ‘ecstasy’ seizures (notably the United Kingdom and, up till 2008, the Netherlands), in 2009 the largest ‘ecstasy’ seizures reported by European countries were made in Turkey (432,513 tablets) and Spain (404,334 tablets), while Poland registered seizures comparable with the quanti-ties seized in the United Kingdom (6% of the European total). Poland assessed that some of the `ecstasy’ on its territory originated in Poland itself, as well as the Netherlands. According to Colombian authorities,94 a
94 Dirección Nacional de Estupefacientes, Ministerio del Interior y de Justicia, Colombia.
Fig. 133: Amphetamine seizures in Europe, 2000-2009* Data for 2009 for the Netherlands were unavailable; the value used is that corresponding to the year 2008, and is only included to estimate the regional total.** Data for the United Kingdom for 2007, 2008 and 2009 are based on incomplete data for some jurisdictions for the financial years 2007/08, 2008/09 and 2009/10 respectively, and adjusted for the missing jurisdictions using the distribution in 2006/07.
Source: UNODC DELTA.
0
1
2
3
4
5
6
7
8
9
10
2000 2001 2002 2003 2004 2005 2006 2007 2008 2009
Ton
eq
uiv
alen
ts
Bulgaria
Turkey
Rest of Europe
Belgium
Sweden
France
Poland
Norway
Germany
Netherlands*
United Kingdom**
West and Central Europe (total)0
1
2
3
4
5
6
7
8
9
10
2000 2001 2002 2003 2004 2005 2006 2007 2008 2009
Ton
eq
uiv
alen
ts
Bulgaria
Turkey
Rest of Europe
Belgium
Sweden
France
Poland
Norway
Germany
Netherlands*
United Kingdom**
West and Central Europe (total)

164
World Drug Report 2011
shipment of 15 million ‘ecstasy’ tablets seized in Poland and intended for Colombia suggested that Colombian syndicates were accepting payment for cocaine in the form of ‘ecstasy’ tablets manufactured in Europe. Similar arrangements were also reported from other European countries in the past.
Methamphetamine emerging in Europe
While the European ATS market has in the past been dominated by amphetamine and ‘ecstasy’, recent years have seen the emergence of methamphetamine manu-facture, trafficking and consumption in parts of Europe. Between 2004 and 2009, there was a five-fold increase of methamphetamine seizures in West and Central
Europe, driven mainly by seizures in Norway, Sweden and Lithuania. Over the period 2002-2009, Lithuania and the Netherlands were the European countries most frequently mentioned as a country of origin for meth-amphetamine, followed by Poland, the Czech Republic and Slovakia. Lithuania assessed that methamphetamine on its territory originated entirely in Lithuania itself in 2009, while the percentage of domestic manufacture was estimated at 98% by Slovakia and 95% by the Czech Republic. The Czech Republic reported seizures of a large number of methamphetamine laboratories (342); one methamphetamine laboratory was also dis-mantled in Lithuania and an unspecified number in Slovakia.
Fig. 134: Seizures of ecstasy in Europe, 2000-2009* Data for the United Kingdom for 2007, 2008 and 2009 are based on incomplete data for some jurisdictions for the financial years 2007/08, 2008/09 and 2009/10 respectively, and adjusted for the missing jurisdictions using the distribution in 2006/07.
** Data for 2009 for the Netherlands were unavailable; the value used is that corresponding to the year 2008, and is only included to estimate the regional total.
Source: UNODC DELTA.'Ecstasy' seizures in Europe, 2000-2009
0
1
2
3
4
5
6
7
8
9
2000 2001 2002 2003 2004 2005 2006 2007 2008 2009
Ton
eq
uiv
alen
ts
Rest of Europe
Bulgaria
Poland
Spain
Turkey
France
Belgium
Germany
United Kingdom*
Netherlands**
Fig. 135: Methamphetamine seizures in West and Central Europe, 2000-2009
Source: UNODC DELTA. Methamphetamine seizures in West and Central Europe, 2000-2009
0
100
200
300
400
500
600
2000 2001 2002 2003 2004 2005 2006 2007 2008 2009
Kg
eq
uiv
alen
ts
Rest of West and Central Europe
Switzerland
Denmark
Estonia
Germany
Czech Republic
Finland
Latvia
Lithuania
Sweden
Norway
Methamphetamine seizures in West and Central Europe, 2000-2009
0
100
200
300
400
500
600
2000 2001 2002 2003 2004 2005 2006 2007 2008 2009
Kg
eq
uiv
alen
ts
Rest of West and Central Europe
Switzerland
Denmark
Estonia
Germany
Czech Republic
Finland
Latvia
Lithuania
Sweden
Norway

The ATS market
165
4.5 Emerging trends
'Ecstasy' seizures in Europe, 2000-2009
0
1
2
3
4
5
6
7
8
9
2000 2001 2002 2003 2004 2005 2006 2007 2008 2009
Ton
eq
uiv
alen
ts
Rest of Europe
Bulgaria
Poland
Spain
Turkey
France
Belgium
Germany
United Kingdom*
Netherlands**
Market expansion for ATS markets in East and South-East Asia
Established markets for amphetamine-type stimulants in East and South-East Asia have seen an expansion over the past year. Expert perceptions confirm that ATS - notably methamphetamine - play a significant role in the region. ATS may even have overtaken the use of plant-based drugs in some countries over the past few years. Methamphetamine in pill form has been reported as the primary drug of use in the Lao People’s Demo-cratic Republic and Thailand, while methamphetamine in crystalline form has been reported as the primary drug of use in Brunei Darussalam, Cambodia, Japan, the Republic of Korea and the Philippines. Metham-phetamine in pill and crystalline form ranked as the second most commonly used drug type in China, with ‘ecstasy’ ranking third. In Indonesia, crystalline meth-amphetamine and ‘ecstasy’ ranked as the second and third most commonly used drugs, respectively. Crystal-line methamphetamine ranked as the third most com-monly used drug in Malaysia and Singapore.
Over the past few years, several expanding markets have emerged in the region. For example, the market for methamphetamine in Viet Nam has grown as the coun-try becomes an attractive target for traffickers due to its large, increasingly affluent and urban population. The use of crystalline methamphetamine, in particular, has increased among young people in major cities and sei-zures of methamphetamine pills have increased signifi-cantly over the past three years. Viet Nam also reports the existence of drug storage points along the northern border with the Lao People’s Democratic Republic.
In Indonesia, crystalline methamphetamine use has been increasing each year since 2003 according to experts, and the drug now ranks as the second most commonly used drug, after having ranked fifth in 2005. Over the past five years, Indonesia - hitherto primarily a transit country for methamphetamine - has become a manufacturing centre for crystalline methamphetamine. Malaysia is a key transit country for crystalline metham-phetamine trafficking in the region and in recent years has seen seizures of several small and large-scale manu-facturing laboratories, echoing the same pattern as some other countries.
Another trend is the increasing trafficking and use of
ketamine which is often sold in the traditional ATS markets of South-East Asia. In 2009, 6.9 mt of ketamine was seized in East and South-East Asia. Almost 90% of this was seized in China, which, along with India, is one of the major source countries for ketamine in the region. Ketamine seizure figures are almost certainly under-reported, particularly in Asia. Ketamine is not under international control and only some countries in the region have imposed restrictions on its availability. Use is reportedly increasing in several countries and areas, and in Hong Kong, China, it was the main drug of use, with 2009 seizures reaching five times their 2007 level. One reason for its growing popularity is that ketamine is cheaper than other drugs such as MDMA and its licit use makes it widely available for diversion for illicit pur-poses in many countries in the region.
Ketamine is also frequently trafficked in South Asia, particularly from India. Seizures of ketamine in India have increased from 60 kg in 2005 to more than 1 mt in 2009. Ketamine has been trafficked to countries in East and South-East Asia as well as to North America (notably Canada) and some European countries (nota-bly the United Kingdom and the Netherlands).
The emergence of analogue substances in established ATS markets
The appearance of several new unregulated synthetic compounds in established ATS markets, particularly in
0
200
400
600
800
1,000
1,200
2005 2006 2007 2008 2009
Qu
anti
ty (
kg)
Fig. 136: Seizures of ketamine in India, 2005-2009
Source: Directorate of Revenue Intelligence and Narcotics Control Board, India.

166
World Drug Report 2011
Europe, the United States, Canada, Australia and New Zealand, has been an important trend observed over the past years. Many of these substances are marketed as ‘legal highs’ and substitute for illicit stimulant drugs such as cocaine or ecstasy.
In Europe, the emergence of these substances coincided with the gradual disappearance of ecstasy from the illicit drugs market. Seizures of ecstasy precursors have con-tinually declined over the past five years. Seizures of the main ecstasy precursor 3,4-MDP-2-P (also known as piperonyl methyl ketone) steeply declined after 2004. The slow and steady disappearance of MDMA from the illicit market coincided with a decline in laboratory activity. In 2009, only one ecstasy-related laboratory incident was reported in Europe.
At the same time, other synthetic substances, notably piperazines, have been sold as ‘ecstasy’ to meet the demand from the illicit market. Manufacturers and traf-fickers have started to exploit the lack of national and international control over piperazines and other new synthetic substances. Piperazines are not under interna-tional control although many countries have introduced national controls over BZP and taken other action to prevent their sale and distribution.
As a result, other substances have emerged, notably mephedrone. Mephedrone, 4-methylmethcathinone (4-MMC), first appeared on the illicit market around 2007. The substance has no medical use in either humans or animals and has been associated with a number of fatalities in European countries. In Decem-ber 2010, mephedrone was banned in the countries of the European Union. But it is still available in illicit drug markets and has also appeared on markets in devel-oped countries outside Europe, including the United States and Australia.
Methamphetamine trafficking from Africa
Africa poses one of the greatest emerging threats with regard to trafficking of amphetamine-type stimulants. Trafficking of methamphetamine from Africa was reported first at the end of 2008 and reports of such trafficking have continued since. West Africa, in particu-lar, is emerging as a source of methamphetamine for illicit markets in East Asia, with couriers transiting Europe, western Asia or East Africa. Few countries in the region have the capacity and governance structures to address the problem.
Methamphetamine manufacture is not entirely new to Africa. South Africa has had increasing reports since 2004 and Egypt reported a case as recently as April 2010. There are also indications that ATS manufacture could occur in West Africa. In July 2009, equipment that could be used in ATS manufacture was discovered in Guinea. In June 2010, the United States Government
indicted members of a large international cocaine traf-ficking organization for, inter alia, the intent to establish large-scale manufacture of crystalline methamphetamine in Liberia.
Precursor chemicals are frequently trans-shipped through the region. The International Narcotics Control Board (INCB) identified Africa as the region with the greatest number of diversions or attempted diversions of ATS precursor chemicals in 2008. Countries import precur-sors in considerable excess of legitimate annual needs and are targets for organized crime. For example, a single shipment to Uganda of 300 kg of pseudoephedrine was seized upon arrival in 2008. At the same time, the INCB notes that precursor trafficking patterns in Africa stand in sharp contrast to the low number of seizures made by Governments in the region. Only two cases were reported in 2009: 1.25 mt of ephedrine to the Central African Republic and 1 mt of pseudoephedrine to Kenya, both of which can be used in the manufacture of methamphetamine.
The World Customs Organization (WCO) noted a small number of methamphetamine trafficking cases from Africa (southern) to East Asia in mid-2008 with no prior cases reported. The year 2009 saw both the number of seizures and their quantities originating from Africa more than triple. This trend appears to be growing and spreading. Cases of methamphetamine trafficking have emerged from various West African nations. Trafficking of methamphetamine originating in or transiting through Benin, Cameroon, Côte d’Ivoire, Ghana,
To East Asia via Europe
To East Asia and Gulf area
To Oceania
Methamphetamine laboratories
Methamphetamine trafficsince 2009 reported
Routes (arrow indicates sourceand routing reported in 2009/2010
Source: Global SMART Update Vol 4, October 2010
Note: The boundaries and names shown and the designations used on this map do not imply official endorsement or acceptance by the United Nations. Lines represent origin and intended destination, not necessarily exact route, and include completed or stopped trafficking attempts. Modes of transport include by air, sea, overland, or any combination thereof.
Map 37: Trafficking routes of methamphetamine in Africa

167
The ATS market
Guinea, Senegal and in particular Nigeria have all been reported since 2009.
The most common destinations for methamphetamine have been outside the region, primarily Japan, followed by the Republic of Korea, with new reports from Malay-sia and Thailand. Cases are typically multi-kilo and transported via air passengers hidden in luggage or by body concealment resembling methods employed by West African syndicates for other drugs. Couriers transit via Gulf countries, East African as well as European countries. Significantly larger shipments have also been reported. For example, in May 2010, Nigerian authori-ties stopped two separate cargo shipments totalling 63 kg of methamphetamine and amphetamine to Japan and South Africa. In July 2009, 10 kg of crystalline metham-phetamine, 10 kg of amphetamine and 57 kg of ephe-drine were seized in Nigeria en route to South Africa.
The infrastructure established by transnational cocaine and heroin traffickers in West Africa is readily adaptable to accommodate the flexibility of ATS manufacture. While the capacity to report on the situation in the region remains limited, initial indications suggest that the products are a threat for lucrative markets around the world. This raises the need for a truly global effort to address the synthetic drugs problem.
ATS in South Asia
Located at the crossroads of drug supply between the sources in South-East and South-West Asia, South Asia has traditionally been affected by illicit manufacture, trafficking and use of drugs, mostly opiates. Over the past few years, however, South Asia has emerged as a source for amphetamine-type stimulants (ATS) and the precursors needed to manufacture them.
The geographical proximity to East and South-East Asian source countries of illicit methamphetamine is one of several factors which makes South Asia a vulner-able target for illicit manufacture of amphetamine-type stimulants. The first clandestine ATS manufacture oper-ation was detected in India in May 2003. Since then, several additional facilities have been uncovered. In August 2010, a methamphetamine laboratory was dis-covered in India. However, attempts at illicit ATS man-ufacture are not limited to India, they have also been reported from Bangladesh and Sri Lanka. In Sri Lanka, for example, a large-scale methamphetamine laboratory was dismantled in May 2008.
In addition, South Asia has become one of the main regions used by drug traffickers to obtain ephedrine and pseudoephedrine for the illicit manufacture of metham-phetamine. India is one of the world’s largest manufac-turers of precursor chemicals and Bangladesh also has a growing chemical industry. Despite efforts to control precursor chemicals, both countries have been identified
in a number of cases as the source of diverted precursor chemicals for a range of drugs, including methampheta-mine. Several significant seizures of pseudoephedrine in Central America and the Caribbean (such as the Domin-ican Republic, Guatemala and Honduras) are believed to have originated in Bangladesh. Many countries in Central America and the Caribbean are vulnerable as destinations for these shipments. Africa also remains at risk at being used by traffickers to obtain precursor chemicals.
Amphetamine, methamphetamine and ecstasy have been regularly seized in South Asia over the past five years. Methamphetamine pills originating from Myan-mar are trafficked into Bangladesh, India and Nepal. The recent upsurge of methamphetamine seizures origi-nating from Myanmar may therefore be felt acutely in the region.

168
World Drug Report 2011
Fig. 137: Global seizures of amphetamines(a), 2001-2009Global seizures of amphetamines-group substances : 2001-2009
(a) Amphetamine, methamphetamine and related non-specified amphetamines.
Year 2001 2002 2003 2004 2005 2006 2007 2008 2009
Metric ton equivalents(b) 33 33 42 42 50 56 51 55 65
(b) This quantity reflects the bulk weight of seizures, with no adjustment for purity. Seizures of amphetamines-group substances reported in tablets or similar units are converted using assumed bulk tablet weights between 90mg and 300 mg, depending on the region and specific drug type, and based on information currently available to UNODC. This differs from the approach adopted in earlier editions of the World Drug Report.
1,383
1,322
1,169
505
447
428
368
280
253
1,462
1,713
2,627
3,396
3,795
4,940
6,078
6,623
7,664
13,554
565
759
981
854
1,157
Saudi Arabia (21%)
United States of America (12%)
China (10%)
Mexico (9%)
Jordan (8%)
Syrian Arab Republic (6%)
Myanmar (5%)
Thailand (4%)
United Kingdom (3%)
Iran (Islamic Republic of) (2%)
Germany (2%)
Turkey (2%)
Malaysia (2%)
Netherlands (2%)
Philippines (2%)
Yemen (1%)
Qatar (1%)
France (0.9%)
Sweden (0.8%)
Norway (0.7%)
Poland (0.7%)
Japan (0.6%)
Russian Federation (0.4%)
Bulgaria (0.4%)
13,876
1,643
7,132
15,985
253
301
46
56
98
102
25,560Near and Middle East /South-West Asia (39%)
East and South-East Asia (25%)
North America (21%)
West & Central Europe (11%)
South-East Europe (3%)
East Europe (0.5%)
Oceania (0.4%)
Caribbean (0.2%)
Southern Africa (0.2%)
Central America (0.09%)
South Asia (0.07%)
SEIZURES OF AMPHETAMINES-GROUP SUBSTANCES as % of world total and
in kg equivalents (a) - HIGHEST RANKING COUNTRIES - 2009
SEIZURES OF AMPHETAMINE-GROUP SUBSTANCES as % of world total and in kg equivalents (a) - BY REGION - 2009
0
10
20
30
40
50
60
70
2001 2002 2003 2004 2005 2006 2007 2008 2009
Met
ric
ton
eq
uiv
alen
ts (b
)
(a)
(b)
(c)
(b) Data for the United Kingdom for 2009 are based on incomplete data for some jurisdictions for the financial year 2009/10, and adjusted for the missing jurisdictions using the latest available complete distribution (relative to the financial year 2006/07).(c) Data relative to 2008. Data for 2009 from the Netherlands were not available.
(a) This quantity reflects the bulk weight of seizures, with no adjustment for purity. Seizures of amphetamines-group substances reported in tablets or similar units are converted using assumed bulk tablet weights between 90mg and 300 mg, depending on the region and specific drug type, and based on information currently available to UNODC. This differs from the approach adopted in earlier editions of the World Drug Report.

169
The ATS market
Fig. 138: Interception of amphetamines-group substances, 2001-2009
AMPHETAMINES-GROUP SUBSTANCES INTERCEPTED - WORLD: 2001-2009
AMPHETAMINES-GROUP SUBSTANCES INTERCEPTED - ASIA: 2001-2009
AMPHETAMINES-GROUP SUBSTANCES INTERCEPTED - AMERICAS: 2001-2009
AMPHETAMINES-GROUP SUBSTANCES INTERCEPTED - EUROPE: 2001-2009
AMPHETAMINES-GROUP SUBSTANCES INTERCEPTED - AFRICA: 2001-2009
AMPHETAMINES-GROUP SUBSTANCES INTERCEPTED - OCEANIA: 2001-2009
0
5
10
15
20
25
30
35
40
45
2001 2002 2003 2004 2005 2006 2007 2008 2009
Met
ric
ton
eq
uiv
alen
ts
0
10
20
30
40
50
60
70
2001 2002 2003 2004 2005 2006 2007 2008 2009
Met
ric
ton
eq
uiv
alen
ts
0
3
6
9
12
15
2001 2002 2003 2004 2005 2006 2007 2008 2009
Met
ric
ton
eq
uiv
alen
ts
0
2
4
6
8
10
12
2001 2002 2003 2004 2005 2006 2007 2008 2009
Met
ric
ton
eq
uiv
alen
ts
0
1
2
3
4
2001 2002 2003 2004 2005 2006 2007 2008 2009
Met
ric
ton
eq
uiv
alen
ts
0.0
0.3
0.6
0.9
1.2
1.5
1.8
2001 2002 2003 2004 2005 2006 2007 2008 2009
Met
ric
ton
eq
uiv
alen
ts

170
World Drug Report 2011
Fig. 139: Global seizures of ‘ecstasy’-group(a) substances, 2001-2009Global seizures of ecstasy-group substances: 2001 - 2009
Year 2001 2002 2003 2004 2005 2006 2007 2008 2009Kilogram equivalents 10,895 13,049 9,410 12,727 9,729 9,776 16,595 5,991 5,435
reported by** data refer to
2003.
0
2,000
4,000
6,000
8,000
10,000
12,000
14,000
16,000
18,000
2001 2002 2003 2004 2005 2006 2007 2008 2009
Kilo
gra
m e
qu
ival
ents
(b)
3,411
13
13
8
8
28
29
37
59
59
63
102
110
117
319
405
452
25
20
23
19
14
United States of America (63%)
Netherlands (8%)
Canada (7%)
China (6%)
Turkey (2%)
Spain (2%)
Indonesia (2%)
United Kingdom (1%)
Australia (1%)
Poland (1%)
Argentina (0.7%)
France (0.5%)
Japan (0.5%)
Bulgaria (0.5%)
Malaysia (0.4%)
Italy (0.4%)
Lithuania (0.3%)
Thailand (0.3%)
Denmark (0.2%)
Greece (0.2%)
Ireland (0.2%)
Belgium (0.2%)
3,816
837
496
150
63
52
9
8
3
0
0
0
North America (70%)
West & Central Europe (15%)
East and South-East Asia (9%)
South-East Europe (3%)
Oceania (1%)
South America (0.95%)
Near and Middle East /South-WestAsia (0.17%)
East Europe (0.14%)
Caribbean (0.05%)
Central America (0.002%)
North Africa (0.0004%)
South Asia (0.0004%)
SEIZURES OF ECSTASY-GROUP SUBSTANCES as % of world
total in kg equivalents (a) - BY REGION - 2009
SEIZURES OF ECSTASY-GROUP SUBSTANCES as % of world total and in kg equivalents (a)
- HIGHEST RANKING COUNTRIES - 2009
(a) Includes substances believed to be ecstasy (e.g. MDMA, MDA, MDE) which may not have been confirmed by forensic testing. (b) This quantity reflects the bulk weight of ecstasy seizures, with no adjustment for purity. Seizures of ecstasy reported in tablets or similar units are converted using assumed bulk tablet weights between 200mg and 300mg, depending on the region and based on information currently available to UNODC. This differs from the approach adopted in earlier editions of the World Drug Report.
(a)
(b)
(c)
(a) This quantity reflects the bulk weight of ecstasy seizures, with no adjustment for purity. Seizures of ecstasy reported in tablets or similar units are converted using assumed bulk tablet weights between 200mg and 300mg, depending on the region and based on information currently available to UNODC. This differs from the approach adopted in earlier editions of the World Drug Report.(b) Data relative to 2008. Data for 2009 from the Netherlands were not available(c) Data for the United Kingdom for 2009 are based on incomplete data for some jurisdictions for the financial year 2009/10, and adjusted for the missing jurisdictions using the latest available complete distribution (relative to the financial year 2006/07).

171
The ATS market
Fig. 140: Interception of ‘ecstasy’-group substances, 2001-2009
ECSTASY INTERCEPTED - WORLD: 2001-2009 ECSTASY INTERCEPTED - ASIA: 2001-2009
ECSTASY INTERCEPTED - AMERICAS: 2001-2009 ECSTASY INTERCEPTED - EUROPE: 2001-2009
ECSTASY INTERCEPTED - AFRICA: 2001-2009 ECSTASY INTERCEPTED - OCEANIA: 2001-2009
0
300
600
900
1,200
1,500
1,800
2,100
2001 2002 2003 2004 2005 2006 2007 2008 2009
Kilo
gra
ms
equ
ival
ents
0
2,000
4,000
6,000
8,000
10,000
12,000
14,000
16,000
18,000
2001 2002 2003 2004 2005 2006 2007 2008 2009
Kilo
gra
ms
equ
ival
ents
0
600
1,200
1,800
2,400
3,000
3,600
4,200
2001 2002 2003 2004 2005 2006 2007 2008 2009
Kilo
gra
ms
equ
ival
ents
0
1,000
2,000
3,000
4,000
5,000
6,000
7,000
8,000
9,000
2001 2002 2003 2004 2005 2006 2007 2008 2009
Kilo
gra
ms
equ
ival
ents
0
50
100
150
200
250
300
350
2001 2002 2003 2004 2005 2006 2007 2008 2009
Kilo
gra
ms
equ
ival
ents
0
600
1,200
1,800
2,400
3,000
3,600
4,200
4,800
2001 2002 2003 2004 2005 2006 2007 2008 2009
Kilo
gra
ms
equ
ival
ents

172
World Drug Report 2011
Map
38:
S
eizu
res
of
amp
het
amin
es-g
rou
p s
ub
stan
ces,
200
9 (c
ou
ntr
ies
and
ter
rito
ries
rep
ort
ing
sei
zure
s o
f m
ore
th
an 1
0 kg
)*
* Th
is q
uan
tity
ref
lect
s th
e b
ulk
wei
gh
t o
f am
ph
etam
ine
gro
up
sei
zure
s, w
ith
no
ad
just
men
t fo
r p
uri
ty. S
eizu
res
of
amp
het
amin
es-g
rou
p r
epo
rted
in t
able
ts o
r si
mila
r u
nit
s ar
e co
nve
rted
usi
ng
ass
um
ed b
ulk
tab
let
wei
gh
ts b
etw
een
90m
g a
nd
300
mg
, d
epen
din
g o
n t
he
reg
ion
an
d s
pec
ific
dru
g t
ype
and
bas
ed o
n in
form
atio
n c
urr
entl
y av
aila
ble
to
UN
OD
C. T
his
dif
fers
fro
m t
he
app
roac
h a
do
pte
d in
ear
lier
edit
ion
s o
f th
e W
orl
d D
rug
Rep
ort
.So
urc
e: U
NO
DC
An
nu
al R
epo
rts
Qu
esti
on
nai
res
dat
a su
pp
lem
ente
d b
y o
ther
so
urc
esN
ote
: Th
e b
ou
nd
arie
s an
d n
ames
sh
ow
n a
nd
th
e d
esig
nat
ion
s u
sed
on
th
is m
ap d
o n
ot
imp
ly o
ffic
ial e
nd
ors
emen
t o
r ac
cep
tan
ce b
y th
e U
nit
ed N
atio
ns.
Incr
ease
(>
10%
)
Stab
le (
+/-
10%
)
Dec
reas
e (>
10%
)
Seiz
ure
s in
200
9W
eig
ht
in m
etri
c to
ns
Tren
d 2
008-
2009
Seiz
ure
s o
f am
ph
eta
min
es-
gro
up
su
bst
an
ces,
2009 (c
ou
ntr
ies
and
ter
rito
ries
rep
ort
ing
sei
zure
s* o
f m
ore
th
an 1
0 kg
)
Am
ph
etam
ines
-gro
up
sei
zure
sre
po
rted
to
UN
OD
C (
2005
-200
9)
No
am
ph
etam
ines
-gro
up
sei
zure
sre
po
rted
to
UN
OD
C (
2005
-200
9)
13
.6
Saud
i Ara
bia
Uni
ted
Stat
es o
f A
mer
ica
7.7
Jord
an4
.9
Wes
t &
Cen
tral
Eur
ope
7.1
32
Chi
na6
.6
Mex
ico
6.1
Syria
n A
rab
Repu
blic
3.8
Mya
nmar
3.4 Th
aila
nd2.
6
Sout
h-Ea
st E
urop
e1
.64
3
Mal
aysi
a1.
2
Qat
ar0.
76
Phili
ppin
es1.
0
Isla
mic
Rep
ublic
of
Iran
1.5
Yem
en0
.9
East
Eur
ope
0.3
0
Japa
n0.
37
Dom
inic
an R
epub
lic0
.10
Indo
nesi
a0.
24Lao
Peop
le’s
Dem
ocra
tic R
epub
lic0.
21
Aus
tral
ia
0.23
Vie
t N
am0.
18
Can
ada
0.13
Uni
ted
Ara
b Em
irate
s0.
13Ta
iwan
, Pro
vinc
e of
Chi
na0.
11In
dia
0.04
6
No
dat
a av
aila
ble
fo
r p
revi
ou
s ye
ar
Nic
arag
ua0
.06
Kuw
ait
0.05
Sout
h A
fric
a
0.04
8
Hon
g K
ong,
Chi
na0.
044
Cam
bodi
a0.
017
Repu
blic
of
Kor
ea0.
015
New
Zea
land
0.02
2
Zam
bia
0.05
Col
ombi
a0
.02
6

173
The ATS market
Map
39:
S
eizu
res
of
ecst
asy,
200
9 (c
ou
ntr
ies
and
ter
rito
ries
rep
ort
ing
sei
zure
s o
f m
ore
th
an 1
0 kg
)*
* Th
is q
uan
tity
ref
lect
s th
e b
ulk
wei
gh
t o
f ec
stas
y se
izu
res,
wit
h n
o a
dju
stm
ent
for
pu
rity
. Sei
zure
s o
f ec
stas
y re
po
rted
in t
able
ts o
r si
mila
r u
nit
s ar
e co
nve
rted
usi
ng
ass
um
ed b
ulk
tab
let
wei
gh
ts b
etw
een
200
mg
an
d 3
00m
g,
dep
end
ing
on
th
e re
gio
n a
nd
bas
ed o
n in
form
atio
n c
urr
entl
y av
aila
ble
to
UN
OD
C. T
his
dif
fers
fro
m t
he
app
roac
h a
do
pte
d in
ear
lier
edit
ion
s o
f th
e W
orl
d D
rug
Rep
ort
.So
urc
e: U
NO
DC
An
nu
al R
epo
rts
Qu
esti
on
nai
res
dat
a su
pp
lem
ente
d b
y o
ther
so
urc
esN
ote
: Th
e b
ou
nd
arie
s an
d n
ames
sh
ow
n a
nd
th
e d
esig
nat
ion
s u
sed
on
th
is m
ap d
o n
ot
imp
ly o
ffic
ial e
nd
ors
emen
t o
r ac
cep
tan
ce b
y th
e U
nit
ed N
atio
ns.
Incr
ease
(>
10%
)
Stab
le (
+/-
10%
)
Dec
reas
e (>
10%
)
Seiz
ure
s in
200
9W
eig
ht
in k
ilog
ram
sTr
end
200
8-20
09
Seiz
ure
s o
f ecs
tasy
, 2009 (c
ou
ntr
ies
and
ter
rito
ries
rep
ort
ing
sei
zure
s* o
f m
ore
th
an 1
kg
)
Ecst
asy
seiz
ure
sre
po
rted
to
UN
OD
C (
2005
-200
9)
No
ecs
tasy
sei
zure
sre
po
rted
to
UN
OD
C (
2005
-200
9)
No
dat
a av
aila
ble
fo
r p
revi
ou
s ye
ar
Uni
ted
Stat
es o
f A
mer
ica
3,41
0.55
Wes
t &
Cen
tral
Eur
ope
837.
28
Can
ada
404.
59
Chi
na31
8.6
Sout
h-Ea
st E
urop
e14
9.76
Aus
tral
ia59
.5
Arg
entin
a37
.02
Japa
n27
.59
Mal
aysi
a22
.65
Thai
land
14.0
8
East
Eur
ope
7.71
Braz
il7.
67
Leba
non
4.1
Hon
g K
ong,
Chi
na4.
63
New
Zea
land
4.00
Saud
i Ara
bia
3.50
Sing
apor
e2.
70
Isra
el1.
62Ta
iwan
, Pro
vinc
e of
Chi
na2
.02
Mex
ico
1.12
Cam
bodi
a1.
01 Indo
nesi
a10
2.26
Col
ombi
a6.
36
Dom
inic
an R
epub
lic2.
75