Seventh United Nations Survey of Crime Trends ... - UNODC
316
Seventh United Nations Survey of Crime Trends and Operations of Criminal Justice Systems, covering the period 1998 - 2000 UNITED NATIONS NATIONS UNIES Office on Drugs and Crime Division for Policy Analysis and Public Affairs POLICE 1. Police personnel, by sex, and financial resources 01.01 5b TOTPOL Total police personnel 1998 1999 2000 1998 1999 2000 Count Rate per 100,000 inhabitants Country Argentina 198,459 542.24 Australia 42,041 41,969 42,047 223.62 220.89 218.99 Barbados 1,324 1,346 1,379 499.06 505.86 516.48 Canada 54,763 55,321 56,020 181.33 181.38 181.88 Chile 29,010 29,458 29,658 196.01 196.39 195.12 Colombia 103,958 102,904 91,155 254.80 247.96 215.50 Costa Rica 1,352 1,428 1,489 37.01 38.27 39.07 Czech Republic 44,603 45,020 45,840 433.04 437.09 445.05 Denmark 10,167 10,259 10,414 191.79 192.87 195.16 Dominica 442 442 442 605.48 England & Wales 126,504 125,464 123,826 241.29 238.12 233.88 Estonia 4,089 3,584 3,633 290.82 258.46 265.38 Finland 7,981 7,995 8,166 154.88 154.79 157.74 France 114,665 120,400 124,284 196.34 205.46 211.01 Georgia 12,253 12,786 11,507 225.16 254.50 229.04 Germany 253,766 240,000 309.47 291.97 Guatemala 18,850 24,547 26,634 174.54 221.14 233.63 Holy See (Vatican City State) 128 126 124 Hong Kong, China (SAR) 34,036 33,708 33,072 512.16 501.55 486.57 Hungary 29,532 29,878 28,873 292.40 295.82 288.73 Iceland 622 637 666 227.01 229.55 237.01 India 1,019,238 1,032,956 104.00 103.50 Ireland 11,235 11,458 11,642 302.67 305.38 306.85 Page 1 of 316 Population Source: World Bank
-
Upload
khangminh22 -
Category
Documents
-
view
0 -
download
0
Transcript of Seventh United Nations Survey of Crime Trends ... - UNODC

Seventh United Nations Survey of Crime Trends and Operations of Criminal Justice Systems,covering the period 1998 - 2000
UNITED NATIONS NATIONS UNIES
Office on Drugs and CrimeDivision for Policy Analysis and Public Affairs
POLICE1. Police personnel, by sex, and financial resources
01.01 5b TOTPOLTotal police personnel
1998 1999 2000 1998 1999 2000Count Rate per 100,000 inhabitants
CountryArgentina 198,459 542.24Australia 42,041 41,969 42,047 223.62 220.89 218.99Barbados 1,324 1,346 1,379 499.06 505.86 516.48Canada 54,763 55,321 56,020 181.33 181.38 181.88Chile 29,010 29,458 29,658 196.01 196.39 195.12Colombia 103,958 102,904 91,155 254.80 247.96 215.50Costa Rica 1,352 1,428 1,489 37.01 38.27 39.07Czech Republic 44,603 45,020 45,840 433.04 437.09 445.05Denmark 10,167 10,259 10,414 191.79 192.87 195.16Dominica 442 442 442 605.48England & Wales 126,504 125,464 123,826 241.29 238.12 233.88Estonia 4,089 3,584 3,633 290.82 258.46 265.38Finland 7,981 7,995 8,166 154.88 154.79 157.74France 114,665 120,400 124,284 196.34 205.46 211.01Georgia 12,253 12,786 11,507 225.16 254.50 229.04Germany 253,766 240,000 309.47 291.97Guatemala 18,850 24,547 26,634 174.54 221.14 233.63Holy See (Vatican City State) 128 126 124Hong Kong, China (SAR) 34,036 33,708 33,072 512.16 501.55 486.57Hungary 29,532 29,878 28,873 292.40 295.82 288.73Iceland 622 637 666 227.01 229.55 237.01India 1,019,238 1,032,956 104.00 103.50Ireland 11,235 11,458 11,642 302.67 305.38 306.85
Page 1 of 316Population Source: World Bank
POLICE1. Police personnel, by sex, and financial resources
01.01 5b TOTPOLTotal police personnel
1998 1999 2000 1998 1999 2000Count Rate per 100,000 inhabitants
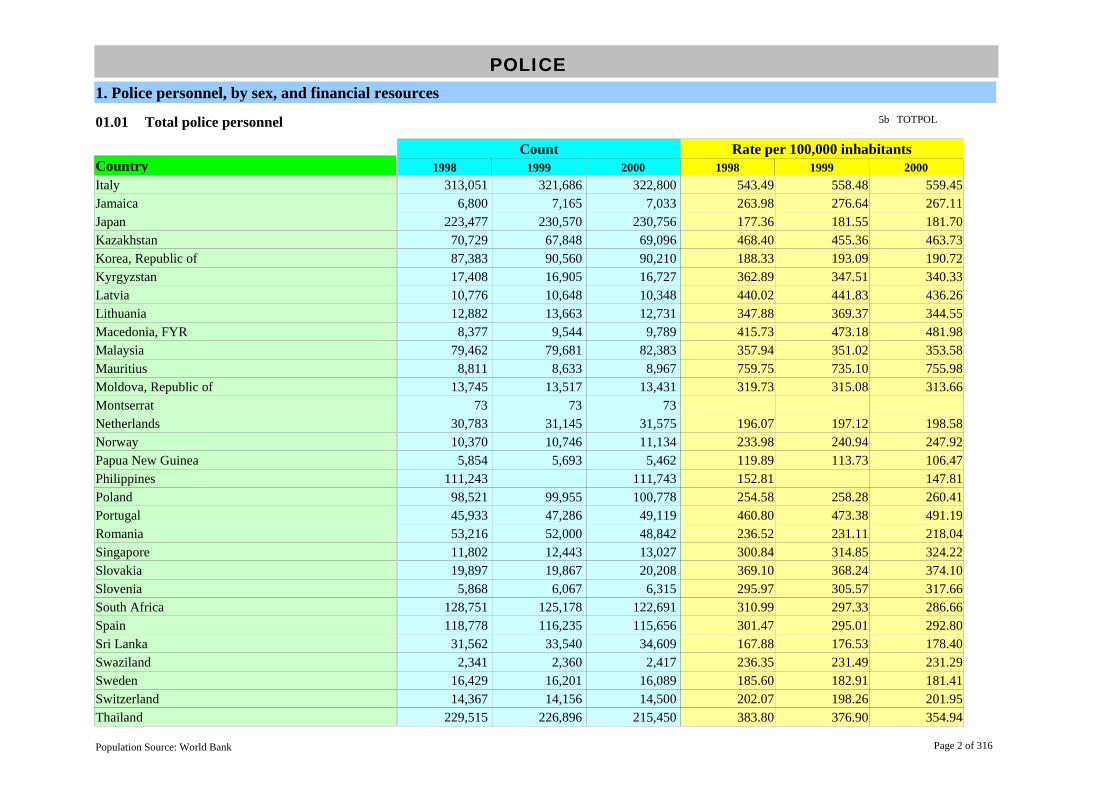
CountryItaly 313,051 321,686 322,800 543.49 558.48 559.45Jamaica 6,800 7,165 7,033 263.98 276.64 267.11Japan 223,477 230,570 230,756 177.36 181.55 181.70Kazakhstan 70,729 67,848 69,096 468.40 455.36 463.73Korea, Republic of 87,383 90,560 90,210 188.33 193.09 190.72Kyrgyzstan 17,408 16,905 16,727 362.89 347.51 340.33Latvia 10,776 10,648 10,348 440.02 441.83 436.26Lithuania 12,882 13,663 12,731 347.88 369.37 344.55Macedonia, FYR 8,377 9,544 9,789 415.73 473.18 481.98Malaysia 79,462 79,681 82,383 357.94 351.02 353.58Mauritius 8,811 8,633 8,967 759.75 735.10 755.98Moldova, Republic of 13,745 13,517 13,431 319.73 315.08 313.66Montserrat 73 73 73Netherlands 30,783 31,145 31,575 196.07 197.12 198.58Norway 10,370 10,746 11,134 233.98 240.94 247.92Papua New Guinea 5,854 5,693 5,462 119.89 113.73 106.47Philippines 111,243 111,743 152.81 147.81Poland 98,521 99,955 100,778 254.58 258.28 260.41Portugal 45,933 47,286 49,119 460.80 473.38 491.19Romania 53,216 52,000 48,842 236.52 231.11 218.04Singapore 11,802 12,443 13,027 300.84 314.85 324.22Slovakia 19,897 19,867 20,208 369.10 368.24 374.10Slovenia 5,868 6,067 6,315 295.97 305.57 317.66South Africa 128,751 125,178 122,691 310.99 297.33 286.66Spain 118,778 116,235 115,656 301.47 295.01 292.80Sri Lanka 31,562 33,540 34,609 167.88 176.53 178.40Swaziland 2,341 2,360 2,417 236.35 231.49 231.29Sweden 16,429 16,201 16,089 185.60 182.91 181.41Switzerland 14,367 14,156 14,500 202.07 198.26 201.95Thailand 229,515 226,896 215,450 383.80 376.90 354.94
Page 2 of 316Population Source: World Bank

POLICE1. Police personnel, by sex, and financial resources
01.01 5b TOTPOLTotal police personnel
1998 1999 2000 1998 1999 2000Count Rate per 100,000 inhabitants
CountryTurkey 152,239 159,044 165,833 240.12 247.35 253.96United States of America 677,933 243.86Zambia 11,047 12,048 12,802 114.29 121.93 126.75Zimbabwe 18,211 20,535 146.86 162.98
Page 3 of 316Population Source: World Bank

POLICE1. Police personnel, by sex, and financial resources
01.02 5b FEPOLFemale police personnel
1998 1999 2000 1998 1999 2000Count Rate per 100,000 inhabitants
CountryBarbados 112 121 134 42.22 45.48 50.19Canada 6,687 7,152 7,658 22.14 23.45 24.86Chile 1,509 1,641 1,778 10.20 10.94 11.70Colombia 4,158 4,116 4,558 10.19 9.92 10.78Czech Republic 5,132 4,813 4,914 49.83 46.73 47.71Denmark 665 729 797 12.54 13.71 14.94Dominica 39 38 38 52.05England & Wales 19,891 20,223 20,694 37.94 38.38 39.09Estonia 916 908 943 65.15 65.48 68.88Finland 551 625 702 10.69 12.10 13.56France 11,108 14,516 16,543 19.02 24.77 28.09Georgia 889 837 979 16.34 16.66 19.49Guatemala 2,972 3,500 3,898 27.52 31.53 34.19Hong Kong, China (SAR) 4,156 4,177 4,128 62.54 62.15 60.73Hungary 3,012 4,128 4,416 29.82 40.87 44.16India 20,619 23,025 2.10 2.31Ireland 1,094 1,251 1,411 29.47 33.34 37.19Italy 13,693 16,061 16,981 23.77 27.88 29.43Jamaica 6,272 238.21Japan 8,058 8,298 8,520 6.40 6.53 6.71Kazakhstan 6,347 6,660 6,897 42.03 44.70 46.29Korea, Republic of 1,666 1,778 2,177 3.59 3.79 4.60Kyrgyzstan 821 786 813 17.11 16.16 16.54Latvia 1,473 1,651 1,678 60.15 68.51 70.74Lithuania 1,627 1,824 1,800 43.94 49.31 48.71Macedonia, FYR 1,268 1,567 1,635 62.93 77.69 80.50Malaysia 6,732 7,197 8,008 30.32 31.70 34.37Mauritius 437 425 488 37.68 36.19 41.14Moldova, Republic of 343 401 476 7.98 9.35 11.12Montserrat 12 14 14
Page 4 of 316Population Source: World Bank
POLICE1. Police personnel, by sex, and financial resources
01.02 5b FEPOLFemale police personnel
1998 1999 2000 1998 1999 2000Count Rate per 100,000 inhabitants
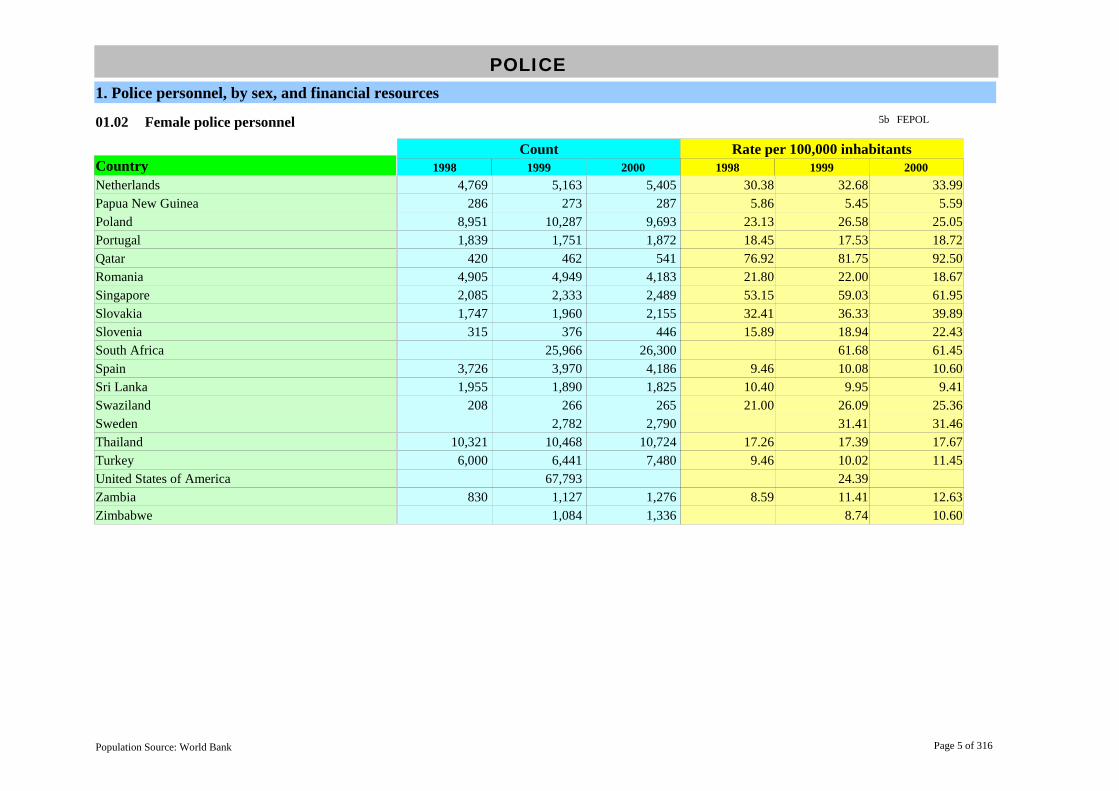
CountryNetherlands 4,769 5,163 5,405 30.38 32.68 33.99Papua New Guinea 286 273 287 5.86 5.45 5.59Poland 8,951 10,287 9,693 23.13 26.58 25.05Portugal 1,839 1,751 1,872 18.45 17.53 18.72Qatar 420 462 541 76.92 81.75 92.50Romania 4,905 4,949 4,183 21.80 22.00 18.67Singapore 2,085 2,333 2,489 53.15 59.03 61.95Slovakia 1,747 1,960 2,155 32.41 36.33 39.89Slovenia 315 376 446 15.89 18.94 22.43South Africa 25,966 26,300 61.68 61.45Spain 3,726 3,970 4,186 9.46 10.08 10.60Sri Lanka 1,955 1,890 1,825 10.40 9.95 9.41Swaziland 208 266 265 21.00 26.09 25.36Sweden 2,782 2,790 31.41 31.46Thailand 10,321 10,468 10,724 17.26 17.39 17.67Turkey 6,000 6,441 7,480 9.46 10.02 11.45United States of America 67,793 24.39Zambia 830 1,127 1,276 8.59 11.41 12.63Zimbabwe 1,084 1,336 8.74 10.60
Page 5 of 316Population Source: World Bank

POLICE1. Police personnel, by sex, and financial resources
01.03 5b MAPOLMale police personnel
1998 1999 2000 1998 1999 2000Count Rate per 100,000 inhabitants
CountryBarbados 1,212 1,225 1,245 456.84 460.39 466.29Canada 48,076 48,169 48,362 159.19 157.93 157.02Chile 27,501 27,817 27,880 185.82 185.45 183.42Colombia 99,800 98,788 86,597 244.61 238.04 204.72Czech Republic 39,471 40,207 40,926 383.21 390.36 397.34Denmark 9,502 9,530 9,617 179.25 179.17 180.23Dominica 403 404 404 553.42England & Wales 106,613 105,241 103,132 203.35 199.74 194.80Estonia 3,173 2,676 2,690 225.67 192.98 196.49Finland 7,430 7,370 7,464 144.19 142.69 144.18France 103,557 105,884 107,741 177.32 180.69 182.92Georgia 11,364 11,949 10,528 208.82 237.84 209.55Guatemala 15,878 21,047 22,436 147.02 189.61 196.81Holy See (Vatican City State) 128 126 128Hong Kong, China (SAR) 29,880 29,531 28,944 449.62 439.40 425.83Hungary 26,520 25,750 24,457 262.57 254.95 244.57India 998,619 1,009,931 101.90 101.20Ireland 10,141 10,207 10,231 273.20 272.04 269.66Italy 299,358 305,625 305,819 519.72 530.60 530.02Jamaica 761 28.90Japan 215,419 222,272 222,236 170.97 175.02 174.99Kazakhstan 64,382 61,188 62,199 426.37 410.66 417.44Korea, Republic of 85,717 88,782 88,033 184.73 189.30 186.12Kyrgyzstan 15,303 15,010 14,971 319.01 308.56 304.60Latvia 8,438 8,010 7,818 344.55 332.37 329.60Lithuania 11,255 11,839 10,931 303.94 320.06 295.83Macedonia, FYR 7,109 7,977 8,154 352.80 395.49 401.48Malaysia 72,730 72,484 74,375 327.61 319.31 319.21Mauritius 8,374 8,208 8,479 722.06 698.91 714.84Moldova, Republic of 13,402 13,116 12,955 311.75 305.73 302.55
Page 6 of 316Population Source: World Bank

POLICE1. Police personnel, by sex, and financial resources
01.03 5b MAPOLMale police personnel
1998 1999 2000 1998 1999 2000Count Rate per 100,000 inhabitants
CountryMontserrat 51 52 52Netherlands 26,014 25,982 26,170 165.69 164.44 164.59Papua New Guinea 5,568 5,420 5,175 114.03 108.27 100.88Poland 89,570 89,668 91,085 231.45 231.70 235.36Portugal 44,114 45,535 47,247 442.56 455.85 472.47Qatar 10,128 10,383 11,292 1,854.95 1,837.34 1,930.62Romania 48,311 47,051 44,659 214.72 209.12 199.37Singapore 9,717 10,110 10,538 247.69 255.82 262.27Slovakia 18,150 17,907 18,053 336.69 331.91 334.20Slovenia 5,553 5,691 5,869 280.09 286.63 295.22South Africa 99,212 96,391 235.66 225.21Spain 115,052 112,265 111,470 292.01 284.94 282.20Sri Lanka 29,607 31,650 32,784 157.48 166.58 168.99Swaziland 1,792 1,930 2,096 180.93 189.31 200.57Sweden 13,419 13,299 151.50 149.95Thailand 219,194 216,428 204,726 366.55 359.51 337.28Turkey 146,239 152,603 158,353 230.66 237.33 242.50United States of America 610,140 219.47Zambia 10,267 10,921 12,526 106.22 110.52 124.02Zimbabwe 17,127 19,199 138.12 152.37
Page 7 of 316Population Source: World Bank

POLICE1. Police personnel, by sex, and financial resources
01.04 5a POLBUDTotal police budget/financial resources
1998 1999 2000 1998 1999 2000Count Rate per 100,000 inhabitants
CountryAustralia 3,688 4,036 4,197 19.62 21.24 21.86Canada 6,210 6,391 20.56 20.95Chile 180,265,625 205,140,710 216,394,860 1,218,010.98 1,367,604.73 1,423,650.39Colombia 1,584,669 1,876,737 2,060,888 3,883.99 4,522.26 4,872.08Costa Rica 4,564 5,946 6,731 124.94 159.36 176.62Czech Republic 20,652 22,003 27,073 200.50 213.62 262.84Denmark 5,354 5,448 5,668 101.00 102.43 106.22Dominica 17 18 19 25.48England & Wales 7,290 7,452 7,647 13.90 14.14 14.44Estonia 571 833 799 40.61 60.07 58.36Finland 2,914 3,017 3,133 56.55 58.41 60.52France 28,282 29,111 29,992 48.43 49.68 50.92Georgia 91 103 97 1.67 2.05 1.92Greece 284,402 305,858 356,699 2,708.59 2,912.93 3,365.08Guatemala 536,660,174 763,813,140 839,741,843 4,969,075.68 6,881,199.46 7,366,156.52Hong Kong, China (SAR) 11,915 11,892 11,741 179.29 176.95 172.74Hungary 86,571 98,891 103,833 857.14 979.11 1,038.33Iceland 3 4 4 1.21 1.41 1.43Ireland 569 589 639 15.33 15.70 16.84Jamaica 4,724 5,751 5,570 183.38 222.05 211.55Japan 252,906 258,654 286,342 200.72 203.66 225.47Kazakhstan 180,917,009 7,677,188 6,869,903 1,198,125.89 51,524.75 46,106.73Korea, Republic of 3,483,335 3,475,456 3,701,069 7,507.19 7,410.35 7,824.67Kyrgyzstan 82 95 113 1.72 1.95 2.29Latvia 35 38 37 1.41 1.56 1.56Lithuania 416 389 383 11.23 10.53 10.36Malaysia 2,059 1,793 1,932 9.27 7.90 8.29Mauritius 1,429 1,710 1,709 123.22 145.61 144.08Mexico 218,121 715,426 1,270,028 229.12 740.61 1,295.95Moldova, Republic of 128 118 150 2.97 2.76 3.51
Page 8 of 316Population Source: World Bank

POLICE1. Police personnel, by sex, and financial resources
01.04 5a POLBUDTotal police budget/financial resources
1998 1999 2000 1998 1999 2000Count Rate per 100,000 inhabitants
CountryPapua New Guinea 96 82 97 1.97 1.64 1.89Poland 3,724 4,385 4,848 9.62 11.33 12.53Portugal 191,721 207,430 213,451 1,923.36 2,076.58 2,134.51Romania 1,905,981 2,611,490 4,510,856 8,471.03 11,606.62 20,137.75Singapore 1,012 1,146 1,279 25.80 29.00 31.84Slovakia 8,891 9,190 9,922 164.93 170.34 183.68Slovenia 33,719 35,428 38,354 1,700.75 1,784.34 1,929.28South Africa 13,896,690 14,519,460 15,594,140 33,566.88 34,488.03 36,434.91Spain 558,308,040 571,977,688 597,377,794 1,417,025.48 1,451,720.02 1,512,348.85Sri Lanka 8,814 8,070 46.88 42.47Sweden 10,957 11,492 11,594 123.78 129.74 130.73Switzerland 83,258 117,697 1,171.00 1,648.42Thailand 34,337 38,112 42,446 57.42 63.31 69.93Turkey 338,693,250 579,400,800 937,037,000 534,216.48 901,089.89 1,434,972.43Ukraine 477 485 630 0.95 0.97 1.27Zambia 15,026 53,337 60,860 155.46 539.78 602.57Zimbabwe 2,931 2,973 3,270 24.03 23.97 25.95
Page 9 of 316Population Source: World Bank

POLICE2. Crimes recorded in criminal (police) statistics, by type of crime including attempts to commit crimes
02.01 5c GTPOLGrand total of recorded crimes
1998 1999 2000 1998 1999 2000Count Rate per 100,000 inhabitants
CountryArgentina 922,948 1,062,241 1,129,900 2,556.64 2,902.30 3,053.78Armenia 10,761 10,056 12,048 283.56 264.56 316.80Azerbaijan 14,937 14,400 13,958 188.77 180.38 173.41Barbados 10,094 10,199 10,908 3,804.75 3,833.06 4,085.39Belarus 122,858 130,537 135,540 1,216.42 1,305.37 1,355.40Bulgaria 163,988 145,035 148,915 1,986.05 1,767.00 1,823.38Canada 2,567,894 2,475,915 2,476,520 8,502.96 8,117.75 8,040.65Chile 1,505,455 1,614,991 1,409,939 10,171.99 10,766.61 9,275.91China 1,986,068 2,249,319 3,637,307 160.17 179.95 288.68Colombia 224,250 223,616 214,192 549.63 538.83 506.36Costa Rica 45,522 48,107 1,246.13 1,289.36Côte d'Ivoire 70,066 437.91Czech Republic 425,930 426,626 391,469 4,135.24 4,142.00 3,800.67Denmark 499,174 494,205 504,240 9,416.60 9,291.31 9,449.78Dominica 9,831 7,041 7,857 10,763.01England & Wales 5,109,089 5,301,187 5,170,831 9,744.98 10,061.11 9,766.73Estonia 45,721 51,539 57,799 3,251.78 3,716.75 4,221.99Finland 383,479 509,606 530,270 7,441.86 9,866.52 10,242.80France 3,565,525 3,567,864 3,771,849 6,105.35 6,088.51 6,403.82Georgia 14,874 14,148 15,029 273.32 281.61 299.14Germany 6,456,996 6,302,316 6,264,723 7,874.39 7,676.39 7,621.32Greece 255,799 248,619 102,783 2,436.18 2,367.80 969.65Guatemala 21,426 22,253 27,318 198.39 200.48 239.63Holy See (Vatican City State) 20 15 11Hong Kong, China (SAR) 74,952 79,861 80,592 1,127.84 1,188.28 1,185.70Hungary 600,621 505,716 450,078 5,946.74 5,007.09 4,500.78India 1,778,815 1,764,629 181.51 176.82Ireland 85,627 81,274 2,306.76 2,166.15Italy 2,426 2,374 2,205,782 4.21 4.12 3,822.85Jamaica 47,763 41,456 39,188 1,854.15 1,600.62 1,488.34
Page 10 of 316Population Source: World Bank

POLICE2. Crimes recorded in criminal (police) statistics, by type of crime including attempts to commit crimes
02.01 5c GTPOLGrand total of recorded crimes
1998 1999 2000 1998 1999 2000Count Rate per 100,000 inhabitants
CountryJapan 2,033,546 2,165,626 2,443,470 1,613.93 1,705.22 1,923.99Korea, Republic of 1,579,728 1,574,902 1,543,219 3,404.59 3,358.00 3,262.62Kyrgyzstan 34,287 39,951 38,620 714.76 821.26 785.76Latvia 36,674 43,969 50,199 1,497.51 1,824.44 2,116.32Lithuania 78,149 77,108 82,370 2,110.42 2,084.56 2,229.23Macedonia, FYR 22,123 22,462 19,814 1,097.92 1,113.63 975.58Malaysia 158,859 169,115 167,173 715.58 745.00 717.48Mauritius 37,562 38,049 35,943 3,238.86 3,239.87 3,030.25Mexico 1,364,987 1,390,468 1,363,709 1,433.81 1,439.41 1,391.54Moldova, Republic of 36,195 39,346 38,267 841.94 917.16 893.67Montserrat 715 831 751Netherlands 1,223,500 1,284,328 1,305,635 7,792.99 8,128.66 8,211.54New Zealand 461,677 438,074 427,230 12,174.38 11,495.89 11,152.50Norway 318,275 315,924 330,071 7,181.30 7,083.50 7,349.61Pakistan 2,627 2,623 3,072 1.99 1.94 2.23Palestinian Territory, occupied 22,286 21,426Papua New Guinea 12,069 13,733 13,292 247.17 274.34 259.10Paraguay 4,657 5,882 4,383 89.23 109.76 79.75Philippines 71,575 82,358 80,108 98.32 110.99 105.96Poland 1,073,042 1,121,545 1,266,910 2,772.72 2,898.05 3,273.67Portugal 341,122 362,589 363,294 3,422.17 3,629.88 3,632.94Qatar 4,897 5,632 5,838 896.89 996.62 998.14Romania 389,172 360,299 368,025 1,729.65 1,601.33 1,642.97Russian Federation 2,581,940 3,001,748 2,952,367 1,756.42 2,055.99 2,022.17Seychelles 4,074 4,297 5,166.77 5,369.24Singapore 64,861 52,097 48,321 1,653.35 1,318.24 1,202.61Slovakia 93,859 94,016 88,817 1,741.14 1,742.61 1,644.21Slovenia 55,259 61,693 67,617 2,787.20 3,107.18 3,401.26South Africa 2,829,874 3,074,378 3,422,743 6,835.44 7,302.56 7,997.06Spain 965,837 961,787 923,271 2,451.36 2,441.08 2,337.39
Page 11 of 316Population Source: World Bank

POLICE2. Crimes recorded in criminal (police) statistics, by type of crime including attempts to commit crimes
02.01 5c GTPOLGrand total of recorded crimes
1998 1999 2000 1998 1999 2000Count Rate per 100,000 inhabitants
CountrySwaziland 48,078 48,338 50,186 4,854.11 4,741.48 4,802.49Switzerland 332,000 311,000 271,000 4,669.48 4,355.74 3,774.37Thailand 781,139 580,762 565,108 1,306.25 964.72 930.99Tunisia 129,476 124,705 126,576 1,387.25 1,318.81 1,323.53Turkey 330,403 305,776 286,482 521.14 475.55 438.72Ukraine 575,982 558,716 553,594 1,145.09 1,119.67 1,118.37United States of America 24,537,600 23,677,800 8,922.76 8,517.19Uruguay 68,799 67,846 74,133 2,091.79 2,047.87 2,221.55Venezuela 239,412 246,967 236,165 1,031.95 1,042.05 975.89Yemen 13,640 16,517 24,066 82.17 97.16 137.52Zambia 65,085 67,382 59,426 673.36 681.92 588.38Zimbabwe 302,810 346,519 351,153 2,482.05 2,794.51 2,786.93
Page 12 of 316Population Source: World Bank

POLICE2. Crimes recorded in criminal (police) statistics, by type of crime including attempts to commit crimes
02.02 5c CIHPOLTotal recorded intentional homicide, completed
1998 1999 2000 1998 1999 2000Count Rate per 100,000 inhabitants
CountryArgentina 2,607 2,668 2,653 7.22 7.29 7.17Armenia 145 156 127 3.82 4.10 3.34Australia 285 343 302 1.52 1.81 1.57Azerbaijan 280 242 226 3.54 3.03 2.81Barbados 20 23 20 7.54 8.64 7.49Belarus 1,036 974 1,013 10.26 9.74 10.13Bulgaria 381 327 332 4.61 3.98 4.07Canada 506 482 489 1.68 1.58 1.59Chile 225 240 235 1.52 1.60 1.55Colombia 23,089 24,355 26,539 56.59 58.69 62.74Costa Rica 224 245 6.13 6.57Côte d'Ivoire 651 4.07Czech Republic 174 172 174 1.69 1.67 1.69Denmark 49 52 58 0.92 0.98 1.09Dominica 9 7 2 2.74England & Wales 750 766 850 1.43 1.45 1.61Estonia 196 157 143 13.94 11.32 10.45Finland 113 143 148 2.19 2.77 2.86France 961 953 1,051 1.65 1.63 1.78Georgia 243 244 239 4.47 4.86 4.76Germany 976 1,005 960 1.19 1.22 1.17Greece 176 155 81 1.68 1.48 0.76Guatemala 3,310 2,655 2,904 30.65 23.92 25.47Hong Kong, China (SAR) 63 58 38 0.95 0.86 0.56Hungary 289 253 205 2.86 2.50 2.05Iceland 2 5 0.72 1.78India 38,584 37,170 3.94 3.72Indonesia 1,758 2,090 2,204 0.86 1.01 1.05Ireland 38 38 1.02 1.01Italy 876 805 746 1.52 1.40 1.29
Page 13 of 316Population Source: World Bank

POLICE2. Crimes recorded in criminal (police) statistics, by type of crime including attempts to commit crimes
02.02 5c CIHPOLTotal recorded intentional homicide, completed
1998 1999 2000 1998 1999 2000Count Rate per 100,000 inhabitants
CountryJamaica 859 854 887 33.35 32.97 33.69Japan 716 674 637 0.57 0.53 0.50Korea, Republic of 975 993 955 2.10 2.12 2.02Kyrgyzstan 425 433 413 8.86 8.90 8.40Latvia 250 229 238 10.21 9.50 10.03Lithuania 311 309 370 8.40 8.35 10.01Macedonia, FYR 48 38 47 2.38 1.88 2.31Malaysia 629 588 551 2.83 2.59 2.36Mauritius 31 23 26 2.67 1.96 2.19Mexico 14,216 14,619 13,829 14.93 15.13 14.11Moldova, Republic of 322 327 348 7.49 7.62 8.13Netherlands 195 225 183 1.24 1.42 1.15New Zealand 45 40 45 1.19 1.05 1.17Norway 38 37 49 0.86 0.83 1.09Pakistan 88 74 66 0.07 0.05 0.05Palestinian Territory, occupied 45 54Papua New Guinea 502 450 465 10.28 8.99 9.06Paraguay 856 634 662 16.40 11.83 12.05Philippines 5,913 5,703 5,735 8.12 7.69 7.59Poland 1,869 1,820 2,170 4.83 4.70 5.61Portugal 340 299 247 3.41 2.99 2.47Qatar 2 3 1 0.37 0.53 0.17Romania 561 465 560 2.49 2.07 2.50Russian Federation 26,504 28,128 28,904 18.03 19.27 19.80Saudi Arabia 92 172 105 0.47 0.85 0.51Seychelles 7 3 6 8.88 3.75 7.39Singapore 37 40 37 0.94 1.01 0.92Slovakia 128 141 143 2.37 2.61 2.65Slovenia 14 25 36 0.71 1.26 1.81South Africa 24,875 23,823 21,995 60.08 56.59 51.39
Page 14 of 316Population Source: World Bank

POLICE2. Crimes recorded in criminal (police) statistics, by type of crime including attempts to commit crimes
02.02 5c CIHPOLTotal recorded intentional homicide, completed
1998 1999 2000 1998 1999 2000Count Rate per 100,000 inhabitants
CountrySpain 464 458 494 1.18 1.16 1.25Swaziland 899 902 926 90.77 88.48 88.61Switzerland 76 89 69 1.07 1.25 0.96Thailand 5,717 5,052 5,140 9.56 8.39 8.47Tunisia 81 101 113 0.87 1.07 1.18Ukraine 4,195 4,250 4,418 8.34 8.52 8.93United States of America 14,276 12,658 5.19 4.55Uruguay 122 136 154 3.71 4.11 4.61Venezuela 4,550 5,974 8,022 19.61 25.21 33.15Yemen 615 1,024 697 3.70 6.02 3.98Zambia 872 1,072 797 9.02 10.85 7.89Zimbabwe 778 873 912 6.38 7.04 7.24
Page 15 of 316Population Source: World Bank

POLICE2. Crimes recorded in criminal (police) statistics, by type of crime including attempts to commit crimes
02.03 5c AIHPOLTotal recorded intentional homicide, attempted
1998 1999 2000 1998 1999 2000Count Rate per 100,000 inhabitants
CountryArgentina 783 876 2.14 2.37Australia 387 359 391 2.06 1.89 2.04Azerbaijan 128 104 99 1.62 1.30 1.23Belarus 192 206 173 1.90 2.06 1.73Bulgaria 233 271 175 2.82 3.30 2.14Canada 745 686 766 2.47 2.25 2.49Costa Rica 112 903 3.07 24.20Czech Republic 135 89 101 1.31 0.86 0.98Denmark 157 167 157 2.96 3.14 2.94England & Wales 676 750 708 1.29 1.42 1.34Estonia 52 43 46 3.70 3.10 3.36Finland 306 284 5.94 5.50France 1,189 1,044 1,115 2.04 1.78 1.89Georgia 161 145 183 2.96 2.89 3.64Germany 1,921 1,846 1,810 2.34 2.25 2.20Greece 168 149 69 1.60 1.42 0.65Hong Kong, China (SAR) 2 9 7 0.03 0.13 0.10Hungary 157 166 152 1.55 1.64 1.52Iceland 2 0.72India 30,577 29,628 3.12 2.97Ireland 5 6 0.13 0.16Italy 1,653 1,639 1,399 2.87 2.85 2.42Jamaica 1,235 1,002 1,035 47.94 38.69 39.31Japan 672 591 754 0.53 0.47 0.59Lithuania 45 34 28 1.22 0.92 0.76Macedonia, FYR 56 50 77 2.78 2.48 3.79Malaysia 51 52 43 0.23 0.23 0.18Mauritius 13 12 17 1.12 1.02 1.43Moldova, Republic of 53 64 65 1.23 1.49 1.52Netherlands 1,508 1,197 1,486 9.61 7.58 9.35
Page 16 of 316Population Source: World Bank

POLICE2. Crimes recorded in criminal (police) statistics, by type of crime including attempts to commit crimes
02.03 5c AIHPOLTotal recorded intentional homicide, attempted
1998 1999 2000 1998 1999 2000Count Rate per 100,000 inhabitants
CountryNew Zealand 32 32 31 0.84 0.84 0.81Norway 48 66 68 1.08 1.48 1.51Pakistan 110 120 97 0.08 0.09 0.07Palestinian Territory, occupied 99 92Paraguay 111 202 303 2.13 3.77 5.51Poland 351 338 462 0.91 0.87 1.19Qatar 11 8 4 2.01 1.42 0.68Romania 463 377 486 2.06 1.68 2.17Russian Federation 3,047 3,012 2,925 2.07 2.06 2.00Singapore 4 0.10Slovakia 34 28 34 0.63 0.52 0.63Slovenia 48 45 44 2.42 2.27 2.21South Africa 29,418 28,662 28,120 71.06 68.08 65.70Spain 599 644 698 1.52 1.63 1.77Swaziland 328 304 275 33.12 29.82 26.32Switzerland 109 103 93 1.53 1.44 1.30Thailand 4,777 4,311 4,739 7.99 7.16 7.81Tunisia 155 136 161 1.66 1.44 1.68Ukraine 368 374 388 0.73 0.75 0.78Uruguay 33 61 74 1.00 1.84 2.22Yemen 832 858 797 5.01 5.05 4.55Zambia 124 144 91 1.28 1.46 0.90Zimbabwe 392 290 334 3.21 2.34 2.65
Page 17 of 316Population Source: World Bank

POLICE2. Crimes recorded in criminal (police) statistics, by type of crime including attempts to commit crimes
02.04 6a HFAPOLTotal recorded intentional homicides committed with a firearm
1998 1999 2000 1998 1999 2000Count Rate per 100,000 inhabitants
CountryAustralia 54 62 59 0.29 0.33 0.31Azerbaijan 12 14 18 0.15 0.18 0.22Barbados 7 9 8 2.64 3.38 3.00Belarus 411 329 331 4.07 3.29 3.31Bulgaria 54 68 63 0.65 0.83 0.77Canada 151 165 0.50 0.54Chile 27 0.18Colombia 18,910 19,678 21,898 46.35 47.42 51.77Costa Rica 118 126 3.23 3.38Czech Republic 217 189 213 2.11 1.83 2.07Denmark 14 11 14 0.26 0.21 0.26Dominica 1England & Wales 49 62 0.09 0.12Estonia 30 21 21 2.13 1.51 1.53Finland 22 0.43Germany 402 414 384 0.49 0.50 0.47Guatemala 2,392 1,839 2,109 22.15 16.57 18.50Hong Kong, China (SAR) 1 0.01Hungary 41 48 44 0.41 0.48 0.44India 9,294 0.93Ireland 3 12 0.08 0.32Latvia 47 37 30 1.92 1.54 1.26Lithuania 117 84 83 3.16 2.27 2.25Macedonia, FYR 28 18 26 1.39 0.89 1.28Mexico 3,286 4,390 3,589 3.45 4.54 3.66Moldova, Republic of 22 32 20 0.51 0.75 0.47New Zealand 4 5 7 0.11 0.13 0.18Paraguay 514 403 404 9.85 7.52 7.35Poland 121 114 166 0.31 0.29 0.43Portugal 128 98 84 1.28 0.98 0.84
Page 18 of 316Population Source: World Bank

POLICE2. Crimes recorded in criminal (police) statistics, by type of crime including attempts to commit crimes
02.04 6a HFAPOLTotal recorded intentional homicides committed with a firearm
1998 1999 2000 1998 1999 2000Count Rate per 100,000 inhabitants
CountryQatar 1 0.18Singapore 1 0.02Slovakia 114 116 117 2.11 2.15 2.17Slovenia 8 10 12 0.40 0.50 0.60South Africa 34,383 33,702 31,918 83.05 80.05 74.57Spain 92 83 97 0.23 0.21 0.25Switzerland 66 72 40 0.93 1.01 0.56Thailand 23,631 21,635 20,032 39.52 35.94 33.00Ukraine 223 202 173 0.44 0.40 0.35United States of America 9,257 8,259 3.37 2.97Uruguay 75 87 84 2.28 2.63 2.52Zimbabwe 562 596 598 4.61 4.81 4.75
Page 19 of 316Population Source: World Bank

POLICE2. Crimes recorded in criminal (police) statistics, by type of crime including attempts to commit crimes
02.05 5c NIHPOLTotal recorded non-intentional homicides
1998 1999 2000 1998 1999 2000Count Rate per 100,000 inhabitants
CountryArgentina 4,446 4,744 12.15 12.82Australia 323 268 296 1.72 1.41 1.54Belarus 64 108 83 0.63 1.08 0.83Bulgaria 99 94 112 1.20 1.15 1.37Canada 52 56 52 0.17 0.18 0.17Costa Rica 551 580 15.08 15.55Côte d'Ivoire 458 2.86Czech Republic 89 80 80 0.86 0.78 0.78Denmark 11 13 21 0.21 0.24 0.39Estonia 13 10 27 0.92 0.72 1.97Finland 32 32 28 0.62 0.62 0.54Georgia 61 48 40 1.12 0.96 0.80Greece 40 42 19 0.38 0.40 0.18Hong Kong, China (SAR) 1 5 5 0.02 0.07 0.07Hungary 38 37 21 0.38 0.37 0.21India 3,681 3,912 0.38 0.39Indonesia 530 398 420 0.26 0.19 0.20Ireland 13 9 0.35 0.24Italy 1,607 1,501 1,871 2.79 2.61 3.24Japan 451 453 511 0.36 0.36 0.40Korea, Republic of 3,262 3,439 3,737 7.03 7.33 7.90Latvia 26 22 23 1.06 0.91 0.97Lithuania 33 26 38 0.89 0.70 1.03Macedonia, FYR 4 1 4 0.20 0.05 0.20Mauritius 5 5 2 0.43 0.43 0.17Mexico 20,228 18,623 18,115 21.25 19.28 18.48Moldova, Republic of 27 29 21 0.63 0.68 0.49Montserrat 1New Zealand 11 11 10 0.29 0.29 0.26Norway 40 47 41 0.90 1.05 0.91
Page 20 of 316Population Source: World Bank

POLICE2. Crimes recorded in criminal (police) statistics, by type of crime including attempts to commit crimes
02.05 5c NIHPOLTotal recorded non-intentional homicides
1998 1999 2000 1998 1999 2000Count Rate per 100,000 inhabitants
CountryPalestinian Territory, occupied 13 13Paraguay 792 485 553 15.18 9.05 10.06Philippines 4,467 3,920 4,079 6.14 5.28 5.40Poland 187 214 190 0.48 0.55 0.49Portugal 113 111 99 1.13 1.11 0.99Qatar 4 9 6 0.73 1.59 1.03Romania 1,586 1,282 1,276 7.05 5.70 5.70Russian Federation 1,314 1,513 1,674 0.89 1.04 1.15Saudi Arabia 21 38 20 0.11 0.19 0.10Singapore 6 7 5 0.15 0.18 0.12Slovenia 3 0.15South Africa 13,140 12,166 10,961 31.74 28.90 25.61Spain 96 72 95 0.24 0.18 0.24Swaziland 383 347 276 38.67 34.04 26.41Thailand 277 286 230 0.46 0.48 0.38Tunisia 76 48 58 0.81 0.51 0.61Turkey 1,693 1,541 2,175 2.67 2.40 3.33Ukraine 357 370 335 0.71 0.74 0.68Uruguay 41 27 5 1.25 0.81 0.15Yemen 162 190 129 0.98 1.12 0.74Zambia 105 125 31 1.09 1.27 0.31Zimbabwe 888 541 969 7.28 4.36 7.69
Page 21 of 316Population Source: World Bank

POLICE2. Crimes recorded in criminal (police) statistics, by type of crime including attempts to commit crimes
02.06 5c MASPOLTotal recorded major assaults
1998 1999 2000 1998 1999 2000Count Rate per 100,000 inhabitants
CountryBarbados 267 249 275 100.64 93.58 103.00Belarus 3,567 3,615 3,864 35.32 36.15 38.64Bulgaria 190 154 76 2.30 1.88 0.93Canada 2,625 2,517 2,567 8.69 8.25 8.33Chile 3,398 3,509 3,923 22.96 23.39 25.81Colombia 161 151 86 0.39 0.36 0.20Côte d'Ivoire 11,417 71.36Czech Republic 791 801 848 7.68 7.78 8.23Denmark 955 1,106 1,262 18.02 20.79 23.65Dominica 150 56 69 94.52England & Wales 14,006 15,135 15,662 26.71 28.72 29.58Estonia 409 379 414 29.09 27.33 30.24Finland 1,805 1,805 1,972 35.03 34.95 38.09France 175 158 172 0.30 0.27 0.29Georgia 293 283 222 5.38 5.63 4.42Hong Kong, China (SAR) 7,710 8,012 7,450 116.02 119.21 109.61Hungary 8,423 8,035 7,881 83.40 79.55 78.81Iceland 44 59 58 16.06 21.26 20.64Indonesia 8,663 9,324 10,626 4.25 4.50 5.06Ireland 691 450 18.62 11.99Jamaica 1,747 1,641 5,649 67.82 63.36 214.55Latvia 427 429 424 17.44 17.80 17.88Lithuania 381 395 463 10.29 10.68 12.53Macedonia, FYR 214 209 206 10.62 10.36 10.14Malaysia 5,746 5,310 5,104 25.88 23.39 21.91Mauritius 116 109 199 10.00 9.28 16.78Mexico 162,851 166,173 181,312 171.06 172.02 185.01Moldova, Republic of 420 528 447 9.77 12.31 10.44Montserrat 3 5 8New Zealand 3,711 3,535 3,897 97.86 92.77 101.73
Page 22 of 316Population Source: World Bank

POLICE2. Crimes recorded in criminal (police) statistics, by type of crime including attempts to commit crimes
02.06 5c MASPOLTotal recorded major assaults
1998 1999 2000 1998 1999 2000Count Rate per 100,000 inhabitants
CountryNorway 2,671 3,004 3,517 60.27 67.35 78.31Pakistan 145 151 154 0.11 0.11 0.11Papua New Guinea 996 1,332 1,351 20.40 26.61 26.34Poland 14,141 13,627 15,214 36.54 35.21 39.31Portugal 954 896 805 9.57 8.97 8.05Qatar 45 37 36 8.24 6.55 6.16Romania 1,559 1,287 1,301 6.93 5.72 5.81Russian Federation 38,513 41,138 39,437 26.20 28.18 27.01Saudi Arabia 718 1,508 3.64 7.29Seychelles 585 720.18Singapore 111 86 99 2.83 2.18 2.46Slovenia 818 813 763 41.26 40.95 38.38South Africa 234,056 256,434 284,481 565.35 609.11 664.68Spain 11,913 11,054 10,164 30.24 28.06 25.73Swaziland 7,370 7,274 7,883 744.10 713.51 754.35Switzerland 185 199 205 2.60 2.79 2.86Tunisia 14,859 14,496 15,273 159.20 153.30 159.70United States of America 976,580 916,380 355.12 329.63Uruguay 3,245 3,622 3,480 98.66 109.33 104.29Venezuela 32,101 31,475 25,444 138.37 132.81 105.14Zimbabwe 23,329 25,790 25,060 191.22 207.98 198.89
Page 23 of 316Population Source: World Bank

POLICE2. Crimes recorded in criminal (police) statistics, by type of crime including attempts to commit crimes
02.07 5c TASPOLTotal recorded assaults
1998 1999 2000 1998 1999 2000Count Rate per 100,000 inhabitants
CountryArgentina 107,864 291.52Australia 130,903 134,271 141,124 696.29 706.69 735.02Azerbaijan 219 197 200 2.77 2.47 2.48Barbados 1,553 1,495 1,540 585.38 561.86 576.78Belarus 5,275 5,390 5,600 52.23 53.90 56.00Bulgaria 3,357 3,290 3,084 40.66 40.08 37.76Canada 223,926 221,348 233,517 741.48 725.73 758.17Chile 41,880 45,183 53,133 282.97 301.22 349.56China 80,862 92,772 120,778 6.52 7.42 9.59Colombia 25,516 26,790 25,219 62.54 64.55 59.62Costa Rica 1,098 716 30.06 19.19Czech Republic 23,464 23,228 21,998 227.81 225.51 213.57Denmark 8,460 8,973 9,796 159.59 168.70 183.58Dominica 153 59 70 95.89England & Wales 383,722 439,285 450,865 731.90 833.72 851.60Estonia 493 416 460 35.06 30.00 33.60Finland 25,660 26,223 27,820 497.96 507.71 537.38France 86,796 95,235 106,484 148.62 162.52 180.79Georgia 589 600 488 10.82 11.94 9.71Germany 110,277 114,516 116,912 134.48 139.48 142.23Greece 7,089 7,166 3,322 67.51 68.25 31.34Guatemala 4,728 4,704 5,401 43.78 42.38 47.38Hong Kong, China (SAR) 7,710 8,012 7,450 116.02 119.21 109.61Hungary 11,307 11,049 11,161 111.95 109.40 111.61Iceland 1,392 1,495 1,384 508.03 538.74 492.53India 235,870 236,313 24.07 23.68Indonesia 15,412 16,474 18,562 7.55 7.96 8.84Ireland 9,493 9,921 255.74 264.42Italy 26,732 29,942 29,068 46.41 51.98 50.38Jamaica 13,066 11,478 10,833 507.22 443.17 411.43
Page 24 of 316Population Source: World Bank

POLICE2. Crimes recorded in criminal (police) statistics, by type of crime including attempts to commit crimes
02.07 5c TASPOLTotal recorded assaults
1998 1999 2000 1998 1999 2000Count Rate per 100,000 inhabitants
CountryJapan 26,656 27,826 43,229 21.16 21.91 34.04Korea, Republic of 7,510 10,506 14,925 16.19 22.40 31.55Kyrgyzstan 208 208 208 4.34 4.28 4.23Latvia 904 787 825 36.91 32.66 34.78Mauritius 12,663 11,422 10,784 1,091.89 972.58 909.17Mexico 242,144 248,643 255,179 254.35 257.39 260.39Moldova, Republic of 1,169 1,445 1,216 27.19 33.68 28.40Montserrat 27 144 96Netherlands 38,015 42,301 44,129 242.13 267.73 277.54New Zealand 29,773 29,187 30,177 785.11 765.92 787.75Norway 13,081 13,119 14,727 295.15 294.15 327.92Pakistan 180 190 208 0.14 0.14 0.15Palestinian Territory, occupied 6,515 6,415Papua New Guinea 996 1,332 1,351 20.40 26.61 26.34Poland 32,530 30,605 32,792 84.06 79.08 84.73Portugal 39,879 36,976 37,979 400.07 370.17 379.79Qatar 263 292 327 48.17 51.67 55.91Romania 11,366 10,152 9,370 50.52 45.12 41.83Saudi Arabia 3,668 8,820 4,705 18.62 43.66 22.73Seychelles 697 729 700 883.96 910.91 861.75Singapore 543 497 534 13.84 12.58 13.29Slovakia 4,034 3,933 3,731 74.83 72.90 69.07Slovenia 1,972 2,035 2,208 99.47 102.49 111.07South Africa 433,369 478,361 535,461 1,046.79 1,136.25 1,251.08Spain 86,061 88,532 90,453 218.43 224.70 228.99Swaziland 13,147 13,258 14,179 1,327.36 1,300.48 1,356.84Thailand 17,852 18,526 20,125 29.85 30.77 33.15Tunisia 39,113 38,718 40,558 419.07 409.46 424.09Turkey 52,497 52,417 53,485 82.80 81.52 81.91Ukraine 4,897 4,816 5,264 9.74 9.65 10.63
Page 25 of 316Population Source: World Bank

POLICE2. Crimes recorded in criminal (police) statistics, by type of crime including attempts to commit crimes
02.07 5c TASPOLTotal recorded assaults
1998 1999 2000 1998 1999 2000Count Rate per 100,000 inhabitants
CountryUnited States of America 2,315,380 2,238,480 841.96 805.21Uruguay 4,041 4,532 4,584 122.86 136.79 137.37Yemen 3,077 3,457 1,015 18.54 20.34 5.80Zambia 22,566 23,109 22,127 233.46 233.87 219.08Zimbabwe 75,693 87,584 93,062 620.43 706.32 738.59
Page 26 of 316Population Source: World Bank

POLICE2. Crimes recorded in criminal (police) statistics, by type of crime including attempts to commit crimes
02.08 5c RAPPOLTotal recorded rapes
1998 1999 2000 1998 1999 2000Count Rate per 100,000 inhabitants
CountryArgentina 2,888 3,023 7.89 8.17Armenia 22 23 28 0.58 0.61 0.74Australia 14,336 14,104 15,630 76.26 74.23 81.41Azerbaijan 37 45 30 0.47 0.56 0.37Barbados 94 68 68 35.43 25.56 25.47Belarus 596 552 530 5.90 5.52 5.30Bulgaria 771 740 593 9.34 9.02 7.26Canada 25,553 23,859 24,049 84.61 78.23 78.08Chile 1,052 1,297 1,250 7.11 8.65 8.22China 40,967 39,435 35,819 3.30 3.15 2.84Colombia 1,918 1,889 1,861 4.70 4.55 4.40Costa Rica 461 475 12.62 12.73Côte d'Ivoire 329 2.06Czech Republic 675 634 500 6.55 6.16 4.85Denmark 418 477 497 7.89 8.97 9.31Dominica 39 15 24 32.88England & Wales 7,636 8,409 8,593 14.56 15.96 16.23Estonia 53 59 73 3.77 4.25 5.33Finland 463 514 579 8.99 9.95 11.18France 7,828 7,958 8,458 13.40 13.58 14.36Georgia 39 35 47 0.72 0.70 0.94Germany 7,914 7,565 7,499 9.65 9.21 9.12Greece 213 239 114 2.03 2.28 1.08Guatemala 220 323 366 2.04 2.91 3.21Hong Kong, China (SAR) 90 91 104 1.35 1.35 1.53Hungary 666 675 589 6.59 6.68 5.89Iceland 65 79 73 23.72 28.47 25.98India 15,151 15,468 1.55 1.55Indonesia 1,159 1,330 1,372 0.57 0.64 0.65Ireland 292 218 7.87 5.81
Page 27 of 316Population Source: World Bank

POLICE2. Crimes recorded in criminal (police) statistics, by type of crime including attempts to commit crimes
02.08 5c RAPPOLTotal recorded rapes
1998 1999 2000 1998 1999 2000Count Rate per 100,000 inhabitants
CountryItaly 1,846 1,904 2,336 3.20 3.31 4.05Jamaica 1,420 1,261 1,304 55.12 48.69 49.53Japan 1,873 1,857 2,260 1.49 1.46 1.78Korea, Republic of 5,745 6,164 6,139 12.38 13.14 12.98Kyrgyzstan 268 285 321 5.59 5.86 6.53Latvia 83 101 104 3.39 4.19 4.38Lithuania 166 225 183 4.48 6.08 4.95Macedonia, FYR 24 40 27 1.19 1.98 1.33Malaysia 1,539 1,457 1,210 6.93 6.42 5.19Mauritius 42 29 27 3.62 2.47 2.28Mexico 11,315 11,492 13,061 11.89 11.90 13.33Moldova, Republic of 201 211 200 4.68 4.92 4.67Montserrat 7 4 7Netherlands 1,633 1,775 1,648 10.40 11.23 10.36New Zealand 874 729 861 23.05 19.13 22.48Norway 456 467 555 10.29 10.47 12.36Pakistan 61 56 54 0.05 0.04 0.04Palestinian Territory, occupied 74 38Papua New Guinea 1,513 1,598 1,295 30.99 31.92 25.24Paraguay 2,998 2,912 3,152 57.44 54.34 57.35Philippines 3,031 3,110 3,071 4.16 4.19 4.06Poland 2,174 2,029 2,399 5.62 5.24 6.20Portugal 405 383 385 4.06 3.83 3.85Qatar 12 9 12 2.20 1.59 2.05Romania 1,183 1,172 1,110 5.26 5.21 4.96Russian Federation 7,724 7,314 6,978 5.25 5.01 4.78Saudi Arabia 248 110 87 1.26 0.54 0.42Seychelles 55 98 64 69.75 122.45 78.79Singapore 104 124 122 2.65 3.14 3.04Slovakia 153 171 129 2.84 3.17 2.39
Page 28 of 316Population Source: World Bank

POLICE2. Crimes recorded in criminal (police) statistics, by type of crime including attempts to commit crimes
02.08 5c RAPPOLTotal recorded rapes
1998 1999 2000 1998 1999 2000Count Rate per 100,000 inhabitants
CountrySlovenia 89 75 86 4.49 3.78 4.33South Africa 49,280 51,249 53,008 119.03 121.73 123.85Spain 6,004 5,856 5,664 15.24 14.86 14.34Sri Lanka 1,076 1,309 1,202 5.72 6.89 6.20Swaziland 1,116 1,246 1,267 112.67 122.22 121.24Switzerland 385 447 404 5.41 6.26 5.63Thailand 3,516 3,932 4,020 5.88 6.53 6.62Tunisia 441 421 334 4.73 4.45 3.49Turkey 743 642 1,260 1.17 1.00 1.93Ukraine 1,334 1,288 1,151 2.65 2.58 2.33United States of America 93,140 89,110 33.87 32.05Uruguay 202 181 175 6.14 5.46 5.24Venezuela 3,314 3,135 2,931 14.28 13.23 12.11Yemen 38 45 80 0.23 0.26 0.46Zambia 263 313 300 2.72 3.17 2.97Zimbabwe 5,564 5,857 5,567 45.61 47.23 44.18
Page 29 of 316Population Source: World Bank

POLICE2. Crimes recorded in criminal (police) statistics, by type of crime including attempts to commit crimes
02.09 5c ROBPOLTotal recorded robberies
1998 1999 2000 1998 1999 2000Count Rate per 100,000 inhabitants
CountryArgentina 340,578 359,232 930.54 970.90Armenia 126 126 162 3.32 3.31 4.26Australia 23,801 22,606 23,314 126.60 118.98 121.43Azerbaijan 144 138 145 1.82 1.73 1.80Barbados 295 414 428 111.19 155.59 160.30Belarus 5,056 5,349 5,668 50.06 53.49 56.68Bulgaria 4,494 4,044 4,266 54.43 49.27 52.23Canada 28,963 28,740 27,012 95.90 94.23 87.70Chile 87,792 108,494 110,672 593.19 723.29 728.11China 175,116 198,607 309,818 14.12 15.89 24.59Colombia 27,424 26,870 24,537 67.22 64.75 58.01Costa Rica 16,547 19,241 452.96 515.70Czech Republic 4,306 4,817 4,099 41.81 46.77 39.80Denmark 2,606 2,781 3,152 49.16 52.28 59.07Dominica 50 61 57 78.08England & Wales 66,835 84,277 95,154 127.48 159.95 179.73Estonia 3,978 4,918 4,754 282.92 354.66 347.26Finland 2,092 2,277 2,600 40.60 44.09 50.22France 20,869 21,062 24,304 35.73 35.94 41.26Georgia 306 286 336 5.62 5.69 6.69Germany 64,405 61,420 59,414 78.54 74.81 72.28Greece 2,254 2,048 833 21.47 19.50 7.86Guatemala 7,213 8,272 11,547 66.79 74.52 101.29Hong Kong, China (SAR) 3,224 3,640 3,433 48.51 54.16 50.51Hungary 3,056 3,167 3,494 30.26 31.36 34.94Iceland 19 40 34 6.93 14.41 12.10India 31,694 28,411 3.23 2.85Indonesia 65,077 68,550 61,260 31.90 33.12 29.17Ireland 3,817 2,414 102.83 64.34Italy 37,782 39,401 37,726 65.59 68.40 65.38
Page 30 of 316Population Source: World Bank

POLICE2. Crimes recorded in criminal (police) statistics, by type of crime including attempts to commit crimes
02.09 5c ROBPOLTotal recorded robberies
1998 1999 2000 1998 1999 2000Count Rate per 100,000 inhabitants
CountryJamaica 2,985 2,392 2,331 115.88 92.36 88.53Japan 3,426 4,237 5,173 2.72 3.34 4.07Korea, Republic of 5,316 4,885 4,524 11.46 10.42 9.56Kyrgyzstan 1,222 1,505 1,497 25.47 30.94 30.46Latvia 609 2,619 3,160 24.87 108.67 133.22Lithuania 3,646 3,376 4,374 98.46 91.27 118.38Macedonia, FYR 217 222 296 10.77 11.01 14.57Malaysia 11,708 13,750 14,696 52.74 60.57 63.07Mauritius 980 1,145 1,166 84.50 97.50 98.30Mexico 301,512 265,250 215,120 316.71 274.59 219.51Moldova, Republic of 2,451 2,728 2,539 57.01 63.59 59.29Netherlands 14,447 17,462 18,630 92.02 110.52 117.17New Zealand 2,000 1,584 1,775 52.74 41.57 46.33Norway 1,354 1,698 1,781 30.55 38.07 39.66Pakistan 105 115 81 0.08 0.09 0.06Papua New Guinea 2,215 3,359 3,394 45.36 67.10 66.16Paraguay 262 273 273 5.02 5.09 4.97Philippines 5,519 5,740 5,884 7.58 7.74 7.78Poland 34,225 44,775 53,533 88.44 115.70 138.33Portugal 12,442 16,065 17,156 124.82 160.83 171.56Qatar 8 7 4 1.47 1.24 0.68Romania 3,749 3,882 4,143 16.66 17.25 18.50Russian Federation 122,366 138,973 132,393 83.24 95.19 90.68Saudi Arabia 133 960 598 0.68 4.75 2.89Seychelles 78 56 53 98.92 69.97 65.25Singapore 895 663 463 22.81 16.78 11.52Slovakia 1,231 1,437 1,264 22.84 26.64 23.40Slovenia 379 463 474 19.12 23.32 23.84South Africa 150,430 168,976 197,038 363.36 401.37 460.37Spain 527,994 524,899 497,262 1,340.09 1,332.23 1,258.89
Page 31 of 316Population Source: World Bank

POLICE2. Crimes recorded in criminal (police) statistics, by type of crime including attempts to commit crimes
02.09 5c ROBPOLTotal recorded robberies
1998 1999 2000 1998 1999 2000Count Rate per 100,000 inhabitants
CountrySri Lanka 4,778 4,952 4,647 25.41 26.06 23.95Swaziland 2,508 2,460 2,708 253.22 241.30 259.14Switzerland 2,572 2,642 2,178 36.17 37.00 30.33Thailand 1,060 859 780 1.77 1.43 1.29Tunisia 967 826 958 10.36 8.74 10.02Turkey 1,483 1,387 1,633 2.34 2.16 2.50Ukraine 22,492 21,281 21,429 44.72 42.65 43.29United States of America 447,190 409,670 162.61 147.36Uruguay 4,358 50,348 5,367 132.50 1,519.71 160.83Venezuela 30,956 34,226 34,975 133.43 144.41 144.52Yemen 161 175 0.97 1.03Zambia 3,392 4,024 2,699 35.09 40.72 26.72Zimbabwe 8,723 9,003 11,855 71.50 72.60 94.09
Page 32 of 316Population Source: World Bank

POLICE2. Crimes recorded in criminal (police) statistics, by type of crime including attempts to commit crimes
02.10 5c MTFPOLTotal recorded major thefts
1998 1999 2000 1998 1999 2000Count Rate per 100,000 inhabitants
CountryBarbados 515 570 399 194.12 214.22 149.44Belarus 37,427 41,767 43,328 370.56 417.67 433.28Canada 23,600 22,493 21,381 78.15 73.75 69.42China 603,180 659,725 48.64 52.78Colombia 4,933 5,044 4,345 12.09 12.15 10.27Costa Rica 9,883 9,392 270.54 251.72Côte d'Ivoire 4,456 27.85Czech Republic 12,371 12,072 13,426 120.11 117.20 130.35Dominica 2,602 2,189 2,269 3,108.22Finland 312 559 1,549 6.05 10.82 29.92France 1,454,869 1,455,311 1,519,702 2,491.21 2,483.47 2,580.14Georgia 50 101 0.92 2.01Greece 514 483 157 4.90 4.60 1.48Hong Kong, China (SAR) 14,254 15,628 16,601 214.49 232.54 244.24Hungary 4,880 4,748 12,041 48.32 47.01 120.41Ireland 896 774 24.14 20.63Jamaica 3,529 2,745 2,605 137.00 105.98 98.94Latvia 3,367 2,208 1,637 137.48 91.62 69.01Lithuania 13,593 13,072 9,634 367.08 353.39 260.73Macedonia, FYR 11,116 11,052 8,820 551.66 547.94 434.27Mauritius 384 611 487 33.11 52.03 41.06Moldova, Republic of 426 740 826 9.91 17.25 19.29Montserrat 8 4 6Norway 81,149 71,487 69,941 1,830.98 1,602.85 1,557.36Pakistan 137 163 53 0.10 0.12 0.04Papua New Guinea 743 926 1,038 15.22 18.50 20.23Paraguay 3,269 3,831 2,822 62.64 71.49 51.35Philippines 6,859 7,584 7,457 9.42 10.22 9.86Poland 1,173 558 212 3.03 1.44 0.55Singapore 8,846 7,494 7,181 225.49 189.63 178.72
Page 33 of 316Population Source: World Bank

POLICE2. Crimes recorded in criminal (police) statistics, by type of crime including attempts to commit crimes
02.10 5c MTFPOLTotal recorded major thefts
1998 1999 2000 1998 1999 2000Count Rate per 100,000 inhabitants
CountrySlovenia 943 1,023 997 47.56 51.52 50.15Spain 88,463 91,415 98,322 224.53 232.02 248.92Swaziland 10,607 10,647 11,430 1,070.92 1,044.37 1,093.78Tunisia 8,162 6,858 6,668 87.45 72.53 69.72Ukraine 62,200 59,156 59,451 123.66 118.55 120.10Uruguay 27,338 25,286 27,361 831.19 763.24 819.93Venezuela 67,824 63,727 51,203 292.34 268.89 211.58Yemen 102 0.61Zambia 25,251 25,272 21,970 261.24 255.76 217.52Zimbabwe 132,498 154,248 159,390 1,086.05 1,243.94 1,265.00
Page 34 of 316Population Source: World Bank

POLICE2. Crimes recorded in criminal (police) statistics, by type of crime including attempts to commit crimes
02.11 5c TFTPOLTotal recorded thefts
1998 1999 2000 1998 1999 2000Count Rate per 100,000 inhabitants
CountryArgentina 298,154 394,495 814.63 1,066.20Armenia 2,921 3,056 3,663 76.97 80.40 96.32Australia 563,482 612,559 674,813 2,997.24 3,223.99 3,514.65Azerbaijan 2,667 2,560 2,534 33.70 32.07 31.48Barbados 2,519 2,505 2,323 949.49 941.45 870.04Belarus 54,005 59,916 60,833 534.70 599.16 608.33Bulgaria 54,362 46,985 47,613 658.37 572.43 583.00Canada 737,232 700,860 683,997 2,441.17 2,297.90 2,220.77Chile 27,559 33,889 40,391 186.21 225.93 265.73China 1,296,988 1,447,390 2,373,696 104.60 115.79 188.39Colombia 8,484 8,354 6,657 20.79 20.13 15.74Côte d'Ivoire 13,258 82.86Czech Republic 162,037 157,249 155,125 1,573.17 1,526.69 1,506.07Denmark 180,554 183,143 193,896 3,406.04 3,443.18 3,633.73Dominica 2,615 2,197 2,279 3,121.92England & Wales 1,723,875 1,769,115 1,724,637 3,288.09 3,357.60 3,257.52Estonia 8,616 10,308 14,222 612.79 743.36 1,038.86Finland 103,981 107,166 114,293 2,017.87 2,074.85 2,207.71France 2,291,404 2,252,528 2,334,696 3,923.64 3,843.90 3,963.83Georgia 4,262 4,307 4,517 78.32 85.73 89.91Germany 3,388,394 3,194,838 3,042,683 4,132.19 3,891.40 3,701.56Greece 68,391 56,933 24,999 651.34 542.22 235.84Hong Kong, China (SAR) 26,529 29,046 30,570 399.20 432.19 449.76Hungary 184,000 161,407 149,060 1,821.78 1,598.09 1,490.60Iceland 5,482 6,818 7,483 2,000.73 2,456.94 2,662.99India 287,967 271,907 29.38 27.25Ireland 41,918 31,012 1,129.26 826.55Italy 1,478,221 1,480,775 1,367,216 2,566.36 2,570.79 2,369.53Jamaica 8,107 6,571 4,937 314.71 253.71 187.50Japan 1,506,801 1,624,324 1,821,526 1,195.87 1,279.00 1,434.27
Page 35 of 316Population Source: World Bank

POLICE2. Crimes recorded in criminal (police) statistics, by type of crime including attempts to commit crimes
02.11 5c TFTPOLTotal recorded thefts
1998 1999 2000 1998 1999 2000Count Rate per 100,000 inhabitants
CountryKorea, Republic of 57,393 60,315 68,564 123.69 128.60 144.96Kyrgyzstan 13,097 19,233 18,280 273.02 395.37 371.92Latvia 21,524 24,773 28,737 878.89 1,027.93 1,211.51Lithuania 48,303 47,924 53,291 1,304.43 1,295.59 1,442.25Macedonia, FYR 14,895 14,613 13,455 739.21 724.49 662.48Malaysia 58,610 58,953 54,881 264.01 259.70 235.54Mauritius 9,998 10,994 9,532 862.10 936.14 803.62Mexico 141,225 104,413 98,179 148.35 108.09 100.18Moldova, Republic of 19,877 17,568 17,820 462.36 409.51 416.16Montserrat 22 30 41Netherlands 687,855 713,932 728,261 4,381.24 4,518.56 4,580.26New Zealand 134,889 128,612 126,924 3,557.01 3,375.02 3,313.25Norway 193,630 188,087 192,275 4,368.91 4,217.20 4,281.34Pakistan 461 398 307 0.35 0.29 0.22Palestinian Territory, occupied 2,157 2,011Papua New Guinea 743 926 1,038 15.22 18.50 20.23Poland 150,500 171,994 241,784 388.89 444.43 624.76Portugal 76,103 84,981 90,377 763.47 850.75 903.77Qatar 577 710 761 105.68 125.64 130.11Romania 132,985 120,903 135,172 591.04 537.35 603.45Russian Federation 1,143,364 1,413,810 1,310,079 777.80 968.36 897.31Saudi Arabia 12,527 24,509 12,994 63.59 121.33 62.77Seychelles 859 806 1,089.41 1,007.12Singapore 24,781 19,154 16,861 631.68 484.67 419.64Slovakia 33,798 30,511 26,365 626.97 565.53 488.08Slovenia 15,280 18,274 21,336 770.71 920.37 1,073.24South Africa 427,132 479,637 550,925 1,031.72 1,139.28 1,287.21Spain 551,710 557,397 539,537 1,400.28 1,414.71 1,365.92Sri Lanka 17,270 16,603 14,785 91.86 87.38 76.21Swaziland 12,084 12,115 13,082 1,220.04 1,188.36 1,251.87
Page 36 of 316Population Source: World Bank

POLICE2. Crimes recorded in criminal (police) statistics, by type of crime including attempts to commit crimes
02.11 5c TFTPOLTotal recorded thefts
1998 1999 2000 1998 1999 2000Count Rate per 100,000 inhabitants
CountryThailand 58,184 56,062 57,743 97.30 93.13 95.13Tunisia 28,994 24,619 23,815 310.65 260.36 249.02Turkey 104,282 89,351 84,159 164.48 138.96 128.88Ukraine 184,760 175,437 177,000 367.32 351.58 357.58United States of America 7,376,300 6,957,400 2,682.29 2,502.66Uruguay 41,030 38,193 41,474 1,247.49 1,152.82 1,242.85Yemen 4,363 5,057 7,271 26.28 29.75 41.55Zambia 25,251 25,272 21,970 261.24 255.76 217.52Zimbabwe 132,498 154,248 159,390 1,086.05 1,243.94 1,265.00
Page 37 of 316Population Source: World Bank

POLICE2. Crimes recorded in criminal (police) statistics, by type of crime including attempts to commit crimes
02.12 6a ATMPOLTotal recorded automobile theft
1998 1999 2000 1998 1999 2000Count Rate per 100,000 inhabitants
CountryAustralia 131,587 129,552 139,094 699.93 681.85 724.45Azerbaijan 86 110 107 1.09 1.38 1.33Barbados 191 282 223 71.99 105.98 83.52Belarus 1,996 1,787 1,710 19.76 17.87 17.10Bulgaria 8,007 7,744 11,281 96.97 94.35 138.13Canada 165,920 161,388 160,268 549.40 529.14 520.35Chile 4,557 29.98China 450,377 35.74Colombia 30,854 32,989 33,135 75.62 79.49 78.33Costa Rica 2,219 2,399 60.74 64.30Côte d'Ivoire 2,961 18.51Czech Republic 27,889 27,092 23,839 270.77 263.03 231.45Denmark 37,566 33,905 32,203 708.66 637.43 603.50Dominica 42 72 98.63England & Wales 391,807 374,686 338,796 747.33 711.12 639.92Estonia 2,106 2,455 2,322 149.78 177.04 169.61Finland 26,404 29,611 16,391 512.40 573.30 316.61France 317,474 297,058 301,539 543.62 506.92 511.95Georgia 401 325 244 7.37 6.47 4.86Germany 112,717 93,745 83,063 137.46 114.18 101.05Greece 16,816 17,091 8,486 160.15 162.77 80.06Guatemala 5,894 6,262 7,072 54.57 56.41 62.04Hong Kong, China (SAR) 2,409 2,575 2,804 36.25 38.31 41.25Hungary 15,258 11,556 10,024 151.07 114.42 100.24Iceland 322 430 387 117.52 154.95 137.72India 59,685 5.98Indonesia 25,249 33,259 29,061 12.38 16.07 13.84Ireland 13,793 14,851 371.58 395.82Italy 309,113 294,726 243,890 536.65 511.68 422.69Jamaica 183 433 258 7.10 16.72 9.80
Page 38 of 316Population Source: World Bank

POLICE2. Crimes recorded in criminal (police) statistics, by type of crime including attempts to commit crimes
02.12 6a ATMPOLTotal recorded automobile theft
1998 1999 2000 1998 1999 2000Count Rate per 100,000 inhabitants
CountryJapan 282,248 286,069 309,638 224.01 225.25 243.81Kyrgyzstan 189 143 163 3.94 2.94 3.32Lithuania 4,163 3,675 5,185 112.42 99.35 140.32Macedonia, FYR 232 350 303 11.51 17.35 14.92Malaysia 43,950 51,586 55,879 197.97 227.25 239.82Mexico 153,497 156,006 158,801 161.24 161.50 162.04Moldova, Republic of 1,088 815 777 25.31 19.00 18.15Netherlands 37,407 37,831 38,320 238.26 239.44 241.01New Zealand 30,803 25,680 21,992 812.27 673.89 574.08Norway 21,672 20,863 23,339 488.99 467.78 519.68Pakistan 106 87 75 0.08 0.06 0.05Palestinian Territory, occupied 156 44Papua New Guinea 1,739 1,467 763 35.61 29.31 14.87Paraguay 1,897 1,245 1,403 36.35 23.23 25.53Poland 61,151 71,543 68,062 158.01 184.87 175.87Portugal 26,965 28,163 26,428 270.52 281.94 264.28Qatar 33 60 25 6.04 10.62 4.27Romania 3,828 4,219 4,546 17.01 18.75 20.29Russian Federation 30,208 27,442 26,106 20.55 18.80 17.88Saudi Arabia 7,677 11,021 5,573 38.97 54.56 26.92Singapore 2,736 2,149 1,651 69.74 54.38 41.09Slovakia 7,682 7,123 6,073 142.51 132.03 112.43Slovenia 1,064 1,019 1,412 53.67 51.32 71.03South Africa 188,438 103,502 99,963 455.16 245.85 233.56Spain 138,082 138,961 134,584 350.46 352.69 340.72Switzerland 10,981 9,890 9,349 154.44 138.52 130.21Thailand 3,833 2,870 3,276 6.41 4.77 5.40Tunisia 882 894 1,176 9.45 9.45 12.30Turkey 19,109 17,912 14,954 30.14 27.86 22.90Ukraine 4,216 3,201 3,164 8.38 6.41 6.39
Page 39 of 316Population Source: World Bank

POLICE2. Crimes recorded in criminal (police) statistics, by type of crime including attempts to commit crimes
02.12 6a ATMPOLTotal recorded automobile theft
1998 1999 2000 1998 1999 2000Count Rate per 100,000 inhabitants
CountryUnited States of America 1,242,800 1,147,300 451.93 412.70Uruguay 2,957 3,862 4,088 89.91 116.57 122.51Yemen 1,053 1,066 821 6.34 6.27 4.69Zambia 655 986 792 6.78 9.98 7.84Zimbabwe 1,646 1,645 1,342 13.49 13.27 10.65
Page 40 of 316Population Source: World Bank

POLICE2. Crimes recorded in criminal (police) statistics, by type of crime including attempts to commit crimes
02.13 5c BURPOLTotal recorded burglaries
1998 1999 2000 1998 1999 2000Count Rate per 100,000 inhabitants
CountryArmenia 125 104 92 3.29 2.74 2.42Australia 434,376 415,735 436,865 2,310.51 2,188.08 2,275.34Barbados 2,581 2,890 2,963 972.86 1,086.14 1,109.74Belarus 31,750 31,244 32,313 314.36 312.44 323.13Bulgaria 43,830 33,004 39,455 530.82 402.10 483.11Canada 350,774 318,054 293,416 1,161.50 1,042.80 952.65Chile 31,934 35,276 23,065 215.77 235.17 151.74China 1,149,728 91.25Colombia 23,754 19,713 13,375 58.22 47.50 31.62Czech Republic 92,029 85,631 74,231 893.49 831.37 720.69Denmark 101,937 100,896 99,568 1,922.98 1,896.90 1,865.97Dominica 1,533 1,320 1,297 1,776.71England & Wales 953,184 906,968 836,027 1,818.09 1,721.33 1,579.10Estonia 21,189 23,816 23,271 1,507.01 1,717.50 1,699.85Finland 90,655 89,967 87,588 1,759.27 1,741.86 1,691.87France 395,913 370,076 370,993 677.93 631.53 629.87Georgia 1,096 1,728 1,885 20.14 34.39 37.52Greece 43,228 36,947 15,899 411.70 351.88 149.99Hong Kong, China (SAR) 9,770 9,133 8,969 147.01 135.89 131.96Hungary 94,501 81,184 71,635 935.65 803.80 716.35Iceland 2,111 2,556 2,407 770.44 921.08 856.58India 119,260 111,296 12.17 11.15Ireland 25,730 23,042 693.16 614.13Jamaica 3,464 2,551 2,426 134.47 98.49 92.14Japan 237,703 260,981 296,486 188.65 205.50 233.45Korea, Republic of 3,026 3,058 3,027 6.52 6.52 6.40Latvia 7,388 9,452 9,871 301.67 392.20 416.15Lithuania 9,246 9,180 9,203 249.69 248.18 249.07Malaysia 34,471 35,936 32,913 155.27 158.31 141.26Mauritius 1,235 1,628 1,584 106.49 138.62 133.54
Page 41 of 316Population Source: World Bank

POLICE2. Crimes recorded in criminal (police) statistics, by type of crime including attempts to commit crimes
02.13 5c BURPOLTotal recorded burglaries
1998 1999 2000 1998 1999 2000Count Rate per 100,000 inhabitants
CountryMexico 138,804 148,336 139,679 145.80 153.56 142.53Moldova, Republic of 4,266 4,203 3,984 99.23 97.97 93.04Montserrat 88 51 77Netherlands 90,357 91,996 91,146 575.52 582.25 573.25New Zealand 77,964 73,695 65,675 2,055.90 1,933.90 1,714.39Norway 4,967 4,777 5,297 112.07 107.11 117.95Pakistan 226 252 212 0.17 0.19 0.15Palestinian Territory, occupied 502 525Papua New Guinea 2,100 2,663 2,618 43.01 53.20 51.03Poland 355,176 369,235 364,786 917.77 954.10 942.60Portugal 48,199 48,912 47,328 483.54 489.66 473.28Qatar 268 241 300 49.08 42.65 51.29Romania 29,465 19,046 21,322 130.96 84.65 95.19Saudi Arabia 8 17 11 0.04 0.08 0.05Seychelles 906 785 227 1,149.02 980.88 279.45Singapore 1,687 1,562 993 43.00 39.52 24.71Slovakia 28,037 28,610 25,517 520.10 530.29 472.38Slovenia 13,464 16,187 15,962 679.11 815.26 802.92South Africa 360,919 378,304 394,557 871.79 898.58 921.86Spain 28,171 26,901 23,856 71.50 68.28 60.39Sri Lanka 12,506 12,870 12,666 66.52 67.74 65.29Swaziland 8,431 8,336 8,465 851.22 817.68 810.05Switzerland 83,416 76,322 60,384 1,173.22 1,068.94 841.00Thailand 13,784 14,074 13,222 23.05 23.38 21.78Tunisia 10,122 8,293 7,680 108.45 87.70 80.31United States of America 2,332,700 2,099,700 848.25 755.29Uruguay 5,902 5,605 5,587 179.45 169.18 167.43Yemen 2 110 0.01 0.65Zambia 11,347 11,473 9,866 117.39 116.11 97.68Zimbabwe 48,817 54,771 55,280 400.14 441.70 438.73
Page 42 of 316Population Source: World Bank

POLICE2. Crimes recorded in criminal (police) statistics, by type of crime including attempts to commit crimes
02.14 5c FRDPOLTotal recorded frauds
1998 1999 2000 1998 1999 2000Count Rate per 100,000 inhabitants
CountryArmenia 590 700 776 15.55 18.42 20.40Azerbaijan 797 1,245 1,232 10.07 15.60 15.31Barbados 246 260 228 92.73 97.71 85.39Belarus 3,614 4,661 7,251 35.78 46.61 72.51Bulgaria 6,574 7,742 6,902 79.62 94.32 84.51Canada 94,819 90,371 85,669 313.97 296.30 278.15Chile 4,020 4,683 4,516 27.16 31.22 29.71China 83,080 93,192 152,614 6.70 7.46 12.11Colombia 1,950 1,756 1,229 4.78 4.23 2.91Costa Rica 1,292 1,572 35.37 42.13Côte d'Ivoire 3,015 18.84Czech Republic 27,758 33,800 26,752 269.50 328.16 259.73Denmark 8,935 7,949 8,040 168.55 149.45 150.67Dominica 16 7 32 43.84England & Wales 279,503 334,773 319,324 533.12 635.36 603.14Estonia 1,919 1,330 1,802 136.48 95.91 131.63Finland 13,990 13,175 14,963 271.49 255.08 289.03France 82,252 95,444 142,583 140.84 162.87 242.08Georgia 217 315 221 3.99 6.27 4.40Germany 815,749 833,349 895,758 994.82 1,015.04 1,089.73Greece 569 672 391 5.42 6.40 3.69Hong Kong, China (SAR) 3,484 4,344 5,090 52.43 64.64 74.89Hungary 119,646 52,269 27,388 1,184.61 517.51 273.88Iceland 367 472 405 133.94 170.09 144.13India 38,271 41,403 3.91 4.15Ireland 3,096 1,529 83.41 40.75Italy 56,952 63,796 33,564 98.88 110.76 58.17Jamaica 2,434 2,239 1,149 94.49 86.45 43.64Japan 48,279 43,431 44,384 38.32 34.20 34.95Korea, Republic of 174,419 176,160 136,206 375.90 375.61 287.96
Page 43 of 316Population Source: World Bank
POLICE2. Crimes recorded in criminal (police) statistics, by type of crime including attempts to commit crimes
02.14 5c FRDPOLTotal recorded frauds
1998 1999 2000 1998 1999 2000Count Rate per 100,000 inhabitants
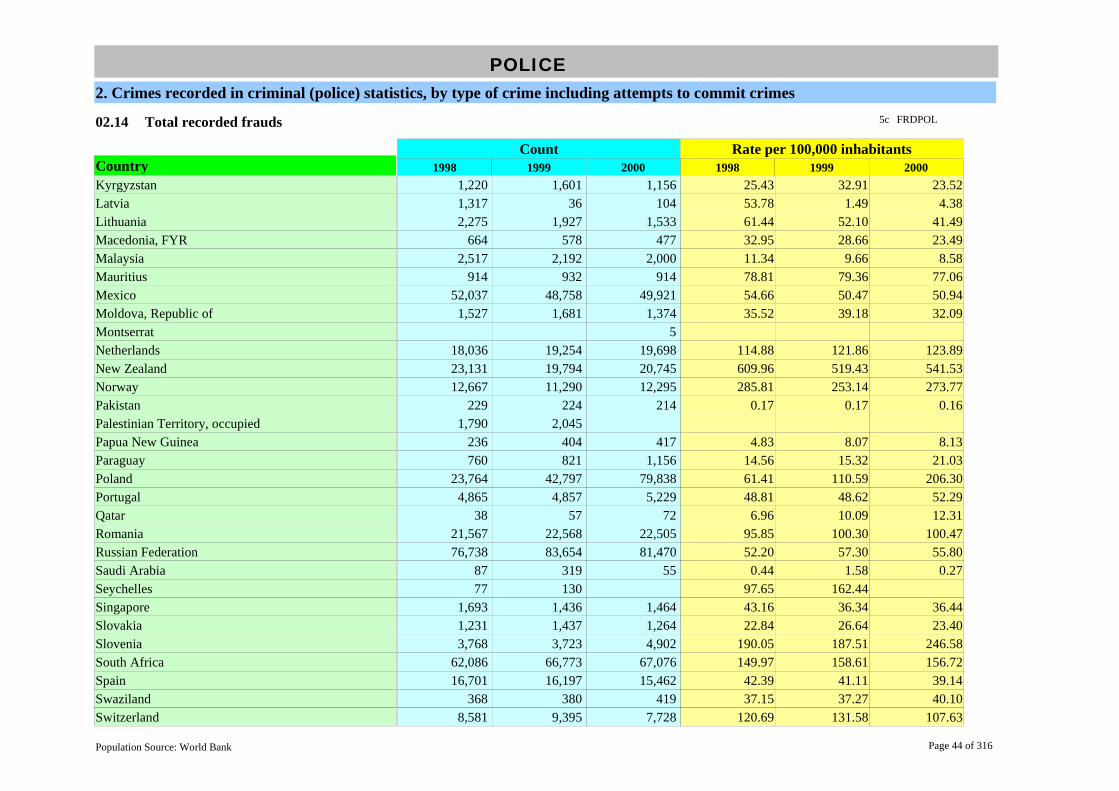
CountryKyrgyzstan 1,220 1,601 1,156 25.43 32.91 23.52Latvia 1,317 36 104 53.78 1.49 4.38Lithuania 2,275 1,927 1,533 61.44 52.10 41.49Macedonia, FYR 664 578 477 32.95 28.66 23.49Malaysia 2,517 2,192 2,000 11.34 9.66 8.58Mauritius 914 932 914 78.81 79.36 77.06Mexico 52,037 48,758 49,921 54.66 50.47 50.94Moldova, Republic of 1,527 1,681 1,374 35.52 39.18 32.09Montserrat 5Netherlands 18,036 19,254 19,698 114.88 121.86 123.89New Zealand 23,131 19,794 20,745 609.96 519.43 541.53Norway 12,667 11,290 12,295 285.81 253.14 273.77Pakistan 229 224 214 0.17 0.17 0.16Palestinian Territory, occupied 1,790 2,045Papua New Guinea 236 404 417 4.83 8.07 8.13Paraguay 760 821 1,156 14.56 15.32 21.03Poland 23,764 42,797 79,838 61.41 110.59 206.30Portugal 4,865 4,857 5,229 48.81 48.62 52.29Qatar 38 57 72 6.96 10.09 12.31Romania 21,567 22,568 22,505 95.85 100.30 100.47Russian Federation 76,738 83,654 81,470 52.20 57.30 55.80Saudi Arabia 87 319 55 0.44 1.58 0.27Seychelles 77 130 97.65 162.44Singapore 1,693 1,436 1,464 43.16 36.34 36.44Slovakia 1,231 1,437 1,264 22.84 26.64 23.40Slovenia 3,768 3,723 4,902 190.05 187.51 246.58South Africa 62,086 66,773 67,076 149.97 158.61 156.72Spain 16,701 16,197 15,462 42.39 41.11 39.14Swaziland 368 380 419 37.15 37.27 40.10Switzerland 8,581 9,395 7,728 120.69 131.58 107.63
Page 44 of 316Population Source: World Bank

POLICE2. Crimes recorded in criminal (police) statistics, by type of crime including attempts to commit crimes
02.14 5c FRDPOLTotal recorded frauds
1998 1999 2000 1998 1999 2000Count Rate per 100,000 inhabitants
CountryThailand 6,468 6,461 6,831 10.82 10.73 11.25Tunisia 2,416 2,057 2,019 25.89 21.75 21.11Turkey 13,490 12,354 10,696 21.28 19.21 16.38Ukraine 15,505 16,079 14,634 30.83 32.22 29.56United States of America 394,600 371,800 143.49 133.74Uruguay 874 1,039 1,131 26.57 31.36 33.89Venezuela 9,408 11,227 11,741 40.55 47.37 48.52Yemen 318 419 658 1.92 2.46 3.76Zambia 333 477 349 3.45 4.83 3.46Zimbabwe 5,111 5,366 5,013 41.89 43.27 39.79
Page 45 of 316Population Source: World Bank
POLICE2. Crimes recorded in criminal (police) statistics, by type of crime including attempts to commit crimes
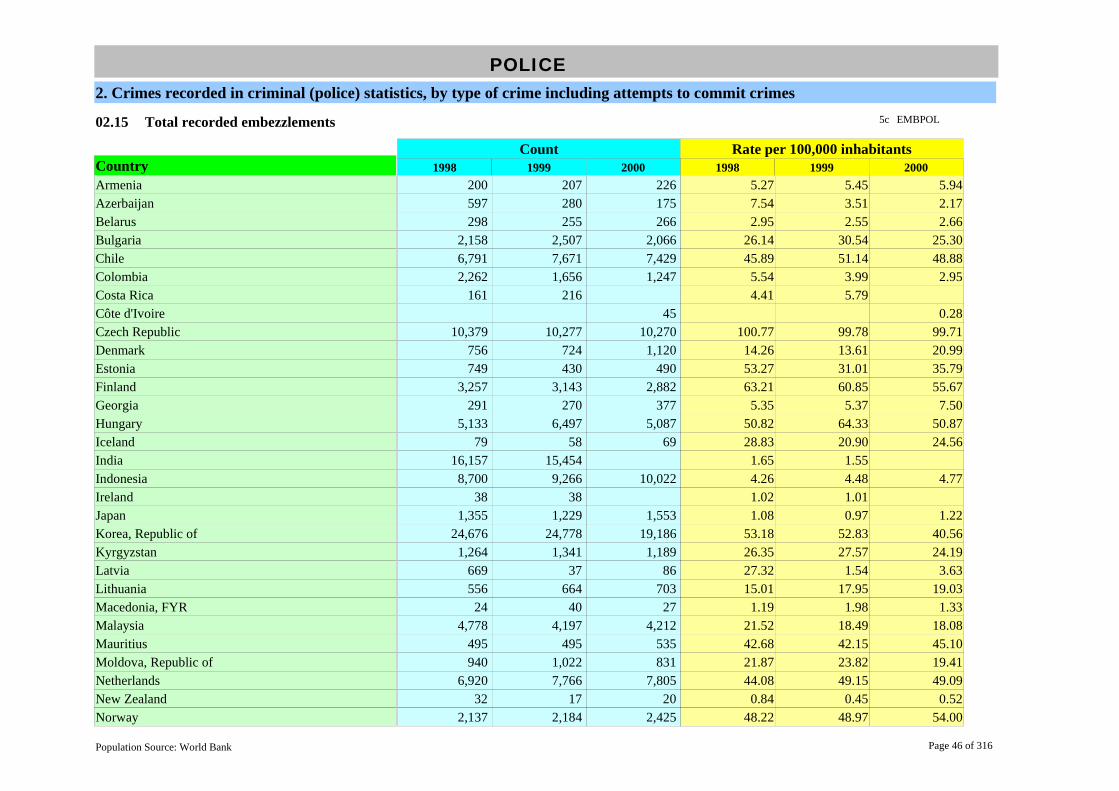
02.15 5c EMBPOLTotal recorded embezzlements
1998 1999 2000 1998 1999 2000Count Rate per 100,000 inhabitants
CountryArmenia 200 207 226 5.27 5.45 5.94Azerbaijan 597 280 175 7.54 3.51 2.17Belarus 298 255 266 2.95 2.55 2.66Bulgaria 2,158 2,507 2,066 26.14 30.54 25.30Chile 6,791 7,671 7,429 45.89 51.14 48.88Colombia 2,262 1,656 1,247 5.54 3.99 2.95Costa Rica 161 216 4.41 5.79Côte d'Ivoire 45 0.28Czech Republic 10,379 10,277 10,270 100.77 99.78 99.71Denmark 756 724 1,120 14.26 13.61 20.99Estonia 749 430 490 53.27 31.01 35.79Finland 3,257 3,143 2,882 63.21 60.85 55.67Georgia 291 270 377 5.35 5.37 7.50Hungary 5,133 6,497 5,087 50.82 64.33 50.87Iceland 79 58 69 28.83 20.90 24.56India 16,157 15,454 1.65 1.55Indonesia 8,700 9,266 10,022 4.26 4.48 4.77Ireland 38 38 1.02 1.01Japan 1,355 1,229 1,553 1.08 0.97 1.22Korea, Republic of 24,676 24,778 19,186 53.18 52.83 40.56Kyrgyzstan 1,264 1,341 1,189 26.35 27.57 24.19Latvia 669 37 86 27.32 1.54 3.63Lithuania 556 664 703 15.01 17.95 19.03Macedonia, FYR 24 40 27 1.19 1.98 1.33Malaysia 4,778 4,197 4,212 21.52 18.49 18.08Mauritius 495 495 535 42.68 42.15 45.10Moldova, Republic of 940 1,022 831 21.87 23.82 19.41Netherlands 6,920 7,766 7,805 44.08 49.15 49.09New Zealand 32 17 20 0.84 0.45 0.52Norway 2,137 2,184 2,425 48.22 48.97 54.00
Page 46 of 316Population Source: World Bank

POLICE2. Crimes recorded in criminal (police) statistics, by type of crime including attempts to commit crimes
02.15 5c EMBPOLTotal recorded embezzlements
1998 1999 2000 1998 1999 2000Count Rate per 100,000 inhabitants
CountryPakistan 39 37 61 0.03 0.03 0.04Palestinian Territory, occupied 26 19Paraguay 70 86 55 1.34 1.60 1.00Portugal 2,429 2,466 2,369 24.37 24.69 23.69Romania 44 21 47 0.20 0.09 0.21Russian Federation 44,399 48,516 53,579 30.20 33.23 36.70Saudi Arabia 346 582 479 1.76 2.88 2.31Singapore 645 593 521 16.44 15.01 12.97Slovakia 979 1,167 1,253 18.16 21.63 23.20Slovenia 192 188 163 9.68 9.47 8.20Spain 5,305 4,980 4,351 13.46 12.64 11.02Switzerland 2,563 2,486 2,369 36.05 34.82 32.99Thailand 13,824 11,840 12,846 23.12 19.67 21.16Tunisia 115 108 108 1.23 1.14 1.13Ukraine 10,082 10,640 10,582 20.04 21.32 21.38United States of America 17,100 17,300 6.22 6.22Uruguay 755 691 832 22.96 20.86 24.93Venezuela 4,031 4,147 4,111 17.38 17.50 16.99Yemen 15 0.09Zimbabwe 6,468 7,089 7,568 53.02 57.17 60.06
Page 47 of 316Population Source: World Bank

POLICE2. Crimes recorded in criminal (police) statistics, by type of crime including attempts to commit crimes
02.16 5c DRGPOLTotal recorded drug offenses
1998 1999 2000 1998 1999 2000Count Rate per 100,000 inhabitants
CountryArgentina 14,720 15,994 40.22 43.23Armenia 641 480 483 16.89 12.63 12.70Azerbaijan 2,446 2,383 2,369 30.91 29.85 29.43Barbados 1,094 984 1,459 412.36 369.81 546.44Belarus 3,018 3,163 3,811 29.88 31.63 38.11Bulgaria 764 808 424 9.25 9.84 5.19Canada 70,922 80,142 87,945 234.84 262.76 285.54Chile 117 120 117 0.79 0.80 0.77Colombia 21,254 16,656 20,983 52.09 40.13 49.61Costa Rica 735 908 20.12 24.34Côte d'Ivoire 360 2.25Czech Republic 5,234 7,720 4,458 50.82 74.95 43.28Denmark 971 830 942 18.32 15.60 17.65Dominica 300 162 270 369.86England & Wales 135,945 121,866 113,458 259.30 231.29 214.30Estonia 235 297 1,581 16.71 21.42 115.49Finland 9,461 11,674 13,445 183.60 226.02 259.71France 92,858 101,841 103,731 159.00 173.79 176.11Georgia 1,218 1,367 1,671 22.38 27.21 33.26Germany 216,682 226,563 244,336 264.25 275.96 297.25Greece 6,574 6,692 3,530 62.61 63.73 33.30Hong Kong, China (SAR) 2,778 2,246 2,312 41.80 33.42 34.02Hungary 2,075 2,883 3,456 20.54 28.54 34.56Iceland 713 962 781 260.22 346.67 277.94India 18,270 20,132 1.86 2.02Indonesia 6,700 6,902 7,044 3.28 3.33 3.35Ireland 5,984 7,137 161.21 190.22Italy 43,014 45,038 34,800 74.68 78.19 60.31Jamaica 9,192 10,178 11,897 356.83 392.97 451.84Japan 25,216 26,469 28,241 20.01 20.84 22.24
Page 48 of 316Population Source: World Bank

POLICE2. Crimes recorded in criminal (police) statistics, by type of crime including attempts to commit crimes
02.16 5c DRGPOLTotal recorded drug offenses
1998 1999 2000 1998 1999 2000Count Rate per 100,000 inhabitants
CountryKorea, Republic of 3,690 4,241 4,657 7.95 9.04 9.85Kyrgyzstan 3,295 3,459 3,539 68.69 71.11 72.00Latvia 389 511 655 15.88 21.20 27.61Lithuania 620 697 953 16.74 18.84 25.79Macedonia, FYR 201 293 432 9.98 14.53 21.27Malaysia 12,987 12,268 13,702 58.50 54.04 58.81Mauritius 2,118 1,963 2,473 182.63 167.15 208.49Mexico 19,629 23,156 24,156 20.62 23.97 24.65Moldova, Republic of 870 2,101 2,031 20.24 48.97 47.43Montserrat 15 42 42Netherlands 7,690 7,613 7,474 48.98 48.18 47.01New Zealand 26,783 26,215 24,580 706.27 687.93 641.64Norway 38,990 41,229 44,330 879.74 924.42 987.09Pakistan 145 402 402 0.11 0.30 0.29Palestinian Territory, occupied 629 391Papua New Guinea 1,012 636 856 20.73 12.70 16.69Paraguay 76 82 64 1.46 1.53 1.16Poland 16,432 15,628 19,649 42.46 40.38 50.77Portugal 7,043 8,226 6,534 70.66 82.35 65.34Qatar 168 239 261 30.77 42.29 44.62Romania 557 464 352 2.48 2.06 1.57Russian Federation 190,127 216,364 243,572 129.34 148.19 166.83Saudi Arabia 6,336 8,769 10,727 32.16 43.41 51.82Seychelles 239 197 255 303.11 246.16 313.92Singapore 4,994 4,586 4,222 127.30 116.04 105.08Slovakia 520 362 604 9.65 6.71 11.18Slovenia 676 746 939 34.10 37.57 47.23South Africa 39,830 41,461 45,691 96.21 98.48 106.75Spain 13,469 12,389 11,032 34.19 31.44 27.93Swaziland 757 814 883 76.43 79.85 84.50
Page 49 of 316Population Source: World Bank

POLICE2. Crimes recorded in criminal (police) statistics, by type of crime including attempts to commit crimes
02.16 5c DRGPOLTotal recorded drug offenses
1998 1999 2000 1998 1999 2000Count Rate per 100,000 inhabitants
CountrySwitzerland 45,726 44,343 46,558 643.12 621.05 648.44Thailand 225,252 238,621 260,354 376.68 396.38 428.92Tunisia 335 362 611 3.59 3.83 6.39Turkey 3,145 3,303 3,446 4.96 5.14 5.28Ukraine 39,801 42,590 45,554 79.13 85.35 92.03United States of America 1,559,100 1,557,100 566.95 560.11Uruguay 32 177 209 0.97 5.34 6.26Venezuela 13,156 8,857 2,702 56.71 37.37 11.17Yemen 42 59 135 0.25 0.35 0.77Zambia 177 387 404 1.83 3.92 4.00Zimbabwe 6,170 6,244 6,833 50.57 50.35 54.23
Page 50 of 316Population Source: World Bank
POLICE2. Crimes recorded in criminal (police) statistics, by type of crime including attempts to commit crimes
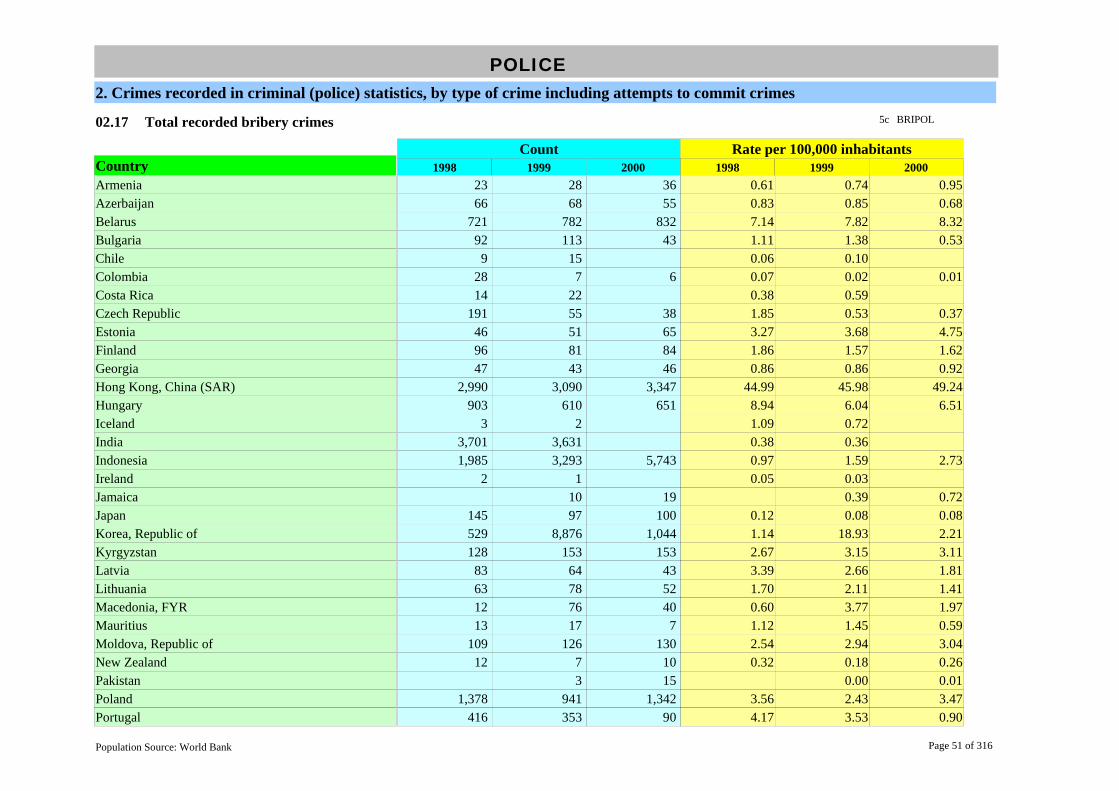
02.17 5c BRIPOLTotal recorded bribery crimes
1998 1999 2000 1998 1999 2000Count Rate per 100,000 inhabitants
CountryArmenia 23 28 36 0.61 0.74 0.95Azerbaijan 66 68 55 0.83 0.85 0.68Belarus 721 782 832 7.14 7.82 8.32Bulgaria 92 113 43 1.11 1.38 0.53Chile 9 15 0.06 0.10Colombia 28 7 6 0.07 0.02 0.01Costa Rica 14 22 0.38 0.59Czech Republic 191 55 38 1.85 0.53 0.37Estonia 46 51 65 3.27 3.68 4.75Finland 96 81 84 1.86 1.57 1.62Georgia 47 43 46 0.86 0.86 0.92Hong Kong, China (SAR) 2,990 3,090 3,347 44.99 45.98 49.24Hungary 903 610 651 8.94 6.04 6.51Iceland 3 2 1.09 0.72India 3,701 3,631 0.38 0.36Indonesia 1,985 3,293 5,743 0.97 1.59 2.73Ireland 2 1 0.05 0.03Jamaica 10 19 0.39 0.72Japan 145 97 100 0.12 0.08 0.08Korea, Republic of 529 8,876 1,044 1.14 18.93 2.21Kyrgyzstan 128 153 153 2.67 3.15 3.11Latvia 83 64 43 3.39 2.66 1.81Lithuania 63 78 52 1.70 2.11 1.41Macedonia, FYR 12 76 40 0.60 3.77 1.97Mauritius 13 17 7 1.12 1.45 0.59Moldova, Republic of 109 126 130 2.54 2.94 3.04New Zealand 12 7 10 0.32 0.18 0.26Pakistan 3 15 0.00 0.01Poland 1,378 941 1,342 3.56 2.43 3.47Portugal 416 353 90 4.17 3.53 0.90
Page 51 of 316Population Source: World Bank
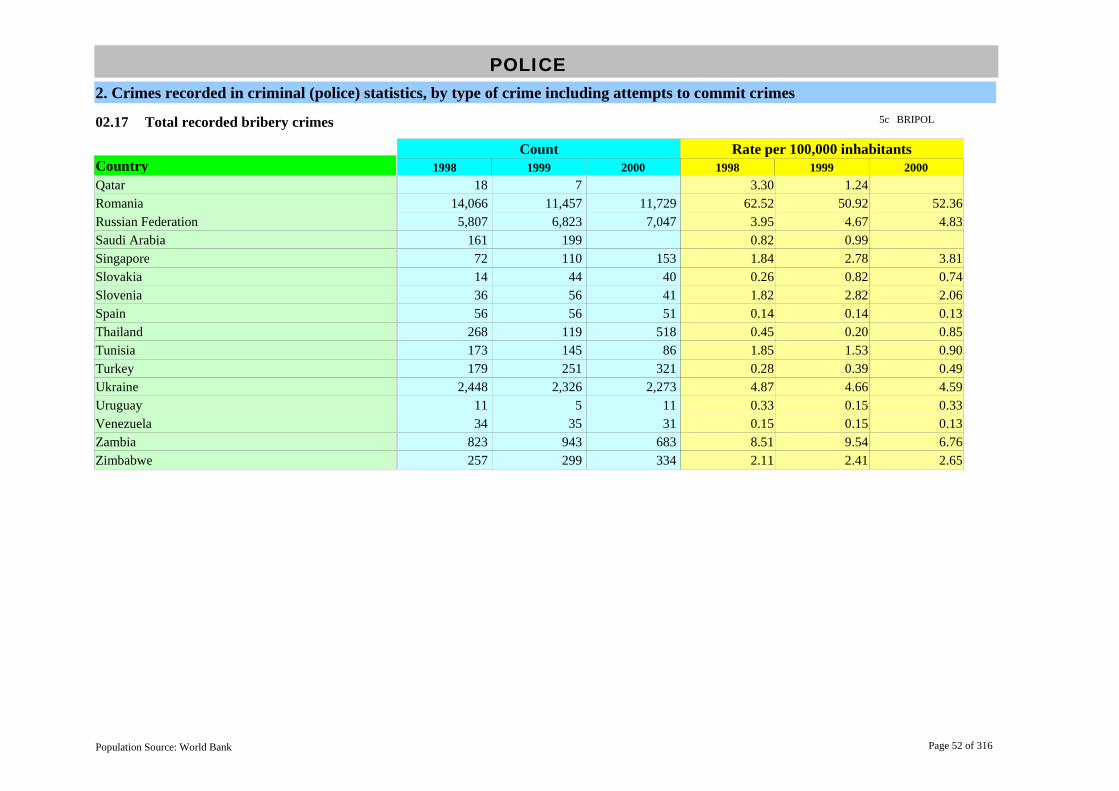
POLICE2. Crimes recorded in criminal (police) statistics, by type of crime including attempts to commit crimes
02.17 5c BRIPOLTotal recorded bribery crimes
1998 1999 2000 1998 1999 2000Count Rate per 100,000 inhabitants
CountryQatar 18 7 3.30 1.24Romania 14,066 11,457 11,729 62.52 50.92 52.36Russian Federation 5,807 6,823 7,047 3.95 4.67 4.83Saudi Arabia 161 199 0.82 0.99Singapore 72 110 153 1.84 2.78 3.81Slovakia 14 44 40 0.26 0.82 0.74Slovenia 36 56 41 1.82 2.82 2.06Spain 56 56 51 0.14 0.14 0.13Thailand 268 119 518 0.45 0.20 0.85Tunisia 173 145 86 1.85 1.53 0.90Turkey 179 251 321 0.28 0.39 0.49Ukraine 2,448 2,326 2,273 4.87 4.66 4.59Uruguay 11 5 11 0.33 0.15 0.33Venezuela 34 35 31 0.15 0.15 0.13Zambia 823 943 683 8.51 9.54 6.76Zimbabwe 257 299 334 2.11 2.41 2.65
Page 52 of 316Population Source: World Bank

POLICE3. Persons brought into initial formal contact with the police and/or criminal justice system by type of crime, where initial formal contact might include being suspected, arrested, cautioned etc.
03.01 6a FCALLTotal - all persons brought into initial formal contact
1998 1999 2000 1998 1999 2000Count Rate per 100,000 inhabitants
CountryAzerbaijan 12,750 11,908 11,590 161.13 149.17 143.99Belarus 65,326 68,289 68,225 646.79 682.89 682.25Bulgaria 78,982 74,465 62,021 956.55 907.22 759.41Canada 545,150 537,120 547,500 1,805.13 1,761.05 1,777.60Chile 593,767 704,718 703,130 4,011.94 4,698.12 4,625.86Colombia 130,643 147,255 156,810 320.20 354.83 370.71Côte d'Ivoire 33,384 208.65Czech Republic 129,271 127,887 130,234 1,255.06 1,241.62 1,264.41Denmark 55,577 53,447 52,453 1,048.42 1,004.83 983.00Dominica 825 737 789 1,080.82England & Wales 2,222,222 2,132,809 4,238.62 4,047.85Estonia 9,950 11,192 13,297 707.67 807.11 971.29Finland 212,681 327,080 349,534 4,127.32 6,332.62 6,751.67Germany 2,319,895 2,263,140 2,286,372 2,829.14 2,756.57 2,781.47Greece 195,390 202,914 81,969 1,860.86 1,932.51 773.29Guatemala 49,837 70,869 66,493 461.45 638.46 583.27Holy See (Vatican City State) 15 11Hong Kong, China (SAR) 40,796 41,234 41,535 613.88 613.54 611.08Hungary 140,064 131,608 122,766 1,386.77 1,303.05 1,227.66India 2,651,416 2,600,876 270.55 260.61Ireland 37,972 34,309 1,022.95 914.42Italy 813,124 797,488 657,248 1,411.67 1,384.53 1,139.08Jamaica 38,327 33,807 33,387 1,487.85 1,305.29 1,268.02Japan 324,263 315,355 309,649 257.35 248.31 243.82Kazakhstan 86,793 90,677 92,348 574.79 608.57 619.79Korea, Republic of 1,880,016 1,946,470 1,918,952 4,051.76 4,150.26 4,056.98Kyrgyzstan 21,805 22,366 23,359 454.55 459.77 475.26Latvia 17,476 17,366 18,191 713.60 720.58 766.91Lithuania 25,373 25,160 25,046 685.20 680.18 677.83
Page 53 of 316Population Source: World Bank

POLICE3. Persons brought into initial formal contact with the police and/or criminal justice system by type of crime, where initial formal contact might include being suspected, arrested, cautioned etc.
03.01 6a FCALLTotal - all persons brought into initial formal contact
1998 1999 2000 1998 1999 2000Count Rate per 100,000 inhabitants
CountryMacedonia, FYR 21,967 21,288 19,597 1,090.17 1,055.43 964.89Malaysia 29,934 30,308 31,673 134.84 133.52 135.94Mauritius 29,515 28,895 29,278 2,544.99 2,460.41 2,468.34Moldova, Republic of 15,220 15,896 18,308 354.04 370.54 427.56Montserrat 62 108 98Morocco 563,974 650,564 550,712 2,028.68 2,306.96 1,918.86Netherlands 266,853 267,247 268,173 1,699.70 1,691.44 1,686.62New Zealand 193,111 189,037 197,115 5,092.32 4,960.69 5,145.53Norway 28,586 31,519 34,235 644.99 706.70 762.30Pakistan 6,295 5,450 9,216 4.77 4.04 6.68Palestinian Territory, occupied 6,952 7,575 5,243Panama 51,690 54,932 1,870.12 1,954.18Papua New Guinea 5,968 6,376 6,203 122.22 127.37 120.92Paraguay 435 370 500 8.33 6.90 9.10Poland 396,055 364,272 405,275 1,023.40 941.27 1,047.22Portugal 227,283 237,903 2,280.13 2,381.65Qatar 5,617 6,129 6,406 1,028.75 1,084.57 1,095.25Romania 223,921 201,140 200,529 995.20 893.96 895.22Russian Federation 1,481,503 1,716,679 1,741,439 1,007.83 1,175.81 1,192.77Singapore 19,541 18,116 18,341 498.11 458.40 456.47Slovenia 18,676 939.44Spain 197,366 205,532 211,018 500.93 521.65 534.22Swaziland 34,672 33,566 34,243 3,500.60 3,292.50 3,276.84Sweden 85,852 69,384 86,657 969.88 783.34 977.08Thailand 218,304 207,577 217,915 365.06 344.81 359.00Tunisia 133,448 130,846 136,219 1,429.81 1,383.75 1,424.36Turkey 352,518 347,452 326,570 556.02 540.36 500.11Ukraine 279,674 266,890 261,849 556.01 534.85 528.99United States of America 14,533,500 14,363,600 5,284.91 5,166.76
Page 54 of 316Population Source: World Bank

POLICE3. Persons brought into initial formal contact with the police and/or criminal justice system by type of crime, where initial formal contact might include being suspected, arrested, cautioned etc.
03.01 6a FCALLTotal - all persons brought into initial formal contact
1998 1999 2000 1998 1999 2000Count Rate per 100,000 inhabitants
CountryUruguay 66,618 65,156 68,213 2,025.48 1,966.68 2,044.14Venezuela 110,370 66,694 15,777 475.73 281.41 65.19Yemen 11,127 13,328 12,599 67.03 78.40 71.99Zambia 17,459 19,633 16,736 180.63 198.69 165.70
Page 55 of 316Population Source: World Bank

POLICE3. Persons brought into initial formal contact with the police and/or criminal justice system by type of crime, where initial formal contact might include being suspected, arrested, cautioned etc.
03.02 5e CIHSUSCommitted intentional homicide suspects
1998 1999 2000 1998 1999 2000Count Rate per 100,000 inhabitants
CountryAustralia 171 215 178 0.91 1.13 0.93Azerbaijan 275 200 213 3.48 2.51 2.65Belarus 1,006 901 963 9.96 9.01 9.63Bulgaria 347 305 291 4.20 3.72 3.56Canada 425 452 433 1.41 1.48 1.41Chile 646 695 803 4.36 4.63 5.28Colombia 5,201 5,232 5,465 12.75 12.61 12.92Czech Republic 166 177 167 1.61 1.72 1.62Denmark 60 42 40 1.13 0.79 0.75Dominica 9 7 2 2.74England & Wales 1,059 1,053 2.02 2.00Estonia 164 144 149 11.66 10.38 10.88Finland 122 149 157 2.37 2.88 3.03Greece 334 303 148 3.18 2.89 1.40Guatemala 477 423 197 4.42 3.81 1.73Hong Kong, China (SAR) 65 70 61 0.98 1.04 0.90Hungary 289 257 203 2.86 2.54 2.03Iceland 2 6 0.72 2.14India 871,391 77,334 88.92 7.75Ireland 34 31 0.92 0.83Italy 580 636 554 1.01 1.10 0.96Jamaica 501 551 553 19.45 21.27 21.00Japan 698 696 663 0.55 0.55 0.52Kazakhstan 2,434 2,425 2,337 16.12 16.28 15.68Korea, Republic of 1,095 1,125 1,058 2.36 2.40 2.24Kyrgyzstan 475 450 477 9.90 9.25 9.70Latvia 211 176 145 8.62 7.30 6.11Lithuania 287 259 265 7.75 7.00 7.17Macedonia, FYR 42 39 202 2.08 1.93 9.95
Page 56 of 316Population Source: World Bank

POLICE3. Persons brought into initial formal contact with the police and/or criminal justice system by type of crime, where initial formal contact might include being suspected, arrested, cautioned etc.
03.02 5e CIHSUSCommitted intentional homicide suspects
1998 1999 2000 1998 1999 2000Count Rate per 100,000 inhabitants
CountryMalaysia 480 515 457 2.16 2.27 1.96Mauritius 49 26 26 4.23 2.21 2.19Moldova, Republic of 192 157 313 4.47 3.66 7.31Morocco 743 741 640 2.67 2.63 2.23Netherlands 363 397 275 2.31 2.51 1.73New Zealand 34 34 36 0.90 0.89 0.94Norway 24 32 36 0.54 0.72 0.80Pakistan 191 158 198 0.14 0.12 0.14Palestinian Territory, occupied 149 171 154Panama 462 384 16.71 13.66Papua New Guinea 540 438 465 11.06 8.75 9.06Paraguay 215 241 242 4.12 4.50 4.40Poland 1,018 975 1,209 2.63 2.52 3.12Portugal 278 195 2.79 1.95Qatar 8 3 1 1.47 0.53 0.17Romania 470 469 521 2.09 2.08 2.33Russian Federation 22,494 23,917 24,352 15.30 16.38 16.68Saudi Arabia 80 70 90 0.41 0.35 0.43Singapore 35 28 42 0.89 0.71 1.05Slovenia 30 1.51Spain 627 567 695 1.59 1.44 1.76Swaziland 396 343 326 39.98 33.64 31.20Sweden 75 84 105 0.85 0.95 1.18Thailand 5,717 5,052 5,140 9.56 8.39 8.47Tunisia 98 163 169 1.05 1.72 1.77Ukraine 2,928 3,151 3,526 5.82 6.31 7.12United States of America 17,450 14,920 6.35 5.37Uruguay 432 603 639 13.13 18.20 19.15Venezuela 5,071 3,460 1,512 21.86 14.60 6.25
Page 57 of 316Population Source: World Bank

POLICE3. Persons brought into initial formal contact with the police and/or criminal justice system by type of crime, where initial formal contact might include being suspected, arrested, cautioned etc.
03.02 5e CIHSUSCommitted intentional homicide suspects
1998 1999 2000 1998 1999 2000Count Rate per 100,000 inhabitants
CountryZambia 833 943 670 8.62 9.54 6.63
Page 58 of 316Population Source: World Bank

POLICE3. Persons brought into initial formal contact with the police and/or criminal justice system by type of crime, where initial formal contact might include being suspected, arrested, cautioned etc.
03.03 5e AIHSUSAttempted intentional homicide suspects
1998 1999 2000 1998 1999 2000Count Rate per 100,000 inhabitants
CountryAustralia 278 262 273 1.48 1.38 1.42Azerbaijan 120 97 75 1.52 1.22 0.93Belarus 189 167 177 1.87 1.67 1.77Bulgaria 220 256 161 2.66 3.12 1.97Canada 616 580 622 2.04 1.90 2.02Czech Republic 135 91 88 1.31 0.88 0.85Denmark 51 28 44 0.96 0.53 0.82Estonia 44 26 42 3.13 1.87 3.07Finland 283 288 325 5.49 5.58 6.28Germany 3,348 3,235 3,196 4.08 3.94 3.89Hong Kong, China (SAR) 3 7 3 0.05 0.10 0.04Hungary 158 148 145 1.56 1.47 1.45Iceland 2 0.72India 73,068 73,070 7.46 7.32Ireland 5 5 0.13 0.13Italy 1,556 1,571 1,342 2.70 2.73 2.33Jamaica 795 609 607 30.86 23.51 23.05Japan 667 617 753 0.53 0.49 0.59Lithuania 40 28 22 1.08 0.76 0.60Macedonia, FYR 56 64 80 2.78 3.17 3.94Malaysia 26 26 24 0.12 0.11 0.10Mauritius 14 11 5 1.21 0.94 0.42Moldova, Republic of 26 24 47 0.60 0.56 1.10Netherlands 1,513 1,460 1,627 9.64 9.24 10.23New Zealand 25 29 31 0.66 0.76 0.81Norway 23 22 26 0.52 0.49 0.58Pakistan 347 264 304 0.26 0.20 0.22Palestinian Territory, occupied 174 191 114Panama 39 18 1.41 0.64
Page 59 of 316Population Source: World Bank

POLICE3. Persons brought into initial formal contact with the police and/or criminal justice system by type of crime, where initial formal contact might include being suspected, arrested, cautioned etc.
03.03 5e AIHSUSAttempted intentional homicide suspects
1998 1999 2000 1998 1999 2000Count Rate per 100,000 inhabitants
CountryParaguay 29 39 42 0.56 0.73 0.76Qatar 17 10 4 3.11 1.77 0.68Romania 419 420 437 1.86 1.87 1.95Russian Federation 2,552 2,598 2,532 1.74 1.78 1.73Singapore 4 0.10Slovenia 31 1.56Spain 613 662 706 1.56 1.68 1.79Swaziland 134 95 109 13.53 9.32 10.43Thailand 4,777 4,311 4,739 7.99 7.16 7.81Tunisia 183 170 216 1.96 1.80 2.26Ukraine 264 276 298 0.52 0.55 0.60Uruguay 93 69 77 2.83 2.08 2.31Zambia 57 71 52 0.59 0.72 0.51
Page 60 of 316Population Source: World Bank

POLICE3. Persons brought into initial formal contact with the police and/or criminal justice system by type of crime, where initial formal contact might include being suspected, arrested, cautioned etc.
03.04 6a FCIHFAIntentional homicide committed with a firearm suspects
1998 1999 2000 1998 1999 2000Count Rate per 100,000 inhabitants
CountryCanada 151 165 0.50 0.54Czech Republic 219 198 201 2.13 1.92 1.95Dominica 1Finland 22 0.43Germany 447 437 368 0.55 0.53 0.45Guatemala 2,810 2,568 2,270 26.02 23.14 19.91Iceland 1 0.36Ireland 2 7 0.05 0.19Japan 44 39 34 0.03 0.03 0.03Macedonia, FYR 26 19 24 1.29 0.94 1.18Moldova, Republic of 13 12 9 0.30 0.28 0.21New Zealand 4 2 6 0.11 0.05 0.16Qatar 1 0.18Singapore 2 0.05Slovenia 11 0.55Spain 127 123 155 0.32 0.31 0.39Sweden 21 18 27 0.24 0.20 0.30Thailand 23,631 21,635 20,032 39.52 35.94 33.00Uruguay 70 50 77 2.13 1.51 2.31
Page 61 of 316Population Source: World Bank

POLICE3. Persons brought into initial formal contact with the police and/or criminal justice system by type of crime, where initial formal contact might include being suspected, arrested, cautioned etc.
03.05 5e NIHSUSTotal non-intentional homicide suspects
1998 1999 2000 1998 1999 2000Count Rate per 100,000 inhabitants
CountryAzerbaijan 13 20 19 0.16 0.25 0.24Belarus 58 81 57 0.57 0.81 0.57Bulgaria 82 85 95 0.99 1.04 1.16Canada 62 65 61 0.21 0.21 0.20Czech Republic 90 92 96 0.87 0.89 0.93Denmark 9 17 19 0.17 0.32 0.36Estonia 12 10 9 0.85 0.72 0.66Finland 33 27 30 0.64 0.52 0.58Greece 44 56 27 0.42 0.53 0.25Guatemala 5,458 8,670 9,007 50.54 78.11 79.01Hong Kong, China (SAR) 1 2 3 0.02 0.03 0.04Hungary 36 37 22 0.36 0.37 0.22India 7,381 7,204 0.75 0.72Ireland 13 9 0.35 0.24Italy 1,598 1,568 1,836 2.77 2.72 3.18Jamaica 3 0.11Japan 682 638 752 0.54 0.50 0.59Korea, Republic of 4,055 4,562 4,986 8.74 9.73 10.54Latvia 24 17 19 0.98 0.71 0.80Lithuania 32 17 24 0.86 0.46 0.65Macedonia, FYR 4 3 7 0.20 0.15 0.34Mauritius 9 4 5 0.78 0.34 0.42Moldova, Republic of 23 22 21 0.54 0.51 0.49Montserrat 2Morocco 1,563 3,021 1,654 5.62 10.71 5.76New Zealand 14 10 9 0.37 0.26 0.23Norway 42 38 40 0.95 0.85 0.89Panama 13 8 0.47 0.28Paraguay 66 55 87 1.26 1.03 1.58
Page 62 of 316Population Source: World Bank

POLICE3. Persons brought into initial formal contact with the police and/or criminal justice system by type of crime, where initial formal contact might include being suspected, arrested, cautioned etc.
03.05 5e NIHSUSTotal non-intentional homicide suspects
1998 1999 2000 1998 1999 2000Count Rate per 100,000 inhabitants
CountryPoland 160 182 160 0.41 0.47 0.41Portugal 75 72 0.75 0.72Qatar 6 14 7 1.10 2.48 1.20Romania 1,276 1,186 1,115 5.67 5.27 4.98Russian Federation 1,330 1,318 1,628 0.90 0.90 1.12Saudi Arabia 24 21 18 0.12 0.10 0.09Singapore 12 9 11 0.31 0.23 0.27Spain 92 53 91 0.23 0.13 0.23Swaziland 121 111 75 12.22 10.89 7.18Sweden 82 57 115 0.93 0.64 1.30Thailand 277 286 230 0.46 0.48 0.38Tunisia 92 60 94 0.99 0.63 0.98Turkey 2,497 2,491 2,333 3.94 3.87 3.57Ukraine 389 376 382 0.77 0.75 0.77Uruguay 8 6 5 0.24 0.18 0.15Zambia 153 92 75 1.58 0.93 0.74
Page 63 of 316Population Source: World Bank

POLICE3. Persons brought into initial formal contact with the police and/or criminal justice system by type of crime, where initial formal contact might include being suspected, arrested, cautioned etc.
03.06 5e MASSUSMajor assault suspects
1998 1999 2000 1998 1999 2000Count Rate per 100,000 inhabitants
CountryBelarus 3,172 3,249 3,354 31.41 32.49 33.54Bulgaria 182 182 81 2.20 2.22 0.99Canada 2,059 2,133 2,138 6.82 6.99 6.94Chile 1,589 1,631 3,126 10.74 10.87 20.57Colombia 15 49 2 0.04 0.12 0.00Czech Republic 695 709 800 6.75 6.88 7.77Denmark 958 1,017 1,110 18.07 19.12 20.80Estonia 209 227 229 14.86 16.37 16.73Finland 1,802 1,925 1,976 34.97 37.27 38.17Hong Kong, China (SAR) 5,599 5,984 5,465 84.25 89.04 80.40Hungary 6,047 5,879 5,632 59.87 58.21 56.32Iceland 29 28 40 10.58 10.09 14.23Ireland 571 369 15.38 9.83Jamaica 1,502 1,282 5,194 58.31 49.50 197.27Latvia 106 97 95 4.33 4.02 4.01Lithuania 231 221 255 6.24 5.97 6.90Macedonia, FYR 286 514 297 14.19 25.48 14.62Malaysia 3,628 3,235 3,063 16.34 14.25 13.15Mauritius 224 68 62 19.31 5.79 5.23Moldova, Republic of 275 277 344 6.40 6.46 8.03Montserrat 11 18 17Morocco 1,291 1,072 1,022 4.64 3.80 3.56New Zealand 3,218 3,157 3,384 84.86 82.85 88.34Norway 1,055 1,127 1,156 23.80 25.27 25.74Pakistan 483 462 469 0.37 0.34 0.34Papua New Guinea 430 431 467 8.81 8.61 9.10Poland 20,147 19,558 22,276 52.06 50.54 57.56Portugal 1,117 1,069 11.21 10.70Qatar 63 51 45 11.54 9.02 7.69
Page 64 of 316Population Source: World Bank

POLICE3. Persons brought into initial formal contact with the police and/or criminal justice system by type of crime, where initial formal contact might include being suspected, arrested, cautioned etc.
03.06 5e MASSUSMajor assault suspects
1998 1999 2000 1998 1999 2000Count Rate per 100,000 inhabitants
CountryRomania 1,213 1,150 1,126 5.39 5.11 5.03Russian Federation 33,918 38,559 36,694 23.07 26.41 25.13Saudi Arabia 1,500 1,429 1,812 7.61 7.07 8.75Singapore 79 85 67 2.01 2.15 1.67Slovenia 637 32.04Spain 6,408 6,506 7,400 16.26 16.51 18.73Swaziland 6,362 6,337 6,133 642.33 621.60 586.89Sweden 1,476 16.67Tunisia 17,377 16,708 18,033 186.18 176.69 188.56United States of America 506,630 490,790 184.23 176.54Uruguay 3,600 4,042 3,668 109.46 122.00 109.92Venezuela 18,694 10,636 1,291 80.58 44.88 5.33Zambia 6,159 7,051 6,044 63.72 71.36 59.84
Page 65 of 316Population Source: World Bank

POLICE3. Persons brought into initial formal contact with the police and/or criminal justice system by type of crime, where initial formal contact might include being suspected, arrested, cautioned etc.
03.07 5e TASSUSTotal assault suspects
1998 1999 2000 1998 1999 2000Count Rate per 100,000 inhabitants
CountryAustralia 58,911 60,538 63,681 313.36 318.62 331.67Azerbaijan 119 164 151 1.50 2.05 1.88Belarus 4,311 4,531 4,669 42.68 45.31 46.69Bulgaria 3,617 3,581 3,084 43.81 43.63 37.76Canada 105,785 103,279 109,481 350.28 338.62 355.46Chile 9,497 10,189 29,778 64.17 67.93 195.91Colombia 15,140 14,531 16,173 37.11 35.01 38.23Czech Republic 18,546 17,444 17,003 180.06 169.36 165.08Denmark 5,082 5,478 5,818 95.87 102.99 109.03England & Wales 92,711 90,062 176.84 170.93Estonia 289 247 258 20.55 17.81 18.85Finland 24,162 25,145 25,307 468.89 486.83 488.84Germany 122,985 129,243 133,939 149.98 157.42 162.94Greece 7,823 7,835 3,583 74.50 74.62 33.80Guatemala 4,259 6,145 4,795 39.44 55.36 42.06Hong Kong, China (SAR) 5,599 5,984 5,465 84.25 89.04 80.40Hungary 6,743 6,449 6,213 66.76 63.85 62.13Iceland 1,056 1,047 1,132 385.40 377.30 402.85India 444,633 445,827 45.37 44.67Ireland 9,373 9,840 252.51 262.26Italy 25,739 28,631 26,103 44.69 49.71 45.24Jamaica 11,714 10,387 10,033 454.74 401.04 381.05Japan 28,342 27,157 37,182 22.49 21.38 29.28Kazakhstan 2,267 2,282 2,439 15.01 15.32 16.37Korea, Republic of 11,679 16,708 23,152 25.17 35.62 48.95Kyrgyzstan 299 20 15 6.23 0.41 0.31Latvia 616 567 499 25.15 23.53 21.04Mauritius 1,086 995 987 93.64 84.72 83.21Moldova, Republic of 824 881 913 19.17 20.54 21.32
Page 66 of 316Population Source: World Bank

POLICE3. Persons brought into initial formal contact with the police and/or criminal justice system by type of crime, where initial formal contact might include being suspected, arrested, cautioned etc.
03.07 5e TASSUSTotal assault suspects
1998 1999 2000 1998 1999 2000Count Rate per 100,000 inhabitants
CountryMontserrat 22 39 29Morocco 95,195 81,751 95,137 342.43 289.90 331.49Netherlands 26,201 28,488 29,765 166.89 180.30 187.20New Zealand 24,130 23,754 24,589 636.31 623.35 641.88Norway 3,455 3,642 3,771 77.96 81.66 83.97Pakistan 623 583 631 0.47 0.43 0.46Palestinian Territory, occupied 2,047 1,848 1,140Panama 3,410 4,456 123.37 158.52Papua New Guinea 430 431 467 8.81 8.61 9.10Paraguay 380 318 387 7.28 5.93 7.04Poland 30,820 29,431 32,689 79.64 76.05 84.47Portugal 49,809 46,706 499.69 467.57Qatar 349 420 424 63.92 74.32 72.49Romania 6,328 7,536 7,825 28.12 33.49 34.93Saudi Arabia 5,859 5,861 5,282 29.74 29.01 25.52Singapore 393 422 397 10.02 10.68 9.88Slovenia 1,786 89.84Spain 8,075 7,991 9,271 20.49 20.28 23.47Swaziland 10,780 11,337 10,630 1,088.38 1,112.05 1,017.22Sweden 10,964 10,300 11,114 123.86 116.29 125.31Thailand 17,852 18,526 20,125 29.85 30.77 33.15Tunisia 43,340 43,101 45,876 464.36 455.81 479.70Turkey 87,080 92,002 96,364 137.35 143.08 147.57Ukraine 4,223 4,288 4,569 8.40 8.59 9.23United States of America 1,845,400 1,812,890 671.05 652.12Uruguay 4,279 4,547 4,340 130.10 137.25 130.06Zambia 6,159 7,051 6,044 63.72 71.36 59.84
Page 67 of 316Population Source: World Bank

POLICE3. Persons brought into initial formal contact with the police and/or criminal justice system by type of crime, where initial formal contact might include being suspected, arrested, cautioned etc.
03.08 5e RAPSUSRape suspects
1998 1999 2000 1998 1999 2000Count Rate per 100,000 inhabitants
CountryAustralia 3,783 3,531 3,675 20.12 18.58 19.14Azerbaijan 40 36 22 0.51 0.45 0.27Belarus 581 481 420 5.75 4.81 4.20Bulgaria 958 902 750 11.60 10.99 9.18Canada 9,466 8,913 9,522 31.34 29.22 30.92Chile 524 653 646 3.54 4.35 4.25Colombia 1,876 2,274 2,609 4.60 5.48 6.17Czech Republic 474 427 360 4.60 4.15 3.50Denmark 187 200 221 3.53 3.76 4.14England & Wales 2,212 2,202 4.22 4.18Estonia 45 31 40 3.20 2.24 2.92Finland 299 342 337 5.80 6.62 6.51Germany 6,052 5,932 5,888 7.38 7.23 7.16Greece 214 220 111 2.04 2.10 1.05Guatemala 144 194 143 1.33 1.75 1.25Hong Kong, China (SAR) 81 71 99 1.22 1.06 1.46Hungary 428 372 332 4.24 3.68 3.32Iceland 44 59 94 16.06 21.26 33.45India 19,585 20,313 2.00 2.04Ireland 244 174 6.57 4.64Italy 1,764 1,924 2,211 3.06 3.34 3.83Jamaica 785 550 684 30.47 21.24 25.98Japan 1,512 1,392 1,486 1.20 1.10 1.17Kazakhstan 1,112 1,036 1,159 7.36 6.95 7.78Korea, Republic of 5,732 6,193 5,920 12.35 13.20 12.52Kyrgyzstan 286 292 335 5.96 6.00 6.82Latvia 82 61 78 3.35 2.53 3.29Lithuania 155 202 164 4.19 5.46 4.44Macedonia, FYR 43 47 42 2.13 2.33 2.07
Page 68 of 316Population Source: World Bank
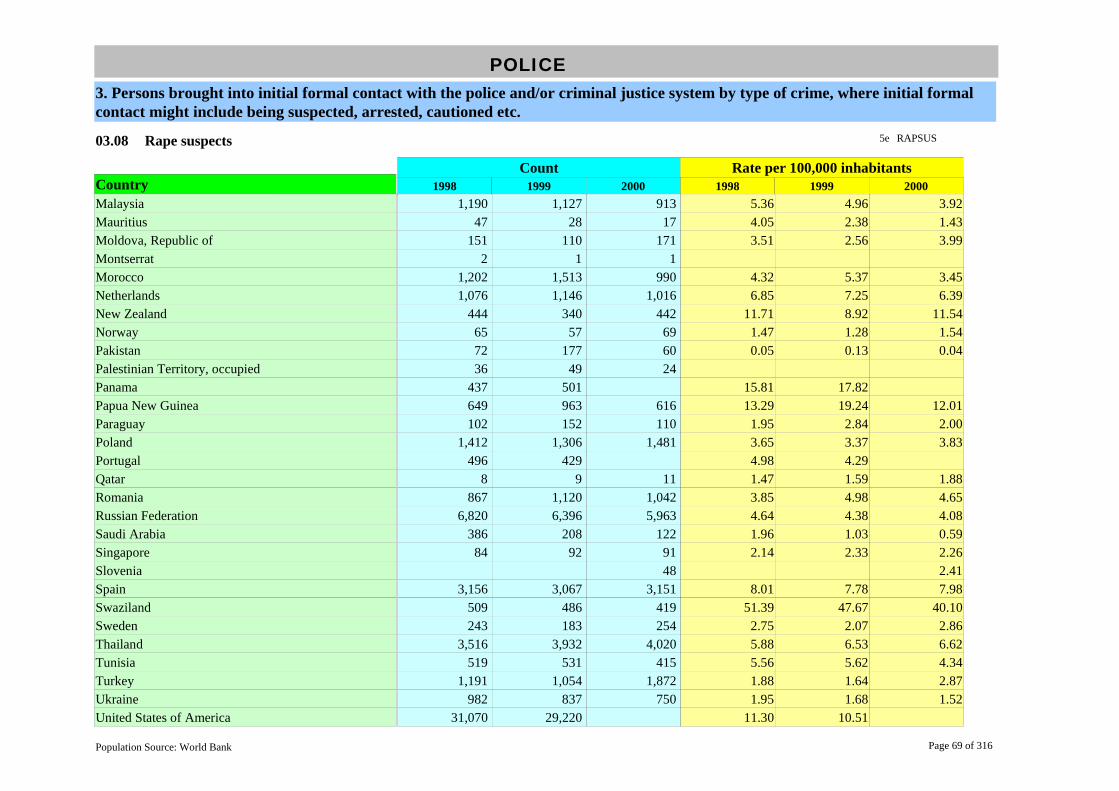
POLICE3. Persons brought into initial formal contact with the police and/or criminal justice system by type of crime, where initial formal contact might include being suspected, arrested, cautioned etc.
03.08 5e RAPSUSRape suspects
1998 1999 2000 1998 1999 2000Count Rate per 100,000 inhabitants
CountryMalaysia 1,190 1,127 913 5.36 4.96 3.92Mauritius 47 28 17 4.05 2.38 1.43Moldova, Republic of 151 110 171 3.51 2.56 3.99Montserrat 2 1 1Morocco 1,202 1,513 990 4.32 5.37 3.45Netherlands 1,076 1,146 1,016 6.85 7.25 6.39New Zealand 444 340 442 11.71 8.92 11.54Norway 65 57 69 1.47 1.28 1.54Pakistan 72 177 60 0.05 0.13 0.04Palestinian Territory, occupied 36 49 24Panama 437 501 15.81 17.82Papua New Guinea 649 963 616 13.29 19.24 12.01Paraguay 102 152 110 1.95 2.84 2.00Poland 1,412 1,306 1,481 3.65 3.37 3.83Portugal 496 429 4.98 4.29Qatar 8 9 11 1.47 1.59 1.88Romania 867 1,120 1,042 3.85 4.98 4.65Russian Federation 6,820 6,396 5,963 4.64 4.38 4.08Saudi Arabia 386 208 122 1.96 1.03 0.59Singapore 84 92 91 2.14 2.33 2.26Slovenia 48 2.41Spain 3,156 3,067 3,151 8.01 7.78 7.98Swaziland 509 486 419 51.39 47.67 40.10Sweden 243 183 254 2.75 2.07 2.86Thailand 3,516 3,932 4,020 5.88 6.53 6.62Tunisia 519 531 415 5.56 5.62 4.34Turkey 1,191 1,054 1,872 1.88 1.64 2.87Ukraine 982 837 750 1.95 1.68 1.52United States of America 31,070 29,220 11.30 10.51
Page 69 of 316Population Source: World Bank

POLICE3. Persons brought into initial formal contact with the police and/or criminal justice system by type of crime, where initial formal contact might include being suspected, arrested, cautioned etc.
03.08 5e RAPSUSRape suspects
1998 1999 2000 1998 1999 2000Count Rate per 100,000 inhabitants
CountryUruguay 297 228 238 9.03 6.88 7.13Venezuela 2,817 1,775 454 12.14 7.49 1.88Zambia 99 89 71 1.02 0.90 0.70
Page 70 of 316Population Source: World Bank

POLICE3. Persons brought into initial formal contact with the police and/or criminal justice system by type of crime, where initial formal contact might include being suspected, arrested, cautioned etc.
03.09 5e ROBSUSRobbery suspects
1998 1999 2000 1998 1999 2000Count Rate per 100,000 inhabitants
CountryAustralia 3,814 3,965 3,962 20.29 20.87 20.64Azerbaijan 129 98 112 1.63 1.23 1.39Belarus 3,329 3,641 3,808 32.96 36.41 38.08Bulgaria 3,234 3,006 2,179 39.17 36.62 26.68Canada 9,834 9,528 9,639 32.56 31.24 31.30Chile 20,752 27,012 28,707 140.22 180.08 188.86Colombia 14,360 17,173 18,485 35.20 41.38 43.70Czech Republic 2,400 2,441 3,015 23.30 23.70 29.27Denmark 897 964 1,106 16.92 18.12 20.73England & Wales 11,070 10,897 21.11 20.68Estonia 1,048 1,277 1,322 74.54 92.09 96.57Finland 1,611 1,569 1,920 31.26 30.38 37.09Germany 42,004 40,025 38,747 51.22 48.75 47.14Greece 824 936 363 7.85 8.91 3.42Guatemala 5,448 7,058 6,611 50.44 63.59 57.99Hong Kong, China (SAR) 1,230 1,206 1,521 18.51 17.94 22.38Hungary 1,687 1,585 1,732 16.70 15.69 17.32Iceland 7 35 17 2.55 12.61 6.05India 57,398 53,036 5.86 5.31Ireland 1,158 828 31.20 22.07Italy 10,887 12,513 11,684 18.90 21.72 20.25Jamaica 1,571 1,149 1,067 60.99 44.36 40.52Japan 3,379 3,762 3,797 2.68 2.96 2.99Kazakhstan 4,425 5,125 5,136 29.30 34.40 34.47Korea, Republic of 8,333 6,966 6,337 17.96 14.85 13.40Kyrgyzstan 860 795 974 17.93 16.34 19.82Latvia 1,064 888 936 43.45 36.85 39.46Lithuania 1,320 1,232 1,364 35.65 33.31 36.91Macedonia, FYR 358 244 327 17.77 12.10 16.10
Page 71 of 316Population Source: World Bank

POLICE3. Persons brought into initial formal contact with the police and/or criminal justice system by type of crime, where initial formal contact might include being suspected, arrested, cautioned etc.
03.09 5e ROBSUSRobbery suspects
1998 1999 2000 1998 1999 2000Count Rate per 100,000 inhabitants
CountryMalaysia 2,634 3,078 3,530 11.86 13.56 15.15Mauritius 421 389 318 36.30 33.12 26.81Moldova, Republic of 1,099 1,078 1,249 25.56 25.13 29.17Netherlands 5,615 6,671 7,036 35.76 42.22 44.25New Zealand 1,024 838 922 27.00 21.99 24.07Norway 178 264 323 4.02 5.92 7.19Pakistan 397 362 245 0.30 0.27 0.18Palestinian Territory, occupied 67 64 66Panama 2,769 2,795 100.18 99.43Papua New Guinea 877 1,200 1,100 17.96 23.97 21.44Paraguay 518 437 521 9.93 8.15 9.48Poland 16,616 19,983 24,266 42.94 51.64 62.70Portugal 20,080 26,016 201.44 260.45Qatar 9 16 6 1.65 2.83 1.03Romania 2,256 2,203 2,516 10.03 9.79 11.23Russian Federation 65,680 75,367 71,303 44.68 51.62 48.84Saudi Arabia 208 254 322 1.06 1.26 1.56Singapore 460 270 214 11.73 6.83 5.33Slovenia 205 10.31Spain 61,188 62,344 60,810 155.30 158.23 153.95Swaziland 774 877 883 78.15 86.03 84.50Sweden 936 942 1,308 10.57 10.64 14.75Thailand 1,060 859 780 1.77 1.43 1.29Tunisia 1,087 996 1,214 11.65 10.53 12.69Turkey 2,083 1,915 2,526 3.29 2.98 3.87Ukraine 9,263 9,331 9,934 18.42 18.70 20.07United States of America 120,870 109,840 43.95 39.51Uruguay 2,104 2,586 3,256 63.97 78.06 97.57Venezuela 15,410 9,986 3,270 66.42 42.14 13.51
Page 72 of 316Population Source: World Bank

POLICE3. Persons brought into initial formal contact with the police and/or criminal justice system by type of crime, where initial formal contact might include being suspected, arrested, cautioned etc.
03.09 5e ROBSUSRobbery suspects
1998 1999 2000 1998 1999 2000Count Rate per 100,000 inhabitants
CountryZambia 669 845 546 6.92 8.55 5.41
Page 73 of 316Population Source: World Bank

POLICE3. Persons brought into initial formal contact with the police and/or criminal justice system by type of crime, where initial formal contact might include being suspected, arrested, cautioned etc.
03.10 5e MTFSUSMajor theft suspects
1998 1999 2000 1998 1999 2000Count Rate per 100,000 inhabitants
CountryBelarus 15,668 17,039 15,435 155.13 170.39 154.35Canada 2,563 2,459 2,235 8.49 8.06 7.26Colombia 4,314 5,273 4,075 10.57 12.71 9.63Czech Republic 1,551 1,324 1,435 15.06 12.85 13.93Finland 228 273 2,753 4.42 5.29 53.18Greece 307 261 113 2.92 2.49 1.07Hong Kong, China (SAR) 7,652 7,906 8,497 115.14 117.64 125.01Hungary 1,474 1,295 1,644 14.59 12.82 16.44Ireland 374 580 10.08 15.46Jamaica 1,859 1,353 1,251 72.17 52.24 47.51Latvia 794 545 265 32.42 22.61 11.17Lithuania 2,005 1,941 1,593 54.15 52.47 43.11Macedonia, FYR 10,231 9,242 7,549 507.74 458.21 371.69Mauritius 143 126 60 12.33 10.73 5.06Moldova, Republic of 148 183 332 3.44 4.27 7.75Montserrat 2 4 1Morocco 9,499 7,965 7,931 34.17 28.24 27.63Norway 3,859 4,009 3,898 87.07 89.89 86.80Pakistan 140 165 60 0.11 0.12 0.04Papua New Guinea 230 270 431 4.71 5.39 8.40Poland 712 151 1.84 0.39Singapore 5,518 4,542 4,432 140.66 114.93 110.30Slovenia 162 8.15Spain 9,803 10,364 12,189 24.88 26.30 30.86Swaziland 5,446 6,350 6,055 549.85 622.87 579.43Tunisia 7,417 6,579 6,877 79.47 69.58 71.91Uruguay 11,359 11,079 12,004 345.36 334.41 359.72Venezuela 27,238 15,704 2,255 117.41 66.26 9.32Zambia 7,049 8,001 7,742 72.93 80.97 76.65
Page 74 of 316Population Source: World Bank

POLICE3. Persons brought into initial formal contact with the police and/or criminal justice system by type of crime, where initial formal contact might include being suspected, arrested, cautioned etc.
03.11 5e TTFSUSTotal theft suspects
1998 1999 2000 1998 1999 2000Count Rate per 100,000 inhabitants
CountryAustralia 66,777 73,190 79,058 355.20 385.21 411.76Azerbaijan 1,702 1,647 1,854 21.51 20.63 23.03Belarus 23,520 25,674 25,513 232.87 256.74 255.13Bulgaria 20,837 19,263 17,134 252.36 234.69 209.80Canada 92,164 82,978 76,590 305.18 272.06 248.67Chile 20,097 29,172 33,562 135.79 194.48 220.80Colombia 18,096 19,437 13,806 44.35 46.84 32.64Czech Republic 29,172 26,863 27,999 283.22 260.81 271.83Denmark 21,960 20,533 19,700 414.26 386.03 369.19England & Wales 233,578 234,118 445.52 444.33Estonia 1,988 2,147 2,481 141.39 154.83 181.23Finland 46,908 46,851 52,398 910.30 907.09 1,012.13Germany 851,775 787,369 753,732 1,038.75 959.04 916.95Greece 7,139 7,244 3,572 67.99 68.99 33.70Hong Kong, China (SAR) 12,325 12,779 13,736 185.46 190.14 202.09Hungary 36,620 31,319 26,606 362.57 310.09 266.06Iceland 1,260 1,306 1,642 459.85 470.63 584.34India 167,388 170,360 17.08 17.07Ireland 17,313 12,845 466.41 342.35Italy 103,906 96,636 75,748 180.39 167.77 131.28Jamaica 5,512 4,255 3,265 213.98 164.29 124.00Japan 157,137 149,823 142,877 124.71 117.97 112.50Kazakhstan 30,835 27,849 29,673 204.21 186.91 199.15Korea, Republic of 73,194 66,811 66,082 157.75 142.45 139.71Kyrgyzstan 6,429 7,173 8,113 134.02 147.45 165.07Latvia 7,787 1,515 3,428 317.97 62.86 144.52Lithuania 10,775 10,409 11,779 290.98 281.40 318.78Macedonia, FYR 13,472 12,077 10,703 668.59 598.76 526.98Malaysia 11,451 10,935 11,662 51.58 48.17 50.05
Page 75 of 316Population Source: World Bank

POLICE3. Persons brought into initial formal contact with the police and/or criminal justice system by type of crime, where initial formal contact might include being suspected, arrested, cautioned etc.
03.11 5e TTFSUSTotal theft suspects
1998 1999 2000 1998 1999 2000Count Rate per 100,000 inhabitants
CountryMauritius 2,275 2,132 1,076 196.17 181.54 90.71Moldova, Republic of 6,098 6,576 7,571 141.85 153.29 176.81Montserrat 7 16 10Morocco 34,931 25,786 35,229 125.65 91.44 122.75Netherlands 92,327 86,925 83,577 588.07 550.16 525.64New Zealand 30,739 31,619 32,391 810.58 829.74 845.54Norway 7,300 8,020 8,560 164.71 179.82 190.60Pakistan 1,220 601 341 0.92 0.45 0.25Palestinian Territory, occupied 931 1,057 680Panama 7,267 7,260 262.92 258.27Papua New Guinea 230 270 431 4.71 5.39 8.40Poland 38,212 36,988 46,909 98.74 95.58 121.21Portugal 17,651 17,989 177.08 180.09Qatar 422 382 587 77.29 67.60 100.36Romania 71,281 48,414 54,074 316.80 215.17 241.40Russian Federation 530,835 690,187 654,342 361.11 472.73 448.18Saudi Arabia 3,139 2,750 3,383 15.93 13.61 16.34Singapore 7,699 6,552 6,292 196.25 165.79 156.60Slovenia 4,309 216.75Spain 16,853 17,064 19,496 42.77 43.31 49.36Swaziland 6,023 6,910 6,607 608.10 677.80 632.25Sweden 32,241 23,055 28,305 364.23 260.29 319.15Thailand 58,184 56,062 57,743 97.30 93.13 95.13Tunisia 22,196 20,162 21,245 237.82 213.22 222.15Turkey 47,648 46,221 46,196 75.15 71.88 70.74Ukraine 57,386 56,942 60,492 114.09 114.11 122.21United States of America 1,307,100 1,213,300 475.31 436.44Uruguay 14,182 13,665 14,529 431.19 412.47 435.39Zambia 7,049 8,001 7,742 72.93 80.97 76.65
Page 76 of 316Population Source: World Bank

POLICE3. Persons brought into initial formal contact with the police and/or criminal justice system by type of crime, where initial formal contact might include being suspected, arrested, cautioned etc.
03.12 6a FCATAutomobile theft suspects
1998 1999 2000 1998 1999 2000Count Rate per 100,000 inhabitants
CountryAustralia 8,792 9,546 10,311 46.77 50.24 53.70Azerbaijan 53 57 50 0.67 0.71 0.62Belarus 1,174 1,110 1,033 11.62 11.10 10.33Bulgaria 1,653 1,664 1,245 20.02 20.27 15.24Canada 14,653 13,818 13,974 48.52 45.30 45.37Chile 783 5.15Colombia 6,967 8,150 8,114 17.08 19.64 19.18Czech Republic 4,042 3,369 3,137 39.24 32.71 30.46Denmark 2,476 2,453 2,197 46.71 46.12 41.17England & Wales 23,629 24,609 45.07 46.71Estonia 281 285 280 19.99 20.55 20.45Finland 9,521 10,132 11,516 184.77 196.17 222.45Germany 26,422 23,131 20,408 32.22 28.17 24.83Greece 1,000 1,228 647 9.52 11.70 6.10Guatemala 787 739 821 7.29 6.66 7.20Hong Kong, China (SAR) 220 222 206 3.31 3.30 3.03Iceland 122 168 161 44.53 60.54 57.30Ireland 2,526 3,221 68.05 85.85Italy 13,278 11,389 8,196 23.05 19.77 14.20Jamaica 146 64 5.64 2.43Japan 24,192 22,324 19,733 19.20 17.58 15.54Kazakhstan 838 988 646 5.55 6.63 4.34Kyrgyzstan 90 96 101 1.88 1.97 2.05Malaysia 5,501 6,269 7,021 24.78 27.62 30.13Moldova, Republic of 268 198 210 6.23 4.62 4.90Netherlands 4,969 4,765 5,039 31.65 30.16 31.69New Zealand 4,746 4,477 4,413 125.15 117.48 115.20Norway 813 998 993 18.34 22.38 22.11Pakistan 106 87 75 0.08 0.06 0.05
Page 77 of 316Population Source: World Bank

POLICE3. Persons brought into initial formal contact with the police and/or criminal justice system by type of crime, where initial formal contact might include being suspected, arrested, cautioned etc.
03.12 6a FCATAutomobile theft suspects
1998 1999 2000 1998 1999 2000Count Rate per 100,000 inhabitants
CountryPapua New Guinea 287 399 269 5.88 7.97 5.24Paraguay 140 131 157 2.68 2.44 2.86Poland 5,655 5,915 5,516 14.61 15.28 14.25Portugal 3,889 3,761 39.01 37.65Qatar 18 34 16 3.30 6.02 2.74Russian Federation 20,500 19,901 18,130 13.95 13.63 12.42Saudi Arabia 108 62 25 0.55 0.31 0.12Singapore 374 254 216 9.53 6.43 5.38Slovenia 299 15.04Spain 14,633 16,238 16,759 37.14 41.21 42.43Sweden 3,161 2,808 3,208 35.71 31.70 36.17Thailand 3,833 2,870 3,276 6.41 4.77 5.40Tunisia 516 518 785 5.53 5.48 8.21Turkey 4,062 3,903 3,472 6.41 6.07 5.32United States of America 150,700 144,200 54.80 51.87Uruguay 254 270 366 7.72 8.15 10.97Zambia 82 94 77 0.85 0.95 0.76
Page 78 of 316Population Source: World Bank

POLICE3. Persons brought into initial formal contact with the police and/or criminal justice system by type of crime, where initial formal contact might include being suspected, arrested, cautioned etc.
03.13 5e BURSUSBurglary suspects
1998 1999 2000 1998 1999 2000Count Rate per 100,000 inhabitants
CountryAustralia 25,953 26,720 26,591 138.05 140.63 138.49Belarus 12,355 12,486 12,302 122.33 124.86 123.02Bulgaria 12,180 9,149 8,693 147.51 111.46 106.44Canada 40,541 35,476 33,858 134.24 116.31 109.93Chile 5,582 6,118 4,658 37.72 40.79 30.64Colombia 12,695 15,674 13,595 31.12 37.77 32.14Czech Republic 15,865 14,021 13,024 154.03 136.13 126.45Denmark 3,841 3,550 3,322 72.46 66.74 62.26England & Wales 56,486 53,830 107.74 102.16Estonia 2,763 2,870 3,044 196.51 206.97 222.35Finland 22,528 21,291 22,634 437.18 412.22 437.20Greece 3,942 4,052 2,098 37.54 38.59 19.79Hong Kong, China (SAR) 1,217 1,052 978 18.31 15.65 14.39Hungary 14,548 11,462 10,084 144.04 113.49 100.84Iceland 514 644 577 187.59 232.07 205.34India 72,610 70,189 7.41 7.03Ireland 9,636 5,553 259.59 148.00Jamaica 1,372 1,209 1,152 53.26 46.68 43.75Japan 15,480 15,234 13,651 12.29 12.00 10.75Korea, Republic of 2,913 2,799 2,503 6.28 5.97 5.29Malaysia 4,790 4,895 4,834 21.58 21.56 20.75Mauritius 291 293 142 25.09 24.95 11.97Moldova, Republic of 1,004 970 1,236 23.35 22.61 28.87Montserrat 18 13 11Netherlands 9,519 8,099 7,511 60.63 51.26 47.24New Zealand 11,429 10,930 14,363 301.38 286.82 374.93Norway 311 353 380 7.02 7.91 8.46Pakistan 662 516 608 0.50 0.38 0.44Papua New Guinea 667 858 652 13.66 17.14 12.71
Page 79 of 316Population Source: World Bank

POLICE3. Persons brought into initial formal contact with the police and/or criminal justice system by type of crime, where initial formal contact might include being suspected, arrested, cautioned etc.
03.13 5e BURSUSBurglary suspects
1998 1999 2000 1998 1999 2000Count Rate per 100,000 inhabitants
CountryPoland 62,277 57,508 55,956 160.92 148.60 144.59Portugal 11,464 10,802 115.01 108.14Qatar 212 143 241 38.83 25.30 41.20Saudi Arabia 15 2 12 0.08 0.01 0.06Singapore 279 284 162 7.11 7.19 4.03Slovenia 1,071 53.87Spain 5,029 5,111 4,331 12.76 12.97 10.96Swaziland 3,482 3,039 3,251 351.55 298.10 311.10Sweden 5,030 4,003 4,512 56.82 45.19 50.87Thailand 13,784 14,074 13,222 23.05 23.38 21.78Tunisia 8,300 7,131 7,348 88.93 75.41 76.83United States of America 330,700 301,500 120.25 108.45Zambia 1,914 2,041 947 19.80 20.66 9.38
Page 80 of 316Population Source: World Bank

POLICE3. Persons brought into initial formal contact with the police and/or criminal justice system by type of crime, where initial formal contact might include being suspected, arrested, cautioned etc.
03.14 5e FRDSUSFraud suspects
1998 1999 2000 1998 1999 2000Count Rate per 100,000 inhabitants
CountryAzerbaijan 330 494 514 4.17 6.19 6.39Belarus 634 903 1,143 6.28 9.03 11.43Bulgaria 3,981 4,310 2,920 48.21 52.51 35.75Canada 27,438 26,466 24,708 90.85 86.77 80.22Chile 687 762 708 4.64 5.08 4.66Colombia 1,636 1,918 2,042 4.01 4.62 4.83Czech Republic 10,196 12,081 14,859 98.99 117.29 144.26Estonia 255 289 419 18.14 20.84 30.61Finland 13,486 13,047 12,690 261.71 252.60 245.12Germany 450,469 435,902 456,196 549.35 530.94 554.98Greece 467 538 322 4.45 5.12 3.04Hong Kong, China (SAR) 1,829 2,042 2,040 27.52 30.38 30.01Hungary 5,918 7,515 7,621 58.59 74.41 76.21Iceland 153 295 212 55.84 106.31 75.44India 32,489 36,946 3.32 3.70Ireland 2,699 1,772 72.71 47.23Italy 34,060 30,946 22,368 59.13 53.73 38.77Jamaica 1,791 1,436 108 69.53 55.44 4.10Japan 8,651 8,178 8,492 6.87 6.44 6.69Kazakhstan 827 1,271 1,089 5.48 8.53 7.31Korea, Republic of 209,009 221,828 174,767 450.45 472.98 369.49Kyrgyzstan 394 499 493 8.21 10.26 10.03Latvia 181 17 33 7.39 0.71 1.39Lithuania 393 428 340 10.61 11.57 9.20Macedonia, FYR 735 1,069 513 36.48 53.00 25.26Malaysia 34 48 78 0.15 0.21 0.33Mauritius 634 599 317 54.67 51.00 26.73Moldova, Republic of 157 170 191 3.65 3.96 4.46Montserrat 3
Page 81 of 316Population Source: World Bank

POLICE3. Persons brought into initial formal contact with the police and/or criminal justice system by type of crime, where initial formal contact might include being suspected, arrested, cautioned etc.
03.14 5e FRDSUSFraud suspects
1998 1999 2000 1998 1999 2000Count Rate per 100,000 inhabitants
CountryMorocco 5,445 5,734 6,755 19.59 20.33 23.54Netherlands 8,298 8,460 8,281 52.85 53.54 52.08New Zealand 11,766 9,858 9,960 310.27 258.69 260.00Norway 2,047 1,904 1,808 46.19 42.69 40.26Pakistan 617 345 600 0.47 0.26 0.43Palestinian Territory, occupied 778 922 548Panama 565 558 20.44 19.85Papua New Guinea 208 292 282 4.26 5.83 5.50Paraguay 248 231 242 4.75 4.31 4.40Poland 8,046 16,838 26,569 20.79 43.51 68.65Portugal 5,105 5,026 51.21 50.32Qatar 50 63 92 9.16 11.15 15.73Romania 11,091 8,617 11,157 49.29 38.30 49.81Russian Federation 28,190 27,188 26,977 19.18 18.62 18.48Saudi Arabia 121 79 50 0.61 0.39 0.24Singapore 568 464 469 14.48 11.74 11.67Slovenia 1,829 92.00Spain 4,444 4,711 5,076 11.28 11.96 12.85Swaziland 107 109 101 10.80 10.69 9.67Sweden 3,797 3,198 3,894 42.90 36.11 43.91Thailand 6,468 6,461 6,831 10.82 10.73 11.25Tunisia 2,161 2,091 2,006 23.15 22.11 20.98Turkey 17,355 18,777 17,899 27.37 29.20 27.41Ukraine 4,016 3,683 3,752 7.98 7.38 7.58United States of America 394,600 371,800 143.49 133.74Uruguay 988 143 882 30.04 4.32 26.43Venezuela 2,839 1,780 463 12.24 7.51 1.91Zambia 127 102 113 1.31 1.03 1.12
Page 82 of 316Population Source: World Bank

POLICE3. Persons brought into initial formal contact with the police and/or criminal justice system by type of crime, where initial formal contact might include being suspected, arrested, cautioned etc.
03.15 5e EMBSUSEmbezzlement suspects
1998 1999 2000 1998 1999 2000Count Rate per 100,000 inhabitants
CountryAzerbaijan 772 590 512 9.76 7.39 6.36Belarus 197 176 183 1.95 1.76 1.83Bulgaria 2,050 2,388 1,917 24.83 29.09 23.47Chile 259 301 241 1.75 2.01 1.59Colombia 888 569 623 2.18 1.37 1.47Czech Republic 5,314 5,937 6,241 51.59 57.64 60.59Denmark 3,486 3,111 3,121 65.76 58.49 58.49Estonia 200 213 238 14.22 15.36 17.38Finland 2,165 2,272 2,106 42.01 43.99 40.68Hungary 3,380 3,142 3,036 33.47 31.11 30.36Iceland 40 29 37 14.60 10.45 13.17India 15,108 15,267 1.54 1.53Ireland 35 38 0.94 1.01Japan 882 759 971 0.70 0.60 0.76Kazakhstan 1,373 478 379 9.09 3.21 2.54Korea, Republic of 27,044 29,308 22,236 58.28 62.49 47.01Kyrgyzstan 1,179 1,091 903 24.58 22.43 18.37Latvia 187 20 36 7.64 0.83 1.52Lithuania 271 201 220 7.32 5.43 5.95Macedonia, FYR 25 36 28 1.24 1.78 1.38Malaysia 125 165 239 0.56 0.73 1.03Mauritius 325 307 229 28.02 26.14 19.31Moldova, Republic of 510 513 477 11.86 11.96 11.14Morocco 713 118 71 2.56 0.42 0.25Netherlands 2,979 3,326 3,217 18.97 21.05 20.23New Zealand 11 7 9 0.29 0.18 0.23Norway 339 416 446 7.65 9.33 9.93Pakistan 41 41 92 0.03 0.03 0.07Palestinian Territory, occupied 11 2
Page 83 of 316Population Source: World Bank

POLICE3. Persons brought into initial formal contact with the police and/or criminal justice system by type of crime, where initial formal contact might include being suspected, arrested, cautioned etc.
03.15 5e EMBSUSEmbezzlement suspects
1998 1999 2000 1998 1999 2000Count Rate per 100,000 inhabitants
CountryPanama 222 196 8.03 6.97Portugal 2,653 2,619 26.62 26.22Qatar 1 0.18Romania 33 11 12 0.15 0.05 0.05Russian Federation 26,058 24,016 25,284 17.73 16.45 17.32Saudi Arabia 360 371 433 1.83 1.84 2.09Singapore 298 287 228 7.60 7.26 5.67Slovenia 78 3.92Spain 1,467 1,503 1,525 3.72 3.81 3.86Sweden 466 418 473 5.26 4.72 5.33Thailand 13,824 11,840 12,846 23.12 19.67 21.16Tunisia 143 150 132 1.53 1.59 1.38Ukraine 9,539 9,186 8,501 18.96 18.41 17.17United States of America 17,100 17,300 6.22 6.22Uruguay 560 535 545 17.03 16.15 16.33Venezuela 1,151 623 86 4.96 2.63 0.36
Page 84 of 316Population Source: World Bank

POLICE3. Persons brought into initial formal contact with the police and/or criminal justice system by type of crime, where initial formal contact might include being suspected, arrested, cautioned etc.
03.16 5e DRGSUSTotal drug crime suspects
1998 1999 2000 1998 1999 2000Count Rate per 100,000 inhabitants
CountryAzerbaijan 1,865 1,757 1,384 23.57 22.01 17.19Belarus 1,793 1,554 2,062 17.75 15.54 20.62Bulgaria 791 839 456 9.58 10.22 5.58Canada 44,153 49,533 54,580 146.20 162.40 177.21Chile 12,285 15,785 17,786 83.01 105.23 117.01Colombia 20,677 22,952 27,877 50.68 55.31 65.90Czech Republic 1,355 1,436 1,815 13.16 13.94 17.62Denmark 724 609 569 13.66 11.45 10.66England & Wales 115,073 105,979 219.49 201.14Estonia 131 194 637 9.32 13.99 46.53Finland 9,594 12,123 14,332 186.18 234.71 276.84Germany 177,170 185,413 202,291 216.06 225.84 246.10Greece 10,186 10,199 5,439 97.01 97.13 51.31Hong Kong, China (SAR) 3,372 2,829 2,859 50.74 42.09 42.06Hungary 1,733 2,598 3,064 17.16 25.72 30.64Iceland 635 917 698 231.75 330.45 248.40India 21,328 22,866 2.18 2.29Ireland 5,984 7,137 161.21 190.22Italy 50,257 53,790 48,898 87.25 93.39 84.75Jamaica 6,718 8,872 259.38 336.95Japan 18,499 19,764 20,382 14.68 15.56 16.05Kazakhstan 15,720 18,947 38,439 104.11 127.16 257.98Korea, Republic of 3,920 5,435 5,395 8.45 11.59 11.41Kyrgyzstan 2,980 2,984 3,238 62.12 61.34 65.88Latvia 239 251 392 9.76 10.41 16.53Lithuania 422 442 570 11.40 11.95 15.43Macedonia, FYR 264 427 605 13.10 21.17 29.79Malaysia 14,956 14,445 15,918 67.37 63.63 68.32Mauritius 2,010 1,107 1,429 173.32 94.26 120.47
Page 85 of 316Population Source: World Bank

POLICE3. Persons brought into initial formal contact with the police and/or criminal justice system by type of crime, where initial formal contact might include being suspected, arrested, cautioned etc.
03.16 5e DRGSUSTotal drug crime suspects
1998 1999 2000 1998 1999 2000Count Rate per 100,000 inhabitants
CountryMoldova, Republic of 543 1,355 1,553 12.63 31.59 36.27Montserrat 13 37 44Morocco 24,081 26,070 24,600 86.62 92.45 85.71Netherlands 11,863 11,500 11,644 75.56 72.78 73.23New Zealand 25,446 24,557 23,988 671.01 644.42 626.19Norway 6,550 8,050 9,252 147.79 180.49 206.01Pakistan 151 294 409 0.11 0.22 0.30Palestinian Territory, occupied 383 456 454Panama 2,998 3,115 108.47 110.81Papua New Guinea 1,196 745 992 24.49 14.88 19.34Paraguay 110 164 102 2.11 3.06 1.86Poland 5,018 4,777 6,639 12.97 12.34 17.16Portugal 10,216 11,381 102.49 113.94Qatar 232 303 337 42.49 53.62 57.62Romania 622 353 414 2.76 1.57 1.85Russian Federation 124,869 139,272 159,385 84.94 95.39 109.17Saudi Arabia 10,465 13,838 15,297 53.12 68.50 73.90Slovenia 543 27.31Spain 19,640 17,780 16,685 49.85 45.13 42.24Swaziland 1,243 1,161 1,322 125.50 113.88 126.51Sweden 11,490 10,400 12,545 129.80 117.42 141.45Thailand 225,252 238,621 260,354 376.68 396.38 428.92Tunisia 1,134 1,114 1,730 12.15 11.78 18.09Turkey 5,952 5,992 6,289 9.39 9.32 9.63Ukraine 30,644 32,087 32,682 60.92 64.30 66.02United States of America 1,559,100 1,557,100 566.95 560.11Uruguay 66 307 377 2.01 9.27 11.30Venezuela 15,546 10,009 1,641 67.01 42.23 6.78Zambia 317 304 399 3.28 3.08 3.95
Page 86 of 316Population Source: World Bank

POLICE3. Persons brought into initial formal contact with the police and/or criminal justice system by type of crime, where initial formal contact might include being suspected, arrested, cautioned etc.
03.17 5e BRISUSBribery/corruption suspects
1998 1999 2000 1998 1999 2000Count Rate per 100,000 inhabitants
CountryAzerbaijan 37 31 24 0.47 0.39 0.30Belarus 257 279 296 2.54 2.79 2.96Bulgaria 81 118 44 0.98 1.44 0.54Chile 29 36 46 0.20 0.24 0.30Colombia 26 38 60 0.06 0.09 0.14Czech Republic 146 32 18 1.42 0.31 0.17Estonia 32 57 48 2.28 4.11 3.51Hong Kong, China (SAR) 374 489 605 5.63 7.28 8.90Hungary 455 426 475 4.50 4.22 4.75Iceland 5 1.80India 2,667 2,986 0.27 0.30Ireland 2 1 0.05 0.03Japan 226 169 163 0.18 0.13 0.13Kazakhstan 161 411 380 1.07 2.76 2.55Korea, Republic of 1,124 9,272 1,344 2.42 19.77 2.84Kyrgyzstan 109 99 103 2.27 2.04 2.10Latvia 25 42 67 1.02 1.74 2.82Lithuania 54 72 54 1.46 1.95 1.46Macedonia, FYR 12 91 44 0.60 4.51 2.17Mauritius 3 10 4 0.26 0.85 0.34Moldova, Republic of 37 34 86 0.86 0.79 2.01New Zealand 7 5 5 0.18 0.13 0.13Pakistan 5 30 0.00 0.02Panama 19 17 0.69 0.60Poland 702 491 675 1.81 1.27 1.74Portugal 386 344 3.87 3.44Qatar 32 11 5.86 1.95Romania 3,816 5,390 6,353 16.96 23.96 28.36Russian Federation 2,803 2,921 3,481 1.91 2.00 2.38
Page 87 of 316Population Source: World Bank
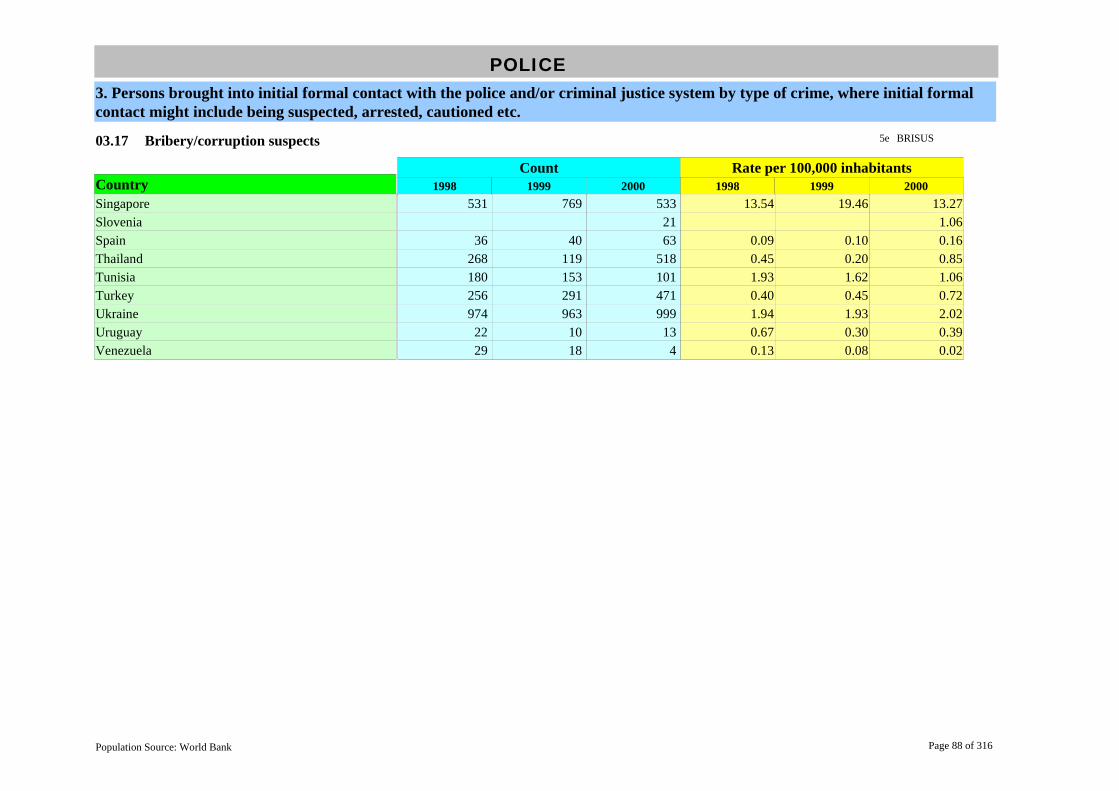
POLICE3. Persons brought into initial formal contact with the police and/or criminal justice system by type of crime, where initial formal contact might include being suspected, arrested, cautioned etc.
03.17 5e BRISUSBribery/corruption suspects
1998 1999 2000 1998 1999 2000Count Rate per 100,000 inhabitants
CountrySingapore 531 769 533 13.54 19.46 13.27Slovenia 21 1.06Spain 36 40 63 0.09 0.10 0.16Thailand 268 119 518 0.45 0.20 0.85Tunisia 180 153 101 1.93 1.62 1.06Turkey 256 291 471 0.40 0.45 0.72Ukraine 974 963 999 1.94 1.93 2.02Uruguay 22 10 13 0.67 0.30 0.39Venezuela 29 18 4 0.13 0.08 0.02
Page 88 of 316Population Source: World Bank

POLICE4. Persons brought into formal contact with the criminal justice system, by sex and age group, where formal contact might include being suspected, arrested, cautioned etc.
04.01 5f TFSUSPTotal female suspects
1998 1999 2000 1998 1999 2000Count Rate per 100,000 inhabitants
CountryAzerbaijan 1,262 1,076 1,155 15.95 13.48 14.35Belarus 13,338 13,460 12,064 132.06 134.60 120.64Bulgaria 8,772 8,981 6,846 106.24 109.42 83.83Canada 101,395 99,042 100,821 335.75 324.73 327.34Chile 48,468 56,167 61,715 327.49 374.45 406.02Colombia 10,106 11,693 12,743 24.77 28.18 30.13Côte d'Ivoire 661 4.13Czech Republic 13,662 14,298 15,483 132.64 138.82 150.32Denmark 10,942 10,541 9,828 206.41 198.18 184.18England & Wales 349,653 663.61Estonia 949 1,006 1,116 67.50 72.55 81.52Finland 32,743 47,648 53,466 635.42 922.52 1,032.76Germany 539,375 527,816 528,972 657.77 642.89 643.52Holy See (Vatican City State) 5 2Hong Kong, China (SAR) 7,467 7,598 8,672 112.36 113.05 127.59Hungary 17,842 17,913 16,719 176.65 177.36 167.19Iceland 634 621 830 231.39 223.78 295.37India 143,551 145,656 14.65 14.59Japan 72,723 64,922 63,378 57.72 51.12 49.90Korea, Republic of 288,940 313,566 290,931 622.72 668.58 615.08Kyrgyzstan 2,626 2,383 2,397 54.74 48.99 48.77Latvia 1,763 1,783 1,874 71.99 73.98 79.01Lithuania 3,428 3,261 2,516 92.57 88.16 68.09Mauritius 3,931 3,618 3,803 338.96 308.07 320.62Moldova, Republic of 1,783 1,893 2,080 41.47 44.13 48.58Montserrat 9 7 8Morocco 67,300 56,628 242.09 200.81Netherlands 31,344 31,634 31,421 199.64 200.22 197.62New Zealand 36,467 35,105 37,272 961.63 921.22 972.96
Page 89 of 316Population Source: World Bank

POLICE4. Persons brought into formal contact with the criminal justice system, by sex and age group, where formal contact might include being suspected, arrested, cautioned etc.
04.01 5f TFSUSPTotal female suspects
1998 1999 2000 1998 1999 2000Count Rate per 100,000 inhabitants
CountryNorway 4,176 4,576 5,341 94.22 102.60 118.93Pakistan 7 9 10 0.01 0.01 0.01Panama 6,019 6,770 217.76 240.84Paraguay 384 542 451 7.36 10.11 8.21Portugal 37,342 35,753 374.62 357.92Qatar 339 390 371 62.09 69.01 63.43Romania 41,448 32,374 30,636 184.21 143.88 136.77Russian Federation 218,224 260,674 284,068 148.45 178.54 194.57Saudi Arabia 2,436 2,672 1,804 12.37 13.23 8.71Singapore 3,626 3,181 3,442 92.43 80.49 85.66Slovenia 2,599 130.73Spain 34,101 37,910 28,461 86.55 96.22 72.05Sri Lanka 26,714 28,462 31,361 142.10 149.80 161.65Swaziland 8,612 7,188 6,093 869.49 705.07 583.06Sweden 16,644 12,243 15,462 188.03 138.22 174.34Thailand 20,067 153,748 144,759 33.56 255.40 238.48Tunisia 12,587 12,224 11,893 134.86 129.27 124.36Turkey 29,929 31,432 33,113 47.21 48.88 50.71Ukraine 57,499 52,847 46,019 114.31 105.91 92.97United States of America 1,951,413 1,630,160 709.60 586.39Uruguay 14,954 13,286 13,275 454.67 401.03 397.81Venezuela 7,885 4,851 921 33.99 20.47 3.81Yemen 180 187 1.08 1.10Zambia 3,925 4,231 3,052 40.61 42.82 30.22
Page 90 of 316Population Source: World Bank

POLICE4. Persons brought into formal contact with the criminal justice system, by sex and age group, where formal contact might include being suspected, arrested, cautioned etc.
04.02 5f TMSUSPTotal male suspects
1998 1999 2000 1998 1999 2000Count Rate per 100,000 inhabitants
CountryAzerbaijan 11,488 10,832 10,435 145.18 135.69 129.64Belarus 51,988 54,829 56,161 514.73 548.29 561.61Bulgaria 70,210 65,484 55,175 850.31 797.81 675.59Canada 443,755 438,078 446,679 1,469.39 1,436.32 1,450.26Chile 545,299 648,551 641,415 3,684.45 4,323.67 4,219.84Colombia 120,537 135,562 144,067 295.43 326.66 340.58Côte d'Ivoire 7,344 45.90Czech Republic 115,609 113,589 114,751 1,122.42 1,102.81 1,114.09Denmark 44,635 42,906 42,625 842.01 806.66 798.82Estonia 9,001 10,186 12,181 640.17 734.57 889.77Finland 179,938 279,432 296,068 3,491.91 5,410.11 5,718.91Germany 1,780,520 1,735,324 1,757,400 2,171.37 2,113.67 2,137.96Holy See (Vatican City State) 10 9Hong Kong, China (SAR) 32,955 33,147 32,258 495.89 493.21 474.59Hungary 122,222 113,695 106,047 1,210.12 1,125.69 1,060.47Iceland 3,226 3,916 3,786 1,177.37 1,411.17 1,347.33India 2,507,865 2,455,220 255.90 246.01Japan 251,540 250,433 246,271 199.63 197.19 193.91Korea, Republic of 1,574,056 1,612,592 1,606,484 3,392.36 3,438.36 3,396.37Kyrgyzstan 19,182 19,983 20,962 399.87 410.78 426.49Latvia 15,713 15,583 16,317 641.61 646.60 687.90Lithuania 21,945 21,899 22,530 592.63 592.02 609.74Mauritius 25,684 25,277 25,475 2,214.65 2,152.33 2,147.72Moldova, Republic of 13,437 14,003 16,228 312.56 326.41 378.98Montserrat 53 101 90Morocco 493,954 591,736 1,776.81 2,098.35Netherlands 235,509 235,613 236,752 1,500.06 1,491.22 1,489.01New Zealand 156,605 153,896 159,809 4,129.66 4,038.52 4,171.69Norway 24,405 26,939 28,854 550.65 604.01 642.48
Page 91 of 316Population Source: World Bank

POLICE4. Persons brought into formal contact with the criminal justice system, by sex and age group, where formal contact might include being suspected, arrested, cautioned etc.
04.02 5f TMSUSPTotal male suspects
1998 1999 2000 1998 1999 2000Count Rate per 100,000 inhabitants
CountryPakistan 6,288 5,441 9,206 4.76 4.03 6.67Panama 45,671 48,162 1,652.35 1,713.34Paraguay 2,352 2,253 2,541 45.07 42.04 46.23Portugal 189,941 202,150 1,905.51 2,023.73Qatar 5,278 5,739 6,035 966.67 1,015.55 1,031.82Romania 222,491 206,972 208,708 988.85 919.88 931.73Russian Federation 1,263,279 1,456,005 1,457,371 859.37 997.26 998.20Saudi Arabia 26,121 29,355 33,046 132.59 145.32 159.64Singapore 15,384 14,166 14,366 392.15 358.45 357.54Slovenia 16,077 808.70Spain 264,034 276,880 260,543 670.14 702.74 659.60Sri Lanka 246,955 254,196 278,842 1,313.59 1,337.87 1,437.33Swaziland 26,060 26,378 28,150 2,631.10 2,587.42 2,693.78Sweden 69,208 57,141 71,195 781.85 645.12 802.74Thailand 1,090,619 1,041,042 977,838 1,823.78 1,729.31 1,610.94Tunisia 120,861 118,622 124,326 1,294.94 1,254.48 1,300.01Turkey 322,589 316,020 293,457 508.82 491.48 449.40Ukraine 272,568 264,148 263,038 541.88 529.35 531.39United States of America 7,026,568 5,791,429 2,555.12 2,083.25Uruguay 53,951 53,522 56,552 1,640.35 1,615.51 1,694.70Venezuela 102,485 61,843 14,856 441.75 260.94 61.39Yemen 10,947 13,141 65.95 77.30Zambia 28,135 29,357 26,602 291.08 297.10 263.39
Page 92 of 316Population Source: World Bank

POLICE4. Persons brought into formal contact with the criminal justice system, by sex and age group, where formal contact might include being suspected, arrested, cautioned etc.
04.03 5f ADSUSPTotal adult suspects
1998 1999 2000 1998 1999 2000Count Rate per 100,000 inhabitants
CountryAzerbaijan 12,172 11,332 11,033 153.82 141.95 137.07Belarus 57,385 60,160 60,456 568.17 601.60 604.56Bulgaria 69,468 65,615 53,879 841.32 799.40 659.72Canada 427,608 426,063 433,902 1,415.92 1,396.93 1,408.77Chile 544,876 644,267 635,609 3,681.59 4,295.11 4,181.64Colombia 124,442 140,591 149,296 305.00 338.77 352.95Côte d'Ivoire 8,005 50.03Czech Republic 109,898 108,909 112,430 1,066.97 1,057.37 1,091.55Denmark 50,306 48,441 46,719 948.99 910.72 875.54Estonia 8,171 9,368 11,377 581.14 675.58 831.04Finland 184,667 292,523 308,768 3,583.68 5,663.56 5,964.23Germany 1,864,708 1,815,733 1,846,071 2,274.03 2,211.61 2,245.83Holy See (Vatican City State) 15 11Hong Kong, China (SAR) 27,975 28,221 28,236 420.96 419.91 415.42Hungary 127,198 120,068 111,685 1,259.39 1,188.79 1,116.85Iceland 3,466 4,226 4,238 1,264.96 1,522.88 1,508.19India 2,639,480 2,589,005 269.33 259.42Italy 674,488 683,658 556,689 1,170.99 1,186.91 964.80Japan 166,878 173,634 177,313 132.44 136.72 139.62Korea, Republic of 1,711,613 1,784,639 1,754,397 3,688.82 3,805.20 3,709.08Kyrgyzstan 20,128 20,659 21,651 419.60 424.68 440.51Latvia 14,446 14,572 14,964 589.87 604.65 630.86Lithuania 22,051 21,821 21,468 595.49 589.92 581.00Macedonia, FYR 15,520 14,232 14,258 770.22 705.60 702.02Malaysia 23,914 23,770 25,844 107.72 104.71 110.92Mauritius 26,020 25,420 25,539 2,243.63 2,164.51 2,153.12Moldova, Republic of 12,845 13,572 15,443 298.79 316.36 360.65Montserrat 61 94 98Morocco 2,720 2,200 9.78 7.80
Page 93 of 316Population Source: World Bank

POLICE4. Persons brought into formal contact with the criminal justice system, by sex and age group, where formal contact might include being suspected, arrested, cautioned etc.
04.03 5f ADSUSPTotal adult suspects
1998 1999 2000 1998 1999 2000Count Rate per 100,000 inhabitants
CountryNetherlands 220,481 218,287 221,012 1,404.34 1,381.56 1,390.01New Zealand 151,760 145,642 151,593 4,001.90 3,821.92 3,957.22Norway 23,595 25,707 27,564 532.38 576.39 613.76Pakistan 6,293 5,446 9,213 4.77 4.03 6.68Palestinian Territory, occupied 8,794 9,446 6,245Panama 45,696 47,674 1,653.26 1,695.98Portugal 183,420 196,787 1,840.09 1,970.04Qatar 5,537 5,957 6,221 1,014.10 1,054.13 1,063.62Romania 236,557 223,227 223,833 1,051.36 992.12 999.25Russian Federation 1,316,716 1,533,232 1,563,588 895.73 1,050.16 1,070.95Singapore 16,602 15,699 16,210 423.20 397.24 403.43Slovenia 15,739 791.70Spain 275,187 289,460 261,887 698.44 734.67 663.01Sri Lanka 263,812 276,233 299,326 1,403.26 1,453.86 1,542.92Sweden 730 61,204 75,184 8.25 690.99 847.72Thailand 1,080,330 1,165,424 1,095,486 1,806.57 1,935.92 1,804.75Tunisia 125,641 124,152 128,892 1,346.16 1,312.96 1,347.75Ukraine 301,800 288,887 279,442 600.00 578.93 564.53United States of America 7,368,678 6,126,052 2,679.52 2,203.62Uruguay 55,980 54,536 55,660 1,702.04 1,646.12 1,667.97Venezuela 97,721 57,177 13,141 421.21 241.25 54.30Yemen 11,004 13,166 66.29 77.45Zambia 31,049 32,567 28,808 321.23 329.59 285.23
Page 94 of 316Population Source: World Bank

POLICE4. Persons brought into formal contact with the criminal justice system, by sex and age group, where formal contact might include being suspected, arrested, cautioned etc.
04.04 5f AFSUSPAdult female suspects
1998 1999 2000 1998 1999 2000Count Rate per 100,000 inhabitants
CountryAzerbaijan 1,232 1,061 1,140 15.57 13.29 14.16Belarus 11,717 11,858 10,690 116.01 118.58 106.90Bulgaria 7,719 7,939 5,895 93.48 96.72 72.18Canada 74,969 74,121 75,032 248.24 243.02 243.61Chile 40,996 46,539 51,628 277.00 310.26 339.66Czech Republic 12,222 12,890 13,881 118.66 125.15 134.77Denmark 9,905 9,541 8,820 186.85 179.38 165.29Estonia 774 842 930 55.05 60.72 67.93Finland 27,827 41,686 46,294 540.02 807.09 894.22Germany 416,183 407,584 412,496 507.54 496.45 501.82Hong Kong, China (SAR) 5,014 5,352 6,046 75.45 79.63 88.95Hungary 16,469 16,538 15,473 163.06 163.74 154.73Iceland 528 534 743 192.70 192.43 264.41India 140,433 142,679 14.33 14.30Japan 32,609 33,324 33,675 25.88 26.24 26.52Korea, Republic of 274,161 295,759 272,760 590.86 630.62 576.66Kyrgyzstan 2,490 2,267 2,260 51.91 46.60 45.98Latvia 1,467 1,535 1,626 59.90 63.69 68.55Lithuania 3,248 3,101 2,338 87.71 83.83 63.27Mauritius 3,376 3,080 3,234 291.10 262.26 272.65Moldova, Republic of 1,639 1,737 1,900 38.13 40.49 44.37Montserrat 9 7 8Morocco 67,300 56,628 242.09 200.81Netherlands 25,422 25,015 25,162 161.92 158.32 158.25New Zealand 27,408 25,226 26,831 722.75 661.98 700.40Norway 3,454 3,702 4,272 77.93 83.00 95.12Pakistan 7 9 10 0.01 0.01 0.01Palestinian Territory, occupied 126Panama 4,866 5,305 176.05 188.72
Page 95 of 316Population Source: World Bank

POLICE4. Persons brought into formal contact with the criminal justice system, by sex and age group, where formal contact might include being suspected, arrested, cautioned etc.
04.04 5f AFSUSPAdult female suspects
1998 1999 2000 1998 1999 2000Count Rate per 100,000 inhabitants
CountryQatar 338 390 371 61.90 69.01 63.43Russian Federation 205,358 245,602 268,836 139.70 168.22 184.13Saudi Arabia 86,880 8,184 4,252 441.02 40.51 20.54Singapore 2,944 2,704 2,889 75.04 68.42 71.90Slovenia 2,235 112.42Spain 32,160 35,893 26,282 81.62 91.10 66.54Sri Lanka 25,394 27,690 28,784 135.07 145.74 148.37Swaziland 7,124 6,193 5,069 719.26 607.47 485.07Thailand 15,490 149,270 140,134 25.90 247.96 230.86Tunisia 11,456 11,225 10,804 122.74 118.71 112.97Ukraine 55,413 50,967 44,163 110.17 102.14 89.22United States of America 1,523,646 1,274,593 554.05 458.49Uruguay 12,845 11,499 11,255 390.54 347.09 337.28Venezuela 6,759 4,112 770 29.13 17.35 3.18Yemen 178 175 1.07 1.03Zambia 3,804 4,096 2,947 39.36 41.45 29.18
Page 96 of 316Population Source: World Bank

POLICE4. Persons brought into formal contact with the criminal justice system, by sex and age group, where formal contact might include being suspected, arrested, cautioned etc.
04.05 5f AMSUSPAdult male suspects
1998 1999 2000 1998 1999 2000Count Rate per 100,000 inhabitants
CountryAzerbaijan 10,940 10,271 9,893 138.25 128.66 122.91Belarus 45,668 48,302 49,766 452.16 483.02 497.66Bulgaria 61,749 57,676 47,984 747.84 702.68 587.54Canada 352,639 351,942 358,870 1,167.68 1,153.91 1,165.16Chile 503,880 597,728 583,981 3,404.59 3,984.85 3,841.98Czech Republic 97,676 97,019 98,549 948.31 941.93 956.79Denmark 40,401 38,900 37,899 762.14 731.34 710.25Estonia 7,397 8,526 10,447 526.09 614.85 763.11Finland 156,840 250,837 262,474 3,043.66 4,856.48 5,070.00Germany 1,448,525 1,408,149 1,433,575 1,766.49 1,715.16 1,744.01Hong Kong, China (SAR) 22,961 22,869 22,190 345.51 340.28 326.47Hungary 110,729 103,530 96,212 1,096.33 1,025.05 962.12Iceland 2,938 3,692 3,495 1,072.26 1,330.45 1,243.77India 2,499,047 2,446,326 255.00 245.12Japan 134,269 140,310 143,638 106.56 110.48 113.10Korea, Republic of 1,437,452 1,488,880 1,481,637 3,097.96 3,174.58 3,132.42Kyrgyzstan 17,638 18,392 19,391 367.69 378.08 394.53Latvia 12,979 13,037 13,338 529.97 540.95 562.31Lithuania 18,811 18,720 19,130 507.99 506.08 517.73Mauritius 22,644 22,340 22,305 1,952.52 1,902.25 1,880.47Moldova, Republic of 11,206 11,835 13,543 260.67 275.87 316.28Montserrat 52 87 96Morocco 493,954 591,736 1,776.81 2,098.35Netherlands 195,059 194,272 195,850 1,242.41 1,229.57 1,231.76New Zealand 124,325 120,389 124,736 3,278.44 3,159.24 3,256.13Norway 20,137 22,001 23,254 454.35 493.30 517.79Pakistan 6,286 5,437 9,203 4.76 4.03 6.67Palestinian Territory, occupied 6,119Panama 40,830 42,369 1,477.21 1,507.26
Page 97 of 316Population Source: World Bank
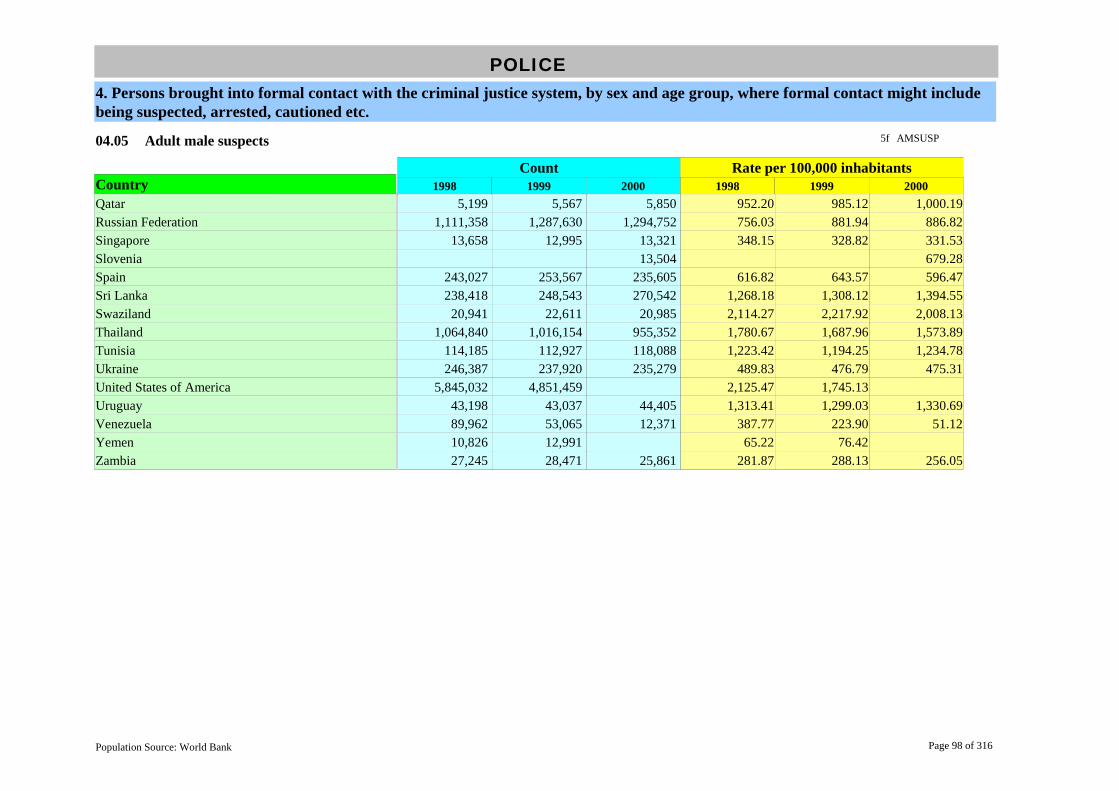
POLICE4. Persons brought into formal contact with the criminal justice system, by sex and age group, where formal contact might include being suspected, arrested, cautioned etc.
04.05 5f AMSUSPAdult male suspects
1998 1999 2000 1998 1999 2000Count Rate per 100,000 inhabitants
CountryQatar 5,199 5,567 5,850 952.20 985.12 1,000.19Russian Federation 1,111,358 1,287,630 1,294,752 756.03 881.94 886.82Singapore 13,658 12,995 13,321 348.15 328.82 331.53Slovenia 13,504 679.28Spain 243,027 253,567 235,605 616.82 643.57 596.47Sri Lanka 238,418 248,543 270,542 1,268.18 1,308.12 1,394.55Swaziland 20,941 22,611 20,985 2,114.27 2,217.92 2,008.13Thailand 1,064,840 1,016,154 955,352 1,780.67 1,687.96 1,573.89Tunisia 114,185 112,927 118,088 1,223.42 1,194.25 1,234.78Ukraine 246,387 237,920 235,279 489.83 476.79 475.31United States of America 5,845,032 4,851,459 2,125.47 1,745.13Uruguay 43,198 43,037 44,405 1,313.41 1,299.03 1,330.69Venezuela 89,962 53,065 12,371 387.77 223.90 51.12Yemen 10,826 12,991 65.22 76.42Zambia 27,245 28,471 25,861 281.87 288.13 256.05
Page 98 of 316Population Source: World Bank

POLICE4. Persons brought into formal contact with the criminal justice system, by sex and age group, where formal contact might include being suspected, arrested, cautioned etc.
04.06 5f JUSUSPTotal juvenile suspects
1998 1999 2000 1998 1999 2000Count Rate per 100,000 inhabitants
CountryAzerbaijan 578 576 557 7.30 7.22 6.92Belarus 7,941 8,129 7,769 78.62 81.29 77.69Bulgaria 6,974 6,245 5,770 84.46 76.08 70.65Canada 117,542 111,057 113,598 389.21 364.12 368.82Chile 48,891 60,451 67,521 330.34 403.01 444.22Colombia 6,201 6,664 7,514 15.20 16.06 17.76Côte d'Ivoire 581 3.63Czech Republic 19,373 17,978 17,804 188.09 174.54 172.85Denmark 5,271 5,006 5,734 99.43 94.12 107.46England & Wales 239,674 454.88Estonia 1,779 1,824 1,920 126.53 131.54 140.25Finland 28,014 34,557 40,766 543.64 669.06 787.44Germany 692,260 687,516 687,887 844.22 837.41 836.85Hong Kong, China (SAR) 12,447 12,524 12,694 187.30 186.35 186.76Hungary 12,866 11,540 11,081 127.39 114.26 110.81Iceland 394 311 378 143.80 112.07 134.52India 11,936 11,871 1.22 1.19Italy 17,083 16,541 14,382 29.66 28.72 24.93Japan 157,385 141,721 132,336 124.91 111.59 104.20Korea, Republic of 151,383 141,519 143,018 326.26 301.75 302.36Kyrgyzstan 1,680 1,708 1,713 35.02 35.11 34.85Latvia 3,030 2,794 3,227 123.72 115.93 136.05Lithuania 3,322 3,339 3,578 89.71 90.27 96.83Macedonia, FYR 6,447 7,056 5,339 319.95 349.83 262.88Malaysia 6,020 6,538 5,829 27.12 28.80 25.02Mauritius 3,595 3,475 3,739 309.99 295.90 315.22Moldova, Republic of 2,375 2,324 2,865 55.25 54.17 66.91Montserrat 1 14 2Morocco 8,309 11,267 29.89 39.95
Page 99 of 316Population Source: World Bank

POLICE4. Persons brought into formal contact with the criminal justice system, by sex and age group, where formal contact might include being suspected, arrested, cautioned etc.
04.06 5f JUSUSPTotal juvenile suspects
1998 1999 2000 1998 1999 2000Count Rate per 100,000 inhabitants
CountryNetherlands 46,372 47,960 47,161 295.36 303.54 296.61New Zealand 29,999 30,665 31,324 791.07 804.71 817.69Norway 4,991 5,812 6,671 112.61 130.31 148.54Pakistan 2 4 3 0.00 0.00 0.00Palestinian Territory, occupied 1,460 1,404 1,054Panama 5,994 7,258 216.86 258.20Paraguay 502 577 627 9.62 10.77 11.41Portugal 5,694 5,318 57.12 53.24Qatar 80 172 185 14.65 30.44 31.63Romania 27,382 16,119 16,511 121.70 71.64 73.71Russian Federation 164,787 183,447 177,851 112.10 125.65 121.82Singapore 2,408 1,648 1,598 61.38 41.70 39.77Slovenia 2,937 147.74Spain 22,948 25,330 27,117 58.24 64.29 68.65Sri Lanka 9,857 6,425 10,877 52.43 33.82 56.07Sweden 12,768 8,180 11,473 144.24 92.35 129.36Thailand 30,356 29,366 27,111 50.76 48.78 44.66Tunisia 7,807 6,694 7,327 83.65 70.79 76.61Ukraine 28,267 28,108 29,615 56.20 56.33 59.83United States of America 1,609,303 1,295,537 585.20 466.02Uruguay 12,925 12,272 14,167 392.98 370.42 424.54Venezuela 13,649 9,517 2,636 58.83 40.16 10.89Yemen 123 162 0.74 0.95Zambia 1,011 1,021 846 10.46 10.33 8.38
Page 100 of 316Population Source: World Bank

POLICE4. Persons brought into formal contact with the criminal justice system, by sex and age group, where formal contact might include being suspected, arrested, cautioned etc.
04.07 5f JFSUSPJuvenile female suspects
1998 1999 2000 1998 1999 2000Count Rate per 100,000 inhabitants
CountryAzerbaijan 30 15 15 0.38 0.19 0.19Belarus 1,621 1,602 1,374 16.05 16.02 13.74Bulgaria 600 582 507 7.27 7.09 6.21Canada 26,426 24,921 25,789 87.50 81.71 83.73Chile 7,472 9,628 10,087 50.49 64.19 66.36Czech Republic 1,440 1,408 1,602 13.98 13.67 15.55Denmark 1,037 1,000 1,008 19.56 18.80 18.89Dominica 5 2Estonia 175 164 186 12.45 11.83 13.59Finland 4,917 5,962 7,172 95.42 115.43 138.54Germany 167,002 164,692 163,227 203.66 200.60 198.57Hong Kong, China (SAR) 2,453 2,246 2,626 36.91 33.42 38.63Hungary 1,373 1,375 1,246 13.59 13.61 12.46Iceland 106 87 87 38.69 31.35 30.96India 3,118 2,977 0.32 0.30Japan 40,114 31,598 29,703 31.84 24.88 23.39Korea, Republic of 14,779 17,807 18,171 31.85 37.97 38.42Kyrgyzstan 136 116 137 2.84 2.38 2.79Latvia 296 248 248 12.09 10.29 10.46Lithuania 188 160 178 5.08 4.33 4.82Malaysia 78 87 90 0.35 0.38 0.39Mauritius 555 538 569 47.86 45.81 47.97Moldova, Republic of 144 156 180 3.35 3.64 4.20Morocco 1,533 1,866 5.51 6.62Netherlands 5,922 6,619 6,259 37.72 41.89 39.36New Zealand 6,444 6,647 7,189 169.93 174.43 187.66Norway 722 874 1,069 16.29 19.60 23.80Palestinian Territory, occupied 39 35 26Panama 1,153 1,465 41.71 52.12
Page 101 of 316Population Source: World Bank

POLICE4. Persons brought into formal contact with the criminal justice system, by sex and age group, where formal contact might include being suspected, arrested, cautioned etc.
04.07 5f JFSUSPJuvenile female suspects
1998 1999 2000 1998 1999 2000Count Rate per 100,000 inhabitants
CountryQatar 1 0.18Russian Federation 12,866 15,072 15,232 8.75 10.32 10.43Singapore 682 477 553 17.38 12.07 13.76Slovenia 364 18.31Spain 1,941 2,017 2,179 4.93 5.12 5.52Sri Lanka 1,320 772 2,577 7.02 4.06 13.28Swaziland 1,488 995 1,024 150.23 97.60 97.99Thailand 4,577 4,478 4,625 7.65 7.44 7.62Tunisia 1,131 999 1,089 12.12 10.56 11.39Ukraine 2,086 1,880 1,856 4.15 3.77 3.75United States of America 427,767 355,567 155.55 127.90Uruguay 2,172 1,787 2,020 66.04 53.94 60.53Venezuela 1,126 739 151 4.85 3.12 0.62Yemen 2 12 0.01 0.07Zambia 121 135 105 1.25 1.37 1.04
Page 102 of 316Population Source: World Bank

POLICE4. Persons brought into formal contact with the criminal justice system, by sex and age group, where formal contact might include being suspected, arrested, cautioned etc.
04.08 5f JMSUSPJuvenile male suspects
1998 1999 2000 1998 1999 2000Count Rate per 100,000 inhabitants
CountryAzerbaijan 548 561 542 6.93 7.03 6.73Belarus 6,320 6,527 6,395 62.57 65.27 63.95Bulgaria 6,374 5,663 5,263 77.20 68.99 64.44Canada 91,116 86,136 87,809 301.71 282.41 285.09Chile 41,419 50,823 57,434 279.86 338.82 377.86Czech Republic 17,933 16,570 16,202 174.11 160.87 157.30Denmark 4,234 4,006 4,726 79.87 75.31 88.57Dominica 78 21Estonia 1,604 1,660 1,734 114.08 119.71 126.66Finland 23,097 28,595 33,594 448.22 553.63 648.91Germany 525,258 522,824 524,660 640.56 636.81 638.27Hong Kong, China (SAR) 9,994 10,278 10,068 150.39 152.93 148.12Hungary 11,493 10,165 9,835 113.79 100.64 98.35Iceland 288 224 291 105.11 80.72 103.56India 8,818 8,894 0.90 0.89Japan 117,271 110,123 102,633 93.07 86.71 80.81Korea, Republic of 136,604 123,712 124,847 294.41 263.78 263.95Kyrgyzstan 1,544 1,592 1,576 32.19 32.73 32.07Latvia 2,734 2,546 2,979 111.64 105.64 125.59Lithuania 3,134 3,179 3,400 84.63 85.94 92.02Malaysia 5,942 6,451 5,739 26.77 28.42 24.63Mauritius 3,040 2,937 3,170 262.13 250.09 267.25Moldova, Republic of 2,231 2,168 2,685 51.90 50.54 62.70Montserrat 1 14 2Morocco 6,748 9,335 24.27 33.10Netherlands 40,450 41,341 40,902 257.64 261.65 257.25New Zealand 23,554 24,018 24,135 621.12 630.28 630.03Norway 4,268 4,938 5,600 96.30 110.72 124.69Pakistan 2 4 3 0.00 0.00 0.00
Page 103 of 316Population Source: World Bank

POLICE4. Persons brought into formal contact with the criminal justice system, by sex and age group, where formal contact might include being suspected, arrested, cautioned etc.
04.08 5f JMSUSPJuvenile male suspects
1998 1999 2000 1998 1999 2000Count Rate per 100,000 inhabitants
CountryPalestinian Territory, occupied 1,421 1,369 1,028Panama 4,841 5,793 175.14 206.08Qatar 79 172 185 14.47 30.44 31.63Russian Federation 151,921 168,375 162,619 103.35 115.33 111.38Saudi Arabia 11,404 13,044 11,404 57.89 64.57 55.09Singapore 1,726 1,171 1,045 44.00 29.63 26.01Slovenia 2,573 129.43Spain 21,007 23,313 29,938 53.32 59.17 75.79Sri Lanka 8,537 5,653 8,300 45.41 29.75 42.78Swaziland 5,119 3,767 7,165 516.83 369.51 685.65Thailand 25,779 24,888 22,486 43.11 41.34 37.04Tunisia 6,676 5,695 6,238 71.53 60.23 65.23Ukraine 26,181 26,228 27,759 52.05 52.56 56.08United States of America 1,181,536 939,970 429.65 338.12Uruguay 10,753 10,485 12,147 326.94 316.48 364.01Venezuela 12,523 8,778 2,485 53.98 37.04 10.27Yemen 121 150 0.73 0.88Zambia 890 886 741 9.21 8.97 7.34
Page 104 of 316Population Source: World Bank

PROSECUTION5. Prosecution personnel, by sex, and financial resources
05.01 5g TOTPROTotal prosecution personnel
1998 1999 2000 1998 1999 2000Count Rate per 100,000 inhabitants
CountryAzerbaijan 1,191 1,187 946 15.05 14.87 11.75Barbados 8 8 8 3.02 3.01 3.00Bulgaria 856 922 10.43 11.29Canada 3,131 10.37Chile 1 55 0.01 0.36China 156,924 168,780 171,189 12.66 13.50 13.59Colombia 18,548 17,867 44.69 42.24Costa Rica 444 450 500 12.15 12.06 13.12Croatia 333 342 376 7.57 7.82 8.58Czech Republic 874 888 918 8.49 8.62 8.91Denmark 509 532 539 9.60 10.00 10.10Dominica 2 3 2 2.74Dominican Republic 354 324 384 4.37 3.93 4.59Egypt 14,942 15,892 17,846 24.29 25.36 27.96El Salvador 1,422 1,476 1,381 23.56 23.99 22.00England & Wales 6,118 6,181 11.61 11.67Estonia 157 150 157 11.17 10.82 11.47Finland 265 305 315 5.14 5.91 6.08France 1,541 1,566 1,619 2.64 2.67 2.75Georgia 1,026 1,034 951 18.85 20.58 18.93Guatemala 1,627 2,007 2,136 15.06 18.08 18.74Holy See (Vatican City State) 5 5 5Hungary 1,251 1,275 1,312 12.39 12.62 13.12Iceland 34 12.10Ireland 59 67 64 1.59 1.79 1.69Japan 2,193 2,223 2,264 1.74 1.75 1.78Kazakhstan 2,223 1,999 3,254 14.72 13.42 21.84Korea, Republic of 1,105 1,134 1,187 2.38 2.42 2.51Kyrgyzstan 577 586 599 12.03 12.05 12.19Latvia 616 615 570 25.15 25.52 24.03
Page 105 of 316Population Source: World Bank

PROSECUTION5. Prosecution personnel, by sex, and financial resources
05.01 5g TOTPROTotal prosecution personnel
1998 1999 2000 1998 1999 2000Count Rate per 100,000 inhabitants
CountryLithuania 794 808 820 21.44 21.84 22.19Macedonia, FYR 172 169 172 8.54 8.38 8.47Mexico 13,496 13.77Moldova, Republic of 614 655 735 14.28 15.27 17.16Montserrat 2 2 2Pakistan 6 6 6 0.00 0.00 0.00Palestinian Territory, occupied 45 55 64Papua New Guinea 31 29 28 0.63 0.58 0.55Portugal 982 999 1,068 9.85 10.00 10.68Qatar 36 34 35 6.59 6.02 5.98Romania 2,009 2,007 2,099 8.93 8.92 9.37Russian Federation 43,813 44,373 30.01 30.39Singapore 137 141 152 3.49 3.57 3.78Slovakia 596 634 645 11.06 11.75 11.94Slovenia 164 169 166 8.27 8.51 8.35Spain 1,451 3.67Sweden 612 672 716 6.91 7.59 8.07Thailand 1,674 1,990 1,959 2.80 3.31 3.23Turkey 2,812 2,893 2,874 4.44 4.50 4.40United States of America 26,000 9.45Uruguay 386 395 422 11.74 11.92 12.65Zambia 25 21 18 0.26 0.21 0.18Zimbabwe 147 164 172 1.20 1.32 1.37
Page 106 of 316Population Source: World Bank

PROSECUTION5. Prosecution personnel, by sex, and financial resources
05.02 5g FEPROFemale prosecution personnel
1998 1999 2000 1998 1999 2000Count Rate per 100,000 inhabitants
CountryAzerbaijan 37 38 30 0.47 0.48 0.37Barbados 2 2 2 0.75 0.75 0.75Canada 1,860 6.16Chile 11 0.07China 28,351 31,653 32,911 2.29 2.53 2.61Colombia 8,306 19.64Czech Republic 501 518 529 4.86 5.03 5.14Denmark 253 263 273 4.77 4.94 5.12Dominica 1 2 2.74Dominican Republic 170 104 114 2.10 1.26 1.36Egypt 6,175 6,702 7,217 10.04 10.70 11.31El Salvador 611 677 645 10.12 11.00 10.28Estonia 105 99 111 7.47 7.14 8.11Finland 105 125 130 2.04 2.42 2.51France 540 552 594 0.92 0.94 1.01Georgia 76 76 75 1.40 1.51 1.49Hungary 687 706 728 6.80 6.99 7.28Iceland 5 1.78Ireland 27 31 29 0.73 0.83 0.76Japan 122 135 159 0.10 0.11 0.13Kazakhstan 507 438 773 3.36 2.94 5.19Korea, Republic of 16 21 29 0.03 0.04 0.06Latvia 344 344 325 14.05 14.27 13.70Lithuania 319 336 342 8.61 9.08 9.26Macedonia, FYR 58 59 61 2.88 2.93 3.00Moldova, Republic of 111 131 148 2.58 3.05 3.46Papua New Guinea 7 5 4 0.14 0.10 0.08Portugal 419 432 485 4.20 4.32 4.85Qatar 1 1 0.18 0.18Romania 728 888 906 3.24 3.95 4.04
Page 107 of 316Population Source: World Bank

PROSECUTION5. Prosecution personnel, by sex, and financial resources
05.02 5g FEPROFemale prosecution personnel
1998 1999 2000 1998 1999 2000Count Rate per 100,000 inhabitants
CountrySingapore 38 36 37 0.97 0.91 0.92Slovakia 265 298 310 4.92 5.52 5.74Slovenia 87 91 88 4.39 4.58 4.43Sweden 226 255 322 2.55 2.88 3.63Thailand 195 272 273 0.33 0.45 0.45Turkey 125 142 134 0.20 0.22 0.21Uruguay 254 261 279 7.72 7.88 8.36Zambia 18 14 11 0.19 0.14 0.11Zimbabwe 33 38 40 0.27 0.31 0.32
Page 108 of 316Population Source: World Bank

PROSECUTION5. Prosecution personnel, by sex, and financial resources
05.03 5g MAPROMale prosecution personnel
1998 1999 2000 1998 1999 2000Count Rate per 100,000 inhabitants
CountryAzerbaijan 1,154 1,149 916 14.58 14.39 11.38Barbados 6 6 6 2.26 2.25 2.25Canada 1,271 4.21Chile 1 44 0.01 0.29China 128,573 137,127 138,278 10.37 10.97 10.97Colombia 9,561 22.60Czech Republic 373 370 389 3.62 3.59 3.78Denmark 256 269 266 4.83 5.06 4.99Dominica 1 3Dominican Republic 184 220 270 2.27 2.67 3.22Egypt 8,768 9,189 10,529 14.25 14.67 16.50El Salvador 811 799 736 13.44 12.98 11.73Estonia 52 51 46 3.70 3.68 3.36Finland 160 180 185 3.10 3.48 3.57France 1,001 1,014 1,025 1.71 1.73 1.74Georgia 950 958 876 17.46 19.07 17.44Holy See (Vatican City State) 5 5 5Hungary 564 569 584 5.58 5.63 5.84Iceland 29 10.32Ireland 32 36 35 0.86 0.96 0.92Japan 2,071 2,088 2,105 1.64 1.64 1.66Kazakhstan 1,716 1,561 2,481 11.36 10.48 16.65Korea, Republic of 1,089 1,113 1,158 2.35 2.37 2.45Kyrgyzstan 517 10.52Latvia 272 271 244 11.11 11.24 10.29Lithuania 475 472 478 12.83 12.76 12.94Macedonia, FYR 114 110 111 5.66 5.45 5.47Moldova, Republic of 503 524 587 11.70 12.21 13.71Montserrat 2 2 2Pakistan 6 6 6 0.00 0.00 0.00
Page 109 of 316Population Source: World Bank

PROSECUTION5. Prosecution personnel, by sex, and financial resources
05.03 5g MAPROMale prosecution personnel
1998 1999 2000 1998 1999 2000Count Rate per 100,000 inhabitants
CountryPalestinian Territory, occupied 45 55 64Papua New Guinea 24 24 24 0.49 0.48 0.47Portugal 563 567 583 5.65 5.68 5.83Romania 1,281 1,119 1,193 5.69 4.97 5.33Singapore 99 105 115 2.52 2.66 2.86Slovakia 331 336 335 6.14 6.23 6.20Slovenia 77 78 78 3.88 3.93 3.92Sweden 386 417 394 4.36 4.71 4.44Thailand 1,479 1,718 1,681 2.47 2.85 2.77Turkey 2,687 2,751 2,740 4.24 4.28 4.20Uruguay 132 134 143 4.01 4.04 4.29Zambia 7 7 7 0.07 0.07 0.07Zimbabwe 114 126 132 0.93 1.02 1.05
Page 110 of 316Population Source: World Bank

PROSECUTION5. Prosecution personnel, by sex, and financial resources
05.04 5a PROBUDTotal prosecution budget/financial resources
1998 1999 2000 1998 1999 2000Count Rate per 100,000 inhabitants
CountryAzerbaijan 9,688 12,428 15,570 122.43 155.68 193.44Bulgaria 7,777 9,000 13,214 94.19 109.65 161.80Canada 278,284 921.47Chile 77 3,133 0.51 20.61Colombia 459,774 502,062 554,259 1,126.90 1,209.79 1,310.30Costa Rica 2,762 3,348 3,788 75.61 89.73 99.40Czech Republic 959 1,137 1,320 9.31 11.04 12.82Denmark 5,354 5,448 5,668 101.00 102.43 106.22Dominica 2 1 2 2.33Egypt 482,206 2,914,858 2,769,161 783.77 4,652.24 4,339.09El Salvador 129,881 162,794 166,833 2,152.14 2,645.45 2,658.27Estonia 50 57 53 3.56 4.11 3.87Finland 130 141 149 2.52 2.73 2.88Guatemala 256 253 318 2.37 2.28 2.79Hungary 9,242 11,024 12,464 91.50 109.15 124.64Iceland 115 123 122 41.97 44.32 43.42Ireland 8 10 10 0.22 0.26 0.27Japan 102,752 104,832 105,560 81.55 82.54 83.12Kazakhstan 1,775 1,489 1,838 11.75 10.00 12.34Korea, Republic of 223,250 224,966 298,574 481.14 479.67 631.23Kyrgyzstan 24 26 34 0.49 0.53 0.70Latvia 5 6 6 0.22 0.26 0.25Lithuania 70 63 61 1.88 1.71 1.65Macedonia, FYR 124,657,885 120,977,036 122,229,185 6,186,495.53 5,997,869.91 6,018,177.50Mexico 99,346 342,162 246,061 104.36 354.20 251.08Moldova, Republic of 10 12 14 0.22 0.29 0.33Montserrat 536,830Pakistan 6 6 6 0.00 0.00 0.00Papua New Guinea 12 20 23 0.25 0.40 0.45Portugal 2,516 1,413 1,805 25.24 14.15 18.05
Page 111 of 316Population Source: World Bank

PROSECUTION5. Prosecution personnel, by sex, and financial resources
05.04 5a PROBUDTotal prosecution budget/financial resources
1998 1999 2000 1998 1999 2000Count Rate per 100,000 inhabitants
CountryRomania 265,200 355,391 714,899 1,178.67 1,579.52 3,191.51Singapore 40 34 41 1.02 0.86 1.01Slovakia 515,939 559,330 633,502 9,570.98 10,367.33 11,727.63Slovenia 2 2 2 0.10 0.11 0.12Sweden 609 621 730 6.88 7.01 8.23Thailand 1,530 1,375 1,503 2.56 2.28 2.48Turkey 3,125,737 5,691,338 8,641,024 4,930.18 8,851.23 13,232.81Uruguay 98,778 109,454 128,778 3,003.28 3,303.77 3,859.09Zambia 2,000 4,000 4,800 20.69 40.48 47.52Zimbabwe 33 39 75 0.27 0.31 0.60
Page 112 of 316Population Source: World Bank

PROSECUTION6. Persons prosecuted, by type of crime
06.01 5g GTPROGrand total of persons prosecuted
1998 1999 2000 1998 1999 2000Count Rate per 100,000 inhabitants
CountryArmenia 6,435 6,536 6,789 169.57 171.95 178.52Barbados 3,778 3,595 4,643 1,424.05 1,351.10 1,738.95Belarus 66,259 67,741 68,526 656.03 677.41 685.26Bulgaria 29,051 30,530 31,533 351.83 371.95 386.10Canada 500,624 479,728 1,657.70 1,572.88China 584,763 672,367 708,836 47.16 53.79 56.26Colombia 425,689 1,025.76Costa Rica 85,926 88,843 91,444 2,352.17 2,381.17 2,399.48Croatia 50,539 47,160 47,860 1,149.51 1,078.06 1,092.69Cyprus 1,474 1,506 196.80 199.73Czech Republic 106,488 107,879 110,808 1,033.86 1,047.37 1,075.81Dominican Republic 12,170 9,027 147.73 107.81El Salvador 73,649 1,173.50England & Wales 1,934,338 1,866,683 3,689.52 3,542.77Estonia 9,950 11,192 13,297 707.67 807.11 971.29Finland 90,243 92,316 176,921 1,751.27 1,787.34 3,417.44Georgia 6,613 6,476 7,384 121.52 128.90 146.97Germany 706,230 697,257 861.26 849.28Guatemala 1,203 1,408 1,598 11.14 12.68 14.02Holy See (Vatican City State) 18 10 6Hong Kong, China (SAR) 26,192 25,235 26,961 394.13 375.48 396.66Hungary 140,083 131,658 122,860 1,386.96 1,303.54 1,228.60Iceland 2,804 2,306 2,532 1,023.36 830.99 901.07India 2,482,351 2,476,194 253.30 248.12Ireland 29,333 20,257 790.22 539.90Japan 1,128,503 1,129,774 1,035,182 895.64 889.59 815.10Korea, Republic of 1,196,363 1,194,863 1,200,986 2,578.37 2,547.68 2,539.08Kyrgyzstan 20,854 21,294 23,086 434.73 437.73 469.70Latvia 17,476 17,084 17,807 713.60 708.88 750.72Macedonia, FYR 22,714 21,382 22,035 1,127.25 1,060.09 1,084.93
Page 113 of 316Population Source: World Bank

PROSECUTION6. Persons prosecuted, by type of crime
06.01 5g GTPROGrand total of persons prosecuted
1998 1999 2000 1998 1999 2000Count Rate per 100,000 inhabitants
CountryMexico 54,403 61,424 63,724 57.15 63.59 65.02Moldova, Republic of 17,885 18,469 21,018 416.03 430.51 490.85Netherlands 212 206,278 1.35 1,305.56New Zealand 133,457 132,619 131,569 3,519.25 3,480.17 3,434.50Norway 12,150 12,554 13,130 274.14 281.48 292.36Pakistan 6,295 5,450 9,216 4.77 4.04 6.68Papua New Guinea 984 888 1,100 20.15 17.74 21.44Portugal 120,811 117,523 108,948 1,211.99 1,176.52 1,089.48Romania 99,920 75,743 68,483 444.09 336.64 305.73Russian Federation 1,351,492 1,552,617 1,521,214 919.38 1,063.44 1,041.93Singapore 16,276 16,028 17,167 414.89 405.57 427.25Slovakia 34,926 34,502 36,779 647.90 639.50 680.87Slovenia 22,152 24,889 26,526 1,117.32 1,253.54 1,334.31South Africa 924,894 1,024,010 1,206,584 2,234.04 2,432.33 2,819.12Sweden 137,314 127,239 136,535 1,551.26 1,436.53 1,539.46Thailand 808,584 747,825 742,394 1,352.15 1,242.23 1,223.05Turkey 1,881,986 2,151,025 2,968.43 3,345.30Ukraine 330,067 316,995 309,057 656.20 635.26 624.36United States of America 14,477,440 14,203,822 5,264.52 5,109.29Uruguay 6,322 189.45Zambia 316 330 263 3.27 3.34 2.60Zimbabwe 55,911 57,982 56,892 458.29 467.60 451.52
Page 114 of 316Population Source: World Bank

PROSECUTION6. Persons prosecuted, by type of crime
06.02 5g CIHPROTotal prosecuted for committed intentional homicide
1998 1999 2000 1998 1999 2000Count Rate per 100,000 inhabitants
CountryArmenia 92 119 102 2.42 3.13 2.68Barbados 21 30 18 7.92 11.27 6.74Belarus 1,430 1,293 1,392 14.16 12.93 13.92Bulgaria 131 178 143 1.59 2.17 1.75Canada 382 369 1.26 1.21Chile 4 0.03Costa Rica 224 245 238 6.13 6.57 6.25Croatia 380 365 292 8.64 8.34 6.67Cyprus 3 16 0.40 2.12Czech Republic 284 289 245 2.76 2.81 2.38Egypt 546 817 428 0.89 1.30 0.67El Salvador 610 9.72England & Wales 624 629 1.19 1.19Estonia 164 144 149 11.66 10.38 10.88Finland 81 95 83 1.57 1.84 1.60Georgia 147 133 153 2.70 2.65 3.05Germany 275 202 0.34 0.25Guatemala 230 315 329 2.13 2.84 2.89Hong Kong, China (SAR) 42 71 48 0.63 1.06 0.71Hungary 289 257 203 2.86 2.54 2.03Iceland 1 4 0.36 1.42India 75,415 74,124 7.70 7.43Ireland 26 27 0.70 0.72Japan 758 801 855 0.60 0.63 0.67Korea, Republic of 788 851 761 1.70 1.81 1.61Kyrgyzstan 678 567 525 14.13 11.66 10.68Latvia 219 185 157 8.94 7.68 6.62Macedonia, FYR 106 85 95 5.26 4.21 4.68Moldova, Republic of 357 387 413 8.30 9.02 9.65Netherlands 2,551 2,675 16.25 16.93
Page 115 of 316Population Source: World Bank

PROSECUTION6. Persons prosecuted, by type of crime
06.02 5g CIHPROTotal prosecuted for committed intentional homicide
1998 1999 2000 1998 1999 2000Count Rate per 100,000 inhabitants
CountryNew Zealand 36 39 35 0.95 1.02 0.91Norway 23 27 29 0.52 0.61 0.65Pakistan 191 158 198 0.14 0.12 0.14Papua New Guinea 51 59 65 1.04 1.18 1.27Portugal 200 197 222 2.01 1.97 2.22Romania 1,401 1,172 1,315 6.23 5.21 5.87Russian Federation 26,847 28,537 28,694 18.26 19.55 19.65Singapore 35 26 41 0.89 0.66 1.02Slovakia 102 111 128 1.89 2.06 2.37Slovenia 63 65 58 3.18 3.27 2.92South Africa 11,446 11,687 10,696 27.65 27.76 24.99Spain 1,129 1,316 1,145 2.87 3.34 2.90Sweden 60 71 78 0.68 0.80 0.88Thailand 3,654 3,516 3,417 6.11 5.84 5.63Turkey 13,571 14,073 21.41 21.89Ukraine 3,903 4,037 4,436 7.76 8.09 8.96Zambia 26 30 11 0.27 0.30 0.11Zimbabwe 1,055 964 948 8.65 7.77 7.52
Page 116 of 316Population Source: World Bank

PROSECUTION6. Persons prosecuted, by type of crime
06.03 5g AIHPROTotal prosecuted for attempted intentional homicide
1998 1999 2000 1998 1999 2000Count Rate per 100,000 inhabitants
CountryBulgaria 50 37 43 0.61 0.45 0.53Canada 409 374 1.35 1.23Costa Rica 129 175 211 3.53 4.69 5.54Cyprus 6 2 0.80 0.27Egypt 565 1,064 627 0.92 1.70 0.98El Salvador 507 8.08England & Wales 431 418 0.82 0.79Estonia 44 26 42 3.13 1.87 3.07Finland 68 68 88 1.32 1.32 1.70Georgia 70 67 76 1.29 1.33 1.51Germany 115 103 0.14 0.13Guatemala 5 7 7 0.05 0.06 0.06Hong Kong, China (SAR) 1 4 2 0.02 0.06 0.03Hungary 158 148 145 1.56 1.47 1.45Iceland 6 3 2.19 1.07India 70,279 71,028 7.17 7.12Ireland 5 5 0.13 0.13New Zealand 19 30 22 0.50 0.79 0.57Norway 19 20 22 0.43 0.45 0.49Pakistan 347 264 304 0.26 0.20 0.22Papua New Guinea 43 52 61 0.88 1.04 1.19Portugal 193 142 151 1.94 1.42 1.51Romania 753 620 614 3.35 2.76 2.74Singapore 3 0.07Slovakia 12 27 35 0.22 0.50 0.65South Africa 9,009 9,508 9,316 21.76 22.58 21.77Sweden 191 177 209 2.16 2.00 2.36Thailand 3,635 3,741 3,760 6.08 6.21 6.19Ukraine 359 346 391 0.71 0.69 0.79Zambia 6 9 7 0.06 0.09 0.07
Page 117 of 316Population Source: World Bank

PROSECUTION6. Persons prosecuted, by type of crime
06.03 5g AIHPROTotal prosecuted for attempted intentional homicide
1998 1999 2000 1998 1999 2000Count Rate per 100,000 inhabitants
CountryZimbabwe 856 666 546 7.02 5.37 4.33
Page 118 of 316Population Source: World Bank

PROSECUTION6. Persons prosecuted, by type of crime
06.04 6b IHFAPRTotal prosecuted for intentional homicide committed with a firearm
1998 1999 2000 1998 1999 2000Count Rate per 100,000 inhabitants
CountryHungary 41 48 45 0.41 0.48 0.45Iceland 1 0.36Ireland 1 6 0.03 0.16New Zealand 2 6 9 0.05 0.16 0.23Papua New Guinea 105 120 230 2.15 2.40 4.48Singapore 2 0.05Slovakia 22 21 13 0.41 0.39 0.24South Africa 10,830 11,113 10,258 26.16 26.40 23.97Sweden 47 47 40 0.53 0.53 0.45Zambia 270 278 233 2.79 2.81 2.31
Page 119 of 316Population Source: World Bank

PROSECUTION6. Persons prosecuted, by type of crime
06.05 5g NIHPROTotal prosecuted for non-intentional homicide
1998 1999 2000 1998 1999 2000Count Rate per 100,000 inhabitants
CountryArmenia 12 8 7 0.32 0.21 0.18Bulgaria 46 40 70 0.56 0.49 0.86Canada 138 119 0.46 0.39Chile 9 0.06Croatia 18 10 19 0.41 0.23 0.43Cyprus 1 0.13Dominican Republic 274 310 3.33 3.70Egypt 278 627 292 0.45 1.00 0.46El Salvador 591 9.42England & Wales 100 115 0.19 0.22Estonia 12 10 9 0.85 0.72 0.66Germany 1,026 963 1.25 1.17Guatemala 10 13 15 0.09 0.12 0.13Hong Kong, China (SAR) 10 5 8 0.15 0.07 0.12Hungary 36 37 22 0.36 0.37 0.22India 6,804 6,698 0.69 0.67Ireland 13 9 0.35 0.24Japan 247 291 283 0.20 0.23 0.22Latvia 16 12 16 0.65 0.50 0.67Macedonia, FYR 8 8 4 0.40 0.40 0.20Moldova, Republic of 36 24 24 0.84 0.56 0.56Netherlands 63 92 0.40 0.58New Zealand 48 31 24 1.27 0.81 0.63Norway 39 32 39 0.88 0.72 0.87Papua New Guinea 45 41 38 0.92 0.82 0.74Portugal 834 839 967 8.37 8.40 9.67Romania 185 173 174 0.82 0.77 0.78Singapore 12 9 11 0.31 0.23 0.27Slovakia 5,728 5,643 5,821 106.26 104.59 107.76Slovenia 1 0.05
Page 120 of 316Population Source: World Bank

PROSECUTION6. Persons prosecuted, by type of crime
06.05 5g NIHPROTotal prosecuted for non-intentional homicide
1998 1999 2000 1998 1999 2000Count Rate per 100,000 inhabitants
CountrySouth Africa 2,725 2,662 2,259 6.58 6.32 5.28Sweden 35 8 17 0.40 0.09 0.19Thailand 4,684 5,122 5,397 7.83 8.51 8.89Turkey 25,602 25,634 40.38 39.87Zambia 14 13 12 0.14 0.13 0.12Zimbabwe 675 103 374 5.53 0.83 2.97
Page 121 of 316Population Source: World Bank

PROSECUTION6. Persons prosecuted, by type of crime
06.06 5g MASPROTotal prosecuted for major assault
1998 1999 2000 1998 1999 2000Count Rate per 100,000 inhabitants
CountryBarbados 112 127 79 42.22 47.73 29.59Bulgaria 20 20 22 0.24 0.24 0.27Canada 26,607 25,784 88.10 84.54Chile 101 0.66Croatia 1,865 1,323 1,081 42.42 30.24 24.68Czech Republic 2,031 1,843 1,767 19.72 17.89 17.16Dominican Republic 1,458 942 17.70 11.25Egypt 491 902 208 0.80 1.44 0.33El Salvador 10,264 163.54England & Wales 8,120 7,883 15.49 14.96Estonia 209 227 229 14.86 16.37 16.73Finland 551 652 722 10.69 12.62 13.95Georgia 134 119 103 2.46 2.37 2.05Germany 28,738 29,444 35.05 35.86Guatemala 45 61 78 0.42 0.55 0.68Hungary 5,833 5,631 5,427 57.75 55.75 54.27Ireland 414 258 11.15 6.88Kyrgyzstan 299 238 263 6.23 4.89 5.35Macedonia, FYR 351 79 375 17.42 3.92 18.46New Zealand 2,266 2,202 2,370 59.75 57.78 61.87Norway 841 851 856 18.98 19.08 19.06Pakistan 483 462 469 0.37 0.34 0.34Papua New Guinea 50 32 42 1.02 0.64 0.82Portugal 533 413 407 5.35 4.13 4.07Romania 1,203 1,013 963 5.35 4.50 4.30Russian Federation 34,855 39,840 38,082 23.71 27.29 26.08Singapore 57 45 37 1.45 1.14 0.92Slovenia 776 776 686 39.14 39.08 34.51South Africa 89,482 99,153 110,680 216.14 235.52 258.60Spain 480,614 498,031 479,030 1,219.83 1,264.04 1,212.73
Page 122 of 316Population Source: World Bank

PROSECUTION6. Persons prosecuted, by type of crime
06.06 5g MASPROTotal prosecuted for major assault
1998 1999 2000 1998 1999 2000Count Rate per 100,000 inhabitants
CountrySweden 1,403 15.85Thailand 20,135 22,638 23,253 33.67 37.60 38.31Zambia 814 1,089 1,220 8.42 11.02 12.08Zimbabwe 3,665 2,434 2,210 30.04 19.63 17.54
Page 123 of 316Population Source: World Bank

PROSECUTION6. Persons prosecuted, by type of crime
06.07 5g TASPROTotal prosecuted for assault
1998 1999 2000 1998 1999 2000Count Rate per 100,000 inhabitants
CountryBarbados 605 685 697 228.04 257.44 261.05Belarus 1,908 2,087 2,260 18.89 20.87 22.60Bulgaria 682 654 1,173 8.26 7.97 14.36Canada 83,849 79,952 277.65 262.14Chile 343 2.26China 55,835 68,974 75,617 4.50 5.52 6.00Costa Rica 5,405 5,273 5,385 147.96 141.33 141.30Croatia 55 52 40 1.25 1.19 0.91Cyprus 59 62 7.88 8.22Czech Republic 12,073 11,455 9,544 117.21 111.21 92.66El Salvador 14,776 235.44England & Wales 125,128 129,820 238.67 246.38Estonia 289 247 258 20.55 17.81 18.85Finland 8,350 8,976 10,107 162.04 173.79 195.23Germany 70,041 74,877 85.42 91.20Guatemala 92 109 117 0.85 0.98 1.03Hong Kong, China (SAR) 2,882 2,496 2,681 43.37 37.14 39.44Hungary 6,529 6,201 6,008 64.64 61.40 60.08Iceland 241 206 199 87.96 74.23 70.82India 422,570 434,686 43.12 43.56Ireland 9,373 9,729 252.51 259.30Korea, Republic of 191,091 220,805 229,850 411.83 470.80 485.94Kyrgyzstan 299 238 263 6.23 4.89 5.35Latvia 1,917 1,756 1,749 78.28 72.86 73.74Macedonia, FYR 406 125 411 20.15 6.20 20.24Moldova, Republic of 337 355 375 7.84 8.28 8.76Netherlands 15,049 15,502 95.85 98.11New Zealand 13,389 13,003 12,865 353.07 341.22 335.83Norway 1,514 1,543 1,446 34.16 34.60 32.20Pakistan 623 583 631 0.47 0.43 0.46
Page 124 of 316Population Source: World Bank

PROSECUTION6. Persons prosecuted, by type of crime
06.07 5g TASPROTotal prosecuted for assault
1998 1999 2000 1998 1999 2000Count Rate per 100,000 inhabitants
CountryPapua New Guinea 20 17 12 0.41 0.34 0.23Portugal 10,888 12,948 16,270 109.23 129.62 162.70Romania 4,220 3,923 3,817 18.76 17.44 17.04Singapore 261 230 228 6.65 5.82 5.67Slovakia 4,137 4,059 3,981 76.74 75.23 73.70Slovenia 2,081 2,043 2,001 104.96 102.90 100.65South Africa 133,333 147,546 182,861 322.06 350.47 427.25Spain 481,325 498,664 479,833 1,221.64 1,265.64 1,214.77Sweden 12,071 11,496 11,707 136.37 129.79 132.00Turkey 162,748 161,841 256.70 251.70Ukraine 5,888 5,739 6,072 11.71 11.50 12.27Zambia 814 1,089 1,220 8.42 11.02 12.08Zimbabwe 10,384 4,483 4,343 85.11 36.15 34.47
Page 125 of 316Population Source: World Bank

PROSECUTION6. Persons prosecuted, by type of crime
06.08 5g RAPPROTotal prosecuted for rape
1998 1999 2000 1998 1999 2000Count Rate per 100,000 inhabitants
CountryArmenia 20 21 16 0.53 0.55 0.42Barbados 31 20 26 11.68 7.52 9.74Belarus 672 519 480 6.65 5.19 4.80Bulgaria 166 216 185 2.01 2.63 2.27Canada 7,525 6,662 24.92 21.84Chile 9 0.06China 27,490 28,060 26,581 2.22 2.24 2.11Costa Rica 1,137 1,224 1,341 31.12 32.81 35.19Croatia 122 104 112 2.77 2.38 2.56Cyprus 6 6 0.80 0.80Czech Republic 503 491 406 4.88 4.77 3.94Dominican Republic 261 242 3.17 2.89Egypt 258 207 692 0.42 0.33 1.08El Salvador 1,273 20.28England & Wales 2,185 2,169 4.17 4.12Estonia 45 31 40 3.20 2.24 2.92Finland 44 54 61 0.85 1.05 1.18Georgia 20 19 32 0.37 0.38 0.64Germany 2,401 2,480 2.93 3.02Guatemala 58 59 56 0.54 0.53 0.49Hong Kong, China (SAR) 38 48 34 0.57 0.71 0.50Hungary 225 191 172 2.23 1.89 1.72Iceland 5 3 5 1.82 1.08 1.78India 18,607 19,623 1.90 1.97Ireland 108 80 2.91 2.13Japan 1,071 966 1,242 0.85 0.76 0.98Korea, Republic of 2,574 2,679 2,627 5.55 5.71 5.55Kyrgyzstan 309 339 308 6.44 6.97 6.27Latvia 111 91 127 4.53 3.78 5.35Macedonia, FYR 41 31 34 2.03 1.54 1.67
Page 126 of 316Population Source: World Bank

PROSECUTION6. Persons prosecuted, by type of crime
06.08 5g RAPPROTotal prosecuted for rape
1998 1999 2000 1998 1999 2000Count Rate per 100,000 inhabitants
CountryMoldova, Republic of 279 276 254 6.49 6.43 5.93Netherlands 904 975 5.76 6.17New Zealand 465 493 480 12.26 12.94 12.53Norway 52 36 49 1.17 0.81 1.09Pakistan 72 177 60 0.05 0.13 0.04Papua New Guinea 78 93 105 1.60 1.86 2.05Portugal 109 96 114 1.09 0.96 1.14Romania 792 767 770 3.52 3.41 3.44Russian Federation 8,979 8,351 7,880 6.11 5.72 5.40Singapore 36 14 14 0.92 0.35 0.35Slovakia 165 149 155 3.06 2.76 2.87Slovenia 71 84 68 3.58 4.23 3.42South Africa 22,121 23,403 23,995 53.43 55.59 56.06Spain 539 388 416 1.37 0.98 1.05Sweden 243 369 339 2.75 4.17 3.82Thailand 2,693 3,019 2,951 4.50 5.01 4.86Turkey 22,566 23,795 35.59 37.01Ukraine 1,289 1,124 991 2.56 2.25 2.00Zambia 12 25 18 0.12 0.25 0.18Zimbabwe 4,105 2,778 2,632 33.65 22.40 20.89
Page 127 of 316Population Source: World Bank

PROSECUTION6. Persons prosecuted, by type of crime
06.09 5g ROBPROTotal prosecuted for robbery
1998 1999 2000 1998 1999 2000Count Rate per 100,000 inhabitants
CountryArmenia 65 54 78 1.71 1.42 2.05Barbados 54 113 66 20.35 42.47 24.72Belarus 3,858 4,132 4,511 38.20 41.32 45.11Bulgaria 1,065 947 1,372 12.90 11.54 16.80Canada 7,747 7,322 25.65 24.01Chile 80 0.53China 91,981 106,482 108,881 7.42 8.52 8.64Costa Rica 24,991 26,872 26,207 684.11 720.22 687.67Croatia 563 709 681 12.81 16.21 15.55Cyprus 13 20 1.74 2.65Czech Republic 2,590 2,400 2,294 25.15 23.30 22.27Dominican Republic 2,334 1,816 28.33 21.69El Salvador 3,466 55.23England & Wales 10,450 10,321 19.93 19.59Estonia 1,048 1,277 1,322 74.54 92.09 96.57Finland 433 477 588 8.40 9.24 11.36Georgia 212 172 231 3.90 3.42 4.60Germany 14,277 13,164 17.41 16.03Guatemala 165 153 217 1.53 1.38 1.90Hong Kong, China (SAR) 683 705 811 10.28 10.49 11.93Hungary 1,687 1,585 1,732 16.70 15.69 17.32Iceland 17 17 20 6.20 6.13 7.12India 49,157 46,922 5.02 4.70Ireland 555 424 14.95 11.30Japan 1,450 1,848 1,979 1.15 1.46 1.56Korea, Republic of 5,862 4,450 3,892 12.63 9.49 8.23Kyrgyzstan 803 809 906 16.74 16.63 18.43Latvia 1,064 915 986 43.45 37.97 41.57Macedonia, FYR 319 262 265 15.83 12.99 13.05Moldova, Republic of 1,089 1,083 970 25.33 25.24 22.65
Page 128 of 316Population Source: World Bank

PROSECUTION6. Persons prosecuted, by type of crime
06.09 5g ROBPROTotal prosecuted for robbery
1998 1999 2000 1998 1999 2000Count Rate per 100,000 inhabitants
CountryNetherlands 5,298 5,431 33.75 34.37New Zealand 1,003 934 886 26.45 24.51 23.13Norway 130 176 245 2.93 3.95 5.46Pakistan 397 362 245 0.30 0.27 0.18Papua New Guinea 70 65 82 1.43 1.30 1.60Portugal 1,652 1,533 1,930 16.57 15.35 19.30Romania 3,391 3,133 3,432 15.07 13.92 15.32Russian Federation 68,252 77,642 73,533 46.43 53.18 50.37Singapore 397 224 189 10.12 5.67 4.70Slovakia 1,244 1,225 1,235 23.08 22.71 22.86Slovenia 218 335 279 11.00 16.87 14.03South Africa 23,302 26,194 29,492 56.29 62.22 68.91Spain 769,227 802,356 723,964 1,952.35 2,036.44 1,832.82Sweden 734 817 1,002 8.29 9.22 11.30Thailand 1,997 1,796 1,502 3.34 2.98 2.47Turkey 8,681 9,932 13.69 15.45Ukraine 12,280 12,331 12,645 24.41 24.71 25.55Zambia 140 179 180 1.45 1.81 1.78Zimbabwe 2,455 2,090 2,540 20.12 16.85 20.16
Page 129 of 316Population Source: World Bank

PROSECUTION6. Persons prosecuted, by type of crime
06.10 5g MTFPROTotal prosecuted for major theft
1998 1999 2000 1998 1999 2000Count Rate per 100,000 inhabitants
CountryBarbados 250 233 211 94.23 87.57 79.03Canada 8,803 7,648 29.15 25.08Croatia 11,878 11,495 11,800 270.17 262.77 269.41Egypt 1,694 1,782 868 2.75 2.84 1.36El Salvador 7,517 119.77Finland 563 646 650 10.93 12.51 12.56Germany 8,756 9,445 10.68 11.50Guatemala 57 82 66 0.53 0.74 0.58Hungary 8,280 7,016 6,263 81.98 69.47 62.63Ireland 125 217 3.37 5.78Kyrgyzstan 6,262 7,406 7,959 130.54 152.24 161.93Latvia 794 558 278 32.42 23.15 11.72Macedonia, FYR 3,634 3,341 3,247 180.35 165.64 159.87Moldova, Republic of 248 378 350 5.77 8.81 8.17Norway 2,344 2,519 2,468 52.89 56.48 54.95Pakistan 140 165 60 0.11 0.12 0.04Papua New Guinea 40 38 53 0.82 0.76 1.03Portugal 5,388 5,147 5,872 54.05 51.53 58.72Romania 20,996 13,120 12,126 93.32 58.31 54.13Singapore 2,120 1,747 1,867 54.04 44.21 46.47Slovakia 19 218 1,052 0.35 4.04 19.48Slovenia 173 189 223 8.73 9.52 11.22Spain 693,618 742,896 1,760.45 1,885.52Zambia 1,126 1,424 1,625 11.65 14.41 16.09Zimbabwe 10,005 6,477 6,950 82.01 52.23 55.16
Page 130 of 316Population Source: World Bank

PROSECUTION6. Persons prosecuted, by type of crime
06.11 5g TFTPROTotal prosecuted for theft
1998 1999 2000 1998 1999 2000Count Rate per 100,000 inhabitants
CountryArmenia 1,400 1,296 1,182 36.89 34.10 31.08Barbados 508 460 574 191.48 172.88 214.98Belarus 23,313 25,507 25,934 230.82 255.07 259.34Bulgaria 16,478 13,306 15,540 199.56 162.11 190.28Canada 60,274 55,680 199.58 182.56Chile 186 1.22China 197,125 215,954 206,928 15.90 17.28 16.42Costa Rica 11,313 10,830 10,355 309.69 290.27 271.71Croatia 7,484 7,581 7,618 170.22 173.30 173.93Cyprus 335 313 44.73 41.51Czech Republic 28,188 28,261 29,096 273.67 274.38 282.49El Salvador 10,584 168.64England & Wales 126,965 134,067 242.17 254.45Estonia 1,988 2,147 2,481 141.39 154.83 181.23Finland 35,403 34,677 34,361 687.04 671.38 663.72Georgia 1,854 1,897 2,052 34.07 37.76 40.84Germany 175,844 165,723 214.44 201.86Guatemala 71 113 99 0.66 1.02 0.87Hong Kong, China (SAR) 7,503 7,744 8,314 112.90 115.23 122.32Hungary 36,620 31,324 26,618 362.57 310.14 266.18Iceland 265 267 348 96.72 96.22 123.84India 144,832 150,128 14.78 15.04Ireland 11,492 10,009 309.59 266.76Japan 969 1,071 1,242 0.77 0.84 0.98Korea, Republic of 17,659 21,797 21,088 38.06 46.48 44.58Kyrgyzstan 7,841 8,946 9,227 163.46 183.90 187.73Latvia 7,787 7,556 8,378 317.97 313.53 353.20Moldova, Republic of 8,995 9,226 11,353 209.23 215.06 265.13Netherlands 59,414 55,152 378.43 349.06New Zealand 9,356 9,627 9,711 246.72 252.63 253.50
Page 131 of 316Population Source: World Bank

PROSECUTION6. Persons prosecuted, by type of crime
06.11 5g TFTPROTotal prosecuted for theft
1998 1999 2000 1998 1999 2000Count Rate per 100,000 inhabitants
CountryNorway 3,437 3,610 3,858 77.55 80.94 85.91Pakistan 1,220 601 341 0.92 0.45 0.25Papua New Guinea 102 98 175 2.09 1.96 3.41Portugal 1,465 9,466 11,552 14.70 94.76 115.52Romania 28,895 18,011 16,640 128.42 80.05 74.29Russian Federation 527,369 677,113 640,941 358.75 463.78 439.00Singapore 3,330 2,542 2,712 84.88 64.32 67.50Slovakia 13,747 12,721 12,512 255.02 235.79 231.63Slovenia 3,878 4,794 5,379 195.60 241.45 270.57South Africa 75,763 81,983 89,800 183.00 194.73 209.81Sweden 19,450 18,227 18,853 219.73 205.78 212.57Thailand 46,513 44,883 45,146 77.78 74.56 74.38Turkey 153,657 142,020 242.36 220.87Ukraine 124,714 127,042 136,430 247.94 254.59 275.62Zambia 1,126 1,424 1,625 11.65 14.41 16.09
Page 132 of 316Population Source: World Bank

PROSECUTION6. Persons prosecuted, by type of crime
06.12 6b ATPROTotal prosecuted for automobile theft
1998 1999 2000 1998 1999 2000Count Rate per 100,000 inhabitants
CountryBarbados 16 28 11 6.03 10.52 4.12Croatia 193 33 32 4.39 0.75 0.73El Salvador 29 0.46England & Wales 24,041 24,689 45.86 46.86Estonia 281 285 280 19.99 20.55 20.45Georgia 127 106 94 2.33 2.11 1.87Hungary 15,255 11,556 10,022 151.04 114.42 100.22Iceland 61 58 88 22.26 20.90 31.32Ireland 2,526 3,221 68.05 85.85Latvia 252 408 465 10.29 16.93 19.60Macedonia, FYR 607 610 687 30.12 30.24 33.83Moldova, Republic of 486 392 11.30 9.14New Zealand 1,949 1,869 1,672 51.39 49.05 43.65Norway 477 524 578 10.76 11.75 12.87Pakistan 106 87 75 0.08 0.06 0.05Papua New Guinea 43 56 68 0.88 1.12 1.33Romania 588 335 393 2.61 1.49 1.75Singapore 298 171 186 7.60 4.33 4.63Slovakia 1,175 1,163 2,538 21.80 21.56 46.98Slovenia 322 302 238 16.24 15.21 11.97South Africa 8,231 8,011 7,079 19.88 19.03 16.54Spain 76,144 84,625 85,648 193.26 214.78 216.83Sweden 4,267 3,770 3,567 48.20 42.56 40.22Turkey 23,817 23,717 37.57 36.88Ukraine 2,978 2,497 1,905 5.92 5.00 3.85Zimbabwe 745 420 477 6.11 3.39 3.79
Page 133 of 316Population Source: World Bank

PROSECUTION6. Persons prosecuted, by type of crime
06.13 5g BURPROTotal prosecuted for burglary
1998 1999 2000 1998 1999 2000Count Rate per 100,000 inhabitants
CountryArmenia 54 97 63 1.42 2.55 1.66Barbados 224 191 303 84.43 71.78 113.48Canada 25,881 22,498 85.70 73.76Chile 217 1.43Cyprus 162 183 21.63 24.27Czech Republic 17,086 12,557 10,982 165.88 121.91 106.62Egypt 286 590 225 0.46 0.94 0.35England & Wales 48,114 46,141 91.77 87.57Estonia 2,763 2,870 3,044 196.51 206.97 222.35Georgia 361 733 831 6.63 14.59 16.54Germany 27,159 23,541 33.12 28.67Hong Kong, China (SAR) 805 650 627 12.11 9.67 9.22Hungary 14,548 11,466 10,088 144.04 113.52 100.88India 65,128 24,109 6.65 2.42Ireland 7,149 4,251 192.59 113.30Japan 29,243 31,535 32,147 23.21 24.83 25.31Korea, Republic of 529 685 606 1.14 1.46 1.28Latvia 562 488 540 22.95 20.25 22.77Macedonia, FYR 8,636 8,227 8,742 428.59 407.88 430.43New Zealand 4,679 4,633 4,807 123.38 121.58 125.48Norway 87 83 101 1.96 1.86 2.25Pakistan 662 516 608 0.50 0.38 0.44Papua New Guinea 76 88 94 1.56 1.76 1.83Romania 16,417 13,599 12,578 72.96 60.44 56.15Singapore 222 237 140 5.66 6.00 3.48Slovakia 4,314 4,201 4,403 80.03 77.87 81.51Slovenia 1,464 2,009 1,773 73.84 101.18 89.19South Africa 50,557 53,073 54,565 122.12 126.06 127.49Spain 28,204 40,267 34,611 71.58 102.20 87.62Sweden 5,809 4,150 4,519 65.63 46.85 50.95
Page 134 of 316Population Source: World Bank

PROSECUTION6. Persons prosecuted, by type of crime
06.13 5g BURPROTotal prosecuted for burglary
1998 1999 2000 1998 1999 2000Count Rate per 100,000 inhabitants
CountryTurkey 22,985 22,405 36.25 34.84Zimbabwe 8,654 6,025 6,850 70.93 48.59 54.37
Page 135 of 316Population Source: World Bank

PROSECUTION6. Persons prosecuted, by type of crime
06.14 5g FRDPROTotal prosecuted for fraud
1998 1999 2000 1998 1999 2000Count Rate per 100,000 inhabitants
CountryArmenia 180 179 224 4.74 4.71 5.89Barbados 68 29 109 25.63 10.90 40.82Belarus 665 845 1,108 6.58 8.45 11.08Bulgaria 428 348 532 5.18 4.24 6.51Canada 21,935 20,802 72.63 68.20Chile 23 0.15China 18,515 19,418 19,848 1.49 1.55 1.58Costa Rica 4,278 14,795 3,269 117.11 396.54 85.78Croatia 4,047 3,393 2,796 92.05 77.56 63.84Cyprus 117 131 15.62 17.37Czech Republic 7,879 10,730 11,985 76.50 104.17 116.36Dominican Republic 384 344 4.66 4.11Egypt 491,816 472,879 604,258 799.38 754.74 946.83El Salvador 2,421 38.58England & Wales 23,871 24,827 45.53 47.12Estonia 255 289 419 18.14 20.84 30.61Finland 3,908 4,113 4,496 75.84 79.63 86.85Georgia 118 112 109 2.17 2.23 2.17Germany 131,985 135,754 160.96 165.35Guatemala 28 25 37 0.26 0.23 0.32Hong Kong, China (SAR) 489 516 475 7.36 7.68 6.99Hungary 5,920 7,527 7,638 58.61 74.52 76.38Iceland 62 50 104 22.63 18.02 37.01India 28,948 63,210 2.95 6.33Ireland 2,191 1,533 59.02 40.86Japan 7,168 7,508 8,269 5.69 5.91 6.51Korea, Republic of 54,365 56,652 48,089 117.17 120.79 101.67Kyrgyzstan 368 505 454 7.67 10.38 9.24Latvia 181 225 236 7.39 9.34 9.95Macedonia, FYR 739 624 615 36.67 30.94 30.28
Page 136 of 316Population Source: World Bank

PROSECUTION6. Persons prosecuted, by type of crime
06.14 5g FRDPROTotal prosecuted for fraud
1998 1999 2000 1998 1999 2000Count Rate per 100,000 inhabitants
CountryMoldova, Republic of 154 146 163 3.58 3.40 3.81Netherlands 12,253 10,749 78.04 68.03New Zealand 3,871 3,571 3,454 102.08 93.71 90.16Norway 1,519 1,369 1,293 34.27 30.70 28.79Pakistan 617 345 600 0.47 0.26 0.43Papua New Guinea 89 59 97 1.82 1.18 1.89Portugal 2,483 3,300 2,175 24.91 33.04 21.75Romania 3,153 2,721 2,519 14.01 12.09 11.25Russian Federation 24,538 22,761 21,668 16.69 15.59 14.84Singapore 278 201 144 7.09 5.09 3.58Slovakia 1,695 1,930 2,548 31.44 35.77 47.17Slovenia 2,099 2,293 2,737 105.87 115.49 137.68South Africa 12,779 13,007 12,657 30.87 30.90 29.57Spain 30,479 31,413 31,340 77.36 79.73 79.34Sweden 7,828 5,793 4,554 88.43 65.40 51.35Thailand 3,166 3,318 3,293 5.29 5.51 5.43Turkey 18,058 19,242 28.48 29.93Ukraine 4,513 4,210 4,265 8.97 8.44 8.62Zambia 282 358 315 2.92 3.62 3.12Zimbabwe 1,665 774 803 13.65 6.24 6.37
Page 137 of 316Population Source: World Bank

PROSECUTION6. Persons prosecuted, by type of crime
06.15 5g EMBPROTotal prosecuted for embezzlement
1998 1999 2000 1998 1999 2000Count Rate per 100,000 inhabitants
CountryArmenia 139 110 140 3.66 2.89 3.68Bulgaria 467 399 617 5.66 4.86 7.55Chile 20 0.13China 9,316 10,242 11,641 0.75 0.82 0.92Costa Rica 5,410 5,328 4,526 148.10 142.80 118.76Croatia 316 332 268 7.19 7.59 6.12Czech Republic 4,865 5,514 6,273 47.23 53.53 60.90Egypt 547 515 641 0.89 0.82 1.00El Salvador 779 12.41Estonia 200 213 238 14.22 15.36 17.38Finland 833 886 898 16.17 17.15 17.35Georgia 160 88 118 2.94 1.75 2.35Germany 10,629 10,647 12.96 12.97Guatemala 10 10 18 0.09 0.09 0.16Hungary 3,380 3,143 3,041 33.47 31.12 30.41Iceland 28 17 23 10.22 6.13 8.19India 13,383 33,620 1.37 3.37Ireland 25 9 0.67 0.24Japan 1,049 1,056 1,290 0.83 0.83 1.02Korea, Republic of 11,165 11,801 9,081 24.06 25.16 19.20Kyrgyzstan 768 788 785 16.01 16.20 15.97Latvia 20 37 0.83 1.56Macedonia, FYR 309 243 191 15.33 12.05 9.40Moldova, Republic of 364 305 260 8.47 7.11 6.07Netherlands 2,306 2,267 14.69 14.35New Zealand 152 120 96 4.01 3.15 2.51Norway 183 221 256 4.13 4.96 5.70Pakistan 41 41 92 0.03 0.03 0.07Papua New Guinea 48 75 66 0.98 1.50 1.29Portugal 704 869 1,068 7.06 8.70 10.68
Page 138 of 316Population Source: World Bank

PROSECUTION6. Persons prosecuted, by type of crime
06.15 5g EMBPROTotal prosecuted for embezzlement
1998 1999 2000 1998 1999 2000Count Rate per 100,000 inhabitants
CountryRomania 473 299 243 2.10 1.33 1.08Russian Federation 15,215 18,757 19,947 10.35 12.85 13.66Singapore 137 127 80 3.49 3.21 1.99Slovakia 946 1,073 1,104 17.55 19.89 20.44Slovenia 33 98 111 1.66 4.94 5.58Spain 21,649 19,221 20,884 54.95 48.78 52.87Sweden 1,471 1,367 1,297 16.62 15.43 14.62Thailand 3,962 3,597 3,394 6.63 5.98 5.59Turkey 4,012 4,518 6.33 7.03Zimbabwe 2,034 869 994 16.67 7.01 7.89
Page 139 of 316Population Source: World Bank

PROSECUTION6. Persons prosecuted, by type of crime
06.16 5g DRGPROTotal prosecuted for all drug offenses
1998 1999 2000 1998 1999 2000Count Rate per 100,000 inhabitants
CountryArmenia 543 442 403 14.31 11.63 10.60Barbados 1,130 1,036 1,517 425.93 389.36 568.16Belarus 1,647 1,388 1,819 16.31 13.88 18.19Bulgaria 74 124 261 0.90 1.51 3.20Canada 24,919 26,890 82.51 88.16Chile 8 0.05China 31,626 37,306 36,157 2.55 2.98 2.87Costa Rica 2,554 3,167 4,592 69.91 84.88 120.49Croatia 3,016 4,184 4,525 68.60 95.64 103.31Cyprus 187 220 24.97 29.18Czech Republic 1,776 2,084 2,453 17.24 20.23 23.82Dominican Republic 1,345 1,444 16.33 17.25Egypt 10,292 16,728 17,012 16.73 26.70 26.66El Salvador 3,815 60.79England & Wales 56,347 56,646 107.48 107.51Estonia 131 194 637 9.32 13.99 46.53Finland 4,080 4,648 5,923 79.18 89.99 114.41Georgia 707 838 1,070 12.99 16.68 21.30Germany 49,869 52,678 60.82 64.16Guatemala 162 207 202 1.50 1.86 1.77Hong Kong, China (SAR) 2,598 1,785 1,615 39.09 26.56 23.76Hungary 1,727 2,582 3,055 17.10 25.56 30.55Iceland 175 151 281 63.87 54.41 100.00India 21,211 24,863 2.16 2.49Ireland 5,984 7,137 161.21 190.22Japan 24,495 22,831 23,484 19.44 17.98 18.49Korea, Republic of 5,751 7,665 7,104 12.39 16.34 15.02Kyrgyzstan 2,958 3,159 3,378 61.66 64.94 68.73Latvia 239 254 398 9.76 10.54 16.78Macedonia, FYR 249 317 448 12.36 15.72 22.06
Page 140 of 316Population Source: World Bank
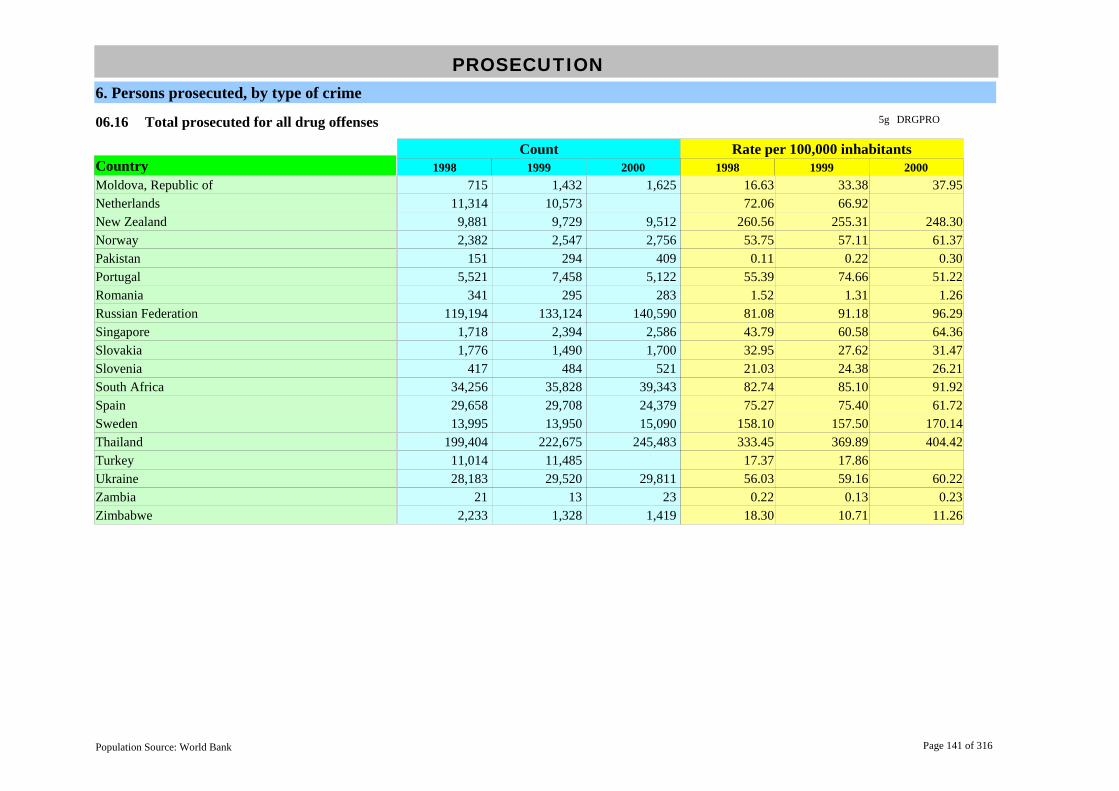
PROSECUTION6. Persons prosecuted, by type of crime
06.16 5g DRGPROTotal prosecuted for all drug offenses
1998 1999 2000 1998 1999 2000Count Rate per 100,000 inhabitants
CountryMoldova, Republic of 715 1,432 1,625 16.63 33.38 37.95Netherlands 11,314 10,573 72.06 66.92New Zealand 9,881 9,729 9,512 260.56 255.31 248.30Norway 2,382 2,547 2,756 53.75 57.11 61.37Pakistan 151 294 409 0.11 0.22 0.30Portugal 5,521 7,458 5,122 55.39 74.66 51.22Romania 341 295 283 1.52 1.31 1.26Russian Federation 119,194 133,124 140,590 81.08 91.18 96.29Singapore 1,718 2,394 2,586 43.79 60.58 64.36Slovakia 1,776 1,490 1,700 32.95 27.62 31.47Slovenia 417 484 521 21.03 24.38 26.21South Africa 34,256 35,828 39,343 82.74 85.10 91.92Spain 29,658 29,708 24,379 75.27 75.40 61.72Sweden 13,995 13,950 15,090 158.10 157.50 170.14Thailand 199,404 222,675 245,483 333.45 369.89 404.42Turkey 11,014 11,485 17.37 17.86Ukraine 28,183 29,520 29,811 56.03 59.16 60.22Zambia 21 13 23 0.22 0.13 0.23Zimbabwe 2,233 1,328 1,419 18.30 10.71 11.26
Page 141 of 316Population Source: World Bank

PROSECUTION6. Persons prosecuted, by type of crime
06.17 5g BRIPROTotal prosecuted for bribery
1998 1999 2000 1998 1999 2000Count Rate per 100,000 inhabitants
CountryArmenia 13 12 28 0.34 0.32 0.74Belarus 315 298 302 3.12 2.98 3.02Bulgaria 88 84 72 1.07 1.02 0.88China 6,546 5,390 6,270 0.53 0.43 0.50Costa Rica 74 64 69 2.03 1.72 1.81Croatia 112 59 103 2.55 1.35 2.35Cyprus 2 5 0.27 0.66Czech Republic 218 215 177 2.12 2.09 1.72Dominican Republic 18 13 0.22 0.16El Salvador 167 2.66Estonia 32 57 48 2.28 4.11 3.51Finland 12 5 36 0.23 0.10 0.70Georgia 10 8 18 0.18 0.16 0.36Germany 564 477 0.69 0.58Guatemala 4 18 17 0.04 0.16 0.15Hong Kong, China (SAR) 171 90 134 2.57 1.34 1.97Hungary 455 426 476 4.50 4.22 4.76India 4,197 4,087 0.43 0.41Ireland 2 1 0.05 0.03Japan 353 253 230 0.28 0.20 0.18Korea, Republic of 1,460 9,038 2,211 3.15 19.27 4.67Kyrgyzstan 95 91 111 1.98 1.87 2.26Latvia 63 64 54 2.57 2.66 2.28Macedonia, FYR 31 78 46 1.54 3.87 2.26Moldova, Republic of 51 55 78 1.19 1.28 1.82Netherlands 11 21 0.07 0.13New Zealand 8 7 14 0.21 0.18 0.37Pakistan 5 30 0.00 0.02Portugal 50 43 62 0.50 0.43 0.62Romania 631 449 388 2.80 2.00 1.73
Page 142 of 316Population Source: World Bank

PROSECUTION6. Persons prosecuted, by type of crime
06.17 5g BRIPROTotal prosecuted for bribery
1998 1999 2000 1998 1999 2000Count Rate per 100,000 inhabitants
CountryRussian Federation 2,103 2,299 2,373 1.43 1.57 1.63Singapore 126 107 183 3.21 2.71 4.55Slovakia 40 50 105 0.74 0.93 1.94Slovenia 26 34 36 1.31 1.71 1.81Spain 98 81 82 0.25 0.21 0.21Turkey 1,436 1,432 2.26 2.23Ukraine 974 963 999 1.94 1.93 2.02Zambia 21 17 19 0.22 0.17 0.19Zimbabwe 426 210 170 3.49 1.69 1.35
Page 143 of 316Population Source: World Bank

PROSECUTION7. Persons prosecuted, by sex and age group
07.01 5h TFPROSTotal females prosecuted
1998 1999 2000 1998 1999 2000Count Rate per 100,000 inhabitants
CountryBarbados 334 338 125.53 126.59Bulgaria 2,400 2,577 3,707 29.07 31.40 45.39Canada 81,538 79,065 269.99 259.23China 20,581 26,135 34,287 1.66 2.09 2.72Colombia 50,629 122.00Croatia 3,416 3,337 3,375 77.70 76.28 77.05Cyprus 127 132 16.96 17.51Czech Republic 9,037 11,808 12,717 87.74 114.64 123.47El Salvador 10,218 162.81England & Wales 304,766 285,782 581.30 542.38Estonia 949 1,006 1,116 67.50 72.55 81.52Finland 14,197 14,693 26,578 275.51 284.47 513.39France 8,380 8,186 7,201 14.35 13.97 12.23Georgia 58 164 157 1.07 3.26 3.13Germany 126,499 127,522 154.27 155.33Guatemala 69 112 120 0.64 1.01 1.05Holy See (Vatican City State) 10 5 4Hong Kong, China (SAR) 4,878 5,146 5,550 73.40 76.57 81.65Hungary 17,842 17,913 16,719 176.65 177.36 167.19India 2,482,351 2,476,194 253.30 248.12Japan 9,337 10,829 10,996 7.41 8.53 8.66Korea, Republic of 146,466 147,870 137,767 315.66 315.29 291.26Kyrgyzstan 2,443 2,194 2,396 50.93 45.10 48.75Latvia 1,763 1,790 1,880 71.99 74.27 79.26Macedonia, FYR 842 781 749 41.79 38.72 36.88Netherlands 25,952 25,666 165.30 162.44New Zealand 22,772 23,160 23,091 600.50 607.76 602.77Norway 1,580 1,514 1,739 35.65 33.95 38.72Pakistan 7 9 10 0.01 0.01 0.01Papua New Guinea 14 10 15 0.29 0.20 0.29
Page 144 of 316Population Source: World Bank

PROSECUTION7. Persons prosecuted, by sex and age group
07.01 5h TFPROSTotal females prosecuted
1998 1999 2000 1998 1999 2000Count Rate per 100,000 inhabitants
CountryPortugal 18,906 14,301 12,751 189.67 143.17 127.51Romania 7,981 5,542 4,572 35.47 24.63 20.41Singapore 1,334 1,295 1,365 34.00 32.77 33.97Slovakia 2,113 2,377 2,590 39.20 44.06 47.95Slovenia 2,643 3,069 3,584 133.31 154.57 180.28Thailand 186,679 173,513 172,693 312.17 288.23 284.50Turkey 111,587 120,582 176.00 187.53Ukraine 57,499 52,847 46,019 114.31 105.91 92.97United States of America 2,519,324 2,481,808 916.12 892.74Zambia 18 15 13 0.19 0.15 0.13Zimbabwe 4,753 4,209 3,667 38.96 33.94 29.10
Page 145 of 316Population Source: World Bank

PROSECUTION7. Persons prosecuted, by sex and age group
07.02 5h TMPROSTotal males prosecuted
1998 1999 2000 1998 1999 2000Count Rate per 100,000 inhabitants
CountryBarbados 3,297 4,374 1,239.10 1,638.20Bulgaria 34,421 28,549 39,673 416.87 347.82 485.77Canada 405,772 392,417 1,343.62 1,286.61China 564,182 646,232 674,549 45.50 51.70 53.54Colombia 375,060 903.76Croatia 32,914 29,087 29,135 748.63 664.92 665.18Cyprus 1,347 1,374 179.84 182.23Czech Republic 97,451 96,071 98,091 946.13 932.73 952.34El Salvador 63,431 1,010.69England & Wales 1,629,572 1,580,901 3,108.22 3,000.39Estonia 9,001 10,186 12,181 640.17 734.57 889.77Finland 76,046 77,623 150,343 1,475.76 1,502.87 2,904.06France 57,480 54,943 50,625 98.42 93.76 85.95Georgia 6,555 6,312 7,227 120.45 125.64 143.85Germany 579,731 569,735 706.99 693.95Guatemala 1,134 1,296 1,478 10.50 11.68 12.96Holy See (Vatican City State) 8 5 2Hong Kong, China (SAR) 21,314 20,089 21,411 320.72 298.91 315.01Hungary 122,241 113,745 106,061 1,210.31 1,126.19 1,060.61Japan 118,470 124,548 124,857 94.02 98.07 98.31Korea, Republic of 1,049,897 1,046,993 1,063,229 2,262.71 2,232.39 2,247.84Latvia 15,713 15,862 16,670 641.61 658.17 702.78Macedonia, FYR 21,872 20,601 21,286 1,085.46 1,021.37 1,048.06Netherlands 183,990 178,251 1,171.91 1,128.17New Zealand 107,511 106,623 106,121 2,835.06 2,797.99 2,770.20Norway 10,566 11,037 11,384 238.40 247.47 253.48Pakistan 6,288 5,441 9,206 4.76 4.03 6.67Papua New Guinea 970 878 1,026 19.87 17.54 20.00Portugal 101,905 103,222 96,197 1,022.32 1,033.36 961.97Romania 91,939 70,201 63,911 408.62 312.00 285.32
Page 146 of 316Population Source: World Bank

PROSECUTION7. Persons prosecuted, by sex and age group
07.02 5h TMPROSTotal males prosecuted
1998 1999 2000 1998 1999 2000Count Rate per 100,000 inhabitants
CountrySingapore 10,674 9,515 9,508 272.09 240.76 236.64Slovakia 32,813 32,125 34,189 608.70 595.45 632.92Slovenia 19,509 21,820 22,942 984.01 1,098.97 1,154.02Thailand 590,568 555,792 546,280 987.57 923.24 899.97Turkey 1,770,399 2,030,443 2,792.43 3,157.77Ukraine 272,568 264,148 279,442 541.88 529.35 564.53United States of America 12,958,395 12,718,185 4,712.14 4,574.89Zambia 298 315 250 3.08 3.19 2.48Zimbabwe 51,158 53,773 53,225 419.33 433.65 422.42
Page 147 of 316Population Source: World Bank

PROSECUTION7. Persons prosecuted, by sex and age group
07.03 5h ADPROSTotal adults prosecuted
1998 1999 2000 1998 1999 2000Count Rate per 100,000 inhabitants
CountryBarbados 3,778 3,595 4,643 1,424.05 1,351.10 1,738.95Belarus 59,572 61,226 62,005 589.82 612.26 620.05Bulgaria 36,821 31,126 43,380 445.94 379.22 531.16Canada 393,959 377,667 1,304.50 1,238.25China 551,911 633,546 667,935 44.51 50.68 53.01Colombia 425,689 1,025.76Croatia 48,643 44,893 45,485 1,106.39 1,026.24 1,038.47Cyprus 1,439 1,470 192.12 194.96Czech Republic 96,221 99,146 102,250 934.18 962.58 992.72El Salvador 67,532 1,076.04England & Wales 1,574,932 1,504,730 3,004.00 2,855.82Estonia 8,171 9,368 11,377 581.14 675.58 831.04Finland 82,192 84,118 165,229 1,595.03 1,628.62 3,191.60France 61,996 59,547 54,224 106.16 101.62 92.06Georgia 6,175 6,092 6,960 113.47 121.26 138.54Germany 577,921 568,661 704.78 692.64Holy See (Vatican City State) 18 10 6Hong Kong, China (SAR) 24,849 23,977 25,494 373.92 356.76 375.08Hungary 127,217 120,118 111,779 1,259.57 1,189.29 1,117.79Japan 127,807 175,377 145,872 101.43 138.09 114.86Korea, Republic of 1,142,391 1,146,285 1,196,482 2,462.05 2,444.10 2,529.56Kyrgyzstan 19,178 19,589 21,373 399.79 402.68 434.85Latvia 14,446 14,815 15,255 589.87 614.73 643.13Macedonia, FYR 20,582 19,383 20,220 1,021.44 960.98 995.57Mexico 54,403 61,424 63,724 57.15 63.59 65.02Netherlands 182,706 177,062 1,163.73 1,120.65New Zealand 126,880 126,155 125,323 3,345.82 3,310.55 3,271.46Norway 11,269 11,585 12,009 254.26 259.75 267.40Pakistan 6,293 5,446 9,213 4.77 4.03 6.68Papua New Guinea 983 888 1,041 20.13 17.74 20.29
Page 148 of 316Population Source: World Bank

PROSECUTION7. Persons prosecuted, by sex and age group
07.03 5h ADPROSTotal adults prosecuted
1998 1999 2000 1998 1999 2000Count Rate per 100,000 inhabitants
CountryPortugal 119,490 115,918 106,693 1,198.74 1,160.46 1,066.93Romania 89,002 67,512 61,161 395.56 300.05 273.04Singapore 11,725 10,605 10,721 298.88 268.35 266.82Slovakia 29,877 29,954 32,503 554.24 555.21 601.71Slovenia 19,353 20,732 23,177 976.14 1,044.17 1,165.85Thailand 612,643 575,930 572,083 1,024.49 956.69 942.48Turkey 1,785,355 2,060,065 2,816.02 3,203.83United States of America 14,477,440 14,203,822 5,264.52 5,109.29Zambia 306 316 251 3.17 3.20 2.49Zimbabwe 53,328 56,098 54,934 437.11 452.40 435.98
Page 149 of 316Population Source: World Bank

PROSECUTION7. Persons prosecuted, by sex and age group
07.04 5h AFPROSAdult females prosecuted
1998 1999 2000 1998 1999 2000Count Rate per 100,000 inhabitants
CountryBarbados 343 323 313 129.29 121.39 117.23Canada 59,002 57,558 195.37 188.71Croatia 3,307 3,186 3,212 75.22 72.83 73.33Cyprus 127 131 16.96 17.37Czech Republic 8,449 11,146 11,981 82.03 108.21 116.32El Salvador 9,560 152.33England & Wales 262,892 244,779 501.44 464.57Estonia 774 842 930 55.05 60.72 67.93Finland 12,524 12,963 24,517 243.04 250.98 473.58Georgia 58 164 157 1.07 3.26 3.13Germany 106,870 107,502 130.33 130.94Hong Kong, China (SAR) 4,680 4,955 5,337 70.42 73.73 78.52Hungary 16,469 16,538 15,473 163.06 163.74 154.73Japan 9,280 10,757 10,937 7.37 8.47 8.61Korea, Republic of 142,511 142,901 133,253 307.14 304.69 281.72Latvia 1,467 1,540 1,630 59.90 63.90 68.72Macedonia, FYR 771 738 694 38.26 36.59 34.17Mexico 2,207 2,462 2,765 2.32 2.55 2.82Netherlands 22,984 22,264 146.39 140.91New Zealand 22,228 22,489 22,467 586.15 590.15 586.48Norway 1,491 1,428 1,623 33.64 32.02 36.14Pakistan 7 9 10 0.01 0.01 0.01Papua New Guinea 14 10 15 0.29 0.20 0.29Portugal 18,703 14,095 12,324 187.63 141.11 123.24Romania 7,254 5,117 4,207 32.24 22.74 18.78Singapore 1,266 1,266 1,345 32.27 32.03 33.47Slovakia 1,909 2,162 2,410 35.41 40.07 44.61Slovenia 2,406 2,715 3,250 121.36 136.74 163.48Turkey 103,416 112,700 163.12 175.27United States of America 2,316,390 2,272,612 842.32 817.49
Page 150 of 316Population Source: World Bank

PROSECUTION7. Persons prosecuted, by sex and age group
07.04 5h AFPROSAdult females prosecuted
1998 1999 2000 1998 1999 2000Count Rate per 100,000 inhabitants
CountryZambia 16 11 8 0.17 0.11 0.08Zimbabwe 4,228 3,868 3,304 34.66 31.19 26.22
Page 151 of 316Population Source: World Bank

PROSECUTION7. Persons prosecuted, by sex and age group
07.05 5h AMPROSAdult males prosecuted
1998 1999 2000 1998 1999 2000Count Rate per 100,000 inhabitants
CountryBarbados 3,435 3,272 4,330 1,294.76 1,229.71 1,621.72Canada 321,643 311,863 1,065.04 1,022.50Croatia 31,127 26,971 26,923 707.98 616.55 614.68Cyprus 1,312 1,339 175.17 177.59Czech Republic 87,772 88,000 90,269 852.16 854.37 876.40El Salvador 57,972 923.71England & Wales 1,312,040 1,259,951 2,502.56 2,391.26Estonia 7,397 8,526 10,447 526.09 614.85 763.11Finland 69,668 71,155 140,712 1,351.99 1,377.64 2,718.02Georgia 6,117 5,928 6,803 112.40 117.99 135.41Germany 471,051 461,159 574.45 561.70Hong Kong, China (SAR) 20,169 19,022 20,157 303.49 283.04 296.56Hungary 110,748 103,580 96,226 1,096.51 1,025.54 962.26Japan 117,627 123,696 133,862 93.35 97.40 105.40Korea, Republic of 999,880 1,003,384 1,023,638 2,154.91 2,139.41 2,164.14Latvia 12,979 13,275 13,625 529.97 550.83 574.41Macedonia, FYR 19,811 18,645 19,526 983.18 924.39 961.40Mexico 52,196 58,962 60,959 54.83 61.04 62.20Netherlands 159,722 154,798 1,017.34 979.73New Zealand 104,650 103,666 102,856 2,759.61 2,720.39 2,684.97Norway 9,778 10,154 10,379 220.62 227.67 231.11Pakistan 6,286 5,437 9,203 4.76 4.03 6.67Papua New Guinea 969 878 1,026 19.85 17.54 20.00Portugal 100,787 101,823 14,369 1,011.11 1,019.35 143.69Romania 81,748 62,395 56,954 363.32 277.31 254.26Singapore 10,459 9,339 9,376 266.61 236.31 233.35Slovakia 27,968 27,792 30,073 518.82 515.13 556.72Slovenia 16,947 18,017 19,927 854.79 907.43 1,002.36Turkey 1,681,939 1,947,365 2,652.90 3,028.56United States of America 12,161,050 11,931,210 4,422.20 4,291.80
Page 152 of 316Population Source: World Bank

PROSECUTION7. Persons prosecuted, by sex and age group
07.05 5h AMPROSAdult males prosecuted
1998 1999 2000 1998 1999 2000Count Rate per 100,000 inhabitants
CountryZambia 290 305 243 3.00 3.09 2.41Zimbabwe 49,100 52,230 51,630 402.46 421.21 409.76
Page 153 of 316Population Source: World Bank

PROSECUTION7. Persons prosecuted, by sex and age group
07.06 5h JUPROSTotal juveniles prosecuted
1998 1999 2000 1998 1999 2000Count Rate per 100,000 inhabitants
CountryBarbados 21 36 69 7.92 13.53 25.84Belarus 6,687 6,515 6,521 66.21 65.15 65.21Bulgaria 4,020 3,950 48.69 48.12Canada 106,665 102,061 353.20 334.63China 110,845 138,126 152,975 8.94 11.05 12.14Croatia 1,896 2,267 2,375 43.12 51.82 54.22Cyprus 35 36 4.67 4.77Czech Republic 10,267 8,733 8,558 99.68 84.79 83.09El Salvador 6,117 97.47England & Wales 359,406 361,953 685.52 686.95Estonia 1,779 1,824 1,920 126.53 131.54 140.25Finland 8,051 8,198 11,692 156.24 158.72 225.85France 3,864 3,582 3,602 6.62 6.11 6.12Georgia 438 384 424 8.05 7.64 8.44Germany 128,309 128,596 156.47 156.63Hong Kong, China (SAR) 1,343 1,258 1,467 20.21 18.72 21.58Hungary 12,866 11,540 11,081 127.39 114.26 110.81Japan 900 924 1,054 0.71 0.73 0.83Korea, Republic of 53,972 48,578 44,095 116.32 103.58 93.22Kyrgyzstan 1,676 1,705 1,713 34.94 35.05 34.85Latvia 3,030 2,837 3,295 123.72 117.72 138.91Macedonia, FYR 2,132 1,999 1,815 105.81 99.11 89.36Netherlands 27,237 26,855 173.48 169.97New Zealand 3,396 3,612 3,876 89.55 94.79 101.18Norway 881 969 1,121 19.88 21.73 24.96Pakistan 2 4 3 0.00 0.00 0.00Papua New Guinea 1 0.02Portugal 1,321 1,605 2,255 13.25 16.07 22.55Romania 10,918 8,231 7,322 48.52 36.58 32.69Singapore 283 205 152 7.21 5.19 3.78
Page 154 of 316Population Source: World Bank

PROSECUTION7. Persons prosecuted, by sex and age group
07.06 5h JUPROSTotal juveniles prosecuted
1998 1999 2000 1998 1999 2000Count Rate per 100,000 inhabitants
CountrySlovakia 5,049 4,548 4,276 93.66 84.30 79.16Slovenia 2,799 4,157 3,349 141.18 209.37 168.46Thailand 164,604 153,367 146,890 275.26 254.76 241.99Turkey 96,631 90,960 152.41 141.46United States of America 1,000,279 996,171 363.74 358.33Zambia 10 14 12 0.10 0.14 0.12Zimbabwe 2,583 1,884 1,958 21.17 15.19 15.54
Page 155 of 316Population Source: World Bank

PROSECUTION7. Persons prosecuted, by sex and age group
07.07 5h JFPROSJuvenile females prosecuted
1998 1999 2000 1998 1999 2000Count Rate per 100,000 inhabitants
CountryBarbados 11 25 4.13 9.36Canada 22,536 21,507 74.62 70.51Croatia 109 151 163 2.48 3.45 3.72Cyprus 1 0.13Czech Republic 588 662 736 5.71 6.43 7.15El Salvador 658 10.48England & Wales 41,874 41,003 79.87 77.82Estonia 175 164 186 12.45 11.83 13.59Finland 1,673 1,730 2,061 32.47 33.49 39.81Germany 19,629 20,020 23.94 24.38Hong Kong, China (SAR) 198 191 213 2.98 2.84 3.13Hungary 1,373 1,375 1,246 13.59 13.61 12.46Japan 57 72 59 0.05 0.06 0.05Korea, Republic of 3,955 4,969 4,504 8.52 10.59 9.52Latvia 296 250 250 12.09 10.37 10.54Macedonia, FYR 71 43 55 3.52 2.13 2.71Netherlands 2,969 3,402 18.91 21.53New Zealand 542 670 620 14.29 17.58 16.18Norway 89 86 116 2.01 1.93 2.58Portugal 203 206 427 2.04 2.06 4.27Romania 727 425 365 3.23 1.89 1.63Singapore 68 29 20 1.73 0.73 0.50Slovakia 204 215 180 3.78 3.99 3.33Slovenia 237 354 334 11.95 17.83 16.80Turkey 8,171 7,882 12.89 12.26Ukraine 28,267 28,108 29,615 56.20 56.33 59.83United States of America 202,934 209,196 73.79 75.25Zambia 2 4 5 0.02 0.04 0.05Zimbabwe 525 341 363 4.30 2.75 2.88
Page 156 of 316Population Source: World Bank

PROSECUTION7. Persons prosecuted, by sex and age group
07.08 5h JMPROSJuvenile males prosecuted
1998 1999 2000 1998 1999 2000Count Rate per 100,000 inhabitants
CountryBarbados 25 44 9.40 16.48Canada 84,129 80,554 278.57 264.11Croatia 1,787 2,116 2,212 40.65 48.37 50.50Cyprus 35 35 4.67 4.64Czech Republic 9,679 8,071 7,822 93.97 78.36 75.94El Salvador 5,459 86.98England & Wales 317,532 320,950 605.65 609.13Estonia 1,604 1,660 1,734 114.08 119.71 126.66Finland 6,378 6,468 9,631 123.77 125.23 186.03Georgia 438 384 424 8.05 7.64 8.44Germany 108,680 108,576 132.54 132.25Hong Kong, China (SAR) 1,145 1,067 1,254 17.23 15.88 18.45Hungary 11,493 10,165 9,835 113.79 100.64 98.35Japan 843 852 995 0.67 0.67 0.78Korea, Republic of 40,017 43,609 39,591 86.24 92.98 83.70Latvia 2,734 2,587 3,045 111.64 107.34 128.37Macedonia, FYR 2,061 1,956 1,760 102.28 96.98 86.66Netherlands 24,268 23,453 154.57 148.44New Zealand 2,854 2,942 3,256 75.26 77.20 85.00Norway 788 883 1,005 17.78 19.80 22.38Pakistan 2 4 3 0.00 0.00 0.00Papua New Guinea 1 0.02Portugal 1,118 1,399 1,828 11.22 14.01 18.28Qatar 170 236 176 31.14 41.76 30.09Romania 10,191 7,806 6,957 45.29 34.69 31.06Singapore 215 176 132 5.48 4.45 3.29Slovakia 4,845 4,333 4,096 89.88 80.31 75.83Slovenia 2,562 3,803 3,015 129.22 191.54 151.66Turkey 88,460 83,078 139.53 129.20United States of America 797,345 786,975 289.94 283.08
Page 157 of 316Population Source: World Bank
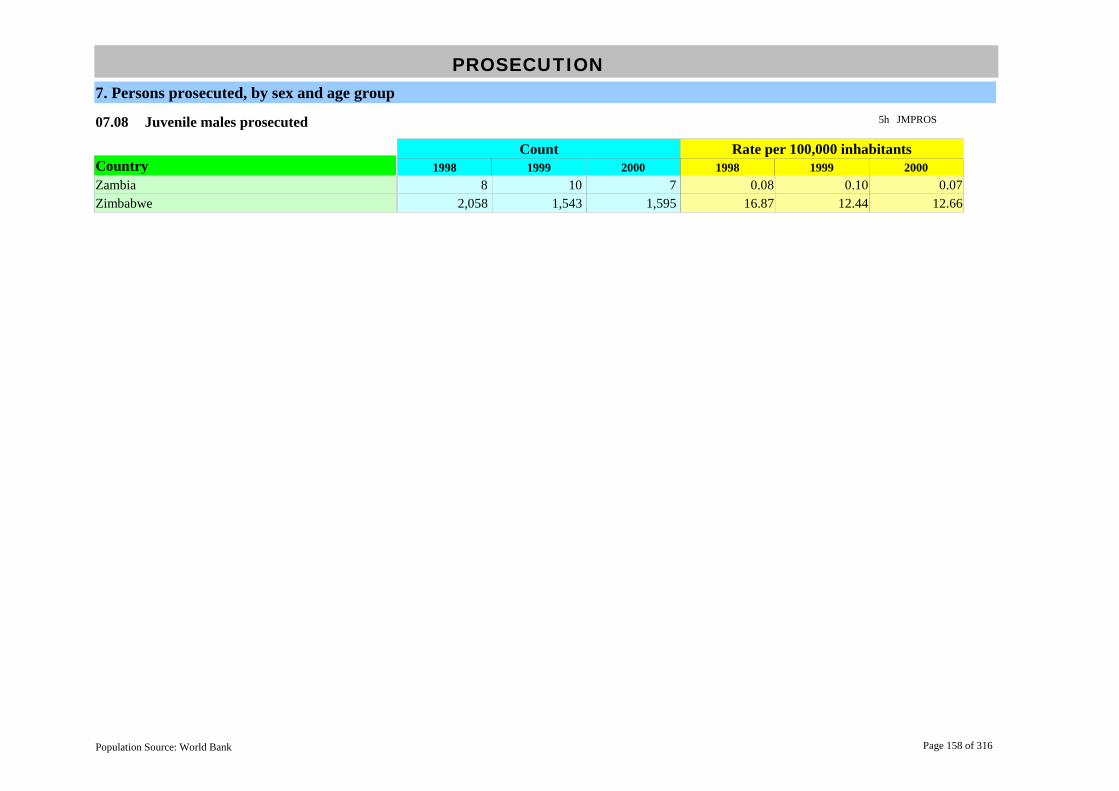
PROSECUTION7. Persons prosecuted, by sex and age group
07.08 5h JMPROSJuvenile males prosecuted
1998 1999 2000 1998 1999 2000Count Rate per 100,000 inhabitants
CountryZambia 8 10 7 0.08 0.10 0.07Zimbabwe 2,058 1,543 1,595 16.87 12.44 12.66
Page 158 of 316Population Source: World Bank

COURTS8. Judges, by status and sex, and financial resources, including in appeal courts
08.01 5i PROJUDTotal number of professional judges/magistrates
1998 1999 2000 1998 1999 2000Count Rate per 100,000 inhabitants
CountryAlbania 270 262 264 8.03 7.74 7.74Azerbaijan 185 185 324 2.34 2.32 4.03Barbados 18 18 18 6.78 6.76 6.74Belarus 927 997 1,003 9.18 9.97 10.03Bulgaria 1,419 1,636 17.29 20.03Canada 1,994 6.60Chile 505 514 544 3.41 3.43 3.58China 172,453 13.91Colombia 4,011 3,998 3,995 9.83 9.63 9.44Costa Rica 536 556 581 14.67 14.90 15.25Croatia 1,577 1,732 1,788 35.87 39.59 40.82Cyprus 75 82 82 10.01 10.88 10.83Czech Republic 2,390 2,481 2,577 23.20 24.09 25.02Denmark 684 648 12.86 12.14Dominica 4 5 6 8.22Dominican Republic 535 6.39England & Wales 3,294 6.22Estonia 218 224 228 15.50 16.15 16.65Finland 1,280 1,280 1,250 24.84 24.78 24.15France 6,496 6,558 6,774 11.12 11.19 11.50Georgia 254 285 315 4.67 5.67 6.27Germany 20,969 25.57Guatemala 354 481 383 3.28 4.33 3.36Holy See (Vatican City State) 15 15 15Hong Kong, China (SAR) 150 140 143 2.26 2.08 2.10Hungary 2,411 2,406 2,512 23.87 23.82 25.12Iceland 50 50 40 18.25 18.02 14.23Japan 2,919 2,949 3,019 2.32 2.32 2.38Korea, Republic of 1,449 1,508 1,598 3.12 3.22 3.38Kyrgyzstan 238 240 236 4.96 4.93 4.80
Page 159 of 316Population Source: World Bank

COURTS8. Judges, by status and sex, and financial resources, including in appeal courts
08.01 5i PROJUDTotal number of professional judges/magistrates
1998 1999 2000 1998 1999 2000Count Rate per 100,000 inhabitants
CountryLatvia 358 368 366 14.62 15.27 15.43Lithuania 503 599 631 13.58 16.19 17.08Macedonia, FYR 645 639 637 32.01 31.68 31.36Malaysia 366 381 357 1.65 1.68 1.53Moldova, Republic of 359 369 370 8.35 8.60 8.64Montserrat 6 7 7Pakistan 15 15 17 0.01 0.01 0.01Palestinian Territory, occupied 69 67 66Panama 219 239 239 7.92 8.50 8.37Papua New Guinea 15 15 15 0.31 0.30 0.29Philippines 1,529 1,503 1,513 2.10 2.03 2.00Portugal 1,324 1,382 1,368 13.28 13.84 13.68Qatar 51 52 57 9.34 9.20 9.75Romania 3,308 3,479 3,511 14.70 15.46 15.67Russian Federation 66,257 67,994 45.38 46.57Saudi Arabia 604 621 710 3.07 3.07 3.43Singapore 88 87 85 2.24 2.20 2.12Slovakia 1,204 1,244 1,260 22.33 23.06 23.33Slovenia 816 855 892 41.16 43.06 44.87Spain 3,339 3,468 3,420 8.47 8.80 8.66Swaziland 10 10 10 1.01 0.98 0.96Sweden 1,694 1,742 1,698 19.14 19.67 19.15Thailand 2,416 2,455 2,930 4.04 4.08 4.83Turkey 5,445 5,799 5,704 8.59 9.02 8.74Ukraine 4,374 4,379 4,409 8.70 8.78 8.91United States of America 28,793 29,023 10.47 10.44Uruguay 440 440 440 13.38 13.28 13.19Venezuela 279 629 630 1.20 2.65 2.60Zambia 1,029 10.19Zimbabwe 73 44 82 0.60 0.35 0.65
Page 160 of 316Population Source: World Bank

COURTS8. Judges, by status and sex, and financial resources, including in appeal courts
08.02 5i PFEJUDNumber of female professional judges/magistrates
1998 1999 2000 1998 1999 2000Count Rate per 100,000 inhabitants
CountryAzerbaijan 22 22 45 0.28 0.28 0.56Barbados 5 5 5 1.88 1.88 1.87Belarus 438 486 499 4.34 4.86 4.99Chile 216 223 236 1.46 1.49 1.55China 33,704 2.72Colombia 1,899 1,893 1,892 4.65 4.56 4.47Croatia 946 1,045 1,087 21.52 23.89 24.82Cyprus 16 19 19 2.14 2.52 2.51Czech Republic 1,511 1,558 1,603 14.67 15.13 15.56Denmark 329 312 6.19 5.85Dominica 2 3 3 4.11Dominican Republic 207 2.47England & Wales 433 0.82Estonia 131 139 141 9.32 10.02 10.30Finland 420 435 440 8.15 8.42 8.50France 3,116 3,182 3,337 5.34 5.43 5.67Georgia 81 105 111 1.49 2.09 2.21Germany 5,511 6.72Guatemala 95 140 140 0.88 1.26 1.23Hong Kong, China (SAR) 27 27 28 0.41 0.40 0.41Hungary 1,657 1,672 1,755 16.41 16.55 17.55Iceland 12 12 12 4.38 4.32 4.27Japan 298 308 328 0.24 0.24 0.26Korea, Republic of 100 103 119 0.22 0.22 0.25Kyrgyzstan 58 69 71 1.21 1.42 1.44Latvia 264 271 273 10.78 11.24 11.51Lithuania 223 299 322 6.02 8.08 8.71Macedonia, FYR 317 316 316 15.73 15.67 15.56Malaysia 125 132 124 0.56 0.58 0.53Moldova, Republic of 110 113 112 2.56 2.63 2.62
Page 161 of 316Population Source: World Bank

COURTS8. Judges, by status and sex, and financial resources, including in appeal courts
08.02 5i PFEJUDNumber of female professional judges/magistrates
1998 1999 2000 1998 1999 2000Count Rate per 100,000 inhabitants
CountryPakistan 2 0.00Palestinian Territory, occupied 2 3 2Panama 103 113 113 3.73 4.02 3.96Philippines 273 279 298 0.38 0.38 0.39Portugal 490 537 536 4.92 5.38 5.36Romania 2,119 2,267 2,430 9.42 10.08 10.85Singapore 33 31 32 0.84 0.78 0.80Slovakia 709 739 759 13.15 13.70 14.05Slovenia 542 571 604 27.34 28.76 30.38Spain 1,146 1,244 1,242 2.91 3.16 3.14Swaziland 1 1 1 0.10 0.10 0.10Sweden 659 668 665 7.44 7.54 7.50Thailand 427 451 541 0.71 0.75 0.89Turkey 1,491 1,595 1,540 2.35 2.48 2.36Ukraine 1,672 1,724 1,760 3.32 3.45 3.56Uruguay 224 224 224 6.81 6.76 6.71Venezuela 162 430 430 0.70 1.81 1.78Zimbabwe 17 10 20 0.14 0.08 0.16
Page 162 of 316Population Source: World Bank

COURTS8. Judges, by status and sex, and financial resources, including in appeal courts
08.03 5i PMAJUDNumber of male professional judges/magistrates
1998 1999 2000 1998 1999 2000Count Rate per 100,000 inhabitants
CountryAzerbaijan 163 163 279 2.06 2.04 3.47Barbados 13 13 13 4.90 4.89 4.87Belarus 489 511 504 4.84 5.11 5.04Chile 289 291 308 1.95 1.94 2.03China 138,749 11.19Colombia 2,112 2,104 2,103 5.18 5.07 4.97Croatia 631 687 701 14.35 15.70 16.00Cyprus 59 63 63 7.88 8.36 8.32Czech Republic 879 923 974 8.53 8.96 9.46Denmark 355 336 6.67 6.30Dominica 2 2 3 4.11Dominican Republic 328 3.92England & Wales 2,861 5.40Estonia 70 85 87 4.98 6.13 6.36Finland 860 845 810 16.69 16.36 15.65France 3,380 3,376 3,437 5.79 5.76 5.84Georgia 173 180 204 3.18 3.58 4.06Germany 15,458 18.85Guatemala 259 341 243 2.40 3.07 2.13Holy See (Vatican City State) 15 15 15Hong Kong, China (SAR) 123 113 115 1.85 1.68 1.69Hungary 754 734 757 7.47 7.27 7.57Iceland 38 38 37 13.87 13.69 13.17Japan 2,621 2,641 2,691 2.08 2.08 2.12Korea, Republic of 1,349 1,405 1,479 2.91 3.00 3.13Kyrgyzstan 180 171 165 3.75 3.52 3.36Latvia 94 97 93 3.84 4.02 3.92Lithuania 280 300 309 7.56 8.11 8.36Macedonia, FYR 328 323 321 16.28 16.01 15.81Malaysia 241 249 233 1.09 1.10 1.00
Page 163 of 316Population Source: World Bank

COURTS8. Judges, by status and sex, and financial resources, including in appeal courts
08.03 5i PMAJUDNumber of male professional judges/magistrates
1998 1999 2000 1998 1999 2000Count Rate per 100,000 inhabitants
CountryMoldova, Republic of 249 256 258 5.79 5.97 6.03Montserrat 6 7 7Pakistan 15 15 15 0.01 0.01 0.01Palestinian Territory, occupied 67 64 64Panama 116 126 126 4.20 4.48 4.41Papua New Guinea 15 15 18 0.31 0.30 0.35Philippines 1,256 1,224 1,215 1.73 1.65 1.61Portugal 834 845 832 8.37 8.46 8.32Qatar 51 52 57 9.34 9.20 9.75Romania 1,189 1,212 1,081 5.28 5.39 4.83Saudi Arabia 604 621 710 3.07 3.07 3.43Singapore 55 56 53 1.40 1.42 1.32Slovakia 495 505 501 9.18 9.36 9.27Slovenia 274 284 288 13.82 14.30 14.49Spain 2,193 2,224 2,178 5.57 5.64 5.51Swaziland 9 9 9 0.91 0.88 0.86Sweden 1,035 1,074 1,033 11.69 12.13 11.65Thailand 1,989 2,004 2,389 3.33 3.33 3.94Turkey 3,954 4,204 4,164 6.24 6.54 6.38Ukraine 2,702 2,655 2,649 5.37 5.32 5.35Uruguay 216 216 216 6.57 6.52 6.47Venezuela 117 199 199 0.50 0.84 0.82Zimbabwe 56 34 61 0.46 0.27 0.48
Page 164 of 316Population Source: World Bank

COURTS8. Judges, by status and sex, and financial resources, including in appeal courts
08.04 5i LAYJUDNumber of lay judges/magistrates
1998 1999 2000 1998 1999 2000Count Rate per 100,000 inhabitants
CountryChile 354 369 363 2.39 2.46 2.39Costa Rica 1 1 1 0.03 0.03 0.03Croatia 7,035 7,143 7,190 160.01 163.29 164.16England & Wales 30,260 25,917 57.43 48.95Estonia 5,485 5,485 5,485 390.11 395.55 400.66Finland 3,600 3,600 3,600 69.86 69.70 69.54France 17,902 17,902 17,902 30.65 30.55 30.39Germany 35,781 43.53Guatemala 315 364 373 2.92 3.28 3.27Holy See (Vatican City State) 2 2 2Hong Kong, China (SAR) 10 10 10 0.15 0.15 0.15Hungary 12,120 7,345 7,345 120.00 72.72 73.45Montserrat 3 2Pakistan 15 15 17 0.01 0.01 0.01Papua New Guinea 110 110 110 2.25 2.20 2.14Russian Federation 2,879 1.97Singapore 3 3 0.08 0.07Slovenia 3,651 184.15Spain 1,516 1,723 1,884 3.85 4.37 4.77Swaziland 12 12 12 1.21 1.18 1.15Sweden 7,655 7,751 7,701 86.48 87.51 86.83Thailand 865 929 1,095 1.45 1.54 1.80Uruguay 110 110 110 3.34 3.32 3.30
Page 165 of 316Population Source: World Bank

COURTS8. Judges, by status and sex, and financial resources, including in appeal courts
08.05 5i LFEJUDNumber of female lay judges/magistrates
1998 1999 2000 1998 1999 2000Count Rate per 100,000 inhabitants
CountryChile 245 257 257 1.66 1.71 1.69Croatia 1,623 1,864 2,067 36.92 42.61 47.19England & Wales 14,699 12,714 27.90 24.01Finland 1,440 1,440 1,440 27.94 27.88 27.82Germany 17,171 20.89Guatemala 39 51 56 0.36 0.46 0.49Hong Kong, China (SAR) 1 1 1 0.02 0.01 0.01Hungary 3,963 3,963 39.24 39.63Montserrat 1 1Pakistan 2 0.00Papua New Guinea 13 13 13 0.27 0.26 0.25Singapore 2 1 0.05 0.02Slovenia 1,672 84.33Spain 929 1,061 1,199 2.36 2.69 3.04Swaziland 3 3 3 0.30 0.29 0.29Sweden 3,782 3,865 3,833 42.73 43.64 43.22Thailand 505 558 637 0.84 0.93 1.05Uruguay 26 26 26 0.79 0.78 0.78
Page 166 of 316Population Source: World Bank

COURTS8. Judges, by status and sex, and financial resources, including in appeal courts
08.06 5i LMAJUDNumber of male lay judges/magistrates
1998 1999 2000 1998 1999 2000Count Rate per 100,000 inhabitants
CountryChile 109 112 106 0.74 0.75 0.70Croatia 5,412 5,279 5,123 123.10 120.68 116.96England & Wales 15,561 13,203 29.53 24.94Finland 2,160 2,160 2,160 41.92 41.82 41.72Germany 18,610 22.64Guatemala 276 313 317 2.56 2.82 2.78Holy See (Vatican City State) 2 2 2Hong Kong, China (SAR) 9 9 9 0.14 0.13 0.13Hungary 3,382 3,382 33.49 33.82Montserrat 2 1Pakistan 15 15 15 0.01 0.01 0.01Papua New Guinea 97 97 97 1.99 1.94 1.89Singapore 1 2 0.03 0.05Slovenia 1,979 99.82Spain 584 661 685 1.48 1.68 1.73Swaziland 9 9 9 0.91 0.88 0.86Sweden 3,873 3,886 3,868 43.75 43.87 43.61Thailand 360 371 458 0.60 0.62 0.75Uruguay 84 84 84 2.55 2.54 2.52
Page 167 of 316Population Source: World Bank

COURTS8. Judges, by status and sex, and financial resources, including in appeal courts
08.07 5a CORBUDTotal court budget/financial resources
1998 1999 2000 1998 1999 2000Count Rate per 100,000 inhabitants
CountryAustralia 768 816 852 4.09 4.29 4.44Belarus 562 2,263 6,929 5.56 22.63 69.29Bulgaria 29,620 33,219 360.87 406.75Canada 924,767,000 3,062,142.38Chile 69,372 74,791 100,804 468.73 498.61 663.18Colombia 591,941 706,805 684,835 1,450.84 1,703.14 1,619.00Costa Rica 9,996 12,645 14,884 273.63 338.91 390.55Cyprus 3 3 3 0.36 0.37 0.41Czech Republic 4,246 5,434 5,845 41.22 52.76 56.75Denmark 1,173 1,173 1,247 22.12 22.05 23.38Dominica 2 2 2 2.88Egypt 661,758,918 551,274,548 299,565 1,075,605.77 879,858.07 469.40Estonia 171 203 200 12.16 14.64 14.61Finland 1,009 1,064 1,055 19.58 20.60 20.38France 24,868 26,265 27,299 42.58 44.82 46.35Georgia 2 5 8 0.04 0.11 0.15Germany 12,618 15.39Guatemala 44,291,716 58,283,739 75,237,411 410,108.48 525,078.73 659,977.29Hong Kong, China (SAR) 241 231 283 3.62 3.43 4.17Hungary 24,754 31,404 34,082 245.09 310.93 340.82Iceland 572 626 654 208.76 225.59 232.74Japan 325,820 319,260 320,501 258.59 251.39 252.36Korea, Republic of 545,332,000 567,222,000 630,149,000 1,175,284.48 1,209,428.57 1,332,238.90Latvia 7 8 7 0.27 0.32 0.31Lithuania 124 103 109 3.34 2.78 2.95Macedonia, FYR 621,867,490 77,030,820 619,866,175 30,861,910.17 3,819,078.83 30,520,244.95Mexico 91,592 111,436 430,268 96.21 115.36 439.05Panama 7,274,400 7,752,000 7,752,000 263,183.79 275,773.75 271,428.57Papua New Guinea 26 26 29 0.53 0.52 0.57Philippines 608,603,720 608,570,610 715,052,263 835,994.12 820,176.02 945,836.33
Page 168 of 316Population Source: World Bank
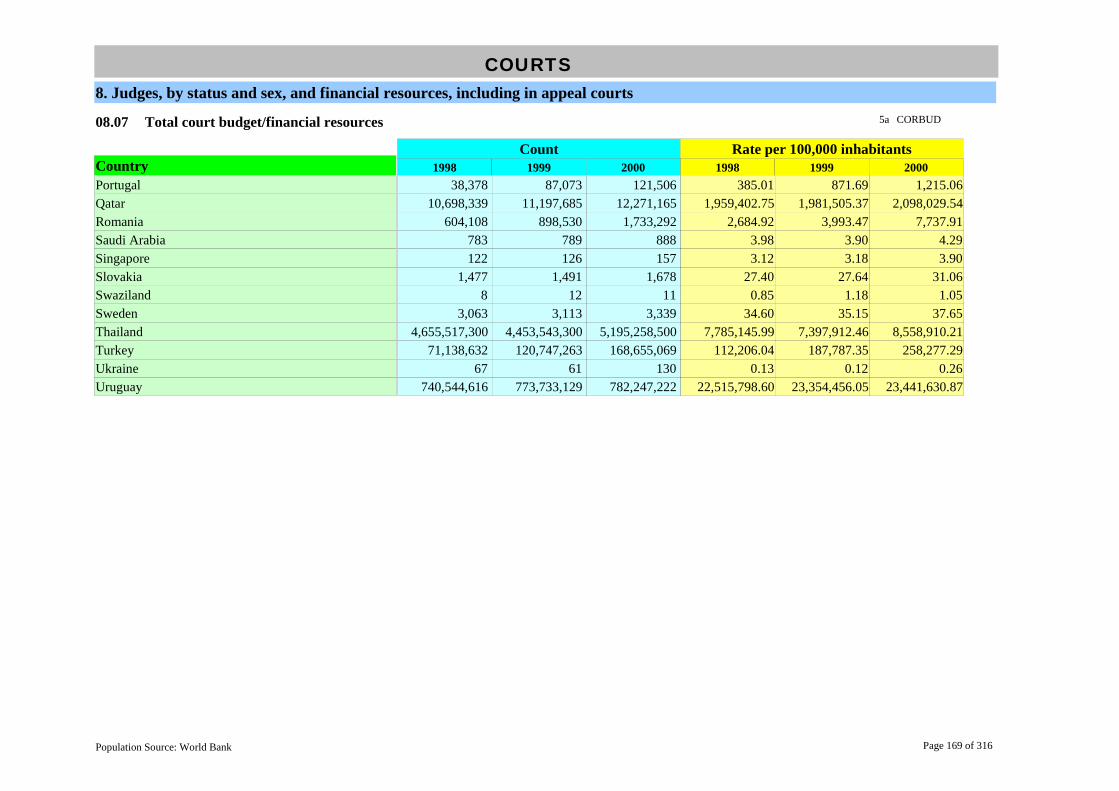
COURTS8. Judges, by status and sex, and financial resources, including in appeal courts
08.07 5a CORBUDTotal court budget/financial resources
1998 1999 2000 1998 1999 2000Count Rate per 100,000 inhabitants
CountryPortugal 38,378 87,073 121,506 385.01 871.69 1,215.06Qatar 10,698,339 11,197,685 12,271,165 1,959,402.75 1,981,505.37 2,098,029.54Romania 604,108 898,530 1,733,292 2,684.92 3,993.47 7,737.91Saudi Arabia 783 789 888 3.98 3.90 4.29Singapore 122 126 157 3.12 3.18 3.90Slovakia 1,477 1,491 1,678 27.40 27.64 31.06Swaziland 8 12 11 0.85 1.18 1.05Sweden 3,063 3,113 3,339 34.60 35.15 37.65Thailand 4,655,517,300 4,453,543,300 5,195,258,500 7,785,145.99 7,397,912.46 8,558,910.21Turkey 71,138,632 120,747,263 168,655,069 112,206.04 187,787.35 258,277.29Ukraine 67 61 130 0.13 0.12 0.26Uruguay 740,544,616 773,733,129 782,247,222 22,515,798.60 23,354,456.05 23,441,630.87
Page 169 of 316Population Source: World Bank

COURTS9. Persons brought before the criminal courts
09.01 5i TOTCORTotal number of persons brought before the criminal courts
1998 1999 2000 1998 1999 2000Count Rate per 100,000 inhabitants
CountryArmenia 6,435 6,536 6,789 169.57 171.95 178.52Australia 1,812,762 1,891,188 1,658,396 9,642.35 9,953.62 8,637.48Azerbaijan 17,566 17,375 15,779 221.99 217.65 196.04Barbados 4,677 3,728 5,406 1,762.91 1,401.08 2,024.72Belarus 61,153 61,673 58,810 605.48 616.73 588.10Bulgaria 29,051 30,530 31,533 351.83 371.95 386.10Canada 500,624 479,728 1,657.70 1,572.88Chile 193,230 215,123 230,282 1,305.61 1,434.15 1,515.01China 533,790 608,259 646,431 43.05 48.66 51.30Colombia 79,366 104,151 194.52 250.97Costa Rica 5,845 5,195 4,758 160.00 139.24 124.85Croatia 29,624 28,674 27,237 673.80 655.48 621.85Cyprus 117,101 105,204 15,634.31 13,952.79Czech Republic 73,905 84,973 86,074 717.52 824.98 835.67Denmark 106 104 112 2.00 1.96 2.10Dominica 1,319 1,169 1,019 1,395.89Dominican Republic 19,461 7,761 4,856 240.16 94.21 58.00England & Wales 1,934,338 1,866,683 3,689.52 3,542.77Estonia 8,860 9,357 10,758 630.14 674.78 785.83Finland 90,243 92,316 176,921 1,751.27 1,787.34 3,417.44France 1,184,587 1,197,319 1,109,428 2,028.40 2,043.21 1,883.58Georgia 7,177 8,233 8,581 131.88 163.87 170.80Germany 706,230 697,257 861.26 849.28Guatemala 54,874 110,574 185,958 508.09 996.16 1,631.21Holy See (Vatican City State) 18 10 6Hong Kong, China (SAR) 26,192 25,235 26,961 394.13 375.48 396.66Hungary 108,217 107,499 107,950 1,071.46 1,064.35 1,079.50Iceland 2,543 2,332 2,570 928.10 840.36 914.59India 1,776,689 1,768,001 181.29 177.15Indonesia 788,287 806,519 116,693 386.42 389.62 55.57
Page 170 of 316Population Source: World Bank

COURTS9. Persons brought before the criminal courts
09.01 5i TOTCORTotal number of persons brought before the criminal courts
1998 1999 2000 1998 1999 2000Count Rate per 100,000 inhabitants
CountryJapan 68,705 73,160 79,431 54.53 57.61 62.54Kazakhstan 58,394 66,319 77,984 386.72 445.09 523.38Korea, Republic of 201,581 195,585 192,410 434.44 417.03 406.79Kyrgyzstan 19,409 19,230 21,820 404.61 395.30 443.95Latvia 13,747 13,416 13,267 561.33 556.68 559.32Lithuania 23,173 23,386 23,782 625.79 632.22 643.63Malaysia 69,557 70,865 67,281 313.32 312.18 288.76Mexico 140,312 143,255 141,725 147.39 148.30 144.62Moldova, Republic of 15,131 16,314 17,120 351.97 380.28 399.81Montserrat 170 206 214Netherlands 105,827 109,236 674.06 691.37New Zealand 133,457 132,619 131,569 3,519.25 3,480.17 3,434.50Pakistan 6,295 5,450 9,216 4.77 4.04 6.68Panama 20,213 21,954 731.30 781.00Papua New Guinea 1,503 1,402 1,612 30.78 28.01 31.42Portugal 119,530 115,958 106,795 1,199.14 1,160.86 1,067.95Qatar 3,156 3,327 4,439 578.02 588.73 758.95Romania 280,631 265,691 265,867 1,247.25 1,180.85 1,186.91Saudi Arabia 52,232 53,903 56,380 265.14 266.85 272.37Singapore 16,222 16,031 17,137 413.51 405.64 426.51Slovakia 28,413 28,913 29,125 527.08 535.91 539.17Slovenia 11,429 11,678 12,721 576.47 588.16 639.89Swaziland 26,329 24,503 23,936 2,658.26 2,403.50 2,290.53Sweden 58,667 60,732 59,199 662.77 685.66 667.48Thailand 540,611 503,615 904.03 836.57Turkey 1,690,548 1,901,079 2,666.48 2,956.58Ukraine 258,667 247,059 258,804 514.25 495.11 522.84United States of America 14,623,330 14,203,822 5,317.57 5,109.29Uruguay 5,842 6,534 6,698 177.62 197.22 200.72Venezuela 5,803 2,149 1,659 25.01 9.07 6.86
Page 171 of 316Population Source: World Bank

COURTS9. Persons brought before the criminal courts
09.01 5i TOTCORTotal number of persons brought before the criminal courts
1998 1999 2000 1998 1999 2000Count Rate per 100,000 inhabitants
CountryZambia 8,289 5,665 3,316 85.76 57.33 32.83Zimbabwe 101,355 56,167 110,639 830.78 452.96 878.09
Page 172 of 316Population Source: World Bank

COURTS9. Persons brought before the criminal courts
09.02 5i TOTCONTotal convicted in criminal court
1998 1999 2000 1998 1999 2000Count Rate per 100,000 inhabitants
CountryAlbania 3,581 3,734 4,090 106.45 110.38 119.91Azerbaijan 16,935 15,698 14,605 214.01 196.64 181.45Belarus 59,700 59,862 57,074 591.09 598.62 570.74Bulgaria 28,074 29,391 30,405 340.00 358.08 372.29Canada 312,076 295,912 1,033.36 970.20Chile 188,884 211,198 226,652 1,276.24 1,407.99 1,491.13China 528,296 602,381 639,814 42.60 48.19 50.78Colombia 63,228 85,180 154.97 205.25Costa Rica 3,456 3,186 3,005 94.61 85.39 78.85Croatia 12,749 16,903 17,253 289.98 386.40 393.90Cyprus 82,471 73,883 11,010.81 9,798.81Czech Republic 54,083 62,594 63,211 525.08 607.71 613.70Dominica 389 433 495 678.08Dominican Republic 5,385 5,643 3,442 66.46 68.50 41.11Egypt 3,210,793 3,141,102 3,576,012 5,218.74 5,013.33 5,603.37England & Wales 1,457,566 1,398,271 2,780.13 2,653.77Estonia 8,267 8,786 10,261 587.97 633.60 749.53Finland 87,491 89,233 173,140 1,697.87 1,727.65 3,344.41France 1,145,668 1,156,969 1,069,553 1,961.76 1,974.35 1,815.88Georgia 6,998 7,973 8,284 128.59 158.70 164.89Germany 554,127 545,444 675.76 664.37Guatemala 11,292 26,366 30,180 104.56 237.53 264.74Holy See (Vatican City State) 10 4 3Hong Kong, China (SAR) 21,643 21,337 22,349 325.67 317.48 328.81Hungary 97,285 96,186 95,213 963.22 952.34 952.13Iceland 2,435 2,156 2,426 888.69 776.94 863.35India 583,420 604,547 59.53 60.58Indonesia 787,468 805,559 115,715 386.01 389.16 55.10Italy 308,666 278,660 308,300 535.88 483.78 534.32Japan 67,291 71,657 77,619 53.41 56.42 61.12
Page 173 of 316Population Source: World Bank

COURTS9. Persons brought before the criminal courts
09.02 5i TOTCONTotal convicted in criminal court
1998 1999 2000 1998 1999 2000Count Rate per 100,000 inhabitants
CountryKazakhstan 58,394 66,311 77,984 386.72 445.04 523.38Korea, Republic of 180,767 178,278 175,343 389.58 380.12 370.70Kyrgyzstan 18,484 17,652 20,168 385.32 362.87 410.34Latvia 12,952 12,862 12,689 528.87 533.69 534.95Lithuania 19,536 19,672 20,680 527.57 531.82 559.68Malaysia 52,399 50,544 51,433 236.03 222.66 220.74Mexico 120,720 124,704 122,582 126.81 129.09 125.08Moldova, Republic of 13,754 14,606 15,968 319.93 340.47 372.91Montserrat 76 183 167Netherlands 94,493 100,663 601.87 637.11New Zealand 100,205 98,647 95,734 2,642.40 2,588.68 2,499.06Norway 11,019 11,752 10,782 248.62 263.50 240.08Pakistan 526 545 1,036 0.40 0.40 0.75Palestinian Territory, occupied 1,842 1,871 1,002Panama 3,918 4,029 141.75 143.33Papua New Guinea 820 705 885 16.79 14.08 17.25Portugal 40,622 44,509 53,682 407.52 445.58 536.82Qatar 2,096 2,470 3,610 383.88 437.08 617.21Romania 125,758 98,503 89,423 558.92 437.79 399.21Russian Federation 1,071,051 1,223,255 1,183,631 728.61 837.85 810.71Singapore 11,434 11,065 11,761 291.46 279.98 292.71Slovakia 22,417 21,550 22,363 415.85 399.44 413.99Slovenia 6,365 6,489 6,895 321.04 326.82 346.83Spain 229,796 267,845 277,597 583.24 679.81 702.78Swaziland 25,037 23,602 23,108 2,527.82 2,315.12 2,211.29Sweden 54,867 56,554 55,520 619.84 638.49 626.00Switzerland 72,598 70,335 1,021.07 985.08Syrian Arab Republic 142,703 97,141 926.64 614.82Thailand 497,199 468,984 831.44 779.04Turkey 832,128 972,124 1,312.50 1,511.86
Page 174 of 316Population Source: World Bank

COURTS9. Persons brought before the criminal courts
09.02 5i TOTCONTotal convicted in criminal court
1998 1999 2000 1998 1999 2000Count Rate per 100,000 inhabitants
CountryUkraine 232,598 222,239 230,903 462.42 445.37 466.47Uruguay 4,109 5,988 4,876 124.93 180.74 146.12Zambia 4,000 3,286 1,947 41.38 33.26 19.28Zimbabwe 64,653 54,486 68,275 529.94 439.40 541.87
Page 175 of 316Population Source: World Bank

COURTS9. Persons brought before the criminal courts
09.03 5i TOTACQTotal acquitted in criminal court
1998 1999 2000 1998 1999 2000Count Rate per 100,000 inhabitants
CountryAzerbaijan 14 16 24 0.18 0.20 0.30Belarus 272 179 189 2.69 1.79 1.89Bulgaria 732 715 739 8.87 8.71 9.05Canada 10,960 10,356 36.29 33.95Chile 4,346 3,925 3,630 29.36 26.17 23.88China 5,494 5,878 6,617 0.44 0.47 0.53Colombia 16,138 18,971 39.55 45.71Costa Rica 2,389 2,009 1,753 65.40 53.85 46.00Croatia 16,875 11,771 9,984 383.82 269.08 227.95Cyprus 34,511 31,187 4,607.61 4,136.21Czech Republic 4,069 4,433 4,771 39.50 43.04 46.32Dominica 7 3 8 10.96Dominican Republic 1,988 1,821 1,199 24.53 22.10 14.32Egypt 135,291 190,371 174,230 219.90 303.84 273.01England & Wales 53,554 52,537 102.15 99.71Estonia 331 358 297 23.54 25.82 21.69Finland 2,281 2,348 2,889 44.27 45.46 55.80France 38,919 40,350 39,875 66.64 68.86 67.70Georgia 25 42 38 0.46 0.84 0.76Germany 21,667 21,672 26.42 26.40Guatemala 1,790 4,295 4,835 16.57 38.69 42.41Holy See (Vatican City State) 8 6 3Hong Kong, China (SAR) 4,549 3,898 4,612 68.45 58.00 67.85Hungary 3,880 3,993 5,007 38.42 39.53 50.07Iceland 144 142 109 52.55 51.17 38.79India 1,193,269 1,163,454 121.76 116.58Indonesia 819 960 978 0.40 0.46 0.47Japan 60 55 41 0.05 0.04 0.03Kazakhstan 282 241 201 1.87 1.62 1.35Korea, Republic of 1,248 1,347 1,161 2.69 2.87 2.45
Page 176 of 316Population Source: World Bank

COURTS9. Persons brought before the criminal courts
09.03 5i TOTACQTotal acquitted in criminal court
1998 1999 2000 1998 1999 2000Count Rate per 100,000 inhabitants
CountryKyrgyzstan 206 214 334 4.29 4.40 6.80Latvia 152 148 142 6.21 6.14 5.99Lithuania 473 464 599 12.77 12.54 16.21Malaysia 5,268 4,810 4,265 23.73 21.19 18.30Mexico 19,592 18,551 19,143 20.58 19.20 19.53Moldova, Republic of 293 337 331 6.82 7.86 7.73Montserrat 53 71 105Netherlands 3,720 4,217 23.69 26.69New Zealand 2,890 3,232 3,690 76.21 84.81 96.32Pakistan 1,106 1,143 1,806 0.84 0.85 1.31Panama 1,158 1,149 41.90 40.88Papua New Guinea 683 697 727 13.99 13.92 14.17Portugal 13,217 11,901 13,897 132.59 119.14 138.97Qatar 96 177 145 17.58 31.32 24.79Romania 22,922 21,730 25,389 101.88 96.58 113.34Singapore 141 151 111 3.59 3.82 2.76Slovakia 754 631 697 13.99 11.70 12.90Slovenia 5,064 5,189 5,826 255.42 261.34 293.06Spain 228,173 181,459 196,600 579.12 460.56 497.72Swaziland 1,184 881 968 119.54 86.42 92.63Sweden 3,800 4,178 3,679 42.93 47.17 41.48Thailand 23,925 20,668 40.01 34.33Turkey 285,835 306,445 450.84 476.59Ukraine 884 774 755 1.76 1.55 1.53Zambia 724 231 188 7.49 2.34 1.86Zimbabwe 11,050 9,885 13,952 90.57 79.72 110.73
Page 177 of 316Population Source: World Bank

COURTS9. Persons brought before the criminal courts
09.04 7c o1Other 1
1998 1999 2000 1998 1999 2000Count Rate per 100,000 inhabitants
CountryAzerbaijan 1,308 1,545 1,051 16.53 19.35 13.06Belarus 825 1,269 1,175 8.17 12.69 11.75Bulgaria 72 68 123 0.87 0.83 1.51Canada 177,588 173,460 588.04 568.72Cyprus 119 134 15.89 17.77Czech Republic 22,149 6,890 5,037 215.04 66.89 48.90Dominica 923 733 516 706.85Dominican Republic 12,088 297 215 149.18 3.61 2.57England & Wales 414,232 401,556 790.10 762.11Estonia 239 181 179 17.00 13.05 13.08Finland 471 735 892 9.14 14.23 17.23Georgia 40 60 150 0.74 1.19 2.99Germany 129,323 129,087 157.71 157.23Guatemala 4,810 11,622 34,281 44.54 104.70 300.71Hungary 7,052 7,320 7,703 69.82 72.48 77.03Iceland 36 34 35 13.14 12.25 12.46Japan 1,354 1,448 1,771 1.07 1.14 1.39Korea, Republic of 10,806 6,270 5,545 23.29 13.37 11.72Kyrgyzstan 719 1,364 1,318 14.99 28.04 26.82Latvia 150 129 6.22 5.44Lithuania 1,032 999 906 27.87 27.01 24.52Malaysia 5,933 6,616 8,058 26.73 29.15 34.58Moldova, Republic of 67 61 64 1.56 1.42 1.49Montserrat 16 13 7New Zealand 1,277 1,362 1,341 33.67 35.74 35.01Pakistan 4,664 3,762 6,374 3.53 2.79 4.62Palestinian Territory, occupied 101,469 123,154 130,354Panama 8,999 10,580 325.58 376.38Portugal 27,115 23,698 22,742 272.02 237.24 227.42Romania 72,908 63,733 74,387 324.04 283.26 332.08
Page 178 of 316Population Source: World Bank

COURTS9. Persons brought before the criminal courts
09.04 7c o1Other 1
1998 1999 2000 1998 1999 2000Count Rate per 100,000 inhabitants
CountrySingapore 2 0.05Thailand 19,487 13,963 32.59 23.19Turkey 572,585 622,510 903.13 968.13Zambia 3,565 2,148 1,181 36.88 21.74 11.69Zimbabwe 7,674 6,454 4,946 62.90 52.05 39.25
Page 179 of 316Population Source: World Bank

COURTS9. Persons brought before the criminal courts
09.04 7c o2Other 2
1998 1999 2000 1998 1999 2000Count Rate per 100,000 inhabitants
CountryBelarus 356 363 372 3.52 3.63 3.72Bulgaria 173 159 266 2.10 1.94 3.26Czech Republic 15,682 2,501 919 152.25 24.28 8.92Dominica 900 722 491 672.60England & Wales 17,162 19,059 32.73 36.17Estonia 23 32 21 1.64 2.31 1.53Georgia 114 158 109 2.09 3.14 2.17Germany 1,113 1,054 1.36 1.28Korea, Republic of 3,066 3,795 3,204 6.61 8.09 6.77Latvia 248 284 10.29 11.97Lithuania 141 172 147 3.81 4.65 3.98Moldova, Republic of 1,017 1,310 757 23.66 30.54 17.68Montserrat 25 13 4New Zealand 28,995 29,273 30,673 764.60 768.18 800.69Palestinian Territory, occupied 169,959 147,281 153,733Panama 3,552 3,561 128.51 126.68Portugal 1,796 16,024 4,590 18.02 160.42 45.90Singapore 1 1 0.03 0.02Ukraine 24,030 22,884 25,991 47.77 45.86 52.51Zimbabwe 2,710 1,649 2,663 22.21 13.30 21.13
Page 180 of 316Population Source: World Bank

COURTS9. Persons brought before the criminal courts
09.04 7c o3Other 3
1998 1999 2000 1998 1999 2000Count Rate per 100,000 inhabitants
CountryAzerbaijan 109 116 99 1.38 1.45 1.23Czech Republic 273 485 518 2.65 4.71 5.03Dominica 8 2 4 5.48Korea, Republic of 5,694 5,895 7,157 12.27 12.57 15.13Latvia 8 25 0.33 1.05Lithuania 1,991 2,079 1,450 53.77 56.20 39.24Montserrat 26 25 44New Zealand 90 105 131 2.37 2.76 3.42Palestinian Territory, occupied 148,053 140,101 167,206Panama 2,586 2,635 93.56 93.74Portugal 36,780 19,826 11,884 368.98 198.48 118.84Ukraine 1,155 1,162 1,155 2.30 2.33 2.33Zimbabwe 3,189 3,672 1,592 26.14 29.61 12.63
Page 181 of 316Population Source: World Bank

COURTS10. Persons convicted in the criminal courts, by type of crime
10.01 5j GTCONGrand total of persons convicted
1998 1999 2000 1998 1999 2000Count Rate per 100,000 inhabitants
CountryAlbania 3,581 3,734 4,090 106.45 110.38 119.91Armenia 6,435 6,536 6,789 169.57 171.95 178.52Azerbaijan 16,135 15,688 14,605 203.90 196.52 181.45Belarus 59,700 59,862 57,074 591.09 598.62 570.74Bulgaria 28,074 29,391 30,405 340.00 358.08 372.29Canada 312,076 295,912 1,033.36 970.20Chile 14,128 15,116 19,289 95.46 100.77 126.90China 528,296 602,381 639,814 42.60 48.19 50.78Colombia 79,366 104,151 194.52 250.97Costa Rica 3,456 3,186 3,005 94.61 85.39 78.85Croatia 12,749 16,903 17,253 289.98 386.40 393.90Cyprus 82,471 73,883 11,010.81 9,798.81Czech Republic 54,083 62,594 63,211 525.08 607.71 613.70Denmark 73,040 69,063 67,627 1,377.85 1,298.42 1,267.37Dominican Republic 5,385 5,643 3,442 66.46 68.50 41.11England & Wales 1,457,566 1,398,271 2,780.13 2,653.77Estonia 8,267 8,786 10,261 587.97 633.60 749.53Finland 87,491 89,233 173,140 1,697.87 1,727.65 3,344.41France 563,204 585,745 580,039 964.39 999.56 984.79Georgia 6,998 7,973 8,284 128.59 158.70 164.89Germany 554,127 545,444 675.76 664.37Guatemala 13,082 30,661 34,995 121.13 276.23 306.97Holy See (Vatican City State) 10 4 3Hong Kong, China (SAR) 20,432 20,182 21,313 307.45 300.30 313.56Hungary 97,285 96,186 95,213 963.22 952.34 952.13Iceland 1,670 1,668 2,019 609.49 601.08 718.51India 583,420 604,547 59.53 60.58Italy 303 279 308 0.53 0.48 0.53Japan 67,291 71,657 77,619 53.41 56.42 61.12Korea, Republic of 180,767 178,278 175,343 389.58 380.12 370.70
Page 182 of 316Population Source: World Bank

COURTS10. Persons convicted in the criminal courts, by type of crime
10.01 5j GTCONGrand total of persons convicted
1998 1999 2000 1998 1999 2000Count Rate per 100,000 inhabitants
CountryKyrgyzstan 18,484 17,652 20,168 385.32 362.87 410.34Latvia 12,952 12,862 12,689 528.87 533.69 534.95Lithuania 19,536 19,672 20,680 527.57 531.82 559.68Macedonia, FYR 7,062 7,719 7,435 350.47 382.70 366.08Malaysia 46,206 44,044 44,788 208.14 194.03 192.22Mexico 120,720 124,704 122,582 126.81 129.09 125.08Moldova, Republic of 13,754 14,606 15,968 319.93 340.47 372.91Montserrat 12 10 27Netherlands 94,493 100,663 601.87 637.11New Zealand 100,205 98,647 95,734 2,642.40 2,588.68 2,499.06Norway 11,019 11,752 10,782 248.62 263.50 240.08Palestinian Territory, occupied 1,842 1,871 1,002Panama 3,918 4,049 141.75 144.04Papua New Guinea 134 183 203 2.74 3.66 3.96Portugal 40,607 44,498 53,638 407.37 445.47 536.38Qatar 2,096 2,470 2,610 383.88 437.08 446.24Romania 106,221 87,576 75,407 472.09 389.23 336.64Russian Federation 1,071,051 1,223,255 1,183,631 728.61 837.85 810.71Singapore 11,434 11,065 11,761 291.46 279.98 292.71Slovakia 22,417 21,550 22,363 415.85 399.44 413.99Slovenia 6,365 6,489 6,895 321.04 326.82 346.83Spain 110,672 99,936 280.89 253.64Swaziland 13,200 13,104 13,939 1,332.71 1,285.37 1,333.88Sweden 54,867 56,554 55,520 619.84 638.49 626.00Switzerland 72,598 70,335 1,021.07 985.08Syrian Arab Republic 142,703 97,141 926.64 614.82Thailand 227,222 249,357 379.97 414.21Ukraine 232,598 222,239 230,903 462.42 445.37 466.47Uruguay 4,109 5,986 4,876 124.93 180.68 146.12Venezuela 12,450 13,402 4,294 53.66 56.55 17.74
Page 183 of 316Population Source: World Bank

COURTS10. Persons convicted in the criminal courts, by type of crime
10.01 5j GTCONGrand total of persons convicted
1998 1999 2000 1998 1999 2000Count Rate per 100,000 inhabitants
CountryZambia 4,000 3,286 1,947 41.38 33.26 19.28Zimbabwe 75,445 74,224 78,196 618.40 598.58 620.60
Page 184 of 316Population Source: World Bank

COURTS10. Persons convicted in the criminal courts, by type of crime
10.02 5j CIHCONTotal convicted for committing intentional homicide
1998 1999 2000 1998 1999 2000Count Rate per 100,000 inhabitants
CountryAlbania 202 185 138 6.00 5.47 4.05Armenia 92 119 102 2.42 3.13 2.68Azerbaijan 239 252 166 3.02 3.16 2.06Barbados 18 17 21 6.78 6.39 7.87Belarus 917 931 823 9.08 9.31 8.23Bulgaria 115 176 141 1.39 2.14 1.73Canada 86 60 0.28 0.20Chile 421 366 464 2.84 2.44 3.05Colombia 3,214 3,467 7.88 8.35Costa Rica 132 126 125 3.61 3.38 3.28Croatia 126 174 177 2.87 3.98 4.04Cyprus 12 1.59Czech Republic 189 184 167 1.83 1.79 1.62Denmark 60 42 40 1.13 0.79 0.75Dominican Republic 103 83 65 1.27 1.01 0.78Egypt 2,118 2,462 3.38 3.86England & Wales 258 260 0.49 0.49Estonia 135 128 110 9.60 9.23 8.04Finland 79 92 80 1.53 1.78 1.55France 593 585 494 1.02 1.00 0.84Georgia 272 233 198 5.00 4.64 3.94Germany 234 175 0.29 0.21Guatemala 2,865 3,150 2,954 26.53 28.38 25.91Hong Kong, China (SAR) 11 20 11 0.17 0.30 0.16Hungary 286 274 302 2.83 2.71 3.02Iceland 3 1.07India 20,541 21,348 2.10 2.14Indonesia 1,957 1,748 1,912 0.96 0.84 0.91Italy 398 475 551 0.69 0.82 0.95Japan 424 382 458 0.34 0.30 0.36
Page 185 of 316Population Source: World Bank

COURTS10. Persons convicted in the criminal courts, by type of crime
10.02 5j CIHCONTotal convicted for committing intentional homicide
1998 1999 2000 1998 1999 2000Count Rate per 100,000 inhabitants
CountryKyrgyzstan 555 360 467 11.57 7.40 9.50Latvia 92 115 91 3.76 4.77 3.84Macedonia, FYR 25 42 33 1.24 2.08 1.62Malaysia 49 48 46 0.22 0.21 0.20Mexico 2,760 2,824 2,840 2.90 2.92 2.90Moldova, Republic of 141 150 178 3.28 3.50 4.16Netherlands 1,111 1,086 7.08 6.87New Zealand 23 23 25 0.61 0.60 0.65Norway 19 21 21 0.43 0.47 0.47Palestinian Territory, occupied 43 49 51Panama 81 106 2.93 3.77Papua New Guinea 80 155 220 1.64 3.10 4.29Portugal 148 154 147 1.48 1.54 1.47Romania 1,360 1,329 1,045 6.04 5.91 4.67Russian Federation 18,623 18,746 19,415 12.67 12.84 13.30Singapore 7 2 0.18 0.05Slovakia 5,754 67 5 106.74 1.24 0.09Slovenia 38 29 49 1.92 1.46 2.46Spain 77 105 0.20 0.27Swaziland 52 28 10 5.25 2.75 0.96Sweden 68 83 101 0.77 0.94 1.14Switzerland 81 60 1.14 0.84Thailand 2,508 2,598 4.19 4.32Ukraine 3,592 3,647 4,043 7.14 7.31 8.17Uruguay 223 250 243 6.78 7.55 7.28Venezuela 4,251 4,370 1,555 18.32 18.44 6.43Zambia 223 132 98 2.31 1.34 0.97Zimbabwe 119 124 130 0.98 1.00 1.03
Page 186 of 316Population Source: World Bank

COURTS10. Persons convicted in the criminal courts, by type of crime
10.03 5j AIHCONTotal convicted for attempting intentional homicide
1998 1999 2000 1998 1999 2000Count Rate per 100,000 inhabitants
CountryAlbania 142 136 146 4.22 4.02 4.28Belarus 111 129 137 1.10 1.29 1.37Bulgaria 59 37 42 0.71 0.45 0.51Canada 87 81 0.29 0.27Costa Rica 67 63 46 1.83 1.69 1.21Croatia 75 58 75 1.71 1.33 1.71Cyprus 1 3 0.13 0.40Denmark 51 28 44 0.96 0.53 0.82Dominican Republic 31 27 8 0.38 0.33 0.10Egypt 1,798 2,479 2.87 3.88England & Wales 64 70 0.12 0.13Estonia 21 5 4 1.49 0.36 0.29Finland 63 65 84 1.22 1.26 1.62Germany 102 88 0.12 0.11Hong Kong, China (SAR) 3 1 0.04 0.01Iceland 2 1 0.73 0.36India 15,134 17,697 1.54 1.77Italy 298 256 284 0.52 0.44 0.49Japan 274 280 264 0.22 0.22 0.21Latvia 8 14 4 0.33 0.58 0.17Macedonia, FYR 3 2 0.15 0.10Mexico 243 271 300 0.26 0.28 0.31New Zealand 4 6 7 0.11 0.16 0.18Norway 7 6 6 0.16 0.13 0.13Palestinian Territory, occupied 6 5 4Panama 11 16 0.40 0.57Papua New Guinea 23 30 37 0.47 0.60 0.72Portugal 131 96 107 1.31 0.96 1.07Romania 596 524 390 2.65 2.33 1.74Saudi Arabia 424 440 616 2.15 2.18 2.98
Page 187 of 316Population Source: World Bank

COURTS10. Persons convicted in the criminal courts, by type of crime
10.03 5j AIHCONTotal convicted for attempting intentional homicide
1998 1999 2000 1998 1999 2000Count Rate per 100,000 inhabitants
CountrySingapore 1 0.02Slovakia 9 9 9 0.17 0.17 0.17Swaziland 22 5 10 2.22 0.49 0.96Switzerland 6 2 0.08 0.03Zambia 32 3 7 0.33 0.03 0.07Zimbabwe 208 233 218 1.70 1.88 1.73
Page 188 of 316Population Source: World Bank

COURTS10. Persons convicted in the criminal courts, by type of crime
10.04 6c HFACONTotal convicted for committing intentional homicide with a firearm
1998 1999 2000 1998 1999 2000Count Rate per 100,000 inhabitants
CountryBarbados 5 7 1.88 2.62Korea, Republic of 736 902 715 1.59 1.92 1.51New Zealand 1 3 7 0.03 0.08 0.18Papua New Guinea 132 122 2.64 2.38Zimbabwe 63 88 127 0.52 0.71 1.01
Page 189 of 316Population Source: World Bank

COURTS10. Persons convicted in the criminal courts, by type of crime
10.05 5j NIHCONTotal convicted for non-intentional homicide
1998 1999 2000 1998 1999 2000Count Rate per 100,000 inhabitants
CountryArmenia 12 8 7 0.32 0.21 0.18Belarus 59 79 68 0.58 0.79 0.68Bulgaria 81 72 100 0.98 0.88 1.22Canada 78 68 0.26 0.22China 982 1,012 1,094 0.08 0.08 0.09Colombia 665 775 1.63 1.87Costa Rica 47 37 30 1.29 0.99 0.79Croatia 28 30 23 0.64 0.69 0.53Cyprus 3 4 0.40 0.53Denmark 9 17 20 0.17 0.32 0.37Dominican Republic 201 211 148 2.48 2.56 1.77Egypt 1,236 2,285 1.97 3.58England & Wales 266 234 0.51 0.44Estonia 20 17 12 1.42 1.23 0.88France 731 729 687 1.25 1.24 1.17Georgia 29 27 28 0.53 0.54 0.56Germany 685 640 0.84 0.78Guatemala 805 1,154 1,510 7.45 10.40 13.25Hong Kong, China (SAR) 27 40 22 0.41 0.60 0.32Hungary 40 30 22 0.40 0.30 0.22Iceland 1 5 3 0.36 1.80 1.07India 2,133 2,191 0.22 0.22Indonesia 5,844 4,573 3,725 2.86 2.21 1.77Italy 4,167 3,859 3,473 7.23 6.70 6.02Japan 276 256 243 0.22 0.20 0.19Latvia 29 22 20 1.18 0.91 0.84Macedonia, FYR 7 7 4 0.35 0.35 0.20Malaysia 127 120 80 0.57 0.53 0.34Mexico 1,712 1,684 1,672 1.80 1.74 1.71Moldova, Republic of 34 32 28 0.79 0.75 0.65
Page 190 of 316Population Source: World Bank

COURTS10. Persons convicted in the criminal courts, by type of crime
10.05 5j NIHCONTotal convicted for non-intentional homicide
1998 1999 2000 1998 1999 2000Count Rate per 100,000 inhabitants
CountryNetherlands 53 56 0.34 0.35New Zealand 43 27 21 1.13 0.71 0.55Norway 32 42 46 0.72 0.94 1.02Panama 65 48 2.35 1.71Portugal 539 523 652 5.41 5.24 6.52Romania 1,050 909 845 4.67 4.04 3.77Russian Federation 1,325 1,172 0.90 0.80Singapore 10 8 3 0.25 0.20 0.07Slovakia 40 24 20 0.74 0.44 0.37Slovenia 1 0.05Spain 275 347 0.70 0.88Swaziland 11 4 2 1.11 0.39 0.19Sweden 96 87 107 1.08 0.98 1.21Switzerland 225 183 3.16 2.56Thailand 3,592 4,067 6.01 6.76Ukraine 306 246 325 0.61 0.49 0.66Uruguay 82 104 96 2.49 3.14 2.88Venezuela 2 2 3 0.01 0.01 0.01Zimbabwe 328 224 216 2.69 1.81 1.71
Page 191 of 316Population Source: World Bank

COURTS10. Persons convicted in the criminal courts, by type of crime
10.06 5j MASCONTotal convicted for major assault
1998 1999 2000 1998 1999 2000Count Rate per 100,000 inhabitants
CountryBelarus 1,349 1,460 1,368 13.36 14.60 13.68Canada 14,748 14,226 48.83 46.64Chile 11 77 66 0.07 0.51 0.43Croatia 525 676 554 11.94 15.45 12.65Cyprus 24 18 3.20 2.39Czech Republic 946 900 807 9.18 8.74 7.83Dominican Republic 755 419 232 9.32 5.09 2.77Egypt 1,502 1,916 2.40 3.00England & Wales 1,775 1,622 3.39 3.08Estonia 209 236 213 14.86 17.02 15.56Finland 530 619 677 10.29 11.98 13.08France 103 133 104 0.18 0.23 0.18Germany 18,518 18,567 22.58 22.62Hungary 4,771 4,446 4,557 47.24 44.02 45.57Iceland 77 50 75 28.10 18.02 26.69Indonesia 7,695 7,818 6,873 3.77 3.78 3.27Macedonia, FYR 166 196 166 8.24 9.72 8.17Malaysia 564 551 430 2.54 2.43 1.85Montserrat 1 2New Zealand 1,501 1,408 1,475 39.58 36.95 38.50Norway 665 669 625 15.00 15.00 13.92Papua New Guinea 43 62 0.86 1.21Portugal 271 213 228 2.72 2.13 2.28Romania 1,144 961 897 5.08 4.27 4.00Russian Federation 24,043 26,796 27,513 16.36 18.35 18.84Singapore 27 22 7 0.69 0.56 0.17Slovakia 1,684 1,688 1,663 31.24 31.29 30.79Slovenia 233 266 248 11.75 13.40 12.47Spain 4,041 4,298 10.26 10.91Swaziland 2,591 2,649 2,685 261.60 259.84 256.94
Page 192 of 316Population Source: World Bank

COURTS10. Persons convicted in the criminal courts, by type of crime
10.06 5j MASCONTotal convicted for major assault
1998 1999 2000 1998 1999 2000Count Rate per 100,000 inhabitants
CountrySweden 618 559 636 6.98 6.31 7.17Switzerland 53 45 0.75 0.63Uruguay 3 0.09Venezuela 52 54 8 0.22 0.23 0.03Zambia 1,634 877 486 16.91 8.88 4.81Zimbabwe 6,618 5,319 6,022 54.25 42.90 47.79
Page 193 of 316Population Source: World Bank

COURTS10. Persons convicted in the criminal courts, by type of crime
10.07 5j TASCONTotal convicted for assault
1998 1999 2000 1998 1999 2000Count Rate per 100,000 inhabitants
CountryAlbania 93 2.76Barbados 104 30 50 39.20 11.27 18.73Belarus 3,357 3,743 3,520 33.24 37.43 35.20Bulgaria 658 633 1,138 7.97 7.71 13.93Canada 46,769 44,165 154.86 144.80Chile 2,311 2,570 2,268 15.61 17.13 14.92China 56,370 67,827 73,192 4.55 5.43 5.81Colombia 8,951 9,946 21.94 23.97Costa Rica 129 96 109 3.53 2.57 2.86Croatia 289 332 271 6.57 7.59 6.19Cyprus 461 470 61.55 62.33Czech Republic 5,663 5,849 5,778 54.98 56.79 56.10Denmark 6,040 6,495 6,928 113.94 122.11 129.84Egypt 1,153 1,925 1.84 3.02England & Wales 70,501 71,346 134.47 135.41Estonia 262 295 264 18.63 21.27 19.28Finland 7,837 8,299 9,354 152.09 160.68 180.68France 51,823 52,803 52,969 88.74 90.11 89.93Georgia 646 577 503 11.87 11.48 10.01Germany 47,548 50,465 57.99 61.47Guatemala 220 304 556 2.04 2.74 4.88Hong Kong, China (SAR) 1,930 1,667 1,665 29.04 24.80 24.50Hungary 6,122 5,800 5,831 60.61 57.43 58.31Iceland 217 184 169 79.20 66.31 60.14India 62,315 73,157 6.36 7.33Italy 4,820 4,742 4,659 8.37 8.23 8.07Japan 3,884 3,472 4,598 3.08 2.73 3.62Korea, Republic of 3,751 3,904 4,147 8.08 8.32 8.77Macedonia, FYR 641 658 582 31.81 32.62 28.66Malaysia 704 714 622 3.17 3.15 2.67
Page 194 of 316Population Source: World Bank

COURTS10. Persons convicted in the criminal courts, by type of crime
10.07 5j TASCONTotal convicted for assault
1998 1999 2000 1998 1999 2000Count Rate per 100,000 inhabitants
CountryMexico 20,918 22,316 22,809 21.97 23.10 23.27Moldova, Republic of 221 199 218 5.14 4.64 5.09Montserrat 1 2Netherlands 6,161 7,280 39.24 46.08New Zealand 8,931 8,504 8,285 235.51 223.16 216.27Norway 1,317 1,311 1,161 29.72 29.39 25.85Palestinian Territory, occupied 216 234 173Panama 430 390 15.56 13.87Papua New Guinea 43 62 0.86 1.21Portugal 3,341 3,842 5,246 33.52 38.46 52.46Qatar 94 121 16.63 20.69Romania 2,837 2,440 2,578 12.61 10.84 11.51Singapore 161 114 116 4.10 2.88 2.89Slovakia 3,048 3,070 2,961 56.54 56.90 54.82Slovenia 639 703 677 32.23 35.41 34.05Swaziland 4,204 4,556 4,395 424.45 446.90 420.57Sweden 7,230 7,305 7,245 81.68 82.47 81.69Thailand 10,251 11,261 17.14 18.71Ukraine 2,647 2,521 2,540 5.26 5.05 5.13Uruguay 834 993 994 25.36 29.97 29.79Venezuela 72 75 9 0.31 0.32 0.04Zambia 1,658 911 508 17.15 9.22 5.03Zimbabwe 11,099 10,041 10,542 90.98 80.98 83.67
Page 195 of 316Population Source: World Bank

COURTS10. Persons convicted in the criminal courts, by type of crime
10.08 5j RAPCONTotal convicted for rape
1998 1999 2000 1998 1999 2000Count Rate per 100,000 inhabitants
CountryAlbania 7 5 9 0.21 0.15 0.26Armenia 20 21 16 0.53 0.55 0.42Azerbaijan 61 63 39 0.77 0.79 0.48Barbados 92 45 35 34.68 16.91 13.11Belarus 487 514 390 4.82 5.14 3.90Bulgaria 152 207 176 1.84 2.52 2.16Canada 2,860 2,677 9.47 8.78Chile 634 626 741 4.28 4.17 4.88China 24,804 25,156 24,299 2.00 2.01 1.93Costa Rica 140 152 155 3.83 4.07 4.07Croatia 32 45 57 0.73 1.03 1.30Cyprus 2 0.27Czech Republic 203 165 139 1.97 1.60 1.35Denmark 187 200 221 3.53 3.76 4.14Dominican Republic 77 145 103 0.95 1.76 1.23England & Wales 675 659 1.29 1.25Estonia 53 37 39 3.77 2.67 2.85Finland 43 45 50 0.83 0.87 0.97France 1,719 1,845 1,747 2.94 3.15 2.97Georgia 23 45 22 0.42 0.90 0.44Germany 1,873 1,917 2.28 2.33Guatemala 1,244 1,799 1,879 11.52 16.21 16.48Hong Kong, China (SAR) 13 16 11 0.20 0.24 0.16Hungary 203 173 163 2.01 1.71 1.63Iceland 13 4 3 4.74 1.44 1.07India 3,715 4,395 0.38 0.44Indonesia 1,985 1,873 2,212 0.97 0.90 1.05Ireland 46 48 51 1.24 1.28 1.34Italy 1,390 1,310 1,291 2.41 2.27 2.24Japan 722 718 688 0.57 0.57 0.54
Page 196 of 316Population Source: World Bank

COURTS10. Persons convicted in the criminal courts, by type of crime
10.08 5j RAPCONTotal convicted for rape
1998 1999 2000 1998 1999 2000Count Rate per 100,000 inhabitants
CountryKorea, Republic of 2,863 1,962 1,915 6.17 4.18 4.05Kyrgyzstan 300 266 300 6.25 5.47 6.10Latvia 81 67 85 3.31 2.78 3.58Macedonia, FYR 29 25 21 1.44 1.24 1.03Malaysia 302 249 161 1.36 1.10 0.69Mexico 2,513 2,596 2,589 2.64 2.69 2.64Moldova, Republic of 147 149 109 3.42 3.47 2.55Montserrat 1Netherlands 335 337 2.13 2.13New Zealand 249 239 216 6.57 6.27 5.64Norway 40 31 25 0.90 0.70 0.56Palestinian Territory, occupied 4 8 4Panama 198 250 7.16 8.89Papua New Guinea 84 157 136 1.72 3.14 2.65Portugal 72 61 64 0.72 0.61 0.64Romania 776 727 627 3.45 3.23 2.80Russian Federation 7,245 6,827 6,441 4.93 4.68 4.41Singapore 7 1 3 0.18 0.03 0.07Slovakia 89 73 58 1.65 1.35 1.07Slovenia 26 27 16 1.31 1.36 0.80Spain 322 820 0.82 2.08Swaziland 54 53 33 5.45 5.20 3.16Sweden 127 98 121 1.43 1.11 1.36Switzerland 91 97 1.28 1.36Thailand 2,786 3,066 4.66 5.09Ukraine 1,116 1,082 904 2.22 2.17 1.83Uruguay 72 88 71 2.19 2.66 2.13Venezuela 675 693 139 2.91 2.92 0.57Zambia 11 59 47 0.11 0.60 0.47Zimbabwe 1,397 1,329 1,263 11.45 10.72 10.02
Page 197 of 316Population Source: World Bank

COURTS10. Persons convicted in the criminal courts, by type of crime
10.09 5j ROBCONTotal convicted for robbery
1998 1999 2000 1998 1999 2000Count Rate per 100,000 inhabitants
CountryArmenia 65 54 78 1.71 1.42 2.05Azerbaijan 95 102 115 1.20 1.28 1.43Barbados 39 23 21 14.70 8.64 7.87Belarus 1,313 1,409 1,334 13.00 14.09 13.34Bulgaria 1,030 920 1,356 12.47 11.21 16.60Canada 4,709 4,393 15.59 14.40Chile 3,655 3,640 5,529 24.70 24.27 36.38China 80,770 93,093 97,214 6.51 7.45 7.72Costa Rica 895 903 856 24.50 24.20 22.46Croatia 131 161 205 2.98 3.68 4.68Cyprus 1 1 0.13 0.13Czech Republic 1,619 1,490 1,427 15.72 14.47 13.85Denmark 897 964 1,106 16.92 18.12 20.73Dominican Republic 1,174 1,445 775 14.49 17.54 9.26Egypt 2,127 2,184 3.39 3.42England & Wales 5,542 5,626 10.57 10.68Estonia 873 922 1,086 62.09 66.49 79.33Finland 408 447 545 7.92 8.65 10.53France 589 423 441 1.01 0.72 0.75Georgia 226 241 222 4.15 4.80 4.42Germany 10,875 10,076 13.26 12.27Guatemala 4,464 5,893 9,150 41.33 53.09 80.26Hong Kong, China (SAR) 469 534 567 7.06 7.95 8.34Hungary 1,594 1,509 1,552 15.78 14.94 15.52Iceland 2 9 27 0.73 3.24 9.61India 9,969 11,585 1.02 1.16Italy 7,377 6,623 6,970 12.81 11.50 12.08Japan 1,028 1,227 1,451 0.82 0.97 1.14Korea, Republic of 2,052 1,633 1,420 4.42 3.48 3.00Latvia 360 378 644 14.70 15.68 27.15
Page 198 of 316Population Source: World Bank

COURTS10. Persons convicted in the criminal courts, by type of crime
10.09 5j ROBCONTotal convicted for robbery
1998 1999 2000 1998 1999 2000Count Rate per 100,000 inhabitants
CountryMacedonia, FYR 61 114 106 3.03 5.65 5.22Malaysia 805 782 634 3.63 3.44 2.72Mexico 41,991 43,548 41,207 44.11 45.08 42.05Moldova, Republic of 731 834 786 17.00 19.44 18.36Netherlands 3,421 3,622 21.79 22.92New Zealand 590 572 479 15.56 15.01 12.50Norway 119 180 211 2.69 4.04 4.70Palestinian Territory, occupied 14 15 14Panama 493 532 17.84 18.93Papua New Guinea 91 23 31 1.86 0.46 0.60Portugal 1,286 1,172 1,465 12.90 11.73 14.65Qatar 2 6 1 0.37 1.06 0.17Romania 3,174 3,054 2,670 14.11 13.57 11.92Russian Federation 58,306 64,285 64,717 39.66 44.03 44.33Singapore 185 34 39 4.72 0.86 0.97Slovakia 591 699 689 10.96 12.96 12.76Slovenia 80 89 90 4.04 4.48 4.53Spain 35,342 31,330 89.70 79.52Swaziland 215 260 263 21.71 25.50 25.17Sweden 592 604 797 6.69 6.82 8.99Switzerland 350 374 4.92 5.24Syrian Arab Republic 10,495 10,389 68.15 65.75Thailand 1,296 1,269 2.17 2.11Ukraine 8,314 8,520 8,293 16.53 17.07 16.75Uruguay 522 516 561 15.87 15.58 16.81Venezuela 5,047 5,267 1,821 21.75 22.22 7.52Zambia 301 194 107 3.11 1.96 1.06Zimbabwe 1,502 1,706 2,268 12.31 13.76 18.00
Page 199 of 316Population Source: World Bank

COURTS10. Persons convicted in the criminal courts, by type of crime
10.10 5j MTFCONTotal convicted for major theft
1998 1999 2000 1998 1999 2000Count Rate per 100,000 inhabitants
CountryAlbania 42 244 1.24 7.15Azerbaijan 783 552 576 9.90 6.91 7.16Canada 3,180 2,777 10.53 9.10Costa Rica 139 106 92 3.81 2.84 2.41Croatia 1,511 1,798 1,851 34.37 41.10 42.26Denmark 23,597 21,906 20,993 445.14 411.84 393.42Finland 531 622 627 10.30 12.04 12.11France 682 597 577 1.17 1.02 0.98Georgia 47 15 34 0.86 0.30 0.68Germany 6,830 7,476 8.33 9.11Guatemala 2,653 4,788 5,282 24.56 43.14 46.33Hungary 17,416 16,674 14,587 172.44 165.09 145.87Iceland 197 220 290 71.90 79.28 103.20Latvia 658 583 298 26.87 24.19 12.56Macedonia, FYR 186 901 775 9.23 44.67 38.16Malaysia 4,120 4,385 3,996 18.56 19.32 17.15Moldova, Republic of 126 176 173 2.93 4.10 4.04Norway 2,077 2,150 1,848 46.86 48.21 41.15Papua New Guinea 22 31 54 0.45 0.62 1.05Portugal 3,625 3,465 3,780 36.37 34.69 37.80Saudi Arabia 6,623 6,999 6,346 33.62 34.65 30.66Singapore 1,519 1,505 1,544 38.72 38.08 38.43Slovenia 58 63 76 2.93 3.17 3.82Spain 4,471 3,666 11.35 9.30Swaziland 2,028 2,606 2,593 204.75 255.62 248.13Sweden 1,251 1,150 1,139 14.13 12.98 12.84Switzerland 729 644 10.25 9.02Ukraine 5,782 3,273 2,563 11.50 6.56 5.18Venezuela 717 783 143 3.09 3.30 0.59Zambia 1,324 1,012 543 13.70 10.24 5.38
Page 200 of 316Population Source: World Bank

COURTS10. Persons convicted in the criminal courts, by type of crime
10.10 5j MTFCONTotal convicted for major theft
1998 1999 2000 1998 1999 2000Count Rate per 100,000 inhabitants
CountryZimbabwe 5,807 6,728 10,214 47.60 54.26 81.06
Page 201 of 316Population Source: World Bank

COURTS10. Persons convicted in the criminal courts, by type of crime
10.11 5j TFTCONTotal convicted for theft
1998 1999 2000 1998 1999 2000Count Rate per 100,000 inhabitants
CountryAlbania 534 210 755 15.87 6.21 22.13Armenia 1,400 1,296 1,182 36.89 34.10 31.08Azerbaijan 859 1,523 1,541 10.86 19.08 19.15Belarus 22,131 23,287 22,508 219.12 232.87 225.08Bulgaria 16,174 13,001 15,226 195.88 158.39 186.43Canada 38,028 35,052 125.92 114.92Chile 1,681 1,347 1,839 11.36 8.98 12.10China 186,644 202,232 187,884 15.05 16.18 14.91Colombia 15,329 22,230 37.57 53.57Croatia 1,621 2,126 1,954 36.87 48.60 44.61Cyprus 398 327 53.14 43.37Czech Republic 15,473 15,292 15,130 150.22 148.47 146.89Denmark 26,073 24,359 23,190 491.85 457.96 434.60England & Wales 100,616 107,867 191.91 204.72Estonia 590 607 720 41.96 43.77 52.59Finland 35,063 34,243 33,911 680.44 662.98 655.03France 99,857 97,979 93,216 170.99 167.20 158.26Georgia 1,771 2,137 2,202 32.54 42.54 43.83Germany 141,134 132,964 172.11 161.95Guatemala 6,138 9,989 12,469 56.83 89.99 109.38Hong Kong, China (SAR) 6,438 6,770 7,205 96.88 100.73 106.00Hungary 36,932 34,994 31,305 365.66 346.48 313.05Iceland 197 220 290 71.90 79.28 103.20India 44,870 44,560 4.58 4.46Indonesia 34,502 38,635 29,407 16.91 18.66 14.00Italy 49,207 50,698 55,850 85.43 88.02 96.79Japan 15,337 17,026 17,247 12.17 13.41 13.58Korea, Republic of 14,004 13,146 13,254 30.18 28.03 28.02Kyrgyzstan 5,882 6,113 7,473 122.62 125.66 152.04Latvia 3,223 3,120 2,846 131.60 129.46 119.98
Page 202 of 316Population Source: World Bank

COURTS10. Persons convicted in the criminal courts, by type of crime
10.11 5j TFTCONTotal convicted for theft
1998 1999 2000 1998 1999 2000Count Rate per 100,000 inhabitants
CountryLithuania 10,137 9,592 11,087 273.75 259.31 300.05Malaysia 2,245 2,214 2,411 10.11 9.75 10.35Moldova, Republic of 7,421 7,943 8,986 172.62 185.15 209.86Montserrat 1Netherlands 25,580 26,747 162.93 169.28New Zealand 5,828 6,110 5,943 153.68 160.34 155.14Norway 3,029 3,254 2,851 68.34 72.96 63.48Palestinian Territory, occupied 285 277 223Panama 639 553 23.12 19.67Portugal 4,960 4,819 5,570 49.76 48.24 55.70Qatar 58 215 143 10.62 38.05 24.45Romania 44,036 33,675 27,411 195.72 149.67 122.37Russian Federation 471,228 591,567 598,460 320.56 405.18 409.90Singapore 2,263 2,150 2,244 57.69 54.40 55.85Slovakia 7,507 5,809 6,712 139.26 107.67 124.26Slovenia 872 814 931 43.98 41.00 46.83Swaziland 2,216 2,803 2,776 223.73 274.95 265.65Sweden 8,573 7,636 7,174 96.85 86.21 80.89Thailand 27,907 26,436 46.67 43.91Ukraine 59,546 58,122 65,158 118.38 116.48 131.63Uruguay 2,707 2,841 3,000 82.30 85.75 89.90Venezuela 797 849 153 3.44 3.58 0.63Zambia 2,920 2,823 953 30.21 28.57 9.44Zimbabwe 16,765 18,911 22,152 137.42 152.51 175.81
Page 203 of 316Population Source: World Bank

COURTS10. Persons convicted in the criminal courts, by type of crime
10.12 6c ATCONTotal convicted for automobile theft
1998 1999 2000 1998 1999 2000Count Rate per 100,000 inhabitants
CountryAzerbaijan 49 60 44 0.62 0.75 0.55Belarus 1,160 1,087 1,036 11.49 10.87 10.36Bulgaria 251 279 344 3.04 3.40 4.21Croatia 47 6 2 1.07 0.14 0.05Denmark 2,476 2,453 2,197 46.71 46.12 41.17England & Wales 14,989 15,430 28.59 29.28Estonia 235 235 238 16.71 16.95 17.38Georgia 119 132 57 2.19 2.63 1.13Hungary 878 847 869 8.69 8.39 8.69Iceland 64 55 77 23.36 19.82 27.40India 8,379 0.84Macedonia, FYR 129 155 127 6.40 7.68 6.25Malaysia 4,097 4,565 4,396 18.45 20.11 18.87New Zealand 1,341 1,237 1,080 35.36 32.46 28.19Norway 258 259 223 5.82 5.81 4.97Papua New Guinea 6 10 0.12 0.20Romania 125 0.56Russian Federation 20,898 21,978 18,209 14.22 15.05 12.47Singapore 112 51 95 2.85 1.29 2.36Slovakia 247 177 111 4.58 3.28 2.05Slovenia 147 106 141 7.41 5.34 7.09Spain 3,485 2,736 8.85 6.94Sweden 1,649 1,620 1,430 18.63 18.29 16.12Ukraine 2,068 1,818 1,390 4.11 3.64 2.81Zambia 418 18 38 4.32 0.18 0.38Zimbabwe 91 371 540 0.75 2.99 4.29
Page 204 of 316Population Source: World Bank

COURTS10. Persons convicted in the criminal courts, by type of crime
10.13 5j BURCONTotal convicted for burglary
1998 1999 2000 1998 1999 2000Count Rate per 100,000 inhabitants
CountryAlbania 3 10 0.09 0.29Armenia 54 97 63 1.42 2.55 1.66Barbados 7 24 15 2.64 9.02 5.62Canada 18,890 16,094 62.55 52.77Cyprus 192 193 25.63 25.60Czech Republic 4,675 6,216 5,505 45.39 60.35 53.45Denmark 3,841 3,550 3,322 72.46 66.74 62.26England & Wales 30,769 29,261 58.69 55.53Estonia 3,755 3,953 3,653 267.06 285.07 266.84Germany 22,021 18,973 26.85 23.11Hong Kong, China (SAR) 660 552 555 9.93 8.21 8.17Iceland 20 12 13 7.30 4.32 4.63India 17,935 18,134 1.83 1.82Japan 523 536 664 0.42 0.42 0.52Korea, Republic of 380 247 224 0.82 0.53 0.47Kyrgyzstan 562 422 423 11.72 8.67 8.61Latvia 2,789 2,708 2,699 113.88 112.37 113.79Macedonia, FYR 1,343 1,796 1,814 66.65 89.04 89.32Malaysia 1,446 1,541 1,218 6.51 6.79 5.23Montserrat 8 7 18New Zealand 3,303 3,151 3,130 87.10 82.69 81.71Norway 56 35 34 1.26 0.78 0.76Qatar 103 84 98 18.86 14.86 16.76Singapore 165 79 69 4.21 2.00 1.72Slovakia 1,273 1,410 1,338 23.61 26.13 24.77Slovenia 546 692 632 27.54 34.85 31.79Swaziland 1,304 1,202 1,313 131.66 117.90 125.65Switzerland 1,226 1,101 17.24 15.42Zambia 408 286 176 4.22 2.89 1.74Zimbabwe 8,867 10,284 12,337 72.68 82.94 97.91
Page 205 of 316Population Source: World Bank

COURTS10. Persons convicted in the criminal courts, by type of crime
10.14 5j FRDCONTotal convicted for fraud
1998 1999 2000 1998 1999 2000Count Rate per 100,000 inhabitants
CountryAlbania 36 33 46 1.07 0.98 1.35Armenia 180 179 224 4.74 4.71 5.89Azerbaijan 151 353 329 1.91 4.42 4.09Belarus 580 698 898 5.74 6.98 8.98Bulgaria 410 358 503 4.97 4.36 6.16Canada 13,171 12,243 43.61 40.14Chile 268 212 372 1.81 1.41 2.45China 14,705 16,471 17,063 1.19 1.32 1.35Colombia 312 374 0.76 0.90Costa Rica 86 66 39 2.35 1.77 1.02Croatia 577 857 840 13.12 19.59 19.18Czech Republic 3,664 5,138 6,034 35.57 49.88 58.58Denmark 2,945 2,574 2,573 55.56 48.39 48.22Dominican Republic 126 219 117 1.55 2.66 1.40England & Wales 17,198 17,786 32.80 33.76Estonia 175 211 262 12.45 15.22 19.14Finland 3,615 3,807 4,173 70.15 73.71 80.61France 6,667 6,742 6,488 11.42 11.51 11.02Georgia 103 2.05Germany 105,359 108,018 128.49 131.57Guatemala 711 913 910 6.58 8.23 7.98Hong Kong, China (SAR) 409 443 359 6.15 6.59 5.28Hungary 3,019 3,383 4,543 29.89 33.50 45.43Iceland 24 43 50 8.76 15.50 17.79India 4,927 5,969 0.50 0.60Indonesia 2,002 2,011 2,115 0.98 0.97 1.01Italy 4,560 3,798 3,824 7.92 6.59 6.63Japan 3,736 3,820 4,113 2.97 3.01 3.24Korea, Republic of 18,122 20,865 19,324 39.06 44.49 40.85Latvia 107 134 142 4.37 5.56 5.99
Page 206 of 316Population Source: World Bank

COURTS10. Persons convicted in the criminal courts, by type of crime
10.14 5j FRDCONTotal convicted for fraud
1998 1999 2000 1998 1999 2000Count Rate per 100,000 inhabitants
CountryMacedonia, FYR 146 207 228 7.25 10.26 11.23Malaysia 257 322 266 1.16 1.42 1.14Mexico 1,791 1,618 1,593 1.88 1.67 1.63Moldova, Republic of 122 108 101 2.84 2.52 2.36Netherlands 5,440 5,990 34.65 37.91New Zealand 2,892 2,743 2,556 76.26 71.98 66.72Norway 1,341 1,293 1,100 30.26 28.99 24.49Palestinian Territory, occupied 143 168 128Panama 49 46 1.77 1.64Papua New Guinea 34 2 52 0.70 0.04 1.01Portugal 806 642 688 8.09 6.43 6.88Qatar 22 50 4.03 8.85Romania 2,310 2,295 1,876 10.27 10.20 8.38Russian Federation 17,676 17,547 16,328 12.02 12.02 11.18Singapore 161 90 21 4.10 2.28 0.52Slovakia 751 717 1,157 13.93 13.29 21.42Slovenia 479 470 546 24.16 23.67 27.46Spain 1,557 1,483 3.95 3.76Swaziland 14 13 6 1.41 1.28 0.57Sweden 1,205 1,249 1,099 13.61 14.10 12.39Switzerland 1,535 1,485 21.59 20.80Thailand 1,395 1,405 2.33 2.33Ukraine 2,753 2,458 2,676 5.47 4.93 5.41Uruguay 302 329 325 9.18 9.93 9.74Venezuela 51 56 11 0.22 0.24 0.05Zambia 269 52 43 2.78 0.53 0.43Zimbabwe 3,666 6,631 10,917 30.05 53.48 86.64
Page 207 of 316Population Source: World Bank

COURTS10. Persons convicted in the criminal courts, by type of crime
10.15 5j EMBCONTotal convicted for embezzlement
1998 1999 2000 1998 1999 2000Count Rate per 100,000 inhabitants
CountryArmenia 139 110 140 3.66 2.89 3.68Azerbaijan 117 281 302 1.48 3.52 3.75Belarus 1,424 1,423 1,372 14.10 14.23 13.72Bulgaria 447 385 588 5.41 4.69 7.20Chile 257 242 324 1.74 1.61 2.13China 6,480 7,180 8,202 0.52 0.57 0.65Costa Rica 24 25 12 0.66 0.67 0.31Croatia 103 152 158 2.34 3.47 3.61Cyprus 8 12 1.07 1.59Czech Republic 2,255 2,620 2,951 21.89 25.44 28.65Denmark 464 443 431 8.75 8.33 8.08Egypt 516 1,120 0.82 1.75Estonia 124 165 158 8.82 11.90 11.54Finland 755 810 804 14.65 15.68 15.53France 1,981 2,387 2,352 3.39 4.07 3.99Germany 7,809 7,916 9.52 9.64Guatemala 709 1,348 1,391 6.56 12.14 12.20Hungary 2,382 2,235 2,291 23.58 22.13 22.91Iceland 20 17 15 7.30 6.13 5.34India 2,463 3,275 0.25 0.33Indonesia 1,844 2,171 1,921 0.90 1.05 0.91Italy 1,625 1,637 1,552 2.82 2.84 2.69Japan 510 478 581 0.40 0.38 0.46Korea, Republic of 3,083 3,240 2,713 6.64 6.91 5.74Latvia 160 138 145 6.53 5.73 6.11Macedonia, FYR 76 81 66 3.77 4.02 3.25Malaysia 257 610 614 1.16 2.69 2.64Mexico 648 572 543 0.68 0.59 0.55Moldova, Republic of 258 225 207 6.00 5.24 4.83Netherlands 954 1,088 6.08 6.89
Page 208 of 316Population Source: World Bank

COURTS10. Persons convicted in the criminal courts, by type of crime
10.15 5j EMBCONTotal convicted for embezzlement
1998 1999 2000 1998 1999 2000Count Rate per 100,000 inhabitants
CountryNew Zealand 110 72 61 2.90 1.89 1.59Norway 202 208 231 4.56 4.66 5.14Panama 39 29 1.41 1.03Portugal 234 273 409 2.35 2.73 4.09Romania 7 2 0.03 0.01Russian Federation 10,818 13,899 15,094 7.36 9.52 10.34Singapore 90 65 30 2.29 1.64 0.75Slovakia 624 549 625 11.58 10.18 11.57Slovenia 37 43 40 1.87 2.17 2.01Spain 1,289 1,156 3.27 2.93Sweden 272 254 201 3.07 2.87 2.27Switzerland 906 885 12.74 12.39Thailand 1,508 1,398 2.52 2.32Ukraine 22 18 14 0.04 0.04 0.03Uruguay 112 132 160 3.41 3.98 4.79Venezuela 1 1 0.00 0.00Zimbabwe 5,703 6,872 7,075 46.75 55.42 56.15
Page 209 of 316Population Source: World Bank

COURTS10. Persons convicted in the criminal courts, by type of crime
10.16 5j DRGCONTotal convicted for all drug offenses
1998 1999 2000 1998 1999 2000Count Rate per 100,000 inhabitants
CountryAlbania 79 155 223 2.35 4.58 6.54Armenia 543 442 403 14.31 11.63 10.60Azerbaijan 1,900 1,875 1,658 24.01 23.49 20.60Barbados 17 5 15 6.41 1.88 5.62Belarus 1,683 1,332 1,519 16.66 13.32 15.19Bulgaria 80 119 232 0.97 1.45 2.84Canada 15,178 15,606 50.26 51.17Chile 4,453 5,735 7,431 30.09 38.23 48.89China 27,175 33,589 32,916 2.19 2.69 2.61Colombia 5,436 7,476 13.32 18.01Costa Rica 433 493 461 11.85 13.21 12.10Croatia 1,059 1,782 2,075 24.09 40.74 47.37Cyprus 17 19 2.27 2.52Czech Republic 802 891 972 7.79 8.65 9.44Denmark 8,315 7,728 7,637 156.86 145.29 143.12Dominican Republic 869 978 528 10.72 11.87 6.31Egypt 17,746 25,867 28.32 40.53England & Wales 48,826 48,717 93.13 92.46Estonia 67 143 322 4.77 10.31 23.52Finland 3,985 4,551 5,812 77.33 88.11 112.27France 23,836 24,112 22,917 40.82 41.15 38.91Georgia 719 838 929 13.21 16.68 18.49Germany 42,377 45,033 51.68 54.85Guatemala 1,753 2,915 4,770 16.23 26.26 41.84Hong Kong, China (SAR) 2,336 1,578 1,438 35.15 23.48 21.16Hungary 500 705 1,151 4.95 6.98 11.51Iceland 362 453 651 132.12 163.24 231.67India 8,168 7,961 0.83 0.80Indonesia 1,830 1,829 5,047 0.90 0.88 2.40Italy 20,715 18,134 17,849 35.96 31.48 30.93
Page 210 of 316Population Source: World Bank

COURTS10. Persons convicted in the criminal courts, by type of crime
10.16 5j DRGCONTotal convicted for all drug offenses
1998 1999 2000 1998 1999 2000Count Rate per 100,000 inhabitants
CountryJapan 13,317 13,537 15,755 10.57 10.66 12.41Korea, Republic of 3,862 4,841 4,611 8.32 10.32 9.75Kyrgyzstan 263 2,245 2,542 5.48 46.15 51.72Latvia 151 172 162 6.17 7.14 6.83Lithuania 357 395 515 9.64 10.68 13.94Macedonia, FYR 115 145 1,983 5.71 7.19 97.64Malaysia 12,612 12,922 12,484 56.81 56.93 53.58Mexico 7,684 7,487 8,719 8.07 7.75 8.90Moldova, Republic of 565 994 1,347 13.14 23.17 31.46Morocco 23,837 25,558 23,214 85.74 90.63 80.89Netherlands 6,791 6,914 43.25 43.76New Zealand 7,313 7,128 6,845 192.84 187.05 178.68Norway 2,497 2,780 2,598 56.34 62.33 57.85Palestinian Territory, occupied 10 19 26Panama 1,107 1,228 40.05 43.69Portugal 4,538 3,127 3,540 45.53 31.30 35.40Romania 279 267 258 1.24 1.19 1.15Russian Federation 101,510 108,290 99,114 69.05 74.17 67.89Slovakia 396 129 266 7.35 2.39 4.92Slovenia 151 155 175 7.62 7.81 8.80Spain 7,235 6,803 18.36 17.27Swaziland 453 440 526 45.74 43.16 50.33Sweden 4,359 3,917 4,028 49.24 44.22 45.42Switzerland 8,565 8,035 120.46 112.54Thailand 175,979 197,857 294.28 328.67Ukraine 23,687 24,556 25,592 47.09 49.21 51.70Uruguay 115 179 278 3.50 5.40 8.33Venezuela 1,840 1,945 528 7.93 8.21 2.18Zambia 344 225 131 3.56 2.28 1.30Zimbabwe 2,504 2,869 3,545 20.52 23.14 28.13
Page 211 of 316Population Source: World Bank

COURTS10. Persons convicted in the criminal courts, by type of crime
10.17 5j BRICONTotal convicted for bribery
1998 1999 2000 1998 1999 2000Count Rate per 100,000 inhabitants
CountryAlbania 1 0.03Armenia 13 12 28 0.34 0.32 0.74Azerbaijan 45 45 45 0.57 0.56 0.56Belarus 246 224 220 2.44 2.24 2.20Bulgaria 32 26 38 0.39 0.32 0.47Chile 5 8 7 0.03 0.05 0.05China 8,770 8,568 9,729 0.71 0.69 0.77Costa Rica 10 4 4 0.27 0.11 0.10Croatia 31 55 44 0.71 1.26 1.00Cyprus 1 1 0.13 0.13Czech Republic 111 110 118 1.08 1.07 1.15Egypt 528 1,225 0.84 1.92Estonia 28 20 43 1.99 1.44 3.14Finland 5 3 3 0.10 0.06 0.06France 193 314 279 0.33 0.54 0.47Georgia 11 2 18 0.20 0.04 0.36Germany 427 395 0.52 0.48Guatemala 380 369 600 3.52 3.32 5.26Hong Kong, China (SAR) 130 74 107 1.96 1.10 1.57Hungary 278 297 294 2.75 2.94 2.94India 654 684 0.07 0.07Indonesia 136 391 232 0.07 0.19 0.11Italy 963 723 717 1.67 1.26 1.24Japan 187 153 119 0.15 0.12 0.09Korea, Republic of 803 1,466 960 1.73 3.13 2.03Latvia 17 32 10 0.69 1.33 0.42Lithuania 44 43 51 1.19 1.16 1.38Macedonia, FYR 11 23 19 0.55 1.14 0.94Malaysia 230 641 800 1.04 2.82 3.43Mexico 49 239 247 0.05 0.25 0.25
Page 212 of 316Population Source: World Bank

COURTS10. Persons convicted in the criminal courts, by type of crime
10.17 5j BRICONTotal convicted for bribery
1998 1999 2000 1998 1999 2000Count Rate per 100,000 inhabitants
CountryMoldova, Republic of 18 22 32 0.42 0.51 0.75Netherlands 2 3 0.01 0.02New Zealand 3 2 8 0.08 0.05 0.21Papua New Guinea 30 42 12 0.61 0.84 0.23Portugal 33 24 43 0.33 0.24 0.43Qatar 1 41 1 0.18 7.26 0.17Romania 534 381 298 2.37 1.69 1.33Russian Federation 1,314 1,515 1,529 0.89 1.04 1.05Singapore 72 110 153 1.84 2.78 3.81Slovakia 7 8 30 0.13 0.15 0.56Slovenia 18 15 9 0.91 0.76 0.45Spain 33 40 0.08 0.10Sweden 14 7 9 0.16 0.08 0.10Switzerland 29 16 0.41 0.22Ukraine 504 441 505 1.00 0.88 1.02Uruguay 35 9 16 1.06 0.27 0.48Venezuela 12 12 0.05 0.05Zambia 480 330 112 4.97 3.34 1.11Zimbabwe 673 810 1,750 5.52 6.53 13.89
Page 213 of 316Population Source: World Bank

COURTS11. Adults convicted of any type of crime, by number and type of sentence
11.01 5i TOTSENTotal adults sentenced
1998 1999 2000 1998 1999 2000Count Rate per 100,000 inhabitants
CountryArmenia 6,151 6,205 6,526 162.08 163.25 171.60Australia 12,556 14,093 14,711 66.79 74.17 76.62Azerbaijan 15,765 15,347 14,221 199.23 192.25 176.68Belarus 53,537 53,752 51,394 530.07 537.52 513.94Bulgaria 25,428 26,760 27,013 307.96 326.02 330.76Canada 240,115 227,728 795.08 746.65China 494,684 562,367 598,106 39.89 44.99 47.47Colombia 57,778 77,028 141.61 185.61Costa Rica 3,456 3,186 3,005 94.61 85.39 78.85Croatia 12,243 16,206 16,466 278.47 370.46 375.94Cyprus 82,309 73,482 10,989.19 9,745.62Czech Republic 49,468 57,873 58,959 480.27 561.87 572.42Denmark 67,190 63,573 61,365 1,267.50 1,195.21 1,150.02Dominica 389 433 495 678.08Dominican Republic 5,369 5,636 3,438 66.26 68.41 41.06England & Wales 1,203,360 1,142,214 2,295.27 2,167.80Estonia 8,267 8,786 10,261 587.97 633.60 749.53Finland 79,596 68,718 161,705 1,544.65 1,330.45 3,123.53France 528,105 546,863 540,980 904.29 933.21 918.47Georgia 6,641 7,590 7,896 122.03 151.07 157.17Germany 473,486 463,102 577.42 564.07Guatemala 13,082 30,661 34,995 121.13 276.23 306.97Holy See (Vatican City State) 10 4 3Hong Kong, China (SAR) 19,565 19,410 20,568 294.41 288.81 302.60Hungary 89,249 88,436 87,689 883.65 875.60 876.89Iceland 1,543 1,566 1,918 563.14 564.32 682.56Italy 299,028 275,194 305,686 519.15 477.77 529.79Japan 67,130 71,499 77,468 53.28 56.30 61.00Korea, Republic of 172,427 170,559 164,682 371.61 363.67 348.16Kyrgyzstan 17,362 16,576 19,018 361.93 340.75 386.94
Page 214 of 316Population Source: World Bank

COURTS11. Adults convicted of any type of crime, by number and type of sentence
11.01 5i TOTSENTotal adults sentenced
1998 1999 2000 1998 1999 2000Count Rate per 100,000 inhabitants
CountryLatvia 11,274 11,069 10,892 460.35 459.29 459.19Lithuania 17,415 17,432 17,881 470.29 471.26 483.92Macedonia, FYR 6,128 6,783 6,496 304.12 336.29 319.84Malaysia 51,271 48,616 49,384 230.95 214.17 211.95Mexico 120,720 124,704 122,582 126.81 129.09 125.08Moldova, Republic of 12,172 13,075 14,186 283.14 304.78 331.29New Zealand 94,652 93,133 89,335 2,495.97 2,443.99 2,332.02Norway 10,289 10,891 9,973 232.15 244.19 222.07Pakistan 525 545 1,036 0.40 0.40 0.75Palestinian Territory, occupied 1,842 1,871 1,002Panama 3,918 141.75Papua New Guinea 396 297 283 8.11 5.93 5.52Portugal 36,407 38,843 46,189 365.24 388.86 461.89Qatar 1,942 2,317 3,503 355.68 410.01 598.92Romania 95,025 78,779 68,670 422.33 350.13 306.56Russian Federation 1,071,051 1,076,557 1,035,071 728.61 737.37 708.95Saudi Arabia 52,232 53,903 56,380 265.14 266.85 272.37Singapore 74 83 101 1.89 2.10 2.51Slovakia 18,936 18,550 19,357 351.27 343.83 358.34Slovenia 5,729 5,783 6,304 288.96 291.26 317.10Spain 110,672 99,936 280.89 253.64Swaziland 10,779 11,310 10,412 1,088.28 1,109.40 996.36Sweden 109,777 103,882 106,647 1,240.17 1,172.83 1,202.47Switzerland 72,598 70,335 1,021.07 985.08Thailand 395,146 354,403 660.78 588.71Turkey 832,128 972,124 1,312.50 1,511.86Ukraine 214,433 204,587 183,887 426.31 409.99 371.49Venezuela 12,450 13,402 4,294 53.66 56.55 17.74Zambia 2,774 1,967 1,309 28.70 19.91 12.96Zimbabwe 49,571 44,960 62,697 406.32 362.58 497.60
Page 215 of 316Population Source: World Bank

COURTS11. Adults convicted of any type of crime, by number and type of sentence
11.02 6c TOTDTHTotal adults receiving death penalty
1998 1999 2000 1998 1999 2000Count Rate per 100,000 inhabitants
CountryAlbania 9 0.27Armenia 5 0.13Azerbaijan 9 0.11Barbados 4 5 1.50 1.87Belarus 47 13 4 0.47 0.13 0.04Dominica 4 5 5 6.85Egypt 58 111 72 0.09 0.18 0.11Indonesia 2 5 0.00 0.00Japan 7 8 14 0.01 0.01 0.01Korea, Republic of 14 20 17 0.03 0.04 0.04Latvia 1 1 0.04 0.04Malaysia 26 6 5 0.12 0.03 0.02Pakistan 4 27 18 0.00 0.02 0.01Russian Federation 116 19 0.08 0.01Singapore 36 25 28 0.92 0.63 0.70Swaziland 1 1 2 0.10 0.10 0.19Thailand 107 109 0.18 0.18Turkey 3 6 0.00 0.01Ukraine 142 104 0.28 0.21
Page 216 of 316Population Source: World Bank

COURTS11. Adults convicted of any type of crime, by number and type of sentence
11.03 5i TOTCRPTotal adults receiving corporal punishment
1998 1999 2000 1998 1999 2000Count Rate per 100,000 inhabitants
CountryQatar 4 0.68Singapore 14 28 34 0.36 0.71 0.85Swaziland 14 54 15 1.41 5.30 1.44Zambia 213 81 24 2.20 0.82 0.24Zimbabwe 887 1,224 1,515 7.27 9.87 12.02
Page 217 of 316Population Source: World Bank

COURTS11. Adults convicted of any type of crime, by number and type of sentence
11.04 5i TOTLIFTotal adults receiving life imprisonment
1998 1999 2000 1998 1999 2000Count Rate per 100,000 inhabitants
CountryAlbania 30 287 0.89 8.41Azerbaijan 14 23 0.18 0.29Belarus 3 29 18 0.03 0.29 0.18Bulgaria 6 22 3 0.07 0.27 0.04Cyprus 9 1.19Czech Republic 1 4 2 0.01 0.04 0.02Dominica 4 4 4 5.48Egypt 1,746 2,822 2,927 2.84 4.50 4.59England & Wales 357 415 0.68 0.79Estonia 1 5 4 0.07 0.36 0.29Finland 5 5 7 0.10 0.10 0.14France 34 30 31 0.06 0.05 0.05Georgia 5 4 1 0.09 0.08 0.02Germany 128 96 0.16 0.12Hong Kong, China (SAR) 12 18 12 0.18 0.27 0.18Hungary 9 12 13 0.09 0.12 0.13Indonesia 9 1 18 0.00 0.00 0.01Japan 46 72 66 0.04 0.06 0.05Korea, Republic of 90 130 101 0.19 0.28 0.21Latvia 2 2 3 0.08 0.08 0.13Lithuania 3 6 0.08 0.16Malaysia 59 47 68 0.27 0.21 0.29Moldova, Republic of 11 13 11 0.26 0.30 0.26New Zealand 33 41 41 0.87 1.08 1.07Pakistan 4 8 8 0.00 0.01 0.01Papua New Guinea 5 2 5 0.10 0.04 0.10Qatar 2 2 0.35 0.34Romania 16 13 18 0.07 0.06 0.08Russian Federation 55 75 98 0.04 0.05 0.07Singapore 1 4 0.03 0.10
Page 218 of 316Population Source: World Bank

COURTS11. Adults convicted of any type of crime, by number and type of sentence
11.04 5i TOTLIFTotal adults receiving life imprisonment
1998 1999 2000 1998 1999 2000Count Rate per 100,000 inhabitants
CountrySlovakia 5 4 0.09 0.07Sweden 10 18 14 0.11 0.20 0.16Switzerland 1 0.01Thailand 544 538 0.91 0.89Turkey 368 459 0.58 0.71
Page 219 of 316Population Source: World Bank

COURTS11. Adults convicted of any type of crime, by number and type of sentence
11.05 5i TOTDPLTotal adults receiving sentence of deprivation of liberty
1998 1999 2000 1998 1999 2000Count Rate per 100,000 inhabitants
CountryArmenia 2,864 2,891 2,794 75.47 76.06 73.47Azerbaijan 6,937 7,202 6,098 87.67 90.22 75.76Belarus 19,951 19,995 17,961 197.53 199.95 179.61Bulgaria 19,969 15,998 16,396 241.84 194.91 200.76Canada 84,011 77,977 278.18 255.66China 375,561 423,419 444,194 30.29 33.87 35.25Costa Rica 1,874 1,928 1,929 51.30 51.67 50.62Croatia 1,650 2,090 2,142 37.53 47.78 48.90Cyprus 674 889 89.99 117.90Czech Republic 14,037 14,830 13,682 136.28 143.98 132.83Dominican Republic 13,053 14,604 15,008 161.08 177.27 179.24Egypt 1,124 2,323 6,458 1.83 3.71 10.12England & Wales 75,989 79,244 144.94 150.40Estonia 2,027 2,133 2,333 144.16 153.82 170.42Finland 6,137 6,799 7,964 119.10 131.64 153.83France 192,244 210,757 209,618 329.18 359.65 355.89Georgia 3,171 3,386 2,876 58.27 67.40 57.25Germany 36,331 36,843 44.31 44.88Hong Kong, China (SAR) 9,727 9,850 10,965 146.37 146.56 161.32Hungary 28,738 29,474 30,279 284.53 291.82 302.79Iceland 280 242 310 102.19 87.21 110.32Indonesia 54,302 71,507 94,935 26.62 34.54 45.21Italy 167,811 185,269 185,241 291.34 321.65 321.04Japan 24,165 25,828 28,770 19.18 20.34 22.65Korea, Republic of 140,299 135,734 129,212 302.37 289.41 273.18Latvia 2,653 2,498 2,922 108.33 103.65 123.19Lithuania 6,857 6,959 8,730 185.17 188.13 236.27Malaysia 21,340 20,993 22,385 96.13 92.48 96.07Moldova, Republic of 2,223 2,191 2,327 51.71 51.07 54.34Montserrat 9 3 8
Page 220 of 316Population Source: World Bank

COURTS11. Adults convicted of any type of crime, by number and type of sentence
11.05 5i TOTDPLTotal adults receiving sentence of deprivation of liberty
1998 1999 2000 1998 1999 2000Count Rate per 100,000 inhabitants
CountryNetherlands 24,859 27,195 158.34 172.12New Zealand 8,137 8,064 7,826 214.57 211.61 204.29Norway 5,055 5,586 5,367 114.06 125.25 119.51Pakistan 2 3 0.00 0.00Panama 1,899 68.70Papua New Guinea 40 34 47 0.82 0.68 0.92Portugal 4,638 4,170 4,284 46.53 41.75 42.84Qatar 1,306 613 2,781 239.19 108.47 475.47Romania 50,332 40,855 34,430 223.70 181.58 153.71Russian Federation 345,399 354,398 325,006 234.97 242.74 222.61Singapore 35 50 61 0.89 1.27 1.52Slovakia 4,061 3,891 4,197 75.33 72.12 77.70Slovenia 842 978 1,099 42.47 49.26 55.28Spain 67,378 63,365 171.01 160.82Swaziland 4,646 3,452 3,351 469.07 338.61 320.67Sweden 14,823 12,845 12,539 167.46 145.02 141.38Switzerland 12,104 11,194 170.24 156.78Thailand 7,367 6,641 12.32 11.03Turkey 272,261 351,785 429.43 547.10Ukraine 81,492 78,955 78,059 162.01 158.23 157.69Uruguay 1,518 1,619 1,683 46.15 48.87 50.43Venezuela 12,450 13,402 4,294 53.66 56.55 17.74Zambia 4,000 3,286 1,947 41.38 33.26 19.28Zimbabwe 45,669 6,411 7,521 374.34 51.70 59.69
Page 221 of 316Population Source: World Bank

COURTS11. Adults convicted of any type of crime, by number and type of sentence
11.06 5i TOTCIFTotal adults receiving sentence of control in freedom
1998 1999 2000 1998 1999 2000Count Rate per 100,000 inhabitants
CountryArmenia 92 170 149 2.42 4.47 3.92Azerbaijan 74 0.92Belarus 4,524 4,743 4,460 44.79 47.43 44.60Canada 65,749 63,200 217.71 207.21Costa Rica 1,341 1,090 894 36.71 29.21 23.46Croatia 8,964 11,322 10,798 203.89 258.82 246.53Cyprus 15 56 2.00 7.43Czech Republic 31,165 36,689 34,654 302.57 356.20 336.45Egypt 1,124 2,323 6,185 1.83 3.71 9.69England & Wales 94,608 94,076 180.45 178.55France 39,587 41,912 42,983 67.79 71.52 72.98Georgia 1,672 2,265 2,997 30.72 45.08 59.65Germany 71,430 73,910 87.11 90.02Hong Kong, China (SAR) 1,312 1,303 1,548 19.74 19.39 22.77Hungary 16,144 14,863 13,909 159.84 147.16 139.09Iceland 321 341 360 117.15 122.88 128.11Indonesia 4,833 3,637 4,029 2.37 1.76 1.92Japan 5,227 5,265 5,554 4.15 4.15 4.37Korea, Republic of 4,575 4,545 4,007 9.86 9.69 8.47Latvia 6,126 6,099 5,924 250.14 253.07 249.75Lithuania 654 851 589 17.66 23.01 15.94Malaysia 1,158 1,239 1,179 5.22 5.46 5.06Montserrat 1 2 8New Zealand 5,345 4,797 4,199 140.95 125.88 109.61Norway 4,198 4,275 3,673 94.72 95.85 81.79Portugal 957 952 1,374 9.60 9.53 13.74Romania 1,297 1,154 445 5.76 5.13 1.99Singapore 3 0.08Slovakia 13,135 13,061 13,591 243.66 242.09 251.60Sweden 13,369 14,163 10,981 151.03 159.90 123.81
Page 222 of 316Population Source: World Bank

COURTS11. Adults convicted of any type of crime, by number and type of sentence
11.06 5i TOTCIFTotal adults receiving sentence of control in freedom
1998 1999 2000 1998 1999 2000Count Rate per 100,000 inhabitants
CountryThailand 79,503 80,409 132.95 133.57Zimbabwe 2 2 1 0.02 0.02 0.01
Page 223 of 316Population Source: World Bank

COURTS11. Adults convicted of any type of crime, by number and type of sentence
11.07 5i TOTWRNTotal adults receiving warning
1998 1999 2000 1998 1999 2000Count Rate per 100,000 inhabitants
CountryArmenia 11 17 15 0.29 0.45 0.39Belarus 133 207 315 1.32 2.07 3.15Bulgaria 69 77 97 0.84 0.94 1.19Canada 10,312 11,468 34.15 37.60Croatia 225 534 587 5.12 12.21 13.40Cyprus 519 1,143 69.29 151.59Czech Republic 30,843 36,063 34,491 299.45 350.13 334.86Denmark 17,958 17,730 17,047 338.77 333.33 319.47Egypt 252 1,019 1,005 0.41 1.63 1.57England & Wales 90,402 86,854 172.43 164.84Estonia 3,540 4,016 4,465 251.77 289.61 326.15Finland 12,344 10,576 13,547 239.55 204.76 261.68France 123,988 117,699 108,880 212.31 200.85 184.86Georgia 863 911 542 15.86 18.13 10.79Hong Kong, China (SAR) 2,600 2,395 2,322 39.12 35.64 34.16Hungary 1,805 1,771 1,982 17.87 17.53 19.82Iceland 64 56 83 23.36 20.18 29.54Indonesia 6,367 9,667 5,006 3.12 4.67 2.38Japan 36,691 39,170 41,760 29.12 30.84 32.88Korea, Republic of 89,748 86,196 84,388 193.42 183.79 178.41Latvia 287 297 250 11.72 12.32 10.54Lithuania 9,260 8,833 5,798 250.07 238.79 156.91Moldova, Republic of 6,563 7,701 7,209 152.66 179.51 168.36Montserrat 1Netherlands 19,467 20,996 123.99 132.89New Zealand 5,934 5,758 5,749 156.48 151.10 150.07Pakistan 2 0.00Panama 124 4.49Portugal 4,854 4,891 6,380 48.70 48.96 63.80Singapore 3 4 8 0.08 0.10 0.20
Page 224 of 316Population Source: World Bank

COURTS11. Adults convicted of any type of crime, by number and type of sentence
11.07 5i TOTWRNTotal adults receiving warning
1998 1999 2000 1998 1999 2000Count Rate per 100,000 inhabitants
CountrySlovakia 454 341 293 8.42 6.32 5.42Slovenia 4,505 4,505 4,859 227.23 226.89 244.42Sweden 9,784 8,351 17,118 110.53 94.28 193.01Switzerland 36,200 35,740 509.14 500.56Thailand 82,288 81,190 137.61 134.87Turkey 142,457 154,666 224.70 240.54Zambia 149 110 61 1.54 1.11 0.60Zimbabwe 2,177 1,907 2,974 17.84 15.38 23.60
Page 225 of 316Population Source: World Bank

COURTS11. Adults convicted of any type of crime, by number and type of sentence
11.08 5i TOTFINTotal adults receiving a fine
1998 1999 2000 1998 1999 2000Count Rate per 100,000 inhabitants
CountryAlbania 642 539 19.08 15.80Armenia 1,052 1,229 1,386 27.72 32.33 36.44Azerbaijan 341 338 858 4.31 4.23 10.66Belarus 9,529 8,606 7,375 94.35 86.06 73.75Bulgaria 4,897 5,046 9,825 59.31 61.48 120.30Canada 78,281 72,205 259.21 236.74China 6,072 6,654 8,077 0.49 0.53 0.64Costa Rica 241 168 182 6.60 4.50 4.78Croatia 1,404 2,260 2,939 31.93 51.66 67.10Cyprus 80,784 71,135 10,785.58 9,434.35Czech Republic 2,611 3,351 3,553 25.35 32.53 34.50Denmark 37,790 33,950 31,825 712.88 638.28 596.42Egypt 870 1,016 2,227 1.41 1.62 3.49England & Wales 925,925 863,892 1,766.09 1,639.58Estonia 2,382 2,274 2,910 169.41 163.99 212.56Finland 57,273 48,002 136,886 1,111.45 929.37 2,644.12France 176,408 191,622 201,782 302.07 327.00 342.58Georgia 137 275 994 2.52 5.47 19.79Germany 365,725 352,349 446.01 429.17Holy See (Vatican City State) 10 4 3Hong Kong, China (SAR) 5,128 4,795 4,376 77.16 71.35 64.38Hungary 42,093 41,129 40,220 416.76 407.22 402.20Iceland 878 927 1,165 320.44 334.05 414.59Indonesia 721,936 733,787 1,011,634 353.89 354.49 481.73Ireland 121,647 124,578 111,713 3,277.13 3,320.31 2,944.46Italy 131,217 89,925 120,445 227.81 156.12 208.74Japan 926 1,076 1,233 0.73 0.85 0.97Korea, Republic of 30,611 32,323 33,288 65.97 68.92 70.38Latvia 2,205 1,992 1,237 90.04 82.66 52.15Lithuania 536 667 485 14.47 18.03 13.13
Page 226 of 316Population Source: World Bank

COURTS11. Adults convicted of any type of crime, by number and type of sentence
11.08 5i TOTFINTotal adults receiving a fine
1998 1999 2000 1998 1999 2000Count Rate per 100,000 inhabitants
CountryMacedonia, FYR 1,702 1,594 1,412 84.47 79.03 69.52Malaysia 17,526 17,085 15,170 78.95 75.26 65.11Moldova, Republic of 2,605 3,078 4,586 60.60 71.75 107.10Montserrat 1 4 5Netherlands 40,767 42,112 259.66 266.53New Zealand 45,435 45,850 46,036 1,198.12 1,203.19 1,201.73Norway 516 495 402 11.64 11.10 8.95Pakistan 239 189 389 0.18 0.14 0.28Panama 979 35.42Papua New Guinea 20 25 14 0.41 0.50 0.27Portugal 25,934 28,755 34,082 260.17 287.87 340.82Qatar 694 1,680 684 127.11 297.29 116.95Romania 21,507 18,794 18,235 95.59 83.53 81.41Russian Federation 59,628 63,976 61,857 40.56 43.82 42.37Slovakia 1,259 1,039 1,112 23.36 19.26 20.59Slovenia 382 300 346 19.27 15.11 17.40Spain 20,736 14,410 52.63 36.57Swaziland 6,118 7,803 7,044 617.69 765.40 674.07Sweden 68,730 65,386 59,868 776.45 738.21 675.03Switzerland 23,741 22,972 333.91 321.74Thailand 225,337 185,516 376.82 308.17Turkey 271,534 279,229 428.29 434.26Zambia 536 1,032 519 5.55 10.44 5.14Zimbabwe 32,076 28,722 39,088 262.92 231.63 310.22
Page 227 of 316Population Source: World Bank

COURTS11. Adults convicted of any type of crime, by number and type of sentence
11.09 5i TOTCSOTotal adults receiving community sentence orders
1998 1999 2000 1998 1999 2000Count Rate per 100,000 inhabitants
CountryArmenia 34 25 22 0.90 0.66 0.58Azerbaijan 102 1.27Bulgaria 256 209 182 3.10 2.55 2.23Czech Republic 1,627 2,967 6,532 15.80 28.81 63.42Denmark 779 933 1,904 14.70 17.54 35.68Egypt 171 572 822 0.28 0.91 1.29Finland 3,854 3,328 3,358 74.79 64.43 64.86France 21,447 20,893 19,083 36.72 35.65 32.40Georgia 793 749 486 14.57 14.91 9.67Hong Kong, China (SAR) 786 1,049 1,345 11.83 15.61 19.79Hungary 1,850 2,490 2,754 18.32 24.65 27.54Iceland 20 19 22 7.30 6.85 7.83Ireland 4,312 4,261 3,562 116.16 113.57 93.89Korea, Republic of 22,959 21,745 22,599 49.48 46.36 47.78Latvia 180 556 7.47 23.44Lithuania 105 122 2,273 2.84 3.30 61.52Moldova, Republic of 768 83 53 17.86 1.93 1.24Montserrat 1 6Netherlands 14,181 16,615 90.32 105.16New Zealand 29,768 28,623 25,484 784.98 751.12 665.24Norway 520 535 531 11.73 12.00 11.82Pakistan 3 2 10 0.00 0.00 0.01Papua New Guinea 45 51 50 0.92 1.02 0.97Portugal 12 15 38 0.12 0.15 0.38Romania 628 195 111 2.79 0.87 0.50Russian Federation 53,514 56,489 50,499 36.40 38.69 34.59Spain 2 0.01Sweden 524 3,077 3,963 5.92 34.74 44.68Uruguay 865 891 948 26.30 26.89 28.41Zimbabwe 8,427 3,746 11,570 69.07 30.21 91.83
Page 228 of 316Population Source: World Bank

COURTS12. Persons convicted in the criminal courts, by sex and age group
12.01 5j TFCONVTotal females convicted
1998 1999 2000 1998 1999 2000Count Rate per 100,000 inhabitants
CountryAlbania 1,190 1,584 35.37 46.44Armenia 366 435 443 9.64 11.44 11.65Azerbaijan 777 709 810 9.82 8.88 10.06Belarus 12,162 10,543 9,041 120.42 105.43 90.41Bulgaria 1,953 1,577 2,344 23.65 19.21 28.70Canada 45,206 43,425 149.69 142.38China 20,580 23,197 27,503 1.66 1.86 2.18Costa Rica 345 365 327 9.44 9.78 8.58Croatia 965 1,452 1,521 21.95 33.19 34.73Czech Republic 4,696 6,226 6,961 45.59 60.45 67.58Denmark 12,587 12,111 11,336 237.45 227.69 212.44Dominican Republic 757 602 9.34 7.31Egypt 2,294 4,407 5,409 3.73 7.03 8.48England & Wales 235,578 219,980 449.34 417.50Estonia 710 781 814 50.50 56.32 59.46Finland 13,765 14,198 25,961 267.13 274.89 501.47France 55,650 58,034 55,981 95.29 99.03 95.04Georgia 352 425 542 6.47 8.46 10.79Germany 99,256 100,227 121.04 122.08Guatemala 2,368 4,615 4,787 21.93 41.58 41.99Holy See (Vatican City State) 6 2 2Hong Kong, China (SAR) 3,983 4,294 4,559 59.93 63.89 67.07Hungary 10,670 11,276 11,615 105.64 111.64 116.15Iceland 185 185 230 67.52 66.67 81.85Indonesia 742,352 808,371 1,117,784 363.90 390.52 532.28Italy 51,404 45,861 56,849 89.24 79.62 98.53Japan 6,287 4.99Kazakhstan 6,017 6,631 8,014 39.85 44.50 53.79Korea, Republic of 18,151 18,993 17,893 39.12 40.50 37.83Kyrgyzstan 1,896 1,870 2,084 39.52 38.44 42.40
Page 229 of 316Population Source: World Bank

COURTS12. Persons convicted in the criminal courts, by sex and age group
12.01 5j TFCONVTotal females convicted
1998 1999 2000 1998 1999 2000Count Rate per 100,000 inhabitants
CountryLatvia 1,240 1,141 1,023 50.63 47.34 43.13Macedonia, FYR 407 398 374 20.20 19.73 18.41Malaysia 4,419 4,935 4,724 19.91 21.74 20.27Mexico 9,805 10,979 11,493 10.30 11.37 11.73Moldova, Republic of 1,184 1,136 1,329 27.54 26.48 31.04Montserrat 1Netherlands 10,408 11,494 66.29 72.75New Zealand 16,050 16,310 15,880 423.24 428.01 414.53Norway 1,459 1,462 1,353 32.92 32.78 30.13Papua New Guinea 22 21 23 0.45 0.42 0.45Portugal 3,281 3,114 4,063 32.92 31.17 40.63Qatar 26 64 23 4.76 11.33 3.93Romania 11,605 9,067 10,361 51.58 40.30 46.25Russian Federation 123,972 144,247 154,198 84.33 98.80 105.62Saudi Arabia 52,232 53,903 56,380 265.14 266.85 272.37Slovakia 1,563 1,475 1,593 28.99 27.34 29.49Slovenia 729 746 727 36.77 37.57 36.57Spain 7,162 6,480 18.18 16.45Swaziland 3,665 3,060 2,591 370.03 300.16 247.94Sweden 6,778 7,326 7,035 76.57 82.71 79.32Switzerland 11,345 12,088 159.56 169.30Syrian Arab Republic 22,986 16,184 149.26 102.43Thailand 95,060 87,052 158.96 144.60Turkey 44,303 50,382 69.88 78.35Ukraine 35,140 32,175 31,912 69.86 64.48 64.47Uruguay 493 522 598 14.99 15.76 17.92Zimbabwe 8,978 11,252 13,140 73.59 90.74 104.29
Page 230 of 316Population Source: World Bank

COURTS12. Persons convicted in the criminal courts, by sex and age group
12.02 5j TMCONVTotal males convicted
1998 1999 2000 1998 1999 2000Count Rate per 100,000 inhabitants
CountryArmenia 6,069 6,191 6,346 159.92 162.88 166.87Azerbaijan 15,358 14,989 13,795 194.09 187.76 171.39Belarus 47,538 49,319 48,033 470.67 493.19 480.33Bulgaria 26,121 22,733 28,061 316.35 276.96 343.59Canada 255,940 246,445 847.48 808.02China 507,716 579,184 612,311 40.94 46.33 48.60Costa Rica 3,164 2,877 2,718 86.61 77.11 71.32Croatia 11,784 15,451 15,732 268.03 353.21 359.18Czech Republic 49,387 56,368 56,250 479.49 547.26 546.12Denmark 60,453 56,952 56,291 1,140.41 1,070.73 1,054.93Dominican Republic 4,426 5,040 54.62 61.18Egypt 11,867 16,810 22,104 19.29 26.83 34.64England & Wales 1,221,988 1,178,291 2,330.80 2,236.27Estonia 7,557 8,005 9,447 537.47 577.28 690.07Finland 73,726 75,035 147,179 1,430.74 1,452.76 2,842.94France 507,554 527,711 524,058 869.10 900.53 889.74Georgia 6,646 7,548 7,742 122.12 150.24 154.10Germany 454,871 445,217 554.72 542.29Guatemala 10,617 25,691 29,328 98.31 231.45 257.26Holy See (Vatican City State) 4 2 1Hong Kong, China (SAR) 16,449 15,888 16,754 247.52 236.40 246.49Hungary 86,615 85,010 83,598 857.57 841.68 835.98Iceland 1,485 1,483 1,789 541.97 534.41 636.65Italy 251,262 232,799 251,451 436.22 404.16 435.79Japan 61,004 48.42Kazakhstan 52,377 59,680 69,970 346.87 400.54 469.60Korea, Republic of 162,616 159,285 157,450 350.47 339.63 332.88Kyrgyzstan 16,588 15,782 18,084 345.80 324.43 367.93Latvia 11,712 11,721 11,666 478.24 486.35 491.82Macedonia, FYR 6,655 7,321 7,061 330.27 362.96 347.66
Page 231 of 316Population Source: World Bank

COURTS12. Persons convicted in the criminal courts, by sex and age group
12.02 5j TMCONVTotal males convicted
1998 1999 2000 1998 1999 2000Count Rate per 100,000 inhabitants
CountryMalaysia 51,205 49,416 50,670 230.65 217.69 217.47Mexico 110,915 113,725 111,089 116.51 117.73 113.36Moldova, Republic of 12,570 13,470 14,639 292.39 313.99 341.87Montserrat 12 9 27Netherlands 83,183 88,979 529.83 563.16New Zealand 82,300 80,793 78,557 2,170.24 2,120.16 2,050.67Norway 9,560 10,290 9,429 215.70 230.72 209.95Papua New Guinea 474 327 278 9.71 6.53 5.42Portugal 37,326 41,384 49,575 374.46 414.30 495.75Qatar 3,125 4,087 3,592 572.34 723.22 614.13Romania 94,616 78,509 65,046 420.52 348.93 290.38Russian Federation 947,079 1,079,008 1,029,433 644.27 739.05 705.09Slovakia 20,854 20,075 20,770 386.85 372.10 384.50Slovenia 5,636 5,743 6,168 284.27 289.25 310.26Spain 102,156 92,340 259.28 234.37Swaziland 9,535 10,044 11,348 962.68 985.22 1,085.93Sweden 48,089 49,228 48,194 543.27 555.78 543.40Switzerland 71,381 70,400 1,003.95 985.99Syrian Arab Republic 119,717 80,957 777.38 512.39Thailand 419,144 393,607 700.91 653.83Turkey 787,825 921,742 1,242.63 1,433.50Ukraine 197,458 190,064 198,991 392.56 380.89 402.00Uruguay 6,105 6,822 7,106 185.62 205.92 212.95Zimbabwe 50,330 51,816 58,473 412.54 417.87 464.07
Page 232 of 316Population Source: World Bank

COURTS12. Persons convicted in the criminal courts, by sex and age group
12.03 5j ADCONVTotal adults convicted
1998 1999 2000 1998 1999 2000Count Rate per 100,000 inhabitants
CountryAlbania 1,499 1,884 44.56 55.23Armenia 6,151 6,205 6,526 162.08 163.25 171.60Azerbaijan 15,765 15,347 14,291 199.23 192.25 177.55Belarus 53,537 53,752 51,394 530.07 537.52 513.94Bulgaria 25,428 21,679 27,013 307.96 264.12 330.76Canada 240,115 227,728 795.08 746.65China 494,684 562,367 598,106 39.89 44.99 47.47Colombia 57,778 77,028 141.61 185.61Costa Rica 3,456 3,186 3,005 94.61 85.39 78.85Croatia 12,243 16,206 16,466 278.47 370.46 375.94Czech Republic 49,468 57,873 58,959 480.27 561.87 572.42Denmark 67,190 63,573 61,365 1,267.50 1,195.21 1,150.02Dominican Republic 5,170 5,635 63.80 68.40England & Wales 1,203,670 1,142,176 2,295.86 2,167.73Estonia 6,765 7,254 8,644 481.14 523.12 631.41Finland 79,596 81,216 161,705 1,544.65 1,572.43 3,123.53France 528,105 546,863 540,980 904.29 933.21 918.47Georgia 6,641 7,590 7,896 122.03 151.07 157.17Germany 473,486 463,102 577.42 564.07Guatemala 97 355 900 0.90 3.20 7.89Holy See (Vatican City State) 10 4 3Hong Kong, China (SAR) 19,565 19,410 20,568 294.41 288.81 302.60Hungary 89,249 88,436 87,689 883.65 875.60 876.89Iceland 1,543 1,566 1,909 563.14 564.32 679.36Indonesia 716,055 780,867 1,088,678 351.01 377.23 518.42Italy 299,028 275,194 304,686 519.15 477.77 528.05Japan 67,130 71,413 77,420 53.28 56.23 60.96Kazakhstan 61,769 72,591 414.56 487.19Korea, Republic of 172,427 170,559 164,682 371.61 363.67 348.16Latvia 11,274 11,069 10,892 460.35 459.29 459.19
Page 233 of 316Population Source: World Bank

COURTS12. Persons convicted in the criminal courts, by sex and age group
12.03 5j ADCONVTotal adults convicted
1998 1999 2000 1998 1999 2000Count Rate per 100,000 inhabitants
CountryLithuania 17,415 17,432 17,881 470.29 471.26 483.92Macedonia, FYR 6,128 6,783 6,496 304.12 336.29 319.84Malaysia 42,679 42,271 43,556 192.25 186.22 186.94Mexico 111,086 114,874 113,759 116.69 118.92 116.08Moldova, Republic of 12,172 13,075 14,186 283.14 304.78 331.29Netherlands 86,697 92,621 552.21 586.21New Zealand 97,768 96,570 93,877 2,578.13 2,534.18 2,450.58Norway 10,289 10,891 9,973 232.15 244.19 222.07Palestinian Territory, occupied 1,842 1,871 1,002Papua New Guinea 396 297 283 8.11 5.93 5.52Portugal 36,407 38,843 46,189 365.24 388.86 461.89Qatar 3,151 2,100 3,387 577.11 371.61 579.08Romania 95,025 78,779 68,669 422.33 350.13 306.56Russian Federation 938,825 1,076,557 1,035,071 638.66 737.37 708.95Slovakia 19,390 18,891 19,650 359.70 350.15 363.77Slovenia 5,729 5,783 6,304 288.96 291.26 317.10Spain 108,010 97,543 274.14 247.57Sweden 49,593 52,125 50,710 560.26 588.49 571.77Switzerland 72,598 70,336 1,021.07 985.10Syrian Arab Republic 120,712 78,576 783.84 497.32Thailand 477,535 451,316 798.55 749.69Turkey 783,841 922,954 1,236.34 1,435.39Ukraine 214,433 204,587 210,887 426.31 409.99 426.03Uruguay 6,598 7,344 7,704 200.61 221.67 230.87Venezuela 12,450 13,402 4,294 53.66 56.55 17.74Zambia 2,774 1,967 1,309 28.70 19.91 12.96Zimbabwe 42,623 50,509 56,403 349.37 407.33 447.64
Page 234 of 316Population Source: World Bank

COURTS12. Persons convicted in the criminal courts, by sex and age group
12.04 5j AFCONVAdult females convicted
1998 1999 2000 1998 1999 2000Count Rate per 100,000 inhabitants
CountryArmenia 363 424 438 9.57 11.15 11.52Australia 12,556 14,093 14,711 66.79 74.17 76.62Azerbaijan 760 705 803 9.60 8.83 9.98Belarus 11,690 10,108 8,638 115.74 101.08 86.38Bulgaria 1,865 1,500 2,179 22.59 18.27 26.68Canada 30,850 29,986 102.15 98.31Costa Rica 341 361 323 9.33 9.68 8.48Croatia 942 1,410 1,480 21.43 32.23 33.79Czech Republic 4,460 5,915 6,651 43.30 57.43 64.57Denmark 11,495 11,071 10,292 216.85 208.14 192.88Dominican Republic 755 602 9.32 7.31Egypt 2,294 4,407 5,409 3.73 7.03 8.48England & Wales 205,483 190,660 391.93 361.85Estonia 569 660 674 40.47 47.60 49.23Finland 12,108 12,498 23,945 234.97 241.97 462.53France 52,960 54,775 52,570 90.68 93.47 89.25Georgia 349 423 540 6.41 8.42 10.75Germany 89,097 89,635 108.65 109.18Guatemala 2,368 4,615 4,787 21.93 41.58 41.99Hong Kong, China (SAR) 3,865 4,190 4,481 58.16 62.34 65.93Hungary 10,072 10,553 10,977 99.72 104.49 109.77Iceland 176 171 220 64.23 61.62 78.29Indonesia 19,438 20,670 29,002 9.53 9.99 13.81Italy 50,702 45,238 56,142 88.02 78.54 97.30Japan 6,283 4.99Latvia 1,142 1,030 919 46.63 42.74 38.74Macedonia, FYR 373 372 357 18.51 18.44 17.58Malaysia 3,920 4,396 3,482 17.66 19.37 14.94Mexico 9,805 10,979 11,493 10.30 11.37 11.73Moldova, Republic of 1,098 1,119 1,249 25.54 26.08 29.17
Page 235 of 316Population Source: World Bank

COURTS12. Persons convicted in the criminal courts, by sex and age group
12.04 5j AFCONVAdult females convicted
1998 1999 2000 1998 1999 2000Count Rate per 100,000 inhabitants
CountryMontserrat 1Netherlands 9,685 10,717 61.69 67.83New Zealand 15,966 16,231 15,805 421.02 425.93 412.58Norway 1,382 1,373 1,267 31.18 30.78 28.21Panama 3,918 4,029 141.75 143.33Papua New Guinea 22 21 23 0.45 0.42 0.45Qatar 26 64 23 4.76 11.33 3.93Romania 10,464 8,306 9,973 46.51 36.92 44.52Russian Federation 114,766 133,882 143,354 78.07 91.70 98.19Slovakia 1,420 1,332 1,484 26.34 24.69 27.47Slovenia 689 691 694 34.75 34.80 34.91Spain 7,099 6,405 18.02 16.26Swaziland 3,073 2,695 2,179 310.26 264.35 208.52Sweden 6,210 6,773 6,431 70.16 76.47 72.51Switzerland 9,821 10,007 138.13 140.15Thailand 88,764 82,409 148.43 136.89Turkey 40,442 46,595 63.79 72.47Ukraine 33,834 30,996 30,696 67.26 62.12 62.01Uruguay 493 522 598 14.99 15.76 17.92Venezuela 627 174 2.65 0.72Zambia 201 15 19 2.08 0.15 0.19Zimbabwe 11,461 9,762 8,452 93.94 78.73 67.08
Page 236 of 316Population Source: World Bank

COURTS12. Persons convicted in the criminal courts, by sex and age group
12.05 5j AMCONVAdult males convicted
1998 1999 2000 1998 1999 2000Count Rate per 100,000 inhabitants
CountryArmenia 5,788 5,781 6,088 152.52 152.09 160.08Australia 1,458 1,716 1,855 7.76 9.03 9.66Azerbaijan 15,005 14,642 13,488 189.62 183.41 167.57Belarus 41,847 43,644 42,756 414.33 436.44 427.56Bulgaria 23,563 20,179 24,834 285.37 245.85 304.08Canada 198,335 191,700 656.74 628.52Costa Rica 3,115 2,825 2,682 85.27 75.72 70.38Croatia 11,301 14,796 14,986 257.04 338.23 342.15Czech Republic 45,008 51,958 52,308 436.97 504.45 507.84Denmark 55,695 52,502 51,073 1,050.65 987.07 957.14Dominican Republic 4,415 5,033 54.48 61.09Egypt 11,876 16,810 22,104 19.30 26.83 34.64England & Wales 998,187 951,516 1,903.92 1,805.88Estonia 6,196 6,594 7,970 440.67 475.53 582.18Finland 67,488 68,718 137,760 1,309.68 1,330.45 2,661.00France 475,145 492,088 488,410 813.60 839.74 829.22Georgia 6,292 7,167 7,356 115.62 142.66 146.42Germany 384,389 373,467 468.77 454.89Guatemala 10,617 25,691 29,328 98.31 231.45 257.26Hong Kong, China (SAR) 15,700 15,220 16,087 236.25 226.46 236.68Hungary 79,177 77,883 76,712 783.93 771.12 767.12Iceland 1,367 1,395 1,689 498.91 502.70 601.07Indonesia 696,617 760,197 1,059,676 341.48 367.24 504.61Italy 248,326 229,956 248,544 431.12 399.23 430.75Japan 60,847 48.29Latvia 10,132 10,039 9,973 413.72 416.56 420.45Macedonia, FYR 5,755 6,411 6,139 285.61 317.85 302.26Malaysia 39,610 38,144 38,498 178.42 168.04 165.23Mexico 110,915 113,725 111,089 116.51 117.73 113.36Moldova, Republic of 11,074 11,104 12,937 257.59 258.83 302.13
Page 237 of 316Population Source: World Bank

COURTS12. Persons convicted in the criminal courts, by sex and age group
12.05 5j AMCONVAdult males convicted
1998 1999 2000 1998 1999 2000Count Rate per 100,000 inhabitants
CountryMontserrat 12 9 23Netherlands 76,436 81,914 486.85 518.44New Zealand 81,801 80,339 78,072 2,157.09 2,108.25 2,038.01Norway 8,902 9,518 8,706 200.86 213.41 193.85Panama 349 381 12.63 13.55Papua New Guinea 374 276 260 7.66 5.51 5.07Qatar 2,997 3,440 3,485 548.90 608.73 595.84Romania 84,561 70,473 58,696 375.83 313.21 262.04Russian Federation 824,059 942,675 891,717 560.58 645.67 610.77Slovakia 17,970 17,559 18,166 333.35 325.46 336.30Slovenia 5,040 5,092 5,610 254.21 256.46 282.19Spain 100,911 91,138 256.12 231.31Swaziland 7,706 8,615 8,233 778.02 845.05 787.85Sweden 43,383 45,352 43,988 490.10 512.02 495.97Switzerland 62,774 60,241 882.90 843.71Thailand 388,771 368,907 650.12 612.80Turkey 743,399 876,359 1,172.55 1,362.92Ukraine 180,599 173,591 180,191 359.04 347.88 364.02Uruguay 6,105 6,822 7,106 185.62 205.92 212.95Venezuela 12,775 4,120 53.90 17.02Zambia 2,573 1,952 1,290 26.62 19.75 12.77Zimbabwe 36,934 35,540 40,246 302.74 286.61 319.41
Page 238 of 316Population Source: World Bank

COURTS12. Persons convicted in the criminal courts, by sex and age group
12.06 5j JUCONVTotal juveniles convicted
1998 1999 2000 1998 1999 2000Count Rate per 100,000 inhabitants
CountryAlbania 387 302 11.50 8.85Armenia 284 331 263 7.48 8.71 6.92Australia 11,098 12,377 12,856 59.03 65.14 66.96Azerbaijan 370 351 314 4.68 4.40 3.90Barbados 16 13 15 6.03 4.89 5.62Belarus 6,163 6,110 5,680 61.02 61.10 56.80Bulgaria 2,646 2,631 3,392 32.05 32.05 41.53Canada 71,961 68,184 238.28 223.55Colombia 5,450 8,152 13.36 19.64Costa Rica 246 297 226 6.73 7.96 5.93Croatia 506 697 787 11.51 15.93 17.97Czech Republic 4,615 4,721 4,252 44.81 45.83 41.28Denmark 5,850 5,490 6,262 110.36 103.21 117.35Dominican Republic 13 7 0.16 0.08England & Wales 253,896 256,095 484.28 486.04Estonia 1,502 1,532 1,617 106.83 110.48 118.12Finland 7,895 8,017 11,435 153.21 155.22 220.88France 35,099 38,882 39,059 60.10 66.35 66.31Georgia 357 383 388 6.56 7.62 7.72Germany 80,641 82,342 98.34 100.29Hong Kong, China (SAR) 867 772 745 13.05 11.49 10.96Hungary 8,036 7,750 7,524 79.56 76.73 75.24Iceland 127 102 110 46.35 36.76 39.15Indonesia 26,297 27,504 29,106 12.89 13.29 13.86Italy 3,638 3,466 3,614 6.32 6.02 6.26Japan 161 158 151 0.13 0.12 0.12Kazakhstan 4,542 5,393 30.48 36.19Korea, Republic of 8,340 7,719 10,661 17.97 16.46 22.54Latvia 1,678 1,793 1,797 68.52 74.40 75.76Lithuania 2,121 2,240 2,799 57.28 60.56 75.75
Page 239 of 316Population Source: World Bank

COURTS12. Persons convicted in the criminal courts, by sex and age group
12.06 5j JUCONVTotal juveniles convicted
1998 1999 2000 1998 1999 2000Count Rate per 100,000 inhabitants
CountryMacedonia, FYR 934 936 939 46.35 46.41 46.23Malaysia 3,855 3,281 3,020 17.36 14.45 12.96Moldova, Republic of 1,582 1,531 1,782 36.80 35.69 41.62Netherlands 7,522 7,852 47.91 49.70New Zealand 583 532 560 15.37 13.96 14.62Norway 730 861 809 16.47 19.30 18.01Palestinian Territory, occupied 786 587 367Panama 3,569 3,648 129.12 129.78Papua New Guinea 10 51 18 0.20 1.02 0.35Portugal 3,708 5,050 6,451 37.20 50.56 64.51Qatar 154 153 107 28.21 27.07 18.29Romania 11,196 8,797 6,738 49.76 39.10 30.08Russian Federation 132,226 146,698 148,560 89.95 100.48 101.75Slovakia 3,027 2,659 2,713 56.15 49.29 50.22Slovenia 636 706 591 32.08 35.56 29.73Spain 1,308 1,277 3.32 3.24Sweden 4,552 4,429 4,810 51.42 50.00 54.23Switzerland 10,131 12,240 142.49 171.43Syrian Arab Republic 21,991 18,565 142.80 117.50Thailand 36,669 29,343 61.32 48.74Turkey 48,287 49,170 76.16 76.47Ukraine 18,165 17,652 20,016 36.11 35.37 40.44Zambia 136 6 1 1.41 0.06 0.01Zimbabwe 4,690 5,286 6,183 38.44 42.63 49.07
Page 240 of 316Population Source: World Bank

COURTS12. Persons convicted in the criminal courts, by sex and age group
12.07 5j JFCONVJuvenile females convicted
1998 1999 2000 1998 1999 2000Count Rate per 100,000 inhabitants
CountryArmenia 3 11 5 0.08 0.29 0.13Azerbaijan 17 4 7 0.21 0.05 0.09Barbados 9 7 8 3.39 2.63 3.00Belarus 472 435 403 4.67 4.35 4.03Bulgaria 88 77 165 1.07 0.94 2.02Canada 14,356 13,439 47.54 44.06China 33,612 40,014 41,708 2.71 3.20 3.31Costa Rica 4 4 4 0.11 0.11 0.10Croatia 23 42 41 0.52 0.96 0.94Czech Republic 236 311 310 2.29 3.02 3.01Denmark 1,092 1,040 1,044 20.60 19.55 19.57Dominican Republic 2 0.02Egypt 279 1,604 1,264 0.45 2.56 1.98England & Wales 30,095 29,320 57.40 55.65Estonia 141 121 140 10.03 8.73 10.23Finland 1,657 1,700 2,016 32.16 32.91 38.94France 2,690 3,259 3,411 4.61 5.56 5.79Georgia 3 2 2 0.06 0.04 0.04Germany 10,159 10,592 12.39 12.90Hong Kong, China (SAR) 118 104 78 1.78 1.55 1.15Hungary 598 623 638 5.92 6.17 6.38Iceland 9 14 10 3.28 5.05 3.56Italy 702 623 707 1.22 1.08 1.23Japan 4 0.00Kyrgyzstan 1,122 982 1,314 23.39 20.19 26.73Latvia 98 111 104 4.00 4.61 4.38Macedonia, FYR 34 26 17 1.69 1.29 0.84Malaysia 286 246 249 1.29 1.08 1.07Moldova, Republic of 86 65 80 2.00 1.52 1.87Netherlands 723 787 4.61 4.98
Page 241 of 316Population Source: World Bank

COURTS12. Persons convicted in the criminal courts, by sex and age group
12.07 5j JFCONVJuvenile females convicted
1998 1999 2000 1998 1999 2000Count Rate per 100,000 inhabitants
CountryNew Zealand 84 79 75 2.22 2.07 1.96Norway 77 89 86 1.74 2.00 1.91Romania 1,141 761 388 5.07 3.38 1.73Russian Federation 9,206 10,365 10,844 6.26 7.10 7.43Slovakia 143 143 109 2.65 2.65 2.02Slovenia 40 55 33 2.02 2.77 1.66Spain 63 75 0.16 0.19Swaziland 592 365 412 59.77 35.80 39.43Sweden 568 553 604 6.42 6.24 6.81Switzerland 1,524 2,081 21.43 29.15Thailand 6,296 4,643 10.53 7.71Turkey 3,861 3,787 6.09 5.89Ukraine 1,306 1,179 1,216 2.60 2.36 2.46Zimbabwe 829 1,279 1,205 6.80 10.31 9.56
Page 242 of 316Population Source: World Bank
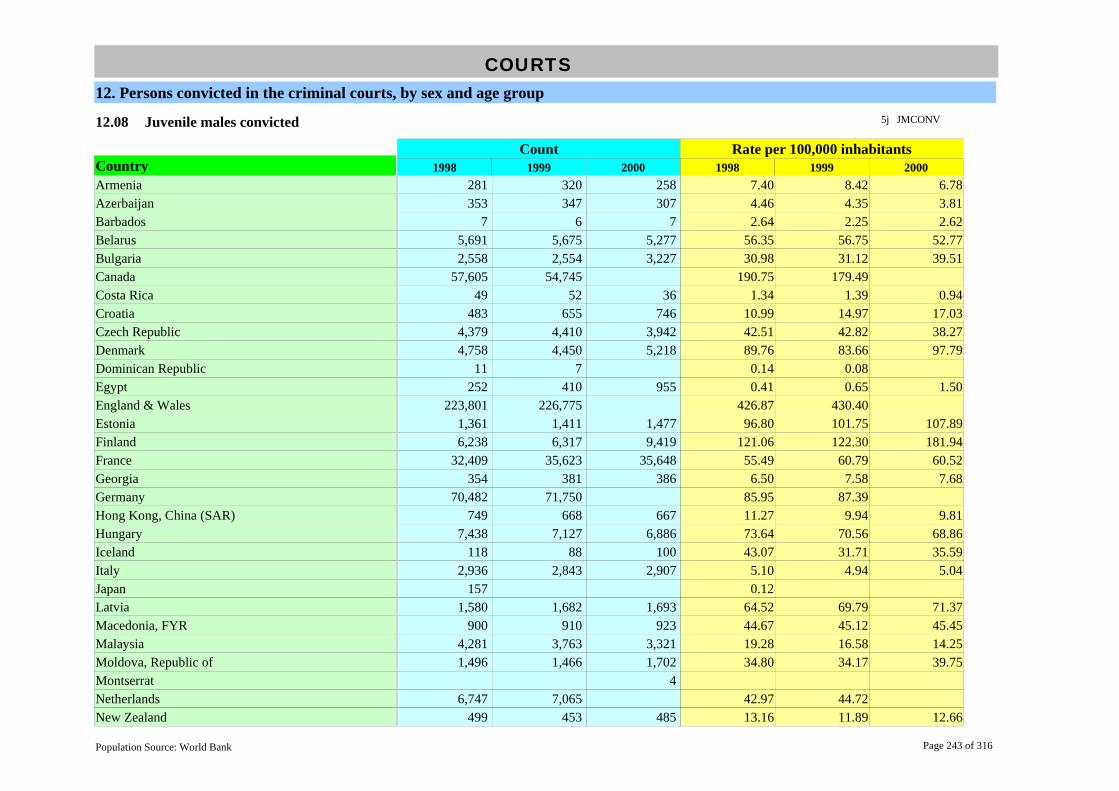
COURTS12. Persons convicted in the criminal courts, by sex and age group
12.08 5j JMCONVJuvenile males convicted
1998 1999 2000 1998 1999 2000Count Rate per 100,000 inhabitants
CountryArmenia 281 320 258 7.40 8.42 6.78Azerbaijan 353 347 307 4.46 4.35 3.81Barbados 7 6 7 2.64 2.25 2.62Belarus 5,691 5,675 5,277 56.35 56.75 52.77Bulgaria 2,558 2,554 3,227 30.98 31.12 39.51Canada 57,605 54,745 190.75 179.49Costa Rica 49 52 36 1.34 1.39 0.94Croatia 483 655 746 10.99 14.97 17.03Czech Republic 4,379 4,410 3,942 42.51 42.82 38.27Denmark 4,758 4,450 5,218 89.76 83.66 97.79Dominican Republic 11 7 0.14 0.08Egypt 252 410 955 0.41 0.65 1.50England & Wales 223,801 226,775 426.87 430.40Estonia 1,361 1,411 1,477 96.80 101.75 107.89Finland 6,238 6,317 9,419 121.06 122.30 181.94France 32,409 35,623 35,648 55.49 60.79 60.52Georgia 354 381 386 6.50 7.58 7.68Germany 70,482 71,750 85.95 87.39Hong Kong, China (SAR) 749 668 667 11.27 9.94 9.81Hungary 7,438 7,127 6,886 73.64 70.56 68.86Iceland 118 88 100 43.07 31.71 35.59Italy 2,936 2,843 2,907 5.10 4.94 5.04Japan 157 0.12Latvia 1,580 1,682 1,693 64.52 69.79 71.37Macedonia, FYR 900 910 923 44.67 45.12 45.45Malaysia 4,281 3,763 3,321 19.28 16.58 14.25Moldova, Republic of 1,496 1,466 1,702 34.80 34.17 39.75Montserrat 4Netherlands 6,747 7,065 42.97 44.72New Zealand 499 453 485 13.16 11.89 12.66
Page 243 of 316Population Source: World Bank

COURTS12. Persons convicted in the criminal courts, by sex and age group
12.08 5j JMCONVJuvenile males convicted
1998 1999 2000 1998 1999 2000Count Rate per 100,000 inhabitants
CountryNorway 653 772 723 14.73 17.31 16.10Papua New Guinea 10 51 18 0.20 1.02 0.35Qatar 154 153 107 28.21 27.07 18.29Romania 10,055 8,036 6,350 44.69 35.72 28.35Russian Federation 123,020 136,333 137,716 83.69 93.38 94.33Slovakia 2,884 2,516 2,604 53.50 46.63 48.21Slovenia 596 651 558 30.06 32.79 28.07Spain 1,245 1,202 3.16 3.05Swaziland 1,829 1,429 3,115 184.66 140.17 298.09Sweden 3,984 3,876 4,206 45.01 43.76 47.42Switzerland 8,607 10,159 121.05 142.28Thailand 30,373 24,700 50.79 41.03Turkey 44,426 45,383 70.07 70.58Ukraine 16,859 16,473 18,800 33.52 33.01 37.98Zimbabwe 3,925 3,989 4,895 32.17 32.17 38.85
Page 244 of 316Population Source: World Bank
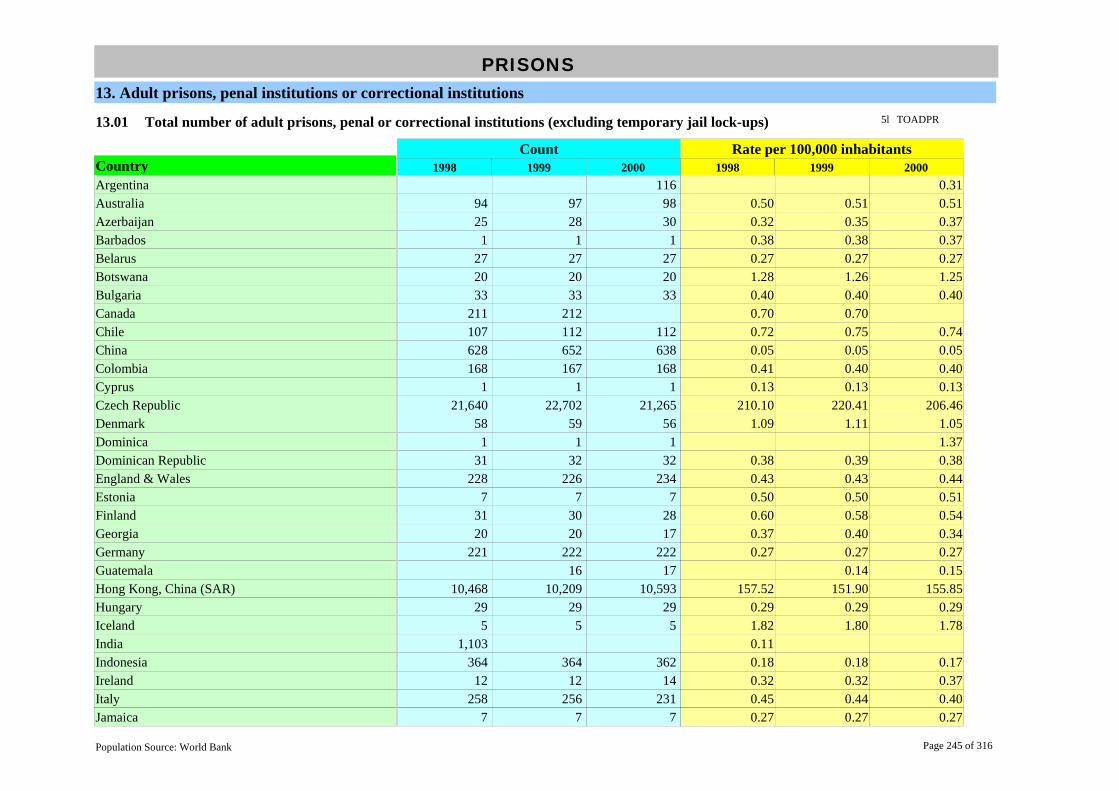
PRISONS13. Adult prisons, penal institutions or correctional institutions
13.01 5l TOADPRTotal number of adult prisons, penal or correctional institutions (excluding temporary jail lock-ups)
1998 1999 2000 1998 1999 2000Count Rate per 100,000 inhabitants
CountryArgentina 116 0.31Australia 94 97 98 0.50 0.51 0.51Azerbaijan 25 28 30 0.32 0.35 0.37Barbados 1 1 1 0.38 0.38 0.37Belarus 27 27 27 0.27 0.27 0.27Botswana 20 20 20 1.28 1.26 1.25Bulgaria 33 33 33 0.40 0.40 0.40Canada 211 212 0.70 0.70Chile 107 112 112 0.72 0.75 0.74China 628 652 638 0.05 0.05 0.05Colombia 168 167 168 0.41 0.40 0.40Cyprus 1 1 1 0.13 0.13 0.13Czech Republic 21,640 22,702 21,265 210.10 220.41 206.46Denmark 58 59 56 1.09 1.11 1.05Dominica 1 1 1 1.37Dominican Republic 31 32 32 0.38 0.39 0.38England & Wales 228 226 234 0.43 0.43 0.44Estonia 7 7 7 0.50 0.50 0.51Finland 31 30 28 0.60 0.58 0.54Georgia 20 20 17 0.37 0.40 0.34Germany 221 222 222 0.27 0.27 0.27Guatemala 16 17 0.14 0.15Hong Kong, China (SAR) 10,468 10,209 10,593 157.52 151.90 155.85Hungary 29 29 29 0.29 0.29 0.29Iceland 5 5 5 1.82 1.80 1.78India 1,103 0.11Indonesia 364 364 362 0.18 0.18 0.17Ireland 12 12 14 0.32 0.32 0.37Italy 258 256 231 0.45 0.44 0.40Jamaica 7 7 7 0.27 0.27 0.27
Page 245 of 316Population Source: World Bank

PRISONS13. Adult prisons, penal institutions or correctional institutions
13.01 5l TOADPRTotal number of adult prisons, penal or correctional institutions (excluding temporary jail lock-ups)
1998 1999 2000 1998 1999 2000Count Rate per 100,000 inhabitants
CountryJapan 183 183 182 0.15 0.14 0.14Kazakhstan 3 3 3 0.02 0.02 0.02Korea, Republic of 30 30 30 0.06 0.06 0.06Kyrgyzstan 10 10 10 0.21 0.21 0.20Latvia 15 15 15 0.61 0.62 0.63Lithuania 13 13 14 0.35 0.35 0.38Macedonia, FYR 7 7 7 0.35 0.35 0.34Malaysia 29,150 23,623 26,294 131.31 104.07 112.85Maldives 534 618 775 203.37 229.49 280.80Mauritius 9 9 9 0.78 0.77 0.76Mexico 445 447 444 0.47 0.46 0.45Moldova, Republic of 18 19 18 0.42 0.44 0.42Montserrat 1 1 1Netherlands 40 40 40 0.25 0.25 0.25New Zealand 18 18 19 0.47 0.47 0.50Norway 43 46 0.97 1.03Oman 2 2 2 0.09 0.09 0.08Palestinian Territory, occupied 7 7 6Panama 21 21 21 0.76 0.75 0.74Papua New Guinea 9,990 8,418 9,474 204.60 168.16 184.68Paraguay 12 13 13 0.23 0.24 0.24Philippines 1,317 1,287 1,253 1.81 1.73 1.66Portugal 52 53 64 0.52 0.53 0.64Qatar 1 1 1 0.18 0.18 0.17Romania 34 37 37 0.15 0.16 0.17Russian Federation 737 739 0.50 0.51Saudi Arabia 30 30 30 0.15 0.15 0.14Singapore 14 14 14 0.36 0.35 0.35Slovakia 18 18 18 0.33 0.33 0.33Slovenia 6 6 6 0.30 0.30 0.30
Page 246 of 316Population Source: World Bank

PRISONS13. Adult prisons, penal institutions or correctional institutions
13.01 5l TOADPRTotal number of adult prisons, penal or correctional institutions (excluding temporary jail lock-ups)
1998 1999 2000 1998 1999 2000Count Rate per 100,000 inhabitants
CountrySouth Africa 211 212 220 0.51 0.50 0.51Sri Lanka 28 29 29 0.15 0.15 0.15Suriname 3 3 3 0.73 0.72 0.72Swaziland 12 12 12 1.21 1.18 1.15Sweden 55 55 55 0.62 0.62 0.62Switzerland 168 168 168 2.36 2.35 2.34Thailand 133 133 134 0.22 0.22 0.22Turkey 559 557 558 0.88 0.87 0.85Ukraine 128 126 128 0.25 0.25 0.26United States of America 1,287 1,328 1,558 0.47 0.48 0.55Venezuela 32 33 31 0.14 0.14 0.13Zambia 52 52 52 0.54 0.53 0.51Zimbabwe 40 40 40 0.33 0.32 0.32
Page 247 of 316Population Source: World Bank

PRISONS13. Adult prisons, penal institutions or correctional institutions
13.02 5l ADPRBDTotal number of spaces (beds) available for adults
1998 1999 2000 1998 1999 2000Count Rate per 100,000 inhabitants
CountryArgentina 27,524 74.39Australia 17,935 19,632 20,503 95.40 103.33 106.79Azerbaijan 20,000 24,000 25,500 252.75 300.64 316.81Belarus 32,250 32,250 32,250 319.31 322.50 322.50Botswana 3,078 3,078 3,078 197.09 193.81 192.13Bulgaria 10,236 10,236 10,236 123.97 124.71 125.33Canada 33,290 33,499 110.23 109.83China 1,439,728 1,432,407 1,445,429 116.11 114.59 114.72Colombia 33,119 33,606 37,986 81.17 80.98 89.80Cyprus 240 240 240 32.04 31.83 31.70Czech Republic 18,833 19,232 19,944 182.84 186.72 193.63Denmark 3,712 3,752 3,638 70.02 70.54 68.18Dominica 175 175 175 239.73Dominican Republic 7,611 8,111 8,561 93.93 98.46 102.25England & Wales 76,785 76,738 76,470 146.46 145.64 144.44Estonia 6,030 6,090 6,130 428.87 439.18 447.77Finland 4,519 4,511 4,335 87.70 87.34 83.74Georgia 14,850 14,850 12,746 272.88 295.58 253.70Germany 73,283 75,102 76,495 89.37 91.48 93.06Guatemala 6,913 6,990 62.28 61.32Hong Kong, China (SAR) 8,635 9,081 9,107 129.94 135.12 133.99Hungary 10,360 9,412 9,637 102.57 93.19 96.37Iceland 138 138 138 50.36 49.73 49.11Ireland 2,561 2,956 3,491 68.99 78.78 92.01Italy 43,995 42,787 42,723 76.38 74.28 74.04Jamaica 2,700 2,700 2,700 104.81 104.25 102.54Japan 58,445 59,002 59,032 46.38 46.46 46.48Kazakhstan 1,830 1,750 1,750 12.12 11.74 11.74Korea, Republic of 39,800 39,600 40,600 85.78 84.43 85.84Kyrgyzstan 13,788 13,788 13,788 287.43 283.44 280.53
Page 248 of 316Population Source: World Bank

PRISONS13. Adult prisons, penal institutions or correctional institutions
13.02 5l ADPRBDTotal number of spaces (beds) available for adults
1998 1999 2000 1998 1999 2000Count Rate per 100,000 inhabitants
CountryLatvia 11,050 11,050 10,500 451.20 458.51 442.66Lithuania 13,254 13,254 9,543 357.93 358.31 258.27Macedonia, FYR 1,982 1,982 1,982 98.36 98.26 97.59Malaysia 20,150 21,623 25,294 90.77 95.26 108.56Maldives 534 618 775 203.37 229.49 280.80Mauritius 2,308 2,308 2,308 199.01 196.53 194.58Mexico 103,906 108,808 121,135 109.14 112.64 123.61Moldova, Republic of 10,566 10,721 10,721 245.78 249.91 250.37Montserrat 18 18 18Netherlands 12,491 12,401 12,279 79.56 78.49 77.23New Zealand 5,873 5,935 6,130 154.87 155.75 160.02Norway 2,818 63.18Papua New Guinea 3,920 4,070 4,040 80.28 81.30 78.75Paraguay 804 50 15.41 0.93Portugal 11,065 11,185 11,371 111.01 111.97 113.71Romania 33,446 33,277 33,401 148.65 147.90 149.11Singapore 4,720 12,099 12,516 120.32 306.15 311.50Slovakia 9,061 8,953 9,087 168.09 165.95 168.22Slovenia 983 978 978 49.58 49.26 49.20South Africa 93,780 94,160 96,012 226.52 223.66 224.33Spain 41,314 41,310 42,345 104.86 104.85 107.20Sri Lanka 6,377 7,641 7,641 33.92 40.22 39.39Suriname 750 750 750 181.68 180.92 179.86Swaziland 1,344 1,344 1,344 135.69 131.83 128.61Sweden 4,243 4,165 4,157 47.93 47.02 46.87Switzerland 6,743 6,668 6,769 94.84 93.39 94.28Thailand 93,441 93,441 96,790 156.26 155.22 159.46Ukraine 165,313 168,268 171,119 328.65 337.21 345.69United States of America 975,579 1,044,467 354.76 370.38Venezuela 15,000 15,750 15,550 64.66 66.46 64.26
Page 249 of 316Population Source: World Bank

PRISONS13. Adult prisons, penal institutions or correctional institutions
13.02 5l ADPRBDTotal number of spaces (beds) available for adults
1998 1999 2000 1998 1999 2000Count Rate per 100,000 inhabitants
CountryZambia 7,500 7,500 7,500 77.59 75.90 74.26Zimbabwe 16,000 16,000 16,000 131.15 129.03 126.98
Page 250 of 316Population Source: World Bank

PRISONS14. Juvenile prisons, penal institutions or correctional institutions
14.01 5l TOJUPRTotal number of juvenile prisons, penal or correctional institutions (excluding temporary jail lock-ups)
1998 1999 2000 1998 1999 2000Count Rate per 100,000 inhabitants
CountryAzerbaijan 1 1 1 0.01 0.01 0.01Barbados 1 1 1 0.38 0.38 0.37Belarus 3 3 3 0.03 0.03 0.03Botswana 1 1 1 0.06 0.06 0.06Bulgaria 2 2 2 0.02 0.02 0.02Canada 400 400 400 1.32 1.31 1.30China 35 34 35 0.00 0.00 0.00Czech Republic 427 358 273 4.15 3.48 2.65Dominican Republic 5 5 6 0.06 0.06 0.07England & Wales 11 12 21 0.02 0.02 0.04Estonia 2 2 2 0.14 0.14 0.15Finland 1 1 1 0.02 0.02 0.02Georgia 1 1 1 0.02 0.02 0.02Hong Kong, China (SAR) 1,446 1,336 1,424 21.76 19.88 20.95Hungary 2 2 2 0.02 0.02 0.02India 30 0.00Indonesia 14 14 16 0.01 0.01 0.01Ireland 2 2 2 0.05 0.05 0.05Italy 17 17 17 0.03 0.03 0.03Jamaica 3 3 3 0.12 0.12 0.11Japan 8 8 8 0.01 0.01 0.01Korea, Republic of 2 2 2 0.00 0.00 0.00Kyrgyzstan 1 1 1 0.02 0.02 0.02Latvia 1 1 1 0.04 0.04 0.04Lithuania 1 1 1 0.03 0.03 0.03Macedonia, FYR 3 3 3 0.15 0.15 0.15Malaysia 992 971 870 4.47 4.28 3.73Mauritius 3 3 3 0.26 0.26 0.25Mexico 54 54 0.06 0.06Moldova, Republic of 1 1 1 0.02 0.02 0.02
Page 251 of 316Population Source: World Bank
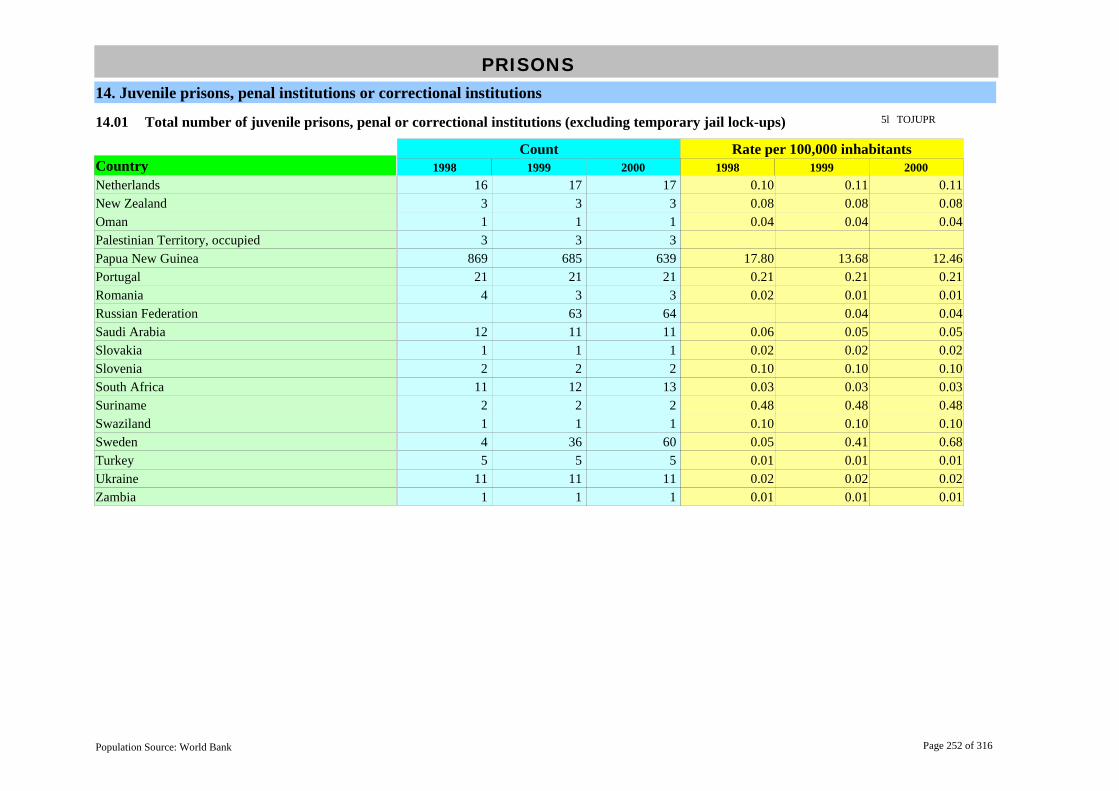
PRISONS14. Juvenile prisons, penal institutions or correctional institutions
14.01 5l TOJUPRTotal number of juvenile prisons, penal or correctional institutions (excluding temporary jail lock-ups)
1998 1999 2000 1998 1999 2000Count Rate per 100,000 inhabitants
CountryNetherlands 16 17 17 0.10 0.11 0.11New Zealand 3 3 3 0.08 0.08 0.08Oman 1 1 1 0.04 0.04 0.04Palestinian Territory, occupied 3 3 3Papua New Guinea 869 685 639 17.80 13.68 12.46Portugal 21 21 21 0.21 0.21 0.21Romania 4 3 3 0.02 0.01 0.01Russian Federation 63 64 0.04 0.04Saudi Arabia 12 11 11 0.06 0.05 0.05Slovakia 1 1 1 0.02 0.02 0.02Slovenia 2 2 2 0.10 0.10 0.10South Africa 11 12 13 0.03 0.03 0.03Suriname 2 2 2 0.48 0.48 0.48Swaziland 1 1 1 0.10 0.10 0.10Sweden 4 36 60 0.05 0.41 0.68Turkey 5 5 5 0.01 0.01 0.01Ukraine 11 11 11 0.02 0.02 0.02Zambia 1 1 1 0.01 0.01 0.01
Page 252 of 316Population Source: World Bank

PRISONS14. Juvenile prisons, penal institutions or correctional institutions
14.02 5l JUPRBDTotal number of spaces (beds) available for juveniles
1998 1999 2000 1998 1999 2000Count Rate per 100,000 inhabitants
CountryAzerbaijan 200 200 200 2.53 2.51 2.48Barbados 80 80 80 30.15 30.07 29.96Belarus 1,780 1,780 1,780 17.62 17.80 17.80Botswana 120 120 120 7.68 7.56 7.49Bulgaria 327 327 327 3.96 3.98 4.00China 16,011 15,825 16,794 1.29 1.27 1.33Czech Republic 450 400 300 4.37 3.88 2.91England & Wales 1,729 1,815 2,663 3.30 3.44 5.03Finland 70 70 70 1.36 1.36 1.35Georgia 250 250 250 4.59 4.98 4.98Hong Kong, China (SAR) 1,772 1,764 1,560 26.66 26.25 22.95Hungary 612 612 612 6.06 6.06 6.12Ireland 232 232 280 6.25 6.18 7.38Italy 718 718 718 1.25 1.25 1.24Jamaica 278 278 278 10.79 10.73 10.56Japan 5,162 5,162 5,162 4.10 4.06 4.06Korea, Republic of 2,700 2,700 2,700 5.82 5.76 5.71Kyrgyzstan 380 380 380 7.92 7.81 7.73Latvia 210 210 210 8.57 8.71 8.85Lithuania 493 493 398 13.31 13.33 10.77Macedonia, FYR 156 156 156 7.74 7.73 7.68Malaysia 800 800 800 3.60 3.52 3.43Mauritius 142 142 142 12.24 12.09 11.97Mexico 5,571 5,521 5.77 5.63Moldova, Republic of 250 250 250 5.82 5.83 5.84Netherlands 1,539 1,636 1,832 9.80 10.35 11.52New Zealand 65 92 127 1.71 2.41 3.32Portugal 742 673 657 7.44 6.74 6.57Romania 2 1 1 0.01 0.01 0.01Slovakia 478 413 413 8.87 7.66 7.65
Page 253 of 316Population Source: World Bank

PRISONS14. Juvenile prisons, penal institutions or correctional institutions
14.02 5l JUPRBDTotal number of spaces (beds) available for juveniles
1998 1999 2000 1998 1999 2000Count Rate per 100,000 inhabitants
CountrySlovenia 78 78 78 3.93 3.93 3.92South Africa 5,514 5,674 5,979 13.32 13.48 13.97Suriname 124 124 124 30.04 29.91 29.74Swaziland 45 45 45 4.54 4.41 4.31Ukraine 5,067 5,112 5,112 10.07 10.24 10.33Zambia 200 200 200 2.07 2.02 1.98
Page 254 of 316Population Source: World Bank

PRISONS15. Staff of adult and juvenile prisons, penal institutions or correctional institutions, by sex, and financial resources
15.01 5m TPRSTATotal number of staff in adult prisons
1998 1999 2000 1998 1999 2000Count Rate per 100,000 inhabitants
CountryAzerbaijan 4,702 4,856 5,505 59.42 60.83 68.39Barbados 40 40 46 15.08 15.03 17.23Belarus 6,192 6,188 6,187 61.31 61.88 61.87Botswana 1,263 1,261 1,258 80.87 79.40 78.53Bulgaria 2,921 5,850 35.58 71.63Canada 29,144 30,290 96.50 99.31Chile 6,618 7,420 7,397 44.72 49.47 48.66China 272,654 276,711 279,557 21.99 22.14 22.19Colombia 8,733 9,580 9,580 21.40 23.08 22.65Cyprus 211 211 211 28.17 27.98 27.87Czech Republic 9,303 9,758 10,226 90.32 94.74 99.28Denmark 3,411 3,468 3,456 64.35 65.20 64.77Dominica 53 53 53 72.60Dominican Republic 132 118 138 1.63 1.43 1.65England & Wales 40,316 41,332 41,015 76.90 78.44 77.47Estonia 2,015 2,003 1,924 143.31 144.45 140.54Finland 2,557 2,545 2,540 49.62 49.27 49.06Georgia 1,997 2,112 2,422 36.70 42.04 48.21Germany 36,834 37,132 44.92 45.23Guatemala 7,749 6,974 69.81 61.18Hong Kong, China (SAR) 4,603 4,623 4,708 69.26 68.79 69.27Hungary 6,470 6,857 6,776 64.06 67.89 67.76Iceland 79 89 88 28.83 32.07 31.32India 40,470 4.13Ireland 2,727 3,073 3,200 73.46 81.90 84.34Italy 47,459 48,088 48,000 82.39 83.49 83.19Japan 15,468 15,494 15,420 12.28 12.20 12.14Korea, Republic of 11,632 11,599 11,601 25.07 24.73 24.53Kyrgyzstan 2,371 2,371 2,371 49.43 48.74 48.24Latvia 2,188 2,210 2,176 89.34 91.70 91.74
Page 255 of 316Population Source: World Bank

PRISONS15. Staff of adult and juvenile prisons, penal institutions or correctional institutions, by sex, and financial resources
15.01 5m TPRSTATotal number of staff in adult prisons
1998 1999 2000 1998 1999 2000Count Rate per 100,000 inhabitants
CountryLithuania 3,036 3,130 3,034 81.99 84.62 82.11Macedonia, FYR 416 417 389 20.65 20.67 19.15Malaysia 10,368 10,368 10,102 46.70 45.67 43.36Maldives 534 618 775 203.37 229.49 280.80Mexico 2,267 3,003 24,041 2.38 3.11 24.53Moldova, Republic of 2,696 2,833 2,855 62.71 66.04 66.67Montserrat 19 19 19Netherlands 12,120 12,022 11,835 77.20 76.09 74.43Oman 312 305 315 13.55 12.99 13.15Papua New Guinea 1,490 1,490 1,490 30.52 29.76 29.04Paraguay 1,102 1,124 1,151 21.12 20.97 20.94Philippines 5,790 6,466 6,381 7.95 8.71 8.44Portugal 5,337 5,331 5,910 53.54 53.37 59.10Qatar 322 314 344 58.97 55.56 58.81Romania 8,590 9,190 10,170 38.18 40.84 45.40Singapore 1,591 1,754 1,737 40.56 44.38 43.23Slovakia 6,434 6,632 6,781 119.35 122.93 125.53Slovenia 628 693 713 31.68 34.90 35.87Spain 19,840 20,323 20,718 50.36 51.58 52.45Sri Lanka 4,806 4,960 4,875 25.56 26.11 25.13Suriname 400 400 400 96.89 96.49 95.92Swaziland 1,011 1,061 1,080 102.07 104.07 103.35Sweden 6,450 6,500 6,300 72.87 73.38 71.03Switzerland 3,000 3,000 42.19 42.02Thailand 10,745 10,909 10,909 17.97 18.12 17.97Turkey 24,260 24,600 25,307 38.26 38.26 38.75Ukraine 56,873 50,804 43,843 113.07 101.81 88.57United States of America 383,027 391,015 398,195 139.28 140.65 141.20Venezuela 1,657 6.85Zambia 1,752 1,674 1,823 18.13 16.94 18.05
Page 256 of 316Population Source: World Bank

PRISONS15. Staff of adult and juvenile prisons, penal institutions or correctional institutions, by sex, and financial resources
15.01 5m TPRSTATotal number of staff in adult prisons
1998 1999 2000 1998 1999 2000Count Rate per 100,000 inhabitants
CountryZimbabwe 4,350 4,356 4,356 35.66 35.13 34.57
Page 257 of 316Population Source: World Bank

PRISONS15. Staff of adult and juvenile prisons, penal institutions or correctional institutions, by sex, and financial resources
15.02 5m FPRSTATotal number of female staff in adult prisons
1998 1999 2000 1998 1999 2000Count Rate per 100,000 inhabitants
CountryAzerbaijan 530 622 556 6.70 7.79 6.91Belarus 1,961 1,972 1,953 19.42 19.72 19.53Botswana 212 190 180 13.57 11.96 11.24Chile 1,141 1,363 1,311 7.71 9.09 8.63Cyprus 11 11 14 1.47 1.46 1.85Czech Republic 2,064 2,127 2,281 20.04 20.65 22.15Dominica 6 6 6 8.22Dominican Republic 70 54 65 0.86 0.66 0.78England & Wales 9,611 10,581 11,068 18.33 20.08 20.91Estonia 537 558 528 38.19 40.24 38.57Georgia 267 291 310 4.91 5.79 6.17Guatemala 448 379 4.04 3.32Hong Kong, China (SAR) 755 754 772 11.36 11.22 11.36Hungary 1,566 1,719 1,755 15.50 17.02 17.55Iceland 12 15 16 4.38 5.41 5.69India 1,388 0.14Italy 6,320 6,921 7,005 10.97 12.02 12.14Japan 1,162 1,165 1,161 0.92 0.92 0.91Korea, Republic of 786 775 788 1.69 1.65 1.67Kyrgyzstan 97 97 97 2.02 1.99 1.97Latvia 624 706 708 25.48 29.29 29.85Lithuania 963 1,014 971 26.01 27.41 26.28Macedonia, FYR 68 70 68 3.37 3.47 3.35Malaysia 789 788 9,502 3.55 3.47 40.78Maldives 17 2 18 6.47 0.74 6.52Mauritius 31 35 47 2.67 2.98 3.96Mexico 752 678 4,559 0.79 0.70 4.65Moldova, Republic of 538 682 698 12.51 15.90 16.30Montserrat 5 5 5Netherlands 3,437 3,470 3,487 21.89 21.96 21.93
Page 258 of 316Population Source: World Bank

PRISONS15. Staff of adult and juvenile prisons, penal institutions or correctional institutions, by sex, and financial resources
15.02 5m FPRSTATotal number of female staff in adult prisons
1998 1999 2000 1998 1999 2000Count Rate per 100,000 inhabitants
CountryOman 22 22 22 0.96 0.94 0.92Papua New Guinea 127 127 127 2.60 2.54 2.48Philippines 949 919 1,010 1.30 1.24 1.34Portugal 1,274 1,548 1,427 12.78 15.50 14.27Qatar 37 34 55 6.78 6.02 9.40Romania 1,572 1,762 1,993 6.99 7.83 8.90Singapore 353 345 8.93 8.59Slovakia 238 242 268 4.42 4.49 4.96Slovenia 175 182 186 8.83 9.17 9.36Spain 3,251 3,429 3,522 8.25 8.70 8.92Sri Lanka 375 386 391 1.99 2.03 2.02Suriname 50 50 50 12.11 12.06 11.99Swaziland 168 167 164 16.96 16.38 15.69Sweden 2,387 2,470 2,394 26.97 27.89 26.99Thailand 1,590 1,723 1,723 2.66 2.86 2.84Turkey 1,261 1,381 1,308 1.99 2.15 2.00United States of America 120,270 124,343 131,404 43.73 44.73 46.60Venezuela 617 2.55Zambia 263 237 330 2.72 2.40 3.27Zimbabwe 344 352 348 2.82 2.84 2.76
Page 259 of 316Population Source: World Bank

PRISONS15. Staff of adult and juvenile prisons, penal institutions or correctional institutions, by sex, and financial resources
15.03 5m MPRSTATotal number of male staff in adult prisons
1998 1999 2000 1998 1999 2000Count Rate per 100,000 inhabitants
CountryAzerbaijan 4,172 4,234 4,949 52.72 53.04 61.49Belarus 4,231 4,216 4,234 41.89 42.16 42.34Botswana 1,051 1,070 1,078 67.30 67.38 67.29Chile 5,477 6,057 6,086 37.01 40.38 40.04Cyprus 200 200 197 26.70 26.53 26.02Czech Republic 7,239 7,631 7,945 70.28 74.09 77.14Dominica 47 47 47 64.38Dominican Republic 67 64 73 0.83 0.78 0.87England & Wales 30,705 30,751 29,947 58.57 58.36 56.56Estonia 1,478 1,445 1,396 105.12 104.21 101.97Georgia 1,730 1,821 2,112 31.79 36.25 42.04Guatemala 7,301 6,595 65.77 57.85Hong Kong, China (SAR) 3,848 3,869 3,936 57.90 57.57 57.91Hungary 4,904 5,138 5,021 48.55 50.87 50.21Iceland 67 74 72 24.45 26.67 25.62India 39,082 3.99Italy 41,139 41,167 40,995 71.42 71.47 71.05Japan 14,306 14,329 14,259 11.35 11.28 11.23Korea, Republic of 10,846 10,824 10,813 23.38 23.08 22.86Kyrgyzstan 2,274 2,274 2,274 47.40 46.75 46.27Latvia 1,564 1,504 1,468 63.86 62.41 61.89Lithuania 2,073 2,116 2,063 55.98 57.20 55.83Macedonia, FYR 348 347 321 17.27 17.20 15.81Malaysia 9,104 9,103 9,090 41.01 40.10 39.01Maldives 517 207 436 196.89 76.87 157.97Mauritius 751 739 781 64.76 62.93 65.84Mexico 1,945 2,125 19,482 2.04 2.20 19.88Moldova, Republic of 2,158 2,151 2,157 50.20 50.14 50.37Montserrat 14 14 14Netherlands 8,683 8,552 8,348 55.31 54.13 52.50
Page 260 of 316Population Source: World Bank

PRISONS15. Staff of adult and juvenile prisons, penal institutions or correctional institutions, by sex, and financial resources
15.03 5m MPRSTATotal number of male staff in adult prisons
1998 1999 2000 1998 1999 2000Count Rate per 100,000 inhabitants
CountryOman 290 283 293 12.60 12.05 12.23Papua New Guinea 1,363 1,363 1,363 27.91 27.23 26.57Philippines 4,841 5,547 5,371 6.65 7.48 7.10Portugal 4,063 3,738 4,483 40.76 37.42 44.83Qatar 285 281 289 52.20 49.72 49.41Romania 7,018 7,428 8,177 31.19 33.01 36.50Singapore 1,401 1,392 35.45 34.64Slovakia 6,196 6,390 6,513 114.94 118.44 120.57Slovenia 453 511 517 22.85 25.74 26.01Spain 16,589 16,894 17,196 42.10 42.88 43.53Sri Lanka 4,431 4,574 4,484 23.57 24.07 23.11Suriname 350 350 350 84.78 84.43 83.93Swaziland 843 894 916 85.11 87.69 87.66Sweden 4,063 4,030 3,906 45.90 45.50 44.04Thailand 9,155 9,186 9,186 15.31 15.26 15.13Turkey 22,999 23,219 23,999 36.28 36.11 36.75United States of America 262,757 266,672 266,791 95.55 95.93 94.61Venezuela 1,040 4.30Zambia 1,489 1,437 1,493 15.40 14.54 14.78Zimbabwe 4,006 4,004 4,008 32.84 32.29 31.81
Page 261 of 316Population Source: World Bank

PRISONS15. Staff of adult and juvenile prisons, penal institutions or correctional institutions, by sex, and financial resources
15.04 5m TPRSTJTotal number of staff in juvenile prisons
1998 1999 2000 1998 1999 2000Count Rate per 100,000 inhabitants
CountryAzerbaijan 78 42 42 0.99 0.53 0.52Belarus 681 697 695 6.74 6.97 6.95Botswana 43 45 45 2.75 2.83 2.81Bulgaria 151 289 1.84 3.54Chile 59 66 62 0.40 0.44 0.41China 9,558 9,910 9,398 0.77 0.79 0.75Czech Republic 330 330 300 3.20 3.20 2.91Dominican Republic 229 229 229 2.83 2.78 2.73England & Wales 645 1.22Estonia 228 219 214 16.22 15.79 15.63Finland 158 158 141 3.06 3.05 2.72Georgia 77 88 132 1.41 1.75 2.63Hong Kong, China (SAR) 941 917 934 14.16 13.64 13.74Hungary 290 306 296 2.87 3.03 2.96Italy 1,189 1,147 1,130 2.06 1.99 1.96Japan 1,562 1,544 1,557 1.24 1.22 1.23Korea, Republic of 533 530 528 1.15 1.13 1.12Kyrgyzstan 117 117 117 2.44 2.41 2.38Latvia 141 141 140 5.76 5.85 5.90Lithuania 314 305 281 8.48 8.25 7.60Macedonia, FYR 61 61 60 3.03 3.02 2.95Malaysia 475 475 475 2.14 2.09 2.04Maldives 336 457 574 127.96 169.71 207.97Mexico 1,164 1.19Moldova, Republic of 122 114 115 2.84 2.66 2.69Netherlands 1,221 1,274 1,412 7.78 8.06 8.88Portugal 726 851 843 7.28 8.52 8.43Romania 843 850 879 3.75 3.78 3.92Slovakia 183 208 169 3.39 3.86 3.13Slovenia 144 150 156 7.26 7.55 7.85
Page 262 of 316Population Source: World Bank

PRISONS15. Staff of adult and juvenile prisons, penal institutions or correctional institutions, by sex, and financial resources
15.04 5m TPRSTJTotal number of staff in juvenile prisons
1998 1999 2000 1998 1999 2000Count Rate per 100,000 inhabitants
CountrySuriname 40 40 40 9.69 9.65 9.59Swaziland 23 23 26 2.32 2.26 2.49Turkey 310 313 302 0.49 0.49 0.46Ukraine 2,246 2,246 2,246 4.47 4.50 4.54Zambia 22 22 22 0.23 0.22 0.22
Page 263 of 316Population Source: World Bank
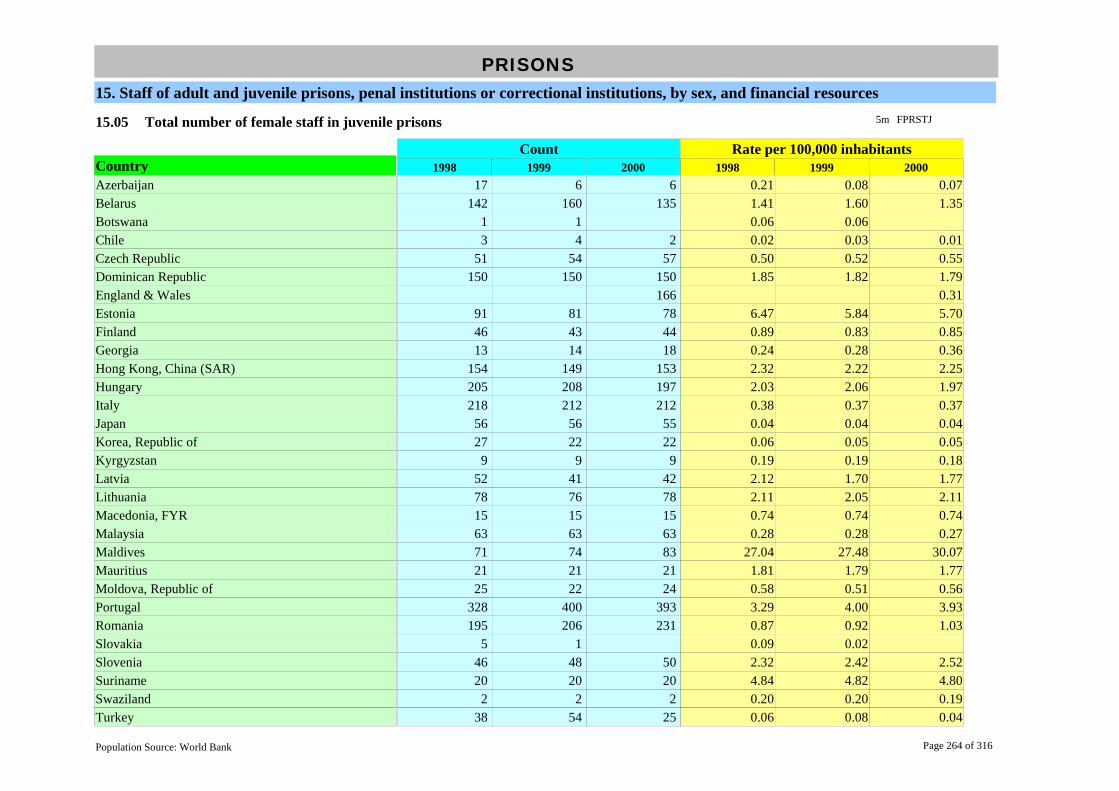
PRISONS15. Staff of adult and juvenile prisons, penal institutions or correctional institutions, by sex, and financial resources
15.05 5m FPRSTJTotal number of female staff in juvenile prisons
1998 1999 2000 1998 1999 2000Count Rate per 100,000 inhabitants
CountryAzerbaijan 17 6 6 0.21 0.08 0.07Belarus 142 160 135 1.41 1.60 1.35Botswana 1 1 0.06 0.06Chile 3 4 2 0.02 0.03 0.01Czech Republic 51 54 57 0.50 0.52 0.55Dominican Republic 150 150 150 1.85 1.82 1.79England & Wales 166 0.31Estonia 91 81 78 6.47 5.84 5.70Finland 46 43 44 0.89 0.83 0.85Georgia 13 14 18 0.24 0.28 0.36Hong Kong, China (SAR) 154 149 153 2.32 2.22 2.25Hungary 205 208 197 2.03 2.06 1.97Italy 218 212 212 0.38 0.37 0.37Japan 56 56 55 0.04 0.04 0.04Korea, Republic of 27 22 22 0.06 0.05 0.05Kyrgyzstan 9 9 9 0.19 0.19 0.18Latvia 52 41 42 2.12 1.70 1.77Lithuania 78 76 78 2.11 2.05 2.11Macedonia, FYR 15 15 15 0.74 0.74 0.74Malaysia 63 63 63 0.28 0.28 0.27Maldives 71 74 83 27.04 27.48 30.07Mauritius 21 21 21 1.81 1.79 1.77Moldova, Republic of 25 22 24 0.58 0.51 0.56Portugal 328 400 393 3.29 4.00 3.93Romania 195 206 231 0.87 0.92 1.03Slovakia 5 1 0.09 0.02Slovenia 46 48 50 2.32 2.42 2.52Suriname 20 20 20 4.84 4.82 4.80Swaziland 2 2 2 0.20 0.20 0.19Turkey 38 54 25 0.06 0.08 0.04
Page 264 of 316Population Source: World Bank

PRISONS15. Staff of adult and juvenile prisons, penal institutions or correctional institutions, by sex, and financial resources
15.06 5m MPRSTJTotal number of male staff in juvenile prisons
1998 1999 2000 1998 1999 2000Count Rate per 100,000 inhabitants
CountryAzerbaijan 61 36 36 0.77 0.45 0.45Belarus 539 537 560 5.34 5.37 5.60Botswana 42 44 45 2.69 2.77 2.81Chile 56 62 60 0.38 0.41 0.39Czech Republic 279 276 243 2.71 2.68 2.36Dominican Republic 79 79 79 0.97 0.96 0.94England & Wales 480 0.91Estonia 137 138 136 9.74 9.95 9.93Finland 112 115 97 2.16 2.22 1.87Georgia 64 74 114 1.18 1.47 2.27Hong Kong, China (SAR) 787 768 781 11.84 11.43 11.49Hungary 85 98 99 0.84 0.97 0.99Italy 971 935 918 1.69 1.62 1.59Japan 1,506 1,488 1,502 1.20 1.17 1.18Korea, Republic of 506 508 506 1.09 1.08 1.07Kyrgyzstan 108 108 108 2.25 2.22 2.20Latvia 89 100 98 3.63 4.15 4.13Lithuania 236 229 203 6.37 6.19 5.49Macedonia, FYR 46 46 45 2.28 2.28 2.22Malaysia 412 411 411 1.86 1.81 1.76Maldives 265 383 491 100.92 142.23 177.90Mauritius 31 30 29 2.67 2.55 2.44Moldova, Republic of 97 92 91 2.26 2.14 2.13Portugal 398 451 450 3.99 4.51 4.50Romania 648 644 648 2.88 2.86 2.89Slovakia 178 207 169 3.30 3.84 3.13Slovenia 98 102 106 4.94 5.14 5.33Suriname 20 20 20 4.84 4.82 4.80Swaziland 21 21 24 2.12 2.06 2.30Turkey 272 259 277 0.43 0.40 0.42
Page 265 of 316Population Source: World Bank

PRISONS15. Staff of adult and juvenile prisons, penal institutions or correctional institutions, by sex, and financial resources
15.06 5m MPRSTJTotal number of male staff in juvenile prisons
1998 1999 2000 1998 1999 2000Count Rate per 100,000 inhabitants
CountryZambia 22 22 22 0.23 0.22 0.22
Page 266 of 316Population Source: World Bank

PRISONS15. Staff of adult and juvenile prisons, penal institutions or correctional institutions, by sex, and financial resources
15.07 5a PRIBUDTotal prison budget/financial resources (adult and juvenile institutions)
1998 1999 2000 1998 1999 2000Count Rate per 100,000 inhabitants
CountryAustralia 955 1,049 1,174 5.08 5.52 6.11Azerbaijan 41,000 46,000 64,000 518.13 576.22 795.13Barbados 2 2 3 0.90 0.90 1.05Belarus 1,419 7,494 22,263 14.05 74.94 222.63Bulgaria 23,218 27,375 49,211 281.19 333.52 602.56Canada 2,201,616 2,365,139 7,290.12 7,754.55Chile 67,901 73,047 74,511 458.79 486.98 490.20China 10,100 11,200 12,300 0.81 0.90 0.98Colombia 233,237 264,267 305,879 571.66 636.79 723.12Cyprus 3 3 4 0.44 0.45 0.49Czech Republic 4,389 4,797 5,194 42.61 46.57 50.43Denmark 965 996 1,062 18.21 18.73 19.90Dominican Republic 10 17 40 0.13 0.21 0.47England & Wales 1,894 1,934 2,014 3.61 3.67 3.80Estonia 266 263 259 18.92 18.97 18.92Finland 828 820 893 16.06 15.88 17.25Georgia 8 4 7 0.14 0.09 0.13Germany 4,347 4,452 5.30 5.42Guatemala 145,000 145,000 1,306.31 1,271.93Hong Kong, China (SAR) 2,523 2,538 2,611 37.96 37.76 38.41Hungary 13,660 16,119 19,477 135.24 159.59 194.77Iceland 490 539 606 178.83 194.23 215.66Indonesia 1,399 5,440 11,888 0.69 2.63 5.66Ireland 182 180 199 4.91 4.81 5.25Italy 256,138 243,936 253,934 444.68 423.50 440.09Japan 124,737 127,166 126,812 99.00 100.13 99.85Korea, Republic of 407,905 411,238 461,665 879.11 876.84 976.04Kyrgyzstan 2,488 2,488 2,488 51.87 51.15 50.62Latvia 13 13 13 0.54 0.56 0.56Lithuania 123 109 112 3.32 2.94 3.02
Page 267 of 316Population Source: World Bank

PRISONS15. Staff of adult and juvenile prisons, penal institutions or correctional institutions, by sex, and financial resources
15.07 5a PRIBUDTotal prison budget/financial resources (adult and juvenile institutions)
1998 1999 2000 1998 1999 2000Count Rate per 100,000 inhabitants
CountryMacedonia, FYR 168,111,000 170,590,000 162,644,000 8,342,977.67 8,457,610.31 8,008,074.84Malaysia 162,002,900 159,928,200 201,916,900 729,742.79 704,529.52 866,596.14Mauritius 137,054,932 147,671,316 161,759,358 11,817,831.05 12,574,192.44 13,637,459.15Mexico 731,523 1,610,748 2,096,304 768.41 1,667.44 2,139.09Moldova, Republic of 37 42 49 0.85 0.99 1.14Montserrat 66,346 62,000Netherlands 1,670 2,100 10.64 13.29Papua New Guinea 27 13 23 0.55 0.26 0.46Paraguay 13,865 13,985 14,926 265.67 260.97 271.59Portugal 43,319 45,054 48,364 434.58 451.04 483.64Romania 648,825 948,442 1,871,842 2,883.67 4,215.30 8,356.44Singapore 137 146 172 3.49 3.69 4.29Slovenia 2,796 3,142 3,268 141.03 158.25 164.39Spain 80,282,420 83,206,909 91,794,113 203,762.49 211,185.05 232,390.16Sri Lanka 351 430 511 1.87 2.26 2.64Suriname 3 3 3 0.65 0.70 0.72Sweden 3,508 3,453 3,461 39.63 38.98 39.02Switzerland 682,488 685,074 9,598.99 9,594.87Thailand 4,752,631,600 5,239,976,800 5,515,973,800 7,947,544.48 8,704,280.40 9,087,271.50Turkey 51,445,546 84,871,371 120,507,308 81,144.39 131,992.80 184,544.12Ukraine 181 217 229 0.36 0.43 0.46United States of America 30,613 11.13Zambia 6,300 5,900 19,900 65.18 59.71 197.03Zimbabwe 545 696 1,331 4.47 5.61 10.57
Page 268 of 316Population Source: World Bank

PRISONS16. Persons incarcerated, by category of incarceration, selected day
16.01 5k TOTPRITotal persons incarcerated
1998 1999 2000 1998 1999 2000Count Rate per 100,000 inhabitants
CountryArgentina 30,145 30,956 33,007 83.50 84.58 89.21Australia 19,906 21,538 21,714 105.88 113.36 113.09Azerbaijan 2,860 2,365 2,357 36.14 29.63 29.28Barbados 1,076 1,187 1,411 405.58 446.11 528.46Belarus 63,157 59,267 59,590 625.32 592.67 595.90Botswana 6,455 6,913 6,742 413.33 435.29 420.85Bulgaria 11,541 11,237 10,147 139.77 136.90 124.24Canada 36,418 35,049 120.59 114.91Chile 26,871 30,051 33,050 181.56 200.34 217.43Colombia 44,398 45,064 51,518 108.82 108.59 121.79Cyprus 247 272 286 32.98 36.07 37.78Czech Republic 22,067 23,060 21,538 214.24 223.88 209.11Denmark 3,422 3,477 3,382 64.55 65.37 63.38Dominica 385 355 402 550.68Dominican Republic 13,053 14,604 15,008 161.08 177.27 179.24England & Wales 65,727 64,529 65,194 125.37 122.47 123.14Estonia 4,379 4,712 4,822 311.44 339.81 352.23Finland 2,848 2,775 3,041 55.27 53.73 58.74France 53,845 52,961 51,441 92.20 90.38 87.34Georgia 10,406 8,529 8,349 191.22 169.77 166.18Germany 79,251 80,610 79,507 96.65 98.19 96.72Guatemala 7,749 6,974 69.81 61.18Hong Kong, China (SAR) 11,914 11,545 12,017 179.28 171.78 176.80Hungary 14,366 15,110 15,539 142.24 149.60 155.39Iceland 103 92 82 37.59 33.15 29.18India 275,605 28.12Indonesia 13,907 22,047 19,173 6.82 10.65 9.13Ireland 2,724 2,770 2,978 73.38 73.83 78.49Italy 48,760 52,870 54,039 84.65 91.79 93.66Jamaica 3,269 3,489 3,489 126.90 134.71 132.51
Page 269 of 316Population Source: World Bank

PRISONS16. Persons incarcerated, by category of incarceration, selected day
16.01 5k TOTPRITotal persons incarcerated
1998 1999 2000 1998 1999 2000Count Rate per 100,000 inhabitants
CountryJapan 52,713 56,133 61,242 41.84 44.20 48.22Kazakhstan 17,322 16,498 19,065 114.72 110.72 127.95Korea, Republic of 67,883 68,087 63,472 146.30 145.17 134.19Kyrgyzstan 13,617 13,788 13,900 283.86 283.44 282.81Latvia 3,561 3,641 3,864 145.41 151.08 162.90Lithuania 14,404 14,412 9,516 388.98 389.62 257.54Macedonia, FYR 1,201 1,333 1,464 59.60 66.09 72.08Malaysia 73,755 80,333 79,197 332.23 353.89 339.90Maldives 13 4 6 4.95 1.49 2.17Mauritius 1,510 1,497 1,635 130.20 127.47 137.84Mexico 128,902 142,800 154,765 135.40 147.83 157.92Moldova, Republic of 9,771 9,285 9,881 227.29 216.43 230.76Montserrat 40 48 47Netherlands 11,759 11,872 11,759 74.90 75.14 73.96New Zealand 5,523 5,685 5,926 145.64 149.19 154.69Norway 1,945 43.89Oman 1,906 1,769 2,020 82.80 75.34 84.34Papua New Guinea 3,658 3,271 3,531 74.92 65.34 68.83Paraguay 4,421 4,198 3,373 84.71 78.34 61.37Portugal 14,880 13,093 12,944 149.28 131.07 129.44Qatar 520 593 570 95.24 104.94 97.45Romania 52,047 49,778 48,267 231.32 221.24 215.48Russian Federation 996,927 1,059,965 923,556 678.18 726.00 632.57Saudi Arabia 23,088 26,465 23,720 117.20 131.01 114.59Singapore 15,455 16,610 16,536 393.96 420.29 411.55Slovakia 6,628 6,858 6,941 122.95 127.11 128.49Slovenia 848 980 1,148 42.77 49.36 57.75South Africa 152,133 167,093 165,488 367.47 396.90 386.65Spain 44,747 45,384 45,309 113.57 115.19 114.71Sri Lanka 97,737 99,840 89,325 519.88 525.47 460.44
Page 270 of 316Population Source: World Bank

PRISONS16. Persons incarcerated, by category of incarceration, selected day
16.01 5k TOTPRITotal persons incarcerated
1998 1999 2000 1998 1999 2000Count Rate per 100,000 inhabitants
CountrySuriname 665 713 786 161.09 171.99 188.49Swaziland 8,690 9,003 9,277 877.37 883.11 887.75Sweden 3,573 3,596 3,712 40.36 40.60 41.85Switzerland 5,648 5,818 5,760 79.44 81.48 80.22Thailand 170,490 205,340 223,406 285.10 341.10 368.05Ukraine 202,906 215,668 220,439 403.39 432.20 445.33United States of America 1,706,138 1,767,433 1,799,582 620.41 635.77 638.15Venezuela 23,918 16,556 15,107 103.09 69.86 62.43Zambia 14,318 14,581 11,999 148.13 147.56 118.80Zimbabwe 18,977 19,566 20,567 155.55 157.79 163.23
Page 271 of 316Population Source: World Bank

PRISONS16. Persons incarcerated, by category of incarceration, selected day
16.02 5k REMPRITotal persons awaiting trial or adjudication
1998 1999 2000 1998 1999 2000Count Rate per 100,000 inhabitants
CountryArgentina 20,323 21,017 56.30 57.42Australia 2,788 3,206 3,785 14.83 16.87 19.71Azerbaijan 1,786 1,482 1,479 22.57 18.56 18.37Barbados 223 289 502 84.06 108.61 188.01Belarus 10,466 10,587 9,949 103.62 105.87 99.49Botswana 963 822 1,027 61.66 51.76 64.11Bulgaria 3,303 2,627 2,113 40.00 32.01 25.87Canada 7,218 7,295 23.90 23.92Chile 11,762 12,787 13,642 79.47 85.25 89.75Colombia 19,893 17,417 20,308 48.76 41.97 48.01Cyprus 48 35 44 6.41 4.64 5.81Czech Republic 7,125 6,934 5,967 69.17 67.32 57.93Denmark 948 901 887 17.88 16.94 16.62Dominica 341 287 255 349.32Dominican Republic 11,468 12,598 12,335 141.52 152.92 147.32England & Wales 8,358 7,932 7,219 15.94 15.05 13.64Estonia 1,323 1,639 1,541 94.09 118.20 112.56Finland 324 378 409 6.29 7.32 7.90France 21,591 20,452 18,100 36.97 34.90 30.73Georgia 2,116 2,137 2,511 38.88 42.54 49.98Germany 20,005 18,586 18,201 24.40 22.64 22.14Guatemala 5,146 3,890 46.36 34.12Hong Kong, China (SAR) 1,135 896 1,252 17.08 13.33 18.42Hungary 3,909 4,114 4,105 38.70 40.73 41.05Iceland 8 8 16 2.92 2.88 5.69India 202,564 20.67Ireland 428 11.28Italy 13,239 13,714 13,118 22.98 23.81 22.73Jamaica 1,564 60.71Japan 9,195 10,473 11,062 7.30 8.25 8.71
Page 272 of 316Population Source: World Bank

PRISONS16. Persons incarcerated, by category of incarceration, selected day
16.02 5k REMPRITotal persons awaiting trial or adjudication
1998 1999 2000 1998 1999 2000Count Rate per 100,000 inhabitants
CountryKazakhstan 13,989 13,393 15,257 92.64 89.89 102.40Korea, Republic of 31,238 28,609 24,745 67.32 61.00 52.32Kyrgyzstan 501 497 466 10.44 10.22 9.48Latvia 1,515 1,697 1,733 61.86 70.41 73.06Lithuania 2,421 2,207 1,915 65.38 59.66 51.83Macedonia, FYR 197 194 217 9.78 9.62 10.68Malaysia 37,181 40,513 39,393 167.48 178.47 169.07Mauritius 323 332 400 27.85 28.27 33.72Mexico 54,403 61,424 63,724 57.15 63.59 65.02Moldova, Republic of 2,903 2,775 2,750 67.53 64.69 64.22Netherlands 4,392 4,614 4,731 27.97 29.20 29.75New Zealand 674 702 783 17.77 18.42 20.44Norway 546 12.32Oman 182 238 236 7.91 10.14 9.85Papua New Guinea 1,032 1,042 1,428 21.14 20.82 27.84Paraguay 4,168 3,889 3,062 79.86 72.57 55.71Philippines 25,435 30,886 31,888 34.94 41.63 42.18Portugal 4,250 4,052 3,854 42.64 40.56 38.54Romania 6,089 5,434 5,325 27.06 24.15 23.77Saudi Arabia 14,988 16,556 15,613 76.08 81.96 75.43Singapore 552 552 794 14.07 13.97 19.76Slovenia 262 267 335 13.21 13.45 16.85Spain 11,272 10,564 9,729 28.61 26.81 24.63Sri Lanka 76,930 77,374 70,610 409.20 407.23 363.97Suriname 93 75 76 22.53 18.09 18.23Swaziland 119 119 149 12.01 11.67 14.26Sweden 1,066 1,082 1,150 12.04 12.22 12.97Switzerland 1,941 2,049 1,829 27.30 28.70 25.47Thailand 44,225 51,662 59,373 73.95 85.82 97.81Turkey 24,861 25,716 27,029 39.21 39.99 41.39
Page 273 of 316Population Source: World Bank

PRISONS16. Persons incarcerated, by category of incarceration, selected day
16.02 5k REMPRITotal persons awaiting trial or adjudication
1998 1999 2000 1998 1999 2000Count Rate per 100,000 inhabitants
CountryUkraine 17,259 16,092 34.59 32.51Venezuela 14,239 8,414 8,689 61.38 35.50 35.90Zambia 5,138 1,898 3,054 53.16 19.21 30.24Zimbabwe 4,929 5,077 5,747 40.40 40.94 45.61
Page 274 of 316Population Source: World Bank

PRISONS16. Persons incarcerated, by category of incarceration, selected day
16.03 5k SENPRITotal persons sentenced to incarceration
1998 1999 2000 1998 1999 2000Count Rate per 100,000 inhabitants
CountryArgentina 8,840 9,050 24.49 24.73Australia 16,842 17,865 17,842 89.59 94.03 92.93Azerbaijan 1,084 683 878 13.70 8.56 10.91Barbados 511 608 581 192.61 228.50 217.60Belarus 50,785 46,936 44,711 502.82 469.36 447.11Botswana 5,354 5,817 5,521 342.83 366.28 344.63Bulgaria 8,238 8,610 8,034 99.77 104.90 98.37Canada 28,927 21,207 95.78 69.53Chile 13,222 14,994 17,017 89.34 99.96 111.95Colombia 24,505 27,647 31,210 60.06 66.62 73.78Cyprus 199 237 244 26.57 31.43 32.23Czech Republic 14,942 16,126 15,571 145.07 156.56 151.17Denmark 2,385 2,487 2,405 44.99 46.76 45.07Dominica 737 642 655 897.26Dominican Republic 1,585 2,006 2,673 19.56 24.35 31.92England & Wales 52,269 51,392 53,180 99.70 97.54 100.45Estonia 2,999 3,040 3,262 213.30 219.23 238.28Finland 2,403 2,268 2,491 46.63 43.91 48.12France 31,984 32,261 33,126 54.77 55.05 56.24Georgia 8,290 6,392 5,838 152.33 127.23 116.20Germany 55,303 58,798 57,879 67.44 71.62 70.41Guatemala 2,603 3,084 23.45 27.05Hong Kong, China (SAR) 10,333 10,354 10,577 155.49 154.06 155.61Hungary 10,171 10,800 11,201 100.70 106.93 112.01Iceland 85 82 65 31.02 29.55 23.13India 66,414 6.78Ireland 2,550 67.21Italy 34,347 37,857 39,631 59.63 65.72 68.68Jamaica 2,160 2,078 325 83.85 80.23 12.34Japan 43,297 45,372 49,867 34.36 35.73 39.27
Page 275 of 316Population Source: World Bank

PRISONS16. Persons incarcerated, by category of incarceration, selected day
16.03 5k SENPRITotal persons sentenced to incarceration
1998 1999 2000 1998 1999 2000Count Rate per 100,000 inhabitants
CountryKazakhstan 3,333 3,105 3,808 22.07 20.84 25.56Korea, Republic of 35,125 38,364 37,120 75.70 81.80 78.48Kyrgyzstan 179 149 165 3.73 3.06 3.36Latvia 959 967 1,150 39.16 40.12 48.48Lithuania 11,983 12,205 7,601 323.60 329.95 205.71Macedonia, FYR 986 1,101 1,222 48.93 54.59 60.17Malaysia 34,663 38,465 38,736 156.14 169.45 166.25Maldives 13 4 6 4.95 1.49 2.17Mauritius 1,228 1,044 1,305 105.89 88.90 110.02Mexico 74,499 81,376 91,041 78.26 84.24 92.90Moldova, Republic of 6,868 6,510 7,131 159.76 151.75 166.53Netherlands 5,731 5,572 5,223 36.50 35.27 32.85New Zealand 4,849 4,983 5,143 127.87 130.76 134.25Norway 1,323 29.85Papua New Guinea 2,662 2,229 2,089 54.52 44.53 40.72Paraguay 253 309 311 4.85 5.77 5.66Philippines 2,370 2,839 3,110 3.26 3.83 4.11Portugal 10,630 9,041 9,090 106.64 90.51 90.90Qatar 518 592 570 94.87 104.76 97.45Romania 38,662 38,919 34,478 171.83 172.97 153.92Saudi Arabia 8,101 9,909 8,107 41.12 49.05 39.16Singapore 8,384 10,883 12,008 213.71 275.38 298.86Slovakia 4,998 4,980 5,039 92.72 92.31 93.28Slovenia 562 685 768 28.35 34.50 38.63South Africa 97,254 108,414 109,951 234.91 257.52 256.89Spain 33,475 34,820 35,580 84.96 88.38 90.08Sri Lanka 20,807 22,466 18,715 110.68 118.24 96.47Suriname 572 638 710 138.56 153.90 170.26Swaziland 3,501 3,751 4,039 353.47 367.94 386.51Sweden 3,708 3,742 3,865 41.89 42.25 43.58
Page 276 of 316Population Source: World Bank

PRISONS16. Persons incarcerated, by category of incarceration, selected day
16.03 5k SENPRITotal persons sentenced to incarceration
1998 1999 2000 1998 1999 2000Count Rate per 100,000 inhabitants
CountrySwitzerland 3,231 3,266 3,474 45.44 45.74 48.38Thailand 97,027 125,258 132,337 162.25 208.07 218.02Turkey 38,538 43,772 45,503 60.79 68.07 69.68Ukraine 170,451 181,104 184,752 338.87 362.93 373.24Venezuela 9,679 8,142 6,418 41.72 34.35 26.52Zambia 9,180 12,683 8,945 94.97 128.35 88.56Zimbabwe 14,048 14,489 14,820 115.15 116.85 117.62
Page 277 of 316Population Source: World Bank

PRISONS16. Persons incarcerated, by category of incarceration, selected day
16.04 5k ADTPRITotal persons in administrative detention
1998 1999 2000 1998 1999 2000Count Rate per 100,000 inhabitants
CountryArgentina 982 889 2.72 2.43Botswana 222 248 195 14.22 15.62 12.17Canada 271 548 0.90 1.80Chile 1,887 2,270 2,391 12.75 15.13 15.73England & Wales 4,545 4,657 4,214 8.67 8.84 7.96Estonia 21 20 8 1.49 1.44 0.58Hong Kong, China (SAR) 444 295 181 6.68 4.39 2.66Hungary 113 15 60 1.12 0.15 0.60India 3,965 0.40Jamaica 548 983 67 21.27 37.95 2.54Norway 58 1.31Papua New Guinea 403 34 322 8.25 0.68 6.28Slovakia 1,630 1,878 1,902 30.24 34.81 35.21Slovenia 24 28 45 1.21 1.41 2.26Sweden 21 23 26 0.24 0.26 0.29Switzerland 476 503 424 6.69 7.04 5.91Thailand 42 34 27 0.07 0.06 0.04Zambia 1 0.01
Page 278 of 316Population Source: World Bank

PRISONS16. Persons incarcerated, by category of incarceration, selected day
16.05 5k NPFPRITotal persons incarcerated for non-payment of penal fine
1998 1999 2000 1998 1999 2000Count Rate per 100,000 inhabitants
CountryAustralia 276 467 87 1.47 2.46 0.45Barbados 89 110 124 33.55 41.34 46.44Cyprus 8 4 1.07 0.53Denmark 49 51 54 0.92 0.96 1.01Dominica 186 134 201 275.34England & Wales 110 99 87 0.21 0.19 0.16Finland 121 129 141 2.35 2.50 2.72France 270 248 215 0.46 0.42 0.37Germany 4,096 3,980 3,769 5.00 4.85 4.59Hungary 385 421 346 3.81 4.17 3.46Iceland 10 2 1 3.65 0.72 0.36Jamaica 141 103 17 5.47 3.98 0.65Japan 219 284 312 0.17 0.22 0.25Korea, Republic of 1,520 1,114 1,607 3.28 2.38 3.40Macedonia, FYR 18 38 25 0.89 1.88 1.23Mauritius 321 162 354 27.68 13.79 29.84Oman 15 19 25 0.65 0.81 1.04Qatar 1 0.18Sri Lanka 16,582 17,282 13,521 88.20 90.96 69.70Swaziland 3,501 3,751 4,039 353.47 367.94 386.51Thailand 5,997 5,633 5,682 10.03 9.36 9.36Turkey 77 35 16 0.12 0.05 0.02
Page 279 of 316Population Source: World Bank

PRISONS16. Persons incarcerated, by category of incarceration, selected day
16.06 5k CLIPRITotal persons incarcerated under civil law
1998 1999 2000 1998 1999 2000Count Rate per 100,000 inhabitants
CountryBarbados 99 147 173 37.32 55.25 64.79Botswana 1 2 1 0.06 0.13 0.06Cyprus 4 1 0.53 0.13Dominica 14 16 20 27.40England & Wales 555 548 581 1.06 1.04 1.10Estonia 36 13 11 2.56 0.94 0.80Hong Kong, China (SAR) 2 7 0.03 0.10India 188 0.02Maldives 2 0.72Mauritius 321 248 241 27.68 21.12 20.32Norway 18 0.41Qatar 2 0.37South Africa 7 13 12 0.02 0.03 0.03Sri Lanka 7,432 7,070 7,056 39.53 37.21 36.37Turkey 17,034 23,068 26.87 35.88Zimbabwe 901 1,160 885 7.39 9.35 7.02
Page 280 of 316Population Source: World Bank

PRISONS17. Adult prisoners: time spent in prison awaiting trial
17.01 7d aldat17Average length of time spent in prison awaiting trial, for all offences
1998 1999 2000 1998 1999 2000Count Rate per 100,000 inhabitants
CountryAustralia 4 4 4 0.02 0.02 0.02Azerbaijan 4 4 3 0.05 0.05 0.04Belarus 5 5 5 0.05 0.05 0.05Botswana 13 10 10 0.83 0.63 0.62Czech Republic 6 5 6 0.06 0.05 0.06Denmark 2 2 2 0.03 0.03 0.03Dominican Republic 24 20 18 0.30 0.24 0.21Finland 2 3 3 0.04 0.05 0.05France 6 56 55 0.01 0.10 0.09Georgia 5 5 5 0.09 0.10 0.10Hong Kong, China (SAR) 2 2 2 0.03 0.03 0.03Hungary 5 6 9 0.05 0.06 0.09Iceland 2 1 3 0.61 0.36 0.89Italy 6 6 0.01 0.01Lithuania 6 5 5 0.16 0.14 0.14Macedonia, FYR 62 66 70 3.08 3.27 3.45Mauritius 7 7 7 0.60 0.60 0.59New Zealand 2 2 2 0.04 0.04 0.04Norway 2 2 0.05 0.04Papua New Guinea 18 12 12 0.37 0.24 0.23Portugal 10 9 9 0.10 0.09 0.09Qatar 12 5 9 2.20 0.88 1.54Romania 12 10 9 0.05 0.04 0.04Saudi Arabia 3 2 2 0.02 0.01 0.01Singapore 11 12 15 0.28 0.30 0.37Slovakia 12 12 12 0.22 0.22 0.22South Africa 4 5 5 0.01 0.01 0.01Spain 11 11 10 0.03 0.03 0.03Sri Lanka 6 6 6 0.03 0.03 0.03Suriname 10 12 11 2.42 2.89 2.64
Page 281 of 316Population Source: World Bank

PRISONS17. Adult prisoners: time spent in prison awaiting trial
17.01 7d aldat17Average length of time spent in prison awaiting trial, for all offences
1998 1999 2000 1998 1999 2000Count Rate per 100,000 inhabitants
CountrySwaziland 63 86 87 6.36 8.44 8.33Switzerland 53 57 0.75 0.80Turkey 3 3 3 0.01 0.00 0.00Ukraine 4 4 4 0.01 0.01 0.01Zimbabwe 3 3 3 0.02 0.02 0.02
Page 282 of 316Population Source: World Bank

PRISONS18. Adult prisoners: time actually served in prison after conviction
18.01 7d aldas18Average length of time actually served in prison
1998 1999 2000 1998 1999 2000Count Rate per 100,000 inhabitants
CountryAustralia 34 34 37 0.18 0.18 0.19Belarus 43 43 51 0.42 0.43 0.51Botswana 60 60 60 3.84 3.78 3.75Canada 1 1 0.00 0.00Colombia 126 140 137 0.31 0.34 0.32Czech Republic 38 37 39 0.37 0.36 0.38Denmark 3 3 3 0.05 0.05 0.06Dominican Republic 60 48 48 0.74 0.58 0.57England & Wales 14 14 15 0.03 0.03 0.03Estonia 64 51 55 4.55 3.68 4.02Finland 8 7 7 0.15 0.14 0.14Georgia 60 60 60 1.10 1.19 1.19Hong Kong, China (SAR) 7 7 6 0.10 0.10 0.09Hungary 48 50 52 0.48 0.49 0.52Iceland 5 5 5 1.75 1.77 1.74Jamaica 2 2 2 0.08 0.08 0.08Latvia 68 60 58 2.78 2.51 2.45Lithuania 27 26 25 0.73 0.70 0.68Mauritius 9 9 9 0.78 0.77 0.76Moldova, Republic of 83 87 93 1.93 2.03 2.17Montserrat 2 2 2Netherlands 5 5 5 0.03 0.03 0.03New Zealand 9 9 9 0.22 0.23 0.22Papua New Guinea 6 12 24 0.12 0.24 0.47Portugal 26 25 26 0.26 0.25 0.26Qatar 74 78 80 13.55 13.80 13.68Romania 53 50 48 0.24 0.22 0.21Singapore 6 10 7 0.15 0.24 0.17South Africa 25 25 26 0.06 0.06 0.06Spain 29 29 30 0.07 0.07 0.08
Page 283 of 316Population Source: World Bank

PRISONS18. Adult prisoners: time actually served in prison after conviction
18.01 7d aldas18Average length of time actually served in prison
1998 1999 2000 1998 1999 2000Count Rate per 100,000 inhabitants
CountrySuriname 84 87 91 20.35 20.99 21.82Turkey 6 6 9 0.01 0.01 0.01Ukraine 5 5 5 0.01 0.01 0.01United States of America 28 29 0.01 0.01Zimbabwe 24 24 24 0.20 0.19 0.19
Page 284 of 316Population Source: World Bank

PRISONS19. Persons on probation, by age group, selected day
19.01 5l TOPRODTotal persons placed on probation on given day
1998 1999 2000 1998 1999 2000Count Rate per 100,000 inhabitants
CountryAzerbaijan 3,421 3,524 3,463 43.23 44.14 43.02Belarus 21,630 21,002 19,651 214.16 210.02 196.51Canada 134,307 132,869 444.73 435.64Chile 3,584 4,028 3,462 24.22 26.85 22.78Cyprus 87 77 64 11.62 10.21 8.45Denmark 2,204 2,364 4,134 41.58 44.44 77.47England & Wales 126,900 137,000 242.05 260.01Estonia 1,691 4,715 5,988 120.27 340.02 437.40Finland 1,682 1,502 1,485 32.64 29.08 28.68France 2,963 3,161 3,663 5.07 5.39 6.22Hong Kong, China (SAR) 3,578 3,562 3,638 53.84 53.00 53.52Hungary 175 201 198 1.73 1.99 1.98Iceland 16 19 19 5.84 6.85 6.76Indonesia 156 262 321 0.08 0.13 0.15Ireland 3,082 3,151 2,707 83.03 83.98 71.35Jamaica 938 1,020 1,689 36.41 39.38 64.15Japan 53,766 54,538 54,416 42.67 42.94 42.85Kazakhstan 27,778 8,079 27,315 183.96 54.22 183.32Korea, Republic of 46,510 46,343 44,950 100.24 98.81 95.03Kyrgyzstan 478 385 293 9.96 7.91 5.96Lithuania 11,338 306.85Malaysia 37,181 40,518 39,398 167.48 178.49 169.09Maldives 28 5 3 10.66 1.86 1.09Mexico 13,890 30,089 24,242 14.59 31.15 24.74New Zealand 21,655 18,902 17,092 571.04 496.02 446.17Portugal 1,443 1,520 1,795 14.48 15.22 17.95Russian Federation 548,981 652,667 543,615 373.46 447.03 372.34Slovakia 2,163 2,174 2,218 40.12 40.30 41.06Spain 62 102 114 0.16 0.26 0.29Suriname 3 11 11 0.73 2.65 2.64
Page 285 of 316Population Source: World Bank

PRISONS19. Persons on probation, by age group, selected day
19.01 5l TOPRODTotal persons placed on probation on given day
1998 1999 2000 1998 1999 2000Count Rate per 100,000 inhabitants
CountrySweden 7,163 7,029 6,944 80.92 79.36 78.30Ukraine 50,311 29,551 41,860 100.02 59.22 84.57Venezuela 1,493 6.17
Page 286 of 316Population Source: World Bank

PRISONS19. Persons on probation, by age group, selected day
19.02 5l ADPRODAdults placed on probation on given day
1998 1999 2000 1998 1999 2000Count Rate per 100,000 inhabitants
CountryAzerbaijan 3,421 3,524 3,463 43.23 44.14 43.02Belarus 17,385 16,920 15,844 172.13 169.20 158.44Canada 100,982 102,147 334.38 334.91Chile 3,584 4,028 3,462 24.22 26.85 22.78Cyprus 62 49 11 8.28 6.50 1.45England & Wales 117,600 127,200 224.31 241.41Estonia 1,282 3,944 5,187 91.18 284.42 378.89Finland 1,428 1,326 1,287 27.71 25.67 24.86Hong Kong, China (SAR) 2,668 2,684 2,827 40.15 39.94 41.59Hungary 163 186 174 1.61 1.84 1.74Iceland 14 19 16 5.11 6.85 5.69Ireland 2,312 2,363 2,030 62.28 62.98 53.51Jamaica 389 651 1,136 15.10 25.14 43.14Japan 14,712 15,105 15,593 11.68 11.89 12.28Kazakhstan 27,778 8,079 27,315 183.96 54.22 183.32Korea, Republic of 34,755 32,713 28,278 74.90 69.75 59.78Kyrgyzstan 410 315 210 8.55 6.48 4.27Lithuania 13,430 13,610 10,616 362.68 367.94 287.31Maldives 20 4 3 7.62 1.49 1.09Mexico 36,256 29,291 23,283 38.08 30.32 23.76Russian Federation 454,811 544,665 458,857 309.40 373.06 314.29Slovakia 2,080 2,095 2,134 38.59 38.83 39.51Spain 62 100 111 0.16 0.25 0.28Ukraine 46,292 25,327 36,748 92.03 50.76 74.24United States of America 3,384,359 3,740,808 3,807,993 1,230.68 1,345.61 1,350.35Venezuela 1,493 6.17
Page 287 of 316Population Source: World Bank

PRISONS19. Persons on probation, by age group, selected day
19.03 5l JUPRODJuveniles placed on probation on given day
1998 1999 2000 1998 1999 2000Count Rate per 100,000 inhabitants
CountryBelarus 4,245 4,082 3,807 42.03 40.82 38.07Canada 33,325 30,722 110.35 100.73Cyprus 25 28 23 3.34 3.71 3.04England & Wales 9,300 9,800 17.74 18.60Estonia 409 771 801 29.09 55.60 58.51Finland 254 176 198 4.93 3.41 3.82Hong Kong, China (SAR) 910 878 811 13.69 13.06 11.93Hungary 12 15 24 0.12 0.15 0.24Iceland 2 3 0.73 1.07Ireland 770 788 677 20.74 21.00 17.84Italy 1,249 1,412 1,434 2.17 2.45 2.49Jamaica 549 369 553 21.31 14.25 21.00Japan 39,054 39,433 38,823 31.00 31.05 30.57Korea, Republic of 11,755 13,630 16,672 25.33 29.06 35.25Kyrgyzstan 68 70 83 1.42 1.44 1.69Lithuania 722 19.54Maldives 8 1 3.05 0.37Mexico 634 798 959 0.67 0.83 0.98Qatar 78 136 81 14.29 24.07 13.85Russian Federation 94,170 108,002 84,758 64.06 73.97 58.05Slovakia 83 79 84 1.54 1.46 1.56Spain 2 3 0.01 0.01Sweden 165 123 151 1.86 1.39 1.70Ukraine 4,019 4,224 5,112 7.99 8.46 10.33Zambia 123 58 62 1.27 0.59 0.61
Page 288 of 316Population Source: World Bank

PRISONS20. Persons on parole, by age group, selected day
20.01 5l TOPARDTotal persons placed on release/parole on given day
1998 1999 2000 1998 1999 2000Count Rate per 100,000 inhabitants
CountryAzerbaijan 42 49 71 0.53 0.61 0.88Belarus 7,891 7,222 9,099 78.13 72.22 90.99Botswana 2 3 5 0.13 0.19 0.31Bulgaria 1,097 1,233 1,088 13.29 15.02 13.32Canada 9,938 9,995 32.91 32.77Chile 2,516 2,164 1,836 17.00 14.43 12.08China 29,560 30,055 23,550 2.38 2.40 1.87Denmark 1,121 1,126 1,106 21.15 21.17 20.73England & Wales 2,000 2,350 2,700 3.81 4.46 5.10Estonia 394 378 368 28.02 27.26 26.88Finland 1,191 1,165 1,232 23.11 22.56 23.80France 4,685 4,852 5,013 8.02 8.28 8.51Georgia 594 648 1,884 10.92 12.90 37.50Hong Kong, China (SAR) 3,359 2,953 2,764 50.54 43.94 40.66Hungary 4,328 4,517 5,725 42.85 44.72 57.25Iceland 149 126 112 54.38 45.41 39.86India 10,010 1.02Indonesia 1,460 1,735 1,884 0.72 0.84 0.90Ireland 62 73 75 1.67 1.95 1.98Italy 317 225 200 0.55 0.39 0.35Jamaica 61 77 73 2.37 2.97 2.77Japan 12,117 12,740 13,602 9.62 10.03 10.71Kazakhstan 10,097 9,507 12,116 66.87 63.81 81.32Korea, Republic of 5,444 9,299 8,890 11.73 19.83 18.79Kyrgyzstan 1,260 1,796 2,395 26.27 36.92 48.73Latvia 1,007 1,029 794 41.12 42.70 33.47Lithuania 2,654 71.83Macedonia, FYR 177 231 290 8.78 11.45 14.28Maldives 3 1 1 1.14 0.37 0.36Mexico 1,763 2,895 3,934 1.85 3.00 4.01
Page 289 of 316Population Source: World Bank

PRISONS20. Persons on parole, by age group, selected day
20.01 5l TOPARDTotal persons placed on release/parole on given day
1998 1999 2000 1998 1999 2000Count Rate per 100,000 inhabitants
CountryMoldova, Republic of 474 399 229 11.03 9.30 5.35Netherlands 85 87 86 0.54 0.55 0.54New Zealand 1,657 1,610 1,828 43.69 42.25 47.72Norway 2,407 54.31Portugal 2,807 2,722 3,111 28.16 27.25 31.11Qatar 21 11 3.85 1.95Romania 24 29,816 28,864 0.11 132.52 128.86Slovenia 464 615 700 23.40 30.97 35.21Spain 7,101 6,921 6,389 18.02 17.57 16.17Sri Lanka 99 116 112 0.53 0.61 0.58Suriname 5 10 20 1.21 2.41 4.80Sweden 4,023 4,219 4,234 45.45 47.63 47.74Turkey 1,964 1,843 1,364 3.10 2.87 2.09Ukraine 13,578 15,587 21,558 26.99 31.24 43.55Zimbabwe 74 69 61 0.61 0.56 0.48
Page 290 of 316Population Source: World Bank

PRISONS20. Persons on parole, by age group, selected day
20.02 5l ADPARDAdults placed on release/parole on given day
1998 1999 2000 1998 1999 2000Count Rate per 100,000 inhabitants
CountryAzerbaijan 40 49 71 0.51 0.61 0.88Belarus 7,287 6,473 8,288 72.15 64.73 82.88Botswana 2 3 5 0.13 0.19 0.31Bulgaria 1,076 1,226 1,085 13.03 14.94 13.29Canada 9,938 9,995 32.91 32.77Chile 2,516 2,164 1,836 17.00 14.43 12.08Estonia 360 360 354 25.60 25.96 25.86Finland 1,190 1,165 1,231 23.09 22.56 23.78Georgia 562 633 1,847 10.33 12.60 36.76Hong Kong, China (SAR) 1,903 1,638 1,561 28.64 24.37 22.97Hungary 4,108 4,312 5,495 40.67 42.69 54.95Iceland 149 126 112 54.38 45.41 39.86Ireland 56 72 71 1.51 1.92 1.87Italy 317 225 200 0.55 0.39 0.35Jamaica 61 77 73 2.37 2.97 2.77Japan 6,302 6,317 6,625 5.00 4.97 5.22Kazakhstan 9,762 9,255 11,814 64.65 62.11 79.29Korea, Republic of 4,790 8,559 8,035 10.32 18.25 16.99Kyrgyzstan 1,200 1,701 2,310 25.02 34.97 47.00Latvia 910 923 723 37.16 38.30 30.48Lithuania 2,873 2,986 2,647 77.59 80.72 71.64Macedonia, FYR 175 227 290 8.68 11.25 14.28Maldives 1 1 0.38 0.37Mexico 1,706 3,118 1.77 3.18Moldova, Republic of 446 351 212 10.37 8.18 4.95Netherlands 85 87 86 0.54 0.55 0.54Philippines 2,630 3,980 3,099 3.61 5.36 4.10Qatar 21 11 3.85 1.95Slovenia 458 613 700 23.10 30.87 35.21Spain 7,076 6,901 6,364 17.96 17.52 16.11
Page 291 of 316Population Source: World Bank

PRISONS20. Persons on parole, by age group, selected day
20.02 5l ADPARDAdults placed on release/parole on given day
1998 1999 2000 1998 1999 2000Count Rate per 100,000 inhabitants
CountrySri Lanka 99 116 112 0.53 0.61 0.58Thailand 18,687 24,127 19,321 31.25 40.08 31.83Turkey 1,942 1,836 1,363 3.06 2.86 2.09Ukraine 12,434 14,397 20,117 24.72 28.85 40.64United States of America 638,203 641,693 652,199 232.07 230.82 231.28Zimbabwe 74 69 61 0.61 0.56 0.48
Page 292 of 316Population Source: World Bank

PRISONS20. Persons on parole, by age group, selected day
20.03 5l JUPARDJuveniles placed on release/parole on given day
1998 1999 2000 1998 1999 2000Count Rate per 100,000 inhabitants
CountryAzerbaijan 2 0.03Belarus 604 749 811 5.98 7.49 8.11Bulgaria 21 7 3 0.25 0.09 0.04Estonia 34 18 14 2.42 1.30 1.02Finland 1 1 0.02 0.02Georgia 32 15 37 0.59 0.30 0.74Hong Kong, China (SAR) 1,456 1,315 1,203 21.91 19.57 17.70Hungary 220 205 230 2.18 2.03 2.30Ireland 5 1 4 0.13 0.03 0.11Japan 5,813 6,423 6,977 4.61 5.06 5.49Kazakhstan 335 252 302 2.22 1.69 2.03Korea, Republic of 654 740 855 1.41 1.58 1.81Kyrgyzstan 60 95 85 1.25 1.95 1.73Latvia 97 106 71 3.96 4.40 2.99Lithuania 7 0.19Macedonia, FYR 2 4 0.10 0.20Maldives 2 1 0.76 0.36Mexico 1,763 1,189 816 1.85 1.23 0.83Moldova, Republic of 28 48 17 0.65 1.12 0.40Slovenia 6 3 0.30 0.15Spain 25 20 25 0.06 0.05 0.06Sweden 3 2 0.03 0.02Turkey 22 7 1 0.03 0.01 0.00Ukraine 1,144 1,290 1,381 2.27 2.59 2.79
Page 293 of 316Population Source: World Bank

PRISONS21. Convicted prisoners, by sex and age group, selected day
21.01 6d FPRCVNumber of female convicted prisoners
1998 1999 2000 1998 1999 2000Count Rate per 100,000 inhabitants
CountryArgentina 538 499 1.49 1.36Azerbaijan 281 274 272 3.55 3.43 3.38Barbados 23 17 16 8.67 6.39 5.99Belarus 3,135 2,797 2,638 31.04 27.97 26.38Botswana 214 168 157 13.70 10.58 9.80Bulgaria 266 258 236 3.22 3.14 2.89Chile 789 898 1,085 5.33 5.99 7.14China 43,382 47,181 53,494 3.50 3.77 4.25Cyprus 5 14 8 0.67 1.86 1.06Czech Republic 519 616 605 5.04 5.98 5.87Denmark 113 115 112 2.13 2.16 2.10Dominica 8 5 4 5.48England & Wales 2,676 2,757 2,936 5.10 5.23 5.55Estonia 108 113 126 7.68 8.15 9.20Finland 114 111 124 2.21 2.15 2.40France 1,014 902 993 1.74 1.54 1.69Georgia 172 105 113 3.16 2.09 2.25Germany 2,296 2,467 2,386 2.80 3.00 2.90Hong Kong, China (SAR) 1,198 1,291 1,524 18.03 19.21 22.42Hungary 521 651 690 5.16 6.45 6.90Iceland 5 3 2 1.82 1.08 0.71India 66,414 6.78Indonesia 556 1,011 955 0.27 0.49 0.45Ireland 58 1.53Jamaica 223 293 291 8.66 11.31 11.05Japan 2,149 2,246 2,507 1.71 1.77 1.97Korea, Republic of 1,411 1,519 1,350 3.04 3.24 2.85Kyrgyzstan 758 705 691 15.80 14.49 14.06Latvia 265 273 242 10.82 11.33 10.20Lithuania 609 549 236 16.45 14.84 6.39
Page 294 of 316Population Source: World Bank

PRISONS21. Convicted prisoners, by sex and age group, selected day
21.01 6d FPRCVNumber of female convicted prisoners
1998 1999 2000 1998 1999 2000Count Rate per 100,000 inhabitants
CountryMacedonia, FYR 24 26 28 1.19 1.29 1.38Malaysia 2,909 3,127 3,511 13.10 13.78 15.07Maldives 1 3 0.37 1.09Mauritius 81 58 67 6.98 4.94 5.65Mexico 2,889 3,492 4,016 3.03 3.61 4.10Moldova, Republic of 258 190 219 6.00 4.43 5.11Montserrat 2New Zealand 199 206 276 5.25 5.41 7.20Norway 78 1.76Oman 73 53 101 3.17 2.26 4.22Pakistan 15 4 7 0.01 0.00 0.01Panama 226 195 195 8.18 6.94 6.83Papua New Guinea 312 216 288 6.39 4.31 5.61Paraguay 209 215 169 4.00 4.01 3.07Philippines 2,272 2,718 2,456 3.12 3.66 3.25Portugal 855 780 746 8.58 7.81 7.46Qatar 70 59 67 12.82 10.44 11.46Romania 1 2 1 0.01 0.01 0.01Saudi Arabia 1,809 1,881 1,570 9.18 9.31 7.58Singapore 577 963 1,111 14.71 24.37 27.65Slovakia 187 165 187 3.47 3.06 3.46Slovenia 15 21 29 0.76 1.06 1.46South Africa 2,183 2,593 2,644 5.27 6.16 6.18Spain 3,966 3,732 3,653 10.07 9.47 9.25Sri Lanka 845 801 533 4.49 4.22 2.75Suriname 45 40 42 10.90 9.65 10.07Swaziland 832 834 798 84.00 81.81 76.36Sweden 208 213 228 2.35 2.40 2.57Switzerland 180 92 185 2.53 1.29 2.58Turkey 1,330 1,485 894 2.10 2.31 1.37
Page 295 of 316Population Source: World Bank

PRISONS21. Convicted prisoners, by sex and age group, selected day
21.01 6d FPRCVNumber of female convicted prisoners
1998 1999 2000 1998 1999 2000Count Rate per 100,000 inhabitants
CountryUkraine 10,429 11,352 11,107 20.73 22.75 22.44United States of America 77,600 82,463 83,668 28.22 29.66 29.67Zambia 240 76 134 2.48 0.77 1.33Zimbabwe 643 547 542 5.27 4.41 4.30
Page 296 of 316Population Source: World Bank

PRISONS21. Convicted prisoners, by sex and age group, selected day
21.02 6d MPRCVNumber of male convicted prisoners
1998 1999 2000 1998 1999 2000Count Rate per 100,000 inhabitants
CountryArgentina 8,302 8,551 23.00 23.36Azerbaijan 21,685 22,599 20,875 274.04 283.09 259.35Barbados 488 591 565 183.94 222.11 211.61Belarus 60,022 56,470 53,952 594.28 564.70 539.52Botswana 5,140 5,649 5,364 329.12 355.70 334.83Bulgaria 7,972 8,352 7,798 96.55 101.75 95.48Chile 12,433 14,096 15,932 84.01 93.97 104.82China 1,391,346 1,380,226 1,386,935 112.21 110.42 110.07Cyprus 194 209 226 25.90 27.72 29.85Czech Republic 14,423 15,510 14,966 140.03 150.58 145.30Denmark 2,272 2,372 2,293 42.86 44.59 42.97Dominica 374 331 370 506.85England & Wales 62,070 53,292 54,458 118.39 101.14 102.86Estonia 2,891 2,927 3,136 205.61 211.08 229.07Finland 2,410 2,286 2,508 46.77 44.26 48.45France 30,970 31,279 32,133 53.03 53.38 54.56Georgia 8,118 6,287 5,725 149.17 125.14 113.95Germany 54,365 57,240 58,412 66.30 69.72 71.06Hong Kong, China (SAR) 9,137 9,063 9,060 137.49 134.85 133.29Hungary 9,650 10,149 10,511 95.54 100.49 105.11Iceland 80 79 60 29.20 28.47 21.35India 1,858 0.19Indonesia 30,525 28,826 33,393 14.96 13.93 15.90Ireland 2,492 65.68Jamaica 2,072 2,359 2,046 80.43 91.08 77.71Japan 41,148 43,126 41,360 32.66 33.96 32.57Korea, Republic of 35,400 37,218 36,874 76.29 79.36 77.96Kyrgyzstan 12,859 13,083 13,209 268.06 268.94 268.75Latvia 5,972 5,575 4,932 243.85 231.33 207.93Lithuania 11,374 11,656 7,365 307.16 315.11 199.32
Page 297 of 316Population Source: World Bank

PRISONS21. Convicted prisoners, by sex and age group, selected day
21.02 6d MPRCVNumber of male convicted prisoners
1998 1999 2000 1998 1999 2000Count Rate per 100,000 inhabitants
CountryMacedonia, FYR 962 1,075 1,222 47.74 53.30 60.17Malaysia 64,166 35,811 35,302 289.04 157.76 151.51Maldives 45 16 23 17.14 5.94 8.33Mauritius 1,280 1,069 1,334 110.37 91.03 112.47Mexico 71,610 77,866 87,025 75.22 80.61 88.80Moldova, Republic of 6,610 6,320 6,912 153.76 147.32 161.42Montserrat 40 48 45New Zealand 4,675 4,759 4,815 123.28 124.89 125.69Norway 1,245 28.09Oman 1,833 1,716 1,919 79.63 73.08 80.13Pakistan 520 541 1,029 0.39 0.40 0.75Panama 2,041 2,368 2,556 73.84 84.24 89.50Papua New Guinea 4,866 3,659 4,494 99.66 73.09 87.60Paraguay 4,212 3,993 3,231 80.71 74.51 58.79Philippines 28,214 32,333 32,401 38.76 43.58 42.86Portugal 9,493 7,976 8,171 95.23 79.85 81.71Qatar 494 472 486 90.48 83.52 83.09Romania 35 37 38 0.15 0.17 0.17Saudi Arabia 21,279 24,584 22,150 108.02 121.70 107.00Singapore 7,807 9,920 10,897 199.01 251.01 271.20Slovakia 4,811 4,815 4,852 89.25 89.25 89.82Slovenia 547 664 739 27.59 33.44 37.17South Africa 81,914 101,814 105,904 197.86 241.84 247.44Spain 40,404 40,465 41,451 102.55 102.70 104.94Sri Lanka 19,962 21,665 18,182 106.18 114.03 93.72Suriname 38 455 581 9.20 109.76 139.33Swaziland 7,853 8,165 8,444 792.86 800.91 808.04Sweden 3,885 3,903 4,035 43.89 44.06 45.50Switzerland 3,051 3,174 3,289 42.91 44.45 45.81Turkey 39,908 42,624 23,961 62.95 66.29 36.69
Page 298 of 316Population Source: World Bank

PRISONS21. Convicted prisoners, by sex and age group, selected day
21.02 6d MPRCVNumber of male convicted prisoners
1998 1999 2000 1998 1999 2000Count Rate per 100,000 inhabitants
CountryUkraine 149,116 159,477 164,035 296.45 319.59 331.38United States of America 1,167,802 1,221,611 1,237,469 424.66 439.43 438.82Zambia 8,940 12,607 8,811 92.49 127.59 87.24Zimbabwe 13,405 13,942 14,278 109.88 112.44 113.32
Page 299 of 316Population Source: World Bank

PRISONS21. Convicted prisoners, by sex and age group, selected day
21.03 5o ADPRCVTotal convicted adults admitted to prison
1998 1999 2000 1998 1999 2000Count Rate per 100,000 inhabitants
CountryArgentina 8,832 9,027 24.47 24.66Australia 17,118 18,332 17,929 91.05 96.48 93.38Azerbaijan 21,893 22,811 21,065 276.67 285.74 261.71Barbados 511 608 581 192.61 228.50 217.60Belarus 61,178 57,622 55,031 605.72 576.22 550.31Botswana 5,011 5,473 5,231 320.86 344.62 326.53Bulgaria 8,196 8,559 7,982 99.26 104.28 97.74Chile 13,212 14,983 17,002 89.27 99.89 111.86China 1,423,717 1,416,582 1,428,635 114.82 113.33 113.38Colombia 44,398 45,064 51,518 108.82 108.59 121.79Cyprus 199 223 234 26.57 29.58 30.91Czech Republic 14,779 15,995 15,461 143.49 155.29 150.11Denmark 2,263 2,365 2,287 42.69 44.46 42.86Dominica 181 233 265 363.01Dominican Republic 3,127 3,771 5,593 38.59 45.77 66.80England & Wales 47,014 46,425 47,729 89.67 88.11 90.15Estonia 2,928 2,975 3,184 208.25 214.54 232.58Finland 2,468 2,397 2,565 47.89 46.41 49.55France 31,846 32,100 32,968 54.53 54.78 55.97Georgia 8,225 6,344 5,811 151.14 126.27 115.66Germany 50,223 52,557 53,402 61.25 64.02 64.97Hong Kong, China (SAR) 9,350 9,387 9,509 140.69 139.67 139.90Hungary 9,863 10,473 10,900 97.65 103.69 109.00Iceland 85 82 62 31.02 29.55 22.06India 64,556 6.59Indonesia 28,355 28,133 32,570 13.90 13.59 15.51Italy 26,666 28,201 29,293 46.30 48.96 50.77Jamaica 2,295 2,483 2,171 89.09 95.87 82.45Japan 43,227 45,341 49,844 34.31 35.70 39.25Korea, Republic of 35,226 37,376 37,170 75.92 79.69 78.58
Page 300 of 316Population Source: World Bank

PRISONS21. Convicted prisoners, by sex and age group, selected day
21.03 5o ADPRCVTotal convicted adults admitted to prison
1998 1999 2000 1998 1999 2000Count Rate per 100,000 inhabitants
CountryKyrgyzstan 13,209 13,788 13,900 275.36 283.44 282.81Latvia 6,049 5,649 5,008 247.00 234.40 211.13Lithuania 11,718 12,006 7,532 316.45 324.57 203.84Macedonia, FYR 962 1,080 1,200 47.74 53.54 59.08Malaysia 34,663 38,465 35,223 156.14 169.45 151.17Maldives 47 18 26 17.90 6.68 9.42Mauritius 1,228 1,044 1,305 105.89 88.90 110.02Mexico 74,499 81,358 91,041 78.26 84.22 92.90Moldova, Republic of 6,708 6,439 7,042 156.04 150.09 164.46Netherlands 6,186 6,086 5,534 39.40 38.52 34.81New Zealand 4,854 4,877 5,067 128.00 127.98 132.27Norway 1,320 29.78Oman 1,777 1,687 1,903 77.19 71.85 79.46Pakistan 525 545 1,036 0.40 0.40 0.75Panama 2,267 2,563 2,751 82.02 91.18 96.32Papua New Guinea 4,853 3,627 4,515 99.39 72.45 88.01Paraguay 3,889 3,696 3,056 74.52 68.97 55.60Philippines 28,729 33,010 33,032 39.46 44.49 43.69Portugal 10,032 8,514 8,542 100.64 85.23 85.42Qatar 564 431 553 103.30 76.27 94.55Romania 35 38 38 0.15 0.17 0.17Russian Federation 719,597 756,843 671,054 489.52 518.39 459.63Saudi Arabia 23,088 26,465 23,720 117.20 131.01 114.59Singapore 8,384 10,883 12,008 213.71 275.38 298.86Slovakia 4,899 4,865 4,947 90.88 90.17 91.58Slovenia 533 658 738 26.88 33.14 37.12South Africa 81,570 92,051 96,201 197.03 218.65 224.77Spain 42,311 42,716 43,712 107.39 108.42 110.66Sri Lanka 20,807 22,466 18,715 110.68 118.24 96.47Suriname 472 482 614 114.34 116.27 147.24
Page 301 of 316Population Source: World Bank

PRISONS21. Convicted prisoners, by sex and age group, selected day
21.03 5o ADPRCVTotal convicted adults admitted to prison
1998 1999 2000 1998 1999 2000Count Rate per 100,000 inhabitants
CountrySwaziland 8,685 8,999 9,242 876.87 882.71 884.40Sweden 4,093 4,116 4,263 46.24 46.47 48.07Switzerland 3,231 3,266 3,474 45.44 45.74 48.38Thailand 97,027 125,258 132,237 162.25 208.07 217.85Turkey 36,879 39,808 22,077 58.17 61.91 33.81Ukraine 156,475 167,682 172,039 311.08 336.04 347.55United States of America 1,245,402 1,304,074 1,321,137 452.87 469.09 468.49Venezuela 12,450 13,402 4,294 53.66 56.55 17.74Zambia 9,057 12,622 8,783 93.70 127.74 86.96Zimbabwe 14,048 14,489 14,672 115.15 116.85 116.44
Page 302 of 316Population Source: World Bank

PRISONS21. Convicted prisoners, by sex and age group, selected day
21.04 5o AFPRCVAdult convicted females admitted to prison
1998 1999 2000 1998 1999 2000Count Rate per 100,000 inhabitants
CountryArgentina 538 498 1.49 1.36Australia 939 1,124 1,083 4.99 5.92 5.64Azerbaijan 277 270 268 3.50 3.38 3.33Belarus 3,060 2,741 2,596 30.30 27.41 25.96Botswana 214 168 157 13.70 10.58 9.80Bulgaria 263 254 232 3.19 3.09 2.84Chile 788 897 1,085 5.32 5.98 7.14Colombia 2,759 2,630 3,141 6.76 6.34 7.43Cyprus 5 14 8 0.67 1.86 1.06Czech Republic 514 614 602 4.99 5.96 5.84Dominica 10 8 15 20.55England & Wales 2,295 2,371 2,499 4.38 4.50 4.72Estonia 105 110 123 7.47 7.93 8.98Finland 112 107 117 2.17 2.07 2.26France 1,010 978 987 1.73 1.67 1.68Georgia 172 105 113 3.16 2.09 2.25Germany 2,105 2,270 2,182 2.57 2.76 2.65Hong Kong, China (SAR) 1,045 1,138 1,252 15.72 16.93 18.42Hungary 513 637 678 5.08 6.31 6.78Iceland 5 3 2 1.82 1.08 0.71India 52,890 5.40Indonesia 538 841 905 0.26 0.41 0.43Italy 1,007 1,140 1,212 1.75 1.98 2.10Jamaica 188 252 263 7.30 9.73 9.99Japan 2,149 2,246 2,506 1.71 1.77 1.97Korea, Republic of 1,397 1,501 1,326 3.01 3.20 2.80Kyrgyzstan 750 700 683 15.63 14.39 13.90Latvia 262 267 236 10.70 11.08 9.95Lithuania 596 536 235 16.10 14.49 6.36Macedonia, FYR 24 26 28 1.19 1.29 1.38
Page 303 of 316Population Source: World Bank

PRISONS21. Convicted prisoners, by sex and age group, selected day
21.04 5o AFPRCVAdult convicted females admitted to prison
1998 1999 2000 1998 1999 2000Count Rate per 100,000 inhabitants
CountryMalaysia 2,779 3,123 3,503 12.52 13.76 15.03Maldives 1 3 0.37 1.09Mauritius 64 49 58 5.52 4.17 4.89Moldova, Republic of 250 185 217 5.82 4.31 5.07Netherlands 297 373 305 1.89 2.36 1.92New Zealand 196 203 270 5.17 5.33 7.05Norway 78 1.76Oman 57 53 91 2.48 2.26 3.80Pakistan 5 4 7 0.00 0.00 0.01Panama 226 195 195 8.18 6.94 6.83Papua New Guinea 541 389 493 11.08 7.77 9.61Paraguay 209 181 144 4.00 3.38 2.62Philippines 2,161 2,588 2,340 2.97 3.49 3.10Portugal 834 774 739 8.37 7.75 7.39Qatar 70 59 67 12.82 10.44 11.46Romania 1 1 1 0.01 0.00 0.01Russian Federation 39,815 43,181 39,601 27.09 29.58 27.12Saudi Arabia 1,809 1,881 1,570 9.18 9.31 7.58Singapore 577 963 1,111 14.71 24.37 27.65Slovakia 185 165 187 3.43 3.06 3.46Slovenia 15 21 25 0.76 1.06 1.26South Africa 1,996 2,390 24,238 4.82 5.68 56.63Spain 3,846 3,635 3,561 9.76 9.23 9.02Sri Lanka 845 801 533 4.49 4.22 2.75Suriname 39 36 39 9.45 8.68 9.35Swaziland 832 834 798 84.00 81.81 76.36Sweden 208 213 228 2.35 2.40 2.57Switzerland 180 92 185 2.53 1.29 2.58Thailand 12,808 19,235 24,418 21.42 31.95 40.23Turkey 1,135 1,299 746 1.79 2.02 1.14
Page 304 of 316Population Source: World Bank

PRISONS21. Convicted prisoners, by sex and age group, selected day
21.04 5o AFPRCVAdult convicted females admitted to prison
1998 1999 2000 1998 1999 2000Count Rate per 100,000 inhabitants
CountryUkraine 10,268 11,196 10,942 20.41 22.44 22.11Venezuela 627 174 2.65 0.72Zambia 240 73 134 2.48 0.74 1.33Zimbabwe 643 547 527 5.27 4.41 4.18
Page 305 of 316Population Source: World Bank

PRISONS21. Convicted prisoners, by sex and age group, selected day
21.05 5o AMPRCVAdult convicted males admitted to prison
1998 1999 2000 1998 1999 2000Count Rate per 100,000 inhabitants
CountryArgentina 8,294 8,529 22.98 23.30Australia 16,179 17,208 16,846 86.06 90.57 87.74Azerbaijan 21,616 22,541 20,797 273.17 282.36 258.38Belarus 58,118 54,881 52,435 575.43 548.81 524.35Botswana 4,797 5,305 5,074 307.16 334.04 316.73Bulgaria 7,933 8,305 7,750 96.08 101.18 94.89Chile 12,424 14,085 15,417 83.95 93.90 101.43Colombia 41,639 42,434 48,377 102.06 102.25 114.37Cyprus 194 209 226 25.90 27.72 29.85Czech Republic 14,265 15,381 14,859 138.50 149.33 144.26Dominica 499 515 430 589.04England & Wales 44,719 44,054 45,230 85.30 83.61 85.43Estonia 2,823 2,865 3,061 200.78 206.61 223.59Finland 2,356 2,237 2,448 45.72 43.31 47.29France 30,836 31,122 31,981 52.80 53.11 54.30Georgia 8,053 6,239 5,698 147.98 124.18 113.42Germany 48,118 50,287 51,220 58.68 61.25 62.31Hong Kong, China (SAR) 8,305 8,249 8,257 124.97 122.74 121.48Hungary 9,350 9,836 10,222 92.57 97.39 102.22Iceland 80 79 60 29.20 28.47 21.35India 1,662 0.17Indonesia 27,817 27,292 31,665 13.64 13.18 15.08Italy 25,659 27,061 28,081 44.55 46.98 48.67Jamaica 1,376 2,231 1,908 53.42 86.14 72.46Japan 41,128 43,095 47,338 32.64 33.93 37.27Korea, Republic of 33,829 35,875 35,844 72.91 76.49 75.78Kyrgyzstan 12,509 12,773 12,909 260.77 262.57 262.64Latvia 5,787 5,382 4,772 236.30 223.32 201.18Lithuania 11,122 11,470 7,297 300.35 310.08 197.48Macedonia, FYR 938 1,054 1,172 46.55 52.26 57.71
Page 306 of 316Population Source: World Bank

PRISONS21. Convicted prisoners, by sex and age group, selected day
21.05 5o AMPRCVAdult convicted males admitted to prison
1998 1999 2000 1998 1999 2000Count Rate per 100,000 inhabitants
CountryMalaysia 31,884 35,342 35,223 143.62 155.69 151.17Maldives 45 16 23 17.14 5.94 8.33Mauritius 1,228 1,044 1,305 105.89 88.90 110.02Moldova, Republic of 6,458 6,254 6,825 150.22 145.78 159.39Netherlands 5,889 5,713 5,229 37.51 36.16 32.89New Zealand 4,658 4,747 5,049 122.83 124.57 131.80Norway 1,242 28.02Oman 1,720 1,634 1,862 74.72 69.59 77.75Pakistan 520 541 1,029 0.39 0.40 0.75Panama 2,041 2,368 2,556 73.84 84.24 89.50Papua New Guinea 9,449 8,029 8,981 193.52 160.39 175.07Paraguay 3,680 3,515 2,912 70.51 65.59 52.98Philippines 26,568 30,422 30,692 36.49 41.00 40.60Portugal 9,198 7,740 7,803 92.28 77.49 78.03Qatar 494 472 486 90.48 83.52 83.09Romania 33 35 37 0.15 0.15 0.16Russian Federation 679,782 713,662 631,453 462.44 488.81 432.50Saudi Arabia 21,279 24,584 22,150 108.02 121.70 107.00Singapore 7,807 9,920 10,897 199.01 251.01 271.20Slovakia 4,714 4,700 4,760 87.45 87.12 88.12Slovenia 518 637 713 26.13 32.08 35.87South Africa 79,574 89,661 93,163 192.21 212.97 217.67Spain 38,465 39,081 40,151 97.63 99.19 101.65Sri Lanka 19,962 21,665 18,182 106.18 114.03 93.72Suriname 447 528 602 108.28 127.37 144.36Swaziland 7,797 8,114 8,393 787.21 795.90 803.16Sweden 3,881 3,903 4,262 43.84 44.06 48.06Switzerland 3,051 3,174 3,289 42.91 44.45 45.81Thailand 84,219 106,023 107,919 140.83 176.12 177.79Turkey 35,744 38,509 21,331 56.38 59.89 32.67
Page 307 of 316Population Source: World Bank

PRISONS21. Convicted prisoners, by sex and age group, selected day
21.05 5o AMPRCVAdult convicted males admitted to prison
1998 1999 2000 1998 1999 2000Count Rate per 100,000 inhabitants
CountryUkraine 146,207 156,486 161,097 290.67 313.60 325.45Venezuela 12,775 4,120 53.90 17.02Zambia 8,817 12,549 8,749 91.22 127.00 86.62Zimbabwe 13,405 13,942 14,145 109.88 112.44 112.26
Page 308 of 316Population Source: World Bank

PRISONS21. Convicted prisoners, by sex and age group, selected day
21.06 5o JUPRCVTotal convicted juveniles admitted to prison
1998 1999 2000 1998 1999 2000Count Rate per 100,000 inhabitants
CountryArgentina 8 23 0.02 0.06Azerbaijan 73 62 82 0.92 0.78 1.02Barbados 16 12 16 6.03 4.51 5.99Belarus 1,979 1,645 1,559 19.59 16.45 15.59Botswana 346 344 290 22.16 21.66 18.10Bulgaria 42 51 52 0.51 0.62 0.64Chile 10 11 15 0.07 0.07 0.10China 11,011 10,825 11,794 0.89 0.87 0.94Czech Republic 163 131 110 1.58 1.27 1.07Denmark 9 7 6 0.17 0.13 0.11Dominica 3 3 1 1.37Dominican Republic 288 255 3.50 3.05England & Wales 9,800 9,624 9,665 18.69 18.27 18.26Estonia 71 65 78 5.05 4.69 5.70Finland 56 53 67 1.09 1.03 1.29France 138 161 158 0.24 0.27 0.27Georgia 65 48 27 1.19 0.96 0.54Germany 6,438 7,150 7,396 7.85 8.71 9.00Hong Kong, China (SAR) 985 967 1,075 14.82 14.39 15.82Hungary 308 327 301 3.05 3.24 3.01India 52,357 5.34Indonesia 2,726 1,705 1,778 1.34 0.82 0.85Jamaica 135 169 186 5.24 6.53 7.06Japan 20 31 23 0.02 0.02 0.02Korea, Republic of 1,585 1,361 1,046 3.42 2.90 2.21Kyrgyzstan 358 315 308 7.46 6.48 6.27Latvia 188 199 166 7.68 8.26 7.00Lithuania 265 199 69 7.16 5.38 1.87Malaysia 428 473 87 1.93 2.08 0.37Maldives 2 1 5 0.76 0.37 1.81
Page 309 of 316Population Source: World Bank

PRISONS21. Convicted prisoners, by sex and age group, selected day
21.06 5o JUPRCVTotal convicted juveniles admitted to prison
1998 1999 2000 1998 1999 2000Count Rate per 100,000 inhabitants
CountryMauritius 52 25 29 4.48 2.13 2.44Mexico 466 581 454 0.49 0.60 0.46Moldova, Republic of 160 71 89 3.72 1.66 2.08Netherlands 483 485 497 3.08 3.07 3.13New Zealand 20 13 24 0.53 0.34 0.63Norway 3 0.07Oman 129 82 67 5.60 3.49 2.80Papua New Guinea 325 248 267 6.66 4.95 5.20Paraguay 532 512 344 10.19 9.55 6.26Philippines 1,757 2,041 1,825 2.41 2.75 2.41Portugal 316 242 375 3.17 2.42 3.75Romania 1 1 937 0.01 0.00 4.18Russian Federation 20,104 21,526 16,981 13.68 14.74 11.63Slovakia 99 115 92 1.84 2.13 1.70Slovenia 29 27 30 1.46 1.36 1.51South Africa 10,587 12,350 12,347 25.57 29.33 28.85Spain 2,059 1,481 1,392 5.23 3.76 3.52Suriname 86 74 69 20.83 17.85 16.55Swaziland 56 51 51 5.65 5.00 4.88Sweden 4 1 0.05 0.01Turkey 4,359 4,301 2,778 6.88 6.69 4.25Ukraine 3,392 3,303 3,268 6.74 6.62 6.60Zambia 123 61 62 1.27 0.62 0.61Zimbabwe 358 150 148 2.93 1.21 1.17
Page 310 of 316Population Source: World Bank

PRISONS21. Convicted prisoners, by sex and age group, selected day
21.07 5o JFPRCVJuvenile convicted females admitted to prison
1998 1999 2000 1998 1999 2000Count Rate per 100,000 inhabitants
CountryArgentina 1 0.00Azerbaijan 4 4 4 0.05 0.05 0.05Barbados 9 7 8 3.39 2.63 3.00Belarus 75 56 42 0.74 0.56 0.42Bulgaria 3 4 4 0.04 0.05 0.05Chile 1 0.01Czech Republic 5 2 3 0.05 0.02 0.03Dominica 1 4Dominican Republic 65 60 0.79 0.72England & Wales 381 386 437 0.73 0.73 0.83Estonia 3 3 3 0.21 0.22 0.22Finland 2 4 7 0.04 0.08 0.14France 4 4 6 0.01 0.01 0.01Germany 191 197 204 0.23 0.24 0.25Hong Kong, China (SAR) 153 153 272 2.30 2.28 4.00Hungary 8 14 12 0.08 0.14 0.12India 1,148 0.12Indonesia 18 171 50 0.01 0.08 0.02Jamaica 33 41 28 1.28 1.58 1.06Japan 1 0.00Korea, Republic of 14 18 16 0.03 0.04 0.03Kyrgyzstan 8 5 8 0.17 0.10 0.16Latvia 3 6 6 0.12 0.25 0.25Lithuania 13 13 1 0.35 0.35 0.03Macedonia, FYR 24 21 22 1.19 1.04 1.08Malaysia 30 4 8 0.14 0.02 0.03Maldives 1 0.37Mauritius 17 9 9 1.47 0.77 0.76Mexico 35 42 28 0.04 0.04 0.03Moldova, Republic of 8 5 2 0.19 0.12 0.05
Page 311 of 316Population Source: World Bank

PRISONS21. Convicted prisoners, by sex and age group, selected day
21.07 5o JFPRCVJuvenile convicted females admitted to prison
1998 1999 2000 1998 1999 2000Count Rate per 100,000 inhabitants
CountryNew Zealand 3 1 6 0.08 0.03 0.16Oman 16 10 0.70 0.42Papua New Guinea 6 1 1 0.12 0.02 0.02Paraguay 50 34 25 0.96 0.63 0.45Philippines 111 130 116 0.15 0.18 0.15Portugal 21 6 7 0.21 0.06 0.07Romania 30 35 29 0.13 0.16 0.13Slovakia 3 0.06Slovenia 4 0.20South Africa 181 203 206 0.44 0.48 0.48Spain 120 97 92 0.30 0.25 0.23Suriname 6 4 3 1.45 0.96 0.72Sweden 1 0.01Turkey 195 186 148 0.31 0.29 0.23Ukraine 161 156 165 0.32 0.31 0.33Zambia 3 0.03Zimbabwe 15 0.12
Page 312 of 316Population Source: World Bank

PRISONS21. Convicted prisoners, by sex and age group, selected day
21.08 5o JMPRCVJuvenile convicted males admitted to prison
1998 1999 2000 1998 1999 2000Count Rate per 100,000 inhabitants
CountryArgentina 8 22 0.02 0.06Azerbaijan 69 58 78 0.87 0.73 0.97Barbados 7 5 8 2.64 1.88 3.00Belarus 1,904 1,589 1,517 18.85 15.89 15.17Botswana 346 344 290 22.16 21.66 18.10Bulgaria 39 47 48 0.47 0.57 0.59Chile 9 11 15 0.06 0.07 0.10Czech Republic 158 129 107 1.53 1.25 1.04Dominican Republic 223 195 2.71 2.33England & Wales 9,419 9,238 9,228 17.97 17.53 17.43Estonia 68 62 75 4.84 4.47 5.48Finland 54 49 60 1.05 0.95 1.16France 134 157 152 0.23 0.27 0.26Georgia 65 48 27 1.19 0.96 0.54Germany 6,247 6,953 7,192 7.62 8.47 8.75Hong Kong, China (SAR) 832 814 803 12.52 12.11 11.81Hungary 300 313 289 2.97 3.10 2.89India 15 0.00Indonesia 2,708 1,534 1,728 1.33 0.74 0.82Jamaica 102 128 138 3.96 4.94 5.24Japan 20 31 22 0.02 0.02 0.02Korea, Republic of 1,571 1,343 1,030 3.39 2.86 2.18Kyrgyzstan 350 310 300 7.30 6.37 6.10Latvia 185 193 160 7.55 8.01 6.75Lithuania 252 186 68 6.81 5.03 1.84Macedonia, FYR 51 48 76 2.53 2.38 3.74Malaysia 398 469 79 1.79 2.07 0.34Maldives 2 5 0.76 1.81Mauritius 35 16 20 3.02 1.36 1.69Mexico 431 539 426 0.45 0.56 0.43
Page 313 of 316Population Source: World Bank

PRISONS21. Convicted prisoners, by sex and age group, selected day
21.08 5o JMPRCVJuvenile convicted males admitted to prison
1998 1999 2000 1998 1999 2000Count Rate per 100,000 inhabitants
CountryMoldova, Republic of 152 66 87 3.54 1.54 2.03New Zealand 17 12 18 0.45 0.31 0.47Norway 3 0.07Oman 113 82 57 4.91 3.49 2.38Papua New Guinea 863 685 638 17.67 13.68 12.44Paraguay 482 478 319 9.24 8.92 5.80Philippines 1,646 1,911 1,709 2.26 2.58 2.26Portugal 295 236 368 2.96 2.36 3.68Romania 1 1 908 0.01 0.00 4.05Slovakia 96 115 92 1.78 2.13 1.70Slovenia 29 27 26 1.46 1.36 1.31South Africa 10,400 12,147 12,141 25.12 28.85 28.37Spain 1,939 1,384 1,300 4.92 3.51 3.29Suriname 80 70 66 19.38 16.89 15.83Swaziland 56 51 51 5.65 5.00 4.88Sweden 4 1 0.05 0.01Turkey 4,164 4,115 2,630 6.57 6.40 4.03Ukraine 3,231 3,147 3,103 6.42 6.31 6.27Zambia 123 58 62 1.27 0.59 0.61Zimbabwe 133 1.06
Page 314 of 316Population Source: World Bank

PRISONS21. Convicted prisoners, by sex and age group, selected day
21.09 6d prcvfbTotal number of convicted prisoners who are citizens of other countries
1998 1999 2000 1998 1999 2000Count Rate per 100,000 inhabitants
CountryAzerbaijan 354 400 303 4.47 5.01 3.76Belarus 1,789 1,590 1,182 17.71 15.90 11.82Botswana 970 750 748 62.11 47.23 46.69Bulgaria 47 67 58 0.57 0.82 0.71Colombia 336 347 290 0.82 0.84 0.69Cyprus 49 77 72 6.54 10.21 9.51Czech Republic 1,497 1,309 1,129 14.53 12.71 10.96Dominica 14 9 23 31.51Dominican Republic 120 39 1.46 0.47England & Wales 555 548 581 1.06 1.04 1.10Estonia 81 146 162 5.76 10.53 11.83Finland 125 150 151 2.43 2.90 2.92Germany 13,929 14,487 14,235 16.99 17.65 17.32Hong Kong, China (SAR) 883 930 938 13.29 13.84 13.80Hungary 623 729 807 6.17 7.22 8.07India 4 0.00Indonesia 68 106 174 0.03 0.05 0.08Italy 5,127 6,079 8.90 10.54Jamaica 97 107 122 3.77 4.13 4.63Japan 2,359 2,903 3,237 1.87 2.29 2.55Korea, Republic of 246 363 323 0.53 0.77 0.68Kyrgyzstan 47 39 52 0.98 0.80 1.06Latvia 67 69 54 2.74 2.86 2.28Lithuania 29 53 53 0.78 1.43 1.43Malaysia 25,587 24,555 27,843 115.26 108.17 119.50Maldives 2 1 0.76 0.37Mauritius 10 3 7 0.86 0.26 0.59Mexico 622 727 808 0.65 0.75 0.82Moldova, Republic of 63 84 86 1.47 1.96 2.01Netherlands 271 586 681 1.73 3.71 4.28
Page 315 of 316Population Source: World Bank

PRISONS21. Convicted prisoners, by sex and age group, selected day
21.09 6d prcvfbTotal number of convicted prisoners who are citizens of other countries
1998 1999 2000 1998 1999 2000Count Rate per 100,000 inhabitants
CountryOman 546 480 410 23.72 20.44 17.12Paraguay 321 312 5.99 5.68Portugal 1,560 1,387 1,547 15.65 13.89 15.47Qatar 359 323 317 65.75 57.16 54.20Romania 322 321 288 1.43 1.43 1.29Saudi Arabia 11,563 13,170 12,062 58.70 65.20 58.27Singapore 1,627 2,443 2,502 41.47 61.82 62.27Slovakia 148 165 194 2.75 3.06 3.59Slovenia 71 22 81 3.58 1.11 4.07Spain 7,850 7,900 8,990 19.92 20.05 22.76Sri Lanka 10 2 11 0.05 0.01 0.06Suriname 91 116 137 22.04 27.98 32.85Swaziland 671 732 654 67.75 71.80 62.58Sweden 1,090 1,077 1,211 12.31 12.16 13.65Switzerland 1,706 1,849 2,015 23.99 25.90 28.06Thailand 4,931 5,929 5,235 8.25 9.85 8.62Turkey 290 337 0.46 0.52Ukraine 2,714 3,112 3,232 5.40 6.24 6.53United States of America 88,995 106,298 98,027 32.36 38.24 34.76Zimbabwe 960 767 713 7.87 6.19 5.66
Page 316 of 316Population Source: World Bank